Embed Size (px)
Citation preview
Topic report 1/2000
Inland waters Annual topic update 1999
Prepared by: A-F. Boschet, V. De Paepe and T.J. Lack, ETC/IW
March 2000
Project manager: Niels Thyssen
European Environment Agency
2
Cover design: Rolf Kuchling, EEA
Legal notice
The contents of this report do not necessarily reflect the official opinion of the European
Commission or other European Communities institutions. Neither the European Environment
Agency nor any person or company acting on the behalf of the Agency is responsible for the use that
may be made of the information contained in this report.
A great deal of additional information on the European Union is available on the Internet.
It can be accessed through the Europa server (http://europa.eu.int)
©EEA, Copenhagen, 2000
Reproduction is authorised provided the source is acknowledged
Printed in
Printed on recycled and chlorine-free bleached paper
ISBN
European Environment Agency
Kongens Nytorv 6
DK-1050 Copenhagen K
Denmark
Tel: +45 33 36 71 00
Fax: +45 33 36 71 99
E-mail: [email protected]
3
Contents
1. Background and management ...............................................................4
2. Work plan...............................................................................................8
3. Progress during 1999 ............................................................................9
3.1. EUROWATERNET and WATERBASE development........................................... 9
3.2. Assistance in the completion of the EU 98 Report and contribution to the annual indicator report ................................................................................. 16
3.3. Support to DG Environment ......................................................................... 24
3.4. IRENIE project ............................................................................................... 26
3.5. Europe’s biodiversity..................................................................................... 27
4. Products/outputs produced by ETC/IW (1994-1999)...........................28
5. Plans and products for 2000................................................................30
4
1. Background and management
The European Environment Agency The European Environment Agency (EEA), based in Copenhagen, was established in 1990 by Council Regulation 1210/90 ‘to provide information for framing and implementing sound environmental policies’. The Regulation laid down a number of tasks for the Agency and prime among these is the establishment and coordination of a network for collecting, processing and analysis of environmental data. The network is European Environmental Information and Observation Network (EIONET) and the Agency has the responsibility to coordinate and develop it. The mission of the Agency is defined in its mission statement for 1999-2003:
The EEA aims to support sustainable development and help achieve significant and measurable improvement in Europe’s environment through the provision of timely, targeted, relevant and reliable information to policy making agents and the public.
European Topic Centres have been appointed by the Agency to act as centres of expertise and to execute particular tasks identified in its multiannual work programme. The European Topic Centre on Inland Waters The European Topic Centre on Inland Waters (ETC/IW) was appointed in December 1994 and is led by the Water Research Centre (WRc) under contract to EEA. ETC/IW consists of a consortium of several European organisations which each has a representative on the ETC Management Committee, which agrees the allocation of tasks and budget. Partners are accountable to the ETC Leader for the satisfactory execution of the work plan. The Management Committee is chaired by the ETC Leader (Dr Tim Lack of WRc), and WRc also provides the services of a Technical Manager (Steve Nixon) and a Data Manager (Marisol Garcia). The other organisations represented on the Management Committee and their nominated representatives are: • Austrian Working Group on Water (AWW - Austria): Wilhelm Vogel;
• Centro de Estudios y Experimentacion de Obras Publicas (CEDEX - Spain): Teodoro Estrela;
• Flemish Environment Agency (VMM - Belgium, Flanders): Jan Voet;
• Instituto da Agua (INAG - Portugal): No representative during 1999;
• International Office for Water (IOW - France): Dominique Preux;
• National Environmental Research Institute (NERI - Denmark): Torben Moth Iversen;
• Norwegian Institute for Water Research (NIVA - Norway): Merete Johannessen.
There are two supporting organisations which also contribute to the Topic Centre's work:
• Danish and Greenland Geological Survey (GEUS - Denmark): Peter Gravesen;
• Institute of Hydrology (IH - UK): Alan Gustard.
5
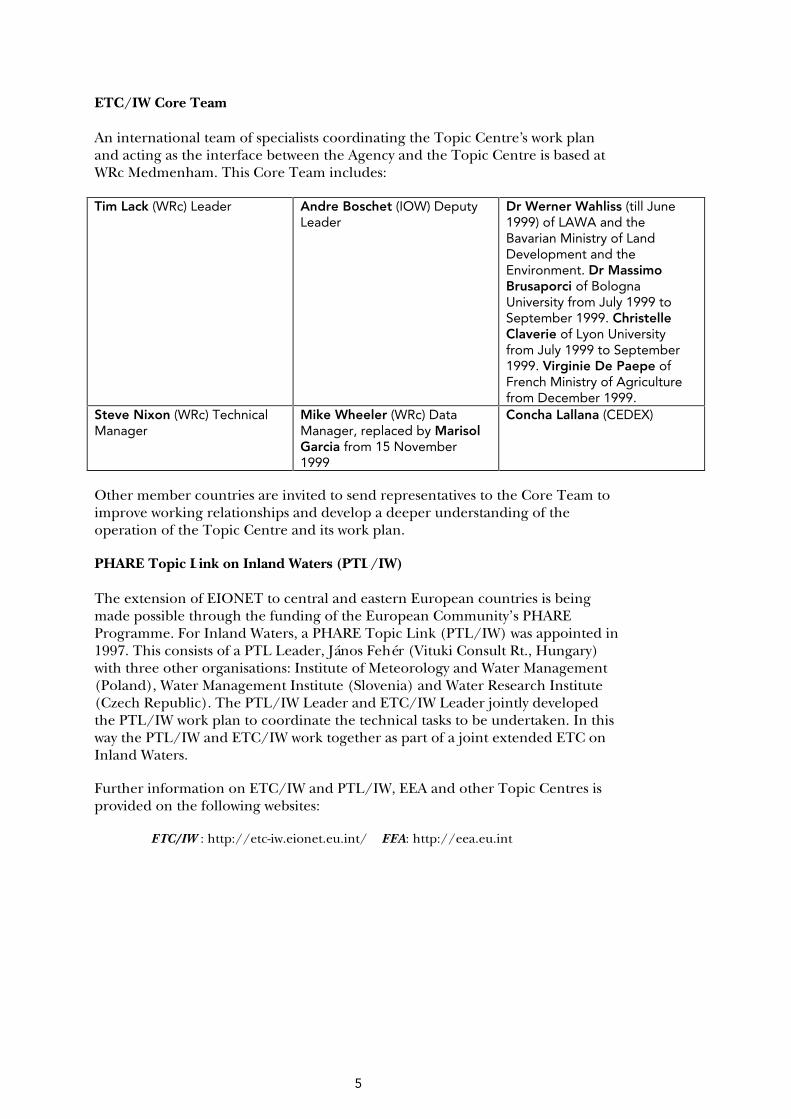
ETC/IW Core Team An international team of specialists coordinating the Topic Centre’s work plan and acting as the interface between the Agency and the Topic Centre is based at WRc Medmenham. This Core Team includes:
Tim Lack (WRc) Leader Andre Boschet (IOW) Deputy Leader
Dr Werner Wahliss (till June 1999) of LAWA and the Bavarian Ministry of Land Development and the Environment. Dr Massimo Brusaporci of Bologna University from July 1999 to September 1999. Christelle Claverie of Lyon University from July 1999 to September 1999. Virginie De Paepe of French Ministry of Agriculture from December 1999.
Steve Nixon (WRc) Technical Manager
Mike Wheeler (WRc) Data Manager, replaced by Marisol Garcia from 15 November 1999
Concha Lallana (CEDEX)
Other member countries are invited to send representatives to the Core Team to improve working relationships and develop a deeper understanding of the operation of the Topic Centre and its work plan.
PHARE Topic Link on Inland Waters (PTL/IW) The extension of EIONET to central and eastern European countries is being made possible through the funding of the European Community’s PHARE Programme. For Inland Waters, a PHARE Topic Link (PTL/IW) was appointed in 1997. This consists of a PTL Leader, János Fehér (Vituki Consult Rt., Hungary) with three other organisations: Institute of Meteorology and Water Management (Poland), Water Management Institute (Slovenia) and Water Research Institute (Czech Republic). The PTL/IW Leader and ETC/IW Leader jointly developed the PTL/IW work plan to coordinate the technical tasks to be undertaken. In this way the PTL/IW and ETC/IW work together as part of a joint extended ETC on Inland Waters.
Further information on ETC/IW and PTL/IW, EEA and other Topic Centres is provided on the following websites:
ETC/IW : http://etc-iw.eionet.eu.int/ EEA: http://eea.eu.int
6
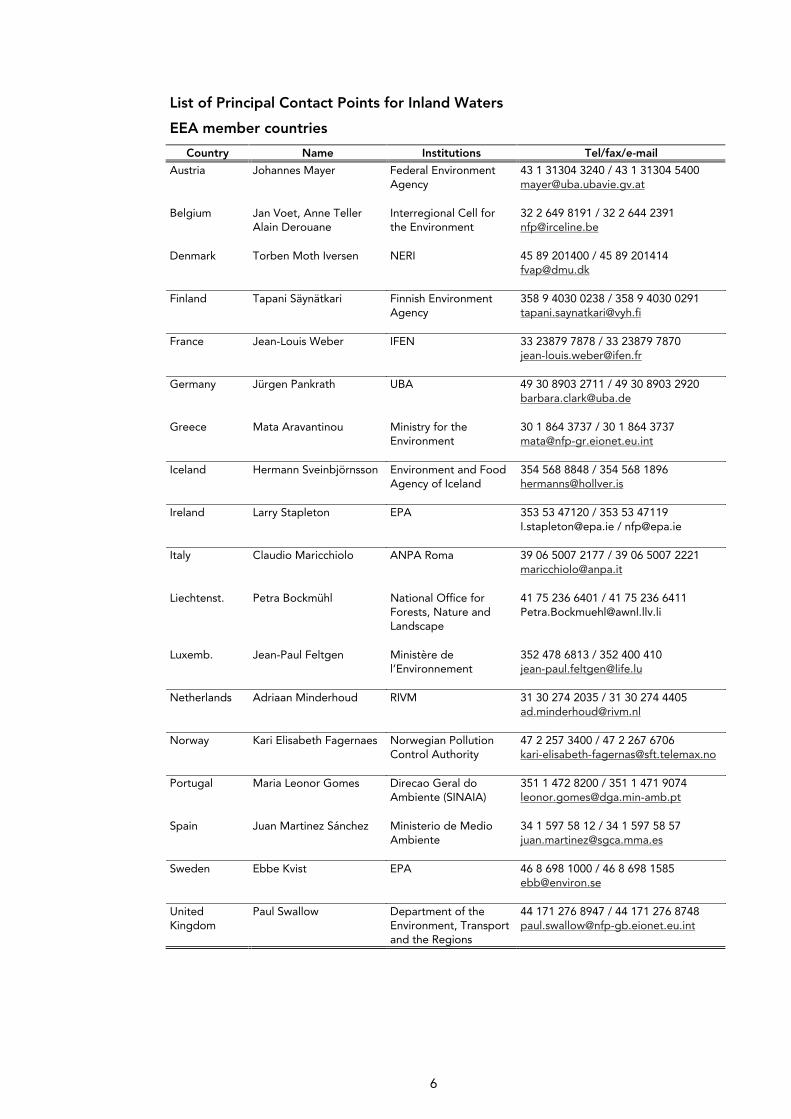
List of Principal Contact Points for Inland Waters
EEA member countries
Country Name Institutions Tel/fax/e-mail
Austria Johannes Mayer Federal Environment Agency
43 1 31304 3240 / 43 1 31304 5400 [email protected]
Belgium Jan Voet, Anne Teller Alain Derouane
Interregional Cell for the Environment
32 2 649 8191 / 32 2 644 2391 [email protected]
Denmark Torben Moth Iversen NERI 45 89 201400 / 45 89 201414 [email protected]
Finland Tapani Säynätkari Finnish Environment Agency
358 9 4030 0238 / 358 9 4030 0291 [email protected]
France Jean-Louis Weber IFEN 33 23879 7878 / 33 23879 7870 [email protected]
Germany Jürgen Pankrath UBA 49 30 8903 2711 / 49 30 8903 2920 [email protected]
Greece Mata Aravantinou Ministry for the Environment
30 1 864 3737 / 30 1 864 3737 [email protected]
Iceland Hermann Sveinbjörnsson Environment and Food Agency of Iceland
354 568 8848 / 354 568 1896 [email protected]
Ireland Larry Stapleton EPA 353 53 47120 / 353 53 47119 [email protected] / [email protected]
Italy Claudio Maricchiolo ANPA Roma 39 06 5007 2177 / 39 06 5007 2221 [email protected]
Liechtenst. Petra Bockmühl National Office for Forests, Nature and Landscape
41 75 236 6401 / 41 75 236 6411 [email protected]
Luxemb. Jean-Paul Feltgen Ministère de l’Environnement
352 478 6813 / 352 400 410 [email protected]
Netherlands Adriaan Minderhoud RIVM 31 30 274 2035 / 31 30 274 4405 [email protected]
Norway Kari Elisabeth Fagernaes Norwegian Pollution Control Authority
47 2 257 3400 / 47 2 267 6706 [email protected]
Portugal Maria Leonor Gomes Direcao Geral do Ambiente (SINAIA)
351 1 472 8200 / 351 1 471 9074 [email protected]
Spain Juan Martinez Sánchez Ministerio de Medio Ambiente
34 1 597 58 12 / 34 1 597 58 57 [email protected]
Sweden Ebbe Kvist EPA 46 8 698 1000 / 46 8 698 1585 [email protected]
United Kingdom
Paul Swallow Department of the Environment, Transport and the Regions
44 171 276 8947 / 44 171 276 8748 [email protected]
7
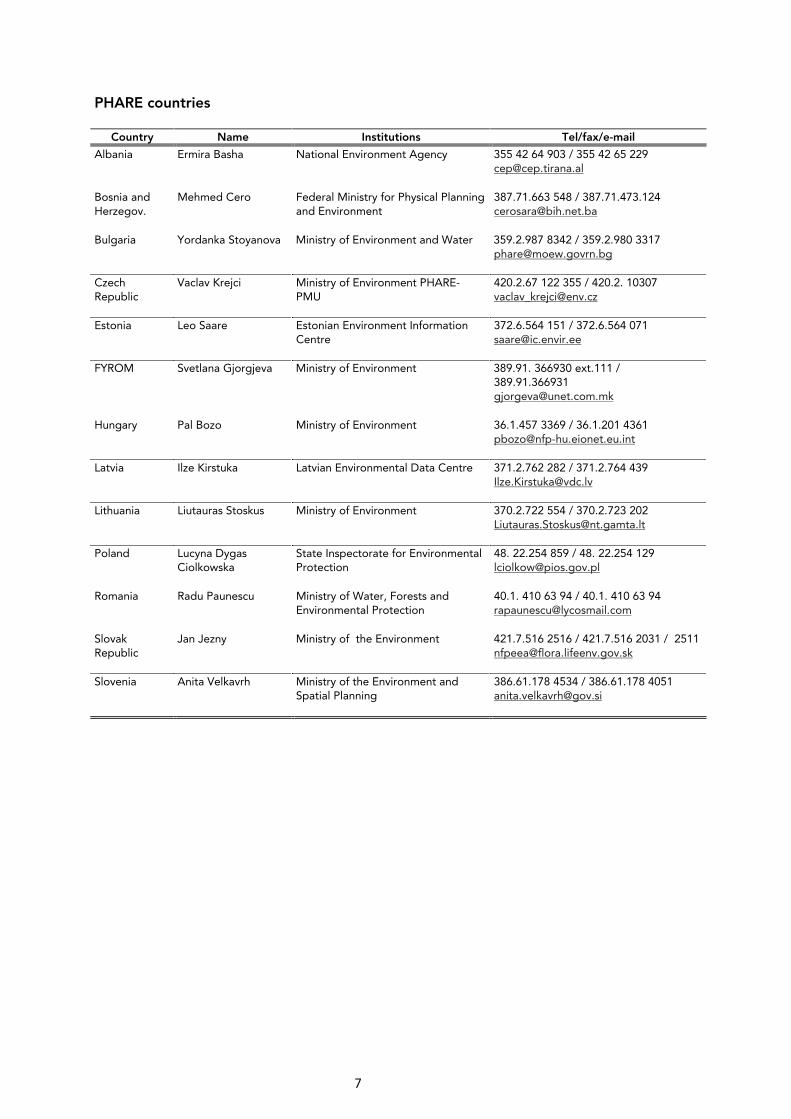
PHARE countries
Country Name Institutions Tel/fax/e-mail
Albania Ermira Basha
National Environment Agency 355 42 64 903 / 355 42 65 229 [email protected]
Bosnia and Herzegov.
Mehmed Cero Federal Ministry for Physical Planning and Environment
387.71.663 548 / 387.71.473.124 [email protected]
Bulgaria Yordanka Stoyanova Ministry of Environment and Water 359.2.987 8342 / 359.2.980 3317 [email protected]
Czech Republic
Vaclav Krejci
Ministry of Environment PHARE- PMU
420.2.67 122 355 / 420.2. 10307 [email protected]
Estonia Leo Saare Estonian Environment Information Centre
372.6.564 151 / 372.6.564 071 [email protected]
FYROM Svetlana Gjorgjeva Ministry of Environment 389.91. 366930 ext.111 / 389.91.366931 [email protected]
Hungary Pal Bozo Ministry of Environment 36.1.457 3369 / 36.1.201 4361 [email protected]
Latvia Ilze Kirstuka Latvian Environmental Data Centre 371.2.762 282 / 371.2.764 439 [email protected]
Lithuania Liutauras Stoskus Ministry of Environment 370.2.722 554 / 370.2.723 202 [email protected]
Poland Lucyna Dygas Ciolkowska
State Inspectorate for Environmental Protection
48. 22.254 859 / 48. 22.254 129 [email protected]
Romania Radu Paunescu Ministry of Water, Forests and Environmental Protection
40.1. 410 63 94 / 40.1. 410 63 94 [email protected]
Slovak Republic
Jan Jezny Ministry of the Environment 421.7.516 2516 / 421.7.516 2031 / 2511 [email protected]
Slovenia Anita Velkavrh Ministry of the Environment and Spatial Planning
386.61.178 4534 / 386.61.178 4051 [email protected]
8
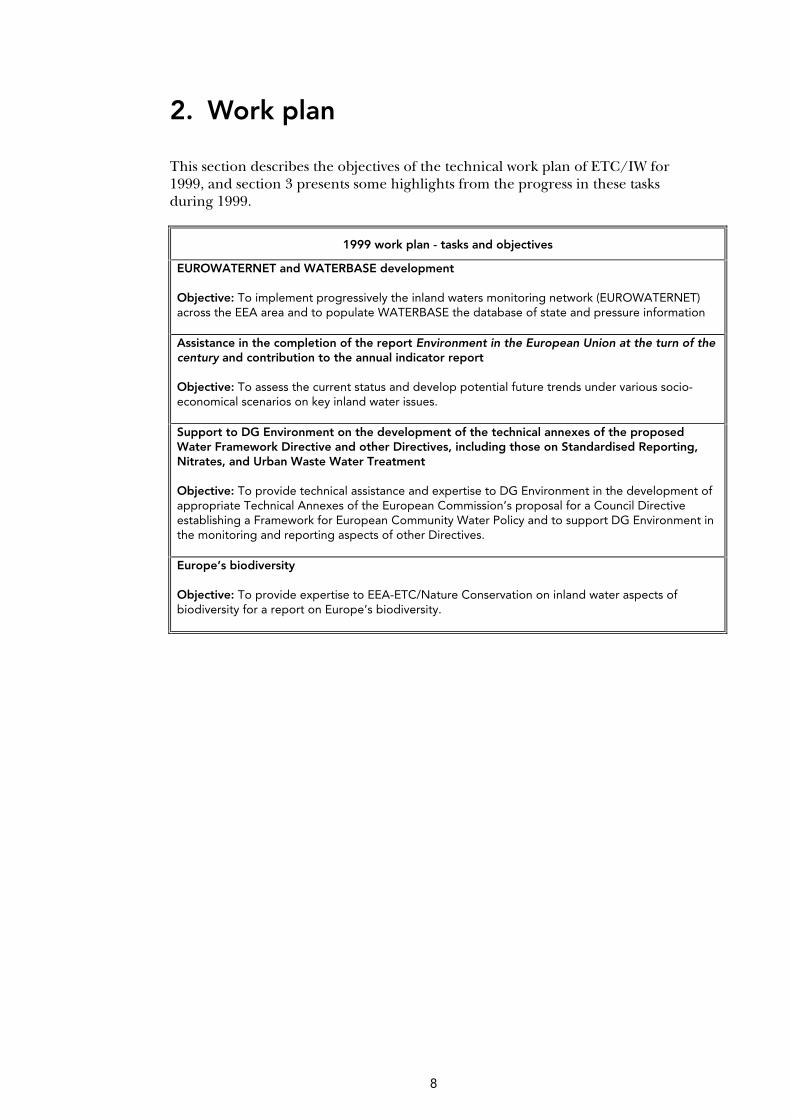
2. Work plan
This section describes the objectives of the technical work plan of ETC/IW for 1999, and section 3 presents some highlights from the progress in these tasks during 1999.
1999 work plan - tasks and objectives
EUROWATERNET and WATERBASE development Objective: To implement progressively the inland waters monitoring network (EUROWATERNET) across the EEA area and to populate WATERBASE the database of state and pressure information Assistance in the completion of the report Environment in the European Union at the turn of the century and contribution to the annual indicator report Objective: To assess the current status and develop potential future trends under various socio-economical scenarios on key inland water issues. Support to DG Environment on the development of the technical annexes of the proposed Water Framework Directive and other Directives, including those on Standardised Reporting, Nitrates, and Urban Waste Water Treatment Objective: To provide technical assistance and expertise to DG Environment in the development of appropriate Technical Annexes of the European Commission’s proposal for a Council Directive establishing a Framework for European Community Water Policy and to support DG Environment in the monitoring and reporting aspects of other Directives. Europe’s biodiversity Objective: To provide expertise to EEA-ETC/Nature Conservation on inland water aspects of biodiversity for a report on Europe’s biodiversity.

9
3. Progress during 1999
3.1. EUROWATERNET and WATERBASE development
The European Environment Agency (EEA) has a mandate from the EU Council of Ministers to produce objective, reliable and comparable information to allow the Commission, Member States and the general public to judge the effectiveness of policy and the needs for policy development. The EEA and the European Environment Information and Observation Network (EIONET) are the main European system for supporting development and implementation of policy through the interactions of networking, moving from national monitoring to European reporting and the establishment of the EEA as the Reference Centre for environmental information. The Monitoring, Data, Information, Assessment and Reporting chain (MDIAR) therefore forms the backbone of the EEA’s activities, as presented in EEA’s second multiannual work programme (EEA, 1999).,
The European Topic Centre on Inland Waters (ETC/IW) has designed and tested an information and monitoring network, called EUROWATERNET (EEA Topic Reports 10/96 and 11/96, EEA Technical Report no 7/98). EUROWATERNET will provide the European Environment Agency (EEA) with information that it needs to meet the requirements of its customers including the European Commission, other policy makers, national regulatory bodies and the general public. Information is required on:
• the status of Europe’s inland water resources, quality and quantity (status and trends assessments) and,
• how these relate and respond to pressures on the environment (cause-effect relationships).
Monitoring is expensive and is unlikely to be undertaken purely for the ‘European need.’ Therefore, EUROWATERNET is based on current national programmes. Usually, national networks are likely to be more than adequate (in terms of numbers of stations, frequency of monitoring and determinands monitored) to meet the EEA needs. However, should this not be the case, it would be of interest to the countries in terms of possible deficiencies and opportunities to further develop their national networks.
During 1999, ETC/IW with the full cooperation of the PHARE Topic Link on Inland Waters (PTL/IW) has concentrated its efforts on broader implementation of EUROWATERNET and making it more efficient. This has involved improvement in data management and a general survey of how many member countries participate in EUROWATERNET. Participation in the EUROWATERNET/WATERBASE process is one of the five priority actions identified by the EEA Management Board and regular reports are required by the Board to monitor progress. ETC/IW also further developed WATERBASE to connect to national monitoring and data collection, and to EUROSTAT and other international bodies as sources of the data required at European level.
10
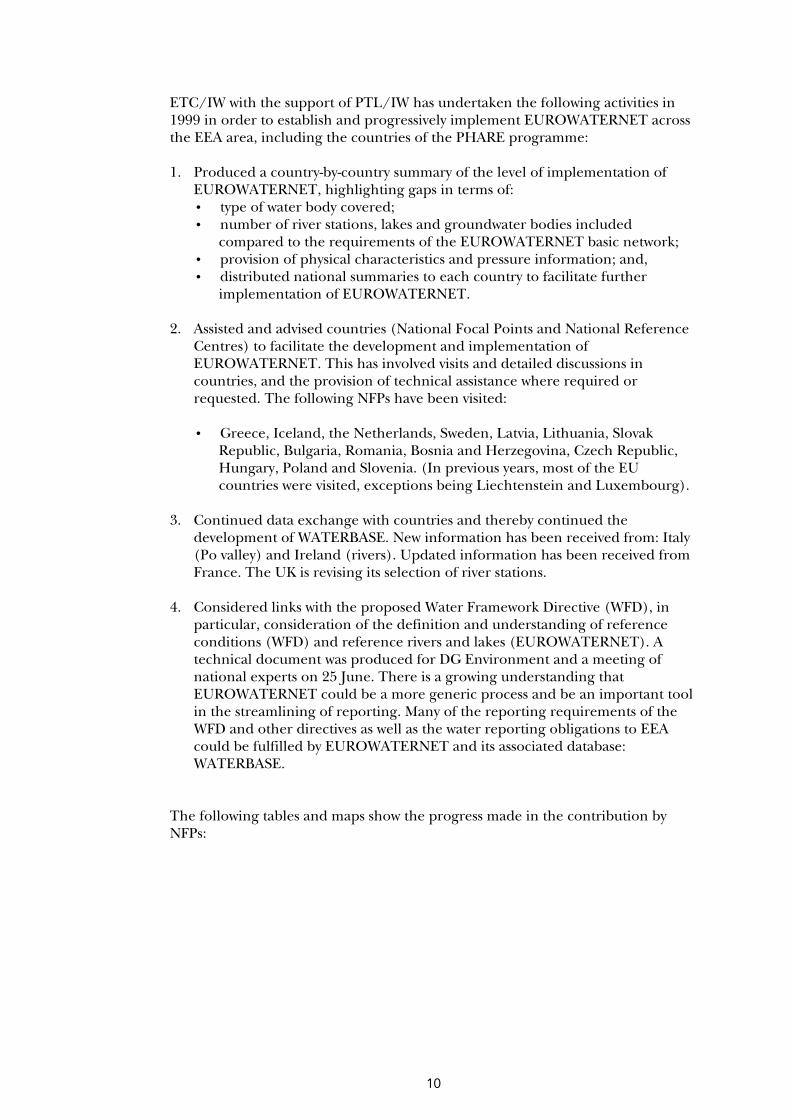
ETC/IW with the support of PTL/IW has undertaken the following activities in 1999 in order to establish and progressively implement EUROWATERNET across the EEA area, including the countries of the PHARE programme: 1. Produced a country-by-country summary of the level of implementation of
EUROWATERNET, highlighting gaps in terms of: • type of water body covered; • number of river stations, lakes and groundwater bodies included
compared to the requirements of the EUROWATERNET basic network; • provision of physical characteristics and pressure information; and, • distributed national summaries to each country to facilitate further
implementation of EUROWATERNET. 2. Assisted and advised countries (National Focal Points and National Reference
Centres) to facilitate the development and implementation of EUROWATERNET. This has involved visits and detailed discussions in countries, and the provision of technical assistance where required or requested. The following NFPs have been visited:
• Greece, Iceland, the Netherlands, Sweden, Latvia, Lithuania, Slovak
Republic, Bulgaria, Romania, Bosnia and Herzegovina, Czech Republic, Hungary, Poland and Slovenia. (In previous years, most of the EU countries were visited, exceptions being Liechtenstein and Luxembourg).
3. Continued data exchange with countries and thereby continued the
development of WATERBASE. New information has been received from: Italy (Po valley) and Ireland (rivers). Updated information has been received from France. The UK is revising its selection of river stations.
4. Considered links with the proposed Water Framework Directive (WFD), in
particular, consideration of the definition and understanding of reference conditions (WFD) and reference rivers and lakes (EUROWATERNET). A technical document was produced for DG Environment and a meeting of national experts on 25 June. There is a growing understanding that EUROWATERNET could be a more generic process and be an important tool in the streamlining of reporting. Many of the reporting requirements of the WFD and other directives as well as the water reporting obligations to EEA could be fulfilled by EUROWATERNET and its associated database: WATERBASE.
The following tables and maps show the progress made in the contribution by NFPs:
11
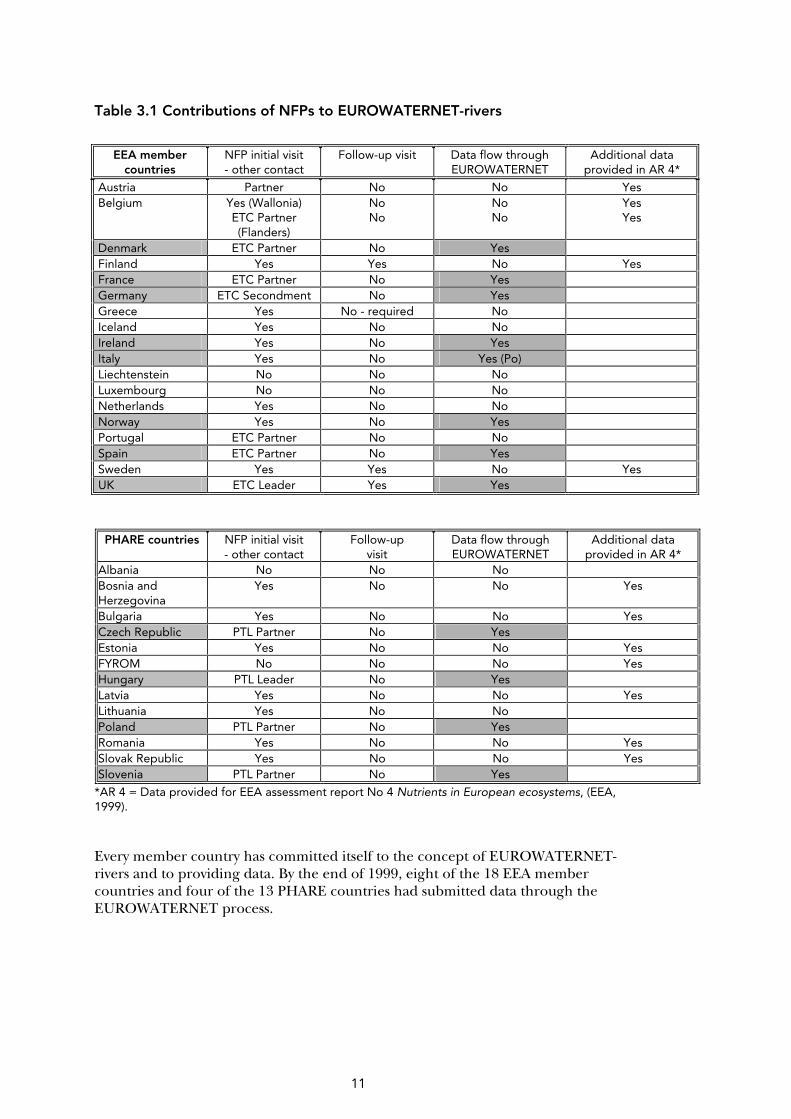
Table 3.1 Contributions of NFPs to EUROWATERNET-rivers
EEA member
countries NFP initial visit - other contact
Follow-up visit Data flow through EUROWATERNET
Additional data provided in AR 4*
Austria Partner No No Yes Belgium Yes (Wallonia)
ETC Partner (Flanders)
No No
No No
Yes Yes
Denmark ETC Partner No Yes Finland Yes Yes No Yes France ETC Partner No Yes Germany ETC Secondment No Yes Greece Yes No - required No Iceland Yes No No Ireland Yes No Yes Italy Yes No Yes (Po) Liechtenstein No No No Luxembourg No No No Netherlands Yes No No Norway Yes No Yes Portugal ETC Partner No No Spain ETC Partner No Yes Sweden Yes Yes No Yes UK ETC Leader Yes Yes
PHARE countries NFP initial visit - other contact
Follow-up visit
Data flow through EUROWATERNET
Additional data provided in AR 4*
Albania No No No Bosnia and Herzegovina
Yes No No Yes
Bulgaria Yes No No Yes Czech Republic PTL Partner No Yes Estonia Yes No No Yes FYROM No No No Yes Hungary PTL Leader No Yes Latvia Yes No No Yes Lithuania Yes No No Poland PTL Partner No Yes Romania Yes No No Yes Slovak Republic Yes No No Yes Slovenia PTL Partner No Yes
*AR 4 = Data provided for EEA assessment report No 4 Nutrients in European ecosystems, (EEA, 1999). Every member country has committed itself to the concept of EUROWATERNET-rivers and to providing data. By the end of 1999, eight of the 18 EEA member countries and four of the 13 PHARE countries had submitted data through the EUROWATERNET process.
12
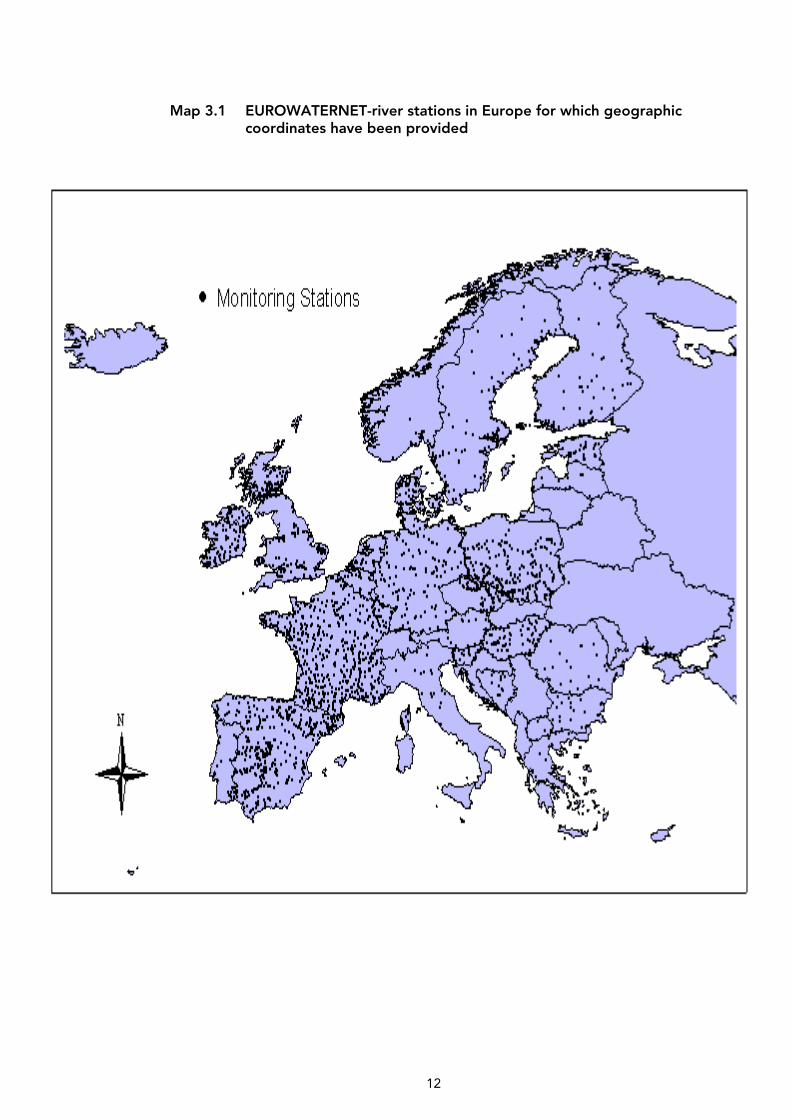
Map 3.1 EUROWATERNET-river stations in Europe for which geographic coordinates have been provided
13
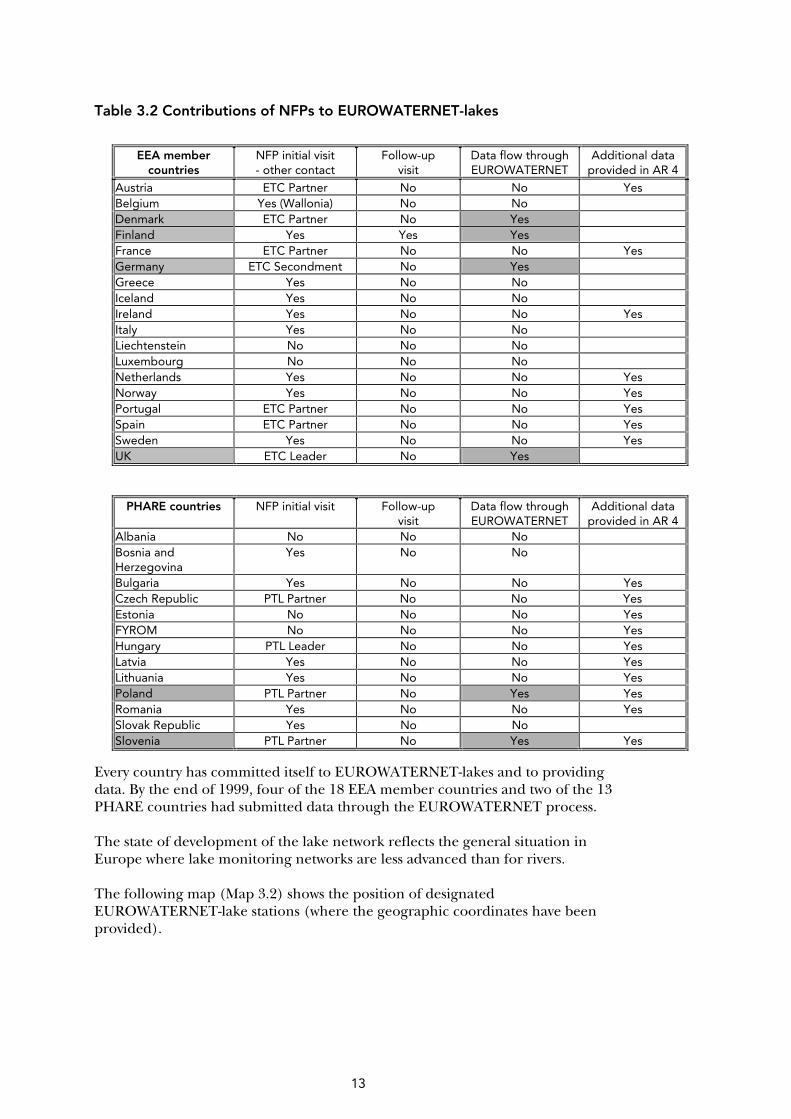
Table 3.2 Contributions of NFPs to EUROWATERNET-lakes
EEA member
countries NFP initial visit - other contact
Follow-up visit
Data flow through EUROWATERNET
Additional data provided in AR 4
Austria ETC Partner No No Yes Belgium Yes (Wallonia) No No Denmark ETC Partner No Yes Finland Yes Yes Yes France ETC Partner No No Yes Germany ETC Secondment No Yes Greece Yes No No Iceland Yes No No Ireland Yes No No Yes Italy Yes No No Liechtenstein No No No Luxembourg No No No Netherlands Yes No No Yes Norway Yes No No Yes Portugal ETC Partner No No Yes Spain ETC Partner No No Yes Sweden Yes No No Yes UK ETC Leader No Yes
PHARE countries NFP initial visit Follow-up visit
Data flow through EUROWATERNET
Additional data provided in AR 4
Albania No No No Bosnia and Herzegovina
Yes No No
Bulgaria Yes No No Yes Czech Republic PTL Partner No No Yes Estonia No No No Yes FYROM No No No Yes Hungary PTL Leader No No Yes Latvia Yes No No Yes Lithuania Yes No No Yes Poland PTL Partner No Yes Yes Romania Yes No No Yes Slovak Republic Yes No No Slovenia PTL Partner No Yes Yes
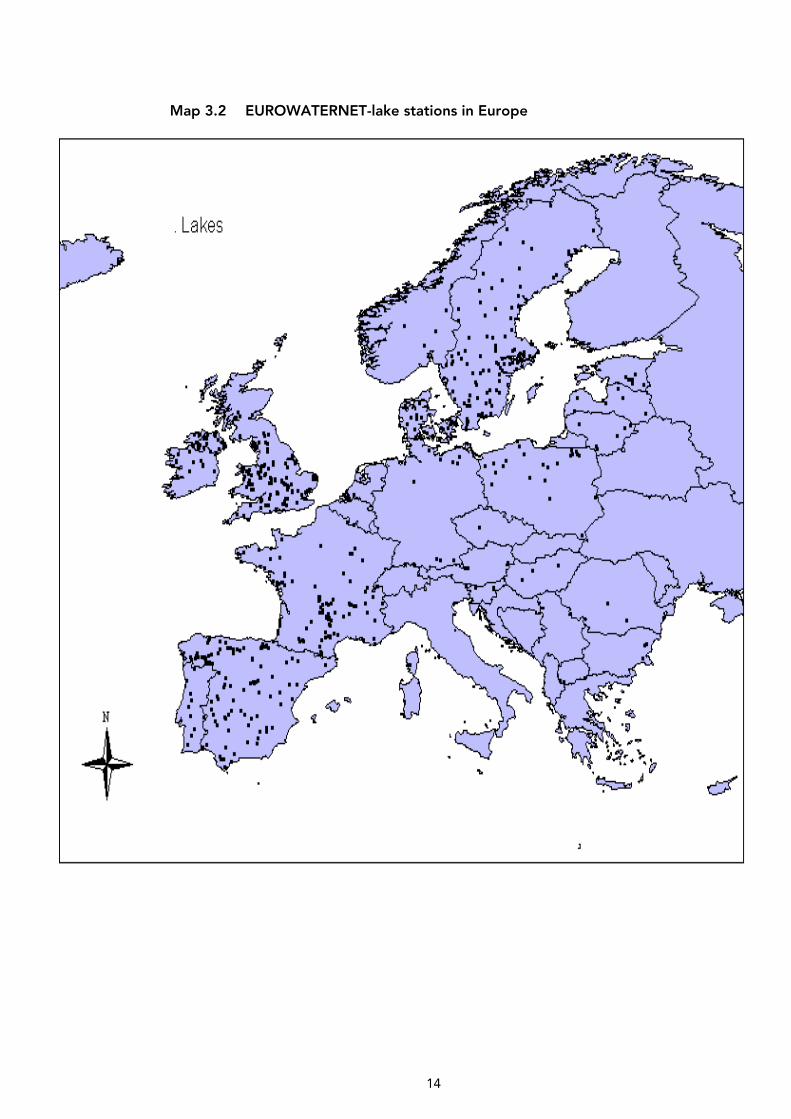
Every country has committed itself to EUROWATERNET-lakes and to providing data. By the end of 1999, four of the 18 EEA member countries and two of the 13 PHARE countries had submitted data through the EUROWATERNET process. The state of development of the lake network reflects the general situation in Europe where lake monitoring networks are less advanced than for rivers. The following map (Map 3.2) shows the position of designated EUROWATERNET-lake stations (where the geographic coordinates have been provided).
14
Map 3.2 EUROWATERNET-lake stations in Europe
15
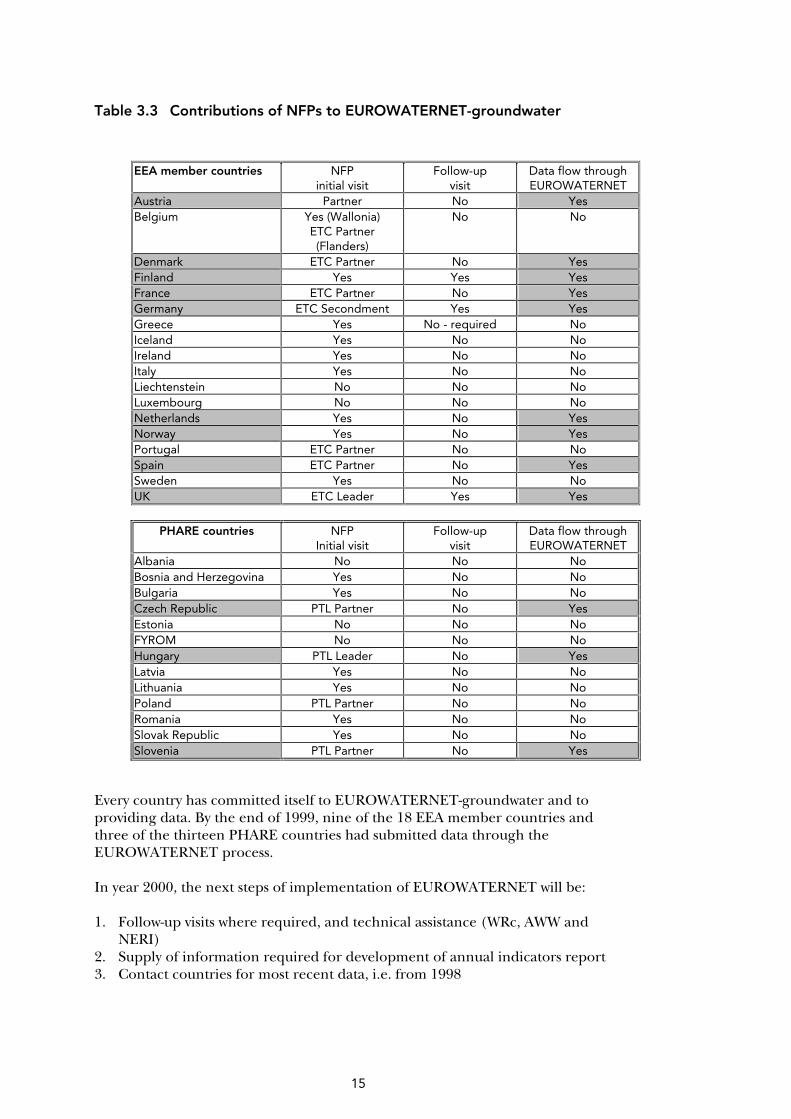
Table 3.3 Contributions of NFPs to EUROWATERNET-groundwater
EEA member countries NFP initial visit
Follow-up visit
Data flow through EUROWATERNET
Austria Partner No Yes Belgium Yes (Wallonia)
ETC Partner (Flanders)
No No
Denmark ETC Partner No Yes Finland Yes Yes Yes France ETC Partner No Yes Germany ETC Secondment Yes Yes Greece Yes No - required No Iceland Yes No No Ireland Yes No No Italy Yes No No Liechtenstein No No No Luxembourg No No No Netherlands Yes No Yes Norway Yes No Yes Portugal ETC Partner No No Spain ETC Partner No Yes Sweden Yes No No UK ETC Leader Yes Yes
PHARE countries NFP Initial visit
Follow-up visit
Data flow through EUROWATERNET
Albania No No No Bosnia and Herzegovina Yes No No Bulgaria Yes No No Czech Republic PTL Partner No Yes Estonia No No No FYROM No No No Hungary PTL Leader No Yes Latvia Yes No No Lithuania Yes No No Poland PTL Partner No No Romania Yes No No Slovak Republic Yes No No Slovenia PTL Partner No Yes
Every country has committed itself to EUROWATERNET-groundwater and to providing data. By the end of 1999, nine of the 18 EEA member countries and three of the thirteen PHARE countries had submitted data through the EUROWATERNET process. In year 2000, the next steps of implementation of EUROWATERNET will be: 1. Follow-up visits where required, and technical assistance (WRc, AWW and
NERI) 2. Supply of information required for development of annual indicators report 3. Contact countries for most recent data, i.e. from 1998
16
Data will be required for rivers: nutrients (N and P) and organic pollution indicators (BOD, DO, COD, TOC); for lakes: nutrients (N and P) and organic pollution indicators (BOD, DO, COD, TOC), Secchi disc depth; for groundwater: pH, conductivity, DO, nitrate, nitrite, chloride, and other important quality determinands such as heavy metals and pesticides.
3.2. Assistance in the completion of the report Environment in the European Union at the turn of the century and contribution to the annual indicator report
During 1999, ETC/IW was responsible for the chapter on water stress, in the EEA report: Environment in the European Union at the turn of the century (working title EU 98 Report)(EEA, 1999). Water stress is mainly caused by activities in two sectors: agriculture and industry and, to a lesser extent, by household activities. Most progress on reducing water stress has been made in industry and households. Little progress has been seen in agriculture. EU countries are abstracting around 21 % of their renewable water resources each year, which is within the recognised sustainability threshold. However, there are large regional differences particularly in southern Europe. Water abstraction will increase very slowly in the EU and water pricing is now an important policy tool to reduce the demand for water. The quality of rivers has improved. There are fewer heavily polluted rivers in the EU due to policies on wastewater discharges and phosphate-free detergents. Phosphorus and organic matter discharges have been significantly reduced but nitrates have remained approximately stable. This probably reflects the diffuse inputs from largely agricultural sources which are poorly controlled. The ETC/IW contributed to the first annual EEA indicator-based report (Environmental Signals) to be published in 2000 by developing indicators for eutrophication and water stress. The main objectives of these indicators are to show the trends in the evolution of the quality and quantity of water and to assess the effectiveness of European water directives. Within the DPSIR assessment framework (Driving Forces, Pressures, State, Impact, Responses) adopted by the EEA eutrophication indicators are: • Inputs of nitrogen from point discharges (domestic and industrial) and
diffuse sources (from agriculture), P; • Inputs of phosphorus from industry, households, agriculture and background,
P; • Nitrogen balance – inputs from fertilisers, manure, atmospheric deposition,
biological fixation and others, P; • Concentrations of total nitrogen and total phosphorus in large rivers, S; • Concentration of total phosphorus in lakes, S; • Status of nitrate in groundwater (exceedances of Drinking Water Directive
guide and limit values), S; • Temporal development of nitrate in groundwater, S; • Temporal development of nitrate and phosphate in coastal waters, S; • Temporal trends in DO levels at the bottom of the major seas, S; • Loads of total nitrogen and total phosphorus to coastal waters, P; • Development of urban waste water treatment processes, R; • Development of point source emissions of phosphorus, P.
17
Water stress indicators are: • Volumes of water used by energy, industry, agriculture, urban and other
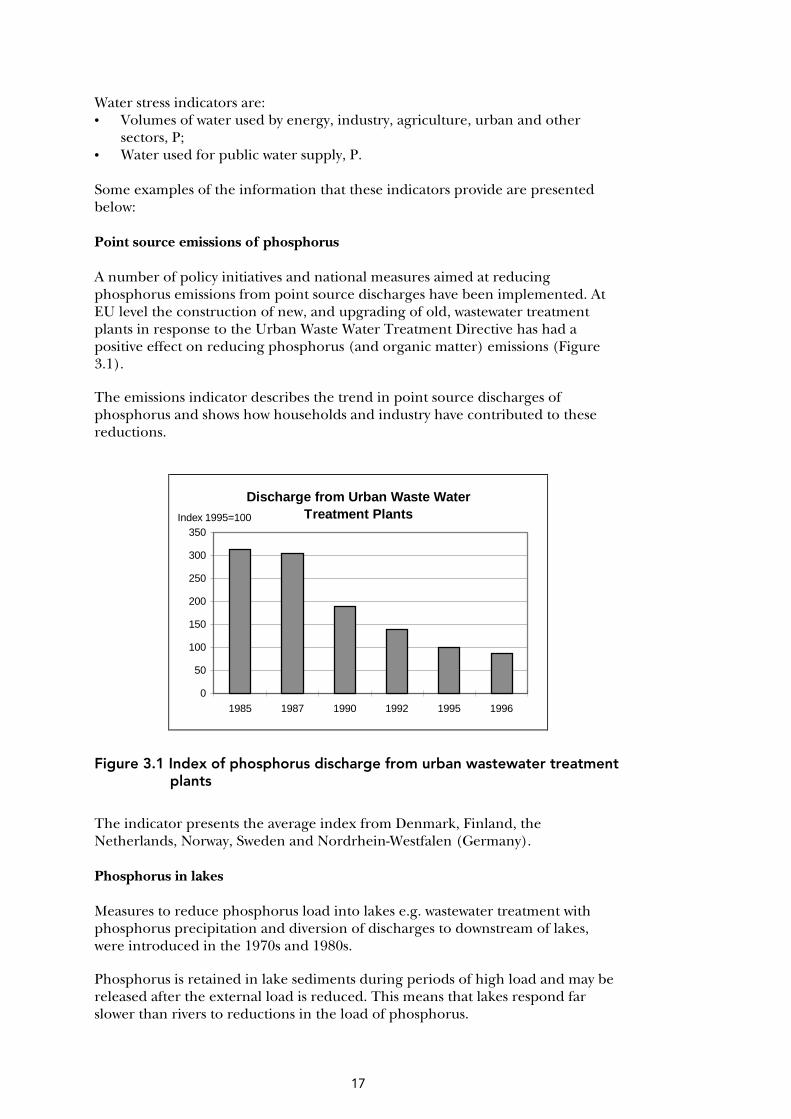
sectors, P; • Water used for public water supply, P. Some examples of the information that these indicators provide are presented below: Point source emissions of phosphorus A number of policy initiatives and national measures aimed at reducing phosphorus emissions from point source discharges have been implemented. At EU level the construction of new, and upgrading of old, wastewater treatment plants in response to the Urban Waste Water Treatment Directive has had a positive effect on reducing phosphorus (and organic matter) emissions (Figure 3.1).
The emissions indicator describes the trend in point source discharges of phosphorus and shows how households and industry have contributed to these reductions.
Discharge from Urban Waste Water Treatment Plants
0
50
100
150
200
250
300
350
1985 1987 1990 1992 1995 1996
Index 1995=100
Figure 3.1 Index of phosphorus discharge from urban wastewater treatment plants
The indicator presents the average index from Denmark, Finland, the Netherlands, Norway, Sweden and Nordrhein-Westfalen (Germany). Phosphorus in lakes Measures to reduce phosphorus load into lakes e.g. wastewater treatment with phosphorus precipitation and diversion of discharges to downstream of lakes, were introduced in the 1970s and 1980s.
Phosphorus is retained in lake sediments during periods of high load and may be released after the external load is reduced. This means that lakes respond far slower than rivers to reductions in the load of phosphorus.
18
0%
10%
20%
30%
40%
50%
60%
70%
80%
90%
100%
1981-85 1986-90 1991-95
> 250 µ125-250
50-125
25-50 10-25 < 10
µg/l P
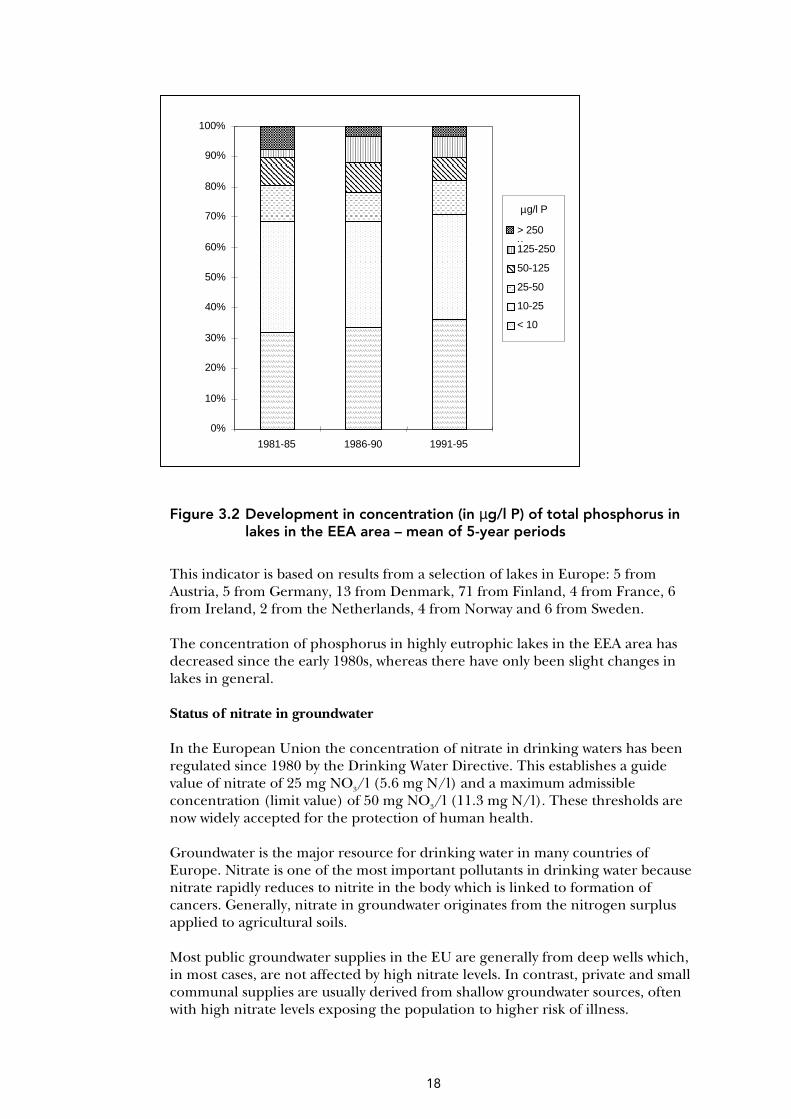
Figure 3.2 Development in concentration (in µg/l P) of total phosphorus in lakes in the EEA area – mean of 5-year periods
This indicator is based on results from a selection of lakes in Europe: 5 from Austria, 5 from Germany, 13 from Denmark, 71 from Finland, 4 from France, 6 from Ireland, 2 from the Netherlands, 4 from Norway and 6 from Sweden. The concentration of phosphorus in highly eutrophic lakes in the EEA area has decreased since the early 1980s, whereas there have only been slight changes in lakes in general. Status of nitrate in groundwater In the European Union the concentration of nitrate in drinking waters has been regulated since 1980 by the Drinking Water Directive. This establishes a guide value of nitrate of 25 mg NO3/l (5.6 mg N/l) and a maximum admissible concentration (limit value) of 50 mg NO3/l (11.3 mg N/l). These thresholds are now widely accepted for the protection of human health. Groundwater is the major resource for drinking water in many countries of Europe. Nitrate is one of the most important pollutants in drinking water because nitrate rapidly reduces to nitrite in the body which is linked to formation of cancers. Generally, nitrate in groundwater originates from the nitrogen surplus applied to agricultural soils. Most public groundwater supplies in the EU are generally from deep wells which, in most cases, are not affected by high nitrate levels. In contrast, private and small communal supplies are usually derived from shallow groundwater sources, often with high nitrate levels exposing the population to higher risk of illness.
19
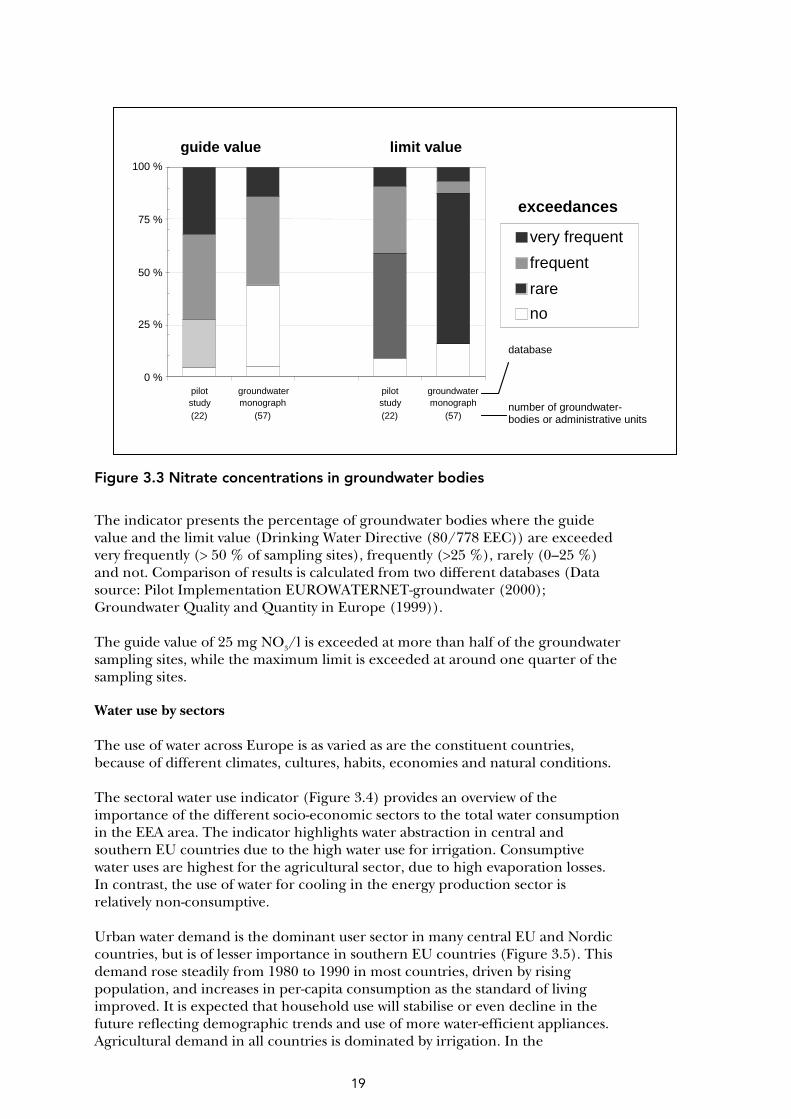
Figure 3.3 Nitrate concentrations in groundwater bodies
The indicator presents the percentage of groundwater bodies where the guide value and the limit value (Drinking Water Directive (80/778 EEC)) are exceeded very frequently (> 50 % of sampling sites), frequently (>25 %), rarely (0–25 %) and not. Comparison of results is calculated from two different databases (Data source: Pilot Implementation EUROWATERNET-groundwater (2000); Groundwater Quality and Quantity in Europe (1999)). The guide value of 25 mg NO3/l is exceeded at more than half of the groundwater sampling sites, while the maximum limit is exceeded at around one quarter of the sampling sites.
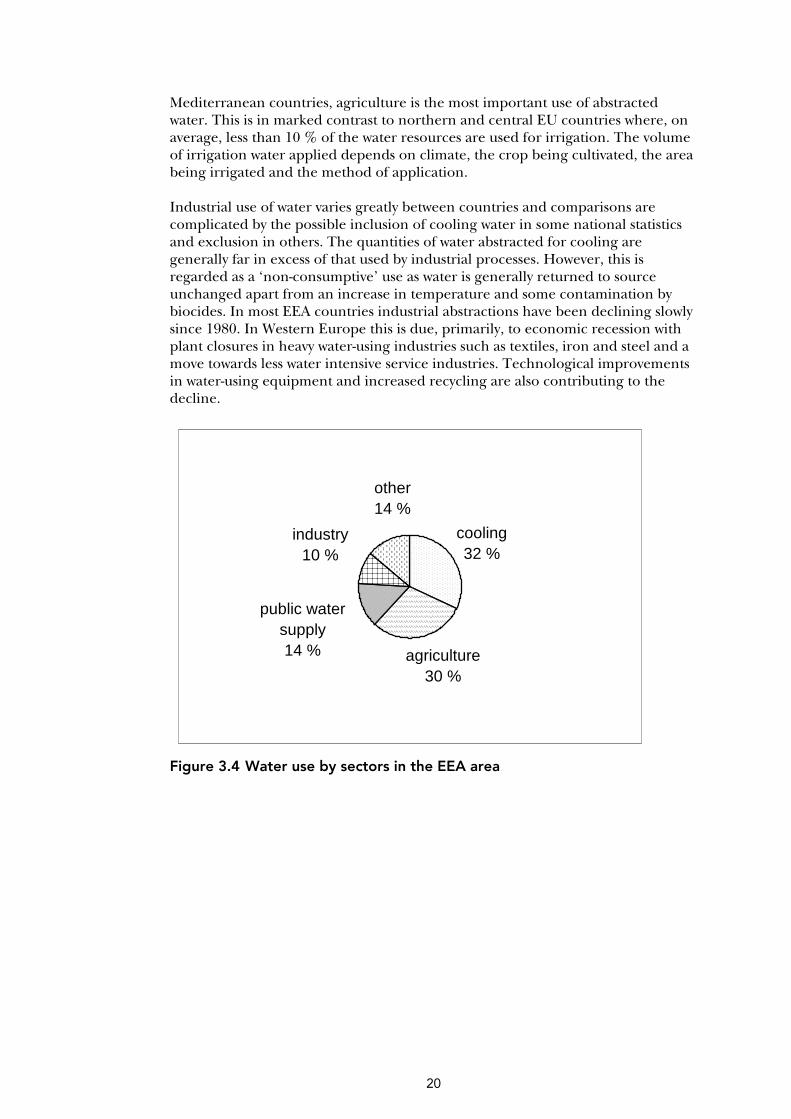
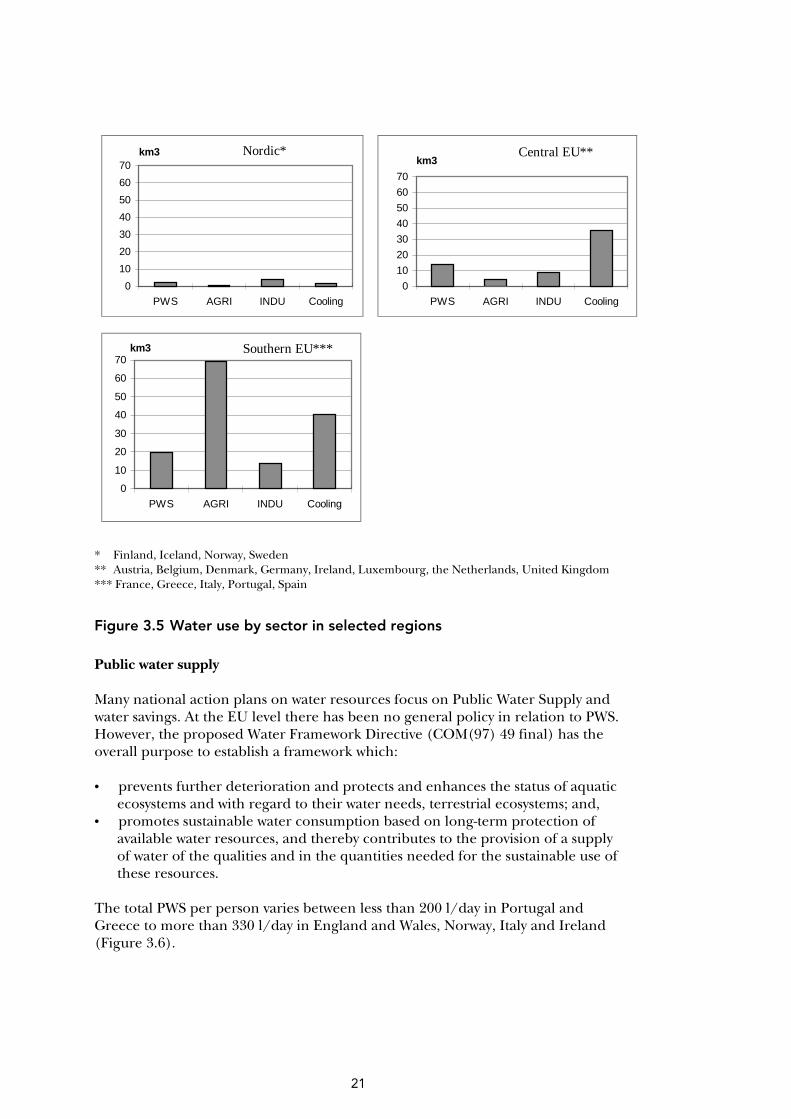
Water use by sectors The use of water across Europe is as varied as are the constituent countries, because of different climates, cultures, habits, economies and natural conditions. The sectoral water use indicator (Figure 3.4) provides an overview of the importance of the different socio-economic sectors to the total water consumption in the EEA area. The indicator highlights water abstraction in central and southern EU countries due to the high water use for irrigation. Consumptive water uses are highest for the agricultural sector, due to high evaporation losses. In contrast, the use of water for cooling in the energy production sector is relatively non-consumptive. Urban water demand is the dominant user sector in many central EU and Nordic countries, but is of lesser importance in southern EU countries (Figure 3.5). This demand rose steadily from 1980 to 1990 in most countries, driven by rising population, and increases in per-capita consumption as the standard of living improved. It is expected that household use will stabilise or even decline in the future reflecting demographic trends and use of more water-efficient appliances. Agricultural demand in all countries is dominated by irrigation. In the
0 %
25 %
50 %
75 %
100 %
pilot study (22)
groundwater monograph
(57)
pilot study (22)
groundwater monograph
(57)
very frequent
frequent
rare
no
guide value limit value
number of groundwater-bodies or administrative units
database
exceedances
20
Mediterranean countries, agriculture is the most important use of abstracted water. This is in marked contrast to northern and central EU countries where, on average, less than 10 % of the water resources are used for irrigation. The volume of irrigation water applied depends on climate, the crop being cultivated, the area being irrigated and the method of application. Industrial use of water varies greatly between countries and comparisons are complicated by the possible inclusion of cooling water in some national statistics and exclusion in others. The quantities of water abstracted for cooling are generally far in excess of that used by industrial processes. However, this is regarded as a ‘non-consumptive’ use as water is generally returned to source unchanged apart from an increase in temperature and some contamination by biocides. In most EEA countries industrial abstractions have been declining slowly since 1980. In Western Europe this is due, primarily, to economic recession with plant closures in heavy water-using industries such as textiles, iron and steel and a move towards less water intensive service industries. Technological improvements in water-using equipment and increased recycling are also contributing to the decline.
Figure 3.4 Water use by sectors in the EEA area
agriculture30 %
cooling32 %
other14 %
industry10 %
public water supply14 %
21
0
10
20
30
40
50
60
70
PWS AGRI INDU Cooling
km3 Nordic*
0
10
20
30
40
50
60
70
PWS AGRI INDU Cooling
km3Central EU**
0
10
20
30
40
50
60
70
PWS AGRI INDU Cooling
km3 Southern EU***
* Finland, Iceland, Norway, Sweden ** Austria, Belgium, Denmark, Germany, Ireland, Luxembourg, the Netherlands, United Kingdom *** France, Greece, Italy, Portugal, Spain
Figure 3.5 Water use by sector in selected regions
Public water supply Many national action plans on water resources focus on Public Water Supply and water savings. At the EU level there has been no general policy in relation to PWS. However, the proposed Water Framework Directive (COM(97) 49 final) has the overall purpose to establish a framework which: • prevents further deterioration and protects and enhances the status of aquatic
ecosystems and with regard to their water needs, terrestrial ecosystems; and, • promotes sustainable water consumption based on long-term protection of
available water resources, and thereby contributes to the provision of a supply of water of the qualities and in the quantities needed for the sustainable use of these resources.
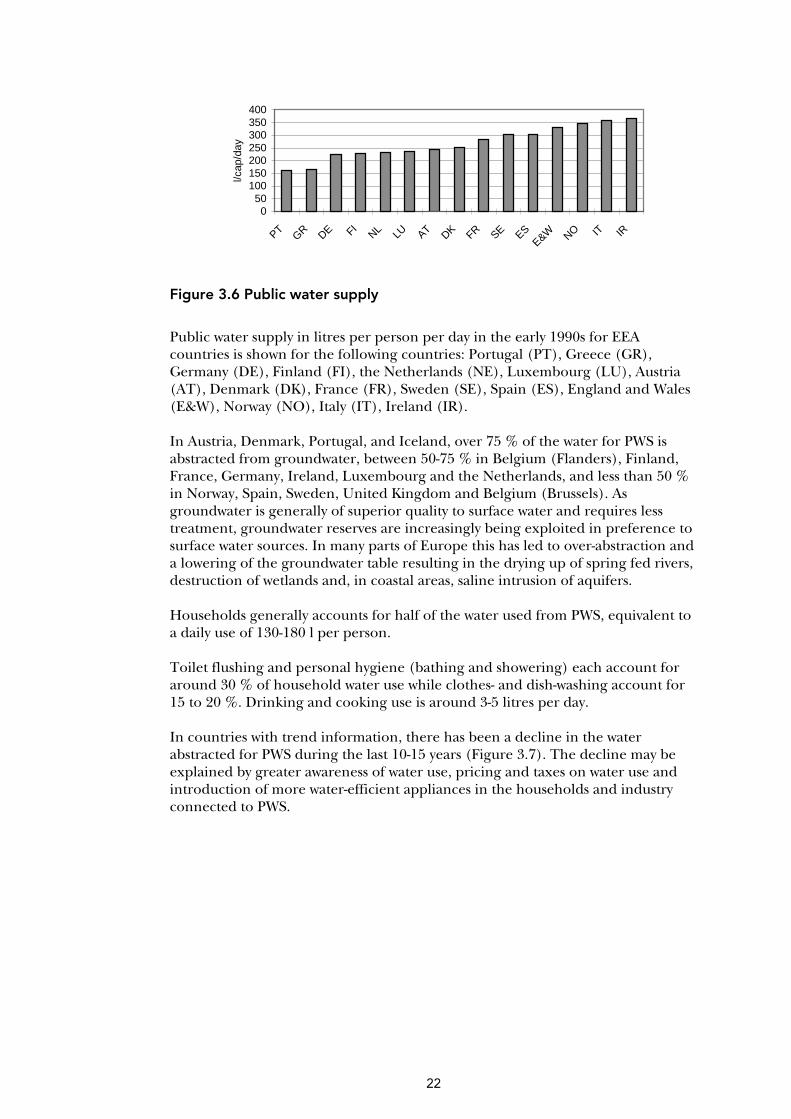
The total PWS per person varies between less than 200 l/day in Portugal and Greece to more than 330 l/day in England and Wales, Norway, Italy and Ireland (Figure 3.6).
22
050
100150200250300350400
PTGR DE FI
NL LU AT DK FR SE ESE&W NO IT IR
l/cap
/day
Figure 3.6 Public water supply
Public water supply in litres per person per day in the early 1990s for EEA countries is shown for the following countries: Portugal (PT), Greece (GR), Germany (DE), Finland (FI), the Netherlands (NE), Luxembourg (LU), Austria (AT), Denmark (DK), France (FR), Sweden (SE), Spain (ES), England and Wales (E&W), Norway (NO), Italy (IT), Ireland (IR). In Austria, Denmark, Portugal, and Iceland, over 75 % of the water for PWS is abstracted from groundwater, between 50-75 % in Belgium (Flanders), Finland, France, Germany, Ireland, Luxembourg and the Netherlands, and less than 50 % in Norway, Spain, Sweden, United Kingdom and Belgium (Brussels). As groundwater is generally of superior quality to surface water and requires less treatment, groundwater reserves are increasingly being exploited in preference to surface water sources. In many parts of Europe this has led to over-abstraction and a lowering of the groundwater table resulting in the drying up of spring fed rivers, destruction of wetlands and, in coastal areas, saline intrusion of aquifers. Households generally accounts for half of the water used from PWS, equivalent to a daily use of 130-180 l per person. Toilet flushing and personal hygiene (bathing and showering) each account for around 30 % of household water use while clothes- and dish-washing account for 15 to 20 %. Drinking and cooking use is around 3-5 litres per day. In countries with trend information, there has been a decline in the water abstracted for PWS during the last 10-15 years (Figure 3.7). The decline may be explained by greater awareness of water use, pricing and taxes on water use and introduction of more water-efficient appliances in the households and industry connected to PWS.
23
Public Water Supply
0
20
40
60
80
100
120
1985
1986
1987
1988
1989
1990
1991
1992
1993
1994
1995
ind
ex 1
985=
100
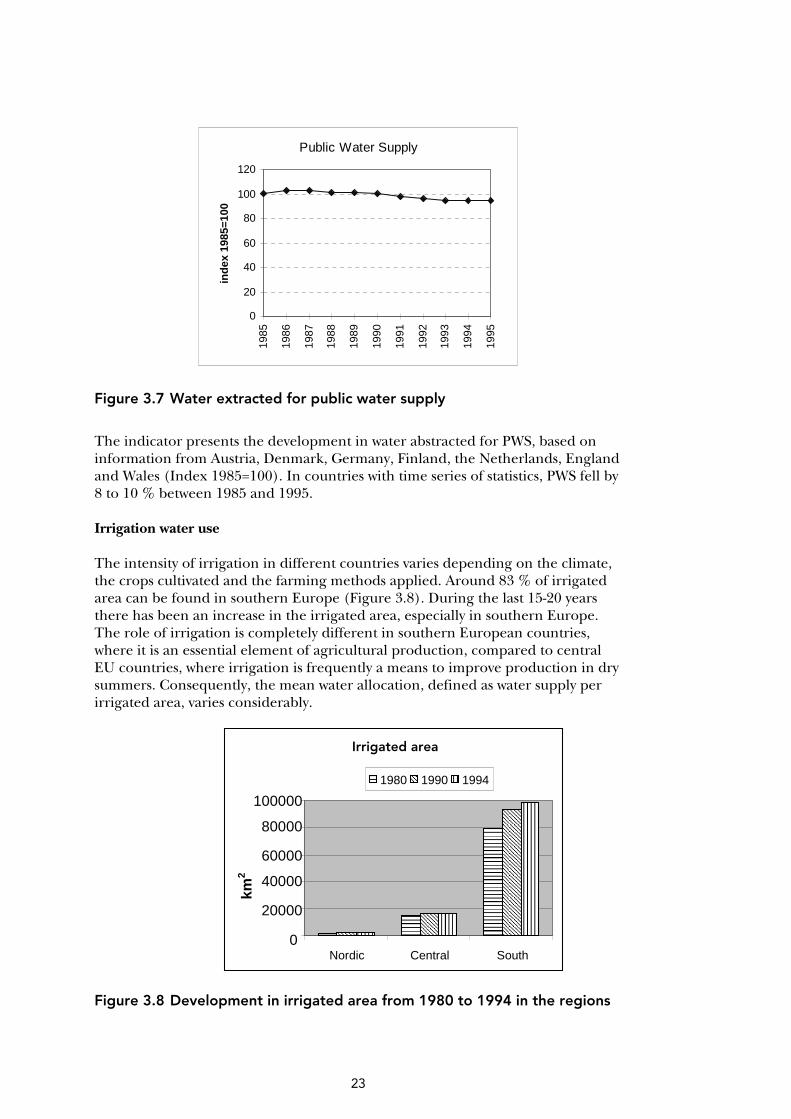
Figure 3.7 Water extracted for public water supply
The indicator presents the development in water abstracted for PWS, based on information from Austria, Denmark, Germany, Finland, the Netherlands, England and Wales (Index 1985=100). In countries with time series of statistics, PWS fell by 8 to 10 % between 1985 and 1995. Irrigation water use The intensity of irrigation in different countries varies depending on the climate, the crops cultivated and the farming methods applied. Around 83 % of irrigated area can be found in southern Europe (Figure 3.8). During the last 15-20 years there has been an increase in the irrigated area, especially in southern Europe. The role of irrigation is completely different in southern European countries, where it is an essential element of agricultural production, compared to central EU countries, where irrigation is frequently a means to improve production in dry summers. Consequently, the mean water allocation, defined as water supply per irrigated area, varies considerably.
Figure 3.8 Development in irrigated area from 1980 to 1994 in the regions
�Irrigated area
0�
20000
40000
60000
80000
100000
Nordic� Central� South�
km2 �
1980� 1990� 1994�

24
Water use for irrigation accounts for one third of the total water use in the EEA area. The year-to-year variation in irrigation water use can be considerable, therefore the trend in irrigated area more clearly illustrates potential water use for irrigation. Around 94 percent of the water used for irrigation is used in southern EU (Figure 3.9). For instance, France, Greece and Portugal each uses around the same amount of water for irrigation as the central EU countries together, and water use for irrigation in Spain and Italy is around 10 times higher than in the central EU countries.
Figure 3.9 Irrigation water use in Europe
Major irrigation water users (1995 or latest year with available data) The mean water allocation, defined as water supply per irrigated area, is around 140 mm per hectare in the Nordic countries, 260 mm in the central EU countries and 720 mm in the southern EU countries. During the last 15-20 years there has been an increase in the irrigated area, especially in southern Europe. Over the past decades the trend in agricultural water use has, in general, been upwards, because of increasing irrigation. However, it appears that more recently the rate of increase of the irrigated area has been diminishing in several countries.
3.3. Support to DG Environment
The European Commission adopted a proposal for a Water Policy Framework Directive (WFD) on 26 February 1997 (COM (97) 49) with the aim of providing: a transparent, effective and coherent legislative framework within which water policy could be formulated and resources protected.
�Irrigation water use�
Italy�43 %�
Portugal�5 %�
Spain�33 %� Greece�
6 %�
France�7 %�
Central EU�6 %�

25
EU Member States will have a legal requirement to provide the European Commission with specified information under the WFD on the status of, and pressures on, rivers, lakes, transitional and coastal waters and groundwater. Member States will be required to send copies of River Basin Management Plans, and all subsequent updates, to the Commission within three months of their publication. Summary reports are also required. The European Environment Agency’s information and monitoring network for inland waters (EURO-WATERNET) could also be used by Member States to submit a significant part of the information required by the Commission under various Articles of the Water Framework Directive. The Commission intends to explore this option further with the EEA and Member States, with a view to producing a guidance note if appropriate. In 1999, ETC/IW produced a document for DG Environment and the National Experts Group to investigate the feasibility of using the EUROWATERNET criteria for reporting under the Water Framework Directive.
Table 3.4 Comparison between criteria proposed for Water Framework Directive and EUROWATERNET
Water Framework Directive
EUROWATERNET
Rivers Size (catchment area): • small 10 to 100 km2 • medium 100 to 1,000 km2 • large 1,000 to 10,000 km2 • very large >10,000 km2
Size (catchment area): • small: <50 km2; • medium: 50 km2 to <250 km2; • large: 250 km2 to <1,000 km2; • very large: 1,000 km2 to <2,500 km2; • largest: ≥2,500 km2
Altitude: • high > 800 m • mid-altitude 200 to 800 m • lowland < 200 m
Altitude: a = >800 m b = 500 to 800 m c = 200 to 500 m d = 100 to 200 m e = <100 m
Geology:calcareous ,siliceous, organic
Geology
Lakes Size (surface area) • 0.5 to 1 km2 • > 1 to 10 km2 • > 10 to 100 km2 • > 100 km2
Size (surface area) • small lakes >0.1 to 1 km2 • medium lakes >1 to 10 km2 • large lakes >10 to 100 km2 • very large lakes >100 km2
Altitude: • high > 800 m • mid-altitude 200 to 800 m • lowland < 200 m
Altitude: a = >800 m b = 500 to 800 m c = 200 to 500 m d = 100 to 200 m e = <100 m
Depth (mean depth) • < 3 m, • >3 m to 15 m, • >15 m
Depth (mean depth) • < 3 m, • >3 m to 15 m, • >15 m
Geology: calcareous, siliceous, organic
Geology
Groundwaters No lower threshold for groundwater bodies:
all must be considered, although the Member States can group them together
All important groundwater bodies (groundwater in porous media, karst groundwater and others), both shallow and deep aquifers. Important groundwater bodies: > 300 km²; or of regional, socio-economic or environ-mental importance in terms of quantity and quality; or, exposed to severe or major impacts.

26
The comparison above illustrates that though the typologies are not identical for every attribute they are consistent with each other. The criteria used for EUROWATERNET are intended as guidelines. Actual values for each attribute are required so that re-classification and comparison according to size or other physical characteristics can be undertaken and modified at a later stage, if necessary. EUROWATERNET has also more specific criteria for selecting groundwater bodies whereas the Water Framework Directive is more general even though it covers all groundwater bodies.
3.4. IRENIE project
The IRENIE (Improved Reporting of ENvironmental Information on Eionet) project aims to improve the process of transferring environmental data, and hence information, through systems at different levels of aggregation, from local to national to European level. An objective of the project was that software developed during the course of the project should be as far as possible generic, so that they can be adapted to other data management systems in EIONET. The Environmental Internet Data Visualizer (EIDV) developed within the project has been integrated into the ETC/IW EIONET server environment (http://etc-iw.eionet.eu.int:443/), using the WATERBASE database as the source of meta-data and measured determinands. Users can access WATERBASE using a web-based graphical application which permits the selection of EUROWATERNET monitoring stations by mouse-clicking on a map. Statistical information (graphs, charts and tables) can then be selected from a number of pull-down menus. Public access will be available early in 2000. Work will continue on further software developments and improving the quality of data held in WATERBASE. The system architecture is shown below:
Figure 3.10 General Architecture of IRENIE project
27
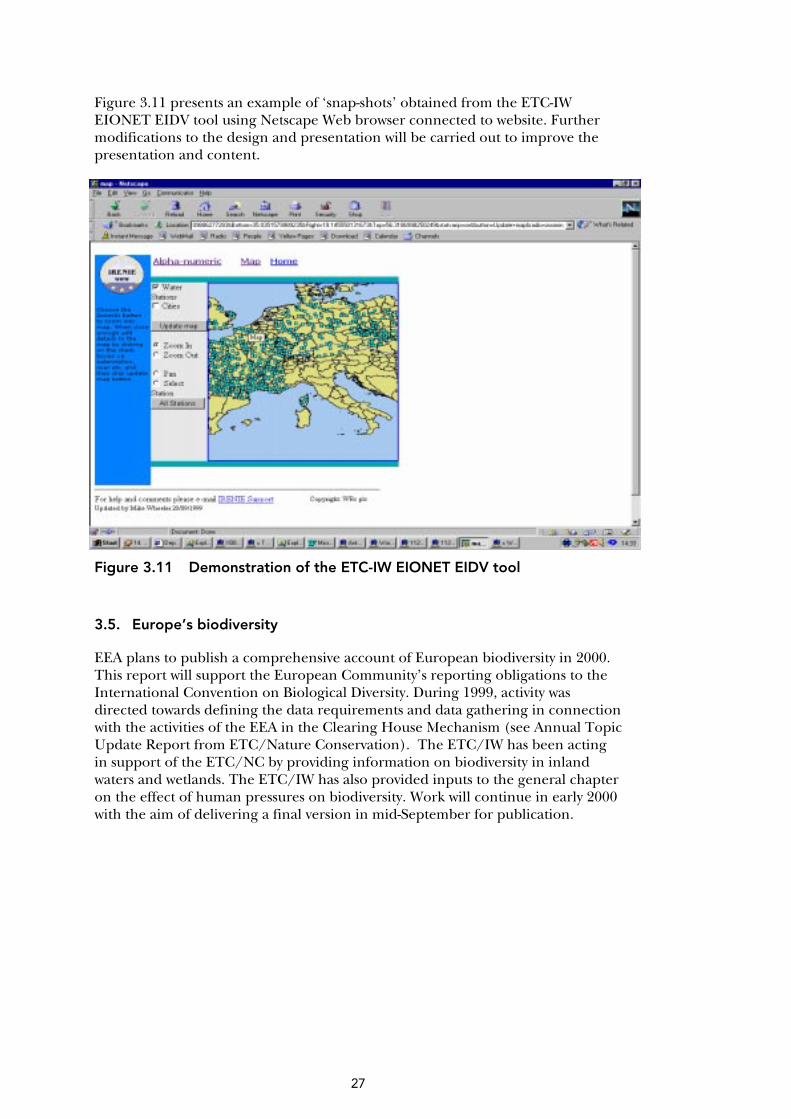
Figure 3.11 presents an example of ‘snap-shots’ obtained from the ETC-IW EIONET EIDV tool using Netscape Web browser connected to website. Further modifications to the design and presentation will be carried out to improve the presentation and content.
Figure 3.11 Demonstration of the ETC-IW EIONET EIDV tool
3.5. Europe’s biodiversity
EEA plans to publish a comprehensive account of European biodiversity in 2000. This report will support the European Community’s reporting obligations to the International Convention on Biological Diversity. During 1999, activity was directed towards defining the data requirements and data gathering in connection with the activities of the EEA in the Clearing House Mechanism (see Annual Topic Update Report from ETC/Nature Conservation). The ETC/IW has been acting in support of the ETC/NC by providing information on biodiversity in inland waters and wetlands. The ETC/IW has also provided inputs to the general chapter on the effect of human pressures on biodiversity. Work will continue in early 2000 with the aim of delivering a final version in mid-September for publication.
28
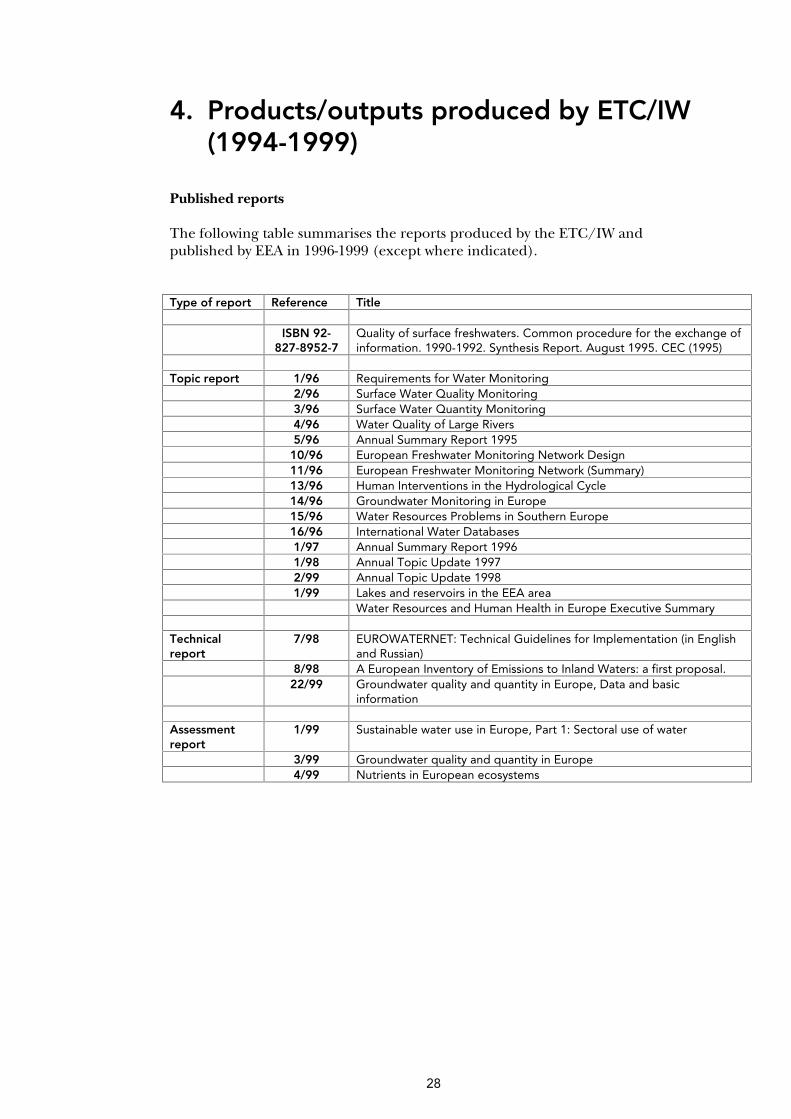
4. Products/outputs produced by ETC/IW (1994-1999)
Published reports The following table summarises the reports produced by the ETC/IW and published by EEA in 1996-1999 (except where indicated). Type of report Reference Title ISBN 92-
827-8952-7 Quality of surface freshwaters. Common procedure for the exchange of information. 1990-1992. Synthesis Report. August 1995. CEC (1995)
Topic report 1/96 Requirements for Water Monitoring 2/96 Surface Water Quality Monitoring 3/96 Surface Water Quantity Monitoring 4/96 Water Quality of Large Rivers 5/96 Annual Summary Report 1995 10/96 European Freshwater Monitoring Network Design 11/96 European Freshwater Monitoring Network (Summary) 13/96 Human Interventions in the Hydrological Cycle 14/96 Groundwater Monitoring in Europe 15/96 Water Resources Problems in Southern Europe 16/96 International Water Databases 1/97 Annual Summary Report 1996 1/98 Annual Topic Update 1997 2/99 Annual Topic Update 1998 1/99 Lakes and reservoirs in the EEA area Water Resources and Human Health in Europe Executive Summary Technical report
7/98 EUROWATERNET: Technical Guidelines for Implementation (in English and Russian)
8/98 A European Inventory of Emissions to Inland Waters: a first proposal. 22/99 Groundwater quality and quantity in Europe, Data and basic
information Assessment report
1/99 Sustainable water use in Europe, Part 1: Sectoral use of water
3/99 Groundwater quality and quantity in Europe 4/99 Nutrients in European ecosystems
29
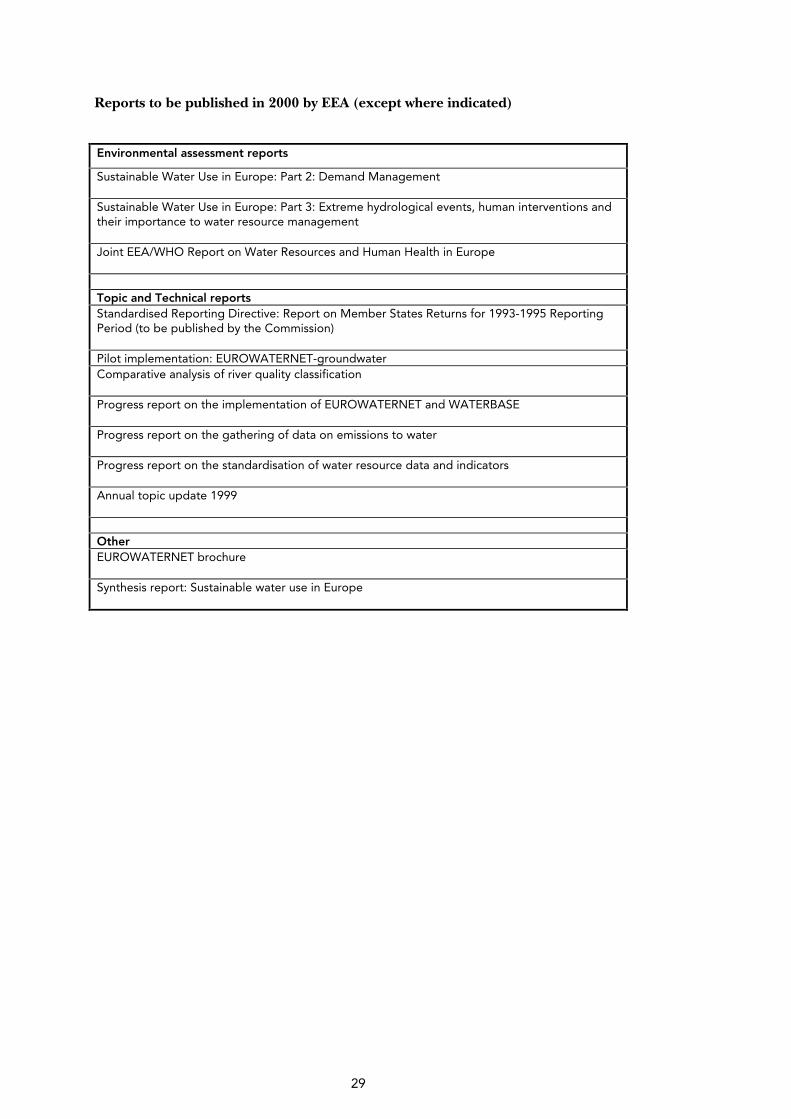
Reports to be published in 2000 by EEA (except where indicated)
Environmental assessment reports
Sustainable Water Use in Europe: Part 2: Demand Management Sustainable Water Use in Europe: Part 3: Extreme hydrological events, human interventions and their importance to water resource management Joint EEA/WHO Report on Water Resources and Human Health in Europe Topic and Technical reports Standardised Reporting Directive: Report on Member States Returns for 1993-1995 Reporting Period (to be published by the Commission) Pilot implementation: EUROWATERNET-groundwater Comparative analysis of river quality classification Progress report on the implementation of EUROWATERNET and WATERBASE Progress report on the gathering of data on emissions to water Progress report on the standardisation of water resource data and indicators Annual topic update 1999 Other EUROWATERNET brochure Synthesis report: Sustainable water use in Europe
30
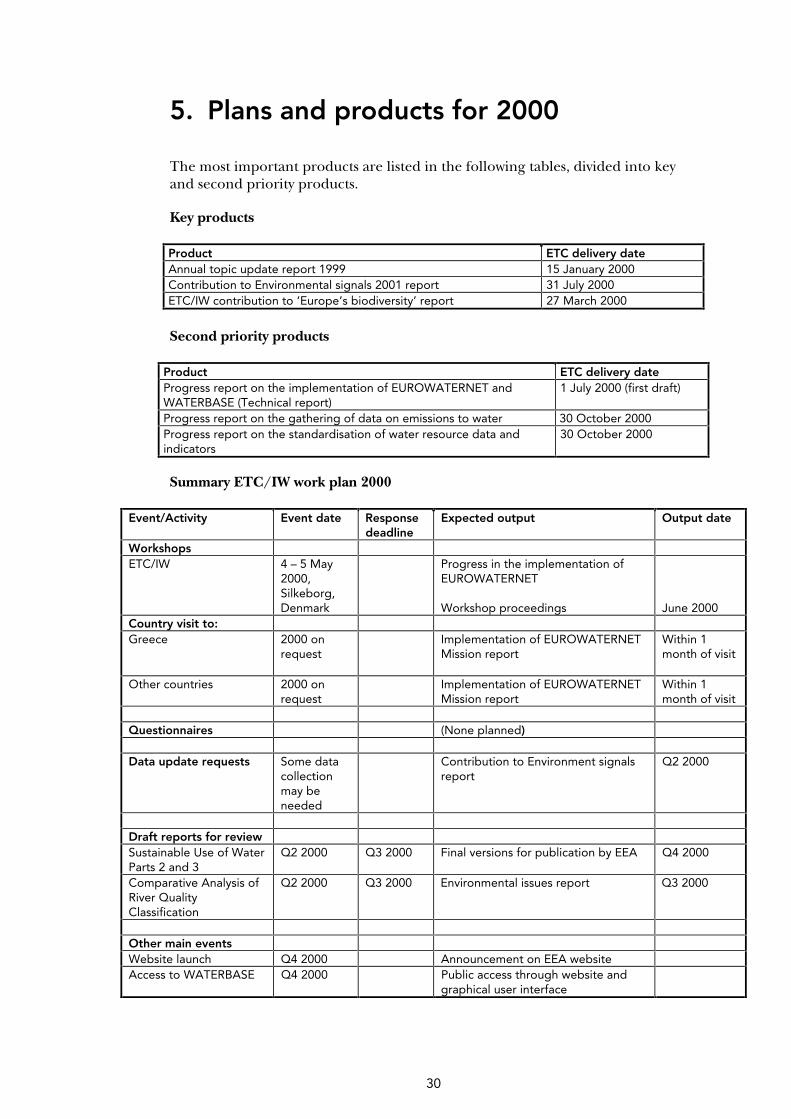
5. Plans and products for 2000
The most important products are listed in the following tables, divided into key and second priority products.
Key products Product ETC delivery date Annual topic update report 1999 15 January 2000 Contribution to Environmental signals 2001 report 31 July 2000 ETC/IW contribution to ‘Europe’s biodiversity’ report 27 March 2000
Second priority products
Product ETC delivery date Progress report on the implementation of EUROWATERNET and WATERBASE (Technical report)
1 July 2000 (first draft)
Progress report on the gathering of data on emissions to water 30 October 2000 Progress report on the standardisation of water resource data and indicators
30 October 2000
Summary ETC/IW work plan 2000
Event/Activity Event date Response deadline
Expected output Output date
Workshops ETC/IW 4 – 5 May
2000, Silkeborg, Denmark
Progress in the implementation of EUROWATERNET Workshop proceedings
June 2000
Country visit to: Greece 2000 on
request Implementation of EUROWATERNET
Mission report
Within 1 month of visit
Other countries 2000 on request
Implementation of EUROWATERNET Mission report
Within 1 month of visit
Questionnaires (None planned) Data update requests Some data
collection may be needed
Contribution to Environment signals report
Q2 2000
Draft reports for review Sustainable Use of Water Parts 2 and 3
Q2 2000 Q3 2000 Final versions for publication by EEA Q4 2000
Comparative Analysis of River Quality Classification
Q2 2000 Q3 2000 Environmental issues report Q3 2000
Other main events Website launch Q4 2000 Announcement on EEA website Access to WATERBASE Q4 2000 Public access through website and
graphical user interface