Embed Size (px)
Citation preview

Electricity Distribution
Annual Tariff Proposal 2018
1 January 2018

Annual Tariff Proposal 2018
ISSUE 17 PAGE 2 OF 79 UNCONTROLLED WHEN PRINTED APPROVED BY AUSTRALIAN ENERGY REGULATOR
Issue/Amendment Status
Issue Number
Date
Description Author Approved by
17 28/09/2017 Updated for 2018 Tariffs Kate Jdanova Charlotte Eddy
16 06/10/2016 Updated for 2017 Tariffs Eric Howie Anh Mai
15 19/11/2015 Updated for 2016 Tariffs Eric Howie Anh Mai
14 31/10/2015 Updated for 2015 Tariffs Eric Howie Tom Hallam
13 31/10/2013 Updated for 2015 Tariffs Eric Howie Tom Hallam
12 31/10/2012 Updated for 2013 Tariffs Eric Howie Tom Hallam
11 31/10/2011 Updated for 2012 Tariffs Eric Howie Tom Hallam
Disclaimer
This template is for generating internal and external document belonging to AusNet Services and may or may not contain all available information on the subject matter this document purports to address. The information contained in this document is subject to review AusNet Services may amend this document at any time. Amendments will be indicated in the Amendment Table, but AusNet Services does not undertake to keep this document up to date.
To the maximum extent permitted by law, AusNet Services makes no representation or warranty (express or implied) as to the accuracy, reliability, or completeness of the information contained in this document, or its suitability for any intended purpose. AusNet Services (which, for the purposes of this disclaimer, includes all of its related bodies corporate, its officers, employees, contractors, agents and consultants, and those of its related bodies corporate) shall have no liability for any loss or damage (be it direct or indirect, including liability by reason of negligence or negligent misstatement) for any statements, opinions, information or matter (expressed or implied) arising out of, contained in, or derived from, or for any omissions from, the information in this document.
Contact
This document is the responsibility of Regulatory and Network Strategy, AusNet Services. Please contact the indicated owner of the document below with any inquiries.
Kate Jdanova AusNet Services Level 31, 2 Southbank Boulevard Melbourne Victoria 3006 Ph: (03) 9695 6000

Annual Tariff Proposal 2018
ISSUE 17 PAGE 3 OF 79 UNCONTROLLED WHEN PRINTED APPROVED BY AUSTRALIAN ENERGY REGULATOR
Table of Contents
1 Introduction 5
1.1 About AusNet Services 5
1.2 Network Charges and Other Charges 7
1.3 Structure of this document 7
2 Regulatory Environment 9
2.1 The Tariff Structure Statement and Changes to 2018 tariffs 9
2.2 Electricity Distribution Price Review requirements 11
2.2.1 Total Annual Revenue 11
2.2.2 Revenue Cap Formulae 13
3 Network Tariff Classes 17
4 Proposed Tariffs and Charging Parameters 18
4.1 Background to Tariff Access 18
4.2 Legacy Tariffs 18
4.3 Flexible Tariffs 19
4.4 Cost Reflective Tariffs 20
4.5 Tariff Reassignments for 40 – 160MWh Customers 21
4.5.1 Customers on Single Rate Tariffs 22
4.5.2 Customers with Dedicated Circuits, Two Rate, and Multi Rate Tariffs 23
4.5.3 Customers with Small Generator (Solar) Tariffs 24
4.6 Charging Parameters 24
4.6.1 Tariff Structures 26
4.7 Indicative tariffs 35
4.8 Long run Marginal Cost 40
4.9 Stand Alone and Avoidable Costs 40
5 Variations To Tariffs 41
5.1 Small Residential 41
5.2 Small Industrial & Commercial 43
5.3 Medium Industrial & Commercial 44
5.4 Large LV Industrial & Commercial 45
5.5 Large HV Industrial & Commercial 47
5.6 Large ST Industrial & Commercial 47
5.7 Capacity & Critical Peak Tariffs 48
5.8 Power Factor Correction 51
6 Designated Pricing Proposal Charges 52

Annual Tariff Proposal 2018
ISSUE 17 PAGE 4 OF 79 UNCONTROLLED WHEN PRINTED APPROVED BY AUSTRALIAN ENERGY REGULATOR
6.1 Overview 52
6.2 Charges for 2018 52
7 Jurisdictional Pricing Proposal Charges 54
7.1 Overview 54
7.2 Jurisdictional Charges for 2018 54
8 Public Lighting 55
8.1 Public Lighting Overview 55
8.2 Public Lighting Tariffs for 2018 55
9 Ancillary Network Services 56
9.1 Ancillary Network Services Overview 56
9.2 Price Changes for 2018 56
10 Prescribed Metering Charges 57
10.1 Electricity Distribution Price Review annual metering charges requirements 57
10.1 Metering Charges Unders and Overs Account 59
11 Glossary 60
12 Attachments 63
12.1 Network Tariff Schedule 64
12.2 Distribution Use of System Tariff Schedule 66
12.3 Transmission Use of System Tariff Schedule 68
12.4 Jurisdictional Tariff Schedule 70
12.5 Tariff Structure 72
12.6 Prescribed Metering Schedule 74
12.7 Ancillary Services Schedule 76
12.8 Public lighting Schedule 78

ISSUE 17 PAGE 5 OF 79 UNCONTROLLED WHEN PRINTED APPROVED BY AUSTRALIAN ENERGY REGULATOR
1 Introduction This document, its appendices and attachments comprise AusNet Services’ 2018 pricing proposal. It covers all our direct control (standard control and alternative control) services for 2018 in accordance with clause 6.18.2 of the National Electricity Rules and the AER’s Final Distribution Determination 2016 to 2020. Clause 6.18 of the Rules sets out the requirements concerning distribution pricing. These requirements include the pricing principles which guide this pricing proposal, and the matters the pricing proposal must address including:
• Classification of services; • The pricing control mechanism; • Assigning and reassigning customers to tariff classes; • Recovery of transmission costs; and • Recovery of jurisdictional scheme amounts.
1.1 About AusNet Services
AusNet Services’ electricity distribution network delivers electricity to 605,000 households and 75,000 businesses. The network is made up of 44,000 kilometres of electricity lines, predominantly overhead network traversing rural areas and built over the period from the 1950s to the present.
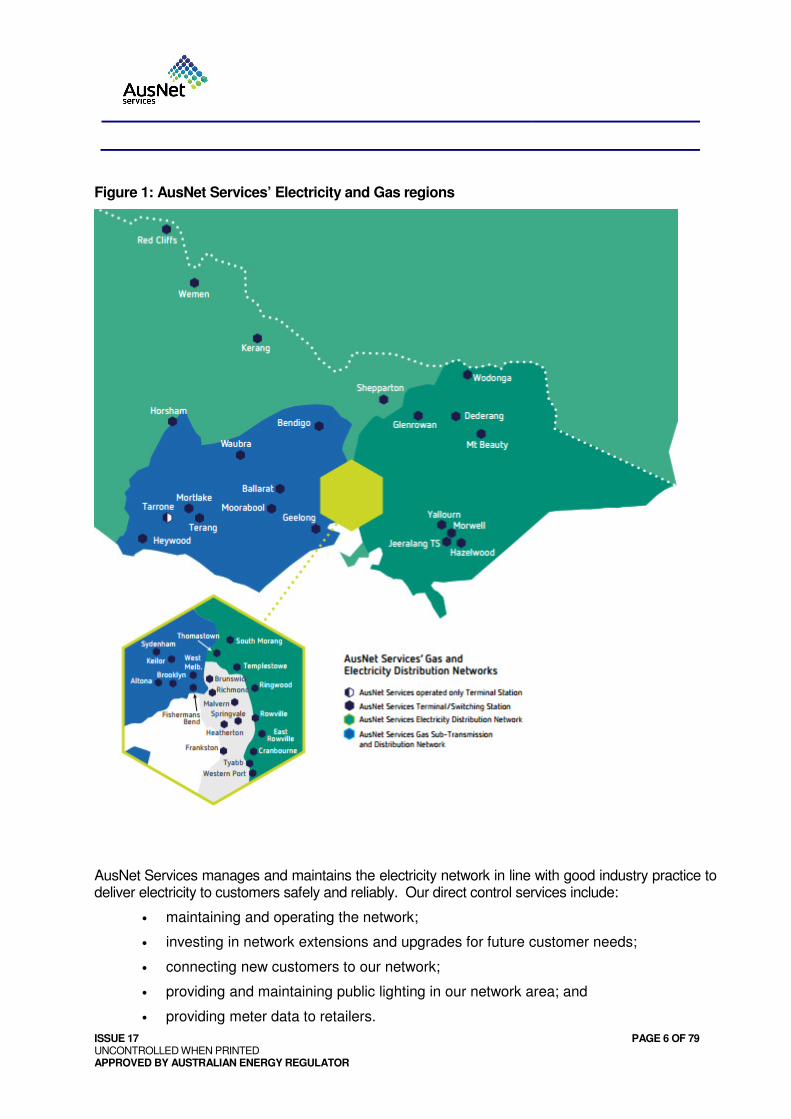
Split by the Great Dividing Range, the network covers heavily forested and mountainous areas, as well as the low lying and coastal regions of Gippsland. On the northern and eastern fringes of Melbourne, the network services highly populated suburbs including through the heavily vegetated Dandenong Ranges. AusNet Services’ electricity distribution area is shown in Figure 1 below.
ISSUE 17 PAGE 6 OF 79 UNCONTROLLED WHEN PRINTED APPROVED BY AUSTRALIAN ENERGY REGULATOR
Figure 1: AusNet Services’ Electricity and Gas regions
AusNet Services manages and maintains the electricity network in line with good industry practice to deliver electricity to customers safely and reliably. Our direct control services include:
• maintaining and operating the network;
• investing in network extensions and upgrades for future customer needs;
• connecting new customers to our network;
• providing and maintaining public lighting in our network area; and
• providing meter data to retailers.

ISSUE 17 PAGE 7 OF 79 UNCONTROLLED WHEN PRINTED APPROVED BY AUSTRALIAN ENERGY REGULATOR
The revenue obtained from tariffs and charges in this Pricing Proposal funds the above services.
1.2 Network Charges and Other Charges
Network tariffs (for standard control services) cover the cost of transporting electricity from the generator through the transmission and distribution networks to our customers’ homes or businesses. Network charges also recover jurisdictional schemes costs which currently comprise the Victorian premium and transitional feed-in tariff schemes.
On average, 2018 distribution network tariffs will be 4% lower than in 2017.
Charges for a variety of other services (referred to in the rules as Alternative Control Services) are also addressed in this Proposal. This includes:
• metering tariffs which cover the costs of the meter and meter data services;
• public lighting charges which relate to the provision and maintenance of public lighting services; and
• other distribution services that are provided in response to the request or specific needs of our customers. Typical examples of these services are Field Officer Visits, Truck Visits and Connection Services for new customers.
1.3 Structure of this document
The purpose of this proposal is to enable distribution customers to understand the basis for the tariff policies adopted by AusNet Services and to communicate changes in tariffs. The structure of this document is outlined in the table below, including how it addresses the informational requirements of Clause 6.18 of the Rules.
Table 1.3 – Proposal Structure
Section Title Intent Rules Compliance
1 Introduction AusNet Services role & services
-
2 Regulatory Environment Description of Price Regulation requirements
-
3 Network Tariff Classes Tariff and Tariff Class descriptions
6.18.2(b)(2)
4 Proposed Tariffs And Charging Parameters
Tariff Rates for 2018 and how they are applied to customers
6.18.2(b)(3)
5 Total Annual Revenue Total revenue by tariff class
6.18.2(b)(4)
6 Variations To Tariffs Changes in rates from TSS and impact on future years
6.18.2(b)(5)

ISSUE 17 PAGE 8 OF 79 UNCONTROLLED WHEN PRINTED APPROVED BY AUSTRALIAN ENERGY REGULATOR
Section Title Intent Rules Compliance
7 Designated Pricing Proposal Charges
How transmission charges are recovered
6.18.2(b)(6)
8 Jurisdictional Pricing Proposal Charges
How Jurisdictional costs are recovered
6.18.2(b)(7) & (8)
9 Distribution Use Of System Unders And Overs Account
True-ups to prior years
10 Proposed Network Tariffs 6.18.2 (d)(e)
11 Annual System Of Assessment And Review Of Tariffs
12 Public Lighting Public Lighting services and charges
13 Ancillary Network Services Ancillary Services 6.2.2 (a)
14 Prescribed Metering Charges How Prescribed metering costs are applied
15 Glossary Description of terms used in this document
16 Attachments Sets out pricing schedules.

ISSUE 17 PAGE 9 OF 79 UNCONTROLLED WHEN PRINTED APPROVED BY AUSTRALIAN ENERGY REGULATOR
2 Regulatory Environment
The AER regulates AusNet Services’ electricity distribution revenues and tariffs. The primary instruments of its regulation are:
• the relevant Electricity Distribution Revenue Determination for AusNet Services;
• the relevant Tariff Structure Statement; and
• the annual Pricing Proposal decision.
In developing this Pricing Proposal, AusNet Services has therefore reflected and ensured consistency with:
• the AER’s Final Distribution Revenue Determination for the period 2016 to 2020 made on 26 May 2016;
• our Tariff Structure Statement (TSS) for the period 2017-2020 which was approved by the AER on 24 August 2016; and
• an addendum to the TSS (discussed further in Section 2.1) approved by the AER on 20 September 2017
It is noted that the pricing arrangements in Victoria have evolved over time. AusNet Services considers the 2017-20 TSS as an important step towards a pricing landscape that will increasingly see prices reflecting costs.
2.1 The Tariff Structure Statement and Changes to 2018 tariffs
On 30 October 2015 AusNet Services submitted its first TSS proposal to the AER. The AER approved the TSS and tariff structures applying for the 2017-20 period.
If any conflict exists between this document and the Approved TSS (and its September 2017 addendum), the TSS will prevail unless the contrary is explicitly stated.
AusNet Services notes that since 2002 AusNet Services has classified Small Industrial & Commercial (I&C) customers as those using up to 160MWh and Medium sized customers as those using 160MWh to 400MWh, consistent with National Market definitions. However, AusNet Services’ TSS (at Table 3.3) identified Small I & C customers as those using up to 70MWh and Medium I & C customers as those using between 70MWh and 400MWh. To clarify, the TSS was incorrect in stating this, and this Pricing Proposal continues to use the existing classification.
For AusNet Services to comply with these settings further tariffs not proposed in the TSS and not included in the current proposal would be required to accommodate customers using between 70MWh and 160MWh that would also need to be assigned to a cost reflective tariff similar in structure to the proposed NASN19 and NASN21 tariffs but classified as Medium I&C. This would also result in a non-compliance with the approved TSS. Therefore AusNet Services preferred solution is to vary the Approved TSS by updating the relevant tables This has no impact on customers in those tariff classes. The following table sets out the correct tariff classifications:

ISSUE 17 PAGE 10 OF 79 UNCONTROLLED WHEN PRINTED APPROVED BY AUSTRALIAN ENERGY REGULATOR
Table 2.1 - AusNet Services’ proposed tariff classes
Tariff Classes Typical Customer Tariffs
Residential
Small LV Residential Customers, 230V & 415V
NEE11, NGT11, NSP11, NEN11, NEE20, NSP20, NGT20, NEN20, NEE23, NSP23, NEE24, NEE30, NSP30, NEE31, NSP31, NEE32,NSP32, NASN11
Small I & C Small LV Industrial & commercial customers using up to 160MWh a year, 230V & 415V
NEE12, NSP12, NEN12, NEE21, NSP21, NSP27, NEN21, NEE25, NASN12, NASN19, NASN21
Medium I & C Medium LV Industrial & Commercial customers using between 160MWh and 400MWh a year, 415V
NEE40, NEE51, NEE55, NSP55, NSP56, NEE60, NEE52
Large I & C Large LV Industrial & Commercial customers using over 400MWh a year, 415V
NSP75, NSP76, NSP77, NSP78
High Voltage Large HV Industrial & Commercial customers 6.6kV, 11kV & 22kV
NSP81, NSP82, NSP83
Sub Transmission Large Extra HV Industrial & Commercial customers 66kV, & Supplies to Latrobe Valley Open Cuts and Works areas.
NSP91, NEE93, NSP94, NSP95
* Additional tariffs in schedules are created by combining Dedicated Circuit tariffs with other tariffs where customers have two element metering installed or by including Premium Transitional and Standard Feed-In arrangements for small PV customers.
The TSS provides for the introduction of opt-in cost-reflective demand tariffs for residential and small commercial customers (<40MWh consumption per year) commencing in 2018. These tariffs are accordingly included in tariff schedules in this Tariff Proposal. We note that energy-based seasonal time of use tariffs continue to be available as an alternative cost reflective tariff structure.
An amendment to the 2016 TSS was necessary to comply with Victorian government policy amendment which is given effect via orders in council gazetted on 14 September 2017. The policy requires that medium business customers, i.e. customers consuming between 40MWh and 160MWh per year, have the option to opt-out of the network tariff with a demand charge to which they have been assigned. The opt-out arrangement is to apply from 1 January 2018.

ISSUE 17 PAGE 11 OF 79 UNCONTROLLED WHEN PRINTED APPROVED BY AUSTRALIAN ENERGY REGULATOR
2.2 Electricity Distribution Price Review requirements
AusNet Services revenue and pricing must comply with its 2016 – 20 Electricity Distribution Price Determination. Total revenues recovered through distribution prices and the relevant price formulae are explained in more detail below.
2.2.1 Total Annual Revenue
AusNet Services Total Annual Revenue for 2018 is determined by the AER taking account of the Annual Smoothed Revenue determined in the 2016 – 2020 Electricity Distribution Price Review and adjusting for CPI, service target performance incentive scheme results, f–factor scheme, the final carryover amount from the application of the DMIS from the 2011–15 regulatory control period, the recovery of Victorian Government license fee charges, the under or over recovery of revenue collected through DUoS charges in previous years, any AER approved pass through amounts and the X factor revised for the return on debt.
Taking account of each of these adjustments AusNet Services annual distribution revenue for 2018 is $616.8M. The following table shows how the above components make up the Total Annual revenue for 2018.
Annual Revenue Item $M
Adjusted Annual Smoothed Revenue for year t 612.236
I factor for year t (F factor Scheme) 0.750
DUoS revenue under/over recovery approved 3.607
License Fee Recovery Amount for year t 0.182
Approved Pass through Amount for year t 0
Total Annual Revenue 616.775
Network Revenues also include the recovery of Transmission Costs and Jurisdictional amounts. For 2018 the recovery of these components are $85.9M and $18.2M, and total Network Revenue is $720.9M. The proportions are shown in the figure below.

ISSUE 17 PAGE 12 OF 79 UNCONTROLLED WHEN PRINTED APPROVED BY AUSTRALIAN ENERGY REGULATOR
Figure 2.2.1: Components of Total Revenue
The chart below shows the proportion of Distribution, Transmission, and Jurisdictional charges in each network tariff.
Transmission charges are discussed in section 6, and Jurisdictional charges are addressed in further detail in section 7.

ISSUE 17 PAGE 13 OF 79 UNCONTROLLED WHEN PRINTED APPROVED BY AUSTRALIAN ENERGY REGULATOR
2.2.2 Revenue Cap Formulae
As of 1 January 2016 AusNet Services’ is subject to a Revenue Cap form of regulation.
For 2016 under the Revenue Cap regulation distribution prices were set in accordance with the formula set out in Attachment 14 of the AER Preliminary Decision which is as follows:
Price Control Formula
o ij
t
m
j
ij
t
n
i
t qpTAR ∑∑==
≥11
i=1,..,n and j=1,..,m and t=1,..,5
o ttttt BTIAARTAR +++= t = 1,2,…,5
o )1( ttt SARAAR +=
t = 1
o )1)(1)(1(1 ttttt SXCPIAARAAR +−∆+= − t = 2,…,5
where;
tTAR is the total annual revenue in year t.
ij
tp is the price of component j of tariff i in year t.
ij
tq is the forecast quantity of component j of tariff i in year t.
tAAR is the adjusted annual smoothed revenue requirement for year t.
tI is the annual adjustment f–factor scheme amount in year t. This amount will be calculated as
per the method set out in the relevant f–factor scheme.
tT is the final carryover amount from the application of the DMIS from the 2011–15 regulatory
control period. This amount will be calculated using the method set out in the DMIS and will be deducted from/added to allowed revenue in the 2018 pricing proposal.
tB is the sum of:
• the recovery of license fee charges by the Victorian Essential Services Commission
indexed by one and a half years of interest, calculated using the following method:
( )( ) 2/1
211 11 −−− ++ ttt WACCWACCL
where:
1−tL are the licence fees paid by AusNet Services to the Victorian Essential
Services Commission in the financial year ending in June of regulatory year t–1,
WACC is the approved nominal weighted average cost of capital (WACC ) for the relevant regulatory year using the following method,
( ) ( )( ) 11 1 −∆+×+= ttt CPIWACC Vanilla realWACC vanilla Nominal

ISSUE 17 PAGE 14 OF 79 UNCONTROLLED WHEN PRINTED APPROVED BY AUSTRALIAN ENERGY REGULATOR
where the tla WACCreal Vanil is as set out in our final decision PTRM and
updated annually
• any under or over recovery of actual revenue collected through DUoS charges in
regulatory year t–2 as calculated using the method in appendix A of Attachment 14
of the AER Preliminary Decision 2016-20;
• the AER approved pass through amounts (positive or negative) with respect to
regulatory year t.
tAR is the annual smoothed revenue requirement as stated in the Post Tax Revenue Model (PTRM)
for year t (when year t is the first year of the 2016–20 regulatory control period).
tS is the s-factor determined in accordance with the service target performance incentive scheme
(STPIS) for regulatory year t.
tCPI∆ is the annual percentage change in the ABS CPI All Groups, Weighted Average of Eight
Capital Cities from the June quarter in year t–2 to the June quarter in year t–1, calculated using the following method:
The ABS CPI All Groups, Weighted Average of Eight Capital Cities for the June quarter in regulatory year t–1 divided by The ABS CPI All Groups, Weighted Average of Eight Capital Cities for the June quarter in regulatory year t–2 minus one.
For example, for the 2017 regulatory year, t–2 is June quarter 2015 and t–1 is June quarter 2016 and for the 2018 regulatory year, t–2 is June quarter 2016 and t–1 is June quarter 2017 and so on.
tX is the X factor for each year of the 2016–20 regulatory control period as determined in the
PTRM, and annually revised for the return on debt update in accordance with the formula specified in attachment 3 of the AER Final Decision—rate of return—calculated for the relevant year.
Generally for each year within a regulatory control period the prices are also subject to a Side Constraint formula that limits the amount by which a tariff can be increased. AusNet Services was not bound by this limitation in 2016 as prices are reset for the commencement of the regulatory period. The AER’s final decision sets out the Side Constraint formula to apply to Standard Control services:

ISSUE 17 PAGE 15 OF 79 UNCONTROLLED WHEN PRINTED APPROVED BY AUSTRALIAN ENERGY REGULATOR
Side Constraint Formula
'''
1
1
1
11)1(%)21()1()1(
)(
)(
ttttttm
j
ij
t
ij
t
n
i
m
j
ij
t
ij
t
n
iBTISXCPI
qd
qd
++++×+×−×∆+≤
∑∑
∑∑
=
−
=
==
where each tariff class has "n" tariffs, with each up to "m" components, and where:
ij
td is the proposed price for component ‘j’ of tariff 'i' for year t.
ij
td 1− is the price charged for component ‘j’ of tariff 'I' in year t–1.
ij
tq is the forecast quantity of component ‘j’ of the tariff class in year t.
tCPI∆ is the annual percentage change in the ABS CPI All Groups, Weighted Average of Eight Capital Cities from the June quarter in year t–2 to the June quarter in year t–1, calculated using the following method:
The ABS CPI All Groups, Weighted Average of Eight Capital Cities for the June quarter in regulatory year t–1 divided by The ABS CPI All Groups, Weighted Average of Eight Capital Cities for the June quarter in regulatory year t–2 minus one.
For example, for the 2017 regulatory year, t–2 is June quarter 2015 and t–1 is June quarter 2016 and for the 2018 regulatory year, t–2 is June quarter 2016 and t–1 is June quarter 2017 and so on.
tX is the X factor for each year of the 2016–20 regulatory control period as determined in the
PTRM, and annually revised for the return on debt update in accordance with the formula specified in attachment 3 of the AER Final Decision—rate of return—calculated for the relevant year. If X>0, then X will be set equal to zero for the purposes of the side constraint formula.
tS is the s-factor determined in accordance with the STPIS for regulatory year t.
'
tI is the annual percentage change from the f–factor scheme amount in year t. This amount will
be calculated as per the method set out in the relevant f–factor scheme.
'
tT is the annual percentage change from the final carryover amount from the application of the
DMIS from the 2011–15 regulatory control period. This amount will be calculated using the method set out in the DMIS and will be deducted from/added to allowed revenue in the 2017 pricing proposal.
'
tB is annual percentage change from the sum of:
• the recovery of license fee charges by the Victorian Essential Services Commission
indexed by one and a half years of interest, calculated using the following method:

ISSUE 17 PAGE 16 OF 79 UNCONTROLLED WHEN PRINTED APPROVED BY AUSTRALIAN ENERGY REGULATOR
( )( ) 2/1
211 11 −−− ++ ttt WACCWACCL
where:
1−tL are the licence fees paid by AusNet Services to the Victorian Essential
Services Commission in the financial year ending in June of regulatory year t– 1
WACC is the approved nominal weighted average cost of capital (WACC) for the relevant regulatory year, using the following method:
where the tla WACCreal Vanil is as set out in our final decision PTRM and
updated annually
• any under or over recovery of actual revenue collected through DUoS
charges in regulatory year t–2 as calculated using the method in
appendix A of Attachment 14 of the AER Preliminary Decision 2016-
20;
• the AER approved pass through amounts (positive or negative) with
respect to regulatory year t.
With the exception of the CPI, X factor and S factor, the percentage for each of the other factors above can be calculated by dividing the incremental revenues (as used in the total annual revenue formula) for each factor by the expected revenues for regulatory year t–1 (based on the prices in year t–1 multiplied by the forecast quantities for year t).
( ) ( )( ) 11 1 −∆+×+= ttt CPIWACC Vanilla realWACC vanilla Nominal

ISSUE 17 PAGE 17 OF 79 UNCONTROLLED WHEN PRINTED APPROVED BY AUSTRALIAN ENERGY REGULATOR
3 Network Tariff Classes
This section sets out AusNet Services proposed tariffs for each tariff. AusNet Services tariff classes have been based on grouping customers that have a common connection and energy use profile.
For 2018 AusNet Services tariff classes and the tariffs within those classes are:
Customer Size
Tariff Class & Tariff Existing ($)
Proposed ($)
Small Residential - <160MWh 331,285,985
323,274,427 NEE11, NEN11, NGT11, NEE13, NEN13, NGT13,
NGT23, NEE14, NGT14, NGT24, NEN14, NEE15, NEN15, NGT15, NGT25, NEE20, NEN20, NEE24, NGT26, NEE23, SUN23, NEE26, NEE30, NEE31, NEE32, NSP30, NSP31, NSP32, NASN11, NASN11P
Industrial/Commercial - <160MWh 134,281,112
128,002,990 NEE12, NEN12, NSP12, NASN19, NEE16, NEN16,
NSP16, NEE17, NEN17, NSP17, NEE18, NEN18, NSP18, NEE21, NEN21, NSP21, NSP27, NEE25, NASN21, SUN21, SSP21, NEE28, SSP27
Medium Industrial/Commercial – 160 to 400MWh 59,672,215
57,066,609 NEE40, NEE41, NEE42, NEE43, NEE51, NEE52,
NEE60, NEE55, NSP55, NSP56, NEN56,
Large-LV1 Industrial/Commercial – 400 to 750MWh 29,676,141
27,425,178 NEE74, NSP75,
Large-LV2 Industrial/Commercial – 750 to 2000MWh 35,940,367
33,246,118 NSP76,
Large-LV3 Industrial/Commercial – 2GWh to 4GWh 19,202,816
17,762,633 NSP77,
Large-LV4 Industrial/Commercial – Over 4GWh 10,478,885
9,690,085 NSP78,
HV-1 Industrial/Commercial - 6.6, 11, 22kV 14,257,084
13,183,274 NSP81,
HV-2 Industrial/Commercial* - 6.6, 11, 22kV N/A
N/A NSP82,
HV-3 Industrial/Commercial - 6.6, 11, 22kV 763,615 707,441
NSP83,
EHV-1 Industrial/Commercial* - 66kV N/A N/A NSP91,
EHV-2 Industrial/Commercial* - LV Gen N/A N/A NEE93,
EHV-3 Industrial/Commercial* - 66kV N/A N/A NSP94,
EHV-4 Industrial/Commercial* - 66kV N/A N/A NSP95
* $ not shown as these Tariff classes apply to individual or a small number of customers.

ISSUE 17 PAGE 18 OF 79 UNCONTROLLED WHEN PRINTED APPROVED BY AUSTRALIAN ENERGY REGULATOR
4 Proposed Tariffs and Charging Parameters
4.1 Background to Tariff Access
AusNet Services’ customers are initially assigned to a Legacy tariff structure; from these tariffs customers may opt to change their tariff structure to either a Flexible tariff or a Cost Reflective tariff. Customers that elect to be assigned to a Flexible tariff may return to the Legacy tariff they were previously assigned to or may exercise their option to be assigned to a Cost reflective tariff. Once a customer has been assigned to a Cost Reflective tariff they must remain on a Cost Reflective tariff. As customers move away from Legacy tariffs and Flexible tariffs these tariffs will be closed and removed from the tariff options.
4.2 Legacy Tariffs
Legacy tariffs are also referred to as Flat Rate tariffs. The energy charges on these tariffs are either all time at a single rate or where two rate tariffs are applied they are limited to either a two rate five day or two rate seven day structure. Legacy tariffs are the tariff structures that are established based on metering installations. These tariff structures are the only structures that can be delivered from an accumulation meter (Type 6) and are set in accordance with the meter installation. For other tariff structures to be applied the customers meter must be either reconfigured on site or the meter must be changed. These tariffs are not cost reflective because they do not make provision for charging rates to align to network usage profiles. AusNet Services’ legacy network tariffs are:

ISSUE 17 PAGE 19 OF 79 UNCONTROLLED WHEN PRINTED APPROVED BY AUSTRALIAN ENERGY REGULATOR
Residential Tariffs
Tariff Type Tariffs
Single Rate NEE11, NEN11
Single Rate Plus Dedicated Circuit NEE13, NEN13, NEE14, NEN14, NEE15, NEN15
Two Rate Five Day NEE20, NEN20, NEE24,
Two Rate Five Day Solar NEE23, SUN23, NEE26
Dedicated Circuit NEE30, NEE31, NEE32
Industrial & Commercial Tariffs
Tariff Type Tariffs
Single Rate NEE12, NEN12, NEE40,
Single Rate Plus Dedicated Circuit NEE16, NEN16, NEE17, NEN17, NEE18, NEN18, NEE41, NEE42, NEE43
Two Rate Five Day NEE21, NEN21, NEE25, NEE51, NEE52, NEE74, NEE93
Two Rate Five Day Solar SUN21, NEE28
Two Rate Seven Day NEE60
Dedicated Circuit NEE30, NEE31, NEE32
4.3 Flexible Tariffs
Flexible tariffs provide customers with an option for a multi rate tariff, and the time periods are adjusted for Daylight savings during summer months. Flexible tariffs give customers with an AMI (smart) meter the opportunity to take a more cost reflective tariff than a flat rate legacy tariff. These flexible tariffs have a common structure across all Victorian Distributors with only the rates between distributors being different. Customers must elect to take a flexible tariff and the Order requires distributors to allow customers to revert to their legacy tariff at any time. AusNet Services’ flexible network tariffs are:

ISSUE 17 PAGE 20 OF 79 UNCONTROLLED WHEN PRINTED APPROVED BY AUSTRALIAN ENERGY REGULATOR
Residential Tariffs
Tariff Type Tariffs
Single Rate NGT11
Single Rate Plus Dedicated Circuit NGT13, NGT14, NGT15
Multi Rate plus Controlled Load NGT26, NGT23, NGT24, NGT25
4.4 Cost Reflective Tariffs
Energy based cost reflective tariffs were introduced in 2010. These tariffs were multi rate tariffs that included high rates at the times demand on the network traditionally peaks, i.e. between 3:00PM and 7:00PM during the summer months. In 2014 the Australian Energy Market Commission included the requirement that a Distributor’s tariffs “…must be based on the long run marginal cost of providing the service to which it relates…” thereby placing an obligation on Distributors’ tariffs to be Cost reflective.
In August 2016 the AER approved AusNet Services’ Tariff Structures Statement which outlined cost reflective tariffs with a common structure to those being introduced by other Victorian Distributors. For customers using between 40MWh and 160MWh a year these tariffs commenced on 1 January 2017, being NASN19 and NASN21 as well as two variants for solar customers NASN2P for those with a Premium Feed-In agreement and NASN2S for those with a Standard Feed-In agreement.
In 2018 cost reflective tariffs with a full demand component for small residential and small commercial customers will be introduced and are included in the tariff schedule. These tariffs are NASN11 and NASN12 with variants for solar customer NASN11P and NASN12P for those with a Premium Feed-In agreement.
NASN11 and NASN12 differ from the NASN19 and NASN21 tariffs in that customers must opt-in to these tariffs, and accordingly do not have a phased introduction of the demand component. The full demand component applies for these tariffs in 2018.
The maximum demand charge is significantly weighted to the summer months (Dec – Mar) when the network is most heavily loaded and likely to reach the limits of its capacity. This is not the case for the Victorian Alpine region however, where a winter peak load occurs and the new tariffs will therefore not be available to Alpine village customers.
AusNet Services cost reflective tariffs are:
Residential Tariffs
Tariff Type Tariffs
Multi Rate NSP11
Multi Rate Plus Dedicated Circuit NSP13, NSP14, NSP15
Single Rate NASN11, NASN11P

ISSUE 17 PAGE 21 OF 79 UNCONTROLLED WHEN PRINTED APPROVED BY AUSTRALIAN ENERGY REGULATOR
Multi Rate Plus Controlled Load NSP20
Multi Rate Solar NSP23, SSP23,
Dedicated Circuit NSP30, NSP31, NSP32
Industrial & Commercial Tariffs
Tariff Type Tariffs
Multi Rate NSP12, NASN19, NASN21, NEE55, NSP55, NSP56, NEN56, NSP75, NSP76, NSP77, NSP78, NSP81, NSP82, NSP83, NSP91, NSP94, NSP95
Single Rate NASN12, NASN12P
Multi Rate Plus Dedicated Circuit NSP16, NSP17, NSP18,
Multi Rate Plus Controlled Load NSP21, NSP27, NASN21,
Multi Rate Solar SSP21
Dedicated Circuit NSP30, NSP31, NSP32
4.5 Tariff Reassignments for 40 – 160MWh Customers
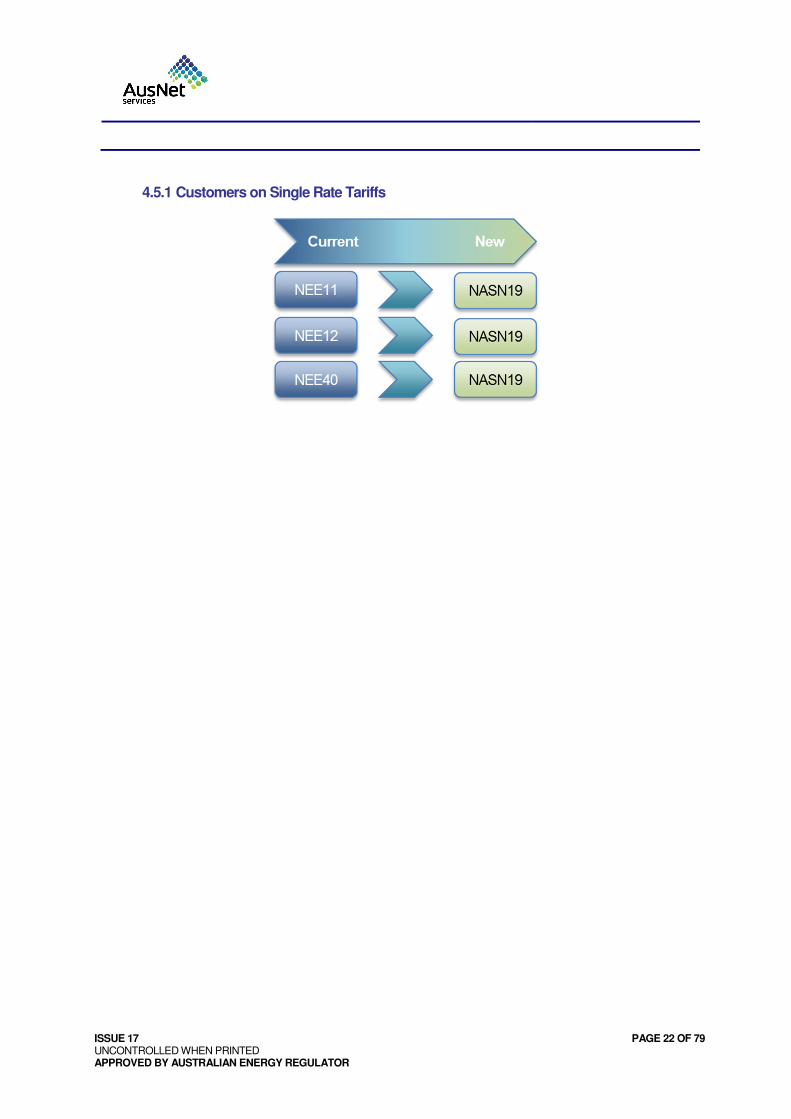
As set out in our Tariff Structure Statement customers that use above 40MWh a year were reassigned to a cost reflective tariff with the Victorian Distributors common structure on 1 January 2017 (NASN19 and NASN21 and its solar derivatives). This totals approximately 8,500 customers, a relatively small proportion (1%) of AusNet services’ customer base.
In accordance with the TSS AusNet Services set a zero demand component for 2017, and the transition plan provides for increments of 20% of the full demand component to be introduced annually from 2018. Therefore, from 1 January 2018, 20% of the full demand component will be assigned to the NASN19 and NASN 21 and its solar derivatives.
The primary tariffs NASN19 and NASN21 are parented to network tariffs NEE12 and NEE21. NASN19 has about 930 customers assigned to it. NASN21 and its solar derivatives made up of the remaining almost 7,570 customers. The tariff reassignments were made from 1 January 2017 and will continue same basis for transfers as provided for in last year Tariff Pricing Proposal as follows1:
1 Some of the tariffs under 4.5.1, 4.5.2 and 4.5.3 intended for residential customers but historically there have been exceptions.
ISSUE 17 PAGE 22 OF 79 UNCONTROLLED WHEN PRINTED APPROVED BY AUSTRALIAN ENERGY REGULATOR
4.5.1 Customers on Single Rate Tariffs

ISSUE 17 PAGE 23 OF 79 UNCONTROLLED WHEN PRINTED APPROVED BY AUSTRALIAN ENERGY REGULATOR
4.5.2 Customers with Dedicated Circuits, Two Rate, and Multi Rate Tariffs

ISSUE 17 PAGE 24 OF 79 UNCONTROLLED WHEN PRINTED APPROVED BY AUSTRALIAN ENERGY REGULATOR
4.5.3 Customers with Small Generator (Solar) Tariffs
The Advanced Metering Infrastructure (AMI Tariffs) Amendment Order 2017 requires DNSPs to make available for customers assigned to cost reflective demand tariffs at least one network tariff with a zero demand usage charge or demand charging parameter. The order also establishes that such tariff is to be assigned to the customer on an opt-out basis, at the request of the customer, from 1 January 2018.
Where a 40 – 160MWh customer has requested to opt out of the default demand-based tariff, the retailer will be able to revert that customer to a network tariff that AusNet Services designates for this purpose. The tariff we will use for reversion is an existing tariff, NSP27. Whilst the tariff structure retains cost-reflective characteristics it is made up of energy components and a fixed charge only, and accordingly satisfies the requirements of the order.
New customers will be assigned to NASN19, and as per the above, will have the ability to opt-out to NSP27.
If a customer chooses to be assigned to NASN19 or NASN21 tariff there will be a minimum period of 12 months that they must remain on that tariff after which time they can elect to be reassigned to NSP27.
4.6 Charging Parameters
AusNet Services’ tariffs have one or more of the following charging parameters:
• Standing charge - Unit
• All time energy use – Flat rate or inclining block - kWh
• Peak Energy - kWh

ISSUE 17 PAGE 25 OF 79 UNCONTROLLED WHEN PRINTED APPROVED BY AUSTRALIAN ENERGY REGULATOR
• Shoulder Energy - kWh
• Off Peak Energy - kWh
• Summer Peak Energy - kWh
• Summer Shoulder Energy - kWh
• Winter Peak Energy - kWh
• Monthly Peak Demand – kW
• Critical Peak Demand – Average of five kVA
• Capacity – kVA
These parameters are a key facet of our tariff offering and are detailed further below, with parameters for specific tariffs set out in the tariff schedules.

ISSUE 17 PAGE 26 OF 79 UNCONTROLLED WHEN PRINTED APPROVED BY AUSTRALIAN ENERGY REGULATOR
4.6.1 Tariff Structures
The following table sets out the tariff structures, charging parameters and metering requirements that apply to each tariff:
Tariffs Minimum Metering Requirement Tariff Structure Description
NEE11, NEN11, NEE12, NEN12
Basic type 6 single register accumulation meter.
Standing Charge;
Inclining Blocks
Block 1 up to 340kWh/Mth (1020kWh/Qtr)
Block 2 Balance
NASN11 An advanced interval single element meter, “smart meter”.
Standing Charge
All time energy (block 1 and 2)
Demand – 3:00PM to 9:00PM ADST, Monday to Friday, Peak Season Dec to Mar Off Peak all other times
NEE131, NEN131, NEE161, NEN161,
NEE142, NEN142, NEE172, NEN172
NEE153, NEN153, NEE183, NEN183
All closed to new entrants
Two basic type 6 single register accumulation meters, one switched by timing device, or a basic type 6 dual register accumulation meter with second register switched by timing device.
Standing Charge;
Inclining Blocks
Block 1 up to 340kWh/Mth (1020kWh/Qtr)
Block 2 Balance
1Dedicated Circuit – 11:00PM to 7:00AM
2Dedicated Circuit – 1:00PM to 4:00PM & 11:00PM to 7:00AM
3Dedicated Circuit – 8:00PM to 8:00AM

ISSUE 17 PAGE 27 OF 79 UNCONTROLLED WHEN PRINTED APPROVED BY AUSTRALIAN ENERGY REGULATOR
Tariffs Minimum Metering Requirement Tariff Structure Description
NGT11, NEE40
All closed to new entrants
Basic type 6 single register accumulation meter.
Standing Charge
Single Flat Rate – All usage
NEE411, NGT131,
NEE422, NGT142,
NEE433, NGT153,
All closed to new entrants
Two basic type 6 single register accumulation meters, one switched by timing device, or a basic type 6 dual register accumulation meter with second register switched by timing device.
Standing Charge
Single Flat Rate – All usage
1Dedicated Circuit – 11:00PM to 7:00AM
2Dedicated Circuit – 1:00PM to 4:00PM & 11:00PM to 7:00AM
3Dedicated Circuit – 8:00PM to 8:00AM
NEE20, NEN20, NEE21, NEN21, NEE52; NEE93
NEE51, & NEE74, closed to new entrants
A basic type 6 dual register with an electronic time switch, capable of switching all loads to off-peak overnight and at weekends.
Standing Charge;
Two Rate Five Day
Peak – 7:00AM to 11:00PM Monday to Friday
Off Peak – All other times

ISSUE 17 PAGE 28 OF 79 UNCONTROLLED WHEN PRINTED APPROVED BY AUSTRALIAN ENERGY REGULATOR
Tariffs Minimum Metering Requirement Tariff Structure Description
NEE23, SUN23, SUN21, NEE26, NEE28,
NEE27
closed to new entrants
An Interval meter with export registers and an electronic time switch, capable of switching all loads to off-peak overnight and at weekends.
Standing Charge;
Two Rate Five Day
Peak – 7:00AM to 11:00PM Monday to Friday
Off Peak – All other times
NSP11, NSP12, NSP55 An advanced interval single element meter, “smart meter”.
Standing Charge
Multi Rate Seasonal
Summer Peak - Dec-March, Mon - Fri, 2pm - 6pm
Summer Shoulder - Dec-March, Mon - Fri, 12pm-2pm and 6pm to 8pm
Winter peak - Jun-Aug, Mon - Fri, 4pm to 8pm
Off Peak - all other times
All times are AEST

ISSUE 17 PAGE 29 OF 79 UNCONTROLLED WHEN PRINTED APPROVED BY AUSTRALIAN ENERGY REGULATOR
Tariffs Minimum Metering Requirement Tariff Structure Description
NSP20, NSP21, NSP27, An advanced interval single element meter, and an electronic time switch, capable of switching all loads to off-peak overnight and at weekends “smart meter”.
Standing Charge
Multi Rate Seasonal
Summer Peak - Dec-March, Mon - Fri, 2pm - 6pm
Summer Shoulder - Dec-March, Mon - Fri, 12pm-2pm and 6pm to 8pm
Winter peak - Jun-Aug, Mon - Fri, 4pm to 8pm
Off Peak - all other times
All times are AEST
NASN12, NASN19 An advanced interval single element meter, “smart meter”.
Standing Charge
All time energy (block 1 and 2)
Demand – 3:00PM to 9:00PM ADST, Monday to Friday, Peak Season Dec to Mar Off Peak all other times
NASN21 An advanced interval single element meter, “smart meter”.
Standing Charge
Two Rate Five Day
Peak – 7:00AM to 11:00PM Monday to Friday
Off Peak – All other times Demand – 3:00PM to 9:00PM ADST, Monday to Friday, Peak Season Dec to Mar Off Peak all other times

ISSUE 17 PAGE 30 OF 79 UNCONTROLLED WHEN PRINTED APPROVED BY AUSTRALIAN ENERGY REGULATOR
Tariffs Minimum Metering Requirement Tariff Structure Description
NSP23, SSP21, SSP23, An advanced interval meter with export registers and an electronic time switch, capable of switching all loads to off-peak overnight and at weekends. meter, “smart meter”
Standing Charge
Multi Rate Seasonal
Summer Peak - Dec-March, Mon - Fri, 2pm - 6pm
Summer Shoulder - Dec-March, Mon - Fri, 12pm-2pm and 6pm to 8pm
Winter peak - Jun-Aug, Mon - Fri, 4pm to 8pm
Off Peak - all other times
All times are AEST
NSP131, NSP161
NSP142, NSP172
NSP153, NSP183
All closed to new entrants
An advanced interval two element meter, “smart meter” where the second element applies to a dedicated circuit that is switched by AusNet Services and that is required to be separately measured to other off peak load.
Standing Charge
Multi Rate Seasonal plus Dedicated Circuit
Summer Peak - Dec-March, Mon - Fri, 2pm - 6pm
Summer Shoulder - Dec-March, Mon - Fri, 12pm-2pm and 6pm to 8pm
Winter peak - Jun-Aug, Mon - Fri, 4pm to 8pm
Off Peak - all other times
1Dedicated Circuit – 11:00PM to 7:00AM
2Dedicated Circuit – 1:00PM to 4:00PM & 11:00PM to 7:00AM
3Dedicated Circuit – 8:00PM to 8:00AM
ISSUE 17 PAGE 31 OF 79 UNCONTROLLED WHEN PRINTED APPROVED BY AUSTRALIAN ENERGY REGULATOR
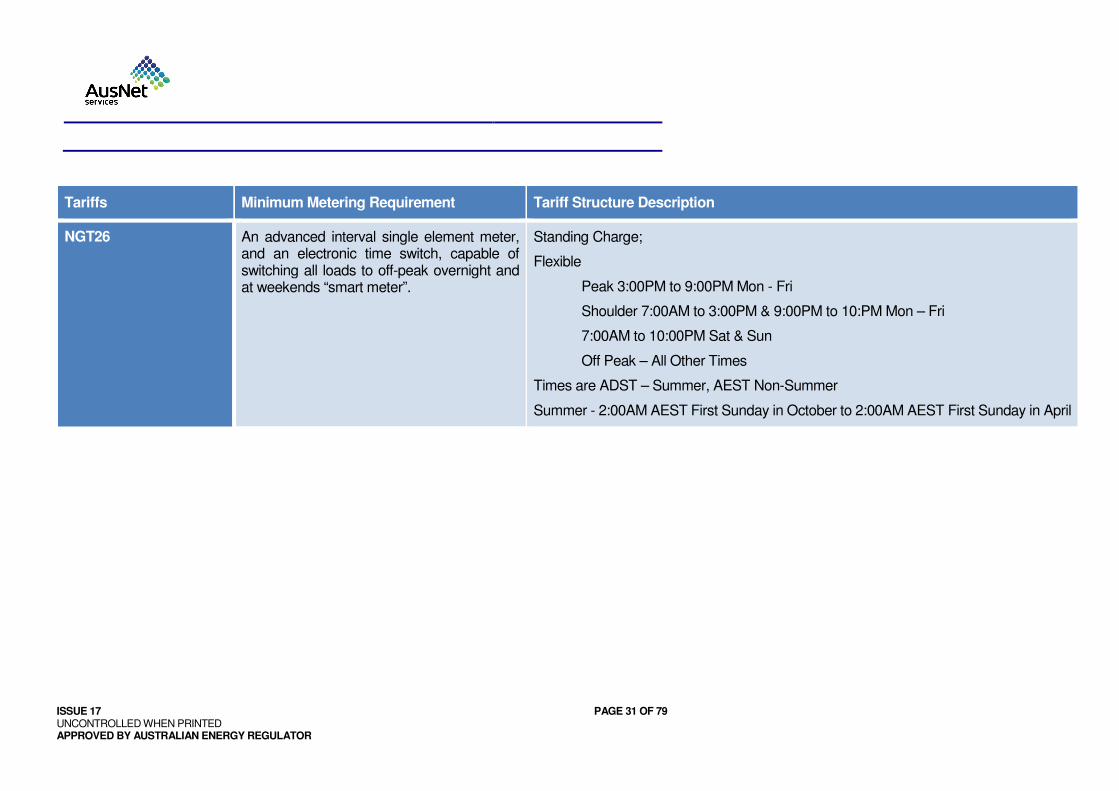
Tariffs Minimum Metering Requirement Tariff Structure Description
NGT26 An advanced interval single element meter, and an electronic time switch, capable of switching all loads to off-peak overnight and at weekends “smart meter”.
Standing Charge;
Flexible
Peak 3:00PM to 9:00PM Mon - Fri
Shoulder 7:00AM to 3:00PM & 9:00PM to 10:PM Mon – Fri
7:00AM to 10:00PM Sat & Sun
Off Peak – All Other Times
Times are ADST – Summer, AEST Non-Summer
Summer - 2:00AM AEST First Sunday in October to 2:00AM AEST First Sunday in April

ISSUE 17 PAGE 32 OF 79 UNCONTROLLED WHEN PRINTED APPROVED BY AUSTRALIAN ENERGY REGULATOR
Tariffs Minimum Metering Requirement Tariff Structure Description
NGT231, NGT242, NGT253
All closed to new entrants
An advanced interval two element meter, “smart meter” where the second element applies to a dedicated circuit that is switched by AusNet Services and that is required to be separately measured to other off peak load.
Standing Charge;
Multi Rate Seasonal plus Dedicated Circuit
Peak 3:00PM to 9:00PM Mon - Fri
Shoulder 7:00AM to 3:00PM & 9:00PM to 10:PM Mon – Fri
7:00AM to 10:00PM Sat & Sun
Off Peak – All Other Times
Times are ADST – Summer, AEST Non-Summer
Summer - 2:00AM AEST First Sunday in October to 2:00AM AEST First Sunday in April
1Dedicated Circuit – 11:00PM to 7:00AM
2Dedicated Circuit – 1:00PM to 4:00PM & 11:00PM to 7:00AM
3Dedicated Circuit – 8:00PM to 8:00AM
Times are AEST
NEE24, NEE25 A basic type 6 dual register with an electronic time switch, capable of switching all loads to off-peak overnight and at weekends.
Standing Charge;
Two Rate Five Day
Peak – 8:00AM to 8:00PM Monday to Friday
Off Peak – All other times

ISSUE 17 PAGE 33 OF 79 UNCONTROLLED WHEN PRINTED APPROVED BY AUSTRALIAN ENERGY REGULATOR
Tariffs Minimum Metering Requirement Tariff Structure Description
NEE301, NSP301
NEE312, NSP312
NEE323, NSP323
All closed to new entrants
A basic type 6 dual register with an electronic time switch, capable of switching all loads to off-peak overnight and at weekends.
Standing Charge
Dedicated Circuits
1Dedicated Circuit – 11:00PM to 7:00AM
2Dedicated Circuit – 1:00PM to 4:00PM & 11:00PM to 7:00AM
3Dedicated Circuit – 8:00PM to 8:00AM
NSP301 NSP312 NSP323
All closed to new entrants
An advanced interval two element meter, “smart meter” where the second element applies to a dedicated circuit that is switched by AusNet Services and that is required to be separately measured to other off peak load.
Standing Charge
Dedicated Circuits
1Dedicated Circuit – 11:00PM to 7:00AM
2Dedicated Circuit – 1:00PM to 4:00PM & 11:00PM to 7:00AM
3Dedicated Circuit – 8:00PM to 8:00AM
NEE55 A basic type 6 dual register with an electronic time switch, capable of switching all loads to off-peak overnight and at weekends.
Standing Charge
Seasonal Snowfield Regions
Peak – 1 May to 30 September
Off Peak – All other times
NEE60
Closed to new entrants
A basic type 6 dual register, with standard time switching capacity.
Standing Charge
Two Rate 7 Day
Peak – 7:00AM to 11:00PM Monday - Sunday
Off Peak – All other times

ISSUE 17 PAGE 34 OF 79 UNCONTROLLED WHEN PRINTED APPROVED BY AUSTRALIAN ENERGY REGULATOR
Tariffs Minimum Metering Requirement Tariff Structure Description
NSP56, NEN56, NSP75, NSP76, NSP77, NSP78, NSP81, NSP82, NSP83
An interval meter, capable of measuring kWh and kVAR integrated over a 30-minute period.
Standing Charge
Multi Rate Seasonal with Demand
Peak – 7:00AM to 10:00AM & 4:00PM to 11:00PM Mon - Fri
Shoulder – 10:00AM to 4:00PM Mon - Fri
Off Peak – All other times
Capacity
Critical Peak Demand – 2:00PM – 6:00PM on 5 Nominated days between December and March
All times are AEST
NSP91, NSP94, NSP95 An interval meter, capable of measuring kWh and kVAR integrated over a 30-minute period.
Standing Charge
Two Rate 5 day with Demand
Peak – 7:00AM to 11:00PM Mon - Fri
Off Peak – All other times
Capacity
Critical Peak Demand – 2:00PM – 6:00PM on 5 Nominated days between December and March
All times are AEST

ISSUE 17 PAGE 35 OF 79 UNCONTROLLED WHEN PRINTED APPROVED BY AUSTRALIAN ENERGY REGULATOR
4.7 Indicative tariffs
The table below compares indicative price levels for year 2018 as set out in the addendum to the Tariff Structure Statement with indicative prices for the remaining regulatory years of the regulatory control period to reflect this 2018 annual pricing proposal.
Tariff Charging Parameter Amended TSS 2018
2018 2019 2020
NEE11 Fixed ($)
109.07
109.00
114.45
120.00
Energy Block 1($/kWh)
0.0981
0.0962
0.1002
0.1031
Energy Block 2 ($/kWh)
0.1230
0.1249
0.1243
0.1297
NEN11 Fixed ($)
109.07
109.00
114.45
120.00
Energy Block 1($/kWh)
0.0684
0.0645
0.0697
0.0725
Energy Block 2 ($/kWh)
0.0729
0.0687
0.0744
0.0775
NASN11 Fixed ($)
109.07
109.00
114.45
120.00
Energy - All Time ($/kWh)
0.0948
0.0716
0.0744
0.0763
Demand peak season ($/kW/mth)
8.9090
8.9111
9.3540
9.8685
Demand off-peak season ($/kW/mth)
2.2323
2.2278
2.3430
2.4719
NEE12 Fixed ($)
109.07
109.00
114.45
120.00
Energy Block 1($/kWh)
0.1320
0.1320
0.1361
0.1425
Energy Block 2 ($/kWh)
0.1714
0.1683
0.1776
0.1863
NASN12 Fixed ($)
109.07
109.00
114.45
120.00
Energy - All Time ($/kWh)
0.1498
0.1271
0.1310
0.1372
Demand peak season ($/kW/mth)
8.9090
8.9111
9.3540
9.8685
Demand off-peak season ($/kW/mth)
2.2323
2.2278
2.3430
2.4719
NASN19 Fixed ($)
109.07
109.00
114.45
120.00
Energy - All Time ($/kWh)
0.1648
0.1556
0.1641
0.1721
Demand peak season ($/kW/mth)
1.7822
1.7838
3.6717
5.5337
Demand off-peak season ($/kW/mth)
0.4456
0.4485
0.9179
1.3835
NEE20 Fixed ($)
109.07
109.00
114.45
120.00
Energy - peak ($/kWh)
0.1848
0.1754
0.1731
0.1671

ISSUE 17 PAGE 36 OF 79 UNCONTROLLED WHEN PRINTED APPROVED BY AUSTRALIAN ENERGY REGULATOR
Energy - off-peak ($/kWh)
0.0395
0.0363
0.0435
0.0586
NEN20 Fixed ($)
109.07
109.00
114.45
120.00
Energy - peak ($/kWh)
0.1101
0.1037
0.1135
0.1187
Energy - off-peak ($/kWh)
0.0323
0.0296
0.0435
0.0586
NSP20 Fixed ($)
109.07
109.00
114.45
120.00
Energy - summer peak ($/kWh)
0.4031
0.3796
0.4212
0.4433
Energy - summer shoulder ($/kWh)
0.3553
0.3346
0.3709
0.3903
Energy - winter peak ($/kWh)
0.3135
0.2952
0.3270
0.3440
Energy - off peak ($/kWh)
0.0321
0.0294
0.0483
0.0596
NEE21 Fixed ($)
109.07
109.00
114.45
120.00
Energy - peak ($/kWh)
0.1776
0.1678
0.1753
0.1741
Energy - off-peak ($/kWh)
0.0416
0.0384
0.0435
0.0586
NEN21 Fixed ($)
109.07
109.00
114.45
120.00
Energy - peak ($/kWh)
0.1307
0.1232
0.1352
0.1391
Energy - off-peak ($/kWh)
0.0646
0.0600
0.0526
0.0586
NASN21 Fixed ($)
109.07
109.00
114.45
120.00
Energy - peak ($/kWh)
0.1647
0.1616
0.1687
0.1676
Energy - off peak ($/kWh)
0.0416
0.0384
0.0435
0.0586
Demand peak season ($/kW/mth)
1.7822
1.7838
3.6717
5.5337
Demand off-peak season ($/kW/mth)
0.4456
0.4485
0.9179
1.3835
NEE23 Fixed ($)
115.00
120.00
119.00
125.00
Energy - peak ($/kWh)
0.1822
0.1754
0.1771
0.1681
Energy - off-peak ($/kWh)
0.0395
0.0363
0.0435
0.0586
Energy - Summer Export ($/kWh)
0.0239
0.0239
0.0104
-
NEE24 Fixed ($)
109.07
109.00
114.45
120.00
Energy - peak ($/kWh)
0.0827
0.0779
0.0847
0.0883
Energy - off-peak ($/kWh)
0.0209
0.0189
0.0376
0.0526
NGT26 Fixed ($)
109.07
109.00
114.45
120.00
Energy - summer peak ($/kWh)
0.1353
0.1319
0.1351
0.1415

ISSUE 17 PAGE 37 OF 79 UNCONTROLLED WHEN PRINTED APPROVED BY AUSTRALIAN ENERGY REGULATOR
Energy - winter peak ($/kWh)
0.1353
0.1319
0.1351
0.1415
Energy - shoulder ($/kWh)
0.1081
0.1019
0.1091
0.1140
Energy - off-peak ($/kWh)
0.0335
0.0307
0.0435
0.0586
NSP27 Fixed ($)
109.07
109.00
114.45
120.00
Energy - summer peak ($/kWh)
0.2075
0.2064
0.2551
0.3023
Energy - summer shoulder ($/kWh)
0.1845
0.1833
0.2259
0.2673
Energy - winter peak ($/kWh)
0.1642
0.1631
0.2006
0.2369
Energy - off peak ($/kWh)
0.0727
0.0666
0.0730
0.0738
NEE30 Fixed ($) -
-
-
-
Energy - off-peak ($/kWh)
0.0299
0.0290
0.0435
0.0586
NEE31 Fixed ($) -
-
-
-
Energy - off-peak ($/kWh)
0.0258
0.0249
0.0435
0.0586
NEE32 Fixed ($) -
-
-
-
Energy - off-peak ($/kWh)
0.0307
0.0297
0.0376
0.0526
NEE55 Fixed ($)
374.07
299.00
304.45
310.00
Energy - peak ($/kWh)
0.1561
0.1485
0.1638
0.1720
Energy - off-peak ($/kWh)
0.0437
0.0415
0.0458
0.0481
NEE52 Fixed ($) -
-
-
-
Energy - peak ($/kWh)
0.1777
0.1731
0.1845
0.1936
Energy - off-peak ($/kWh)
0.0861
0.0866
0.0887
0.0931
NSP56 Fixed ($)
2,720.74
2,542.00
2,659.60
2,795.00
Energy - peak ($/kWh)
0.1236
0.1179
0.1230
0.1289
Energy - shoulder ($/kWh)
0.0939
0.0899
0.0937
0.0980
Energy - off-peak ($/kWh)
0.0413
0.0393
0.0411
0.0431
Demand capacity ($/kVa/mth)
18.9900
17.8782
18.7721
19.8046
Demand critical peak ($/kVa/mth)
31.6566
29.8033
31.2935
33.0146
NSP75 Fixed ($)
5,509.00
5,398.00
5,566.00
5,860.00
Energy - peak ($/kWh)
0.0452
0.0441
0.0456
0.0473
Energy - shoulder ($/kWh)
0.0354
0.0348
0.0357
0.0369

ISSUE 17 PAGE 38 OF 79 UNCONTROLLED WHEN PRINTED APPROVED BY AUSTRALIAN ENERGY REGULATOR
Energy - off-peak ($/kWh)
0.0160
0.0154
0.0160
0.0166
Demand capacity ($/kVa/mth)
47.0000
43.4478
45.6201
48.1293
Demand critical peak ($/kVa/mth)
78.0000
72.8688
76.5123
80.7205
NSP76 Fixed ($)
5,509.00
5,398.00
5,566.00
5,860.00
Energy - peak ($/kWh)
0.0427
0.0418
0.0431
0.0446
Energy - shoulder ($/kWh)
0.0331
0.0325
0.0334
0.0344
Energy - off-peak ($/kWh)
0.0146
0.0141
0.0146
0.0152
Demand capacity ($/kVa/mth)
49.0000
45.2966
47.5614
50.1773
Demand critical peak ($/kVa/mth)
82.0000
76.6057
80.4360
84.8600
NSP77 Fixed ($)
5,509.00
5,398.00
5,566.00
5,860.00
Energy - peak ($/kWh)
0.0423
0.0413
0.0426
0.0441
Energy - shoulder ($/kWh)
0.0328
0.0324
0.0332
0.0342
Energy - off-peak ($/kWh)
0.0140
0.0136
0.0140
0.0146
Demand capacity ($/kVa/mth)
52.2577
49.6691
52.1526
55.0209
Demand critical peak ($/kVa/mth)
87.0662
82.4398
86.5618
91.3227
NSP78 Fixed ($)
5,509.00
5,398.00
5,566.00
5,860.00
Energy - peak ($/kWh)
0.0392
0.0384
0.0396
0.0409
Energy - shoulder ($/kWh)
0.0308
0.0305
0.0312
0.0321
Energy - off-peak ($/kWh)
0.0126
0.0123
0.0127
0.0131
Demand capacity ($/kVa/mth)
57.5305
54.6332
57.3649
60.5199
Demand critical peak ($/kVa/mth)
95.5106
90.3900
94.9095
100.1295
NSP81 Fixed ($)
5,509.00
5,398.00
5,566.00
5,860.00
Energy - peak ($/kWh)
0.0196
0.0199
0.0202
0.0205
Energy - off-peak ($/kWh)
0.0061
0.0062
0.0063
0.0064
Demand capacity ($/kVa/mth)
37.9800
35.7566
37.5444
39.6094
Demand critical peak ($/kVa/mth)
62.2527
58.6082
61.5386
64.9232
NSP82 Fixed ($)
5,509.00
5,398.00
5,566.00
5,860.00
Energy - peak ($/kWh)
0.0190
0.0194
0.0196
0.0198

ISSUE 17 PAGE 39 OF 79 UNCONTROLLED WHEN PRINTED APPROVED BY AUSTRALIAN ENERGY REGULATOR
Energy - shoulder ($/kWh)
0.0190
0.0194
0.0196
0.0198
Energy - off-peak ($/kWh)
0.0079
0.0079
0.0081
0.0083
Demand capacity ($/kVa/mth)
34.8183
32.7800
34.4190
36.3120
Demand critical peak ($/kVa/mth)
56.9701
53.6348
56.3165
59.4139
NSP83 Fixed ($)
5,509.00
5,398.00
5,566.00
5,860.00
Energy - peak ($/kWh)
0.1075
0.1027
0.1071
0.1122
Energy - shoulder ($/kWh)
0.0470
0.0457
0.0473
0.0490
Energy - off-peak ($/kWh)
0.0142
0.0138
0.0142
0.0148
Demand capacity ($/kVa/mth)
4.0553
3.8180
4.0088
4.2293
Demand critical peak ($/kVa/mth)
6.7064
6.3138
6.6295
6.9941
NSP91 Fixed ($)
19,889.20
18,694.00
20,300.00
21,390.00
Energy - peak ($/kWh)
0.0194
0.0198
0.0200
0.0203
Energy - off-peak ($/kWh)
0.0045
0.0046
0.0047
0.0047
Demand capacity ($/kVa/mth)
2.5333
2.3850
2.5043
2.6420
Demand critical peak ($/kVa/mth)
4.1829
3.9380
4.1349
4.3623
NEE93 Fixed ($) -
-
-
-
Energy - peak ($/kWh)
0.0191
0.0190
0.0194
0.0200
Energy - off-peak ($/kWh)
0.0191
0.0190
0.0194
0.0200
NSP94 Fixed ($)
19,889.20
18,694.00
20,300.00
21,390.00
Energy - peak ($/kWh)
0.0191
0.0194
0.0197
0.0199
Energy - off-peak ($/kWh)
0.0043
0.0045
0.0045
0.0045
Demand capacity ($/kVa/mth)
1.8951
1.7841
1.8733
1.9763
Demand critical peak ($/kVa/mth)
3.1421
2.9582
3.1061
3.2769
NSP95 Fixed ($)
19,889.20
18,694.00
20,300.00
21,390.00
Energy - peak ($/kWh)
0.0197
0.0201
0.0203
0.0206
Energy - off-peak ($/kWh)
0.0047
0.0048
0.0049
0.0049
Demand capacity ($/kVa/mth)
3.9276
3.6976
3.8825
4.0960
Demand critical peak ($/kVa/mth)
6.5198
6.1381
6.4450
6.7995

ISSUE 17 PAGE 40 OF 79 UNCONTROLLED WHEN PRINTED APPROVED BY AUSTRALIAN ENERGY REGULATOR
4.8 Long run Marginal Cost
A detailed explanation of AusNet Services’ compliance with the requirement that tariffs be based on the long run marginal cost is set out in section B.2 of its approved TSS. AusNet Services has used the Average Incremental Cost (AIC) approach in calculating the LRMC and the following table shows the results of this calculation. Table 4.7 - Results of AusNet Services’ LRMC analysis
Voltage Level LRMC ($/kVA)
Low Voltage $88.70
High Voltage $24.58
Sub transmission $16.08
4.9 Stand Alone and Avoidable Costs
Section B.3 of the AusNet Services approved TSS sets out how AusNet Services tariffs comply with the requirement that tariffs be set between the stand alone cost and the avoidable costs of supply to a tariff class. The following table shows how the 2018 tariffs meet this objective. Table 4.8 - Stand Alone & Avoidable Costs
Tariff Class Stand alone Cost ($/kWh)
Average All-in Retail Bill Avoided ($/kWh
Avoided Distribution
Costs
Average DUoS Bill
Residential $0.84 $0.27 $0.0210 $0.110
Small I & C $0.60 $0.25 $0.0510 $0.115
Large I & C $1.13 Not applicable $0.0150 $0.063
High Voltage $0.39 Not applicable $0.0030 $0.028
Sub Transmission $0.02 Not applicable $0.0004 $0.007

ISSUE 17 PAGE 41 OF 79 UNCONTROLLED WHEN PRINTED APPROVED BY AUSTRALIAN ENERGY REGULATOR
5 Variations To Tariffs
It is proposed that Distribution tariffs will decrease at an overall rate of 4.01% from 2017 levels. Historic change is shown in the figure below.
5.1 Small Residential
AusNet Services’ residential tariffs apply to customers using less than 160MWh a year for predominantly private domestic purposes. These customers are connected to the low voltage network, 240/415 volts and with a maximum load less than 50kVA. The following chart shows how Distribution Use of System Charges have varied for this group of customers since 2000 compared to the CPI over the same period. The overall decrease in distribution tariffs for this customer group between 2017 to 2018 is 2.42%.
The following Tables show how tariffs changes in 2018 have impacted customers for the most common residential tariff types.

ISSUE 17 PAGE 42 OF 79 UNCONTROLLED WHEN PRINTED APPROVED BY AUSTRALIAN ENERGY REGULATOR
NEE11
Base Case Very Low Low Average High Very High
Energy 4.30 MWh 1.29 MWh 3.01 MWh 4.30 MWh 5.59 MWh 7.31 MWh
Existing 570.22$ 245.97$ 431.26$ 570.22$ 709.19$ 894.48$
Proposed 557.94$ 243.68$ 423.26$ 557.94$ 692.62$ 872.20$
Change -2.15% -0.93% -1.85% -2.15% -2.34% -2.49%
NEE20
Base Case Very Low Low Average High Very High
Energy 6.74 MWh 2.02 MWh 4.71 MWh 6.74 MWh 8.76 MWh 11.45 MWh
Existing 803.55$ 315.96$ 594.58$ 803.55$ 1,012.51$ 1,291.13$
Proposed 751.64$ 301.79$ 558.85$ 751.64$ 944.43$ 1,201.49$
Change -6.46% -4.49% -6.01% -6.46% -6.72% -6.94%
NGT26
Base Case Very Low Low Average High Very High
Energy 7.72 MWh 2.32 MWh 5.40 MWh 7.72 MWh 10.03 MWh 13.12 MWh
Existing 793.72$ 313.01$ 587.70$ 793.72$ 999.73$ 1,274.42$
Proposed 744.18$ 299.55$ 553.63$ 744.18$ 934.74$ 1,188.81$
Change -6.24% -4.30% -5.80% -6.24% -6.50% -6.72%
NEE23
Base Case Very Low Low Average High Very High
Energy 3.49 MWh 1.05 MWh 2.44 MWh 3.49 MWh 4.53 MWh 5.93 MWh
Existing 570.14$ 253.64$ 434.50$ 570.14$ 705.78$ 886.63$
Proposed 546.36$ 247.91$ 418.45$ 546.36$ 674.27$ 844.81$
Change -4.17% -2.26% -3.69% -4.17% -4.46% -4.72%
NEE24
Base Case Very Low Low Average High Very High
Energy 4.27 MWh 1.28 MWh 2.99 MWh 4.27 MWh 5.55 MWh 7.26 MWh
Existing 275.20$ 157.46$ 224.74$ 275.20$ 325.66$ 392.94$
Proposed 263.06$ 155.22$ 216.84$ 263.06$ 309.28$ 370.90$
Change -4.41% -1.42% -3.52% -4.41% -5.03% -5.61%
NEE30
Base Case Very Low Low Average High Very High
Energy 1.39 MWh 0.42 MWh 0.98 MWh 1.39 MWh 1.81 MWh 2.37 MWh
Existing 42.23$ 12.67$ 29.56$ 42.23$ 54.90$ 71.80$
Proposed 40.42$ 12.13$ 28.29$ 40.42$ 52.55$ 68.72$
Change -4.29% -4.29% -4.29% -4.29% -4.29% -4.29%

ISSUE 17 PAGE 43 OF 79 UNCONTROLLED WHEN PRINTED APPROVED BY AUSTRALIAN ENERGY REGULATOR
5.2 Small Industrial & Commercial
The Victorian Government has explicitly excluded Small Business tariffs from the Flexible Pricing arrangements and from the opt in arrangements for Cost reflective tariffs where annual use is in excess of 40MWh. AusNet Services has not included any Flexible tariffs for Small Businesses and has included new cost reflective tariffs for customers using more than 40MWh. The following chart shows how Distribution Use of System Charges have varied for this group of customers since 2000 compared to the CPI over the same period. The overall decrease in distribution tariffs for this customer group between 2017 and 2018 is 4.69%.
The following Tables show how tariffs changes in 2018 have impacted customers for the most common Small Industrial & Commercial tariff types.
NEE31
Base Case Very Low Low Average High Very High
Energy 3.49 MWh 1.05 MWh 2.44 MWh 3.49 MWh 4.54 MWh 5.93 MWh
Existing 91.15$ 27.35$ 63.81$ 91.15$ 118.50$ 154.96$
Proposed 86.88$ 26.06$ 60.82$ 86.88$ 112.94$ 147.70$
Change -4.69% -4.69% -4.69% -4.69% -4.69% -4.69%
NEE32
Base Case Very Low Low Average High Very High
Energy 1.43 MWh 0.43 MWh 1.00 MWh 1.43 MWh 1.86 MWh 2.44 MWh
Existing 44.55$ 13.36$ 31.18$ 44.55$ 57.91$ 75.73$
Proposed 42.61$ 12.78$ 29.83$ 42.61$ 55.39$ 72.44$
Change -4.34% -4.34% -4.34% -4.34% -4.34% -4.34%
NEE12
Base Case Very Low Low Average High Very High
Energy 6.32 MWh 1.90 MWh 4.42 MWh 6.32 MWh 8.21 MWh 10.74 MWh
Existing 1,131.17$ 414.25$ 823.92$ 1,131.17$ 1,438.42$ 1,848.09$
Proposed 1,100.17$ 406.35$ 802.82$ 1,100.17$ 1,397.52$ 1,793.98$
Change -2.74% -1.91% -2.56% -2.74% -2.84% -2.93%

ISSUE 17 PAGE 44 OF 79 UNCONTROLLED WHEN PRINTED APPROVED BY AUSTRALIAN ENERGY REGULATOR
5.3 Medium Industrial & Commercial
Medium customers are customers that consume between 160MWh and 400MWh per annum. Examples of this customer class are medium sized commercial and light industrial businesses. The following chart shows how Distribution Use of System Charges have varied for this group of customers since 2000 compared to the CPI over the same period. The overall decrease in distribution tariffs for this customer group between 2017 and 2018 is 4.37%.
The following Tables show how tariffs changes in 2018 have impacted customers for the most common Medium Industrial & Commercial tariff types.
NEE21
Base Case Very Low Low Average High Very High
Energy 14.94 MWh 4.48 MWh 10.46 MWh 14.94 MWh 19.42 MWh 25.39 MWh
Existing 1,967.48$ 665.14$ 1,409.33$ 1,967.48$ 2,525.62$ 3,269.81$
Proposed 1,830.42$ 625.43$ 1,314.00$ 1,830.42$ 2,346.85$ 3,035.42$
Change -6.97% -5.97% -6.76% -6.97% -7.08% -7.17%
NSP27
Base Case Very Low Low Average High Very High
Energy 55.02 MWh 16.51 MWh 38.51 MWh 55.02 MWh 71.52 MWh 93.53 MWh
Existing 4,934.64$ 1,555.29$ 3,486.35$ 4,934.64$ 6,382.94$ 8,314.00$
Proposed 4,639.58$ 1,468.18$ 3,280.41$ 4,639.58$ 5,998.76$ 7,810.99$
Change -5.98% -5.60% -5.91% -5.98% -6.02% -6.05%

ISSUE 17 PAGE 45 OF 79 UNCONTROLLED WHEN PRINTED APPROVED BY AUSTRALIAN ENERGY REGULATOR
5.4 Large LV Industrial & Commercial
Large customers are those customers who consume more than 400 MWh per annum. Examples of large customers are large industrial sites, commercial buildings, embedded networks, and large public owned enterprises. The following chart shows how Distribution Use of System Charges have varied for this group of customers since 2000 compared to the CPI over the same period. The overall decrease in distribution tariffs for this customer group between 2017 and 2018 is 7.53%
NEE40
Base Case Very Low Low Average High Very High
Energy 12.14 MWh 3.64 MWh 8.50 MWh 12.14 MWh 15.78 MWh 20.63 MWh
Existing 2,783.35$ 909.90$ 1,980.44$ 2,783.35$ 3,586.25$ 4,656.79$
Proposed 2,791.55$ 913.76$ 1,986.78$ 2,791.55$ 3,596.31$ 4,669.33$
Change 0.29% 0.42% 0.32% 0.29% 0.28% 0.27%
NEE51
Base Case Very Low Low Average High Very High
Energy 85.56 MWh 25.67 MWh 59.89 MWh 85.56 MWh 111.23 MWh 145.45 MWh
Existing 11,284.07$ 3,460.12$ 7,930.95$ 11,284.07$ 14,637.19$ 19,108.01$
Proposed 11,268.94$ 3,456.98$ 7,920.96$ 11,268.94$ 14,616.92$ 19,080.90$
Change -0.13% -0.09% -0.13% -0.13% -0.14% -0.14%
NSP56
Base Case Very Low Low Average High Very High
Energy 234.97 MWh 70.49 MWh 164.48 MWh 234.97 MWh 305.46 MWh 399.44 MWh
Existing 27,475.58$ 10,178.17$ 20,062.40$ 27,475.58$ 34,888.75$ 44,772.98$
Proposed 25,669.47$ 9,480.24$ 18,731.23$ 25,669.47$ 32,607.71$ 41,858.69$
Change -6.57% -6.86% -6.64% -6.57% -6.54% -6.51%
NEE60
Base Case Very Low Low Average High Very High
Energy 59.10 MWh 17.73 MWh 41.37 MWh 59.10 MWh 76.84 MWh 100.48 MWh
Existing 4,081.32$ 1,484.80$ 2,968.52$ 4,081.32$ 5,194.11$ 6,677.84$
Proposed 5,607.99$ 1,891.70$ 4,015.29$ 5,607.99$ 7,200.69$ 9,324.28$
Change 37.41% 27.40% 35.26% 37.41% 38.63% 39.63%

ISSUE 17 PAGE 46 OF 79 UNCONTROLLED WHEN PRINTED APPROVED BY AUSTRALIAN ENERGY REGULATOR
The following Tables show how tariffs changes in 2018 have impacted customers for Large Industrial & Commercial tariff types.
NSP75
Base Case Very Low Low Average High Very High
Energy 541.73 MWh 162.52 MWh 379.21 MWh 541.73 MWh 704.25 MWh 920.95 MWh
Existing 43,843.74$ 17,223.62$ 32,435.12$ 43,843.74$ 55,252.36$ 70,463.86$
Proposed 41,109.07$ 16,111.32$ 30,395.75$ 41,109.07$ 51,822.39$ 66,106.82$
Change -6.24% -6.46% -6.29% -6.24% -6.21% -6.18%
NSP76
Base Case Very Low Low Average High Very High
Energy 1,198.11 MWh 359.43 MWh 838.68 MWh 1,198.11 MWh 1,557.55 MWh 2,036.79 MWh
Existing 86,794.48$ 30,108.85$ 62,500.64$ 86,794.48$ 111,088.33$ 143,480.12$
Proposed 81,670.90$ 28,279.87$ 58,789.03$ 81,670.90$ 104,552.77$ 135,061.92$
Change -5.90% -6.07% -5.94% -5.90% -5.88% -5.87%
NSP77
Base Case Very Low Low Average High Very High
Energy 2,277.61 MWh 683.28 MWh 1,594.33 MWh 2,277.61 MWh 2,960.89 MWh 3,871.94 MWh
Existing 156,738.00$ 51,091.90$ 111,461.10$ 156,738.00$ 202,014.90$ 262,384.10$
Proposed 147,627.96$ 48,066.99$ 104,958.97$ 147,627.96$ 190,296.94$ 247,188.92$
Change -5.81% -5.92% -5.83% -5.81% -5.80% -5.79%
NSP78
Base Case Very Low Low Average High Very High
Energy 4,544.56 MWh 1,363.37 MWh 3,181.19 MWh 4,544.56 MWh 5,907.92 MWh 7,725.75 MWh
Existing 291,103.10$ 91,401.43$ 205,516.67$ 291,103.10$ 376,689.53$ 490,804.77$
Proposed 274,562.90$ 86,147.47$ 193,813.43$ 274,562.90$ 355,312.37$ 462,978.33$
Change -5.68% -5.75% -5.69% -5.68% -5.68% -5.67%

ISSUE 17 PAGE 47 OF 79 UNCONTROLLED WHEN PRINTED APPROVED BY AUSTRALIAN ENERGY REGULATOR
5.5 Large HV Industrial & Commercial
Customers connected to the AusNet Services High Voltage 22kV, 11kV or 6.6kV networks are assigned to a High Voltage Network tariff, The following chart shows how Distribution Use of System Charges have varied for this group of customers since 2000 compared to the CPI over the same period. The overall change in distribution tariffs for this customer group between 2017 and 2018 is 7.52%
The following Tables show how tariffs changes in 2018 have impacted customers for High Voltage Industrial & Commercial tariff types.
5.6 Large ST Industrial & Commercial
AusNet Services has only a small number of customers taking supply directly from the sub-transmission system. These customers are very diverse in terms of their location, the size of their load and their annual energy use. In recognition of this diversity, AusNet Services has developed a pricing methodology that is based on customer’s size and distance from Terminal Stations. The following chart shows how Distribution Use of System Charges have varied for this group of customers since 2000 compared to the CPI over the same period. The overall change in distribution tariffs for this customer group between 2017 and 2018 is 7.56%.
NSP81
Base Case Very Low Low Average High Very High
Energy 10,014.30 MWh 3,004.29 MWh 7,010.01 MWh 10,014.30 MWh 13,018.59 MWh 17,024.31 MWh
Existing 365,290.55$ 113,657.67$ 257,447.89$ 365,290.55$ 473,133.22$ 616,923.44$
Proposed 349,347.01$ 108,582.70$ 246,162.31$ 349,347.01$ 452,531.71$ 590,111.32$
Change -4.36% -4.47% -4.38% -4.36% -4.35% -4.35%
NSP83
Base Case Very Low Low Average High Very High
Energy 592.67 MWh 177.80 MWh 414.87 MWh 592.67 MWh 770.47 MWh 1,007.53 MWh
Existing 44,226.35$ 17,338.40$ 32,702.94$ 44,226.35$ 55,749.75$ 71,114.29$
Proposed 41,584.76$ 16,254.03$ 30,728.73$ 41,584.76$ 52,440.79$ 66,915.50$
Change -5.97% -6.25% -6.04% -5.97% -5.94% -5.90%

ISSUE 17 PAGE 48 OF 79 UNCONTROLLED WHEN PRINTED APPROVED BY AUSTRALIAN ENERGY REGULATOR
The following Tables show how tariffs changes in 2018 have impacted customers for Sub Transmission Industrial & Commercial tariff types.
5.7 Capacity & Critical Peak Tariffs
AusNet Services has a Capacity & Critical peak Demand Tariff for medium and large customers. Only customers that seek a reassignment to these tariffs during the 2018 year will be subject to the process described in the table below for the first time. Details on the structure and operation of this tariff are set out below.
Table 5.7 - AusNet Services’ Critical Peak Demand Tariff
>160MWh (large LV, HV and Sub-transmission customers)
Tariff Component
Critical Peak Tariff
Capacity Charge
1. Low Voltage Capacity charge based on the nameplate rating of the transformer supplying the customer’s installation. For sites where the transformer is not dedicated to the customer installation the charge will be established as the portion of the transformer that is allocated to the customer’s requirements.
All 90s (Excludes NEE93)
Base Case Very Low Low Average High Very High
Energy 44,122.90 MWh 13,236.87 MWh 30,886.03 MWh 44,122.90 MWh 57,359.77 MWh 75,008.93 MWh
Existing 666,911.12$ 213,378.94$ 472,540.19$ 666,911.12$ 861,282.06$ 1,120,443.31$
Proposed 603,504.60$ 195,222.88$ 428,526.72$ 603,504.60$ 778,482.48$ 1,011,786.32$
Change -9.51% -8.51% -9.31% -9.51% -9.61% -9.70%

ISSUE 17 PAGE 49 OF 79 UNCONTROLLED WHEN PRINTED APPROVED BY AUSTRALIAN ENERGY REGULATOR
>160MWh (large LV, HV and Sub-transmission customers)
Tariff Component
Critical Peak Tariff
2. High Voltage & Sub transmission Capacity based on the rating of the cabling and switchgear that makes the customer connection point.
Critical Peak Demand Charge
The demand charge is based on the average of customer’s maximum kVA recorded on the 5 nominated peak demand weekdays during the Defined Critical Peak Demand Period.
Defined Critical Peak Demand Period
Days must be during the period of December to March, and the days will be nominated and communicated to customers with a minimum of one business day’s notice.
The period during which the demand is to be measured is between 2pm-6pm AEST2 on the nominated day.
The 5 maximum’s are averaged and used as the basis for the demand charge for the 12 month period from April to March.
Energy Charge
Peak, Off Peak or Peak, Shoulder & Off Peak similar to existing charges
Standing Charge
Fixed annual charge, similar to existing charges
The network benefits of a Critical Peak Demand charge are that it:
• better targets the demand that is driving system capacity constraints, as it focuses only on Demand during peak times of the peak day:
• overcomes the inequities whereby a customer is charged a ‘Demand’ tariff on their peak ‘demand’, even though that demand is not contributing to the overall system peak, and therefore, is not contributing to AusNet Services’ future augmentation costs,
• is easier for customers to respond to, as they only have to alter their consumption for between 1 to 5 days, and for 4 hours within those days, to get a benefit, whereas the traditional demand tariff requires a permanent step down in electricity consumption, which provides more scope for customers to change their consumption in response to the price signal (eg: use of back up generation on those days, changed hours of operation on those days), and
• is clearly tied to ‘past’ peak demand, therefore there are less costs associated with administering this tariff as demand adjustments for existing customers are not required.
AusNet Services will advise the nominated days to customers and their respective Retailers concurrently, at least one business day in advance. In addition, AusNet Services will use a longer
2 2:00PM to 6:00PM AEST which is the standard meter time, or 3:00PM to 7:00PM AEDT.

ISSUE 17 PAGE 50 OF 79 UNCONTROLLED WHEN PRINTED APPROVED BY AUSTRALIAN ENERGY REGULATOR
range weather forecast to flag with customers the possible nomination of a day up to a week in advance. This will not represent a firm commitment; rather, it would provide customers with advance notice of the possible nomination of a certain day, which in turn will allow them to make some preparations in advance. The final nomination would still occur at least 1 business day prior to the nominated day. AusNet Services notes that this ‘advance notification’ stems from a suggestion that was made by a Retailer at one of the one-on-one retailer forums that AusNet Services held with all key Retailers to discuss the introduction of these tariffs.
AusNet Services will communicate this nominated day via any electronic form of notification such as SMS, email and by posting to the AusNet Services website.
For supply points not previously supplied under a contract demand tariff, for the initial period from connection until a Critical Peak demand is able to be established for that customer the critical peak demand shall be 60% of the Capacity.
Conditions for the review of the Capacity Value:
(a) Increase to Capacity. Where a customer requires increased capacity application may be made to AusNet Services for the network to be augmented to cater for the new requirements. Any variation will be made in accordance with AusNet Services’ supply extension policy.
(b) Reduction to capacity. Capacity values are not reviewable except in circumstances where a customer’s requirement has changed significantly and the current level of capacity will no longer be required. In these circumstances the following Conditions for a review will apply.

ISSUE 17 PAGE 51 OF 79 UNCONTROLLED WHEN PRINTED APPROVED BY AUSTRALIAN ENERGY REGULATOR
Conditions for the review of the Capacity Value: Low Voltage
• All obligations under any previous supply extension contract have been met; • Agree to install load limiting devices on the customer’s main switch board in
accordance with Victorian Service & Installation Rules to limit the load on the substation;
• Allow AusNet Services to exchange the transformer with a smaller unit; • Allow AusNet Services to replace the transformer with a smaller unit if the existing
unit is still in place at the end of its physical life; • If the transformer is on the customer’s premise, allow AusNet Services to take “street”
circuits from the substation to supply other customers; • Acknowledge that if they ever require a supply upgrade to the site a customer
contribution may be required (even if the transformer has not been changed). High Voltage
1. All obligations under previous supply extension contract have been met; 2. The customer installs a Capacity control device in accordance with Victorian Service &
Installation Rules Supply Protection & Supply Capacity Limitation – Guidelines Section 1.1 as follows;
a. The customers 22 kV main switch protection relay providing the following settings to trip the main switch circuit breaker;
i. MVA setting 102% of the Demand Capacity (if amps are used for the setting then the max setting in amps needs to accommodate the voltage conditions at the connection point);
ii. Time delay 10 seconds; b. The relay settings are to be locked by the provision of a sealing facility to secure the
adjustable settings by the use of distributor seals or equivalent means; 3. If the Demand Capacity is exceeded and the relay setting results in any loss of supply to the
installation AusNet Services accepts no liability; 4. Any site attendance by AusNet Services will incur an appropriate approved charge; 5. Restoration to the site following an operation will depend upon the security provided at 2b
above and can be undertaken by the customer or by the attendance of AusNet Services personnel.
A copy of the Victorian Service & Installation Rules can be downloaded from the following site: http://www.victoriansir.org.au/
5.8 Power Factor Correction
When a customer takes action in order to correct their power factor the benefits will occur in a lower Critical Peak Demand the following summer. This will result in lower Critical Peak demand charges in following years with no need for AusNet Services to reduce demand charges in the current year.
In some circumstances where the customer is able to release the capacity for AusNet Services to supply other customers AusNet Services may be able to give consideration to a reduction in the Capacity to what is expected with the new power factor correction. This allows AusNet Services to

ISSUE 17 PAGE 52 OF 79 UNCONTROLLED WHEN PRINTED APPROVED BY AUSTRALIAN ENERGY REGULATOR
more efficiently use the network. In these circumstances, a Capacity control device might be required to be installed.
6 Designated Pricing Proposal Charges
6.1 Overview
A Distribution Business’s Annual Pricing Proposal is required to show how Designated Pricing Proposal Charges are applied to customers and what adjustments relate to previous years. Clause 6.18.2 (b) (6) specifically requires that “A pricing proposal must: set out how designated pricing proposal charges are to be passed on to customers and any adjustments to tariffs resulting from over or under recovery of those charges in the previous regulatory year”
This section describes what designated pricing proposal charges are and how AusNet Services proposes to recover them in 2018. An explanation is provided of the mechanism that accounts for any year on year over or under recovery of these charges which has a final impact on 2018 prices.
Transmission service costs are recovered from Distribution Customers through the Designated Pricing Proposal charges. AusNet Services makes payments for Transmission services to the following industry participants for the services noted:
Participant Transmission/Network Service
AusNet Services Transmission Transmission Connection Services
AEMO Transmission Use of System Services
Embedded Generators Avoided Transmission Use of System Services
Other Distributors Transmission Use of System and Distribution Services
6.2 Charges for 2018
AusNet Services has estimated payments for the services covered by the Designated Pricing Proposal for 2018 to be:
Transmission Network Service Provider $M
AEMO 80.014
AusNet Services Transmission 9.486
Embedded generators 0.823
Inter-network -4.804

ISSUE 17 PAGE 53 OF 79 UNCONTROLLED WHEN PRINTED APPROVED BY AUSTRALIAN ENERGY REGULATOR
Total (AEMO + Embedded Generators – Inter-Network) 85.519
AusNet Services recovers the costs of the above services through an energy charge to customers. The energy charges are allocated to peak and off peak periods for each network tariff.
For 2017 AusNet Services has estimated that the Designated Pricing proposal rates for the year will result in an under recovery of $402,104. Under the 2016-20 Price Determination AusNet Services is required to adjust this by the Nominal Pre-tax WACC and deduct $440,207 to the 2018 DPPC revenue. The following table sets out the DPPC recovery arrangements for 2018:
Total Designated Pricing Payment Recovery for 2018 $M
Transmission Charges for 2018 85.519
DPPC revenue under recovery approved 0.456
Total DPPC related payments for 2018 85.976
After including these adjustments AusNet Services DPPC recovery for 2018 is forecast to be $85,975,723.

ISSUE 17 PAGE 54 OF 79 UNCONTROLLED WHEN PRINTED APPROVED BY AUSTRALIAN ENERGY REGULATOR
7 Jurisdictional Pricing Proposal Charges
7.1 Overview
Under Victorian legislation AusNet Services is required to make payments to certain customers with small generation systems, mainly solar panel installations, for the energy that they feed in to the network. Two schemes have been operating for the past five years, the Premium scheme and the Transitional scheme. The Transitional scheme ceased to operate on 31 December 2016, the Premium scheme will continue to operate until 1 November 2024.
A Distribution Business’s Annual Pricing Proposal is required to show how Jurisdictional Pricing Proposal Charges are applied to customers and what adjustments relate to previous years. Clause 6.18.2 (b) (6A) specifically requires that “A pricing proposal must: set out how jurisdictional scheme amounts for each approved jurisdictional scheme are to be passed on to customers and any adjustments to tariffs resulting from over or under recovery of those amounts;”
This section describes what Jurisdictional pricing proposal charges are and how AusNet Services proposes to recover them in 2018. An explanation is provided of the mechanism that accounts for any year on year over or under recovery of these charges which has a final impact on 2018 prices.
Amounts paid out for Jurisdictional schemes are recovered from Distribution Customers through the Jurisdictional Pricing Proposal charges. AusNet Services makes payments to retailers with qualifying customers on tariffs that have a Premium Feed in Tariff component with Network invoices each month.
7.2 Jurisdictional Charges for 2018
Jurisdictional Charges for 2018 are made up of the residual under/over recovery from 2016 and the under/over recovery for 2017 and forecast Premium payments for 2018. The following table sets out the amounts to be recovered in 2018 tariffs: Table 7.3 - JSA Recovery Arrangements
Jurisdictional Recovery Amounts $M
Premium Feed-In Charges for 2018 24.190
Approved over recovery -6.026
Total recovered by tariffs for 2018 18.164
The tariffs that have been set to recover an amount of $18,163,792 are set out in Attachment 12.4. This is 31.6% less than is estimated to be recovered in 2017 mostly due to over recovered amounts in 2016 and expected to be over recovered in 2017.

ISSUE 17 PAGE 55 OF 79 UNCONTROLLED WHEN PRINTED APPROVED BY AUSTRALIAN ENERGY REGULATOR
8 Public Lighting
8.1 Public Lighting Overview
AusNet Services provides public lighting services to 30 local government councils, Vic Roads, the Alpine Resorts Commission and Gippsland Ports. The services provided include the installation, maintenance and repair of public lighting installations, the operation of a fault and emergency call centre, a GIS system to locate and identify light installations. Energy supplied to Public Lights is a contestable service; to facilitate market settlement AusNet Services derives the unmetered 30 minute energy data for the public lights this data is then placed into the market and used for the retail billing of energy consumed by public lights.
Typically lighting installations includes poles, brackets, lanterns, wiring, and control gear. Currently, the AusNet Services manages and maintains around 145,000 streetlights in our electricity distribution area. Energy efficient lights account for 65,000 of the total number of lights installed. AusNet Services provides two categories of lighting, standard and non-standard.
Standard Lights are lights erected on a distribution pole, a dedicated pole supplied by AusNet Services and light head supplied by AusNet Services. Non-standard lights are those lights on decorative poles and those with a decorative lantern. AusNet Services provides the labour and services associated with the maintenance of non-standard public lights, the public lighting customer must provide the replacement decorative pole or decorative lantern.
Local government councils and VicRoads are responsible for decisions regarding the location and types of lights installed.
8.2 Public Lighting Tariffs for 2018
Public Lighting prices are varied in accordance with the Public Lighting pricing model updated for the changes in the CPI. The following table sets out the price changes for 2018 for each light type. Table 12 – Public Lighting Price Changes
Light Type 2017 2018 %���� 2017 2018 %����
LED 18W 15.18 16.59 9.3% 15.57 17.02 9.3%
Non Standard, Standard Output LED 15.18 16.59 9.3% 15.57 17.02 9.3%
High Output LED 15.18 16.59 9.3% 15.57 17.02 9.3%
T5 2X14W 32.79 34.81 6.1% 37.46 39.61 5.7%
T5 2X24W 39.02 41.15 5.5% 44.47 46.75 5.1%
Compact Fluorescent 32W 29.11 30.89 6.1% 33.34 35.25 5.7%
Compact Fluorescent 42W 29.11 30.89 6.1% 33.34 35.25 5.7%
Mercury Vapour 50W 56.36 62.44 10.8% 62.39 68.73 10.2%
Mercury Vapour 80W 36.84 40.81 10.8% 42.16 46.44 10.2%
Mercury Vapour 125W 54.15 59.99 10.8% 62.39 68.73 10.2%
HP Sodium 50W 41.18 43.68 6.1% 48.24 51.02 5.8%
Metal Halide 70W 160.80 178.15 10.8% 160.39 176.67 10.2%
LED L1 22.00 24.05 9.3% 22.41 24.50 9.3%
LED L2 22.67 24.78 9.3% 23.15 25.31 9.3%
LED L3 24.09 26.34 9.3% 24.52 26.81 9.3%
Mercury Vapour 250W 98.49 104.47 6.1% 109.05 115.39 5.8%
Mercury Vapour 400W 102.24 108.45 6.1% 112.19 118.72 5.8%
HP Sodium 100W 99.38 105.41 6.1% 113.51 120.05 5.8%
HP Sodium 150W 92.88 98.52 6.1% 106.08 112.20 5.8%
HP Sodium 250W 93.80 99.49 6.1% 104.85 110.95 5.8%
HP Sodium 400W 133.20 141.28 6.1% 148.89 157.55 5.8%
Metal Halide 100W 221.77 235.23 6.1% 224.68 237.64 5.8%
Metal Halide 150W 251.95 267.23 6.1% 255.26 269.98 5.8%
Central North & East

ISSUE 17 PAGE 56 OF 79 UNCONTROLLED WHEN PRINTED APPROVED BY AUSTRALIAN ENERGY REGULATOR
9 Ancillary Network Services
9.1 Ancillary Network Services Overview
Ancillary Network Services are network services provided to individual customers using the same resources as those used to provide other regulated network services. The costs of providing these services are recovered from the individual customer requesting the service and not from all other customers. The types of service include customer connections, energisation and de-energisation of customer installations, field officer visits, and service truck visits. Where the services is routine in nature and provided on a regular basis to a number of customers AusNet Services sets a fixed fee for the service. In those instances where the number of jobs is infrequent and or the nature of the work varies significantly charges are made on the basis of recovering the actual cost incurred at approved charge out rates.
9.2 Price Changes for 2018
Ancillary Network Service charges have been varied in accordance with the AER determination for the 2016-2020 period which is CPI – X, price cap formula as set out below:
i
t
i
t pp ≥ i=1,...,n and t=2,3,4,5
)1)(1(1
i
tt
i
t
i
t XCPIpp −+= −
Where:
i
tp is the cap on the price of service i in year t
i
tp is the price of service i in year t
i
tp 1− is the cap on the price of service i in year t–1
t is the regulatory year
tCPI is the annual percentage change in the ABS consumer price index (CPI) All Groups,
i
tX is the X factor for service i in year t.
The application of the price cap formula for 2017 where the CPI change was 1.93% and the X factor - 0.79% results in a price increase of 2.7%

ISSUE 17 PAGE 57 OF 79 UNCONTROLLED WHEN PRINTED APPROVED BY AUSTRALIAN ENERGY REGULATOR
10 Prescribed Metering Charges
10.1 Electricity Distribution Price Review annual metering charges requirements
Under the 2016-20 Electricity Distribution Price Review AusNet Services’ metering charges are subject to a Revenue Cap form of regulation. For 2018 under the Revenue Cap regulation metering charges are varied in accordance with the formula set out in Attachment 16 of the AER Final Decision which is as follows:
The formula for the annual metering charges revenue cap is:
(1) ij
t
m
j
ij
t
n
i
t qpTARM ∑∑==
≥11
i=1,...,n and j=1,...,m and t=1,...,5
(2) tttt BTARTARM ++= t=1,2,...,5
(3) )1)(1(1 tttt XCPIARAR −∆+= − t=1,2,...,5
where:
tTARM is the total annual revenue for annual metering charges in year t.
ij
tp is the price of component ‘j’ of metering service ‘i’ in year t.
ij
tq is the forecast quantity of component ‘j’ of metering service ‘i’ in year t.
tAR is the annual revenue requirement for year t. When year t is the first year of the 2016–
20 regulatory control period, ARt is the annual revenue requirement in the annual metering charges Post Tax Revenue Model (PTRM) for year t.
tT is a once off adjustment to 2018 to 2020 charges for the unders and overs recoveries
relating to Advanced Metering Infrastructure actual revenues and actual costs incurred in 2014 and 2015.3
tB is the sum of annual adjustment factors in year t as calculated in the unders and overs
account.
3 AER, AMI Transition Charges Application Final Decision, p.5

ISSUE 17 PAGE 58 OF 79 UNCONTROLLED WHEN PRINTED APPROVED BY AUSTRALIAN ENERGY REGULATOR
1−tAR is the annual revenue requirement for year t–1.
tCPI∆ is the annual percentage change in the ABS CPI All Groups, Weighted Average of
Eight Capital Cities from the June quarter in year t–2 to the June quarter in year t–1, calculated using the following method:
The ABS CPI All Groups, Weighted Average of Eight Capital Cities for the June quarter in regulatory year t–1
divided by
The ABS CPI All Groups, Weighted Average of Eight Capital Cities for the June
quarter in regulatory year t–2
minus one.
tX is the X-factor for each year of the 2016–20 regulatory control period as determined in
the annual metering charges PTRM�
From 2017 to 2020, side constraints will apply, and the permissible percentage increase will be the greater of CPI-X plus 2 per cent or CPI plus 2 per cent. The side constraint formula is:
''
1 %)21)(1)(1( tt
i
tt
i
t
i
t BTXCPIpp +++−∆+≤ −
where:
i
tp is the price of annual metering charges service ‘I’ in year t.
i
tp 1− is the price of annual metering charges service ‘I’ in year t-1.
tCPI∆ is the annual percentage change in the ABS CPI All Groups, Weighted Average of
Eight Capital Cities from the June quarter in year t–2 to the June quarter in year t–1, calculated using the following method:
The ABS CPI All Groups, Weighted Average of Eight Capital Cities for the June quarter in regulatory year t–1

ISSUE 17 PAGE 59 OF 79 UNCONTROLLED WHEN PRINTED APPROVED BY AUSTRALIAN ENERGY REGULATOR
divided by
The ABS CPI All Groups, Weighted Average of Eight Capital Cities for the June
quarter in regulatory year t–2
minus one.
tX is the X-factor for each year of the 2016–20 regulatory control period as determined in
the annual metering charges PTRM�
'
tT is the annual percentage change from the unders and overs recoveries relating to
Advanced Metering Infrastructure actual revenues and actual costs incurred in 2014 and 2015. It is a once off adjustment to 2018 to 2020 charges.4
'
tB is the annual percentage change from the sum of annual adjustment factors in year
t as calculated in the unders and overs account.
10.1 Metering Charges Unders and Overs Account
Prescribed metering charges in 2018 are forecast to be 44.4% less than 2017 rates and to recover $50,930,366. In accordance with the 2016-20 Electricity Distribution Price Review, AusNet Services is expected to achieve a closing balance as close to zero as practicable in its annual metering charges unders and overs account when proposing variations to the amount and structure of annual metering charges. The carry forward amount for 2018 is -$8,883. Table 10.1 – Metering Charges Unders and Overs
Description 2018 Forecast
Opening Balance -$97,603
Interest on Opening Balance -$5,696
Under recovery for 2018 $91,776
Interest on 2018 under recovery $2,640
Closing Balance -$8,883
4 AER, AMI Transition Charges Application Final Decision, p.5

ISSUE 17 PAGE 60 OF 79 UNCONTROLLED WHEN PRINTED APPROVED BY AUSTRALIAN ENERGY REGULATOR
11 Glossary Term Definition
ABS Australian Bureau of Statistics
AER Australian Energy Regulator
AEST Australian Eastern Standard Time, AEST is 10 hours ahead of Coordinated Universal Time (UTC)
AIC Average Incremental Cost, a method of calculating the LRMC
AMI Advanced Metering Infrastructure
ARR Annual revenue requirement
Augmentation New network assets constructed to meet increased demand
Capacity The amount of energy that a part of the network is able to carry
CES Certificate of Electrical Safety
Controlled Load A customer’s electricity circuit that the DNSP controls the hours in which the supply is made
available.
CPI Consumer price index
Demand Energy consumption at a point in time
Demand Management The modification of behaviour so as to constrain demand at critical times
Distribution Network The poles and wires assets that transport energy between the transmission network and customers.
Distributor (DNSP) Distribution Network Service Provider, the owner/operator of a distribution network
DMIS Demand management incentive scheme
DPPC Designated pricing proposal charges
DUoS Distribution use of system
Eastern Standard Time
(EST)
EST is 10 hours ahead of Coordinated Universal Time
Final Decision The Australian Energy Regulator’s final decision determination 2016 to 2020, May 2016
FiT Feed in Tariff
Flexible Pricing Flexible pricing means different rates for electricity at different times of the day as defined by the
Victorian Governments policy on ToU pricing
High voltage (HV) Equipment or supplies at voltages of 22kV 11kV or 6.6kV
Inclining Block A network tariff energy rate that increases as usage increases above defined thresholds
JUoS Jurisdictional scheme use of system
kVA, MVA Kilovolt amperes and Megavolt amperes, units of instantaneous total electrical power demand.
Usually the peak demand is referenced. See also PF for the relationship between power demand
quantities
kVAr, MVAr
Kilovolt amperes (reactive) and Megavolt amperes (reactive) units of instantaneous reactive
electrical power demand. Usually the peak demand is referenced. See also PF for the relationship
between power demand quantities.
kW, MW Kilowatt and Megawatt, units of instantaneous real electrical power demand.

ISSUE 17 PAGE 61 OF 79 UNCONTROLLED WHEN PRINTED APPROVED BY AUSTRALIAN ENERGY REGULATOR
Term Definition
Usually the peak demand is referenced. See also PF for the relationship between power demand
quantities
kWh, MWh Kilowatt hour and Megawatt hour, units of electrical energy consumption
Local Time Daylight savings time in accordance with the Victorian Government’s requirements
Logically Converted
AMI meter
A meter that records energy use for 30 minute intervals and communicates the data to the energy
supplier and is operating in the national energy market as an interval meter.
Low voltage (LV) Equipment or supply at a voltage of 230 V single phase or 415 V, three phase
LRMC Long Run Marginal Costs
Marginal Cost The cost of providing a small increment of service. The Long Run Marginal Cost (LRMC) includes
future investment; Short Run Marginal Cost (SRMC) considers only the costs involved without extra
investment
NMI National Meter Identifier a unique code that identifies a connection point in the NEM
NUoS Network use of system. The utilisation of the total electricity network in the provision of electricity
to consumers (NUoS = DUoS + TUoS + JUoS)
PFiT Premium Feed-in tariff
Power factor (PF) A measure of the ratio of real power to total power of a load. The relationship between real, reactive
and total power is as follows:
PF = Real Power (kW) / Total Power (kVA) Total Power (kVA) = Sqrt (kW2 + kVAr2)
Price structure The components that make up a Price available to customers
Pricing proposal AusNet Services’ 2016 Pricing Proposal, submitted in accordance with the Rules (this document)
PTRM Post tax revenue model
Retailer A financially responsible market participant supplying electricity to customers
Revenue cap A form of regulatory control which limits the total revenue in a given period.
Rules Australian Energy Market Commission, National Electricity Rules (NER), Version 65, 1 October 2014
STPIS Service target performance incentive scheme
Sub-transmission (ST) Equipment or supplies at voltage levels of 66kV
Tariff A grouping of network price components that are applied to customers network usage in
accordance with their conditions of supply
Tariff class A group of customers with similar connection and usage characteristics who are subject to a
particular tariff or particular tariffs and a common price control.
TAR Total Annual Revenue
TFiT Transitional Feed-in tariff
ToU Time of Use, a system of pricing where energy or demand charges are set at different rates
dependent on the time the energy use is recorded
Transmission Network The assets and service that transport energy from generators to major load centres where it is
transferred to the distribution network
TSS Tariff structure statement
TUoS Transmission Use of System

ISSUE 17 PAGE 62 OF 79 UNCONTROLLED WHEN PRINTED APPROVED BY AUSTRALIAN ENERGY REGULATOR
Term Definition
Unmetered supply A connection to the distribution system which is not equipped with a meter and has calculated
consumption. Connections to public lights, phone boxes, minor traffic lights and the like may be
supplied without a physical metering installation.
WACC Weighted average cost of capital

ISSUE 17 PAGE 63 OF 79 UNCONTROLLED WHEN PRINTED APPROVED BY AUSTRALIAN ENERGY REGULATOR
12 Attachments
Intentionally Left Blank

ISSUE 17 PAGE 64 OF 79 UNCONTROLLED WHEN PRINTED APPROVED BY AUSTRALIAN ENERGY REGULATOR
12.1 Network Tariff Schedule

ISSUE 17 PAGE 65 OF 79 UNCONTROLLED WHEN PRINTED APPROVED BY AUSTRALIAN ENERGY REGULATOR

ISSUE 17 PAGE 66 OF 79 UNCONTROLLED WHEN PRINTED APPROVED BY AUSTRALIAN ENERGY REGULATOR
12.2 Distribution Use of System Tariff Schedule
Tariff Code Description Standing
Charge
$/Year
BLOCK 1
c/kWh
BLOCK 2
c/KWh
PEAK
c/KWh
SHOULDER
ALL YEAR
c/KWh
SUMMER
PEAK
c/KWh
SUMMER
SHOULDER
c/KWh
WINTER
PEAK
c/KWh
OFF PEAK
c/KWh
DEDICATED
CIRCUIT
c/KWh
SUMMER
EXPORT
c/KWh
FEEDIN
RATES
c/KWh2
CAPACITY
$/kVA/Year
CRITICAL
PEAK
DEMAND
$/kVA/Year
MONTHLY
PEAK KW
DEMAND
$/kW/Mnth
MONTHLY
OFFPEAK
KW
DEMAND
$/kW/Mnth
Residential
NEE111 Small Residential Single Rate 109.00 7.7110 10.5837
NASN1115 Small Residential Single Rate 109.00 5.2540 5.2540 8.91 2.23
NASN11P15 Small Residential Single Rate Premium Feed In 109.00 5.2540 5.2540 -2.3897 -60.0000 8.91 2.23
NEN111 Small Residential Single Rate within Embedded Network 109.00 4.5376 4.9604
NGT116 Small Residential Flexible Single Rate 109.00 9.8434
NSP117 Small Residential Interval meter time of use 109.00 36.0531 31.5478 27.6103 2.1847
NEE131 & 9 Small Residential Single Rate & Dedicated Circuit 109.00 7.7110 10.5837 2.1400
NEN131 & 9 Small Residential Single Rate & Dedicated Circuit within Embedded Network 109.00 4.5376 4.9604 2.1400
NGT136 & 9 Small Residential Flexible Single Rate & Dedicated Circuit 109.00 9.8434 2.1400
NSP137 & 9 Small Residential Interval meter time of use & Dedicated Circuit 109.00 36.0531 31.5478 27.6103 2.1847 2.1400
NEE141 & 10 Small Residential Single Rate & Dedicated Circuit with Afternoon Boost 109.00 7.7110 10.5837 1.7300
NEN141 & 10 Small Residential Single Rate & Dedicated Circuit with Afternoon Boost within Embedded Network 109.00 4.5376 4.9604 1.7300
NGT146 & 10 Small Residential Flexible Single Rate & Dedicated Circuit with Afternoon Boost 109.00 9.8434 1.7300
NSP147 & 10 Small Residential Interval meter time of use & Dedicated Circuit with Afternoon Boost 109.00 36.0531 31.5478 27.6103 2.1847 1.7300
NEE151 & 11 Small Residential Single Rate & Dedicated Circuit 8:00 to 8:00 109.00 7.7110 10.5837 2.2150
NEN151 & 11 Small Residential Single Rate & Dedicated Circuit 8:00 to 8:00 within Embedded Network 109.00 4.5376 4.9604 2.2150
NGT156 & 11 Small Residential Flexible Single Rate & Dedicated Circuit 8:00 to 8:00 109.00 9.8434 2.2150
NSP157 & 11 Small Residential Interval meter time of use & Dedicated Circuit 8:00 to 8:00 109.00 36.0531 31.5478 27.6103 2.1847 2.2150
NEE203 Small Residential Two Rate 109.00 15.6314 2.8749
NEN203 Small Residential Two Rate within Embedded Network 109.00 8.4641 2.2024
NSP207 Small Residential Interval meter time of use 109.00 36.0531 31.5478 27.6103 2.1847
NEE233 Small Residential Two Rate Solar Installation Standard Feed In Pre December 2012 120.00 15.6315 2.8750 -2.3897
NEE263 Small Residential Two Rate Solar Installation Standard Feed In Post January 2013 120.00 15.6315 2.8750 -2.3897
SUN233 Small Residential Two Rate Solar Installation Premium Feed In 120.00 15.6315 2.8750 -2.3897 -60.00
NSP237 Small Residential Interval Meter time of use Solar Installation Standard Feed In 120.00 36.0531 31.5478 27.6103 2.1847 -2.3897
SSP237 Small Residential Interval Meter time of use Solar Installation Premium Feed In 120.00 36.0531 31.5478 27.6103 2.1847 -2.3897 -60.00
NEE244 Small Residential Two Rate 8:00 to 8:00 109.00 5.8832 1.1315
NGT268 Small Residential Flexible 109.00 11.2782 11.2782 8.2792 2.3128
NGT238 & 9 Small Residential Flexible & Dedicated Circuit 109.00 11.2782 11.2782 8.2792 2.3128 2.1400
NGT248 & 10 Small Residential Flexible & Dedicated Circuit with Afternoon Boost 109.00 11.2782 11.2782 8.2792 2.3128 1.7300
NGT258 & 11 Small Residential Flexible & Dedicated Circuit 8:00 to 8:00 109.00 11.2782 11.2782 8.2792 2.3128 2.2150
NEE309 Small Residential Dedicated circuit 2.1400
NSP309 Small Residential Interval Dedicated circuit 2.1400
NEE3110 Small Residential Dedicated circuit with Afternoon Boost 1.7300
NSP3110 Small Residential Interval Meter Dedicated circuit with Afternoon Boost 1.7300
NEE3211 Small Residential Dedicated circuit 8:00 to 8:00 2.2150
NSP3211 Small Residential Interval Meter Dedicated circuit 8:00 to 8:00 2.2150

ISSUE 17 PAGE 67 OF 79 UNCONTROLLED WHEN PRINTED APPROVED BY AUSTRALIAN ENERGY REGULATOR
Tariff Code Description Standing
Charge
$/Year
BLOCK 1
c/kWh
BLOCK 2
c/KWh
PEAK
c/KWh
SHOULDER
ALL YEAR
c/KWh
SUMMER
PEAK
c/KWh
SUMMER
SHOULDER
c/KWh
WINTER
PEAK
c/KWh
OFF PEAK
c/KWh
DEDICATED
CIRCUIT
c/KWh
SUMMER
EXPORT
c/KWh
FEEDIN
RATES
c/KWh2
CAPACITY
$/kVA/Year
CRITICAL
PEAK
DEMAND
$/kVA/Year
MONTHLY
PEAK KW
DEMAND
$/kW/Mnth
MONTHLY
OFFPEAK
KW
DEMAND
$/kW/Mnth
Business
NEE121 Small Single Rate 109.00 11.2892 14.9180
NASN1215 Small Business Single Rate 109.00 10.8005 10.8005 8.91 2.23
NASN12P15 Small Business Single Rate Premium Feed In 109.00 10.8005 10.8005 -2.3897 -60.0000 8.91 2.23
NASN1915 Business >40MWh Single Rate 109.00 13.6453 13.6453 1.78 0.45
NEN121 Small Single Rate within EmbeddedNetwork 109.00 17.0489 19.8465
NSP127 Small Interval Meter time of use 109.00 36.0531 31.5478 27.6103 2.1847
NEE161 & 9 Small Single Rate & Dedicated Circuit 109.00 11.2892 14.9180 2.1400
NEN161 & 9 Small Single Rate & Dedicated Circuit within Embedded Network 109.00 17.0489 19.8465 2.1400
NSP167 & 9 Small Interval Meter time of use & Dedicated Circuit 109.00 36.0531 31.5478 27.6103 2.1847 2.1400
NEE171 & 10 Small Single Rate & Dedicated Circuit with Afternoon Boost 109.00 11.2892 14.9180 1.7300
NEN171 & 10 Small Single Rate & Dedicated Circuit with Afternoon Boost within Embedded Network 109.00 17.0489 19.8465 1.7300
NSP177 & 10 Small Interval Meter time of use & dedicated Circuit with Afternoon Boost 109.00 36.0531 31.5478 27.6103 2.1847 1.7300
NEE181 & 11 Small Single Rate & Dedicated Circuit 8:00 to 8:00 109.00 11.2892 14.9180 2.2150
NEN181 & 11 Small Single Rate & Dedicated Circuit 8:00 to 8:01 within Embedded Network 109.00 17.0489 19.8465 2.2150
NSP187 & 11 Small Interval Meter time of use & dedicated Circuit 8:00 to 8:00 109.00 36.0531 31.5478 27.6103 2.1847 2.2150
NEE213 Small Two Rate 109.00 14.8727 3.0808
NEN213 Small Two Rate within Embedded Network 109.00 10.4078 5.2383
NSP217 Small Interval meter time of use 109.00 36.0531 31.5478 27.6103 2.1847
NASN212 Business >40MWh Two Rate 109.00 14.2516 3.0808 1.78 0.45
NASN2P2 Business >40MWh Two Rate Premium Feed In 109.00 14.2516 3.0808 -2.3897 -60.00 1.78 0.45
NASN2S2 Business >40MWh Two Rate Standard Feed In 109.00 14.2516 3.0808 -2.3897 1.78 0.45
SUN213 Small Two Rate Solar Installation Premium Feed In 109.00 14.8727 3.0808 -2.3897 -60.00
SSP217 Small Interval meter time of use Solar Installation Premium Feed In 109.00 18.7332 16.4215 14.4025 5.9000 -2.3897 -60.00
SSP277 Small Interval meter time of use Solar Installation Standard Feed In 109.00 18.7332 16.4215 14.4025 5.9000 -2.3897
NEE273 Small Two Rate Solar Installation Standard Feed In Pre December 2012 109.00 14.8727 3.0808 -2.3897
NEE283 Small Two Rate Solar Installation Standard Feed In Post January 2013 109.00 14.8727 3.0808 -2.3897
NSP277 Small Interval meter Low Peak time of use 109.00 18.7332 16.4215 14.4025 5.9000
NEE254 Small Two Rate 8:00 to 8:00 109.00 13.9830 2.9150
NEE406 Medium Single Rate 109.00 20.1934
NEE416 & 9 Medium Single Rate & Dedicated Circuit 109.00 20.1934 2.1400
NEE426 & 10 Medium Single Rate & Dedicated Circuit with Afternoon Boost 109.00 20.1934 1.7300
NEE436 & 11 Medium Single Rate & Dedicated Circuit 8:00 to 8:00 109.00 20.1934 2.2150
NEE513 Medium Two Rate 109.00 17.4700 3.7000
NEE523 Medium Unmetered 15.4000 7.9000
NEE5512 Medium Snowfields 109.00 13.3408 3.7335
NSP557 Medium Interval meter time of use Snowfields 109.00 36.0531 31.5478 27.6103 2.1847
NSP5613 Medium Critical Peak Demand 160MWh to 400MWh 2,352.00 10.2805 7.4860 3.5134 17.88 29.80
NEN5613 Medium Critical Peak Demand 160MWh to 400MWh within Embedded Network 2,352.00 7.8330 5.4592 3.5134 17.88 29.80
NEE605 Medium Seven Day Two Rate 109.00 9.0000 3.5000
NEE743 Large Two Rate 130.00 21.9655 6.2398
NSP7513 Large Critical Peak Demand 400MWh to 750MWh 5,208.00 2.9080 1.9705 1.1239 43.45 72.87
NSP7613 Large Critical Peak Demand 750MWh to 2000MWh 5,208.00 2.6716 1.7500 0.9928 45.30 76.61
NSP7713 Large Critical Peak Demand 2000MWh to 4000MWh 5,208.00 2.6244 1.7303 0.9372 49.67 82.44
NSP7813 Large Critical Peak Demand over 4000MWh 5,208.00 2.3361 1.5410 0.8064 54.63 90.39
NSP8114 High Voltage Critical Peak Demand 5,208.00 0.4890 0.1978 35.76 58.61
NSP8213 High Voltage Critical Peak Demand traction 5,208.00 0.4320 0.4320 0.3681 32.78 53.63
NSP8313 High Voltage Critical Peak Demand low energy use 5,208.00 8.7673 3.0677 0.9554 3.82 6.31
NSP9114 Sub transmission Critical Peak Demand <25MVA & <20KM from TS 18,504.00 0.4714 0.0444 2.39 3.94
NEE933 Large Latrobe Valley Open Cut Supplies 0.00 0.9302 0.9301
NSP9414 Sub transmission Critical Peak Demand >25MVA & <20KM from TS 18,504.00 0.4388 0.0282 1.78 2.96
NSP9514 Sub transmission Critical Peak Demand <25MVA & >20KM from TS 18,504.00 0.5012 0.0631 3.70 6.14

ISSUE 17 PAGE 68 OF 79 UNCONTROLLED WHEN PRINTED APPROVED BY AUSTRALIAN ENERGY REGULATOR
12.3 Transmission Use of System Tariff Schedule
Description Standing
Charge
$/Year
BLOCK 1
c/kWh
BLOCK 2
c/KWh
PEAK
c/KWh
SHOULDER
ALL YEAR
c/KWh
SUMMER
PEAK
c/KWh
SUMMER
SHOULDER
c/KWh
WINTER
PEAK
c/KWh
OFF PEAK
c/KWh
DEDICATED
CIRCUIT
c/KWh
SUMMER
EXPORT
c/KWh
FEEDIN
RATES
c/KWh2
CAPACITY
$/kVA/Year
CRITICAL
PEAK
DEMAND
$/kVA/Year
MONTHLY
PEAK KW
DEMAND
$/kW/Mnth
MONTHLY
OFFPEAK
KW
DEMAND
$/kW/Mnth
Small Residential Single Rate 1.5053 1.5053
Small Residential Single Rate 1.5048 1.5048
Small Residential Single Rate Premium Feed In 1.5048 1.5048
Small Residential Single Rate within Embedded Network 1.5048 1.5048
Small Residential Flexible Single Rate 1.5048
Small Residential Interval meter time of use 1.5053 1.5053 1.5053 0.4196
Small Residential Single Rate & Dedicated Circuit 1.5053 1.5053 0.4196
Small Residential Single Rate & Dedicated Circuit within Embedded Network 1.5048 1.5048 0.4196
Small Residential Flexible Single Rate & Dedicated Circuit 1.5048 0.4196
Small Residential Interval meter time of use & Dedicated Circuit 1.5053 1.5053 1.5053 0.4196 0.4196
Small Residential Single Rate & Dedicated Circuit with Afternoon Boost 1.5053 1.5053 0.4196
Small Residential Single Rate & Dedicated Circuit with Afternoon Boost within Embedded Network 1.5048 1.5048 0.4196
Small Residential Flexible Single Rate & Dedicated Circuit with Afternoon Boost 1.5048 0.4196
Small Residential Interval meter time of use & Dedicated Circuit with Afternoon Boost 1.5053 1.5053 1.5053 0.4196 0.4196
Small Residential Single Rate & Dedicated Circuit 8:00 to 8:00 1.5053 1.5053 0.4196
Small Residential Single Rate & Dedicated Circuit 8:00 to 8:00 within Embedded Network 1.5048 1.5048 0.4196
Small Residential Flexible Single Rate & Dedicated Circuit 8:00 to 8:00 1.5048 0.4196
Small Residential Interval meter time of use & Dedicated Circuit 8:00 to 8:00 1.5053 1.5053 1.5053 0.4196 0.4196
Small Residential Two Rate 1.5048 0.4196
Small Residential Two Rate within Embedded Network 1.5048 0.4196
Small Residential Interval meter time of use 1.5048 1.5048 1.5048 0.4196
Small Residential Two Rate Solar Installation Standard Feed In Pre December 2012 1.5048 0.4196
Small Residential Two Rate Solar Installation Standard Feed In Post January 2013 1.5048 0.4196
Small Residential Two Rate Solar Installation Premium Feed In 1.5048 0.4196
Small Residential Interval Meter time of use Solar Installation Standard Feed In 1.5048 1.5048 1.5048 0.4196
Small Residential Interval Meter time of use Solar Installation Premium Feed In 1.5048 1.5048 1.5048 0.4196
Small Residential Two Rate 8:00 to 8:00 1.5048 0.4196
Small Residential Flexible 1.5048 1.5048 1.5048 0.4196
Small Residential Flexible & Dedicated Circuit 1.5048 1.5048 1.5048 0.4196 0.4196
Small Residential Flexible & Dedicated Circuit with Afternoon Boost 1.5048 1.5048 1.5048 0.4196 0.4196
Small Residential Flexible & Dedicated Circuit 8:00 to 8:00 1.5048 1.5048 1.5048 0.4196 0.4196
Small Residential Dedicated circuit 0.4196
Small Residential Interval Dedicated circuit 0.4196
Small Residential Dedicated circuit with Afternoon Boost 0.4196
Small Residential Interval Meter Dedicated circuit with Afternoon Boost 0.4196
Small Residential Dedicated circuit 8:00 to 8:00 0.4196
Small Residential Interval Meter Dedicated circuit 8:00 to 8:00 0.4196

ISSUE 17 PAGE 69 OF 79 UNCONTROLLED WHEN PRINTED APPROVED BY AUSTRALIAN ENERGY REGULATOR
Description Standing
Charge
$/Year
BLOCK 1
c/kWh
BLOCK 2
c/KWh
PEAK
c/KWh
SHOULDER
ALL YEAR
c/KWh
SUMMER
PEAK
c/KWh
SUMMER
SHOULDER
c/KWh
WINTER
PEAK
c/KWh
OFF PEAK
c/KWh
DEDICATED
CIRCUIT
c/KWh
SUMMER
EXPORT
c/KWh
FEEDIN
RATES
c/KWh2
CAPACITY
$/kVA/Year
CRITICAL
PEAK
DEMAND
$/kVA/Year
MONTHLY
KW
DEMAND
$/kW
MONTHLY
KW
DEMAND
$/kW2
Small Single Rate 1.5048 1.5048
Small Business Single Rate 1.5048 1.5048
Small Business Single Rate Premium Feed In 1.5048 1.5048
Business >40MWh Single Rate 1.5048 1.5048
Small Single Rate within EmbeddedNetwork 1.5048 1.5048
Small Interval Meter time of use 1.5048 1.5048 1.5048 0.4196
Small Single Rate & Dedicated Circuit 1.5048 1.5048 0.4196
Small Single Rate & Dedicated Circuit within Embedded Network 1.5048 1.5048 0.4196
Small Interval Meter time of use & Dedicated Circuit 1.5048 1.5048 1.5048 0.4196 0.4196
Small Single Rate & Dedicated Circuit with Afternoon Boost 1.5048 1.5048 0.4196
Small Single Rate & Dedicated Circuit with Afternoon Boost within Embedded Network 1.5048 1.5048 0.4196
Small Interval Meter time of use & dedicated Circuit with Afternoon Boost 1.5048 1.5048 1.5048 0.4196 0.4196
Small Single Rate & Dedicated Circuit 8:00 to 8:00 1.5048 1.5048 0.4196
Small Single Rate & Dedicated Circuit 8:00 to 8:01 within Embedded Network 1.5048 1.5048 0.4196
Small Interval Meter time of use & dedicated Circuit 8:00 to 8:00 1.5048 1.5048 1.5048 0.4196 0.4196
Small Two Rate 1.5048 0.4196
Small Two Rate within Embedded Network 1.5048 0.4196
Small Interval meter time of use 1.5048 1.5048 1.5048 0.4196
Business >40MWh Two Rate 1.5048 0.4196
Business >40MWh Two Rate Premium Feed In 1.5048 0.4196
Business >40MWh Two Rate Standard Feed In 1.5048 0.4196
Small Two Rate Solar Installation Premium Feed In 1.5048 0.4196
Small Interval meter time of use Solar Installation Premium Feed In 1.5048 1.5048 1.5048 0.4196
Small Interval meter time of use Solar Installation Standard Feed In 1.5048 1.5048 1.5048 0.4196
Small Two Rate Solar Installation Standard Feed In Pre December 2012 1.5048 0.4196
Small Two Rate Solar Installation Standard Feed In Post January 2013 1.5048 0.4196
Small Interval meter Low Peak time of use 1.5048 1.5048 1.5048 0.4196
Small Two Rate 8:00 to 8:00 1.5048 0.4196
Medium Single Rate 1.5048
Medium Single Rate & Dedicated Circuit 1.5048 0.4196
Medium Single Rate & Dedicated Circuit with Afternoon Boost 1.5048 0.4196
Medium Single Rate & Dedicated Circuit 8:00 to 8:00 1.5048 0.4196
Medium Two Rate 1.5048 0.4196
Medium Unmetered 1.5048 0.4196
Medium Snowfields 1.5048 0.4196
Medium Interval meter time of use Snowfields 1.5048 1.5048 1.5048 0.4196
Medium Critical Peak Demand 160MWh to 400MWh 1.5048 1.5048 0.4196
Medium Critical Peak Demand 160MWh to 400MWh within Embedded Network 1.5048 1.5048 0.4196
Medium Seven Day Two Rate 1.5048 0.4196
Large Two Rate 1.5048 0.4196
Large Critical Peak Demand 400MWh to 750MWh 1.5048 1.5048 0.4196
Large Critical Peak Demand 750MWh to 2000MWh 1.5048 1.5048 0.4196
Large Critical Peak Demand 2000MWh to 4000MWh 1.5048 1.5048 0.4196
Large Critical Peak Demand over 4000MWh 1.5048 1.5048 0.4196
High Voltage Critical Peak Demand 1.5048 0.4196
High Voltage Critical Peak Demand traction 1.5048 1.5048 0.4196
High Voltage Critical Peak Demand low energy use 1.5048 1.5048 0.4196
Sub transmission Critical Peak Demand <25MVA & <20KM from TS 1.5048 0.4196
Large Latrobe Valley Open Cut Supplies 0.9650 0.9650
Sub transmission Critical Peak Demand >25MVA & <20KM from TS 1.5048 0.4196
Sub transmission Critical Peak Demand <25MVA & >20KM from TS 1.5048 0.4196
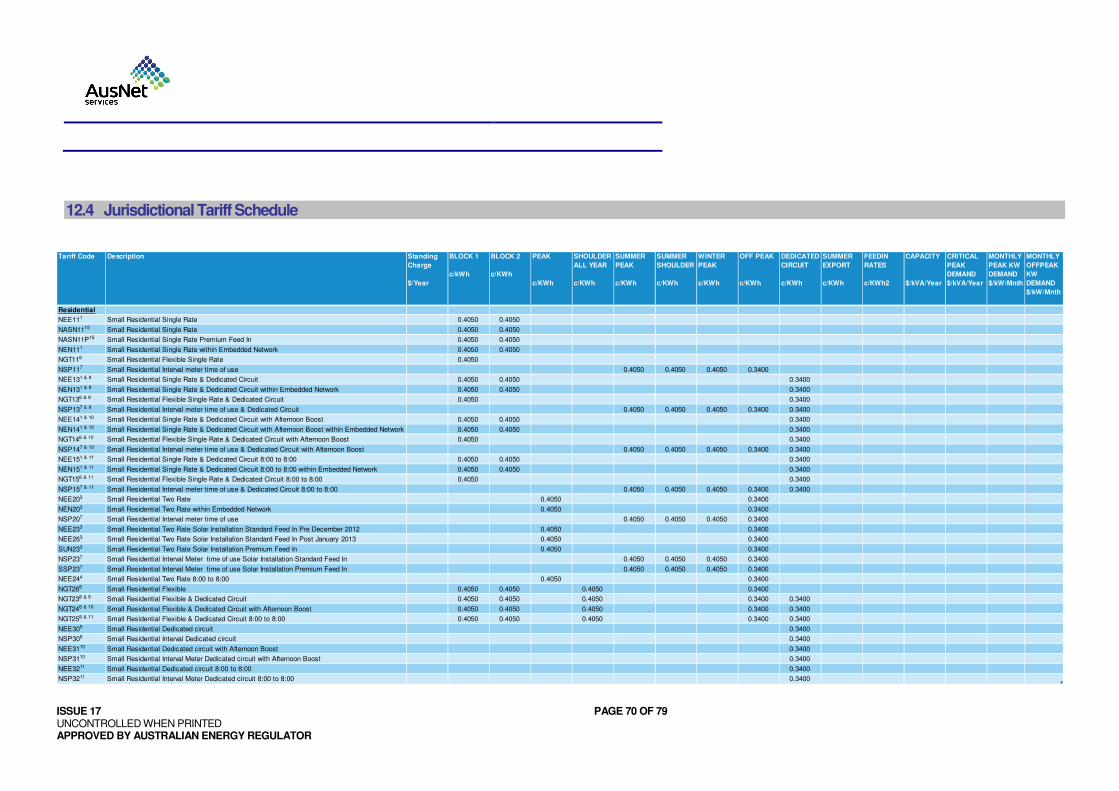
ISSUE 17 PAGE 70 OF 79 UNCONTROLLED WHEN PRINTED APPROVED BY AUSTRALIAN ENERGY REGULATOR
12.4 Jurisdictional Tariff Schedule
Tariff Code Description Standing
Charge
$/Year
BLOCK 1
c/kWh
BLOCK 2
c/KWh
PEAK
c/KWh
SHOULDER
ALL YEAR
c/KWh
SUMMER
PEAK
c/KWh
SUMMER
SHOULDER
c/KWh
WINTER
PEAK
c/KWh
OFF PEAK
c/KWh
DEDICATED
CIRCUIT
c/KWh
SUMMER
EXPORT
c/KWh
FEEDIN
RATES
c/KWh2
CAPACITY
$/kVA/Year
CRITICAL
PEAK
DEMAND
$/kVA/Year
MONTHLY
PEAK KW
DEMAND
$/kW/Mnth
MONTHLY
OFFPEAK
KW
DEMAND
$/kW/Mnth
Residential
NEE111 Small Residential Single Rate 0.4050 0.4050
NASN1115 Small Residential Single Rate 0.4050 0.4050
NASN11P15 Small Residential Single Rate Premium Feed In 0.4050 0.4050
NEN111 Small Residential Single Rate within Embedded Network 0.4050 0.4050
NGT116 Small Residential Flexible Single Rate 0.4050
NSP117 Small Residential Interval meter time of use 0.4050 0.4050 0.4050 0.3400
NEE131 & 9 Small Residential Single Rate & Dedicated Circuit 0.4050 0.4050 0.3400
NEN131 & 9 Small Residential Single Rate & Dedicated Circuit within Embedded Network 0.4050 0.4050 0.3400
NGT136 & 9 Small Residential Flexible Single Rate & Dedicated Circuit 0.4050 0.3400
NSP137 & 9 Small Residential Interval meter time of use & Dedicated Circuit 0.4050 0.4050 0.4050 0.3400 0.3400
NEE141 & 10 Small Residential Single Rate & Dedicated Circuit with Afternoon Boost 0.4050 0.4050 0.3400
NEN141 & 10 Small Residential Single Rate & Dedicated Circuit with Afternoon Boost within Embedded Network 0.4050 0.4050 0.3400
NGT146 & 10 Small Residential Flexible Single Rate & Dedicated Circuit with Afternoon Boost 0.4050 0.3400
NSP147 & 10 Small Residential Interval meter time of use & Dedicated Circuit with Afternoon Boost 0.4050 0.4050 0.4050 0.3400 0.3400
NEE151 & 11 Small Residential Single Rate & Dedicated Circuit 8:00 to 8:00 0.4050 0.4050 0.3400
NEN151 & 11 Small Residential Single Rate & Dedicated Circuit 8:00 to 8:00 within Embedded Network 0.4050 0.4050 0.3400
NGT156 & 11 Small Residential Flexible Single Rate & Dedicated Circuit 8:00 to 8:00 0.4050 0.3400
NSP157 & 11 Small Residential Interval meter time of use & Dedicated Circuit 8:00 to 8:00 0.4050 0.4050 0.4050 0.3400 0.3400
NEE203 Small Residential Two Rate 0.4050 0.3400
NEN203 Small Residential Two Rate within Embedded Network 0.4050 0.3400
NSP207 Small Residential Interval meter time of use 0.4050 0.4050 0.4050 0.3400
NEE233 Small Residential Two Rate Solar Installation Standard Feed In Pre December 2012 0.4050 0.3400
NEE263 Small Residential Two Rate Solar Installation Standard Feed In Post January 2013 0.4050 0.3400
SUN233 Small Residential Two Rate Solar Installation Premium Feed In 0.4050 0.3400
NSP237 Small Residential Interval Meter time of use Solar Installation Standard Feed In 0.4050 0.4050 0.4050 0.3400
SSP237 Small Residential Interval Meter time of use Solar Installation Premium Feed In 0.4050 0.4050 0.4050 0.3400
NEE244 Small Residential Two Rate 8:00 to 8:00 0.4050 0.3400
NGT268 Small Residential Flexible 0.4050 0.4050 0.4050 0.3400
NGT238 & 9 Small Residential Flexible & Dedicated Circuit 0.4050 0.4050 0.4050 0.3400 0.3400
NGT248 & 10 Small Residential Flexible & Dedicated Circuit with Afternoon Boost 0.4050 0.4050 0.4050 0.3400 0.3400
NGT258 & 11 Small Residential Flexible & Dedicated Circuit 8:00 to 8:00 0.4050 0.4050 0.4050 0.3400 0.3400
NEE309 Small Residential Dedicated circuit 0.3400
NSP309 Small Residential Interval Dedicated circuit 0.3400
NEE3110 Small Residential Dedicated circuit with Afternoon Boost 0.3400
NSP3110 Small Residential Interval Meter Dedicated circuit with Afternoon Boost 0.3400
NEE3211 Small Residential Dedicated circuit 8:00 to 8:00 0.3400
NSP3211 Small Residential Interval Meter Dedicated circuit 8:00 to 8:00 0.3400

ISSUE 17 PAGE 71 OF 79 UNCONTROLLED WHEN PRINTED APPROVED BY AUSTRALIAN ENERGY REGULATOR
Tariff Code Description Standing
Charge
$/Year
BLOCK 1
c/kWh
BLOCK 2
c/KWh
PEAK
c/KWh
SHOULDER
ALL YEAR
c/KWh
SUMMER
PEAK
c/KWh
SUMMER
SHOULDER
c/KWh
WINTER
PEAK
c/KWh
OFF PEAK
c/KWh
DEDICATED
CIRCUIT
c/KWh
SUMMER
EXPORT
c/KWh
FEEDIN
RATES
c/KWh2
CAPACITY
$/kVA/Year
CRITICAL
PEAK
DEMAND
$/kVA/Year
MONTHLY
PEAK KW
DEMAND
$/kW/Mnth
MONTHLY
OFFPEAK
KW
DEMAND
$/kW/Mnth
Business
NEE121 Small Single Rate 0.4050 0.4050
NASN1215 Small Business Single Rate 0.4050 0.4050
NASN12P15 Small Business Single Rate Premium Feed In 0.4050 0.4050
NASN1915 Business >40MWh Single Rate 0.4050 0.4050
NEN121 Small Single Rate within EmbeddedNetwork 0.4050 0.4050
NSP127 Small Interval Meter time of use 0.4050 0.4050 0.4050 0.3400
NEE161 & 9 Small Single Rate & Dedicated Circuit 0.4050 0.4050 0.3400
NEN161 & 9 Small Single Rate & Dedicated Circuit within Embedded Network 0.4050 0.4050 0.3400
NSP167 & 9 Small Interval Meter time of use & Dedicated Circuit 0.4050 0.4050 0.4050 0.3400 0.3400
NEE171 & 10 Small Single Rate & Dedicated Circuit with Afternoon Boost 0.4050 0.4050 0.3400
NEN171 & 10 Small Single Rate & Dedicated Circuit with Afternoon Boost within Embedded Network 0.4050 0.4050 0.3400
NSP177 & 10 Small Interval Meter time of use & dedicated Circuit with Afternoon Boost 0.4050 0.4050 0.4050 0.3400 0.3400
NEE181 & 11 Small Single Rate & Dedicated Circuit 8:00 to 8:00 0.4050 0.4050 0.3400
NEN181 & 11 Small Single Rate & Dedicated Circuit 8:00 to 8:01 within Embedded Network 0.4050 0.4050 0.3400
NSP187 & 11 Small Interval Meter time of use & dedicated Circuit 8:00 to 8:00 0.4050 0.4050 0.4050 0.3400 0.3400
NEE213 Small Two Rate 0.4050 0.3400
NEN213 Small Two Rate within Embedded Network 0.4050 0.3400
NSP217 Small Interval meter time of use 0.4050 0.4050 0.4050 0.3400
NASN212 Business >40MWh Two Rate 0.4050 0.3400
NASN2P2 Business >40MWh Two Rate Premium Feed In 0.4050 0.3400
NASN2S2 Business >40MWh Two Rate Standard Feed In 0.4050 0.3400
SUN213 Small Two Rate Solar Installation Premium Feed In 0.4050 0.3400
SSP217 Small Interval meter time of use Solar Installation Premium Feed In 0.4050 0.4050 0.4050 0.3400
SSP277 Small Interval meter time of use Solar Installation Standard Feed In 0.4050 0.4050 0.4050 0.3400
NEE273 Small Two Rate Solar Installation Standard Feed In Pre December 2012 0.4050 0.3400
NEE283 Small Two Rate Solar Installation Standard Feed In Post January 2013 0.4050 0.3400
NSP277 Small Interval meter Low Peak time of use 0.4050 0.4050 0.4050 0.3400
NEE254 Small Two Rate 8:00 to 8:00 0.4050 0.3400
NEE406 Medium Single Rate 0.4050
NEE416 & 9 Medium Single Rate & Dedicated Circuit 0.4050 0.3400
NEE426 & 10 Medium Single Rate & Dedicated Circuit with Afternoon Boost 0.4050 0.3400
NEE436 & 11 Medium Single Rate & Dedicated Circuit 8:00 to 8:00 0.4050 0.3400
NEE513 Medium Two Rate 0.4050 0.3400
NEE523 Medium Unmetered 0.4050 0.3400
NEE5512 Medium Snowfields 190.00
NSP557 Medium Interval meter time of use Snowfields 190.00
NSP5613 Medium Critical Peak Demand 160MWh to 400MWh 190.00
NEN5613 Medium Critical Peak Demand 160MWh to 400MWh within Embedded Network 190.00
NEE605 Medium Seven Day Two Rate 190.00
NEE743 Large Two Rate 190.00
NSP7513 Large Critical Peak Demand 400MWh to 750MWh 190.00
NSP7613 Large Critical Peak Demand 750MWh to 2000MWh 190.00
NSP7713 Large Critical Peak Demand 2000MWh to 4000MWh 190.00
NSP7813 Large Critical Peak Demand over 4000MWh 190.00
NSP8114 High Voltage Critical Peak Demand 190.00
NSP8213 High Voltage Critical Peak Demand traction 190.00
NSP8313 High Voltage Critical Peak Demand low energy use 190.00
NSP9114 Sub transmission Critical Peak Demand <25MVA & <20KM from TS 190.00
NEE933 Large Latrobe Valley Open Cut Supplies
NSP9414 Sub transmission Critical Peak Demand >25MVA & <20KM from TS 190.00
NSP9514 Sub transmission Critical Peak Demand <25MVA & >20KM from TS 190.00

ISSUE 17 PAGE 72 OF 79 UNCONTROLLED WHEN PRINTED APPROVED BY AUSTRALIAN ENERGY REGULATOR
12.5 Tariff Structure

ISSUE 17 PAGE 73 OF 79 UNCONTROLLED WHEN PRINTED APPROVED BY AUSTRALIAN ENERGY REGULATOR
Tariff Structure 8
Standing Charge $/Year
Summer 2:00AM AEST First Sunday in October to 2:00AM AEST First Sunday in April
Peak c/kWh Mon – Fri 3:00PM to 9:00PM
Shoulder c/kWh Mon – Fri 7:00AM to 3:00PM & 9:00PM to 10:00PM; and
Sat - Sun 7:00AM to 10:00PM
Off Peak c/kWh All other times
AEDT in Summer AEST all other times.
Tariff Structure 9
Standing Charge $/Year
Off Peak Energy c/kWh 11:00PM to 7:00AM Monday to Sunday
Tariff Structure 10
Standing Charge $/Year
Off Peak Energy c/kWh 11:00PM to 7:00AM & 1:00PM to 4:00PM Monday to Sunday
Tariff Structure 11
Standing Charge $/Year
Off Peak Energy c/kWh 6 or 8 Hrs between 8:00PM to 8:00AM Monday to Sunday
Tariff Structure 12
Standing Charge $/Year
Peak Energy c/kWh 1 May to 30 September
Off Peak Energy c/kWh All other times
Tariff Structure 13
Standing Charge $/Year
Peak Energy c/kWh 7:00AM to 10:00AM & 4:00PM to 11:00PM Monday to Friday
Shoulder Energy c/kWh 10:00AM to 4:00PM Monday to Friday
Off Peak Energy c/kWh All other times
Demand Capacity $/kVA/yr Fixed Value
Demand Critical Peak $/kVA/yr Average of five rcorded between 3:00PM & 7:00PM ADST on five days nominated in advance
Tariff Structure 14
Standing Charge $/Year
Peak Energy c/kWh 7:00AM to 11:00PM Monday to Friday
Off Peak Energy c/kWh All other times
Demand Capacity $/kVA/yr Fixed Value
Demand Critical Peak $/kVA/yr Average of five rcorded between 3:00PM & 7:00PM ADST on five days nominated in advance
Tariff Structure 15
Standing Charge $/Year
Inclining Block 1 c/kWh 1020kWh/qtr
Inclining Block 2 c/kWh kWh Balance (these tariffs expressed as single rate, all energy is charged at the same rate in 2018)
Demand $/kW/Month 3:00PM to 9:00PM ADST, Monday to Friday, Peak Season Dec to Mar Off Peak all other months

ISSUE 17 PAGE 74 OF 79 UNCONTROLLED WHEN PRINTED APPROVED BY AUSTRALIAN ENERGY REGULATOR
12.6 Prescribed Metering Schedule
Metering Data Services
Un Metered Supplies
Fixed Charge $/NMI/pa $ 317.16
Fixed Charge $/Light/pa $ 1.6578
Meter Provision
<160 MWh a year Single Phase Single Element Meter
Fixed Charge $/meter/pa $60.80
Single Phase Two Element Meter With Contactor
Fixed Charge $/meter/pa $69.90
Multi Phase Meter
Fixed Charge $/meter/pa $84.00
Multi Phase Direct Connected Meter With Contactor
Fixed Charge $/meter/pa $93.00
Multi Phase Current Transformer Connected Meter
Fixed Charge $/meter/pa $120.00
The charges will be applied on a per meter basis in the following manner:
1. Where a site is > 160 MW, a > 160 MWh Multi Phase CT Connected Meter Provisioning tariff will be applied on a per meter basis.
2. For < 160 MWh sites:
a. Which have Multi-phase connections with CT equipment, a Multi Phase CT Connected Meter Provisioning tariff will be applied on a per meter basis.
b. Which have Multi-phase connections with a Direct Connection, a Multi Phase, Direct Connected tariff will be applied on a per meter basis.
c. With only one meter, which is a Single-phase, single register connection a Single Phase Non Off Peak Meter Provisioning tariff will be applied.
d. With Single-phase connections that do not receive a Single Phase Non Off Peak Meter tariff, a Single Phase Off Peak Meter tariff will be applied.
• Note that if a site fits the criteria for more than one of the < 160 MW tariffs, all applicable tariffs may be applied.
The Meter Provisioning charges will be calculated by applying a daily rate to the time period covered in the related NUoS bill.

ISSUE 17 PAGE 75 OF 79 UNCONTROLLED WHEN PRINTED APPROVED BY AUSTRALIAN ENERGY REGULATOR
These charges will be visible in the detailed Billing file, provided on a monthly basis. The charges will be presented in the “600” line structure.
o The “Quantity” field in this structure will reflect the number of days being charged for. In a situation where there are multiple Multi-Phase meters being charged under the same tariff, the “quantity” will be the number of days multiplied by the number of meters.
The “EventDate” field will reflect the “EndDate” presented in the NUoS record
Date of Application - 1 January 2018
B2B Code Meter Type
2018
$
Single Phase Single Element 435.74
Single Phase Two Element with Contactor 455.83
Multiphase 492.77
Multiphase with Contactor 531.66
Multiphase CT Connected 612.14
Meter Exit fees

ISSUE 17 PAGE 76 OF 79 UNCONTROLLED WHEN PRINTED APPROVED BY AUSTRALIAN ENERGY REGULATOR
12.7 Ancillary Services Schedule
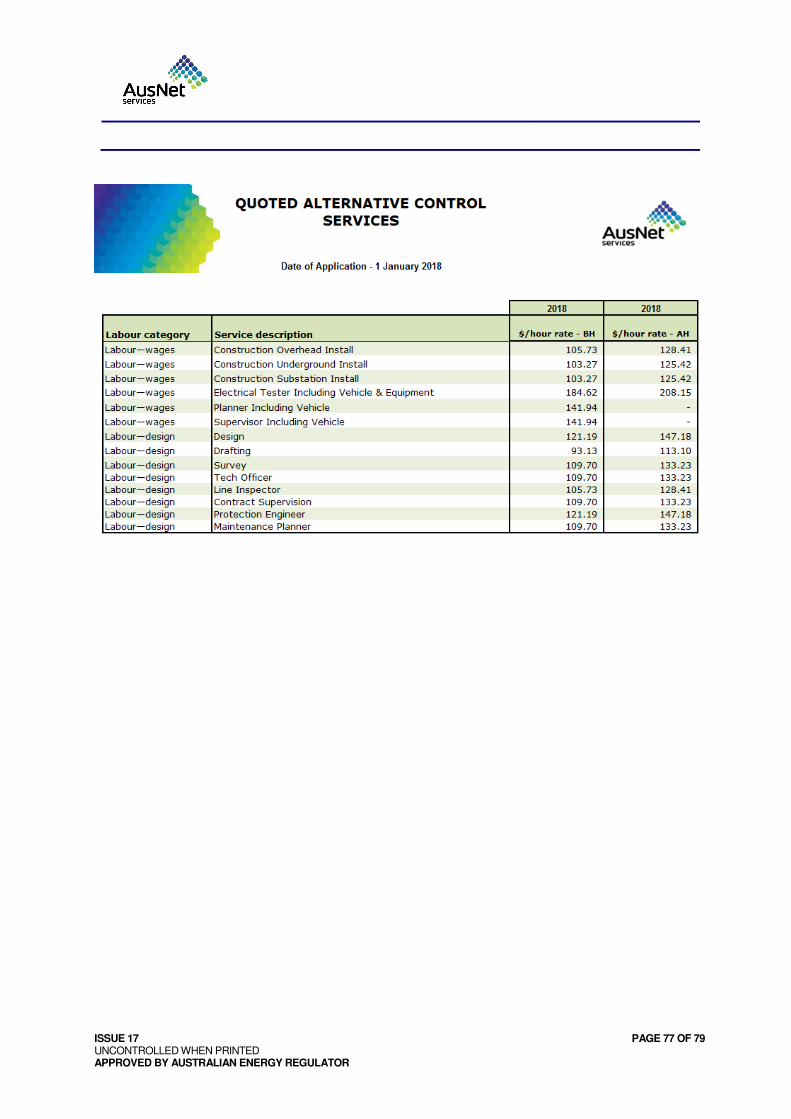
ISSUE 17 PAGE 77 OF 79 UNCONTROLLED WHEN PRINTED APPROVED BY AUSTRALIAN ENERGY REGULATOR

ISSUE 17 PAGE 78 OF 79 UNCONTROLLED WHEN PRINTED APPROVED BY AUSTRALIAN ENERGY REGULATOR
12.8 Public lighting Schedule

ISSUE 17 PAGE 79 OF 79 UNCONTROLLED WHEN PRINTED APPROVED BY AUSTRALIAN ENERGY REGULATOR