Embed Size (px)
Citation preview

REWARDMANAGEMENT
2013Annual survey report supplement 2013Aligning strategy and benefits
WORKFORCEWORK WORKPLACE

Championing better work and working lives
The CIPD’s purpose is to champion better work and working lives by improving practices in people and organisation development, for the benefit of individuals, businesses, economies and society. Our research work plays a critical role – providing the content and credibility for us to drive practice, raise standards and offer advice, guidance and practical support to the profession. Our research also informs our advocacy and engagement with policy-makers and other opinion-formers on behalf of the profession we represent.
To increase our impact, in service of our purpose, we’re focusing our research agenda on three core themes: the future of work, the diverse and changing nature of the workforce, and the culture and organisation of the workplace.
About us
The CIPD is the professional body for HR and people development. We have over 130,000 members internationally – working in HR, learning and development, people management and consulting across private businesses and organisations in the public and voluntary sectors. We are an independent and not-for-profit organisation, guided in our work by the evidence and the front-line experience of our members.
WORKOur focus on work includes what work is and where, when and how work takes place, as well as trends and changes in skills and job needs, changing career patterns, global mobility, technological developments and new ways of working.
WORKPLACEOur focus on the workplace includes how organisations are evolving and adapting, understanding of culture, trust and engagement, and how people are best organised, developed, managed, motivated and rewarded to perform at their best.
WORKFORCEOur focus on the workforce includes demographics, generational shifts, attitudes and expectations, the
changing skills base and trends in learning and education.
Rew
aR
d m
an
ag
em
en
t 2013
1
2013
COntentS
Foreword 2
Summary of key findings 4
Introduction 8
Business strategy 9
Workforce characteristics 15
HR outcomes 21
Benefits transparency 27
Conclusions and implications 32
Background to the report 34
Appendix: benefits categories 36
Endnotes 37
cipd.co.uk/rewardm
anagementsurvey
2
RewaRd management
fORewORd
A quick perusal of Google Scholar for academic
research on employee benefits produces thin
pickings for the reward professional. This lack
of academic interest is perhaps odd given the
significant amount of money that is spent each
year by employers on such rewards, both in the
UK and overseas. By contrast, the quantity, if
not quality, of academic research around pay is
significantly larger.
Despite the fact that little taxpayer-funded research
appears to be focusing on employee benefits,
reward professionals are nevertheless being criticised
by some academics for not making evidence-based
decisions when making reward choices.
This year, to help start to break this circle, the
CIPD asked the researchers involved with the
Reward Management survey to examine employee
benefits in more depth and so help create an
evidence base and encourage more academics to
review this unexplored area.
The objectives of this research have been to
explore the links between benefits provisions and
business strategy, workforce characteristics and
HR workplace outcomes. In addition, we have also
explored the associations between organisational
approaches to employee benefit transparency,
benefits management and workplace outcomes.
The research indicates that there is indeed a
relationship between an organisation’s business
strategy and the workplace benefits on offer to
the workforce. For instance, a firm exhibiting
a prospector strategy or one that focuses on
product quality is statistically more likely to
provide those benefits associated with employee
development (such as coaching and mentoring
or paid/part-paid professional subscription) than
a firm following a cost or defender strategy.
Of course, the implication for practitioners is
whether business strategy and employee benefits
strategy remain in sync or whether there is a lag
as practice catches up with strategy.
Workplaces where most of the workforce are
graduates are more likely to belong to a defined
contribution pension scheme than workplaces
where graduates are in the minority. Another
finding is that women are more likely to be at
workplaces where there is a still open defined
benefit pension scheme, but where share schemes
are not typically provided. However, these findings
are likely to be influenced by sector rather than
gender. That said, these results do highlight public
policy issues that flow from reforms to public
sector pensions or moves to increase the tax
breaks for share plans.
In terms of HR workforce outcomes, organisations

Rew
aR
d m
an
ag
em
en
t 2013
3
2013
that report having a positive employee relations
climate are statistically more apt to offer
development benefits to their staff. Similarly,
those organisations that are more likely to report
employee absenteeism difficulties are statistically
less likely to offer their staff: free tea/coffee;
a Christmas party; paid study leave; flexible
homeworking; training and career development;
and life assurance/death in service. It would be
wrong to think that the lack of a benefit such as
free tea at work leads to absenteeism difficulties,
rather that employers suffering from absenteeism
difficulties may be less likely to be able to afford
to provide this benefit. In turn, this makes the
organisation a less attractive place to work, which
exacerbates the problem.
Similar to last year, the research finds a positive
relationship between the amount of benefit
transparency and various HR outcomes, such
as employee relations, labour productivity and
employee absenteeism. Implications for practice
from this research include HR professionals
examining whether there is scope for greater
innovation in managing investment in total
reward; reviewing whether the business and
benefit strategies are still in sync; and whether
the amount of benefit secrecy, or otherwise, is
delivering intended or unintended consequences.
I would like to thank all those reward
and HR professionals who helped develop
the questionnaire, those that filled in our
questionnaire, those that have reviewed
this report and the team at the University of
Bedfordshire, London Metropolitan University,
the University of Sydney and the University of
Melbourne who helped create this report.
Charles Cotton
CIPD Performance and Reward Adviser
cipd.co.uk/rewardm
anagementsurvey
4
RewaRd management
SummaRy Of key findingS
This report uses data from the CIPD 2013 Reward Management survey report to explore the connections between benefits and pension practices and three aspects of organisations: business strategy, workforce characteristics and HR outcomes. In addition, the report considers the associations between organisational approaches to transparency of benefits systems, benefits management and HR outcomes. This study finds that there are compelling connections between these elements, which have important implications for reward and HR practitioners.
Business strategyOur results in Table 1 show that private sector
firms operationalising different types of business
strategy (based on competition preferences in
chosen product/service markets, for full business
strategy definitions see Table 5) have different
approaches to workplace benefits and pensions
provisions. In general, firms which prefer to take
a more innovative, market-leading approach
(prospectors and quality-focused firms) are more
likely to have a more extensive benefits provision,
while those operating in safe, stable markets
(defenders and cost-focused firms) are more likely
to be offering more traditional defined benefit
pension plans.
For HR practitioners, the implications of these
findings relate to questions around whether or
not business strategy and employee benefits
remain in sync, or whether there is a lag between
reorientation to meet competitive business needs
and aligning this with a key aspect of HRM.

Rew
aR
d m
an
ag
em
en
t 2013
5
2013
Workforce characteristicsTable 2 shows our findings for the associations
between benefits management and workforce
characteristics in all organisations (private, public
and not-for-profit sectors). While we need to be
mindful of sector and size of organisation factors,
these results show that higher proportions of
certain types of workforce (according to age,
gender and education level) are associated with
different workplace practices, particularly around
pensions provisions.
For those with responsibility in this area, careful
consideration needs to be given to the balance
between total reward mix and any intended
segmentation to align with diverse preferences
among employee groups, while being wary of
putting the organisation at risk of claims that
certain categories of employee are unfairly
treated – for example on grounds of gender.
Table 1: Business strategy and benefits management (private sector organisations only)
In defender strategy organisations… In prospector strategy organisations…
Defined benefit pension schemes are more likely.
Defined contribution pension schemes are less likely.
Defined benefit pension schemes are less likely to be closed in 2013.
A high number of different benefits are more likely to be offered.
Development, pay and social benefits are more likely to be offered.
Lower employer and employee DC pensions’ contributions are more likely.
In operating excellence/cost-focused organisations… In product leadership/quality-focused organisations…
Recognition benefits are more likely to be offered.
Voluntary/affinity benefits are more likely to be offered.
A contributory pension scheme is more likely to be offered.
Changes to pension schemes to meet auto-enrolment requirements are more likely in 2013.
A high number of different benefits are more likely to be offered.
Development and pay benefits are more likely to be offered.
Share schemes/long-term incentives are more likely to be offered.
A hybrid pension scheme is more likely. Lower employer pensions’ contributions are more likely.
Table 2: Workforce characteristics and benefits management (all organisations)
In sections of workforces with a majority of female employees…
In sections of workforces with a majority of young employees…
In sections of workforces with a majority of graduate employees…
Share schemes and LTIs are less likely to be used.
Defined benefit schemes are more likely to be open.
Pension schemes with employer contributions are less likely to be offered.
Defined benefit schemes (open and closed) are less common.
Lower levels of defined contribution pension scheme membership are more likely.
Higher levels of defined contribution pension scheme membership are more likely.
Changes to pension schemes are less likely.

cipd.co.uk/rewardm
anagementsurvey
6
RewaRd management
HR outcomesIn Table 3 results shown indicate that certain key
HR outcomes in the workplace (such as employee
relations climate, labour productivity, employee
recruitment, retention, absenteeism and pay
discontent) are associated with different benefits
management practices.
Implications for HR practitioners centre on
whether there is scope for greater innovation
in managing investment in total reward, paying
attention to the benefits aspects, and whether
or not there is a driver effect related to key HR
outcomes, mindful of employee engagement
aspirations as well as overall workforce
productivity.
Table 3: HR outcomes and benefits management (all organisations)
In organisations with a positive employee relations climate…
In organisations that have increased labour productivity in past three years…
Development benefits are more likely to be offered.
25+ days’ leave, eye care vouchers, Internet purchases delivered to work, training and career development, on-site parking (free/subsidised), flexible/homeworking are more likely to be offered.
In organisations that have experienced employee recruitment difficulties in the past 12 months…
In organisations that have experienced employee retention difficulties in the past 12 months…
Flexible/homeworking, enhanced maternity/paternity leave, paid leave for military reserve activities, pension scheme, training and career development, cycle to work scheme loan are less likely to be offered.
Flexible/homeworking, training and career development, paid study leave, pension scheme, Christmas party/lunch and death in service/life assurance are less likely to be offered.
Contributory pension schemes are less likely to be offered.
In organisations that have experienced employee absenteeism difficulties in the past 12 months…
In organisations that have experienced pay discontent raised by employees in the past 12 months…
Tea/coffee/cold drinks free, Christmas party/lunch, paid study leave, flexible/homeworking, training and career development and death in service/life assurance are less likely to be offered.
Defined benefit pension schemes are more likely to be open.
Share schemes and other long-term incentive plans are less likely to be used.
Tea/coffee/cold drinks free, Christmas party/lunch, Internet purchases delivered to work, on-site parking (free/subsidised), 25+ days’ paid leave, paid study leave are less likely to be offered.
Flexible benefits are less likely to be used.
Defined benefit pension schemes are more likely to be open.
Rew
aR
d m
an
ag
em
en
t 2013
7
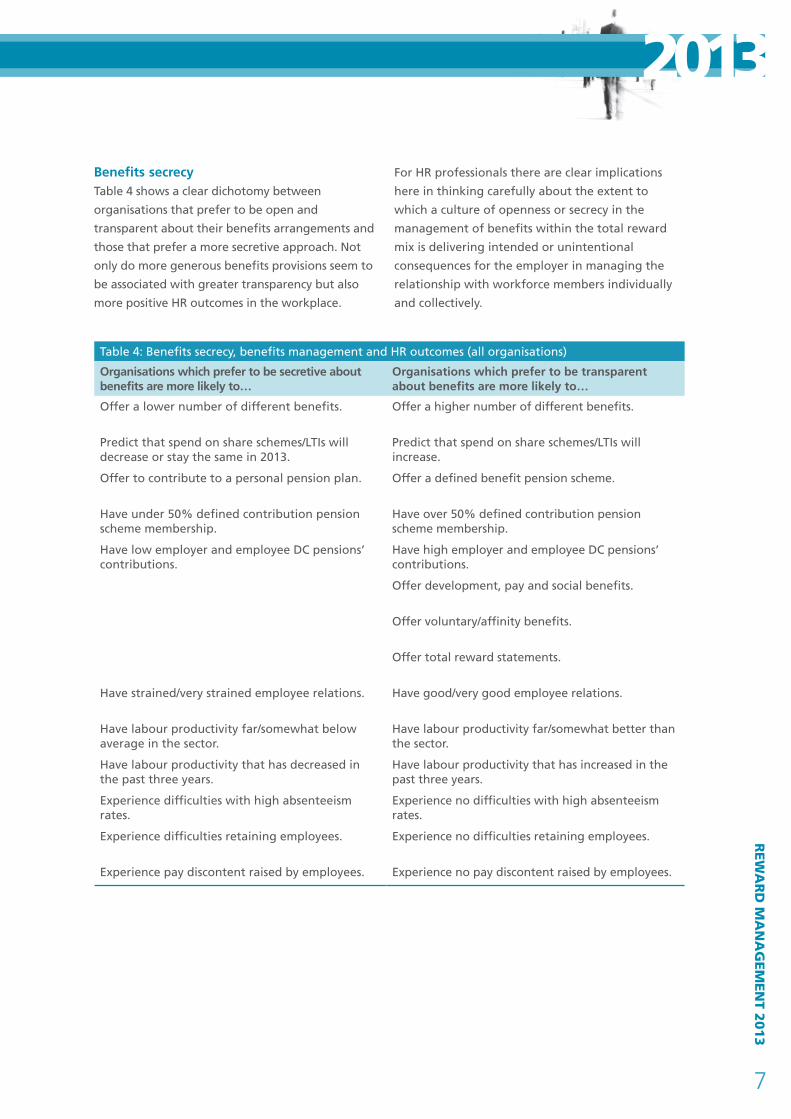
2013Benefits secrecyTable 4 shows a clear dichotomy between
organisations that prefer to be open and
transparent about their benefits arrangements and
those that prefer a more secretive approach. Not
only do more generous benefits provisions seem to
be associated with greater transparency but also
more positive HR outcomes in the workplace.
For HR professionals there are clear implications
here in thinking carefully about the extent to
which a culture of openness or secrecy in the
management of benefits within the total reward
mix is delivering intended or unintentional
consequences for the employer in managing the
relationship with workforce members individually
and collectively.
Table 4: Benefits secrecy, benefits management and HR outcomes (all organisations)
Organisations which prefer to be secretive about benefits are more likely to…
Organisations which prefer to be transparent about benefits are more likely to…
Offer a lower number of different benefits. Offer a higher number of different benefits.
Predict that spend on share schemes/LTIs will decrease or stay the same in 2013.
Predict that spend on share schemes/LTIs will increase.
Offer to contribute to a personal pension plan. Offer a defined benefit pension scheme.
Have under 50% defined contribution pension scheme membership.
Have over 50% defined contribution pension scheme membership.
Have low employer and employee DC pensions’ contributions.
Have high employer and employee DC pensions’ contributions.
Offer development, pay and social benefits.
Offer voluntary/affinity benefits.
Offer total reward statements.
Have strained/very strained employee relations. Have good/very good employee relations.
Have labour productivity far/somewhat below average in the sector.
Have labour productivity far/somewhat better than the sector.
Have labour productivity that has decreased in the past three years.
Have labour productivity that has increased in the past three years.
Experience difficulties with high absenteeism rates.
Experience no difficulties with high absenteeism rates.
Experience difficulties retaining employees. Experience no difficulties retaining employees.
Experience pay discontent raised by employees. Experience no pay discontent raised by employees.
cipd.co.uk/rewardm
anagementsurvey
8
RewaRd management
intROduCtiOn
In 2012, we produced a supplementary report
to the main Reward Management survey report
using inferential statistical analysis of the survey
data to examine the extent of strategic alignment
of pay practices and resulting HR outcomes. The
strategic reward alignment proposition predicts
that aligning reward strategies and practices with
business strategies and workforce characteristics
will generate better HR outcomes. For more
information on the background conceptual
framework of strategic reward, see Reward
Management 2012: Supplement aligning strategy
and pay (CIPD 2012).
Last year our findings showed some support for
the strategic reward alignment proposition; we
found:
• markedly different reward practices used by
private sector firms operationalising different
business strategies in their chosen product/
service sectors
• relationships between the composition of the
workforce and the reward practices employed
in organisations from all sectors
• particular HR outcomes associated with
certain reward management practices.
This year we have focused specifically on benefits
practices (including pensions and share schemes)
to further investigate the proposition that reward
alignment vertically, with business strategy, and
horizontally, with workforce characteristics, leads
to positive HR and organisational outcomes.
We have examined this proposition by testing the
following questions:
• Towhatextentdoprivatesectorfirmswith
different business strategies adopt different
benefits practices?
• Towhatextentdoorganisations(fromall
sectors) with different workforce characteristics
adopt different benefits practices?
• TowhatextentaredifferentHRoutcomes
associated with different benefits practices?
In addition, this report looks at the question of
secrecy versus transparency in the provision of
employee benefits. Last year, looking at pay secrecy,
our findings indicated that there may be positive
HR outcomes related to increasing the transparency
of pay arrangements in organisations. This year,
our focus will be on benefits and whether we see
similar or different results.
The statistical analysis undertaken for this report provides a probability value, that is, the likelihood that the result was due to chance rather than a specific effect or phenomenon. For more information please see the ‘Background to the report’ section.
Rew
aR
d m
an
ag
em
en
t 2013
9
2013
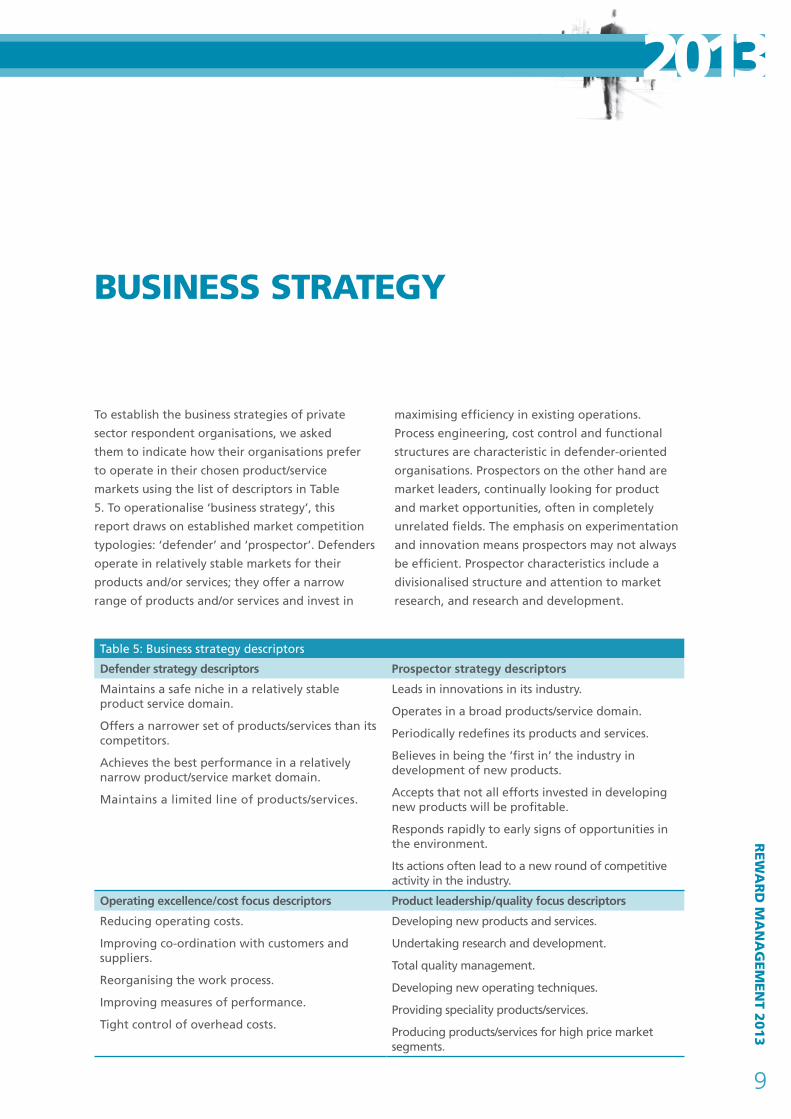
BuSineSS StRategy
To establish the business strategies of private
sector respondent organisations, we asked
them to indicate how their organisations prefer
to operate in their chosen product/service
markets using the list of descriptors in Table
5. To operationalise ‘business strategy’, this
report draws on established market competition
typologies: ‘defender’ and ‘prospector’. Defenders
operate in relatively stable markets for their
products and/or services; they offer a narrow
range of products and/or services and invest in
maximising efficiency in existing operations.
Process engineering, cost control and functional
structures are characteristic in defender-oriented
organisations. Prospectors on the other hand are
market leaders, continually looking for product
and market opportunities, often in completely
unrelated fields. The emphasis on experimentation
and innovation means prospectors may not always
be efficient. Prospector characteristics include a
divisionalised structure and attention to market
research, and research and development.
Table 5: Business strategy descriptors
Defender strategy descriptors Prospector strategy descriptors
Maintains a safe niche in a relatively stable product service domain.
Offers a narrower set of products/services than its competitors.
Achieves the best performance in a relatively narrow product/service market domain.
Maintains a limited line of products/services.
Leads in innovations in its industry.
Operates in a broad products/service domain.
Periodically redefines its products and services.
Believes in being the ‘first in’ the industry in development of new products.
Accepts that not all efforts invested in developing new products will be profitable.
Responds rapidly to early signs of opportunities in the environment.
Its actions often lead to a new round of competitive activity in the industry.
Operating excellence/cost focus descriptors Product leadership/quality focus descriptors
Reducing operating costs.
Improving co-ordination with customers and suppliers.
Reorganising the work process.
Improving measures of performance.
Tight control of overhead costs.
Developing new products and services.
Undertaking research and development.
Total quality management.
Developing new operating techniques.
Providing speciality products/services.
Producing products/services for high price market segments.
cipd.co.uk/rewardm
anagementsurvey
10
RewaRd management
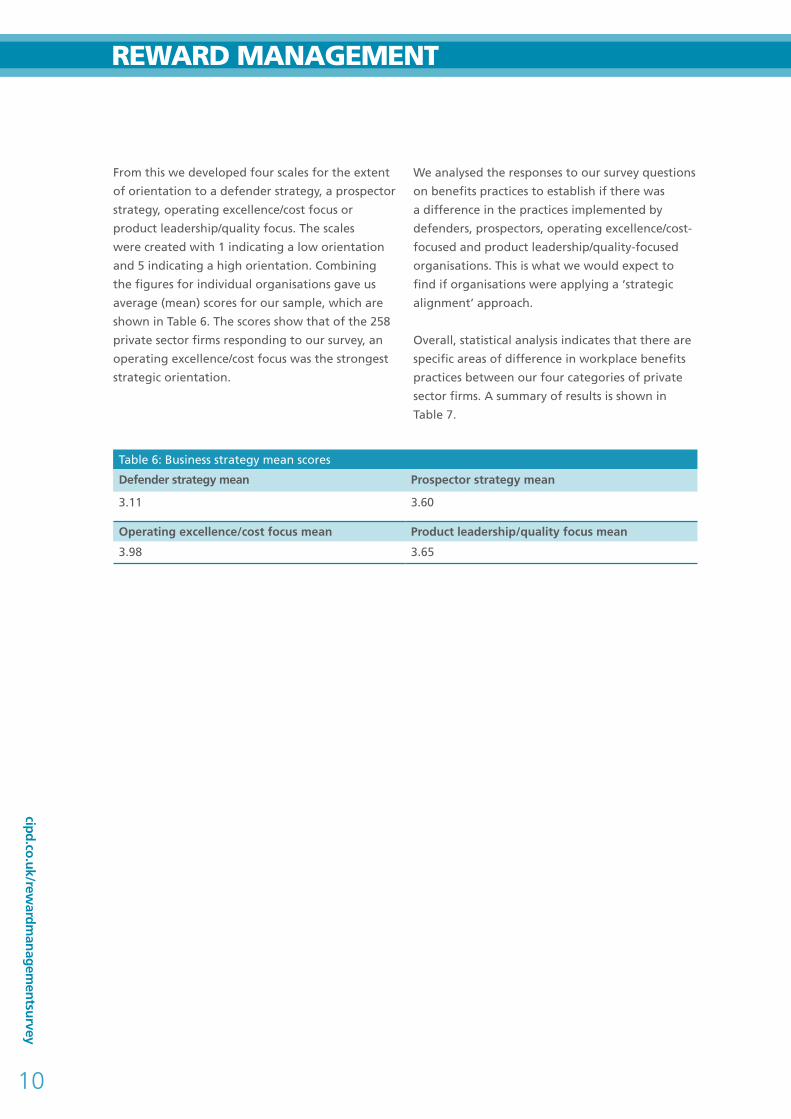
From this we developed four scales for the extent
of orientation to a defender strategy, a prospector
strategy, operating excellence/cost focus or
product leadership/quality focus. The scales
were created with 1 indicating a low orientation
and 5 indicating a high orientation. Combining
the figures for individual organisations gave us
average (mean) scores for our sample, which are
shown in Table 6. The scores show that of the 258
private sector firms responding to our survey, an
operating excellence/cost focus was the strongest
strategic orientation.
We analysed the responses to our survey questions
on benefits practices to establish if there was
a difference in the practices implemented by
defenders, prospectors, operating excellence/cost-
focused and product leadership/quality-focused
organisations. This is what we would expect to
find if organisations were applying a ‘strategic
alignment’ approach.
Overall, statistical analysis indicates that there are
specific areas of difference in workplace benefits
practices between our four categories of private
sector firms. A summary of results is shown in
Table 7.
Table 6: Business strategy mean scores
Defender strategy mean Prospector strategy mean
3.11 3.60
Operating excellence/cost focus mean Product leadership/quality focus mean
3.98 3.65
Rew
aR
d m
an
ag
em
en
t 2013
11
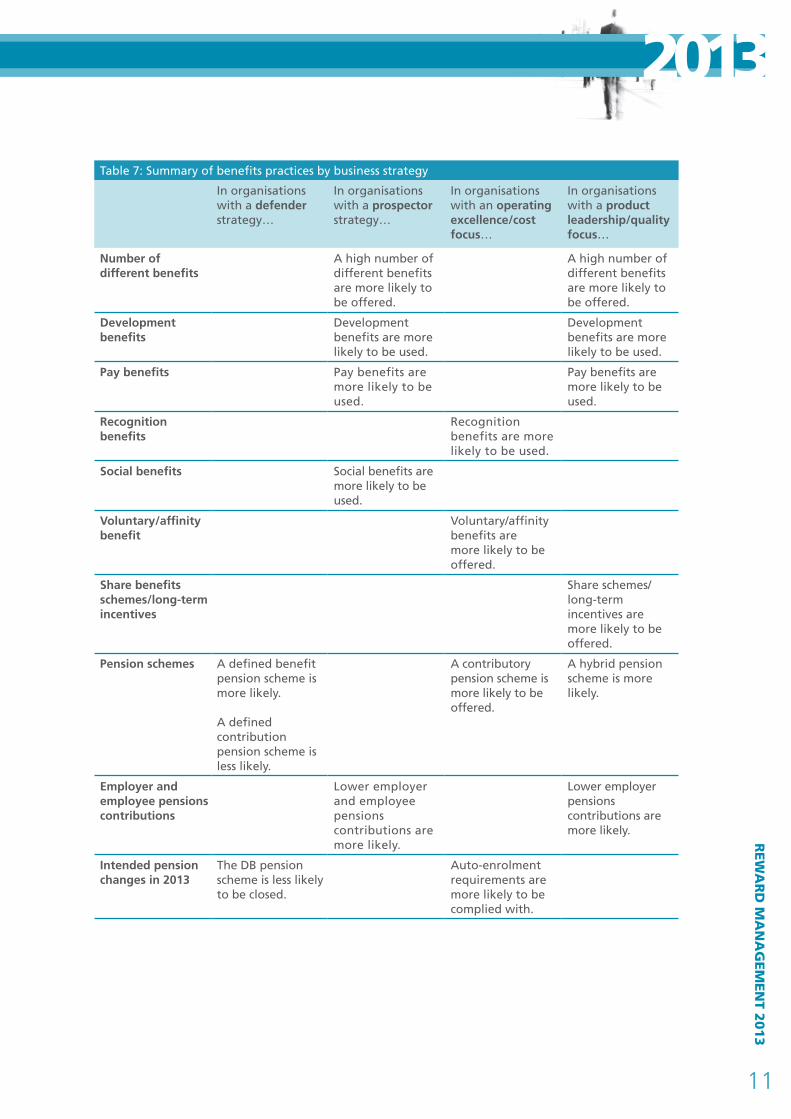
2013Table 7: Summary of benefits practices by business strategy
In organisations with a defender strategy…
In organisations with a prospector strategy…
In organisations with an operating excellence/cost focus…
In organisations with a product leadership/quality focus…
Number of different benefits
A high number of different benefits are more likely to be offered.
A high number of different benefits are more likely to be offered.
Development benefits
Development benefits are more likely to be used.
Development benefits are more likely to be used.
Pay benefits Pay benefits are more likely to be used.
Pay benefits are more likely to be used.
Recognition benefits
Recognition benefits are more likely to be used.
Social benefits Social benefits are more likely to be used.
Voluntary/affinity benefit
Voluntary/affinity benefits are more likely to be offered.
Share benefits schemes/long-term incentives
Share schemes/long-term incentives are more likely to be offered.
Pension schemes A defined benefit pension scheme is more likely.
A defined contribution pension scheme is less likely.
A contributory pension scheme is more likely to be offered.
A hybrid pension scheme is more likely.
Employer and employee pensions contributions
Lower employer and employee pensions contributions are more likely.
Lower employer pensions contributions are more likely.
Intended pension changes in 2013
The DB pension scheme is less likely to be closed.
Auto-enrolment requirements are more likely to be complied with.
cipd.co.uk/rewardm
anagementsurvey
12
RewaRd management
Benefits
Number of benefits offered The survey asked respondents to indicate which
benefits are offered to employees in their
organisations. First, we measured how many
different benefits are offered by our respondent
organisations. Out of the 75 different benefits
listed in the appendix, the average (mean) number
of benefits offered by private sector firms is 20.
Of course, this rather crude measure does not tell
us anything about quality of benefits provision
and treats each benefit equally – whether it is a
high-value item such as private medical insurance
or a low-cost arrangement such as allowing
Internet deliveries at work. However, we do see
a significant difference in approach between
organisations with different business strategies.
The higher the mean score for prospectors and
firms focused on product leadership/quality, the
greater number of benefits offered. Statistically
the correlation is low but it is significant,1
indicating that these two strategic orientations
are likely to result in a greater range of benefits
provision.
Type of benefits offeredThe list of benefits offered were categorised into
four areas: pay – benefits with a financial value;
social – benefits with a social or health promotion
dimension; development – benefits which
support employee development; and recognition
– benefits aimed at recognising employee
contribution (see the appendix for a full list of
what benefits each category includes).
Once again, we see differences between the
business strategies. A high prospector mean
score was correlated with a higher provision of
development, pay and social benefits; a high
product leadership/quality score was correlated
with a higher provision of development and
pay benefits; and a high operating excellence/
cost focus score was correlated with a higher
provision of recognition benefits. We also found
a significant difference in the mean cost focus
scores of firms offering voluntary/affinity benefits
(schemes offering a range of discounted products/
services often negotiated for by the employer but
paid for by the employee) and those not offering
such benefits,2 indicating that operating/cost-
focused firms are more likely to offer voluntary/
affinity benefits to employees.
We can infer from these results that firms pursuing
prospector and quality-led business strategies
are likely to be allocating resources to employee
development as well as higher-cost benefits
provision, presumably seeing this as an investment
in securing, retaining and motivating the type of
employees they need to in the innovative, fast-
paced/high-quality product or service markets they
operate in. This supports what we found in last
year’s supplementary report which focused on pay
– a prospector strategy tended to lead to higher
pay levels, market-oriented reward and increased
use of performance-related pay. Meanwhile, firms
focused on reducing operating costs are more
likely to offer lower-cost, recognition and/or
voluntary/affinity benefits.
Share schemes and long-term incentives
Table 7 shows that firms with product leadership/
quality strategies are more likely to offer share
schemes and/or other long-term incentives (LTIs).
The mean quality score for organisations offering
share schemes/LTIs was significantly higher
compared with organisations not offering such
schemes.3 Again, it seems an orientation towards
quality in terms of the chosen product/services
market translates into increased investment in
higher-cost and longer-term benefits.
Pensions
Pension schemesTable 7 also shows the pension arrangements
associated with different business strategies.
Interestingly, the operating excellence/cost-
focused mean score for private sector firms

Rew
aR
d m
an
ag
em
en
t 2013
13
2013offering contributory pension schemes was
significantly higher than the score for firms not
offering contributory pension schemes,4 indicating
these firms are more likely to offer contributory
pension schemes. This could be linked to
size of organisation – we would expect large
organisations to be more likely to contribute to
pension schemes (not least because of recent
changes to pensions regulation) and we also see
the cost focus mean scores increase as companies
get larger (although due to small numbers of very
large organisations in this survey it is not possible
to say this with certainty).
We also found that having a defender strategic
orientation was more likely to result in a defined
benefit pension scheme being offered5 and less
likely (p<0.05) to result in a defined contribution
scheme being offered6 (see Figure 1). This seems to
be an example of expected ‘fit’ between strategy
and practice – defenders are more likely to be
in traditional, stable product markets where we
would expect to find remnants of private sector
DB pension schemes.
In contrast, Figure 2 shows that the product
leadership/quality strategic orientation was more
likely to result in hybrid pension schemes being
offered to employees.7 While hybrid pensions remain
relatively rare (the 2013 CIPD Reward Management
survey showed only 7% of respondents with a
pension scheme offering a hybrid scheme), they
may well be growing in popularity due to the
‘halfway house’ nature of the provision – sharing risk
between employer and employee rather than asking
one party to shoulder it all. It is interesting that it
should be the quality-led strategy that is connected
with such schemes, perhaps as a result of these
organisations’ inclination to try newer ideas.
figure 1: Pension schemes by defender strategy
3.00
3.60
3.103.20
Definedbenefitscheme
Defined contribution
scheme
Management Other
0.00
1.00
0.50
2.00
1.50
4.00
3.50
3.00
2.50
Def
end
er s
core
figure 2: Hybrid pension schemes by product leadership/quality focus
3.60
3.90
Hybridpensionscheme
No hybridpensionscheme
0.00
1.00
0.50
2.00
1.50
4.00
3.50
3.00
2.50
Pro
du
ct le
ader
ship
/qu
alit
y fo
cus
sco
re
cipd.co.uk/rewardm
anagementsurvey
14
RewaRd management
Employer and employee pensions contributionsWhen it comes to the level of employer and
employee contributions to occupational pension
schemes, results show that a prospector strategy is
directly correlated to lower contributions from both
employers and employees8 (that is, the higher the
prospector mean score the lower the contribution
levels and vice versa). The correlation is quite low
and, as with all correlations, there is no causality
indicated (we cannot say for example that a
prospector strategy causes low contribution rates or
vice versa; the result may be due to a third influence
outside the scope of study) but there is a connection
here worth investigating further, especially as
this seems out of kilter with other results which
indicate prospectors are more likely to invest in
employee benefits provision. Similarly results show
a correlation between product leadership/quality
strategy and low employer contributions, which
again do not fit the pattern of results so far. This
may well be an area for future research focus.
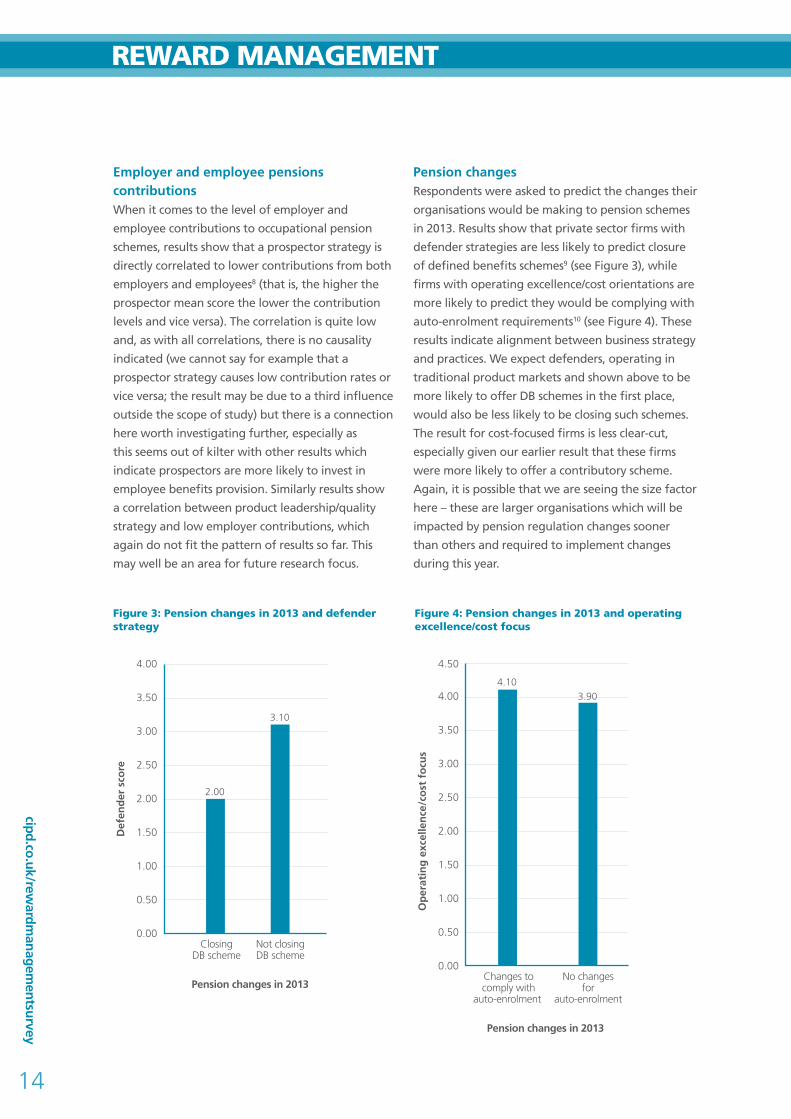
Pension changesRespondents were asked to predict the changes their
organisations would be making to pension schemes
in 2013. Results show that private sector firms with
defender strategies are less likely to predict closure
of defined benefits schemes9 (see Figure 3), while
firms with operating excellence/cost orientations are
more likely to predict they would be complying with
auto-enrolment requirements10 (see Figure 4). These
results indicate alignment between business strategy
and practices. We expect defenders, operating in
traditional product markets and shown above to be
more likely to offer DB schemes in the first place,
would also be less likely to be closing such schemes.
The result for cost-focused firms is less clear-cut,
especially given our earlier result that these firms
were more likely to offer a contributory scheme.
Again, it is possible that we are seeing the size factor
here – these are larger organisations which will be
impacted by pension regulation changes sooner
than others and required to implement changes
during this year.
figure 3: Pension changes in 2013 and defender strategy
figure 4: Pension changes in 2013 and operating excellence/cost focus
3.10
2.00
ClosingDB scheme
Not closingDB scheme
0.00
1.00
0.50
2.00
1.50
4.00
3.50
3.00
2.50
Def
end
er s
core
Pension changes in 2013
3.904.10
Changes tocomply with
auto-enrolment
Pension changes in 2013
No changesfor
auto-enrolment
0.00
1.00
0.50
2.00
1.50
4.00
4.50
3.50
3.00
2.50
Op
erat
ing
exc
elle
nce
/co
st f
ocu
s
Rew
aR
d m
an
ag
em
en
t 2013
15
2013
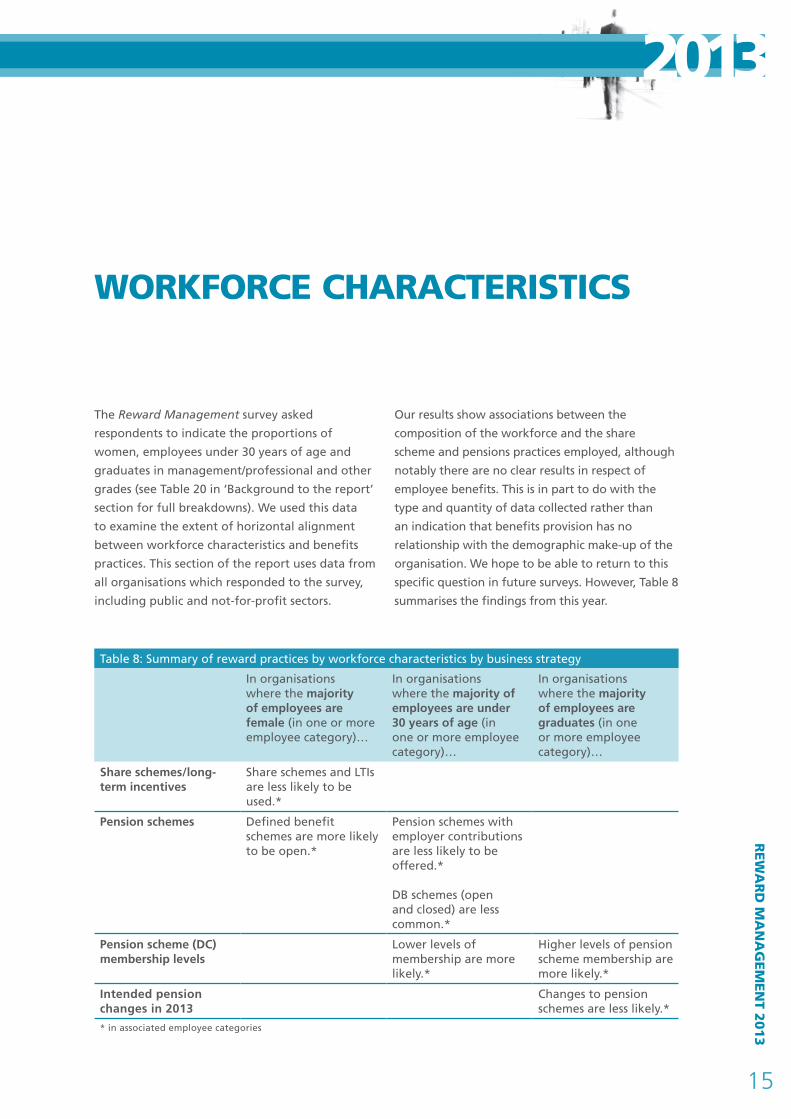
wORkfORCe CHaRaCteRiStiCS
The Reward Management survey asked
respondents to indicate the proportions of
women, employees under 30 years of age and
graduates in management/professional and other
grades (see Table 20 in ‘Background to the report’
section for full breakdowns). We used this data
to examine the extent of horizontal alignment
between workforce characteristics and benefits
practices. This section of the report uses data from
all organisations which responded to the survey,
including public and not-for-profit sectors.
Our results show associations between the
composition of the workforce and the share
scheme and pensions practices employed, although
notably there are no clear results in respect of
employee benefits. This is in part to do with the
type and quantity of data collected rather than
an indication that benefits provision has no
relationship with the demographic make-up of the
organisation. We hope to be able to return to this
specific question in future surveys. However, Table 8
summarises the findings from this year.
Table 8: Summary of reward practices by workforce characteristics by business strategy
In organisations where the majority of employees are female (in one or more employee category)…
In organisations where the majority of employees are under 30 years of age (in one or more employee category)…
In organisations where the majority of employees are graduates (in one or more employee category)…
Share schemes/long-term incentives
Share schemes and LTIs are less likely to be used.*
Pension schemes Defined benefit schemes are more likely to be open.*
Pension schemes with employer contributions are less likely to be offered.*
DB schemes (open and closed) are less common.*
Pension scheme (DC) membership levels
Lower levels of membership are more likely.*
Higher levels of pension scheme membership are more likely.*
Intended pension changes in 2013
Changes to pension schemes are less likely.*
* in associated employee categories

cipd.co.uk/rewardm
anagementsurvey
16
RewaRd management
Female employees
Share schemes and long-term incentive plans (LTIs)Table 8 and Figure 5 show a very clear association
between the proportion of women employed in
organisations and the offering of a share scheme or
other LTI plan. Where women are in the majority,
organisations are far less likely to offer employee
share plans.11 The reason for this may not be readily
apparent but is likely to be due to the occupational
segregation of women into public sector jobs where
share schemes are unavailable. Our survey results
show that 81% of public sector organisations have a
general workforce of which over half are women as
opposed to 59.7% of private sector services and 39%
of manufacturing and production companies. Yet the
public sector only accounts for 23.6% of respondents,
so there may well be other factors at work here.
Pension schemesFigure 6 shows that organisations with higher
proportions of women in non-management/
professional roles are more likely to offer
a defined benefit pension scheme12 while
organisations with fewer women in this employee
category are more likely to offer a defined
contribution scheme.13 Once again we may well
be seeing the influence of higher proportions of
women working in the public sector, where DB
pensions are still common.
While we cannot discount the link between
proportion of women employees and benefits
practices, the results in this area would seem to
indicate that sectoral influence is a stronger factor in
determining share scheme and pension arrangements
than the gender composition of the workforce.
figure 5: Share schemes and proportion of women in management/professional roles (% of respondents)
figure 6: Pension scheme types and proportion of women in non-management/professional roles (% of respondents)
None The minority About half The majority
Proportion of women in management/professional roles
0
20
10
40
30
80
100
90
70
60
50
Res
po
nd
ents
%
Share schemes
Share schemes (all respondents)
No share schemes
No share schemes (all respondents)
The minority About half The majority
Proportion of women in non-management/professional roles
0
20
10
40
30
70
60
50
Res
po
nd
ents
%
Defined benefit
Defined benefit (all respondents)
Defined contribution
Defined contribution (all respondents)
Rew
aR
d m
an
ag
em
en
t 2013
17
2013Young employees
Pension schemesResults show a clear relationship between
the proportion of young workers (under 30
years old) and whether or not employers
contribute to an occupational pension scheme
(see Figure 7). Where younger workers are
the majority of management/professionals,
a contributory pension scheme is less likely.14
This seems to be a straightforward example
of alignment of workforce characteristics with
pension arrangements; presumably employees
under 30 years of age are less likely to value a
contributory pension scheme and therefore it
is not needed to recruit and retain them so a
proportion of organisations are choosing not to
offer it. Size of organisation may well also be a
factor here. We know that SMEs are less likely
to contribute to pension schemes than their
larger counterparts (just 81.2% compared with
97.7% of large organisations and 100% of very
large organisations) and we also found that the
proportion of young managers/professionals is
greater in SMEs. However, results show that there
is also a relationship between proportions of non-
management young workers and contribution
to pension scheme where the difference in rates
of employment by organisation size is far less
pronounced, so it does seem there is an alignment
of practice and workforce composition here.
In addition, results show that defined benefit
pension schemes are less common in organisations
with higher proportions of young people in both
management and non-management employee
categories. Presumably this is due to younger
people working in more non-traditional sectors of
the labour market where DB pension schemes are
no longer (or never have been) offered.
figure 7: Contributory pension schemes and proportion of young (under 30 years of age) managers/professionals (% of respondents)
The minority About half The majority
Proportion of young people in management/professional roles
0
20
10
40
30
70
80
90
100
60
50
Res
po
nd
ents
%
Contributorypension scheme
Contributorypension scheme (all respondents)
No contributorypension scheme
No contributorypension scheme (all respondents)
cipd.co.uk/rewardm
anagementsurvey
18
RewaRd management
Pension scheme (DC) membership levelsResults also indicate that defined contribution
pension scheme membership levels are associated
with proportions of young workers.15 Figure 8
shows that membership levels are highest where
young people are in the minority of non-managers/
professionals. However, there are also a substantial
number of organisations where pension membership
is between 51% and 70% and young people make
up the majority of the workforce. It is likely therefore
that some other factors, perhaps auto-enrolment,
organisation size, size of employer pension
contribution and sector may all play a role here.
Graduate employees
Pension scheme (DC) membership levelsResults indicate that defined contribution pension
membership levels are also associated with the
workforce’s level of education. In organisations
where graduates are in the majority, pension
scheme membership is more likely to be higher
for both managers/professionals16 and non-
management/professional17 employees alike (see
Figures 9 and 10).
figure 8: dC pension scheme membership levels and proportion of young (under 30 years of age) non-management employees (% of respondents)
figure 9: Pension scheme membership levels and proportion of graduates in non-management/professional roles
1820 21
41
25
29
23
32
11
36
21
24
% o
f re
spo
nd
ents
Proportion of young people in non-management/professional roles
10−30% 31−50% 51−70% Over 70%
0
20
10
15
5
25
50
30
35
40
45
The minority About half The majority
Pension scheme membership
41
18
14
27
21
25
21 20
14
35
31
10
22
15
54
32
% o
f re
spo
nd
ents
Proportion of graduates in non-management/professional roles
Pension scheme membership
0
20
10
40
30
60
50
10−30% 31−50% 51−70% Over 70%
None The minority About half The majority

Rew
aR
d m
an
ag
em
en
t 2013
19
2013Reasons for these results could be in part due
to the influence of industry sector. Public sector
services employ a higher proportion of graduates
in management/professional roles than any
other sector (37% compared with 33% in private
sector services, 32% in the voluntary sector and
26% in manufacturing and production firms)
and also have the highest levels of DC pension
scheme membership levels (63% of public
sector organisations have membership over
70% compared with 34% of manufacturing and
production, 27% of private sector services and
25% of voluntary sector employers).
However, Figure 10 shows the same association
between higher pension membership and higher
proportion of graduates but in non-management
roles where there is no sectoral effect. Presumably,
then, graduates themselves are more likely to join
pension schemes or are working in organisations that
are more likely to offer and promote DC pensions.
figure 10: Pension scheme membership levels and proportion of graduates in management/professional roles
26 26 26
22
31
20
1513
26
33
28
13
2119
47
34
% o
f re
spo
nd
ents
Proportion of graduates in management/professional roles
0
20
10
40
30
60
50
10−30% 31−50% 51−70% Over 70%
None The minority About half The majority
Pension scheme membership
cipd.co.uk/rewardm
anagementsurvey
20
RewaRd management
Intended pension scheme changesResults shown in Figure 11 indicate that changes to
pension schemes in 2013 are less likely where there
are graduates in the majority of non-management
and professional roles.18 Considering that our survey
also found the majority of planned changes related
to complying with pension regulation changes
(90% of organisations planning to make changes to
pension arrangements cited this as the reason for
the change), we can infer that proportionally fewer
graduates are employed in organisations that are not
yet compliant. Size of organisation and sector factors
may well play a role here – smaller organisations and
private sector employers are less likely to have auto-
enrolment, for example. However, it may also be the
case that organisations recruiting and retaining more
graduates have been consciously pursuing good
practice pension arrangements.
The minority About half The majority
Proportion of graduates in non-management/professional roles
0
20
10
40
30
70
60
50
Res
po
nd
ents
%
Making pensionchanges
Making pensionchanges (all respondents)
Not makingpension changes
Not makingpension changes (all respondents)
figure 11: intended pension scheme changes and proportion of graduates in non-management/professional roles
Rew
aR
d m
an
ag
em
en
t 2013
21
2013
For the second year, the CIPD Reward Management
survey asked respondents to comment on general
HR conditions within their organisations as well
as specific reward-related subjects. This allowed
us to determine if particular benefits practices are
associated with positive or negative HR outcomes
in the workplace and results have shown this to be
the case to some extent.
Table 9 summarises these findings. In general
it appears that associations between benefits
practices and HR outcomes are less pronounced
than associations between pay practices and HR
outcomes reported in last year’s supplementary
report.
Table 9: Summary of benefits practices by HR outcome by business strategy
In organisations that have a positive employee relations climate…
In organisations that have seen labour productivity increase considerably in the past three years…
In organisations that have experienced high employee absenteeism in the past 12 months…
In organisations that have experienced great difficulties attracting employees in the past 12 months…
In organisations that have experienced great difficulties retaining employees in the past 12 months…
In organisations that have experienced discontent relating to pay in the past 12 months…
Share schemes/long-term incentives
Share schemes and other LTIs are less likely to be used.
Benefits Development benefits are more likely to be offered.
Most common benefits
25+ days’ leave, eye care vouchers, Internet purchases delivered to work, training and career development, on-site parking (free/subsidised), flexible/homeworking are more likely to be offered.
Tea/coffee/cold drinks free, Christmas party/lunch, paid study leave, flexible/homeworking, training and career development and death in service/life assurance are less likely to be offered.
Flexible/homeworking, enhanced maternity/paternity leave, paid leave for military reserve activities, pension scheme, training and career development, cycle to work scheme loan are less likely to be offered.
Flexible/homeworking, training and career development, paid study leave, pension scheme, Christmas party/lunch and death in service/life assurance are less likely to be offered.
Tea/coffee/cold drinks free, Christmas party/lunch, Internet purchases delivered to work, on-site parking (free/subsidised), 25+ days’ paid leave, paid study leave are less likely to be offered.
Flexible benefits
Flexible benefits are less likely to be used.
Pension schemes
Defined benefit pension schemes are more likely to be open.
Contributory pension schemes are less likely to be offered.
Defined benefit pension schemes are more likely to be open.
HR OutCOmeS

cipd.co.uk/rewardm
anagementsurvey
22
RewaRd management
Employee relations climate
Figure 12 shows extensive development-
oriented benefits are more likely to be offered in
organisations with good or very good employee
relations climates and less likely to be offered
by organisations with neither good nor bad,
somewhat strained or very strained employee
relations climates.19 This finding suggests a clear
relationship between the provision of employee
development and employee relations, which has
implications for organisations assessing the impact
of their total reward offering.
Labour productivity
Our results showed that organisations that had
seen labour productivity increase considerably in
the past three years are more likely to offer 25+
days’ leave (offered by 81.7% of respondents
with labour productivity that had increased
considerably in the past three years compared
with the 73.0% of all respondents which offer 25+
days’ leave); eye care vouchers (63.4% compared
with 60.9%); allow Internet purchases delivered
to work (63.4% compared with 58.6%); training
and career development (87.8% compared with
83.1%); free/subsidised on-site parking (62.2%
compared with 58.1%); and flexible/homeworking
(46.3% compared with 43.2%). We need to be
cautious about overstating these links and treating
each of them in isolation; however, we can say
that these benefits are offered in organisations
that have increased in productivity and there may
be an association.
Recruitment, retention andabsenteeism
BenefitsTables 10, 11 and 12 show benefits which are less
likely to be offered by organisations which have
experienced absenteeism (Table 10), recruitment
(Table 11) and retention (Table 12) difficulties in
the past 12 months. There are some intriguing
findings here: flexible/homeworking and training/
career development feature on all three lists;
pension schemes and Christmas parties – while
opposite ends of the scale in terms of employer
investment – are equally well represented.
Speculating about the reasons for these results,
it is perhaps helpful to think of the absence of
these benefits as characteristic of organisations
experiencing these employee problems rather
than as cause and effect equations. It would
be erroneous, for example, to deduce that
the lack of free tea or coffee at work leads to
absenteeism difficulties. However, we could expect
Good Very good Neither goodnor bad
Somewhatstrained
Verystrained
Employee relations climate
0
4
2
8
6
16
14
12
10
Res
po
nd
ents
%
Over 50% ofdevelopmentbenefits offered
Over 50% ofdevelopmentbenefits offered (all respondents)
figure 12: development benefits and employee relations climate

Rew
aR
d m
an
ag
em
en
t 2013
23
2013
Table 10: Benefits less likely to be offered by organisations with employee absenteeism difficulties
Benefit % of all respondents offering benefit
% of respondents that have experienced absenteeism difficulties to a great extent in the past year offering benefit
% difference
Tea/coffee/cold drinks free 64.6 32.4 32.2
Christmas party/lunch 66.0 45.9 20.1
Paid study leave 45.9 29.7 16.2
Flexible/homeworking 43.2 29.7 13.5
Training and career development 82.9 70.3 12.6
Death in service/life assurance 66.7 54.1 12.6
Table 11: Benefits less likely to be offered by organisations with employee recruitment difficulties
Benefit % of all respondents offering benefit
% of respondents that have experienced recruitment difficulties to a great extent in the past year offering benefit
% difference
Flexible/homeworking 43.3 20.5 22.8
Enhanced maternity/paternity leave 55.8 43.2 12.6
Paid leave for military reserve activities 48.5 36.4 12.1
Pension schemes 82.5 70.5 12.0
Training and career development 82.7 72.7 10.0
Cycle to work scheme loans 45.6 36.4 9.2
Table 12: Benefits less likely to be offered by organisations with employee retention difficulties
Benefit % of all respondents offering benefit
% of respondents that have experienced employee retention difficulties to a great extent in the past year offering benefit
% difference
Flexible/homeworking 43.5 16.7 26.8
Training and career development 82.6 66.7 15.9
Paid study leave 45.8 31.0 14.8
Pension schemes 82.6 69.0 13.6
Christmas party/lunch 65.9 52.4 13.5
Death in service/life assurance 66.6 54.8 11.8
that organisations experiencing recruitment
and retention difficulties would be less likely to
agree to flexible working requests if they were
already under-staffed. Overall, we get a picture
of organisations perhaps unable to offer certain
benefits because of employee problems, which in
turn makes them less attractive places to work,
which exacerbates the problems and so on.

cipd.co.uk/rewardm
anagementsurvey
24
RewaRd management
Pension schemesWhen it comes to pension arrangements, we found
organisations which have experienced employee
retention difficulties in the past year are less likely to
offer a contributory pension scheme to employees20
(see Figure 13) and organisations which have
experienced absenteeism problems are more likely to
operate an open defined benefit pension scheme21
(see Figure 14). It is probable there are other factors
such as sector or size of organisation influencing
these findings; we know, for example, that higher
absenteeism rates and open DB pension schemes are
both more common in the public sector.
To a great extent To some extent Not at all
Employee retention difficulties
74
78
76
82
80
88
90
92
94
86
84
Res
po
nd
ents
% Contributorypension scheme
Contributorypension scheme (all respondents)
figure 13: Contributory pension scheme and employee retention difficulties
figure 14: Open defined benefit pension scheme and employee absenteeism
To a great extent To some extent Not at all
Employee absenteeism
0
10
5
20
15
35
40
45
50
30
25
Res
po
nd
ents
% Defined benefitpension scheme
Defined benefitpension scheme (all respondents)
Rew
aR
d m
an
ag
em
en
t 2013
25
2013Pay discontent
Looking at organisations which have experienced
employee discontent with pay levels or pay systems
this year, we see a range of associations with
benefits and pensions provision. The findings are
presented below with regard to the concurrent
finding that public services are much more likely
to have experienced pay discontent in the past 12
months22 (23.1% of public services organisations
experienced pay discontent to a great extent
compared with 12.7% of all organisations).
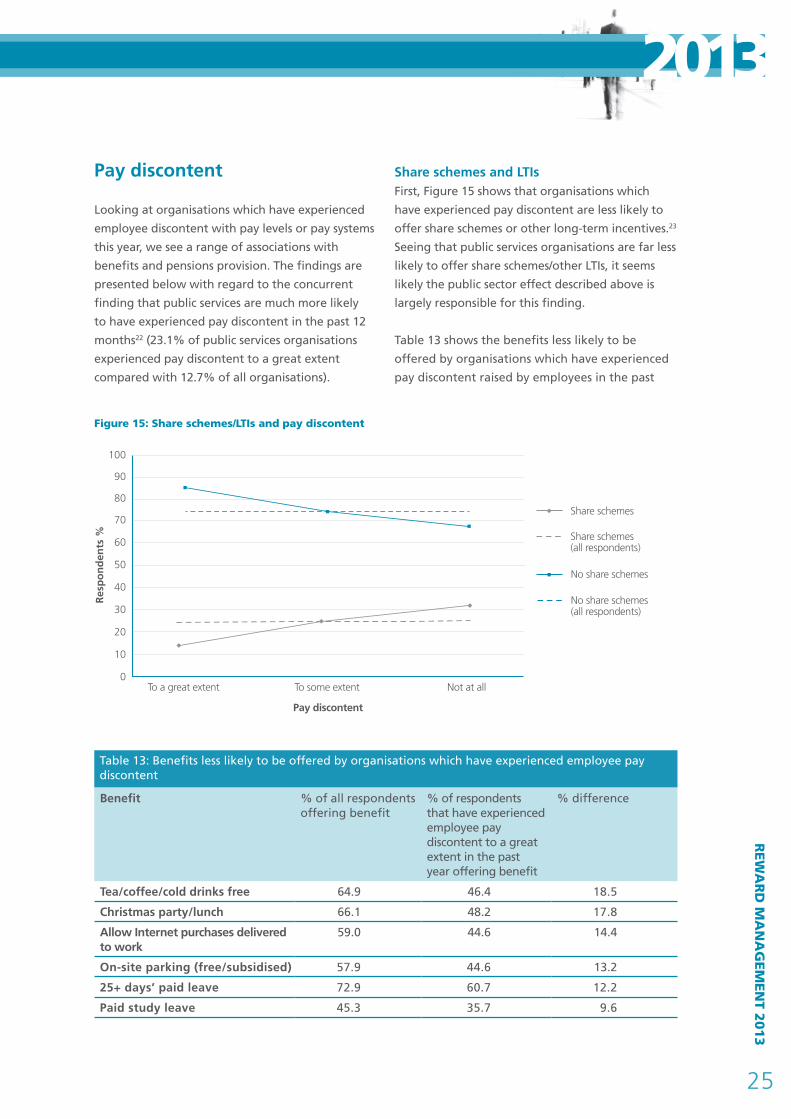
Share schemes and LTIsFirst, Figure 15 shows that organisations which
have experienced pay discontent are less likely to
offer share schemes or other long-term incentives.23
Seeing that public services organisations are far less
likely to offer share schemes/other LTIs, it seems
likely the public sector effect described above is
largely responsible for this finding.
Table 13 shows the benefits less likely to be
offered by organisations which have experienced
pay discontent raised by employees in the past
figure 15: Share schemes/Ltis and pay discontent
To a great extent To some extent Not at all
Pay discontent
0
20
10
40
30
70
80
90
100
60
50
Res
po
nd
ents
%
Share schemes
Share schemes (all respondents)
No share schemes
No share schemes (all respondents)
Table 13: Benefits less likely to be offered by organisations which have experienced employee pay discontent
Benefit % of all respondents offering benefit
% of respondents that have experienced employee pay discontent to a great extent in the past year offering benefit
% difference
Tea/coffee/cold drinks free 64.9 46.4 18.5
Christmas party/lunch 66.1 48.2 17.8
Allow Internet purchases delivered to work
59.0 44.6 14.4
On-site parking (free/subsidised) 57.9 44.6 13.2
25+ days’ paid leave 72.9 60.7 12.2
Paid study leave 45.3 35.7 9.6
cipd.co.uk/rewardm
anagementsurvey
26
RewaRd management
year.24 This set of data, viewed in its entirety,
gives us a picture of benefits provision where pay
levels and/or systems have been raised as an issue
by employees. Surprisingly few of these benefits
are high-cost items, which we might anticipate
if pay is also restricted. The public sector factor
is likely to be an influence here, however, as we
find these more informal benefits – free tea/
coffee, employer-funded Christmas parties and
Internet purchases delivered to work – are also less
common in large public services organisations.
Results also show that organisations experiencing pay
discontent to a great extent are less likely to operate
flexible benefits25 (85.5% of organisations with a
great extent of pay discontent do not offer flexible
benefits compared with 75.2% of all organisations).
But once again, public sector organisations are also
less likely to offer flexible benefits.
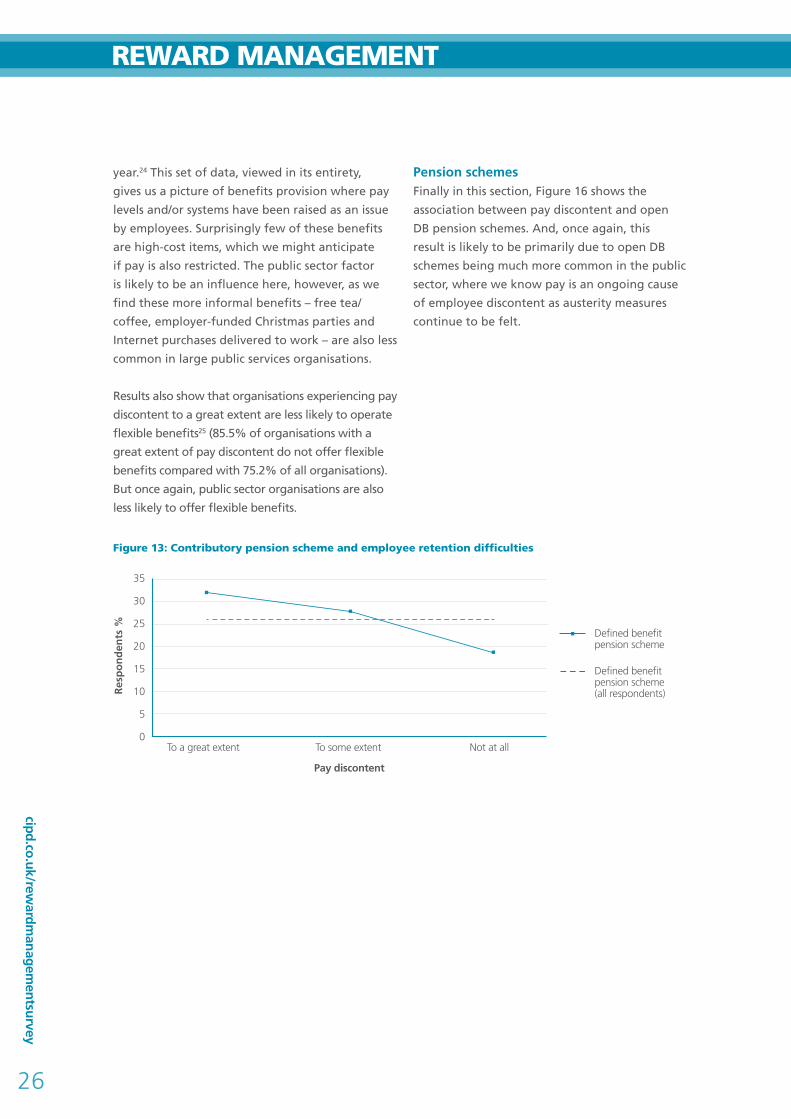
Pension schemesFinally in this section, Figure 16 shows the
association between pay discontent and open
DB pension schemes. And, once again, this
result is likely to be primarily due to open DB
schemes being much more common in the public
sector, where we know pay is an ongoing cause
of employee discontent as austerity measures
continue to be felt.
figure 13: Contributory pension scheme and employee retention difficulties
To a great extent To some extent Not at all
Pay discontent
0
10
5
20
15
35
30
25
Res
po
nd
ents
%
Defined benefitpension scheme
Defined benefitpension scheme (all respondents)

Rew
aR
d m
an
ag
em
en
t 2013
27
2013
Following on from last year’s investigation into pay
secrecy versus transparency in organisations, for
2013 we asked respondents about the approach to
transparency of benefits specifically and the extent
to which organisations are prepared to disclose
to employees information about pensions and
employee benefits and how individuals or groups
of employees are treated the same or differently.
Table 14 shows the findings. The results as a whole
give a very clear picture of organisations which
prefer a more transparent approach to benefits
having a well-developed benefits offering, active
pension arrangements and indications of a total
reward approach, while the reverse is the case for
organisations which prefer to be secretive about
employee benefits. While we need to be cautious
Table 14: Benefits secrecy and benefits management practices
Organisations which prefer to be secretive about benefits are…
Organisations that prefer to be transparent about benefits are…
Number of different benefits More likely to offer a lower number of different benefits.
More likely to offer a higher number of different benefits.
Development benefits Less likely to offer development benefits.
More likely to offer development benefits.
Pay benefits Less likely to offer pay benefits. More likely to offer pay benefits.
Social benefits Less likely to offer social benefits.
More likely to offer social benefits.
Voluntary/affinity benefits Less likely to offer voluntary/affinity benefits.
More likely to offer voluntary/affinity benefits.
Total reward statements Less likely to offer total reward statements.
More likely to offer total reward statements.
Change in spend on share schemes/LTIs
More likely to predict that spend on share schemes/LTIs will decrease or stay the same.
More likely to predict that spend on share schemes/LTIs will increase.
Pension schemes More likely to offer to contribute to a personal pension plan.
More likely to offer a defined benefit pension scheme.
Auto-enrolment to a DC pension scheme
Less likely to auto-enrol employees into a pension scheme.
More likely to auto-enrol employees into a pension scheme.
Pension scheme (DC) membership levels
More likely to have under 50% pension scheme membership.
More likely to have over 50% pension scheme membership.
Employer and employee pensions contributions
More likely to have low employer and employee contributions.
More likely to have high employer and employee contributions.
BenefitS tRanSPaRenCy
cipd.co.uk/rewardm
anagementsurvey
28
RewaRd management
about causality – we cannot claim, for example,
that a secretive approach to benefits causes a
poorer benefits offering or vice versa – there
does seem to be a coherent picture of results that
suggests a strong link between how advanced
an organisation’s benefits provisions are and its
approach to secrecy/transparency.
Benefits and total reward
Table 14 details the benefits provision of
organisations which either prefer to remain
secretive about benefits or are actively transparent
about benefits. Organisations preferring
transparency are more likely to offer a high number
of different workplace benefits and more likely to
offer development-oriented benefits, pay benefits
and social benefits.26 While the correlations are
fairly low,27 the results are clear that the greater the
benefits secrecy, the poorer the benefits offering and,
accordingly, the greater the benefits transparency, the
more extensive the benefits offering.
The results cannot tell us why this is, however
we can presume that organisations which have
well-developed, generous and universal benefits
provisions will naturally want to communicate it to
all employees as a key part of the reward offering
and as a recruitment and retention tool. On the other
hand, organisations which offer limited benefits or
offer benefits for only small, probably senior, sections
of the workforce would be more inclined to keep
these matters confidential. Once again we cannot
discount the sectoral effect here. The main survey
report shows that a more transparent approach to
benefits is found in the public and voluntary sectors,
whereas rather more private sector firms than public
services/voluntary organisations tend towards the
more secretive approaches.
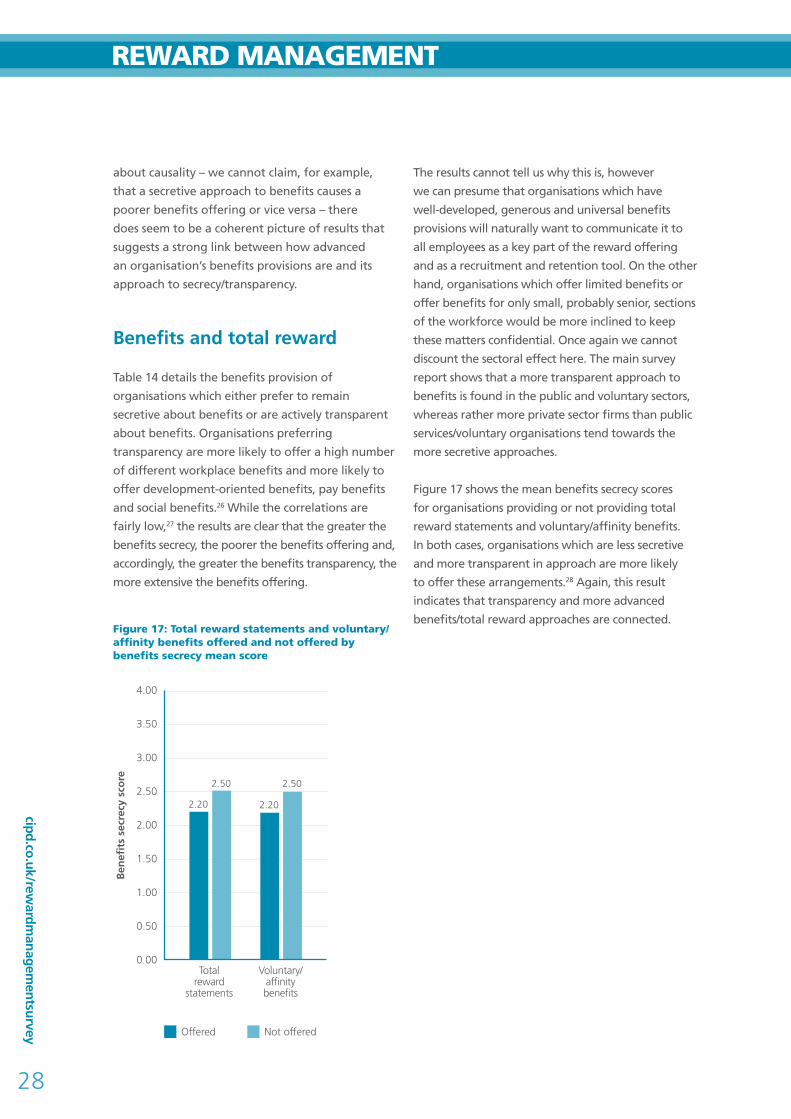
Figure 17 shows the mean benefits secrecy scores
for organisations providing or not providing total
reward statements and voluntary/affinity benefits.
In both cases, organisations which are less secretive
and more transparent in approach are more likely
to offer these arrangements.28 Again, this result
indicates that transparency and more advanced
benefits/total reward approaches are connected.figure 17: total reward statements and voluntary/affinity benefits offered and not offered by benefits secrecy mean score
2.50
2.20 2.20
2.50
Totalreward
statements
Voluntary/affinitybenefits
Offered Not offered
0.00
1.00
0.50
2.00
1.50
4.00
3.50
3.00
2.50
Ben
efit
s se
crec
y sc
ore
Rew
aR
d m
an
ag
em
en
t 2013
29
2013
figure 18: Changes to spend on share schemes/long-term incentive plans by benefits secrecy mean score
1.90
2.60
Increasespend
Decreasespend
Changes to spend on share schemes/long-term incentive plans
0.00
1.00
0.50
2.00
1.50
4.00
3.50
3.00
2.50
Ben
efit
s se
crec
y sc
ore
Share schemes/LTIs
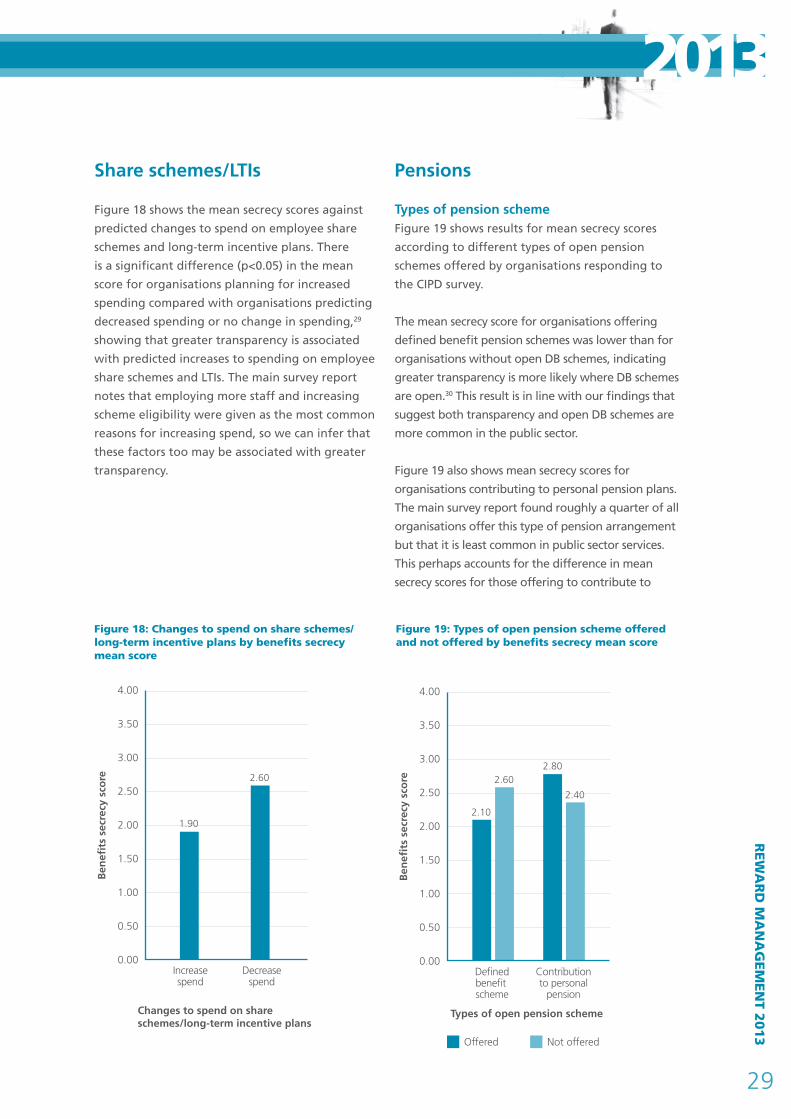
Figure 18 shows the mean secrecy scores against
predicted changes to spend on employee share
schemes and long-term incentive plans. There
is a significant difference (p<0.05) in the mean
score for organisations planning for increased
spending compared with organisations predicting
decreased spending or no change in spending,29
showing that greater transparency is associated
with predicted increases to spending on employee
share schemes and LTIs. The main survey report
notes that employing more staff and increasing
scheme eligibility were given as the most common
reasons for increasing spend, so we can infer that
these factors too may be associated with greater
transparency.
Pensions
Types of pension schemeFigure 19 shows results for mean secrecy scores
according to different types of open pension
schemes offered by organisations responding to
the CIPD survey.
The mean secrecy score for organisations offering
defined benefit pension schemes was lower than for
organisations without open DB schemes, indicating
greater transparency is more likely where DB schemes
are open.30 This result is in line with our findings that
suggest both transparency and open DB schemes are
more common in the public sector.
Figure 19 also shows mean secrecy scores for
organisations contributing to personal pension plans.
The main survey report found roughly a quarter of all
organisations offer this type of pension arrangement
but that it is least common in public sector services.
This perhaps accounts for the difference in mean
secrecy scores for those offering to contribute to
figure 19: types of open pension scheme offered and not offered by benefits secrecy mean score
2.60
2.10
2.80
2.40
Definedbenefit scheme
Contributionto personal
pension
Offered Not offered
0.00
1.00
0.50
2.00
1.50
4.00
3.50
3.00
2.50
Ben
efit
s se
crec
y sc
ore
Types of open pension scheme

cipd.co.uk/rewardm
anagementsurvey
30
RewaRd management
personal pensions compared with those not offering
such a provision, indicating secrecy is a more common
approach among organisations contributing to
personal pension plans.31
Figure 20 shows a significant difference
between mean benefits secrecy scores for
organisations auto-enrolling employees into
defined contribution schemes and those without
auto-enrolment.32 This indicates an association
between pension scheme auto-enrolment and
greater transparency. Similarly, Figure 21 shows
membership levels of defined contribution
schemes are higher in organisations which favour
a more transparent approach. It is unlikely that
greater transparency in the public sector is an
influence here as only 7.2% of open DC schemes
are in public sector organisations. These results
are a clear indication that there is a relationship
between greater transparency and more advanced
pension scheme arrangements.
Employer and employee pensions contributions to DC schemesOur results also show that there is a low, but
significant, negative correlation between benefits
secrecy scores and rates of employer33 and
employee34 contributions to defined contribution
pension schemes; the greater the benefits secrecy,
the lower the employer and employee contribution
rates. Once again, findings suggest that more
generous pensions provisions are associated with
greater transparency.
Benefits transparency and HR outcomes
In addition to finding that approaches to benefits
transparency are associated with benefits practices,
we also looked at the associations between
transparency/secrecy and HR outcomes. The findings
are summarised in Table 15. They show a consistent
figure 21: membership levels in main defined contribution pension schemes by benefits secrecy mean score
2.30
2.60
Over 50% 50% orlower
Membership levels in mainDC scheme
0.00
1.00
0.50
2.00
1.50
4.00
3.50
3.00
2.50
Ben
efit
s se
crec
y sc
ore
figure 20: auto-enrolment in defined contribution pension schemes by benefits secrecy mean score
2.20
2.50
Auto-enrolment Noauto-enrolment
Auto-enrolment in DC scheme
0.00
1.00
0.50
2.00
1.50
4.00
3.50
3.00
2.50
Ben
efit
s se
crec
y sc
ore
Rew
aR
d m
an
ag
em
en
t 2013
31
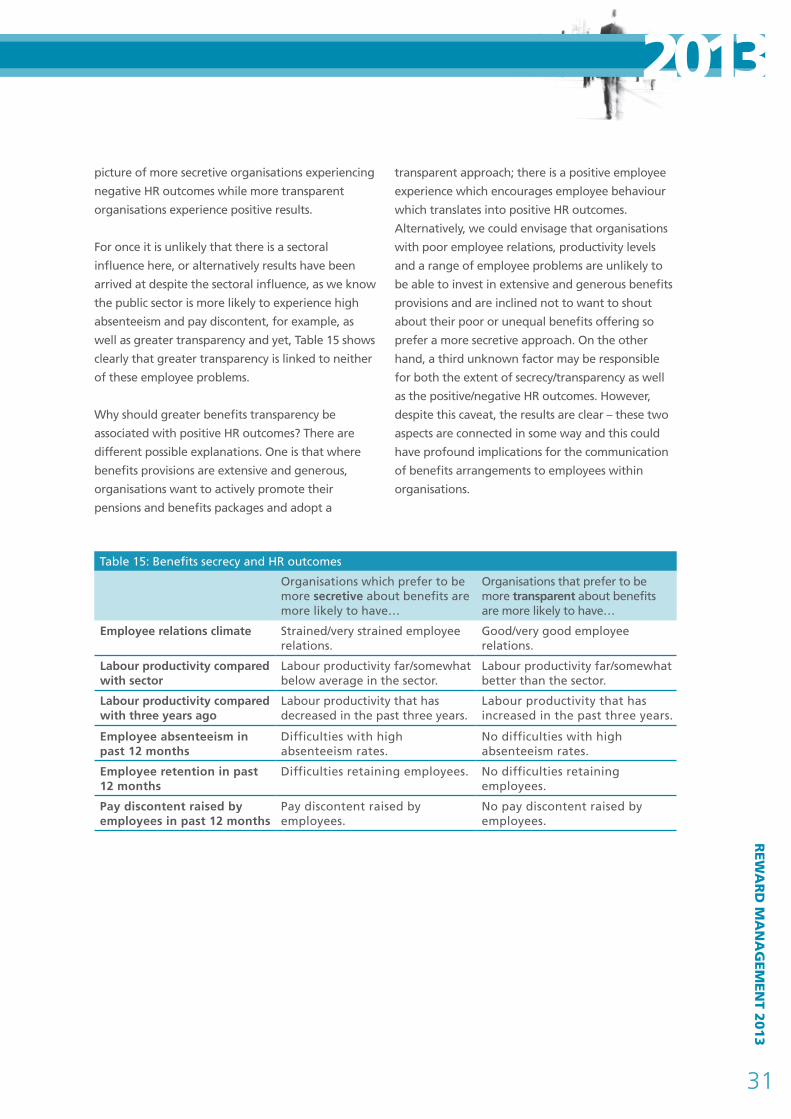
2013picture of more secretive organisations experiencing
negative HR outcomes while more transparent
organisations experience positive results.
For once it is unlikely that there is a sectoral
influence here, or alternatively results have been
arrived at despite the sectoral influence, as we know
the public sector is more likely to experience high
absenteeism and pay discontent, for example, as
well as greater transparency and yet, Table 15 shows
clearly that greater transparency is linked to neither
of these employee problems.
Why should greater benefits transparency be
associated with positive HR outcomes? There are
different possible explanations. One is that where
benefits provisions are extensive and generous,
organisations want to actively promote their
pensions and benefits packages and adopt a
transparent approach; there is a positive employee
experience which encourages employee behaviour
which translates into positive HR outcomes.
Alternatively, we could envisage that organisations
with poor employee relations, productivity levels
and a range of employee problems are unlikely to
be able to invest in extensive and generous benefits
provisions and are inclined not to want to shout
about their poor or unequal benefits offering so
prefer a more secretive approach. On the other
hand, a third unknown factor may be responsible
for both the extent of secrecy/transparency as well
as the positive/negative HR outcomes. However,
despite this caveat, the results are clear – these two
aspects are connected in some way and this could
have profound implications for the communication
of benefits arrangements to employees within
organisations.
Table 15: Benefits secrecy and HR outcomes
Organisations which prefer to be more secretive about benefits are more likely to have…
Organisations that prefer to be more transparent about benefits are more likely to have…
Employee relations climate Strained/very strained employee relations.
Good/very good employee relations.
Labour productivity compared with sector
Labour productivity far/somewhat below average in the sector.
Labour productivity far/somewhat better than the sector.
Labour productivity compared with three years ago
Labour productivity that has decreased in the past three years.
Labour productivity that has increased in the past three years.
Employee absenteeism in past 12 months
Difficulties with high absenteeism rates.
No difficulties with high absenteeism rates.
Employee retention in past 12 months
Difficulties retaining employees. No difficulties retaining employees.
Pay discontent raised by employees in past 12 months
Pay discontent raised by employees.
No pay discontent raised by employees.

cipd.co.uk/rewardm
anagementsurvey
32
RewaRd management
COnCLuSiOnS and imPLiCatiOnS
Employers in the UK invest significantly in
providing their workforce members with non-
cash employee benefits. According to the
benchmarking study published in May 2013,
to which this report is a supplement, many
employers aspire to increase the proportion of
their employee investment related to benefits
compared with the pay element of overall
remuneration.
What this study does is to address questions as to
the strategic nature of investment in employee
benefits: whether statistically significant variation
can be discerned between benefits expenditure
associated with the direction of business strategy
an organisation adopts; whether or not workforce
characteristics play a part in benefits provision
and administration; what the implications
appear to be in terms of HR outcomes; and the
degree to which organisations appear to favour
openness in managing the provision of benefits
to their employees or prefer to keep the matter
confidential.
The study findings offer support for what
we might intuitively expect in terms of the
correlation between organisational settings,
people, preferences and innovation in reward
management – here accenting benefits. When in
the 2012 analysis we focused on pay, the findings
were that the more an organisation leaned
towards a developmental rather than defensive
orientation, the greater confidence could be
discerned managerially in managing pay outcomes
on a contingent or ‘at risk’ basis.
In relation to benefits, in this 2013 data set a
similar conclusion can be drawn: organisations
prospecting for market share, for example, put
less emphasis on pension scheme contributions –
whether for the employer or employee. Pay ranks
most highly among the multiplicity of employment
benefits offered. The inference may be that with
higher immediate cash rewards, also shown in
the correlation between organisation strategy
and pay mix, the culture of such enterprises is to
leave employees to invest – or not – for deferred
reward. A similar patterning is apparent when
correlating product or service quality focus and
benefits management practice. Contrasting with
this, organisations defending market share tend
towards the more traditional defined benefit
pension schemes, although the data show these
arrangements are likely to be currently under
review. Complementing this finding, when
exploring statistical linkages between benefits
management approaches in firms anxious to
maximise operational efficiency (keeping costs
under control), recognition – rather than forward
incentive – benefits and employee contributory
pensions are evident.
Mixed conclusions can be drawn from examining
benefits and workforce characteristics, although
there does seem to be some correlation between
the degree of innovation and gender. And, in
Rew
aR
d m
an
ag
em
en
t 2013
33
2013the case of pension schemes, age and level of
academic qualification call for attention.
When employee relations outcomes are
considered, again the degree of innovation in
managing the reward mix appears to be a factor:
in particular, the presence or absence of longer-
term incentives intended to create a culture
of inclusivity, and the availability of flexibility
offering employees some choice around how their
total reward mix is comprised.
Particularly interesting contrasting inferential
findings from the statistical analysis apply when
considering the controversial issue of whether or
not organisations have a stated preference for
secrecy or transparency in and around employee
benefits management. Table 14 illustrates
vividly the apparently binary divide in terms of
innovation or its absence, and outcomes such
as employee enrolment in corporate pension
plans, correlated with the transparency–secrecy
continuum.
Implications for employers to consider include:
• reflecting on whether there is scope for greater
innovation in managing investment in total
reward, paying attention to the benefits
aspects, and whether or not there is a driver
effect related to key HR outcomes, mindful of
employee engagement aspirations as well as
overall workforce productivity
• reviewing corporately questions around whether
or not business strategy and employee benefits
remain in sync, or whether there is a lag between
reorientation to meet competitive needs and
aligning this with a key aspect of HRM
• considering carefully the balance between total
reward mix and any intended segmentation
to align with diverse preferences among
employee groups, while being wary of putting
the organisation at risk of claims that certain
categories of employee are unfairly treated –
for example on grounds of gender
• thinking carefully about the extent to
which a culture of openness or secrecy in
the management of benefits within the
total reward mix is delivering intended or
unintended consequences for the employer
in managing the relationship with workforce
members individually and collectively.
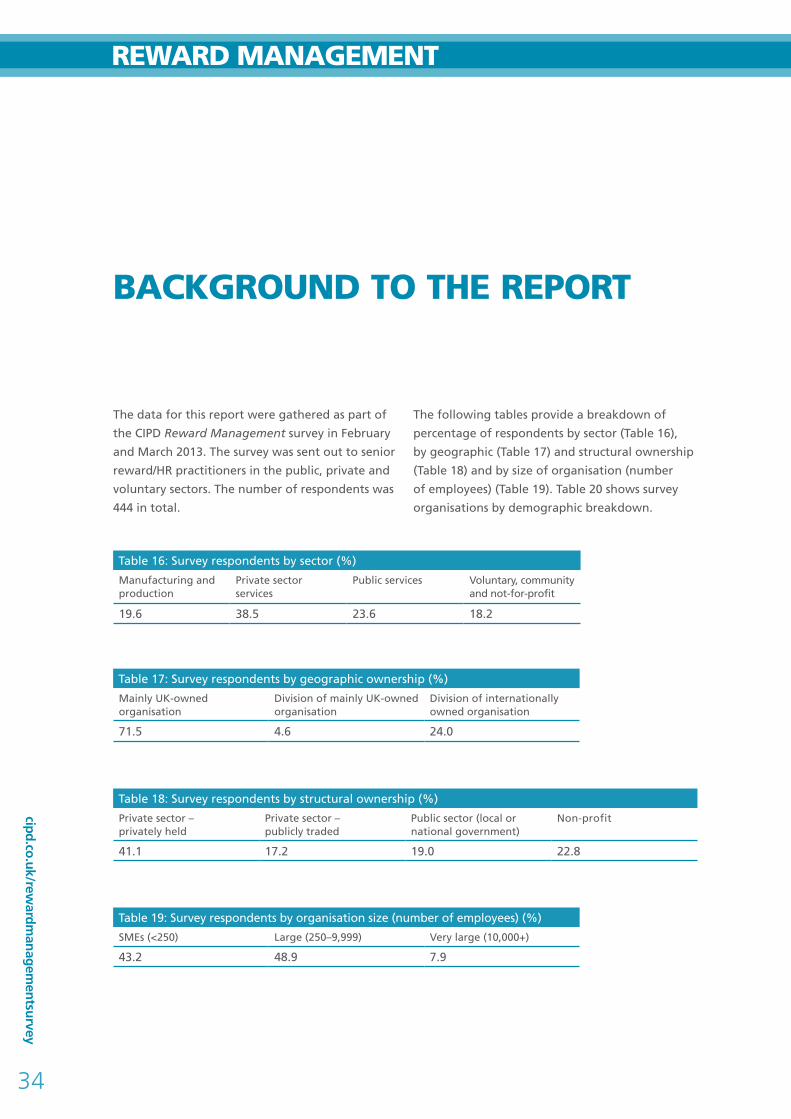
cipd.co.uk/rewardm
anagementsurvey
34
RewaRd management
BaCkgROund tO tHe RePORt
The data for this report were gathered as part of
the CIPD Reward Management survey in February
and March 2013. The survey was sent out to senior
reward/HR practitioners in the public, private and
voluntary sectors. The number of respondents was
444 in total.
The following tables provide a breakdown of
percentage of respondents by sector (Table 16),
by geographic (Table 17) and structural ownership
(Table 18) and by size of organisation (number
of employees) (Table 19). Table 20 shows survey
organisations by demographic breakdown.
Table 16: Survey respondents by sector (%)
Manufacturing and production
Private sector services
Public services Voluntary, community and not-for-profit
19.6 38.5 23.6 18.2
Table 17: Survey respondents by geographic ownership (%)
Mainly UK-owned organisation
Division of mainly UK-owned organisation
Division of internationally owned organisation
71.5 4.6 24.0
Table 18: Survey respondents by structural ownership (%)
Private sector – privately held
Private sector –publicly traded
Public sector (local or national government)
Non-profit
41.1 17.2 19.0 22.8
Table 19: Survey respondents by organisation size (number of employees) (%)
SMEs (<250) Large (250–9,999) Very large (10,000+)
43.2 48.9 7.9

Rew
aR
d m
an
ag
em
en
t 2013
35
2013
Table 20: Survey respondents by demographic composition (%)
None MinorityAbout half Majority
Female employees (management and professional) 0.9 43.2 36.0 17.3
Female employees (other) 0.9 23.4 31.8 34.0
Under age 30 (management and professional) 11.7 65.3 14.2 3.2
Under age 30 (other) 3.4 48.4 26.8 10.4
Graduate employees (management and professional) 7.7 31.5 21.2 32.7
Graduate employees (other) 7.2 52.0 14.4 12.4
Note on statistical analysis The analysis undertaken for this report involved
various statistical tests from which were derived
probability values, that is, the likelihood that a
result is merely due to chance. In these tests the
lower the probability, the more likely it is that the
result is due to a specific effect or phenomenon.
It is conventional to consider results statistically
significant if the probability of the result being
due to chance is less than 5%. If the test shows
that it is 95% certain that a result is not down to
chance, the probability is less than 5% (expressed
in the text as p<0.05); if the test shows that
it is 99% certain that a result is not down to
chance, the probability is less than 1% (expressed
as p<0.01). We use these terms in this report
to indicate where our results are statistically
significant and at what level.
The team that helped design the questionnaire, carry out the analysis and write the report were: Sarah Jones from the University of Bedfordshire, Liz Marriot and Stephen J. Perkins from London Metropolitan University, Michelle Brown from the University of Melbourne and John Shields from the University of Sydney.
We would like to thank all the reward professionals that helped inform the questionnaire and report as well as those who completed the survey.
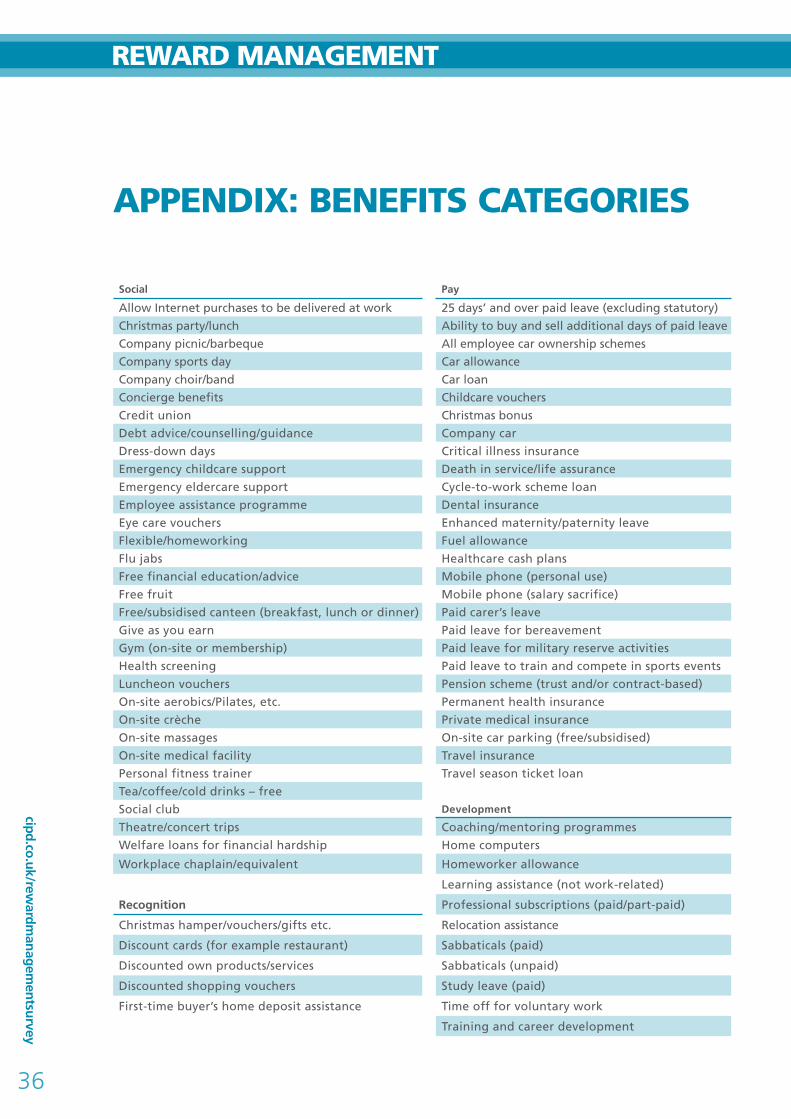
cipd.co.uk/rewardm
anagementsurvey
36
RewaRd management
aPPendix: BenefitS CategORieS
Social Pay
Allow Internet purchases to be delivered at work 25 days’ and over paid leave (excluding statutory)
Christmas party/lunch Ability to buy and sell additional days of paid leave
Company picnic/barbeque All employee car ownership schemes
Company sports day Car allowance
Company choir/band Car loan
Concierge benefits Childcare vouchers
Credit union Christmas bonus
Debt advice/counselling/guidance Company car
Dress-down days Critical illness insurance
Emergency childcare support Death in service/life assurance
Emergency eldercare support Cycle-to-work scheme loan
Employee assistance programme Dental insurance
Eye care vouchers Enhanced maternity/paternity leave
Flexible/homeworking Fuel allowance
Flu jabs Healthcare cash plans
Free financial education/advice Mobile phone (personal use)
Free fruit Mobile phone (salary sacrifice)
Free/subsidised canteen (breakfast, lunch or dinner) Paid carer’s leave
Give as you earn Paid leave for bereavement
Gym (on-site or membership) Paid leave for military reserve activities
Health screening Paid leave to train and compete in sports events
Luncheon vouchers Pension scheme (trust and/or contract-based)
On-site aerobics/Pilates, etc. Permanent health insurance
On-site crèche Private medical insurance
On-site massages On-site car parking (free/subsidised)
On-site medical facility Travel insurance
Personal fitness trainer Travel season ticket loan
Tea/coffee/cold drinks – free
Social club Development
Theatre/concert trips Coaching/mentoring programmes
Welfare loans for financial hardship Home computers
Workplace chaplain/equivalent Homeworker allowance
Learning assistance (not work-related)
Recognition Professional subscriptions (paid/part-paid)
Christmas hamper/vouchers/gifts etc. Relocation assistance
Discount cards (for example restaurant) Sabbaticals (paid)
Discounted own products/services Sabbaticals (unpaid)
Discounted shopping vouchers Study leave (paid)
First-time buyer’s home deposit assistance Time off for voluntary work
Training and career development
Rew
aR
d m
an
ag
em
en
t 2013
37
2013
endnOteS
1 Prospector/number of benefits – correlation
coefficient r=0.2, p<0.01; product leadership
quality/number of benefits – correlation
coefficient r=0.2, p<0.01. 2 Cost focus mean score of firms offering
voluntary/affinity benefits was 4.14 (±0.49)
compared with 3.93 (±0.69) for firms not
offering voluntary/affinity benefits, p<0.05. 3 Quality focus mean score of firms offering share
schemes/other LTIs was 3.80 (±0.68) compared
with 3.55 (±0.74) for firms not offering share
schemes/LTIs, p<0.05. 4 Cost focus mean score of firms offering
contributory pension schemes was 4.02 (±0.64)
compared with 3.76 (±0.71) for firms not
offering contributory pension schemes, p<0.01. 5 p<0.01. 6 p<0.05. 7 p<0.05. 8 Prospector/employer pension contributions –
correlation coefficient r=0.2, p<0.01; prospector/
employee pension contributions – correlation
coefficient r=0.2, p<0.05. 9 p<0.05. 10 p<0.01. 11 p<0.01. 12 p<0.01. 13 p<0.01. 14 p<0.01. 15 p<0.05. 16 p<0.01.
17 p<0.05. 18 p<0.05. 19 p<0.05. 20 p<0.05. 21 p<0.01. 22 p<0.01. 23 p<0.05. 24 p<0.01. 25 p<0.05. 26 p<0.01. 27 Correlation coefficient r=0.20–0.31. 28 p<0.05. 29 Secrecy mean score of organisations planning
increased spending was 1.90 (±0.92) compared
with 2.60 (±1.09) for organisations predicting
decreased spending/no change. 30 Secrecy mean score for organisations offering
DB schemes was 2.09 (±0.95) compared with
2.58 (±1.12) for organisations without open DB
schemes, p<0.01. 31 Secrecy mean score for organisations offering
to contribute to PPPs was 2.81 (±1.15) compared
with 2.36 (±1.07) for organisations not offering
to contribute to PPPs, p<0.01. 32 Secrecy mean score for organisations auto-
enrolling was 2.21 (±0.98) compared with 2.53
(±1.09) for organisations not auto-enrolling,
p<0.01. 33 Correlation coefficient r=–0.2, p<0.01. 34 Correlation coefficient r=–0.1, p<0.05.

cipd.co.uk/rewardm
anagementsurvey
38
RewaRd management
nOteS

Rew
aR
d m
an
ag
em
en
t 2013
39
2013
nOteS

cipd.co.uk/rewardm
anagementsurvey
40
RewaRd management
nOteS
OTHER TITLES IN THIS SERIES
LEARNING AND TALENT DEvELOPmENTThe annual Learning and Talent Development survey provides valuable commentary on current and future issues and trends. It explores employer support for learning, talent management, employee skills, managing and evaluating coaching and training spend. The latest report is brought to you in partnership with Cornerstone OnDemand.
RESOURCING AND TALENT PLANNINGThe annual Resourcing and Talent Planning survey contains valuable information on current and emerging trends in people resourcing practice. The report provides benchmarking information to support employers on resourcing strategies, attracting and selecting candidates, labour turnover and employee retention. The latest report is brought to you in partnership with Hays.
ABSENCE mANAGEmENTThe annual Absence Management survey provides useful benchmarking data on absence levels, the cost and causes of absence, and how organisations are managing absence. The latest report is brought to you in partnership with Simplyhealth.
EmPLOYEE ATTITUDES TO PAYThe annual Employee Attitudes to Pay survey investigates employee attitudes and expectations towards pay and bonuses. This survey is carried out by YouGov and focuses on employees in the UK.
2012

Issu
ed: S
epte
mbe
r 20
13 R
efer
ence
: 633
1 ©
Cha
rter
ed In
stitu
te o
f Pe
rson
nel a
nd D
evel
opm
ent
2013
Chartered Institute of Personnel and Development
151 The Broadway London SW19 1JQ UK
Tel: +44 (0)20 8612 6200 Fax: +44 (0)20 8612 6201
Email: [email protected] Website: cipd.co.uk
Incorporated by Royal Charter Registered charity no.1079797