Embed Size (px)
Citation preview

Strathfield South High School
Annual School Report 2013
8252
1
School context
Founded in 1960, Strathfield South High School is a comprehensive, co-educational high school located in South-West Sydney Region.
The school community comprises students from a variety of cultural backgrounds, reflecting the multicultural nature of its drawing area. A significant majority of students are of Non English Speaking Background.
Adding to this diversity are the facts that the school population includes significant numbers of both students who have had experiences as refugees and international students who have chosen Strathfield South High School for their educational experiences in Australia.
The school also incorporates a Support Unit which caters for the needs of students who are hearing impaired, as well as some who also have an intellectual or social disability. A discrete Autism class was established in 2013.
The school receives extra educational support from the Federal Government under its Priority Schools Program. Inclusion in this program is determined by the levels of affluence and education in the community which the school services.
The school’s educational ethos is underpinned by its Positive Behaviour for Learning Program. All educational and welfare programs are based on the values of Respect, Responsibility, Care and Concern, Honesty and Diligence.
Principal’s message
2013 was a year characterised by consolidation and pedagogical growth for Strathfield South High School. We were extremely fortunate in gaining Mr Ric Ciliona as Deputy Principal at the start of the year. Ric had spent the previous eight years working in the Curriculum Directorate, specialising in the National Curriculum.
When in Term 1 we discovered that we had been included on the list of National Partnership schools to promote development in Literacy and Numeracy education, it was natural that Ric be relieved of his Deputy responsibilities to take charge of the school’s curriculum development.
The three terms of change that ensued saw an enormous outpouring of creative energy from the staff and very significant gains in our pedagogical approach. Teaching programs were redefined and restructured, adhering to a common format to ensure that all essential components are being addressed according to the needs of our students. Stemming from this, a group of staff led by HT Social Science John Falvo rationalised and reinvented the school’s approach to assessment, producing a ‘best practice’ document which will form the foundation of 2014’s focus on differentiation.
The school gained significant academic and sporting successes again, consolidating on achievements from past years. In 2013, the school focused more strongly on community engagement, and two ventures – the Technology Tutors and Early Childhood programs – gained important awards in recognition of their success and effectiveness.
The school made strong efforts to engage more effectively with one of our most significant demographics – the Afghan community in Auburn in 2013. Refugee coordinator Ms Anette Bremer led the school in establishing community gatherings for parents and families of our Afghan students which grew over the course of the year to embrace significant numbers.
The year saw the appointment of a new Head Teacher Support, Mr Peter Kerr, and the expansion of our Hearing Support classes from three to four. Another achievement in 2013 was the establishment of a class for students with Autism.
As always, the school’s nature is best exemplified by the professionalism of its staff and their commitment to the educational, social and personal success of our students. 2013 was a year of great challenge and change for staff, and they embraced these changes whole-heartedly and worked very hard to develop and improve teaching and learning within the school.
Again, the staff and students were supported by highly effective and proactive Welfare and Learning Support Teams led by Joe Gurto and Nadia Blasutto respectively.
Parents, community members and people beyond the school now frequently comment that they see positive change at the school, and now view it as a welcoming, engaging community. The

2
school, with student and community engagement at its heart, is well placed to see the extension of this perception in the years to come.
I certify that the information in this report is the result of a rigorous school self-evaluation process and is a balanced and genuine account of the school’s achievements and areas for development.
Simon Paterson – Relieving Principal
P & C and/or School Council message
Strathfield South High School had neither a
Parents and Citizens Association nor a School
Council during the 2012 School year. It should be
noted, however, that through work undertaken in
Term 4 of 2013, a P&C will be established in Term
1 2014.
Student information
In 2013, Strathfield South High School had total enrolments of 683 students. The major cultural groups within the school are Anglo-Celtic, Lebanese, Afghan, Chinese, Korean, Vietnamese, and Pacific Islander. The school community is comprised of over fifty different cultural backgrounds.
The school draws the majority of its students from schools which lie outside of its drawing area.
Many students come from Auburn and Bankstown to study at Strathfield South High school.
The school also attracts a number of international students. In 2013 there were students from China, Japan, South Korea and Vietnam enrolled at the school.
Student enrolment profile
Enrolments remained steady on the previous year, as did the ratio of female to male students at 39% to 61%. Enrolment trends are tabulated below:
Student attendance profile
Student attendance is above Region and State averages and has improved on previous years as detailed in the table below:
Management of non-attendance
Improvements in attendance against Region and State averages were noted in 2013. The Head
Gender 2007 2008 2009 2010 2011 2012 2013
Male 377 360 387 414 446 412 424
Female 230 241 245 267 270 263 253
0
100
200
300
400
500
600
700
800
2007 2008 2009 2010 2011 2012 2013
Stu
de
nts
Year
Enrolments
Male Female
Year 2008 2009 2010 2011 2012 2013
7 93.9 93.5 94.5 92.2 94.6
8 91.5 94.6 90.7 91.3 94.9
9 87.1 92.5 92.7 89.8 92.6
10 85.3 91.1 91.2 88.0 93.6
11 90.7 93.4 91.7 89.2 91.6
12 87.3 91.6 90.8 90.1 92.0
Total 90.7 89.2 92.8 91.9 89.8 93.1
7 92.9 93.7 93.6 93.7 94.3
8 90.9 91.5 91.4 91.3 92.3
9 89.4 90.4 90.2 90.4 91.0
10 88.9 89.1 88.3 88.2 88.9
11 89.6 89.6 87.9 88.5 89.5
12 89.6 90.0 89.5 90.0 90.5
Total 90.7 90.1 90.7 90.1 90.3 91.0
7 92.3 92.6 92.5 92.4 93.2
8 90.0 90.5 90.1 90.1 90.9
9 88.8 89.1 88.8 88.7 89.4
10 88.7 88.3 87.1 87.0 87.7
11 89.4 89.1 87.6 87.6 88.3
12 89.4 89.8 89.2 89.3 90.1
Total 89.9 89.7 89.9 89.2 89.1 89.9
Sta
te D
EC
Re
gio
nS
cho
ol
0
25
50
75
100
2008 2009 2010 2011 2012 2013
Att
en
dan
ce ra
te
Year
Student attendance rates
School Region State DEC

3
Teacher Administration, Ms Diana Pasalic, identified students at risk of not meeting attendance requirements. A process which involved interviews and monitoring ensured that at risk students and their parents were made aware of their responsibilities regarding attendance and the associated consequences. Ms Pasalic then contacted the Home School Liaison Officer in order to further support students with their attendance.
Post-school destinations
From the available data, the year 12 cohort from
2013 have undertaken the following pathways:
University 37 percent
TAFE / Private College 45 percent
Fulltime Work 13 percent
Unknown 5 percent
Year 12 students undertaking vocational or trade training
In 2013, 79 students undertook VET courses at Strathfield South High School. This constitutes 28% of the entire candidature.
The students undertook studies in Business Services, Construction, Hospitality and Retail Services.
Year 12 students attaining HSC or equivalent Vocational educational qualification
A total of 221 students sat for HSC examinations in 2013. This number includes 123 Year 11 students who were sitting for their first three HSC subjects under the school’s compressed curriculum.
Thirty two students did not complete HSC requirements in a subject, however as the majority of these were in their first year of the HSC and still have three subjects to undertake, this will not necessarily preclude them from gaining the qualification. Five students did not receive an HSC due to N-awarding, absence from examinations or having the qualification withheld due to non-serious attempt.
Workforce information
Teaching staff at Strathfield South High School include a Principal, two Deputy Principals and ten Head Teachers. One Head Teacher position was
placed on review due to a decline in enrolments below 700 students. Our teaching staff also includes twelve Administration Support Staff and Student Learning Support Officers. All of the teaching staff at Strathfield South High School meet the professional requirements for teaching in NSW public schools.
Workforce composition
Position Number
Principal 1
Deputy Principal(s) 2
Head Teachers 10
Classroom Teacher(s) 36.1
Teacher of Hearing Disabilities 3
Learning and Support Teacher(s) 1.7
Teacher Librarian 1
Teacher of ESL 4
School Counsellor 1
School Administrative & Support Staff 12.3
Total 72.1
Teacher qualifications
All teaching staff meet the professional requirements for teaching in NSW public schools.
Qualifications % of staff
Degree or Diploma 100%
Postgraduate 12%
NSW Institute of Teachers Accreditation 8%
Financial summary
This summary covers funds for operating costs and does not involve expenditure areas such as permanent salaries, building and major maintenance.
Date of financial summary 30/11/2013
Income $
Balance brought forward 444,716.65 Global funds 484,367.34 Tied funds 455,215.00 School & community sources 301,536.13 Interest 19,948.19 Trust receipts 37,814.4
Total income 1743597.71
Expenditure
Teaching & learning Key learning areas 149,935.62 Excursions 56,740.05

4
Extracurricular dissections 41,505.60 Library 11,355.66 Training & development 30,653.68 Tied funds 400,208.62 Casual relief teachers 128,934.75 Administration & office 247,612.40 School-operated canteen 0.00 Utilities 105,546.97 Maintenance 116,305.41 Trust accounts 33,511.30 Capital programs 26,494.61
Total expenditure 1348804.67
Balance carried forward 394793.04
A full copy of the school’s 2013 financial statement is tabled at the annual general meetings of the School Council and/or the parent body. Further details concerning the statement can be obtained by contacting the school.
School performance 2013
Academic achievements
NAPLAN
In the National Assessment Program, the results across the Years 3, 5, 7 and 9 literacy and numeracy assessments are reported on a scale from Band 1 to Band 10. Year 7 students score between Band 4 (lowest) and Band 9 (highest) and Year 9 students score between Band 5 (lowest) and Band 10)
The achievement scale represents increasing levels of skills and understandings demonstrated in these assessments.
The My School website provides detailed information and data for national literacy and numeracy testing (NAPLAN).
Click on the link http://www.myschool.edu.au and enter the school name in the Find a school and select GO to access the school data.
NAPLAN Year 7 - Literacy
Year 7 NAPLAN scores are rated from Band 4 (lowest) to Band 9 (highest)
The majority of Year 7 students (63.7%) fell into Bands 5 and 6, which compares to previous years’ cohorts. The number of students who scored in Band 9 was higher than in past years.
The school expanded its Quicksmart literacy program in 2013 to reach more students whose literacy skills fall well below expected levels.
NAPLAN Year 7 - Numeracy
0
20
40
4 5 6 7 8 9
Pe
rce
nta
ge o
f st
ud
en
ts
Bands
Percentage in bands: Year 7 Reading
Percentage in Bands
School Average 2009-2013
SSG % in Band 2013
4 5 6 7 8 9
12 29 27 12 6 2
13.6 33.0 30.7 13.6 6.8 2.3
11.7 30.8 31.3 17.6 7.2 1.4
6.8 20.0 30.7 23.2 14.2 5.1
6.6 17.8 25.9 22.5 17.0 10.2
Average score, 2013
Skill Band Distribution
Number in Band
Percentage in Bands
School Average 2009-2013
SSG % in Band 2013
State DEC % in Band 2013
Band
521.2
SSG
489.6 534.0
School State DEC
Note: paste tables and graphs into ASR
Highlight table or graph -Picture (Enhanced
Metafile)
0
10
20
30
40
50
4 5 6 7 8 9
Pe
rce
nta
ge o
f st
ud
en
ts
Bands
Percentage in bands: Year 7 Numeracy
Percentage in BandsSchool Average 2009-2013SSG % in Band 2013State DEC % in Band 2013
5
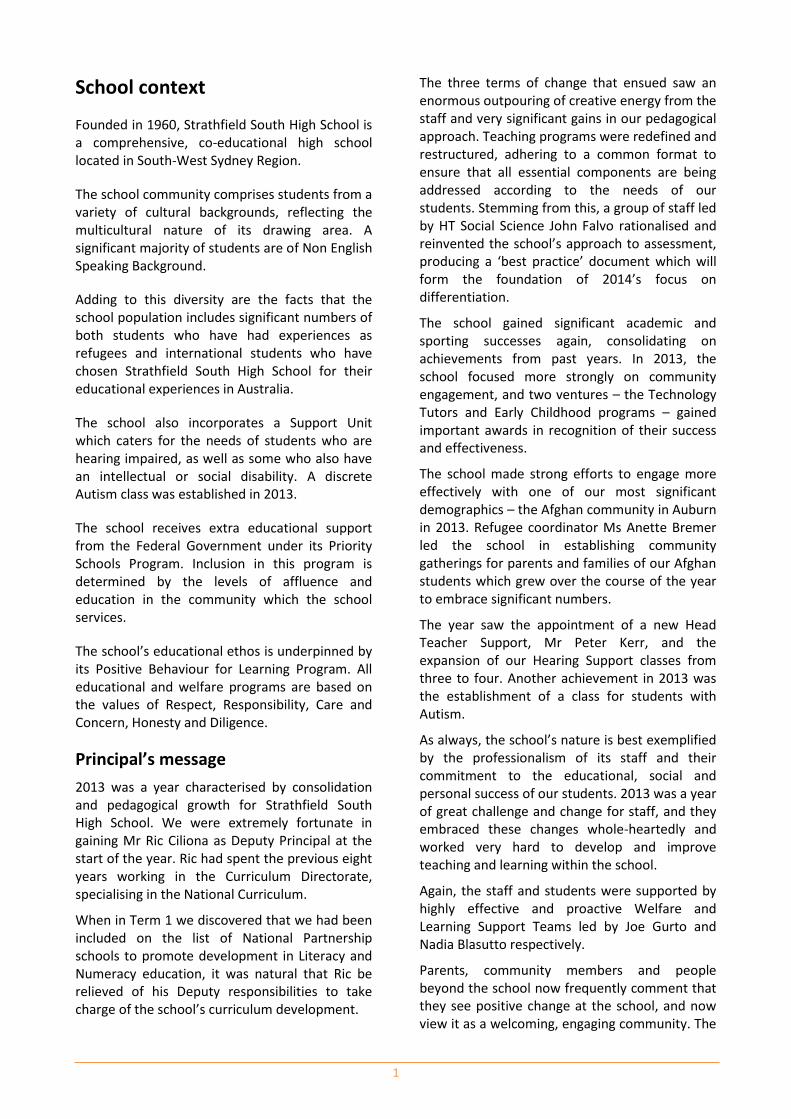
The 2013 cohort’s Numeracy results were placed significantly in Bands 5 and 6, with 63% of students achieving in these Bands. This trend mirrors past years’ results. Fewer students achieved Band 8 and no student in 2013 achieved a Band 9.
The school’s Thinksmart and intensive mentoring in mathematics programs were expanded in 2013 to address the deficiencies in Numeracy.
NAPLAN Year 9 - Literacy (including Reading, Writing, Spelling and Grammar and Punctuation)
Year 9 NAPLAN scores are rated from Band 5 (lowest) to Band 10 (highest)
Analysis of NAPLAN data from this same cohort in Year 7 shows steady growth for most students, although it is worthy of note that only 71% of students had comparative data from Year 7.
Despite this recorded growth, students fell below state averages in all areas of literacy, although rates of growth are similar.
NAPLAN Year 9 - Numeracy
2013 Numeracy scores fell predominantly in Bands 6 and 7, with slight growth noted in Band 9. A notable drop in Band 10 scores was evident from past years.
Higher School Certificate (HSC)
In the Higher School Certificate, the performance of students is reported in performance bands ranging from Performance Band 1 (lowest) to Performance Band 6 (highest).
4 5 6 7 8 9
7 22 41 14 4 0
8.0 25.0 46.6 15.9 4.5 0.0
8.2 27.8 36.1 16.7 8.6 2.7
3.8 23.6 31.8 24.1 11.5 5.3
4.0 20.6 26.6 21.8 13.2 13.9
School State DECSSG
Band
Number in Band
520.0 540.9497.2
Skill Band Distribution
Average score, 2013
Percentage in Bands
School Average 2009-2013
SSG % in Band 2013
State DEC % in Band 2013
0
10
20
30
40
50
5 6 7 8 9 10
Pe
rce
nta
ge o
f st
ud
en
ts
Bands
Percentage in bands: Year 9 Reading
Percentage in BandsSchool Average 2009-2013SSG % in Band 2013State DEC % in Band 2013
5 6 7 8 9 10
10 41 35 15 0 0
9.9 40.6 34.7 14.9 0.0 0.0
16.1 35.5 31.2 14.0 3.3 0.0
7.3 23.7 31.7 22.5 12.0 2.7
6.9 21.2 27.4 23.5 15.9 5.1
529.6Average score, 2013
State DECSSG
574.8564.1
School
Band
Number in Band
Percentage in Bands
Skill Band Distribution
School Average 2009-2013
State DEC % in Band 2013
SSG % in Band 2013
0
10
20
30
40
5 6 7 8 9 10
Pe
rce
nta
ge o
f st
ud
en
ts
Bands
Percentage in bands: Year 9 Numeracy
Percentage in BandsSchool Average 2009-2013SSG % in Band 2013State DEC % in Band 2013
5 6 7 8 9 10
13 28 34 15 10 1
12.9 27.7 33.7 14.9 9.9 1.0
7.2 31.5 31.1 17.2 9.2 3.7
11.9 24.4 29.9 18.4 9.3 6.1
11.0 21.3 25.0 17.3 10.4 15.1
School SSG State DEC
State DEC % in Band 2013
584.4Average score, 2013 545.3 560.4
Skill Band Distribution
Band
Number in Band
Percentage in Bands
School Average 2009-2013
SSG % in Band 2013

6
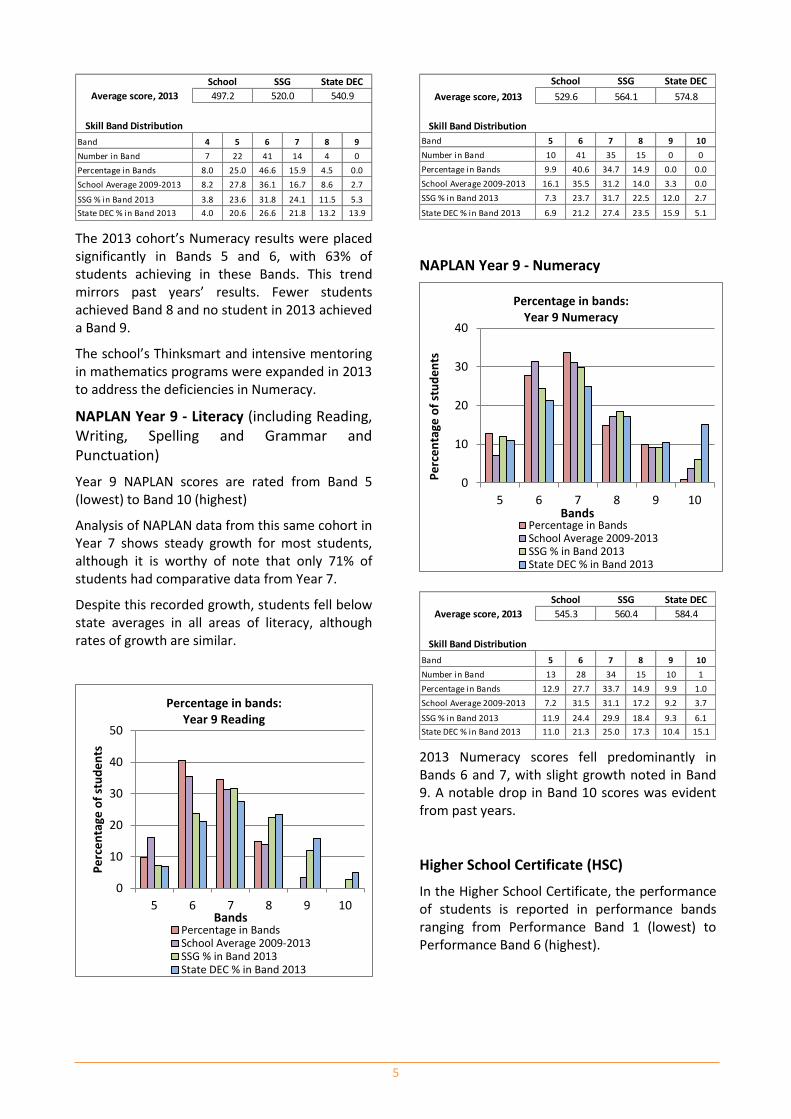
Ancient History
Ancient History was studied by 19 students. Some of the students found the demands of the course challenging.
Percentage in Bands: Overall the school’s results in terms of Bands were below those of all DEC students and all NSW students. However 2 students achieved a Band 5. In addition, the number of students who gained a Band 1 was only half the number of Band 1 students in 2012.
Trend Data: The school’s average score of 58.9% showed an improvement of 2.0% from that of 2012 and was 10.4% below the average of all DEC students.
SSWS Graph: The 2013 cohort performed significantly below the performance of all DEC students (-0.71) but very close to the performance of other courses within the school (-0.04).
Scatterplot Analysis: The value-added data showed a pleasing improvement of 0.65 for the cohort as a whole in comparison with their performance in the School Certificate. This is 2.58 above the performance of the 2012 cohort. The students who were in Bands 5 and 4 in the School Certificate showed a significant improvement especially those in Band 5 (11.58). The Band 4 improvement was 3.85. The students who were in Band 3 in the School Certificate displayed a slight rise of 0.41. These results showed a significant increase for students in Bands 5, 4 and 3 compared to those of 2012. This indicates that the school has had some success in assisting the more capable students to meet the higher order demands of the course. Students in Band 2
showed a similar decline to that of 2012 (9.87). This indicates that there remains a need to support the students who are struggling to more fully meet the basic requirements of the course.
Biology
Percentages in Bands: The number of students that achieved at band 5 and 6 was 12.5% compared to 33.3% statewide. The number of students who achieved bands 3 and 4 was 56.2% compared to 58.4% statewide. The remaining students that achieved bands 1 and 2 was 31.3% compared to 8.3% statewide. In summary the results show a pleasing improvement in band 5 results of 3.7% and a significantly a drop of 8.7% in the band 2 results from the 2012 results. The middle band results were comparable to state average.
Trend Data: Pleasingly, The Biology results from 2012 to 2013 show a slightly upward trend. The statistical average of the 2012 Biology results was 64.2.
SSWS Graph: The Biology cohort for 2013 was -0.77 and performed moderately below statewide performance. The performance of the Biology students was significantly better when compared to SSHS students in other courses and showed a figure of 0.13
Scatter Plot Analysis: The value adding for Biology overall showed a slight retraction of -0.82 which is slightly below average. Pleasingly, Bands 3 and 5 representing 26.8 % of the cohort demonstrated positive growth. Unfortunately Bands 2 and 4 showed negative growth demonstrating focus is necessary in these bands in particular.
Business Studies
A total of 43 students sat for the Business Studies HSC examination in 2013. Almost 7% gained a Band 5, 14% gained Band 4, 30% gained Band 3, and the remaining students gained Band 1 or 2. 5 students did not complete the course.
Chemistry
Percentages in Bands: The number of students that achieved at band 5 and 6 was 4.9% compared to 41.9% statewide. The number of students who achieved bands 4 and 3 was 39.1%
0102030405060708090
100
An
cie
nt
His
tory
Bio
logy
Bu
sin
ess
Stu
die
s
Ch
em
istr
y
Engi
nee
rin
g St
ud
ies
Engl
ish
(St
and
ard
)
School 2013School Average 2009-2013

7
compared to 50% statewide. The remaining students that achieved bands 1 and 2 was 56.1% compared to 8% statewide. The HSC Chemistry results show a need to drive the upper band results and implement a remediation program to improve lower band results.
Trend Data: The results from 2008 to 2013 show a downward trend. The statistical average of the 2012 Chemistry results was 54.6.
SSWS Graph: The Chemistry cohort for 2013 was -1.64 and performed significantly below statewide performance. The performance of the Chemistry students, however, was comparable to SSHS students in other courses and showed a figure of - 0.09.
Scatter Plot Analysis: The value adding for Chemistry shows a slight retraction of -3.48 which is below state average.
Engineering Studies
11 students completed the course, two gained Band 4 and 9 gained Band 3.
Standard English
Percentages in Bands: Very few students state-wide scored in band 6 in HSC English (0.4%). 0.9% of SSHS students scored a band 5 result compared to 6.4% state-wide. 5.5% of SSHS Standard English students scored in bands 4 compared to 27.1% state-wide. 29.1% of SSHS students scored in band 3 compared to 45.1% state-wide. 64.5 % of SSHS students scored in bands 1 or 2 compared to 21.0% state-wide. In summary this results are significantly depressed compared to state wide averages.
Trend Data: The scaled average score for Standard English decreased to 53.9 in 2013. This is a dip of approximately 6 points on the results obtained in the three prior years. The gap between the state-wide average scaled score and that of SSHS Standard English students has increased from 5.1 in 2012 to 7.6 in 2012.
SSWS Graph Analysis: The Standard English cohort for 2012 performed significantly below parity with state-wide performance. When compared with other courses in the school, however, the Standard English students nearly achieved parity being just 0.05 below other subjects offered in the school.
Scatter Plot Analysis: The value added data for Standard English displayed a small retraction of -5.32 however, this retraction was not uniform across all School Certificate performance bands. Students who performed in the top two bands of the School Certificate achieved a positive growth of 5.64 but students who scored in the bottom two bands in School Certificate English regressed a substantial 11.09. These results point to a disengagement of lower performing students and may also be a symptom of the recent increase in the mandatory minimum school leaving age which has resulted in the retention of students who would have left school in previous years.
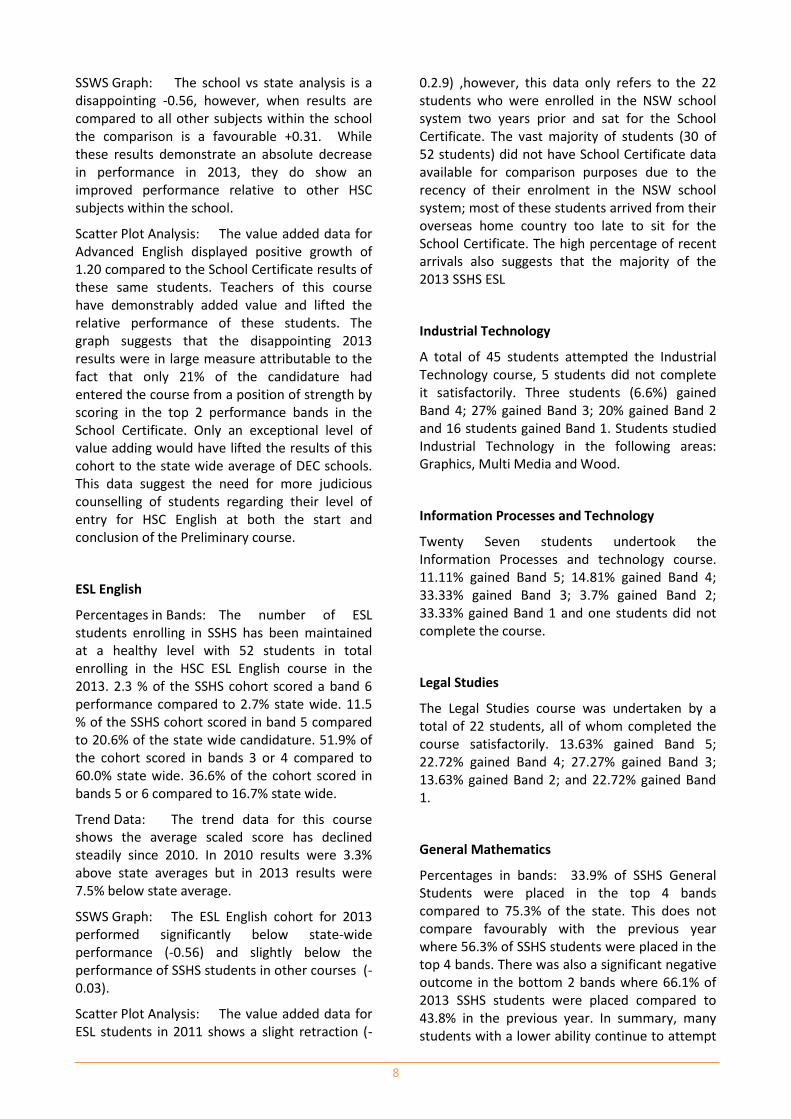
Advanced English
Percentages in Bands: In 2013, as in the previous three years no SSHS students were placed in band 6 compared 12.0% of DEC schools state-wide, however, 16.7% of SSHS Advanced students scored in band 5. This is well below the state-wide figure of 41.1%. The remaining students fell into band 4 (61.3%) and band 3 (19.4%), with no students falling into bands 1 or 2. In summary the results are not strong as the percentage of students performing in the top three bands has declined from 100% in 2012 to 51% in 2013.
Trend Data: The trend data shows a dip from 79.1 in 2012 to 73.5 in 2013. This is disappointing given the fact that the three previous years had demonstrated a trend of modest growth.
0102030405060708090
100
Engl
ish
(A
dva
nce
d)
Engl
ish
as
a Se
con
dLa
ngu
age
Ind
ust
rial
Tec
hn
olo
gy
Info
rmat
ion
Pro
cess
es
and
Tech
no
logy
Lega
l Stu
die
s
Gen
eral
Mat
he
mat
ics
School 2013
School Average 2009-2013
8
SSWS Graph: The school vs state analysis is a disappointing -0.56, however, when results are compared to all other subjects within the school the comparison is a favourable +0.31. While these results demonstrate an absolute decrease in performance in 2013, they do show an improved performance relative to other HSC subjects within the school.
Scatter Plot Analysis: The value added data for Advanced English displayed positive growth of 1.20 compared to the School Certificate results of these same students. Teachers of this course have demonstrably added value and lifted the relative performance of these students. The graph suggests that the disappointing 2013 results were in large measure attributable to the fact that only 21% of the candidature had entered the course from a position of strength by scoring in the top 2 performance bands in the School Certificate. Only an exceptional level of value adding would have lifted the results of this cohort to the state wide average of DEC schools. This data suggest the need for more judicious counselling of students regarding their level of entry for HSC English at both the start and conclusion of the Preliminary course.
ESL English
Percentages in Bands: The number of ESL students enrolling in SSHS has been maintained at a healthy level with 52 students in total enrolling in the HSC ESL English course in the 2013. 2.3 % of the SSHS cohort scored a band 6 performance compared to 2.7% state wide. 11.5 % of the SSHS cohort scored in band 5 compared to 20.6% of the state wide candidature. 51.9% of the cohort scored in bands 3 or 4 compared to 60.0% state wide. 36.6% of the cohort scored in bands 5 or 6 compared to 16.7% state wide.
Trend Data: The trend data for this course shows the average scaled score has declined steadily since 2010. In 2010 results were 3.3% above state averages but in 2013 results were 7.5% below state average.
SSWS Graph: The ESL English cohort for 2013 performed significantly below state-wide performance (-0.56) and slightly below the performance of SSHS students in other courses (-0.03).
Scatter Plot Analysis: The value added data for ESL students in 2011 shows a slight retraction (-
0.2.9) ,however, this data only refers to the 22 students who were enrolled in the NSW school system two years prior and sat for the School Certificate. The vast majority of students (30 of 52 students) did not have School Certificate data available for comparison purposes due to the recency of their enrolment in the NSW school system; most of these students arrived from their overseas home country too late to sit for the School Certificate. The high percentage of recent arrivals also suggests that the majority of the 2013 SSHS ESL
Industrial Technology
A total of 45 students attempted the Industrial Technology course, 5 students did not complete it satisfactorily. Three students (6.6%) gained Band 4; 27% gained Band 3; 20% gained Band 2 and 16 students gained Band 1. Students studied Industrial Technology in the following areas: Graphics, Multi Media and Wood.
Information Processes and Technology
Twenty Seven students undertook the Information Processes and technology course. 11.11% gained Band 5; 14.81% gained Band 4; 33.33% gained Band 3; 3.7% gained Band 2; 33.33% gained Band 1 and one students did not complete the course.
Legal Studies
The Legal Studies course was undertaken by a total of 22 students, all of whom completed the course satisfactorily. 13.63% gained Band 5; 22.72% gained Band 4; 27.27% gained Band 3; 13.63% gained Band 2; and 22.72% gained Band 1.
General Mathematics
Percentages in bands: 33.9% of SSHS General Students were placed in the top 4 bands compared to 75.3% of the state. This does not compare favourably with the previous year where 56.3% of SSHS students were placed in the top 4 bands. There was also a significant negative outcome in the bottom 2 bands where 66.1% of 2013 SSHS students were placed compared to 43.8% in the previous year. In summary, many students with a lower ability continue to attempt

9
General Mathematics with a view to developing their mathematical skills to pursue further technical education and careers.
Trend Data: The 2013 trend data shows a negative growth from 61% in 2012 to 52%. (State 2013 – 67.4%)
SSWS Graph: The 2013 General Maths students were below parity when compared to state performances (-0.83) and were roughly comparable with the performances of other subjects offered by the school (-0.03).
Scatter Plot Analysis: the value added data for General Mathematics displayed negative growth of -4.59 with our top end students compared to the school certificate results of the students (bands 4, 5 and 6 in the SC). The overall average value added was -2.92.
Mathematics
Percentages in bands: 31.8% of SSHS Mathematics Students were placed in the top 3 bands compared to 72.4% of the state. These results are down on the previous year when 53.2% of SSHS students achieved a band 4 or better.
Of great concern are the 43.9% of the students who achieved bands 1 and 2. These are primarily the students who could not cope with the course and would not or could not drop this subject.
Trend Data: The 2013 trend data shows a negative growth from 65.6% in 2012 to 58.2% (State 2013 – 77.8%).
SSWS Graph: The 2013 Mathematics students were largely below parity when compared to state performances (-1.33) and were moderately comparable with the performances of other subjects offered by the school (0.1).
Scatter Plot Analysis: the value added data for Mathematics displayed negative growth of -1.49 with our top end students compared to the school certificate results of the students (bands 5 and 6 in the SC). The students at the low end (48% of candidates) showed a small growth of 1.06 (these were the students who achieved bands 1,2 or 3 in the SC). The overall average value added was -3.30.
Mathematics Extension 1
Percentages in bands: 75% of SSHS Mathematics Extension 1 Students were placed in the top 2 (E4 and E3) bands compared to 83.7% of the state. These results show a pleasing improvement on the previous year when 61.1% of SSHS students achieved a band E4 or E3.
It is pleasing to note that only 25% of the students achieved band E2. These are primarily the students who continued with the course to obtain recognition for attempting this more demanding subject for the purposes of tertiary education. No student achieved band E1.
Trend Data: The 2013 trend data shows a positive growth from 68.7% in 2012 to 74% (State 2013 – 81.1%).
SSWS Graph: The data for 2013 was unavailable.
Scatter Plot Analysis: the value added data for Mathematics displayed negative growth of -1.57 with our top end students compared to the school certificate results of the students (bands 5 and 6 in the SC). One student showed a large growth of 18.58 (this student achieved band 4 in the SC)
Mathematics Extension 2
Percentages in bands: 50% of SSHS Mathematics Extension 2 Students were placed in the top 2 (E4 and E3) bands compared to 87.3% of the state.
0
10
20
30
40
50
60
70
80
90
100
Mat
hem
atic
s
Pe
rso
nal
Dev
elo
pm
ent,
Hea
lth
an
d P
hys
ical
…
Ph
ysic
s
Soci
ety
and
Cu
ltu
re
Vis
ual
Art
s
Jap
anes
e B
egin
ne
rs
School 2013School Average 2009-2013
10
Trend Data: The 2013 trend data shows negative growth from 83.3% in 2012 to 74.0% (State 2013 – 82.5%).
SSWS Graph: The data for 2013 Extension 2 students is not available.
Scatter Plot Analysis: the value added data for Mathematics displayed positive growth of 8.24 with our top end students compared to the school certificate results of the students who achieved a band 4 or higher.
PDHPE
Percentages in Bands: 30.8% of SSHS PDHPE students scored in band 4 compared to 30.9% statewide. 42.3% of SSHS students scored in band 3 compared to 23.5% statewide. 19.2% of SSHS students scored in band 2 compared to 12.4% statewide. 7.7% of SSHS students scored in band 1 as opposed to 4.8% statewide.
Trend Data: Statistics show inconsistent results in PDHPE. In 2009 the average scaled score was 63.2, Increased to 70.3 in 2010, decreased to 61.1 in 2011, Increased to 65.9 in 2012, and decreased to 63.1 in 2013. The gap between the statewide average scaled score and that of SSHS PDHPE students has shortened from 9.6 in 2009 to 8.2 in 2013.
SSWS Graph: The PDHPE Cohort for 2013 performed below statewide average at -0.42. When compared to other subjects in the school, the PDHPE students performed slightly above at 0.11.
Scatter Plot Analysis: The value added data for PDHPE displayed a retraction of -0.48%. It was disappointing to see a decrease of -0.97 in Bands 4, with an increase in Bands 3 of 0.26.
Physics
Percentages in Bands: The number of students that achieved at band 5 and 6 was 4.3% compared to 33.8% statewide. The number of students who achieved bands 4 and 3 was 39% compared to 55.1% statewide. The number of students that achieved band 1 and 2 was 53.7% compared to 11% statewide. In summary the results show that the middle band results were closest to state average. The HSC Physics results show a further need to drive the upper band
results and implement a remediation program to improve lower band results.
Trend Data: The 2013 Physics results show a significant upward trend, opposing the downward trend from 2008-2012. The statistical average of the 2013 Physics results was 59.2.
SSWS Graph: The Physics cohort for 2012 was -1.14 and performed significantly below statewide performance. The performance of the Physics students, however, was comparable to SSHS students in other courses and showed a figure of - 0.03.
Scatter Plot Analysis: The value adding for Physics in 2013 shows a slight retraction of -0.41. Pleasingly, Bands 3 and 5 representing 26.8 % of the cohort demonstrated positive growth. Unfortunately Bands 2 and 4 showed negative growth demonstrating focus is necessary in these bands in particular.
Society and Culture
The Society and Culture course was undertaken by 27 students, all of whom completed the course successfully. 3.7% gained Band 6; 11.11% gained Band 5; 22.22% gained Band 4; 40.74% gained Band 3; 14.81% gained Band 2; and 7.4% gained Band 1.
Visual Arts
Percentage in Bands: In 2013, as in the previous three years no SSHS students were placed in band 6 compared to 12.3% State- wide, however, 66.7 % of our students received a band 4 or higher. The remainder of the cohort received a Band 2 or better. One pleasing result was that none of our students scored in the lowest band
Trend Data: The trend data for this course shows the average scaled score has fluctuated slightly above or below the state-wide mean over the past 5 years. Against NSW DEC, students in the 2013 cohort were below by 4.9% and 7% against State Average. The trend data suggests that students peaked above average in 2010 and 2012. There is a significant correlation between class sizes and mean results; smaller class sizes have yielded our best results.
SSWS Graph: In 2013 SSHS Visual Arts students were 0.59 below state average. However when compared to other subjects offered in the school

11
Visual Arts students scored 0.24 above the mean of other subjects offered at the school.
Scatter Plot Analysis: Visual Arts students in 2013 HSC displayed a positive growth of 1.73 when their results are compared to the School Certificate. Thus whilst 2013 Visual Arts results are below state averages, the students were commencing HSC Studies from a lower base but did exhibit significant growth over the two years of study. Our top student showed a growth of 14.8%. Only two students did not exhibit growth. Casual observation of these lower performing students’ application and attendance patterns suggest disengagement amongst these students is responsible for their poor performance. To address this problem it is proposed to engage parents/caregivers at an early stage in the Preliminary Course where deemed necessary.
Japanese Beginners
This course was attempted by 18 students. Two students, or 11.11% gained Band 6; 11.11% gained Band 4; 33.33% gained Band 3; 33.33% gained Band 2 and 11.11% gained Band 1.
Additionally, 8 students sat for the Japanese Continuers course. 12.5% gained Band 5; 37.5% gained Bands 4 and 3 respectively; and 12.5% gained Band 2.
HSC Music 1
Percentage in Bands: In 2013, as in the previous three years, no SSHS students were placed in band 6 compared to 15% state-wide. All of the students achieved a Band 4 and above. 33.0% of the cohort achieved a Band 5 in 2013, compared to no students in 2012 and 2011.
Trend Data: Students in the 2013 cohort were below the State mean by 3.9%. The data shows a consistent upward trend from 2011- 2013.
SSWS Graph: No analysis of data was available due to the small candidature.
Scatter Plot Analysis: The value added data for Music 1 displayed a positive growth of 1.02 compared to the School Certificate results of these students. The majority of the cohort displayed value added, with the top student securing an increase of 19 in his performance over the two year period. The growth displayed by the cohort was not consistent; whilst one
student scored a positive growth of other students demonstrated negative growth. Analysis of relevant data suggests poor attendance and disengagement of several students was responsible. To address this problem it is proposed to engage parents/caregivers at an early stage in the Preliminary Course where deemed necessary.
Hospitality Examination
41 students sat for the Hospitality examination, which is not mandatory under VET frameworks. 4.34% gained Band 5; 17.39% gained Band 4; 45.65% gained Band 3; 19.56% gained Band 2; and 2.17% gained Band 1.
Retail Services Examination
This examination, which is not compulsory under VET frameworks, was sat by 29 students. 6.06% gained Band 5; 12.12% gained Band 4; 48.48% gained Band 3; 12.12% gained Band 2; and 9.09% gained Band 1.
0102030405060708090
100
Ho
spit
alit
y Ex
amin
atio
n
Re
tail
Serv
ice
s Ex
amin
atio
n
School 2013School Average 2009-2013

12
Support Unit
Hearing Support Unit
In 2013 the Hearing Support Unit at Strathfield South High School grew from three to four classes. Students participated in small, discrete classes for Maths, English, Science and Social Science with mainstream integration for PDHPE, Arts and Technology. 2013 has seen an increase in the use of specialised hearing technology, with the Support Unit purchasing several Sound Field Systems and expanding its use of FM technology. Hearing Support students have actively participated in whole school activities and initiatives through representation on SRC, participation in school sporting teams, activity days and through dance and arts performances.
Autism Support Class
In 2013 an Autism Support Class was established at Strathfield South High School. The class is capped at 7 students all of whom began 2013 in Year 7. Students participated in a modified program with a strong focus on literacy and numeracy. Students engaged in a range of programs including social skills activities and learning in the community making use of local shopping centres and community facilities. Lessons had a strong ICT focus with students using iPads in innovative and meaningful learning activities. There were many opportunities for student integration including school camps, sport, whole school excursions and needs based subject integration.
Significant programs and initiatives Homework Centre
The Homework Centre is an integral and essential
component of Strathfield South High School’s
commitment to quality teaching and learning. It
runs on Monday and Thursday afternoons, and is
extremely well patronised with up to 50 students
attending each session.
A range of teachers assist in the Homework
Centre, and their expertise has been augmented
by the school’s participation in the University of
Western Sydney’s Refugee Action Support (RAS)
program. This program supplies current Master
of Teaching Students to schools with a high
refugee cohort, with the aim of providing literary
and numeracy support to these students.
Strathfield South High School welcomed five RAS
tutors in Semester 2 2013, and another six tutors
are in the school for Semester 1 2014.
In 2013, Strathfield South High School was in
receipt of an Equity Grant to fund a HSC Tutorial
Program. This program was merged with the
Homework Centre, and allowed specialist
teachers to tutor at need HSC students both
during term and for holiday classes. Ten HSC
tutorial sessions ran across the July and
September-October school holidays, in which 57
and 50 students respectively were tutored.
Strathfield South High School will continue to in
partnership with the University of Western
Sydney and we seek to expand our relationship
with the tertiary sector in terms of Homework
Centre tutorial support.
A productive Homework Centre. Students can
work independently, one on one with tutors (at
the computers and in the centre left of the
photo), or in small groups with a teacher or
tutor.

13
Mrs Shahettin tutors a group of biology
students, while in the background Mr Staszak
tutors Maths.
Refugee Program
As a school with a significant refugee student
population, Strathfield South High School was
invited to participate in the Refugee Transition
Program (RTP) in 2012. The program is now well
embedded within the school, and assists students
with a refugee background in a number of key
learning areas as well as running programs to
familiarise the target group with workplace
cultures and post-school pathways.
At Strathfield South High School, RTP is not a
discrete program; it is embedded within a range
of school programs and activities. It is run in
consultation with the Year Advisers, the Welfare
Team, the Learning Support Team, and the
designated Deputy Principal. Two key facets of
the RTP are engagement and participation in
whole school events.
In partnership with the NSW government agency
Services for the Treatment and Rehabilitation of
Trauma and Torture Survivors (STARTTS), the
school ran Sporting Linx which was
simultaneously a team-building and positive
behaviour and engagement program. Sporting
Linx program involved students from Years 7 to
10. This program translated into a high level of
referral and attendance at STARTTS holiday
camps. Nine students attended the July camp,
and a further nine students attended a Sport
Leadership camp, which resulted in the
participants receiving Certificates for Grassroots
Coaching, Soccer Coaching Level 1 and
Community Refereeing (Soccer.) The partnership
with STARTTS strengthened the bonds between
the target students, the RTP coordinator and the
school. The students recognised and appreciated
the efforts of the school in securing assistance
and opportunities for them through this external
agency. Sporting Linx will continue to run in 2014.
Funding made available through the Multicultural
Unit has allowed the target group to partake in a
range of whole school activities such as
excursions and workshops by way of covering
their costs. Students were funded to attend
Grade Sport, the ConoccoPhillip Science
Experience at UTS, the excursion to Manly as well
as funded to participate in two whole school
events: the excursion to the Easter Show and
Jamberoo.
In 2013, a group of students undertook a
pathways program called Ready Arrive Work,
which introduced them to Australian work
culture and expectations, as well as familiarising
the students with a range of services in their local
council area. Secondly, a group of HSC students
visited the Universities of Technology and
Sydney, and also had an information session at
TAFE.
To further develop students’ familiarity with
Australian life and law, a group of 25 Year 10
students participated in DARE to be Sensible, a
legal rights and obligations program developed
by Ashfield Metro Migrant Resource Centre. The
students received advice from local Legal centre
and the program culminated with a visit to
Burwood Local Court, Burwood and Auburn
Police Stations. Strathfield South High School will
run this successful program again in 2014.
As many of the target students are interested in a
career in the Australian Defence Forces, a

14
recruitment visit was organised in Term 4. This
event was extremely well attended.
As part of the school’s outreach program, a
community evening was held in Auburn, the
suburb in which the bulk of the refugee students
live. By moving a school event to an off-school
location in the locality of the parents, was a
major step in deepening the ties between the
school and its community. 2014 will witness more
Auburn Parents Evenings, with a range of guest
speakers and workshop to familiarise parents
with the Australian education system, customs
and opportunities.
Finally, the RTP targets literacy and numeracy
through a number of programs. Year 7 and 8 RTP
students received academic and language
support through three programs: Year 7
Quicksmart Literacy and Numeracy Program, Year
8 Thinksmart Literacy Program, and a specialised
Year 7 and 8 reading program, run in connection
with National Partnership funding.
The second aspect of literacy and numeracy
support is the RAS program. Integrated into the
Homework Centre, the Refugee Action Support
(RAS) program from the University of Western
Sydney offers academic assistance to students
through individual or small group tutoring. The
RAS tutors joined the Year 10 RTP students who
had attended the Homework Centre on an
excursion to Shelly Beach, Manly.
Auburn Parents’ Meetings in 2013
15
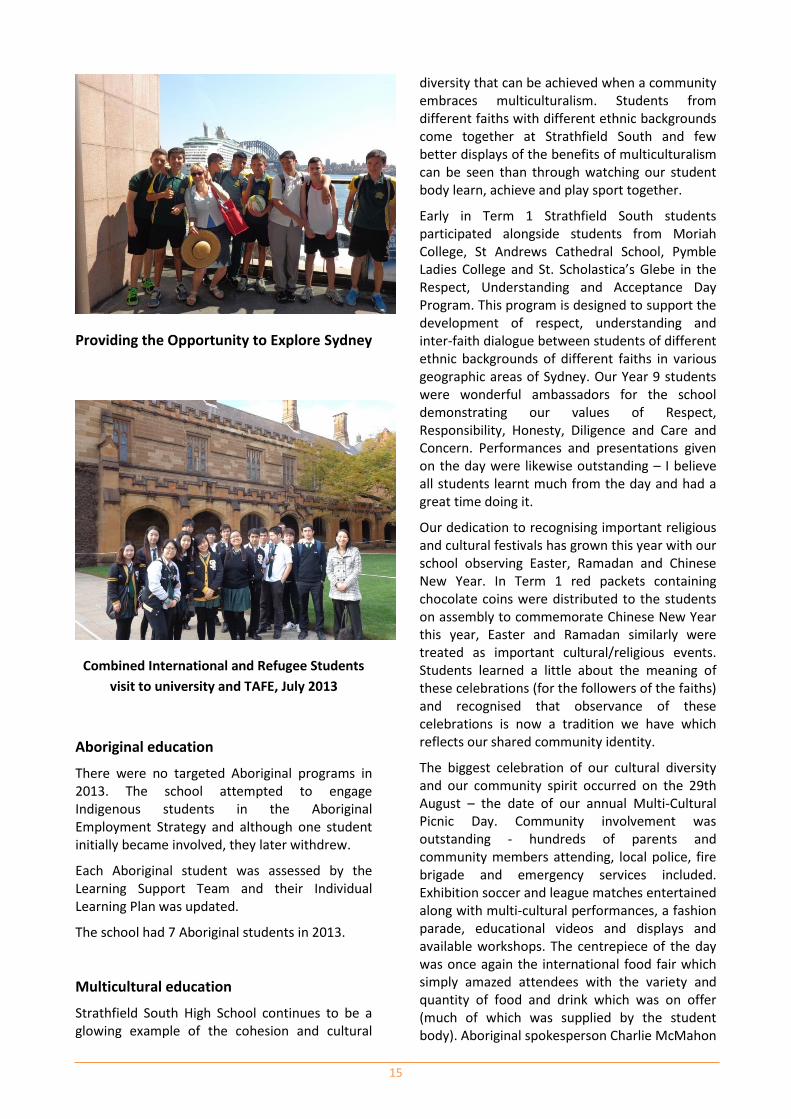
Providing the Opportunity to Explore Sydney
Combined International and Refugee Students
visit to university and TAFE, July 2013
Aboriginal education
There were no targeted Aboriginal programs in 2013. The school attempted to engage Indigenous students in the Aboriginal Employment Strategy and although one student initially became involved, they later withdrew.
Each Aboriginal student was assessed by the Learning Support Team and their Individual Learning Plan was updated.
The school had 7 Aboriginal students in 2013.
Multicultural education
Strathfield South High School continues to be a glowing example of the cohesion and cultural
diversity that can be achieved when a community embraces multiculturalism. Students from different faiths with different ethnic backgrounds come together at Strathfield South and few better displays of the benefits of multiculturalism can be seen than through watching our student body learn, achieve and play sport together.
Early in Term 1 Strathfield South students participated alongside students from Moriah College, St Andrews Cathedral School, Pymble Ladies College and St. Scholastica’s Glebe in the Respect, Understanding and Acceptance Day Program. This program is designed to support the development of respect, understanding and inter-faith dialogue between students of different ethnic backgrounds of different faiths in various geographic areas of Sydney. Our Year 9 students were wonderful ambassadors for the school demonstrating our values of Respect, Responsibility, Honesty, Diligence and Care and Concern. Performances and presentations given on the day were likewise outstanding – I believe all students learnt much from the day and had a great time doing it.
Our dedication to recognising important religious and cultural festivals has grown this year with our school observing Easter, Ramadan and Chinese New Year. In Term 1 red packets containing chocolate coins were distributed to the students on assembly to commemorate Chinese New Year this year, Easter and Ramadan similarly were treated as important cultural/religious events. Students learned a little about the meaning of these celebrations (for the followers of the faiths) and recognised that observance of these celebrations is now a tradition we have which reflects our shared community identity.
The biggest celebration of our cultural diversity and our community spirit occurred on the 29th August – the date of our annual Multi-Cultural Picnic Day. Community involvement was outstanding - hundreds of parents and community members attending, local police, fire brigade and emergency services included. Exhibition soccer and league matches entertained along with multi-cultural performances, a fashion parade, educational videos and displays and available workshops. The centrepiece of the day was once again the international food fair which simply amazed attendees with the variety and quantity of food and drink which was on offer (much of which was supplied by the student body). Aboriginal spokesperson Charlie McMahon

16
spoke and performed on the day alongside our own school dance troupe as well as students demonstrating the Hula, the Haka and a display of Lebanese drumming and dancing. The welfare team and in particular Mr Gurto should be congratulated on another fine effort 2013.
The introduction of the National curriculum next year will see Aboriginal and Multi-cultural education outcomes embedded with greater relevance into teaching programs (as they are revised to meet syllabus requirements) and likewise learning about Australia’s involvement with Asia will grow in importance. Along with the various other programs and experiences we have on offer it places Strathfield South truly at the forefront of multi-cultural education in the 21st Century.
Solar Car Program
The school again enjoyed significant success in the University of New South Wales Sunsprint Model Solar Car Competition, reaching the National finals for the third year in a row and gaining second place for the second consecutive year.
In 2013, the program’s director, HT Science Steven So, built upon the school’s partnership with the University of Western Sydney by facilitating three of our Year 10 students to work with UTS technicians on the development and creation of a full-scale solar vehicle which was raced from Darwin to Adelaide in the September-October school holidays in participation with the Global Solar Challenge. Strathfield South High School was only one of two high schools (and the only Australian school) to participate in the race, which was otherwise dominated by universities as prestigious as Cambridge and Stanford.
The school is looking to expand its relationship with UWS in the coming years and exploring the possibilities of scholarships and other tertiary opportunities for our students post-school. The Solar Car program has gained great international prestige for our school and is a credit to the capacity of Mr So and the team of students he leads.
Technology Tutors Initiative
In 2013, the school forged a partnership with Strathfield Council to prepare and present a
‘Technology Tutor’ program to local senior citizens. This involved twelve students and a teacher, Ms Palpasa Shrestha, helping older community members more effectively use their mobile phones, digital cameras, laptops, tablets and other technological devices during Tuesday afternoon sessions.
The program was so successful that it has now become a permanent fixture in Strathfield Council’s delivery of services, and the school was awarded a $4000 prize for community involvement from Wests Ashfield in recognition of the school’s contribution to the lives of local community members.
Goodstart Early Learning Partnership
From mid-year 2013 a small group of our students began supporting staff at Goodstart Early Learning Centre in Bankstown as both a community outreach program and an educational extension to their studies of Early Childhood.
This program, coordinated by Mr Paris Hadjisocratous, was awarded a certificate for Innovative Curriculum and provided an excellent ‘hands-on’ opportunity for students interested in early childhood careers to gain skills related to the vocation.
Grade Sport
The school gained entrance into the Bankstown Zone Sports Competition for the 2013 Season. For our first year, SSHS entered 7 representative teams on a weekly basis, won 12 Zone Grand Finals and had 24 students represented the region in sports such as Soccer, Rugby League, Touch & Tennis.
Our girls Rugby League Team were crowned State Champions for the second year in a row, which was an outstanding achievement.
Recreational Sport
Students for the first time in the school’s history were offered options for Recreational Sport. Activities given were Gym, Ten Pin Bowling, Walking, Badminton, Boot Camp, Boxing, Kodu, Chess, Craft, Dance and Music Groups. These gave students options to choose activities they are interested in and they engaged in sport in an enthusiastic manner.

17
GAT Program (Rugby League/Gym)
The Gifted and Talented Rugby League/Gym Program is targeted at students who excel as an athlete and the program supports them in their conquest for bettering themselves in Health and Fitness.
The program has twenty students in it and they attend the gym on a fortnightly basis for specialised training sessions.
Dance Program
The Dance Program has 20 girls and boys who get taught by a professional Dance Teacher every Monday morning for an hour.
The Dance Team has come a long way and they perform at events such as Assemblies, Open Days, school Promotional Evenings and at local primary schools.
The Dance Team also goes to local primary schools and teach junior students Dance routines to give them a sense of Leadership through mentoring people.
NSW Touch, AFL & ARL Affiliation Programs
The NSW Touch, AFL and ARL Affiliation Programs are links with organisations were students who are involved in elective subjects, have the opportunity to partake in activities like event management, refereeing, coaching, scorers, caterers and general assistants at events run by these three organisations.
It gives our students opportunities to get first hand experience in the areas of their future interest.
National Partnerships
The Improving Literacy and Numeracy National Partnership uses evidence based approaches to lift the performance of students in Literacy and Numeracy. The Partnership recognises the importance of:
• A whole school approach to quality teaching
• inspirational leadership towards a culture of continuous school improvement
• using evidence and data to identify and address students' needs, using the most effective resources
• building capacity through professional learning
• collaboration and shared responsibility.
The Federal and State Governments have made Literacy and Numeracy a priority in schools. To facilitate this priority, significant amounts of money have been allocated to some schools to develop programs which address literacy and/ or numeracy needs. Strathfield South High School was fortunate to be one of the schools which were granted funding to help address literacy needs. This money was allocated to the school in term 2 2013. Further funding is to be allocated in 2014.
To assist with planning, a committee was formed and an action plan developed in term 2. The main focus of the action plain was across 2 main areas – improving teacher understanding of literacy teaching in classrooms and secondly, assisting individual students who may need extra support with reading and comprehension.
During terms 2 and 3 all staff were in serviced in literacy development using the Literacy Continuum K-10. This continuum was developed by the NSW Department of Education and Communities and shows teachers what students should be able to do at each Year level from kindergarten through to year 10 in literacy. Staff were workshopped in the possible applications of the continuum for their own subject area and asked to develop ideas on how to assist students in their classes. All staff then attended a professional development day which was devoted to Literacy teaching and were given time to consider lesson development in their subject areas using literacy strategies. During terms 3 and 4, all staff were given the opportunity to have programming days in which literacy strategies were incorporated into their programming for the new syllabuses which will be introduced progressively from 2014.
Alongside this professional learning, a reading teacher has been employed by the school to work with individual students who require extra support in reading and comprehension. To further support individual students who need additional assistance, 5 teachers at the school have been trained in reading and comprehension
18
approaches –MULTI LIT- these teachers will work with students this year and next.
Funding was also used to purchase resources for the library and for each Learning Area which all students can use.
At the conclusion of 2013, the school reported on the achievement levels of students across Years and 8 in Reading and Comprehension – for many students this resulted in marked improvement from initial testing in March of 2013. Strathfield South High School will continue to work with the funding allocation for 2014 to further strengthen and develop teacher quality and student learning outcomes in Literacy.
Priority Schools Program (PSP)
The school received additional funding of $85000 and additional staffing of 1.5 under the Priority Schools Program for 2013. The resources were focused on three areas:
Development of Literacy and Numeracy
skills
Student Engagement
Community connectedness
The Quicksmart program continued and was
expanded in 2013 through the training of two
extra staff members to deliver targeted literacy
development to identified students.
A mentoring program was established to work
with students at risk of disengaging with learning,
and this focused of both the social and academic
aspects of engagement for students. In Term 4 of
2013, this program was expanded to work with
older students who displayed very poor literacy
skills.
A Dari-speaking Community Liaison Officer was
employed to more effectively engage with our
Afghan community, and regular community
meetings were established in Auburn to further
develop the school’s connection with this
significant population.
School planning and evaluation 2012—2014
Progress in 2013
School priority 1
Literacy and Numeracy
Outcomes from 2012–2014
• An increase of 3% in the percentage of students in Year 9 attaining expected growth in NAPLAN Reading.
• An increase of 3% in the percentage of students in Year 9 attaining expected growth NAPLAN numeracy.
• An increase of 5% from 76.1% to 81.1% in the percentage of students at or above minimum standard in the Year 9 NAPLAN Reading examinations.
• An increase of 4.2% from 3.7% to 7.9% in the percentage of students who attain proficiency on the Year 9 NAPLAN Reading examinations.
• An increase of 1.6% in the percentage of students at or above minimum standard in the Year 9 NAPLAN numeracy examinations.
• An increase of 3.2% in the percentage of students who attain proficiency on the Year 9 NAPLAN numeracy examinations
Evidence of progress towards outcomes in 2013:
ILPs developed for students with poor growth in Literacy and Numeracy using NAPLAN data and other testing. These ILPs are then used to place students more appropriately so that they can access additional in-class support.
Intensive LAST support of under-performing students to assist with development and consolidation of basic Literacy skills in targeted students.
Further staff received training in Quicksmart in order to provide focused literacy support for students identified as being in need of this.
2013 NAPLAN results indicated a general improvement of 3.5% across Literacy testing and a 2.5% improvement in Numeracy.

19
Introduction of a targeted numeracy mentoring program to support students who have made the least progress in numeracy testing.
Strategies to achieve these outcomes in 2014
Embedding of explicit Literacy and Numeracy strategies in all programs was achieved in 2013.
Expansion on the Quicksmart and Thinksmart programs through additional staff being trained to take on a supporting role for students with literacy and numeracy difficulties.
School priority 2
Student Engagement and Attainment
Outcomes from 2012–2014
• The creation of ILPs for students at risk.
• Decrease of 5% in the number of N Awards given to students.
• Decrease of 3% in the fractional truancy.
• Decrease of 2% in the number of negative issues reported.
• Increase of 2% in the number of positive issues reported.
• Increase of 1% in attendance rates.
• Increase of 5% in the number of awards given to students.
Evidence of progress towards outcomes in 2013:
ILPs continued to be created and utilised to support students. This process was undertaken by the Learning Support Team.
The N-Award system was refocused to make it less punitive and more supportive in nature, resulting in a significantly higher number of students completing courses successfully. A major focus was placed on the early engagement of parents in this process.
Decreases in Fractional Truancy and Negative incident reporting is difficult to ascertain, as this target coincides with the implementation of a new record-keeping system which staff were strongly encouraged to use. This resulted in a
seeming increase in the number of incidents, but is actually indicative of more effective recording of incidents.
Attendance rates recorded an improvement of slightly more than 1%.
Merit and Star Awards continued to be issued to large numbers of students, although it was identified that the school needs to find ways in which to engage older students in the Merit system.
Strategies to achieve these outcomes in 2014:
Creation of internal time and space (sport afternoons) for Senior students to complete outstanding work to avoid N-Awards.
Expansion of staff participation in the Homework Centre to ensure representation by all faculties.
The revision of fractional truancy and discipline policies by the Welfare Team to refine and improve existing processes.
School priority 3
Aboriginal Education
Outcomes from 2012–2014
• Indigenous students achieve national benchmarks for literacy and numeracy and 75% of indigenous students equal or better expected growth in NAPLAN testing.
• 1% increase in the attendance of indigenous students.
• All senior indigenous students attain school credentials or successfully transition into further education or the work force.
Evidence of progress towards outcomes in 2013:
The school’s very small cohort of indigenous students (7 individuals) made it difficult to measure NAPLAN progress, given that only 2 students sat for the examinations in 2013.
Attendance of Indigenous students was slightly higher than for non-Indigenous in 2013.
One Indigenous student sat for and successfully completed the HSC in 2013.
20
Strategies to achieve these outcomes in 2014:
Ongoing monitoring of Aboriginal students and refinement of their ILPs to ensure that all educational needs are being met.
Encouragement of Senior Indigenous students to seek election to Student Leadership positions
Ongoing connection to Aboriginal families and community to reinforce the value of education for Indigenous students with a particular focus on attaining the HSC
School priority 4
Leadership and Management
Outcomes from 2012–2014
• Establish processes for the implementation of the Australian Curriculum in all KLAs
• Develop processes for the review of differentiation practices across all KLAs
• Develop processes for the review of teacher quality across all faculties.
• Creation of Classroom Protocol
• Creation of Whole School Pedagogical Statement
• All staff to be involved in teams which monitor the school plan and the fulfillment of its associated targets.
• Various school teams to develop their own processes for monitoring and review.
• EOI procedures to be offered across the whole staff in order to increase opportunities.
• All roles to be offered for EOI on two year rotation, in order to increase opportunities.
• Increase by 5% the number of students taking on leadership roles.
• Broaden the opportunities for students to be involved in leadership training opportunities through the exploration of external groups and what they offer.
• Ensure that students are represented on each team around the school. (eg. Welfare Team, LAS Team, PBL Team)
• Creation of processes for the development of peer mediation and student led anti-bullying procedures.
• Establishment of a Whole School Professional Learning Plan to enhance staff professional development.
• Establishment of an explicit EARS process.
• Creation of staff roles and responsibilities statements.
• Creation of a Leadership Development Program aimed at prospective DPs
Evidence of progress towards outcomes in 2013:
• Progress was made in ensuring that all faculties were ready for the implementation of the Australian Curriculum, led by the Learning Support Team and DP Ric Cilona.
• The focus on National Partnerships in 2013 led to a rewriting of the school plan and the reallocation of many planned elements for 2013 to 2014, especially those relating to assessment and differentiation.
• A CV writing course and Interview Techniques program was delivered for casual and temporary classroom teachers seeking permanency.
Strategies to achieve these outcomes in 2014:
• Professional Learning focus on differentiation
• Creation and implementation of the Classroom Protocol
• Implementation of new TARS/EARS in line with new DEC and Teachers Federation guidelines.
School priority 5
Curriculum and Assessment
Outcomes from 2012–2014
• Rewriting of all assessment schedules to reflect both the National Curriculum and the new delivery of the HSC.
• Faculties redevelop their programs and assessment documentation to embody the new National Curriculum.
Review of ICT and how it is embedded

21
• Collaborative development of Faculty Plans
• Alignment of faculty plans to the needs of Australian Curriculum and teaching and learning program development.
• Alignment of teaching and learning programs to cross curricular outcomes as per Australian Curriculum
• Implementation of new assessment and reporting procedures
• Review of differentiation across all KLAs and development of procedure for the refinement of differentiation practice.
• Review of opportunities for extra-curricular activities including: GAT programs, Activity days, Refugee Transition Program, External organisations
• Increase student access to alternative educational settings
• Reintroduce TVET to SSHS and increase the number of VET options available at the school.
Evidence of progress towards outcomes in 2013:
• A major revision of assessment procedures was undertaken by a committee led by John Falvo, HT Social Sciences and with full KLA representation. This resulted in a ‘best practice’ document being created with exemplars of assessment tasks all fitting to an established proforma that will be used across the school from 2014.
• National Partnerships funding was used to release staff for programming according to new proformas which were introduced, discussed, evaluated and accepted in 2013. By the end of the year all faculties had rewritten a significant proportion of their programs including all Australian Curriculum documents.
Strategies to achieve these outcomes in 2014:
• Differentiation will be the school’s primary pedagogical focus in 2014. The 2013 processes and templates for programming and assessment will form the basis of this.
• GAT delivery will be evaluated in 2014 and amended to embrace a wider range of students with different specialities.
• Two staff members completed training in Sports Caching VET to broaden curriculum choices for students.
Professional learning
Professional Learning in 2013 was centred around the implementation of the National Curriculum and improvements in Literacy and Numeracy through National Partnership funding.
A total of $81,000 from National Partnership funding was allocated to staff Professional Learning. Of this, $61,000 was allocated to staff release, including the release of Deputy Principal Ric Cilona to oversee and provide quality control to the Professional Learning programs.
Staff worked with Mr Cilona in reprogramming to ensure that teaching programs reflected all elements required by the new curriculum, including the explicit teaching of literacy skills in all subject areas.
An additional $30,000 was allocated for the purchase of new teaching resources, particularly those developed for the Australian Curriculum.
About this report
In preparing this report, the self-evaluation committee has gathered information from evaluations conducted during the year and analysed other information about the school's practices and student learning outcomes. The self-evaluation committee and school planning committee have determined targets for the school's future development.
Simon Paterson (Relieving Principal)
Ric Cilona (Deputy Principal)
John Falvo (Relieving Deputy Principal)
Belinda Nicholls (Relieving SAM)
Christina Cotis (Relieving LAST)
Anette Bremer (Refugee Students’ Coordinator)
Mark Bentley (HT English)
Nathan Gray (HT PDHPE)
Joe Gurto (Acting HT TAS and Welfare Coordinator)
Peter Kerr (HT Support)
Ellen Letsios (Relieving HT CAPA)

22
Martin Mansfield (HT History)
Diana Pasalic (HT Administration)
Fotis Poulios (HT Maths)
Steven So (HT Science)
School contact information
Strathfield South High School
43 Hedges Avenue
Enfield NSW 2136
Ph: 9642 4422
Fax: 9742 5942
Email: [email protected]
Web: http://web1.strathfies-h.schools.nsw.edu.au
School Code: 8252
Parents can find more information about Annual School Reports, how to interpret information in the report and have the opportunity to provide feedback about the report at:
http:// www.schools.nsw.edu.au/asr