Embed Size (px)
Citation preview

Virgin Islands Water Resources Research InstituteAnnual Technical Report
FY 2015
Virgin Islands Water Resources Research Institute Annual Technical Report FY 2015 1

Introduction
The United States Virgin Islands (USVI) is a Territory of the United States of America and consists of a groupof several islands and cays located in the Lesser Antilles which separate the Atlantic Ocean and the CaribbeanSea. The USVI is about 1,200 miles southeast of Miami, Florida and 80 miles east of Puerto Rico. Theprincipal islands in the USVI are St. Croix, St. Thomas, St. John and Water Island. Several of the othersmaller islands in recent years have undergone various stages of development. In total, the islands have acombined area of approximately 137 square miles, are of volcanic origin and are mountainous. Tourism is theprincipal source of support for the economy.
With an annual rainfall of just over 40 inches, the USVI is one of the few places in the world where rain waterharvesting is required by law. Buildings are constructed with cisterns that are sized and managed to provide areliable and relatively safe water supply for users. Because of the hilly terrain, there are virtually no naturalsurface water supplies. Ground water is limited due to the geology and the risk of salt-water intrusion thatcould occur from coastal wells. The increasing potable water demands are met largely through use ofdesalination plants that provide water to the public water distribution systems. The islands experiencechallenges in collecting and disposing wastewater and water conservation and increasing efficiency inwater-use are critical components of effective water resources management in the USVI.
The Virgin Islands Water Resources Research Institute (VI-WRRI) is hosted by the University of the VirginIslands (UVI). UVI is the Territory’s only institution of higher education and has campuses on the islands ofSt. Croix and St. Thomas and a research station on St. John. It is a Historically Black College or University(HBCU) and a land-grant institution. It was started in 1962. Though UVI is primarily an undergraduateinstitution, it offers graduate programs in teacher education, business administration, public administration,marine and environmental science and mathematics for secondary education teachers. The University’sdemographics reflect the local population in that it consists of a diversified mix of USVI residents and personsfrom the Caribbean region, the United States’ mainland and other areas of the world.
The VI WRRI maximizes all resources available to it to serve the water resources research, informationdissemination and training needs of the people of the U. S. Virgin Islands that might otherwise not be apriority in other settings. It works collaboratively with other units at UVI, with researchers in the U.S.Geological Survey’s Islands Region and others, to address issues of local, regional, national, and internationalimportance. Areas of focus in the past have included quantity and quality issues of water harvesting,development of alternative on-site sewage disposal systems and non-point source pollution in islandenvironments. This year’s projects investigated the use of rooftop surfaces as a means to improve the qualityof harvested rainwater, examined the influence of land-based discharge on lagoonal water quality, developededucational material to increase U.S. Virgin Islands youth awareness of the importance of water and itsconservation, and provided support for a joint conference held in Hawaii in December 2015 of the four islandWater Resources Research Institutes (U.S. Virgin Islands, Puerto Rico, Hawaii, and Guam).
Introduction 1

Research Program Introduction
The Virgin Islands Water Resources Research Institute at the University of the Virgin Islands supported tworesearch projects in the FY2015 VI-WRRI program year. This year’s projects investigated the use of rooftopsurfaces as a means of improving the quality of harvested rainwater and examined the influence of land-baseddischarges on the water quality of a coastal lagoon. Of the two research projects, one was implemented on St.Croix and one with a collaborator at the University of Puerto in Mayaguez, Puerto Rico. Summaries of theseprojects follow.
Research Program Introduction
Research Program Introduction 1

Engineered Pervious Layer for Rooftop Rain Harvesting andSolar/Dark Inactivation of E. coli
Basic Information
Title: Engineered Pervious Layer for Rooftop Rain Harvesting and Solar/Dark Inactivationof E. coli
Project Number: 2015VI251BStart Date: 3/1/2015End Date: 2/28/2016
Funding Source: 104BCongressional
District:Research Category: Water Quality
Focus Category: Water Quality, Water Use, TreatmentDescriptors: None
PrincipalInvestigators: Sangchul Hwang, Henry H. Smith
Publications
Soto-Pérez L., S. Hwang, 2016, Mix design and pollution control potential of pervious concrete withnon-compliant waste fly ash, Journal of Environmental Management, accepted for publication Mar2016.
1.
Soto-Pérez L., V. Lopez, S. Hwang, 2015, Response surface methodology to optimize the cementpaste mix design: time-dependent contribution of fly ash and nano-iron oxide as admixtures, Materials& Design, 86, 22-29.
2.
Jo M., L. Soto, M. Arocho, J. St John, S. Hwang, 2015, Optimum mix design of fly ash geopolymerpaste and its use in pervious concrete for removal of fecal coliforms and phosphorus in water,Construction & Building Materials, 93, 1097-1104.
3.
Engineered Pervious Layer for Rooftop Rain Harvesting and Solar/Dark Inactivation of E. coli
Engineered Pervious Layer for Rooftop Rain Harvesting and Solar/Dark Inactivation of E. coli 1

ENGINEERED PERVIOUS LAYER FOR ROOFTOP RAIN HARVESTING AND
SOLAR/DARK INACTIVATION OF E. COLI
Problem and Research Objectives
Rain harvesting and reuse have been a principal source of potable water for the residents
of the United States Virgin Islands (USVI). As rainfall is very seasonal, over 50% of the USVI
residents rely on cistern rainwater. It should be noted that rainwater is not contaminant-free
(Houston et al., 2012). Contamination can occur in rainwater before it is collected to the cisterns
due to urban pollution, bird and reptile waste materials, roof material deterioration, and
particulate matter deposition (Evans et al., 2006; Lee et al., 2012). Chemical and microbiological
contamination have also been reported in cistern water (Al-Khatib and Arafat, 2009; Crabtree et
al., 1996).
Engineered pervious layer (EPL) would benefit many communities that rely on rainwater
as their potable water source (e.g., USVI). EPL has two-fold benefits. First, the pervious property
of EPL serves as rainwater drainage with additional potential for the reduction of large particles
and organic and inorganic contaminants (Luck et al, 2008; Mbabaso et al., 2013). Second,
pathogens potentially present in rainwater will be removed and inactivated with the topical
photocatalytic reactions of nano-titanium dioxide (nTiO2) coated on the EPL in the presence of
sunlight in daytime and the antimicrobial inactivation by nano-zinc oxide (nZnO) embedded in
depth of the EPL in nighttime (Sanchez and Sobolev, 2010). In addition, rainwater retained in the
meso- and micro- pores in EPL will reduce energy consumptions used for building cooling by
the latent heat of moisture evaporation (Santamouris, 2010).
Methodology
The major components of EPL were nanomaterials (nTiO2, nZnO, nano-iron oxide
(nFe3O4)), gravels (4.75 - 9.5 mm), coal fly ash (FA) and ordinary Portland cement. In order to
be pervious, EPL did contain fine aggregates (i.e., sand). nTiO2 was the key component for the
photocatalytic oxidative removal and inactivation of coliforms in sun-lit water, whereas nZnO
was added to EPL to utilize their antimicrobial properties in the dark (Ge et al., 2012). Powder
nTiO2 (anatase, 18 nm) and nZnO (10-30 nm) were purchased from US nanomaterials (Houston,
TX). Potential reductive contaminant removal was assessed with nFe3O4 that was composed of
(in % vol.) nominal 10-nm magnetite (2.8-3.5), proprietary surfactant(s) (2.0-4.0), and water
(92.5-95.2). nFe3O4 was purchased from Ferrotec (Bedford, NH). nTiO2 was coated on the
surface of the EPL after curing, whereas nZnO and nFe3O4 were integrally mixed in the EPL
mixture. The BASF Glenium 3030 NS water-reducing admixture was supplied by a local
company in Puerto Rico.
EPL specimens in triplicate were made in a 24 face centered, central composite design
(Table 1). The four factors were the water-to-binder (W/B), fly ash-to-binder (FA/B), nFe3O4-to-
binder (ENP/B) and water reducer-to-binder (WR/B) ratios. The binding material is the total of
the powder materials (i.e., cement + FA).
The mixtures were prepared in a mechanical mixer and then transferred to cylindrical
molds of 20.32 cm in length and 10.16 cm in diameter. Compaction of the specimens was made
using a rod in accordance to ASTM C192. After 24 hours, specimens were demolded and cured
for 28 days in lime-saturated tap water at ambient temperature (24±2 oC).

Table 1. Four factor Central Composite Design.
Levels
Factors Axial Low Center High Axial
W/B 30 32 34 36 38
FA/B 0 10 20 30 40
ENP/B 0 1.7 3.4 5.1 6.8
WR/B 0 0.4 0.8 1.2 1.6
In accordance to ASTM C39, compressive strength was tested for the pervious concrete
specimens after they were cured for 28 days in Ca(OH)2-saturated tap water. Capping rubber
pads (Gilson HM-370) were placed during the compressive strength test on the top and bottom
sides of the specimens to provide a uniform load distribution by a 3000 kN Forney universal
testing machine. The permeability of the samples was measured by quantifying the flow of water
passing through the specimen, under a constant head difference. ASTM D2434 was modified to
accommodate the experiment with EPL specimens.
For the assessment of E. coli and total coliform inactivation, two specimens were made
with the optimum EPL mixture with an addition of 3% of nZnO. An acrylic mold with
measurements of 30 cm in width x 30 cm in length x 5 cm in depth was used to cast the slab
specimens. After demolding at 24 hours, the specimens were cured in lime saturated water for 28
days. nTiO2 coating was applied to the optimum and control mixtures to determine coliform
inactivation of the mixture with and without the coating.
Coliform-containing water was applied to EPL and the harvested water in the sun-lit or
dark condition was tested for E. coli and total coliform concentration. EPL without nanoparticle
addition was tested as a control under the same experimental conditions. The system was set up
inside an environmental chamber equipped with a solar simulator and rainwater application unit
(Figure 1). A solar simulator was used as the light source of the sunlight for the photo-catalytic
inactivation of bacteria by nTiO2. For the dark inactivation of bacteria by nZnO, the experiment
was run without the light in the environmental chamber.
Figure 1. Environmental chamber equipped with rainfall and solar simulation.

E. coli and total coliforms were quantified by a membrane filtration technique with a 0.45
μm membrane filter. The filtered membrane was put in the petri dish containing m-ColiBlue24®
from the HACH Company and then it was incubated at 35˚C for 24 hours. Blue colonies were
reported as E. coli, while the sum of the blue and red colonies were reported as total coliforms.
Principal Findings and Significance
Optimized mix design: Numerical optimization of the independent variables for the EPL
specimens was performed to identify the combination of variable settings that equally maximize
the compressive strength while targeting the water permeability at 8 mm/s. Results showed that
the combination of 34% W/B, 30% FA/B, 3% ENP/B and WR/B resulted in a permeability of
8.45 mm/s and a compressive strength of 13.8 MPa (Figure 2).
Figure 2. Optimization results of EPL specimens.
This optimum mixture composition and an addition of 3% of nZnO was used to make the
EPL as shown in Table 2. The coating of nTiO2 was done by mixing 50% of cement with 50% of
the nanoparticles, with a W/B ratio of 95%.
Table 2. Mixture composition of EPL slabs.
Sample
ID W/B FA
ENP
(nFe3O4) nZnO WR
nTiO2
Coating
S1A 34 30 3 3 0.8 Yes
S1B 34 30 3 3 0.8 No
C1A 34 0 0 0 0 Yes
C1B 34 0 0 0 0 No
Water quality: A very low inactivation of bacteria was achieved during most of the
experiment due to the low contact time provided. After seven days of experiment, contact time

was increased by closing the end corner of the slab and allowing water to exit by overflow over
the slab. Figures 3a and 4a show that after the retention time increment, during the day time
simulation both E. coli and total coliforms inactivation was slightly improved. No reliable
relationship was observed between bacteria inactivation and surface coating of the EPL with the
nTiO2. Surface coating didn’t work under this experimental condition probably due to the short
contact time of the wastewater and the nTiO2 coating as it only passed through the surface.
Another reason might be that the approximate ~4,000 lux emitted by the light source was not
strong enough to activate the photocatalytic activity of the nTiO2, in comparison to the ~14,090
lux that can be obtained from direct sun light in a regular day in Puerto Rico. On the other hand,
nZnO seems to be working as a night time bacteria inactivator, since specimens S1A and S1B
achieved total coliform inactivation in the range of 25 to 45% along the experiment (Figure 3).
Figure 3. Total coliform reduction in water after treatment with the EPLs during (a) day and (b)
night simulation.
It is important to notice that coliform inactivation was achieved better at higher water pH,
as has been shown in previous experiments. Calcium hydroxide (CH) is one of the principal
hydration products of concrete and is highly soluble in water, contributing to the high alkalinity
of concrete (Mehta and Monteiro, 2014). After treating the wastewater with the EPLs, pH
slightly increased. A notable decrease in the pH was observed as time passed, independent of the
increase in contact time. The main reason for this behavior is that the CH was washed off the
specimens, thus decreasing the pH of the resulting water as time passed. The water treated with
the SIA and SIB specimens resulted in slightly higher pHs than the C1A and C1B specimens.
Conclusions
Mix design with 34% W/B, 30% FA/B, 3% ENP/B and WR/B resulted in a permeability
of 8.45 mm/s and a compressive strength of 13.8 MPa.
The increment of W/B and WR/B resulted in a decrease of the permeability of the
specimens due to drainage of the binder material and clogging of the bottom of the
specimens.
Compressive strength increased with the decrease of permeability due to pore structure
reduction of the specimens.
Surface coating of nTiO2 didn’t work as a photocatalyst for coliform inactivation.
The incorporation of nZnO into the EPL had a positive effect as a coliform inactivator in
night time.

Despite the potential of coliform inactivation with the incorporation of nZnO, the water
infiltrated through the EPLs had alkaline pHs. Therefore, additional unit processing of pH
neutralization is needed. However, it is recommended to assess the EPLs made of a different
mixture containing a less alkaline but pozzolanic material, such as metakaoline, in order to
eliminate the neutralization process. Use of light-weight aggregates is also recommended to
facilitate placement of EPLs on the roof.
References
Al-Khatib, I.A., H.A. Arafat. 2009. Chemical and microbiological quality of desalinated water,
groundwater and rain-fed cisterns in the Gaza strip, Palestine. Desalination 249, 1165-
1170.
Crabrtee, K.D., R.H. Ruskin, S.B. Shaw, J.B. Rose. 1996. The detection of Cryptosporidium
oocysts and Giardia cysts in cistern water in the U.S. Virgin Islands. Water Research 30,
208-216.
Evans, C.A., P.J. Coombes, R.H. Dunstan. 2006. Wind, rain and bacteria: The effect of weather
on the microbial composition of roof-harvested rainwater. Water Research 40, 37-44.
Ge, Y., J.P. Schimel, P.A. Holden. 2012. Identification of Soil Bacteria Susceptible to TiO2 and
ZnO Nanoparticles. Applied and Environmental Microbiology 78, 6749-6758.
Huston, R., Y.C. Chan, H. Chapman, T. Gardner, G. Shaw. 2012. Source apportionment of
heavy metals and ionic contaminants in rainwater tanks in a subtropical urban area in
Australia. Water Research 26, 1121-1132.
Lee, J.Y., G. Bak, M. Han. 2012. Quality of roof-harvested rainwater – Comparison of different
roofing materials. Environmental Pollution 162, 422-429.
Luck, J.D., S.R. Workman, M.S. Coyne, S.F. Higgins. 2008. Solid material retention and nutrient
reduction properties of pervious concrete mixtures. Biosystems Engineering 100, 401-
408.
Mbanaso, F.U., S.J. Coupe, S.M. Charlesworth, E.O. Nnadi. 2013. Laboratory-based
experiments to investigate the impact of glyphosate-containing herbicide on pollution
attenuation and biodegradation in a model pervious paving system. Chemosphere 90,
737-746.
Metha, P., P. Monteiro. 2014. Concrete microstructure, properties and materials. 4th Ed.
McGraw-Hill Education.
Sanchez, F., K. Sobolev. 2010. Nanotechnology in concrete – A review. Construction and
Building Materials 24, 2060-2071.
Santamouris, M. 2010. Using cool pavements as a mitigation strategy to fight urban heat
island—A review of the actual developments. Renewable and Sustainable Energy
Review 26, 224-240.

Influences of Watersheds Inputs on Water Quality andBioluminescent Dinoflagellates in Mangrove Lagoon, St.Croix, USVI
Basic Information
Title: Influences of Watersheds Inputs on Water Quality and Bioluminescent Dinoflagellatesin Mangrove Lagoon, St. Croix, USVI
Project Number: 2015VI252BStart Date: 3/1/2015End Date: 2/28/2016
Funding Source: 104BCongressional
District: VI
Research Category: Water QualityFocus Category: Nutrients, Sediments, Water Quality
Descriptors: NonePrincipal
Investigators: Bernard Fernando Castillo, James Linehan Pinckney
Publication
Reale-Munroe, Kynoch, Bernard Castillo II and James Pinckney, 2016. Influences of WatershedsInputs on Water Quality and Bioluminescent Dinoflagellates in Mangrove Lagoon, St. Croix, USVI inUVI Research Day 2016. St. Croix, VI.
1.
Influences of Watersheds Inputs on Water Quality and Bioluminescent Dinoflagellates in Mangrove Lagoon, St. Croix, USVI
Influences of Watersheds Inputs on Water Quality and Bioluminescent Dinoflagellates in Mangrove Lagoon, St. Croix, USVI1

INFLUENCES OF WATERSHED INPUTS ON WATER QUALITY AND
BIOLUMINESCENT DINOFLAGELLATES IN MANGROVE LAGOON, ST.
CROIX, USVI
Problem and Research Objectives
Bioluminescent bays and lagoons, which are often referred to as ‘biobays’ are rare
and natural phenomena. Currently, reports suggest that there are approximately four to six
year-round bioluminescent bays that remain worldwide (Seliger and McElroy 1968, Sastre et
al. 2013, Zimberlin 2013). Depending on a myriad of natural and anthropogenic
environmental factors (e.g., physical, chemical and ecological factors) bioluminescent bays
increase and decrease in their ability to sustain high concentrations of the bioluminescent
dinoflagellate, Pyrodinium bahamense.
Anthropogenic activities such as, dredging, channel disturbance, development and
unwise management, threaten the few remaining bioluminescent water bodies in the Caribbean
(Environmental Solutions, Ltd. 2005, Soler-Lopez & Santos 2010, Kenny et al. 2012, Sastre et
al. 2013). In the U.S. Virgin Islands, land development, terrestrial erosion, sedimentation, urban
runoff, leaking septic tanks, storm sewers, boat discharges, etc. collectively continue to degrade
estuarine and nearshore coastal waters, including the waters surrounding Mangrove Lagoon in
the Salt River National and Historical Park and Ecological Preserve, St. Croix, US Virgin
Islands (VI DPNR 2004, Rothenburger et al. 2008, VI DPNR 2010).
This study takes place in the year-round bioluminescent, Mangrove Lagoon, which
was first described by (Pinckney et al. 2014). The vibrant displays of light created by
Pyrodinium bahamense when the water is agitated, make it a popular eco-tourism destination
for locals and tourists alike. The research objectives of this project were to: (1) correlate
potential watershed inputs with precipitation and changes in water quality (e.g., temperature,
salinity, dissolved oxygen, turbidity, nutrients), (2) assess relationships between dinoflagellate
and phytoplankton composition with changes in water quality parameters, and (3) map the
temporal and spatial distribution of dinoflagellate and phytoplankton abundance in Mangrove
Lagoon.
Methodology
Precipitation: A HOBO Data Logging Weather Station equipped with a HOBO®
Pendant Event data logger was installed onsite. The data were used to determine 1-hr rainfall
intensities, to calculate total rainfall during storm events and to summarize monthly rainfall data.
Water Quality Data – Temperature, Salinity, pH, Turbidity & Dissolved Oxygen: A
YSI 6920 V2 multi-parameter water quality monitoring system (sonde) was used to collect
turbidity, temperature, pH, dissolved oxygen, and salinity (derived from specific conductance) in
Mangrove Lagoon. Discrete samples were obtained from the top (0.5 m) and bottom (2.0 m) of
the water column using a YSI 650 MDS multi-parameter display in tandem with the sonde.
Relative baseline data were established with bi-weekly sampling intervals at 4 fixed locations in
Mangrove Lagoon. Sampling intervals were increased to approximately every 2 – 3 days for 7 –
10 days following intense precipitation events suspected to generate runoff into Salt River Bay
and Mangrove Lagoon. Precipitation was graphically plotted with water quality parameters and
analyzed using scatter matrices and Pearson's correlation statistics to investigate potential
relationships between precipitation and water quality variables.

Water Quality Data – Orthophosphate, Nitrite/Nitrate & Ammonium: Water samples
for orthophosphate, nitrate/nitrite and ammonium were collected simultaneously during the
discrete sampling events with the sonde, i.e., bi-weekly with increased sampling intervals
following intense precipitation events. Water samples were collected using a 1 m integrated water
column sampler (surface waters) and a horizontal Niskin bottle (0.5 m from the bottom) from the
4 fixed locations within Mangrove Lagoon. For determining nutrient concentrations, water filtrate
(0.7 µm filtered) was analyzed for orthophosphate, dissolved inorganic nitrogen as nitrite/nitrate,
and ammonium using a Lachat Quick-Chem 8000 nutrient auto-analyzer according to standard
methodology (Johnson & Petty 1983, Zimmerman & Keefe 1991, Grasshoff 1999). The samples
were analyzed for dissolved nutrient concentrations and phytoplankton community
composition/biomass.
Phytoplankton Data – Dinoflagellates, Diatoms & Cyanobacteria: Water for
phytoplankton analyses was filtered through glass fiber filters (Whatman GF/F) using a gentle
vacuum. Phytoplankton photopigment concentrations were measured using high performance
liquid chromatography (HPLC; Pinckney et al. 2001). Filters were lyophilized for 18-24 hours at
-50 °C then extracted by adding 750 µl of 90% aqueous acetone solvent followed by storage in
the dark for 12-20 hours at - 20°C. Filtered extracts (250 µl) were injected into a Shimadzu
HPLC with a single monomeric column (Rainin Microsorb, 0.46 × 1.5 cm, 3 µm packing) and a
polymeric (Vydac 201TP54, 0.46 × 25 cm, 5 µm packing) reverse-phase C18 column in series. A
non-linear binary gradient consisting of solvent A (80% methanol: 20% 0.5 M ammonium
acetate) and solvent B (80% methanol: 20% acetone) was used for the mobile phase (Pinckney et
al. 1996). Absorption spectra and chromatograms (440 ± 4 nm) were obtained using a Shimadzu
SPD-M10av photodiode array detector and pigment peaks were identified by comparing retention
times and absorption spectra with pure standards (DHI, Denmark). The synthetic carotenoid β-
apo-8’-carotenal (Sigma) was used as an internal standard. Pigment concentrations were further
analyzed using ChemTax (v. 1.95) to determine the relative abundance of major phytoplankton
groups (Pinckney et al. 2001, Higgins et al. 2011). ChemTax calculates the relative concentration
of different algal groups in units of chl a. Thus total chl a is partitioned into the contribution of
individual algal groups. The initial pigment ratio matrix used for this analysis was derived from
Mackey et al. (1996). The convergence procedure outlined by Latasa (2007) was used to
minimize errors in algal group biomass due to inaccurate pigment ratio seed values. The major
phytoplankton groups used for ChemTax categories were based on qualitative microscopic
examinations of water from the bioassays.
Principal Findings and Significance
On the island of St. Croix, 2015 ended as the 3rd driest (during the dry season) and 6th
wettest (during the wet season) year on record (Martinez-Sanchez 2015). On April 1, 2015 the U.
S. Department of Agriculture (USDA) designated St. Croix as a Primary Natural Disaster Area
due to drought (USDA, 2015). Water temperatures in Mangrove Lagoon ranged from 26.3°C on
December 23, 2015 to 31.3 °C on June 8, 2015 (Fig 1). The average water temperature was 29.3
°C (± 1.41 SD, n = 231). Temperature decreases were often evident following large precipitation
events, however no significant correlations were determined (p > 0.01). The average salinity was
38.7 practical salinity units (psu; ± 2.17 SD, n = 231). Salinity ranged from 43.5 psu on July 9,
2015 to 35.2 psu on September 9, 2015. The highest salinity (43.5 psu) was during the 2nd driest

month on record (Martinez-Sanchez 2015). The lowest salinity (35.2 psu) corresponded to 15
days after the highest rainfall event of the study period, Tropical Storm (TS) Erika on August 27,
2015. Salinity and 12-day cumulative precipitation were negatively correlated (r = -0.68, df = 28,
p < 0.01). The pH values were highest on January 6, 2016 (7.72) and lowest on October 19, 2015
(7.37). The average pH was 7.53 (± 0.10 SD, n = 231). The average turbidity was 5.48
nephelometric turbidity units, NTU (± 3.18, n = 223). Turbidity ranged from 10.19 NTU on June
25, 2015 to 0.000 NTU on December 2, 2015. Turbidity data were not found to be significantly
correlated with precipitation events (p > 0.01). Dissolved oxygen ranged from 6.20 mg/L on
December 23, 2015 to 4.12 mg/L on January 17, 2016. The average DO was 5.01 mg/L (± 0.56
SD, n = 231). There was not a significant correlation between precipitation and DO. No direct
correlations were found between precipitation and the five water quality parameters tested,
except between precipitation and salinity.
Figure 1. Graphical data of daily precipitation, water temperature, salinity, pH,
turbidity and dissolved oxygen over the study period.
Analysis of the spatiotemporal data for phytoplankton abundances suggest a series of
small phytoplankton “blooms” occurred in July, October, December, and January. Chl a
concentrations were significantly higher in the bottom waters compared to surface waters.
Diatoms, cyanobacteria, and dinoflagellates were the primary groups responsible for the blooms,

with a larger contribution of dinoflagellates in the fall period. There were two diatom blooms,
one in July and the other in late December. Dinoflagellates exhibited 3 distinct concentration
peaks (i.e., “blooms”) in October, December, and January. Like total chl a, dinoflagellate
concentrations were higher in the bottom waters relative to surface waters. Cyanobacteria
concentrations were higher during June-July and October. Concentrations of all algal groups
except cyanobacteria were higher in the late fall and early winter months (November - January).
Although the blooms were widely dispersed, the persistence of the blooms appeared higher at
station 3, near the center of the lagoon.
Plots for the pooled data (all stations, surface and bottom) for the three most abundant
phytoplankton groups for each sampling date illustrate the bloom periods as well as a large
increase in the variability of concentrations in the fall period (Fig. 2). The relationship between
daily rainfall and the concentrations of the total phytoplankton community and dinoflagellates
was examined by overlaying the data from the weekly sampling (Fig. 3). There was no obvious
direct correlation between rainfall and concentrations of total phytoplankton or dinoflagellates.
Figure 2. Mean concentrations (in μg chl a l-1) of dinoflagellates, diatoms, and cyanobacteria.
Yellow shading indicates ± 1 sd.

Figure 3. Mean concentrations (in μg chl a l-1) of all phytoplankton and dinoflagellates
compared with daily rainfall. Yellow shading indicates ± 1 sd.
Conclusions
The bioluminescence in Mangrove Lagoon is part of a unique and rare ecosystem found
in the Salt River Bay National and Historical Park and Ecological Preserve on the central,
northern coast of St. Croix, US Virgin Islands. Existing anthropogenic activities in the Salt
River watershed and planned construction projects on the shores of Mangrove Lagoon will
likely affect the existing physical, chemical and biological conditions in Mangrove Lagoon. The
primary objectives of this study were to determine potential correlations between storm events,
water quality and phytoplankton composition. No direct correlations were found between
precipitation and changes in water quality, except between 12- day cumulative precipitation and
salinity (r =- 0.68, df = 28, p < 0.01). Similarly, no direct correlation was found between
changes in water quality parameters and phytoplankton groups.
The phytoplankton community in Mangrove Lagoon is composed primarily of diatoms,
dinoflagellates, and cyanobacteria. The relative contributions of each of these groups seem to
vary seasonally. Changes in phytoplankton biomass and community composition were not
directly related to DIN concentrations or N:P ratios. During the day, phytoplankton
concentrations were higher in the bottom waters, possibly due to negative phototaxis in the
shallow lagoon waters. Phytoplankton concentrations were low and relatively constant, with
dinoflagellates composing as much as 90% of total phytoplankton biomass. In general, most
rainfall events do not result in increased nutrient concentrations. However, it is possible that
nutrient uptake occurred at time scales shorter than our weekly sample collections.
References
Environmental Solutions, Ltd., 2005, Environmental impact assessment: Oyster Bay Resort
Development, Falmouth, Trelawny, Jamaica, Kingston Jamaica, Retrieved from
https://www.elaw.org/system/files/OysterBayEIA-Report.pdf, 152 pp.
Grasshoff, K.K., K. Kremling, M. Ehrhardt, 1999, Methods of Seawater Analysis, Wiley- VCH.
Higgins, H.W., S.W. Wright, L. Schlüter L., 2011, Quantitative interpretation of chemotaxonomic
pigment data. In: Roy S, Llewellyn CA, Egeland ES, Johnsen G (eds). Phytoplankton
pigments. Cambridge University Press, NY, p 257-313.
Johnson, K.S., R.L. Petty, 1983, Determination of nitrate and nitrite in seawater by flow injection
analysis, Limnology & Oceanography 28: 1260-1266.
Kenny, I., A. Kramer, P.W. Kelly, T. Burbury, 2012, Coral Relocation: A mitigation tool for
dredging works in Jamaica, in “Proceedings of the 12th International Coral Reef
Symposium,” 20A Restoration of coral reefs, Cairns, Australia, 5 pp.
Latasa, M., 2007, Improving estimations of phytoplankton class abundances using CHEMTAX.
Marine Ecology Progress Series 329: 13-21.
Mackey, M., D. Mackey, H. Higgins, S. Wright, 1996, CHEMTAX - a program for estimating
class abundances from chemical markers: application to HPLC measurements of
phytoplankton. Marine Ecology Progress Series 144:265-283.
Martinez-Sanchez, O., 2015, 2015 Climate Review for Puearto Rico and the U.S. Virgin Islands,
National Oceanic and Atmospheric Administration, Retrieved from
http://www.srh.noaa.gov/images/sju/climo/monthly_reports/2015/2015Summary.pdf on 07
April 2016, 15 pp.
Pinckney, J.L., T. Richardson, D. Millie, H. Paerl, 2001, Application of photopigment biomarkers
for quantifying microalgal community composition and in situ growth rates. Org Geochem
32:585-595.
Pinckney, J.L., D.I. Greenfield, C. Benitez-Nelson, R. Long, M. Zimberlin M, C. Lane, P.
Reidhaar, C. Tomas, B. Castillo II, K. Reale-Munroe, M. Taylor, D. Goldstein, Z. Hillis-
Starr, 2014, Ecological Characterization of Bioluminescence in Mangrove Lagoon, Salt
River Bay, St. Croix, USVI. Project Report. Retrieved from
http://www.nps.gov/sari/parknews/upload/Mangrove-Lagoon-Report-FINAL.pdf on 02
April 2016, St. Croix, USVI, 78 pp.
Rothenberger, P., J. Blondeau, C. Cox, S. Curtis, W. Fisher, V. Garrison, Z. Hillis-Starr, C.
Jeffrey, E. Kadison, I. Lundgren, W. J. Miller, E. Muller, R. Nemeth, S. Paterson, C.
Rogers, T. Smith, A. Spitzack, M. Taylor, W. Toller, J. Wright, D. Wusinich-Mendez and
J. Waddell, 2008, The state of the coral reef ecosystems of the U.S. Virgin Islands, pp 29
– 73 in J.E Waddell and A.M. Clarke (eds.), The State of Coral Reef Ecosystems of the
United States and Pacific Freely Associated States: 2008. NOAA Technical
Memorandum NOS NCCOS 73. NOAA/NCCOS Center for Coastal Monitoring and
Assessment’s Biogeography Team. Retrieved from
https://coastalscience.noaa.gov/research/docs/CoralReport2008.pdf on 02 April 2016,
Silver Spring, MD. 569 pp.
Sastre, M.P., E. Sánchez, M. Flores, S. Astacio, J. Rodriguez, M. Santiago, K. Olivier, V. Francis,
J. Núñez, 2013, Population fluctuations of Pyrodinium bahamense and Ceratium furca
(Dinophyceae) in Laguna Grande, Puerto Rico, and environmental variables associated
during a three-year period, International Journal of Tropical Biology, 61, 1799-1813.
Seliger, H.H., W.D. McElroy, 1968, Studies at Oyster Bay, Jamaica, West Indies: I. Intensity
patterns of bioluminescence in a natural environment, Journal of Marine Research, 26,
244- 255.

Soler-Lopez, L.R., C.R. Santos, 2010, Selected hydrologic, water-quality, biological and
sedimentation characteristics of Laguna Grande, Fajardo, Puerto Rico, March 2007-
February 2009, Scientific Investigations Report 2010-5071. US Geological Survey,
Reston, VA, 52 pp.
USDA, United States Department of Agriculture, 2015, USDA Designates St. Croix County in the
U.S. Virgin Islands as a Primary Natural Disaster Area, News Release, Retrieved from
http://www.fsa.usda.gov/FSA/newsReleases?mystate=vi&area=stnewsroom&subject=stnr&t
opic=landing&newstype=stnewsrel&type=detail&item=stnr_vi_20150826_rel_047.html on 19
April 2016.
VI DPNR, US Virgin Islands Department of Planning and Natural Resources, 2004, Dissolved
Oxygen Total Maximum Daily Load, Salt River Bay, St. Croix, USVI, Retrieved from
https://ofmpub.epa.gov/waters10/attains_impaired_waters.show_tmdl_document?p_tmdl
_do c_blobs_id=74849 on 13 March 2016, US Virgin Islands, 66p.
VI DPNR, US Virgin Islands Department of Natural Resources, 2010, USVI Integrated Water
Quality Monitoring and Assessment Report, US Virgin Islands. Retrieved from
http://environmental-protection.dpnr.gov.vi/userfiles/2010%20Integrated%20Report.pdf on
13 March 2016, US Virgin Islands, 165 pp.
Zimberlin, M, 2013, Nutrient Limitation of Bioluminescent Dinoflagellates in Mangrove
Lagoon, Salt River Bay, St. Croix, USVI, “MS thesis,” Department of Biological
Sciences, College of Arts and Sciences, University of South Carolina, Columbia, SC,
38p, Retrieved from http://scholarcommons.sc.edu/etd/2488 on 13 March 2016.
Zimmerman, C.F., C.W. Keefe CW, 1991, EPA Method 353.4, In An interim manual of methods
for the determination of nutrients in estuarine and coastal waters. Revision 1.1, June 1991.

Information Transfer Program Introduction
Two VI-WRRI projects were supported through the Information Transfer Program during the 2015-2016program year: the Water Ambassador Program and the Second Conference on Water Resource SustainabilityIssues on Tropical Islands. Support from 104b funding resulted in educational material and programming thatincreased awareness of the importance of water and its conservation among USVI elementary and middleschool students and a successful joint conference in Hawaii in December 2015 of the four island WaterResources Research Institutes (U.S. Virgin Islands, Puerto Rico, Hawaii, and Guam). Important to note,however, is that all projects conducted through the VI-WRRI are required to include elements of informationdissemination and training in their activities. This was done and is evident through the public presentationsthat were made and the many students, both graduate and undergraduate, that participated in the researchprojects.
Information Transfer Program Introduction
Information Transfer Program Introduction 1
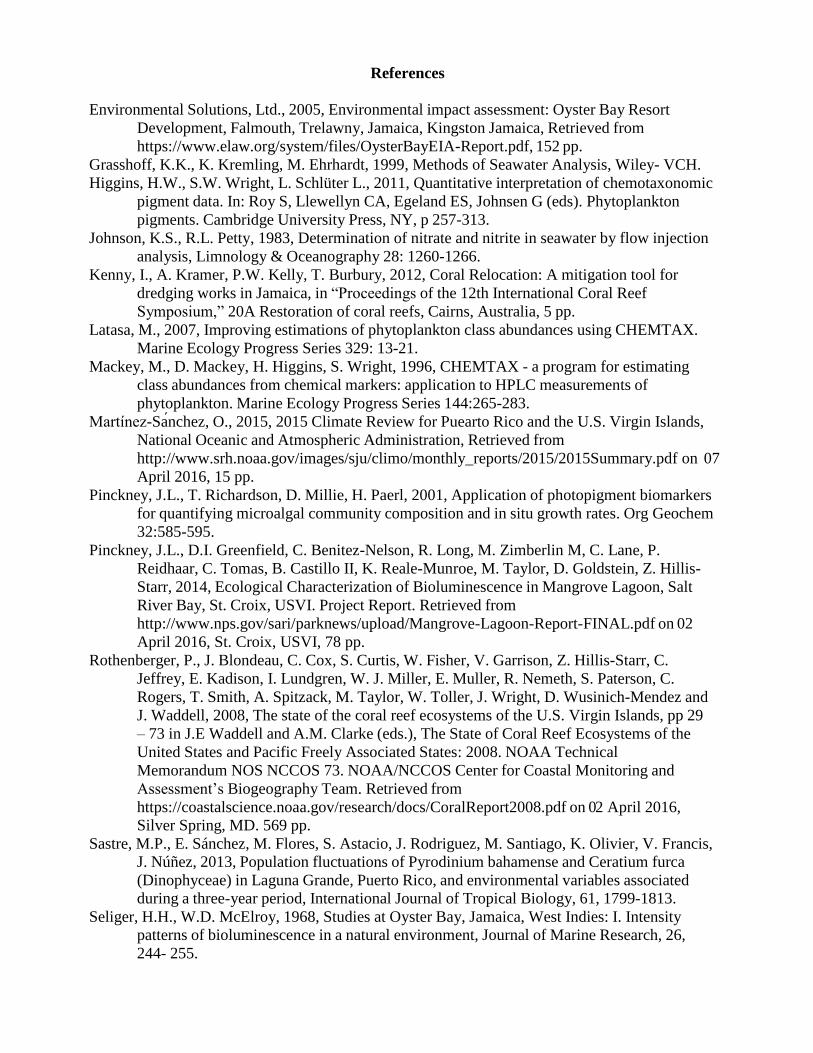
Water Ambassador Program
Basic Information
Title: Water Ambassador ProgramProject Number: 2015VI250B
Start Date: 3/1/2015End Date: 2/28/2016
Funding Source: 104BCongressional District:
Research Category: Social SciencesFocus Category: Education, Hydrology, Water Supply
Descriptors: NonePrincipal Investigators: christina marie chanes, David C Morris, Avram Gerald Primack
Publications
There are no publications.
Water Ambassador Program
Water Ambassador Program 1

WATER AMBASSADOR PROGRAM: A PILOT PROGRAM OF EDUCATION ON THE
HYDROLOGIC CYCLE AND WATERSHED ISSUES TARGETED AT STUDENTS IN
PUBLIC AND PRIVATE SCHOOLS IN THE UNITED STATES VIRGIN ISLANDS
Problem and Research Objectives
The United States Virgin Islands is a small territory just to the east of Puerto Rico that
consists of three main islands, St. Thomas, St. Croix, and St. John, and a few smaller, mostly
unpopulated islands. The majority of the people in the Territory live on St. Croix and St.
Thomas. St. John and Water Island have fewer people. In addition to permanent residents, St.
Thomas is one of the busiest tourism destinations in the Caribbean (Allen 1992) with more
than 2 million visitors annually in recent years (USVI BER 2012). A significant proportion of
the population of these islands draws their water from cisterns that collect rooftop water. The
rest are dependent on groundwater sources. Everyone must purchase water purified in reverse
osmosis when there are no other sources. Because of the small size of the islands, surface
water supplies are limited and the availability of groundwater supplies is restricted by high
relief and small aquifers. Most residents away from major towns rely on gathering rainwater
from their personal rooftop into cisterns that they maintain themselves. Streams only flow for
short periods after rainfall, are nearly dry for the rest of the year, and are heavily impacted by
roads and erosion from poor construction practices high in their watersheds. All of these
forces place great stress on natural hydrologic systems throughout the Territory and on St
Thomas in particular.
There is a great need for education about water resources and their management on St.
Thomas. There is also need for data collection on the status of streams and watersheds and
increased understanding of climate patterns on the island. This proposal started and
implemented a model educational program that introduced sixth grade students to good water
and landscape conservation practices, created a system for collecting crowd source data (data
collected by the public through a web mapping interface) on the status of hydrologic systems
in the Territory using these students to report on their own watersheds, and increased the
spread of the weather station system currently operated by the University of the Virgin
Islands (UVI) on St. Thomas by bringing a station to each participating school.
Methodology
In response to the need for education in the public and private schools the Water
Ambassador Program was created by Ms. Chanes in Cooperative Extension Service as part of
the 4H program at UVI. The goals of the in-school program were to: (1) create awareness of
and to reduce nonpoint source pollution, (2) bring attention to the importance of water quality
and the need for water testing in schools, homes and the community, and (3) encourage and
promote understanding of watersheds. These were accomplished through the development of
a model educational program, the installation of weather stations at each participating school,
and the creation of online, web-mapping applications that allowed students to report
observations about their landscape and to see the watershed observations made by others.

Principal Findings and Significance
More than 350 students from seven schools participated in the Water Ambassador
Program (Table 1). These include youths from ESL classes who spoke multiple languages in
4th through 6th grade and local students from 6th through 12th grades. Six weather stations
were installed at these schools, significantly adding to the existing weather station network on
St. Thomas (Table 2). Students were introduced to the weather station and how it reports
data. More than 16 teachers and six administrators participated in the program and gained
access to the weather station on the school grounds (Table 1). Many more teachers and
schools requested to participate in the program than could be accommodated.
Table 1. Over 350 students, six teachers and six administrators participated.
School Teachers/
Administrators
Students
Addelita Cancryn Junior High School 4/2 150
E. Oliver Benjamin Elementary School 3/1 100
CAHS*no station due to proximity to
Lockhart Elementary School
3/0 20
Ivanna Eudora Kean High School 1/0 20
VI Montessori School International Academy 1/0 10
All Saints School 1/1 Participates in year 2
Lockhart Elementary School 3/2 98
Table 2. Six schools received weather stations as part of the program.
School Grades
Addelita Cancryn Junior High School 7-8th
E. Oliver Benjamin Elementary School K-5th (4-5)
Ivanna Eudora Kean High School 9-12th
VI Montessori School Int’l Academy K-12 (private)
All Saints School K-12 (private)
Lockhart Elementary School K-6 (4-6) (ESL)
Web mapping application pages were created that are available on the Citizen Science
tab of the GeoCAS web page (geocas.org). Because the Department of Education firewall
system would not let outside web pages into the schools we were not able to use them in the
classroom with students. We are working on this and expect to get them into the schools in
the next school year where they will become part of the in-class program. These pages were
used from home and during the Big Production at the end of the project where students took
part in a daylong, hands-on learning activity at UVI.
Each weather station and its associated online reporting page are available to the
public through the GeoCAS website to the general public (geocas.org). An example of
weather station output from a station currently operating in this network can be found at
http://www.weatherlink.com/user/uviwsx6/. The watershed model purchased as part of the
project is also being used in public events around the Territory. In February of this year, Dr

Primack and Ms. Chanes travelled to St Croix with the watershed model and shared it at the
annual Virgin Islands Agriculture and Food Fair.
The final Big Production included 80 students and teachers from two schools. These
students met with faculty and administrators at UVI, where they presented the results of their
own investigations into water quality topics and heard presentations from faculty and
administrators at UVI about the college experience. We took advantage of the Virgin Islands
Experimental Program to Stimulate Competitive Research’s Celebrity Scientist Program to
introduce students to Engineer and 3D printmaker Arthur Spivey, who is from the U.S.
Virgin Islands, to demonstrate 3D printing. Our invited speaker, Dr. Walter Silva of the
University of Puerto Rico at Mayaguez observed the student presentations and spoke with
students during the event. His final presentation drew together the threads of the student
presentations into his own presentation on the water cycle, how we are tied to it, and how we
need to care for it.
The Water Ambassador Program introduced students to public action by having each
school create and record a public service announcement that has been aired on WUVI, UVI’s
radio station. They also created short video presentations. Because Ms. Chanes, PI of the
project, has extensive experience working with radio and has a regular weekend show,
students in the program were able to prepare their own short radio spots which they recorded
during a visit to the radio station this along with several interviews on a variety of shows at
WUVI, which continue to be played regularly on WUVI and are archived on the WUVI
SoundCloud which hosts podcasts.
Student Water Ambassadors also learned how to present water-related materials to
their peers, both on- and off-island. This year’s Water Ambassador Program graduates of
both Lockhart Elementary School and E. Benjamin Oliver Elementary School presented their
efforts in a school assembly. The Water Ambassador Program was presented by five high
school aged youth in August 2015 at the 31st Annual West Indies Agricultural Economics
Conference held on St Croix to more than 60 researchers and farmers from across the nation
and 13 countries.
An unexpected benefit of the Water Ambassador Program is that it has also connected
others at the University and in the Territory, including UVI’s Etelman Observatory and the
Virgin Islands Department of Agriculture. Dr. Primack is currently in discussions with Dr.
Silva, our guest presenter at the Big Production that have led to several proposals in the area
of Food, Energy, and Water.
Conclusions
The Water Ambassador Program advanced science literacy in schools on St. Thomas.
The program involved more than 240 classroom contact hours in the area of water resources
covering water conservation, water resources, and their management on islands, with more
than 16 teachers, six administrators and 350 students. Youth collected data on the status of
watersheds, thereby increasing their understanding of climate change and climate patterns.
The Big Production gave youth a chance to present their findings in a formal college
level setting and afforded them the chance to interact directly with a variety of researchers. In
the future, more administrators and teachers should be trained. Lessons included writing,
vocabulary and spelling exercises including the Water Droplet essay which drove home the

message that water conservation and hydrology affect them, and water resources must be
conserved not only here but all over the world. In addition, the youth were able to apply the
water resources lessons to agriculture, fisheries, and other food sources.
Water chemistry testing should be included in future programs as the youth enjoy
taking part in it and it served as an introduction to chemistry. Youth also asked about the
physics of water and sediment movement down slopes during storm periods, which could
damage homes and beaches.
References
Allen, W. H. (1992). Increased dangers to Caribbean marine ecosystems, Bioscience: 330-
335.
USVI BER 2012. http://www.usviber.org/November%202012.pdf

Second Conference on Water Resource SustainabilityIssues on Tropical Islands
Basic Information
Title: Second Conference on Water Resource Sustainability Issues on Tropical IslandsProject Number: 2015VI253B
Start Date: 3/1/2015End Date: 2/28/2016
Funding Source: 104BCongressional District: Not Applicable
Research Category: Not ApplicableFocus Category: Water Supply, Management and Planning, Climatological Processes
Descriptors: NonePrincipal Investigators: Henry H. Smith
Publications
There are no publications.
Second Conference on Water Resource Sustainability Issues on Tropical Islands
Second Conference on Water Resource Sustainability Issues on Tropical Islands 1

December 1-3 2015, the VI WRRI participated in the Second Conference on Water Resource
Sustainability Issues on Tropical Islands held in Honolulu, HI. Per reporting instructions
received from the USGS for this joint conference, the full report revealing conference details is
available through the Hawaii Water Resources Research Center’s FY 2015 Annual Report.

USGS Summer Intern Program
None.
USGS Summer Intern Program 1
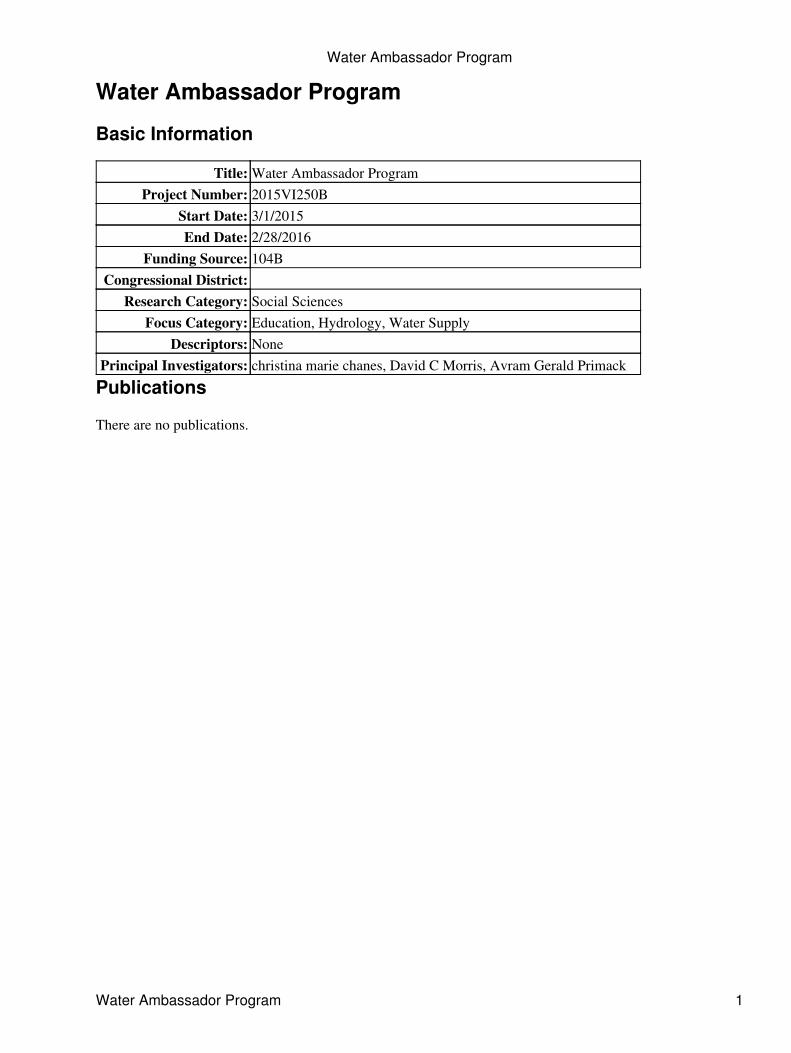
Student Support
Category Section 104 BaseGrant
Section 104 NCGPAward
NIWR-USGSInternship
SupplementalAwards Total
Undergraduate 6 0 0 0 6Masters 2 0 0 0 2
Ph.D. 0 0 0 0 0Post-Doc. 0 0 0 0 0
Total 8 0 0 0 8
1

Notable Awards and Achievements
Notable Awards and Achievements 1