Embed Size (px)
Citation preview
11-12 Annual ReportThe Southern Metropolitan Regional Council
Contents
SMRC 2011-2012 Annual Report2
01 TheSMRCataglance 3
02 Chairman’sReport 5
03 CorporateGovernance 6
04 RegionalCouncillors 7
05 Committeesestablishedandappointedbythecouncilare: 8
06 SMRCSeniorStaff 10
07 ChiefExecutiveOfficer’sReport 11
08OurPurposeandPrinciples 12
09 KeyPerformanceIndicators 13
10 Compliance 25
11 FinancialReport 28
12 IndependentAuditorsReport 62
01 The SMRC at a glance
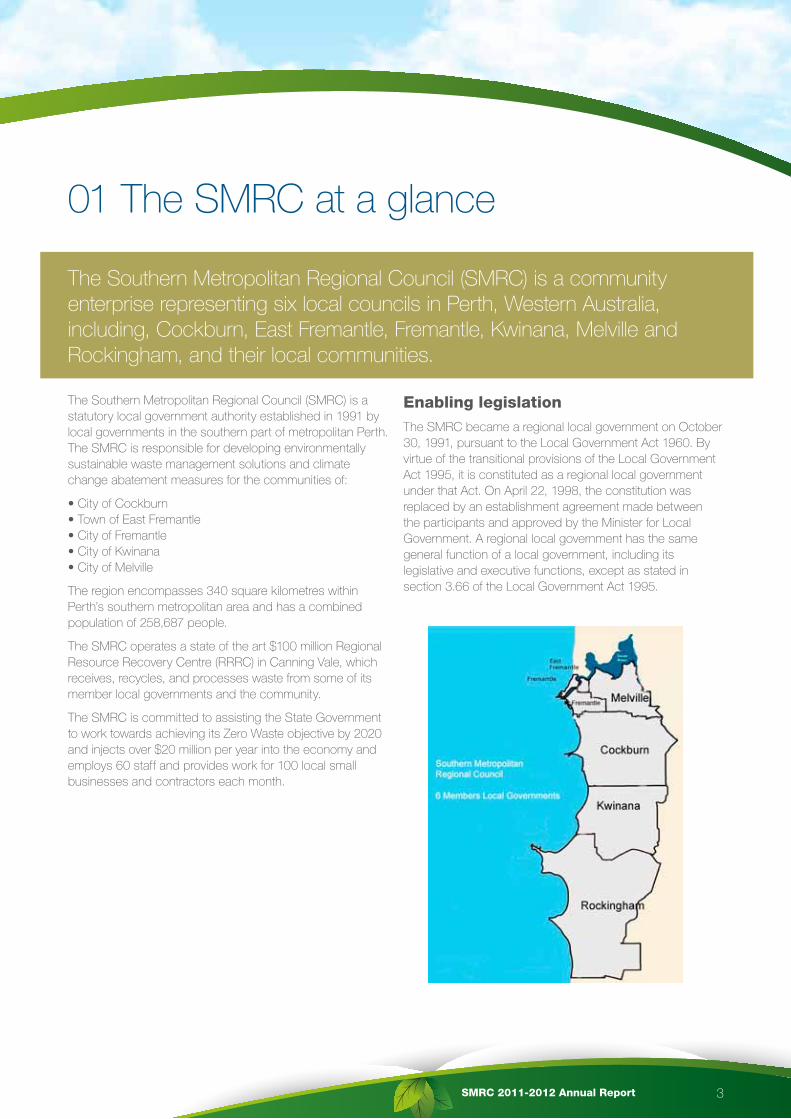
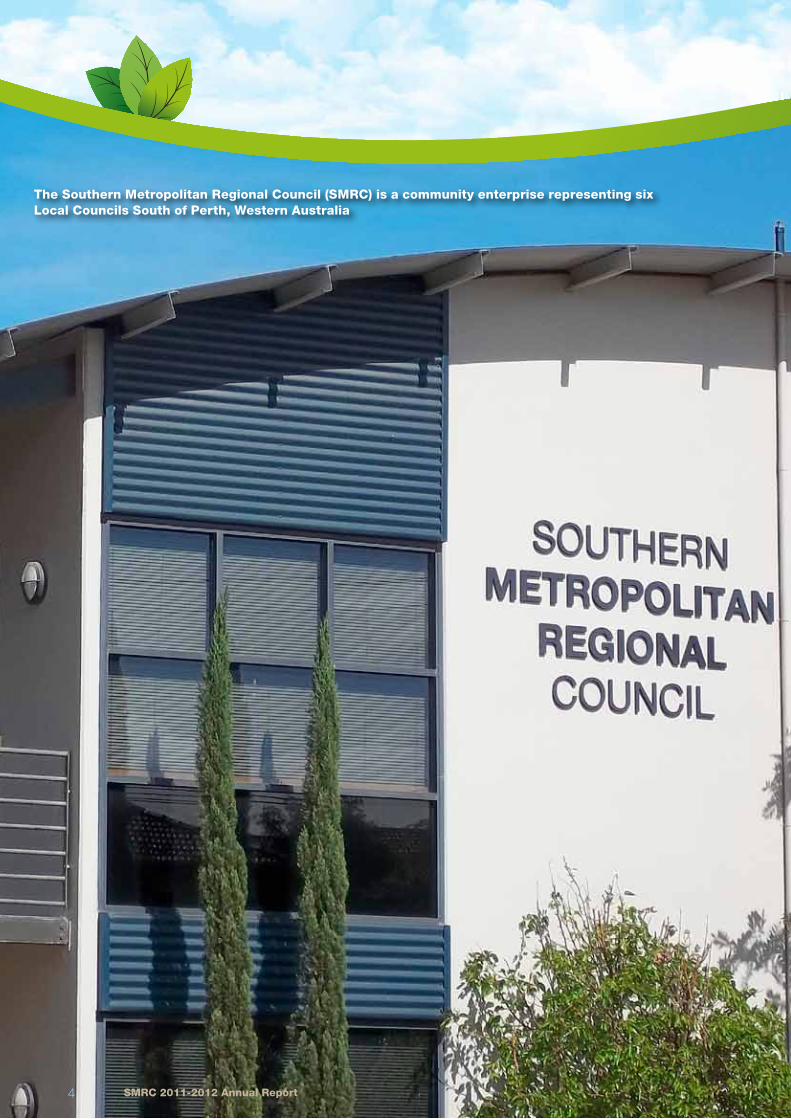
The Southern Metropolitan Regional Council (SMRC) is a community enterprise representing six local councils in Perth, Western Australia, including, Cockburn, East Fremantle, Fremantle, Kwinana, Melville and Rockingham, and their local communities.
The Southern Metropolitan Regional Council (SMRC) is a statutory local government authority established in 1991 by local governments in the southern part of metropolitan Perth. The SMRC is responsible for developing environmentally sustainable waste management solutions and climate change abatement measures for the communities of:
• City of Cockburn • Town of East Fremantle • City of Fremantle • City of Kwinana • City of Melville
The region encompasses 340 square kilometres within Perth’s southern metropolitan area and has a combined population of 258,687 people.
The SMRC operates a state of the art $100 million Regional Resource Recovery Centre (RRRC) in Canning Vale, which receives, recycles, and processes waste from some of its member local governments and the community.
The SMRC is committed to assisting the State Government to work towards achieving its Zero Waste objective by 2020 and injects over $20 million per year into the economy and employs 60 staff and provides work for 100 local small businesses and contractors each month.
Enabling legislationThe SMRC became a regional local government on October 30, 1991, pursuant to the Local Government Act 1960. By virtue of the transitional provisions of the Local Government Act 1995, it is constituted as a regional local government under that Act. On April 22, 1998, the constitution was replaced by an establishment agreement made between the participants and approved by the Minister for Local Government. A regional local government has the same general function of a local government, including its legislative and executive functions, except as stated in section 3.66 of the Local Government Act 1995.
SMRC 2011-2012 Annual Report 3
SMRC 2011-2012 Annual Report44
The Southern Metropolitan Regional Council (SMRC) is a community enterprise representing six Local Councils South of Perth, Western Australia

SMRC 2011-2012 Annual Report 5
02 Chairman’s Report
I am pleased to present the 2011/12 Annual Report of the Southern Metropolitan Regional Council.
This year a number of critical issues faced the SMRC including: rebuilding the Materials Recovery Facility (MRF),
monitoring and continually improving the odour management systems at the Regional Resource Recovery Centre (RRRC), in Canning Vale and building and maintaining relationships with the Regional Council’s key stakeholders: the Member Councils of Cockburn, East Fremantle, Fremantle, Kwinana, Melville and Rockingham.
While much work remains to be done, the organisation has embarked on a pathway of continuous improvement that is already yielding significant rewards. In this challenging year we achieved a recovery rate of 63% which exceeded the State Waste Strategy 2015 recovery target of 50%, and we expect this rate to continue to rise above the state 2020 target of 65% during the coming year.
An independent survey was conducted in November 2011 involving 700 interviews with residents surveying a range of issues surrounding the activities of the SMRC. It is pleasing to record that the majority of residents feel very positively toward RRRC waste processing methods;
• 86% positive about recycling and re-use of glass, plastics, paper and metals
• 83% positive about composting of organic materials
• 82% positive about Green waste processing
The survey also highlighted that odour emissions are a concern for those who reside in the RRRC area although most residents say things are improving with 69% reporting the odour problem has improved over the last year or two, with 15% saying it has stayed about the same and only 1% saying it has become worse.
The rebuilding of the new $20 million Materials Recovery Facility commenced in October of 2011. This state of the art facility is due to be officially opened in November of 2012 and will establish a benchmark for community and commercial recycling and again increase the amount of waste diverted from landfill and recycled into new products.
The Department of Environment and Conservation amended the RRRC’s operating licence in May this year to include a number of stringent conditions requiring significant capital upgrades to improve odour management at the waste composting facility. I would like to take this opportunity to
sincerely thank our member council’s elected members and officers for their commitment and support in pursuing an improved environmental outcome for the facility and our community.
During the year we launched the RRRC Bulletin which provides useful updates including the status of the works required to comply with our licence conditions along with other information relating to the centre.
I would like to acknowledge a number of changes to the organisation that have occurred during this year including the departure of the Chief Executive Officer, Stuart McAll. During seventeen years Stuart made a huge contribution to the organisation which included overseeing the construction and operation of the Regional Resource Recovery Centre. The SMRC thanks Stuart for the contribution he has made in providing sustainable waste management solutions to our Member Councils and their communities.
I would also like to recognise the colossal contribution of outgoing Councillor Clive Robartson. Having served as SMRC Councillor, Chair and Deputy Chairperson for the past seventeen years, Clive was the driving force behind a regional approach to waste management. He and his colleagues were instrumental in realising a vision for a sustainable environment and the achievements of the SMRC could not have been reached without his dedication.
During the year Councillor Rob Willis was nominated to the SMRC by the City of Melville and the Town of East Fremantle nominated Cr Cliff Collinson. The year also saw the departure of City of Rockingham’s Councillor and SMRC Deputy Chair, Cr Richard Smith and East Fremantle Councillor Richard Olson. I thank both of them for their valuable contributions during their tenure.
I would like to thank the Acting Chief Executive Officer Mr Tim Youé, the senior management team and the entire staff for their valuable contribution in achieving this year’s key objectives.
The SMRC looks forward to our continuing commitment to achieving sustainable waste management solutions on behalf of the communities of its Member Councils. We are committed to continuously improving communications and educating the community about the importance of recycling.
Cr Tony Romano, Chairman

SMRC 2011-2012 Annual Report6
03 Corporate Governance
The SMRC comprises one elected councillor from each of the member councils. It holds ordinary meetings throughout the year, with special meetings called from time to time.
A Chairperson is elected by members for a term of two years. Each councillor has equal voting rights, except the Chairperson who may exercise a second vote in the event of a tie.
Regional Council
Audit&RiskCommittee
PublicRelationsCommittee
CEOPerformanceCommittee
CEO&Administration
6 Member Local Governments
RegionalExecutiveGroup
CommunityAdvisoryGroup
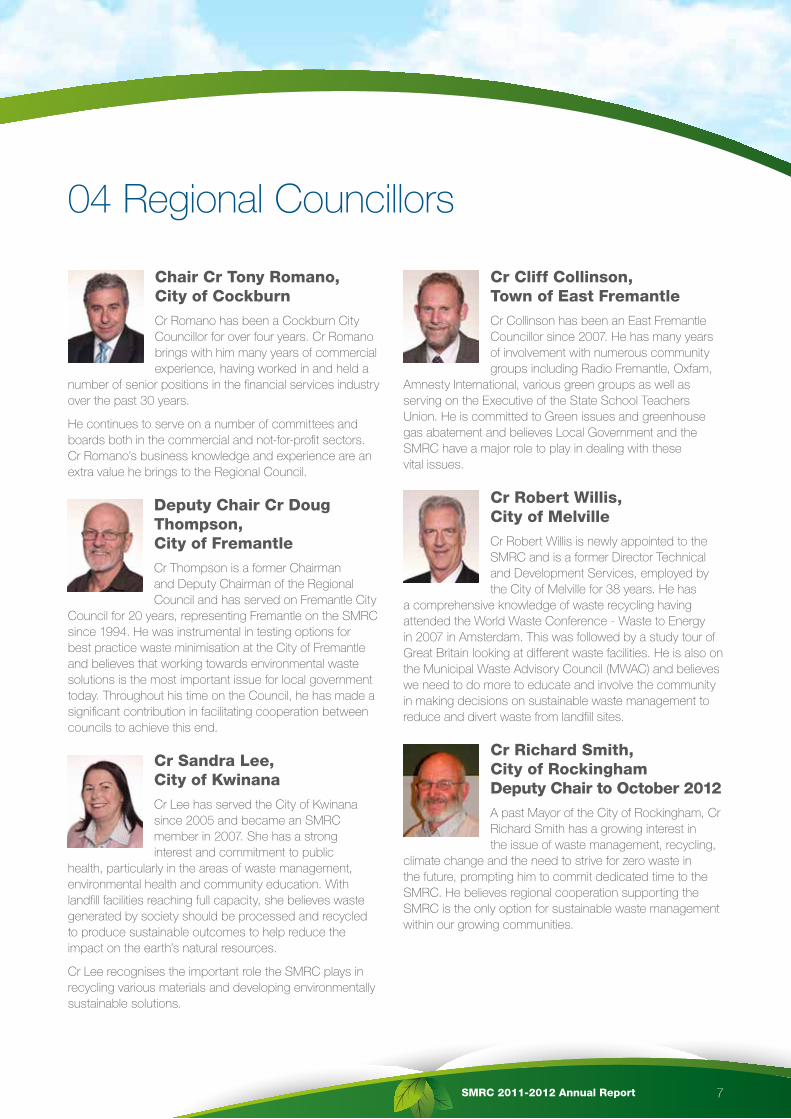
Chair Cr Tony Romano, City of CockburnCr Romano has been a Cockburn City Councillor for over four years. Cr Romano brings with him many years of commercial experience, having worked in and held a
number of senior positions in the financial services industry over the past 30 years.
He continues to serve on a number of committees and boards both in the commercial and not-for-profit sectors. Cr Romano’s business knowledge and experience are an extra value he brings to the Regional Council.
Deputy Chair Cr Doug Thompson, City of FremantleCr Thompson is a former Chairman and Deputy Chairman of the Regional Council and has served on Fremantle City
Council for 20 years, representing Fremantle on the SMRC since 1994. He was instrumental in testing options for best practice waste minimisation at the City of Fremantle and believes that working towards environmental waste solutions is the most important issue for local government today. Throughout his time on the Council, he has made a significant contribution in facilitating cooperation between councils to achieve this end.
Cr Sandra Lee, City of KwinanaCr Lee has served the City of Kwinana since 2005 and became an SMRC member in 2007. She has a strong interest and commitment to public
health, particularly in the areas of waste management, environmental health and community education. With landfill facilities reaching full capacity, she believes waste generated by society should be processed and recycled to produce sustainable outcomes to help reduce the impact on the earth’s natural resources.
Cr Lee recognises the important role the SMRC plays in recycling various materials and developing environmentally sustainable solutions.
Cr Cliff Collinson, Town of East FremantleCr Collinson has been an East Fremantle Councillor since 2007. He has many years of involvement with numerous community groups including Radio Fremantle, Oxfam,
Amnesty International, various green groups as well as serving on the Executive of the State School Teachers Union. He is committed to Green issues and greenhouse gas abatement and believes Local Government and the SMRC have a major role to play in dealing with these vital issues.
Cr Robert Willis, City of MelvilleCr Robert Willis is newly appointed to the SMRC and is a former Director Technical and Development Services, employed by the City of Melville for 38 years. He has
a comprehensive knowledge of waste recycling having attended the World Waste Conference - Waste to Energy in 2007 in Amsterdam. This was followed by a study tour of Great Britain looking at different waste facilities. He is also on the Municipal Waste Advisory Council (MWAC) and believes we need to do more to educate and involve the community in making decisions on sustainable waste management to reduce and divert waste from landfill sites.
Cr Richard Smith, City of Rockingham Deputy Chair to October 2012A past Mayor of the City of Rockingham, Cr Richard Smith has a growing interest in the issue of waste management, recycling,
climate change and the need to strive for zero waste in the future, prompting him to commit dedicated time to the SMRC. He believes regional cooperation supporting the SMRC is the only option for sustainable waste management within our growing communities.
SMRC 2011-2012 Annual Report 7
04 Regional Councillors
SMRC 2011-2012 Annual Report8
05 Committees established and appointed by the council are:Audit & Risk CommitteeThe Audit & Risk Committee meets quarterly and is made up of Regional Councillors and members of the public. Its purpose is to review the audit function and performance and risk management processes.
Membership of CommitteeChair: Cr Tony Romano
Members: Cr Doug Thompson, Cr Sandra Lee, Cr Richard Olson to October 2011.
External Member of Public: Mr Phillip Draber
Public Relations CommitteeThe Public Relations Committee was created to review, consider and discuss the SMRC’s communication strategy. It is made up of Regional Councillors and a member of the community advisory group.
Membership of CommitteeChair: Cr Tony Romano
Members: Cr Richard Smith, Cr Robert Willis, Cr Clive Robartson to October 2011.
External Member of Public: Mr Norman Holtzman
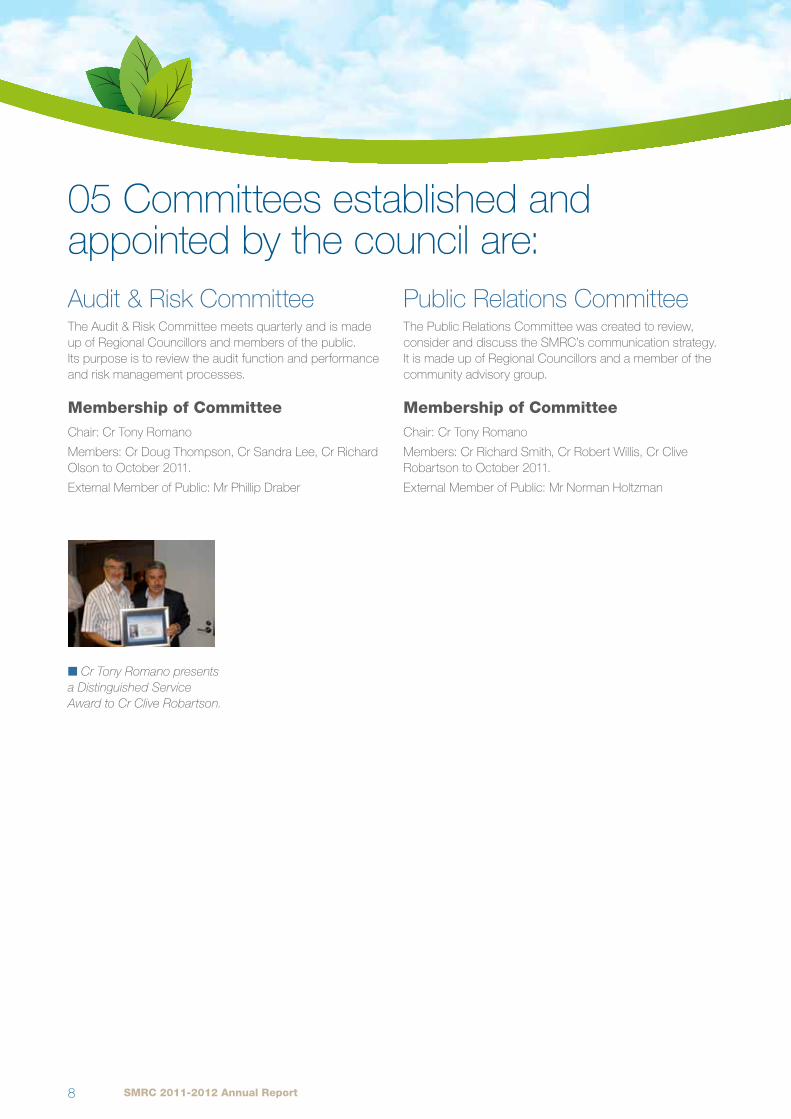
n Cr Tony Romano presents a Distinguished Service Award to Cr Clive Robartson.

SMRC 2011-2012 Annual Report 9
CEO Performance CommitteeThe CEO Performance Committee reviews the performance of the Chief Executive Officer. This committee is made up of all Councillors and meets as needed during the year.
The SMRC also has a number of community and officer advisory groups, including:
Regional Executive GroupConsists of two senior officers (one is a deputy) from each of the member local governments. The Regional Council appoints members to the group from recommendations from each member local government. Its purpose is to engage in a consultative and communication network between the Regional Council and its member local governments.
Membership of CommitteeMembers: Michael Littleton, Director Technical Services City of Cockburn; Stuart Wearne, CEO Town of East Fremantle; Peter Pikor, City Engineer City of Fremantle; Peter McKenzie, Manager Health Services City of Kwinana; John Christie, Director Technical Services City of Melville; Graham Rose, Waste Manger City of Rockingham.
Deputy Members: Stuart Downing, Director Finance City of Cockburn; Shelley Cocks, Principal Environmental Health Officer Town of East Fremantle; Glen Dougall, Director Corporate Services City of Fremantle; Maurice Ferialdi, Director Operations & Technical Services City of Kwinana; Marten Tieleman Director Corporate Services City of Melville; Chris Thompson, Director Technical Services City of Rockingham.
SMRC Community Advisory GroupThe SMRC Community Advisory Group (CAG) is made up of interested community members from the Perth Southern Metropolitan Region. The CAG has an independent Chairman and Deputy Chair. No Regional Council elected members or staff are members of the CAG. The CAG’s role is to be a “trusted advisor” to the SMRC, advising the Regional Council on community concerns and feedback concerning the activities of the SMRC and the RRRC.
Anyone interested in contacting the CAG or wishing to join the group is welcome to contact the CAG on smrccag.gmail.com, or the CAG can be found on Facebook.
Operational Waste Managers GroupConsisting of operational waste managers, this group meets regularly to facilitate resources and information sharing, and to undertake joint inter-council projects such as waste audits and the Regional Landfill Airspace Study.
Finance Managers’ GroupThe Finance Managers’ Group comprises Executive Officers from each of the SMRC’s member councils’ corporate and financial divisions. The group meets to review the SMRC’s financial affairs, budget and strategic direction.
The SMRC is represented on a number of external committees and industry associations including:
Municipal Waste Advisory Council
Forum of Regional Councils
Waste Management Association of Australia
Be Living Smart IncSMRC maintains a representative on the board of Be Living Smart Inc, an independently run body since the closure of the SMRC’s ClimateWise program.
SMRC 2011-2012 Annual Report10
06 SMRC Senior Staff
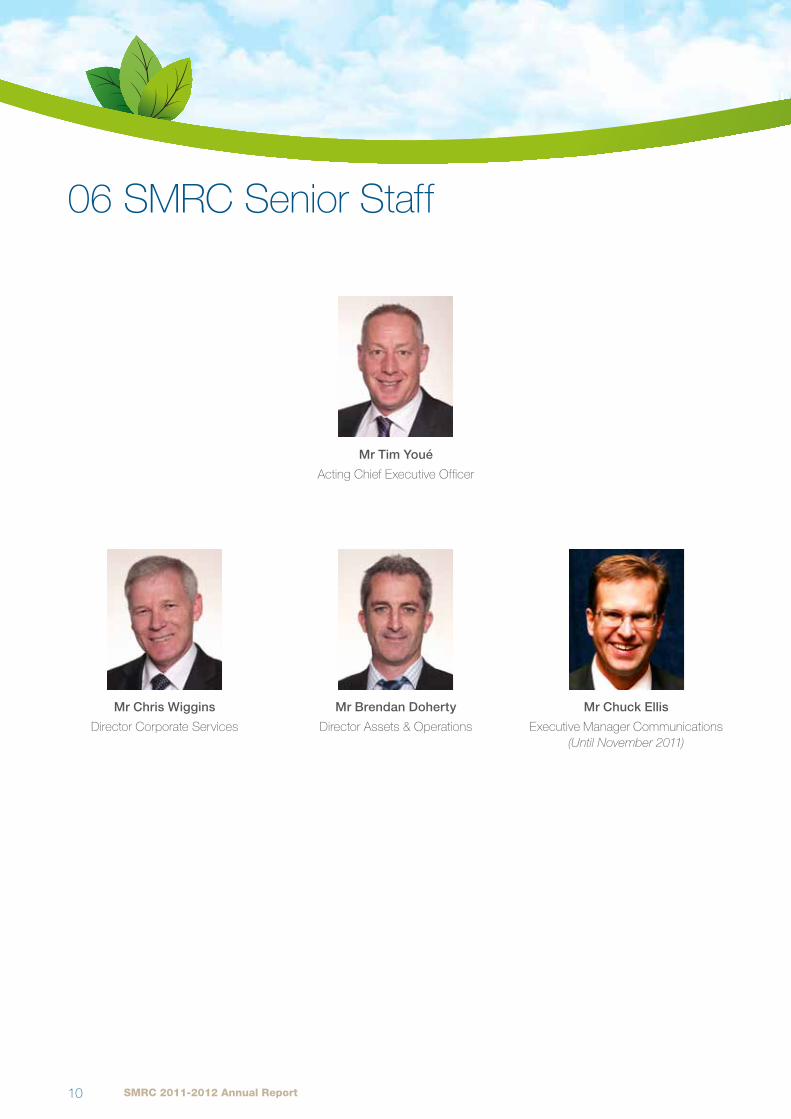
MrTimYoué
Acting Chief Executive Officer
MrChrisWiggins
Director Corporate Services
MrBrendanDoherty
Director Assets & Operations
MrChuckEllis
Executive Manager Communications (Until November 2011)
SMRC 2011-2012 Annual Report 11
07 Chief Executive Officer’s Report
The past year has required significant effort and dedication on the part of all our employees and I would like to give my heartfelt thanks to all of our staff for their support, strong work ethic and applaud their efforts in helping deliver on the organisation’s key performance commitments.
During the year the SMRC has achieved a state leading waste diversion rate from landfill of 63% by processing and recovering the organic fraction of the municipal waste stream. This is a considerable achievement.
In October 2011, the SMRC commenced rebuilding the Materials Recovery Facility (MRF) at the RRRC. This facility sorts and processes the contents of the yellow top recycling bin into bales. The bales are then sold into domestic and international markets for manufacturing into new products. This will raise the recovery rate of material collected and processed at the Regional Resource Recovery Facility to in excess of 70% during 2012/13, thereby exceeding the State Government’s 2020 target.
The Department of Environment and Conservation (DEC) amended the RRRC’s operating licence on 7 May 2012. The Licence contains a number of key conditions related to odour management improvements which require significant capital works to be undertaken within very short time frames.
In order to keep our stakeholders and the community informed of progress with the works programme required to fulfil our licence conditions, we commenced producing and distributing RRRC Bulletins to advise stakeholders and the community on our progress. The bulletins along with an e-newsletter containing more general news and information are readily available from our website.
Another exciting development this year was the introduction of the Recycle Right website. Still in its infancy, it will take shape next year as a regional repository of information and fact sheets on recycling. Recycle Right is a campaign which encourages and assists residents and businesses in the South Metropolitan Region to recycle, reduce their rubbish and buy more recycled products.
In April 2012, the SMRC along with two other project proponents, jointly submitted a Carbon Farming Initiative (CFI) Methodology for our Waste Composting Facility. The methodology was accepted by the Domestic Offsets Integrity Committee for public consultation. We are anticipating final approval of the project methodology in 2012/13 thus allowing the SMRC to generate income from the sale of Australian Carbon Credit Units (ACCU’s) into the formal emissions trading market.
I would also like to acknowledge the important feedback we received from our Community Advisory Group, our external audit committee member and all our other supporters and advisors during the year.
The Regional Council and its participant local governments are committed to ensuring the Regional Resource Recovery Centre continues to improve its operational performance and community engagement while delivering on the State Government’s goal of reducing waste sent to landfill and maximising resource recovery.
Mr Tim Youé Acting Chief Executive Officer
SMRC 2011-2012 Annual Report12
08 Our Purpose and Principles
Our PurposeLeading in sustainable recycling and climate change solutions.
Our PrinciplesWe will conduct our business guided by these Principles:-
Employee Value
Sustainability
Innovative Solutions
Integrity & Transparency
Community Driven Outcomes
Adaptiveness
Forward Thinking
Responsiveness
A Safe Work Environment
The SMRC’s strategic plan reviewThe Key focus areas for the next 5 years are:
1. Resource RecoveryGoal: Ensure maximum resource recovery from waste generated from our municipality and domestic community.
2. Climate ChangeGoal: To reduce our corporate greenhouse gas emissions footprint.
3. Business SustainabilityGoal: Ensure the short and longer term sustainability of the Southern Metropolitan Regional Council.
4. Stakeholder EngagementBuild sustainability through strengthened and expanded partnerships, alliances and relationships.
5. Research & InnovationBe an innovative provider of resource recovery and greenhouse gas abatement solutions.
SMRC 2011-2012 Annual Report 13
09 Key Performance Indicators
The SMRC has a strategic goal for each of its key focus areas, measured by a series of key performance indicators.
The following key performance indicators were adopted in August 2011 to measure the SMRC’s success in achieving the goals:
Key Focus Area 1 – Resource RecoveryGoal: Ensure maximum resource recovery from waste generated from our municipality and domestic community.
Key Area
Indicator Measure 11/12 Target
11/12 Actual
Resource Recovery
Waste diverted from landfill
Percentage of waste diverted = (1 – total residuals/total waste processed x 100%).
62% 64%
Total amount of recovered products
Weight of recovered products as measured across the weighbridge for the 2 facilities at the RRRC
43,688 t 42,690 t
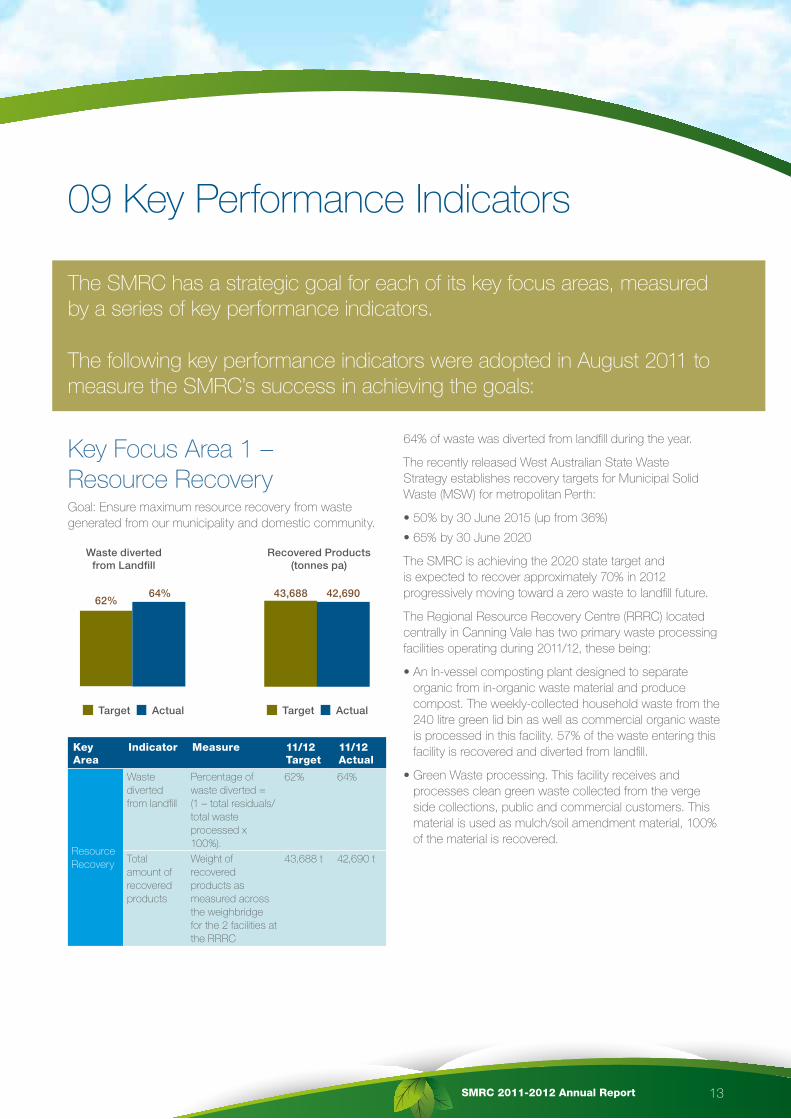
64% of waste was diverted from landfill during the year.
The recently released West Australian State Waste Strategy establishes recovery targets for Municipal Solid Waste (MSW) for metropolitan Perth:
• 50% by 30 June 2015 (up from 36%)
• 65% by 30 June 2020
The SMRC is achieving the 2020 state target and is expected to recover approximately 70% in 2012 progressively moving toward a zero waste to landfill future.
The Regional Resource Recovery Centre (RRRC) located centrally in Canning Vale has two primary waste processing facilities operating during 2011/12, these being:
• An In-vessel composting plant designed to separate organic from in-organic waste material and produce compost. The weekly-collected household waste from the 240 litre green lid bin as well as commercial organic waste is processed in this facility. 57% of the waste entering this facility is recovered and diverted from landfill.
• Green Waste processing. This facility receives and processes clean green waste collected from the verge side collections, public and commercial customers. This material is used as mulch/soil amendment material, 100% of the material is recovered.
WastedivertedfromLandfill
RecoveredProducts(tonnespa)
62%64%
Target TargetActual Actual
43,688 42,690
SMRC 2011-2012 Annual Report14
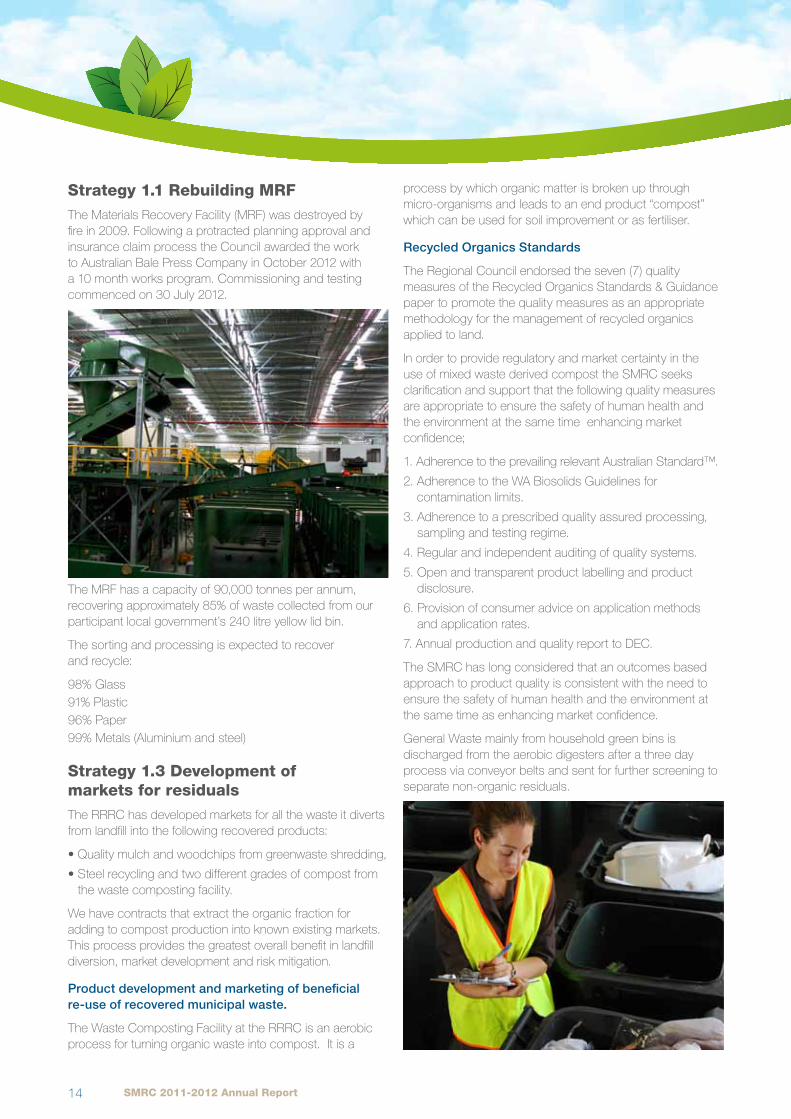
Strategy 1.1 Rebuilding MRFThe Materials Recovery Facility (MRF) was destroyed by fire in 2009. Following a protracted planning approval and insurance claim process the Council awarded the work to Australian Bale Press Company in October 2012 with a 10 month works program. Commissioning and testing commenced on 30 July 2012.
The MRF has a capacity of 90,000 tonnes per annum, recovering approximately 85% of waste collected from our participant local government’s 240 litre yellow lid bin.
The sorting and processing is expected to recover and recycle:
98% Glass 91% Plastic96% Paper99% Metals (Aluminium and steel)
Strategy 1.3 Development of markets for residualsThe RRRC has developed markets for all the waste it diverts from landfill into the following recovered products:
• Quality mulch and woodchips from greenwaste shredding,
• Steel recycling and two different grades of compost from the waste composting facility.
We have contracts that extract the organic fraction for adding to compost production into known existing markets. This process provides the greatest overall benefit in landfill diversion, market development and risk mitigation.
Productdevelopmentandmarketingofbeneficialre-useofrecoveredmunicipalwaste.
The Waste Composting Facility at the RRRC is an aerobic process for turning organic waste into compost. It is a
process by which organic matter is broken up through micro-organisms and leads to an end product “compost” which can be used for soil improvement or as fertiliser.
RecycledOrganicsStandards
The Regional Council endorsed the seven (7) quality measures of the Recycled Organics Standards & Guidance paper to promote the quality measures as an appropriate methodology for the management of recycled organics applied to land.
In order to provide regulatory and market certainty in the use of mixed waste derived compost the SMRC seeks clarification and support that the following quality measures are appropriate to ensure the safety of human health and the environment at the same time enhancing market confidence;
1. Adherence to the prevailing relevant Australian Standard™.
2. Adherence to the WA Biosolids Guidelines for contamination limits.
3. Adherence to a prescribed quality assured processing, sampling and testing regime.
4. Regular and independent auditing of quality systems.
5. Open and transparent product labelling and product disclosure.
6. Provision of consumer advice on application methods and application rates.
7. Annual production and quality report to DEC.
The SMRC has long considered that an outcomes based approach to product quality is consistent with the need to ensure the safety of human health and the environment at the same time as enhancing market confidence.
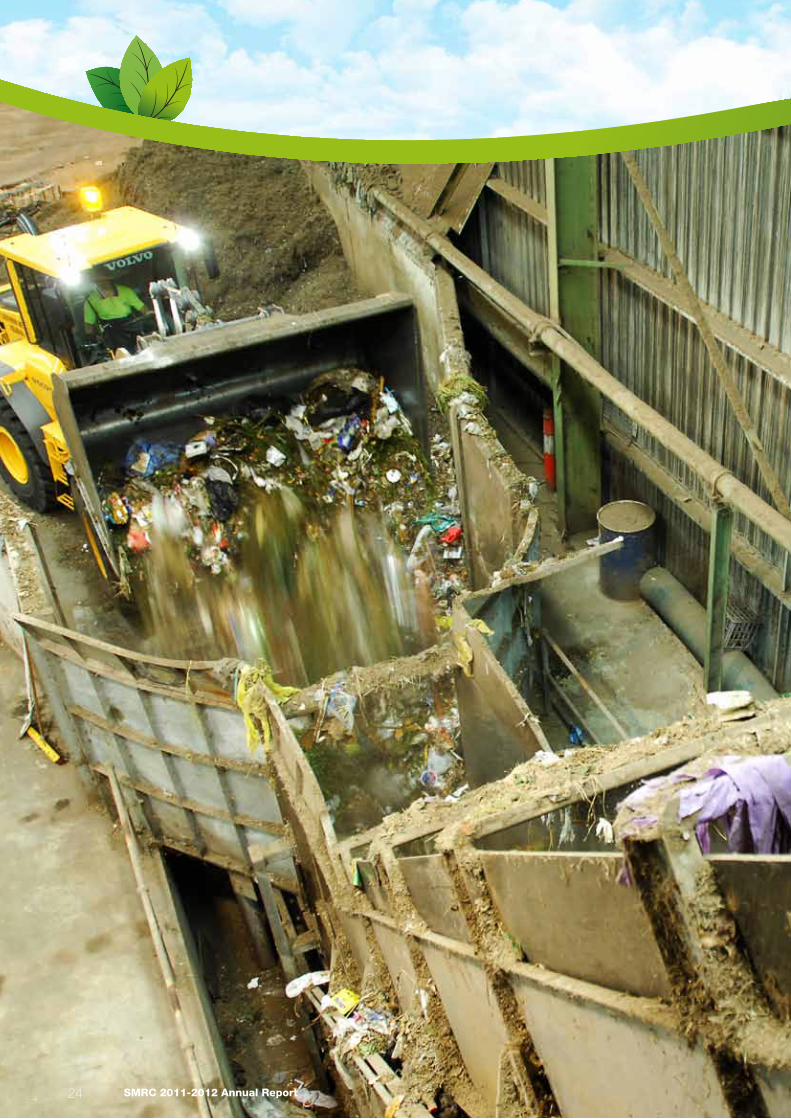
General Waste mainly from household green bins is discharged from the aerobic digesters after a three day process via conveyor belts and sent for further screening to separate non-organic residuals.
SMRC 2011-2012 Annual Report 15
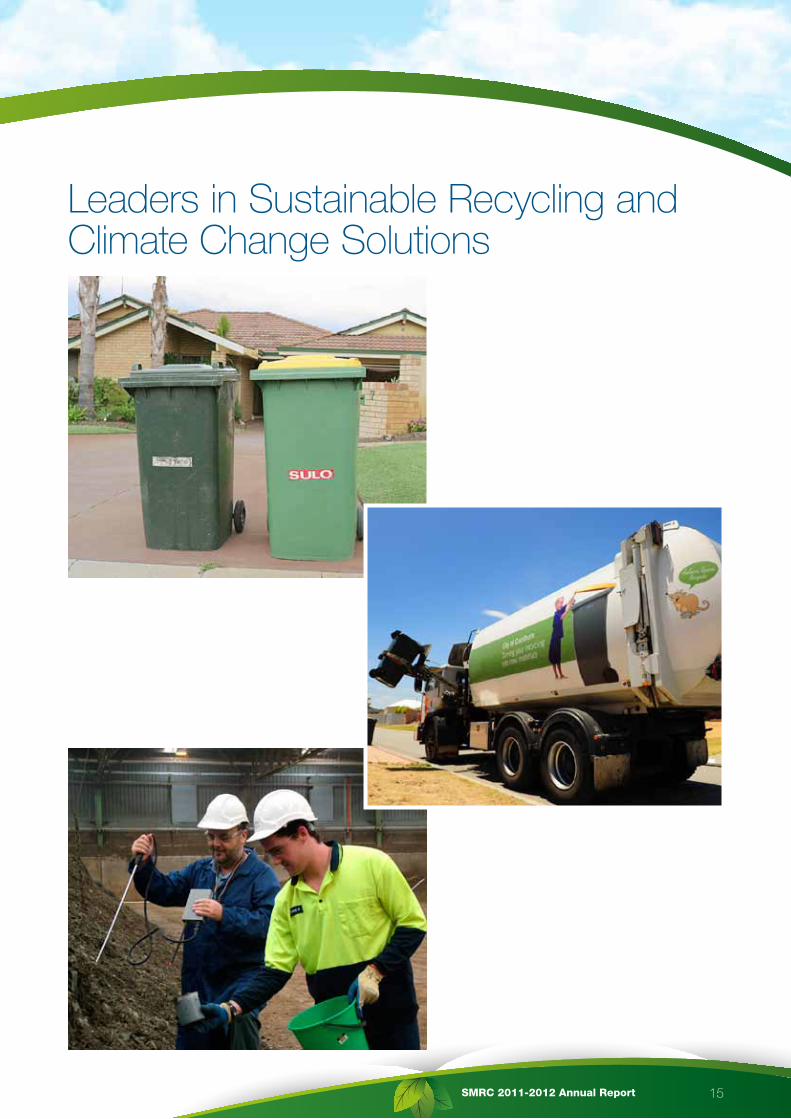
Leaders in Sustainable Recycling and Climate Change Solutions
SMRC 2011-2012 Annual Report16
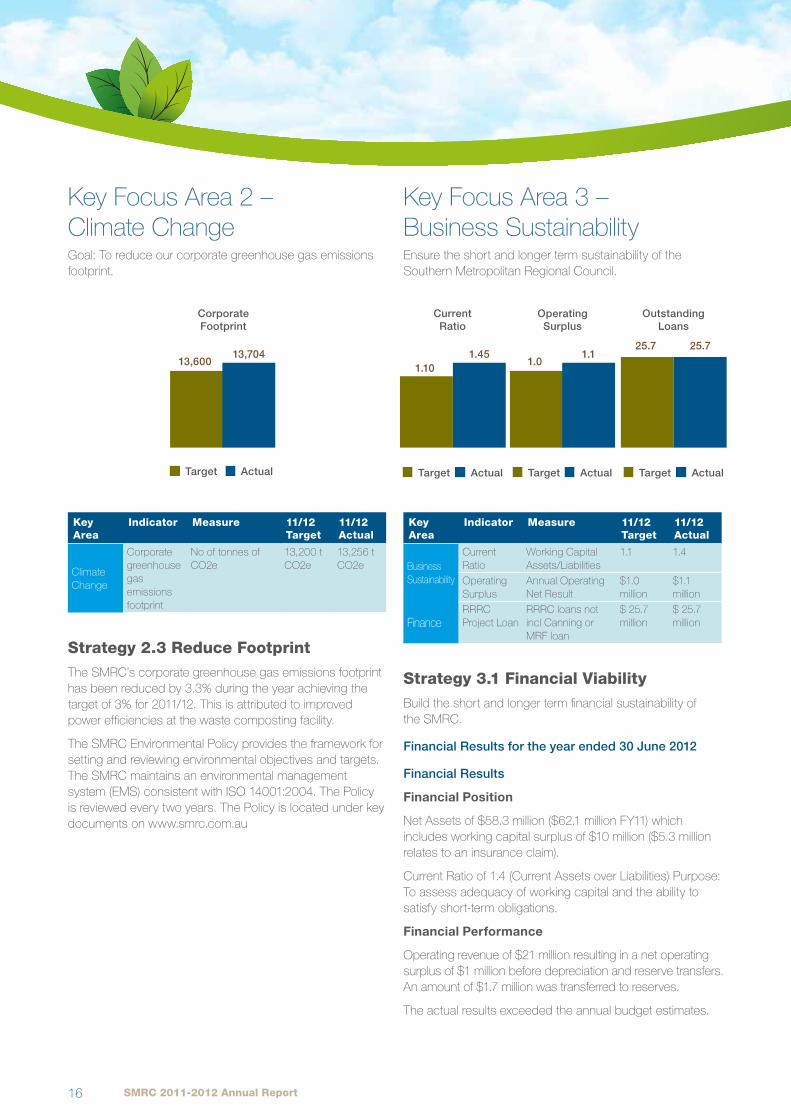
Key Focus Area 2 – Climate ChangeGoal: To reduce our corporate greenhouse gas emissions footprint.
Key Area
Indicator Measure 11/12 Target
11/12 Actual
Climate Change
Corporate greenhouse gas emissions footprint
No of tonnes of CO2e
13,200 t CO2e
13,256 t CO2e
Strategy 2.3 Reduce FootprintThe SMRC’s corporate greenhouse gas emissions footprint has been reduced by 3.3% during the year achieving the target of 3% for 2011/12. This is attributed to improved power efficiencies at the waste composting facility.
The SMRC Environmental Policy provides the framework for setting and reviewing environmental objectives and targets. The SMRC maintains an environmental management system (EMS) consistent with ISO 14001:2004. The Policy is reviewed every two years. The Policy is located under key documents on www.smrc.com.au
Key Focus Area 3 – Business SustainabilityEnsure the short and longer term sustainability of the Southern Metropolitan Regional Council.
Key Area
Indicator Measure 11/12 Target
11/12 Actual
Business Sustainability
Current Ratio
Working Capital Assets/Liabilities
1.1 1.4
Operating Surplus
Annual Operating Net Result
$1.0 million
$1.1 million
FinanceRRRC Project Loan
RRRC loans not incl Canning or MRF loan
$ 25.7 million
$ 25.7 million
Strategy 3.1 Financial ViabilityBuild the short and longer term financial sustainability of the SMRC.
FinancialResultsfortheyearended30June2012
FinancialResults
Financial Position
Net Assets of $58.3 million ($62.1 million FY11) which includes working capital surplus of $10 million ($5.3 million relates to an insurance claim).
Current Ratio of 1.4 (Current Assets over Liabilities) Purpose: To assess adequacy of working capital and the ability to satisfy short-term obligations.
Financial Performance
Operating revenue of $21 million resulting in a net operating surplus of $1 million before depreciation and reserve transfers. An amount of $1.7 million was transferred to reserves.
The actual results exceeded the annual budget estimates.
CorporateFootprint
13,60013,704
Target Actual
CurrentRatio
1.101.45
Target Actual
OperatingSurplus
1.01.1
Target Actual
OutstandingLoans
25.7 25.7
Target Actual
SMRC 2011-2012 Annual Report 17
Cash backed reserves
The Reserves decreased during the year by $0.9 million, to fund WCF capital equipment replacements and the fixed expenses during the loss of the MRF resulting in a balance of $2.9 million.
Borrowings
No new loans were raised during the year and an amount of $2.6 million was repaid during the year. The outstanding loan balance for the RRRC Project (not including City of Canning’s liability of $12.4 million) was $31.9 million and the Office Accommodation Project was $1.8 million.
The SMRC’s KPI for RRRC Project outstanding loans paid by project participants does not include the MRF loan or the City of Canning’s liability total $25.7 million.
This is in line with an annual target of $25.7 million as at 30 June 2012.
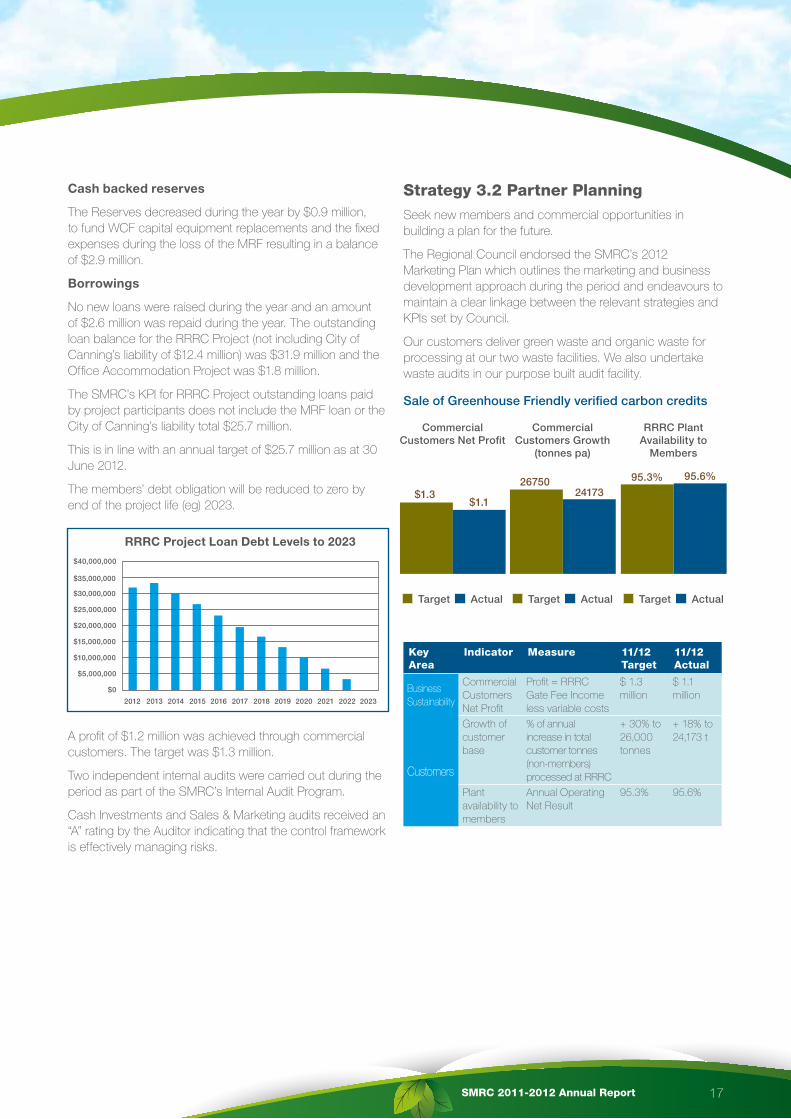
The members’ debt obligation will be reduced to zero by end of the project life (eg) 2023.
A profit of $1.2 million was achieved through commercial customers. The target was $1.3 million.
Two independent internal audits were carried out during the period as part of the SMRC’s Internal Audit Program.
Cash Investments and Sales & Marketing audits received an “A” rating by the Auditor indicating that the control framework is effectively managing risks.
Strategy 3.2 Partner PlanningSeek new members and commercial opportunities in building a plan for the future.
The Regional Council endorsed the SMRC’s 2012 Marketing Plan which outlines the marketing and business development approach during the period and endeavours to maintain a clear linkage between the relevant strategies and KPIs set by Council.
Our customers deliver green waste and organic waste for processing at our two waste facilities. We also undertake waste audits in our purpose built audit facility.
SaleofGreenhouseFriendlyverifiedcarboncredits
Key Area
Indicator Measure 11/12 Target
11/12 Actual
Business Sustainability
Commercial Customers Net Profit
Profit = RRRC Gate Fee Income less variable costs
$ 1.3 million
$ 1.1 million
Customers
Growth of customer base
% of annual increase in total customer tonnes (non-members) processed at RRRC
+ 30% to 26,000 tonnes
+ 18% to 24,173 t
Plant availability to members
Annual Operating Net Result
95.3% 95.6%
$40,000,000
RRRC Project Loan Debt Levels to 2023
$35,000,000
$30,000,000
$25,000,000
$20,000,000
$15,000,000
$10,000,000
$5,000,000
$0
2012 2013 2014 2015 2016 2017 2018 2019 2020 2021 2022 2023
CommercialCustomersNetProfit
$1.3$1.1
Target Actual
CommercialCustomersGrowth
(tonnespa)
2675024173
Target Actual
RRRCPlantAvailabilityto
Members
95.3% 95.6%
Target Actual
SMRC 2011-2012 Annual Report18
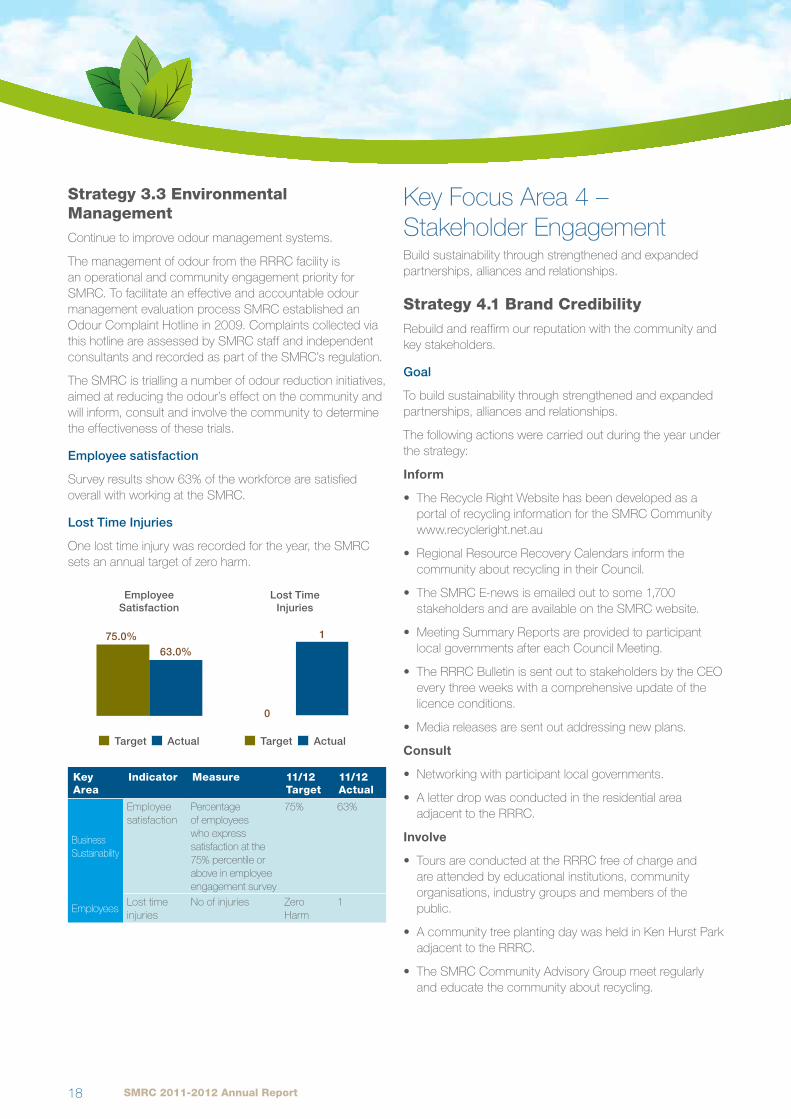
Strategy 3.3 Environmental ManagementContinue to improve odour management systems.
The management of odour from the RRRC facility is an operational and community engagement priority for SMRC. To facilitate an effective and accountable odour management evaluation process SMRC established an Odour Complaint Hotline in 2009. Complaints collected via this hotline are assessed by SMRC staff and independent consultants and recorded as part of the SMRC’s regulation.
The SMRC is trialling a number of odour reduction initiatives, aimed at reducing the odour’s effect on the community and will inform, consult and involve the community to determine the effectiveness of these trials.
Employeesatisfaction
Survey results show 63% of the workforce are satisfied overall with working at the SMRC.
LostTimeInjuries
One lost time injury was recorded for the year, the SMRC sets an annual target of zero harm.
Key Area
Indicator Measure 11/12 Target
11/12 Actual
Business Sustainability
Employee satisfaction
Percentage of employees who express satisfaction at the 75% percentile or above in employee engagement survey
75% 63%
EmployeesLost time injuries
No of injuries Zero Harm
1
Key Focus Area 4 – Stakeholder EngagementBuild sustainability through strengthened and expanded partnerships, alliances and relationships.
Strategy 4.1 Brand CredibilityRebuild and reaffirm our reputation with the community and key stakeholders.
Goal
To build sustainability through strengthened and expanded partnerships, alliances and relationships.
The following actions were carried out during the year under the strategy:
Inform
• The Recycle Right Website has been developed as a portal of recycling information for the SMRC Community www.recycleright.net.au
• Regional Resource Recovery Calendars inform the community about recycling in their Council.
• The SMRC E-news is emailed out to some 1,700 stakeholders and are available on the SMRC website.
• Meeting Summary Reports are provided to participant local governments after each Council Meeting.
• The RRRC Bulletin is sent out to stakeholders by the CEO every three weeks with a comprehensive update of the licence conditions.
• Media releases are sent out addressing new plans.
Consult
• Networking with participant local governments.
• A letter drop was conducted in the residential area adjacent to the RRRC.
Involve
• Tours are conducted at the RRRC free of charge and are attended by educational institutions, community organisations, industry groups and members of the public.
• A community tree planting day was held in Ken Hurst Park adjacent to the RRRC.
• The SMRC Community Advisory Group meet regularly and educate the community about recycling.
EmployeeSatisfaction
75.0%63.0%
Target Actual
LostTimeInjuries
0
1
Target Actual

SMRC 2011-2012 Annual Report 19
Government Relations
• The CEO regularly attends each South West Group CEO meeting providing updates on the SMRC activities.
• The CEO attends meetings of the Municipal Waste Advisory Council.
• The CEO attends the Forum of Regional Councils.
• The CEO attends meetings with Ministers and local Members of Parliament.
Strategy 4.2 Transparent Stakeholder ManagementTo align with and clearly communicate to our key stakeholders.
Council adopted its updated Communication Strategy Plan and new Community Engagement Plan in early 2012.
This Community Engagement Strategy details the SMRC communications and stakeholder relations activities pertaining specifically to the community as defined as those directly or indirectly affected by the SMRC operations including the RRRC facility. This document outlines the delivery of this strategy for the three year period (2012-2015). It is intended to be a working document, referred to throughout the years and updated regularly.
StakeholderBriefingSession–5April2012
The Regional Council invited participants’ Mayors, CEOs and senior executives to discuss and ask questions on the options available to the SMRC in light of the new licence conditions imposed by the DEC to cease receiving waste by June 2012. SMRC’s solicitors responded to questions raised by members and SMRC executives provided capital works improvement solutions and contingency financial plans for further consideration.
A special council meeting of the SMRC was held on 11 April addressing the proposed amended licence application and odour improvement strategies and the short-term financial viability of the SMRC, resolving to seek participants’ financial support in the interim.
CommunityAdvisoryGroup
The SMRC Community Advisory Group provides the conduit for a two-way dialogue between the Southern Metropolitan Regional Council and its regional community with the goal of providing both parties with the informed advice and guidance necessary to enhance decision-making.
The Community Advisory Group’s purpose is to increase the community understanding of the importance of recycling, gather community feedback and suggestions and help the SMRC respond more effectively to issues and concerns arising in the community.

SMRC 2011-2012 Annual Report20
Strategy 4.3 Relationships with Regulatory BodiesBuild relationships with regulatory bodies based upon the promise of, ethical behaviour, sensitivity to needs and mutual respect.
Regular meeting with the Department of Environment and Conservation (DEC) relating to the RRRC current and future improvements to meet environment licence conditions.
OdourHotline
The Southern Metropolitan Regional Council has established a 24-hour telephone service to allow residents and businesses to report any odours they suspect may be originating from the Regional Resource Recovery Centre in Canning Vale.
Once an odour is reported to the 24-hour hotline, 1300 556 726, details such as the location, time and character of the odour will be immediately forwarded to SMRC staff at the Regional Resource Recovery Centre, who will conduct an inspection of the waste composting facility to determine if odours are escaping the facility and take corrective action if needed.
CommunityAttitudesSurvey
An independent survey was conducted in November of 2011 on 700 residents, comprising a mix of residents in areas adjacent to the RRRC facility, residents in SMRC local government areas and residents outside this catchment.
The Southern Metropolitan Regional Council Community Attitudes Survey, completed by JWS Research, included attitudes pertaining to the operation of the RRRC facility, awareness of the SMRC and support for recycling.
These results provide a benchmark for evaluating the effect of community engagement and providing benchmarks to measure its effectiveness.
The key findings of the survey were:
• The majority of residents feel very positively toward RRRC waste processing methods;
• Odour emissions are a concern for those who reside in the RRRC area;
• Most residents in the RRRC locale say things are improving; and
• Most people don’t want the RRRC to be closed.
The majority of residents feel very positively toward RRRC waste processing methods:
• 86% positive about recycling and re-use of glass, plastics, paper and metals.
• 83% positive about composting of organic materials.
• 82% positive about green waste processing.
• 82% disagreed with landfill as a means of disposing of waste, with 57% having very strong feelings against landfill as a waste disposal option.
The survey recorded a majority of very positive sentiments toward RRRC waste processing methods, with residents ambivalent about high temperature incineration and very negatively disposed to waste disposal in land fill. These positive views toward RRRC waste processing techniques are shared by residents living near the RRRC.
The survey recorded that odour remains a community issue, particularly in areas adjacent to the RRRC, with about half of residents personally affected by odour. Outside of this catchment area just 6% of respondents recorded being impacted.
Most residents in the RRRC area say things are improving
• 69% say the odour problem has improved since 2009.
• 1% saying it has become worse, with 15% saying it has stayed about the same.
• 9% had lodged an odour complaint since the start of 2011.
SMRC 2011-2012 Annual Report 21
• 3% of those who agree with closure of the RRRC had lodged an odour complaint.
Survey findings are in line with DEC figures that recorded an 89% reduction in odour complaints, between 2009 and 2011.
The survey revealed majority support for the RRRC remaining in operation.
• 56% of those surveyed that live in close proximity of the RRRC disagree with any proposal for closure.
• 74% of those aware of odour emissions disagree with any proposed closure of RRRC, as do 66% of those who have experienced odours in the last 12 months.
• Upon learning that DEC has reported there have been significant improvements in odour management since 2009, and a significant reduction in complaints, over the past 12 months; 84% of the total surveyed disagreed with closure of the RRRC, including 67% of those living in close proximity to the facility.
NoticebyaparticipanttowithdrawfromtheSMRC
City of Rockingham withdrew from the SMRC effective from 30 June 2012.
Following the withdrawal of the City of Rockingham from the SMRC, two business plans have been prepared to notify remaining participants of the impact of their withdrawal and to calculate the liability owed by City of Rockingham as part of the withdrawal notice. The City of Rockingham was not a project participant of the RRRC Project and therefore there are no financial obligations. The final calculations will be prepared after the annual audited financial accounts of the SMRC in October 2012.
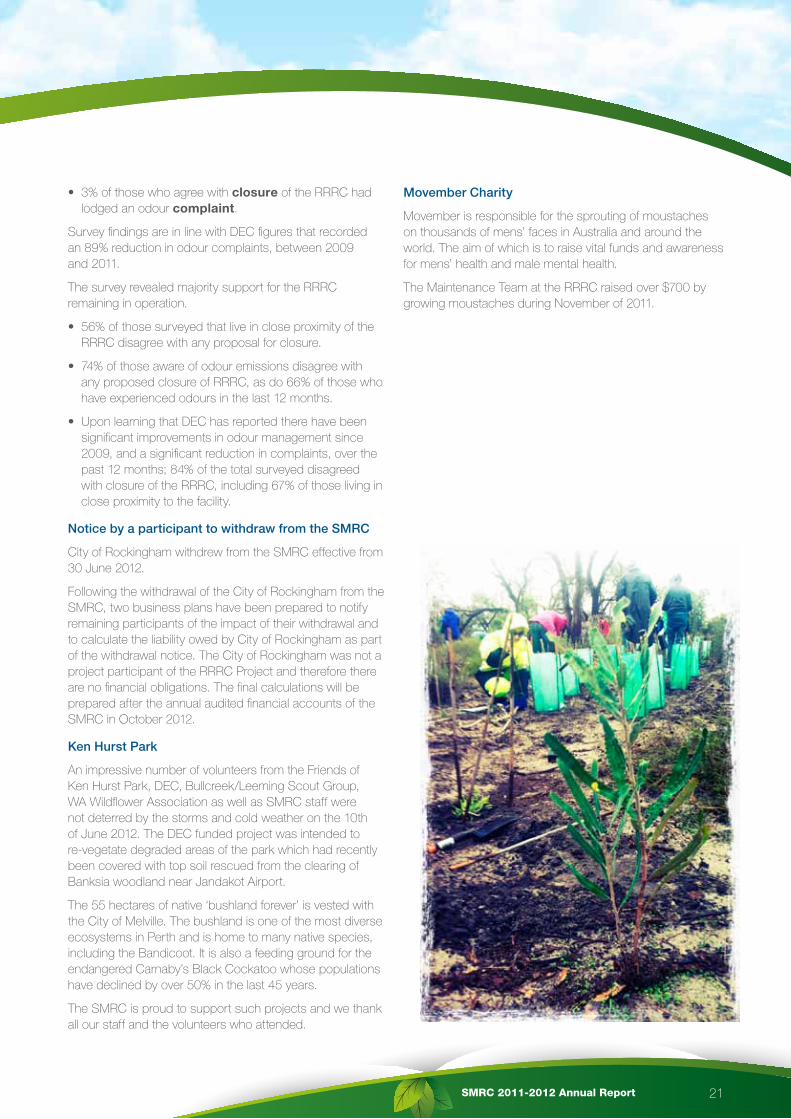
KenHurstPark
An impressive number of volunteers from the Friends of Ken Hurst Park, DEC, Bullcreek/Leeming Scout Group, WA Wildflower Association as well as SMRC staff were not deterred by the storms and cold weather on the 10th of June 2012. The DEC funded project was intended to re-vegetate degraded areas of the park which had recently been covered with top soil rescued from the clearing of Banksia woodland near Jandakot Airport.
The 55 hectares of native ‘bushland forever’ is vested with the City of Melville. The bushland is one of the most diverse ecosystems in Perth and is home to many native species, including the Bandicoot. It is also a feeding ground for the endangered Carnaby’s Black Cockatoo whose populations have declined by over 50% in the last 45 years.
The SMRC is proud to support such projects and we thank all our staff and the volunteers who attended.
MovemberCharity
Movember is responsible for the sprouting of moustaches on thousands of mens’ faces in Australia and around the world. The aim of which is to raise vital funds and awareness for mens’ health and male mental health.
The Maintenance Team at the RRRC raised over $700 by growing moustaches during November of 2011.

SMRC 2011-2012 Annual Report22
Key Focus Area 5 – Research & InnovationBe an innovative provider of resource recovery and greenhouse gas abatement solutions.
Strategy 5.1 Forward PlanningThrough research and development, develop and implement structures and business models to support forward planning.
Key Area
Indicator Measure 11/12 Target
11/12 Actual
Research & innovation
Research Investment
Percentage of total turnover/ operating revenue dedicated to research investment
0.9% 1%
Innovative Projects Undertaken
The number .of innovative projects undertaken as signed off by the audit committee
$5.0 million
$6 million
ResearchInvestmentGoal
To conduct fundamental research to increase understanding of fundamental principles that will lead to pathways of innovation, and to conduct applied research to develop and prove commercial and practical implementation of new and innovative projects.
Result
Expenditure for Research and Development has been within the budget target of $126k.
SummaryofContinuousImprovementProjectsUndertakenin2011/12.
To be an innovative provider of business, resource recovery and greenhouse gas abatement solutions.
Six projects were undertaken during the year.
1. Biofilter Trials Improvement for odour management control
2. Biofilter Water Treatment Upgrade - Improvement for Odour management control
3. Water Treatment for Compost Windrows
4. Waste Composting Humidification Monitoring Systems
5. RRRC Remnant Bushland Plan
6. Community Engagement Plan
10 SUMMARY OF CONTINUOUS IMPROVEMENT PROJECTS
1.BiofilterTrialsImprovement
Biofilters are used to treat odorous air extracted from composting facilities. The material contained within bio-filters to support the natural bacteria that consume the odorous compounds is referred to as the biofilter media. The SMRC biofilters use wood chip material as media.
The installation of these advanced gauges and ducting systems have improved the control and measurement of air flow, thus enabling more reliable data on the biofilter’s performance which can then be up scaled for the enhanced performance of future biofilter bed refurbishment.
2.BiofilterWaterTreatmentUpgrade
Biofilters are used to treat odours produced from composting domestic organic waste.
An improvement method of water treatment was investigated and installed in the largest of the four biofilters on site. Biofilter No 1 was upgraded with re-circulating pumps to reuse and recycle water on the biofilter cells rather than extracting new water supplies.
3.WaterTreatmentforCompostWindrows
Putrescible waste is aerobically treated within a fully enclosed rotating in-vessel digester and buildings and spread in windrows to mature with periodically turning in a fully enclosed aeration building for approximately six weeks.
SMRC invested in an improved water treatment system by installing pipes that recycle excess water from biofilter humidification to improve moisture composition for compost piles during the maturing process.
ResearchInvestment
(%ofincome)
0.9%1.0%
Target Actual
NumberofContinuous
ImprovementProjectsUndertaken
56
Target Actual

SMRC 2011-2012 Annual Report 23
4.WasteCompostingHumidificationMonitoringSystem
Humidifier Probes were installed in June 2012 to chart and report relative humidity, temperature and pressure to ensure the aeration building maintains regular negative pressure.
The report is automatically logged into the facility’s programme control software and is regularly charted 24 hours per day. The plant is manned 24 hours, 7 days by supervisors who regularly review the live chart reporting on monitors or by printout reports over the chart period.
5.RRRCRemnantBushlandPlan
A report was prepared to fulfil the requirement of the Regional Resource Recovery Centre (RRRC) to develop an Environmental Improvement Plan based on the sustainability, long term protection, conservation and restoration of the remnant vegetation onsite.
The report prepared by Randika Jayasinghe, Internship placement in September 2011 was carried out to fulfil the requirements of the AusAID Leadership Awards, as a Practice module component.
There are a number of management measures and recommendations to improve the site conditions in the report.
6.CommunityEngagementPlan
The Community Engagement Strategy details the SMRC communications and stakeholder relations activities pertaining specifically to the community as defined as those directly or indirectly affected by the SMRC operations including the RRRC facility.
SMRC 2011-2012 Annual Report24

SMRC 2011-2012 Annual Report 25
10 Compliance
Plan for the FutureSection 5.53(2)(e) of the Local Government Act 1995 requires local governments to provide an overview of the plan for the future of the district, made in accordance with s.5.56, including major initiatives that are proposed to commence, or to continue, in the next financial year (FY).
The SMRC’s major initiative in its current Strategic Plan is Strategy 1.2 - the re-build of the Materials Recovery Facility at a cost of $20 million funded from insurance claim proceeds. The capital project commenced in FY 2012 and will be completed in early FY 2013.
The SMRC will comply with the new requirements of the Integrated Planning Framework as outlined by Regulation 19C (Strategic Community Plan) and Regulation 19DA (Corporate Business Plan) of the Local Government (Administration) Regulations 1996 for each financial year commencing 1 July 2013.
Statutory Compliance ReturnThe Statutory Compliance Return for the period 1 January 2011 to 31 December 2011 was completed and lodged as required. There were no matters of non-compliance to report.
Payment to EmployeesThe number of employees of the Council, in bands of $10,000 that received an annual cash salary of $100,000 or more.
Salary Range $2012
$2011
$
200,000 - 209,999 1 1
140,000 - 149,999 2 1
130,000 - 139,999 1 1
120,000 - 129,999 - -
110,000 - 119,999 1 2
100,000 - 109,999 1 1
Total 6 6
NUMBER OF EMPLOYEES
The number of full-time and part-time employees as at the balance date. 50 56
National Competition PolicyClause 7 of the Competition Principles Agreement sets out Local Government’s responsibilities under the National Competition Policy. The clause deals with competitive neutrality, structural reform of public monopolies and regulation review.
Application of Competitive Neutrality Principles for significant business activities (business activities where annual income exceeds $200,000) Local Government is required to undertake a cost-benefit analysis to evaluate whether or not competitive neutrality principles should apply. The analysis must take into account all the quantitative and qualitative costs and benefits, which may include economic, social and environmental criteria. Where it is judged that the benefits of implementing competitive neutrality outweigh the costs, then the Local Government must impose costs that the private sector would be required to pay (i.e. payroll tax, Commonwealth & State taxes, debt guarantee fees and other regulatory requirements imposed on private but not government bodies).
The Regional Council has one significant business activity – Regional Resource Recovery Centre (RRRC). The centre meets the “public benefit test” in respect to “user pay charges” and the provision of services is beneficial to the regional community.
Regulatory ReviewUnder clause 7 of the Competition Principles Agreement Local Governments are required to review their Local Laws. The intention of this clause is to ensure existing Local Laws set by Local Governments do not restrict competition unless there are benefits to the community as a whole.
The Southern Metropolitan Regional Council adopted its Standing Orders Local Law on 27 November 2008 and meets the principles of Clause 7.
SMRC 2011-2012 Annual Report26
Record-Keeping PlansPrinciple 6 of the State Records Commission of WA Standard 1/2001 (Record Keeping Plans) refers to compliance requirements by the Regional Council.
• A Record Keeping Plan for the SMRC was approved by the State Records Commission (19/11/2010).
• Staff training programmes for new and existing staff are regularly undertaken to ensure staff comply with the Record Keeping Policy and Procedures.
• An Independent internal audit for record keeping was conducted in October 2010 and achieved an “A” rating (control framework effectively managing risks). The audit scope included:
• Assessing the level of compliance with the Council’s policies and practices in relation to Record Management.
• Assessing the adequacy of controls which ensure compliance with relevant State Records Act legislation.
Disability Access & Inclusion PlanRegional Local Governments are not required to prepare a plan in accordance with S29 of the Disability Services Act 1993.
Environmental Operating LicenceIn May 2012, SMRC was granted an amended two-year operating licence for the Regional Resource Recovery Centre, which requires renewal in 30 March 2014. The licence includes 54 conditions, which will be monitored and evaluated by the Department of Environment and Conservation (DEC). A full copy of the licence can be viewed on SMRC’s website.
The main part of the conditions relate to odour improvement or reduction management of the Centre and in particular, SMRC is required to install and commission, by 15 December 2012, a wet scrubbing or gas scrubbing system which is designed to achieve not less than 85% humidity in biofilter inlet gases. If this system is not be installed by 15 December 2012, SMRC shall cease accepting waste for composting at the premises and only commence the re-acceptance of putrescible waste at the premises for composting when the wet scrubbing or gas scrubbing system has been installed. Following the installation and commissioning of the wet scrubbing or gas scrubbing system, SMRC shall submit a compliance document to DEC certifying the system was constructed in accordance with the licence conditions.
By 15 March 2013, SMRC shall submit an Ambient Odour Assessment Plan Report detailing the results of measuring the odour improvement within the community surrounding the Centre. Should odour emissions not be reduced to DEC’s satisfaction after the completion of the actions in the licence, SMRC will need to submit a works approval for new primary/secondary pollution control equipment in April 2013.
Updates on the status of works required to comply with those conditions along with other information relating to the centre is available on SMRC’s website for further reading.
The Regional Resource Recovery Centre (RRRC) is required to provide an audit compliance report on an annual basis to the Department of Environment and Conservation (DEC). This is a legal requirement under part V of the Environmental Protection Act 1986 and stipulated as a condition in the RRRC operating licence. The report was forwarded to DEC in November 2011.
SMRC 2011-2012 Annual Report 27
SMRC 2011-2012 Annual Report28
11 Financial Report

SMRC 2011-2012 Annual Report 29
Note 2012 2012 2011Budget
$ $ $
REVENUEOperating Grants, Subsidies and Contributions 22 3,551,188 3,671,007 6,871,678 Fees and Charges 23 16,384,710 17,082,972 14,850,851 Interest Earnings 2(a) 925,117 540,000 265,978 Other Revenues 101,215 212,000 97,909
20,962,230 21,505,979 22,086,416 EXPENSESEmployee Costs (4,741,949) (5,110,153) (4,569,378) Materials and Contracts (9,131,195) (10,349,094) (8,294,287) Utility Charges (1,955,452) (1,922,028) (1,738,982) Depreciation on Non-current Assets 2(a) (4,165,785) (4,202,954) (4,016,604) Interest Expenses 31 (2,901,010) (2,918,061) (3,236,534) Insurance Expenses (1,219,392) (1,401,643) (683,787)
(24,114,783) (25,903,933) (22,539,572) (3,152,553) (4,397,954) (453,156)
Non Operating Grants, Subsidies and Contributions 22 - - 6,451,283 Fair value adjustment to financial assets at fair value through profit and loss 4 - - (25,000) Realised gain on Investments 4 - - 75,000 Profit on Asset Disposals 25 - - 32,076
NET RESULT (3,152,553) (4,397,954) 6,080,203
Other Comprehensive Income - - - Total Other Comprehensive Income - - -
TOTAL COMPREHENSIVE INCOME (3,152,553) (4,397,954) 6,080,203
This statement is to be read in conjunction with the accompanying notes.
SOUTHERN METROPOLITAN REGIONAL COUNCIL
STATEMENT OF COMPREHENSIVE INCOME
BY NATURE OR TYPE
FOR THE YEAR ENDED 30 JUNE 2012
3

SMRC 2011-2012 Annual Report30
Note 2012 2012 2011Budget
$ $ $
REVENUE 2(a)Governance 316,750 361,750 333,692 Community Amenities 20,645,480 21,144,229 21,752,724
20,962,230 21,505,979 22,086,416
EXPENSES EXCLUDING FINANCE COSTS 2(a)Governance (306,553) (361,750) (257,934) Community Amenities (20,907,220) (22,624,122) (19,045,104)
(21,213,773) (22,985,872) (19,303,038)
FINANCE COSTS 31Governance (103,315) (103,320) (110,033) Community Amenities (2,797,695) (2,814,741) (3,126,501)
(2,901,010) (2,918,061) (3,236,534)
Fair value adjustment to financial assets at fair value through profit and lossGovernance - - (25,000)
Non Operating Grants, Subsidies and ContributionsCommunity Amenities - - 6,451,283
Realised gain on InvestmentsGovernance - - 75,000
Profit on Asset DisposalsGovernance - - 4,076 Community Amenities - - 28,000
NET RESULT (3,152,553) (4,397,954) 6,080,203
Other Comprehensive Income - - - Total Other Comprehensive Income - - -
TOTAL COMPREHENSIVE INCOME (3,152,553) (4,397,954) 6,080,203
This statement is to be read in conjunction with the accompanying notes.
SOUTHERN METROPOLITAN REGIONAL COUNCIL
STATEMENT OF COMPREHENSIVE INCOME
BY PROGRAM
FOR THE YEAR ENDED 30 JUNE 2012
4

SMRC 2011-2012 Annual Report 31
Note 2012 2011$ $
CURRENT ASSETSCash and Cash Equivalents 3 11,500,403 7,968,573 Investments 4 - - Trade and Other Receivables 5 13,633,370 30,788,226 Inventories 6 239,109 249,743 TOTAL CURRENT ASSETS 25,372,882 39,006,542
NON-CURRENT ASSETSOther Receivables 5 34,947,016 36,155,165 Property, Plant and Equipment 7 48,553,627 39,994,991 TOTAL NON-CURRENT ASSETS 83,500,643 76,150,156
TOTAL ASSETS 108,873,525 115,156,698
CURRENT LIABILITIESTrade and Other Payables 8 3,760,402 2,831,072 Current portion of Long-term Borrowings 9 11,262,523 13,582,317 Provisions 10 461,711 371,466 TOTAL CURRENT LIABILITIES 15,484,636 16,784,855
NON-CURRENT LIABILITIESLong-term Borrowings 9 34,947,016 36,155,165 Provisions 10 141,774 151,273 TOTAL NON-CURRENT LIABILITIES 35,088,790 36,306,438
TOTAL LIABILITIES 50,573,426 53,091,293
NET ASSETS 58,300,099 62,065,405
EQUITYRetained Surplus 47,135,063 49,952,635 Reserves- Cash backed 11 2,908,444 3,856,178 Reserves - Asset Revaluation 12 8,256,592 8,256,592 TOTAL EQUITY 58,300,099 62,065,405
This statement is to be read in conjunction with the accompanying notes.
SOUTHERN METROPOLITAN REGIONAL COUNCIL
STATEMENT OF FINANCIAL POSITION
AS AT 30 JUNE 2012
5

SMRC 2011-2012 Annual Report32
Note Retained Reserves Asset TotalSurplus Cash Revaluation Equity
Backed Reserve$ $ $ $
Balance as at 1 July 2010 46,370,227 1,982,917 8,256,592 56,609,736
Net Result 6,080,203 - - 6,080,203 Total Other Comprehensive Income - - - - Participants Contributions for the year (New Loans) - - - - Loans repaid from Equity (624,534) - - (624,534) Transfer from / (to) Reserves 11 (1,873,261) 1,873,261 - -
Balance as at 30 June 2011 49,952,635 3,856,178 8,256,592 62,065,405
Net Result (3,152,553) - - (3,152,553) Total Other Comprehensive Income - - - - Participants Contributions for the year (New Loans) - - - - Loans repaid from Equity (612,753) - - (612,753) Transfer from / (to) Reserves 11 947,734 (947,734) - -
Balance as at 30 June 2012 47,135,063 2,908,444 8,256,592 58,300,099
This statement is to be read in conjunction with the accompanying notes.
SOUTHERN METROPOLITAN REGIONAL COUNCIL
STATEMENT OF CHANGES IN EQUITY
FOR THE YEAR ENDED 30 JUNE 2012
6
SMRC 2011-2012 Annual Report 33
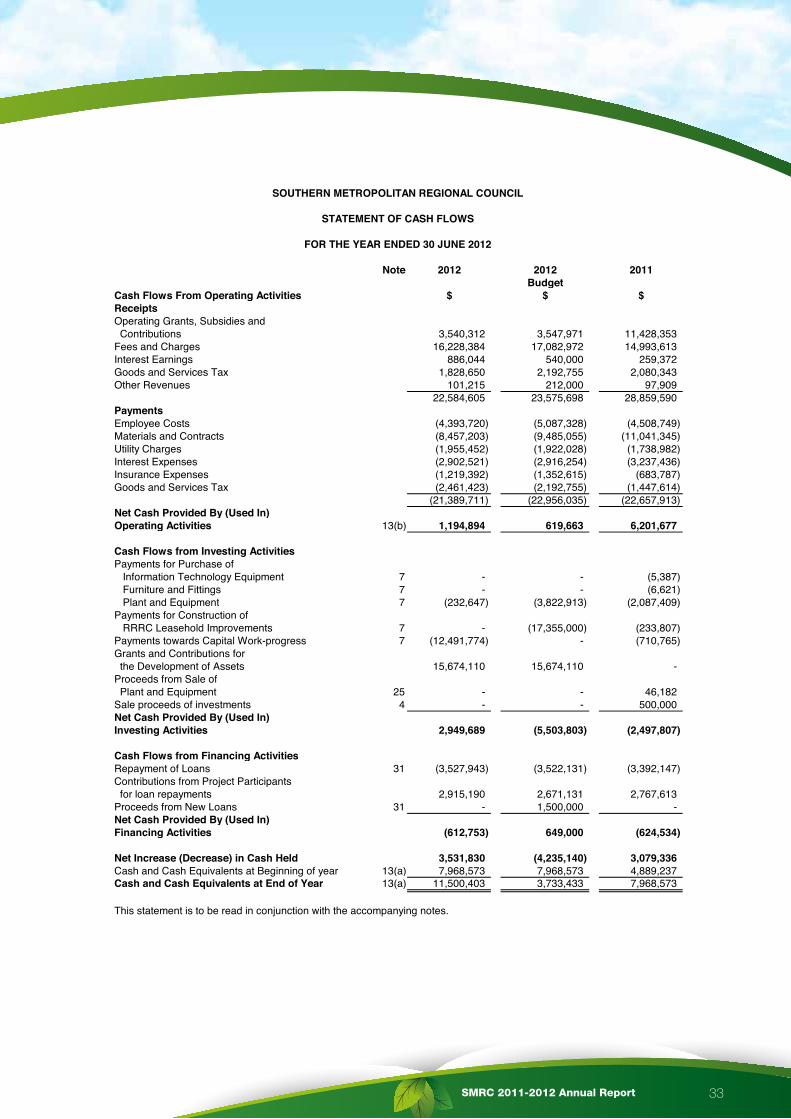
Note 2012 2012 2011Budget
Cash Flows From Operating Activities $ $ $ReceiptsOperating Grants, Subsidies and Contributions 3,540,312 3,547,971 11,428,353 Fees and Charges 16,228,384 17,082,972 14,993,613 Interest Earnings 886,044 540,000 259,372 Goods and Services Tax 1,828,650 2,192,755 2,080,343 Other Revenues 101,215 212,000 97,909
22,584,605 23,575,698 28,859,590 PaymentsEmployee Costs (4,393,720) (5,087,328) (4,508,749) Materials and Contracts (8,457,203) (9,485,055) (11,041,345) Utility Charges (1,955,452) (1,922,028) (1,738,982) Interest Expenses (2,902,521) (2,916,254) (3,237,436) Insurance Expenses (1,219,392) (1,352,615) (683,787) Goods and Services Tax (2,461,423) (2,192,755) (1,447,614)
(21,389,711) (22,956,035) (22,657,913) Net Cash Provided By (Used In)Operating Activities 13(b) 1,194,894 619,663 6,201,677
Cash Flows from Investing ActivitiesPayments for Purchase of Information Technology Equipment 7 - - (5,387) Furniture and Fittings 7 - - (6,621) Plant and Equipment 7 (232,647) (3,822,913) (2,087,409) Payments for Construction of RRRC Leasehold Improvements 7 - (17,355,000) (233,807) Payments towards Capital Work-progress 7 (12,491,774) - (710,765) Grants and Contributions for the Development of Assets 15,674,110 15,674,110 - Proceeds from Sale of Plant and Equipment 25 - - 46,182 Sale proceeds of investments 4 - - 500,000 Net Cash Provided By (Used In)Investing Activities 2,949,689 (5,503,803) (2,497,807)
Cash Flows from Financing ActivitiesRepayment of Loans 31 (3,527,943) (3,522,131) (3,392,147) Contributions from Project Participants for loan repayments 2,915,190 2,671,131 2,767,613 Proceeds from New Loans 31 - 1,500,000 - Net Cash Provided By (Used In)Financing Activities (612,753) 649,000 (624,534)
Net Increase (Decrease) in Cash Held 3,531,830 (4,235,140) 3,079,336 Cash and Cash Equivalents at Beginning of year 13(a) 7,968,573 7,968,573 4,889,237 Cash and Cash Equivalents at End of Year 13(a) 11,500,403 3,733,433 7,968,573
This statement is to be read in conjunction with the accompanying notes.
SOUTHERN METROPOLITAN REGIONAL COUNCIL
STATEMENT OF CASH FLOWS
FOR THE YEAR ENDED 30 JUNE 2012
7
SMRC 2011-2012 Annual Report34
SOUTHERN METROPOLITAN REGIONAL COUNCIL NOTES TO AND FORMING PART OF THE FINANCIAL REPORT
FOR THE YEAR ENDED 30 JUNE 2012
8
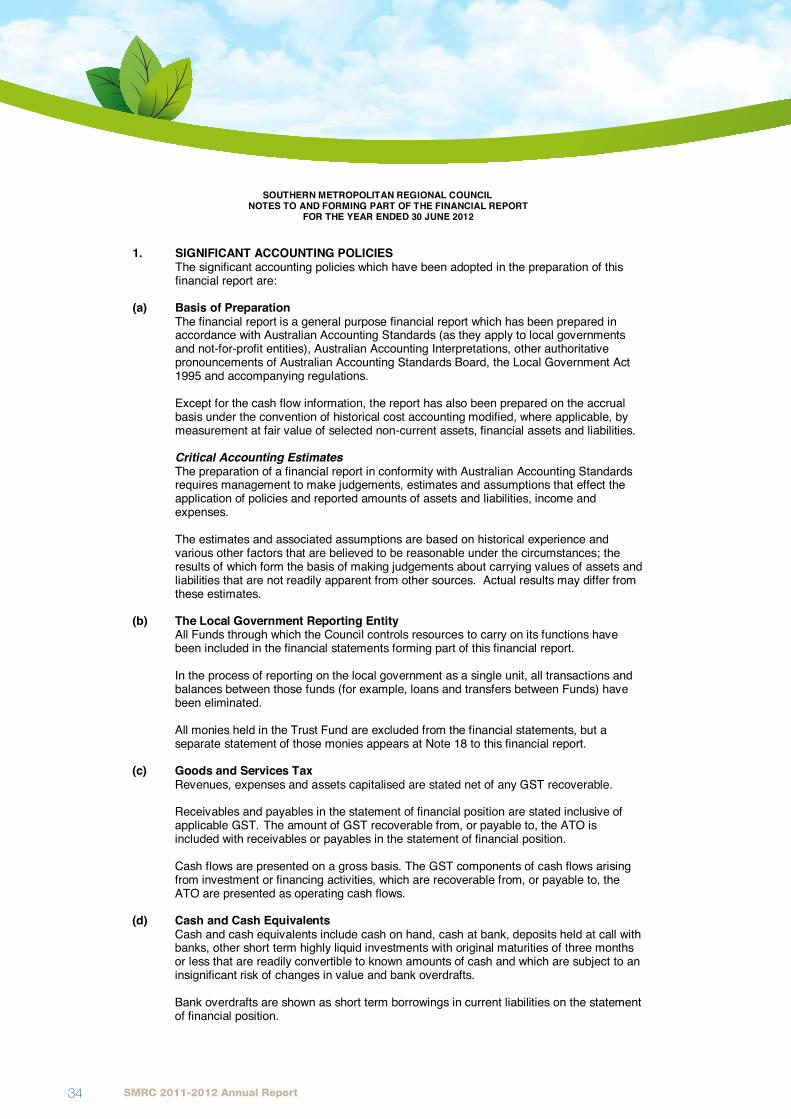
1. SIGNIFICANT ACCOUNTING POLICIES The significant accounting policies which have been adopted in the preparation of this financial report are: (a) Basis of Preparation The financial report is a general purpose financial report which has been prepared in
accordance with Australian Accounting Standards (as they apply to local governments and not-for-profit entities), Australian Accounting Interpretations, other authoritative pronouncements of Australian Accounting Standards Board, the Local Government Act 1995 and accompanying regulations. Except for the cash flow information, the report has also been prepared on the accrual basis under the convention of historical cost accounting modified, where applicable, by measurement at fair value of selected non-current assets, financial assets and liabilities.
Critical Accounting Estimates The preparation of a financial report in conformity with Australian Accounting Standards requires management to make judgements, estimates and assumptions that effect the application of policies and reported amounts of assets and liabilities, income and expenses.
The estimates and associated assumptions are based on historical experience and
various other factors that are believed to be reasonable under the circumstances; the results of which form the basis of making judgements about carrying values of assets and liabilities that are not readily apparent from other sources. Actual results may differ from these estimates.
(b) The Local Government Reporting Entity
All Funds through which the Council controls resources to carry on its functions have been included in the financial statements forming part of this financial report.
In the process of reporting on the local government as a single unit, all transactions and balances between those funds (for example, loans and transfers between Funds) have been eliminated.
All monies held in the Trust Fund are excluded from the financial statements, but a separate statement of those monies appears at Note 18 to this financial report.
(c) Goods and Services Tax Revenues, expenses and assets capitalised are stated net of any GST recoverable. Receivables and payables in the statement of financial position are stated inclusive of
applicable GST. The amount of GST recoverable from, or payable to, the ATO is included with receivables or payables in the statement of financial position.
Cash flows are presented on a gross basis. The GST components of cash flows arising
from investment or financing activities, which are recoverable from, or payable to, the ATO are presented as operating cash flows.
(d) Cash and Cash Equivalents Cash and cash equivalents include cash on hand, cash at bank, deposits held at call with
banks, other short term highly liquid investments with original maturities of three months or less that are readily convertible to known amounts of cash and which are subject to an insignificant risk of changes in value and bank overdrafts.
Bank overdrafts are shown as short term borrowings in current liabilities on the statement
of financial position.

SMRC 2011-2012 Annual Report 35
SOUTHERN METROPOLITAN REGIONAL COUNCIL NOTES TO AND FORMING PART OF THE FINANCIAL REPORT
FOR THE YEAR ENDED 30 JUNE 2012
1. SIGNIFICANT ACCOUNTING POLICIES (Continued)
9
(e) Trade and Other Receivables Collectibility of trade receivables is reviewed on an ongoing basis. Debts that are known to be uncollectible are written off when identified. An allowance for doubtful debts is raised when there is objective evidence that they will not be collectible.
(f) Inventories Inventories are valued at the lower of cost and net realisable value. Net realisable value
is the estimated selling price in the ordinary course of business less the estimated costs of completion and the estimated cost necessary to make the sale.
(g) Fixed Assets
Each class of fixed assets is carried at cost or fair value as indicated less, where applicable, any accumulated depreciation and impairment losses.
Initial Recognition All assets are initially recognised at cost. Cost is determined as the fair value of the
assets given as consideration plus costs incidental to the acquisition. For assets acquired at no cost or for nominal consideration, cost is determined as fair value at the date of acquisition. The cost of non-current assets constructed includes the cost of all materials used in construction, direct labour on the project and an appropriate portion of variable and fixed overheads.
Subsequent costs are included in the asset’s carrying amount or recognised as a
separate asset, as appropriate, only when it is probable that future economic benefits associated with the item will flow to the Council and the cost of the item can be measured reliably. All other repairs and maintenance are recognised as expenses in the statement of comprehensive income in the period in which they are incurred.
Revaluation Certain asset classes may be revalued on a regular basis such that the carrying values
are not materially different from fair value. For asset classes where no active market exists, fair value is determined to be the current replacement cost of an asset less, where applicable, accumulated depreciation calculated on the basis of such cost to reflect the already consumed or expired future economic benefits of the asset.
Increases in the carrying amount arising on revaluation of assets are credited to a
revaluation surplus in equity. Decreases that offset previous increases in the same asset are charged against revaluation surplus directly in equity; all other decreases are charged to the statement of comprehensive income. Any accumulated depreciation at the date of revaluation is eliminated against the gross carrying amount of the asset and the net amount is restated to the revalued amount of the asset. Those assets carried at a revalued amount, being their fair value at the date of revaluation less any subsequent accumulated depreciation and accumulated impairment losses, are to be revalued with sufficient regularity to ensure the carrying amount does not differ materially from that determined using fair value at reporting date.
Depreciation of Non-Current Assets All non-current assets having a limited useful life where the cost / fair value exceeds
$2,000 for furniture, computer and electronic equipment, $5,000 for vehicles, mobile plant and equipment, and $10,000 for fixed plant and equipment, buildings and infrastructure assets are systematically depreciated over their useful lives in a manner which reflects the consumption of the future economic benefits embodied in those assets.

SMRC 2011-2012 Annual Report36
SOUTHERN METROPOLITAN REGIONAL COUNCIL NOTES TO AND FORMING PART OF THE FINANCIAL REPORT
FOR THE YEAR ENDED 30 JUNE 2012
1. SIGNIFICANT ACCOUNTING POLICIES (Continued)
10
(g) Depreciation of Non-Current Assets (Continued) Assets are depreciated from the date of acquisition or, in respect of internally constructed
assets, from the time the asset is completed and held ready for use. Depreciation is recognised on a straight line basis, using rates which are reviewed each
reporting period. The fair value of leasehold improvements is capitalised and the fair value is amortised over the unexpired period of the lease or the estimated useful lives of the improvements, whichever is the shorter.
Major depreciation periods are: Computer Equipment 3 to 5 years Furniture and Equipment 5 to 10 years Plant and Equipment 4 to 15 years Leasehold Improvements 10 to 50 years Freehold Buildings 40 years
The assets residual values and useful lives are reviewed, and adjusted if appropriate, at the end of each reporting period. An asset's carrying amount is written down immediately to its recoverable amount if the asset's carrying amount is greater than its estimated recoverable amount. Gains and losses on disposals are determined by comparing proceeds with the carrying amount. These gains and losses are included in the statement of comprehensive income. When revalued assets are sold, amounts included in the revaluation surplus relating to that asset are transferred to retained earnings.
(h) Financial Instruments Initial Recognition and Measurement
Financial assets and financial liabilities are recognised when the Council becomes a party to the contractual provisions to the instrument. For financial assets, this is equivalent to the date that the Council commits itself to either the purchase or sale of the asset (i.e. trade date accounting is adopted).
Financial instruments are initially measured at fair value plus transaction costs, except where the instrument is classified ‘at fair value through profit of loss’, in which case transaction costs are expensed to profit or loss immediately.
Classification and Subsequent Measurement Financial instruments are subsequently measured at fair value, amortised cost using the effective interest rate method or cost.
Fair value represents the amount for which an asset could be exchanged or a liability settled, between knowledgeable, willing parties. Where available, quoted prices in an active market are used to determine fair value. In other circumstances, valuation techniques are adopted.
Amortised cost is calculated as: a) the amount in which the financial asset or financial liability is measured at initial
recognition; b) less principal repayments; c) plus or minus the cumulative amortisation of the difference, if any, between the
amount initially recognised and the maturity amount calculated using the effective interest rate method; and
d) less any reduction for impairment.
SMRC 2011-2012 Annual Report 37
SOUTHERN METROPOLITAN REGIONAL COUNCIL NOTES TO AND FORMING PART OF THE FINANCIAL REPORT
FOR THE YEAR ENDED 30 JUNE 2012
1. SIGNIFICANT ACCOUNTING POLICIES (Continued)
11
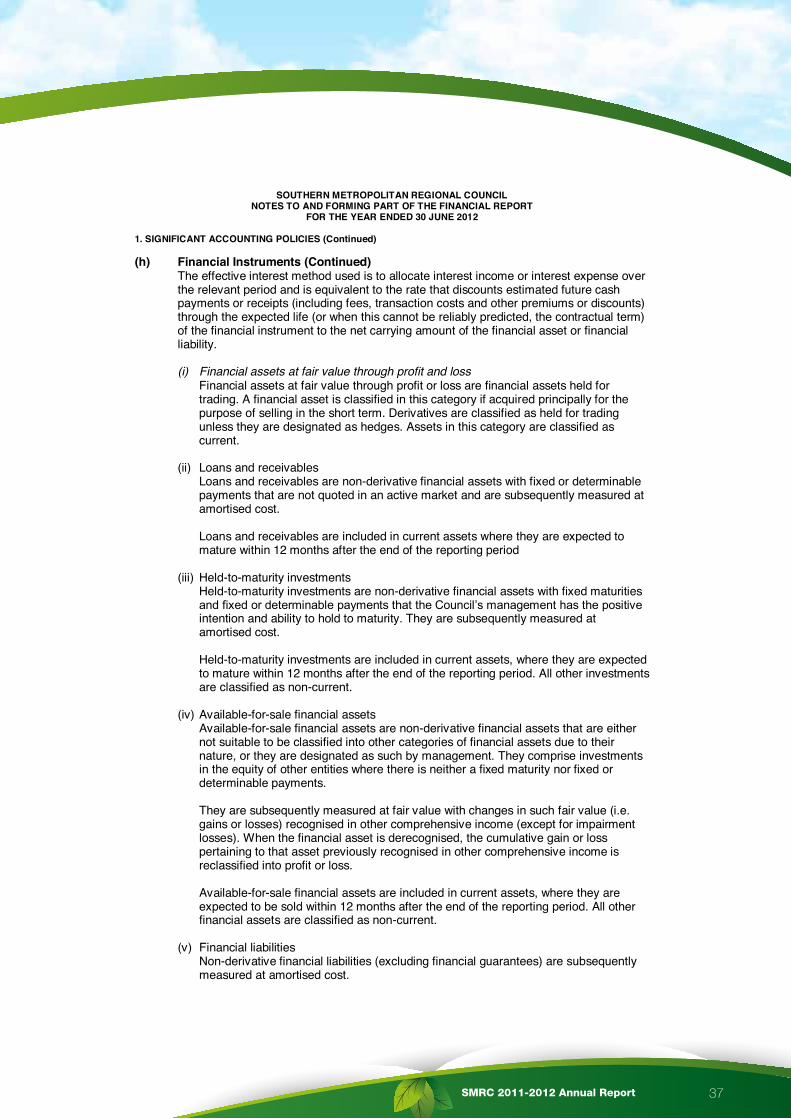
(h) Financial Instruments (Continued) The effective interest method used is to allocate interest income or interest expense over the relevant period and is equivalent to the rate that discounts estimated future cash payments or receipts (including fees, transaction costs and other premiums or discounts) through the expected life (or when this cannot be reliably predicted, the contractual term) of the financial instrument to the net carrying amount of the financial asset or financial liability. (i) Financial assets at fair value through profit and loss
Financial assets at fair value through profit or loss are financial assets held for trading. A financial asset is classified in this category if acquired principally for the purpose of selling in the short term. Derivatives are classified as held for trading unless they are designated as hedges. Assets in this category are classified as current.
(ii) Loans and receivables
Loans and receivables are non-derivative financial assets with fixed or determinable payments that are not quoted in an active market and are subsequently measured at amortised cost.
Loans and receivables are included in current assets where they are expected to mature within 12 months after the end of the reporting period
(iii) Held-to-maturity investments
Held-to-maturity investments are non-derivative financial assets with fixed maturities and fixed or determinable payments that the Council’s management has the positive intention and ability to hold to maturity. They are subsequently measured at amortised cost. Held-to-maturity investments are included in current assets, where they are expected to mature within 12 months after the end of the reporting period. All other investments are classified as non-current.
(iv) Available-for-sale financial assets
Available-for-sale financial assets are non-derivative financial assets that are either not suitable to be classified into other categories of financial assets due to their nature, or they are designated as such by management. They comprise investments in the equity of other entities where there is neither a fixed maturity nor fixed or determinable payments.
They are subsequently measured at fair value with changes in such fair value (i.e. gains or losses) recognised in other comprehensive income (except for impairment losses). When the financial asset is derecognised, the cumulative gain or loss pertaining to that asset previously recognised in other comprehensive income is reclassified into profit or loss.
Available-for-sale financial assets are included in current assets, where they are expected to be sold within 12 months after the end of the reporting period. All other financial assets are classified as non-current.
(v) Financial liabilities
Non-derivative financial liabilities (excluding financial guarantees) are subsequently measured at amortised cost.
SMRC 2011-2012 Annual Report38
SOUTHERN METROPOLITAN REGIONAL COUNCIL NOTES TO AND FORMING PART OF THE FINANCIAL REPORT
FOR THE YEAR ENDED 30 JUNE 2012
1. SIGNIFICANT ACCOUNTING POLICIES (Continued)
12
(h) Financial Instruments (Continued) Impairment At the end of each reporting period, the Council assesses whether there is objective evidence that a financial instrument has been impaired. In the case of available-for-sale financial instruments, a prolonged decline in the value of the instrument is considered to determine whether impairment has arisen. Impairment losses are recognised in profit or loss. Any cumulative decline in fair value previously recognised in other comprehensive income is reclassified to profit or loss at this point. Derecognition Financial assets are derecognised where the contractual rights to receipt of cash flows expire or the asset is transferred to another party whereby the Council no longer has any significant continual involvement in the risks and benefits associated with the asset. Financial liabilities are derecognised where the related obligations are discharged, cancelled or expired. The difference between the carrying amount of the financial liability extinguished or transferred to another party and the fair value of the consideration paid, including the transfer of non-cash assets or liabilities assumed, is recognised in profit or loss.
(i) Impairment
In accordance with Australian Accounting Standards, the Council’s assets, other than inventories, are assessed at each reporting date to determine whether there is any indication they may be impaired.
Where such an indication exists, an impairment test is carried out on the asset by comparing the recoverable amount of the asset, being the higher of the asset’s fair value less costs to sell and value in use, to the asset’s carrying amount.
Any excess of the asset’s carrying amount over its recoverable amount is recognised immediately in profit or loss, unless the asset is carried at a revalued amount in accordance with another standard (e.g. AASB 116) whereby any impairment loss of a revalued asset is treated as a revaluation decrease in accordance with that other standard.
For non-cash generating assets such as roads and drains, value in use is represented by the depreciated replacement cost of the asset.
(j) Trade and Other Payables
Trade and other payables represent liabilities for goods and services provided to the Council prior to the end of the financial year that are unpaid and arise when the Council becomes obliged to make future payments in respect of the purchase of these goods and services. The amounts are unsecured and are usually paid within 30 days of recognition.
(k) Employee Benefits
Provision is made for the Council’s liability for employee benefits arising from services rendered by employees to the end of the reporting period. Employee benefits that are expected to be settled within one year have been measured at the amounts expected to be paid when the liability is settled. Employee benefits payable later than one year have been measured at the present value of the estimated future cash outflows to be made for those benefits. In determining the liability, consideration is given to employee wage increases and the probability that the employee may not satisfy vesting requirements. Those cash flows are discounted using market yields on national government bonds with terms to maturity that match the expected timing of cash flows.
SMRC 2011-2012 Annual Report 39
SOUTHERN METROPOLITAN REGIONAL COUNCIL NOTES TO AND FORMING PART OF THE FINANCIAL REPORT
FOR THE YEAR ENDED 30 JUNE 2012
1. SIGNIFICANT ACCOUNTING POLICIES (Continued)
13
(l) Borrowing Costs Borrowing costs are recognised as an expense when incurred except where they are directly attributable to the acquisition, construction or production of a qualifying asset. Where this is the case, they are capitalised as part of the cost of the particular asset. (m) Provisions Provisions are recognised when a) The council has a present legal or constructive obligation as a result of past events, b) for which it is probable that an outflow of resources will be required to settle the obligation; and c) the amount has been reliably measured. Provisions are measured using the best estimate of the amounts required to settle the obligation at the end of the reporting period. (n) Leases
Leases of fixed assets, where substantially all the risks and benefits incidental to the ownership of the asset, but not legal ownership, are transferred to the Council, are classified as finance leases. Finance leases are capitalised recording an asset and a liability at the lower amounts equal to the fair value of the leased property or the present value of the minimum lease payments, including any guaranteed residual values. Lease payments are allocated between the reduction of the lease liability and the lease interest expense for the period. Leased assets are depreciated on a straight line basis over the shorter of their estimated useful lives or the lease term. Lease payments for operating leases, where substantially all the risks and benefits remain with the lessor, are charged as expenses in the periods in which they are incurred. Lease incentives under operating leases are recognised as a liability and amortised on a straight line basis over the life of the lease term.
(o) Grants, Donations and Other Contributions Grants, donations and other contributions are recognised as revenues when the local government obtains control over the assets comprising the contributions.
Where contributions recognised as revenues during the reporting period were obtained
on the condition that they be expended in a particular manner or used over a particular period, and those conditions were undischarged as at the reporting date, the nature of and amounts pertaining to those undischarged conditions are disclosed in Note 2(c). That note also discloses the amount of contributions recognised as revenues in a previous reporting period which were obtained in respect of the local government's operation for the current reporting period.
(p) Superannuation The Council contributes to a number of Superannuation Funds on behalf of employees.
All the funds are defined contribution schemes.
SMRC 2011-2012 Annual Report40
SOUTHERN METROPOLITAN REGIONAL COUNCIL NOTES TO AND FORMING PART OF THE FINANCIAL REPORT
FOR THE YEAR ENDED 30 JUNE 2012
1. SIGNIFICANT ACCOUNTING POLICIES (Continued)
14
(q) Current and Non-Current Classification In the determination of whether an asset or liability is current or non-current, consideration is given to the time when each asset or liability is expected to be settled. The asset or liability is classified as current if it is expected to be settled within the next 12 months, being the Council’s operational cycle. In the case of liabilities where Council does not have the unconditional right to defer settlement beyond 12 months, such as vested long service leave, the liability is classified as current even if not expected to be settled within the next 12 months. Inventories held for trading are classified as current even if not expected to be realised in the next 12 months.
( r) Rates The Council does not levy rates. Accordingly, the rating statement and information as
required by the Local Government Act (Financial Management Regulations) has not been presented in these financial reports.
(s) Participants Contribution The Participants contributions towards the Regional Resource Recovery Centre (RRRC)
is treated as an equity contribution. The Participants Equity is also credited when loans are taken which are guaranteed by SMRC/ RRRC participants. The corresponding liability of participants is shown as a receivable.
However, when loans are repaid by the Council without seeking funds from the project
participants, the receivables and equity are reduced by the amount of loans repaid. (t) Rounding of amounts All figures shown in this financial report are rounded to the nearest dollar. (u) Comparative Figures Where required, comparative figures have been adjusted to conform to the changes in
presentation of the current financial year. When the Council applies an accounting policy retrospectively, makes a retrospective
restatement or reclassifies items in its financial statement, a statement of financial position as at the beginning of the earliest period will be disclosed.
(v) Budget Comparative Figures Unless otherwise stated, the budget comparative figures shown in the financial report
relate to the approved revised budget estimate for the relevant item of disclosure.
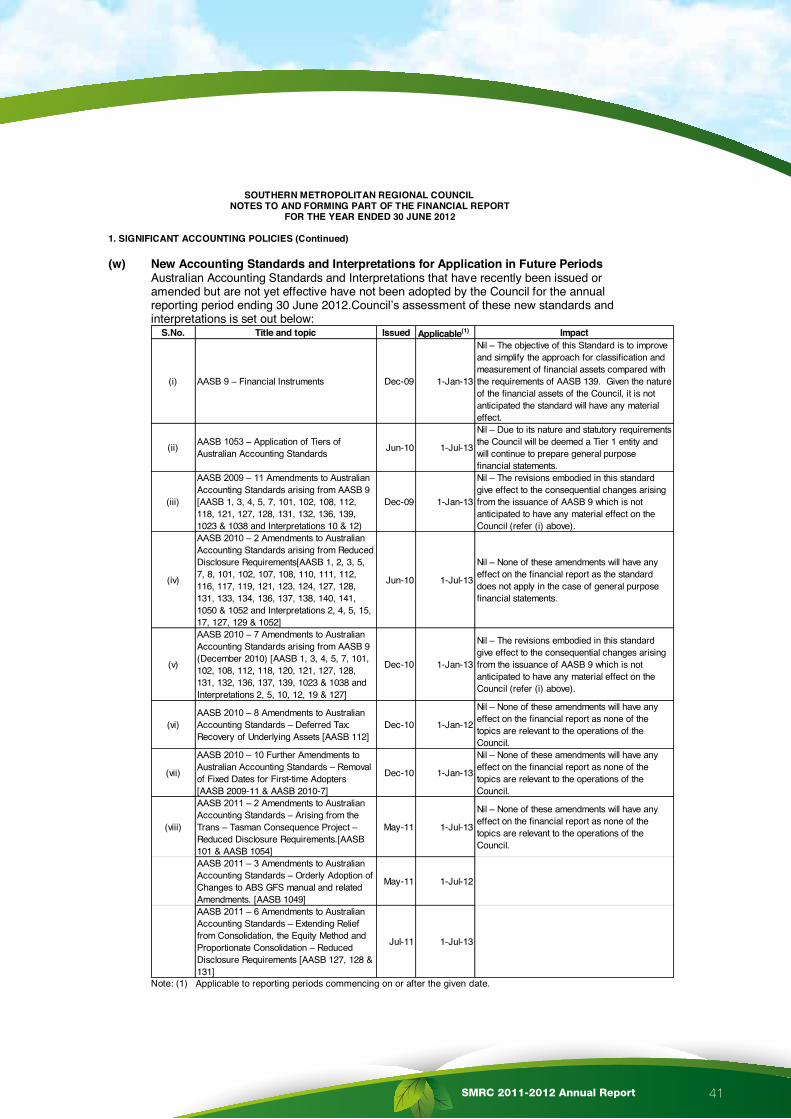
SMRC 2011-2012 Annual Report 41
SOUTHERN METROPOLITAN REGIONAL COUNCIL NOTES TO AND FORMING PART OF THE FINANCIAL REPORT
FOR THE YEAR ENDED 30 JUNE 2012
1. SIGNIFICANT ACCOUNTING POLICIES (Continued)
15
(w) New Accounting Standards and Interpretations for Application in Future Periods
Australian Accounting Standards and Interpretations that have recently been issued or amended but are not yet effective have not been adopted by the Council for the annual reporting period ending 30 June 2012.Council’s assessment of these new standards and interpretations is set out below:
S.No. Title and topic Issued Applicable(1) Impact
(i) AASB 9 – Financial Instruments Dec-09 1-Jan-13
Nil – The objective of this Standard is to improve and simplify the approach for classification and measurement of financial assets compared with the requirements of AASB 139. Given the nature of the financial assets of the Council, it is not anticipated the standard will have any material effect.
(ii) AASB 1053 – Application of Tiers of Australian Accounting Standards Jun-10 1-Jul-13
Nil – Due to its nature and statutory requirements the Council will be deemed a Tier 1 entity and will continue to prepare general purpose financial statements.
(iii)
AASB 2009 – 11 Amendments to Australian Accounting Standards arising from AASB 9 [AASB 1, 3, 4, 5, 7, 101, 102, 108, 112, 118, 121, 127, 128, 131, 132, 136, 139, 1023 & 1038 and Interpretations 10 & 12)
Dec-09 1-Jan-13
Nil – The revisions embodied in this standard give effect to the consequential changes arising from the issuance of AASB 9 which is not anticipated to have any material effect on the Council (refer (i) above).
(iv)
AASB 2010 – 2 Amendments to Australian Accounting Standards arising from Reduced Disclosure Requirements[AASB 1, 2, 3, 5, 7, 8, 101, 102, 107, 108, 110, 111, 112, 116, 117, 119, 121, 123, 124, 127, 128, 131, 133, 134, 136, 137, 138, 140, 141, 1050 & 1052 and Interpretations 2, 4, 5, 15, 17, 127, 129 & 1052]
Jun-10 1-Jul-13
Nil – None of these amendments will have any effect on the financial report as the standard does not apply in the case of general purpose financial statements.
(v)
AASB 2010 – 7 Amendments to Australian Accounting Standards arising from AASB 9 (December 2010) [AASB 1, 3, 4, 5, 7, 101, 102, 108, 112, 118, 120, 121, 127, 128, 131, 132, 136, 137, 139, 1023 & 1038 and Interpretations 2, 5, 10, 12, 19 & 127]
Dec-10 1-Jan-13
Nil – The revisions embodied in this standard give effect to the consequential changes arising from the issuance of AASB 9 which is not anticipated to have any material effect on the Council (refer (i) above).
(vi)AASB 2010 – 8 Amendments to Australian Accounting Standards – Deferred Tax: Recovery of Underlying Assets [AASB 112]
Dec-10 1-Jan-12
Nil – None of these amendments will have any effect on the financial report as none of the topics are relevant to the operations of the Council.
(vii)
AASB 2010 – 10 Further Amendments to Australian Accounting Standards – Removal of Fixed Dates for First-time Adopters [AASB 2009-11 & AASB 2010-7]
Dec-10 1-Jan-13
Nil – None of these amendments will have any effect on the financial report as none of the topics are relevant to the operations of the Council.
(viii)
AASB 2011 – 2 Amendments to Australian Accounting Standards – Arising from the Trans – Tasman Consequence Project – Reduced Disclosure Requirements.[AASB 101 & AASB 1054]
May-11 1-Jul-13
Nil – None of these amendments will have any effect on the financial report as none of the topics are relevant to the operations of the Council.
AASB 2011 – 3 Amendments to Australian Accounting Standards – Orderly Adoption of Changes to ABS GFS manual and related Amendments. [AASB 1049]
May-11 1-Jul-12
AASB 2011 – 6 Amendments to Australian Accounting Standards – Extending Relief from Consolidation, the Equity Method and Proportionate Consolidation – Reduced Disclosure Requirements [AASB 127, 128 & 131]
Jul-11 1-Jul-13
Note: (1) Applicable to reporting periods commencing on or after the given date.

SMRC 2011-2012 Annual Report42
SOUTHERN METROPOLITAN REGIONAL COUNCIL NOTES TO AND FORMING PART OF THE FINANCIAL REPORT
FOR THE YEAR ENDED 30 JUNE 2012
1. SIGNIFICANT ACCOUNTING POLICIES (Continued)
16
(w) New Accounting Standards and Interpretations for Application in Future Periods (Continued)
S.No. Title and topic Issued Applicable(1) Impact
(ix)
AASB 10 – Consolidated Financial Statements AASB 11 – Joint Arrangements AASB 12 – Disclosure of Interests in Other Entities AASB 127 – Separate Financial Statements AASB 128 – Investments in Associates and Joint Ventures AASB 2011 – 7 Amendments to Australian Accounting Standards arising from the Consolidation and Joint Arrangement Standards [AASB 1, 2, 3, 5, 7, 9, 2009-11, 101, 107, 112, 118, 121, 124, 132, 133, 131, 138, 139, 1023 & 1038 and Interpretations 5, 9, 16 & 17]
Aug-11 1-Jan-13Nil – None of these amendments are expected to have significant application to the operations of the Council.
(x)
AASB 13 – Fair Value Measurement AASB 2011 – 8 Amendments to Australian Accounting Standards arising from AASB 13 [AASB 1, 2, 3, 4, 5, 7, 9, 2009-11, 2010-7, 101, 102, 108, 110, 116, 117, 118, 119, 120, 121, 128, 131, 132, 133, 134, 136, 138, 139, 140, 141, 1004, 1023 & 1038 and Interpretations 2, 4, 12, 13, 14, 17, 19, 131 & 132]
Sep-11 1-Jan-13
AASB 13 defines fair value, establishes a framework for measuring fair value and requires disclosures about fair value measurements. AASB 13 requires:- Inputs to all fair value measurements to be categorised in accordance with a fair value hierarchy; and enhanced disclosures regarding all assets and liabilities (including, but not limited to financial assets and financial liabilities) measured at fair value. AASB 13 will have particular relevance to the process of the Council adopting fair value methodology in relation to its fixed assets as mandated from 1 July 2012. Apart from the changes in value in relation to assets to be revalued (which are mandated by legislation and not changes to the standard) it is not expected to significantly impact the Council as the framework embodied in AASB 13 does not differ significantly from that which is present in existing standards.
(xi)
AASB 2011 - 9 Amendments to Australian Accounting Standards – Presentation of Items of Other Comprehensive Income [AASB 1, 5, 7, 101, 112, 120, 121, 132, 133, 134, 1039 & 1049]
Sep-11 1-Jul-13
The main change embodied in this standard is the requirement to group items presented in other comprehensive income on the basis of whether they are potentially reclassifiable to profit or loss subsequently. It effects presentation only and is not expected to significantly impact the Council.
(xii)
AASB 119 – Employee Benefits AASB 2010 – 10 Amendments to Australian Accounting Standards arising from AASB 119 [AASB 1, 8, 101, 124, 134, 1049 & 2011 – 8 and Interpretation 14]
Sep-11 1-Jan-13
The changes in relation to defined benefit plans contained in this standard are not expected to significantly impact the Council nor are the changes to AASBs in relation to termination benefits.
(xiii)AASB 2011-11 Amendments to AASB 119 (September 2011) arising from Reduced Disclosure Requirements
Sep-11 1-Jul-13
Nil – None of these amendments will have any effect on the financial report as none of the topics are relevant to the operations of the Council.
AASB 2011 – 12 Amendments to Australian Accounting Standards arising from Interpretation 20 [AASB 1]
Nov-11 1-Jan-13
AASB 2011 – 13 Amendments to Australian Accounting Standards – Improvements to AASB 1049
Dec-11 1-Jul-12
Note: (1) Applicable to reporting periods commencing on or after the given date.

SMRC 2011-2012 Annual Report 43
SOUTHERN METROPOLITAN REGIONAL COUNCIL NOTES TO AND FORMING PART OF THE FINANCIAL REPORT
FOR THE YEAR ENDED 30 JUNE 2012
1. SIGNIFICANT ACCOUNTING POLICIES (Continued)
17
(x) Adoption of New and Revised Accounting Standards During the current year, the Council adopted all of the new and revised Australian
Accounting Standards and Interpretations which became mandatory and which were applicable to its operations.
These new and revised standards were:
AASB 124 AASB 1054 AASB 2009 – 12 AASB 2010 – 4 AASB 2010 – 5 AASB 2010 – 6 AASB 2010 – 9 AASB 2010 – 14 AASB 2011 - 1
The standards adopted had a minimal effect on the accounting and reporting practices of
the Council as they were either not applicable, largely editorial in nature, were revisions to help ensure consistency with presentation, recognition and measurement criteria of IFRSs or related to topics not relevant to operations.
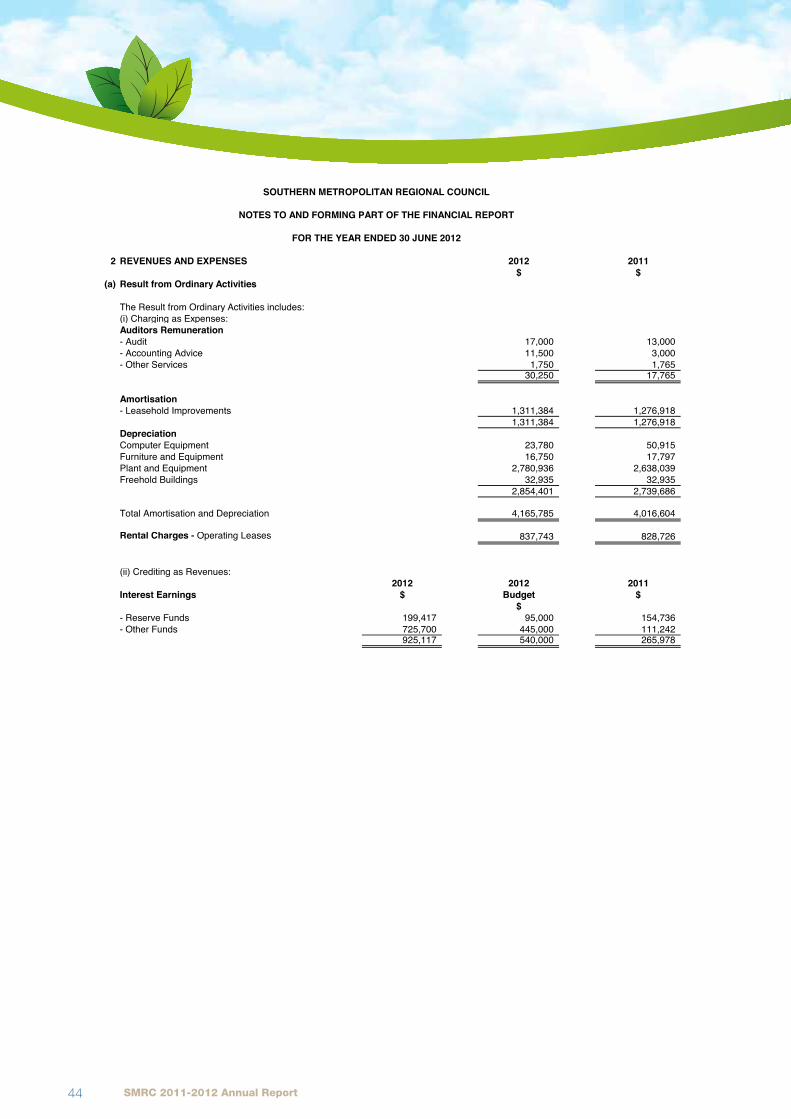
SMRC 2011-2012 Annual Report44
SOUTHERN METROPOLITAN REGIONAL COUNCIL
NOTES TO AND FORMING PART OF THE FINANCIAL REPORT
FOR THE YEAR ENDED 30 JUNE 2012
2 REVENUES AND EXPENSES 2012 2011$ $
(a) Result from Ordinary Activities
The Result from Ordinary Activities includes:(i) Charging as Expenses:Auditors Remuneration- Audit 17,000 13,000 - Accounting Advice 11,500 3,000 - Other Services 1,750 1,765
30,250 17,765
Amortisation - Leasehold Improvements 1,311,384 1,276,918
1,311,384 1,276,918 DepreciationComputer Equipment 23,780 50,915 Furniture and Equipment 16,750 17,797 Plant and Equipment 2,780,936 2,638,039 Freehold Buildings 32,935 32,935
2,854,401 2,739,686
Total Amortisation and Depreciation 4,165,785 4,016,604
Rental Charges - Operating Leases 837,743 828,726
(ii) Crediting as Revenues: 2012 2012 2011
Interest Earnings $ Budget $$
- Reserve Funds 199,417 95,000 154,736 - Other Funds 725,700 445,000 111,242
925,117 540,000 265,978
18

SMRC 2011-2012 Annual Report 45
SOUTHERN METROPOLITAN REGIONAL COUNCIL
NOTES TO AND FORMING PART OF THE FINANCIAL REPORT
FOR THE YEAR ENDED 30 JUNE 2012
2. REVENUES AND EXPENSES (Continued)
(b) Statement of Objective
The regional purposes for which the Regional Local Government is established are:(a) to plan, coordinate and implement the removal, processing, treatment and disposal of waste for the benefit of the communities of the participants;(b) to influence local, state and federal governments in the development of regional waste management policies and legislation.
The objectives of the Regional Local Government shall be:(a) without loss being incurred by the Regional Local Government, to carry out the regional purposes so that services and facilities are provided to the consumer at a reasonable cost and with due regard for community needs;(b) to reduce the quantity of waste disposed at landfill sites in accordance with targets set by the Regional Local Government.
The Council operations as disclosed in this report encompass the following service orientated programs:
GOVERNANCEAdministration and operation facilities and services to Members of Council, other costs that relate to tasks of assisting the member councils and the public on matters which do not concern specific council services. In accordance with legislative changes effective 1 July 1997, the General Administration costs have been allocated to the various programs of the Council to reflect the true cost of the services provided. Directly attributable administration costs have been recorded in the relevant program while indirect costshave been allocated on the basis of Administration staff timesheets.
COMMUNITY AMENITIESTo provide environmentally friendly waste management facilities to consumers at a competitive cost, mindful of community requirements, whilst aiming to greatly reduce the quantity of waste disposed at landfill sites. This includes the Regional Resource Recovery Centre at Canning Vale which isa Major Commercial Business Undertaking.
2012 2011$ $
(c) Conditions Over Grants / Contributions
Grants which were recognised as revenues in the previous reporting period,which were not expended at the close of the previous reporting period : Glass Contamination Reduction Programme 10,000 10,000 Zero Waste Plan 76,462 76,462
86,462 86,462
Add: New Grants which were recognised as revenues during the reportingperiod and which had not yet been fully expended in the manner specified by the contributor. Glass Contamination Reduction Programme - - Zero Waste Plan - -
Less: Grants which were recognised as revenues in the previous reportingperiod and which were expended in the current reporting period in the mannerspecified by the contributor. Glass Contamination Reduction Programme - - Zero Waste Plan - -
Closing Balance of Unspent Grants 86,462 86,462 -
Comprises: Glass Contamination Reduction Programme 10,000 10,000 Zero Waste Plan 76,462 76,462
86,462 86,462
19
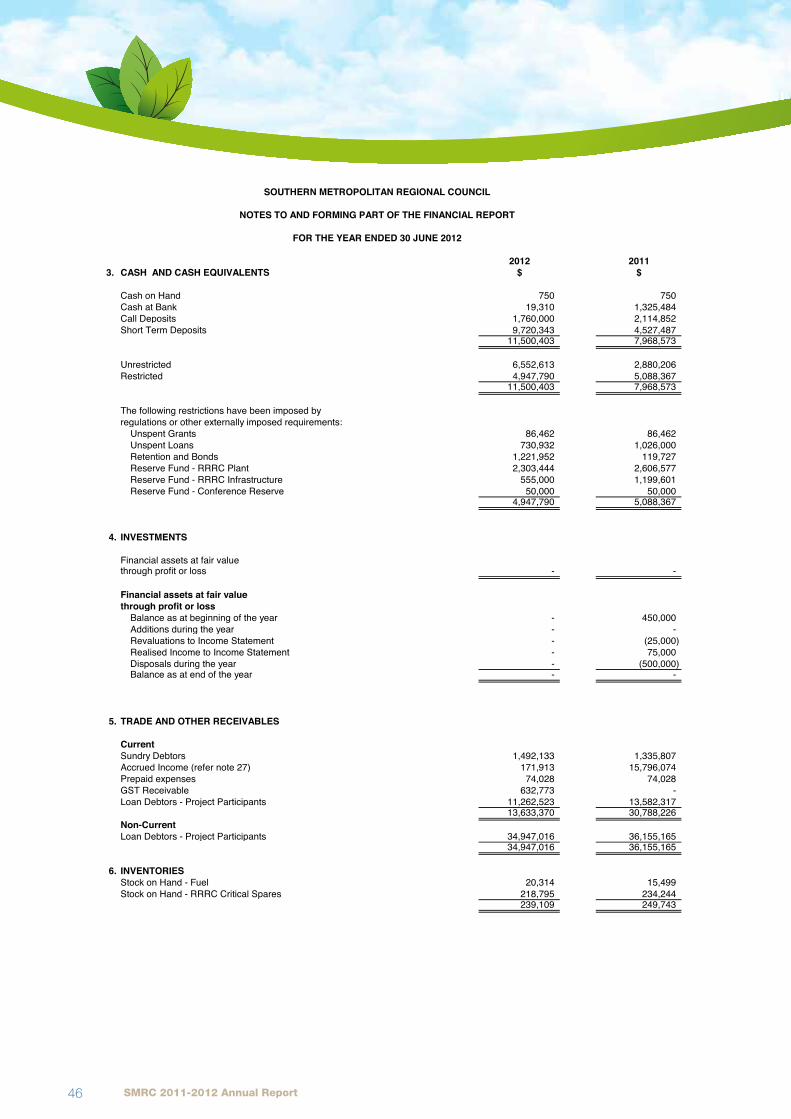
SMRC 2011-2012 Annual Report46
NOTES TO AND FORMING PART OF THE FINANCIAL REPORT
FOR THE YEAR ENDED 30 JUNE 2012
2012 20113. CASH AND CASH EQUIVALENTS $ $
Cash on Hand 750 750 Cash at Bank 19,310 1,325,484 Call Deposits 1,760,000 2,114,852 Short Term Deposits 9,720,343 4,527,487
11,500,403 7,968,573
Unrestricted 6,552,613 2,880,206 Restricted 4,947,790 5,088,367
11,500,403 7,968,573
The following restrictions have been imposed by regulations or other externally imposed requirements:
Unspent Grants 86,462 86,462 Unspent Loans 730,932 1,026,000 Retention and Bonds 1,221,952 119,727 Reserve Fund - RRRC Plant 2,303,444 2,606,577 Reserve Fund - RRRC Infrastructure 555,000 1,199,601 Reserve Fund - Conference Reserve 50,000 50,000
4,947,790 5,088,367
#REF!4. INVESTMENTS
Financial assets at fair value through profit or loss - -
Financial assets at fair valuethrough profit or loss
Balance as at beginning of the year - 450,000 Additions during the year - - Revaluations to Income Statement - (25,000) Realised Income to Income Statement - 75,000 Disposals during the year - (500,000) Balance as at end of the year - -
5. TRADE AND OTHER RECEIVABLES
CurrentSundry Debtors 1,492,133 1,335,807 Accrued Income (refer note 27) 171,913 15,796,074 Prepaid expenses 74,028 74,028 GST Receivable 632,773 - Loan Debtors - Project Participants 11,262,523 13,582,317
13,633,370 30,788,226 Non-CurrentLoan Debtors - Project Participants 34,947,016 36,155,165
34,947,016 36,155,165
6. INVENTORIESStock on Hand - Fuel 20,314 15,499 Stock on Hand - RRRC Critical Spares 218,795 234,244
239,109 249,743
SOUTHERN METROPOLITAN REGIONAL COUNCIL
20
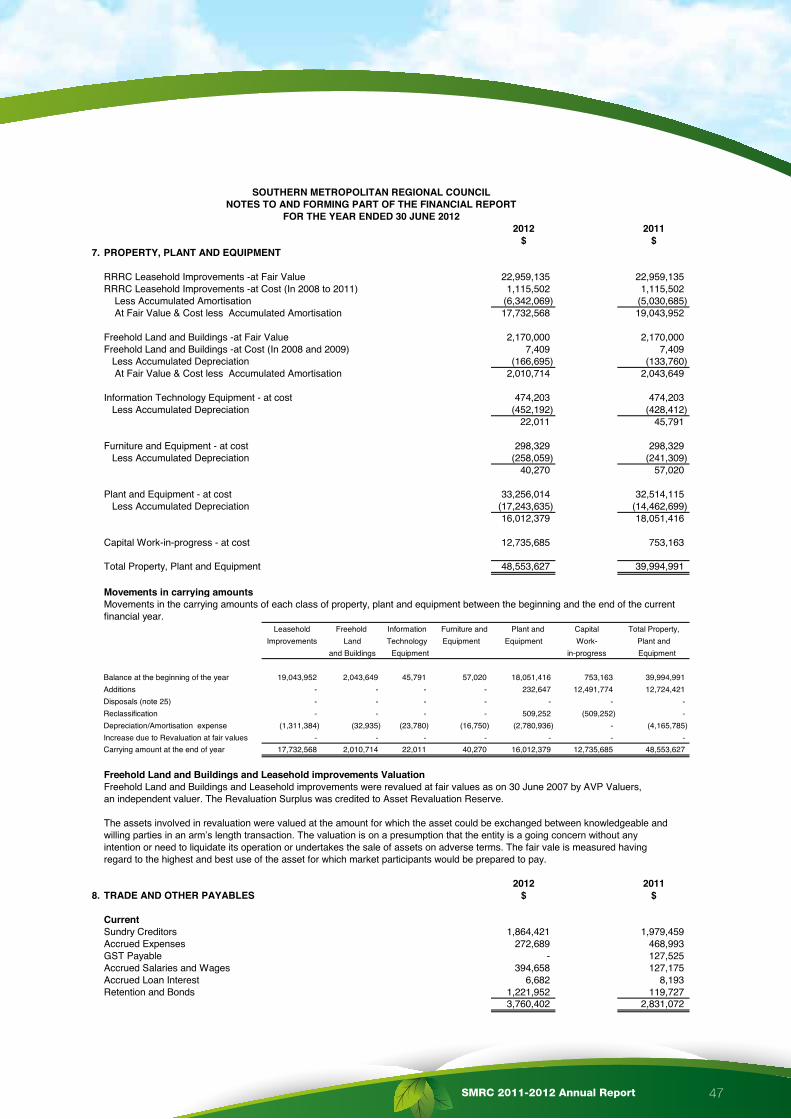
SMRC 2011-2012 Annual Report 47
2012 2011$ $
7. PROPERTY, PLANT AND EQUIPMENT
RRRC Leasehold Improvements -at Fair Value 22,959,135 22,959,135 RRRC Leasehold Improvements -at Cost (In 2008 to 2011) 1,115,502 1,115,502 Less Accumulated Amortisation (6,342,069) (5,030,685) At Fair Value & Cost less Accumulated Amortisation 17,732,568 19,043,952
Freehold Land and Buildings -at Fair Value 2,170,000 2,170,000 Freehold Land and Buildings -at Cost (In 2008 and 2009) 7,409 7,409 Less Accumulated Depreciation (166,695) (133,760) At Fair Value & Cost less Accumulated Amortisation 2,010,714 2,043,649
Information Technology Equipment - at cost 474,203 474,203 Less Accumulated Depreciation (452,192) (428,412)
22,011 45,791
Furniture and Equipment - at cost 298,329 298,329 Less Accumulated Depreciation (258,059) (241,309)
40,270 57,020
Plant and Equipment - at cost 33,256,014 32,514,115 Less Accumulated Depreciation (17,243,635) (14,462,699)
16,012,379 18,051,416
Capital Work-in-progress - at cost 12,735,685 753,163
Total Property, Plant and Equipment 48,553,627 39,994,991
Movements in carrying amountsMovements in the carrying amounts of each class of property, plant and equipment between the beginning and the end of the current financial year.
Leasehold Freehold Information Furniture and Plant and Capital Total Property,Improvements Land Technology Equipment Equipment Work- Plant and
and Buildings Equipment in-progress Equipment
Balance at the beginning of the year 19,043,952 2,043,649 45,791 57,020 18,051,416 753,163 39,994,991 Additions - - - - 232,647 12,491,774 12,724,421 Disposals (note 25) - - - - - - - Reclassification - - - - 509,252 (509,252) - Depreciation/Amortisation expense (1,311,384) (32,935) (23,780) (16,750) (2,780,936) - (4,165,785) Increase due to Revaluation at fair values - - - - - - - Carrying amount at the end of year 17,732,568 2,010,714 22,011 40,270 16,012,379 12,735,685 48,553,627
- - - - - - Freehold Land and Buildings and Leasehold improvements ValuationFreehold Land and Buildings and Leasehold improvements were revalued at fair values as on 30 June 2007 by AVP Valuers, an independent valuer. The Revaluation Surplus was credited to Asset Revaluation Reserve.
The assets involved in revaluation were valued at the amount for which the asset could be exchanged between knowledgeable and willing parties in an arm’s length transaction. The valuation is on a presumption that the entity is a going concern without any intention or need to liquidate its operation or undertakes the sale of assets on adverse terms. The fair vale is measured havingregard to the highest and best use of the asset for which market participants would be prepared to pay.
2012 20118. TRADE AND OTHER PAYABLES $ $
CurrentSundry Creditors 1,864,421 1,979,459 Accrued Expenses 272,689 468,993 GST Payable - 127,525 Accrued Salaries and Wages 394,658 127,175 Accrued Loan Interest 6,682 8,193 Retention and Bonds 1,221,952 119,727
3,760,402 2,831,072
SOUTHERN METROPOLITAN REGIONAL COUNCILNOTES TO AND FORMING PART OF THE FINANCIAL REPORT
FOR THE YEAR ENDED 30 JUNE 2012
21
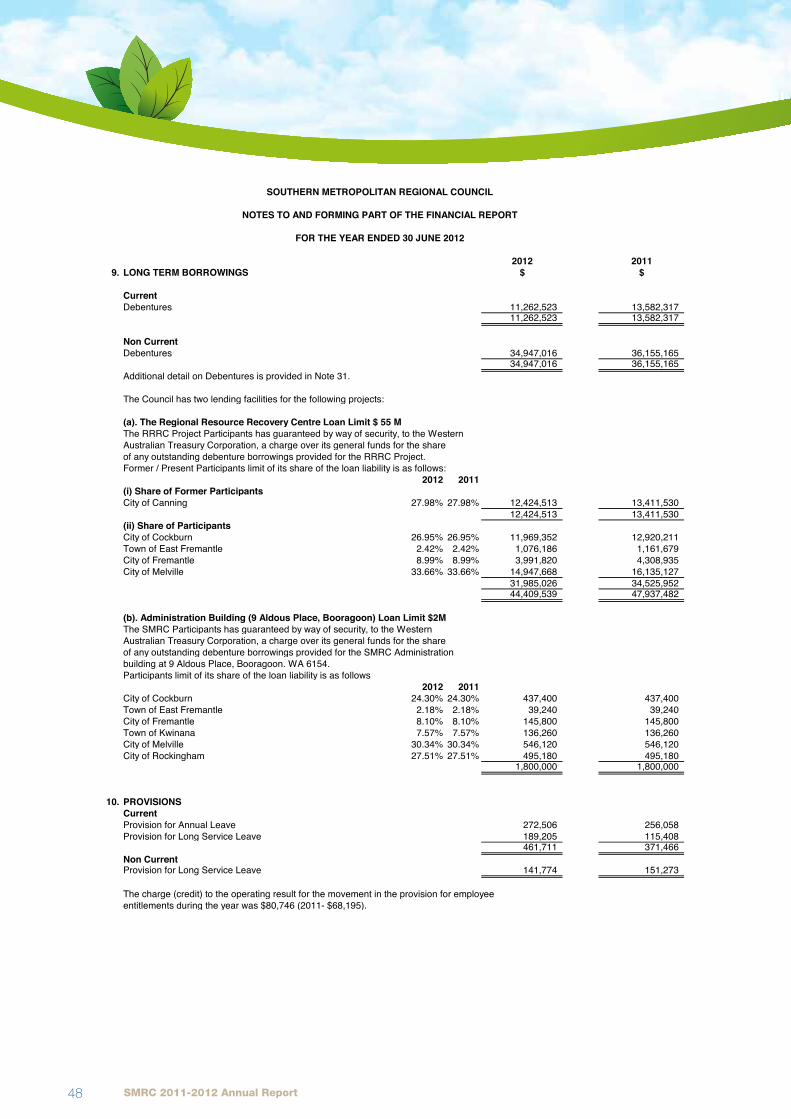
SMRC 2011-2012 Annual Report48
NOTES TO AND FORMING PART OF THE FINANCIAL REPORT
FOR THE YEAR ENDED 30 JUNE 2012
2012 20119. LONG TERM BORROWINGS $ $
CurrentDebentures 11,262,523 13,582,317
11,262,523 13,582,317
Non CurrentDebentures 34,947,016 36,155,165
34,947,016 36,155,165 Additional detail on Debentures is provided in Note 31.
The Council has two lending facilities for the following projects:
(a). The Regional Resource Recovery Centre Loan Limit $ 55 MThe RRRC Project Participants has guaranteed by way of security, to the Western Australian Treasury Corporation, a charge over its general funds for the share of any outstanding debenture borrowings provided for the RRRC Project. Former / Present Participants limit of its share of the loan liability is as follows:
2012 2011(i) Share of Former ParticipantsCity of Canning 27.98% 27.98% 12,424,513 13,411,530
12,424,513 13,411,530 (ii) Share of Participants City of Cockburn 26.95% 26.95% 11,969,352 12,920,211 Town of East Fremantle 2.42% 2.42% 1,076,186 1,161,679 City of Fremantle 8.99% 8.99% 3,991,820 4,308,935 City of Melville 33.66% 33.66% 14,947,668 16,135,127
31,985,026 34,525,952 44,409,539 47,937,482
(b). Administration Building (9 Aldous Place, Booragoon) Loan Limit $2MThe SMRC Participants has guaranteed by way of security, to the Western Australian Treasury Corporation, a charge over its general funds for the share of any outstanding debenture borrowings provided for the SMRC Administration building at 9 Aldous Place, Booragoon. WA 6154. 1800000Participants limit of its share of the loan liability is as follows
2012 2011City of Cockburn 24.30% 24.30% 437,400 437,400 Town of East Fremantle 2.18% 2.18% 39,240 39,240 City of Fremantle 8.10% 8.10% 145,800 145,800 Town of Kwinana 7.57% 7.57% 136,260 136,260 City of Melville 30.34% 30.34% 546,120 546,120 City of Rockingham 27.51% 27.51% 495,180 495,180
1,800,000 1,800,000
10. PROVISIONSCurrentProvision for Annual Leave 272,506 256,058 Provision for Long Service Leave 189,205 115,408
461,711 371,466 Non CurrentProvision for Long Service Leave 141,774 151,273
The charge (credit) to the operating result for the movement in the provision for employee entitlements during the year was $80,746 (2011- $68,195).
SOUTHERN METROPOLITAN REGIONAL COUNCIL
22
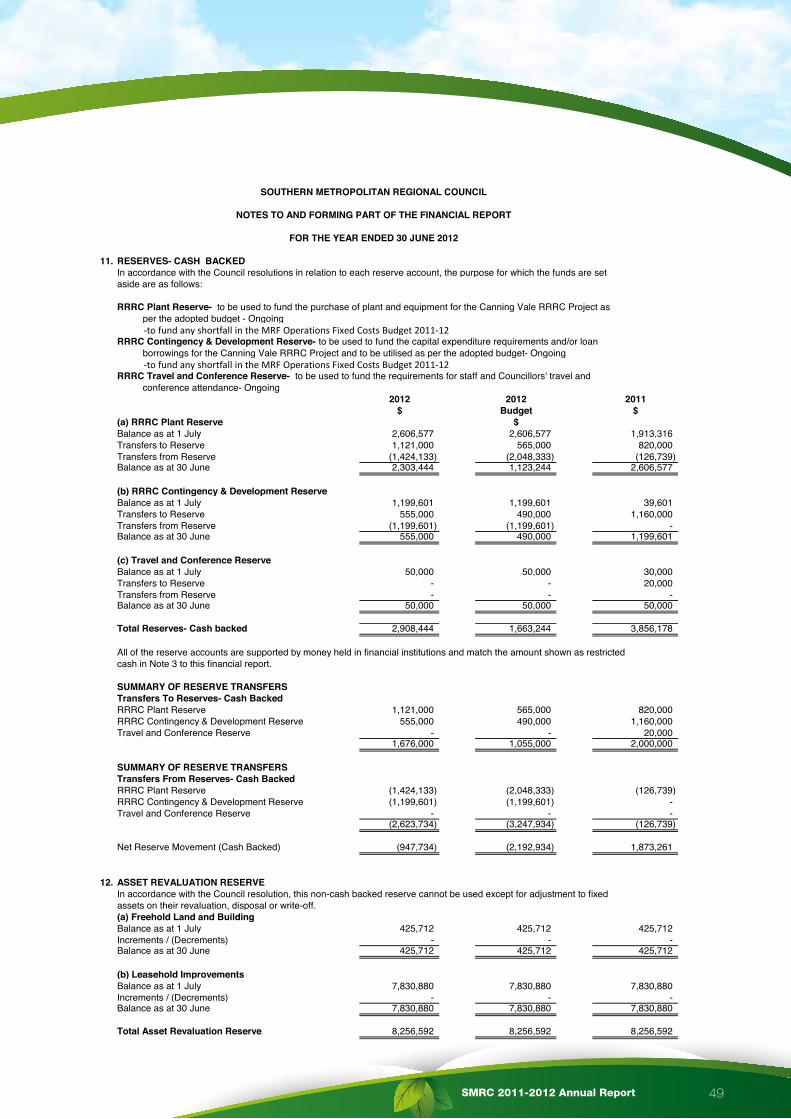
SMRC 2011-2012 Annual Report 49
NOTES TO AND FORMING PART OF THE FINANCIAL REPORT
FOR THE YEAR ENDED 30 JUNE 2012
11. RESERVES- CASH BACKEDIn accordance with the Council resolutions in relation to each reserve account, the purpose for which the funds are setaside are as follows:
RRRC Plant Reserve- to be used to fund the purchase of plant and equipment for the Canning Vale RRRC Project as per the adopted budget - Ongoing -to fund any shortfall in the MRF Operations Fixed Costs Budget 2011-12RRRC Contingency & Development Reserve- to be used to fund the capital expenditure requirements and/or loan borrowings for the Canning Vale RRRC Project and to be utilised as per the adopted budget- Ongoing -to fund any shortfall in the MRF Operations Fixed Costs Budget 2011-12RRRC Travel and Conference Reserve- to be used to fund the requirements for staff and Councillors' travel and conference attendance- Ongoing
2012 2012 2011$ Budget $
(a) RRRC Plant Reserve $Balance as at 1 July 2,606,577 2,606,577 1,913,316 Transfers to Reserve 1,121,000 565,000 820,000 Transfers from Reserve (1,424,133) (2,048,333) (126,739) Balance as at 30 June 2,303,444 1,123,244 2,606,577
(b) RRRC Contingency & Development ReserveBalance as at 1 July 1,199,601 1,199,601 39,601 Transfers to Reserve 555,000 490,000 1,160,000 Transfers from Reserve (1,199,601) (1,199,601) - Balance as at 30 June 555,000 490,000 1,199,601
(c) Travel and Conference ReserveBalance as at 1 July 50,000 50,000 30,000 Transfers to Reserve - - 20,000 Transfers from Reserve - - - Balance as at 30 June 50,000 50,000 50,000
Total Reserves- Cash backed 2,908,444 1,663,244 3,856,178
All of the reserve accounts are supported by money held in financial institutions and match the amount shown as restrictedcash in Note 3 to this financial report.
SUMMARY OF RESERVE TRANSFERSTransfers To Reserves- Cash BackedRRRC Plant Reserve 1,121,000 565,000 820,000 RRRC Contingency & Development Reserve 555,000 490,000 1,160,000 Travel and Conference Reserve - - 20,000
1,676,000 1,055,000 2,000,000
SUMMARY OF RESERVE TRANSFERSTransfers From Reserves- Cash BackedRRRC Plant Reserve (1,424,133) (2,048,333) (126,739) RRRC Contingency & Development Reserve (1,199,601) (1,199,601) - Travel and Conference Reserve - - -
(2,623,734) (3,247,934) (126,739)
Net Reserve Movement (Cash Backed) (947,734) (2,192,934) 1,873,261
12. ASSET REVALUATION RESERVEIn accordance with the Council resolution, this non-cash backed reserve cannot be used except for adjustment to fixedassets on their revaluation, disposal or write-off.(a) Freehold Land and BuildingBalance as at 1 July 425,712 425,712 425,712 Increments / (Decrements) - - - Balance as at 30 June 425,712 425,712 425,712
(b) Leasehold ImprovementsBalance as at 1 July 7,830,880 7,830,880 7,830,880 Increments / (Decrements) - - - Balance as at 30 June 7,830,880 7,830,880 7,830,880
Total Asset Revaluation Reserve 8,256,592 8,256,592 8,256,592
SOUTHERN METROPOLITAN REGIONAL COUNCIL
23

SMRC 2011-2012 Annual Report50
NOTES TO AND FORMING PART OF THE FINANCIAL REPORT
FOR THE YEAR ENDED 30 JUNE 2012
13. NOTES TO THE CASH FLOW STATEMENT
(a) Reconciliation of Cash
For the purposes of the Statement of Cash Flows, cash includes cash on hand and in banks andinvestments, net of outstanding bank overdrafts. Cash at the end of the reporting period isreconciled to the related items in the Statement of Financial Position as follows:
2012 2012 2011$ Budget $
$
Cash on Hand 750 750 750 Cash at Bank 19,310 50,000 1,325,484 Call Deposits 1,760,000 682,683 2,114,852 Short Term Deposits 9,720,343 3,000,000 4,527,487
11,500,403 3,733,433 7,968,573
(b) Reconciliation of Net Cash Provided ByOperating Activities to Change in Net Assets Resulting from Operations
Change in Net Assets Resultingfrom Operations (3,152,553) (4,397,954) 6,080,203 Add / (Less):Depreciation 4,165,785 4,202,954 4,016,604 (Profit)/Loss on Investments - - (75,000) (Profit)/Loss on Sale / Disposal of Asset - - (32,076) (Increase)/Decrease in Receivables (839,048) - (1,758,452) (Increase)/Decrease in Prepaid Expenses - (74,008) (62,028) (Increase)/Decrease in Inventories 10,634 9,743 (8,812) Increase/(Decrease) in Creditors and Accruals 929,330 856,103 (2,051,957) Increase/(Decrease) in Employee Provisions 80,746 22,825 68,195 Revaluations of Investments valued at
fair value through profit or loss - - 25,000 Net Cash from Operating Activities 1,194,894 619,663 6,201,677
2012 2011$ $
(c) Credit Standby ArrangementsCredit Card limit 20,000 20,000 Credit Card balance at reporting date (5,459) (1,960) Total Amount of Credit Unused 14,541 18,040
(d) Loan FacilitiesLoan Facilities - Current 11,262,523 13,582,317 Loan Facilities - Non-Current 34,947,016 36,155,165 Total Facilities in Use at reporting date 46,209,539 49,737,482
Unused Loan Facilities at reporting date - -
SOUTHERN METROPOLITAN REGIONAL COUNCIL
24
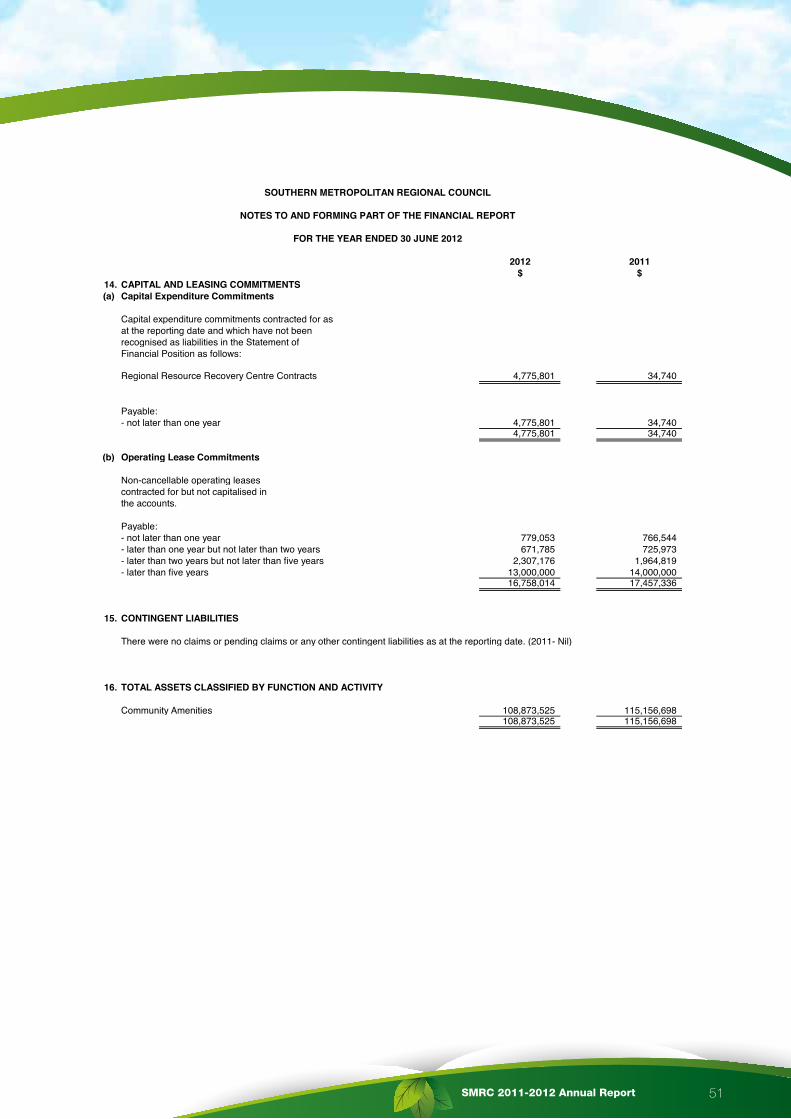
SMRC 2011-2012 Annual Report 51
NOTES TO AND FORMING PART OF THE FINANCIAL REPORT
FOR THE YEAR ENDED 30 JUNE 2012
2012 2011$ $
14. CAPITAL AND LEASING COMMITMENTS(a) Capital Expenditure Commitments
Capital expenditure commitments contracted for as at the reporting date and which have not beenrecognised as liabilities in the Statement of Financial Position as follows:
Regional Resource Recovery Centre Contracts 4,775,801 34,740
Payable:- not later than one year 4,775,801 34,740
4,775,801 34,740
(b) Operating Lease Commitments
Non-cancellable operating leases contracted for but not capitalised in the accounts.
Payable:- not later than one year 779,053 766,544 - later than one year but not later than two years 671,785 725,973 - later than two years but not later than five years 2,307,176 1,964,819 - later than five years 13,000,000 14,000,000
16,758,014 17,457,336
15. CONTINGENT LIABILITIES
There were no claims or pending claims or any other contingent liabilities as at the reporting date. (2011- Nil)
16. TOTAL ASSETS CLASSIFIED BY FUNCTION AND ACTIVITY
Community Amenities 108,873,525 115,156,698 108,873,525 115,156,698
SOUTHERN METROPOLITAN REGIONAL COUNCIL
25
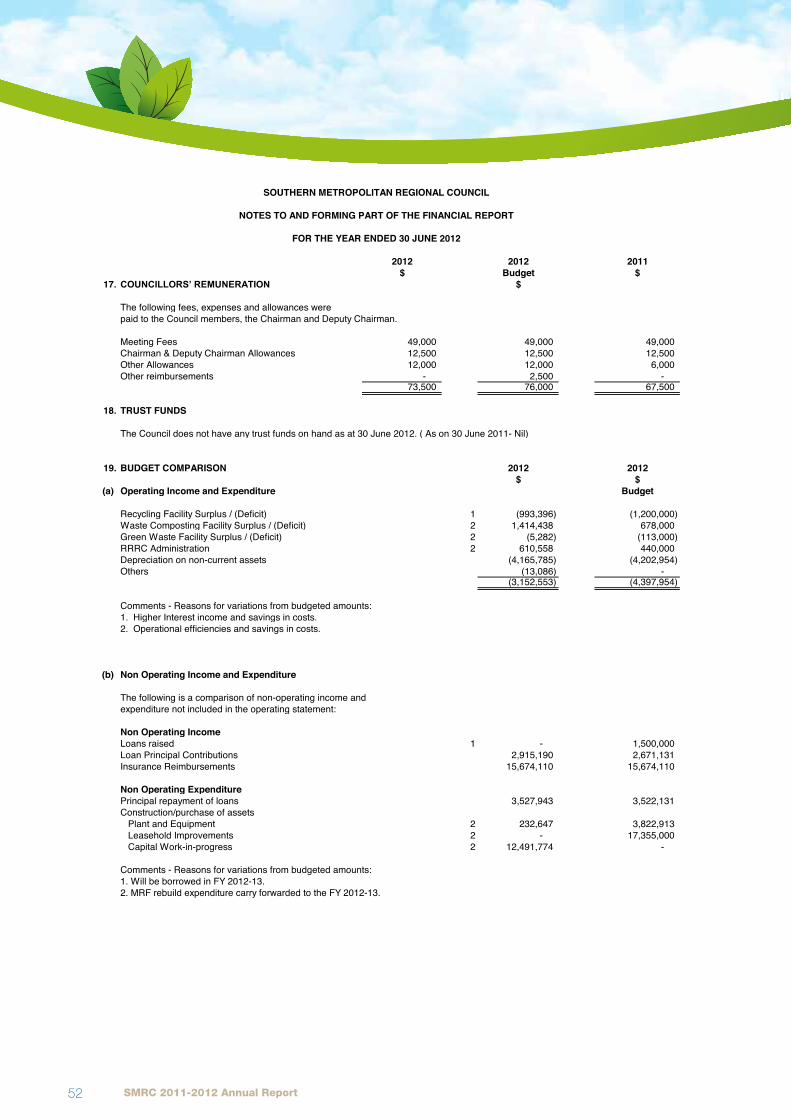
SMRC 2011-2012 Annual Report52
NOTES TO AND FORMING PART OF THE FINANCIAL REPORT
FOR THE YEAR ENDED 30 JUNE 2012
2012 2012 2011$ Budget $
17. COUNCILLORS’ REMUNERATION $
The following fees, expenses and allowances werepaid to the Council members, the Chairman and Deputy Chairman.
Meeting Fees 49,000 49,000 49,000Chairman & Deputy Chairman Allowances 12,500 12,500 12,500Other Allowances 12,000 12,000 6,000Other reimbursements - 2,500 -
73,500 76,000 67,500
18. TRUST FUNDS
The Council does not have any trust funds on hand as at 30 June 2012. ( As on 30 June 2011- Nil)
19. BUDGET COMPARISON 2012 2012$ $
(a) Operating Income and Expenditure Budget
Recycling Facility Surplus / (Deficit) 1 (993,396) (1,200,000)Waste Composting Facility Surplus / (Deficit) 2 1,414,438 678,000Green Waste Facility Surplus / (Deficit) 2 (5,282) (113,000)RRRC Administration 2 610,558 440,000Depreciation on non-current assets (4,165,785) (4,202,954)Others (13,086) -
(3,152,553) (4,397,954)
Comments - Reasons for variations from budgeted amounts:1. Higher Interest income and savings in costs.2. Operational efficiencies and savings in costs.
(b) Non Operating Income and Expenditure
The following is a comparison of non-operating income andexpenditure not included in the operating statement:
Non Operating IncomeLoans raised 1 - 1,500,000Loan Principal Contributions 2,915,190 2,671,131Insurance Reimbursements 15,674,110 15,674,110
Non Operating ExpenditurePrincipal repayment of loans 3,527,943 3,522,131Construction/purchase of assets Plant and Equipment 2 232,647 3,822,913 Leasehold Improvements 2 - 17,355,000 Capital Work-in-progress 2 12,491,774 -
Comments - Reasons for variations from budgeted amounts:1. Will be borrowed in FY 2012-13. 2. MRF rebuild expenditure carry forwarded to the FY 2012-13.
SOUTHERN METROPOLITAN REGIONAL COUNCIL

SMRC 2011-2012 Annual Report 53
NOTES TO AND FORMING PART OF THE FINANCIAL REPORT
FOR THE YEAR ENDED 30 JUNE 201220. MAJOR TRADING UNDERTAKING
REGIONAL RESOURCE RECOVERY CENTRE (RRRC), CANNING VALEThis project is undertaken on behalf of the SMRC's five participating councils. The $55 m project funded by borrowingsand payable over 10-20 years by the five participants, involves the construction of an administration and visitors centre, weighbridge, greenwaste processing and waste composting and recycling facility. Operating revenues is received from gatefees from participants / the private sector and sale of materials. Accounting for this undertaking is in accordance with the Local Government (Financial Management) Amendment Regulations 9 & 45.
STATEMENT OF COMPREHENSIVE INCOME 2012 2011Revenues from Ordinary Activities $ $Education & Marketing 227,703 217,864 RRRC Admin & Weighbridge 287,112 81,995 Recycling 823,908 2,980,797 Greenwaste 1,111,996 1,184,414 Waste Compost 15,068,252 13,669,127 Business Development 240,000 8,100 Waste Audit Service 21,401 - Contributions for interest on loans 2,403,633 2,784,653 Profit on sale of Assets - 28,000 MRF Insurance Reimbursements - 6,451,283
20,184,005 27,406,233 Less Expenses from Ordinary ActivitiesEducation & Marketing 187,421 147,983 RRRC Admin & Weighbridge (259,770) (335,678) Recycling 1,828,544 1,387,556 Greenwaste 1,272,015 1,317,591 Waste Compost 17,425,606 15,660,614 Business Development 300,864 271,640 Waste Audit Service 126,528 115,758
20,881,208 18,565,464 Less Borrowing Cost ExpenseRRRC Property 2,401,411 3,126,501 Net Profit or (Loss) (3,098,614) 5,714,268
STATEMENT OF FINANCIAL POSITIONCurrent AssetsCash and Cash Equivalents 10,376,749 6,953,703 Trade and Other Receivables 11,588,771 30,649,163 Inventories 239,109 249,743 Total Current Assets 22,204,629 37,852,609
Non-Current AssetsTrade and Other Receivables 34,947,016 34,355,165 Property, Plant and Equipment 28,766,394 18,855,522 Leasehold Improvements 17,732,568 19,043,952 Total Non-Current Assets 81,445,978 72,254,639
Total Assets 103,650,607 110,107,248
Current LiabilitiesTrade and Other Payables 3,353,213 2,633,866 Borrowings - current portion 9,462,523 13,582,317 Provisions 197,350 144,064 Total Current Liabilities 13,013,086 16,360,247
Non-Current LiabilitiesBorrowings - non-current portion 34,947,016 34,355,165 Provisions 107,480 97,444 Total Non-Current Liabilities 35,054,496 34,452,609
Total Liabilities 48,067,582 50,812,856
Net Assets 55,583,025 59,294,392 EquityOpening Balance 59,294,392 54,204,658 RRRC Participants Contribution towards Equity - - Retained Surplus/(Deficit) for year (3,098,614) 5,714,268 Less: Loans repaid from Equity (612,753) (624,534) Total Equity 55,583,025 59,294,392
SOUTHERN METROPOLITAN REGIONAL COUNCIL
27
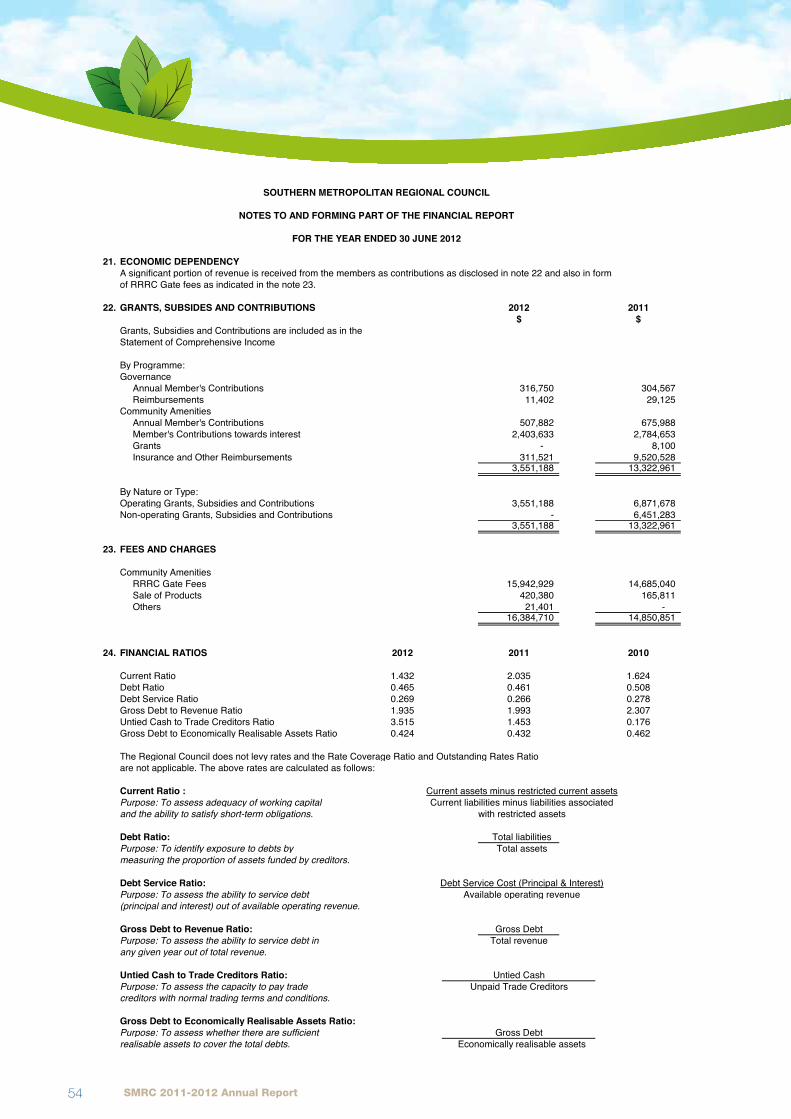
SMRC 2011-2012 Annual Report54
NOTES TO AND FORMING PART OF THE FINANCIAL REPORT
FOR THE YEAR ENDED 30 JUNE 2012
21. ECONOMIC DEPENDENCYA significant portion of revenue is received from the members as contributions as disclosed in note 22 and also in form of RRRC Gate fees as indicated in the note 23.
22. GRANTS, SUBSIDES AND CONTRIBUTIONS 2012 2011$ $
Grants, Subsidies and Contributions are included as in the Statement of Comprehensive Income
By Programme:Governance Annual Member's Contributions 316,750 304,567 Reimbursements 11,402 29,125 Community Amenities Annual Member's Contributions 507,882 675,988 Member's Contributions towards interest 2,403,633 2,784,653 Grants - 8,100 Insurance and Other Reimbursements 311,521 9,520,528
3,551,188 13,322,961
By Nature or Type:Operating Grants, Subsidies and Contributions 3,551,188 6,871,678 Non-operating Grants, Subsidies and Contributions - 6,451,283
3,551,188 13,322,961
23. FEES AND CHARGES
Community Amenities RRRC Gate Fees 15,942,929 14,685,040 Sale of Products 420,380 165,811 Others 21,401 -
16,384,710 14,850,851
24. FINANCIAL RATIOS 2012 2011 2010
Current Ratio 1.432 2.035 1.624Debt Ratio 0.465 0.461 0.508Debt Service Ratio 0.269 0.266 0.278Gross Debt to Revenue Ratio 1.935 1.993 2.307Untied Cash to Trade Creditors Ratio 3.515 1.453 0.176Gross Debt to Economically Realisable Assets Ratio 0.424 0.432 0.462
The Regional Council does not levy rates and the Rate Coverage Ratio and Outstanding Rates Ratioare not applicable. The above rates are calculated as follows:
Current Ratio :Purpose: To assess adequacy of working capital Current liabilities minus liabilities associatedand the ability to satisfy short-term obligations. with restricted assets
Debt Ratio: Total liabilitiesPurpose: To identify exposure to debts by Total assetsmeasuring the proportion of assets funded by creditors.
Debt Service Ratio: Debt Service Cost (Principal & Interest)Purpose: To assess the ability to service debt Available operating revenue(principal and interest) out of available operating revenue.
Gross Debt to Revenue Ratio: Gross DebtPurpose: To assess the ability to service debt in Total revenueany given year out of total revenue.
Untied Cash to Trade Creditors Ratio: Untied CashPurpose: To assess the capacity to pay trade Unpaid Trade Creditorscreditors with normal trading terms and conditions.
Gross Debt to Economically Realisable Assets Ratio:Purpose: To assess whether there are sufficient Gross Debtrealisable assets to cover the total debts. Economically realisable assets
SOUTHERN METROPOLITAN REGIONAL COUNCIL
Current assets minus restricted current assets
28
SMRC 2011-2012 Annual Report 55
25. DISPOSALS OF ASSETS - 2011/12 FINANCIAL YEAR
There are no disposal of assets by the Regional Council during the year.
26. Rating Information
Being a Regional Council, no rates were raised during the year ended 30 June 2012 and in the year ended 30 June 2011.
27. MRF Fire Insurance Claims
The Accrued Income (Refer Note 5) as on 30 June 2011 included MRF fire damage claims of $15,674,110. The amount was received during the current financial year.
28. City of Canning's withdrawal from the SMRC
(a) Pursuant to a resolution of the City of Canning on 19 February 2009, the City of Canning, as a Participant under the EstablishmentAgreement and Project Agreements, gave notice of its intention to withdraw from the SMRC effective from 30 June 2010. In line with the Agreements the City of Canning withdrew from SMRC with effect from that date.
(b) In accordance with the agreements, the City of Canning, as a Former Project Participant, shall continue to pay the borrowings until the borrowings have been repaid or satisfied. Accordingly the City of Canning will continue to pay their proportional loan liability of the RRRC Project as at 30 June 2012 at Note 9(a) amounting to $12,424,513 (2011: $13,411,530).
(c) RRRC Project Agreement states that the assets acquired from borrowings are to be valued only when the borrowings are fully repaid.The appropriate share of City of Canning in these assets is valued at current book values. The share of City of Canning in these assets is still shown as a part of Equity as the City of Canning is not currently entitled for the amount as per the RRRC Project Agreement.
29. Notice by a Participant of an Intention to Withdraw from the SMRC
Pursuant to a resolution of the City of Rockingham on 27 April 2011, the City of Rockingham, as a Participant under the EstablishmentAgreement and Office Accommodation Project Agreement, give a notice of its intention to withdraw from the SMRC effective from 30 June 2012. In line with the Agreements the City of Rockingham withdrew from SMRC with effect from that date
As required by the Office Accommodation Project, SMRC will prepare an amended Business Plan for the project having regard to the effect of the withdrawal of the City of Rockingham and will also arrive at amount payable or receivable from the City of Rockingham. This withdrawal is not expected to have any significant impact on the operations or on the financial position of the SMRC.
30. RRRC Licence
In May 2012, SMRC was granted an amended two-year operating licence for the Regional Resource Recovery Centre, which requires renewal in 30 March 2014. The licence includes 54 stringent conditions, which will be monitored and evaluated by the Department of Environment and Conservation (DEC). A full copy of the licence can be viewed on SMRC's website.
The main part of the conditions are relating to odour improvement or reduction management of the Centre and in particular, SMRC isrequired to install and commission, by 15 December 2012, a wet scrubbing or gas scrubbing system which is designed to achieve not less than 85% humidity in biofilter inlet gases. If this system is not be installed by 15 December 2012, SMRC shall cease accepting wastefor composting at the premises and only commence the reacceptance of putrescible waste at the premises for composting when the wet scrubbing or gas scrubbing system has been installed. Following the installation and commissioning of the wet scrubbing or gas scrubbingsystem, SMRC shall submit a compliance document to DEC certifying the system was constructed in accordance with the license conditions.
By 15 March 2013, SMRC shall submit an Ambient Odour Assessment Plan Report detailing the results of measuring the odour improvementwithin the community surrounding the Centre. Should odour emissions not be reduced to DEC’s satisfaction after the completion of the actions in the licence, SMRC will need to submit a works approval for new primary/secondary pollution control equipment in April 2013.
Updates on the status of works required to comply with those conditions along with other information relating to the centre is available on SMRC’s website for further reading.
SOUTHERN METROPOLITAN REGIONAL COUNCIL
NOTES TO AND FORMING PART OF THE FINANCIAL REPORT
FOR THE YEAR ENDED 30 JUNE 2012
29

SMRC 2011-2012 Annual Report56
SOUTHERN METROPOLITAN REGIONAL COUNCILNOTES TO AND FORMING PART OF THE FINANCIAL REPORT
FOR THE YEAR ENDED 30 JUNE 2012
31. INFORMATION ON BORROWINGS(a) Loan Repayments
Principal New / Interest Repayments Principal Principal1-Jul-11 Refinanced Repayments 30 Jun 12
Loans Budget Actual Budget ActualCommunity AmenitiesRRRCLOAN NO 1-23 1,349,973 - 83,770 83,770 99,878 99,878 1,250,095LOAN NO 1-28 671,886 - 37,475 37,475 51,299 51,299 620,587LOAN NO 1-29 669,867 - 36,706 36,706 51,396 51,396 618,471LOAN NO 1-30 675,813 - 37,231 37,231 51,776 51,776 624,037LOAN NO 1-31 1,377,389 - 77,095 77,095 105,062 105,062 1,272,327LOAN NO 1-33 1,306,890 - 73,093 73,093 100,174 100,174 1,206,716LOAN NO 1-34 1,451,544 - 45,020 45,020 1,451,544 1,451,544 -LOAN NO 1-35 1,072,898 - 61,109 61,109 1,072,898 1,072,898 -LOAN NO 1-37 2,005,288 - 110,530 110,530 178,669 178,669 1,826,619LOAN NO 1-40 718,151 - 39,822 39,822 55,209 55,209 662,942LOAN NO 1-41 734,880 - 42,814 42,814 55,725 55,725 679,155LOAN NO 1-42 728,083 - 41,563 41,563 55,536 55,536 672,547LOAN NO 1-43 1,291,128 - 73,714 73,714 101,254 101,254 1,189,874LOAN NO 1-49 1,378,514 - 86,537 86,537 79,541 79,541 1,298,973LOAN NO 1-50 815,444 - 50,070 50,070 47,457 47,457 767,987LOAN NO 1-52 5,030,849 - 295,548 295,548 716,683 716,683 4,314,166LOAN NO 1-53 1,363,378 - 85,626 85,626 78,807 78,807 1,284,571LOAN NO 1-56 705,729 - 47,909 47,909 39,436 39,436 666,293LOAN NO 1-57 704,452 - 47,822 47,822 39,364 39,364 665,088LOAN NO 1-59 613,923 - 45,051 45,051 613,923 613,923 -LOAN NO 1-60 1,308,714 - 90,838 90,838 93,799 93,799 1,214,915LOAN NO 1-61 2,114,363 - 152,743 152,743 114,962 114,962 1,999,401LOAN NO 1-62 1,717,791 - 89,457 89,457 105,855 105,855 1,611,936LOAN NO 1-63 1,730,326 - 106,209 106,209 100,640 100,640 1,629,686LOAN NO 1-64 789,136 - 47,525 47,525 46,237 46,237 742,899LOAN NO 1-65 1,835,202 - 112,649 112,649 106,740 106,740 1,728,462LOAN NO 1-66 3,446,527 - 214,298 214,298 199,355 199,355 3,247,172LOAN NO 1-67 1,377,188 - 81,624 81,624 81,087 81,087 1,296,101LOAN NO 1-68 1,344,016 - 81,478 81,478 78,507 78,507 1,265,509LOAN NO 1-71 5,497,321 - 144,850 144,850 5,497,305 5,497,321 -LOAN NO 1-72 2,110,819 - 55,618 55,619 2,110,819 2,110,819 -LOAN NO 1-73 - 1,398,036 35,696 33,040 45,126 46,422 1,351,615LOAN NO 1-74 - 5,329,931 136,464 125,964 173,479 176,979 5,152,952LOAN NO 1-75 - 2,046,546 46,787 44,402 2,045,546 2,046,546 -LOAN NO 1-76 - 1,571,752 - - - - 1,571,752LOAN NO 1-77 - 1,976,692 - - - - 1,976,692Office AccommodationLOAN NO 2-4 1,800,000 - 103,320 103,320 - - 1,800,000
49,737,482 12,322,957 2,918,061 2,902,521 15,845,088 15,850,900 46,209,539Add: Accrued Interest - (1,511)Net Interest 2,918,061 2,901,010Less: Loans refinanced 12,322,957 12,322,957 12,322,957Net Borrowings / Repayments 3,522,131 3,527,943
Particulars

SMRC 2011-2012 Annual Report 57
SOUTHERN METROPOLITAN REGIONAL COUNCILNOTES TO AND FORMING PART OF THE FINANCIAL REPORT
FOR THE YEAR ENDED 30 JUNE 2012
31. INFORMATION ON BORROWINGS (Continued)(b)
Amount Borrowed Institution Loan Term Total Interest BalanceType (Years) Interest & Rate Unspent
Budget Actual Charges Budget ActualCommunity Amenities $ $ $ $ $RRRC ProjectLOAN NO 1-73 (Refinanced) 1,398,036 1,398,036 WATC Debenture 11.00 429,587 4.71% 1,398,036 1,398,036 -LOAN NO 1-74 (Refinanced) 5,329,931 5,329,931 WATC Debenture 11.50 1,637,774 4.71% 5,329,931 4,598,999 730,932LOAN NO 1-75 (Refinanced) 2,046,546 2,046,546 WATC Debenture 0.50 44,401 4.30% 2,046,546 2,046,546 -LOAN NO 1-76 (Refinanced) 1,571,752 1,571,752 WATC Debenture 11.00 388,252 4.00% 1,571,752 1,571,752 -LOAN NO 1-77 (Refinanced) 1,976,692 1,976,692 WATC Debenture 0.50 35,836 3.59% 1,976,692 1,976,692 -
12,322,957 12,322,957 2,535,850 12,322,957 11,592,025 730,932
(c) Unspent Loans
(d) Overdraft
AmountUsed
Particulars/Purpose
An amount of $730,932 (2011- $1,026,000) remained unspent out of the amount borrowed on the reporting date and is shown as a part of restricted cash.
Council does not have an overdraft facility with its bankers.
New / Refinanced Borrowings
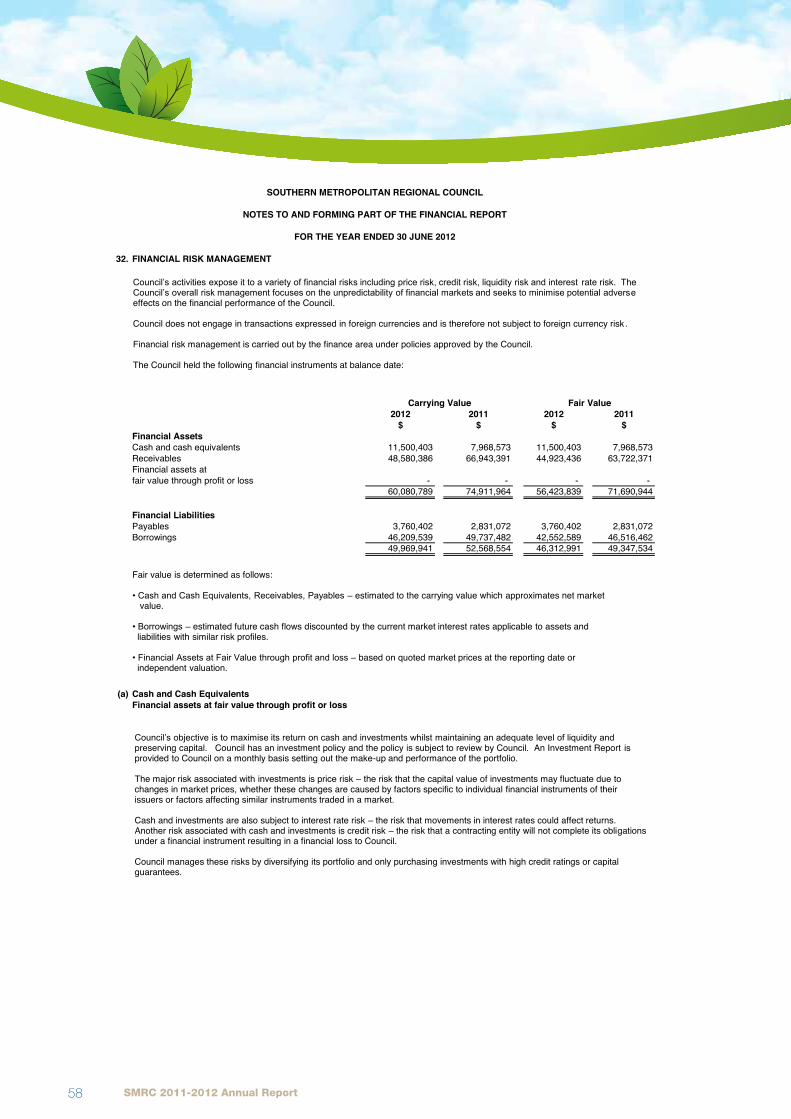
SMRC 2011-2012 Annual Report58
32. FINANCIAL RISK MANAGEMENT
Carrying Value Fair Value2012 2011 2012 2011
$ $ $ $Financial AssetsCash and cash equivalents 11,500,403 7,968,573 11,500,403 7,968,573Receivables 48,580,386 66,943,391 44,923,436 63,722,371Financial assets atfair value through profit or loss - - - -
60,080,789 74,911,964 56,423,839 71,690,944- -
Financial LiabilitiesPayables 3,760,402 2,831,072 3,760,402 2,831,072Borrowings 46,209,539 49,737,482 42,552,589 46,516,462
49,969,941 52,568,554 46,312,991 49,347,534- - -435,930 381,565
(a) Cash and Cash EquivalentsFinancial assets at fair value through profit or loss
SOUTHERN METROPOLITAN REGIONAL COUNCIL
NOTES TO AND FORMING PART OF THE FINANCIAL REPORT
FOR THE YEAR ENDED 30 JUNE 2012
Council’s activities expose it to a variety of financial risks including price risk, credit risk, liquidity risk and interest rate risk. The Council’s overall risk management focuses on the unpredictability of financial markets and seeks to minimise potential adverse effects on the financial performance of the Council. Council does not engage in transactions expressed in foreign currencies and is therefore not subject to foreign currency risk . Financial risk management is carried out by the finance area under policies approved by the Council. The Council held the following financial instruments at balance date:
Fair value is determined as follows: • Cash and Cash Equivalents, Receivables, Payables – estimated to the carrying value which approximates net market value. • Borrowings – estimated future cash flows discounted by the current market interest rates applicable to assets and liabilities with similar risk profiles. • Financial Assets at Fair Value through profit and loss – based on quoted market prices at the reporting date or independent valuation.
Council’s objective is to maximise its return on cash and investments whilst maintaining an adequate level of liquidity and preserving capital. Council has an investment policy and the policy is subject to review by Council. An Investment Report is provided to Council on a monthly basis setting out the make-up and performance of the portfolio. The major risk associated with investments is price risk – the risk that the capital value of investments may fluctuate due to changes in market prices, whether these changes are caused by factors specific to individual financial instruments of their issuers or factors affecting similar instruments traded in a market. Cash and investments are also subject to interest rate risk – the risk that movements in interest rates could affect returns. Another risk associated with cash and investments is credit risk – the risk that a contracting entity will not complete its obligations under a financial instrument resulting in a financial loss to Council. Council manages these risks by diversifying its portfolio and only purchasing investments with high credit ratings or capital guarantees.
32
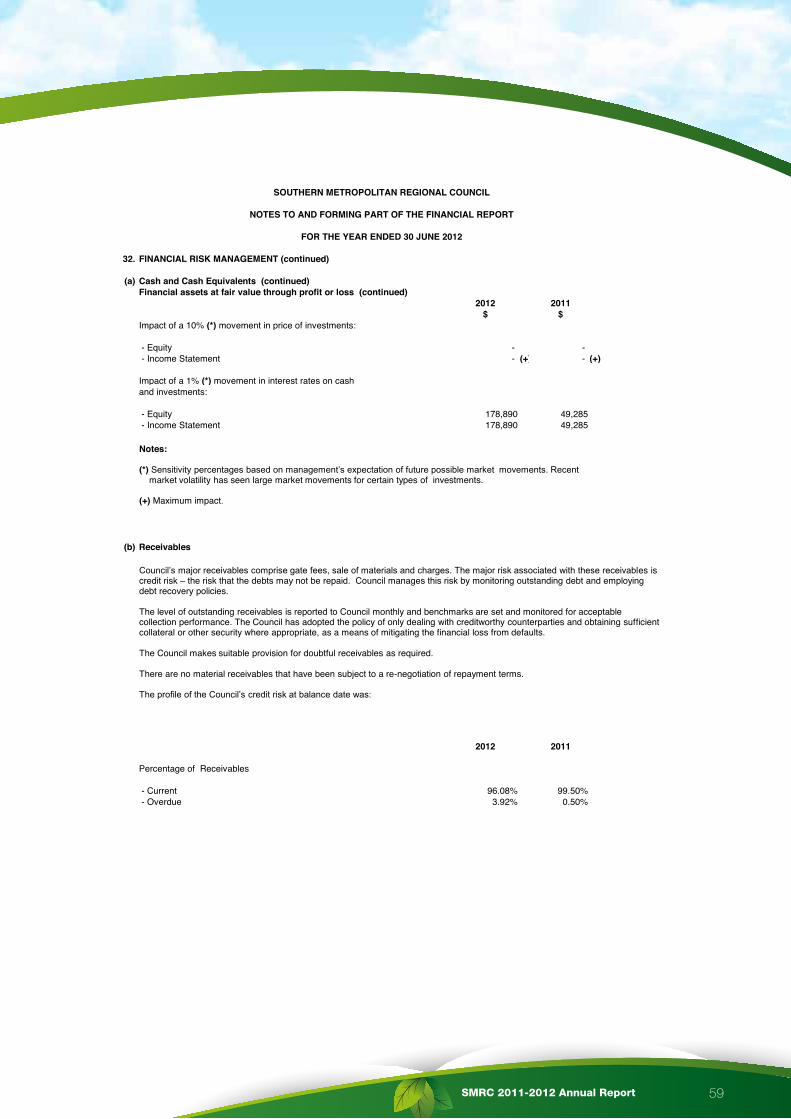
SMRC 2011-2012 Annual Report 59
32. FINANCIAL RISK MANAGEMENT (continued)
(a) Cash and Cash Equivalents (continued)Financial assets at fair value through profit or loss (continued)
2012 2011$ $
Impact of a 10% (*) movement in price of investments:
- Equity - - - Income Statement - (+) - (+)
Impact of a 1% (*) movement in interest rates on cashand investments:
- Equity 178,890 49,285 - Income Statement 178,890 49,285
(b) Receivables
2012 2011
Percentage of Receivables
- Current 96.08% 99.50% - Overdue 3.92% 0.50%
SOUTHERN METROPOLITAN REGIONAL COUNCIL
NOTES TO AND FORMING PART OF THE FINANCIAL REPORT
FOR THE YEAR ENDED 30 JUNE 2012
Notes: (*) Sensitivity percentages based on management’s expectation of future possible market movements. Recent market volatility has seen large market movements for certain types of investments. (+) Maximum impact.
Council’s major receivables comprise gate fees, sale of materials and charges. The major risk associated with these receivables is credit risk – the risk that the debts may not be repaid. Council manages this risk by monitoring outstanding debt and employing debt recovery policies. The level of outstanding receivables is reported to Council monthly and benchmarks are set and monitored for acceptable collection performance. The Council has adopted the policy of only dealing with creditworthy counterparties and obtaining sufficient collateral or other security where appropriate, as a means of mitigating the financial loss from defaults. The Council makes suitable provision for doubtful receivables as required. There are no material receivables that have been subject to a re-negotiation of repayment terms. The profile of the Council’s credit risk at balance date was:
33

SMRC 2011-2012 Annual Report60
32. FINANCIAL RISK MANAGEMENT (continued)
( c) Payables and Borrowings
Due Due Due Total Carryingwithin between after contractual values1 year 1 & 5 years 5 years cash flows
$ $ $ $ $2012
Payables 3,760,402 - - 3,760,402 3,760,402Borrowings 13,702,644 30,487,064 10,519,692 54,709,400 46,209,539
17,463,046 30,487,064 10,519,692 58,469,802 49,969,941(0.02)
2011
Payables 2,831,072 - - 2,831,072 2,831,072Borrowings 16,281,432 34,622,783 7,699,800 58,604,015 49,737,482
19,112,504 34,622,783 7,699,800 61,435,087 52,568,554
SOUTHERN METROPOLITAN REGIONAL COUNCIL
NOTES TO AND FORMING PART OF THE FINANCIAL REPORT
FOR THE YEAR ENDED 30 JUNE 2012
Payables and borrowings are both subject to liquidity risk – that is the risk that insufficient funds may be on hand to meet payment obligations as and when they fall due. Council manages this risk by monitoring its cash flow requirements and liquidity levels and maintaining an adequate cash buffer. The contractual undiscounted cash flows of Council’s Payables and Borrowings are set out in the Liquidity Sensitivity Table below:
34
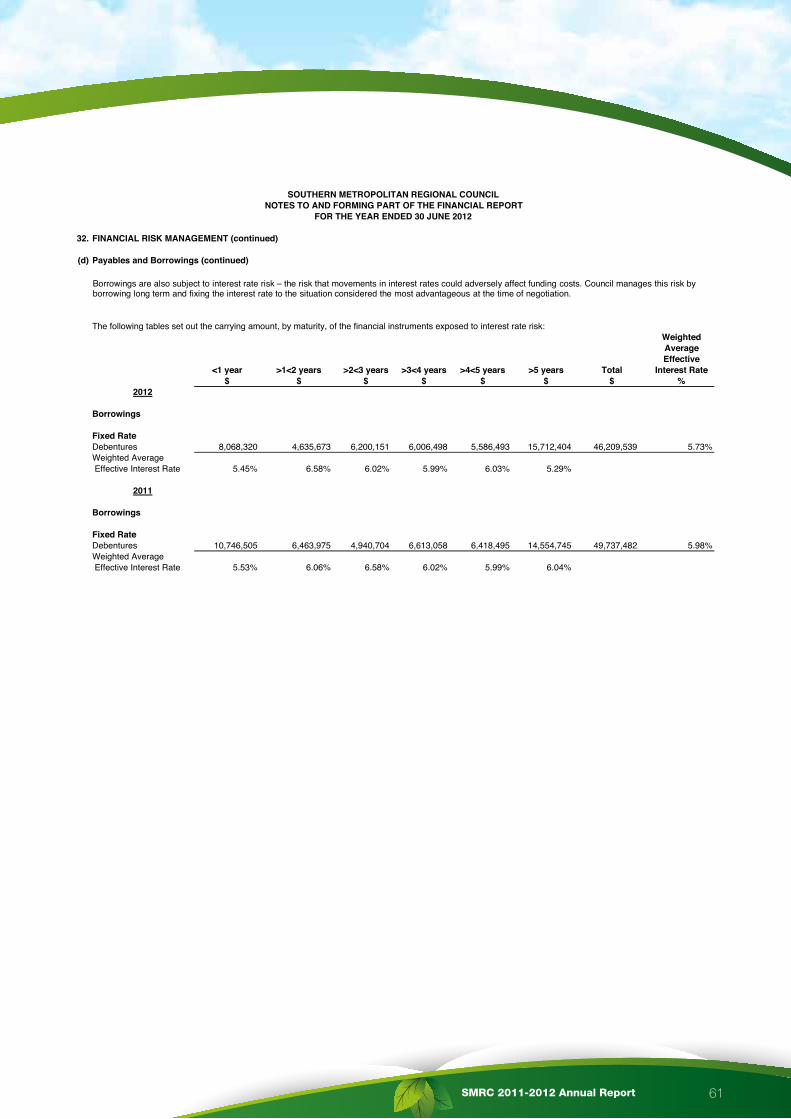
SMRC 2011-2012 Annual Report 61
32. FINANCIAL RISK MANAGEMENT (continued)
(d) Payables and Borrowings (continued)
The following tables set out the carrying amount, by maturity, of the financial instruments exposed to interest rate risk:WeightedAverageEffective
<1 year >1<2 years >2<3 years >3<4 years >4<5 years >5 years Total Interest Rate$ $ $ $ $ $ $ %
Borrowings
Fixed RateDebentures 8,068,320 4,635,673 6,200,151 6,006,498 5,586,493 15,712,404 46,209,539 5.73%Weighted Average Effective Interest Rate 5.45% 6.58% 6.02% 5.99% 6.03% 5.29%
Borrowings
Fixed RateDebentures 10,746,505 6,463,975 4,940,704 6,613,058 6,418,495 14,554,745 49,737,482 5.98%Weighted Average Effective Interest Rate 5.53% 6.06% 6.58% 6.02% 5.99% 6.04%
SOUTHERN METROPOLITAN REGIONAL COUNCILNOTES TO AND FORMING PART OF THE FINANCIAL REPORT
FOR THE YEAR ENDED 30 JUNE 2012
2012
2011
Borrowings are also subject to interest rate risk – the risk that movements in interest rates could adversely affect funding costs. Council manages this risk by borrowing long term and fixing the interest rate to the situation considered the most advantageous at the time of negotiation.

SMRC 2011-2012 Annual Report62
12 Independent Auditors Report

SMRC 2011-2012 Annual Report 63

Southern Metropolitan Regional Council
9 Aldous Place, Booragoon WA 6154
Tel: (08) 9329 2700 Fax: (08) 9330 6788
Web: www.smrc.com.au Email: [email protected]