Embed Size (px)
Citation preview

A N N U A L R E P O RT 2 0 0 2A N N U A L R E P O RT 2 0 0 2A N N U A L R E P O RT 2 0 0 2
In 2002, only four of the vehicles tested achieved five stars in Euro-NCAP, Europe’s leading crash test program. Autoliv is the onlysafety system company which is a supplier to all four vehicles.
From top: Renault’s Vel Satis and Mégane, Saab 9-3 and MercedesE-class.

Our vision is to substantially reduce traffic accidents,fatalities and injuries.
Our mission is to create, manufacture and sell state-of-the-art automotive safety systems.
Our strategy is to be the vehicle manufacturers’ first-choice supplier through:
• Technological leadership
• Complete system capabilities
• Highest-value safety system solutions
• Cost efficiency
• Quality excellence
• Global presence
• Highest level of service and commitment
• Dedicated and motivated employees
Our values are:
Life We have a passion for saving lives.
Customers We are dedicated to creating satisfaction for our customers and value for the driving public.
Employees We are committed to the develop-ment of people’s skills, knowledge and potential.
Innovation We are driven for innovation and continuous improvement.
Ethics We adhere to the highest level of ethical and social behavior.
Culture We are founded on global thinking and local actions.
Autoliv Inc., which is a Fortune 500 company, is theworld’s largest automotive safety supplier with salesto all the leading car manufacturers in the world. TheCompany develops, markets and manufacturesairbags, seat belts, safety electronics, steeringwheels, anti-whiplash systems, seat componentsand child seats.
Autoliv has 80 subsidiaries and joint ventures in 30vehicle-producing countries with over 30,000employees. In addition, Autoliv has technical centersin nine countries with 20 crash test tracks – morethan any other automotive safety supplier.
Autoliv’s shares are listed on the New York StockExchange (NYSE: ALV) and its Swedish DepositoryReceipts on the Stockholm Stock Exchange (SSE:ALIV).
3 Summary
4 Letter to Shareholders
6 Creating Shareholder Value
8 Autoliv’s Safety Systems
10 Research, Development & Engineering
12 R,D&E Projects
14 Autoliv around the World
16 Human Resources
17 Environment
18 Quality
19 Management’s Discussion and Analysis
28 Consolidated Statements of Income
29 Consolidated Balance Sheets
30 Consolidated Statements of Cash Flows
31 Consolidated Statements of Shareholders’ Equity
32 Notes to Consolidated Financial Statements
42 Report of Independent Auditors
42 Definitions
43 Selected Financial Data
44 Board of Directors
45 Senior Management
46 Shareholder Information

32002 Autoliv — Driven for Life
US$ (million)
1998 1999 2000 2001 2002
Capex Net cash flow
CASH FLOW
314
436
266 266
509
0
100
200
300
400
500
600
EARNINGS PER SHARE
1.841.95
1.67
.49
1.84
1.49
2.16
2.41
2.26
1998 1999 2000 2001 2002
Reported Comparable basis (pro forma)
US$
0.0
0.5
1.0
1.5
2.0
2.5
NET SALES
+11%
-3%+8%+9%
+7%
Consolidated sales
Global light vehicle production
US$ (million)
0
1,000
2,000
3,000
4,000
5,000
1998 1999 2000 2001 2002
Earnings per share recovered after a drop caused by a combination of pricingpressure, peaking component prices and falling vehicle production. Therecovery in 2002 to $1.84 corresponds to an improvement from 2001 of23% on a comparable basis (i.e. excluding Unusual Items in 2001 and usingthe same accounting principles for all years).
Both cash flow from operations and cash flow after investments hit recordhighs in 2002 of $509 million and $269 million, respectively. Although cashflow from operations has varied, the internal cash generation every year hasbeen enough to cover capital expenditures. The net cash flow in 2002 wasused for acquisitions ($22 million), dividends ($43 million), share buy-backs($30 million) and reduction of debt ($159 million).
Over the last five years, Autoliv’s sales have grown by an average of 6%,compared to an average increase in global light vehicle production of1%. In 2002, consolidated sales rose by 11%. Autoliv’s organic growthwas 6% compared to a 2% increase in global light vehicle production.
Autoliv is the exclusive safety system supplier to both the U.S. “Truck of the Year” – the VolvoXC90 (above) – and the European “Car of the Year” – the new Renault Mégane (page 8).
The XC90 features Autoliv's smart frontal airbags, side thorax bags, side curtain bags, andseat belts with pretensioners, load limiters and automatic height adjusters. It also featuresAutoliv's seat structures with anti-whiplash systems and – in the mid-rear seat – a Belt-in-Seat system.
Autoliv also manufactures the optional products: the emergency phone system, the fold-able third-row seat structure and the child safety seats.
• Record sales; up 11%
• Record cash flow from operations; up 91%
• Recovery in earnings per share; up 23%
• Raised declared dividend; up 18%
• Reactivated share repurchase program
• Record order intake
• World’s first anti-sliding bag
• Market breakthrough; Electronics operations added in the U.S.
Summary

was a successful year forAutoliv for many reasons.
We achieved record-breaking salesof $4.4 billion, an increase of 11%.Excluding acquisitions and currencyeffects, organic growth was 6%. Globalvehicle production increased byapproximately 2% and the supply valueof safety systems per vehicle atapproximately the same rate. Hence,Autoliv achieved its target to outgrowthe global market.
Costs were contained and, in relation tosales, reduced. This was partly a result ofthe restructuring program announced inOctober 2001 and the continuing move ofproduction to low-labor-cost countries. In2002, we created 1,900 jobs there (seegraph). Currently, Autoliv has 30% of itsemployees in these countries, comparedto less than 10% four years ago. Conse-quently, Autoliv is on track to reach the35% target we have set for the Company.
Return on equity has improved on ayear-over-year basis for each quarterduring 2002. The average return onequity for the year exceeded 9%.
The five-year trend of increasing levelsof working capital was broken. Thisreduction was achieved despite thehigher sales and the move to low-labor-cost countries. In relation to annualsales, working capital was reduced from11.0% at the beginning of the year to8.7% at the end. This was in compliancewith our target that working capitalshould not exceed 10% of sales.
Cash flow hit record highs of $509million before investing activities, and
lead our industry into its next technicalgeneration: active safety. We will alsofocus on traffic accidents and caroccupant groups that have not yetbeen properly addressed, such as pe-destrians and the growing populationof the elderly.
We see so many opportunities withinautomotive safety that we have noneed to expand in other areas outsideour core business. Funds and re-sources that Autoliv does not need forits core business are better returned toshareholders, allowing us to focus onwhat we do best.
Autoliv will remain the vehicle manu-facturers’ first-choice supplier partnermainly by offering:
- Technical leadership- Complete system capabilities- Cost efficiency- Quality excellence- Global presence- Dedicated and motivated employees
Implementation
During 2002, we implemented thisstrategy in several ways.
Technical leadership was evidencedby the introductions of the world’s firstanti-sliding bag (see page 9) and smartseat belt system with adaptive load lim-iters. In addition, we increased the num-ber of patent applications by 50% (seepage 10). We also drove the Night Visionand Pedestrian Protection projects (seepages 12 and 13) closer to completion.
The system capabilities of Autolivwere strengthened by the acquisitionof Visteon Restraint Electronics. Autolivnow offers the same capability in NorthAmerica to deliver complete airbag
$269 million after capital expendituresand acquisitions. The net cash flowcorresponds to 14% of Autoliv’s mar-ket capitalization at the end of 2002.Although this cash flow yield may notbe sustainable long-term, it certainlycontributes to Autoliv’s target of beingan attractive investment for the stockmarket.
Net debt was further reduced andamounted to 29% in relation to totalcapitalization, creating a comfortabledistance to the 40% cap in Autoliv’sgearing policy (see page 27).
Due to Autoliv’s strong cash flow andstrong balance sheet, the Board hasdecided not only to raise the dividendby 18%, but also to reactivate Autoliv’sshare repurchase program. The firsttime the higher quarterly dividend willbe paid is in March. The share buy-backs started during the fourth quarter2002, when 1.6% of the shares out-standing were repurchased for nearly$30 million.
Order intake during 2002 was also arecord high. The real difference com-pared to previous years was the strongorder intake from Asian car manufac-turers. Their orders reached the level ofthe contracts received from Autoliv’straditional customers in Europe.
Vision
We intend to remain the industry leader,but with an even stronger leadershipposition. We plan to expand in marketswhere there is still plenty of room formarket share gains such as in Asia.Along with staying in the technical fore-front of passive restraints we plan to
4 2002 Autoliv — Driven for Life
Letter to Shareholders
•
•
•
•
•
•
•
•
2002

52002 Autoliv — Driven for Life
Outlook for 2003
For the full year 2003, light vehicle pro-duction is expected to show a modestdecrease of 2-4%. Strong vehicle reg-istration in the fourth quarter of 2002,due to various incentives, may indicatethat some of this year’s sales werepulled into 2002. This could lead to asomewhat slow start in 2003. However,full-year production volumes could stillcome in as expected.
The acquisition of the remainingshares in NSK’s Asian seat belt opera-tions on April 1 will add just over $100million to the 2003 revenues. This con-solidation will, however, have a negli-gible effect on Autoliv’s results.
Assuming that the mid-Februaryexchange rates prevail, currency ef-fects could add approximately 5% toAutoliv’s 2003 sales. Consolidatedsales should also be favorably impact-ed by additional market share gains,although the gains are not expected tobe as significant as in the fourth quar-ter 2002.
Consequently, we expect 2003 to beanother successful year for our company.
Lars Westerberg
systems, including electronics that wealready offer in Europe. Furthermore,Autoliv’s system capabilities were ev-idenced in the EuroNCAP tests,Europe’s leading crash test program,where two car models for which Autolivhas had the safety-system responsibil-ity were among the few vehicles thatreceived the 5-star top rating.
Cost efficiency remains top priority forAutoliv. In November, we announced aprogram expected to save $5 million in2003 and then $20 million annually. In2002, we also sold Autoliv’s non-core steelstamping company in France, in accord-ance with our outsourcing strategy. Wealso opened a new seat belt plant inPoland, which will enable us to move moreproduction to low-labor-cost countries.
Quality excellence was evidenced byreceiving such prestigious awards as “TheExcellent Award for Quality Performance”from Toyota and “The Top SupplierAward” from Mitsubishi North America.
Global presence is one of Autoliv’s com-petitive edges. During 2002, we strength-ened that advantage by opening a largeplant in Korea and by being first to openan airbag plant in China. Sales in Japan,Korea and China rose by close to 25% in2002 and the order intake from these cus-tomers skyrocketed. We estimate thatwithin two years, Autoliv will have morethan one billion dollars in consolidatedsales in Asia, twice as much as in 2002.
Our dedicated and motivatedemployees have achieved these re-sults. They have done a fine job overmany years, for which I am very grate-ful. We are committed to continuallydeveloping their skills, knowledge andpotential even more.
Letter to Shareholders
0
2
4
6
8
10
12
PROFITABILITY
%
7.1
9.08.48.2
10.8
8.3
9.4
6.4
Q1 Q2 Q3 Q4
2001 (Excl. Unusual Items in the 3rd quarter and adjusted for new accounting principles)
2002
0
2,000
4,000
6,000
8,000
10,000
0
10
20
30
40
50 %
% of total employees
1998 1999 2000 2001 2002
HEADCOUNT ALLOCATION
SALES PLAN ASIA
0
200
400
600
800
1,000
1,200
Affiliates
2000 2001 2002 2003 2004 2005
Subsidiaries
US$ (million)
Within two years, Autoliv expects to have one billiondollars in consolidated sales in Asia compared toless than half a billion in 2002. Approximately half of the expected increase will be
organic. The other half will come from joint venturesthat will become consolidated subsidiaries.
During each quarter of 2002, the return on share-holders’ equity improved on a year-over-year basisand reached 10.8% during the second quarter com-pared to 9.0% in the corresponding quarter 2001.
In low-labor-cost countries, Autoliv increased itsnumber of employees by 1,900 in 2002 to over 9,400or to 31% of the total number of employees. In 1998,Autoliv had 1,300 employees in these countries,corresponding to 6% of the total number.

6 2002 Autoliv — Driven for Life
Autoliv’s overriding objective is to be anattractive equity investment. To achievethis target, cash flow is key as it is acompany’s ability to generate cash thatdrives returns to its shareholders.
Since cash flow depends both onearnings and the amount of capital thatis needed in operations, we focuse ongrowing earnings per share (“EPS”)while controlling the capital employedrequired to take advantage of Autoliv’sgrowth potential.
During the next few years, cash need-ed for working capital is targeted toremain below 10% of sales. At thesame time, capital expenditures areexpected to be in the same range asdepreciation (including amortization).
In order to assess Autoliv’s cash-gen-erating capability – and hence Autoliv’spotential for shareholder value creation –the most important drivers for earningsgrowth in Autoliv are identified below.
Revenue Growth
As for all companies, Autoliv’s revenuesare determined by the size of the market and the Company’s share ofthat market. In Autoliv’s case, thegrowth of the safety systems markethas added 3% annually to sales since1997 when the present Autoliv compa-ny was started. Higher market shareshave also contributed 3% on average torevenues. Since Autoliv already has arelatively high market share, we expectgrowth of the total market to be moreimportant for revenue growth during thenext several years than market sharegains, although Autoliv’s global marketshare should continue to increase.
The Market
Autoliv’s market is the global occupantrestraint market, which primarily com-
prises airbags, seat belts and relatedelectronics. In 2002, the market totaled$13 billion.
Apart from currency fluctuations, thesize of the safety market depends onglobal vehicle production and safetycontent per vehicle. Global vehicle pro-duction tends to grow by approximate-ly 2% per year, disregarding cyclicalswings. The safety content per vehiclehas expanded the market since 1993by 6% annually. This includes the effectof price reductions, which used to besignificant.
The growth of the safety value pervehicle has also moderated andamounts currently to approximately2%, disregarding currency effects.
The safety value per vehicle is drivenby introduction and penetration rates of new airbags and other new tech-nologies. We, and other safety systemssuppliers, can therefore influence thegrowth rate of our market by findingnew safety solutions that people valueand are prepared to pay for. New regulations are the other important driver of the safety content per vehicle.
Prices and margins are typically bet-ter for newer technologies. For manyyears, Autoliv has therefore made inno-vation a top priority, which has boostedthe Company into the technology lead-ership position it enjoys today.
Technical leadership has also con-tributed to making Autoliv the global sales
leader, providing economies of scale andresulting in a competitive edge oversmaller market players. Being the tech-nology leader also contributes to a bettersales mix. As a result, Autoliv is the lead-ing supplier for a majority of the vehicleswith safety content above the 2002 glob-al average of $229 per vehicle.
Market Share
During the past ten years, Autoliv hasincreased its share of the globalrestraint market from 11% to over30%. This has been accomplished byacquisitions (primarily the merger withMorton ASP in 1997) and by introduc-ing virtually all of the major industrybreakthroughs over the past decades.
Our goal is to continue to outgrow thetotal market. We are better positionedthan other safety suppliers in the mar-ket’s growth segments (such as sideairbags for head and chest protection).In addition, our investments in Asia arepaying off in the form of sharply risingsales. As a result, Autoliv’s marketshare in Asia, which has seen a recentgrowth surge, is expected to continueto increase from 15% to over 20% inJapan and from 30% to 40% in Koreaover the next three years.
Likewise, the North American marketshare is expected to increase to morethan 30% and the European share toremain in excess of 50%.
Cost Control
More than 50% of Autoliv’s revenuesare spent on components and otherdirect material from external suppliers.Controlling material costs is, conse-quently, one of the most important suc-cess factors in our business.
The most efficient method to reducethese costs is to continuously replaceexisting designs and components withnew, more cost-efficient ones. Betterdesigns can enhance quality even fur-ther, thereby eliminating scrap andhence saving costs. Consequently,Autoliv’s comprehensive quality program(see page 18), which is proactive, is vitalnot only for the the safety and function-
Creating Shareholder Value
(Left) Autoliv is the safety systems supplier toChrysler's new Pacifica. We deliver the smart driverand passenger airbags, the knee airbags, theInflatable Curtains, the steering wheel, and all theseat belts, including pretensioners for the front-seatoccupants.
(Right) Autoliv will also deliver safety systems toNissan's new Titan. Autoliv supplies the smart driverand passenger airbags, the steering wheel, and thethorax airbags and Inflatable Curtains for side-impactprotection.

72002 Autoliv — Driven for Life
ing of the products but also for Autoliv’sown profitability. Traditional purchasingactions such as consolidation of thesupplier base, standardization, and pur-chases in low-cost countries are alsoused to reduce material costs.
Our target is to reduce Autoliv’s ma-terial costs at least in line with thedecline in market product prices.
The second most important cost itemis labor. Manufacturing labor costs rep-resent nearly 20% of Autoliv’s rev-enues. In addition to traditional stream-lining actions, we have set the target tomove at least 1,000 jobs per year tolow-labor-cost countries. As a result,30% of the overall workforce is now inthese countries compared to less than10% four years ago. Given the currentcost and product structure, our targetis to increase this share to at least 35%within the next few years.
Total labor costs, including salariedemployees mainly in administrationand R,D&E represent over 25% ofAutoliv’s revenues. Our target is tospend at least 5% of Autoliv’s revenueson R,D&E (see page 10) to maintain our technical leadership and to manageour strong order intake. Autoliv’s sales and marketing expense is lowsince sales are exclusively to a fewcustomers, i.e. the vehicle manu-facturers. Consequently, the Selling,General and Administrative expense isonly 5% of sales, a level that we believeis sustainable.
Short-term Drivers
Since roughly one-third of Autoliv’scosts are relatively fixed, short-termearnings are highly dependent on thecapacity utilization in Autoliv’s plantsand are therefore sales dependent.Short-term cash flow also depends onthe timing of customer payments.These swings in cash flow can be sub-stantial from quarter to quarter.
The total production levels in ourmajor markets are good overall indica-tors of Autoliv’s capacity utilization, butit is the production levels for individualvehicle models that are critical, sincemany under-utilized production linestypically can not be used to supplyanother car model.
Conclusions
Currently, 58% of Autoliv’s capitalemployed consists of goodwill andother intangible assets, mainly from theacquisition of Morton ASP in 1997.Since this fixed amount does notincrease as long as sales growth isgenerated organically, we could growour sales and earnings at a higher ratethan capital employed.
Currently, we do not foresee anymajor acquisitions. In addition, we donot believe that there is a need toreduce debt levels further, since netdebt at the end of 2002 amounted toless than 30% of capitalization. InAutoliv’s gearing policy (see page 27),we have set the cap at 40%, which
Creating Shareholder Value
MARKET BY PRODUCT
0
2
4
6
8
10
12
14
1993 1994 1995 1996 1997 1998 1999 2000 2001 2002
US$ (billion)
Seat belts Frontal airbags
Side airbags Electronics
MARKET BY COMPANY
Autoliv
TRW
Takata
Breed
Other
SALES BY CUSTOMER
Ford
GM
Renault/Nissan
VW
DaimlerChrysler
Peugeot/Citroen
Toyota
OtherSALES BY REGION
0
20
40
60
80
100
1998 1999 2000 2001 2002
Europe N. America Japan RoW
%
Since 1993, Autoliv’s market has grown at an annualaverage rate of 9% to $13 billion. Higher safety contentper vehicle has added 6% annually. Increased vehicleproduction contributed the remaining 3%.In 2002, the market recovered after having declined
for two years as a result of the weak Euro and Yen,pricing pressure and, in 2001, falling global vehicleproduction. The growth is currently driven by side-impact airbags and smart frontal airbags whichmainly drive the electronics segment.
Autoliv has been the global sales leader in automotivesafety since 1997. Currently, the Company accountsfor one-third of the world market.
Autoliv’s competitive edge is technological lead-ership, superior global presence and system capabil-ities with in-house expertise in all key competence areas. The second largest suppliers are TRW and Takata,
each with approximately a quarter of the market. TRW is an American company. In 2002, TRW’s safety
systems and TRW’s other automotive businesses wereacquired by the Blackstone equity fund.Takata is a Japanese, family-owned company.Breed’s share has dropped to less than a tenth of the
market. Breed is an American company which isowned by its creditors after having emerged fromChapter 11 in 2000.
In 2002, Ford’s (incl. Volvo, Land Rover, etc) share ofAutoliv’s sales increased from 20% to 23% as a resultof the acquisition of VRE, a former Ford unit. The second largest customer group is General
Motors (incl. Opel, Isuzu, Saab, etc.) with 15%, fol-lowed by Renault/Nissan (13%), DaimlerChrysler(9%), Volkswagen (9%,) Peugeot/Citroën (8%) andToyota (5%). From a risk point of view, it is more important that no
individual contract accounts for more than 4% ofAutoliv’s sales. Each contract is typically for one vehicle model or plat-
form. A contract is usually valid as long as that car modelor platform is produced (approximately 4-5 years). The contracts are awarded some three years before
production starts.
The European market accounts for approximately 50%of Autoliv’s sales, the North American market for a thirdof sales and Japan and the rest of the world for approx-imately 10% each. The most important individual markets are the
United States, Germany, France, Japan, Spain,Great Britain and Korea. Sweden accounts for 4% of revenues.
should be enough for the inherent risksand the cyclicality in Autoliv’s business.At the same time, it is important for acompany to have a capital structurethat is optimal for its shareholders.
Consequently, provided that costscontinue to be controlled, Autolivshould be able to generate a strongcash flow resulting from rising revenuesas both the safety market and Autoliv’sshare of that market continue to grow.
Through dividend payments andshare buy-backs, cash can be returnedto the Company’s owners, thereby cre-ating incremental value for Autoliv’sshareholders.

8 2002 Autoliv — Driven for Life
Autoliv’s Safety Systems
Renault’s new Mégane, which was
named The European Vehicle of the
Year in 2003, is an example of a new
vehicle with many state-of-the-art safe-
ty products from Autoliv, often devel-
oped in cooperation with Renault.
SEAT BELT SYSTEMS
Estimated to reduce the overall risk for
serious injuries in crashes by 60–70%.
Produced by Autoliv since 1956.
Pretensioners and Load limiters in
the retractors which act on the shoulder
part of the seat belt. A pretensioner tight-
ens the belt at the onset of a crash, using
a small pyrotechnic charge. Load limiters,
originally introduced by Renault in 1995,
pay out some webbing to reduce the seat
belt load on the occupant’s chest. In the
front seats where there is a risk of hitting
the steering wheel or the dash board the
excessive energy is instead absorbed
1
2
more uniformly by the frontal airbag. This
reduces the risk for life-threatening chest
injuries by about 75% in frontal crashes.
Buckle-mounted pretensioners for
both front seat occupants. Tightens the
belt at the onset of a crash. If it is a very
severe crash the lap-belt pretensioners
(no. 4) or the anti-sliding bags (no. 5)
are also deployed. Buckle pretension-
ers were originally introduced by
Autoliv in 1989.
Load limiters at the outer, lower
anchorage points of both front belts. In
combination with the load limiters in the
retractors, they release some webbing
before the load on the occupant becomes
too high. In the 5-door Mégane, there are
also lap-belt pretensioners at these
anchorage points, while the 3-door and the
Coupé-Cabriolet versions have anti-sliding
bags.
ANTI-SLIDING BAGS
An Autoliv invention introduced in 2002
installed in the 3-door and the Coupé-
Cabriolet versions of the new Mégane.
(See separate illustration).
THORAX SIDEBAGS
Introduced by Autoliv in 1994 and esti-
mated to reduce the risk of serious
chest injuries in side-impact crashes
by approximately 20%. In the new
Mégane, these bags are standard in
the front seats and optional in the rear
seats.
PASSENGER AIRBAG
Estimated to reduce fatalities in frontal
crashes by approximately 20% (for
belted occupants). Both frontal airbags
in the new Mégane have the new
Autoliv invention “Variable-Volume
Bags” (VVB), developed in cooperation
with Renault, to inflate the passenger
7
4
5
6
3
1
2
3
8
910
11
2

92002 Autoliv — Driven for Life
bag to either 90 or 120 liters depending
on the severity of the crash.
STEERING WHEEL
Most driver airbags are snapped into
the steering wheels. Autoliv introduced
this concept in 1995 in cooperation
with Renault. It reduces the overall cost
for the vehicle manufacturers by elimi-
nating screwing operations at the ve-
hicle assembly line.
DRIVER AIRBAG
Estimated to reduce driver fatalities in
frontal crashes by approximately 25%
for belted drivers and serious head
injuries by over 60%. The driver airbag
in the new Mégane has the new Autoliv
invention “Variable-Volume Bags” (VVB),
developed in cooperation with Renault,
to inflate the driver bag to either 45 or
65 liters depending on the severity of
the crash and the size of the occupant.
8
9
INFLATABLE CURTAINS (IC)
Estimated to reduce the risk for life-
threatening head injuries in side-impact
collisions by more than 50%. An
Autoliv innovation introduced in 1998.
The textile bag is manufactured using
Autoliv’s patented one-piece-weaving
technology.
AIRBAG CONTROL UNIT (ACU)
Located in the middle of the vehicle,
where it is well protected. This “elec-
tronic brain” of the car’s safety systems
decides not only if and exactly when
each of the seat belt pretensioners
should be fired but also if and when
each airbag stage should be deployed.
The central electronic unit contains a
crash sensor and a microprocessor.
There are also satellite sensors in the
doors for side-impact collisions.
World’s First Anti-Sliding Bag
In 2002, Autoliv introduced the world'sfirst anti-sliding bag, made for and incooperation with Renault. The bag isaimed at preventing “submarining” –i.e. sliding under the seat belt. The bagis currently available in the 3-door andthe Coupé-Cabriolet versions of the newMégane, but will soon be available inother European and Japanese vehicles.
The new airbag improves the protec-tion offered by the seat belt and reducesthe risk for injuries to the abdomen. Italso improves the protection providedby the frontal airbags by keeping theoccupant in a more upright position sothe occupant's impact is absorbed bythe entire bag. In addition, the anti-slid-ing bag reduces the risk of the knees hit-ting hard against the instrument panel.
The anti-sliding bag is not only the firstairbag in the world that protects againstsubmarining, but it is also the first auto-motive airbag that is made of metalsheets instead of textile fabric. These verythin sheets provide additional restrainingforce by deformation, in addition to therestraining force provided by gas pressureas in regular textile airbags. A robustmetal sheet can also better withstand theharsh environments under the seat. Inaddition, no folding or protective cover isrequired, which provides cost benefits.
Autoliv’s Safety Systems
10
11
4
5
6
7

According to an estimate by the WorldHealth Organization (WHO), every yearover one million people are killed glob-ally in traffic accidents. By 2020, twiceas many will perish if nothing is done.Road traffic accidents will rise from theninth position today to become thethird leading cause of death.
In addition to the human suffering,traffic accidents cost societies hun-dreds of billions of dollars annually forcare, rehabilitation and lost income.Hence, there is a compelling need forsafer roads and safer motor vehicles.
Autoliv’s business mission is to con-tribute to meeting this need by beingthe leading automotive safety compa-ny. Consequently, Autoliv continues toprioritize the most severe and expen-sive accident types to which it canapply its safety technologies andexpertise. To identify these problemareas, Autoliv uses available accidentdatabases (such as CCIS in the U.K,and NASS-CDS in the U.S.).
Autoliv’s R,D&E (Research, Develop-ment and application Engineering) isbased on the Company’s internal tests,trials and studies in addition to the vastexpertise that Autoliv’s specialists havedeveloped over many years.
Autoliv’s research is also conductedin consultation with its TechnicalAdvisory Board (see next page).
Product Development
If a feasibility study indicates thatAutoliv’s product idea is technically andfinancially sound, a project is started,often in cooperation with a selected
varying dates through the year 2022. Theexpiration of any single patent is notexpected to have any material adverseeffect on Autoliv’s financial position.
The number of patent applications hasincreased over the past few years, part-ly as a result of a new policy to providestronger and broader patent protection.In 2002, the number of patent applica-tions increased by almost 50% relativeto 2001. The applications increased inall product and component areas.
Autoliv has secured trademarks,which also offer benefits in marketingand differentiating products.
Products and Systems
Since it is Autoliv’s strategy to be thecustomers’ first-choice supplier forautomotive safety, it is important to bethe technology leader and to have themost comprehensive product offeringin the industry. In this way, Autoliv cantruly be “the one-stop-shop” for auto-motive safety.
In addition, Autoliv focuses on beingthe customers’ preferred advisor andconsultant for automotive safety.Autoliv is well positioned for this taskwith expertise in all of the special tech-nologies that are required for designingcomplete safety systems. For instance,Autoliv Inflators provides the pyrotech-nic expertise required for developingand producing the inflators for airbagsystems and the micro gas generatorsfor seat belt pretensioners. AutolivElectronics provides expertise requiredfor programming the microprocessorsthat control one or more safety sys-
vehicle manufacturer as the develop-ment partner. The development partnershould have a suitable vehicle modelplanned for launch when the new prod-uct is intended to be ready for intro-duction.
The project gradually progressesthrough the development process,APDS (Autoliv Product DevelopmentSystem), which consists of four toll-gates. At each tollgate, expert teamsevaluate the project’s progress and, atthe last tollgate, the developed productis finally released for production andsales. This process can take betweentwo and four years.
All application engineering projectsare completed at Autoliv’s local techni-cal centers. Corporate developmentprojects are usually assigned to one ofthe major technical centers in France,Germany, Japan, Sweden or the UnitedStates.
Technical centers have also been es-tablished in Australia, Spain and the U.K.There is also a sled test facility in India.
Autoliv’s corporate research projectsare concentrated in the Autoliv Re-search Center in Sweden.
Patents and Trademarks
Autoliv holds more than 3,000 patentscovering a large number of innovations,such as the Inflatable Curtain, rolloversensing, the one-piece-weaving tech-nology for airbags, the buckle pretension-er principle, the seat-mounted thoraxside airbag, the anti-whiplash seat prin-ciple and a vast number of other systemsand technologies. The patents expire on
10 2002 Autoliv — Driven for Life
Research, Development & Engineering
Autoliv is the main safety system supplier to GM’snew Pontiac Grand Prix. Autoliv manufactures the smart driver and passen-
ger airbags, the steering wheel and the pretension-ing seat belts.

tems. Weaving expertise is provided byAutoliv Textiles.
To create optimal restraint systems,the driver airbag should be integratedwith the steering wheel, while the tho-rax sidebag, the seat belt buckle andthe anti-whiplash mechanisms shouldall be integrated within the seat. Autolivcan accomplish this through its AutolivSteering Wheels and Autoliv Seat Sub-Systems groups.
Having these sub-technologies in-house is a competitive advantage whencomplete safety systems are beingdesigned, not only for functionality ofthe system but also for cost optimiza-tion. For example, savings on an airbagmodule must not lead to more expen-sive and complex belt or sensing sys-tems. Autoliv is therefore involved inthe entire integration, development andmanufacturing process to providevalue to its customers.
Often it is also more cost efficient ifone company can supply all safety sys-tems to a car model, instead of onecompany delivering the frontal airbags,another the side airbags, a third makingthe seat belts, etc. A single supplierapproach could also provide bettercrash performance for the vehicle. As aresult, vehicle manufacturers areincreasingly following this trend andAutoliv, with its system capabilities andcomprehensive product program, isleading this trend among the safetysystems suppliers.
112002 Autoliv — Driven for Life
Research, Development & Engineering
0
50
100
150
200
250 US$ (million)
1998 1999 2000 2001 20023
4
5
6
7
8
%
9
10
R,D&E EXPENDITURES
In percent of sales
During 2002, Autoliv’s net expenditures for R,D&E(research, development and customer applicationengineering) rose by 14% to $230 million. This corresponds to 5.2% of sales during 2002, com-
pared to 5.0% during 2001. The increase in R,D&E expenditures is mainly a
reflection of the strong order intake during the pastthree years.
Excluding customer reimbursement for engineeringprojects and crash tests, the R,D&E ratio exceeds 7%of consolidated net sales.
Professor Murray Mackay Chairman University of Birmingham, U.K.
Professor Jeff Crandall University of Virginia, Charlottesville, USA.
Professor Per Lövsund Chalmers University of Technology,Gothenburg, Sweden.
Professor Koshiro Ono Japan Automobile Research Institute (JARI)and Tokyo Institute of Technology, Japan.
The Autoliv Technical Advisory Board
Autoliv’s research is conducted in con-sultation with its Technical AdvisoryBoard, which consists of recognizedresearchers in traffic safety, crash safe-ty and biomechanics of impact.
In 2002, board member ProfessorHermann Appel from the TechnicalUniversity of Berlin, Germany, passedaway. Professor Koshiro Ono from theJapan Automobile Institute joined theAdvisory Board later that year.
Rolls Royce’s new Phantom has Autoliv’s steeringwheel and smart driver airbag. Autoliv also deliversthe smart passenger airbag, the knee airbag and thesmart seat belt systems with adaptive load limiters.

Night Vision
By using an infrared camera, the driver’svision can be significantly improved atnight.
The view from the camera can be seenon a pop-up display. This screen can beplaced on the instrument panel in frontof the driver without interfering with hisview through the windshield.
With Autoliv’s system, the distancethat the driver can see in front of thevehicle can be extended from less than100 meters with dipped head beams tomore than 500 meters in ideal condi-tions.
The driver’s view is also much broaderthan the narrow beam that headlightsprovide. In addition, there is no risk forglare from oncoming vehicles, since thecamera Autoliv uses can work withoutany illumination and the normal lightfrom head beams has another wavelength.
The camera in Autoliv’s Night VisionSystem has been developed by IndigoSystems Corp. An existing camera from
this American company is currently inthe process of being miniaturized andqualified to the tough environments typ-ical for a motor vehicle.
The new camera will be smaller than acigarette packet which will make it pos-
12 2002 Autoliv — Driven for Life
R,D&E Projects
A small screen on the instrument panel showswhat the driver can not see with the naked eye.
Courtesy of Saab Automobile AB.
3+2-Point Seat Belt
The 3-point seat belt is the most ef-ficient passive protection system inautomobiles today. It reduces the riskof life-threatening injuries by 60-70%.
However, in some accidents it is lessefficient, because there is a risk that theoccupant slides out of the shoulderbelt. This can occur in rollovers and tofar-side occupants in side-impact col-lisions.
Of all life-threatening injuries to caroccupants, about 10% are to the headin side-impact collisions and half ofthese injuries are to the far-side oc-cupants.
In vehicle rollovers, 10,000 people arekilled every year in the U.S.
In many new vehicles, the occupantson the near side (the side that theoccupant hits first in a rollover) will getprotection from an Inflatable Curtain, inaddition to the protection offered bythe seat belt.
For the occupants sitting on the farside, however, it is imperative that they
do not slide out of the seat belt, their“last lifeline”.
The 4- and 5-point belts that are usedin racing cars require both hands forbuckling up, which would reduce seatbelt use if they were to be introduced inregular cars. Autoliv’s answer to theproblem is a 3+2-point belt and a newairbag, a Side-Support Bag at the in-board edge of the seat back.
The additional 2-point belt is attachedto the upper edge of the seat and runsacross the shoulder part of the existing3-point belt. It is supplemental to the 3-point belt and can only be buckled afterthis belt is properly buckled.
This means that people who do notuse the new belt will always have atleast the same seat belt protection astoday, i.e. not considering the addition-al protection from the Side-SupportBag.
Independent scientists in the UnitedStates are also currently evaluating thebenefits of the 3+2-point belt in frontalcollisions.
sible to install the camera in suitablelocations such as under the rear edgeof the hood. When used, the camera israised and “looks” above the hood justlike a periscope – without interferingwith the vision of the driver.
132002 Autoliv — Driven for Life
R,D&E Projects
During 2002, Autoliv extended its crash test facility in Sweden to include a test facility for rollovers. Since the tests can be conducted indoors, the results are not affected by rain,snow or other weather conditions. It is also an advantage that the confidentiality of future vehicles is maintained inside a building, away from photographers and potential onlookers.With the extension, the test lab building is 150 meters long and 30 meters wide.
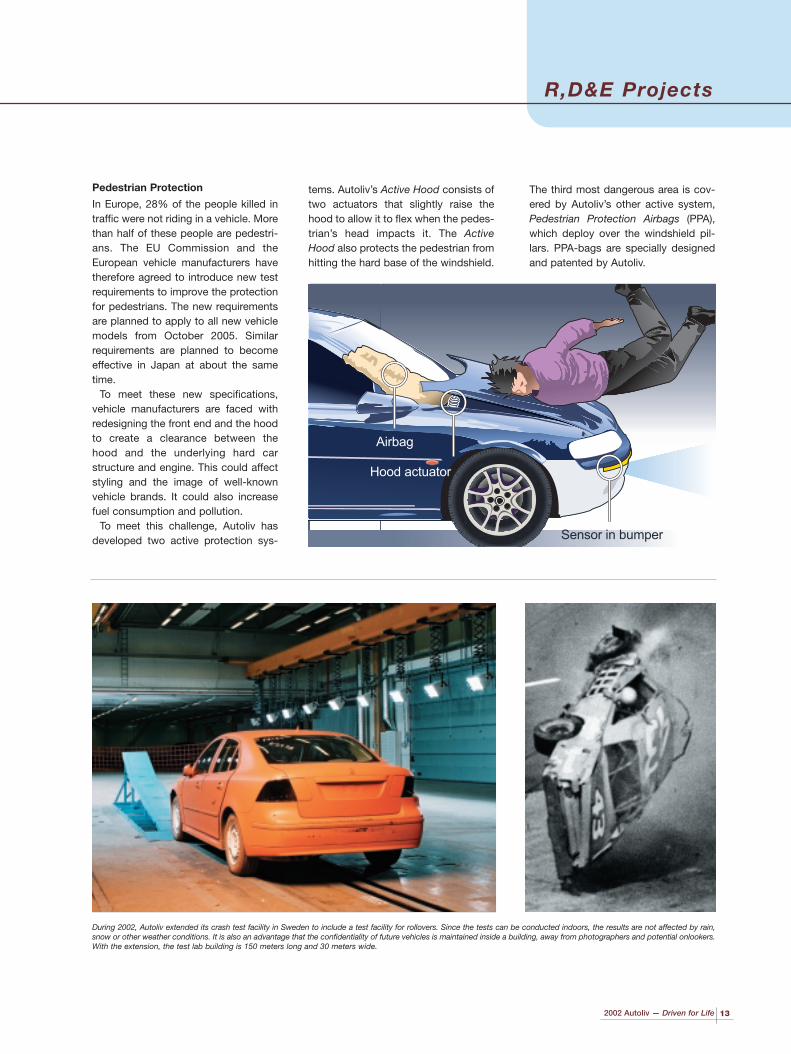
Pedestrian Protection
In Europe, 28% of the people killed intraffic were not riding in a vehicle. Morethan half of these people are pedestri-ans. The EU Commission and theEuropean vehicle manufacturers havetherefore agreed to introduce new testrequirements to improve the protectionfor pedestrians. The new requirementsare planned to apply to all new vehiclemodels from October 2005. Similarrequirements are planned to becomeeffective in Japan at about the sametime.
To meet these new specifications,vehicle manufacturers are faced withredesigning the front end and the hoodto create a clearance between thehood and the underlying hard carstructure and engine. This could affectstyling and the image of well-knownvehicle brands. It could also increasefuel consumption and pollution.
To meet this challenge, Autoliv hasdeveloped two active protection sys-
tems. Autoliv’s Active Hood consists oftwo actuators that slightly raise thehood to allow it to flex when the pedes-trian’s head impacts it. The ActiveHood also protects the pedestrian fromhitting the hard base of the windshield.
Airbag
Hood actuator
Sensor in bumper
The third most dangerous area is cov-ered by Autoliv’s other active system,Pedestrian Protection Airbags (PPA),which deploy over the windshield pil-lars. PPA-bags are specially designedand patented by Autoliv.

Note: “Customer” may exclude these with small sales, and headcounts include joint ventures.
14 2002 Autoliv — Driven for Life
Autoliv around the World
KOREAHeadcount: 100Capabilities: Production of seat belts and airbags; Sled-tracktestingCustomers: Daewoo, GM, Hyundai, Kia, Renault,Samsung and SsangyongLocations: Seoul; licensees in Munmak, Ulsan andKyungki-do
ARGENTINAHeadcount: 100Capabilities: Production of airbags and seat beltsCustomers: DaimlerChrysler, Faurecia, Fiat, Ford, GM,Iveco, JCI, Lear, Peugeot/Citroën, Renault, SAS, Toyota,Visteon and Volkswagen Location: Pilar (Buenos Aires)
AUSTRALIAHeadcount: 860Capabilities: Production of airbags, seat belts and web-bing; Crash testingCustomers: Ford, GM/Holden, Hyundai, Kia, Mitsubishi,Ssangyong, Telco and ToyotaLocation: Melbourne
BRAZILHeadcount: 400Capabilities: Production of airbags, seat belts, steeringwheels and webbingCustomers: Audi, DaimlerChrysler, Faurecia, Fiat, Ford,GM, JCI, PSA, Renault, SAS, Toyota and Volkswagen Location: Taubaté (Sao Paulo)
CANADAHeadcount: 750Capabilities: Production of webbing, airbag cushions andelectronicsCustomers: Autoliv and other seat belt manufacturersLocations: Collingwood, Markham and Tilbury
CHINAHeadcount: 310Capabilities: Production of airbags, seat belts and webbingCustomers: DaimlerChrysler, GM, Fiat, Ford, Honda,Hyundai/Kia, Iveco, Nissan, Peugeot/Citroën, Toyota,Renault, Volkswagen/Audi and Volvo Locations: Nanjing, Changchun and Shanghai (joint ven-tures)
ESTONIAHeadcount: 1,040Capabilities: Production of seat belts and seat belt componentsCustomers: AvtoVaz, GAZ, GM and Autoliv CompaniesLocation: Tallinn
FRANCEHeadcount: 5,870Capabilities: Production of airbags, inflators, initiators,steering wheels, seat belts, and electronics; Crash testingand technical development.Customers: Citroën, Nissan, Peugeot, Renault, Toyota,Samsung and Autoliv companiesLocations: Paris, Gournay-en-Bray, Poitiers, Pont-deBuis,Survilliers, Pontoise, Rouen and Valentigney (joint venture)
GERMANYHeadcount: 3,270Capabilities: Production of airbags, seat belts andsteel components; Crash testing and technical developmentCustomers: Audi, BMW, DaimlerChrysler, Ford, Grammer,Hyundai, ISRI, MAN, Mazda, Opel, Porsche, Volkswagenand Autoliv companiesLocations: Elmshorn, Dachau, Braunschweig, Döbeln andNorderstedt
GREAT BRITAINHeadcount: 1,420Capabilities: Production of airbags, airbag cushions, and seatbelt components; Crash testing and technical develop-mentCustomers: Aston Martin, Bentley, Ford, Honda, Jaguar,Mazda, Mitsubishi, Nissan, Rover, Toyota and Autolivcompanies Locations: Havant, Milton Keynes and Congleton
HUNGARYHeadcount: 730Capabilities: Production of seat beltsCustomers: Audi, BMW, DaimlerChrysler, Fiat, GM,Grammer, Intier, ISRI, Lamborghini, MAN, RSL, Skoda,Steyr, Suzuki, Volkswagen Location: Sopronkövesd
INDIAHeadcount: 240Capabilities: Production of seat belts; Sled-track testingCustomers: Daewoo, DaimlerChrysler, Ford, GM,Hindustan Motors, Hyundai, Maruti, Peugeot, Telco andVolvo Locations: Bangalore and New Delhi (joint venture)
BELGIUMHeadcount: 30Capabilities: Sequence supply and assembly of airbags, seat belts, steering wheels and seat componentsCustomers: Volvo and ECALocation: Gent
INDONESIAHeadcount: 70Capabilities: Production of seat beltsCustomers: GM, Hyundai, Mitsubishi, Nissan and Toyota Location: Jakarta
ITALYHeadcount: 15Capabilities: Sales & Application EngineeringCustomer: Fiat Location: Turin
JAPANHeadcount: 1,530Capabilities: Production of airbags, inflators, seat belts,steering wheels and electronics; Crash testing and technical developmentCustomers: Daihatsu, Hino, Honda, Isuzu, Mazda,Mitsubishi, Nissan, Nissan-Diesel, Subaru, Suzuki, Toyotaand Autoliv CompaniesLocations: Atsugi, Fujisawa, Fukuoka, Hiroshima, Nagoya,Osaka, Taketoyo, Tsukuba and Yokohama (joint ventures andsubsidiaries)
CZECH REPUBLICHeadcount: 2Capabilities: Sales officeCustomers: SkodaLocation: Mladá Boleslav

152002 Autoliv — Driven for Life
MEXICOHeadcount: 3,150Capabilities: Production of airbags, airbag cushions, seatbelts and steering wheelsCustomers: DaimlerChrysler, Ford, GM, Honda, Hyundai,Nissan, Mazda, Mitsubishi, Toyota, Volkswagen, Volvo andAutoliv CompaniesLocations: Toluca, Querétaro and Tijuana
NEW ZEALANDHeadcount: 5Capabilities: Sales officeCustomers: AftermarketLocation: Auckland
MALAYSIAHeadcount: 400Capabilities: Production of airbags, seat belts, steeringwheels and webbingCustomers: BMW, DaimlerChrysler, Ford, Honda,Hyundai, Kia, Mitsubishi, Nissan, Perodua, Proton,Suzuki, Toyota and VolvoLocation: Kuala Lumpur (joint ventures)
NETHERLANDSHeadcount: 250Capabilities: Production of seat belts, child seats andwebbing seat beltCustomers: BMW, Ford, GM, Mitsubishi, Renault, Saab,Volvo and VolkswagenLocations: Landgraaf and Boxtel
PHILIPPINESHeadcount: 570Capabilities: Production of seat belts and steering wheelsCustomers: Ford, GM/Isuzu, Honda, Kia, Mitsubishi,Toyota and Autoliv Japan Location: Manila and Cebu
ROMANIAHeadcount: 200Capabilities: Production of airbags and seat belts Customers: Dacia, Daewoo and Autoliv companiesLocation: Brasov
SPAINHeadcount: 1,480Capabilities: Production of airbags and seat belts; Crash testing and technical developmentCustomers: : AutoEuropa, Ford, DaimlerChrysler, Mazda,Nissan, Opel, Peugeot/Citroën, Pininfarina, Renault, SEAT,Volkswagen and Autoliv companiesLocations: Barcelona and Valencia
SWEDENHeadcount: 2,720Capabilities: Production of airbags, seat belts, seat sub-systems, child seats, electronics and inflators; Crash testingand technical developmentCustomers: Jaguar, Saab, Scania, Volvo and AutolivcompaniesLocations: Stockholm, Vårgårda, Växjö, Hässleholm,Motala, Linköping, Kungälv and Göteborg
TAIWANHeadcount: 80Capabilities: Production of airbags and seat beltsCustomers: Ford, GM, Honda, Isuzu, Mitsubishi, Nissanand ToyotaLocation: Taipei (joint venture)
THAILANDHeadcount: 770Capabilities: Production of airbags, seat belts and steeringwheels Customers: BMW, GM, Honda, Isuzu, Nissan, Samsung,Thai Rung, Toyota, Volvo and Autoliv CompaniesLocation: Bangkok (joint venture and subsidiary)
TURKEYHeadcount: 490Capabilities: Production of airbags, seat belts, seat beltcomponents and steering wheelsCustomers: Anadolu Isuzu, BMC, Chrysler, Ford Otosan,Hyundai Assan, Karsan, MAN, Mercedes Benz, Otokar,Otoyol, Oyak Renault, Tofas-Fiat, Toyota and Autoliv compa-niesLocation: Gebze-Kocaeli and Dudulu-Istanbul
USAHeadcount: 6,980Capabilities: Production of airbags, seat belts, steeringwheels, inflators, airbag cushions and electronics; Crashtesting and technical developmentCustomers: BMW, DaimlerChrysler, Daihatsu, Ford, GM,Honda, Hyundai, Isuzu, Kia, Mazda, Mitsubishi, Nissan,Subaru, Suzuki, Toyota and Autoliv companiesLocations: Auburn Hills and Southfield, Michigan;Brigham City, Ogden, Tremonton and Promontory, Utah;Indianapolis and Columbia City, Indiana; Madisonville,Kentucky; and Denver, Colorado
POLANDHeadcount: 760Capabilities: Production of airbags, airbag cushions andassembly of seat beltsCustomers: Autoliv companiesLocations: Olawa, Jelcz-Laskowice.
SOUTH AFRICAHeadcount: 150Capabilities: Production of airbags and seat beltsCustomers: BMW, Ford, Mazda, Nissan, Toyota andVolkswagen.Location: Johannesburg
TUNISIAHeadcount: 1,950Capabilities: Production of seat belts and steering wheels Customers: Autoliv companiesLocation: Zriba, Nadhour and El Fahs
Autoliv around the World

The objective of the human resource(“HR”) activities is to support the busi-ness targets of Autoliv. For this support,the HR departments in Autoliv haveseveral tools, ranging from on-the-jobtraining, job rotations, and internationalassignments, to incentive-based, com-petitive compensation packages. Thetarget – and the challenge – is to com-bine these tools in the most efficientway to carefully foster the talent, ener-gy and dedication of each individual inAutoliv.
The overall target is to have empow-ered employees, global culture andcooperation, flexibility and labor mobil-ity as well as motivated individuals.
People Development
We have many well-trained, qualifiedand dedicated employees who havebrought the Company to its currentworld-leading position. To strengthenthis position, we continue to invest indeveloping people. In 2002 for in-stance, a new process was put in placewith the target for 2003 of investing, onaverage, 4 days per employee in devel-opment and training programs. Webelieve in providing all employees withthe opportunity to use and expand theirskills, knowledge and creative poten-tial. This motivates people and unleash-es their full potential while securingAutoliv’s need for qualified people.
We also encourage job rotation andmobility across functions, companies andnational boundaries. This gives partici-pants broader views and better under-standing of Autoliv’s common goals.
Management Resources
To maintain Autoliv’s growth momentum,we identify employees with high potentialand offer them further training based ontheir individual development plan. During2002, a new identification process and anew leadership program were launchedwith the goal of developing people fromwithin Autoliv’s organization to fill mostkey management positions.
We have also introduced a new train-ing program for senior leaders. This ispart of a review of Autoliv’s manage-ment resources. The review is based onthe leadership values formalized during2002 which state, for instance, thatAutoliv’s leaders should empower, sup-
port and develop employees; fostercreativity and innovation; and treat allemployees with respect.
Global Culture
We are committed to taking full advant-age of our superior global reach. Thisnot only involves product standardiza-tion, purchase pooling and other “hard-ware” synergies, but also the best useof Autoliv’s human resources by coor-dinating employees, streamlining orga-nizations, etc.
To meet this challenge, Autoliv hasglobal teams, policies and training pro-grams. Autoliv also has nearly 100international assignments where peoplework for the Company in another coun-try. The target is to double theseassignments within the next two years.International experience within theCompany or with another company willincreasingly be required for top posi-tions in Autoliv’s major subsidiaries. Onthe corporate level, more than half ofthe management already have thisbackground.
Furthermore, to promote and driveglobal synergies, all bonuses for seniorlevels, including executives in sub-sidiaries, are increasingly based onAutoliv’s consolidated earnings and notonly on the result of the local company.
Incentives
To attract, retain and motivate manage-ment, the compensation for keyemployees in Autoliv consists of apackage with three components: abase salary, a performance-basedbonus and a long-term incentive plan.All bonuses have a cap.
A manager’s bonus is typically basedon a combination of the operating prof-its of Autoliv Inc. and the local unitwhere he/she works. The long-termincentives are usually in the form ofstock options with a 10-year life (seepage 38).
Corporate Governance Guidelines
Autoliv has a Social Policy as part of ourCorporate Governance Guidelines thatdraws on the principles of the UnitedNations’ “Global Compact” and theGlobal Sullivan “Principles of SocialResponsibilities”. The Policy is availableat http://www.autoliv.com/policies.
16 2002 Autoliv — Driven for Life
Human Resources
Over the last five years, the number of Autolivemployees has increased by nearly 50%, includingthe effects of acquisitions and the effect of transfer-ring production to low-labor-cost countries. During the same period, the production volumes for
seat belts have risen by nearly 40% and for Autoliv’smain product – airbags – by 90%. During 2002, the number of employees increased
by 6%, while seat belt and airbag volumes rose by6% and 17%, respectively.
Employee Facts
At the end of 2002, Autoliv had 30,100 employ-
ees and 4,100 temporary workers or a total
headcount of 34,200. The total number
increased by 2,400 during 2002.
Of the employees, 85% work in manufactur-
ing, close to 10% in R,D&E and 5% in sales
and administration. Nearly 50% are women.
Work hours lost due to employee illness was
2.5% in North America and over 6% in Europe,
despite the fact that the production technology
is the same. The European plants have
launched programs aimed at reducing this gap
which we believe primarily reflects differences
in the welfare systems.
The turnover rate among the employees is
less than 5%, in line with Autoliv’s target.
PRODUCTIVITY IMPROVEMENT
1998 1999 2000 2001 2002
Number of employees
Number of airbags (in thousands)
Number of seat belts (in thousands)
0
10,000
20,000
30,000
40,000
50,000
60,000
70,000
EMPLOYEE TRAINING
2000 2001 2002 2003
Days/Employee
0
1
2
3
4
5
In 2002, Autoliv invested on average approximately 2days per employee in training programs. In 2003, thisinvestment is intended to increase to 4 days.

172002 Autoliv — Driven for Life
Environment
The primary purpose of Autoliv’s envi-ronmental management is to fulfill alllegal and customer requirements. Butenvironmental management also con-tributes to the profitability of theCompany, both by reducing material useand by making Autoliv’s products betterand more valuable for the driving public.
Today more than ever, consumerswant environmental-friendly vehicleswith low levels of pollution and carbon-dioxide emission and vehicles withmore recyclable materials for end-of-life scrapping. As a result, automotivesuppliers are increasingly competingusing environmental-friendly products.To lead this trend, Autoliv focuses onproduct development and on:- weight reduction- recycling capability improvements - and material selection.
Autoliv’s own production facilities arealso important and every plant monitorsclosely all relevant environmental fac-tors such as use of packaging material,energy and water consumption, andemissions. The plants also have thor-ough environmental management sys-tems, which are audited by internal andexternal experts. However, since mostof Autoliv’s plants do assembly workexclusively with manufactured compo-nents, the overall environmental impactis nearly comparable to that of an office.Hence, the most significant improve-ments to be gained are from the threeareas mentioned above.
Weight Reduction
By redesigning a product, the materialcontent can be reduced. Although thereduction in an individual product maybe just a few grams, it can lead to hugematerial savings – often thousands oftons annually – and therefore to lesspollution from steel mills and othercompanies in Autoliv’s supply chain.
The new designs also lead to lessweight in the vehicles and, consequent-ly, to less fuel consumption and carbon-dioxide emissions, which can be signi-ficant during the life of a vehicle.
Recycling Capabilities
In 2000, the European Parliamentadopted the directive End of Life ofVehicle (“ELV”), which stipulates that95% of the material in a new vehicle
Autoliv’s plants in Utah are reloaded inthe Midwest with components afterhaving delivered Autoliv’s products tothat region’s vehicle plants. Autoliv alsouses foldable reusable shipping boxesto minimize the space needed forreturning boxes for reuse.
Autoliv actively supports its customersin their environmental programs. Autolivis, for instance, represented in the FordSupplier Environmental Forum togetherwith ten other leading Ford supplierswhich have a track record of being in theforefront of environmental management.
Autoliv’s Environmental Policy is avail-able at http://www.autoliv.com/policies.
shall be recoverable. The directive willbe phased-in, starting in the fall of2003, on all new vehicle models. ELValso bans the use of hazardous sub-stances and restricts the use of othersubstances.
Several years ago, Autoliv started itspreparations for this expected changeby putting increased focus on materialreduction, elimination of hazardous sub-stances and the use of recyclable ma-terials. As a result, the use of hazardousmaterials is extremely limited and theremaining quantities will be eliminated intime for ELV’s deadline. Over the pastseveral years, Autoliv has also beenactively reducing its use of other sub-stances unfriendly to the environment.Consequently, Autoliv is one of the sup-pliers ahead of the ELV-requirements,which is a competitive advantage.
We are committed to maintaining thatlead by continuing to optimize thedesign and recyclability of our productsand improving our manufacturingprocesses. The requirements in the ELVdirective will also be applied by Autolivto its operations outside Europe.
Material Selection
In addition to fulfilling their function, thematerials in Autoliv’s products have tobe cost competitive, safe for car occu-pants and easy to recover when thevehicle is scrapped. Selecting and con-trolling the material is therefore a criticalpart in Autoliv’s Product DevelopmentSystem (“APDS”) (see page 10).
The data from APDS as well as allother data on the product are regis-tered in Autoliv’s global Product DataManagement database. As a result,Autoliv had a head start when, in 2001,the vehicle manufacturers decided torequire their suppliers to register allsubstances in their products in theIMDS. This global material databasewas started by the vehicle manufactur-ers to enable them to assess vehiclecompliance with the ELV directive.
Customers and Suppliers
Autoliv works closely with its supplierson environmental matters. For instancein the United States, Autoliv initiated across-dock logistical system to in-crease shipping efficiency. Using thisnew system, trucks returning to
At the end of 2002, 48 plants had been certifiedaccording to ISO 14001, an international environ-mental management standard. More than 90% ofAutoliv’s consolidated sales come from these fac-ilities. The numbers include all the major plants inEurope and North America. The certification work was begun in 1997. The
operations not yet certified are mainly companiesthat have been started or acquired recently.
1998 1999 2000 2001 2002
Number of facilities % of sales
0
20
40
60
80
100
CERTIFICATIONS
20
40
60
80
100
0
%Facilities
The chart represents the environmental impact fromAutoliv’s plants and products based on a life-cycleperspective, which consists of four stages.
It is not enough to focus on the manufacturingphase, but it is the combined effects from all fourstages that should be minimized. Since the environ-mental impact from Autoliv's own plants is small,Autoliv focuses most on the other stages.
LIFE CYCLE PERSPECTIVE
Supply chain ManufacturingUse of the productEnd-of-life recovery/scrapage

18 2002 Autoliv — Driven for Life
Quality and reliability are key at Autoliv.Our products never get a secondchance. They have to work for decadesin the tough and varying environmentsthat are typical for motor vehicles.
Quality is also a must for Autoliv’sown profitability. Even small increasesin scrap rates can effect earnings of anAutoliv plant, since manufacturing andmaterial costs take two-thirds of rev-enues, and margins are modest in theautomotive supplier industry.
To meet these challenges, Autolivadopted a “zero defect” quality policymany years ago that is based on proac-tive and preventative principles. Thispursuit of excellence starts with the well-monitored Autoliv Product DevelopmentSystem APDS (see page 10).
The “zero defect” policy stipulatesthat no defective materials should enterthe production lines and that no non-conforming intermediate products orfinished products should be passed tothe next stage. Check points for errordetection are installed at critical sta-tions throughout the manufacturingprocess. As a result, Autoliv's rejectrate from its customers is low, typicallybelow 50 parts per million (ppm). Theoverwhelming majority of these returnsare related to bar codes, labels, andother administrative errors that do notaffect the performance of the product.
Supplier Cooperation
Autoliv has some of the best suppliers inthe industry. To reach high quality andlow reject rates, Autoliv puts greatemphasis on selecting suppliers andsupporting them to reach the excellencerequired for safety products. The suppli-er selection and development process isbecoming continuously more competi-tive since lower cost and further qualityimprovements are expected in Autoliv’songoing supplier consolidation program.
In 2002, Autoliv started a supplier part-ner portal on the web to enable suppli-ers to track orders and production fore-casts. The suppliers can also track theirscore in Autoliv’s supplier rating.
Autoliv requires its suppliers to becertified according to QS 9000.
Internal Quality
All of Autoliv’s own facilities are certifiedto this special automotive quality stan-
Targets
Autoliv is now taking the next step insuperior quality by tightening the target forthe customer return rates, bringing it downto 10 ppm. Supplier reject rates, which arecurrently much higher, should also bereduced to this level, which will enableAutoliv’s plants to reduce their internalreject rates to the same level. The perfor-mance of every Autoliv plant is publishedquarterly in an internal global database.Plants can then be benchmarked andwork to continously improve quality.
In this way, Autoliv’s comprehensivequality management not only ensuresthat the Company’s products meetcustomer specifications and legalrequirements, but also contributes toAutoliv’s profitability by servicing cus-tomers, promoting sales and continu-ously reducing costs.
dard, and 35 plants representing 75% ofsales are also certified to the newISO/TS 16949, an international qualitystandard. In 2002, a new edition of theISO/TS 16949 was adopted. Autoliv hasalready started the process of makingits facilities certified to the new editionand will require its key suppliers to do soas well. All Autoliv plants will be certifiedno later than 2004 to the new edition.
To drive global standardization, prod-uct improvements and cost savings,Autoliv has appointed a corporatedesign authority with global responsibil-ity for each product group. In this way,quality is assured – and improved –when a product is being modified.
In addition, Autoliv has a globalLessons Learned database to shareexperiences and spread best practicesamong its plants. Intercompany qualityaudits also accomplish this effect,when plants audit each other.Customer and other independent qual-ity audits provide additional input.
Autoliv uses Kaizen, Six Sigma and othertools for continuous quality improvements.Applying the corporate-wide Six Sigma in-itiative, which was started in 2001, Autolivtrains mentors to employ various methodsfor finding root causes to complex prob-lems and to take corrective actions.Already, 35 facilities have Six Sigmamentors and over 60 projects have beencompleted, yielding significant qualityimprovements and cost reductions.
Customer Support
Since a reputation for quality can gener-ate sales for the car manufacturers, it is acompetitive tool for many automotivesuppliers. Consequently, successful sup-pliers should not be content to simply bea customer’s approved supplier on a“green status list”, but should strive to beranked at the top of their supplier ratings.Autoliv’s plants generally belong to thiselite group in automotive safety products.
To strengthen an already strong posi-tion and further improve quality and ser-vice to customers, Autoliv has begunappointing Customer Quality Managers(CQM). These “quality champions”, whoare each dedicated to a sole customer,are specialists in their customer’s indi-vidual quality requirements and work toensure that these requirements are met.
Quality
CUSTOMER RATINGIndex
0
20
40
60
80
100
Aut
oliv
Aut
oliv
Aut
oliv
Oth
er
Oth
er
Oth
er
Oth
er
Oth
er
Oth
er
Two Autoliv business units shared the number oneposition in the supplier rating that one of the world’slargest vehicle manufacturers reported for 2002. Thenearest competitor scored 60% of that scored byAutoliv’s top units. The third Autoliv unit was rankednumber five among this customer`s nine suppliers of“Restraint Devices”.
CERTIFICATIONS
0
2000 2001 2002 2003
%
Certified facilities in percent
Percent of total sales
0
20
40
60
80
100
At the end of 2002, 45% of Autoliv's facilities werecertified to the new automotive standard ISO/TS16949. The combined sales of these companies rep-resents 75% of consolidated sales. In 2003, 95% ofthe Autoliv plants are expected to have this certifica-tion.

192002 Autoliv — Driven for Life
Management’s Discussion and Analysis
SIGNIFICANT TRENDSA number of trends have influencedAutoliv’s operations in the years 2000,2001 and 2002. The most significanthave been the changes in light vehicleproduction, the growing safety contentper vehicle, raw materials and compo-nents costs, pricing pressures fromcustomers, and foreign exchangerates, especially between the U.S. dol-lar and the Euro. The level of interestrates, particularly U.S. dollar and Eurorates, have also had an impact on thecost of financing the Company’s oper-ations.
Light vehicle production is one of themost important factors influencingAutoliv’s business. Historically it hasbeen light vehicle production in theTriad (i.e. Europe, North America andJapan) that has been most important.However, light vehicle production isincreasing rapidly in the rest of Asia.This trend has not yet had a majorimpact on Autoliv, but through bothconsolidated subsidiaries and jointventures, the Company has positioneditself to benefit from these emergingmarkets. In addition, Autoliv’s marketcontinues to be driven by the growingsafety content per vehicle. This enablesAutoliv to increase its sales above the2% long-term growth rate of globallight vehicle production. A major cur-rent driver of this trend is the InflatableCurtain for side-impact and rolloverprotection. The market for this headairbag is expected to grow to approxi-mately 30 million in annual unit sales by2005, from less than 10 million in 2001.
In the third quarter of 2000 signs ofweakness in the automotive marketbegan to appear, especially in the U.S.This set the stage for a large drop in
KEY FINANCIAL DATA
Years ended December 31,(Dollars in millions) 2002 2001 2000 Sales of airbag products (incl. steering wheels) $3,160 71% $2,817 71% $2,934 71%
Sales of seat belt products (incl. seat components) 1,283 29% 1,174 29% 1,182 29%
Total sales $4,443 100% $3,991 100% $4,116 100%
Years ended December 31,(Dollars in millions) 2002 2001 20011) 2000 20001)
Gross profit $811 $655 $701 $786 $786Gross margin 18.2% 16.4% 17.6% 19.1% 19.1%Operating income $331 $174 $291 $340 $389Operating margin 7.4% 4.4% 7.3% 8.2% 9.5% Net income $181 $48 $146 $169 $218Net Margin 4.1% 1.2% 3.7% 4.1% 5.3%Earnings per share $1.84 $.49 $1.49 $1.67 $2.16Return on equity 9.2% 2.5% 7.7% 8.7% 11.3%
1)Pro-forma. Adjusted to remove the income statement effects of the “Unusual Items” in 2001 and to show theeffects of FAS-142 “Goodwill and Other Intangible Assets”, as if the non-amortization of goodwill provisions hadbeen applied in all periods presented.
-4
-2
0
2
4
6
8
10
12 %
1998 1999 2000 2001 2002
CHANGES IN ORGANIC SALESand
LIGHT VEHICLE PRODUCTION
Organic sales
Global light vehicle production
light vehicle production in the fourthquarter of 2000 which lead to adecrease in organic sales (i.e. sales inlocal currencies excluding acquisi-tions/divestitures) and a significantdecrease in year-over-year earnings.
The Company had experienced sus-tained growth, both organic and acqui-sition driven, for several years, but fol-lowing the drop in vehicle production inlate 2000, the Company entered a con-solidation phase. Since late 2000, theCompany has been more active inrestructuring to reduce costs, hasincreased focus on control of workingcapital and has reduced levels of capi-tal expenditure. At the same time, theCompany has continued to makestrategic acquisitions and has disposedof certain small, non-core componentmanufacturing operations. Further-more, the Company has continued toinvest in the development of new prod-ucts and in capacity to support growth.
In the second half of 2000, increases inthe price of steel, petroleum-basedmaterials and electronics fed through tocost of sales. In 2001 the prices of thesematerials and components then stabi-lized at these higher levels.
Pricing pressure from customers is aninherent part of the automotive compo-nents business. The extent of reduc-tions varies from year-to-year. Inresponse, the Company is continuous-ly engaged in efforts to reduce costs,including shifting of production to low-labor-cost countries, product re-
designs, product standardization, effi-ciencies from global purchasing activi-ties and improvements in manufactur-ing productivity. The Company alsoworks to give customers added valueby developing new products andthrough its world-class engineeringorganization and test facilities. TheCompany’s various cost-reductionprograms are, to a considerable extent,interrelated. This interrelationshipmakes it extremely difficult to isolatethe impact of any single program oncosts and Management does not gen-erally attempt to do so. Rather, mana-gement monitors key measures suchas costs as a percentage of sales, mar-gins and geographical employee mix.
The second quarter of 2002 reflecteda reversal in the U.S. dollar/Euroexchange rate trend. For the first timein many years, reported sales wereincreased by currency effects. This alsoaffected equity as the stronger Eurobegan to generate positive CumulativeTranslation Adjustments (“CTA”). Thistrend continued throughout the remain-der of 2002 and into early 2003.
Interest rates peaked in late 2000 and,in the past two years, have more or lesscontinuously trended downwards.Autoliv benefited, but only partially, fromthis trend, having locked in fixed rates ona portion of its borrowings in accordancewith Corporate policy. Autoliv’s weightedaverage funding cost peaked at 6.2% inDecember 2000, dropped to 4.7% inearly 2002 and finished 2002 at 4.9%.

ADJUSTMENTS FOR COMPARABILITY
The table below adjusts reported 2001 results for the effects of the Unusual Itemsand the pro-forma application of FAS-142.
Unusual Goodwill AsPro-Forma* Items amortization reported
Total net sales $3,991.0 $3,991.0Cost of sales (3,290.1) $(46.1) (3,336.2)Gross profit 700.9 (46.1) 654.8
Selling, general & adm. expenses (196.7) (196.7)Research, development engineering expenses (200.8) (200.8)
Amortization of intangibles (16.0) (5.7) $(51.6) (73.3)Other income (expense), net 3.2 (13.5) (10.3)Operating income 290.6 (65.3) (51.6) 173.7
Equity in earnings of affiliates 5.7 5.7Financial items, net (62.6) (62.6)Income (loss) before taxes 233.7 (65.3) (51.6) 116.8
Income taxes (78.3) 18.5 (59.8)Minority interests in subsidiaries (9.1) (9.1)Net income (loss) $146.3 $(46.8) $(51.6) $47.9
Earnings per share $1.49 $(.48) $(.52) $.49
*Excluding Goodwill amortization and Unusual Items
The $46 million charged to Cost of sales consisted of approximately $18 million of fixed asset impairment andapproximately $28 million of provisions for contractual, warranty and liability issues. Goodwill impairment ofapproximately $6 million was charged to Amortization of intangibles. Approximately $13 million, principallyemployee-related restructuring, was charged to Other income (expense), net.
ITEMS AFFECTING COMPARABILITYTwo major items make comparisons ofreported costs and margins between2002, 2001 and 2000 difficult.
Effective January 1, 2002, theCompany adopted Financial Ac-counting Standards Board (“FASB”)Statement on Financial AccountingStandards (“FAS”)-142 “Goodwill andOther Intangible Assets”.
The application of FAS-142 resultedin a reduction of approximately $50million of annual amortization of good-will. The provisions of FAS-142 do notpermit restatement in the primary finan-cial statements of periods prior toJanuary 2002. Had FAS-142 beenapplied in prior periods, goodwill amor-tization would have been lower by $52million in 2001 and $49 million in 2000.
During October 2001, a restructuringpackage was introduced to improveprofitability and offset the effects of anexpected downturn in light vehicle pro-duction. The costs and provisions forthis package, totaling $65 million, werecharged to the third quarter 2001
20 2002 Autoliv — Driven for Life
Management’s Discussion and Analysis
YEAR ENDED DECEMBER 31, 2002VERSUS YEAR ENDED DECEMBER31, 2001
Net salesNet sales for 2002 increased by 11%. Inreported dollars, the increase was $452million. The weakening of the U.S. dol-lar, particularly against the Euro, increa-sed reported sales by approximately2%. Acquisitions made during 2002added incremental sales of $122 millionor 3%. Virtually all of the impact fromacquisitions was generated by theacquisition of Visteon RestraintElectronics (“VRE”) on April 1, 2002. Theeffect of the acquisitions was entirely inthe airbag products group. The disposi-tion of non-core operations resulted in areduction in sales of only $3 million.Consequently, Autoliv’s organic salesincreased by approximately 6%, whileproduction of light vehicles in the Triad isestimated to have increased by just over2%. After an organic sales decrease inthe first quarter of 1%, organic salesgrew by 7% in the second and thirdquarters and then accelerated to 12% inthe fourth quarter. During 2002, lightvehicle production is estimated to haveincreased by 6% in North America and4% in Japan. Europe is estimated tohave decreased light vehicle productionby 2%. In North America, Autoliv has aslightly higher percent of its sales in thepassenger car segment, in which pro-duction increased by less than 1%. Inthe other segment, light trucks (inclu-ding SUV’s), production increased by10%. Due in large part to the acquisitionof VRE, Autoliv is improving its positionin the light truck segment.
The 6% organic increase in sales ofairbag products was principally due tothe continuing rollout of new products,such as side-impact airbags (includingAutoliv’s Inflatable Curtain), as well asgains in market share in steeringwheels in Europe and North America.
The 7% organic growth in sales ofseat belt products was primarily due tocontinued gains in market share, espe-cially in Europe and Korea. The marketshare gains in Europe were mainly dueto a favorable sales mix.
Sales in North America grew by 8%.The acquisition of VRE added 6% torevenues. Organic sales increased by2%. Organic sales of airbag productsincreased by 4% while seat belt salesdropped by 5% as a result of contractshaving expired during the autumn of2002. However, these contracts willstart to be replaced during the spring of
results and are referred to in this reportas “Unusual Items”. The Unusual Itemsalso included provisions for contractu-al, warranty and liability issues totalingapproximately $29 million. Of the total,approximately $7 million related tocontractual, $10 million to warranty and$12 million to liability issues. Therestructuring package mainly includedrestructuring costs and asset write-offsof the Seat Sub-System division, sev-erance costs related to the U.S. andthe Swedish textile operations andadditional costs incurred for the partialintegration of a former OEA plant intothe main U.S. inflator operations. Theserestructuring activities accelerated theCompany’s efforts to reduce costs byshifting production to low-labor-costcountries and improve manufacturingproductivity by consolidating manufac-turing activities.
See Note 10 to the ConsolidatedFinancial Statements included hereinfor information related to the UnusualItems, including a roll-forward of bal-ance sheet reserves.

212002 Autoliv — Driven for Life
Management’s Discussion and Analysis
items affecting comparability discussedabove, the operating income in 2001would have been $291 million or 7.3%of sales. SG&A was 4.9% of sales inboth years. On a comparable basis,Amortization of intangibles, at 0.4% ofsales, was also unchanged. RD&Eincreased to 5.2% of sales from 5.0% in2001. RD&E is expected to continue toincrease, as it is necessary to incurengineering expense to support thegrowth of order intake. Orders, on aver-age, go into production approximatelythree years after they are received.
Other income (expense), net wasapproximately $12 million of expense,or 0.3% of sales, in 2002 compared toapproximately $3 million of income, or0.1% of sales, in 2001 excluding theUnusual Items. The expense in 2002 isprincipally related to severance costsassociated with plant consolidationsunderway in the U.S. The income in2001 was generated by a gain from thesale of a building, net of several smallexpense items.
Interest expense, netInterest expense, net was $49 million in2002 compared to $60 million in 2001.Net debt at December 31, 2002, de-creased by $159 million to $864 millionfrom $1,023 million at December 31,2001. Average net debt decreased by$92 million during 2002. A lower require-ment for working capital contributed toa $243 million increase in cash providedby operations. Lower capital expendi-ture was more than offset by higherspending on acquisitions and the cost ofthe Company’s share repurchase pro-gram. The weighted average interestrate, net was 5.2% in 2002 compared to5.8% in 2001. Lower interest rates,therefore, along with the lower borrow-ing requirement contributed to thereduction in interest expense, net.
Income taxesThe effective tax rate in 2002 was 33%versus 51.2% in 2001. Excluding theeffect of non-deductible goodwillamortization and Unusual Items in2001, the effective rate was 33.5%.
2003 by new seat belt orders. The de-cline in seat belt sales will therefore betemporary.
Sales in Europe rose by 11%. Organicgrowth added 4% to revenues, curren-cy effects 5% and the VRE acquisition2%. Autoliv’s market share gains weremainly driven by program launches anda favorable vehicle mix.
Sales growth in the rest of the world,led by Japan and Korea, acceleratedthroughout the year. Organic sales fromcompanies in these countries rose by38%. Currency effects reduced report-ed sales by 3%. Strong demand for theInflatable Curtain was the biggestgrowth driver, but the other productareas also outperformed the increase invehicle production.
Gross marginThe pressure on unit sales prices in theautomotive components industry con-tinued, but was more than offset byhigher volumes and the beneficialeffect of ongoing cost reduction pro-grams which reduced per unit productcosts. The gross margin improved in2002 to 18.2% from 17.6%, excludingthe Unusual Items in 2001. Includingthe Unusual Items, the gross marginwas 16.4% in 2001. Of the improve-ment, 0.3 percentage points were dueto costs that this year are reported asResearch, Development & Engineering(“RD&E”) expenses or Selling, General& Administrative (“SG&A”) Expensesand not as Cost of sales as in 2001.
The cost reduction programs includethe shifting of production to low-labor-cost countries, product redesigns, prod-uct standardization, efficiencies fromglobal purchasing activities andimprovements in manufacturing produc-tivity. Some of the productivity improve-ments are the result of the consolidationof production into fewer facilities as partof the Company’s restructuring program.
Operating incomeOperating income in 2002 was $331million or 7.4% of sales. This compareswith reported operating income of $174million in 2001, which was 4.4% ofsales. However, after adjusting for the
Components of sales Airbag Seat beltincrease in 2002 products products Total
Organic sales growth 6% 7% 6%Impact of acquisitions, net of divestitures 4% 0% 3%
Effect of exchange rates 2% 2% 2%Reported sales increase 12% 9% 11%
Net income and Earnings per shareAs a result of the higher operating profitand the lower interest cost, net incomewas $181 million in 2002 compared to$48 million in 2001. Net income as apercentage of sales increased to 4.1%in 2002 from 1.2% in 2001. Earnings pershare was $1.84 during 2002 comparedto $.49 during 2001. On a comparablebasis, earnings per share was $1.49 in2001. Currency effects (including bothtranslation and transaction effects)added two cents to per share earnings.The Company’s share repurchase pro-gram improved earnings per share byless than one cent.
YEAR ENDED DECEMBER 31, 2001VERSUS YEAR ENDED DECEMBER31, 2000
Net salesAfter several consecutive years of salesincreases, net sales for 2001 de-creased by 3%. This compares with anestimated average decrease in produc-tion of light vehicles of 5% in the Triad(i.e. Europe, North America and Japan).In reported dollars, the decrease was$125 million. The strengthening of theU.S. dollar, particularly against theEuro, reduced reported sales by 3%.Acquisitions made during 2000 addedincremental sales in 2001 of $130 mil-lion or 3%. The effect from acquisitionswas principally in the first quarter andreflected the acquisitions, early in thesecond quarter of 2000, of OEA, Inc.and the North American seat belt oper-ations of NSK. The disposition of non-core operations resulted in a reductionin sales of $13 million. Consequently,Autoliv’s organic sales (i.e. sales inlocal currencies excluding acquisi-tions/divestitures) decreased by 3%.
During 2001, light vehicle production isestimated to have declined by 10% inNorth America and 4% in Japan. Europeis estimated to have increased lightvehicle production by 1%. The decreasein production in North America con-trasts with the relatively strong sales ofvehicles. A significant portion of thosesales was out of inventories that hadaccumulated during 2000.
The 5% organic decrease in sales ofairbag products, from year 2000 levels,was consistent throughout the year.The decrease reflected the particularweakness in the North American mar-ket, as well as an unfavorable customerand vehicle type mix in that market.

decline in gross margin and a higherlevel of operating expenses. TheUnusual Items increased operatingexpenses by $19 million and reducedoperating income by $65 million or1.6% of sales. Excluding the UnusualItems, cost increases were held toabout 3%, corresponding to 0.6% ofsales. An increase in SG&A expenseswas due, in part, to expansions inKorea and Japan. RD&E spending alsoincreased, and is expected to continueto increase, as it is necessary to incurengineering expense to support thegrowth of order intake.
Interest expense, netInterest expense, net was $60 million in2001 compared to $54 million in 2000.Net debt on December 31, 2001,increased to $1,023 million from $1,009million at December 31, 2000. Averagenet debt, therefore, increased only mar-ginally in 2001. However, the averageoutstanding during 2001 was approxi-mately $200 million higher than during2000. A higher requirement for workingcapital and the cost of acquisitionscontributed to the higher borrowingrequirement. The weighted averageinterest rate, net was 5.8% in 2001compared to 6.5% in 2000. Lowerinterest rates, therefore, only partiallyoffset the higher borrowing require-ment.
Income taxesThe effective tax rate in 2001 was51.2% versus 40.3% in 2000. Theincrease was due primarily to the effectof a largely fixed amount of non-deductible goodwill amortization rela-tive to lower earnings.
Net income and Earnings per shareAs a result of the lower operating mar-gin and the higher interest cost, netincome was $48 million in 2001 com-pared to $169 million in 2000. Netincome as a percentage of salesdecreased to 1.2% in 2001 from 4.1%in 2000. Earnings per share was $.49during 2001 compared to $1.67 during2000. Currency effects are estimated tohave had a negligible effect on earn-
Autoliv has its highest market share inthe passenger car segment, in whichproduction declined by 14%. In theother segment, light trucks (includingSUV’s), production increased by 2%.The continuing rollout of new products,such as side-impact airbags (includingAutoliv’s Inflatable Curtain) mitigatedthe unfavorable sales mix impact.
The 3% organic growth in sales ofseat belt products was primarily due tocontinued gains in market share, drivenby new business in Korea and continu-ing market share gains in NorthAmerica. However, after growing 7% inthe first half of the year, compared tothe equivalent quarters in 2000, salesof seat belt products leveled off in thesecond half of the year. The increase insales of seat belt products early in theyear was primarily due to gains in mar-ket share in North America that werefirst reflected in the second half of2000.
Gross margin
The pressure on unit sales prices in theautomotive components industry con-tinued in 2001. Despite the beneficialeffect of ongoing cost reduction pro-grams, the gross margin fell in 2001 to16.4% from 19.1% in 2000. The bene-fit of the cost reductions was not suffi-cient to offset the effects of pricing andunfavorable mix. In the second half of2000, margins were hurt by supplychain issues associated with fast vol-ume ramp-ups of new program launch-es and with production shifts to low-labor cost countries. The surge indemand for materials and components,along with quality issues, resulted inhigher than normal costs of freight,scrap and rework. These issues werecorrected by early 2001. Excluding theeffect of the Unusual Items, gross mar-gin would have been 17.6% for 2001.
Operating income
Operating income in 2001 was $174million or 4.4% of sales. This compareswith operating income of $340 millionin 2000, which was 8.2% of sales. Themargin decrease was due to both the
22 2002 Autoliv — Driven for Life
Management’s Discussion and Analysis
ings per share. The Unusual Itemsreduced net income by $47 million andearnings per share by $.48.
OUTLOOK FOR 2003
For the full year 2003, light vehicle pro-duction in the Triad is expected toshow a modest decrease of 2-4%.Strong vehicle registration in the fourthquarter of 2002, due to various incen-tives, may indicate that some 2003sales were pulled into 2002. This couldlead to a somewhat slow start in 2003.However, full-year production volumecould still come in as expected.Autoliv’s sales in 2003 will increase byjust over $100 million from April 1 whenNSK’s Asian seat belt operations willbe consolidated. This consolidation willhave a negligible effect on Autoliv’sresult.
Assuming that the mid-February ex-change rates prevail, currency effectscould add approximately 5% toAutoliv’s 2003 sales. Consolidatedsales should also be favorably impact-ed by additional market share gains,although the gains are not expected tobe as significant as in the fourth quar-ter 2002.
LIQUIDITY, CAPITAL RESOURCESAND FINANCIAL POSITION
Cash generation
Cash provided by operating activitieswas $509 million in 2002 and $266 mil-lion in both 2001 and 2000. Workingcapital requirements decreased duringthe year, mainly reflecting mana-gement’s increased efforts to controlworking capital levels. The reportedamounts of most of the components ofworking capital increased during 2002,primarily due to acquistions and foreignexchange rate effects. However, cur-rent operating liabilites increased bymore than current operating assets. Asa result, working capital was $385 mil-lion (8.7% of sales) at December 31,2002 compared to $437 million (11% ofsales) at December 31, 2001. TheCompany has set a target that workingcapital should not exceed 10% ofsales. Days receivables outstandingwere 78 at December 31, 2002 com-pared to 79 at December 31, 2001.Days inventory outstanding were 31 atDecember 31, 2002 compared to 32 atDecember 31, 2001.
Components of sales Airbags Seat beltdecrease in 2001 products products Total
Organic sales growth (5%) 3% (3%)Impact of acquisitions, net of divestitures 4% 1% 3%
Effect of exchange rates (3%) (5%) (3%)Reported sales decrease (4%) (1%) (3%)

232002 Autoliv — Driven for Life
Management’s Discussion and Analysis
Of the $65 million total of UnusualItems recorded in the third quarter of2001, approximately $24 million relatedto non-cash write-offs of assets(including goodwill) and approximately$39 million to provisions that did nothave any immediate effect on cash-flow. Through December 31, 2002,approximately $17 million in cash pay-ments have been paid against variousaccruals, leaving approximately $22million to be incurred. See Note 10 tothe Consolidated Financial Statementsincluded herein.
Capital expendituresCash generated by operating activitiescontinues to be more than adequate tocover capital expenditures. Theseexpenditures, gross, for property, plantand equipment were $228 million in2002, $248 million in 2001, and $235million in 2000. Capital expenditures asa percentage of sales were 5.1% in2002, 6.2% in 2001, and 5.7% in 2000.Capital expenditures for 2003 areexpected to range from $230 million to$260 million.
Major capital expenditures in 2002were for additional manufacturingcapacity, especially for inflators andairbags assembly in the U.S. andEurope, and for electronics and steer-ing wheels in the U.S. Major capitalexpenditures in 2001 were for capacityexpansions for inflators in Europe andthe U.S., as well as capacity expan-sions in Europe for airbags and steer-ing wheels. During 2001, the Companyalso completed a major expansion,begun in 2000, of its technical centersin the U.S. and France and the con-struction of a new seat belt facility inthe U.S. State of Kentucky. During
As of May 1, 2000, the Companyacquired OEA, Inc., the Company’smain external supplier of initiators forairbag inflators. Excluding OEA’sAerospace Division, OEA had sales ofapproximately $205 million in its lastfiscal year, which ended July 31, 1999.OEA’s Aerospace Division was not con-solidated by Autoliv and substantiallyall of the Aerospace assets were sub-sequently sold. As of January 1, 2000,the Company acquired Japan’s secondlargest steering wheel business, whichhad annual sales of approximately $99million. As of April 1, 2000, the NorthAmerican seat belt operations of NSK,with annual sales of approximately $70million, were acquired together with a40% interest in NSK’s Asian seat beltoperations. The Company originallyhad an option to acquire the remaining60% in two steps on April 1, 2002 and2003. However, the Company agreed,during 2002, that it would exerciseboth options on April 1, 2003. Thecompany currently accounts for itsinvestment in the 40% interest ofNSK’s Asian seat belt operations underthe equity method. These operationswill be consolidated when theCompany exercises its options onApril 1, 2003.
In February 2000, Autoliv exercisedits option to increase, from 49.5% to51%, its interest in the Estonian com-pany Norma AS, the dominant seat beltsupplier to the Russian vehicle indus-try. The Company also sold three smallnon-core operations during 2000.
EquityDuring the year, equity increased by$171 million, partly due to an $80 mil-lion positive effect from translatinglocal currencies into U.S. dollars. Theeffect of the change in the market valueof cash flow hedges had a negativeeffect of $17 million. Equity was alsoreduced by repurchases of shares for$30 million and by the payment of divi-dends of $43 million.
0
50
100
150
200
250
300
1998 1999 2000 2001 2002
Depreciation
CAPITAL EXPENDITURESversus
DEPRECIATION
Capex
US$ (million)
2000, the Company substantiallyincreased manufacturing capacity forinflators and steering wheels. Therewere also significant new investmentsin weaving capacity in the U.K. andCanada.
Acquisitions
The Company has continued its expan-sion through acquisitions. Cash (net ofcash acquired) paid for acquisitionswas $22 million in 2002, $13 million in2001, and $211 million in 2000.Goodwill of $7 million, $9 million and$206 million, respectively, was associ-ated with these acquisitions. Prior to2002, such goodwill was being amor-tized over 5 to 40 years.
In April 2002, the Company acquiredthe Restraint Electronics Business ofVisteon Corporation. The operationsthat Autoliv acquired had $150 millionin annual sales. During 2002, Autolivalso increased its interest in Autoliv QB,Inc., a Philippine company, to 91%.The Company also sold its French steelcomponent company, Autoliv Com-posants S.A.S, in the beginning of2002. The sale of Autoliv Composantsdid not have a material impact onAutoliv’s consolidated sales or earn-ings.
An agreement was signed in Nov-ember 2000 to establish a new venturewith Mando Corporation, a leadingKorean auto parts supplier. This newventure, Autoliv Mando Corporation, inwhich Autoliv holds 65% of the shares,was consolidated starting in January2001. Autoliv Mando’s annual sales in2001 were approximately $35 million.Effective January 1, 2001, theCompany exercised its option to purchase, for 84 million French Francs (approximately $12 million), anadditional 17% of the Livbag inflatoroperations in France. This purchaseincreased the Company’s owner-ship interest to 83%. The Company hasan option to purchase the remaining17% of the Livbag operations in March, 2003 for 12.8 million Euros(approximately $14 million). TheCompany intends to exercise thisoption. In June, 2001 the Companymade Autoliv Romania S.A. a whollyowned subsidiary by acquiring theremaining 10% of the shares. In Augustof 2001, the Company acquired theremaining 10% minority interest inAutoliv Thailand.

24 2002 Autoliv — Driven for Life
Financing ActivitiesCash generated after operating andinvesting activities was $269 million in2002. Cash and cash equivalentsincreased by $17 million. Cash used infinancing activities was $257 million.The Company’s net debt (i.e. debt, netof cash) decreased by $159 million dur-ing 2002 to $864 million. The net debtto capitalization ratio was 29% atDecember 31, 2002, compared to 35%at December 31, 2001. The weightedaverage interest rate on the $966 mil-lion of debt outstanding at December31, 2002, was approximately 5%.
The Company has an $804 millionrevolving credit facility (“RCF”) syndicat-ed among 16 banks. The agreement isdivided into one facility of $530 million,maturing in November 2005, and onerenewable 364-day facility of $274 mil-lion. The overall commitment of $804million supports the Company’s com-mercial paper borrowings as well asbeing available for other corporate pur-poses. Borrowings are unsecured andbear interest based on the relevantLIBOR rate. The Company pays a facil-ity fee based on the unused amount ofthe RCF. Borrowings are prepayable atany time and are due at expiration. Thefacility is subject to financial covenantsrequiring the Company to maintain acertain level of debt to earnings and acertain interest coverage ratio. TheCompany was in compliance with these
covenants at December 31, 2002.These covenants do not impair the abil-ity of Autoliv Inc. to make regular quar-terly dividend payments or to meetother expected cash commitments.
The Company has two commercialpaper programs. One is a $1 billion U.S.program (rated A2-P2 by Standard &Poors and Moody’s, respectively). Theother is a Euro 485 million Swedishcommercial paper program rated K1 byStandard & Poors. The Company alsohas credit facilities with a number ofbanks that manage the cash pools ofthe Company’s subsidiaries. In addi-tion, the Company’s subsidiaries havecredit agreements, principally in theform of overdraft facilities, with a num-ber of local banks. The total commercialpaper borrowings outstanding at De-cember 31, 2002, in the amount of $369million are classified as long-term.Thisis because the Company intends to refi-nance these borrowings on a long-termbasis either through continued com-mercial paper borrowings or utilizationof the available credit facilities.
At December 31, 2002, the maturitiesof long-term debt were as follows (inmillions): 2003: $76.1; 2004: $34.4;2005: $484.1; 2006: $289.3; 2007:$1.0; 2008 and thereafter: $33.9.
At December 31, 2002, future mini-mum lease payments for non-cancel-able operating leases total $66.1 mil-lion and are payable as follows (in mil-
Management’s Discussion and Analysis
lions): 2003: $15.7; 2004: $12.0; 2005:$9.1; 2006: $4.1; 2007: $2.9; 2008 andthereafter: $22.3.
Most of the Company’s non-U.S.employees are covered by governmentsponsored pension and welfare pro-grams. Under the terms of the pro-grams, the Company makes periodicpayments to various government agen-cies. However, the Company has non-contributory defined benefit pensionplans covering most U.S. employees.The funding policy for U.S. plans is tocontribute amounts sufficient to meetthe minimum funding requirements ofthe Employee Retirement IncomeSecurity Act of 1974, as amended, plusany additional amounts which may bedetermined to be appropriate. TheCompany’s balance sheet liability forits U.S. plans was $34 million atDecember 31, 2002. At December 31,2002, the U.S. plans had an unrecog-nized net actuarial loss of approximate-ly $23 million. The amortization of thisloss is expected to increase pensionexpense by approximately $1.1 millionper year over the twelve year estimatedremaining service lives of the plan par-ticipants. Pension expense associatedwith these plans was approximately$12 million in 2002 and is expected tobe approximately $14 million in 2003.The Company will contribute approxi-mately $18 million to the plans in 2003and is currently projecting a fundinglevel of around $15 million in the yearsthereafter.
In May 2000, the Board of Directorsauthorized a Share Repurchase Pro-gram for up to ten million of the Com-pany’s shares. During the year 2002,the Company repurchased 1,554,600shares at a cost of $30 million. Duringthe year 2000, the Company repur-chased 4,542,438 shares at a cost of$103 million. There were no repurchas-es during 2001. At December 31, 2002,there were 96.3 million shares out-standing, net of shares repurchased. AtDecember 31, 2001, there were 98.0million shares outstanding, net ofshares repurchased.
Autoliv pays regular quarterly divi-dends. The current dividend is 13 centsper share each quarter. The quarterlydividend was raised from 11 cents bythe Board of Directors in December,2002. The dividend at the new rate willbe paid for the first time in March 2003.Total cash dividends of $43.0 million
FINANCING ACTIVITIES
Borrowings outstanding and available to the Company at December 31, 2002, aresummarized below:
Weighted AdditionalType of Facility Amount of Amount average amount(Dollars in millions) facility outstanding interest rate availableRevolving credit facility(matures 2005) $530 - n/a $530
Revolving credit facility (364 days-November 2003) 274 - n/a 274
U.S. commercial paperprogram 1,000 $290 1.8% 7101)
Swedish commercial paper program 505 79 4.3% 4261)
Other short-term debt 322 47 3.5% 275Eurobond (due 2006) 265 265 6.5% -Swedish medium-term-note program (due 2003-2008) 453 236 6.0% 217
Other long-term debt, includingcurrent portion (various maturities through 2015) 48 48 2.8% -
Total $3,397 $966 $2,4321) Total outstanding commercial paper programs (“CP”) should not exceed total undrawn revolving credit facilities(“RCF”) according to the Company's financial policy, see page 27.

252002 Autoliv — Driven for Life
Management’s Discussion and Analysis
were paid in both 2002 and 2001. Forthe foreseeable future, cash flow fromoperations, together with availablefinancial resources, are expected to beadequate to fund Autoliv’s anticipatedworking capital requirements, capitalexpenditures, acquisition program,share repurchase program and divi-dend payments.
New Accounting Pronouncements
New accounting policies issued by theFASB have been implemented during2002. See Note 1 to the ConsolidatedFinancial Statements included herein.FAS-144 “Accounting for the Impair-ment or Disposal of Long-lived Assets”and FAS-142 “Goodwill and OtherIntangible Assets” were implementedeffective January 1, 2002. FAS-144 didnot have any material impact on theCompany’s results of operations orfinancial position. However, the appli-cation of FAS-142 resulted in a reduc-tion of approximately $50 million ofannual amortization of goodwill. FAS-142 abolished the amortization ofintangible assets for which the expect-ed period of benefit may be indetermi-nate at the time of acquisition andintroduced a process for evaluatingwhether goodwill has been impaired.Management has performed theimpairment reviews required by FAS-142 and has concluded that theCompany’s goodwill is not impaired.FAS-142 has not been applied to anyreported periods prior to 2002. ThePro-Forma effects of FAS-142 on priorperiods are presented on the face ofthe income statement.
In August 2001 the FASB issued FAS-143 “Asset Retirement Obligations”,regarding non-temporary removal oflong-lived assets from service. FAS-143will become effective for fiscal yearsbeginning after June 15, 2002, which forthe Company will be January 1, 2003.Management does not expect that theadoption of FAS-143 will have a materi-al impact on the Company’s results ofoperations or financial position.
In July 2002, the FASB issued FAS-146 “Accounting for Costs Associatedwith Exit or Disposal Activities” whichnullifies EITF 94-3, “Liability Recog-nition for Certain Employee TerminationBenefits and other Costs to Exit anActivity” (including Certain CostsIncurred in a restructuring). FAS-146 isto be applied prospectively to exit or
disposal activities initiated afterDecember 31, 2002. Autoliv does notexpect the application of FAS-146 tohave a material effect on earnings orfinancial position.
Impact of InflationInflation generally has not had a signif-icant impact upon the Company’sfinancial position or results of opera-tions. Inflation is currently expected toremain low in all of the major countriesin which the Company operates.
PersonnelTotal headcount (employees plus tem-porary hourly workers) increased byapproximately 2,400 during the year to34,200. This 7.5% increase in head-count during the year could be com-pared with the production volume out-put for the major products that rose by17% for airbags and 6% for seat belts.
Of the headcount increase during theyear, 1,900 was concentrated in low-labor-cost countries, 400 was a result ofthe VRE-acquisition and 100 to organicgrowth in high-labor-cost countries.Compensation paid to Directors andSenior Management is reported, as for allpublic U.S. companies, in the Company’sproxy statement which is distributed tothe Company’s shareholders.
APPLICATION OF CRITICALACCOUNTING POLICIES
The Company’s significant accountingpolicies are disclosed in Note 1 to theConsolidated Financial Statementsincluded herein. The application ofaccounting policies necessarily re-quires judgements and the use of esti-mates by a company’s management.Actual results could differ from theseestimates. Management considers itimportant to assure that all appropriatecosts are recognized on a timely basis.In cases where capitalization of costs isrequired (e.g. certain pre-productioncosts), stringent realization criteria areapplied before capitalization is permit-ted. The depreciable lives of fixedassets are intended to reflect their trueeconomic life, taking into account suchfactors as product life cycles andexpected changes in technology.Assets are periodically reviewed forrealizability and appropriate valuationallowances are established when evi-dence of impairment exists. Im-pairment of long-lived assets has gen-erally not been significant. Start-up
operations are given a reasonable timeto develop before impairment provi-sions would be considered.
Following the adoption of FAS-142 onJanuary 1, 2002, the Company is nowrequired to perform an annual impair-ment review of goodwill. This analysisis performed in December of each yearfollowing the Company’s annual bud-geting process. The estimated fair mar-ket value of goodwill is determined bythe discounted cash flow method. TheCompany discounts projected operat-ing cash flows using its weighted aver-age cost of capital. To supplement thisanalysis, the Company compares themarket value of its equity, by referenceto the quoted market prices of itsshares, with the book value of its equity.
The Company has non-contributorydefined benefit pension plans coveringmost U.S. employees. See Note 17 tothe Consolidated Financial Statementsincluded herein. The Company, in con-sultation with its actuarial advisors,determines certain key assumptions tobe used in calculating the ProjectedBenefit Obligation and annual pensionexpense. The assumptions used as ofJanuary 1, 2002 for calculating 2002pension expense were a discount rateof 7.25%, expected rate of increase incompensations levels of 5.0%, and anexpected long-term rate of return onplan assets of 9.5%. The assumptionsused in calculating the benefit obliga-tions disclosed as of December 31,2002 were a discount rate of 6.75%,and an expected rate of increase incompensation levels of 5%. The dis-count rate is set based on the yields onlong-term high-grade corporate bondsand is determined by reference tofinancial markets on the measurementdate. The expected rate of increase incompensation levels and long-termreturn on plan assets are determinedbased on a number of factors and musttake into account long-term expecta-tions. The U.S. Plans have, for a num-ber of years, invested approximately85% of Plan assets in equities and theCompany has, accordingly, assumed along-term return on plan assets of9.5%. A one percent change in thelong-term rate return on plan assetswould result in a change in annual pen-sion expense of approximately $0.5million.
A one percent decrease in the dis-count rate would have increased 2002

The Company, at each stage of pro-duction, relies on internal or externalsuppliers in order to meet its deliverycommitments. The Company may bedependent, in certain instances, on asingle supplier for certain components.In addition, the Company’s customers,in many cases, require that theCompany’s suppliers are qualified andapproved by them. Disruptions in thesupply chain could lead to extra costsin order to meet delivery commitments.
The Company carries product liabilityand product recall insurance with limitsthat management believes are suffi-cient to cover the risks. Such insurancemay not always be available in suchamounts and a substantial recall, or lia-bility in excess of coverage levels,could have a material adverse effect onthe Company.
The Company manufactures its prod-ucts in several countries and sells theproducts mostly in those countries, butalso in other markets. As a result, theCompany’s financial results are affect-ed by economic conditions in the mar-kets in which the Company distributesits products.
The Company is also exposed tofinancial risk through its internationaloperations and debt-financed activi-ties. This financial risk is caused byvariations in the Company’s cash flowsresulting from changes in foreignexchange rates and interest rate levels,as well as from refinancing and coun-terparty risks. Below follows a descrip-tion of the Company’s financial risksand its overall policy to manage them.The Company defines the financialrisks as currency risk, interest rate risk,refinancing risk and credit risk. In orderto reduce these risks, and to takeadvantage of economies of scale, theCompany has a central treasury func-
tion supporting operations and man-agement. The Treasury Departmenthandles external financial transactionsand functions as the Company’s in-house bank for its subsidiaries. Autolivis compliant with its financial policywith one exception and that is theremaining maturity of the fixed ratedebt under the interest rate risk policy.This will be addressed in 2003.
Currency Risk - Transaction Exposure
Transaction exposure arises becausethe cost of a product originates in onecurrency and the product is sold inanother currency. The Company’sgross transaction exposure is about$520 million annually. Part of the flowhas counter-flows in the same currencypair, which reduces the net exposure toabout $513 million per annum. In thethree largest net exposures Autolivsells EUR against SEK, USD againstMXN and EUR against GBP. Togetherthese account for more than half of theCompany’s net exposure. The total netexposure is, however, spread over 20currency pairs. In order to mitigate theshort-term impact of currency move-ments, the Company hedges 75-100%of forecasted exposure in the comingsix months and 50-75% of forecastedexposure in the period seven to twelvemonths out. The resulting transactioneffect was not significant in either 2002or 2001.
Currency Risk - Translation Exposurein the Income StatementAnother effect of exchange rate fluctu-ations arises when the income state-ments of the non-U.S. subsidiaries aretranslated into U.S. dollars. The Com-pany’s policy is not to hedge this typeof translation exposure.
Outside the U.S., the Company’s mostsignificant currency is the Euro. The
26 2002 Autoliv — Driven for Life
Management’s Discussion and Analysis
pension expense by approximately$1.8 million and would have increasedthe December 31, 2002 benefit obli-gation by approximately $13 million.A one percent increase in the expectedrate of increase in compensation levelswould have increased 2002 pensionexpense by approximately $2.4 millionand would have increased theDecember 31, 2002 benefit obligationby approximately $11 million.
The Company uses the intrinsic valuemethod in accounting for stock optionsgranted to employees. Accordingly, theexercise of stock options is recorded inShareholders’ equity and no cost is rec-ognized in the income statement. Hadthe fair market value method been used,earnings per share would have beenreduced by four cents. See Note 14 tothe Consolidated Financial Statementsincluded herein for pro-forma informa-tion related to stock options.
The Company is subject to claimsand legal proceedings that arise in theordinary course of business, principallyrelated to alleged defects in productsmanufactured by the Company. TheCompany diligently defends itself insuch actions and, in addition, carriesinsurance coverage, to the extent rea-sonably available, against insurablerisks. The Company believes, based oncurrently available information, that theresolution of outstanding claims, aftertaking into account available insurancecoverage and provision for productrecalls, should not have a materialeffect on the Company’s financial posi-tion or results of operations.
Senior management has discussedthe development and selection of criti-cal accounting estmates and disclo-sures with the Audit Committee of theBoard of Directors.
MARKET AND FINANCIAL RISKSThe Company’s operations consistprincipally of manufacturing and salesin several countries. Although theCompany has no customer groupaccounting for more than 23% of salesand no single contract accounting formore than 4% of sales, the Company isdependent on a relatively small numberof customer groups with strong pur-chasing power. The loss of all of thebusiness of a single customer groupcould have a material adverse effect onthe Company.
Net borrowings at December 31, 2002
% of % of fixed % of floating Maturity oftotal interest interest fixed rate part
USD 70 53 47 3 yearsEUR 10 100 - 2 yearsSEK 6 100 - 3 yearsJPY 6 77 23 1 yearOther 8 - 100
100 64 36
Given this interest rate profile, a 1% change in interest rates on the Company's floating rate debt would changeinterest cost by approximately $3 million per year.

Company has estimated that a onepercent change in the value of the U.S.dollar versus the Euro has approxi-mately a $20 million annual impact onreported U.S. dollar sales and approxi-mately a two million dollar impact onoperating income.
Currency Risk - Translation Exposurein the Balance Sheet
A translation exposure also ariseswhen the balance sheets of non-U.S.subsidiaries are translated into U.S.dollars. The general policy of theCompany is to finance major sub-sidiaries in the country’s local currency.Consequently, changes in currencyrates relating to funding have a smallimpact on the Company’s income.
Interest Rate RiskInterest rate risk is the risk that interestrate changes will affect the Company’sborrowing costs. The Company’s poli-cy is that, as a target, at least 50% ofits net debt shall have fixed interestrates with a target average life of atleast three years. The fixed rate debt isachieved both by issuing fixed ratenotes and through interest rate swaps.The table on the previous page showsthe maturity and composition of theCompany’s borrowings at year-end.
Refinancing Risk
Refinancing risk or borrowing riskrefers to the risk that it could becomedifficult to refinance outstanding debt.In order to protect against this risk, the
272002 Autoliv — Driven for Life
Management’s Discussion and Analysis
Statements in this report that are notstatements of historical fact may beforward-looking statements, whichinvolve risks and uncertainties, includ-ing – but not limited to – the economicoutlook for the Company’s markets,
fluctuation of foreign currencies, fluctu-ation in vehicle production schedulesfor which the company is a supplier,continued uncertainty in programawards and performance, the financialresults of companies in which Autoliv
has made technology investments, andother factors discussed in Autoliv’s fil-ings with the Securities and ExchangeCommission.
Company has a syndicated revolvingcredit facility with a group of bankswhich backs its short-term commercialpaper programs.The committed facility of $804 millionhas a $530 million long-term portion,which expires in November 2005, and a$274 million 364-day facility, which may– but is not guaranteed – to be renewedeach November. For further details onlong-term borrowing see Note 11.The Company’s policy is that total netdebt shall be issued or covered bylong-term facilities with an averagematurity of at least three years. AtDecember 31, 2002, net debt was $864million and total available long-termfacilities were $1,004 million with anaverage life of 3.1 years.
Credit RiskCredit risk is the risk of a counterpartybeing unable to fulfill an agreed obliga-tion. In the Company’s financial opera-tions, this risk arises in connection withthe investment of liquid assets andwhen entering forward exchangeagreements, swap contracts or otherfinancial instruments. In order toreduce credit risk, deposits and finan-cial instruments can only be enteredinto with a limited number of banks andin limited amounts, as approved by theCompany’s Board of Directors. Thepolicy of the Company is to work withbanks that have a high credit rating andthat participate in the Company’sfinancing.
Gearing PolicyThe net debt to capitalization hasdecreased from 35% at year-end 2001to 29% at year-end 2002. In order toincrease shareholder value and reducethe weighted average cost of capital,the Company, in 2002, reactivated itsshare repurchase program and, effec-tive for 2003, increased the dividend.However, in order to assure that theCompany maintains a relatively conser-vative gearing ratio, the financial policylimits net debt to capitalization to 40%.
0
200
400
600
800
1,000
1,200
1998 1999 2000 2001 2002
Net debt Net debt to capitalization %
GEARING, NET DEBT
US$ (million)
10
20
30
40
50
0
%
During 2002, net debt was reduced to $864 millionfrom $1,023 million at the end of 2001. In relation tototal capitalization, the reduction was to 29% from35%.The sharp increase in net debt in 2000 was mainly
due to the effect of acquisitions and of repurchasesof shares.
SAFE HARBOR STATEMENT UNDER THE PRIVATE SECURITIES LITIGATION REFORM ACT OF 1995
Selected data in Swedish Kronor 2002 2001 ChangeNet sales (million) 43,279 41,187 5 %Income before taxes (million) 2,793 1,2051) 132%Net income (million) 1,758 4941) 256%Earnings per share 17.92 5.061) 254%
(Average exchange rates: $1 = SEK 9.74 for 2002 and $1 = SEK 10.32 for 2001)1)Excluding the Unusual Items in 2001, the Operations generated an income before taxes of 1,879 millionSwedish Kronor, net income of 977 million Swedish Kronor and earnings per share of 10.01.

28 2002 Autoliv — Driven for Life
Years ended December 31
(Dollars and shares in millions, except per share data) 2002 2001 2000
Net sales Note 18 $4,443.4 $3,991.0 $4,116.1
Cost of sales (3,632.6) ( 3,336.2) (3,330.0)
Gross profit 810.8 654.8 786.1
Selling, general and administrative expenses (219.0) (196.7) (190.0)
Research, development and engineering expenses (229.8) (200.8) (195.7)
Amortization of intangibles (19.4) (73.3) (66.7)
Other income (expense), net (11.8) (10.3) 5.8
Operating income 330.8 173.7 339.5
Equity in earnings of affiliates 4.1 5.7 4.3
Interest income Note 11 6.1 6.2 5.5
Interest expense Note 11 (55.0) (66.3) (59.6)
Other financial items, net 0.7 (2.5) 0.9
Income before income taxes 286.7 116.8 290.6
Income taxes Note 4 (94.6) (59.8) (117.2)
Minority interests in subsidiaries (11.6) (9.1) (4.7)
Net income $180.5 $47.9 $168.7
Earnings per common share and earnings
per common share assuming dilution $1.84 $.49 $1.67
Number of shares used in computing per share amount 98.0 98.0 100.9
Number of shares outstanding, net of Treasury shares 96.3 98.0 97.8
Consolidated Statements of Income
Pro-Forma (adjusted for FAS-142) 2002 2001 2000
Amortization of intangibles $(19.4) $(21.7) $(17.4)
Operating income 330.8 225.3 388.8
Income before income taxes 286.7 168.4 339.9
Net income $180.5 $99.5 $218.0
Earnings per common share and earnings per
common share assuming dilution $1.84 $1.02 $2.16
See Notes to Consolidated Financial Statements

292002 Autoliv — Driven for Life
At December 31
(Dollars in millions) 2002 2001
Assets
Cash and cash equivalents $101.5 $84.2
Receivables (net of allowances of $9.9 million and $12.6 million) Note 5 1,008.6 837.2
Inventories Note 6 381.5 329.5
Income tax receivables Note 4 17.7 46.8
Prepaid expenses 44.5 67.9
Total current assets 1,553.8 1,365.6
Property, plant and equipment, net Note 8 916.9 845.0)
Investments and other non-current assets Note 7 133.8 108.3
Goodwill assets, net Note 9 1,498.2 1,472.3
Intangible assets, net Note 9 192.1 213.1
Total assets $4,294.8 $4,004.3
Liabilities
Short-term debt Note 11 $122.9 $70.2
Accounts payable 619.3 481.3
Accrued expenses Note 10 293.9 256.2
Other current liabilities 121.3 78.6
Income taxes Note 4 32.4 28.1
Total current liabilities 1,189.8 914.4
Long-term debt Note 11 842.7 1,037.1
Other non-current liabilities 174.5 150.7
Minority interests in subsidiaries 41.1 26.8
Total non-current liabilities and minority interests 1,058.3 1,214.6
Shareholders’ equity
Common stock (shares outstanding 102.4 million and 102.4 million) 102.4 102.4
Additional paid-in capital 1,943.1 1,942.5
Retained earnings (accumulated deficit) and
accumulated other comprehensive income (loss) 134.6 (66.6)
Treasury stock (6.1 million and 4.5 million shares) (133.4) (103.0)
Total shareholders’ equity Note 12 2,046.7 1,875.3
Total liabilities and shareholders’ equity $4,294.8 $4,004.3
See Notes to Consolidated Financial Statements
Consolidated Balance Sheets

30 2002 Autoliv — Driven for Life
Years ended December 31
(Dollars in millions) 2002 2001 2000
Operating activities
Net income $180.5 $47.9 $168.7
Adjustments to reconcile net income
to net cash provided by operating activities:
Depreciation and amortization 248.5 304.2 269.1
Deferred income taxes and other 29.6 19.1 24.0
Undistributed earnings from affiliated companies (4.1) (5.7) (4.3)
Changes in operating assets and liabilities
Receivables and other assets (27.9) (52.9) (84.2)
Inventories (29.8) (8.2) (37.5)
Accounts payable and accrued expenses 110.6 (38.4) (68.7)
Income taxes 1.6 0.2 (1.3)
Net cash provided by operating activities 509.0 266.2 265.8
Investing activities
Expenditures for property, plant and equipment (228.4) (248.4) (234.5)
Expenditures for intangible assets - (20.8) (10.3)
Acquisition of businesses and investments
in affiliated companies, net of cash acquired Note 13 (22.3) (13.1) (211.0)
Other 10.5 12.7 27.9)
Net cash used in investing activities (240.2) (269.6) (427.9)
Net cash before financing 268.8 (3.4) (162.1)
Financing activities
Increase (decrease) in short-term debt (23.8) (274.4) (17.4)
Issuance of long-term debt 5.6 329.8 716.1
Repayments and other changes in long-term debt (165.4) (3.4) (438.3)
Increase (decrease) in minority interest (2.5) (2.7) 3.3
Dividends paid (42.9) (43.0) (44.5)
Shares repurchased (30.4) - (103.0)
Common stock issued - 0.9 -
Stock options exercised 0.7 - 0.1
Other, net 1.7 3.1 14.6
Net cash provided by (used in) financing activities (257.0) 10.3 130.9
Effect of exchange rate changes on cash 5.5 (4.9) (5.8)
Increase (decrease) in cash and cash equivalents 17.3 2.0 (37.0)
Cash and cash equivalents at beginning of year 84.2 82.2 119.2
Cash and cash equivalents at end of year $101.5 $84.2 $82.2
See Notes to Consolidated Financial Statements
Consolidated Statements of Cash Flows

312002 Autoliv — Driven for Life
Consolidated Statements of Shareholders’ Equity
Accumulated Total Number other com- share-
of shares Share Paid Retained Treasury prehensive holders'(in millions) capital in capital earnings shares income (loss) equity
Balance at December 31, 1999 102.3 $102.3 $1,941.5 $(40.1) - $(72.7) $1,931.0
Comprehensive Income:
Net income 168.7 168.7
Foreign currency translation (42.2) (42.2)
Total Comprehensive Income 126.5
Stock options exercised 0.1 0.1
Cash dividends (44.5) (44.5)
Repurchased treasury shares $(103.0) (103.0)
Balance at December 31, 2000 102.3 $102.3 $1,941.6 $84.1 $(103.0) $(114.9) $1,910.1
Comprehensive Income:
Net income 47.9 47.9
Net loss in cash flow hedges (3.8) (3.8)
Foreign currency translation (36.9) (36.9)
Total Comprehensive Income 7.2
Common stock issued 0.1 0.1 0.9 1.0
Cash dividends (43.0) (43.0)
Balance at December 31, 2001 102.4 $102.4 $1,942.5 $89.0 $(103.0) $(155.6) $1,875.3
Comprehensive Income:
Net income 180.5 180.5
Net loss in cash flow hedges (16.8) (16.8)
Foreign currency translation 80.4 80.4
Total Comprehensive Income 244.1
Stock options exercised 0.6 0.6
Cash dividends (42.9) (42.9)
Repurchased treasury shares (30.4) (30.4)
Balance at December 31, 2002 102.4 $102.4 $1,943.1 $226.6 $(133.4) $(92.0) $2,046.7
See Notes to Consolidated Financial Statements

32 2002 Autoliv — Driven for Life
(Dollars in millions, except per share data)
Note 1. Summary of Significant Accounting Policies
Principles of Consolidation
The consolidated financial statements have been prepared inaccordance with U.S. Generally Accepted Accounting Principles(“GAAP”) and include Autoliv, Inc. and all companies in whichAutoliv, Inc., directly or indirectly, owns more than 50% of thevoting rights and exercises control (the “Company”).
All intercompany accounts and transactions within theCompany have been eliminated from the consolidated financialstatements.
Investments in affiliated companies in which the Companyexercises significant influence over the operations and financialpolicies, but does not control, are reported according to theequity method of accounting. Generally the Company ownsbetween 20 and 50 percent of such investments.
Use of Estimates
The preparation of consolidated financial statements in confor-mity with U.S. GAAP requires management to make estimatesand assumptions that affect the reported amounts of assets andliabilities, disclosures of contingent assets and liabilities at thedate of the financial statements, and the reported amounts ofrevenues and expenses during the reporting period. Actualresults could differ from those estimates.
Accounting Policies
New Accounting PoliciesNew accounting policies issued by the Financial AccountingStandards Board (“FASB”) which have been implemented effec-tive January 1, 2002 are the following: FAS-144 “Accounting forthe Impairment or Disposal of Long-lived Assets” and FAS-142“Goodwill and Other Intangible Assets”. The adoption of FAS-144 did not have any material impact on the Company’s resultsof operations or financial position. However, the application ofFAS-142 resulted in a reduction of approximately $50 million ofannual amortization of goodwill in 2002. Under FAS-142 good-will and other indefinate lived intangible assets are no longeramortized and such assets are to be evaluated for impairmenton at least an annual basis. Autoliv has performed an impair-ment analysis during the first and fourth quarters of 2002 andconcluded that the value of its goodwill is not impaired. FAS-142(non-amortization of goodwill) has not been applied to anyreported periods prior to 2002. The Pro-Forma effects of FAS-142 on prior periods are presented on the face of the incomestatement.
In August 2001 the FASB issued FAS-143 “Asset RetirementObligations”, regarding the non-temporary removal of long-livedassets from service, whether by sale, abandonment, recyclingor other method of disposal. FAS-143 will become effective forfiscal years beginning after June 15, 2002, which for theCompany will be January 1, 2003. Management does notexpect that adoption of FAS-143 will have a material impact onthe Company’s results of operations or financial position.
In July 2002, FAS-146 “Accounting for Costs Associated withExit or Disposal activities” was issued. It addresses financialaccounting and reporting for costs associated with exit or dis-posal activities and nullifies EITF 94-3, “Liability Recognition forCertain Employee Termination Benefits and other Costs to Exitan Activity (including Certain Costs Incurred in a restructuring).”The principal difference between FAS-146 and EITF 94-3 relates
to FAS-146’s requirements that a liability for a cost associatedwith an exit or disposal activity should be recognized when theliability is incurred. The statement is effective for exit or dispos-al activities initiated after December 31, 2002. Autoliv does notexpect the application of FAS-146 to have a material effect onearnings or financial position.
In December 2002 the FASB issued FAS-148, “Accounting forStock-Based Compensation-Transition and Disclosure anamendment of FASB Statement No. 123” (“FAS-148”). ThisStatement amends FAS-123, “Accounting for Stock-BasedCompensation”, to provide alternative methods of transition fora voluntary change to the fair value based method of account-ing for stock-based employee compensation. In addition, thisStatement amends the disclosure requirements of FAS-123 torequire prominent disclosures in both annual and interim finan-cial statements about the method of accounting for stock-based employee compensation and the effect of the methodused on reported results. The Company does not plan tochange its accounting for stock-based compensation fromAPB-25 (intrinsic value method) to FAS-123 (fair value method)and accordingly does not expect the application of FAS-148 tohave a material effect on earnings or financial position.
Translation of non-U.S. Subsidiaries
The balance sheets of non-U.S. subsidiaries are translated intoU.S. dollars using year-end rates of exchange. Income statementsare translated into U.S. dollars at the average rates of exchange forthe year. Translation differences are reflected in other comprehen-sive income as a separate component of shareholders’ equity.
Revenue Recognition
The Company’s revenue recognition policy is in accordance withthe Securities and Exchange Commission’s Staff AccountingBulletin (“SAB”) No. 101, “Revenue Recognition in FinancialStatements”. SAB 101 requires the recognition of revenues whenthere is evidence of a sales agreement, delivery of goods hasoccurred, the sales price is fixed or determinable and the col-lectibility of revenue is reasonably assured. The Company recordsrevenue from the sale of manufactured products upon shipment.Income from contracts to perform engineering design and prod-uct development services are generally recognized as milestonesare achieved. Contracts to supply products which extend for peri-ods in excess of one year are reviewed when conditions indicatethat costs may exceed selling prices, resulting in losses. Losseson long-term supply contracts are recognized when estimable.Net sales include the sales value exclusive of added tax.
Cost of Sales
Shipping and handling costs are included in cost of sales.
Research, Development and Engineering (R,D&E)
Research and development expenses are charged to income asincurred. Engineering expenses normally are charged to incomeas incurred.
These expenses are reported net of royalty income andincome from contracts to perform engineering design and prod-uct development services. Such income is not significant in anyperiod presented.
In addition, certain engineering costs are capitalized when thecriteria in Emerging Issues Task Force (“EITF”) 99-5 “Accountingfor Pre-production Costs Related to Long-Term SupplyArrangements” are met. The aggregate amount of such assetsis not significant in any period presented.
Notes to Consolidated Financial Statements

332002 Autoliv — Driven for Life
Property, Plant and Equipment
Property, plant and equipment are recorded at historical cost.Construction in progress generally involves short-term projectsfor which capitalized interest is not significant. The Companyprovides for depreciation of property, plant and equipment, byannual charges to income, computed under the straight-linemethod over the assets estimated useful lives, ranging from 3 to40 years. Repairs and maintenance are expensed as incurred,except for when functionality of the related asset is enhanced orthe asset’s useful life is substantially extended.
Intangible Assets
Intangible assets are recorded at historical cost. Until the end of thefinancial year ending December 31, 2001, goodwill was amortizedon a straight-line basis over periods ranging from 5 to 40 years. In2002, in accordance with FAS-142 goodwill is no longer amortizied.Other intangible assets, principally related to acquired technology,are amortized over their useful lives which range from 7 to 25 years.
Impairment of Long-lived and Identifiable Intangible Assets
The Company evaluates the carrying value of long-lived assetsand identifiable intangible assets for potential impairment on anongoing basis in accordance with the provisions of FAS-144. Thefair value of impaired assets is primarily determined by the dis-counted cash flow method. The Company discounts projectedoperating cash flows using its weighted average cost of capital.
Income Taxes
Current tax liabilities and assets are recognized for the estimatedtaxes payable or refundable on the tax returns for the current year.Deferred tax liabilities or assets are recognized for the estimatedfuture tax effects attributable to temporary differences and carry-forwards that result from events that have been recognized ineither the financial statements or the tax returns, but not both. Themeasurement of current and deferred tax liabilities and assets isbased on provisions of enacted tax laws. Deferred tax assets arereduced by the amount of any tax benefits that are not expectedto be realized. Tax assets and liabilities are not offset unlessattributable to the same tax jurisdiction and netting is possibleaccording to law and expected to take place in the same period.
Earnings per Share
The Company calculates earnings per share in accordance with theprovisions of FAS-128. There was no difference between basic anddiluted earnings per share in 2002, 2001 and 2000. The dilutiveeffect of stock options was immaterial in all periods presented.
Cash Equivalents
The Company considers all highly liquid investment instruments pur-chased with a maturity of three months or less to be cash equivalents.
Financial InstrumentsThe Company uses derivative financial instruments, (“deriva-tives”), to mitigate the market risk that occurs from its exposureto changes in interest and foreign exchange rates. TheCompany does not utilize financial instruments for trading orother speculative purposes. The use of such derivatives is inaccordance with the strategies contained in the Company’soverall financial policy. With respect to derivatives, the policyhas two key elements. One is to hedge forecasted foreign cur-rency cash flows arising from transaction exposure; between 75and 100% of forecasted exposure is hedged for the coming sixmonths and between 50 and 75% in the period from seven to
twelve months forward. The second element sets the target thatat least 50% of the Company’s net debt shall have fixed interestrates with an average life of at least three years.
The Company adopted FAS-133, as amended by FAS-138,effective January 1, 2001. The cumulative transition adjustmentwas not significant.
The Company’s criteria for a derivative to be accounted for asa hedge include the following four elements: 1) The hedge trans-action is expected to be highly effective in achieving offsettingchanges in fair value or cash flows attributable to the hedgedrisk. 2) The effectiveness of the hedge can be reliably measured.3) Adequate documentation of the hedging relationships hasbeen prepared at the inception of the hedge. 4) For cash flowhedges, the forecasted transaction that is subject to the hedgemust be highly probable.
The changes in the fair values of the hedges are recorded at eachbalance sheet date. The fair value of the Company’s derivatives areestimated based on dealer quotes or on pricing models using cur-rent assumptions. When an anticipated future cash flow is hedgedand the underlying position has not been recognized in the finan-cial statements, any change in the fair value of the hedge is notrecognized in the income statement for the period but recordeddirectly in equity as a component of Other ComprehensiveIncome, (“OCI”). No material reclassifications are expected fromOCI to the income statement in 2003. When a hedge is classifiedas a fair value hedge, the change in the fair value of the hedge isrecognized in the income statement along with the offsettingchange in the fair value of the hedged item. There has been nomaterial gain or loss due to hedge ineffectiveness.
The Company periodically enters into forward exchange con-tracts with terms of twelve months or less to hedge anticipatedcash flows denominated in foreign currencies. At December 31,2002, the counterparty exposure on these contracts wasapproximately $414 million. These contracts are designated ascash flow hedges. The Company also uses interest rate swapsto protect against interest rate risks, as well as currency swapsto hedge against currency risks arising as a part of debt man-agement. These hedges are designated either as cash flowhedges or fair value hedges. These swaps principally match theterms of maturity of the underlying debt. For further details onthe Company’s debt, see Note 11.
Receivables and Liabilities in non-functional currencies
Receivables and liabilities not denominated in functional curren-cies are converted at year-end rates of exchange. Transactiongains (losses), net reflected in income amounted to $(3.2) millionin 2002, $1.0 million in 2001 and $0.5 million in 2000.
Inventories
Inventories are valued at the lower of cost or market. Cost iscomputed according to the first-in, first-out method (FIFO).
Reclassifications
Certain prior-year amounts have been reclassified to conform tocurrent year presentation.
Note 2. Significant Business Acquisitions
In September 2002, Autoliv acquired the 10% stake in AutolivQB Inc., a Philippine company, formerly held by one of two localshareholders. Autoliv has thereby increased its ownership in thecompany from 75% to 85%. In addition, Autoliv agreed to inject
Notes to Consolidated Financial Statements

34 2002 Autoliv — Driven for Life
18 million Philippine Pesos ($0.3 million) into the company as newshare capital. The remaining local shareholder did not participatein the equity increase. Thus, Autoliv effectively increased its inter-est in Autoliv QB, Inc. to 91%. In April the acquisition of theRestraint Electronics Business of Visteon Corporation was com-pleted. The operations that Autoliv acquired had $150 million inannual sales. The Company also sold its French steel componentcompany Autoliv Composants S.A.S in the beginning of 2002.The sale of Autoliv Composants did not have a material impacton Autoliv’s consolidated sales or earnings.
An agreement was signed in November 2000 to establish a newventure with Mando Corporation, a leading Korean auto partssupplier. This new venture, Autoliv Mando Corporation, in whichAutoliv holds 65% of the shares was consolidated startingJanuary 2001. The annual sales were approximately $35 million.Also in 2001, effective January 1, the Company exercised itsoption to increase its holding from 66% to 83% in the Frenchairbag inflator company Livbag and its initiator manufacturingsubsidiary, N.C.S. SA. The Company has the right to acquire, andthe minority owner the right to sell, the remaining Livbag sharesin 2003. In June 2001, the Company made Autoliv Romania S.A.a wholly owned subsidiary by aquiring the remaining 10% of theshares. In August 2001, the Company aquired the remaining 10%minority interest in Autoliv Thailand.
As of January 1, 2000, the Company acquired from Izumi, 99%of Japan’s second-largest steering wheel business, which hadannual sales of approximately $99 million. In February 2000,Autoliv exercised its option to increase, from 49.5% to 51%, itsinterest in the Estonian company Norma AS, the dominant seat beltsupplier to the Russian vehicle industry. As a result, Norma AS,which had annual sales of approximately $37 million, has beenconsolidated since the beginning of 2000. As of April 1, 2000, theNorth American seat belt operations of NSK, which had annualsales of approximately $70 million, were acquired together with a40% interest in NSK’s Asian seat belt operations. The Companyoriginally had an option to acquire the remaining 60% in two stepson April 1, 2002 and 2003. However, the Company agreed during2002, that it would exercise both options in April 1, 2003. TheCompany currently accounts for its investments in the 40% interestof NSK’s Asian seat belt operations under the equity method. As ofMay 1, 2000, the Company acquired OEA, Inc., the Company’smain external supplier of initiators for airbag inflators. ExcludingOEA’s Aerospace Division, OEA had sales of approximately $205million in its last fiscal year, which ended July 31, 1999. OEA’sAerospace Division was not consolidated by Autoliv and substan-tially all of the Aerospace assets were subsequently sold. TheCompany also sold three small non-core operations during 2000.
The acquisitions have been accounted for using the purchasemethod of accounting, and accordingly, the results of operationsof the entities have been consolidated since the respective datesof acquisition. Investments in which the Company previously exer-cised significant influence, but did not control prior to these acqui-sitions, were accounted for using the equity method. The pur-chase price of the acquisitions amounted to $25 million in 2002,$16 million in 2001 and $233 million in 2000. Goodwill of $7 mil-lion, $9 million and $206 million, respectively, was associated withthese acquisitions. Prior to 2002, such goodwill was being amor-tized over 5 to 40 years. The pro-forma effects of the acquisitionswould not be materially different from reported results.
Note 3. Fair Values of Financial Instruments
The following methods were used by the Company to estimate itsfair value disclosures for financial instruments.
Current Financial Assets and Liabilities
The carrying amounts reported in the balance sheet for currentfinancial assets and liabilities approximate their fair valuesbecause of the short maturity of these items.
Long-Term Debt and Other Non-Current Financial Liabilities
The carrying amounts reported in the balance sheet for long-termdebt and other non-current financial liabilities approximate theirfair values because these instruments bear rates consistent withcurrent market interest rates, except for certain debt instrumentsand related swaps. These financial instruments and relatedswaps are specified in Note 11 and had a negative mark-to-mar-ket of $34.2 million at December 31, 2002. At December 31,2001, they had a negative mark-to-market of $13.2 million.
Note 4. Income Taxes
Income before income taxes 2002 2001 2000U.S. $71.6 $4.8 $98.1Non-U.S. 215.1 112.0 192.5Total $286.7 $116.8 $290.6
Provision for income taxes 2002 2001 2000Current
U.S. federal $19.5 - $21.6Non-U.S. 59.1 $50.9 65.2U.S. state and local 6.8 0.2 6.4
DeferredU.S. federal 1.3 13.8 7.2Non-U.S. 9.7 (8.0) 13.8U.S. state and local (1.8) 2.9 3.0
Total income taxes $94.6 $59.8 $117.2
Effective income tax rate 2002 2001 2000U.S. federal income tax rate 35.0% 35.0% 35.0%Goodwill amortization - 16.3 5.6Net operating loss carry-forwards (1.8) (0.9) (0.4)Non-utilized operating losses 4.5 6.3 2.7Foreign tax rate variances (2.5) (0.2) 1.0State taxes, net of federal benefit 1.2 1.7 2.1Earnings of equity investments (0.5) (1.7) (0.5)Export sales incentives (1.1) (2.6) (2.6)Tax credits (2.6) (5.0) (0.6)Other, net 0.8 2.3 (2.0)Effective income tax rate 33.0% 51.2% 40.3%
Deferred income taxes reflect the net tax effects of temporary dif-ferences between the carrying amounts of assets and liabilitiesfor financial reporting purposes and the amounts used for incometax purposes. On December 31, 2002, the Company had netoperating loss carry-forwards (“NOL’s”) of approximately $120million, of which approximately $65 million have no expirationdate. The balance expires on various dates through 2019. TheCompany also has approximately $20 million of Foreign TaxCredits, which expire at various dates through 2006. Valuationallowances have been established which partially offset the relat-ed deferred assets. The Company provides valuation allowances
Notes to Consolidated Financial Statements

352002 Autoliv — Driven for Life
against potential future tax benefits when, in the opinion of man-agement, based on the weight of available evidence, it is morelikely than not that some portion of the deferred tax assets willnot be realized. Such allowances are primarily provided againstNOL’s of companies that have perennially incurred losses, as wellas the NOL’s of companies that are start-up operations and havenot established a pattern of profitability.
Deferred taxesDecember 31 2002 2001AssetsAccruals and reserves $40.9 $55.0Costs capitalized for tax 2.5 3.3Pensions 27.0 20.2Tax receivables, principally NOL’s 81.3 75.7Other temporary differences 12.8 1.5
164.5 155.7Valuation allowances (50.2) (52.1)Total $114.3 $103.6
LiabilitiesAcquired intangibles $(66.4) $(72.9)Statutory tax allowances (8.6) (8.1)Property, plant and equipment (3.5) 9.0Other temporary differences (61.7) (66.9)Total (140.2) (138.9)Net deferred tax asset (liability) $(25.9) $(35.3)
Valuation allowances against tax receivablesDecember 31 2002 2001 2000Allowances at beginning of
year $52.1 $45.9 $18.6Change due to
aquisitions/divestitures – – 4.5Benefits reserved current year 12.4 10.3 33.3Benefits recognized current year (5.0) (1.1) (6.3)Write-offs and other changes (7.8) (2.1) (3.3)Translation difference (1.5) (0.9) (0.9)Allowances at end of year $50.2 $52.1 $45.9
Deferred income taxes have not been provided on approximate-ly $810 million of undistributed earnings of non-U.S. subsidiarycompanies, which are considered to be permanently reinvested.These earnings generally would not be subject to withholdingtaxes, either upon distribution to intermediate holding companiesor upon distribution to the U.S. In addition, U.S. income taxes onnon-U.S. earnings which might be remitted would be substantial-ly offset by foreign tax credits.
Note 5. Receivables
December 31 2002 2001 2000Receivables $1,018.5 $849.8 $849.0Allowances at beginning of
year (12.6) (13.6) (8.9)Change due to
aquisitions/divertitures - - (3.4)Reversal of allowance 5.9 3.2 2.3Addition to allowance (14.5) (7.1) (11.0)Write-off against allowance 11.8 4.7 6.9Translation difference (0.5) 0.2 0.5Allowances at end of year (9.9) (12.6) (13.6)Total receivables,
net of allowances $1,008.6 $837.2 $835.4
Note 6. InventoriesDecember 31 2002 2001 2000Raw material $176.6 $148.9 $163.3Finished products 92.7 67.9 63.5Work in progress 130.9 125.2 117.8
$400.2 $342.0 $344.6Inventory reserve at
beginning of year (12.5) (11.1) (8.1)Change due to
acquisitions/divestitures 0.3 - (0.7)Reversal of reserve 1.6 1.9 1.2Addition to reserve (13.7) (9.3) (7.3)Write-off against reserve 7.1 5.5 3.3Translation difference (1.5) 0.5 0.5Inventory reserve at end of year (18.7) (12.5) (11.1)Total inventories,
net of reserve $381.5 $329.5 $333.5
Note 7. Investments and Other Non-current assets The Company has invested in eleven affiliated companies which itdoes not control, but in which it exercises significant influence overoperations and financial position. These investments are accountedfor under the equity method. The total investment was $32 millionand $33 million at December 31, 2002 and 2001, respectively. Otherreceivables include deferred income tax receivables of $77 millionand $51 million at December 31, 2002 and 2001, respectively.
Note 8. Property, Plant and Equipment December 31 2002 2001Land and land improvements $49.1 $46.3Machinery and equipment 1,551.9 1,356.2Buildings 452.2 393.8Construction in progress 104.1 109.1
2,157.3 1,905.4Less accumulated depreciation (1,240.4) (1,060.4)Net of depreciation $916.9 $845.0
Depreciation included in 2002 2001 2000Cost of goods sold $199.2 $203.5 $176.2Selling, general and
administrative expenses 11.2 10.2 9.1Research, development &
engineering expenses 18.7 17.2 17.0Total $229.1 $230.9 $202.3
During 2002, impairment provisions of totaling $8 million wererecognized. They were principally related to the plant closures inIndianapolis and Denver and further asset write-offs in the SeatSub-System division.
In the third quarter of 2001, an impairment provision of $18 mil-lion was recognized. The provisions were included in cost of sales.
Note 9. Goodwill and Intangible Assets Unamortized intangibles 2002 2001Goodwill $1,727.0 $1,684.7Assembled workforce1) - 14.0Gross carrying amount 1,727.0 1,698.7
Goodwill (228.8) (212.4)Assembled workforce1) - (8.2)Accumulated amortization (228.8) (220.6)
Goodwill 1,498.2 1,472.3Assembled workforce1) - 5.8 Carrying value $1,498.2 $1,478.11)Upon adoption of FAS-141 “Assembled workforce” of net $5.8 million was reclassifiedto goodwill.
Notes to Consolidated Financial Statements

36 2002 Autoliv — Driven for Life
Amortized intangibles 2002 2001Intellectual propertyGross carrying amount $297.0 $296.7Accumulated amortization (104.9) (89.4)Carrying value $192.1 $207.3
During the second quarter of 2002, $7 million of intellectualproperty was acquired as part of the Visteon RestraintElectronics acquisition. The property is amortized over 7 yearsand had at December 31, 2002 a residual value of $6 million.
At December 31, 2002, goodwill assets net include $1,208 mil-lion associated with the 1997 merger of Autoliv AB and theAutomotive Safety Products Division of Morton International, Inc.
The aggregate amortization expense was $19.4 million in 2002and $73.3 million in 2001. The estimated amortization expenseis as follows (in millions): 2003: $19.6; 2004: $18.2; 2005: $10.6;
2006: $10.6; and 2007: $10.6.The following changes in the carrying amount of goodwill for
the year ended December 31, are as follows:
December 31 2002 2001Gross carrying amount at beginning $1,684.7 $1,685.9
of yearGoodwill acquired during year 7.1 8.5Impairment losses - (5.7)Reclassification1) 14.0 -Translation differences 21.2 (4.0)Gross carrying amount at end of year $1,727.0 $1,684.71) Upon adoption of FAS-141 “assembled workforce” of $14.0 million was reclassifiedto goodwill.
During the third quarter of 2001, an impairment provision forintangible assets of $6 million was recognized.
Notes to Consolidated Financial Statements
Note 10. Restructing and Unusual itemsThe table below summarizes the provisions made in the third quarter 2001 by type of charge:
Amorti- OtherCost of zation of Income/
Total Sales intangibles ExpenseFixed asset impairment $18.2 $18.2Goodwill impairment 5.7 $5.7Subtotal impairment $23.9
Restructuring-employee related $11.9 0.9 $11.0Contractual losses 7.0 7.0Warranty 10.0 10.0Liability 12.5 10.0 2.5Subtotal provisions $41.4Total $65.3 $46.1 $5.7 $13.5
The tables below summarize the changes in restructuring reserves from the third quarter 2001 to December 31, 2002.Reserve balance
Provision Q3 Cash Change in Translation September 30 2001 payments reserve difference 2001
Restructuring-employee related $11.9 $(0.9) $(0.2) $10.8Contractual losses 7.0 (0.3) 6.7Warranty 10.0 10.0Liability 12.5 (0.1) 12.4Subtotal reserve $41.4 $(0.9) $(0.6) $39.9
Fixed asset impairment $18.2Goodwill impairment 5.7Subtotal impairment $23.9Total $65.3
September 30 Cash Change in Translation December 31Balance sheet position 2001 payments reserve difference 2001Restructuring-employee related $10.8 $(3.8) $0.1 $7.1Contractual losses 6.7 $(1.0) 0.1 5.8Warranty 10.0 (10.0) -Liability 12.4 10.0 22.4Total reserve $39.9 $(3.8) $(1.0) $0.2 $35.3
Cash Change in TranslationDecember 31 2001 payments reserve difference 2002Restructuring-employee related $7.1 $(3.4) $8.5 $0.3 $12.5Contractual losses 5.8 (5.8) (0.2) 0.5 0.3Liability 22.4 (4.5) 0.5 18.4Total reserve $35.3 $(13.7) $8.3 $1.3 $31.2

372002 Autoliv — Driven for Life
During October 2001, a restructuring package was introducedto improve profitability and offset the effects of expected down-turn in light vehicle production. The costs and provisions for thispackage, totaling $65 million, were charged to the third quarter2001 results and are referred to in this report as “UnusualItems”. The Unusual Items also included provisions for contrac-tual, warranty and liability issues related to ongoing litigation.
The restructuring package mainly included restructuring costsand asset write-offs of the Seat Sub-System division, severancecosts related to the U.S. and the Swedish textile operations andadditional costs incurred for the partial integration of a formerOEA plant into the main U.S. inflator operation.
In 2002 restructuring provisions of $9 million were made forseverance costs associated with plant consolidations in theU.S. These severance provisions have been charged againstOther income and expense in the income statement in the fourthquarter of 2002.
The employee related restructuring activities are expected tobe completed before the end of 2003.
The number of employees that were expected to be terminat-ed as part of the restructuring activities when the provisions weremade in the third quarter 2001, were 521. At December 31, 2001,104 employees were terminated or had left voluntarily and 417employees remained to be terminated. During 2002 an addition-al 265 employees were terminated or left voluntarily. As part ofthe restructuring activities in North America in 2002, for whichprovisions were made in the fourth quarter of 2002, an addition-al 888 employees are expected to be terminated. Therefore, atDecember 31, 2002, 1,040 employees remain to be terminatedas part of the restructuring activities covered by the reserves.
Note 11. Debt and Credit Agreements
Average net debt and interest net 2002 2001 2000Average interest-bearing debt $1,047 $1,114 $938Average net debt 940 1,032 835Interest, net 48.9 60.1 54.1Average interest on net debt 5.2% 5.8% 6.5%
Short-term debtThe Company has two commercial paper programs: one $1,000million U.S. program, which at December 31, 2002, had notes of$290 million outstanding at a weighted average interest rate of1.8%, and one 485 million Euro Swedish program, which atDecember 31, 2002, had notes of $79 million (SEK 0.7 billion)outstanding at a weighted average interest rate of 4.3%. All ofthe notes outstanding under both programs were reclassified aslong-term debt since they are backed with a committed facilitymaturing 2005.
The Company also has credit facilities with a number of banksthat manage the Company’s subsidiaries’ cash pools. In addition,the Company’s subsidiaries have credit agreements, principally inthe form of overdraft facilities, with a number of local banks.Excluding the commercial paper programs, total available facilitiesas of December 31, 2002, amounted to $322 million, of which $47million was utilized. The aggregate amount of unused short-termlines of credit at December 31, 2002, was $275 million.Furthermore, $76 million represents the short-term portion of long-term loans, primarily notes under the Swedish medium-term noteprogram and unsecured bank borrowings in Japan. The weightedaverage interest rate on total short-term debt outstanding atDecember 31, 2002 and 2001, was 4.0% and 3.9%, respectively.
2002 2001December 31 Amount %1) Amount %1)
U.S. commercial paper (not reclassified) – n/a – n/a
Swedish commercial paper(not reclassified) – n/a $45.4 4.1%
Overdrafts and other short-term debt $46.8 3.5% 21.6 3.2%
Short-term portion of long-term loan 76.1 4.2% 3.2 5.0%
Short-term debt $122.9 4.0% $70.2 3.9%1) Weighted average interest rate at December 31
Long-term debtIn 2001, the Company launched a 5-year 300 millionEurobond. All proceeds of the issue were swapped into USD,totaling $265 million. Under the Swedish medium-term note pro-gram of SEK 4 billion (approximately $450 million), 3- to 7-yearnotes have been issued in Euro at an interest rate of 5.9% to6.4% and in SEK at an interest rate of 4.9% to 6.8%. In total$190.8 million of notes, with a remaining maturity of more thanone year, were outstanding at year-end. Commercial paper bor-rowings, in the amount of $369 million outstanding at December31, 2002, are classified as long-term because the Companyintends to refinance these borrowings on a long-term basiseither through continued commercial paper borrowings or uti-lization of available credit facilities. The remaining other long-term debt, $17.8 million, consisted primarily of capital leasingsin various annual installments through 2015.
2002 2001December 31 Amount %1) Amount %1)
Commercial paper (reclass.) $368.8 2.4% $330.0 3.4%Eurobond 265.3 6.5% 265.3 6.5%Revolving credit facility – n/a 200.0 2.3%Medium-term notes 190.8 5.9% 195.9 5.9%Other long-term debt 17.8 4.8% 45.9 3.1%Long-term debt $842.7 4.5% $1,037.1 4.4%1) Weighted average interest rate at December 31
The Company has an $804 million revolving credit facility,(“RCF”), syndicated among 16 banks. The agreement is dividedin two facilities, one of $530 million, maturing in November2005, and one renewable 364-day facility of $274 million. Theoverall commitment of $804 million supports the Company’scommercial paper borrowings as well as being available forother corporate purposes. Borrowings are unsecured and bearinterest based on the relevant LIBOR rate. The Company pays afacility fee based on the unused amount of the RCF. Borrowingsare prepayable at any time and are due at expiration. The facili-ty is subject to financial covenants requiring the Company tomaintain a certain level of debt to earnings and a certain inter-est coverage ratio.
The Company was in compliance with these covenants atDecember 31, 2002. These covenants do not impair the abilityof Autoliv Inc. to make regular quarterly dividend payments or tomeet other expected cash commitments. For a description ofhedging instruments used as part of debt management, see theFinancial Instruments section of Note 1.
In the Company’s financial operations, risk arises in connec-tion with the investment of liquid assets and when entering for-ward exchange agreements, swap contracts or other financial
Notes to Consolidated Financial Statements

38 2002 Autoliv — Driven for Life
instruments. In order to reduce this risk, deposits and financialinstruments can only be entered with a limited number of banksand in limited amounts, as approved by the Company’s Boardof Directors. The policy of the Company is to work with banksthat have a high credit rating and that participate in theCompany’s financing.
Total Fair Mark toDecember 31, 2002 Nominal value MarketEurobond $265.3 $283.3 $(18.0)Interest rate swaps $145.2 12.4 (12.4)Cross currency interest
rate swaps $265.3 (5.3) 5.3 Total $290.4 $(25.1)Medium-term notes $236.4 $241.6 $(5.2)Interest rate swaps $69.8 0.3 (0.3)Cross currency interest
rate swaps $86.5 1.8 (1.8) Total $243.7 $(7.3)Commercial paper $368.8 $368.8 $0.0Interest rate swaps $75.0 1.8 (1.8)Total $370.6 $(1.8)
Note 12. Shareholders’ EquityDividendsDividend declared per share was $.46 and dividend paid pershare was $.44 in 2002. Corresponding amounts in 2001 were$.44 and $.44.
Other comprehensive incomeThe components of other comprehensive income are net of anyrelated income tax effects.
The opening amount of other comprehensive income consist-ed of a negative cumulative translation adjustments of $151.8million and a net loss on cash flow hedge derivatives of $3.8 mil-lion. The ending balance of other comprehensive income con-sisted of negative cumulative translation adjustments of $71.4million and a net loss on cash flow hedge derivatives of $20.6million. The ending balance of the loss on cash flow hedge deriv-atives was net of $11.3 million of deferred taxes. The corre-sponding amount of deferred taxes in 2001 was not significant.
Share Repurchase Program
In May 2000, the Board of Directors authorized a Share Repur-chase Program for up to ten million of the Company’s shares.During 2000, the Company repurchased 4.5 million shares at a
cost of $103 million. There were no repurchases during 2001.During 2002, the Company repurcahsed 1.6 million shares at acost of $30 million.
Shareholder Rights Plan
Autoliv, Inc., has a shareholder rights plan under which eachshareholder of record as of November 6, 1997, received oneright for each share of Autoliv, Inc., common stock held. Eachright entitles the registered holder, upon the occurrence of cer-tain events, to buy one one-hundredth of a share of Series AJunior Participating Preferred Stock with a par value of $1 at aprice of $150, subject to adjustment.
Initially the rights will be attached to all Common StockCertificates representing shares then outstanding and upon theoccurrence of certain events the rights will separate from theCommon Stock, and each holder of a right will have the right toreceive, upon exercise, common stock (or in certain circum-stances, cash, property or other securities of the Company) hav-ing a value equal to two times the exercise price of the right.Autoliv, Inc., may redeem the rights in whole at a price of onecent per right.
Note 13. Supplemental Cash Flow Information
The Company’s non-cash investing and financing activities wereas follows:
2002 2001Acquisitions/Divestitures:Fair value of assets acquired $30.3 $16.2Cash Paid 27.1 15.9Liabilities assumed $3.2 $0.3Payments for interest and income taxes were as follows:
2002 2001 2000Interest $54 $58 $54Income taxes $54 $52 $110
Note 14. Stock Incentive Plan
Under the Autoliv, Inc. 1997 Stock Incentive Plan (the “Plan”)adopted by the Company, and amended in 1999, awards havebeen made to selected executive officers of the Company andother key employees in the form of stock options. All options aregranted for 10 year terms, have an exercise price equal to thestock market price on the date of grant, and become exercisableafter one year of continued employment following the grant date.The Plan provides for the issuance of up to 3,085,055 common
Notes to Consolidated Financial Statements
Debt profileFair value on
Principal (notional) amount by expected maturity December 31Weighted average interest rate 2003 2004 2005 2006 2007 Thereafter Total 2002Overdraft/Other short-term debt $46.8 $46.8 $46.8
(Weighted average interest rate 3.5%)Commercial paper 1) $368.8 368.8 370.6
(Weighted average interest rate 2.4%)Eurobond $265.3 265.3 290.4
(Weighted average interest rate 6.5%)Medium-term notes 2) 45.6 $29.1 110.7 22.7 $28.3 236.4 243.7
(Weighted average interest rate 5.9%)Other long-term loans, incl current portion 3) 30.5 5.3 4.6 1.3 $1.0 5.6 48.3 48.3
(Primarily fixed rates)Total debt $122.9 $34.4 $484.1 $289.3 $1.0 $33.9 $965.6 $999.81)Interest rates will change as rollovers occur prior to final maturity. 2) These borrowings are specified together with the related swaps. In the table below the fair values of therespective instrument types in relation to interest rates are detailed. 3) Primarily denominated in JPY and Euro.

392002 Autoliv — Driven for Life
shares for awards under the Plan. In December 2000, theCompensation Committee of the Board of Directors of theCompany made an offer (the “Offer”) to the recipients of all out-standing stock option grants made under the Plan in 1997, 1998and 1999. In exchange for the irrevocable cancellation of theseoutstanding options, a promise was made to: (a) transfer to theoptionees a number of the Company’s shares (Restricted StockUnits or “RSU’s”) representing 30% of the number of options can-celed and; (b) grant to the optionees on June 18, 2001, in accor-dance with normal terms and conditions of the Plan, a number ofstock options equal to 20 % of the number of options canceled.The RSU’s carry a Date of Promise of December 15, 2000, and a Dateof Vesting of December 15, 2003. Under the Offer, 920,165 optionswere canceled. Under the terms of the Offer, RSU’s representing276,050 of the Company’s shares were issued and 151,626 optionswere granted in June 2001. The RSU’s had a weighted average fairvalue of $14.94 on the grant date. During 2002, 7,977 shares wereissued to retirees and 4,026 RSU’s were canceled. During 2001,45,130 shares were issued to retirees and 6,632 RSU’s were can-celed. At December 31, 2002, 212,285 RSU’s remain outstanding.
The Company applies APB Opinion 25 “Accounting for StockIssued to Employees” and related interpretations in accounting forits stock option plan. Accordingly, no compensation cost for stockoption grants has been recognized in the Company’s financialstatements. The Company is, however, recording compensationexpense of approximately $4 million for the RSU’s over the servicelives of the employees during the three year vesting period.
Had compensation cost for all of the Company’s stock-based com-pensation awards been determined based on the fair value of suchawards at the grant date, consistent with the methods of FAS-123Accounting for Stock-Based Compensation, the Company’s total andper share net income would have been as follows:
2002 2001 2000Net income as reported $180.5 $47.9 $168.7Add: Compensation under fair value
method included in Net income,net of tax 0.8 1.2 -
Deduct: Compensation under fairvalue method for all awards, netof tax (4.9) (2.8) (3.4)
Net income pro-forma $176.4 $46.3 $165.3Earnings per share:
As reported $1.84 $.49 $1.67Pro-forma $1.80 $.47 $1.64
No options were granted during 2000. Instead, options weregranted in December 1999, as part of 2000 compensation forkey employees. The weighted average fair value of optionsgranted during 2002 and 2001 was estimated at $5.23 and$4.79, using the Black-Scholes option-pricing model based onthe following assumptions:
2002 2001Risk-free interest rate 4.5% 4.7%Dividend yield 2.5% 2.0%Expected life in years 5 5Expected volatility 30.0% 30.0%
Information related to the Company’s stock option plan during theperiod 1999 to 2002 is as follows:
Number of Weighted averageshares exercise price
Outstanding at Dec. 31, 1999 1,130,737 $31.84Exercised (6,416) 15.58Canceled (31,770) 32.25 Canceled under the Offer (920,165) 32.23 Outstanding at Dec. 31, 2000 172,386 $30.30Granted 661,946 17.00Exercised (1,237) 15.58Canceled (73,120) 33.77Outstanding at Dec.31, 2001 759,975 $18.41Granted 552,050 19.96Exercised (47,826) 16.66Canceled (64,817) 20.26Outstanding at Dec. 31, 2002 1,199,382 $19.09
Options exercisable Dec. 31, 2000 172,386 $30.30Options exercisable Dec. 31, 2001 99,229 $27.77Options exercisable Dec. 31, 2002 655,832 $18.37
Note 15. Contingent Liabilities
The Company is subject to claims and legal proceedings thatarise in the ordinary course of business, principally related toalleged defects in products manufactured by the Company. TheCompany diligently defends itself in such actions and, in addition,carries insurance coverage, to the extent reasonably available,against insurable risks. The Company believes, based on current-ly available information, that the resolution of outstanding claims,after taking into account available insurance coverage and provi-sion for product recalls, should not have a material effect on theCompany’s financial position or results of operations.
Note 16. Lease Commitments
The Company leases certain offices, manufacturing andresearch buildings, machinery, automobiles and data process-ing and other equipment. Such operating leases, some of whichare non-cancelable and include renewals, expire at variousdates through 2019. The Company pays most maintenance,insurance and tax expenses relating to leased assets. Rentalexpense for operating leases was $17.5 million for 2002, $17.1million for 2001 and $19.0 million for 2000.
At December 31, 2002, future minimum lease payments fornon-cancelable operating leases total $66.1 million and are
Notes to Consolidated Financial Statements
The following summarizes information about stock options outstanding on December 31, 2002
Weighted averageNumber remaining contract life Weighted average Number Weighted average
Range of exercise prices outstanding (in years) exercise price excercisable exercise price
$16.99 - $19.96 1,124,745 8.72 $18.43 581,195 $17.01$24.38 - $29.37 45,315 2.32 26.40 45,315 26.40$31.07 - $38.25 29,322 4.30 33.10 29,322 33.10
1,199,382 8.37 $19.09 655,832 $18.37

40 2002 Autoliv — Driven for Life
payable as follows (in millions): 2003: $15.7; 2004: $12.0; 2005:$9.1; 2006: $4.1; 2007: $2.9; 2008 and thereafter: $22.3.
Note 17. Retirement Plans
PensionsMost of the Company’s non-U.S. employees are covered bygovernment sponsored pension and welfare programs. Underthe terms of the programs, the Company makes periodic pay-ments to various government agencies. In addition, in somecountries the Company sponsors or participates in certain otherbenefit plans. Contributions to these non-governmental plansfor the years ended December 31, 2002, 2001, and 2000 were$11.1 million, $11.0 million and $10.9 million, respectively.
The Company has non-contributory defined benefit pension planscovering most U.S. employees. Benefits are based on an average ofthe employee’s earnings in the years preceding retirement and oncredited service. Certain supplemental unfunded plan arrangementsalso provide retirement benefits to specified groups of participants.
The funding policy for U.S. plans is to contribute amounts suffi-cient to meet the minimum funding requirements of the EmployeeRetirement Income Security Act of 1974, as amended, plus anyadditional amounts which may be determined to be appropriate.
The components of net benefit cost associated with U.S. non-contributory defined benefit retirement plans are as follows:
2002 2001 2000Service cost $10.0 $8.4 $7.0Interest cost 5.8 5.4 4.9Expected return on plan assets (4.1) (4.4) (4.5)Amortization of unrecognized
net loss 0.3 0.3 0.3Benefit cost $12.0 $9.7 $7.7
The changes in benefit obligations and plan assets for the U.S.non-contributory defined benefit plans for the periods endedDecember 31, are as follows:
2002 2001Projected benefit obligation at
beginning of year $83.9 $76.0Service cost 10.0 8.4Interest cost 5.8 5.4Actuarial (gain) loss 4.0 0.6Benefit payments (3.7) (6.5)Project benefit obligation at year end $100.0 $83.9Fair value of plan assets at
beginning of year $42.8 $45.6Actual return on plan assets (6.8) (2.4)Company contributions 7.9 6.1Benefit payments (3.7) (6.5)Fair value of plan assets at year end $40.2 $42.8
Funded status of the plan $(59.8) $(41.1)Unrecognized net actuarial loss 23.3 8.5Unrecognized prior service cost 2.6 2.8Accrued retirement benefit cost
recognized in the balance sheet $(33.9) $(29.8)
The weighted averages of assumptions used by the non-con-tributory defined benefit plans are as follows:
% 2002 2001 2000Discount rate 6.75 7.25 7.50Rate of increases in
compensation level 5.00 5.25 5.25Expected long-term
rate of return on assets 9.50 9.50 9.50
The assets of the U.S. plans are invested primarily in equitiesand bonds.
Postretirement Benefits Other than PensionsThe Company currently provides postretirement health care andlife insurance benefits to most of its U.S. retirees. In general, theterms of the plans provide that U.S. employees who retire afterattaining age 55, with five years of service, are eligible for con-tinued health care and life insurance coverage. Dependenthealth care and life insurance coverage are also available. Mostretirees contribute toward the cost of health care coverage withthe contributions generally varying based on service. In June1993, a provision was adopted which caps the level of theCompany’s subsidy at the amount in effect as of the year 2000for most U.S. employees who retire after December 31, 1992.
At present, there is no prefunding of the postretirement bene-fits recognized under FAS-106. The changes in benefit obliga-tions and plan assets for the U.S. postretirement benefit plan asof December 31 are as follows:
2002 2001Projected benefit obligation at
beginning of year $12.3 $11.2Service cost 1.1 0.9Interest cost 0.8 0.7Actuarial (gain) loss (0.8) (0.4)Benefit payments (0.3) (0.1)Project benefit obligation at year end $13.1 $12.3
Fair value of plan assets at beginning of year $ – $ –Company contributions 0.3 0.1Benefit payments (0.3) (0.1)Fair value of plan assets at year end $ – $ –
Funded status of the plan $(13.1) $(12.3)Unrecognized net actuarial (gain) loss (2.4) (1.7)Accrued postretirement benefit cost
recognized in the balance sheet $(15.5) $(14.0)
For measurement purposes, the assumed annual rate ofincrease of per capita cost of health care benefits was 10% for2002 and assumed to grade to 5% in 2012 and remain constantthereafter. As noted above, for U.S. employees retiring afterDecember 31, 1992, the Company’s policy is to increase retireecontributions so that the annual per capita cost contributionremains constant at the level incurred in the year 2000.
The weighted average discount rate used in determining theaccumulated post retirement benefit obligation was 6.75% atDecember 31, 2002, 7.25% at December 31, 2001, and 7.50%at December 31, 2000.
A one percent increase in the annual health care cost trendrates would have had no significant impact on the Company’snet periodic postretirement health care benefit cost for the cur-rent period or on the accumulated postretirement benefit oblig-ation at December 31, 2002.
The components of net benefit cost associated with thepostretirement benefit plan are as follows:
Notes to Consolidated Financial Statements

412002 Autoliv — Driven for Life
Period ended December 31 2002 2001 2000Service cost $1.1 $0.9 $0.9Interest cost 0.8 0.7 0.7Actuarial gain (0.1) (0.1) -Benefit cost $1.8 $1.5 $1.6
Note 18. Segment InformationAutoliv, Inc. is a U.S. registered company providing advanced tech-nology products for the automotive market. Airbag modules, seatbelts and inflators for airbags are supplied to all major European,U.S. and Asian automobile manufacturers. Seat belts and airbagsare considered as integrated safety systems that should functiontogether under common electronic control systems for the protec-tion of occupants in motor vehicles. The Company’s revenues aregenerated by sales to the automotive industry, which is made up ofa relatively small number of customers. A significant disruption inthe industry, a significant change in demand or pricing or a dra-matic change in technology could have a material adverse effect onthe Company. Sales to individual customers representing 10% ormore of net sales were in 2002: 23%, 15%, and 13%, in 2001:20%, 14%, 12%, in 2000: 20%, 13%, 12% and 11%.
The Company has concluded that its operating segmentsmeet the criteria, stated in FAS-131 “Disclosures aboutSegments of an Enterprise and Related Information”, for aggre-gation for reporting purposes into a single operating segment.
Net sales 2002 2001 2000United States $1,598 $1,464 $1,562Europe 2,344 2,121 2,162Other regions 501 406 392Total $4,443 $3,991 $4,116
Long-lived assets 2002 2001 2000United States $1,907 $1,988 $2,060Europe 631 481 505Other regions 203 170 154Total $2,741 $2,639 $2,719
The Company’s operations are located primarily in Europe andthe United States. Exports to other regions amounted toapproximately $472 million in 2002. The long-lived assets in theU.S. include $1,591 million of intangible assets, principally fromacquisition goodwill. The Company has attributed net sales tothe geographic area based on the location of the entity sellingthe final product.
Sales by product 2002 2001 2000Airbags and associated products1) $3,160 $2,817 $2,934Seat belts and associated products2) 1,283 1,174 1,182Total $4,443 $3,991 $4,1161)Includes sales of steering wheels 2)Includes sales of seat components
Notes to Consolidated Financial Statements
Foreign Exchange Rates (unaudited)The balance sheets of non-U.S. subsidiaries have been converted into dollars using the year-end rates of exchange. Income state-ments have been converted using the average rates of exchange for the year. The rates for the most important currencies are:
2002 2002 2001 2001 2000 2000Average Year end Average Year end Average Year end
EUR 0.941 1.042 0.896 0.883 0.924 0.929AUD 0.542 0.564 0.518 0.509 0.583 0.554GBP 1.498 1.603 1.441 1.451 1.517 1.491SEK 0.103 0.113 0.097 0.094 0.110 0.105JPY/1000 7.972 8.380 8.238 7.617 9.314 8.721
The Euro is the most representative currency for the Company in Europe. The Euro, at average rates, translated into 5.0% more dol-lars in 2002 compared to 2001. From year-end 2001 to year-end 2002, the Euro increased by 18.0% compared to the dollar.
Note 19. Quarterly Financial Data (unaudited)Q1 Q2 Q3 Q4 Year
2002Net sales $1,029.0 $1,169.1 $1,066.5 $1,178.8 $4,443.4Gross profit 189.0 215.1 192.5 214.2 810.8Income before taxes 62.0 82.3 65.7 76.7 286.7Net income 39.0 52.5 41.4 47.6 180.5Earnings per share $.40 $.53 $.42 $.49 $1.84
2001Net sales $1,080.6 $1,032.9 $907.7 $969.8 $3,991.0Gross profit 185.6 182.6 116.11) 170.5 654.8Income before taxes 39.6 55.6 (26.9)1) 48.5 116.8Net income 20.8 30.0 (29.5)1) 26.5 47.9Earnings per share $.21 $.31 $(.30)1) $.27 $.491) In the third quarter of 2001, Unusual Items reduced gross profit by $46.1 million, income before taxes by $65.3 million, net income by $46.8 million and earnings per share by $.48.See Note 10 for further details.
2001 Pro-Forma effect of FAS-142 Q1 Q2 Q3 Q4 YearIncome before taxes $52.5 $68.5 $(14.0) $61.4 $168.4Net income 33.7 42.9 (16.6) 39.4 99.5Earnings per share $.34 $.44 $(.17) $.40 $1.02

42 2002 Autoliv — Driven for Life
The Board of Directors and Shareholders of Autoliv, Inc.
We have audited the accompaning consolidated balance sheets of Autoliv, Inc. with subsidiaries as of December 31, 2002 and2001, and the related consolidated statements of income, shareholders’ equity, and cash flows for the years then ended. Thesefinancial statements are the responsibility of the Company’s management. Our responsibility is to express an opinion on these finan-cial statements based on our audits.
We conducted our audits in accordance with auditing standards generally accepted in the United States. Those standards requirethat we plan and perform the audit to obtain reasonable assurance about whether the financial statements are free of material mis-statements. An audit includes examining, on a test basis, evidence supporting the amounts and disclosures in the financial state-ments. An audit also includes assessing the accounting principles used and significant estimates made by management, as well asevaluating the overall financial statement presentation. We believe that our audits provide a reasonable basis for our opinion.
In our opinion, the financial statements referred to above present fairly, in all material respects, the consolidated financial position ofAutoliv, Inc. and subsidiaries as of December 31, 2002 and 2001, and the consolidated results of its operations and its cash flows foreach of the three years then ended in conformity with accounting principles generally accepted in the United States.
As discussed in Note 1 to the Consolidated Financial Statements, in 2002 the Company changed its method of accounting for goodwill.
Ernst & Young AB
Torbjörn HansonStockholm, SwedenJanuary 21, 2003
Capital employedTotal shareholders’ equity and net debt.
Capital expendituresInvestments in property, plant and equip-ment.
Cash flow per shareNet cash before financing excludingacquisitions in relation to weighted aver-age numbers of shares (net of Treasuryshares) assuming dilution.
Days inventory outstandingOutstanding inventory at averageexchange rates relative to average dailysales.
Days receivables outstandingOutstanding receivables at averageexchange rates relative to average dailysales.
Earnings per shareNet income (loss) relative to weightedaverage number of shares (net ofTreasury shares) assuming dilution.
Equity ratioShareholders’ equity relative to totalassets.
Interest coverage ratioIncome before taxes, plus interestexpense, relative to interest expense.
Gross marginGross profit relative to sales.
Net debtShort- and long-term interest bearing lia-bilities less cash and cash equivalents.
Net debt equity ratioNet debt relative to shareholders’ equity.
Net debt to capitalizationNet debt in relation to total shareholders’equity (including Minority) and net debt.
Operating marginOperating income relative to sales.
Pretax marginIncome before taxes relative to sales.
Return on capital employedIncome before financial items relative toaverage capital employed.
Return on shareholders’ equityNet income relative to average share-holders’ equity.
Definitions
Report of Independent Auditors

432002 Autoliv — Driven for Life
Selected Financial Data
2002 2001 20011) 2000 20002) 1999 19992) 1998 19982)
(Dollars in millions, except per share data)
Sales and IncomeNet sales $4,443 $3,991 $4,116 $3,812 $3,489Operating income 331 174 $291 340 $389 369 $416 354 $397Income before taxes 287 117 234 291 340 330 377 312 355Net income 181 48 146 169 218 200 247 188 232
Financial positionCurrent assets excluding cash 1,452 1,281 1,267 1,062 1,013Property, plant and equipment 917 845 867 835 869Intangible assets (primarily goodwill) 1,690 1, 685 1,739 1,596 1,649Non-interest bearing liabilities 1,241 995 1,045 992 986Capital employed 2,911 2,898 2,919 2,527 2,549Net debt 864 1,023 1,009 596 703Shareholders’ equity 2,047 1,875 1,910 1,931 1,846Total assets 4,295 4,004 4,068 3,647 3,668Long-term debt 843 1,037 737 470 629
Per share data Earnings per share3) 1.84 .49 1.49 1.67 2.16 1.95 2.41 1.84 2.26Cash flow per share3) 2.97 .10 .48 2.19 .34Equity per share 21.25 19.14 19.49 18.9 18.0Cash dividend declared per share .46 .44 .44 .44 .44Number of shares outstanding (million)4) 96.3 98.0 97.8 102.3 102.3
RatiosGross margin (%) 18.2 16.4 17.6 19.1 21.2 21.4Operating margin (%) 7.4 4.4 7.3 8.2 9.5 9.7 10.9 10.2 11.4Pretax margin (%) 6.5 2.9 5.9 7.1 8.3 8.6 9.9 9.0 10.2Return on capital employed (%) 12 6 10 12 14 15 16 14 16Return on shareholders’ equity (%) 9 3 8 9 11 11 13 11 13Equity ratio (%) 48 47 47 53 50Net debt to equity ratio (%) 42 55 53 31 38Net debt to capitalization (%) 29 35 34 24 27Interest coverage ratio 6.2 2.8 4.5 5.9 6.7 7.4 8.3 6.8 7.6Days receivables outstanding 78 79 76 72 72Days inventory outstanding 31 32 31 28 28
Other dataSeat belt sales incl. seat components 1,283 1,174 1,182 1,097 1,072Airbag sales, incl. steering wheels 3,160 2,817 2,934 2,715 2,417Net cash provided by operating activities 509 266 266 436 314Capital expenditures 228 248 235 258 285Net cash used in investing activities (240) (270) (428) (255) (309)Net cash provided by (used in) financing activities (257) 10 131 (172) (45)Number of employees, December 31 30,100 28,300 28,000 22,580 20,670
1) Adjusted for the effect of the accounting principle FAS-142, which became effective in 2002 and that abolishes the requirement for annual goodwill amortization and adjusted for Unusual Itemsof $65.3 million. See Note 10 for further details of the Unusual Items. 2)Adjusted for the effect of the new accounting principle, FAS-142. 3)There is no difference between basic and dilutive pershare amounts. 4)At year-end, net of Treasury shares.

44 2002 Autoliv — Driven for Life
Board of Directors
S. JAY STEWART 1, 2, 3 , 4
Chai rmanBorn 1938Director s ince 1989Elected unt i l 2005Former Chai rman and ChiefExecut ive Off icer of MortonInternat ional Inc. D i rector ofHousehold Internat ional Inc. and of Box USA Corp.B.Sc. and MBAShares: 76,532
LARS WESTERBERGPres ident & Chief Execut ive Off icer Born 1948Director s ince 1999Elected unt i l 2004Chai rman of Ahlse l l AB. Di rector ofP lasta l AB.B.Sc. and MBAShares: 19,000Restr ic ted stock un i ts : 13,500Stock opt ions: 99,000
PER-OLOF ARONSON 1, 2, 3 , 4
Born 1930Director s ince 1994Elected unt i l 2004Former Vice Chai rman. Pres ident andChief Execut ive Off icer of SAPA AB(Gränges AB)Graduate Engineer,Shares: 6 ,867
WILHELM KULLBorn 1936Director s ince 1997Elected unt i l 2005Former Vice Pres ident IT and FormerChief F inancia l Off icerMBAShares: 5 ,306
WALTER KUNERTH 1, 3, 4
Born 1940Director s ince 1998Elected unt i l 2004Senior Advisor to Lazard & Co.Former Member of S iemens ’Corporate Execut ive Board andPres ident of S iemens ’ Automot iveSystems Group. Di rector of theSuperv isory Board of Gi ldemeisterAG. Chai rman of the Superv isoryBoard of Bas ler AG, Gö tz AG,Paragon AG and Suspa GmbH. M.Sc, Honorary Professor
TETSUO SEKIYA 1, 3, 4 , 5
Born 1934Director s ince 2001Elected unt i l 2003Chai rman of NSK Ltd. Vice Chai rmanof the suppl ier counci ls of Toyotaand Nissan.B.Sc. in Economics.Shares: 1 ,500
JAMES M. RINGLER 1, 2, 4
Born 1946Director s ince 2002Elected unt i l 2003Vice Chai rman of I l l ino is Tool WorksInc. Former Chai rman, Pres ident andChief Execut ive Off icer of PremarkInternat ional Inc. D i rector of DowChemical Company, FMC TechnologiesInc. and CPC Corporat ionMBA, B.Sc.
PER WELIN 1, 2, 3 , 4 , 5
Born 1936Director s ince 1995Elected unt i l 2003Chai rman of L-E Lundberg-fö retagenAB. Di rector of A l lgon AB andHolmen AB. Techn L ic and MBAShares: 2 ,867
ROGER W. STONE 1, 2 , 4
Born 1935Director s ince 1989Elected unt i l 2005Chai rman and Chief Execut ive Off icerof Box USA Corp. Former Pres identand Chief Execut ive Off icer ofSmurf i t -Stone Conta iner Corporat ion.Di rector of McDonald ’s Corporat ion. B.Sc.Shares: 4 ,401
DIONISIO GARZA MEDINA 1, 2 , 4
Born 1954Director s ince 2002Elected unt i l 2004Chai rman and Chief Execut ive Off icerof ALFA. Di rector of Cornex, Vi t ro ,Cydsa and Seguros Commerc ia lAmé r ica. Member of the AdvisoryCommit tee of the New York StockExchange.MBA and M.Sc. in Industr ia lEngineer ing
1 Nominating and Corporate Governance Committee 2 Compensation Committee 3 Audit Committee 4 Qualifies as independent director 5 Qualifies as audit committee financial expert“Director since” includes time as Director of Autoliv AB and Morton International, Inc. For information on restricted stock units and options refer to Note 14 on page 38 and forwork of the Board to the proxy statement which is distributed to Autoliv's shareholders with this annual report.

452002 Autoliv — Driven for Life
Senior Management
LEIF BERNTSSONVice Pres ident Qual i tyBorn 1955. Employed 1988Shares: 200 Restr ic ted stock un i ts : 7 ,887Stock opt ions: 25,258
DR. YNGVE HÅLANDVice Pres ident ResearchAssociate ProfessorBorn 1945. Employed 1984Restr ic ted stock un i ts : 5 ,392Stock opt ions: 21,895
BENO ÎT MARSAUDVice Pres ident Manufactur ingBorn 1952. Employed 1980Restr ic ted stock un i ts : 5 ,046Stock opt ions: 23,364
HALVAR JONZONVice Pres ident Purchas ingBorn 1950. Employed 2001Stock opt ions: 10,710
LARS SUNDBERGChief In format ion Off icerBorn 1949. Employed 2001Stock opt ions: 9 ,800
LARS WESTERBERGPres ident & Chief Execut iveOff icerBorn 1948. Employed 1999Shares: 19,000Restr ic ted stock un i ts : 13,500Stock opt ions: 99,000
HANS-GÖRAN PATRINGVice Pres ident HumanResourcesBorn 1949. Employed 2002Stock opt ions: 12,910
“Employed” may a lso refer to the f i rs t year of employment wi th the Auto l iv AB Group. For in format ion on rest r ic tedstock un i ts and opt ions, re fer to Note 14 on page 38.
MATS ÖDMANDirector CorporateCommunicat ionsBorn 1950. Employed 1994Shares: 400 Restr ic ted stock un i ts : 5 ,302Stock opt ions: 18,135
JAN OLSSONVice Pres ident Engineer ingBorn 1954. Employed 1987Restr ic ted stock un i ts : 4 ,357Stock opt ions: 21,205
MAGNUS LINDQUISTVice Pres identChief F inancia l Off icerBorn 1963. Employed 2001Stock opt ions: 20,000
JÖRGEN SVENSSONVice Pres ident Legal Affa i rs ,Genera l Counsel and SecretaryBorn 1962. Employed 1989Restr ic ted stock un i ts : 7 ,887Stock opt ions: 25,558
SEATED FROM LEFTSTANDING FROM LEFT

46 2002 Autoliv — Driven for Life
2,000
4,000
6,000
8,000
10,000
12,000
14,000
16,000
18,000
20,000
10
20
30
40
50
60
70
97 98 99 00 01 02 03
(c) SI X
US$
S T O C K P R I C E A N D T R A D I N G V O L U M E O N N Y S E
High and low paid/month
S&P 500 Index S&P Auto Parts IndexTraded volume permonth, in thousands
Market DevelopmentThe original Autoliv stock, which was aSwedish security, was introduced onthe Stockholm Stock Exchange onJune 9, 1994, at an offering price ofSEK90 (approx. US $10) for institutionsand SEK85.50 for private individuals.Following the merger with Morton ASP,the shares in the new Autoliv company,which is a U.S. legal entity incorpora-ted in Delaware, were listed on the NewYork Stock Exchange (NYSE) under thesymbol ALV and the SwedishDepository Receipts (SDR) on the OM-Stockholm Stock Exchange under thesymbol ALIV.
In Stockholm, Autoliv’s security star-ted by outperforming the market,reaching its all-time high at SEK349 onMarch 6, 1997. After having declined toSEK137.50 on January 4, 2001, theAutoliv SDR recovered to SEK 268 onMarch 11, 2002, and then fell back toSEK178.50 at the end of the year as aneffect of the generally weak market.However, the decline for the AutolivSDR was 15% during the full year of2002 compared to a drop of 35% forthe composite index in Stockholm. Asa result, Autoliv’s long-term perform-ance tracks once again above thegeneral market index at the beginningof 2003.
Trading in the securities of the newAutoliv company began on the NYSEon May 1, 1997, when the shares of thecommon stock closed at $35.50, and inStockholm on May 2, when the SDRclosed at SEK 274. The Autoliv Inc.stock has followed its peer group in theS&P Auto Parts Index relatively closely,and hit its all-time high on September19, 1997, at $45.13 and reached itslowest level on September 21, 2001, at$13.25. In 2000, the Autoliv share de-clined more than the index. In 2002,however, when the S&P Auto PartsIndex dropped by 18%, the Autolivshare closed at $20.93 marginally high-er than the $20.31 it opened at. Theserelatively large swings of the Autolivshare could be due to currencyexchange rates. In 2000 and 2001, theEuro – to which Autoliv is more expo-sed than any of the companies in S&PAuto Parts Index – declined and, in2002, recovered to nearly the samelevel as at the beginning of 2000.
During 2002, the Autoliv share hit itshighest price on March 8 at $22.65 andits lowest on October 9 at $17.20.
Shareholder Information
High and low paid/month
Composite index
Traded volume per month, in thousands(incl. aftermarket trading)
(c) SIX
S T O C K P R I C E A N D T R A D I N G V O L U M E I N S T O C K H O L MRestated for a 2:1 split in 1996
5,000
10,000
15,000
20,000
25,000
80
120
160
200
240
280
320
360
400
440
94 95 96 97 98 99 00 01 02 03
SEK
THE LARGEST SHAREHOLDERS* Number PercentageCountry of shares of equity
Templeton U.S.A. 13,400,848 13.9TIAA-CREF U.S.A. 9,418,139 9.8Alliance Capital Mgmt U.S.A. 4,514,569 4.7Harris Associates. U.S.A. 3,709,500 3.9AXA financial Inc U.S.A. 3,700,426 3.8Robur Funds Sweden 3,524,966 3.7Management and Directors as a group** 404,908 0.460,000 other shareholders 57,671,380 59,8Total December 31, 2002 96,344,736 100.0
* Known to the Company ** Incl. 287,835 shares issuable upon exercise of options exercisable within 60 days

472002 Autoliv — Driven for Life
The daily average trading volume in NewYork increased by 37% in 2002 to141,600 after having doubled in 2001. InStockholm, the average trading volumedeclined by 9% to 435,000. The AutolivSDR was the 24th most-highly-tradedsecurity in Stockholm, accounting for0.9% of the trading compared to the 26thand 0.6%, respectively, during 2001.
Number of SharesDuring 2002, the number of shares out-standing decreased by approximately1.6 million to 96.3 million due to a reac-tivation of Autoliv’s share repurchaseprogram. The outstanding quantity canbe reduced by another 3.9 millionshares. This program adopted in May2000 allowed for the repurchase of atotal of 10 million shares. The repur-chased shares are not retired but heldas treasury stock.
The current number of outstandingshares could increase by 1.4 million ifall outstanding stock options are exer-cised and all restricted stock unitsgranted. For additional information seeNote 14 on page 38.
Shareholder Rights PlanAutoliv has adopted a ShareholderRights Plan designed to encouragethird parties interested in acquiring acontrolling block of shares in theCompany to negotiate with the Board topreserve the best interest of all Autolivshareholders (see Note 12 on page 38).
DividendIf possible, quarterly dividends are paidon the first Thursday in the last month ofeach quarter.
The record date is usually one monthearlier and the ex-date typically two daysbefore the record date. Quarterly divi-dends are declared separately by theBoard, announced in press releases andpublished on Autoliv’s home page.
The quarterly dividend will be raised by18% to 13 cents per share, starting withthe payment in March 2003.
ShareholdersAutoliv estimates that half of the sharesin the Company are held in the U.S.and a quarter of the shares in Sweden.
Most of the remaining shares are heldin the U.K and central Europe.
The number of shareholders is esti-mated to exceed 60,000. The largestshareholders known to the Companyare shown on the previous page.
Shareholder Information
Annual General MeetingAutoliv’s next Annual General Meetingof Shareholders will be held onTuesday April 29, 2003, at Bank One, 1 Bank One Plaza, 57th floor, Chicago,Illinois 60602, USA.
Shareholders are urged to return theirproxies whether or not they plan toattend the meeting.
Stock Transfer Agent & RegistrarEquiServe Trust Company, N.A. P.O. Box 43069Providence, RI 02940+1 (800) 446-2617 (within the U.S.)+1 (781) 575-2723 (outside the U.S.)+1 (800) 952-9245 (hearing impaired)Internet: www.equiserve.com
ANALYSTS
The following banks and securities bro-kers follow Autoliv on a regular basis.• Alfred Berg• BNP• Börsinsikt• Carnegie• Cheuvreux (Credit Agricole Indosuez)• CSFB• Deutsche Bank• Enskilda Securities• Goldman Sachs• Handelsbanken• Hagströmer & Qviberg• JP Nordiska• Julius Bär• Morgan Stanley• Schroder Salomon Smith Barney• SwedBank• UBS Warburg
Corporate GovernanceAutoliv has adopted a Code of Ethicsfor Principal Executive Officers andPrincipal Financial Officers. Autoliv hasalso adopted Corporate GovernanceGuidelines and a Standard of BusinessConduct and Ethics, which includesAutoliv’s Social Policy.
The Board has determined that themajority of the Board Members qualifyas “independent” under applicablerules and regulations.
The Board has further determined thatMessrs. Welin and Sekiya, who are mem-bers of the Audit Committee of theBoard, qualify as “financial experts”.
All members of the standing committ-tees of the Board (i.e. the AuditCommittee, the Compensation Com-mittee and the Nominating andCorporate Governance Committee)qualify as independent directors.
The Codes, Guidelines and CommitteeCharters are available on the internet athttp://www.autoliv.com/policies.
The independent non-managementdirectors will meet at least four times peryear. Any interested party who desires tocommunicate with the non-manage-ment directors regarding Autoliv can doso at the following address: Non-Management Directorsc/o Vice President Legal AffairesAutoliv, Inc.Box 703 81SE-107 24 Stockholm, SwedenTel. +46 (8) 58 72 06 08Fax. +46 (8) 58 72 06 33e-mail: [email protected]
Investor RequestsNorth AmericaAutoliv North America.1320 Pacific Drive,Auburn Hills, MI 48326-1569, USATel +1 (248) 475-0407 Fax +1 (248) [email protected]
Rest of the worldAutoliv Inc.Box 70381, SE-107 24 Stockholm,SwedenTel +46 (8) 58 72 06 23Fax +46 (8) 411 70 [email protected]
Financial InformationJanuary–March April 24, 2003April–June July 17, 2003July–September October 16, 2003October–December January 22, 2004Annual Report March 2004
Autoliv’s reports, news releases, proxystatements and other general informa-tion on Autoliv are published in Englishand Swedish and can be obtained with-out charge upon request from Autoliv atthe addresses given above.
SEC FilingsThe filings with the Securities &Exchange Commission (SEC) ofAutoliv’s annual, 10-K report, quarterlyreports in the form of 10-Q reports,proxy statements, managements certi-fications and other documents canalso be obtained free of charge fromthe Company at the addresses statedabove, but only in English.
These documents are also availableat SEC’s web site http://www.sec.govand at http://www.autoliv.com.

Autoliv Inc. Box 70381, SE-107 24 Stockholm, Sweden / World Trade Center, Klarabergsviadukten 70, Section E.Tel: +46-8-587 206 00, Fax: +46-8-411 70 25, www.autoliv.com, [email protected]
Every year, Autoliv's products save over 10,000 lives and preventten times as many severe injuries.
Autol iv - Dr iven for L i fe


