Embed Size (px)
Citation preview

Annual report 2015–16
www.qao.qld.gov.au LinkedIn: Queensland Audit Office September 2016

Contact
Queensland Audit Office
Level 14, 53 Albert St, Brisbane Q 4000
PO Box 15396, City East Qld 4002
Tel: (07) 3149 6000
Email: [email protected]
Accessibility
We are committed to providing accessible
services to Queenslanders from all culturally
and linguistically diverse backgrounds. If you
have difficulty understanding this report, you
can contact us on (07) 3149 6000 and we will
arrange an interpreter to effectively
communicate the report to you.
Licence
© The State of Queensland (Queensland Audit
Office) 2016.
The Queensland Government supports and
encourages the dissemination of its information.
The copyright in this publication is licensed
under a Creative Commons Attribution (CC BY)
3.0 Australia licence.
To view this licence visit
https://creativecommons.org/licenses/by/3.0/au/
Under this licence, you are free to copy,
communicate and adapt this annual report, as
long as you attribute the work to the State of
Queensland (Queensland Audit Office).
Attribution
Content from this work should be attributed as:
The State of Queensland (Queensland Audit
Office) Annual Report 2015–16, available under
CC BY 3.0 Australia

About this report
This report covers the activities of the Queensland Audit Office
(QAO) for the reporting period from 1 July 2015 to 30 June
2016.
The content in this report differs from previous reports as we
have applied the integrated reporting framework, as published
by the International Integrated Reporting Council, for the first
time. We use this framework to better inform our readers of the
most important aspects of our organisation, its performance,
and our ongoing sustainability.
This report provides a comprehensive view of how QAO
operates to create value, reporting against our published
strategy and performance measures.
The general purpose financial statements within this report were
prepared in accordance with Australian Accounting Standards
and Interpretations, the Treasurer’s Minimum Reporting
Requirements, and other authoritative pronouncements.
There were no significant changes to the accounting policies or
the disclosure requirements impacting on the 2015–16 financial
year. However, a number of new or revised accounting
standards, as disclosed in note 1 of the financial statements,
are of relevance and will impact the financial statements for the
next financial year and beyond.
This report is available online at
www.qao.qld.gov.au/about/ourperformance

Contents Auditor-General’s report 1
Highlights 2
Organisational overview 3
Material issues 4
Our strategy 5
Our business model 7
Our performance 9
Risks and opportunities 11
Services to our clients 12
Client fees — cost of financial audits 13 Understanding the client context 14 Data security — handling client data 15 Benefits from audit services 16 Parliamentary funding 18
Improving our services 20
Audit quality and capability 21 Benefits from audit analytics 22 Independence and mandate 23
How we operate 24
Our people 25 Our governance 27 Stakeholder engagement 29 Workload and health 30
Financial and performance statements 32
Financial statements 33 Certificate of the Queensland Audit Office 52 Independent Audit Report 53 Performance statement 55 Certificate of the Queensland Audit Office 60 Independent Audit Report 61
Appendices 64
Appendix A — Reports to parliament 2015–16 65
Appendix B — Additional information 66
Appendix C — Audit professional service fees 69
Appendix D — Performance against our audit office peers 71
Appendix E — Compliance checklist 72
Appendix F — Glossary 74

Annual report 2015–16 Auditor-General’s report
Queensland Audit Office | 1
Auditor-General’s report
This report reflects the first full year of our vision of better public services and I am pleased to see that our
clients have responded positively to our advice and recommendations. Our customer satisfaction results
have improved and now align with our targets, exceeding them for the first time for parliamentarians. Clearly,
we are better managing expectations, collaborating when delivering services, and our people have
embraced our organisational values. We will continue to provide trusted independent advice.
We set an ambitious goal of delivering ‘world-class’ audit to achieve our vision. World-class audit is a hard
concept to define, let alone fully realise, but we know pursuing it will translate into better outcomes for our
clients. It is a clear signal we have embraced this challenge when our clients and peers ask us about our
innovative approaches to selecting performance audit topics and how we use audit analytics.
Looking forward, we will continue to transform our approach to financial auditing, the systems and tools we
use, and further use of audit analytics. We will also strengthen our capabilities in performance auditing. This
year we gained insights through our inaugural international performance audit conference in Brisbane —
IMPACT — with attendees from all Australian jurisdictions and around the world. We also sponsored
milestone research on the challenges and solutions facing performance auditing as a profession from the
perspective of clients and providers. We will use these insights to provide more public value from our
performance audits and contribute to advancing performance auditing as a profession.
A number of themes arose from our reports to parliament this financial year. The underlying challenge for the
public sector is obtaining quality information on whether they are efficiently, effectively, and economically
achieving their strategic objectives. This, in turn, will improve approaches to procurement, administering
grants, management reporting, and investment decisions and the capabilities to realise them; these were all
areas for improvement highlighted in our reports. I take this opportunity to thank Andrew Greaves, our 22nd
Auditor-General, who has left a positive and enduring impact on both QAO and the public sector.
This year we delivered our financial and performance audit programs mostly on time and more
cost-efficiently. Our financial audit program continues to assess the reliability of financial statements from
public sector entities and aspects of probity and propriety. We introduced a new measure, ‘financial
statement material error’, to be more transparent about audit quality. Our performance audit program
continues to target topics that are important to Queenslanders and provides valuable insights into public
sector performance. We also introduced a measure to assess performance audit benefits and provide
greater transparency of the financial benefits to Queensland from what we do.
Our audit operations continue to benefit from our modernisation program, which aligns with our strategy to
better utilise technology and standardised processes. We have implemented new finance processes
supported by a new system, automated our management reporting, refreshed our website, strengthened
graduate recruitment, and further improved ICT operations. Looking forward, we will transform human
resources, audit workforce planning, and practice management processes for further efficiencies.
But our continued level of achievement is again undermined by the impact caused by our workload and its
impact on our people’s wellbeing. Whilst we performed in the top 20 per cent of public sector agencies for
seven out of ten workplace factors in our latest staff engagement survey, our employees continue to feel
challenged by their workload and its impact on their wellbeing. It is strong positive sign of our client focus
when the team puts the needs of our clients above their own, but the sustained personal impact on our
people continues to concern me. We remain challenged in attracting the right people. While we have
implemented strategies to reduce workload impacts and partially addressed some issues within our
constraints, the managerial and administrative autonomy from the government of the day required to better
align conditions of employment to the ways we work remains elusive. Consequently, our strategy to pursue
opportunities to strengthen independence remain as important as ever.
Anthony Close
Auditor-General (acting)

Annual report 2015–16 Highlights
2 | Queensland Audit Office
Highlights

Annual report 2015–16 Organisational overview
Queensland Audit Office | 3
Organisational overview
The Queensland Audit Office (QAO) is the independent auditor of the Queensland public sector.
We are one of a number of integrity agencies within the Queensland system of government that exist to
safeguard the public interest.
Our role and audit mandate is established under legislation — the Auditor-General Act 2009 — and is
considered to be one of the most progressive and contemporary in the world.
To fulfil our role, we conduct financial and performance audits, and report on the results of these audits to
parliament.
Our unique position provides us with access to information across the entire public sector, enabling us to
better focus our audits and develop unique insights and valuable recommendations for improvement.
Through our financial audits, we evaluate the accuracy and reliability of public sector financial statements.
This helps our clients to meet their reporting obligations and provides members of parliament and the public
with confidence in the reliability of published financial statements.
Through our performance audits, we use constructive, evidence-based approaches to independently
examine the efficiency, effectiveness, and economy of public services. We consult widely each year to
develop our performance audit program, so that we can focus our audits on the areas of greatest value to
our stakeholders.
As we deliver our services, we identify and share information about good practice and make
recommendations that promote accountability and transparency in government, and improve public services.
Our vision is for better public services for all Queenslanders, and we strive to use our unique position and
audit mandate to achieve this.
Our organisational strategy supports our vision and has the following key objectives:
Our people are the best in their field, supported
by efficient and effective operations
Our services are trusted and valued as independent,
authoritative, and timely
Our clients use the information we provide
to improve accountability and performance
Each year we review our strategy to ensure that our objectives, risks, and actions are aligned to our vision.
Throughout the year, we monitor our operational performance and the delivery of our strategy to ensure that
we meet our commitments and achieve our objectives.

Annual report 2015–16 Material issues
4 | Queensland Audit Office
Material issues
In this report, we use the concept of materiality to better inform our readers of significant issues that affect
our ability to achieve our objectives and create value over the short, medium, and long term.
When reporting material issues, we strive to represent the views of multiple stakeholders including our clients
and workforce. We do this by: speaking directly with our stakeholders as we deliver our services
surveying our clients via an independent external provider to develop a clearer understanding of how
satisfied they are with our services
encouraging our employees to participate in the annual public service Working for Queensland survey to
develop a clearer understanding of how satisfied they are with our workplace
engaging with our employees during our daily operations, and planning, governance, and risk activities.
For this reporting period, we also considered key matters identified during an international research project
conducted jointly by QAO and the Queensland University of Technology (QUT). We commissioned this
important project to examine client and service provider perspectives on the challenges and opportunities
facing performance auditing.
We address these material issues within this report.
Material issue Raised by Impact horizon Impacted objective
Audit quality and capability QAO leaders Ongoing
Workload and health QAO employees Short-term
Client fees — cost of financial audits
Financial audit clients Long-term
Understanding the client context
Performance audit clients, QUT research
Ongoing
Benefits from audit services QAO leaders Long-term
Benefits from audit analytics QAO leaders Medium-term
Data security — handling client data
Financial and performance audit clients
Ongoing
Independence and mandate QAO leaders Long-term
Parliamentary funding QAO leaders Ongoing
Our people Our services Our clients
Annual report 2015–16 Our strategy
Queensland Audit Office | 5
Our strategy
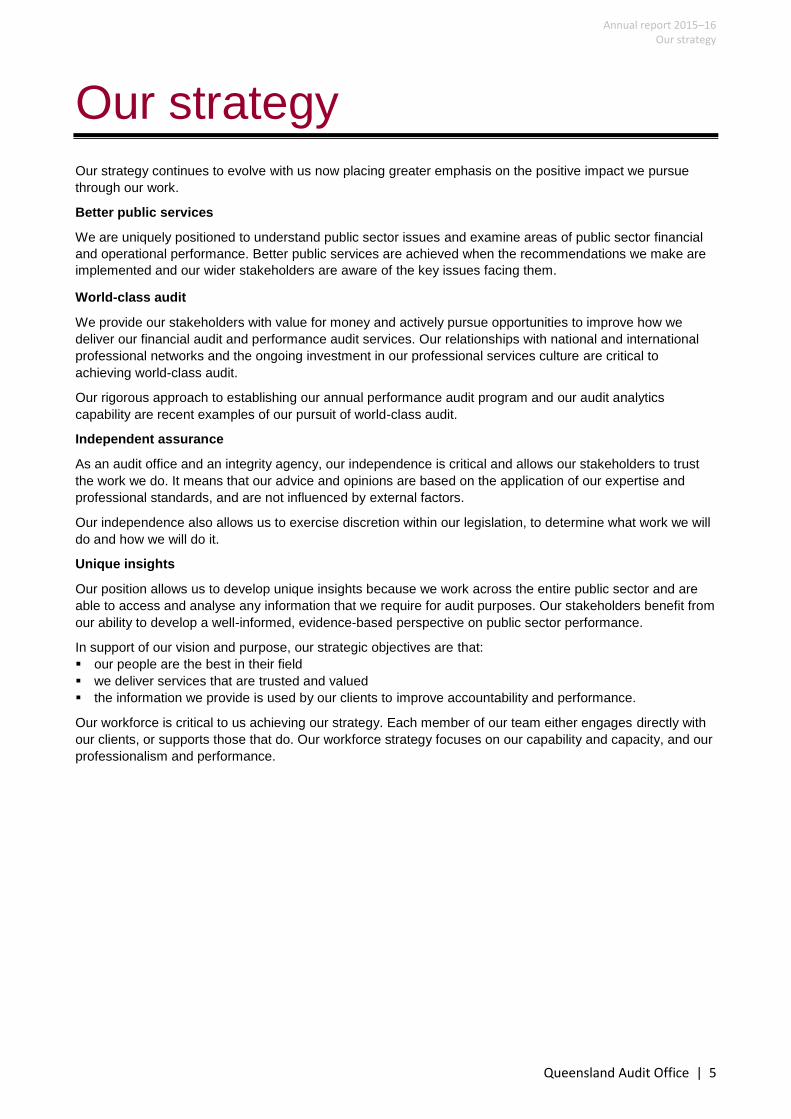
Our strategy continues to evolve with us now placing greater emphasis on the positive impact we pursue
through our work.
Better public services
We are uniquely positioned to understand public sector issues and examine areas of public sector financial
and operational performance. Better public services are achieved when the recommendations we make are
implemented and our wider stakeholders are aware of the key issues facing them.
World-class audit
We provide our stakeholders with value for money and actively pursue opportunities to improve how we
deliver our financial audit and performance audit services. Our relationships with national and international
professional networks and the ongoing investment in our professional services culture are critical to
achieving world-class audit.
Our rigorous approach to establishing our annual performance audit program and our audit analytics
capability are recent examples of our pursuit of world-class audit.
Independent assurance
As an audit office and an integrity agency, our independence is critical and allows our stakeholders to trust
the work we do. It means that our advice and opinions are based on the application of our expertise and
professional standards, and are not influenced by external factors.
Our independence also allows us to exercise discretion within our legislation, to determine what work we will
do and how we will do it.
Unique insights
Our position allows us to develop unique insights because we work across the entire public sector and are
able to access and analyse any information that we require for audit purposes. Our stakeholders benefit from
our ability to develop a well-informed, evidence-based perspective on public sector performance.
In support of our vision and purpose, our strategic objectives are that:
our people are the best in their field
we deliver services that are trusted and valued
the information we provide is used by our clients to improve accountability and performance.
Our workforce is critical to us achieving our strategy. Each member of our team either engages directly with
our clients, or supports those that do. Our workforce strategy focuses on our capability and capacity, and our
professionalism and performance.

Annual report 2015–16 Our strategy
6 | Queensland Audit Office
VISION
Better public services World class audit
PURPOSE
Independent assurance Unique insights
VALUES
Engage with purpose
Challenge ourselves
Deliver on our commitments
Care about people
OBJECTIVES
Our people are the best in their field, supported by efficient
and effective operations
Our services are trusted and valued
as independent, authoritative,
and timely
Our clients use the information
we provide to improve
accountability and performance

Annual report 2015–16 Our business model
Queensland Audit Office | 7
Our business model
The way we create value is expressed through our business model. It represents the relationship between
our organisation’s key inputs, activities, outputs, and outcomes.
We engage with our clients to deliver financial audit and performance audit services, investigate issues about
financial waste and mismanagement, and provide advice and assistance. These services are the key
activities in our business model.
Key inputs to our services:
our workforce — audit professionals and support staff employed by QAO, professional audit firms that we
contract work to, and other subject matter experts that we engage as required
our ways of working — audit methodologies aligned with professional accounting and audit standards,
and modern technology that supports workforce collaboration
client relationships and information — parliamentary and public sector stakeholders, and the financial and
operational performance information relevant to audit planning and conduct
funding for our services — financial audit services are paid for by public sector entities, and our other
services are funded by parliament.
Key outputs from our services:
financial audit opinions — providing assurance about the accuracy and reliability of public sector entity
financial statements
reports to parliament on the results of financial audits — providing aggregated information about financial
performance and issues relevant to whole-of-government or groups within the public sector
reports to parliament on the results of performance audits — providing performance audit results that
examine areas of public sector economy, efficiency, and effectiveness
good practice — providing awareness and resources to promote better practices within the public sector.
In line with our vision, we look beyond our key outputs to our impact on public services.
Key outcomes we contribute to:
increasing maturity in public sector financial management and reporting — by engaging with our
stakeholders on matters of importance, examining our client’s control environments, and
identifying systemic issues to be addressed
maintaining confidence in financial accountability, transparency, and reporting — by providing
professional audit services, forming opinions on financial statements and operational
performance, and publishing the results of our audits in reports to parliament
improvements in the economy, efficiency, and effectiveness of public services — by examining
our client’s financial and operational performance, identifying issues, and providing
recommendations for improvement that our clients accept and implement.
Achieving these outcomes results in better public services.

Annual report 2015–16 Our business model
8 | Queensland Audit Office
INPUTS
Our workforce
Our ways of working
Client relationships
and information
Funding for our services
ACTIVITIES
Financial audit services
Performance audit services
Investigate financial
waste and mismanagement
Advice and assistance
OUTPUTS
Financial audit opinions
Reports to parliament on the results of
financial audits
Reports to parliament on the results of performance
audits
Good practice
OUTCOMES
Increasing maturity in public sector financial
management and reporting
Maintaining confidence in public
sector financial accountability,
transparency, and reporting
Improvements in the economy, efficiency, and effectiveness of
public services
Better public services
Annual report 2015–16 Our performance
Queensland Audit Office | 9
Our performance
We use performance indicators and measures to provide us with ongoing information about the achievement
of our strategy and the efficiency and effectiveness of our business model. More information on these
measures is available in our performance statement within this report.
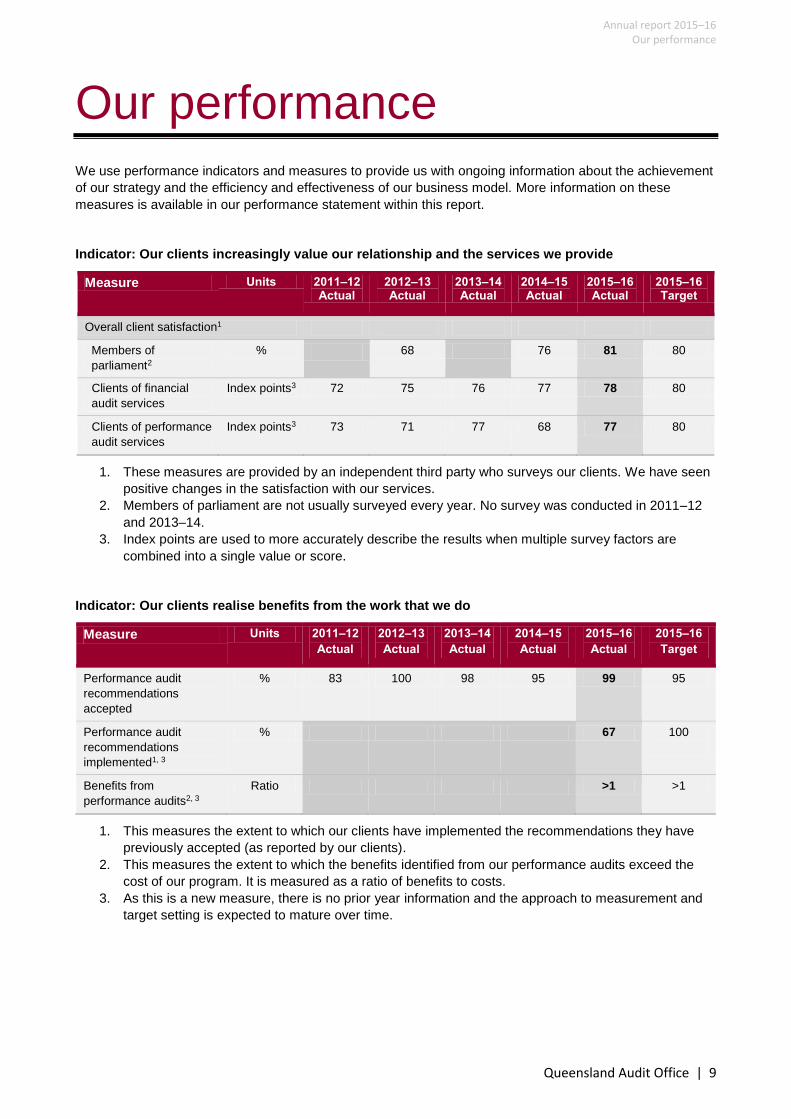
Indicator: Our clients increasingly value our relationship and the services we provide
Measure Units 2011–12 Actual
2012–13 Actual
2013–14 Actual
2014–15 Actual
2015–16 Actual
2015–16 Target
Overall client satisfaction1
Members of
parliament2
% 68 76 81 80
Clients of financial
audit services
Index points3 72 75 76 77 78 80
Clients of performance
audit services
Index points3 73 71 77 68 77 80
1. These measures are provided by an independent third party who surveys our clients. We have seen
positive changes in the satisfaction with our services.
2. Members of parliament are not usually surveyed every year. No survey was conducted in 2011–12
and 2013–14.
3. Index points are used to more accurately describe the results when multiple survey factors are
combined into a single value or score.
Indicator: Our clients realise benefits from the work that we do
Measure Units 2011–12
Actual
2012–13
Actual
2013–14
Actual
2014–15
Actual
2015–16
Actual
2015–16
Target
Performance audit
recommendations
accepted
% 83 100 98 95 99 95
Performance audit
recommendations
implemented1, 3
% 67 100
Benefits from
performance audits2, 3
Ratio >1 >1
1. This measures the extent to which our clients have implemented the recommendations they have
previously accepted (as reported by our clients).
2. This measures the extent to which the benefits identified from our performance audits exceed the
cost of our program. It is measured as a ratio of benefits to costs.
3. As this is a new measure, there is no prior year information and the approach to measurement and
target setting is expected to mature over time.
Annual report 2015–16 Our performance
10 | Queensland Audit Office
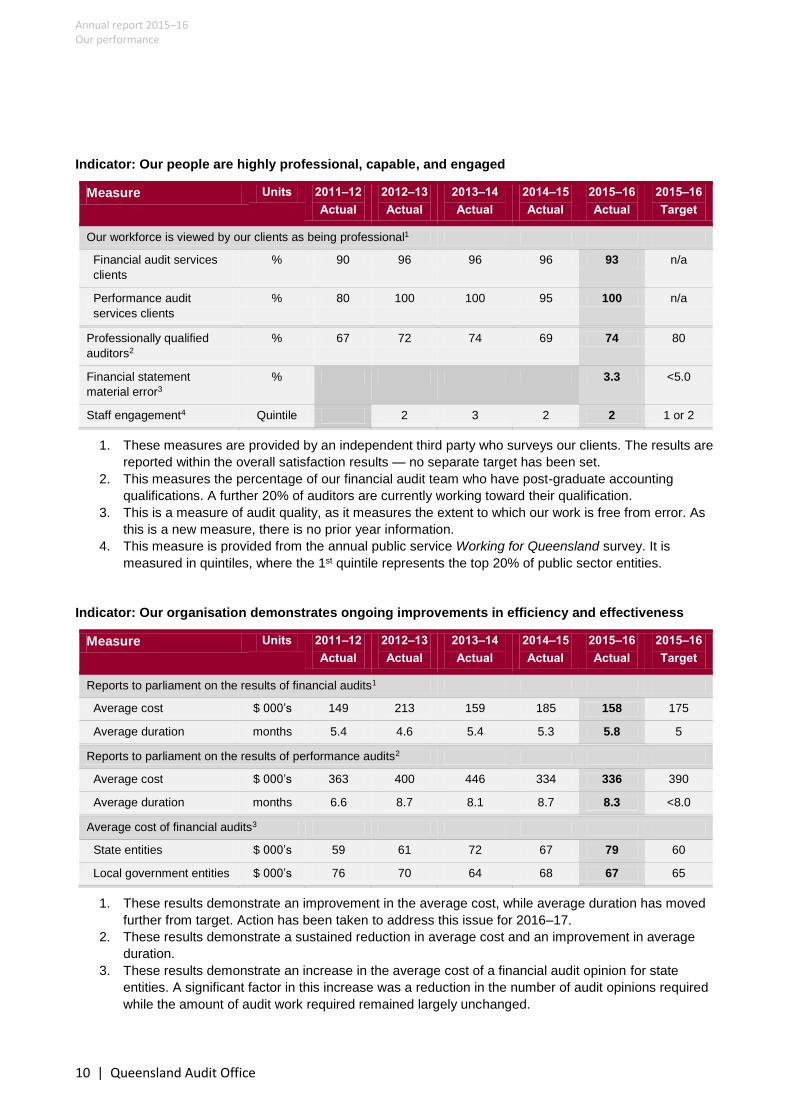
Indicator: Our people are highly professional, capable, and engaged
Measure Units 2011–12
Actual
2012–13
Actual
2013–14
Actual
2014–15
Actual
2015–16
Actual
2015–16
Target
Our workforce is viewed by our clients as being professional1
Financial audit services
clients
% 90 96 96 96 93 n/a
Performance audit
services clients
% 80 100 100 95 100 n/a
Professionally qualified
auditors2
% 67 72 74 69 74 80
Financial statement
material error3
% 3.3 <5.0
Staff engagement4 Quintile 2 3 2 2 1 or 2
1. These measures are provided by an independent third party who surveys our clients. The results are
reported within the overall satisfaction results — no separate target has been set.
2. This measures the percentage of our financial audit team who have post-graduate accounting
qualifications. A further 20% of auditors are currently working toward their qualification.
3. This is a measure of audit quality, as it measures the extent to which our work is free from error. As
this is a new measure, there is no prior year information.
4. This measure is provided from the annual public service Working for Queensland survey. It is
measured in quintiles, where the 1st quintile represents the top 20% of public sector entities.
Indicator: Our organisation demonstrates ongoing improvements in efficiency and effectiveness
Measure Units 2011–12
Actual
2012–13
Actual
2013–14
Actual
2014–15
Actual
2015–16
Actual
2015–16
Target
Reports to parliament on the results of financial audits1
Average cost $ 000’s 149 213 159 185 158 175
Average duration months 5.4 4.6 5.4 5.3 5.8 5
Reports to parliament on the results of performance audits2
Average cost $ 000’s 363 400 446 334 336 390
Average duration months 6.6 8.7 8.1 8.7 8.3 <8.0
Average cost of financial audits3
State entities $ 000’s 59 61 72 67 79 60
Local government entities $ 000’s 76 70 64 68 67 65
1. These results demonstrate an improvement in the average cost, while average duration has moved
further from target. Action has been taken to address this issue for 2016–17.
2. These results demonstrate a sustained reduction in average cost and an improvement in average
duration.
3. These results demonstrate an increase in the average cost of a financial audit opinion for state
entities. A significant factor in this increase was a reduction in the number of audit opinions required
while the amount of audit work required remained largely unchanged.
Annual report 2015–16 Risks and opportunities
Queensland Audit Office | 11
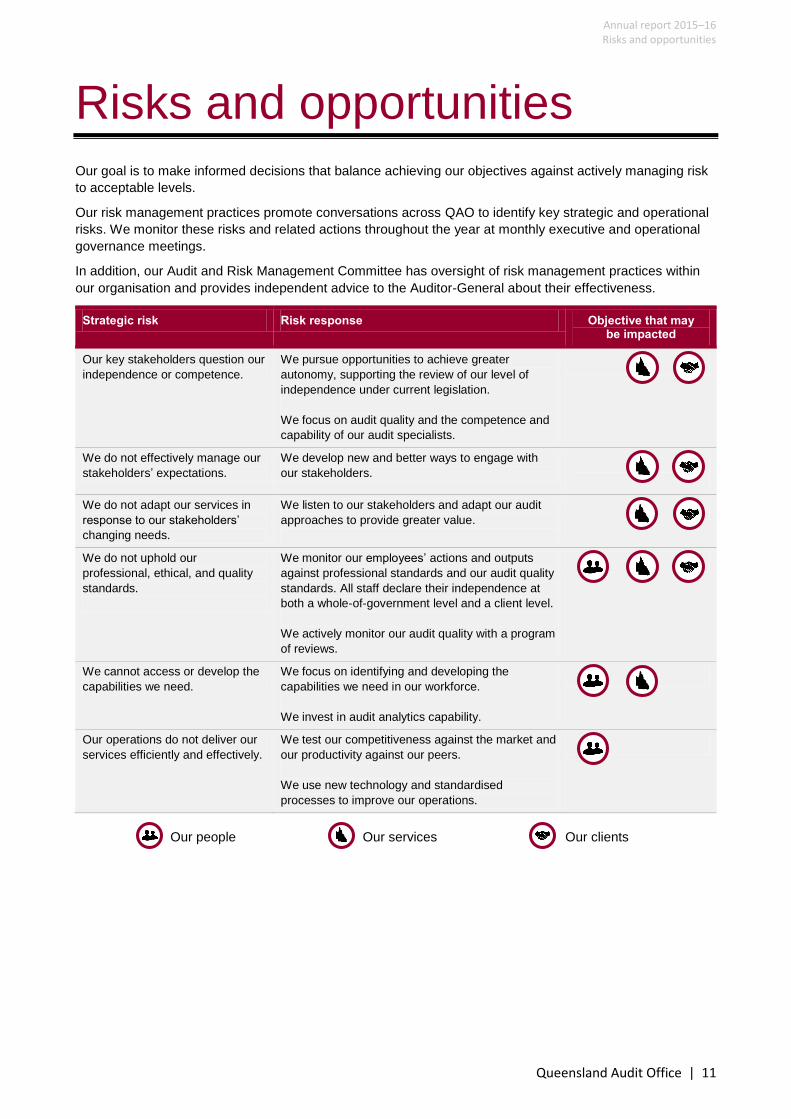
Risks and opportunities
Our goal is to make informed decisions that balance achieving our objectives against actively managing risk
to acceptable levels.
Our risk management practices promote conversations across QAO to identify key strategic and operational
risks. We monitor these risks and related actions throughout the year at monthly executive and operational
governance meetings.
In addition, our Audit and Risk Management Committee has oversight of risk management practices within
our organisation and provides independent advice to the Auditor-General about their effectiveness.
Strategic risk Risk response Objective that may be impacted
Our key stakeholders question our
independence or competence.
We pursue opportunities to achieve greater
autonomy, supporting the review of our level of
independence under current legislation.
We focus on audit quality and the competence and
capability of our audit specialists.
We do not effectively manage our
stakeholders’ expectations.
We develop new and better ways to engage with
our stakeholders.
We do not adapt our services in
response to our stakeholders’
changing needs.
We listen to our stakeholders and adapt our audit
approaches to provide greater value.
We do not uphold our
professional, ethical, and quality
standards.
We monitor our employees’ actions and outputs
against professional standards and our audit quality
standards. All staff declare their independence at
both a whole-of-government level and a client level.
We actively monitor our audit quality with a program
of reviews.
We cannot access or develop the
capabilities we need.
We focus on identifying and developing the
capabilities we need in our workforce.
We invest in audit analytics capability.
Our operations do not deliver our
services efficiently and effectively.
We test our competitiveness against the market and
our productivity against our peers.
We use new technology and standardised
processes to improve our operations.
Our people Our services Our clients
Services to our clients
We want our clients to use the information we provide to improve accountability
and performance.
Our clients are members of parliament, parliamentary committees, and public
sector entities. We also engage directly with public sector Chief Financial Officers
and Audit Committee Chairs to share information and contribute to the increasing
maturity of public sector financial management and reporting.
This section provides information about the services that we provided to our clients
this year, and contains information on the following material issues:
client fees — cost of financial audits
understanding the client context
data security — handling client data
benefits from audit services
parliamentary funding.

Annual report 2015–16 Services to our clients
Queensland Audit Office | 13
Client fees — cost of financial audits We focus on keeping the cost of our financial audit services low, as our clients are
sensitive to these costs.
Under legislation, we are the independent auditor of the Queensland public sector.
This provides our clients with consistency across public sector, enabling
comparison and consolidation. However, it also prevents our clients from engaging
other auditors and places greater responsibility on us to deliver
value-for-money services.
Financial audits are an important part of the public sector accountability framework
and ensure that the financial statements of public sector entities can be relied upon
to:
provide a true and fair view of financial position and performance
explain how an entity earned and spent money
provide details of what assets and liabilities an entity has.
To be efficient and effective, we maintain:
a workforce of financial audit professionals with up-to-date knowledge of
accounting and auditing standards
a fit-for-purpose public sector methodology
an internal network of experts on public sector issues.
To keep the cost of our audits low, we:
regularly refine our audit methodology to remove unnecessary steps
constantly review how our audit teams apply our audit methodology
centrally provide ‘audit analytics’ to our audit teams using automatically
collected and analysed client information
contract about one third of our work to other audit firms to provide an efficient
surge capacity aligned to our audit cycle. We undertake a competitive tender
process that also allows us to test the cost of our services against the market
assign some contracts to regionally-based audit firms to minimise audit team
travel costs, which are paid for by our clients as part of the cost of an audit
continuously improve organisational efficiency to reduce our overheads.
We publicly demonstrate our focus on keeping audit costs low by reporting the
average costs of our financial audits, and independently surveying our financial
audit clients and reporting their level of satisfaction as part of our performance
measures.

Annual report 2015–16 Services to our clients
14 | Queensland Audit Office
Understanding the client context Our performance audits provide recommendations to our clients to improve
government service delivery.
To achieve our vision of better public services, the recommendations we develop
must be accepted and implemented by our clients. We recognise that to develop
valuable recommendations, we need to engage effectively with our clients to
combine our insights with their context and expertise.
Performance audits examine areas of importance to Queensland, providing
independent assurance that public resources are used appropriately. We audit
government programs to determine if they are delivering on their objectives
efficiently, effectively, and economically.
To deliver our performance audit program, we maintain a specialist team of
performance auditors who are experienced in applying our methodology in
different situations and circumstances.
To develop practical recommendations, we:
use our sector-based client engagement model to access relevant expertise
within our organisation
assess the need for external specialist subject matter expertise, during planning
for the performance audit
participate in client induction workshops to improve our understanding of the
client context
engage directly with our clients during the audit to ensure ongoing access to
relevant information
seek feedback from our clients on draft recommendations at multiple points
before finalising them.
We publicly demonstrate our focus on developing valuable recommendations by
independently surveying our performance audit clients and reporting their level of
satisfaction as part of our performance measures.
During 2015–16, our performance audits covered a diverse range of topics:
the use of traffic cameras to address road safety issues
agricultural research, development, and extension programs and projects
the administration of the Royalties for the Regions grant program for councils
major transport infrastructure projects including the Moreton Bay Rail Program
and the Bruce Highway Upgrade Program
the provision of court reporting and transcription services
the management of privately owned prisons
the use of cloud computing across the Queensland public sector
the efficiency of public hospital operating theatres
flood resilience of river catchments since 2011 in the Bremer, Lockyer, mid and
upper Brisbane river catchments
access to early childhood education and kindergarten services
reforms to heavy vehicle road access.

Annual report 2015–16 Services to our clients
Queensland Audit Office | 15
Data security — handling client data Data security is a critical issue for our clients.
Under information standards, data owners remain accountable for the appropriate
handling of their data even when it is provided to other parties. Our commitment to
our clients is that we will manage the data we have in accordance with its security
classification, in line with information standards.
Our commitment to our clients is that we will manage the data we have in
accordance with information standards.
Information about our clients’ financial and operating environment and
performance has always been an essential input to audit services.
Advances in technology provide us with opportunities to access and analyse large
data sets more easily than ever before. Our pursuit of improvements in audit
efficiency and effectiveness has led us to develop an audit analytics capability
that: uses automated processes for receiving data that our clients previously gave
to us via email or on portable storage devices
uses automated scripting to ensure the data sets are complete and accurate
applies analytical techniques to common data sets to enable audit teams to
focus their effort on investigating statistical outliers
continuously develops — where the ad hoc analysis on one audit may be of
benefit to other audits, it can be added to the set of standard analysis
techniques
maintains client data within a secure environment managed by CITEC, the
Queensland government’s primary information and communication technology
service provider.
Previously, clients would check the appropriateness of the data they were
providing prior to sending an email or handing over a portable storage device. By
automating the processes for us to receive client data, these checks occur upfront
and form part of our ongoing information access arrangements.
We recognise that great care needs to be exercised to ensure that access is only
given to the data that is required to deliver our audit services.
We encourage our clients to engage with us about the risks and opportunities
relating to data security as we pursue improvements in our audit services.

Annual report 2015–16 Services to our clients
16 | Queensland Audit Office
Benefits from audit services Our audit services do more than help our clients meet their reporting obligations.
We contribute to better public services by: engaging with our stakeholders to identify potential performance audit topics
that they consider important
engaging with our clients to conduct our performance audits, and then
developing unique insights and valuable recommendations for their acceptance
and implementation
engaging more broadly with public sector stakeholders to share performance
audit insights and wider learnings for them to consider in their own entities
following up with our clients to understand to what extent previously accepted
recommendations have been implemented
independently surveying our performance audit clients for feedback on our
audits for continuous improvement purposes.
Any member of the public can provide us with suggestions for performance audit
topics. We evaluate each potential topic against key criteria to develop a
performance audit program that:
focuses on important topics
leverages our unique position
demonstrates our independence
represents the best use of our limited funding.
We have introduced two new performance measures to be more transparent about
the potential positive impact of our services. These measures are:
the percentage of performance audit recommendations implemented by public
sector entities
a benefit ratio for our performance audit program.
We explain these measures in our performance statement in this report. As these
are new performance measures, we expect our approach to measuring and setting
targets to mature over time.
Our aim is for the public sector to realise more benefits from our performance audit
program than it costs to deliver it, and for us to demonstrate this clearly through our
reporting. To achieve this, we need to work effectively with our clients to identify
and agree on the benefits from our services.

Annual report 2015–16 Services to our clients
Queensland Audit Office | 17
Performance audit highlights
These highlights from our performance audit program demonstrate the breadth of topics we cover and the
potential benefits to Queenslanders.
.
Our website contains copies of these and other reports to parliament, and also details of performance audits
that are planned and in progress. Visit https://www.qao.qld.gov.au/ for details.
Road safety and the use of traffic cameras
Report 2 from our 2015–16 program
Driver disregard for speed limits and traffic signals is a significant factor in road accidents, hospitalisations,
and fatalities. Traffic cameras are one tool used to address this issue. However, it is not uncommon for the
public and media to question whether the use of traffic cameras is effective in addressing this issue, and
whether they are being used appropriately.
We examined the design and implementation of the Camera Detected Offence Program (CDOP) and how
effectively it contributes to road safety outcomes. While we found the program had improved driver
behaviours, we identified issues with program governance and implementation, particularly camera site
selection, deployment, and infringement issuing and enforcement.
The report has resulted in Queensland Police Services taking action to increase the covert use of traffic
cameras to operate at the level already approved by government.
We expect that implementing the CDOP as designed, including deploying the cameras to the right locations
and the right time and mode (covert and overt), will, over time, have a positive impact on driver behaviour,
and ultimately save lives.
Managing privately-operated prisons
Report 11 from our 2015–16 program
Two of Queensland’s high security prisons are privately-operated with a view to achieving significant
cost savings to the state. We examined whether these savings are being achieved without
compromising the quality of prison services.
Our work confirmed that these private arrangements are realising significant cost savings while
providing a level of services commensurate with publically-operated prisons. We noted that health
services cost significantly less (about $4.4 million per annum) in Queensland’s two
privately-operated prisons compared to the public sector’s cost estimates for delivering those services.
Our recommendations included identifying better practices and cost-efficiencies in privately-operated
prisons, and applying them, as appropriate, to the eight other publicly-operated high security prisons.
We expect that this will result in improvements to publicly-operated prisons, including further cost
savings to the state — especially in health services.
Hospital operating theatre efficiency
Report 15 from our 2015–16 program
Hospitals do not use their operating theatres all day, every day. With surgery waiting lists again
starting to increase, we examined how well operating theatres in public hospitals are being utilised.
We concluded that operating theatres are currently underutilised, after identifying 18 898 ‘lost’
hours over an 18 month period across the 39 hospitals examined. We made recommendations to
improve operating theatre planning, operation, and reporting to support their more efficient use.
Our report prompted the Department of Health to establish a new operating theatre efficiency
committee. The committee uses specific performance monitoring measures we developed as part
of our audit.
We expect the committee will drive system-wide efficiency improvements in how public hospitals
manage their operating theatres.

Annual report 2015–16 Services to our clients
18 | Queensland Audit Office
Parliamentary funding We have two sources of funding — parliamentary funding and fee-for-service.
Public sector entities fund our financial audit program, as all state and local
government entities pay us directly for the independent audit of their financial
statements.
Parliament funds the position of the Auditor-General and other services through
appropriation, including:
developing and delivering our performance audit program
preparing and tabling our reports to parliament
providing advice and assistance to our clients.
We also investigate matters raised about financial waste and mismanagement
relating to public services. Where matters are minor and the timing aligns with an
existing financial audit, the matter may be easily investigated by the financial audit
team as part of their audit. Where matters are more significant, we may add them
to our performance audit program.
We manage these two sources of funds separately, as it would be inappropriate
for:
financial audit clients to pay for services that parliament fund
parliament to pay for financial audits.
Parliamentary funding has not changed significantly over the past five years;
however, our services are changing. As we pursue our vision of better public
services, we are engaging more with our stakeholders to better focus our
performance audit program, develop good practice resources for our clients, and
share the outcomes of performance audits with wider audiences.
As we continue to do this, less funding will be available to invest in conducting the
performance audits themselves. To date, we have pursued efficiencies in
performance auditing that have allowed us to do more while still delivering our
agreed performance audit program.
Based on these changes, we expect the number of performance audits we can
conduct to reduce over time. Although, we would also expect to target topics of
greater importance and to deliver outcomes to a broader group of stakeholders —
not just those involved in the audits.
We will continue to monitor how we use our parliamentary funding to ensure we get
the balance right.
Our 2015–16 allocation of $6.4 million in parliamentary funding
Service Amount
Statutory positions $0.7m
Results of performance audits reports to parliament (our performance audit program)
$4.1m
Results of financial audits reports to parliament $0.9m
Strategic audit planning $0.5m
Managing issues raised about financial waste and mismanagement
$0.1m
Advice and assistance to parliament $0.1m
Total $6.4m

Annual report 2015–16 Services to our clients
Queensland Audit Office | 19

Annual report 2015–16 Improving our services
20 |
Improving our services
We want our services to be trusted and valued as independent, authoritative, and
timely.
Accordingly, we continue to invest in audit capabilities, how we engage with our
clients, and in audit efficiencies through innovation and risk-based approaches. In
keeping with our independent nature, we actively pursue opportunities for greater
autonomy to better position us to achieve our vision.
This section provides information about how we are working to improve our
services, and contains information on the following material issues:
audit quality and capability
benefits from audit analytics
independence and mandate.

Annual report 2015–16 Improving our services
Queensland Audit Office | 21
Audit quality and capability We provide specialist financial and performance audit services, and our ability to
deliver these services to professional standards is critical.
Through our financial audits, we form opinions about the reliability of public sector
entity financial statements. We also examine aspects of probity and propriety.
Through our performance audits, we examine the efficiency, effectiveness, and
economy of public services.
For our stakeholders to have confidence in our services, we need to:
demonstrate compliance with professional accounting and audit requirements
demonstrate knowledge of the client and sector
meet agreed commitments to our clients
keep our work free from error.
We do this by:
assigning independent, qualified, and experienced professionals to our audits
ensuring use of compliant, public sector aligned, fit-for-purpose, financial and
performance audit methodologies
investing in audit capabilities through information sharing, training, and
professional development
engaging effectively with our clients, and sharing client and sector knowledge
across our workforce
monitoring quality on audits-in-progress to proactively identify and address
issues
reviewing quality on completed audits to identify areas for improvement
focusing on audit quality through our internal governance.
For our financial audits, we have introduced a new performance measure to be
more transparent about audit quality. The measure is ‘financial statement material
error’ and it is used to report on material errors in prior year financial statements.
We monitor the corrections being made and investigate if a change in our future audit
approach is required.
Our aim is for our outputs to be of the highest standard. To achieve this, we need
to actively manage our financial and performance audit quality and capability, and
use information about our performance to inform our internal improvement
activities.

Annual report 2015–16 Improving our services
22 | Queensland Audit Office
Benefits from audit analytics We are innovating through the use of audit analytics to improve our audit outputs
and our audit efficiency.
Our auditors sample information from client data sets each year as part of our
process to form an audit opinion. We sample very similar information from one
year to the next, across all of our clients.
Due to advances in technology, we can now work with large client data sets. Our
strategy is focused on automating how we access and analyse client data. Our
aim is to improve our knowledge of client operations to better focus our
risk-based testing approach. Our long-term goal is to reduce the total hours
required on an audit and increase the level of testing possible, which will reduce
the cost to our clients and increase value.
As we progress our strategy, we have observed:
improvements in audit quality, due to our ability to easily analyse entire data
sets and focus on outliers and anomalies
no negative impact on client fees, due to existing financial audit resources being
re-directed toward improved audit analytics
some client fee reductions and the potential for further reductions in the medium
term as we integrate our audit analytics with our financial audit methodology,
resulting in more efficient ways of working
a high level of interest from our clients to examine their own data through the
analytical views we have developed.
Our work to date has included: establishing a dedicated, specialist audit analytics team and data champions
within each of our sectors
collecting common client data sets with potential to generate audit efficiencies
identifying a pilot group of clients to test data access principles and processes
collaborating with our clients to implement automated data access
developing new ways to combine client data into a single source for analysis
developing secure technology for receiving, storing, and managing client data
developing automated scripts that ensure the data sets are complete and
accurate before being published for audit use
selecting the most appropriate software tools for analysing client data
developing automated dashboards to allow auditors to visualise client data
training our auditors to interpret standardised dashboard information and to
further customise the dashboards to suit individual clients
integrating audit analytics with our financial audit methodology.
Audit analytics has also been used to more quickly and easily analyse large data
sets for our performance audits. This year, most notably: fraud management in local government
Queensland public hospital operating theatre efficiency.
We will continue to carefully invest in audit analytics while we can see the
potential for improved audit quality or efficiency leading to reductions in client
fees.

Annual report 2015–16 Improving our services
Queensland Audit Office | 23
Independence and mandate The Auditor-General Act 2009 promotes the independence of the Auditor-General
and provides our audit mandate for the Queensland public sector and related
entities.
Our independence is critical, and means that we conduct audits in any way we
consider appropriate and are not subject to direction from any person about the
way we exercise our audit powers.
We are concerned if stakeholders question our independence. We respond by
listening carefully to understand their concerns and providing information about our
role, mandate, approach, audit standards, and the rationale for our decisions. In
our experience, being open and transparent is the most constructive approach to
addressing these types of concerns.
We recognise that there are degrees of independence, and in 2013 we contributed
to a parliamentary inquiry about how to strengthen the independence of the
Auditor-General. In our contribution, we identified potential legislative amendments
to:
strengthen our relationship with the parliament
improve our administrative and financial autonomy
respond to changes that impact auditing in a modern world
resolve minor legislative deficiencies.
This parliamentary inquiry lapsed in early 2015 as a result of a state election being
called. The inquiry was re-established in late 2015 under the newly formed
parliamentary committee but has now been superseded by our five-year
independent strategic review. This review is now in progress and is examining the
operations and performance of our organisation.
We look forward to the outcomes of this review and how they may contribute to
improving our independence and the services we provide to our clients.
How we operate
How we operate
We provide professional audit services to public sector entities.
Our challenge is accessing the audit capabilities we need, when we need them, to
deliver our services across all our clients, to professional standards and agreed
performance expectations.
We focus on this challenge by encouraging our people to be the best in their field,
supported by efficient and effective operations.
This section provides information about how we operate and contains information
about material issues and additional information required for public sector
reporting:
our people
our governance
stakeholder engagement
workload and health.

Annual report 2015–16 How we operate
Queensland Audit Office | 25
Our people Our workforce is critical to us achieving our strategy.
The composition of our workforce is designed to meet the service needs of our clients, and our structure
provides employees with clear accountability and authority for service delivery.
Each year we determine our workforce needs including employee numbers, audit and other contractors, and
the selective use of private audit firms.
Organisational structure as at 30 June 2016
Our audit operations focus on the needs of our clients — delivering our financial audit and performance audit
programs and reporting to parliament — noting that in our:
financial audit program, we supplement our financial audit employees with audit contractors to manage
peak workloads and we contract about one third of our effort to private audit firms
performance audit program, our performance audit employees develop and deliver this program and
access specialist consultants on specific audits when we need additional expertise.
Our support services focus on the needs of our workforce — providing financial, people, technology, and
information services. We actively manage our support services to ensure we have the right mix of ‘audit to
support’ resources to provide value-for-money services to our clients.
Annual report 2015–16 How we operate
26 | Queensland Audit Office
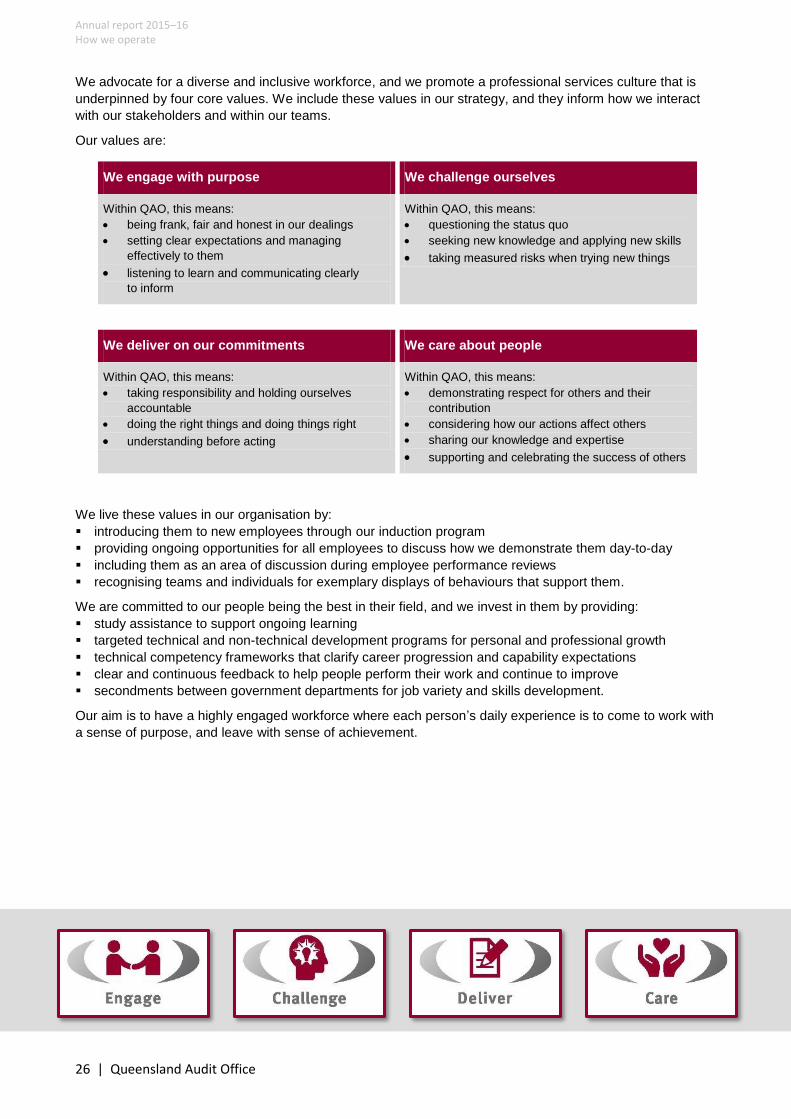
We advocate for a diverse and inclusive workforce, and we promote a professional services culture that is
underpinned by four core values. We include these values in our strategy, and they inform how we interact
with our stakeholders and within our teams.
Our values are:
We engage with purpose We challenge ourselves
Within QAO, this means:
being frank, fair and honest in our dealings
setting clear expectations and managing
effectively to them
listening to learn and communicating clearly
to inform
Within QAO, this means:
questioning the status quo
seeking new knowledge and applying new skills
taking measured risks when trying new things
We deliver on our commitments We care about people
Within QAO, this means:
taking responsibility and holding ourselves
accountable
doing the right things and doing things right
understanding before acting
Within QAO, this means:
demonstrating respect for others and their
contribution
considering how our actions affect others
sharing our knowledge and expertise
supporting and celebrating the success of others
We live these values in our organisation by:
introducing them to new employees through our induction program
providing ongoing opportunities for all employees to discuss how we demonstrate them day-to-day
including them as an area of discussion during employee performance reviews
recognising teams and individuals for exemplary displays of behaviours that support them.
We are committed to our people being the best in their field, and we invest in them by providing:
study assistance to support ongoing learning
targeted technical and non-technical development programs for personal and professional growth
technical competency frameworks that clarify career progression and capability expectations
clear and continuous feedback to help people perform their work and continue to improve
secondments between government departments for job variety and skills development.
Our aim is to have a highly engaged workforce where each person’s daily experience is to come to work with
a sense of purpose, and leave with sense of achievement.

Annual report 2015–16 How we operate
Queensland Audit Office | 27
Our governance Under legislation, the Auditor-General is the Chief Executive Officer of the QAO and is accountable to
parliament for its operation and performance.
To support the Auditor-General in fulfilling these accountabilities, we use a variety of internal and external
mechanisms to govern and control our organisation. In addition to these mechanisms, our legislation
requires the external audit of our annual financial statements and a five-year independent strategic review of
our operations and performance.
Key governance and control mechanisms
Our executive leaders set the tone for integrity and governance within QAO, and monitor the operations and
performance of our governing bodies and activities related to internal and external assurance.
Key executive management personnel as at 30 June 2016
Andrew Greaves
Anthony Close
Poopalasingam Brahman
Karen Johnson
Daniele Bird
BEc FCA FCPA BBus FCPA BBus FCPA BCom FCA BBus CA
Auditor-General Deputy Auditor-General
Assistant Auditor-General
Assistant Auditor-General
Assistant Auditor-General

Annual report 2015–16 How we operate
28 | Queensland Audit Office
Table: Description of key governance and control mechanisms
Governance
element
Description
Integrity
culture
As an integrity agency, we aim to safeguard and promote ethical conduct in line with
our commitment to codes of conduct for professional accountants and the public
service.
Governing
bodies
All governing bodies support the Auditor-General, operate under current charters, and
have their effectiveness reviewed annually by their members.
Executive
Management Group
Our executive leaders form the Executive Management Group (EMG). EMG sets our
strategic direction and leads the achievement of our strategic objectives.
Operational
Management Group
Our divisional leaders form the Operational Management Group (OMG). OMG sets our
operational plans and priorities, and leads the achievement of our operational
objectives.
Information Steering
Committee
A selection of executive and divisional leaders form the Information Steering
Committee (ISC). ISC maintains alignment between our current and future state
enterprise architecture, and our investment in technology.
Audit and Risk
Management
Committee
The Audit and Risk Management Committee (ARMC) is comprised of three external
independent members. ARMC provides advice and assurance to the Auditor-General
through their effective oversight of the risk, control, and compliance frameworks and
fiscal responsibilities underpinning our corporate governance.
Internal
assurance
We use internal assurance mechanisms to monitor key areas of our operations and
performance.
Internal audit Internal audit operates under an approved charter with the head of internal audit
reporting to the Auditor-General. Each year, internal audit conducts independent,
objective, and risk-based assurance activities based on a program approved by
ARMC.
Audit quality
reviews
We conduct audit quality assurance reviews on a representative selection of our ‘in
progress’ and ‘completed’ audits to provide evidence of compliance with our audit
practices and identify areas for improvement.
Operational
performance
reviews
Divisional leaders participate in reviews of their division’s performance every six
months with the Auditor-General and Deputy Auditor-General, to identify improvement
opportunities and corrective actions.
External
assurance
We use external assurance mechanisms to provide further assurance on our
performance, controls, and compliance.
External audit Our legislation requires our financial statements to be independently audited each
financial year. The Governor in Council appoints an external auditor to conduct this
audit. We also engage the auditor to audit our performance statement.
Audit practice
reviews
We periodically engage external independent reviewers to examine our organisation
and challenge the way we operate and perform in regard to our audit practices. This
includes assessing our compliance with professional standards and identifying
opportunities for us to improve.
ACAG
benchmarking
As a member of the Australasian Council of Auditor-Generals (ACAG), each year we
participate in a benchmarking activity that enables audit offices to compare our
operational performance across jurisdictions and identify opportunities to improve.
Five-year
independent
strategic review
Our legislation requires an independent strategic review of QAO to be conducted at
least every five years, which includes an evaluation of the Auditor-General’s functions
and performance. The Governor in Council appoints the reviewer. This review is in
progress.

Annual report 2015–16 How we operate
Queensland Audit Office | 29
Stakeholder engagement Our relationship with our stakeholders impacts our ability to achieve our strategy.
When engaging with our stakeholders, we focus on:
raising awareness about our role and services
sourcing important topics for our performance audit program
sharing better practice with and among our clients
generating greater impacts from our services.
Within audit operations, we organise our audit teams by sectors to improve client engagement and our
understanding of their organisations. Our sector-based approach helps us to develop insights and make
recommendations that better benefit our clients. These teams are led by sector directors and engage with
members of parliament, parliamentary committees, public sector entities, and industry and community
groups relevant to their sector.
Sector directors as at 30 June 2016
David Adams
Paul Christensen
Pat Flemming
Nick George
Ross Hodson
Damon Olive
John Welsh
BBus FCPA
BBus LLB FCPA
BBus GradDip (Adv Acc) MCom FCPA
BBus CPA
BBus Grad Cert Mgt CPA Ffin
BBus FCPA
BBus FCPA Grad Cert Mgt
Infrastructure Central Agencies/ Financial Services
Local Government
Resources Justice and Community Services
Health Education
A key area where we have improved stakeholder engagement is when preparing our Strategic Audit Plan.
This plan contains the performance audit topics we propose to examine over the next three years. When
preparing this plan, we seek to engage with all our key stakeholder groups to ensure we focus our
performance audits on the topics of greatest importance.
In our role as an integrity organisation we engage with:
Queensland Government central agencies to promote integrity in financial management and reporting
other integrity offices to collaborate and maintain service alignment.
In our role as an audit organisation we engage with:
professional accounting bodies and audit regulators to contribute to accounting and audit related matters
public sector audit offices in other jurisdictions to collaborate, and benchmark our performance
private sector audit firms to partner with them to deliver our financial audit services.
We also engage with members of the public, primarily through our website, providing opportunities to
suggest new performance audit topics, contribute to current performance audits, or raise issues about
financial waste and mismanagement of public resources.
To improve how we engage with our stakeholders, we have focused on improving our written communication
by investing in plain language skills. We have also refreshed our website to provide better access to
information about us, and to our reports and resources.

Annual report 2015–16 How we operate
30 | Queensland Audit Office
Workload and health We encourage our employees to participate in the annual public service Working for Queensland survey.
This year 74 per cent of our employees responded. This is a good response rate, which helps us to clearly
identify workplace issues.
This year’s survey assessed ten key workplace factors and, overall, we were in the top 20 per cent to 40 per
cent of public sector agencies for seven of them.
However, the most concerning insight from this survey is how our employees feel about their workload and
the impact it is having on their wellbeing. The survey revealed that a significant proportion of respondents are
experiencing issues in this area.
2016 survey result about workload and health
31%Little or no issue
29%Neutral
40%Issue or significant issue
Other responses within the survey provide more detail about this issue, with half of all participants feeling
overloaded with work, and about a third expressing:
feeling burned out
that they lack work/life balance
that work is having a negative impact on their health.
These concerns were expressed the strongest by participants from audit operations and are the same
concerns from last year’s survey. We had previously responded by:
implementing a strategic workforce plan focusing on employee health and wellbeing, and better matching
the demand for our services against the supply of suitably skilled resources
increasing the number of graduate opportunities within QAO
initiating continuous recruitment practices to identify suitable audit candidates before vacancies occurred
investigating measures to address public versus private sector market disparity for senior audit positions
focusing on workforce management and employee utilisation through our internal governance.
It is clear from the survey results that we need to do more.
Executive leaders received the results of the latest survey in July 2016, and quickly communicated them
within our organisation. We expect that issues in attracting the audit capabilities we need continued to
negatively impact these results.
Looking forward, we will continue to transform our workforce planning approach by leveraging capabilities
available in our new finance system. This will enable us to better measure and manage our workloads. But
we acknowledge that this does not solve this critical and sustained issue.
In addition, we will continue to pursue opportunities to strengthen the independence of the Auditor-General,
particularly in managerial and administrative autonomy. This will position us to review our working
arrangements and better align to a professional audit practice operating in the public sector and increase our
attraction.

Annual report 2015–16 How we operate
Queensland Audit Office | 31

Annual report: 2015–16
Financial and performance statements
Because we work in the public interest, funded by the parliament and public sector
entities, we focus on providing value-for-money services to our clients.
Our financial objective is to break-even over the medium term — to only recover
the cost of providing our services — and we manage any surpluses and deficits
over time to achieve this result.
This year we budgeted for a deficit of $0.748 million.
Our operating result for 2015–16 was a net loss of $0.311 million, which is a better
result than we had budgeted for. Our forecast indicates that we will return to a
near break-even position in 2017–18, in line with our financial objective.
We project to remain financially sustainable into the forward estimates — through
to the end of 2019–20 as we continue to pursue operational efficiencies. Also, an
annual increase of 2.5 per cent to our basic fee rates has been approved to
counter increased organisational costs. This increase will apply each year from 1
October 2016 to 1 October 2019.
This section contains: our financial statements
our performance statement
independent auditor reports from Nexia Australia.

Annual report 2015–16 Financial and performance statements
Queensland Audit Office | 33
Financial statements
Queensland Audit Office Financial Statements
For the year ended 30 June 2016
Contents Statement of Comprehensive Income Statement of Financial Position Statement of Changes in Equity Statement of Cash Flows Notes to and forming part of the Financial Statements Certificate of the Queensland Audit Office Independent Audit Report
General Information These financial statements cover the Queensland Audit Office (QAO) for the 2015–16 financial year. QAO is an office established under the Auditor-General Act 2009 to support the Auditor-General in providing independent public sector auditing services and reporting. For financial reporting purposes, QAO is a department in terms of the Financial Accountability Act 2009 and is subsequently consolidated into the Report on State Finances of the Queensland Government. The head office and principal place of business is:
Level 14, 53 Albert Street BRISBANE QLD 4000
A description of the nature of QAO’s operations and its principal activities is included in the notes to the financial statements. For information relating to QAO’s financial report please call (07) 3149 6000, email [email protected] or visit the QAO’s internet site www.qao.qld.gov.au.

Annual report 2015–16 Financial and performance statements
34 | Queensland Audit Office
Queensland Audit Office
Statement of Comprehensive Income
Year ended 30 June 2016
Notes 2016
$’000 2015
$’000
Income from Continuing Operations
Audit fees 2(i) 37 146 37 575
Appropriation revenue for services 2(ii) 6 422 6 343
Other revenue 2(iii) 872 756
Total Revenue 44 440 44 674
Other Income – Gain on lease .. 743
Total Income from Continuing Operations 44 440 45 417
Expenses from Continuing Operations
Employee expenses 3 20 838 20 474
Supplies and services 4 23 189 22 430
Depreciation and amortisation 8 301 150
Other expenses 5 423 516
Total Expenses from Continuing Operations 44 751 43 570
Total Operating Result from Continuing Operations/Comprehensive Income
(311) 1 847
The accompanying notes form part of these statements.

Annual report 2015–16 Financial and performance statements
Queensland Audit Office | 35
Queensland Audit Office
Statement of Financial Position
As at 30 June 2016
Notes 2016
$’000 2015
$’000
Current Assets
Cash and cash equivalents 1(d) 4 611 4 608
Work in progress 6 3 637 2 030
Receivables 7 1 936 4 616
Other current assets 173 390
Total Current Assets 10 357 11 644
Non-Current Assets
Plant and equipment 8(c)(a) 403 505
Intangible assets 8(c)(b) 985 50
Other financial assets 10 10
Total Non-Current Assets 1 398 565
Total Assets 11 755 12 209
Current Liabilities - Payables and accruals 9 1 505 1 824
Non-Current Liabilities - Provision for lease 10 242 66
Total Liabilities 1 747 1 890
Net Assets 10 008 10 319
Equity
Contributed equity 5 183 5 183
Accumulated surplus 4 825 5 136
Total Equity 10 008 10 319
The accompanying notes form part of these statements.

Annual report 2015–16 Financial and performance statements
36 | Queensland Audit Office
Queensland Audit Office
Statement of Changes in Equity
for the year ended 30 June 2016
Accumulated
Surplus $’000
Contributed Equity $’000
Total $’000
Balance as at 1 July 2015 5 136 5 183 10 319
Operating result from continuing operations (311) .. (311)
Balance as at 30 June 2016 4 825 5 183 10 008
Accumulated
Surplus $’000
Contributed Equity $’000
Total $’000
Balance as at 1 July 2014 3 289 5 183 8 472
Operating result from continuing operations 1 847 .. 1 847
Balance as at 30 June 2015 5 136 5 183 10 319
The accompanying notes form part of these statements.
Annual report 2015–16 Financial and performance statements
Queensland Audit Office | 37
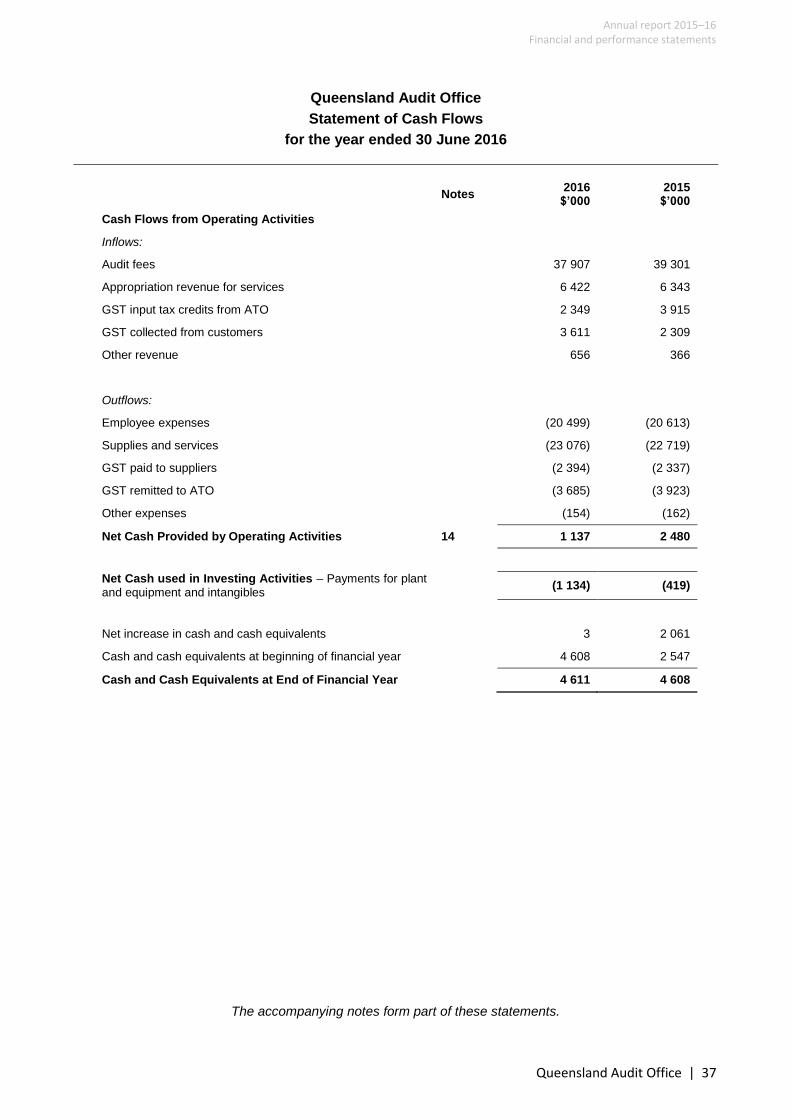
Queensland Audit Office
Statement of Cash Flows
for the year ended 30 June 2016
Notes 2016
$’000 2015
$’000
Cash Flows from Operating Activities
Inflows:
Audit fees 37 907 39 301
Appropriation revenue for services 6 422 6 343
GST input tax credits from ATO 2 349 3 915
GST collected from customers 3 611 2 309
Other revenue 656 366
Outflows:
Employee expenses (20 499) (20 613)
Supplies and services (23 076) (22 719)
GST paid to suppliers (2 394) (2 337)
GST remitted to ATO (3 685) (3 923)
Other expenses (154) (162)
Net Cash Provided by Operating Activities 14 1 137 2 480
Net Cash used in Investing Activities – Payments for plant and equipment and intangibles
(1 134) (419)
Net increase in cash and cash equivalents 3 2 061
Cash and cash equivalents at beginning of financial year 4 608 2 547
Cash and Cash Equivalents at End of Financial Year 4 611 4 608
The accompanying notes form part of these statements.

Queensland Audit Office
Notes to the Financial Statements
for the year ended 30 June 2016
38 | Queensland Audit Office
1. Summary of Significant Accounting Policies
QAO is a not-for-profit entity with the objective to strengthen public sector accountability by providing
independent audit services, including reporting to Parliament.
Significant accounting policies are shown in the notes to which they relate, except as follows:
(a) Statement of compliance
The financial statements are general purpose financial statements which have been prepared on an
accrual basis, except for the statement of cash flows, in accordance with:
section 42 of the Financial and Performance Management Standard 2009
applicable Australian Accounting Standards and Interpretations
Queensland Treasury’s Minimum Reporting Requirements for reporting periods beginning on or after
1 July 2015.
The historical cost convention is used, unless otherwise stated. This means that assets and liabilities are
initially recorded at their fair value and subsequently measured at amortised cost.
(b) Currency and Rounding
Amounts included in the financial statements are in Australian dollars and have been rounded to the
nearest $1 000 or, where that amount is less than $500, to zero unless disclosure of the full amount is
specifically required.
(c) Taxation
QAO is a state body as defined under the Income Tax Assessment Act 1936 and is exempt from
Commonwealth taxation except for Fringe Benefits Tax (FBT) and Goods and Services Tax (GST).
Revenues, expenses and assets are recognised exclusive of GST, except:
receivables and payables, which include input tax credits and GST payable, and the net amount due
to or receivable from the Australian Tax Office (ATO)
where the amount incurred is not recoverable from the ATO.
The GST components of cash flows arising from investing activities which are recoverable from, or
payable to the ATO are included as operating cash flows.
(d) Cash and cash equivalents
Cash assets comprise funds at call with the Commonwealth Bank of Australia.
(e) New and revised accounting standards not yet effective
At the date of authorisation of the financial report, the expected impacts of new or amended Australian
Accounting Standards issued but with future commencement dates are set out below:
AASB 124 Related Party Disclosures
From reporting periods beginning on or after 1 July 2016, the QAO will need to comply with the
requirements of AASB 124 Related Party Disclosures. This accounting standard requires a range of
disclosures about the remuneration of key management personnel and transactions with related
parties/entities. We already comply with the requirements of Queensland Treasury to disclose the
remuneration expenses for key management personnel (refer to Note 3(b)). Therefore, the most
significant implications of AASB 124 for our financial statements will be new disclosures about any
transactions with related parties, including transactions with key management personnel or close
members of their families.

Queensland Audit Office
Notes to the Financial Statements
for the year ended 30 June 2016
Queensland Audit Office | 39
1. Summary of Significant Accounting Policies (continued)
AASB 15 Revenue from Contracts with Customers
This standard will become effective from reporting periods beginning on or after 1 January 2018 and
contains detailed requirements for the accounting for certain types of revenue from customers.
Depending on the specific contractual terms, the new requirements may result in a change to the timing
of revenue from the QAO's services, such that some revenue may need to be deferred to a later
reporting period to the extent that we have received cash but not met associated obligations.
AASB 16 Leases
This standard will become effective for reporting periods beginning on or after 1 January 2019. When
applied, the standard supersedes AASB 117 Leases, AASB Interpretation 4 Determining whether an
Arrangement contains a Lease, AASB Interpretation 115 Operating Leases – Incentives and AASB
Interpretation 127 Evaluating the Substance of Transactions Involving the Legal Form of a Lease.
Unlike AASB 117 Leases, AASB 16 introduces a single lease accounting model and requires a lessee
to recognise assets and liabilities for all leases with a term of more than 12 months, unless the
underlying asset is of low value. A lessee is required to recognise a right-of-use asset representing its
right to use the underlying asset and a lease liability representing its obligations to make lease
payments.
A lessee measures a right-of-use asset similarly to other non-financial assets (such as property, plant
and equipment) and lease liabilities similarly to other financial liabilities. As a consequence, a lessee
recognises depreciation of the right-of-use asset and interest on the lease liability, and also classifies
cash repayments of the lease liability into a principal portion and an interest portion, and presents them
in the statement of cash flows applying AASB 107 Statement of Cash Flows.
Although QAO anticipates that the adoption of AASB 16 will impact the QAO’s financial statements, it is
impractical at this stage to provide a reasonable estimate of such impact.
(f) Issuance of financial statements
The financial statements are authorised for issue by the Auditor-General of Queensland and the Chief
Financial Officer at the date of signing the Certificate of the Queensland Audit Office.
2. Revenue
QAO charges fees for our financial audit services on a full cost recovery basis.
QAO also receives parliamentary appropriation for:
the operation of the statutory Office of the Auditor-General
the conduct of performance audits
reporting to Parliament on the results of financial and performance audits performed
providing advice and assistance to the Parliament and central agencies.
(i) Audit fees for services to the public sector
QAO recognises revenue from audit fees when the work is undertaken. This includes audit work
completed by contracted audit firms on behalf of QAO.

Queensland Audit Office
Notes to the Financial Statements
for the year ended 30 June 2016
40 | Queensland Audit Office
2. Revenue (continued)
(ii) Appropriation revenue for services to the Parliament
QAO recognises appropriation revenue in the year when the services are performed, which matches the
timing of cash transfers made by Queensland Treasury under the Appropriation (Parliament) Bill 2015.
2016 $’000
2015 $’000
Revenue
Budgeted departmental services appropriation 6 401 6 486
Queensland Treasury adjustments 21 (143)
Total 6 422 6 343
(iii) Other Revenue 2016
$’000 2015 $’000
Licence fees 432 487
Storage services received free of charge 201 269
Recovery of costs for Energex Performance Audit report 148 ..
Miscellaneous receipts 91 ..
Total 872 756
3. Employee Expenses 2016
$’000 2015
$’000
Employee Benefits
Wages, salaries and sick leave 16 272 15 510
Annual leave levy 1 815 1 894
Long service leave levy 369 368
Employer superannuation contributions 2 211 2 137
Fringe benefits tax 70 71
Other employee benefits – voluntary early retirement .. 449
Service payment – non-renewal of contract 54 ..
Total 20 791 20 429
Employee Related Expenses - WorkCover Queensland premium 47 45
Total 20 838 20 474
The number of employees on a full-time equivalent (FTE) basis under the Minimum Obligatory Human Resource Information (MOHRI) classification methodology is:
2016 2015
Number of employees as at 30 June 179 189
(a) Employee benefits
Employee benefits include employer superannuation contributions, annual leave levies and long service
leave levies.
Workers’ compensation insurance is not included in an employee’s total remuneration package, and is
recognised separately as employee related expenses.

Queensland Audit Office
Notes to the Financial Statements
for the year ended 30 June 2016
Queensland Audit Office | 41
3. Employee Expenses (continued)
(i) Wages, salaries and sick leave
Wages and salaries are recognised at current salary rates as it is expected these liabilities will be wholly
settled within 12 months of year end. Sick leave is recognised as an expense when the leave is taken.
(ii) Annual leave and long service leave
QAO is a member of the Queensland Government’s Annual Leave and Long Service Leave Schemes.
QAO pays a levy to these schemes to cover the cost of employees’ annual leave (including leave
loading and on-costs) and long service leave. QAO expenses these levies in the period in which they
are payable and claims from these schemes quarterly in arrears for amounts paid to employees for
leave taken.
QAO does not recognise a provision for annual leave or long service leave as these liabilities are held
and disclosed in the Report on State Finances of the Queensland Government pursuant to AASB 1049
Whole of Government and General Government Sector Financial Reporting.
(iii) Superannuation
QSuper is the preferred superannuation scheme for Queensland Government. QAO pays employer
superannuation contributions at rates determined by the Treasurer on the advice of the State Actuary.
QAO expensed contributions in the period in which they are paid or payable and our obligation is limited
to our contribution to QSuper.
The QSuper scheme has defined benefit and defined contribution categories. The liability for defined
benefits is held and disclosed in the Report on State Finances of the Queensland Government pursuant
to AASB 1049 Whole of Government and General Government Sector Financial Reporting
(b) Key executive management personnel and remuneration
(i) Key executive management personnel
Details of key executive management personnel are disclosed in accordance with section 3C of the
Financial Reporting Requirements for Queensland Government Agencies issued by Queensland
Treasury. Key executive management personnel encompasses those positions which form part of the
Executive Management Group. This group had the authority and responsibility for planning, directing
and controlling the activities of the QAO during 2015–16.
Auditor-General – A Greaves (CEO) – under the Auditor-General Act 2009 provides Parliament with
independent assurance of public sector accountability and performance as defined in the
Auditor-General Act 2009.
Deputy Auditor-General – A Close SES3 (s.122) – under the Public Service Act 2008 manages the
financial and performance audit functions of QAO as well as the non-audit responsibilities as Chief
Operating Officer.
Assistant Auditors-General – under the Public Service Act 2008 lead and set the strategic direction for
the delivery of audit services to enhance effective public sector accountability.
Further information on these positions is in the Annual Report under How We Operate section.
(ii) Remuneration
The remuneration policy for QAO’s key executive management personnel is set by the Queensland
Public Service Commission as provided for under the Public Service Act 2008. Individual remuneration
and other terms of employment are specified in employment contracts.

Queensland Audit Office
Notes to the Financial Statements
for the year ended 30 June 2016
42 | Queensland Audit Office
3. Employee Expenses (continued)
Remuneration packages comprise the following components:
Short term employee benefits which include:
Base — salary, incentives, allowances and leave entitlements paid and accrued for the year
or for that part of the year during which the employee occupied the specified position
Non-monetary benefits — car parking and the applicable fringe benefits tax
Long term employee benefits include long service leave accrued
Post-employment benefits include superannuation contributions
Redundancy payments are not provided for within individual contracts of employment. Contracts of employment provide only for notice periods or payments in lieu of notice on termination regardless of the reason for termination
Performance bonuses are not paid under the current contracts.
Total fixed remuneration is calculated on a “total cost” basis and includes the base and non-monetary benefits, long term employee benefits and post-employment benefits. Key executives have acted in higher positions during the year to cover leave.
Position (date resigned if applicable)
Name Short Term Employee Benefits
Long Term Employee
Benefits
Post-Employment
Benefits
Total Remuneration
Base Non-
Monetary
$’000 $’000 $’000 $’000 $’000
1 July 2015 – 30 June 2016
Auditor-General A Greaves 410 13 9 44 476
Deputy Auditor-General A Close 281 13 5 27 326
Assistant Auditor-General P Brahman 222 13 4 22 261
Assistant Auditor-General K Johnson 221 13 4 22 260
Assistant Auditor-General D Bird 258 13 5 27 303
Assistant Auditor-General
(Contract ended 14/10/15) M Booth* 230 5 2 6 243
Total 2016 1 869
1 July 2014 – 30 June 2015
Auditor-General A Greaves 410 13 9 44 476
Deputy Auditor-General A Close 269 13 5 26 313
Assistant Auditor-General P Brahman 210 13 4 20 247
Assistant Auditor-General K Johnson 209 13 4 20 246
Assistant Auditor-General
(Resigned 02/10/14) T Campbell* 115 4 1 5 125
Assistant Auditor-General
(Appointed 02/02/15) D Bird 103 4 2 11 120
Assistant Auditor-General M Booth 197 13 4 19 233
Total 2015 1 760
2015–16: *Total remuneration includes termination benefits of $35 270 and annual and long service leave entitlements of $122 201 (2015: $50 295).

Queensland Audit Office
Notes to the Financial Statements
for the year ended 30 June 2016
Queensland Audit Office | 43
4. Supplies and Services
2016 $’000
2015 $’000
Payment to contract auditors 14 123 13 547
Consultants and expert advice 2 210 2 627
Payments to employment agency personnel 1 964 1 508
Rent and office services 1 860 2 215
Information technology and minor office equipment 1 561 803
Staff development 362 346
Travel costs 443 536
Bureau charges 129 223
Other administrative costs 537 625
Total 23 189 22 430
5. Other Expenses
2016 $’000
2015 $’000
Internal audit fees 86 137
External audit fees* 58 52
Insurance premiums – QGIF 78 58
Storage services received free of charge 201 269
Total 423 516
* Total audit fees due to Nexia Australia (formerly Hayes Knight Audit (Qld) Pty Ltd) relating to the 2015-16 financial year are $32 000 (2014-15: $31 500). Further assurance services in relation to an audit of the Service Delivery Statement - Key Performance Indicators are valued at a cost of $7 200 (2014-15: $7 000).
6. Work in Progress
Work in progress represents services performed but not yet invoiced and is based on:
weekly timesheets and hourly rates for each level of staff. The rates are decided by the Auditor-
General to provide for full cost recovery at the beginning of each year and approved by the Treasurer
costs of work undertaken for QAO by contracted audit firms. The total estimated cost of contracted-
out work is agreed in advance of the work commencing, but may be subject to variations as the work
proceeds
outlays such as travel and accommodation directly incurred in completing the work that are yet to be
recovered.
The recoverability of work in progress is regularly reviewed and an allowance for impairment is provided
if there is evidence that amounts are not fully recoverable.
As at reporting date, all work in progress is assessed as fully recoverable. The bases of our
assessment are:
no dispute by clients
no unexplained overdue WIP
no amount outstanding for entities that no longer exist, and
good quality credit history with the majority of our clients being Government entities.

Queensland Audit Office
Notes to the Financial Statements
for the year ended 30 June 2016
44 | Queensland Audit Office
7. Receivables
Receivables represent amounts owed to QAO at year end.
Receivables are recognised when an invoice is issued and work in progress is reduced accordingly.
Invoices are issued periodically, based on milestones or final completion of the work. The total estimated
cost of audit engagements is communicated in advance of the work commencing, but may be subject to
variations as the work proceeds. Invoices are due for settlement within 14 days of invoice date.
All receivables are current and expected to be fully collectible based on good credit quality and recent
collection history.
8. Plant and Equipment and Intangible Assets
(a) Acquisition
All plant and equipment and intangible assets are initially recognised and subsequently measured at
cost. Cost comprises purchase price plus additional expenditure incurred to maintain the asset in the
condition necessary to be used as intended.
Assets are only recognised in the Statement of Financial Position where their initial acquisition costs
exceed $5 000 for plant and equipment and $100 000 for intangibles. Items costing less than these
amounts are included as expenses.
(b) Measurement
Assets are carried at their acquisition cost less accumulated depreciation/amortisation and any
accumulated impairment losses. Plant and equipment is depreciated on a straight line basis to allocate
the net cost of each asset, less its estimated remaining value, equally over its estimated useful life.
All intangible assets, including purchased and internally generated software, have finite useful lives and
are amortised on a straight line basis over the period of the expected benefit to QAO.
The depreciation/amortisation rates are:
Asset class Depreciation rate Basis Useful life
Plant and equipment 16.7% to 33.3% Straight line 3 to 6 years
Intangible assets Amortisation rate Basis Useful life
Software purchased 12.5% to 20.0% Straight line 5 to 8 years
Software internally generated 12.5% to 33.3% Straight line 3 to 8 years
2016 $’000
2015 $’000
Audit fees receivable 1 680 4 048
Annual leave reimbursement 139 351
Long service leave reimbursement 102 216
Other receivables 15 1
Total 1 936 4 616

Queensland Audit Office
Notes to the Financial Statements
for the year ended 30 June 2016
Queensland Audit Office | 45
8. Plant and Equipment and Intangible Assets (continued)
(c) Impairment
All plant and equipment and intangible assets are assessed annually for indicators of impairment. If an
indicator of possible impairment exists, QAO determines the asset’s recoverable amount. Any amount
by which the asset’s carrying amount exceeds the recoverable amount is recorded as an impairment
loss. Impairment losses are recognised immediately in the Statement of Comprehensive Income.
2016
$’000 2015
$’000
(a) Plant and Equipment
Plant and equipment
At cost 1 048 884
Accumulated depreciation (645) (536)
Total 403 348
Work in progress – at cost .. 157
Total 403 505
Plant and Equipment Reconciliation
Carrying amount at 1 July 2015 505 197
Acquisitions 152 261
Disposals (145) ..
Depreciation (254) (110)
Accumulated depreciation on disposal 145 ..
Work in progress .. 157
Carrying amount at 30 June 2016 403 505
(b) Intangible Assets
Software purchased
At cost 1 090 759
Accumulated amortisation (767) (759)
Total
323 ..
Software internally generated
At cost 790 790
Accumulated amortisation (780) (740)
Total 10 50
Work in progress – at cost 652 ..
Total 985 50
Intangible Assets Reconciliation
Carrying amount at 1 July 2015 50 90
Acquisitions 330 ..
Amortisation (47) (40)
Work in progress 652 ..
Carrying amount at 30 June 2016 985 50
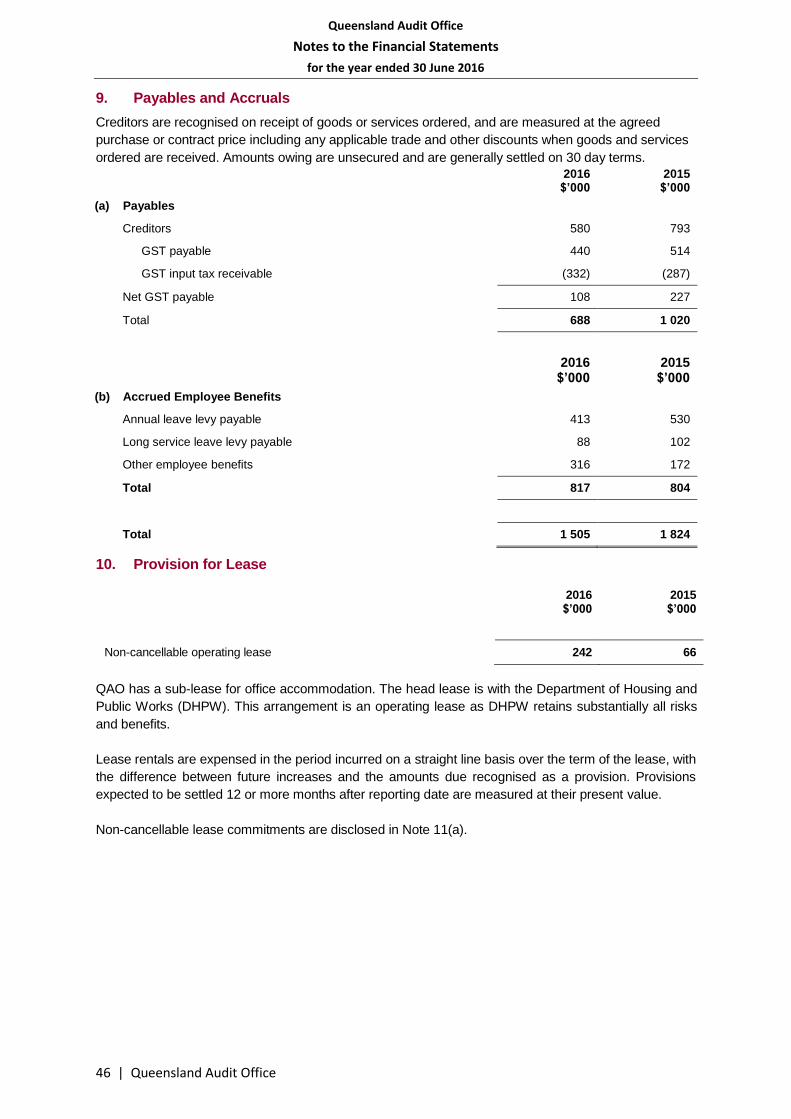
Queensland Audit Office
Notes to the Financial Statements
for the year ended 30 June 2016
46 | Queensland Audit Office
9. Payables and Accruals
Creditors are recognised on receipt of goods or services ordered, and are measured at the agreed
purchase or contract price including any applicable trade and other discounts when goods and services
ordered are received. Amounts owing are unsecured and are generally settled on 30 day terms.
2016
$’000 2015
$’000
(a) Payables
Creditors 580 793
GST payable 440 514
GST input tax receivable (332) (287)
Net GST payable 108 227
Total 688 1 020
2016
$’000 2015
$’000
(b) Accrued Employee Benefits
Annual leave levy payable 413 530
Long service leave levy payable 88 102
Other employee benefits 316 172
Total 817 804
Total 1 505 1 824
10. Provision for Lease
QAO has a sub-lease for office accommodation. The head lease is with the Department of Housing and
Public Works (DHPW). This arrangement is an operating lease as DHPW retains substantially all risks
and benefits.
Lease rentals are expensed in the period incurred on a straight line basis over the term of the lease, with
the difference between future increases and the amounts due recognised as a provision. Provisions
expected to be settled 12 or more months after reporting date are measured at their present value.
Non-cancellable lease commitments are disclosed in Note 11(a).
2016 $’000
2015 $’000
Non-cancellable operating lease 242 66

Queensland Audit Office
Notes to the Financial Statements
for the year ended 30 June 2016
Queensland Audit Office | 47
11. Commitments for Expenditure
2016
$’000 2015
$’000
(a) Non-cancellable Operating Lease
Not later than one year 1 461 1 398
Later than one year and not later than five years 7 597 7 991
More than five years .. 1 067
Total 9 058 10 456
(b) Future Auditing Services Under Contract
Not later than one year 11 866 14 240
Later than one year and not later than five years 6 129 5 596
Total 17 995 19 836
(c) Other Contracts – Not later than one year 847 ..
Total 27 900 30 292
All commitments in existence at reporting date are inclusive of non-recoverable GST input tax credits.
These commitments have not been recognised as liabilities in the financial statements (except for the
provision included in note 10) as services are yet to be performed under these contracts. Audit contracts
commencing 2017 are not included above as contracts were not finalised at reporting date.
12. Budget to Actual Comparison
Statement of Comprehensive Income Notes
2016 Budget
2016 Actual
Variance % of 2016
$’000 $’000 $’000 Budget
Income from Continuing Operations
Audit fees V1 34 825 37 146 2 321 7%
Appropriation revenue for services 6 401 6 422 21 0%
Other revenue 730 872 142 19%
Total Income from Continuing Operations 41 956 44 440 2 484 6%
Expenses from Continuing Operations
Employee expenses V2 21 637 20 838 (799) (4%)
Supplies and services V3 20 385 23 189 2 804 14%
Depreciation and amortisation 432 301 (131) (30%)
Other expenses 250 423 173 69%
Total Expenses from Continuing Operations 42 704 44 751 2 047 5%
Operating Result from Continuing Operations/Comprehensive Income
(748) (311) 437 (58%)

Queensland Audit Office
Notes to the Financial Statements
for the year ended 30 June 2016
48 | Queensland Audit Office
12. Budget to Actual Comparison (continued)
Statement of Financial Position Notes
2016 Budget
2016 Actual
Variance % of 2016
$’000 $’000 $’000 Budget
Current Assets
Cash and cash equivalents V4 3 109 4 611 1 502 48%
Work in progress V5 2 500 3 637 1 137 45%
Receivables V4 4 198 1 936 (2 262) (54%)
Other current assets 404 173 (231) (57%)
Total Current Assets 10 211 10 357 146 1%
Non-Current Assets
Plant and equipment 587 403 (184) (31%)
Intangible assets 994 985 (9) (1%)
Other financial assets 10 10 0 0%
Total Non-Current Assets 1 591 1 398 (193) (12%)
Total Assets 11 802 11 755 (47) 0%
Current Liabilities - Payables and accruals V4 2 638 1 505 (1 133) (43%)
Non-Current Liabilities - Provision for lease V6 531 242 289 54%
Total Liabilities 3 169 1 747 (1 422) (45%)
Net Assets/Total Equity 8 633 10 008 1 375 16%

Queensland Audit Office
Notes to the Financial Statements
for the year ended 30 June 2016
Queensland Audit Office | 49
12. Budget to Actual Comparison (continued)
Statement of Cash Flows Notes
2016 Budget
2016 Actual
Variance % of 2016
Cash Flows from Operating Activities $’000 $’000 $’000 Budget
Inflows:
Audit fees V1 35 041 37 907 2 866 8%
Appropriation revenue for services 6 401 6 422 21 0%
GST input tax credits from ATO V7 .. 2 349 2 349 2 349%
GST collected from customers 3 528 3 611 83 2%
Other revenue 455 656 201 44%
Outflows:
Employee expenses (21 493) (20 499) 994 5%
Supplies and services V3 (20 377) (23 076) (2 699) 13%
GST paid to suppliers (2 011) (2 394) (383) 19%
GST remitted to ATO V7 (1 517) (3 685) (2 168) 143%
Other expenses (250) (154) 96 (38%)
Net Cash Provided by/(used in) Operating Activities
(223) 1 137 1 360 (610%)
Net Cash used in Investing Activities – Payments for plant and equipment and intangibles
V8 (1 396) (1 134) 262 (19%)
Increase/(Decrease) in Cash and Cash Equivalents
(1 619) 3 1 622 (100%)
Explanation of Major Variances
V1. Actual audit fees were higher than budget mostly due to additional audit service providers
recovery ($1 491 372) and work carried over from 2014–15 ($781 875). Higher corresponding
expenses for audit service providers are included in supplies and services. Refer to variance
note V3.
V2. The variance is due to a lower average number of employees (7 FTEs) than budget as we
experienced difficulty in attracting and retaining people with audit capabilities.
V3. The majority of this variance is attributable to higher expenses for audit service providers ($1
491 372), and additional seasonal use of contracted-in auditors ($1 017 397) and other
specialist contractors ($254 141), mostly in line with a higher program of financial audit.
V4. The actual cash and cash equivalents are higher than expected mainly due to a concerted effort
made by management to reduce debtors and creditors to a minimum in preparation for the roll-
out of the new Finance system.
V5. The actual work in progress is higher than budget as customer billings are normally finalised on
30 June, however for the 15-16 Financial year the final billing run was one week earlier to
prepare for the roll-out of the new Finance system. This is partially contributed to a decrease in
the receivables balance.

Queensland Audit Office
Notes to the Financial Statements
for the year ended 30 June 2016
50 | Queensland Audit Office
12. Budget to Actual Comparison (continued)
V6. The variance in non-current provisions for lease is due to the release of deferred lease liability
as the new lease agreement was signed after the budget. QAO’s accommodation lease
payments are recognised and expensed over the full term of the lease.
V7. The variances are attributable to a change in GST methodology with GST input tax credits from
ATO and GST payments remitted to ATO being disclosed separately.
V8. The decrease in payments to plant and equipment and intangibles are mainly due to timing of
ICT work program and lower capital acquisition for the new Finance system.
13. Financial Instruments
Financial assets and financial liabilities are recognised in the Statement of Financial Position on
agreement to the contractual provisions of the financial instrument. The QAO has the following
categories of financial instruments:
(a) Classification
Financial Assets 2016 $’000
2015 $’000
Cash and cash equivalents (fair value through profit or loss) 4 611 4 608
Work in progress (amortised cost) 3 637 2 030
Receivables (amortised cost) 1 936 4 616
Other financial assets (fair value through profit or loss) 10 10
Total 10 194 11 264
Financial Liabilities - Payables and accrued employee benefits (amortised cost)
1 505 1 824
(b) Financial Risk Management
QAO’s activities expose it to credit risk and liquidity risk. Financial risk management is implemented
pursuant to Government and QAO policies. These policies focus on the financial performance of QAO
over the medium term. Primary responsibility for the management of financial risk rests with the Chief
Financial Officer under the authority of the Executive Management Group, with oversight and monitoring
by the Audit and Risk Management Committee.
QAO’s bank account is included in the whole-of-government set-off arrangement managed by
Queensland Treasury. The overdraft limit of the whole-of-government group is $75 million. The account
does not earn interest on surplus funds nor is interest charged on overdrawn funds. Interest
earned/charged on the aggregate set-off arrangement accrues to the Consolidated Fund of the State.
(c) Credit Risk Exposure
QAO may incur financial loss as a result of another party to a financial instrument failing to discharge
their obligation.
The maximum exposure to credit risk at balance date is the gross carrying amount of each category of
recognised financial asset inclusive of any allowance for impairment.
No collateral is held as security and no credit enhancements relate to the financial assets held by QAO.

Queensland Audit Office
Notes to the Financial Statements
for the year ended 30 June 2016
Queensland Audit Office | 51
13. Financial Instruments (continued)
No financial assets had their terms renegotiated to prevent them from being past due or impaired and
are stated at the carrying amounts as indicated. There were no individually impaired financial assets in
the current or previous period.
Ageing of Financial Assets (not impaired) Overdue
Receivables
Less than 30 days
30-60 days
61-90 days
More than 90 days
Total Financial Assets
$’000 $’000 $’000 $’000 $’000
2016 1 936 .. .. .. 1 936
2015 4 197 226 47 146 4 616
(d) Liquidity Risk
Liquidity risk refers to the situation where QAO may encounter difficulty in meeting obligations
associated with financial liabilities that are settled by delivering cash or another financial asset.
QAO ensures it has sufficient funds available to meet financial obligations when they fall due by
maximising its bank account balance and through an approved corporate card facility with a $200 000
limit. At year end, $175 000 (2015: $153 000) was available in this facility.
An approved overdraft facility of $2 million approved for QAO by the Treasurer was not used during the
financial year.
As at 30 June 2016, QAO’s financial liabilities are all payable and accruals that fall due within 12
months.
(e) Fair Value
The carrying amounts of receivables and payables, which represent the value of the original
transactions less any allowance for impairment, are consistent with the fair values of these balances.
14. Reconciliation of Operating Surplus to Net Cash from Operating Activities
2016 $’000
2015 $’000
Operating Surplus/(Deficit) (311) 1 847
Non-cash items included in operating result:
Depreciation and amortisation expense 301 150
Gain on Lease .. (743)
Services performed for other State Audit Offices .. 19
Change in assets and liabilities:
(Increase)/decrease in work in progress (1 607) 1 235
Decrease in receivables 2 680 638
(Increase)/decrease in other current assets 217 (54)
Decrease in payables (213) (645)
Increase in accrued employee benefits 13 77
Decrease in GST payable (119) (35)
Increase/(decrease) in provision 176 (9)
Net Cash from Operating Activities 1 137 2 480

Annual report 2015–16 Financial and performance statements
52 | Queensland Audit Office
Certificate of the Queensland Audit Office

Annual report 2015–16 Financial and performance statements
Queensland Audit Office | 53
Independent Audit Report

Annual report 2015–16 Financial and performance statements
54 | Queensland Audit Office

Annual report 2015–16 Financial and performance statements
Queensland Audit Office | 55
Performance statement
Queensland Audit Office Performance Statement
For the year ended 30 June 2016
Contents Performance Comparison – Target to Actual Notes to and forming part of the Performance Statement Certificate of the Queensland Audit Office Independent Audit Report
General Information This performance statement covers the Queensland Audit Office (QAO) for the 2015–16 financial year. QAO is an office established under the Auditor-General Act 2009 to support the Auditor-General in providing independent public sector auditing services and reporting. The head office and principal place of business is:
Level 14, 53 Albert Street BRISBANE QLD 4000
For information relating to QAO’s performance report please call (07) 3149 6000, email [email protected] or visit the QAO’s internet site www.qao.qld.gov.au.

Annual report 2015–16 Financial and performance statements
56 | Queensland Audit Office
Queensland Audit Office
Performance Statement
Year ended 30 June 2016
Performance comparison –actual to target
The accompanying notes form part of these statements
Service standards Notes Target Actual Variance
Service area: Independent Public Sector Auditing
Service: Reports and Advice to Parliament
Effectiveness measures
Parliament’s overall satisfaction with services (%) 1 80 81 1 favourable
Audit entities’ overall satisfaction with performance audit
services (ip) 1 80 77 - 3 unfavourable
Performance audit recommendations implemented by
audited entities (%) 2 100 66.7 - 33.3 unfavourable
Benefits from performance audits (benefit-cost ratio) 3 > 1 > 1 Nil favourable
Efficiency measures
Reports to parliament on the results of financial audits: 4, 5
Average cost of reports tabled ($ 000) $175.0 $158 3 - $16.7 favourable
Average time taken to produce reports (months) 5.0 5.8 0.8 unfavourable
Reports to parliament on the results of performance
audits: 4, 6
Average cost of reports tabled ($ 000) $390.0 $336.2 - $53.8 favourable
Average time taken to produce reports (months) < 8.0 8.3 0.3 unfavourable
Service: Reports and Advice to the Public Sector
Effectiveness measures
Audit entities’ overall satisfaction with financial audit
services (ip) 1 80 78 - 2 unfavourable
Financial statement material error (%) 7 < 5.0 3.3 - 1.7 favourable
Efficiency measures
Average cost of financial audits
State entities ($ 000) 8, 9 $60.0 $79.2 $19 2 unfavourable
Local government entities ($ 000) 8, 10 $65.0 $67.0 $2.0 unfavourable

Annual report 2015–16 Financial and performance statements
Queensland Audit Office | 57
Notes to and forming part of the Performance Statement
Including the Explanation of Major Variances
1. Actual results are based on opinion surveys issued for the QAO by an independent organisation during
2015-16 to members of the Queensland Parliament and to our financial and performance audit clients
within the Queensland public sector.
Results for audit client measures are expressed as ‘index points’ (ip). This more accurately describes
the result when multiple survey factors are combined into a single value or score.
Actual results are within tolerance of our targets.
2. The ‘Percentage of performance audit recommendations implemented by audit entities’ is a new
measure of the impact of our work. Each year we follow-up clients that accepted recommendations
from our previous reports, to understand the extent to which our recommendations have been
implemented. This replaced our previous measure of the percent of recommendations accepted.
Actual results are based on client responses for eight performance reports that we tabled in 2013-14.
Across all clients, there were 204 acceptances of our recommendations – which includes multiple
clients accepting the same recommendations to implement within their own entities. Client responses
indicate that of the 204 acceptances, 136 (67%) are fully implemented, and a further 57 (28%) are
partially implemented.
As a new performance measure, we expect our approach to measuring and setting targets to mature
over time. We will review this measure during 2016-17.
3. The ‘Benefits from performance audits’ is a new measure of the impact of our work. We introduced this
measure to provide greater transparency of the financial benefits to Queensland from our work. This
measure is reported as a benefit-cost ratio. A value greater than one, indicates that the benefits from
our performance audit program are greater than the cost of the program itself.
As a new performance measure, we expect our approach to measuring and setting targets to mature
over time. This process will require greater engagement with our clients as we work to improve our
transparency.
The actual result reported of ‘greater than one’ represents our assessment that the financial benefits
from our performance audit program is greater than the cost of the program we delivered in 2015-16
($4 370 378). The key benefit that supports this assessment is the potential for cost efficiencies in state
prisons based on our performance audit into the management of privately operated prisons. This audit:
reported that Queensland operates 10 high security prisons at a cost of $443 million per year - two
are privately managed, eight are publicly managed
identified that the operating costs of privately managed prisons are 19% lower than publicly
managed prisons
identified that medical costs alone at the two privately managed prisons would be $4.4 million per
year higher if they were publicly managed
recommended a cost-benefit analysis be completed of options for delivering medical services more
cost-effectively in prisons (which is expected to benefit all publicly managed prisons).
In addition to this, other key financial benefits include:
potential increased utilisation of public hospital operating theatres based on our performance audit
identifying 18 898 ‘lost’ hours over an 18 month period across 39 hospitals examined
potential reduction in duplicate grant payments based on our follow-up performance audit of grants
management for community benefit funds
potential reduction in overpayments to early childhood providers based on our performance audit
into early childhood education identifying payments made for ineligible age children.
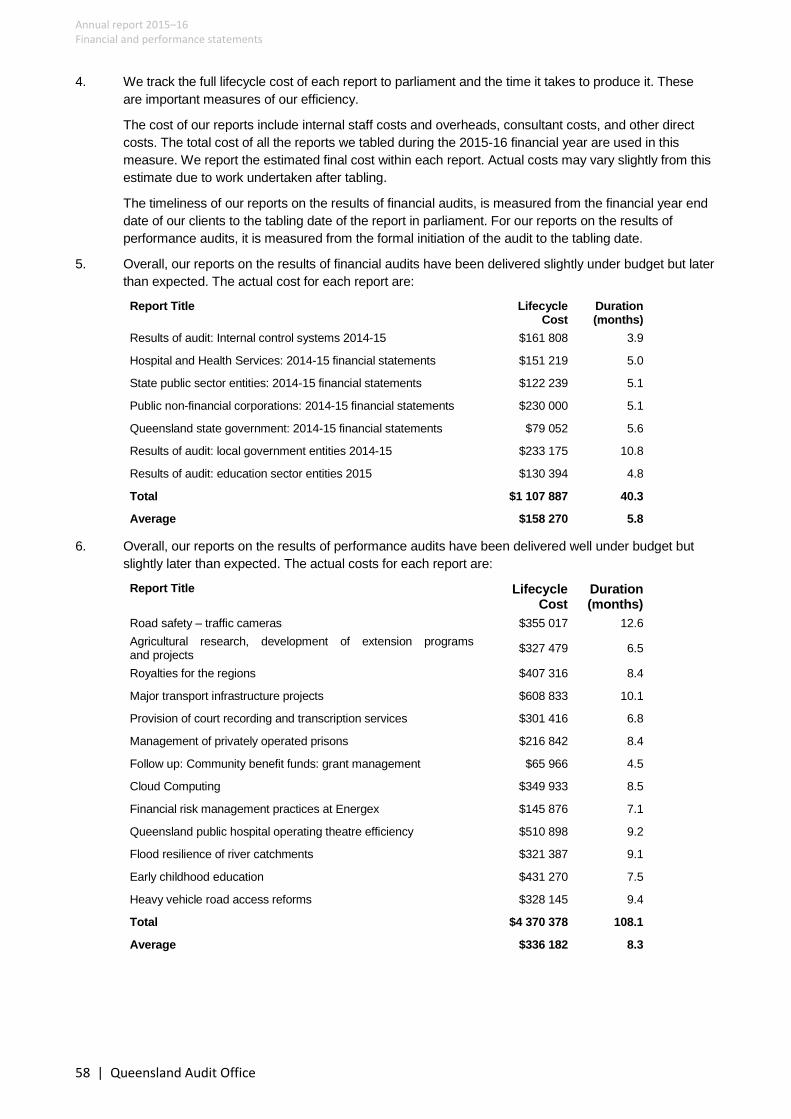
Annual report 2015–16 Financial and performance statements
58 | Queensland Audit Office
4. We track the full lifecycle cost of each report to parliament and the time it takes to produce it. These
are important measures of our efficiency.
The cost of our reports include internal staff costs and overheads, consultant costs, and other direct
costs. The total cost of all the reports we tabled during the 2015-16 financial year are used in this
measure. We report the estimated final cost within each report. Actual costs may vary slightly from this
estimate due to work undertaken after tabling.
The timeliness of our reports on the results of financial audits, is measured from the financial year end
date of our clients to the tabling date of the report in parliament. For our reports on the results of
performance audits, it is measured from the formal initiation of the audit to the tabling date.
5. Overall, our reports on the results of financial audits have been delivered slightly under budget but later
than expected. The actual cost for each report are:
Report Title Lifecycle Cost
Duration (months)
Results of audit: Internal control systems 2014-15 $161 808 3.9
Hospital and Health Services: 2014-15 financial statements $151 219 5.0
State public sector entities: 2014-15 financial statements $122 239 5.1
Public non-financial corporations: 2014-15 financial statements $230 000 5.1
Queensland state government: 2014-15 financial statements $79 052 5.6
Results of audit: local government entities 2014-15 $233 175 10.8
Results of audit: education sector entities 2015 $130 394 4.8
Total $1 107 887 40.3
Average $158 270 5.8
6. Overall, our reports on the results of performance audits have been delivered well under budget but
slightly later than expected. The actual costs for each report are:
Report Title Lifecycle Cost
Duration (months)
Road safety – traffic cameras $355 017 12.6
Agricultural research, development of extension programs and projects
$327 479 6.5
Royalties for the regions $407 316 8.4
Major transport infrastructure projects $608 833 10.1
Provision of court recording and transcription services $301 416 6.8
Management of privately operated prisons $216 842 8.4
Follow up: Community benefit funds: grant management $65 966 4.5
Cloud Computing $349 933 8.5
Financial risk management practices at Energex $145 876 7.1
Queensland public hospital operating theatre efficiency $510 898 9.2
Flood resilience of river catchments $321 387 9.1
Early childhood education $431 270 7.5
Heavy vehicle road access reforms $328 145 9.4
Total $4 370 378 108.1
Average $336 182 8.3

Annual report 2015–16 Financial and performance statements
Queensland Audit Office | 59
7. The ‘Financial statement material error’ is a new measure of our effectiveness. We introduced this
measure to provide greater transparency of the quality of our audit work.
This measure reports where there are material errors in prior year financial statements that we have
already provided an audit opinion on, and need to be corrected in the current year. During 2015-16,
there were 17 material errors identified that related to the prior year, in which a total of 515 audit
opinions had been provided.
This result is favourable against our target, however we aim to have no errors and include information
about these errors to inform our internal audit quality improvement activities.
8. We track the full lifecycle cost of each financial audit – for state and local government entities. The cost
of our audits include internal staff costs and overheads, contractor costs, and other direct costs. The
total cost of all the financial audits we completed during the 2015-16 financial year are used in this
measure.
9. Overall, our average cost of financial audits for state entities is 32% above target. The most significant
factor impacting this variance is a reduction in the number of opinions we produced. This reduction
occurs where entities cease to operate or where we rationalise the number of opinions we produce for
a client - providing a single opinion at the parent level rather than individual opinions for each separate
entity.
In 2014-15, 367 state entity opinions were produced with 77 (21%) of them not required in 2015-16.
The opinions not required, were for smaller audits which had an average cost of $8 051 in 2014-15.
Removing these opinions accounts for most of the variance in our average cost.
10. Overall, our average cost of financial audits for local government entities is within 3% of target. There
have been no significant changes in the number of audit opinions produced this year compared to last
year.

Annual report 2015–16 Financial and performance statements
60 | Queensland Audit Office
Certificate of the Queensland Audit Office

Annual report 2015–16 Financial and performance statements
Queensland Audit Office | 61
Independent Audit Report
Annual report 2015–16 Financial and performance statements
62 | Queensland Audit Office

Annual report 2015–16 Financial and performance statements
Queensland Audit Office | 63

Annual report 2015–16 Appendices
Appendices Appendix A — Reports to parliament 2015–16 65
Appendix B — Additional information 66
Appendix C — Audit professional service fees 69
Appendix D — Performance against our audit office peers 71
Appendix E — Compliance checklist 72
Appendix F — Glossary 74

Annual report 2015–16 Appendices
Queensland Audit Office | 65
Appendix A — Reports to parliament 2015–16
Number Title Date tabled in Legislative Assembly
1 Results of audit: Internal control systems 2014–15 July 2015
2 Road safety — traffic cameras October 2015
3 Agricultural research, development and extension programs and projects November 2015
4 Royalties for the regions December 2015
5 Hospital and Health Services: 2014–15 financial statements December 2015
6 State public sector entities: 2014–15 financial statements December 2015
7 Public non-financial corporations: 2014–15 financial statements December 2015
8 Transport infrastructure projects December 2015
9 Provision of court recording and transcription services December 2015
10 Queensland state government: 2014–15 financial statements December 2015
11 Management of privately operated prisons February 2016
12 Follow up Report 12: 2012–13 Community Benefits Funds: Grant Management February 2016
13 Cloud computing February 2016
14 Financial risk management practices at Energex April 2016
15 Queensland public hospital operating theatre efficiency April 2016
16 Flood resilience of river catchments April 2016
17 Results of audit: Local government entities 2014–15 May 2016
18 Results of audit: Education sector entities 2015 May 2016
19 Early childhood education June 2016
20 Heavy vehicle road access reforms June 2016

Annual report 2015–16 Appendices
66 | Queensland Audit Office
Appendix B — Additional information
This section contains additional information required for annual reporting purposes that is not already
contained in the main body of this report. This information is about:
Public Sector Ethics Act 1994
Audit and Risk Management Committee
internal audit
information systems and record keeping
workforce planning and performance.
Public Sector Ethics Act 1994
We are a signatory to the whole-of-government code of conduct established under the Public Sector
Ethics Act 1994, and we adhere to the Public Service Code of Conduct 2011 and a code of ethics for
professional accountants.
To proactively safeguard and promote ethical conduct we:
undertake pre-employment screening on all contractors and employees, including criminal history
and reference checks
require the completion of a comprehensive independence declaration, including details to help us
manage any potential conflicts of interest
train new recruits in public sector ethics and the Public Service Code of Conduct 2011, and
provide refresher training on ethical decision making
promote ourselves as an integrity agency and routinely discuss issues of ethics and integrity
among our workforce and clients.
Our internal policies, procedures, and practices align with ethical principles and values.
Audit and Risk Management Committee
The Audit and Risk Management Committee (ARMC) provides independent advice and assurance to
the Auditor-General in discharging his responsibilities. The ARMC does this through effective
oversight of the risk, control, and compliance frameworks and fiscal responsibilities underpinning our
corporate governance.
The ARMC has three external independent members and meets at least four times each year.
During 2015–16, the ARMC observed the terms of its charter, reviewing numerous matters including
business risks, internal and external audit plans and reports, risk management frameworks and
registers, financial statements, and strategic and operational plans. The Chair reports annually to the
Auditor-General on ARMC activities and makes recommendations to improve ARMC performance.
Audit and Risk Committee 2015–16
Member Term Meetings attended Remuneration
Mr Bob Grice AO (Chair)
FCA HonDPhil
Jun 12–Aug 17 4 of 4 $6 480
Professor Kerry Jacobs
BCom MCom(Hons) PhD FCA FCPA
May 13–Aug 16 4 of 4 $2 640
Mr Jeff Duthie
BBus(IT)
Jul 15–Aug 18 4 of 4 $2 640
Ms Christine Flynn
BA DipEd FAICD
Nov 11–Aug 15 1 of 1 $660
* All amounts exclude GST and do not include reimbursement of out-of-pocket expenses.
A number of other attendees regularly support the ARMC at its meetings, including our co-sourced
internal auditor, Ms Pamela Robertson-Gregg of O’Connor Marsden and Associates, and our external
auditor, Ms Ann-Maree Robertson of Nexia Brisbane Audit Pty Ltd.

Annual report 2015–16 Appendices
Queensland Audit Office | 67
Internal audit
Internal audit operates under an approved charter, with the head of internal audit reporting directly to
the Auditor-General. The charter aligns with International Standards for the Professional Practice of
Internal Auditing developed by the Institute of Internal Auditors. The primary role of internal audit is to
conduct independent, objective, and risk-based assurance activities. This function complies with
Treasury’s Audit Committee Guidelines.
Mr Brad Wilson, Executive Officer, is the head of internal audit, and develops an internal audit
program each year and submits it to the ARMC for approval. During 2015–16, seven internal audits
were finalised and one was deferred into 2016–17.
Information systems and record keeping
Effective record keeping is paramount to our successful operation.
During 2015–16, to maintain and improve the efficiency and effectiveness of our information
management and record keeping environment, we:
reviewed our classification of information assets to ensure ongoing compliance with the
Queensland Government Information Security Classification Framework, and confirmed that our
controls continue to provide appropriate protection from misuse or unintentional disclosure
continued to review and update information management policies related to information security,
records management, and intellectual property, and developed a number of supporting
frameworks
developed and released training material for our new and existing employees about information
management policies and frameworks, including specific training for our auditors about the
appropriate handling of client information
conducted regular quality assurance activities, including reviewing the integrity of metadata
relevant to electronic records and the availability and accuracy of physical records
disposed of 2 330 records under the General Retention and Disposal Schedule for Administrative
Records (QDAN 249 v.7) and Queensland Audit Office Retention and Disposal Schedule (QDAN
648 v.2)
commenced a review of our Queensland Audit Office Retention and Disposal Schedule (QDAN
648 v.2) to update the requirements for audit records and include new requirements for the client
data we use for audit analytics
commenced detailed planning for an electronic document and records management solution (for
implementing in 2016–17) to move more of our records from physical to digital, and improve our
compliance.
Workforce planning and performance
Our strategic workforce plan is focused on our capability and capacity, and our performance and
professionalism. Each year, we review our workforce needs during our corporate planning process.
This section includes additional information about our workforce.
Workforce numbers at 30 June 2016
Measure Value
QAO effective headcount (full time employees, part time employees, and contractors) 199
QAO effective full-time equivalents (expresses headcount as full time only) 191.50
Minimum Obligatory Human Resource Information* — effective headcount 185
Minimum Obligatory Human Resource Information* — effective full-time equivalents 178.76
* MOHRI measures are for public service reporting purposes.
During 2015–16, our separation rate for permanent employees was 15.5%. No redundancy, early
retirement, or retrenchment packages were paid.

Annual report 2015–16 Appendices
68 | Queensland Audit Office
Over the last few years, we have experienced difficulty in securing the numbers of experienced
auditors we need to deliver our services. In response, we have continued to focus on developing our
employees, increased our graduate recruitment intake, and supplemented our workforce with
contractors.
Continuing to develop our employees has included improving the way we manage performance,
investing in our audit and leadership capabilities, better identifying and managing our high potential
employees, and ensuring succession plans are in place and clearly communicated to those impacted.
During 2015–16, our employees received, on average, 50.9 hours per person of professional
development including workshop attendance, industry presentations, online learning, in-house
training, and induction activities for new starters.
We advocate for a diverse and inclusive workforce and we support the Queensland public sector
inclusion and diversity strategy 2015–2020. We are pleased with the representation of women in our
workforce; however, these results are not as strong in senior roles.
Workforce inclusion and diversity at 30 June 2016
Measure Value
Employees who are women 48.65%
Employees from non-English speaking backgrounds 25.95%
Employees with a disability 2.70%
Employees who identify as Aboriginal or Torres Strait Islanders 0.00%
We provide flexible working arrangements to support our employees to balance work and home
commitments. In the public service Working for Queensland survey for 2016, 59 per cent of
respondents indicated that they use flexible working arrangements.
Use of flexible working arrangements
Option Percentage of respondents
who indicated usage
Flexible work hours 37%
Hot desks 20%
Part-time work 14%
Telecommuting 10%
Leave at half pay 9%
Purchased leave/extended leave 2%
Other 1%
To promote a healthy workforce, we also encourage participation in our health and wellbeing
program, which includes flu vaccinations, health and fitness education, resilience training, and training
about managing mental health. We also promote our confidential Employee Assistance Program to all
employees.
During 2015–16, we made significant improvements to our work health safety system including
updates to policies and procedures, and increased awareness and training for employees.

Annual report 2015–16 Appendices
Queensland Audit Office | 69
Appendix C — Audit professional service fees
Firms providing financial audit services
Location 2014–15* 2015–16*
Deloitte Touche Tohmatsu Brisbane 3 235 777 3 336 494
Crowe Horwath Brisbane 1 396 793 1 639 432
Townsville 293 574 273 631
KPMG Brisbane 1 550 604 1 430 070
Grant Thornton Audit Pty Ltd Cairns 1 192 874 1 136 265
BDO Audit Pty Ltd Brisbane 313 947 352 115
Sunshine Coast 220 425 287 560
Cairns 14 508 284 569
PricewaterhouseCoopers Brisbane 590 441 679 559
Cairns 178 925 130 530
William Buck (QLD) Brisbane 686 873 751 069
Thomas Noble & Russell Lismore 704 987 626 310
Moore Stephens (Queensland) Audit Pty Ltd Townsville 336 023 451 397
Brisbane 141 750 141 068
Pitcher Partners Brisbane 464 026 574 667
Ernst & Young Brisbane 772 728 435 772
Altius Accountants and Advisors Pty Ltd Cairns 263 981 395 528
Bentleys Brisbane (Audit) Pty Ltd Brisbane 282 535 337 055
Bennett Partners Pty Ltd Mackay 193 945 255 001
Prosperity Audit Services Newcastle 324 048 241 038
Lawler Hacketts Audit Brisbane 93 163 109 138
UHY Haines Norton Brisbane 102 567 93 448
HLB Mann Judd (SE Qld Partnership) Brisbane 61 180 68 840
MGI Assurance (South Qld) Pty Ltd Brisbane 31 108 36 678
Priestleys Chartered Accountants Brisbane 64 018 36 589
Vincents Audit & Assurances Brisbane 13 110 21 810
Walsh Accounting Barcaldine - 1 000
BG Thebault & ML Conneely Brisbane 20 400 -
Total 13 544 310 14 126 633
* All amounts represent payments made during the financial year.

Annual report 2015–16 Appendices
70 | Queensland Audit Office
Firms providing performance audit services
Location 2014–15* 2015–16*
Arc Consultancy Brisbane 71 725 136 300
Chappell Dean Pty Ltd Terrigal - 72 000
KPMG Brisbane 69 256 71 376
AGINIC Brisbane 32 700 65 300
Sustainability Queensland Pty Ltd Brisbane 52 950 61 500
Arabon Audit &Assurance Brisbane 57 500
PricewaterhouseCoopers Sydney 148 143 54 965
Word Map Pty Ltd Melbourne 13 162 52 722
Bentleys Brisbane (Audit) Pty Ltd Brisbane - 52 210
Louise Elisabeth Alexander Brisbane - 48 000
Resolutions (Int) Pty Ltd Brisbane - 34 303
Syntura Pty Ltd Brisbane - 12 000
Writebusiness Brisbane 9 404 6 300
Vilridge Pty Ltd Sydney 297 080 5 983
Eva Abal Brisbane - 1 383
Roger Jack Shaw Brisbane - 922
Synergies Economic Consulting Pty Ltd Brisbane 57 360 -
Orima Research Pty Ltd Canberra 24 200 -
Marion Norton Brisbane 14 560 -
GHD Pty Ltd Brisbane 4 995 -
Transfield Services (Australia) Pty Ltd Fremantle 3 690 -
Camcomp Partners Pty Ltd Melbourne 2 100 -
Rocknotes Consulting Canberra 1 590 -
Credence Consulting Brisbane 1 255 7 392
Total 804 170 740 156
* All amounts represent payments made during the financial year.

Annual report 2015–16 Appendices
Queensland Audit Office | 71
Appendix D — Performance against our audit office peers
The Australasian Council of Auditors-General (ACAG) accepts membership from an Auditor-General
in audit jurisdictions within Australia, New Zealand, Fiji, and Papua New Guinea.
As members, audit office staff within the ACAG group collaborate to share knowledge, benchmark
performance, and improve audit practices and services. ACAG also provides a forum for
Auditors-General to form a collective opinion on accounting and auditing standards.
Key measures from the 2015–16 benchmarking activity are presented here to allow comparison
between our performance and ACAG averages. We have also included 2014–15 results to highlight
how each measure has moved from one year to the next.
Comparison of benchmarking results — QAO versus ACAG averages
Measure Units ACAG QAO QAO vs ACAG
2014–15 2015–16 Var. 2014–15 2015–16 Var. 2015–16
Staff available hours charged to audits1
Financial audit staff % 74 73 (1) 82 82 - 9
Performance audit staff % 65 66 1 75 73 (2) 7
All staff % 60 60 - 65 62 (3) 2
Reports to parliament on the results of performance audits2
Average cost $ 000’s 306 292 14 334 336 (2) (44)
Average duration months 8.9 9.0 (0.1) 8.7 8.3 0.4 0.7
Financial audits
Average cost3
State entities $ 000’s 69.6 77.9 (8.3) 76.5 93.9 (17.4) (16)
Local gov. entities $ 000’s 44.6 49.8 (5.2) 64.4 74.6 (10.2) (24.8)
Finalised within 3 months4 % 68 69 1 56 64 8 (5)
Hourly charge to audits5 $ 154 151 3 142 145 (3) 6
Support as a proportion of total audit office6
Full Time Equivalents % 20 18 2 22 23 (1) (5)
Total costs % 15 15 - 17 15 2 -
1. Our overall productivity remains strong against the ACAG average, with our financial audit staff
maintaining the high productivity levels of the prior year.
2. We have improved the average duration of our performance audits while the ACAG average has
slightly declined. We continued to deliver our performance audits faster, but our average cost is
about 15 per cent higher than the ACAG average.
3. Our average cost of a financial audit appears different in ACAG benchmarking results due to it
being calculated using financial year data instead of audit lifecycle data. That aside, the 2015–16
result is significantly impacted by a reduction in audit opinions.
4. The timeliness of our financial audits is below the ACAG average, but has improved significantly
on the prior year.
5. Our hourly charge to audits remains one of the lowest among ACAG members.
6. Our total support costs have reduced as a proportion of total office costs and are now at the
ACAG average. The FTE increase includes people assigned to projects that are improving our
operations and audit practices.
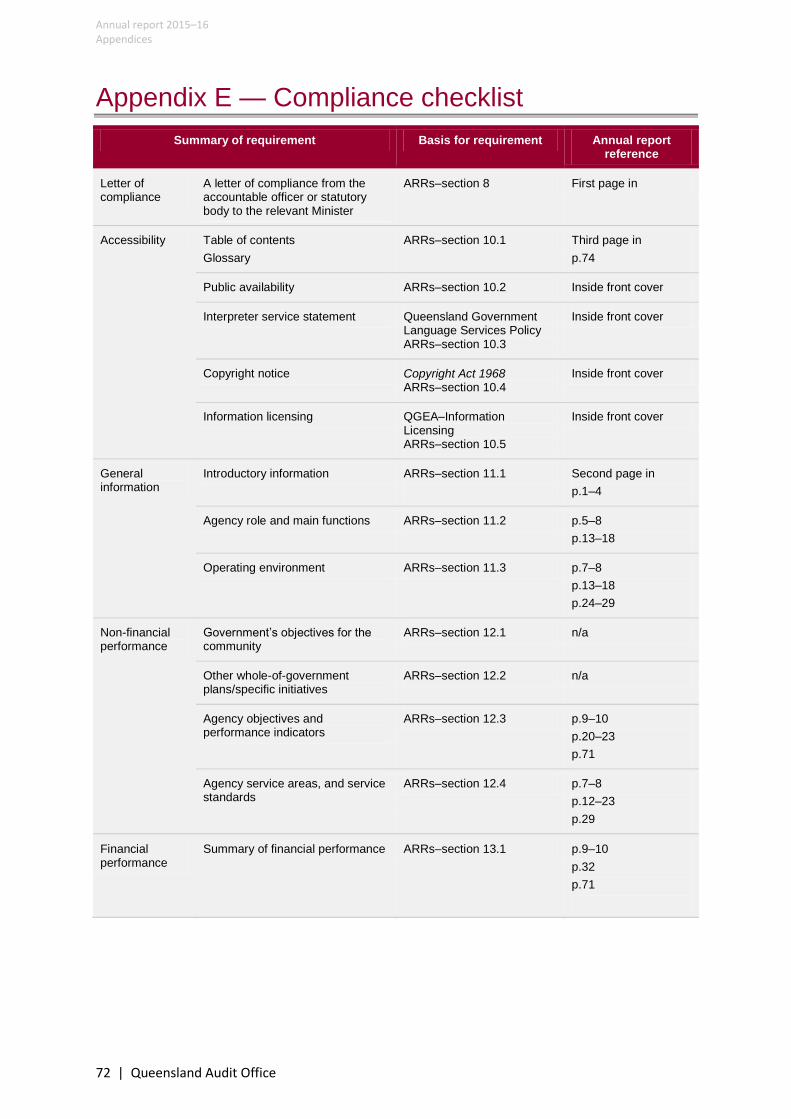
Annual report 2015–16 Appendices
72 | Queensland Audit Office
Appendix E — Compliance checklist
Summary of requirement Basis for requirement Annual report reference
Letter of compliance
A letter of compliance from the accountable officer or statutory body to the relevant Minister
ARRs–section 8 First page in
Accessibility Table of contents
Glossary
ARRs–section 10.1 Third page in
p.74
Public availability ARRs–section 10.2 Inside front cover
Interpreter service statement Queensland Government Language Services Policy ARRs–section 10.3
Inside front cover
Copyright notice Copyright Act 1968 ARRs–section 10.4
Inside front cover
Information licensing QGEA–Information Licensing ARRs–section 10.5
Inside front cover
General information
Introductory information ARRs–section 11.1
Second page in
p.1–4
Agency role and main functions ARRs–section 11.2 p.5–8
p.13–18
Operating environment ARRs–section 11.3 p.7–8
p.13–18
p.24–29
Non-financial performance
Government’s objectives for the community
ARRs–section 12.1 n/a
Other whole-of-government plans/specific initiatives
ARRs–section 12.2 n/a
Agency objectives and performance indicators
ARRs–section 12.3 p.9–10
p.20–23
p.71
Agency service areas, and service standards
ARRs–section 12.4 p.7–8
p.12–23
p.29
Financial performance
Summary of financial performance ARRs–section 13.1 p.9–10
p.32
p.71

Annual report 2015–16 Appendices
Queensland Audit Office | 73
Summary of requirement Basis for requirement Annual report reference
Governance —management and structure
Organisational structure ARRs–section 14.1 p.25
p.29
Executive management ARRs–section 14.2 p.25
p.27
Governance bodies ARRs–section 14.3 p.27–28
p.65–67
Public Sector Ethics Act 1994 Public Sector Ethics Act 1994 ARRs–section 14.4
p.66
Queensland public sector values ARRs–section 14.5 n/a
Governance —risk management and accountability
Risk management ARRs–section 15.1 p.11
Audit committee ARRs–section 15.2 p.27–28
p.66
Internal audit ARRs–section 15.3 p.27–28
p.67
External scrutiny ARRs–section 15.4 p.27–28
Information systems and record keeping
ARRs–section 15.5 p.67
Governance —human resources
Workforce planning and performance
ARRs–section 16.1 p.67
Early retirement, redundancy and retrenchment
Directive No.11/12 Early Retirement, Redundancy and Retrenchment ARRs–section 16.2
p.69–70
Open data
Consultancies ARRs–section 17
ARRs–section 34.1
p.77
Overseas travel ARRs–section 17
AARs–section 34.2
p.77
Queensland Language Services Policy
ARRs–section 17
ARRs–34.3
p.77
Financial statements
Certification of financial statements
FAA–section 62 FPMS–sections 42, 43 and 50 ARRs–section 18.1
p.52
Independent auditors report FAA–section 62 FPMS–section 50 ARRs–section 18.2
p.33–34
FAA Financial Accountability Act 2009
FPMS Financial and Performance Management Standard 2009

Annual report 2015–16 Appendices
74 | Queensland Audit Office
Appendix F — Glossary
Term Meaning
Audit This is an official examination and verification of accounts and records, especially of financial accounts.
Audit, financial Depending on the audit subject (consolidated fund, public sector agency, ministerial expenditure, and whole-of-government financial statements), the Auditor-General must give an opinion as to whether public money was recorded, managed, and protected properly. Usually this involves auditing the financial statements and preparing an audit opinion.
Audit, performance A performance audit may consider all or any particular activities of a public sector entity and may be conducted as a separate audit or as part of another audit, including an audit of another public sector entity. The audit’s object includes deciding whether the objectives of the public sector entity are being achieved economically, efficiently, and effectively, and in compliance with all relevant laws.
Audit mandate This is the scope of the Auditor-General’s authority and powers in terms of the types of audits that may be carried out, the entities subject to audit, and the access to personnel, property, and information.
Part 3 of the Auditor-General Act 2009 defines the audit mandate.
Audit opinion An audit opinion will generally address whether the Auditor-General has received all the information and explanations the role requires. It will also generally address whether the Auditor-General considers the financial statements have been properly drawn up and are accurate and compliant with prescribed requirements to give a true and fair view of an entity’s financial operations and position.
Auditor-General In Queensland, the Auditor-General is appointed by the Governor in Council for a fixed, non-renewable term of seven years.
Auditor-General Act 2009 This is the Queensland law that establishes the position of the Queensland Auditor-General and the Queensland Audit Office, confers the functions and powers necessary to carry out independent audits of the Queensland public sector and related entities, provides for the strategic review of the Queensland Audit Office, and provides for the independent audit of the Queensland Audit Office (published at www.legislation.qld.gov.au).
Australian Accounting Standards Board (AASB)
The Australian Accounting Standards Board, an independent, statutory agency established by the Australian Government, develops standards and guidance for preparers of financial statements (see www.aasb.gov.au).
Certification Certifications complement a financial audit. Some certifications (such as acquittal of minor grant expenditure) are incidental to the financial audit. Other certifications require significantly more resources to be applied and may stand apart from the financial audit process.
Financial Accountability Act 2009
This is the Queensland law that provides for accountability in the administration of the state’s finances and financial administration of departments and statutory bodies.
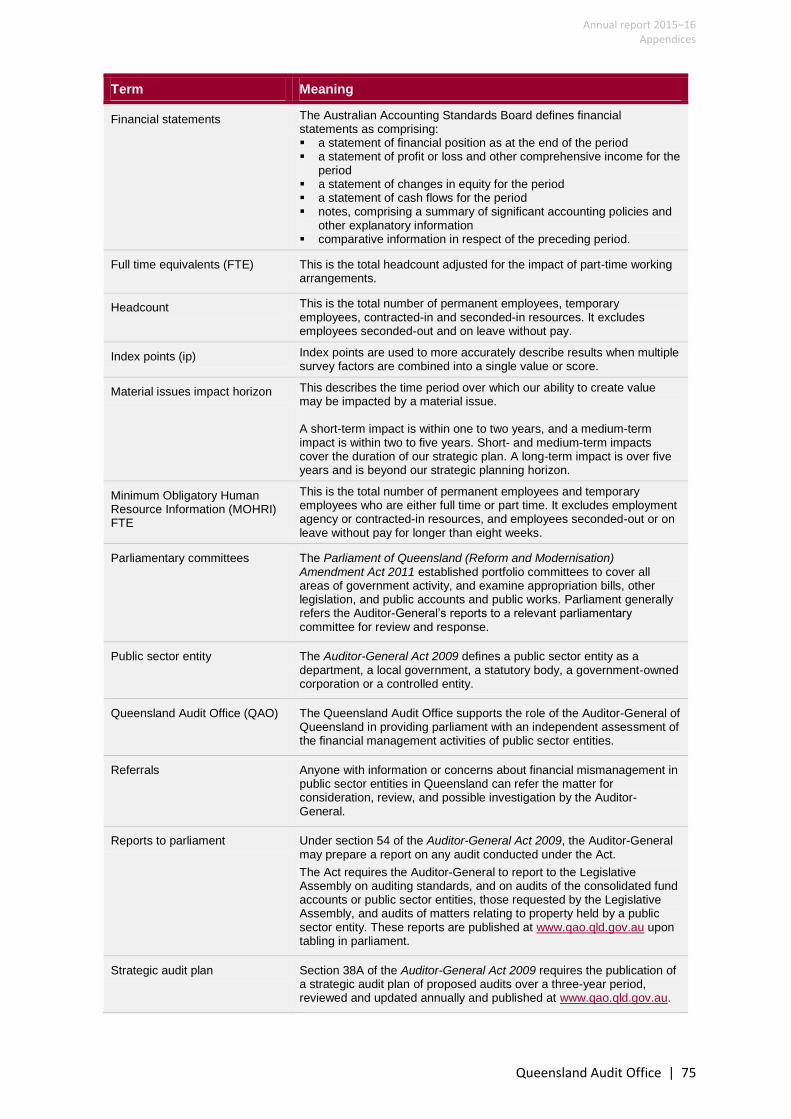
Annual report 2015–16 Appendices
Queensland Audit Office | 75
Term Meaning
Financial statements The Australian Accounting Standards Board defines financial statements as comprising: a statement of financial position as at the end of the period a statement of profit or loss and other comprehensive income for the
period a statement of changes in equity for the period a statement of cash flows for the period notes, comprising a summary of significant accounting policies and
other explanatory information comparative information in respect of the preceding period.
Full time equivalents (FTE) This is the total headcount adjusted for the impact of part-time working arrangements.
Headcount This is the total number of permanent employees, temporary employees, contracted-in and seconded-in resources. It excludes employees seconded-out and on leave without pay.
Index points (ip) Index points are used to more accurately describe results when multiple survey factors are combined into a single value or score.
Material issues impact horizon This describes the time period over which our ability to create value may be impacted by a material issue. A short-term impact is within one to two years, and a medium-term impact is within two to five years. Short- and medium-term impacts cover the duration of our strategic plan. A long-term impact is over five years and is beyond our strategic planning horizon.
Minimum Obligatory Human Resource Information (MOHRI) FTE
This is the total number of permanent employees and temporary employees who are either full time or part time. It excludes employment agency or contracted-in resources, and employees seconded-out or on leave without pay for longer than eight weeks.
Parliamentary committees The Parliament of Queensland (Reform and Modernisation) Amendment Act 2011 established portfolio committees to cover all areas of government activity, and examine appropriation bills, other legislation, and public accounts and public works. Parliament generally refers the Auditor-General’s reports to a relevant parliamentary committee for review and response.
Public sector entity The Auditor-General Act 2009 defines a public sector entity as a department, a local government, a statutory body, a government-owned corporation or a controlled entity.
Queensland Audit Office (QAO) The Queensland Audit Office supports the role of the Auditor-General of Queensland in providing parliament with an independent assessment of the financial management activities of public sector entities.
Referrals Anyone with information or concerns about financial mismanagement in public sector entities in Queensland can refer the matter for consideration, review, and possible investigation by the Auditor-General.
Reports to parliament Under section 54 of the Auditor-General Act 2009, the Auditor-General may prepare a report on any audit conducted under the Act.
The Act requires the Auditor-General to report to the Legislative Assembly on auditing standards, and on audits of the consolidated fund accounts or public sector entities, those requested by the Legislative Assembly, and audits of matters relating to property held by a public sector entity. These reports are published at www.qao.qld.gov.au upon tabling in parliament.
Strategic audit plan Section 38A of the Auditor-General Act 2009 requires the publication of a strategic audit plan of proposed audits over a three-year period, reviewed and updated annually and published at www.qao.qld.gov.au.

Annual report 2015–16 Appendices
76 | Queensland Audit Office
Index
A
Audit analytics………..…….….. Audit mandate.………………… Australasian Council of Auditors-General.….…………. Audit operations…………….… Audit program…………………..
1, 4, 5, 11, 13, 15, 20, 22, 67 3, 4, 20, 23, 74 28, 71 1, 25, 29, 30 1, 3, 5, 14, 16, 17, 18, 25, 29, 57
L
Legislation……………..………….
3, 5, 11, 13, 24, 27, 28, 74, 75
B
Business model....................
7, 8, 9
M
Material issue…………………... Members of parliament…….
4, 12, 20, 24, 29, 75 1, 3, 9, 12, 29
C
Client fees…………………..…….
4, 12, 13, 22
O
Organisational structure…… Our people………………….……. Organisational strategy….…. Our performance………………
25, 73 1, 3, 4, 5, 6, 10, 11, 24, 26 1, 3, 5, 9, 22, 25, 26, 29 1, 3, 9, 13, 14, 16, 17, 18, 21, 22, 25, 28, 29, 32, 57, 67, 71
D
Data security…………..…………
4, 12, 15, 67
P
Parliament….……….…………… Parliamentary committees.. Parliamentary funding……... Performance audit.……………
1, 3, 4, 7, 9, 10, 12, 18, 23, 25, 27, 29, 32, 38, 39, 40, 41, 56, 57, 58, 65, 71, 75 12, 29, 75 4, 7, 12, 18 1, 3, 4, 5, 7, 9, 10, 14, 16, 17, 18, 21, 22, 25, 29, 39, 40, 41, 56, 57, 58, 71, 74
F
Financial audit……………..…… Financial statements……..….
1, 3, 4, 5, 7, 8, 10, 12, 13, 18, 21, 22, 25, 29, 39, 49, 56, 58, 59, 71, 74 1, 3, 4, 7, 13, 18, 21, 27, 28, 32–54, 58, 59, 65, 66, 73, 74
R
Record keeping………………… Reports to Parliament………. Risk…………………………………...
66, 67, 73 1, 7, 8, 10, 17, 18, 56, 65, 71, 75 3, 4, 11, 15, 20, 22, 28, 50, 51, 58, 65, 66, 67, 73
G
Governance………………….…..
Audit and Risk Management Committee…………………… Executive Management Group…………………………… Information Steering Committee……………………
4, 11, 17, 21, 25, 27, 28, 30, 73 11, 28, 66 28, 41 28
S
Sector………………………………. Stakeholder engagement…. Strategic Audit Plan………….. Support services………………..
1, 3, 5, 7, 10, 12, 13, 14, 16, 18, 21, 23, 24, 29, 30, 32, 33, 38, 39, 41, 55, 56, 57, 58, 65, 66, 73, 74, 75 24, 29 18, 29, 75 25

Annual report 2015–16 Appendices
Queensland Audit Office | 77
Further information
As required by the Annual report requirements for Queensland Government agencies, further
information is published online through the Government Open Data website https://data.qld./gov.au
related to the following:
consultancies
overseas travel
Queensland Language Services Policy
government bodies.


Queensland Audit Office
Level 14, 53 Albert Street, Brisbane QLD 4000, Australia
PO Box 15396, City East Qld 4002
Phone: (07) 3149 6000
Email: [email protected]