Embed Size (px)
Citation preview

Annual Report 30 June 2016
ABN 27 058 596 124

TOX FREE SOLUTIONS LTD | Annual Report | 30 June 2016 CONTENTS PAGE Page 2 of 173
Contents Page 30 June 2016
Contents Page
Corporate Directory 3
Strategy 5
Managing Director’s Review of Operations 11
Environment, Social and Corporate Governance 29
Directors' Report 38
Corporate Governance Statement 72
Auditor's Independence Declaration under Section 307C of the Corporations Act 2001 83
Consolidated Statement of Profit or Loss 84
Consolidated Statement of Comprehensive Income 85
Consolidated Balance Sheet 86
Consolidated Statement of Cash Flows 88
Consolidated Statement of Changes in Equity 89
Contents of the Notes to the Consolidated Financial Statements 91
Directors' Declaration 168
Independent Auditor’s Report to the Members 169
Shareholder Information 171

Corporate Directory 30 June 2016
TOX FREE SOLUTIONS LTD | Annual Report | 30 June 2016 CORPORATE DIRECTORY Page 3 of 173
Directors
Robert McKinnon | Non-Executive Chairman
Katherine Hirschfeld | Non-Executive Director
Richard Allen | Non-Executive Director
Michael Humphris | Non-Executive Director
Stephen Gostlow | Managing Director
Secretary
David McArthur
Principal place of business
24 Sangiorgio Court OSBORNE PARK WA 6017 PO Box 1108 OSBORNE PARK WA 6916
Registered office in Australia
Level 2, 55 Carrington Street NEDLANDS WA 6009 PO Box 985 NEDLANDS WA 6909
TEL: +61 8 9423 3200 FAX: +61 8 9389 8327
Website address: www.toxfree.com.au
Share register
Computershare Investor Services Pty Ltd Level 11 172 St Georges Terrace PERTH WA 6000
TEL: +61 8 9323 2000

Corporate Directory 30 June 2016
TOX FREE SOLUTIONS LTD | Annual Report | 30 June 2016 CORPORATE DIRECTORY Page 4 of 173
Auditor BDO Audit (WA) Pty Ltd 38 Station Street SUBIACO WA 6008 TEL: +61 8 6382 4600 FAX: +61 8 6382 4601
Bankers ANZ – Corporate Banking Level 2, 100 Queen Street MELBOURNE VIC 3000
Legal advisor Clayton Utz, Perth QV1 250 St Georges Terrace PERTH WA 6000
Securities exchange Tox Free Solutions Limited’s shares are listed on the Australian Securities Exchange (ASX) – code TOX. The home exchange is in Perth.

Strategy 30 June 2016
TOX FREE SOLUTIONS LTD | Annual Report | 30 June 2016 STRATEGY Page 5 of 173
STRATEGY
Toxfree’s strategy is to grow the Company’s specialist industrial and waste management services within our chosen market sectors, with the aim of increasing returns for our shareholders. Our strategy is driven by our three core service lines, all of which are supported with a number of strategic initiatives aimed at continuing to diversify our client base, and build upon the Company’s strategically located and licensed waste treatment facilities, it’s technologies and services. Toxfree overview
1350 employees.
Over 15,000 active customers.
Providing services to a diverse number of industries and market sectors.
Over 55 operating locations strategically located across Australia.
Toxfree operating locations

TOX FREE SOLUTIONS LTD | Annual Report | 30 June 2016 STRATEGY Page 6 of 173
Strategy 30 June 2016
Our strategy is supported by our three services lines:
Over the last 10 years, Toxfree has focussed on its strategy to grow both organically, and through strategic acquisitions, to diversify its services across multiple market sectors. This is to ensure stability of revenue and ensure that we are well placed to meet the demands of different industry sectors as they move through their respective growth cycles.
Prior to 2007, Toxfree was purely a Western Australian business with operations in Perth and North West Western Australia. It was at that time that Toxfree mapped out a strategy to diversify its revenue across other geographic and industry sectors within Australia.
In 2008, Toxfree diversified and expanded its services into the east coast markets of Queensland and Victoria through the acquisition of Barry Bros in Victoria, and AGR in Queensland, complementing its specialist waste strategy with the addition of industrial services to civil infrastructure, utilities and municipal markets. Barry Bros services were also expanded nationally into other sectors, including the heavy industrial sector such as; alumina, petrochemical, resources and chemical manufacturing facilities throughout Australia over the following years.
•15 licensed and strategically located facilities across Australia.
•400 employees.
•Servicing all industry sectors, including government, utilities, commercial and industrial sectors.
•High barriers to entry.
•Significant IP and patented technologies.
Technical and Environmental Services
Leader in Hazardous and Industrial Waste
Management
•Tailored Total waste management solutions to predominately industrial clients across all market sectors.
•575 employees.
•Solid waste services to complement our hazardous waste and industrial services in major metropolitan areas.
•Municipal, Commercial and Industrial services in the regional hubs in North West WA, Tasmania and Queensland.
Waste Services
Provide waste services in all industrial markets
in Australia
•Civil infrustructure, heavy manufacturing industry, services to mining and oil and gas production assets and refineries.
•Long term contracts.
•Blue chip clients.
•Integrated with hazardous and solid waste services.
•375 employees.
Industrial services
Leader in provision of industrial services
throughout Australia

TOX FREE SOLUTIONS LTD | Annual Report | 30 June 2016 STRATEGY Page 7 of 173
Strategy 30 June 2016
In 2009, Toxfree opened the Pilbara Resource Recovery Centre in Karratha and attracted major customers in the North West including Rio Tinto Iron Ore, Chevron, Fortescue Metals Group and Apache, embedding our position as the leading integrated waste management company for the major LNG and Iron Ore production facilities in North West WA.
In 2012, Toxfree complemented its hazardous waste treatment and diversification strategy with the acquisition of Dolomatrix. Dolomatrix were the leaders in the provision of industrial resource recovery and hazardous waste management servicing all industry sectors, primarily on the east coast of Australia. This provided Toxfree with a national network of licensed waste treatment facilities able to handle all types of industrial and hazardous wastes.
In 2013, Toxfree acquired Wanless to establish a Total Waste Management capability in Queensland and Tasmania. As well as diversifying the revenue by geography, Toxfree entered the Commercial and Industrial sector of Queensland which has proven to be a key driver of growth in recent years.
During the financial years of 2014 and 2015, Toxfree implemented a whole of business Enterprise Resource Planning (ERP) system and consolidated its legal entities into one enabling the business to improve administration efficiencies, productivity and reduce costs as well as provide a solid foundation to enable future growth. The Company also rebranded all of its operations under the ‘Toxfree’ name as well as invested in its fleet, technologies and facilities to improve productivity.
On 1 April 2016, Toxfree acquired Worth Recycling, a leading industrial services and waste management company in New South Wales (NSW). Worth provide hazardous waste liquid collection and treatment as well as some industrial services to the civil infrastructure, utilities and heavy industrial sector in NSW. They operate from four main operations in NSW with two of the facilities having sophisticated industrial waste treatment technologies enabling the treatment of a broad range of bulk liquid waste and contaminated soils. The Worth operations complement Toxfree’s existing business in NSW, and there are significant synergies between the two businesses.
The success in the diversification strategy can be seen in the following graphs which show the changes in Toxfree’s revenue since 2013, by both geography and client industry sector. The percentage of resource based construction revenue has reduced significantly whilst other revenue streams have grown which has enabled Toxfree to largely counter the current significant downturn in Western Australia following the decline in resource capital expenditure over recent years. At the completion of financial year 2017, which will include a full year contribution of Worth and growth in other east coast non resource related markets, revenue from resource related construction activities is forecast to make a minor contribution to the Toxfree Group and the Company will have established a much broader strategic base on which to continue to grow the business.

TOX FREE SOLUTIONS LTD | Annual Report | 30 June 2016 STRATEGY Page 8 of 173
Strategy 30 June 2016
Toxfree Group Revenue Split by Sector – FY13 to FY17 (forecast)
*FY17 forecasts are based on management estimates at time of publication of this report.

TOX FREE SOLUTIONS LTD | Annual Report | 30 June 2016 STRATEGY Page 9 of 173
Strategy 30 June 2016
Toxfree Group Revenue Split by Region – FY13 to FY17 (forecast)
*FY17 forecasts are based on management estimates at time of publication of this report.
Full year contribution from Worth Recycling in NSW, growth in east coast facilities and commencement of Olympic Dam contract within the non-resource and resource production sectors further diversify revenue in FY17.
FY13 resource construction revenues were contributed to be Iron Ore Construction and LNG upstream and downstream construction in North West WA, Coal Seam Gas construction upstream and downstream in the Surat and Gladstone regions together with regional activity in the areas of the Pilbara, Broome, Darwin, Gladstone, Mackay and Surat Basin regions.

TOX FREE SOLUTIONS LTD | Annual Report | 30 June 2016 STRATEGY Page 10 of 173
Strategy 30 June 2016
Strategic Initiatives
Strategically, each service line has a number of initiatives aimed at diversifying services across multiple market sectors, geographies and waste types, increasing our growth and improving earnings per share and return on invested capital.
The initiatives can be broadly categorised as:
1. Broadening Toxfree’s Total Waste Management Capability, treating a greater portion of client’s waste streams in-house.
2. Leveraging Toxfree’s existing waste treatment capabilities and licensed sites through investment in best practice waste treatment technologies, providing the lowest operating cost and best environmental solution in the market.
3. Expanding Toxfree’s geographic coverage within Australia and overseas.
4. Reducing overhead costs, consolidating and closing duplicated sites and increasing productivity by leveraging off the recently implemented Enterprise Resource Planning (ERP) system.
5. Business development – winning large, long term contracts with blue chip companies.
6. Acquisition of complementary businesses in line with Toxfree’s strategy.

Managing Director’s Review of Operations 30 June 2016
TOX FREE SOLUTIONS LTD| Annual Report | 30 June 2016 MANAGING DIRECTOR’S REVIEW OF OPERATIONS Page 11 of 173
FY16 OVERVIEW AND KEY HIGHLIGHTS
The Directors of Tox Free Solutions Ltd (“Toxfree”, the “Company” or “Group”) (ASX: TOX) are pleased to announce the Company’s financial results for the year ended 30 June 2016.
The key highlights of the financial year were:
Safety
A key outcome of financial year 2016 was Toxfree’s safety performance.
Our safety culture and performance continues to improve with significant improvement in all key metrics ^ with a Lost Time Injury Frequency Rate of zero and reduction in Total Recordable Injury Frequency Rate (TRIFR) of 6.7 which was an 18% reduction on last year. There was also reduction in the All Injury Frequency Rate (AIFR) of 43% on FY15 to 25.4.
Job site safety inspections and hazard reporting, which the Company uses to manage risks and increase safety awareness has increased by 90% demonstrating a strong commitment to working safely and a culture of interdependency.
^ Safety metrics are accurate as at the time of publication
SUMMARY OF RESULTS
Table 1|Group Results
Group results
FY16 $‘000
FY15 $‘000
% Change
Revenue - Services 393,380 407,278 (3)%
EBITDA * 72,875 71,876 1%
Amortisation (1,914) (2,073) (8)%
Depreciation (31,594) (29,655) 7%
EBIT * 39,367 40,148 (2)%
Finance expenses (6,154) (6,505) (5)%
Profit before tax * 33,213 33,643 (1)%
Income tax expense * (9,957) (10,673) (7)%
Underlying Profit after tax * 23,256 22,970 1%
Statutory Profit after tax 13,054 21,994 (41)%
Profit attributable to Toxfree Owners 12,608 21,768 (42)%
Non-controlling interest in profit 446 226 97%
Underlying earnings per share (cents) *ordinary holders 16.7 17.0 (2)%
Shares on issue at reporting date (‘000) 143,920 134,007 7%
Weighted average number of shares (‘000) 136,573 133,806 2%
Dividend (cents per share) 9.0 8.5 6%
Cash Conversion as a % of EBITDA* 99% 100% (1)bps
*Non-IFRS Financial Information - Normalised for non-operational adjustments – see Table 2 below

Managing Director’s Review of Operations 30 June 2016
TOX FREE SOLUTIONS LTD | Annual Report | 30 June 2016 MANAGING DIRECTOR’S REVIEW OF OPERATIONS Page 12 of 173
Strong cash flow with full year cash conversion rate of 99% of EBITDA*.
Margins improvement at an EBITDA and EBIT level through improvement in productivity, significant reduction in overhead and reduction in operating costs. Full year dividend of 9 cents per share an increase of 6% on FY15.
Disciplined capital expenditure, improved debtor collections and strong cash flow resulted in net debt to equity of 37%.
Significant growth of east coast operations counters the decline in resource sector construction related activities in the Pilbara, Central Queensland and Surat Basin regions.
Diversification of waste treatment capabilities and market share in NSW with the acquisition and integration of Worth Recycling.
Significant reshaping of the business occurred during FY16 as Toxfree consolidated and flattened the corporate and operational organisational structure of our three service lines and consolidated operational sites to gain efficiencies and enhance our future competitiveness in the market. This generated one-off costs of $5.9m in site closure costs, redundancy and restructuring costs that have been normalised in the result.
Table 2|Exclusion adjustments
*Non-IFRS Financial Information: Adjustments that were excluded in order to reflect the underlying performance of the Group are:
Exclusions
FY16 $‘000
FY15 $‘000
Acquisition, integration and rebranding costs 4,728 1,395
Impairment losses – Port Hedland 2,639 -
Asset write-offs – vacated sites 1,019 -
Redundancy and restructuring costs 4,425 -
Site closure costs 1,426 -
Reduction in contingent consideration (1,067) -
Income tax expense (2,968) (419)
Total costs after tax 10,202 976
For Statutory purposes the above costs are allocated to the following segments; Technical and Environmental $4,964k; Waste Services $3,231k; Industrial Services $132k and Corporate $4,843 (FY15: $1,395).
Operations
Technical and Environmental Services
Results
FY16
$‘000
FY15
$‘000
% Change
Revenue 67,826 53,367 27%
EBITDA * 21,245 19,883 7%
EBIT * 14,558 14,631 (0.1)%
*Non-IFRS Financial Information - Normalised for non-operational adjustments – refer to Tables 1 & 2 on pages 11-12 for further detail

Managing Director’s Review of Operations 30 June 2016
TOX FREE SOLUTIONS LTD | Annual Report | 30 June 2016 MANAGING DIRECTOR’S REVIEW OF OPERATIONS Page 13 of 173
Earnings from east coast waste treatment facilities increased by 28% on FY15 offsetting similar reductions in earnings from West Australian facilities.
Re-development of the Narangba site in Queensland to allow relocation and closure of the Coopers Plains site providing more efficient and diverse range of waste treatment technologies.
Roll out of Community Recycling Centres contract with NSW EPA continued with 60 sites now in place and a further 40 sites to be rolled out over the next 12 months.
Award of a contract for remediation services by the WA Department of Premier and Cabinet for the management of properties damaged by fire in Yarloop WA.
Diversification into the rapidly developing e-waste sector in Victoria and NSW following the acquisition of PGM Refineries utilising the Blue Box e-waste technology.
Diversification of Toxfree’s Total Waste Management service to include the provision of Workshop Waste Management Services.
Industrial Services
Results
FY16
$‘000
FY15
$‘000
% Change
Revenue 93,482 103,828 (10)%
EBITDA * 16,834 18,096 (7)%
EBIT * 9,016 9,902 (9)%
*Non-IFRS Financial Information - Normalised for non-operational adjustments – refer to Tables 1 & 2 on pages 11-12 for further detail
Award of BHP Billiton (BHPB) Olympic Dam 5 year Industrial Services and Waste Management Contract – commenced 1 July 2016.
QAL contract extension for a further 3 years.
Award of further scope of works for Wheatstone LNG Plant in Onslow for pre-commissioning Industrial Services.
Improved performance in the Melbourne and Sydney regions from the increase in the civil construction market with Victorian earnings up 11% on FY15.
Expansion of the Victorian Business into the La Trobe Valley, servicing the power generation companies.
Expansion of the industrial Services technical capability in the downstream refinery and terminals market and heavy Industrial client base.
Addition of Chemical Cleaning service capability for the operating plants in the Oil & Gas sector and other industrial markets to complement our existing industrial services.
An increase in the safety culture with a more than 50% reduction in TRIFR for the year.

Managing Director’s Review of Operations 30 June 2016
TOX FREE SOLUTIONS LTD | Annual Report | 30 June 2016 MANAGING DIRECTOR’S REVIEW OF OPERATIONS Page 14 of 173
Waste Services
Results
FY16
$‘000
FY15
$‘000
% Change
Revenue 232,072 250,083 (7)%
EBITDA * 59,221 62,084 (5)%
EBIT * 41,915 45,045 (7)%
*Non-IFRS Financial Information - Normalised for non-operational adjustments – refer to Tables 1 & 2 on pages 11-12 for further detail
Queensland commercial and industrial waste EBIT increased by over 40% on FY15.
13% organic growth within regional Queensland.
Safety improvement with a reduction in TRIFR of 47% on FY15.
Rationalisation and consolidation of activities within our Mackay and Rockhampton, Roma, Chinchilla and Toowoomba businesses to reduce costs and improve efficiencies.
Retention of Rio Tinto Iron Ore contract.
Corporate
Corporate
30 June 2016
$‘000
30 June 2015
$‘000
% Change
Unallocated EBITDA * (24,425) (28,183) (13)%
EBIT * (26,122) (29,426) (11)%
*Non-IFRS Financial Information - Normalised for non-operational adjustments – refer to Tables 1 & 2 on pages 11-12 for further detail
Corporate costs (EBITDA) reduced by 13% or $3.76 M on FY15.
Implementation of Optical Scanning, Time in Attendance systems and In-Vehicle Management Systems (IVMS) in FY17 will drive continued cost savings.
MANAGING DIRECTOR’S REVIEW OF OPERATIONS
Underlying results for financial year 2016 reflect solid group performance, as the company continues to grow its earnings from east coast operations and services to the major producing assets across Australia. Revenue from construction based activities from the resource sector, primarily in Western Australia and Queensland, have continued to significantly decline over FY16, so it is pleasing to see the Company’s strategy of diversification into other market sectors and geographic regions has not only countered this downturn but placed the Company in an excellent position to grow its services into the future. The Company delivered sound financial results to record underlying Earnings before Interest, Tax, Depreciation and Amortisation (EBITDA) of $72.9m* up 1% on FY15, and Net Profit after Tax (NPAT) of $23.3m*. *Non-IFRS Financial Information - Normalised for non-operational adjustments – refer to Tables 1 & 2 on pages 11-12 for further detail

Managing Director’s Review of Operations 30 June 2016
TOX FREE SOLUTIONS LTD | Annual Report | 30 June 2016 MANAGING DIRECTOR’S REVIEW OF OPERATIONS Page 15 of 173
Through a disciplined and focused strategy on capital expenditure the company was able to fund a number of growth initiatives that will, over time, prove to be significant strategic investments for shareholders. Debtor days’ sales outstanding reduced by 15% during the year and cash conversion was 99% of EBITDA*. At June 30, Toxfree had cash in bank of $32m, net borrowings of $101.9m and net debt to equity of 37%. Net cash capital investment in the business was $23.4m during the period.
The Company balance sheet is very sound and as a result the Board is pleased to announce a final dividend of 4.5 cents per share which will be fully franked based on tax paid of 30%, bringing the total dividend for the 2016 financial year to 9.0 cents per share fully franked. This is a 6% increase on the previous year’s dividend. The 9.0 cent dividend represents a 54% (2015: 50%) return on underlying net profit after tax to ordinary shareholders.
The dividend record date to determine entitlements is 7 September 2016 and the payment date is 29 September 2016. The company dividend reinvestment plan (DRP) is available for all shareholders wishing to participate. Under the DRP, Toxfree shares will be issued or transferred at the average of the daily Volume Weighted Average Price (VWAP) of all shares sold on ASX over the period from 1 August 2016 to 7 September 2016. No discount will be applied to shares issued or transferred under the DRP.
The above result excludes a number of non-IFRS adjustments that were one-off and nonrecurring in nature. The adjustments include $4.7m of acquisition, integration and rebranding costs associated with Worth and the PGM e-waste acquisitions, $4.4m of redundancy and restructuring costs and site closure costs of $1.4m. As part of our Centres of Excellence approach to waste treatment, the Company completed a complete review of our operational sites with the intention of consolidating services in similar locations to improve efficiencies and reduce costs. The opportunity for consolidation was particularly evident for a number of sites that were acquired as part of the Dolomatrix and Worth acquisitions. Non relocatable site improvements at vacated sites were written off which generated a $1.01m non-recurring charge. This predominantly related to the Coopers Plains site. The implementation of the Company’s ERP system also provided an opportunity for consolidation of administration under a centralised shared services model.
The Company also booked a one off specific impairment of $2.6m against its Port Hedland waste water treatment facility. With the decline in resource related expenditure in the Pilbara and the Company’s focus on efficiency and reducing costs, we have directed more waste to our Karratha facility for treatment enabling us to downsize the Port Hedland operations and reduce costs. Toxfree’s Port Hedland operations continue to be a very important part of Toxfree’s portfolio of licensed treatment facilities and we are confident that in the medium to longer term the Port Hedland region will contribute strongly to the Toxfree group, however in the near term the forecast cash flows are expected to be subdued which required a one-off specific impairment to be booked.
Overall, the Company views the above results as an excellent achievement and a strong reward for its execution of strategy over the last 5 years. Even though the market has declined significantly in the West, through improvement in the East, Toxfree has been able to achieve solid financial performance.
We remain focused on the organic growth opportunities through the award of total waste management and industrial service contracts throughout Australia. Toxfree’s tender book remains buoyant with a number of tenders’ already submitted pending award. *Non-IFRS Financial Information - Normalised for non-operational adjustments – refer to Tables 1 & 2 on pages 11-12 for further detail

Managing Director’s Review of Operations 30 June 2016
TOX FREE SOLUTIONS LTD | Annual Report | 30 June 2016 MANAGING DIRECTOR’S REVIEW OF OPERATIONS Page 16 of 173
REVIEW OF OPERATIONS
Health and Safety
Our values are Safe.Reliable.Sustainable.
Safety – In everything we do we are committed to putting safety first.
Reliability – We pride ourselves on positive, long term relationships with our customers, our employees and our stakeholders.
Sustainable – The decisions we make will ensure a future for our environment and our business.
Toxfree continues its quest to be Australia’s leading industrial and waste services provider as judged by the quality of our services, environmental achievements and safety standards compared with peers, customers and best practice industries.
We once again demonstrated significant improvement in all key safety metrics ^ with a Lost Time Injury Frequency Rate of zero, a reduction in Total Recordable Injury Frequency Rate of 18% and a reduction in the All Injury Frequency Rate of 43% on the prior year. The Group remains on track to achieve its 2020 Objectives for a Total Recordable Injury Frequency Rate of 4 and All Injury Frequency Rate of 25.
^ Safety metrics are accurate as at the time of publication
The Company has three segments. The three reportable segments are:
1. Technical and Environmental Services 2. Industrial Services 3. Waste Services
Technical and Environmental Services
Results
FY16 $‘000
FY15 $‘000
% Change
Revenue 67,826 53,367 27%
EBITDA * 21,245 19,883 7%
EBITDA margins (%) 31% 37% (600)bps
Amortisation 678 300 126%
Depreciation 6,009 4,952 21%
EBIT * 14,558 14,631 (0.1)%
EBIT margins (%) 21% 27% (600)bps *Non-IFRS Financial Information - Normalised for non-operational adjustments – refer to Tables 1 & 2 on pages 11-12 for further detail
To meet customer expectations with no incidents, no harm to
people or the environment and no damage to property.

Managing Director’s Review of Operations 30 June 2016
TOX FREE SOLUTIONS LTD | Annual Report | 30 June 2016 MANAGING DIRECTOR’S REVIEW OF OPERATIONS Page 17 of 173
Toxfree’s Technical and Environmental Services Division (TES) is the core of Toxfree’s strategy. It is a key part of our total waste management strategy in which we can offer our clients treatment solutions for any type of hazardous, industrial or regulated waste they produce. During the year we continued to expand our services into new geographic areas and develop new technologies and treatment solutions for industrial and hazardous wastes. The division performed well during the year with growth of 7% EBITDA* on last year. *Non-IFRS Financial Information - Normalised for non-operational adjustments – refer to Tables 1 & 2 on pages 11-12 for further detail
TES Revenue Split by Sector – FY13 to FY17 (forecast)
*FY17 forecasts are based on management estimates at time of publication of this report
67826
21245
53367
19883
0
10000
20000
30000
40000
50000
60000
70000
80000
Revenue Segment EBITDA
$'0
00
Technical & Environmental Services Divisional Revenue and
EBITDA2016
2015 17%
83%
FY16 Revenue as a Percentage of Group
Revenue
Technical &EnvironmentalServices
OtherSegments

Managing Director’s Review of Operations 30 June 2016
TOX FREE SOLUTIONS LTD | Annual Report | 30 June 2016 MANAGING DIRECTOR’S REVIEW OF OPERATIONS Page 18 of 173
TES Revenue Split by Region – FY13 to FY17 (forecast)
*FY17 forecasts are based on management estimates at time of publication of this report
Acquisition of Worth Recycling One of the key highlights of the year was the $70m acquisition of Worth Recycling (Worth) which completed on 1 April 2016. The Worth Business contributed $16.5M in revenue and $3.4M in EBITDA in the three months under Toxfree’s ownership which is in line with our initial acquisition forecasts. The EBITDA margin of Worth (which includes a combination of industrial services and waste treatment) is 21%, and when consolidated into Toxfree’s Technical and Environmental Services division the change in business margins resulted in an overall reduction in the divisional margin for TES. There is also increased depreciation and amortisation from the Worth acquisition which further effected the EBIT margins within this division. As Toxfree complete the integration of systems over the next three months the industrial services and hazardous waste treatment services of Worth will be allocated to each of Toxfree’s respective service lines.
Worth operates in the industrial waste, soil remediation and industrial services markets and undertakes the collection, transportation, processing and recycling of liquids, sludge and contaminated soil as well as providing confined space services, industrial cleaning and non-destructive digging. Worth operates EPA licensed liquid and soil remediation treatment facilities and owns and runs an EPA/DECCW licensed fleet of liquid and vacuum tankers, including heavy vacuum units.
Worth has operations in the Sydney metropolitan region, the Illawarra and the Hunter Valley. Worth designed, built and now operates two major industrial waste treatment plants, including:
An EPA licensed depot and treatment plant at Windsor. The plant receives and processes oily sludge, slops oils, oily waters, drill muds and contaminated solids/sludge and wastewater emulsions and has a wastewater treatment capacity of one million litres per week.
A 15,000 m2, EPA licensed, industrial waste and chemical immobilisation treatment facility at St Marys, which is approved for the treatment of up to 100,000 tonnes of hazardous waste including contaminated soils, drill muds, and packaged waste. The site has also been approved for further development, including a liquid waste treatment plant.

Managing Director’s Review of Operations 30 June 2016
TOX FREE SOLUTIONS LTD | Annual Report | 30 June 2016 MANAGING DIRECTOR’S REVIEW OF OPERATIONS Page 19 of 173
Worth also operates an industrial services depot in Kurri Kurri, Hunter Valley, and on-site liquid treatment facilities at Port Kembla, NSW.
The Worth business comprises 130 employees, including 3 senior managers and 60 drivers.
The business is being integrated with Toxfree’s systems and rebranding has already commenced. We have been impressed with the service orientated culture of the Worth employees and their level of professionalism. There is significant synergy with Toxfree’s existing business and we are focussing on realising this through the rationalisation of sites in both the Hunter Valley and Sydney regions. The NSW economy is buoyant, and we expect our momentum in earnings growth to continue into FY17 and beyond. The company has a number of large soil remediation tenders pending that if successful will lift facility utilisation and earnings in FY17. Other TES operational highlights Waste volumes associated with resource sector construction activities continued to decline as the level of construction wastes and wastes associated with upstream oil and gas activity reduced. Toxfree Karratha, Port Hedland, Kwinana and Queensland were below the prior year’s achievement. In the East there was a direct contrast, with solid growth achieved in NSW and Victoria off the back of improved economic conditions, and the expansion of household hazardous waste contracts.
Victoria achieved 28% growth in EBITDA* on pcp and NSW achieved 30% growth on pcp. The momentum was achieved through expansion of household hazardous waste collection programs and expansion into e-waste recycling.
During the year, Toxfree entered the e-waste management sector through the acquisition of 100% of the shares in PGM based in Melbourne. The expansion of Toxfree services into the e-waste sector will broaden the service offering into this growing market. In Australia, e-waste is growing three times faster than the rate of general domestic waste. Increased e-waste recycling is also driven by mandatory Federal legislation (Product Stewardship Scheme) for ‘end-of-life’ TVs and computers, requiring progressively higher rates of recycling from 50% in 2015/16 to 73% by 2024/25. There is continuing pressure to increase recycling rates by the Commonwealth and State Governments. In Victoria the government plans to ban e-waste from landfill by 2017. E-waste recycling is a complementary activity to our existing focus on consumer based waste types including our household hazardous waste collection programs.
There were also a number of projects which assisted in the performance of TES. One of the projects included the clean-up and remediation of the Yarloop town site in Western Australia following the fires that devastated the area in January 2016.
There are a number of key environmental and regulatory drivers that contribute to growth in the available market, usually at a rate greater than population or industry growth. Increasing environmental awareness from the community, corporate social responsibility, increasing landfill disposal rates and tightening regulations are all positive key drivers in our business.
In the future we also expect a greater portion of remediation projects and an increase in remediation related wastes driven by the key drivers outlined above.
*Non-IFRS Financial Information - Normalised for non-operational adjustments – refer to Tables 1 & 2 on pages 11-12 for further detail

Managing Director’s Review of Operations 30 June 2016
TOX FREE SOLUTIONS LTD | Annual Report | 30 June 2016 MANAGING DIRECTOR’S REVIEW OF OPERATIONS Page 20 of 173
Industrial Services
Results
FY16 $‘000
FY15 $‘000
% Change
Revenue 93,482 103,828 (10)%
EBITDA * 16,834 18,096 (7)%
EBITDA margins (%) 18% 17% 100bps
Amortisation - 103 (100)%
Depreciation 7,818 8,091 (3)%
EBIT * 9,016 9,902 (9)%
EBIT margins (%) 10% 10% 0bps
*Non-IFRS Financial Information - Normalised for non-operational adjustments – refer to Tables 1 & 2 on pages 11-12 for further detail
The Industrial Services (IS) division performed solidly during FY16. Exposure to construction based activities from the resource sector is less within the IS service line than our other divisions. As demonstrated in the graphs below the majority of IS revenue is sourced from non-resource related sectors including utilities, municipal, civil infrastructure, and heavy manufacturing facilities such as Alumina, Refineries and Chemical Manufacture.
However, activity from upstream oil and gas development from construction projects in the Surat Basin and Pilbara and Kimberly regions declined during FY16. Countering this we are experiencing strong growth in utilities, civil infrastructure and municipal markets on the east coast. The business achieved solid growth primarily in the civil infrastructure markets in Victoria in particular achieving 38% growth in earnings on the prior year.
Revenue decreased slightly by 10% however the division was able to hold its margins at an EBIT level.
93482
16834
103828
18096
0
20,000
40,000
60,000
80,000
100,000
120,000
Revenue Segment EBITDA
$'0
00
Industrial Divisional Revenue and EBITDA
2016
201524%
76%
FY16 Revenue as a Percentage of Group
Revenue
IndustrialServices
OtherSegments

Managing Director’s Review of Operations 30 June 2016
TOX FREE SOLUTIONS LTD | Annual Report | 30 June 2016 MANAGING DIRECTOR’S REVIEW OF OPERATIONS Page 21 of 173
Industrial Services Revenue Split by Sector – FY13 to FY17 (forecast)
Industrial Services Revenue Split by Region – FY13 to FY17 (forecast)
*FY17 forecasts are based on management estimates at time of publication of this report.
Through the acquisition of Worth, Toxfree’s presence in the NSW industrial services market has increased considerably. The civil infrastructure sector is currently experiencing high growth and Toxfree is optimistic on further growth opportunities in both Victoria and NSW this financial year. There is budgeted infrastructure capital investment in Australia in excess of $50 bn^ (mostly in the eastern states) and Toxfree is well placed to service this growth, particularly for some of the larger infrastructure projects.
In 2015 Toxfree was awarded an industrial services contract with Bechtel for the Wheatstone LNG facility. The scope of work over the year has continued to increase and is expected to continue into the 2017 financial year.
^source: Australian Government, press release 17 February 2016

Managing Director’s Review of Operations 30 June 2016
TOX FREE SOLUTIONS LTD | Annual Report | 30 June 2016 MANAGING DIRECTOR’S REVIEW OF OPERATIONS Page 22 of 173
On 1 July 2016, Toxfree commenced services for BHP Billiton’s (BHPB) Olympic Dam facility. Located 560 kilometres north of Adelaide, South Australia, Olympic Dam is Australia's largest underground mine, producing copper cathode, uranium oxide concentrate, gold and silver. Toxfree provides both industrial services and waste management services to BHP Billiton for the Olympic Dam site. The contract has commenced smoothly and we look forward to working with BHPB for the long term.
We completed another successful year at Rio Tinto’s Queensland Alumina refinery (QAL). In April 2016 QAL retendered the industrial services contract and we were recently advised that the contract has been retained for a further three-year term. Toxfree has been able to demonstrate improved productivity, use of technology and exceptional safety performance with QAL to achieve a lower total costs of service than our competition.
The return on invested capital improved by 2% within this division through improved debtor management, improved utilisation of fleet, and by leveraging company purchasing power.
There are a number of industrial services contracts that have been tendered and Toxfree are confident in the ability to grow this business in financial year 2017.
Waste Services
Results
FY16 $‘000
FY15 $‘000
% Change
Revenue 232,072 250,083 (7)%
EBITDA * 59,221 62,084 (5)%
EBITDA margins (%) 26% 25% 100bps
Amortisation 1,236 1,671 (26)%
Depreciation 16,070 15,368 5%
EBIT * 41,915 45,045 (7)%
EBIT margins (%) 18% 18% 0bps
*Non-IFRS Financial Information - Normalised for non-operational adjustments – refer to Tables 1 & 2 on pages 11-12 for further detail
232072
59221
250083
62084
0
50000
100000
150000
200000
250000
300000
Revenue Segment EBITDA
$'0
00
Waste Services Divisional Revenue and EBITDA
2016
2015
59%
41%
FY16 Revenue as a Percentage of Group
Revenue
WasteServices
OtherSegments

Managing Director’s Review of Operations 30 June 2016
TOX FREE SOLUTIONS LTD | Annual Report | 30 June 2016 MANAGING DIRECTOR’S REVIEW OF OPERATIONS Page 23 of 173
The Waste Services division had a challenging year as it also transitions from a decline in activity from the West, and increasing activity in the East. Growth in the east was achieved mostly in Queensland servicing the commercial and industrial sector in Brisbane, Gold Coast and regional towns.
Over the last few years, Toxfree has strategically diversified its operations across a broader range of industry sectors and geographic regions in Australia. Services include total waste management contracts to large clients, predominantly in remote regions, municipal and commercial services mainly in Western Australia, Northern Territory, Queensland and Tasmania. This diversity has assisted the business achieve sound performance in Waste Services.
The graphs below outline the change of revenue by sector and location since FY13. In financial year 2016, the level of revenue from construction based activities associated with the resource sector reduced significantly. Over FY17 we expect this trend to continue as the last stages of LNG construction complete. After this time there will be negligible revenue from construction based activities within the Waste Services business. The growth in other sectors is extremely positive and we look forward to continued momentum in these areas.
Waste Services Revenue Split by Sector – FY13 to FY17 (forecast)
Waste Services Revenue Split by Region – FY13 to FY17 (forecast)
*FY17 forecasts are based on management estimates at time of publication of this report.

Managing Director’s Review of Operations 30 June 2016
TOX FREE SOLUTIONS LTD | Annual Report | 30 June 2016 MANAGING DIRECTOR’S REVIEW OF OPERATIONS Page 24 of 173
During the year, contracts with producing assets associated with the resource sector continued to perform well. The resources sector will continue to be a target industry for Toxfree. Waste Services provided to producing assets like LNG production and iron ore mining under large, long term contracts are one of Toxfree’s strengths. The contracts include an opportunity to provide an integrated service whereby Toxfree provides all industrial services requirements, solid waste management, recycling and hazardous and industrial waste treatment all under the one contract. During the period, contracts with Rio Tinto Iron Ore, FMG, Chevron and other operators in the Pilbara region continued to perform well. We are proud of our safety track record which has been acknowledged by all of our clients. Toxfree has now achieved over 6 years without Lost Time Injury in this region. Toxfree services were also formally recognised by Rio Tinto’s Core Services division, as an important partner in their operations. The Core Services division was the recipient of the Rio Tinto CEO award for safety across all of Rio Tinto’s operations globally for the second year running. Toxfree is proud to support the Core Services division in their achievements.
Toxfree has provided waste management services to the Gorgon LNG project since its inception in 2010. The LNG facility commenced production earlier this Calendar year and the final two LNG trains are nearing completion. Waste volumes from Gorgon have reduced over financial year 2016 as the facility commenced production. In May 2016 Toxfree were advised a number of contracts including Toxfree’s waste contract were to be retendered. Toxfree has an excellent safety track record on Barrow Island with zero Lost Time Injuries and a zero Total Recordable Injury Frequency rate. Toxfree has been able to demonstrate considerable improvement in productivity and reduction in costs. We will continue to demonstrate Toxfree is the safest and only integrated service provider able to manage all production related waste streams generated by the LNG sector.
Queensland waste services has had its best performance to date achieving growth of over 40% EBIT on financial year 2015. Services to the commercial sector in south east and regional Queensland performed strongly, as well as commercial and municipal services in Tasmania.
The Surat Basin region has declined from its highs as volumes of waste associated with the Coal Seam Gas upstream development are reducing. Ongoing production waste from Toxfree’s Origin Energy Contract remain stable.
The safety, reliability and presentation of our fleet remains a key focus for Toxfree and we continue to upgrade our fleet with new vehicles across Australia. In doing so we have now achieved an average fleet age of 6 years which we believe provides the appropriate balance between safety, reliability, and return on our capital.
The award of long term Total Waste Management contracts for this division remains a key focus, with a number of tenders’ submitted pending award or in progress.

Managing Director’s Review of Operations 30 June 2016
TOX FREE SOLUTIONS LTD | Annual Report | 30 June 2016 MANAGING DIRECTOR’S REVIEW OF OPERATIONS Page 25 of 173
Unallocated Corporate EBIT | Overview
Corporate
30 June 2016
$‘000
30 June 2015
$‘000
% Change
Revenue – Services 393,380 407,278 (3)%
Finance expenses (6,154) (6,505) (5)%
Unallocated EBITDA * (24,425) (28,183) (13)%
EBITDA * to revenue 6.2% 6.9% (700)bps
Depreciation – corporate (1,697) (1,243) 37%
EBIT * (26,122) (29,426) (11)%
EBIT * to revenue 6.6% 7.2% (600)bps
*Non-IFRS Financial Information - Normalised for non-operational adjustments – refer to Tables 1 & 2 on pages 11-12 for further detail
Unallocated Corporate EBITDA *decreased by 13% on FY15 to $24.4m.
Overall unallocated corporate EBITDA* expenses were 6.2% of Revenue, down 700bps from the previous financial year.
Unallocated Corporate includes the IT, Finance, Human Resources, OHSEQ, Risk and some regional shared service administration teams.
Off the back of the successful implementation of the company’s ERP in FY15 and entity consolidation program, Toxfree has continued to leverage the benefits of the ERP and reduced paper based work flows and improved efficiency which has led to less corporate overhead. There are further efficiencies to be gained through the planned expansion of our existing ERP capability to include an integrated time and attendance capability and improved data processing functionally with the introduction of optical scanning technologies.
To support increased effectiveness, efficiency, and safety throughout our fleet, Toxfree has commenced the rollout of an ERP integrated in-vehicle management system (IVMS). The IVMS delivers greatly enhanced real-time information for safety, decision making, and reporting to our operators, management, and ultimately our customers.
To support Toxfree’s strategic plan, in November 2015, an unsecured rolling 3-year Syndicated Facility Agreement was signed with ANZ and Westpac Banking Groups, whereby each bank is a 50 / 50 lender for the core facilities. Pricing, covenants, terms and conditions are more favorable than those contained in the previous facility.

Managing Director’s Review of Operations 30 June 2016
TOX FREE SOLUTIONS LTD | Annual Report | 30 June 2016 MANAGING DIRECTOR’S REVIEW OF OPERATIONS Page 26 of 173
GROUP STATEMENT OF CASH FLOWS
Group Cash Flow
30 June 2016
$‘000
30 June 2015
$‘000
% Change
Gross operating cash flow 72,459 72,111 0.5%
Other income 217 32 6%
Interest paid (4,655) (4,869) (4)%
Income taxes paid (8,985) (6,329) 42%
Net operating cash flows 59,036 60,945 (3)%
Payments for acquisition of businesses, net of cash acquired
(68,554) (5,328) 1,186%
Proceeds from sale of property, plant and equipment
8,625 3,019 186%
Payments for property, plant and equipment (32,007) (42,297) (24)%
Interest received 344 338 2%
Net investing cash flows (91,592) (44,268) 107%
Net proceeds from borrowings / (repayment of borrowings)
33,048 (1,333) 2,579%
Payments for shares acquired by Share Trust (165) (775) (79)%
Dividends paid (10,784) (8,788) 23%
Dividends paid to non-controlling interests (503) (2,240) (78)%
Proceeds from the issue of share capital (net of capital raising costs)
23,203 - 100%
Net financing cash flows 44,799 (13,136) 441%
Net increase in cash 12,243 3,541 246%
Cash at the beginning of the year 19,709 16,168 22%
Cash at the end of the year 31,952 19,709 62%

Managing Director’s Review of Operations 30 June 2016
TOX FREE SOLUTIONS LTD | Annual Report | 30 June 2016 MANAGING DIRECTOR’S REVIEW OF OPERATIONS Page 27 of 173
GROUP BALANCE SHEET
Balance Sheet
30 June 2016
$‘000
30 June 2015
$‘000
% Change
Cash 31,952 19,709 62%
Trade and other receivables 90,908 88,586 3%
Inventories 584 241 142%
Tax assets 11,414 7,954 44%
Property, plant and equipment 175,943 153,486 15%
Intangibles 180,173 151,388 19%
Total assets 490,974 421,364 17%
Trade and other payables 54,129 46,451 17%
Borrowings 133,853 100,517 33%
Employee benefits 10,346 8,487 22%
Tax liabilities 8,143 6,908 18%
Provisions 6,477 6,402 1%
Derivative financial instruments 1,663 1,864 (11)%
Total liabilities 214,611 170,629 26%
Total equity 276,363 250,735 10%
Gross debt to equity 48% 40% 800bps
Net debt to equity 37% 32% 500bps

Managing Director’s Review of Operations 30 June 2016
TOX FREE SOLUTIONS LTD | Annual Report | 30 June 2016 MANAGING DIRECTOR’S REVIEW OF OPERATIONS Page 28 of 173
OUTLOOK Financial year 2016 has been a very positive year for Toxfree despite the challenges in the economy. The growth in east coast non-resource related markets such as civil infrastructure, commercial, industrial, utilities and government markets resulted in strong performance from all of our east coast operations. The growth of the east coast has to a large extent offset the decline in revenues from resource related construction projects mainly in Western Australia and Queensland. Our focus remains firmly on our strategy of continuing to expand our business into new markets, new geographies and new technologies. We believe by continuing to focus on our strategy we will ensure Toxfree’s continued success over the long term. Through strategic expansion on the East Coast Toxfree has continued to achieve solid financial performance despite a reduction in resource related construction projects across Australia. Toxfree’s growth strategies are being assisted by a number of key drivers including increasing costs of landfill, increasing environmental regulation and community environmental awareness. There are many exciting opportunities across Australia and Toxfree is confident we can continue to gain market share. The east coast is expected to continue its growth trajectory, however, we expect revenues from resource related construction activities to reach a sustainable base during FY17. While the level of growth in the east and contraction in the west is difficult to predict we expect FY17 growth in underlying EBITDA in the range of 5% to 10% over FY16. Our cash flows and balance sheet are strong and through a combination of further growth of our core business and implementation of a number of strategic initiatives, Toxfree is confident that we will continue to deliver shareholder returns. We are committed to ensuring we provide safe, reliable and sustainable services to our clients and through this commitment Toxfree will strengthen long-term relationships. The continuing success of the Company can only be achieved through the hard work and commitment of all Toxfree employees. On behalf of the Toxfree Board of Directors I would like to take this opportunity to thank all employees for their efforts during the year.
STEVE GOSTLOW Managing Director

Environment, Social and Corporate Governance 30 June 2016
TOX FREE SOLUTIONS LTD| Annual Report | 30 June 2016 ENVIRONMENT, SOCIAL, AND CORPORATE GOVERNANCE Page 29 of 173
Environment, Social and Corporate Governance
Vision and Values
Our vision is to be Australia’s leading Industrial Services and Waste Management Company. Part of being a leading business is recognizing that in addition to financial outcomes we must, wherever practical, ensure we contribute to a sustainable environment and better community with strong reliable governance.
We see our values of Safe.Reliable.Sustainable as the pillars which guide us.
Safety – In everything we do we are committed to putting safety first.
Reliability – We pride ourselves on positive, long term relationships with our customers, our employees and our stakeholders.
Sustainability – The decisions we make will ensure a future for our environment and our business.
We believe our interests are tied to our stakeholder’s interests and that long term benefit is assured through a progressive and consistent commitment to sustainability. We recognize that:
Our investors have a foundation stake in knowing their investment is managed with careful stewardship to ensure their return on investment. Long term, we believe this will make Toxfree a prudent investment.
Our customers are the centre of our attention and a long-term partnership built on shared benefit is the core of success.
Toxfree is a service based business and the face of that business is created through the thousands of employees, contractors and suppliers who help us deliver successful services everyday around this country. We are committed to ensuring Toxfree is, and remains, an employer of choice where our people have value, dignity and respect in their relationship with the business, each other and our customers.
We invest in the communities which house and support us, especially the remote and regional communities where our operations provide important employment opportunity and assistance.
Our services help customers and communities better Reduce, Reuse and Recycle their waste in an effective economical manner.
Toxfree is proud of its success in delivering our services and building a business based on these principles, but we are more excited by the future potential to build on that success and achieve our vision to truly be Australia’s leading industrial services and waste management business.
Environmental Social and Corporate Governance
Whilst effective management systems and processes are important to building an effective governance framework it is the culture of the people and organization which will prevail. At Toxfree, our emphasis is on building a values led culture and then supporting our people and business with effective management systems and leadership.
Our values are Safe.Reliable.Sustainable, through these values we focus on:
Safety - Create a safe healthy work environment where everyone enjoys a safe whole of life work career,
People - Where people are our strength and future,

Environment, Social and Corporate Governance 30 June 2016
TOX FREE SOLUTIONS LTD | Annual Report | 30 June 2016 ENVIRONMENT, SOCIAL, AND CORPORATE GOVERNANCE Page 30 of 173
Stronger Communities - Community engagement and reconciliation is part of building a stronger business,
Long Term Success - Where we provide reliable service to our customers, partnerships with our suppliers and communities and returns to our investors, and
Sustainable Environment - Where the environment of today is protected for tomorrow.
Toxfree operates through a single integrated management system QUEST (Quality, Environment, Safety and Training) which ensures across all operations and services we provide the same consistent integrated service. Operating as a single consolidated group with a unified Enterprise Resource Planning (ERP) system Toxfree is able to provide a governance framework and assurance that leads the industry.
SAFE
Health and Safety
The Australian workforce is changing with the demand for skilled knowledgeable workers growing and the ageing workforce placing a premium on proficient experienced workers. Toxfree understands a key part of retaining a highly skilled team is ensuring everyone is safe and well so they can enjoy a healthy whole of life career.
We are committed to developing a workplace that is incident and injury free, by working together to send employees and contractors home safe from work every day. We achieve this through:
Developing a just safety culture which provides clear values and support for safety ownership with accountability for decision making,
Recognising the inherent nature of risk in our industry and ensuring it is kept as low as reasonably practicable (ALARP), and
Recognising and rewarding positive safety behaviours and values via positive safety interactions, consultation and engagement of the whole workforce.
Safe Reliable Sustainable
Risk Ownership & Control
Performance and Recognition
Harmfree Mantra &
Values

Environment, Social and Corporate Governance 30 June 2016
TOX FREE SOLUTIONS LTD | Annual Report | 30 June 2016 ENVIRONMENT, SOCIAL, AND CORPORATE GOVERNANCE Page 31 of 173
Our safety systems are unified across all operations, supported via our ERP with robust analysis and reporting of lead and lag indicators to inform decision making. In the long run we are focused on achieving world class safety performance based on lifting our lead indicators (Job Safety Interactions and Consultation, and lowering our lag indicator Total Recordable Injury Frequency Rate). By focusing on positive safety indicators our lag metrics have improved year on year, with TRIFR down 18% to 6.7, whilst our teams participated in 7,629 Job Safety Interactions and 6,641 Safety Consultations.
In 2016 our proudest safety achievements have focused on:
Fitness for Work & Health Monitoring. We know our workforce will face physical challenges along their work career. To support a healthy whole of life work career we have introduced voluntary free health checks to ensure everyone has the chance of a regular health check with a medical provider to identify health factors early and manage their well-being. Overtime we believe this will help sustain our experienced workers for safer longer careers.
Part of our industrial services offering includes concrete remediation projects, assisting in the rehabilitation and re-engineering of concrete structures. The recent Webb Dock rehabilitation project required the delivery of concrete blasting in adverse and restricted spaces in a sensitive marine environment. Demonstrating our commitment to innovation and safety the Industrial Services team partnered with suppliers to develop a specialized blasting barge and catchment which eliminated the risk to personnel and the environment and reduced the subsequent manual work.
Our industry remains an intensive manual handling environment with many of our workers performing high intensity and high frequency tasks. Whilst large scale automation is an impractical solution it is possible to use the ingenuity and knowledge of our teams to find local micro-solutions which continuously reduce the manual handling intensity of our work. As an example in our Karratha operations, drum crushing operations required repetitive intensive tasks, investing in better technology solution has enabled us to lift productivity and reduce risk with the input from our team.
0
5
10
15
20
25
30
35
40
45
50
0
20
40
60
80
100
120
140
Tota
l Rec
ord
able
Inju
ry F
req
uen
cy R
ate
All
Inju
ry F
req
uen
cy R
ate
Axis Title
Lagging Safety Indicators
AIFR TRIFR

Environment, Social and Corporate Governance 30 June 2016
TOX FREE SOLUTIONS LTD | Annual Report | 30 June 2016 ENVIRONMENT, SOCIAL, AND CORPORATE GOVERNANCE Page 32 of 173
RELIABLE
People
Our people are the heart and soul of Toxfree, creating our unique character and personality. Our people bring a breadth, depth and diversity of skills to the industry providing a friendly and efficient service to our customers every day of the year.
Our team is built around the fundamental steps of getting the right mix of people and shared understanding together to build strong resilient teams. We start with:
Building an inclusive and engaging workplace environment which makes everyone an active participant in shaping their workplace culture and performance.
Sustaining diversity and equality of opportunity focusing on the merits of the individual and their contribution to a proactive and innovative environment.
Recognising the inequality and disadvantage of Australia’s past and reconciliation with our Aboriginal communities to build an inclusive future.
Development of our team’s skills and abilities, investing in their future so they can share in the rewards of our success.
Recognising performance and owning accountability where performance or behaviors challenge expected values.
Toxfree are a finalist in the HRD Awards under the Diversity and Inclusion Category for developing and implementing an Indigenous Traineeship Program. Toxfree worked with several traditional owner groups to design and implement this educational program.
Engagement
Diversity & Equality
Indigenous Reconciliation
Retention & Reward
Performance & Recognition

Environment, Social and Corporate Governance 30 June 2016
TOX FREE SOLUTIONS LTD | Annual Report | 30 June 2016 ENVIRONMENT, SOCIAL, AND CORPORATE GOVERNANCE Page 33 of 173
Through the program Toxfree engaged an Aboriginal organisation Weba Garrungu meaning “Together we are strong”, this program is a financial pathway program that empowers the trainees to prosper by increasing their understanding of how they can break the cycle of poverty by setting financial goals, exercising choice and making well informed decisions to secure their families economic wellbeing.
The traineeship program also has a mentorship or buddy system that has proven to be the most important tool in supporting new trainees coming into fulltime employment, for some of them it is their first job as an employee. Not only does pairing up a workplace ‘veteran’ with a new comer help them understand workplace expectations, necessary life skills and how to have work-life balance, it will also provide recent trainees with a role model they can look up to.
The program involves a Certificate III in Community Waste Management. This is fully funded by Toxfree. The course is delivered through Toxfree’s RTO Franklin Scholar, who provides an Indigenous teacher.
Reconciliation
As part of Toxfree’s Corporate and Social Responsibilities, we have put in place our second RAP. Toxfree is committed to “closing the gap” for all disadvantaged Aboriginal and Torres Strait Islanders. With the support and guidance from Elders within the community and Aboriginal mentors Toxfree aims to achieve outcomes across a range of strategic areas. These include; education and training, healthier lives, economic participation, better home environments, and safe and supportive communities.
The launch of our second RAP was held in Queensland at our Coopers Plains office and was attended by a number of dignitaries. This was a strategic decision to raise the profile of Toxfree’s Indigenous Engagement Program on the East Coast.
Female Representation
Toxfree is committed to encouraging women at all levels throughout the organization. We are pleased to report that we are compliant with the Workplace Gender Equity Agent’s requirements. Toxfree offers paid maternity leave above the statutory requirements and flexible work opportunities for women returning to the workplace after parental leave.
Stronger Communities
Toxfree has a national network of business units, many working in indigenous, rural and remote communities. We have a significant capacity therefore to help these communities build social capital.
We support local communities by:
Emphasizing local purchasing and support of local businesses,
Employing locally, especially within the indigenous community and investing in developing the skills in our workforce,
Involving ourselves in local community groups to provide support and resources and help them sustain their vital work, and
Providing active support to indigenous reconciliation with, employment, training and community support.

Environment, Social and Corporate Governance 30 June 2016
TOX FREE SOLUTIONS LTD | Annual Report | 30 June 2016 ENVIRONMENT, SOCIAL, AND CORPORATE GOVERNANCE Page 34 of 173
Australian Industry Participation of 92% – Our preference is to source locally first, nationally second and internationally as required. Pleasingly 92% of our suppliers are Australian based.
Toxfree has partnered with Volvo Trucks Australia on a new classroom safety campaign. The safety campaign; Stop, Look, Wave is being rolled out nationally in primary schools and is a free education campaign teaching children to STOP on the side of the road, LOOK both ways, and WAVE at the truck driver before they cross.
Toxfree has committed the resources of our own company with Toxfree trucks and staff visiting schools across the nation to give students a look at the view from behind-the-wheel and to understand safety around trucks. Toxfree will also be rolling out training and education package to our 717 drivers. Our drivers are always conscious of their surroundings and we want them to let the children know that they have gained their attention by waving back to them. What a great way to bring the culture of safety into the cabin every day and every time our drivers see a child.
Our analysis of industry data informs us that mobile plant is the single largest risk factor we manage. Our relationship with key partners, like Volvo Australia, allow us to support a national community initiative to help make the roads safer for our children. The Stop, Look, Wave campaign is all about helping our kids know how to be safe on the roads around trucks.
Stronger Communities
Purchasing
Employment Involvment
Reconciliation

Environment, Social and Corporate Governance 30 June 2016
TOX FREE SOLUTIONS LTD | Annual Report | 30 June 2016 ENVIRONMENT, SOCIAL, AND CORPORATE GOVERNANCE Page 35 of 173
SUSTAINABLE
Long Term Success
Toxfree looks beyond the short-term to a long-term future, based on ensuring our actions today secure the future. We have built strong systems and governance to ensure sustainable enduring performance. We focus therefore on:
Long term relationships creating value for customers, employees, suppliers and the community.
Risk awareness ensuring in our strategic and operational decision making that every decision maker is empowered and answerable for managing risk.
Creating an integrated management system QUEST which leverages a best of breed Enterprise Resource Planning (ERP) platform and governance framework to ensure effective control of operations.
Providing balanced delegation of power to ensure our operations have the oversight and leadership required to deliver consistent sustainable performance.
The power of digital technology creates opportunities to provide the greatest availability, timeliness and transparency of data ever possible for our customers. Recognising this need to transition to the knowledge economy, our operations are progressively introducing live waste reporting and tracking so the customer has immediate access to information to understand their waste and services profile, and how Toxfree is controlling services and risk for them. Broome Shire have deployed the most recent upgrade to the Toxfree Wastefree tracking and reporting solution.
Reliable Performance
Relationships
Risk Ownership
Systems & Governance
Oversight & Leadership

Environment, Social and Corporate Governance 30 June 2016
TOX FREE SOLUTIONS LTD | Annual Report | 30 June 2016 ENVIRONMENT, SOCIAL, AND CORPORATE GOVERNANCE Page 36 of 173
e-waste is rapidly becoming a challenge to divert valuable and hazardous resources from landfill disposal to beneficial reuse. As part of a global logistics network, Toxfree has ensured its e-waste recycling operations are accredited to the international R2 standard allowing us to inter-operate with the Original Equipment Manufacturer (OEM) stewardship program. Toxfree in one of only three Australian suppliers with this certification. In FY2016 Toxfree recycled 148,476 screens.
Sustainable Environment
Toxfree envisages a future where our primary business is environmental services and we no longer manage waste but resources. The culture of use and dispose is changing and the foremost industry leaders will be those who innovate and transform to deliver flexible, cost effective solutions to harvest these resources.
The future for Toxfree is built on the pathway of:
Sustainable Development – Targeting our development into those areas which transition us toward environmental services and leverage the power of digital technology.
Your Waste – Providing services which enable customers to reduce, reuse, recycle and recover resources so they improve their economic and environmental outcomes.
Our Footprint – Recognising we can reduce the material impacts from our operations to ensure we contribute to a sustainable future.
Wastes change, with the advent of LCD screens, computer monitors and solar cells Australia has thousands of tonnes of materials tied-up in screens and cells of all forms. A cost-effective and practical means of harnessing these resources and returning them to the production cycle has been elusive. Toxfree identified this need and acquired the unique license to the leading BluBox solution. These units are capable of processing 2500 tonnes of screens per year and a resource recovery of 92-96%. In FY16 Toxfree processed 148,476 screens through its AS:5337 and R2 Certified facility at Dandenong and will expand operations into St Marys in FY17.
In FY16 Toxfree delivered services to over 16,000 customers, collecting, transporting and processing over 150,000 tonnes of waste. By offering improved options and information to our customers we have recycled over 38,000 tonnes.
Toxfree’s operations are logistic intensive with associated impacts using water, fossil fuels, plastics and ferrous materials in bins and equipment. Toxfree invests heavily to reduce these impacts, buying more efficient and lower emissions transport solutions like the Volvo Euro6. We have accelerated the replacement of older vehicles to reduce their disproportionate impact on our fleet emissions. 8% of our fleet is pre-EURO 3 but creates 61.27% of or emissions, whilst our early adoption of EURO 6 vehicles is far more efficient, safe and reliable with 4% of the fleet creating just 0.04% of emissions.
Sustainable Development
Your Waste
Our Footprint

Environment, Social and Corporate Governance 30 June 2016
TOX FREE SOLUTIONS LTD | Annual Report | 30 June 2016 ENVIRONMENT, SOCIAL, AND CORPORATE GOVERNANCE Page 37 of 173
CONCLUSION Ultimately, the Toxfree commitment to sustainability will be judged by our future actions and direction. Focusing on our stakeholder interests and the future of our business we foresee a future based on the following positions: Safe
Safety – We believe all injuries are preventable and we expect every one of our employees to go home safely at the end of their work day with Toxfree. To this end the only acceptable risk is to make our work as safe as reasonably practical over a long term commitment to continuous improvement and engineering, which makes our work amenable to safety and long-term well-being.
Reliable
People – The future of the business is based on the performance of our people and their engagement with Toxfree. We will seek to maximize relationships with employees, contractors and suppliers as long term partnerships based on equal dealing and respect.
Stronger Communities – Toxfree’s size and impact has moderate impact at a national level, but regionally in remote, regional and indigenous communities our business units can have locally significant impacts. Toxfree will therefore focus its primary social energy in those regions where we can most influence and enhance social good.
Sustainable
Governance – Stakeholders need certainty in Toxfree’s performance, commitment and direction. To provide this assurance Toxfree commits to sustaining certified integrated systems of governance which are transparently explained and detailed to our stakeholders.
Environment - Toxfree envisages a waste industry centered on resource management which offers our customers innovative, cost effective and flexible options which optimise resource reduction, reuse, recycling and recovery. Toxfree will make targeted acquisitions and early adoption of technology which over time move us to the forefront of environmental services.

Directors’ Report Contents 30 June 2016
TOX FREE SOLUTIONS LTD | Annual Report | 30 June 2016 DIRECTORS’ REPORT CONTENTS Page 38 of 173
Directors’ Report Contents
Details Page
Directors 39
Result 39
Principal Activities 39
Dividends 39
Review of Operations 40
Significant Changes in the State of Affairs 40
Events since the end of the financial year 40
Likely developments and expected results of operations 40
Environmental Regulation 40
Information on Directors 41
Information on Company Secretary 43
Meetings of Directors 44
2016 Remuneration Report Summary (Unaudited) 45
2016 Remuneration Report (Audited) 46
Options and Rights 69
Insurance and Indemnity of Officers 70
Indemnity of Auditors 70
Proceedings on behalf of the Company 70
Loans to Directors and Executives 70
Non-audit services 70
Auditor’s Independence Declaration 71
Rounding of Amounts 71
Auditor 71

Directors’ Report 30 June 2016
TOX FREE SOLUTIONS LTD | Annual Report | 30 June 2016 DIRECTORS’ REPORT Page 39 of 173
The Directors of Toxfree are pleased to present their report, together with the financial statements of the Group, being Tox Free Solutions Limited (Toxfree) and its controlled entities (the "Group"), for the financial year ended 30 June 2016.
Directors The following persons were Directors of Toxfree during the whole of the financial year and up to the date of this report, unless indicated:
Non-Executive Directors Robert McKinnon (Non-Executive Chairman) Richard (Dick) Allen Michael Humphris Katherine Hirschfeld
Executive Directors Stephen Gostlow
Result The statutory profit after tax for the Group was $13,054,000 (2015: $21,994,000).
Non-IFRS Financial Information The underlying profit after tax for the Group was $23,256,000 (2015: $22,970,000).
The underlying profit includes adjustments that are one off in nature and do not reflect the underlying performance of the business. Please refer to the Managing Director’s Review of Operations set out in pages 11 to 28 for additional information.
Principal activities The principal activities of the Group during the financial year were the provision of industrial services and waste management.
There were no significant changes in the nature of the Group's principal activities during the financial year.
Dividends - Tox Free Solutions Limited Dividends paid to members during the financial year were as follows:
2016
$’000
2015
$’000
The following dividends were declared and paid:
Final ordinary dividend for the year ended 30 June 2015 of 4.5 cents (2014: 3 cents) per share 6,031 4,013 Interim ordinary dividend for the year ended 30 June 2016 of 4.5 cents (2015: 4 cents) per share 6,047 5,350
Total dividends provided for or paid 12,078 9,363
Since the end of the financial year the directors have recommended the payment of a final ordinary dividend of $6,476,385 (4.5 cents per fully paid ordinary share) to be paid on 29 September 2016 out of retained earnings at 30 June 2016.

Directors’ Report 30 June 2016
TOX FREE SOLUTIONS LTD | Annual Report | 30 June 2016 DIRECTORS’ REPORT Page 40 of 173
Review of operations Information on the Group’s operations, financial position, strategies and prospects is set out in the Managing Director’s Review of Operations. Please refer to pages 11 to 28 of this Annual Report.
Significant changes in the state of affairs There were no significant changes in the state of affairs of the Group during the financial year.
Events since the end of the financial year Subsequent to the year end, the Directors of Toxfree recommended the payment of a final dividend on ordinary shares in respect of the 2016 financial year. The total amount of the dividend is $6,476,385 which represents a fully franked dividend of 4.5 cents per share.
On 1 August 2016, Tox Free acquired 100% of the shares in Active Industrial Solutions Pty Ltd and 100% of the units in the Active Industrial Solutions Unit Trust (AIS) for a consideration of $6.4m including working capital. AIS are an industrial services business operating in Melbourne, Victoria. The acquisition of AIS creates the opportunity to strengthen Toxfree’s position in the metropolitan and municipal services market.
Except for the above, no other matters or circumstances have arisen since 30 June 2016 that has significantly affected or may significantly affect the operations of the Group, the results of those operations, or the state of affairs of the Group in future financial years.
Likely developments and expected results of operations The Group will continue to pursue its strategy of developing into one of Australia's leading industrial services and waste management Groups and increasing market share of its major business segments during the next financial year.
Additional comments on the operations of the Group, its strategies and prospects are set out in the Managing Director’s Review of Operations on pages 11 to 28 of this Annual Report.
Environmental Regulation The Group's operations are subject to significant environmental regulations and as such Toxfree currently hold 70 licences and approvals for the operation of its waste facilities and waste transport fleet throughout Australia. These licences and approvals relate to the management of waste including; storage, treatment, transportation and disposal. They set conditions on how we transport waste, receive waste, operate our sites and manage our emissions and discharges
Our environmental legal requirements are assessed, managed and monitored through our ISO 14001 certified QUEST Management System. A rigorous internal audit program is in place to monitor compliance and continually improve our management system.
There have been no prosecutions commenced or pending against the Group’s licences during the period.
National Greenhouse and Energy Reporting Scheme The Group has a system for the collection and calculation of greenhouse gas emissions, energy production, energy consumption and other information specified under NGER legislation.
The Group triggered the corporate group threshold under the National Greenhouse and Energy Reporting Act 2007 and registered in August 2014.

Directors’ Report 30 June 2016
TOX FREE SOLUTIONS LTD | Annual Report | 30 June 2016 DIRECTORS’ REPORT Page 41 of 173
A report was submitted to the Clean Energy Regulator in October 2015, reporting the Group’s corporate and facilities scope 1 and scope 2 emissions and energy consumption for the 2015 financial year. Finalisation of data collection and calculation for 2016 financial year is underway and Toxfree will report under the scheme in October 2016.
Information on Directors – 30 June 2016 The following information is current as at the date of this report.
Robert McKinnon Non-Executive Director
Qualifications
Fellow CPA Australia; Fellow of the Governance Institute of Australia; Member of the Australian Institute of Company Directors
Experience
Robert has been Managing Director of Fleetwood Corporation Limited and Austal Limited. His career spans over 30 years in senior financial and general management positions
Interest in shares, options and rights
50,858 ordinary shares
Special responsibilities
Chair of the Board and Nomination Committee. Member of the Remuneration, Audit and Risk Committees
Other current Directorships in listed entities
Non-Executive Director of Programmed Maintenance Services Limited and Peet Limited
Other Directorships in listed entities held in the previous three years
Nil
Stephen Gostlow Managing Director
Qualifications
Environmental Scientist, Graduate of the Australian Institute of Company Directors
Experience
Stephen has over 19 years’ experience in the waste management industry. His background includes experience in waste treatment, waste technologies and regulatory compliance. Stephen has been employed by Toxfree since 2002 and was appointed Managing Director in 2005
Interest in shares, options and rights
1,250,833 ordinary shares, granted 137,507 share performance rights and 667,326 appreciation rights
Special responsibilities
Nil
Other current Directorships in listed entities
Nil
Other Directorships in listed entities held in the previous three years
Nil

Directors’ Report 30 June 2016
TOX FREE SOLUTIONS LTD | Annual Report | 30 June 2016 DIRECTORS’ REPORT Page 42 of 173
Michael Humphris Non-Executive Director
Qualifications Chartered Accountant; Member of the Australian Institute of Company Directors
Experience
Michael has over 30 years’ experience in the areas of business advice, corporate recovery and dispute resolution. He has extensive experience in business reconstructions and enhancing value for Shareholders. Michael is also Chairman of an unlisted public company and a government owned enterprise.
Interest in shares, options and rights
650,000 ordinary shares
Special responsibilities
Chair of the Audit Committee, Member of the Risk, Remuneration and Nomination Committees
Other current Directorships in listed entities
None
Other Directorships in listed entities held in the previous three years
Non-Executive Director of Virax Holdings Ltd from16 January 2008 to 2 September 2013.
Richard Allen Non-Executive Director
Qualifications Civil Engineer, Member of the Australian Institute of Company Directors
Experience
Richard has extensive national and international experience in the management of public and private companies. He has managed businesses in Australia, the Middle East and Asia, with the bulk of his experience focussed around upstream oil and gas exploration, environmental services and the renewable energy sector
Interest in shares, options and rights
153,231 ordinary shares
Special responsibilities
Chair of the Remuneration Committee; Member of the Audit , Risk and Nomination Committees
Other current Directorships in listed entities
Nil
Other Directorships in listed entities held in the previous three years
Nil

Directors’ Report 30 June 2016
TOX FREE SOLUTIONS LTD | Annual Report | 30 June 2016 DIRECTORS’ REPORT Page 43 of 173
Katherine Hirschfeld Non-Executive Director
Qualifications
Chemical Engineer, Fellow of the Australian Institute of Company Directors
Experience
Katherine has significant experience in management and leadership of public and private companies, both nationally and internationally. She has operated businesses in Turkey, as well as Australia, with the bulk of her experience focussed around oil refining, logistics, exploration and production
Interest in shares, options and rights
20,284 ordinary shares
Special responsibilities
Chair of the Risk Committee; Member of the Audit, Remuneration and Nomination Committees
Other current Directorships in listed entities
Nil
Other Directorships in listed entities held in the previous three years
Non-Executive Director of Broadspectrum Limited (formerly Transfield Services Limited) from 28 October 2013 to 13 May 2016 and Non-Executive Director of InterOil Corporation from 1 January 2015 to 14 June 2016.
Each Director has been in office since the start of the financial year to the date of this report unless otherwise stated. Information on Company Secretary – 30 June 2016 Mr David McArthur has a Bachelor of Commerce Degree and is also a Chartered Accountant. David spent four years with a major international accounting firm and has been actively involved in the financial and corporate management of a number of public listed companies over the past 30 years. David has substantial experience in capital raisings, company re-organisations and restructuring, mergers and takeovers, and asset acquisitions by public companies.
David has been Company Secretary for the full financial year and up to the date of this report.

Directors’ Report 30 June 2016
TOX FREE SOLUTIONS LTD | Annual Report | 30 June 2016 DIRECTORS’ REPORT Page 44 of 173
Meetings of Directors The number of meetings of the Company’s Board of Directors and of each Board Committee held during the year ended 30 June 2016, and the numbers of meetings attended by each Director were:
Directors' Meetings Audit Committee Risk Committee
Number eligible to
attend Number attended
Number eligible to
attend Number attended
Number eligible to
attend Number attended
Robert McKinnon 11 11 6 6 4 4
Stephen Gostlow ^ 11 11 6 6 4 4
Michael Humphris 11 11 6 6 4 4
Richard Allen 11 11 6 6 4 4
Katherine Hirschfeld 11 11 6 6 4 4
Remuneration
Committee Nomination Committee
Number eligible to
attend Number attended
Number eligible to
attend Number attended
Robert McKinnon 6 6 0 0
Stephen Gostlow ^ 6 6 0 0
Michael Humphris 6 6 0 0
Richard Allen 6 6 0 0
Katherine Hirschfeld 6 6 0 0
^ Stephen Gostlow is an Executive Director and therefore not a member of each committee. Attendance requested at committee meetings by the relevant members of each committee. The Nomination Committee did not have a specific need to meet during the year.

Directors’ Report 30 June 2016
TOX FREE SOLUTIONS LTD | Annual Report | 30 June 2016 DIRECTORS’ REPORT Page 45 of 173
2016 REMUNERATION REPORT SUMMARY (UNAUDITED)
During the year remuneration of Key Management Personnel (KMP) was benchmarked at the request of the Remuneration Committee by PricewaterhouseCoopers (PwC) against a peer group of companies of a similar size (by market capitalisation), in order to determine whether any adjustments were required. This information has been used to support and develop executive remuneration in the current and future financial years to ensure continued alignment with financial and strategic objectives. The following Peer Group was used for the KMP benchmark review:
Company 3 month average
market cap($) as at 30 Sept 2015 ($M)
Primary Industry
Monadelphous Group Limited 710 Construction and Engineering
Cardno Limited 469 Construction and Engineering
Tox Free Solutions Limited 375 Environmental and Facilities
Services
Programmed Maintenance Services Ltd 304 Environmental and Facilities
Services
RCR Tomlinson Limited 260 Construction and Engineering
MACA Limited 182 Construction and Engineering
Decmil Group Limited 175 Construction and Engineering
Ausdrill Ltd 90 Construction and Engineering
Ausenco Limited 61 Construction and Engineering
NRW Holdings Limited 41 Construction and Engineering
Percentile Market Cap($M)
75th percentile 304
50th percentile 182
25th percentile 90
Average 255
Toxfree’s policy is to position Executive remuneration at the 50th percentile of the market. Any adjustments proposed to be made to the KMP remuneration will take effect in respect of the 2016/2017 financial year. Changes post FY 2015
There have been no significant changes to the Toxfree remuneration framework post FY15.

Directors’ Report 30 June 2016
TOX FREE SOLUTIONS LTD | Annual Report | 30 June 2016 DIRECTORS’ REPORT Page 46 of 173
2016 REMUNERATION REPORT (AUDITED)
The Directors are pleased to present your Company’s 2016 Remuneration Report prepared in accordance with the Corporations Act 2001. The Report sets out detailed remuneration information for Toxfree’s Non-Executive Directors, Executive Directors and other Executive KMP of the Group.
The report contains the following sections:
A. DIRECTORS, COMPANY SECRETARY AND EXECUTIVE KMP COVERED IN THIS REPORT (PAGE 46)
B. REMUNERATION GOVERNANCE (PAGE 47)
C. USE OF REMUNERATION CONSULTANTS (PAGE 47)
D. EXECUTIVE REMUNERATION STRATEGY AND FRAMEWORK (PAGE 47)
E. DETAILED OVERVIEW OF THE OPERATION OF THE STI AND LTI - 30 JUNE 2016 (PAGE 54)
F. REMUNERATION PAID TO THE MD AND OTHER EXECUTIVE KMP (PAGE 61)
G. SERVICE AGREEMENTS (PAGE 63)
H. NON-EXECUTIVE DIRECTOR REMUNERATION (PAGE 64)
I. OTHER – KMP DISCLOSURES (PAGE 66)
J. VOTING AND COMMENTS MADE AT THE COMPANY’S 2015ANNUAL GENERAL MEETING (PAGE 68)
A. DIRECTORS, COMPANY SECRETARY AND EXECUTIVE KMP COVERED IN THIS REPORT
Name Position
Directors
Robert McKinnon Non-Executive Chairman
Stephen Gostlow Managing Director (MD)
Michael Humphris Non-Executive Director
Katherine Hirschfeld Non-Executive Director
Richard Allen Non-Executive Director
Company Secretary
David McArthur Company Secretary
Executive KMP
Michael Constable Chief Financial Officer (CFO)
Edward Goodwin Chief Operating Officer (COO)
Jason Dixon Executive General Manager - Corporate & Risk (EGM C&R)
Joshua Bovell Chief Information Officer
Sarah Bagshawe Executive General Manager - Human Resources (EGM HR)
David McArthur is an external provider of company secretarial services and is not an employee of the company. David is no longer regarded as a key management person from 1 July 2015. There were no other changes to Directors and Executive KMP during the financial year under review.

Directors’ Report 30 June 2016
TOX FREE SOLUTIONS LTD | Annual Report | 30 June 2016 DIRECTORS’ REPORT Page 47 of 173
B. REMUNERATION GOVERNANCE
The Remuneration Committee is a committee of the Board. It assists the Board in fulfilling its responsibilities relating to the remuneration of Directors, the remuneration of, and incentives for the MD and other Executive KMP, and remuneration practices, strategies and disclosures generally. The Remuneration Committee also reviews gender pay equity. It is critical that the Remuneration Committee is independent of management when making decisions affecting employee remuneration. Accordingly, the Remuneration Committee is comprised solely of Non-Executive Directors, all of whom are independent. A critical objective of the Remuneration Committee is to ensure that remuneration policies and structures are fair, competitive and aligned with the long-term interests of the Group. In doing this, during the year the Remuneration Committee sought assistance from independent remuneration consultants. Refer to section C “Use of Remuneration Consultants” below for details. The membership of the Remuneration Committee did not change during the 2016 financial reporting year. The Corporate Governance Statement set out on pages 72 to 82 provides further information on the role of the Remuneration Committee.
C. USE OF REMUNERATION CONSULTANTS
During the year PwC was engaged to provide market data on executive remuneration to enable the Remuneration Committee to determine whether any adjustments to KMP remuneration were required. PwC did not provide any remuneration recommendations (as defined in the Corporations Act 2001) during the year ended 30 June 2016. For the provision of benchmarking market data, PwC was paid a total of $20,533 (including GST).
D. EXECUTIVE REMUNERATION STRATEGY AND FRAMEWORK
The Group’s executive remuneration strategy is designed to attract, retain and motivate a highly qualified and experienced management team with the necessary skills and attributes to lead the Group in achieving its business objectives. The strategy also aims to encourage management to strive for superior performance by rewarding the achievement of targets that are challenging, clearly understood and within the control of individuals to achieve through their own actions. The objective of the Group’s executive remuneration framework is to ensure that remuneration for performance is competitive and appropriate for the results delivered. The framework aligns executive remuneration with achievement of strategic objectives and the creation of value for shareholders, and conforms to market practice for delivery of reward.
The Board ensures that executive remuneration satisfies the following key criteria for good reward governance practices:
Competitive and reasonableness
Acceptability to shareholders

Directors’ Report 30 June 2016
TOX FREE SOLUTIONS LTD | Annual Report | 30 June 2016 DIRECTORS’ REPORT Page 48 of 173
Performance linkage / alignment of executive compensation
Transparency The Group has structured an executive remuneration framework that is market competitive and complementary to the reward strategy of the organisation. The framework provides a mix of fixed and variable pay, and a blend of short and long-term incentives. As executives gain seniority within the Group, the balance of this mix shifts to a higher proportion of “at risk” rewards. The Executive Remuneration Framework has three components:
1. Fixed Remuneration (FAR)
2. Short-term incentives - Cash Bonus
3. Long-term incentives - Through the issue of Performance Rights (PR) and Share Appreciation Rights (SAR) under the Tox Free Solutions Limited Long-Term Incentive Plan
The combination of the above comprises an executive’s Total Annual Remuneration Cost (TAR). Executive Remuneration Mix
The remuneration of the MD and other Executive KMP was structured as a mix of fixed remuneration and variable or “at risk” remuneration through short-term and long-term incentive components.
Target remuneration mix for the year to 30 June 2016 was:
0% 10% 20% 30% 40% 50% 60% 70% 80% 90% 100%
Other KMP
MD
2016 Total Remuneration Mix
Fixed
STIP
LTIP

Directors’ Report 30 June 2016
TOX FREE SOLUTIONS LTD | Annual Report | 30 June 2016 DIRECTORS’ REPORT Page 49 of 173
1. Fixed Remuneration (FAR)
Executives receive their base pay, allowances and superannuation as a fixed annual remuneration package.
FAR:
Comprises cash salary, allowances, superannuation and other prescribed benefits
Provides a base level of reward for effective completion of business and specific accountabilities
Is not “at risk” but is appropriately benchmarked and set with reference to role, responsibilities, skills and experience
There are no guaranteed FAR increases in any executive employment agreements. FAR levels are reviewed annually by the Remuneration Committee with reference to an individual’s role, experience and performance, as well as relevant comparative market data. Independent remuneration consultants and surveys, internal relativities and market conditions also provide guidance. An executive’s FAR is also reviewed on a change in role and upon promotion. 2. Short Term Incentive (STI) – Cash Bonus
Executives have the opportunity to earn an annual cash bonus under the STI Plan if predefined performance measures are achieved. The measures may include Group, team and individual performance and behavioural measures linked to business objectives including environmental, social and governance principles.
This aligns executive interests with the Group’s financial performance, as well as management principles and the Group’s cultural values, as follows:
Annual rewards are tied to pre-determined individual and business performance measures
Individual targets reflect individual specific accountabilities and key drivers for growth and success
The Group performance targets are linked to the achievement of business plan
The safety performance is linked to the pre-set annual target STI performance measures are set at the beginning of a financial year and include a threshold, target and stretch component. The setting of performance measures and components also depend on the senior executive’s level and seniority. An executive’s individual (key performance indicators) and Group performance targets are set by the Board.
For the year ended 30 June 2016, the performance measures for the STI cash bonus were linked to:
Achievement of the Board approved Business Plan
Working Capital
Return on Investment
Safety Performance
Individual Performance Review
Please refer to Section E, pages 54 to 60 for additional details on performance measures.

Directors’ Report 30 June 2016
TOX FREE SOLUTIONS LTD | Annual Report | 30 June 2016 DIRECTORS’ REPORT Page 50 of 173
3. Long Term Incentive (LTI) – Issue of PR and SAR
On 24 November 2011, Toxfree shareholders approved the adoption of a new Tox Free Solutions Executive Long-Term Incentive (LTI) Plan. Under the LTI Plan, the Board has the discretion to grant PR and/or SAR annually to certain executives. Vesting of awards granted under the LTI Plan will be subject to the satisfaction of performance hurdles determined by the Board.
During the year ended 30 June 2016, the value of all long-term incentive awards granted under the LTI Plan was split evenly between PR and SAR. Both PR and SAR (collectively referred to as “Rights”) have a performance period of three years. The performance measures for the LTI awards granted during the year ended 30 June 2016 are as follows:
Total Shareholder Return (TSR) (50% of the grant) - measured against selected ASX 300 companies
Earnings Per Share (EPS) (50% of the grant)
Both PR and SAR are subject to the two performance hurdles:
50% of each PR and SAR grant will be subject to an EPS growth hurdle (Tranche 1); and
the remaining 50% of each PR and SAR grant will be subject to a TSR hurdle (Tranche 2)
The performance measures are mutually exclusive such that if only one of the hurdles is satisfied, vesting will still occur for that portion of the grant. There is no retesting of performance for the LTI. If any of the Rights fail to become exercisable due to failure to satisfy the vesting conditions, the grant will be forfeited.
Quantum of LTI award The LTI quantum to be granted will be determined with reference to current market practice and will be subject to approval by the Board. The LTI dollar value that Senior Executives will be entitled to receive is set at a fixed percentage of their annual base salary and ranges from 25% to 60% depending on the participants’ level and seniority.
PR Each PR represents a right to be issued one ordinary share at a future point in time. No exercise price will be payable and eligibility to receive a PR under the LTI Plan will be at the Board’s discretion.
SAR Each SAR represents the right to receive a payment equal to the positive difference between the share price at grant and the share price at the vesting date. The total value of all SAR’s on the vesting date will be settled via the provision of shares of an equivalent value.
The share price at the start date and at the vesting date will be determined by reference to the 30-day value weighted average share price (VWAP) at the time of grant and vesting.
The following simple example demonstrates how SAR is to be settled:
100,000 SAR are granted
30-day VWAP at the start date is $1.00
30-day VWAP at the vest date is $2.00

Directors’ Report 30 June 2016
TOX FREE SOLUTIONS LTD | Annual Report | 30 June 2016 DIRECTORS’ REPORT Page 51 of 173
At the vest date (and provided all performance hurdles are satisfied), the 100,000 SAR vest and the dollar value of SAR is $100,000 (100,000 SAR x ($2.0 - $1.0)). The SAR is settled via an issue of 50,000 shares ($100,000 / $2.00) to the Executive.
EPS Performance Condition
EPS performance is assessed against compound annual growth rate (CAGR) targets that are set by the Board. Performance vesting is staggered in the following manner:
EPS performance - CAGR (%) Performance vesting outcome
0% to <5% No rights vest
5% <6% 50% vest
6% <7% 60% vest
7% <8% 70% vest
8% <9% 80% vest
9% <10% 90% vest
10% and greater 100% vest
In setting the CAGR that determines vesting, the Remuneration Committee reviewed the returns of a comparable index and reviewed industry growth rates. Comparable index The comparable index was determined to be the ASX300 Industrials (excluding companies within the metals and mining, financial services, infrastructure, investment and property sectors). This determination is consistent with the prior year. This is the same index that will be used to measure TSR performance (please refer to “TSR Performance Condition” information set out on pages 52 to 53). Industry growth rates The Remuneration Committee referenced the IBIS World Industry Report of March 2012 (Waste Disposal Services in Australia) and the National Waste Report of 2010 (Australian Government – Department of the Environment, Water, Heritage and the Arts). The forecast for the industry growth rate was an IBIS forecast growth of 5.7% per annum from 2012-2017 and the National Waste Report forecast growth of 4.5% per annum 2006-2007 until 2020-2021, a combined average of 5.1%. Toxfree targets Based on its review, the Remuneration Committee determined that 10% CAGR over a three year period was substantially above the comparable index and looking forward, well exceeded the long-term ten year average for the comparator group. Further, it felt that 10% CAGR in EPS was a high hurdle rate as it represented approximately twice the industry forecast growth rate. The 10% growth hurdle has been exceeded historically due to some strategic acquisitions which may not reoccur in the future.

Directors’ Report 30 June 2016
TOX FREE SOLUTIONS LTD | Annual Report | 30 June 2016 DIRECTORS’ REPORT Page 52 of 173
Accordingly, the Remuneration Committee determined that full vesting would occur at an EPS CAGR of 10% or greater and that staggered vesting would commence from 5% CAGR onwards (which was a comparable level with the comparable index and the industry). This determination is consistent with the prior year. Calculation of EPS
EPS measures the earnings generated per ordinary share and the formula for calculating EPS is shown below:
Underlying operating profit attributable to shareholders Weighted average number of ordinary shares
The weighted average number of ordinary shares for the year will be used to calculate EPS. TSR Performance Condition
TSR measures the return received by shareholders from the holding shares in a Company over a particular period. TSR is calculated by taking into account the growth in the Company’s share price over the period and also takes into account the dividends received during that period. The formula for calculating TSR is detailed below:
(Share Price at Test Date – Share Price at Start Date) + ($ Dividends) Share Price at Start Date
A volume weighted average price (VWAP) is used to determine share price at test date and share price at start date.
Toxfree’s TSR is ranked against a peer group of companies in order to adequately measure the performance hurdle:
TSR of the companies in the peer group is calculated; then
These companies are ranked according to their TSR;
Toxfree’s TSR is calculated to determine what percentile in the peer group it relates to;
This percentile determines how many Rights will vest. The TSR (FY16 grant) will be measured against the S&P ASX300 index members as at 1 July 2015 (excluding companies within the metals and mining, financial services, infrastructure, investment and property sectors). Vesting for the Relative TSR portion of the grant will occur as follows:
Relative TSR performance Performance vesting outcomes
Less than the 50th percentile 0% vesting
At the 50th percentile 50% vesting
Between 50th and 75th percentile For each percentile over the 50th, an additional 2% of the PR and SAR will vest
At or above 75th percentile 100% vesting

Directors’ Report 30 June 2016
TOX FREE SOLUTIONS LTD | Annual Report | 30 June 2016 DIRECTORS’ REPORT Page 53 of 173
For the FY16 PR and SAR grants, the peer group included Toxfree and the following companies:
Acrux Limited Adelaide Brighton Ltd Affinity Education Group Limited
Ainsworth Game Technology Ltd ALS Limited Altium Ltd
Amcor Limited Ansell Ltd APN News & Media Ltd
APN Outdoor Group Limited ARB Corporation Limited Ardent Leisure Group
Aristocrat Leisure Ltd Asaleo Care Limited Ausdrill Ltd
Austal Ltd Australian Agricultural Company Limited Australian Pharmaceutical Ind Ltd
Automotive Holdings Group Limited Bega Cheese Limited Billabong International Limited
Bionomics Ltd Boral Limited Bradken Limited
Brambles Limited Breville Group Limited Burson Group Limited
Cabcharge Australia Ltd Capitol Health Ltd Cardno Limited
carsales.com Limited Cash Converters International Limited CIMIC Group Limited
Coca-Cola Amatil Limited Cochlear Ltd Collection House Limited
Computershare Limited Corporate Travel Management Limited Credit Corp. Group Ltd
Crown Resorts Limited CSG Limited CSL Ltd
CSR Limited Decmil Group Limited Dick Smith Holdings Limited
Domino’s Pizza Enterprises Limited Donaco International Limited Downer EDI Limited
DuluxGroup Limited Echo Entertainment Group Limited Energy World Corp Ltd
Estia Health Limited Fletcher Building Ltd Fairfax Media Limited
Flight Centre Travel Group Limited Fisher & Paykel Healthcare Corp Limited G8 Education Limited
GBST Holdings Limited GrainCorp Ltd Greencross Limited
GUD Holdings Limited GWA Group Limited Hansen Technologies Limited
Harvey Norman Holdings Ltd Healthscope Limited Hills Limited
ImpediMed Limited Incitec Pivot Limited Infigen Energy
Infomedia Ltd iiNet Ltd InvoCare Ltd
IPH Limited iProperty Group Limited IRESS Limited
iSelect Ltd iSentia Group Limited James Hardie Industries plc
Japara Healthcare Limited JB Hi-Fi Limited Kathmandu Holdings Limited
M2 Group Ltd MACA Limited Mantra Group Limited
Mayne Pharma Group Limited McMillan Shakespeare Ltd Mesoblast Limited
Metcash Limited Mineral Resources Limited MMA Offshore Limited
Monadelphous Group Limited Monash IVF Group Limited Myer Holdings Limited
Nanosonics Limited Navitas Limited NEXTDC Limited
Nine Entertainment Co Holdings Limited NRW Holdings Limited News Corporation
Nufarm Limited oOh! media Limited Orica Limited
Orora Limited Pacific Brands Limited Pact Group Holdings Limited
Premier Investments Limited Primary Health Care Limited Prime Media Group Limited
Programmed Maintenance Services Ltd Qantas Airways Limited Ramsay Health Care Limited
RCG Corporation Limited RCR Tomlinson Limited REA Group Limited
Recall Holdings Limited Reckon Ltd Regis Healthcare Limited
Retail Food Group Limited Ridley Corporation Limited ResMed Inc
SAI Global Limited SEEK Limited Select Harvests Limited
Sky City Entertainment Group Ltd Sky Network Television Limited Seven Group Holdings Limited
Seven West Media Limited SG Fleet Group Limited Shine Corporate Limited
Sigma Pharmaceuticals Ltd Sirtex Medical Limited SKILLED Group Limited
Slater & Gordon Limited SMS Management & Technology Ltd Sonic Healthcare Limited
Southern Cross Media Group Spotless Group Holdings Limited Spark New Zealand Limited
Starpharma Holdings Limited STW Communications Group Ltd Super Retail Group Limited
Tabcorp Holdings Ltd Tassal Group Limited Tatts Group Limited
Trade ME Group Ltd TechnologyOne Limited Telstra Corporation Limited
Ten Network Holdings Limited TFS Corporation Limited The Reject Shop Limited
Thorn Group Limited TPG Telecom Limited Transfield Services Limited
Transpacific Industries Group Ltd Treasury Wine Estates Limited UGL Limited
UXC Limited Veda Group Limited Village Roadshow Limited
Virtus Health Limited Vocus Communications Limited Webjet Ltd
Wesfarmers Limited Woolworths Limited WorleyParsons Limited

Directors’ Report 30 June 2016
TOX FREE SOLUTIONS LTD | Annual Report | 30 June 2016 DIRECTORS’ REPORT Page 54 of 173
E. DETAILED OVERVIEW OF THE OPERATION OF THE STI AND LTI - 30 JUNE 2016
1. Short Term Incentive – Cash Bonus
STI DISCLOSURE
The FY2016 STI amounts have been reviewed and approved by the Board through the Company’s Remuneration Committee and will be paid in September 2016. These amounts have been accrued within the 2016 financial results.
For additional information please refer to Part F “Remuneration paid to the MD and Other Executive KMP” set out on pages 61 to 62.
STI MEASURES, OUTCOMES AND THE RELATIONSHIP BETWEEN PERFORMANCE AND STI FOR FY2016
STI performance measures are reviewed and set at the beginning of a financial year and include a threshold, target and stretch component.
There were five categories of STI performance measures for the MD and other Executive KMP for the year ended 30 June 2016. Those measures were chosen to provide a balance between corporate, individual, operational, strategic, financial and behavioural aspects of performance and are described below.
The five performance measures for FY2016 are:
Group - Achievement of Business Plan
Group - Safety Performance
Group - Working Capital
Group - Return on Investment
Individual - Performance Review For the year ended 30 June 2016, the MD and the COO had a target STI opportunity of 50% of their base salary and a maximum opportunity of 100% of their base salary. Other KMP had a target STI opportunity of 20% to 40% of their base salary and a maximum STI opportunity of 50% of their base salary. The weighting of the performance measures in relation to each Senior Executive’s STI for FY2016 is:
Measure MD & COO
Weighting % CFO Weighting
% EGM (C&R)
Weighting %
CIO &EGM (HR)
Weighting %
Achievement of Business Plan 40 30 30 30
Safety Performance 15 15 25 15
Working Capital 15 20 10 10
Return on Investment 15 15 15 15
Performance Review 15 20 20 30

Directors’ Report 30 June 2016
TOX FREE SOLUTIONS LTD | Annual Report | 30 June 2016 DIRECTORS’ REPORT Page 55 of 173
FINANCIAL YEAR 2016 PERFORMANCE
The Remuneration Committee considered the performance of each of the Executive against the five STI performance measures outlined above.
Performance against the Business Plan exceeded the threshold but was below target. The exceptional Company Safety Performance exceeded target, however both Working Capital and Return on Investment failed to meet the target thresholds. From an individual performance perspective, the Executive implemented a number of strategic initiatives in FY16 designed to continue to diversify Toxfree’s services by geography and services. The acquisition of Worth Recycling was an important strategic initiative completed within FY16 that provides Toxfree exposure into one of the fastest growing markets (NSW) in Australia. There was further expansion of services into e-waste recycling as well as the award of the BHP Billiton Olympic Dam contract. Results for financial year 2016 reflect solid group performance, as the company continues to grow its earnings from east coast operations and producing assets across Australia. The Company delivered sound earnings to record Earnings before Interest, Tax, Depreciation and Amortisation (EBITDA) of $72.9m* up 1% on FY15, and Net Profit after Tax (NPAT) of $23.3m*. Cash generated from operations was again particularly strong and through a disciplined and focused strategy on capital expenditure the company was able to fund a number of growth initiatives that will, over time, prove to be significant strategic investments for shareholders. During the year, the Debtor days’ sales outstanding reduced by 15% and the cash conversion was 99% of EBITDA*. At June 30, Toxfree had cash in bank of $32m, net borrowings of $101.9m and net debt to equity of 37%. Net cash capital investment in the business was $23.4m during the period. Toxfree’s safety performance was a key highlight in FY16. The Company’s safety culture continues to improve with significant improvement in all key metrics ^ with a Lost Time Injury Frequency Rate of zero and reduction in Total Recordable Injury Frequency Rate (TRIFR) 0f 18% and a reduction in All Injury Frequency Rate (AIFR) of 43% on FY15. *Non-IFRS Financial Information - Normalised for non-operational adjustments – refer to Tables 1 & 2 on pages 11-12 for further detail.
^ Safety metrics are accurate at the time of publication.

Directors’ Report 30 June 2016
TOX FREE SOLUTIONS LTD | Annual Report | 30 June 2016 DIRECTORS’ REPORT Page 56 of 173
Senior Executive STI awards for the year ended 30 June 2016 are set out in the table below:
Actual STI
awarded
($)#
Actual STI
awarded % of base
STI forfeited
(%)
Name
Eligible Annual Base
Salary ($)
Maximum STI
Opportunity %
Maximum STI Value
($) Accrued^
Stephen Gostlow 573,000 100% 573,000 239,476 42% 58%
Edward Goodwin 454,000 100% 454,000 198,254 44% 56%
Michael Constable 348,000 50% 174,000 94,484 54% 46%
Jason Dixon 348,000 50% 174,000 115,364 66% 34%
Josh Bovell 270,000 50% 135,000 57,188 42% 58%
Sarah Bagshawe 147,000 Ω 50% 73,500 30,995 Ω 42% 58%
^ The STI payments in respect of FY2016 have been accrued and will be paid in September 2016.
# Amount excludes superannuation.
Ω Sarah Bagshawe: maternity leave until 11 January 2016 – STI value is calculated on a pro-rata basis. Base salary is based on a part-time three day working week.
GROUP PERFORMANCE SUMMARY:
Details 2016 2015 2014 2013 2012
Share price at year end (cents) 259 302 338 345 250
Dividend paid per share (cents) ¥ 9.0 8.5 6 5 4
Service Revenue ($’000) 393,380 407,278 369,997 284,723 207,963
Statutory NPAT ($‘000) 13,054 21,994 21,724 13,604 15,726
Underlying NPAT ($’000) ϡ 23,256 22,970 22,982 21,703 17,208
Number of ordinary shares (’000) 143,920 134,013 133,752 132,530 115,322
Weighted average number of shares (’000) 136,573 133,806 133,064 117,917 105,562
Market capitalisation($’000) 372,752 404,720 452,083 457,228 288,304
Statutory earnings per share (cents) 9.23 16.27 16.33 11.54 14.90
Underlying earnings per share (cents) ϡ 16.70 17.00 17.27 18.41 16.33
KMP STI incentive ^ as a % of Underlying NPAT Ϡ 3.2% 3.7% 4.3% 4.4% 4.9%
^ STI incentive calculation excludes superannuation component
Ϡ Non-IFRS financial information; please refer to the MD’s Review of Operations set out in pages 11 to 28 for additional information.
¥ includes proposed final dividend for each specific financial year under review.

Directors’ Report 30 June 2016
TOX FREE SOLUTIONS LTD | Annual Report | 30 June 2016 DIRECTORS’ REPORT Page 57 of 173
ADDITIONAL EXECUTIVE REMUNERATION INFORMATION Assessment of Performance Performance against the Group’s targets is assessed by the Board. The MD’s performance is assessed against individual KPIs by the Remuneration Committee which then makes recommendations to the Board. The performance of other Executive KMP against their individual KPIs is assessed by the MD, who confers with the Remuneration Committee and then the Board regarding this assessment. After the year end accounts have been audited and related KPIs have been assessed, the Board approved the STI awards. STI cash awards for the year ended 30 June 2016 will be paid in September 2016. The Board believes the method of assessment is rigorous and provides a balanced evaluation of the MD and other Executive KMP performance. Long-term KMP retention issues are addressed via the LTI Plan. Cessation of Employment Under the service agreements for Senior Executives in place for the year ended 30 June 2016, if a Senior Executive ceased employment with the Group before performance against STI targets were assessed, they would generally not be entitled to receive any STI award, unless otherwise determined by the Board. Executive Remuneration Review The Remuneration Committee has engaged its remuneration consultants, PWC, to review the existing Toxfree Executive Remuneration Framework in FY17 to ensure it meets best practice standards and remains competitive with the market. The review will focus on whether the existing plan is meeting the objectives of the policy framework; to adequately remunerate, retain and incentivise the Executive team as well as ensuring good alignment of reward with shareholders’ interests.
2. Long-Term Incentives – PR and SAR Details of Rights issued for the year ended 30 June 2016 are as follows: On 1 July 2015, 268,213 Performance Rights and 1,343,072 Share Appreciation Rights were granted to Key Management Personnel and to Senior Management under the Executive LTI Plan. The rights vest on 30 June 2018. Specific disclosure details of the 1 July 2015 grant are as follows:

Directors’ Report 30 June 2016
TOX FREE SOLUTIONS LTD | Annual Report | 30 June 2016 DIRECTORS’ REPORT Page 58 of 173
Details
Performance
Rights Granted
Share Appreciation
Rights Granted
Total
Value of Rights
Granted ($)
Directors S Gostlow^ 77,231 386,732 463,963 343,800 KMP E Goodwin 50,993 255,346 306,339 227,000 M Constable 23,452 117,437 140,889 104,400 J Dixon 23,452 117,437 140,889 104,400 S Bagshawe 13,759 68,899 82,658 61,250 J Bovell 15,163 75,929 91,092 67,500 Senior Management 64,163 321,292 385,455 285,625
268,213 1,343,072 1,611,285 1,193,975
^ The grant to Mr S Gostlow was approved by the shareholders at the Annual General Meeting held on 20 November 2015. The above grants made under the Executive LTI Plan will vest subject to the satisfaction of Relative Total Shareholder Return (TSR) (50% of the grant) and Absolute Earnings Per Share (EPS) (50% of the grant) hurdles. These performance hurdles are mutually exclusive so that if only one of the hurdles is satisfied, vesting will still occur for that portion of the grant but not the other if that other hurdle is not met. The valuation of the Rights is based on an adjusted form of the Black Scholes Option Pricing Model (BSM) that includes a Monte Carlo Simulation model to value the TSR right. The Monte Carlo model has been modified to incorporate an estimate of the probability of achieving the TSR hurdle and the number of associated Rights vesting. The fair market value of the Rights at valuation date is as follows:
Fair Market Value
Tranche 1
PR (EPS)
$
Tranche 2
PR(TSR)
$
Tranche 1
SAR (EPS)
$
Tranche 2
SAR (TSR)
$
Grant – 1 July 2015 2.84 1.83 0.46 0.43 Key valuation assumptions made at grant date are summarised below:
Key value assumptions 1 July 2015
Share price $3.06 Effective exercise price (SAR only) $3.09 Annualised volatility (midpoint) 25.0% Annual dividend yield 2.50% Risk free rate 2.04%

Directors’ Report 30 June 2016
TOX FREE SOLUTIONS LTD | Annual Report | 30 June 2016 DIRECTORS’ REPORT Page 59 of 173
Rights to Ordinary Shares - Remuneration
For each grant of Rights to Ordinary Shares, the percentage of the grant that was paid, or that vested in the financial year, and the percentage that was forfeited because the KMP did not meet the service and performance criteria is set out below. The minimum value of the Rights yet to vest is nil, as the Rights will be forfeited if the vesting conditions are not met. The maximum value of the Rights yet to vest is determined as the amount of the grant date fair value that is yet to be expensed.
Performance Rights:
Name
FY granted
Number granted
Share price at date of grant
($)
Vested % ^
Vested number
Forfeited %
FY in which shares
may vest
Maximum value yet to vest ($)
Director S Gostlow 2014 49,010 3.39 0% - 100% 2016 - 2015 60,276 3.36 - - - 2017 50,000 2016 77,231 3.06 - - - 2018 114,600
KMP E Goodwin 2014 41,915 3.39 0% - 100% 2016 - 2015 41,691 3.36 - - - 2017 34,583 2016 50,993 3.06 - - - 2018 75,667
M Constable 2014 15,007 3.39 0% - 100% 2016 - 2015 18,384 3.36 - - - 2017 15,250 2016 23,452 3.06 2018 34,800
J Dixon 2014 15,007 3.39 0% - 100% 2016 - 2015 18,384 3.36 - - - 2017 15,250 2016 23,452 3.36 - - - 2018 34,800
S Bagshawe 2014 9,573 3.39 0% - 100% 2016 - 2015 10,297 3.36 - - - 2017 8,542 2016 13,759 3.06 2018 20,417
J Bovell 2014 9,121 3.39 0% - 100% 2016 - 2015 12,105 3.36 - - - 2017 10,042 2016 15,163 3.06 - - - 2018 22,500
^ FY14 grant - forfeited: EPS and TSR performance conditions were not met at the end of the performance period i.e. 30 June 2016.
Additional details on KMP performance right holdings are set out on page 66.

Directors’ Report 30 June 2016
TOX FREE SOLUTIONS LTD | Annual Report | 30 June 2016 DIRECTORS’ REPORT Page 60 of 173
Share Appreciation Rights
Name
FY granted
Number granted
Share price at date of grant($)
Vested%
Vested number
Forfeited %
FY years in which shares
may vest
Maximum value yet to vest ($)
Director S Gostlow 2014 194,286 3.39 0% - 100% 2016 - 2015 280,594 3.36 - - - 2017 50,000 2016 386,732 3.06 - - - 2018 114,600
KMP E Goodwin 2014 166,162 3.39 0% - 100% 2016 - 2015 194,078 3.36 - - - 2017 34,583 2016 255,346 3.06 - - - 2018 75,667
M Constable 2014 59,490 3.39 0% - 100% 2016 - 2015 85,581 3.36 - - - 2017 15,250 2016 117,437 3.06 - - - 2018 34,800
J Dixon 2014 59,490 3.39 0% - 100% 2016 - 2015 85,581 3.36 - - - 2017 15,250 2016 117,437 3.06 - - - 2018 34,800
S Bagshawe 2014 37,950 3.39 0% - 100% 2016 - 2015 47,935 3.36 - - - 2017 8,542 2016 68,899 3.06 - - - 2018 20,417
J Bovell 2014 36,156 3.39 0% - 100% 2016 - 2015 56,353 3.36 - - - 2017 10,042 2016 75,929 3.06 - - - 2018 22,500
^ FY14 grant - forfeited: EPS and TSR performance conditions were not met at the end of the performance period i.e. 30 June 2016.
Additional details on KMP share appreciation right holdings are set out on page 66. Directors and Other KMP Options:
30 June
2016
Number of Options at beginning
of year
Number of Options
granted as Remuner-
ation
Number of Options
exercised
Number of Options at the end of
year
Number of Options vested
during the year
Number of Options
vested and exercisable
Unvested
KMP
E Goodwin 500,000 - - 500,000 - 500,000 -
No Options were granted, exercised or forfeited during the financial year under review. There are no Options affecting remuneration in the current or a future reporting period. The maximum total value of the Options yet to vest from a Share-based payment expense perspective is $nil (2015:$nil).

Directors’ Report 30 June 2016
TOX FREE SOLUTIONS LTD | Annual Report | 30 June 2016 DIRECTORS’ REPORT Page 61 of 173
F. REMUNERATION PAID TO THE MD AND OTHER EXECUTIVE KMP
Short-term Benefits Post-employment
benefits
Long-term benefits
Share-based payment (SBP)
Salary, fees and
allowances
STI ∆ 2016
STI 2015
Other /Non-
monetary
Benefits ¥
Superan-
nuationϡ
Annual and long service
leave β
Rights Total Fixed Remuner-
ation
At risk - STI
At risk - LTI
$ $ $ $ $ $ $ $ % % %
Executive Director Stephen Gostlow
2016 573,000 239,476 - 15,720 78,750 16,474 175,138 1,098,558 60% 24% 16% 2015 535,000 - 285,389 14,452 77,437 (5,263) 143,050 1,050,065 56% 30% 14%
Other Executive KMP David McArthur Đ
2016 - - - - - - - - - - - 2015 48,000 - - - - - - 48,000 100% - -
Edward Goodwin
2016 449,216 198,254 - 41,632 63,482 20,766 111,083 884,433 62% 25% 13% 2015 445,000 - 252,435 38,713 67,456 12,634 136,667 952,905 57% 29% 14%
Michael Constable
2016 348,000 94,484 - 1,543 44,240 23,204 53,217 564,688 73% 18% 9% 2015 329,000 - 103,181 2,800 41,848 8,334 42,958 528,121 71% 21% 8%
Jason Dixon
2016 345,413 115,364 - 994 47,833 42,733 53,217 605,554 70% 21% 9% 2015 329,000 - 109,220 1,258 41,226 (4,260) 43,625 520,069 69% 23% 8%

TOX FREE SOLUTIONS LTD | Annual Report | 30 June 2016 DIRECTORS’ REPORT Page 62 of 173
Directors’ Report 30 June 2016
REMUNERATION PAID TO THE MD AND OTHER EXECUTIVE KMP (CONTINUED)
Short-term Benefits Post-employment
benefits
Long-term benefits
Share-based payment (SBP)
Salary, fees and
allowances
STI ∆ 2016
STI 2015
Other /Non-
monetary Benefits
¥
Superan-
nuationϡ
Annual and long
service
leave β
Rights Total Fixed Remuner-
ation
At risk - STI
At risk - LTI
$ $ $ $ $ $ $ $ % % %
Other Executive KMP (continued) Sarah Bagshawe ^
2016 92,316 30,995 - 434 11,031 7,575 29,792 172,143 63% 20% 17% 2015 200,373 - 50,445 2,888 20,847 3,574 25,583 303,710 74% 18% 8%
Joshua Bovell
2016 266,538 57,188 - 2,433 31,872 8,308 35,240 401,579 75% 16% 9% 2015 262,219 - 57,382 2,309 30,164 (2,085) 34,771 384,760 75% 16% 9%
Total 2016 2,074,483 735,761 - 62,756 277,208 119,060 457,687 3,726,955
2015 2,148,592 - 858,052 62,420 278,978 12,934 426,654 3,787,630
∆ The 2016 STI (Bonus) has been accrued and will be paid in September 2016.
¥ Other and non-monetary benefits include fringe benefits tax and insurance paid.
β Represents the value of the movement in the annual leave and long service leave entitlement accruals.
Ϡ Superannuation includes the values paid and accrued related to salary and fees, STI and the movement in annual leave and long service leave entitlements.
^ Sarah Bagshawe: maternity leave from 16 March 2015 until 11 January 2016. Đ David McArthur is an external provider of company secretarial services and is not an employee of the company. David is no longer regarded as a KMP from 1 July 2015

TOX FREE SOLUTIONS LTD | Annual Report | 30 June 2016 DIRECTORS’ REPORT Page 63 of 173
Directors’ Report 30 June 2016
G. SERVICE AGREEMENTS On appointment to the Board, all Non-Executive Directors enter into a service agreement with the Group in the form of a contract of appointment. The contract summarises the Board’s policies and terms, including compensation, relevant to the Officer or Director.
Remuneration and other forms of employment for the MD, COO and other Executive KMP are also formalised in service agreements. Each of these agreements provides for performance related short-term incentives, and other benefits including car allowances and participation, where eligible, in a long-term incentive plan. Other major provisions of the agreements relating to remuneration are set out below.
All contracts with Executives may be terminated without cause early by either party providing notice, subject to termination payments detailed below:
Name
Term of agreement
Employee notice period
Employer notice period
Base salary *
Termination benefit
^
Stephen Gostlow
Ongoing from November 2010
6 months 12 months $573,000 ¥
Edward Goodwin
Ongoing from December 2010
6 months
12 months
$454,000
12 months base salary
Michael Constable
Ongoing from July 2010
6 months
6 months
$348,000
6 months
base salary Jason Dixon
Ongoing from October 2010
6 months
6 months
$348,000
6 months
base salary Sarah Bagshawe β
Ongoing from November 2011
6 months
6 months
$147,000
6 months
base salary Joshua Bovell
Ongoing from October 2013
6 months
6 months
$270,000
6 months base
salary
* Base salaries are quoted for the year ended 30 June 2016. They are reviewed annually by the Remuneration Committee and exclude superannuation.
^ Termination benefits are payable on early termination by the Group, other than for gross misconduct. Unless otherwise indicated they are equal to base salary (including superannuation) for the notice period.
¥ Annual contractual remuneration including short-term incentive or an amount equal to the average remuneration received from the Company during the last 12 months prior to termination, whichever is the lesser amount.
β S Bagshawe; part-time and base salary is based on a three day working week as at 30 June 2016.

TOX FREE SOLUTIONS LTD | Annual Report | 30 June 2016 DIRECTORS’ REPORT Page 64 of 173
Directors’ Report 30 June 2016
H. NON-EXECUTIVE DIRECTOR REMUNERATION Fees and payments to Non-Executive Directors reflect the demands which are made on, and the responsibilities of the Directors. Non-Executive Directors' fees and payments are reviewed annually by the Board. The current base fees were last updated on 1 January 2013. The fees approved by the Board were inclusive of the statutory superannuation amount which at the time was 9% of the base fees. From 1 July 2013, the statutory superannuation rate was increased from 9% to 9.25% and from 1 July 2014 was increased from 9.25% to 9.50%. If remuneration amounts were left unaltered, this would effectively result in a reduction in the amount received by Non-Executive Directors on a post-superannuation payment basis. It was resolved that the net payment post- superannuation should remain unaltered which in effect means an increase in total remuneration for Non-Executive Directors of 0.25% for each financial year. The changes are effective from 1 July 2013 and 1 July 2014. Additionally, it was further resolved that this policy should also relate to any future increases in the statutory rate of superannuation. Non-Executive Directors' fees are determined within an aggregate directors' fee pool limit, which is periodically recommended for approval by shareholders. The maximum currently stands at $700,000 per annum and was approved by Shareholders at the Annual General Meeting on 24 November 2011. Current approved fees:
Board fees including Superannuation
$
Chair fees including Superannuation
$
Chair 150,688 - Other Non-Executive Directors 85,390 10,046
Superannuation contributions required under the Australian superannuation guarantee legislation continue to be made and are deducted from the Directors' overall fee entitlements.

TOX FREE SOLUTIONS LTD | Annual Report | 30 June 2016 DIRECTORS’ REPORT Page 65 of 173
Directors’ Report 30 June 2016
REMUNERATION PAID TO NON-EXECUTIVE DIRECTORS
Details of Non-Executive Directors Remuneration for the years ended 30 June 2016 and 30 June 2015 are set out below:
Short-term
benefits Post –employment
benefits
Fees
$
Superannuation¥
$
Total
$
Current Non-Executive Directors
Robert McKinnon
2016 137,615 13,073 150,688
2015 137,615 13,073 150,688
Michael Humphris
2016 87,156 8,280 95,436
2015 87,156 8,280 95,436
Richard Allen
2016 95,000 - 95,000
2015 95,000 - 95,000
Katherine Hirschfeld
2016 87,156 8,280 95,436
2015 87,156 8,280 95,436
Total
2016 406,927 29,633 436,560
2015 406,927 29,633 436,560
¥ Superannuation contributions are made on behalf of Non-Executive Directors to satisfy the Group’s obligations under applicable superannuation guarantee legislation.

TOX FREE SOLUTIONS LTD | Annual Report | 30 June 2016 DIRECTORS’ REPORT Page 66 of 173
Directors’ Report 30 June 2016
I. OTHER - KMP DISCLOSURES
There have been no changes in KMP in the period after the reporting date and prior to the date when the financial report is authorised for issue. 1. KMP - Option Holdings – 30 June 2016
No options were granted to KMP as remuneration during the reporting period (2015: Nil).
30 June 2016
Number of Options at
beginning of year
Granted as Remuner-
ation Exercised
Number of Options at the end of
year
Number of Options
vested and exercisable
Unvested
KMP
E Goodwin 500,000 - - 500,000 500,000 -
2. KMP – Right Holdings – 30 June 2016
Performance Rights
30 June 2016
Beginning of year
Granted as remuneration Exercised Forfeited
End of year
Vested and Exercisable Unvested
Directors S Gostlow 125,482 77,231 (16,196) (49,010) 137,507 - 137,507 Other KMP E Goodwin 83,606 50,993 - (41,915) 92,684 - 92,684 M Constable 40,031 23,452 (6,640) (15,007) 41,836 - 41,836 J Dixon 39,652 23,452 (6,261) (15,007) 41,836 - 41,836 S Bagshawe 23,792 13,759 (3,922) (9,573) 24,056 - 24,056 J Bovell 21,226 15,163 - (9,121) 27,268 - 27,268
333,789 204,050 (33,019) (139,633) 365,187 - 365,187
Share Appreciation Rights
30 June 2016
Beginning of year
Granted as remuneration Exercised Forfeited
End of year
Vested and Exercisable Unvested
Directors S Gostlow 533,413 386,732 (58,533) (194,286) 667,326 - 667,326 Other KMP - E Goodwin 360,240 255,346 - (166,162) 449,424 - 449,424 M Constable 167,756 117,437 (22,685) (59,490) 203,018 - 203,018 J Dixon 166,464 117,437 (21,393) (59,490) 203,018 - 203,018 S Bagshawe 99,286 68,899 (13,401) (37,950) 116,834 - 116,834 J Bovell 92,509 75,929 - (36,156) 132,282 - 132,282
1,419,668 1,021,780 (116,012) (553,534) 1,771,902 - 1,771,902

TOX FREE SOLUTIONS LTD | Annual Report | 30 June 2016 DIRECTORS’ REPORT Page 67 of 173
Directors’ Report 30 June 2016
3. Equity instruments granted as a result of exercise of Rights: Details of ordinary shares in the Group provided as a result of the exercise of remuneration Rights to Directors and other KMP of the Group for FY2016 are set out below:
Name
No. of shares issued as result of exercise of Rights
Exercise
Date
Intrinsic value of Rights exercised during the year
ϡ
S Gostlow 30,168 26/08/2015 $78,437 M Constable 12,055 26/08/2015 $31,343 J Dixon 11,368 26/08/2015 $29,557 S Bagshawe 7,121 26/08/2015 $18,515
Ϡ The fair value is determined at the date of exercise and reflects the intrinsic value of the Rights. The conversion is based on an average market price of approximately $2.60 per ordinary share acquired on-market by the Toxfree Share Trust.
4. KMP – Shareholdings – 30 June 2016 The number of ordinary shares in Toxfree held by KMP (and their related parties) of the Group during the financial year is as follows:
30 June 2016
Balance at beginning of
year Exercise of
rights Other
Additions Disposals
Balance
at end of year
Directors
R McKinnon 50,000 - 858 - 50,858
M Humphris 710,000 - - (60,000) 650,000
R Allen 152,374 - 857 - 153,231
K Hirschfeld 19,426 - 858 - 20,284
S Gostlow 1,295,665 30,168 - (75,000) 1,250,833
Other KMP
E Goodwin 63,492 - 857 - 64,349
M Constable 50,219 12,055 857 (50,219) 12,912
J Dixon 141,446 11,368 7,758 (23,000) 137,572
S Bagshawe 17,489 7,121 - - 24,610
J Bovell 2,000 - - (2,000) -
2,502,111 60,712 12,045 (210,219) 2,364,649
The above shareholdings include KMP related party holdings.

TOX FREE SOLUTIONS LTD | Annual Report | 30 June 2016 DIRECTORS’ REPORT Page 68 of 173
Directors’ Report 30 June 2016
5. Loans to Key Management Personnel There were no loans made to Directors and other Key Management Personnel during the financial year under review. In addition, there were no loan balances outstanding at the end of the year.
J. VOTING AND COMMENTS MADE AT THE COMPANY’S 2015 ANNUAL GENERAL MEETING
Toxfree received more than 99% of “yes” votes on its Remuneration Report for the 2015 financial year. The Company did not receive any specific feedback at the AGM or throughout the year on its remuneration practices.
THIS IS THE END OF THE REMUNERATION REPORT AUDITED

TOX FREE SOLUTIONS LTD | Annual Report | 30 June 2016 DIRECTORS’ REPORT Page 69 of 173
Directors’ Report 30 June 2016
Options and Rights
Unissued ordinary Shares of Tox Free under Option / Rights at the date of this report are as follows: Options
Grant Date
Vesting date Expiry Date Exercise
price Number of Options
23 November 2010 ^ Vested 1 November 2016 $3.00 500,000
Total 500,000
^ Holder of the options is E Goodwin (KMP).
Performance Rights
Grant Date
End of performance
period
Tranche ¥ Number of
Rights
1 July 2014 * 30 June 2017 1 83,033
1 July 2014 * 30 June 2017 2 129,841
1 July 2015 * 30 June 2018 1 105,102
1 July 2015 * 30 June 2018 2 163,111
Total 481,087
Share Appreciation Rights
Grant Date
End of performance
period
Tranche ¥ Number of
Rights
1 July 2014 * 30 June 2017 1 481,591
1 July 2014 * 30 June 2017 2 509,375
1 July 2015 * 30 June 2018 1 648,900
1 July 2015 * 30 June 2018 2 694,172
Total 2,334,038
* Includes Executive-Director, other Executive KMP and other senior employee rights
¥ Tranche 1 = EPS performance condition; tranche 2 TSR performance condition.
TOX FREE SOLUTIONS LTD | Annual Report | 30 June 2016 DIRECTORS’ REPORT Page 70 of 173
Directors’ Report 30 June 2016
Insurance and Indemnity of Officers During the financial year, Toxfree paid a premium of $80,779 (2015: $84,428) excluding GST, to insure the Directors and Secretary of the Group.
The liabilities insured are legal costs that may be incurred in defending civil or criminal proceedings that may be brought against Officers in their capacity as Officers of entities in the Group, and any other payments arising from liabilities incurred by the Officers in connection with such proceedings. This does not include such liabilities that arise from conduct involving a wilful breach of duty by the Officers or the improper use by the Officers of their position or of information to gain advantage for them or someone else or to cause detriment to the Group. It is not possible to apportion the premium between amounts relating to the insurance against legal costs and those relating to other liabilities.
The Group paid a premium of $14,303 (2015: $13,255) excluding GST for life and income protection insurance for the Executive-Directors. The Group has agreed to indemnify the Directors of the Group against all liabilities to another person (other than the Group) that may arise from their position as Directors of the Group, except where the liability arises out of conduct involving lack of good faith.
Indemnity of Auditors No agreements have been entered into to indemnify the Group's current auditors against any claims by third parties arising from their report on the Annual Financial Report.
Proceedings on behalf of the Company No person has applied to the Court under section 237 of the Corporations Act 2011 for leave to bring proceedings on behalf of the Company, or to intervene in any proceedings to which the Company is a party, for the purposes of taking responsibility on behalf of the Company for all or part of those proceedings.
No proceedings have been brought or intervened in on behalf of the Company with leave of the Court under section 237 of the Corporations Act 2001.
Loans to Directors and Executives Information on loans to Directors and Executives are set out in the Remuneration Report and in note 28 to the financial statements.
Non-audit services The Company may decide to employ the auditor on assignments additional to their statutory audit duties where the auditor’s expertise and experience with the Company and / or the Group are important.
Details of the amounts paid or payable to the auditor for audit and non-audit services provided during the year are set out in note 30 to the financial statements.
The Board of Directors has considered the position and, in accordance with advice from the Audit Committee, is satisfied that the provision of the non-audit services during the year is compatible with the general standard of independence for auditors imposed by the Corporations Act 2001. The Directors are satisfied that the provision of non-audit services by the auditor as set out below, did not compromise the auditor independence requirements of the Corporations Act 2001 for the following reasons:

TOX FREE SOLUTIONS LTD | Annual Report | 30 June 2016 DIRECTORS’ REPORT Page 71 of 173
Directors’ Report 30 June 2016
all non-audit services are reviewed by the Audit Committee to ensure they do not impact the impartiality and objectivity of the auditor; and
none of the services undermine the general principles relating to auditor independence in accordance with APES 110: Code of Ethics for Professional Accountants.
The following fees were paid or payable to the auditors (BDO Audit (WA) Pty Ltd) and its related practices for non-audit services provided during the year ended 30 June 2016:
2016
$ 2015
$
Tax advice and compliance services (BDO Corporate Tax (WA) Pty Ltd)
214,381
233,582
Other services Accounting advice and review of information 7,663 12,691 Business combinations and acquisitions 35,627 21,392
Total – Other services 43,290 34,083
Total 257,671 267,665
Auditor's Independence Declaration A copy of the auditor’s independence declaration as required under section 307C of the Corporations Act is set out on page 83. Rounding of Amounts The Company is of a kind referred to in Corporations Instrument 2016/191, issued by the Australian Securities Investments Commission, relating to the ‘rounding off’ of amounts in the Directors’ Report and in the financial statements. Amounts in the Directors' report and the financial statements have been rounded to the nearest thousand dollars. Auditor BDO (Audit) WA Pty Ltd continues in office in accordance with section 327 of the Corporations Act 2001. This Director's report, incorporating the Remuneration Report, is signed in accordance with a resolution of the Board of Directors.
Director - Chairman - Robert McKinnon :
Dated this 22nd day of August 2016

Corporate Governance Statement For the Year Ended 30 June 2016
TOX FREE SOLUTIONS LTD | Annual Report | 30 June 2016 CORPORATE GOVERNANCE STATEMENT Page 72 of 173
The 2016 Corporate Governance Statement is dated as 30 June 2016 and reflects the corporate governance practices in place throughout the 2016 financial year.
Toxfree (the Company) and the Board are committed to achieving and demonstrating the highest standards of Corporate Governance. The Board continues to review the framework and practices to ensure that they meet the interests of Shareholders. The Company and its controlled entities together are referred to as the Group in this statement.
A description of the Group’s main corporate governance practices is set out below. All these practices, unless otherwise stated, were in place for the entire year. Additionally, they comply with the 3rd edition of the ASX Corporate Governance Principles and Recommendations.
The Board of Directors
Role of the Board The matters expressly reserved to the Board of Directors are set out in a written policy and include:
Establishment of long-term goals of the Group and strategic plans to achieve these goals
Monitoring the achievement of these goals
Review of the management accounts and reports to monitor the progress of the Group
Review and adoption of budgets for the financial performance of the Group and monitoring the results on a regular basis to assess performance
Review and approval of the annual and interim financial reports
Nominating and monitoring the external auditor
Approving all significant business transactions
Appointing and monitoring senior management
All remuneration, development and succession issues
Ensuring the Group has implemented adequate systems of risk management and internal control together with appropriate monitoring of compliance activities
Overseeing the process for making timely and balanced disclosure of all material information that a reasonable person would expect to have a material effect on the price or value of the Company’s securities
Ensuring that the Company has a suitably qualified Company Secretary who shall be accountable directly to the Board, through the Chair, on all matters to do with the proper functioning of the Board; and
Ensuring that the Company reports on its measurable objectives in relation to gender diversity and assesses annually both the objectives and progress in achieving gender diversity.
The Board delegates day-to-day operational matters to the management of the Company.
The Board evaluates this policy on an ongoing basis.
Board Composition The Directors' Report contains details of the Directors' skills, experience and education. The Board seeks to establish a Board that consists of Directors with an appropriate range of experience, skill, knowledge and vision to enable it to operate the Group's business with excellence. To maintain this, the Group's policy is that Executive Directors should serve at least 3 years. At the completion of the first 3 years, the position of the Director is reviewed to ascertain if circumstances warrant a further term.

Corporate Governance Statement For the Year Ended 30 June 2016
TOX FREE SOLUTIONS LTD | Annual Report | 30 June 2016 CORPORATE GOVERNANCE STATEMENT Page 73 of 173
The specific skills that the Board collectively bring to the Company include:
Industry experience
Commercial experience
Public Company experience
Analytical expertise
Financial expertise
Risk Management experience
Strategic planning experience
Strategic leadership experience
Corporate Governance expertise
Communications experience
Inter personal experience The chair of each of the sub-committees formed by the Board has specific skills in the area for which they are responsible. The Board does not have a Director with legal experience, as any legal work is out sourced to external lawyers. The Board comprises an independent Non-Executive Chairman, one Executive Director, and three Non-Executive independent Directors. Two Directors have been on the Board of the Company for a considerable period of time. The Board does not believe the independence of these Directors has been compromised by their extended period of Directorship, as both Directors bring specific skill sets to the Board. Directors’ details are set out in the Directors' Report. The Board, through the Nomination Committee, is primarily responsible for identifying potential new Directors and has the option to use an external consulting firm to identify and approach possible new candidates for Directorship. When a vacancy exists, or where it is considered that the Board would benefit from the services of a new Director with particular skills, candidates with the appropriate experience, expertise and diversity are considered. Each incumbent Director is given the opportunity to meet with each candidate on a one-to-one basis. The full Board then appoints the most suitable candidate. The Board undertakes appropriate checks before appointing a person as a Director or putting forward to Shareholders a candidate for election as a Director. The Board ensures that Shareholders are provided with all material information in the Board’s possession relevant to a decision on whether or not to elect or re-elect a Director. The appointment of the Directors must be approved by the majority of the Shareholders at the first Annual General Meeting after the appointment.

Corporate Governance Statement For the Year Ended 30 June 2016
TOX FREE SOLUTIONS LTD | Annual Report | 30 June 2016 CORPORATE GOVERNANCE STATEMENT Page 74 of 173
Retirement and re-election of Directors The Constitution of the Company requires one-third of Directors (or the number nearest one-third, rounded up), other than the Managing Director, to retire from office at each Annual General Meeting. No Director shall hold office for a period in excess of three years without seeking re-election. Directors who have been appointed by the Board are required to retire from office at the Annual General Meeting following their appointment and are not taken into account in determining the number of Directors to retire at that Annual General Meeting. Retiring Directors are eligible for re-election by Shareholders. Independence of Directors The Board has reviewed the position and association of each of the Directors in office at the date of this report and considers that all four Non-Executive Directors of the Company are independent. In considering whether a Director is independent, the Board has regard to the independence criteria in ASX Corporate Governance Principles and Recommendations Principle 2 and other facts, information and circumstances that the Board considers relevant. The Board assesses the independence of new Directors upon appointment and reviews their independence, and the independence of the other Directors, as appropriate. The Board considers that Mr Robert McKinnon, Mr Michael Humphris, Mr Richard Allen and Ms Katherine Hirschfeld meet the criteria in Principle 2. They have no material business or contractual relationship with the Group, other than as Directors, and no conflicts which could interfere with the exercise of independent judgement. Accordingly, they are considered to be independent. Director Education All new Directors complete an induction process. The Non-Executive Directors are given every opportunity to gain a better understanding of the business, the industry, and the environment within which the Group operates, and are given access to continuing education opportunities to update and enhance their skills and knowledge. The Board are specifically provided the opportunity to enhance their financial, regulatory and compliance skills in relation to Public Companies through external courses. On at least two occasions during the year, the full Board travelled to one of the Group’s business locations to gain a greater understanding of that business units operations. Independent Professional Advice With prior approval of the Chairman, each Director has the right to seek independent legal and other professional advice at the Group's expense concerning any aspect of the Group's operations or undertakings in order to fulfil their duties and responsibilities as Directors. Board Performance Review The performance of all Directors is assessed through review by the Board as a whole of a Director's attendance at and involvement in Board meetings, their performance and other matters identified by the Board or other Directors. Significant issues are actioned by the Board. Due to the Board's assessment of the effectiveness of these processes, the Board has not otherwise formalised measures of a Director's performance.

Corporate Governance Statement For the Year Ended 30 June 2016
TOX FREE SOLUTIONS LTD | Annual Report | 30 June 2016 CORPORATE GOVERNANCE STATEMENT Page 75 of 173
The Directors conducted an internal performance evaluation of the Members of the Board during the reporting period, with the assistance of an external advisor. Director Remuneration Details of the Group's remuneration policies are included in the "Remuneration Report" section of the Directors’ Report. Non-Executive Directors will be remunerated by cash payments alone (including statutory superannuation) and will not be provided with any benefits for ceasing to be a Director. The Executive Director is remunerated by both fixed remuneration and equity performance based remuneration, subject to obtaining all regulatory approvals from Shareholders. A reasonable period of notice of termination is required and is detailed in the Executive's employment contract. Managing Business Risk The Group maintains policies and practices designed to identify and manage significant risks including:
Regular budgeting and financial reporting
Procedures and controls to manage financial exposures and operational risks
The Group's business plan
Corporate strategy guidelines and procedures to review and approve the Group's strategic plans
Establish and continuously assess a Group Risk Profile which identifies all significant risk to the Group and controls that are in place to minimise or mitigate the risk; and
Insurance and risk management programs which are reviewed by the Board. The Board reviews these systems and the effectiveness of their implementation annually and considers the management of risk at its meetings. The Group's risk profile is reviewed quarterly by the Risk Committee. The Board may consult with the Group's external auditors on external risk matters or other appropriately qualified external consultants on risk generally, as required. The Board’s review of business risk is also based on reports from the Risk Committee. The Board receives regular reports about the financial condition and operating results of the consolidated Group. The Managing Director (or in his absence the Chairman) and Chief Financial Officer annually provide a formal statement to the Board that in all material respects and to the best of their knowledge and belief:
The Group's financial reports present a true and fair view of the Group's financial condition and operational results and are in accordance with relevant accounting standards; and
The Group's risk management and internal control systems are sound, appropriate and operating efficiently and effectively.
The Company assesses its exposure to economic, environmental and social sustainability risks as part of the Group Risk profile. The Board assesses the likely impact of changes and implements strategies to minimise exposure to these specific risks. Due to risk procedures adopted by the Company, it is not believed the Company has a material exposure to these risks.

Corporate Governance Statement For the Year Ended 30 June 2016
TOX FREE SOLUTIONS LTD | Annual Report | 30 June 2016 CORPORATE GOVERNANCE STATEMENT Page 76 of 173
The Company does not have an internal audit function. The Board has determined that the established internal controls for the Company, combined with the work of the Audit Committee and the Risk Management Committee, at this stage satisfactorily address the function that would otherwise be dealt with by an internal audit function. Internal Controls Procedures have been established at the Board and Executive management levels that are designed to safeguard the assets and interests of the Group, and to ensure the integrity of reporting. These include accounting, financial reporting and internal control policies and procedures. To ensure these established procedures are being followed, the Directors:
Ensure appropriate follow-up of significant audit findings and risk areas identified;
Review the scope of the external audit to align it with Board requirements; and
Conduct a detailed review of published accounts. Audit Committee The role of the Audit Committee is documented in a Charter which is approved by the Board of Directors. In accordance with this Charter, all members of the Committee must be Non-Executive Directors.
The primary role of the Audit Committee is to:
Assist the Board in fulfilling its overview of the audit process
Assist the Board in overviewing financial reporting
Assist the Board in fulfilling its overview of the systems of internal control which the Board and management have established
Monitor, review and recommend the adoption of the financial statements of the Company
Regularly review the adequacy of accounting, internal controls, reporting and other financial management systems and practices of the Company
Review the financial report and other financial information distributed externally
Review any new accounting policies to ensure compliance with Australian Accounting Standards and generally accepted accounting principles
Improve the quality of the accounting function
Review audit reports to ensure that if major deficiencies or breakdowns in controls or procedures are identified, appropriate and prompt remedial action is taken by management
Review the nomination and performance of the auditor
Liaise with external auditors and ensure that the annual and half-year statutory audits are conducted in an effective manner
Monitor the establishment of appropriate ethical standards
Monitor the procedures in place to ensure compliance with the Corporations Act 2001, Australian Accounting Standards and ASX Listing Rules and all other regulatory requirements; and
Address any matters outstanding with the auditors, the Australian Taxation Office, the Australian Securities and Investments Commission, the ASX and financial institutions.

Corporate Governance Statement For the Year Ended 30 June 2016
TOX FREE SOLUTIONS LTD | Annual Report | 30 June 2016 CORPORATE GOVERNANCE STATEMENT Page 77 of 173
The Audit Committee consists of the following Non-Executive Directors, all of whom are independent:
Mr M Humphris (Chair)
Mr R McKinnon
Mr R Allen
Ms K Hirschfeld The auditors and the Managing Director are invited to attend Audit Committee meetings at the discretion of the Committee. The Committee met six times during the year. Risk Committee The purpose of the Risk Committee is to assist the Board in its oversight of the Company’s management of key risks, including strategic and operational risks, as well as the guidelines, policies and processes for monitoring and mitigating such risks. The Risk Committee’s role includes oversight of risk management of the Company’s wholly-owned subsidiaries and operational sites.
Risk assessment and risk management are the responsibility of the Company’s management. The Risk Committee has an oversight role and in fulfilling that role, it relies on the reviews and reports received from management.
The Risk Committee shall have the following authority and responsibilities:
Review and discuss with management the Company’s risk governance structure, risk assessment and risk management practices and the guidelines, policies and processes in place for risk management
Review and discuss with management the Board’s risk appetite and strategy relating to key risks, including credit risk, liquidity and funding risk, market risk, product risk and reputational risk, as well as the guidelines, policies and processes for monitoring and mitigating such risks
Discuss with the Company’s executive team the Company’s risk assessment and risk management guidelines, policies and processes, as the case may be. The Risk Committee meets separately at least twice a year with the executive team
Receive, as and when appropriate, reports from the Company’s Executive General Manager-Corporate & Risk on the results of risk management reviews and assessments
Review disclosure regarding risk contained in the Company’s Annual Report
Review and assess the nature and level of insurance coverage
Review reports on selected risk topics as the Risk Committee deems appropriate from time to time
Initiate and monitor special investigations into areas of corporate risk or breakdowns in internal controls
Discharge any other duties or responsibilities delegated to the Risk Committee by the Board
Delegate any of its responsibilities to subcommittees as the Risk Committee may deem appropriate
Retain such outside counsel, experts and other advisors as the committee may deem appropriate in its sole discretion and approve related fees
Report its actions and any recommendations to the Board; and

Corporate Governance Statement For the Year Ended 30 June 2016
TOX FREE SOLUTIONS LTD | Annual Report | 30 June 2016 CORPORATE GOVERNANCE STATEMENT Page 78 of 173
Review at least annually the adequacy of this Charter and recommend any proposed changes to the board for approval.
The Risk Committee consists of the following Non-Executive Directors, all of whom are independent:
Ms K Hirschfeld (Chair)
Mr M Humphris
Mr R McKinnon
Mr R Allen The Committee met four times during the year. Remuneration Committee The Remuneration Committee operates in accordance with its Charter. The main responsibilities of the Remuneration Committee are:
Determine remuneration policies and remuneration of Directors
Determine remuneration and incentive policies of Key Executives
Determine the Group recruitment, retention and termination policies and procedures for senior management
Determine and review incentive schemes
Ensure all Directors and senior executives have a written agreement setting out the terms of their appointment
Evaluate senior executive performance on an annual basis. This occurred during the 2016 financial year
Determine and review superannuation arrangements of the Group; and
Determine and review professional indemnity and liability insurance for Directors and senior management.
The Remuneration Committee seeks independent external advice from consultants with specific industry experience relevant to Tox Free’s remuneration assessment.
Specific policies and procedures regarding remuneration determination are contained within the Directors’ Report.
The Remuneration Committee consists of the following Non-Executive Directors, all of whom are independent:
Mr R Allen (Chairman)
Mr R McKinnon
Mr M Humphris
Ms K Hirschfeld
The Committee met six times during the year. Nomination Committee The Nomination Committee operates in accordance with its Charter. The main responsibilities of the Nomination Committee are:

Corporate Governance Statement For the Year Ended 30 June 2016
TOX FREE SOLUTIONS LTD | Annual Report | 30 June 2016 CORPORATE GOVERNANCE STATEMENT Page 79 of 173
Review the Board composition to ensure the Board has the correct balance of skills and expertise
Appointment of the Managing Director and the Company Secretary
Approve the recommendation for the appointment of key management personnel presented to the Committee by the Managing Director
Performance appraise the Board members and the Managing Director
Succession planning for Board members and the Managing Director
Approve the recommended succession planning for key management personnel presented to the Committee by the Managing Director; and
Identify, evaluate and recommend candidates for the Board, the position of Managing Director and the position of Company Secretary.
The Nomination Committee consists of the following Non-Executive Directors, all of whom are independent:
Mr R McKinnon (Chair)
Mr R Allen
Mr M Humphris
Ms K Hirschfeld The Committee did not have a specific need to meet during the year. Ethical Standards In pursuit of the highest level of ethical standards, the Group has adopted a Code of Conduct which establishes the standards of behaviour required of Directors and employees in the conduct of the Group's affairs. This code is provided to all Directors and employees. The code stipulates that any unethical behaviour is to be reported to the Group's Managing Director (or in his absence, the Chairman) as soon as possible. The Code of Conduct is based on respect for the law and the rights of individuals, and acting accordingly, dealing with conflicts of interest appropriately, using the consolidated entity's assets responsibly and in the best interests of the Company, acting with integrity, being fair and honest in dealings, treating other people with dignity and being responsible for actions and accountable for the consequences. Trading in the Company's Securities by Directors and Employees The Board has adopted a policy in relation to dealings in the securities of the Company which applies to all Directors and employees. Under the policy, Directors are prohibited from short-term or "active" trading in the Group's securities and Directors and employees are prohibited from dealing in the Group's securities whilst in the possession of price sensitive information. The Company's Managing Director (or in his place the Chairman) must be notified of any proposed transactions in the Company’s shares. Any Director or employee receiving shares pursuant to the Company’s equity based remuneration scheme (refer to the Remuneration Report) is not permitted to enter into transactions which limit the economic risk of participating in the scheme.

Corporate Governance Statement For the Year Ended 30 June 2016
TOX FREE SOLUTIONS LTD | Annual Report | 30 June 2016 CORPORATE GOVERNANCE STATEMENT Page 80 of 173
This policy is provided to all Directors and employees. Compliance with it is reviewed on an on-going basis in accordance with the Company's risk management systems. Continuous Disclosure The Group has in place a continuous disclosure policy, a copy of which is provided to all Group officers and employees who may from time to time be in possession of undisclosed information that may be material to the price or value of the Group's securities.
The continuous disclosure policy aims to ensure timely compliance with the Company’s continuous disclosure obligations under the Corporations Act 2001 and ASX Listing Rules and to ensure officers and employees of the Group understand these obligations.
The procedure adopted by the Group is essentially that any information which may need to be disclosed must be brought to the attention of the Chairman, who, in consultation with the Board (where practicable) and any other appropriate personnel (including external advisors if deemed appropriate) will consider the information and whether disclosure is required. If disclosure is deemed necessary, an appropriate announcement will be prepared for release to the market as soon as possible.
At least once every 12 month period, the Board will review the company's compliance with this continuous disclosure policy and update it from time to time, if necessary. Shareholders The Board aims to ensure that Shareholders are kept fully informed of all major developments affecting the Group. Information is communicated to Shareholders as follows:
As the Company is a disclosing entity, regular announcements are made to the ASX in accordance with the Group's disclosure policy, including the half-year review, the year-end audited accounts and an Annual Report
The Board ensures the Annual Report includes relevant information about the operations of the Group during the year, changes in the state of affairs and details of future developments
Shareholders are advised in writing of key issues affecting the Group by effective use of the Group's share registry or electronically via the website
Shareholders are provided the opportunity to receive communications electronically through the Company’s share registry
Any proposed major changes in the Group's affairs are submitted to a vote of Shareholders, as required by the Corporations Act 2001 and the ASX Listing Rules
The Board encourages full participation of Shareholders at the Annual General Meeting to ensure a high level of accountability and identification of the Group's strategies and goals. All Shareholders who are unable to attend these meetings are encouraged to communicate or ask questions by writing to the Group
The external auditor is requested to attend the Annual General Meetings to answer any questions concerning the audit and the content of the auditor's report; and
The Board seek feedback from proxy advisers to assess the appropriateness and adequacy of its reporting to shareholders.
The Board reviews this policy and compliance with it on an ongoing basis.

Corporate Governance Statement For the Year Ended 30 June 2016
TOX FREE SOLUTIONS LTD | Annual Report | 30 June 2016 CORPORATE GOVERNANCE STATEMENT Page 81 of 173
Diversity Policy The Group is committed to workplace diversity at all levels and recognises the benefits arising from employee and Board diversity. The benefits include a broader pool of high quality employees, improved employee retention, accessing different perspectives and ideas, and benefitting from all available talent.
The Group recognises that diversity includes matters of age, disability, ethnicity, marital and family status, religion and culture, sexual orientation and gender identity.
The Group strives to:
Recruit and manage on the basis of an individual's competence, qualification, skills and performance
Create a workplace culture characterised by inclusive practices and behaviours for the benefit of all staff
Appreciate and respect the unique aspects that an individual brings to the workplace
Where possible and practicable, increase participation and employment opportunities for indigenous people
Create a work environment that values and utilises the contributions of employees with diverse backgrounds, experiences and perspectives through improved awareness of the benefits of workplace diversity and successful management of diversity, and at all times recognising that employees may have restrictions placed on them by domestic responsibilities outside the workplace
Take action to prevent discrimination, harassment, vilification or victimisation
Create awareness in all staff of their rights and responsibilities with regards to fairness, equity and respect for all aspects of diversity; and
Identify and implement programs that will assist in the development of a broader and more diverse pool of skilled and experienced employees, and to offer employees opportunities to reach management levels with the Group.
The Board is committed to workplace diversity and has developed measurable objectives and strategies to support the framework and objectives of the Diversity Policy, and the Board is responsible for monitoring the progress of the measurable objectives through various monitoring, evaluation and reporting mechanisms. For the 2016 financial year the Boards' objectives were met by the Group. The Board assesses the progress and achievement of the objectives.
Pursuant to ASX Corporate Governance Recommendation 1.5, the Company policy discloses the following information as at the date of this report:
Percentage details Women Men
Women and Men employed within the Group 18% 82%
Women and Men at senior management level 20% 80%
Women and Men employed at Board level 20% 80%
Percentage details Total
Indigenous staff employed within the Group 5%^
^ based on the number of full-time employees

Corporate Governance Statement For the Year Ended 30 June 2016
TOX FREE SOLUTIONS LTD | Annual Report | 30 June 2016 CORPORATE GOVERNANCE STATEMENT Page 82 of 173
ASX Corporate Governance principals and recommendations not followed - "if not, why not" approach Pursuant to the ASX Listing Rule 4.10.3, the Company advises that it follows all of the ASX "Corporate Governance Principals and Recommendations (Third Edition)". This statement is current as at 30 June 2016 and has been approved by the Board.
Director - Chairman Robert McKinnon
Director - Stephen Gostlow

TOX FREE SOLUTIONS LTD | Annual Report | 30 June 2016 AUDITOR’S INDEPENDENCE DECLARATION Page 83 of 173
Tel: +61 8 6382 4600 Fax: +61 8 6382 4601 www.bdo.com.au
38 Station Street Subiaco, WA 6008 PO Box 700 West Perth WA 6872 Australia
BDO Audit (WA) Pty Ltd ABN 79 112 284 787 is a member of a national association of independent entities which are all members of BDO Australia Ltd ABN 77 050 110 275, an Australian company limited by guarantee. BDO Audit (WA) Pty Ltd and BDO Australia Ltd are members of BDO International Ltd, a UK company limited by guarantee, and form part of the international BDO network of independent member firms. Liability limited by a scheme approved under Professional Standards Legislation other than for the acts or omissions of financial services licensees
DECLARATION OF INDEPENDENCE BY DEAN JUST TO THE DIRECTORS OF TOX FREE SOLUTIONS
LIMITED
As lead auditor of Tox Free Solutions Limited for the year ended 30 June 2016, I declare that, to the
best of my knowledge and belief, there have been:
1. No contraventions of the auditor independence requirements of the Corporations Act 2001 in
relation to the audit; and
2. No contraventions of any applicable code of professional conduct in relation to the audit.
This declaration is in respect of Tox Free Solutions Limited and the entities it controlled during the period.
Dean Just
Director
BDO Audit (WA) Pty Ltd
Perth, 22 August 2016

Consolidated Statement of Profit or Loss For the Year Ended 30 June 2016
TOX FREE SOLUTIONS LTD | Annual Report | 30 June 2015 CONSOLIDATED STATEMENT OF PROFIT OR LOSS Page 84 of 173
Note
2016
$’000
2015
$’000
Revenue from continuing operations
Services 5 393,380 407,278
Other revenue 5 345 254
Total Revenue 393,725 407,532
Other income 6 1,562 501
Expenses 7
Waste disposal and other non-employee benefit related direct costs (117,820) (127,897)
Outsourcing costs (35,224) (33,417)
Employee benefits expense (137,057) (141,495)
Administrative expenses (19,003) (20,120)
Amortisation (1,914) (2,073)
Depreciation (31,594) (29,655)
Impairment losses and write-offs (3,658) -
Finance costs (6,154) (6,505)
Occupancy costs (11,636) (12,332)
Acquisition, integration and rebranding costs (4,728) (1,395)
Site closure and restructuring costs (5,851) -
Other expenses (605) (896)
Profit before income tax 20,043 32,248
Income tax expense 8 (6,989) (10,254)
Profit after income tax for the year 13,054 21,994
Profit is attributable to:
Owners of Tox Free Solutions Limited 12,608 21,768
Non-controlling interests 446 226
13,054 21,994
Earnings per share for profit attributable to the ordinary equity holders of the company: Cents Cents
Basic earnings per share (cents) 31 9.23 16.27
Diluted earnings per share (cents) 31 9.22 16.19
The above Consolidated Statement of Profit or Loss should be read in conjunction with the accompanying notes.

Consolidated Statement of Comprehensive Income For the Year Ended 30 June 2016
TOX FREE SOLUTIONS LTD | Annual Report | 30 June 2016 CONSOLIDATED STATEMENT OF COMPREHENSIVE INCOME Page 85 of 173
Note
2016
$’000
2015
$’000
Profit for the year 13,054 21,994
Other comprehensive income (expense) Items that may be reclassified to profit or loss
Changes in the fair value of cash flow hedges 21 201 (766) Income tax relating to these items 8 (60) 230
Other comprehensive income (expense) for the year, net of tax 141 (536)
Total comprehensive income for the year 13,195 21,458
Total comprehensive income for the year is attributable to:
Owners of Tox Free Solutions Limited 12,749 21,232
Non-controlling interests 446 226
13,195 21,458
The above Consolidated Statement of Comprehensive Income should be read in conjunction with the accompanying notes.

Consolidated Balance Sheet As at 30 June 2016
TOX FREE SOLUTIONS LTD | Annual Report | 30 June 2016 CONSOLIDATED BALANCE SHEET Page 86 of 173
Note
2016
$’000
2015
$’000
ASSETS
CURRENT ASSETS
Cash and cash equivalents 9 31,952 19,709
Trade and other receivables 10 90,908 88,586
Inventories 12 584 241
Current tax assets 11 2,898 -
TOTAL CURRENT ASSETS 126,342 108,536
NON-CURRENT ASSETS
Property, plant and equipment 13 175,943 153,486
Intangible assets 14 180,173 151,388
Deferred tax assets 11 8,516 7,954
TOTAL NON-CURRENT ASSETS 364,632 312,828
TOTAL ASSETS 490,974 421,364
LIABILITIES
CURRENT LIABILITIES
Trade and other payables 15 53,204 46,451
Borrowings 16 3,598 12,314
Current tax liabilities 11 - 542
Employee benefit obligations 17 10,346 8,487
Provisions 18 6,477 6,402
TOTAL CURRENT LIABILITIES 73,625 74,196
NON-CURRENT LIABILITIES
Borrowings 16 130,255 88,203
Derivative financial instruments 19 1,663 1,864
Deferred tax liabilities 11 8,143 6,366
Other payables 15 925 -
TOTAL NON-CURRENT LIABILITIES 140,986 96,433
TOTAL LIABILITIES 214,611 170,629
NET ASSETS 276,363 250,735

Consolidated Balance Sheet As at 30 June 2016
TOX FREE SOLUTIONS LTD | Annual Report | 30 June 2016 CONSOLIDATED BALANCE SHEET Page 87 of 173
Note
2016
$’000
2015
$’000
EQUITY
Contributed equity 20 195,457 170,885
Reserves 21 4,687 4,376
Retained earnings 21 73,240 72,488
Capital and reserves attributable to owners 273,384 247,749
Non-controlling interests 27 2,979 2,986
TOTAL EQUITY 276,363 250,735
The above Consolidated Balance Sheet should be read in conjunction with the accompanying notes.

Consolidated Statement of Cash Flows For the Year Ended 30 June 2016
TOX FREE SOLUTIONS LTD | Annual Report | 30 June 2016 CONSOLIDATED STATEMENT OF CASH FLOWS Page 88 of 173
Note
2016
$’000
2015
$’000
CASH FLOWS FROM OPERATING ACTIVITIES
Receipts from customers (inclusive of goods and services tax) 416,780 452,409
Payments to suppliers and employees (inclusive of goods and services tax) (344,321) (380,298)
Other income 217 32
Interest paid (4,655) (4,869)
Income taxes paid (8,985) (6,329)
Net cash inflow from operating activities 23 59,036 60,945
CASH FLOWS FROM INVESTING ACTIVITIES
Proceeds from the sale of property, plant and equipment 8,625 3,019
Payments for property, plant and equipment (32,007) (42,297)
Payments for the acquisition of businesses, net of cash acquired 4 (68,554) (5,328)
Interest received 344 338
Net cash (outflow) from investing activities (91,592) (44,268)
CASH FLOWS FROM FINANCING ACTIVITIES
Net proceeds from issue of ordinary shares 23,203 -
Proceeds from borrowings 209,500 40,700
Payments for shares acquired by Employee Share Trust (165) (775)
Repayment of borrowings (176,452) (42,033)
Dividends paid to company’s shareholders (10,784) (8,788)
Dividends paid to non-controlling interests in subsidiaries (503) (2,240)
Net cash inflow / (outflow) from financing activities 44,799 (13,136)
Net increase in cash and cash equivalents 12,243 3,541
Cash and cash equivalents at beginning of year 19,709 16,168
Cash and cash equivalents at end of financial year 9 31,952 19,709
Non-cash financing and investing activities (refer to note 23)
The above Consolidated Statement of Cash Flows should be read in conjunction with the accompanying notes.

Consolidated Statement of Changes in Equity For the Year Ended 30 June 2016
TOX FREE SOLUTIONS LTD | Annual Report | 30 June 2016 CONSOLIDATED STATEMENT OF CHANGES IN EQUITY Page 89 of 173
Note
Contributed Equity
$’000
Share-based Payments
Reserve
$’000
Cash Flow Hedging Reserve
$’000
Equity
Reserve
$’000
Retained Earnings
$’000
Total
$’000
Non-controlling
Interests
$’000
Total
Equity
$’000
Balance at 1 July 2014 170,885 7,145 (769) - 59,721 236,982 - 236,982
Profit for the year - - - - 21,768 21,768 226 21,994
Other comprehensive income (expense) 21 - - (536) - - (536) - (536)
Total comprehensive income for the year - - (536) - 21,768 21,232 226 21,458
Transactions with owners in their capacity as owners
Contribution of equity, net of transaction costs and tax 20 575 - - - - 575 - 575
Share-based payment – current period expense 21 & 24 - 572 - - - 572 - 572
Share-based payment – vested and reclassified 20 & 21 200 (562) - - 362 - - -
Settlement of vested executive rights 20 (760) - - - - (760) - (760)
Acquisition of treasury shares 20 (15) - - - - (15) - (15)
Acquisition of subsidiaries - - - - - - 3,526 3,526
Transactions with non-controlling interests 21 - - - (1,474) - (1,474) 1,474 -
Dividends paid or provided for 22 &27 - - - - (9,363) (9,363) (2,240) (11,603)
- 10 - (1,474) (9,001) (10,465) 2,760 (7,705)
Balance at 30 June 2015 170,885 7,155 (1,305) (1,474) 72,488 247,749 2,986 250,735

Consolidated Statement of Changes in Equity For the Year Ended 30 June 2016
TOX FREE SOLUTIONS LTD | Annual Report | 30 June 2016 CONSOLIDATED STATEMENT OF CHANGES IN EQUITY Page 90 of 173
Note
Contributed Equity
$’000
Share-based Payments
Reserve
$’000
Cash Flow Hedging Reserve
$’000
Equity
Reserve
$’000
Retained Earnings
$’000
Total
$’000
Non-controlling
Interests
$’000
Total
Equity
$’000
Balance at 1 July 2015 170,885 7,155 (1,305) (1,474) 72,488 247,749 2,986 250,735
Profit for the year - - - - 12,608 12,608 446 13,054
Other comprehensive income (expense) 21 - - 141 - - 141 - 141
Total comprehensive income for the year - - 141 - 12,608 12,749 446 13,195
Transactions with owners in their capacity as owners
Contribution of equity, net of transaction costs and tax 20 24,737 - - - - 24,737 - 24,737
Share-based payment – current period expense 21 & 24 - 605 - - - 605 - 605
Share-based payment – vested and reclassified 21 - (222) - - 222 - - -
Settlement of vested executive rights 20 (180) - - - - (180) - (180)
Net disposal / (acquisition)of treasury shares 20 15 - - - - 15 - 15
Acquisition of subsidiaries 4 - - - - - - 185 185
Transactions with non-controlling interests 4 & 21 - - - (213) - (213) (135) (348)
Dividends paid or provided for 22 & 27 - - - - (12,078) (12,078) (503) (12,581)
24,572 383 - (213) (11,856) 12,886 (453) 12,433
Balance at 30 June 2016 195,457 7,538 (1,164) (1,687) 73,240 273,384 2,979 276,363
The above Consolidated Statement of Changes in Equity should be read in conjunction with the accompanying notes.

Notes to the Consolidated Financial Statements For the Year Ended 30 June 2016
TOX FREE SOLUTIONS LTD | Annual Report | 30 June 2016 NOTES TO THE CONSOLIDATED FINANCIAL STATEMENTS Page 91 of 173
Contents of the notes to the Consolidated Financial Statements
Note
Page
1. Critical Accounting Estimates and Judgements 92
2. Financial Risk Management 93
3. Segment Information 99
4. Business Combinations 103
5. Revenue 108
6. Other Income 108
7. Expenses 109
8. Income Tax Expense 110
9. Cash and Cash Equivalents 111
10. Trade and Other Receivables 111
11. Tax Assets and Tax Liabilities 113
12. Inventories 115
13. Property, Plant and Equipment 115
14. Intangibles 117
15. Trade and Other Payables 120
16. Borrowings 120
17. Employee Benefits 122
18. Provisions 123
19. Derivative Financial Instruments 124
20. Contributed Equity 125
21. Other Reserves and Retained Earnings 128
22. Dividends 129
23. Cash Flow Information 130
24. Share-based Payments 131
25. Parent Entity Financial Information 140
26. Commitments 142
27. Interests in Other Entities 143
28. Related Party Transactions 145
29. Contingencies 146
30. Remuneration of Auditor 147
31. Earnings per Share 147
32. Deed of Cross-Guarantee 148
33. Events occurring after the Reporting Period 148
34. Summary of Significant Accounting Policies 149

Notes to the Consolidated Financial Statements For the Year Ended 30 June 2016
TOX FREE SOLUTIONS LTD | Annual Report | 30 June 2016 NOTES TO THE CONSOLIDATED FINANCIAL STATEMENTS Page 92 of 173
This financial report includes the consolidated financial statements and notes of Tox Free Solutions Limited and its subsidiaries (the 'Group'). The financial statements were authorised for issue by the Board of Directors on 22nd August 2016.
Tox Free Solutions Limited is a for-profit Group domiciled in Australia. The consolidated financial statements are presented in Australian Dollars, which is the Group’s functional currency.
The Group is an entity to which ASIC Corporations Instrument 2016/191 applies and, accordingly, amounts in the financial statements and Directors' Report have been rounded to the nearest thousand dollars.
The separate financial statements and notes of the parent entity, Tox Free Solutions Limited, have not been presented within this financial report as permitted by amendments made to the Corporations Act 2001. The Parent entity summary is included in note 25.
1) Critical Accounting Estimates and Judgements
Critical accounting estimates and judgements The preparation of financial statements requires the use of accounting estimates which, by definition will seldom equal the actual results. The Directors evaluate estimates and judgments incorporated into the financial statements based on historical knowledge and best available current information. Estimates assume a reasonable expectation of future events and are based on current trends and economic data, obtained both externally and within the Group.
(i) Key estimates – Impairment of Goodwill and other Intangibles The Group tests annually whether Goodwill and other Intangibles have suffered any impairment, in accordance with the accounting policy stated in note 34(h). The recoverable amount of Goodwill and other Intangibles has been calculated using a number of assumptions as discussed in Note 14. No impairment has been recognised in respect of Goodwill at the end of the reporting period.
(ii) Key estimates – Provision for Impairment of Receivables The Group tests annually whether receivables have suffered any impairment, in accordance with the accounting policy stated in note 34(d) (iii). The value of the provision for impairment of receivables is estimated by considering the ageing of receivables, communication with the debtors and prior history. Refer to note 10 for details on the Provision for Impairment of Receivables and Receivables written off during the year as uncollectible.
(iii) Revenue recognition The Group recognises revenue in the accounting period in which the services are rendered. Revenue is recognised when it is probable that the benefit will flow to the Group. For contract variations, this requires estimates and judgments based on future economic benefit and is typically when the variations / overruns have been agreed with the customer. The contract variations must be approved by the client before sales invoices can be raised. At 30 June 2016, the Group has accrued revenue amounting to $nil (2015: $7,896,333) for contract variations relating to waste management services.
(iv) Key estimates – Depreciation of Major ERP Software Major ERP software is deemed to have a 10 year useful life and is amortised on a straight-line basis.

Notes to the Consolidated Financial Statements For the Year Ended 30 June 2016
TOX FREE SOLUTIONS LTD | Annual Report | 30 June 2016 NOTES TO THE CONSOLIDATED FINANCIAL STATEMENTS Page 93 of 173
(v) Key estimates – other Information about significant areas of estimation uncertainty and critical judgements in applying accounting policies that have the most significant effect on the amount recognised in the financial statements are described in the following notes:
Note 4 - Business Combination
Note 8 - Income Tax Expense
Note 18 - Provisions
Note 24 - Share-based Payment
Note 26 - Commitments
Note 29 - Contingencies (vi) Key estimates – Customer related intangibles The customer related intangibles were acquired as part of a business combination (please refer to note 4 for additional details). The contracts and relationships are recognised at their fair value at the date of acquisition and are subsequently amortised on a straight-line based on the timing of projected cash flows of the contracts over their estimated useful lives. The fair value of the intangible was determined using the following key assumptions:
Assumed level of future revenue
Assumed EBITDA margin
2) Financial Risk Management
The main risks the Group is exposed to through its financial instruments are credit risk, liquidity risk and market risk, consisting of interest rate risk. The Group is not significantly exposed to foreign currency risk and is not exposed to equity price risk.
The Group’s financial instruments consist mainly of deposits with banks, local money market instruments, short-term investments, accounts receivable and payable, bank loans, loans to and from subsidiaries, finance leases, and derivatives.
The Group holds the following financial instruments by category:
Note 2016
$’000 2015
$’000 Financial Assets Cash and cash equivalents 9 31,952 19,709 Trade and other and receivables ^ 10 86,237 85,696
Total financial assets 118,189 105,405
Financial Liabilities Financial liabilities at amortised cost Trade and other payables 15 54,129 46,451 Borrowings ^ 16 134,531 100,517 Derivatives used for hedging Derivative financial instruments 19 1,663 1,864
Total financial liabilities 190,323 148,832
^ excludes prepayments and prepaid establishment costs

Notes to the Consolidated Financial Statements For the Year Ended 30 June 2016
TOX FREE SOLUTIONS LTD | Annual Report | 30 June 2016 NOTES TO THE CONSOLIDATED FINANCIAL STATEMENTS Page 94 of 173
Financial risk management policies The Board of Directors has overall responsibility for the establishment of the Group’s financial risk management framework. This includes the development of policies covering specific areas such as, interest rate risk, credit risk and the use of derivatives. Risk management policies and systems are reviewed regularly to reflect changes in market conditions and the Group’s activities. The day-to-day risk management is carried out by the Group’s finance and risk functions under policies and objectives which have been approved by the Board of Directors. The Chief Financial Officer has been delegated the authority for designing and implementing processes which follow the objectives and policies. This includes monitoring the levels of exposure to interest rate risk and assessment of market forecasts for interest rate movements. The Board of Directors receives monthly reports which provide details of the effectiveness of the processes and policies in place. The Risk Committee oversees how management monitors compliance with the Group's risk management policies and procedures and reviews the adequacy of the risk management framework in relation to the risks faced by the Group. Toxfree does not actively engage in the trading of financial assets for speculative purposes. There have been no significant changes from the way financial risk was managed in the prior financial year. Mitigation strategies for specific risks faced are described below: (a) Credit risk Exposure to credit risk relating to financial assets arises from the potential failure by a customer to meet contractual obligations that could lead to a financial loss to the Group and arises principally from the Group's receivables from customers and cash and cash equivalents. The Group's exposure to credit risk is influenced mainly by individual characteristics of each customer. The demographics of the Group's customer base have little influence on credit risk and there is no concentration of risk geographically. It is the Group’s policy that all customers who wish to trade on credit terms undergo a credit assessment process which takes into account the customer’s financial position, past experience and other factors. Credit limits are then set based on ratings in accordance with the limits set by the Board of Directors; these limits are reviewed on a regular basis. Key customers have been transacting with the Group for a long period of time and losses have occurred infrequently.

Notes to the Consolidated Financial Statements For the Year Ended 30 June 2016
TOX FREE SOLUTIONS LTD | Annual Report | 30 June 2016 NOTES TO THE CONSOLIDATED FINANCIAL STATEMENTS Page 95 of 173
The Group has established an allowance for impairment that represents the estimate of potential incurred losses in respect of trade and other receivables. The main components of this allowance are a specific loss component that relates to individually significant exposures, and a collective loss component established for Groups of similar assets in respect of losses that have been incurred but not yet identified. The collective loss allowance is determined based on historical data of payment statistics for similar financial assets. Please refer to the Financial Instruments accounting policy note 34(d).
Exposure to credit risk The carrying amount of the Group’s financial assets represents the maximum credit exposure. The Group’s maximum exposure to credit risk at reporting date was:
Current Consolidated
2016 2015 $’000 $’000
Cash and cash equivalents 31,952 19,709 Trade and other receivables ^ 86,237 85,696
118,189 105,405
^ excludes prepayments The Group’s maximum exposure to credit risk for trade receivables at the reporting date was primarily attributable to Australian customers. No collateral risk is held as security for this credit risk. For banks and financial institutions, only independently rated parties with a minimum rating of ‘A’ are accepted. There were no favourable derivative financial instruments at the end of the reporting period. (b) Liquidity risk
Liquidity risk arises from the possibility that the Group might encounter difficulty in settling its debts or otherwise meeting its obligations related to financial liabilities. The approach to managing liquidity is to ensure, as far as possible, that it will always have sufficient liquidity to meet its liabilities when due, under both normal and stressed conditions, without incurring unacceptable losses or risking damage to the Group's reputation. The Group manages this risk through the following mechanisms:
preparing forward-looking cash flow analysis in relation to its operational, investing and financial activities which are monitored on a monthly basis;
monitoring undrawn credit facilities;
maintaining a reputable credit profile;
managing credit risk related to financial assets;
only investing surplus cash with major financial institutions; and
comparing the maturity profile of financial liabilities with the realisation profile of financial assets.
Typically, the Group ensures that it has sufficient cash on demand to meet expected operational expenses and servicing financial obligations for a period of 30 days. This excludes the potential impact of extreme circumstances that cannot be reasonably predicted.

Notes to the Consolidated Financial Statements For the Year Ended 30 June 2016
TOX FREE SOLUTIONS LTD | Annual Report | 30 June 2016 NOTES TO THE CONSOLIDATED FINANCIAL STATEMENTS Page 96 of 173
The banking funds available to the Group are disclosed in note 16 and the contractual commitments of the Group are disclosed in note 26.
The tables below reflect the contractual undiscounted maturity analysis for financial liabilities including estimated interest payments and excluding the impact of netting agreements. Financial guarantee liabilities are treated as payable on demand since the Group has no control over the timing of any potential settlement of the liabilities. The timing of cash flows presented in the table to settle financial liabilities reflects the earliest contractual settlement dates and does not reflect management's expectations that banking facilities will be rolled forward. For interest rate swaps the cash flows have been estimated using forward interest rates applicable at the end of the period.
Contractual maturities of financial liabilities
Within 1
year Between 1 and 5 years
Over 5 years
Total contractual cash flows
Carrying amount
At 30 June 2016 $’000 $’000 $’000 $’000 $’000
Non-derivatives Trade and other payables 53,204 925 - 54,129 54,129 Borrowings ^ 3,426 130,946 - 134,372 126,250 Lease liabilities 4,277 4,696 - 8,973 8,281
Total contractual outflows 60,907 136,567 - 197,474 188,660
Derivatives Net settled - Interest rate swaps - 1,663 - 1,663 1,663
^ excludes prepaid establishment costs
Within 1
year Between 1 and 5 years
Over 5 years
Total contractual cash flows
Carrying amount
At 30 June 2015 $’000 $’000 $’000 $’000 $’000 Non-derivatives Trade and other payables 46,451 - - 46,451 46,451 Borrowings 9,940 37,615 49,588 97,143 87,338 Lease liabilities 5,470 9,081 - 14,551 13,179
Total contractual outflows 61,861 46,696 49,588 158,145 146,968
Derivatives Net settled - Interest rate swaps - 1,864 - 1,864 1,864
Financial assets pledged as collateral Certain financial assets have been pledged as security for debt and their realisation into cash may be restricted subject to terms and conditions attached to the relevant debt contracts.

Notes to the Consolidated Financial Statements For the Year Ended 30 June 2016
TOX FREE SOLUTIONS LTD | Annual Report | 30 June 2016 NOTES TO THE CONSOLIDATED FINANCIAL STATEMENTS Page 97 of 173
(c) Market risk Market risk is the risk that the fair value or future cash flows of a financial instrument will fluctuate because of changes in market prices.
(i) Interest rate risk
Exposure to interest rate risk arises on financial assets and financial liabilities recognised at the end of the reporting period, whereby a future change in interest rates will affect future cash flows or the fair value of fixed rate financial instruments. The Group is also exposed to earnings volatility on floating rate instruments.
Interest rate swaps Interest rate risk is managed by maintaining a portion of borrowings at fixed interest rates through the use of interest rate swaps. At 30 June 2016, approximately 37% (2015: 58%) of the Group secured bank loan debt is hedged at a fixed rate.
Bank loans of the Group currently bear an average variable interest rate of 2.72% (2015: 2.85%) before applicable line fees. It is policy to protect part of the loans from exposure to increasing interest rates. Accordingly, the Group has entered into interest rate swap contracts under which it is obliged to receive interest at variable rates and to pay interest at fixed rates.
Swaps currently in place cover 37% (2015: 58%) of the variable loan principal outstanding. The fixed interest rates range between 3.27% and 3.97% (2015: 3.27% and 3.97%) and the variable rates between 2.64% and 2.81% (2015: 2.79% and 3.01%).
The contracts require settlement of net interest receivable or payable on a monthly basis. The settlement dates coincide with the dates on which interest is payable on the underlying debt. The contracts are settled on a net basis.
At the end of the reporting period, the Group had the following variable rate borrowings and interest rate swap contracts outstanding:
30 June 2016 30 June 2015
Category
Weighted
average
interest
rate %
Balance
$’000
Weighted
average
interest
rate %
Balance
$’000
Bank Loans – cash advance facilities^
2.72
126,250
2.85
87,338 Interest rate swaps 3.67 (47,250) 3.69 (50,250)
Net exposure to variable cash flow interest rate risk 79,000 37,088
^ excludes prepaid establishment costs
Finance lease liabilities are not disclosed above as they are financed at fixed interest rates. The weighted average fixed interest rate at the end of the 2016 reporting period was 6.1% (2015: 6.5%).
Sensitivity analysis The following analysis summarises the sensitivity of the Group’s financial assets and liabilities to interest rate risk.

Notes to the Consolidated Financial Statements For the Year Ended 30 June 2016
TOX FREE SOLUTIONS LTD | Annual Report | 30 June 2016 NOTES TO THE CONSOLIDATED FINANCIAL STATEMENTS Page 98 of 173
At 30 June 2016, if interest rates had increased by 100 basis points or decreased by 100 basis points from year end rates with all other variables held constant, pre-tax profit for the period would have been $895,000 (2015: $589,000) higher / lower mainly as a result of higher / lower interest costs from variable rate debt.
The sensitivity analysis has been calculated on a consistent basis with the previous reporting period.
Fair values versus carrying amounts The fair values of financial assets and liabilities, together with the carrying amounts shown in the Consolidated Balance Sheet, are as follows:
2016 2015
Consolidated Carrying
Amount
$’000
Fair Value
$’000
Carrying
Amount
$’000
Fair Value
$’000
Cash and cash equivalents 31,952 31,952 19,709 19,709 Trade and other receivables ^ 86,237 86,237 85,696 85,696
Secured bank loans ^ ϡ (126,250) (127,809) (87,338) (88,285)
Lease liabilities € (8,281) (8,489) (13,179) (13,615) Trade and other payables ¥ (54,129) (54,129) (46,451) (46,451)
(70,471) (72,238) (41,563) (42,946)
^ excludes prepayments and prepaid establishment costs ϡ The fair value of borrowings are based on cash flows discounted at a rate of 2.64% (2015: 2.79%). € The fair value of lease liabilities are based on cash flows discounted at a rate of 4.5% (2015: 4.5%). ¥ The cash flows on the long-term portion of other payables are regarded as insignificant and have not been discounted. (ii) Price risk The Group is not exposed to equity securities or commodity price risk at 30 June 2016 (30 June 2015: Nil). (d) Fair value measurements
The fair value of financial assets and financial liabilities must be estimated for recognition and measurement or for disclosure purposes.
Fair Value Measurement requires disclosure of fair value measurements by level of the following fair value measurement hierarchy: a) quoted prices (unadjusted) in active markets for identical assets or liabilities (level 1) b) inputs other than quoted prices included within level 1 that are observable for the asset or
liability, either directly (as prices) or indirectly (derived from prices) (level 2), and c) inputs for the asset or liability that are not based on observable market data (unobservable
inputs) (level 3). The following table presents the Group’s applicable assets and liabilities measured and recognised at fair value at 30 June 2016 and 30 June 2015:

Notes to the Consolidated Financial Statements For the Year Ended 30 June 2016
TOX FREE SOLUTIONS LTD | Annual Report | 30 June 2016 NOTES TO THE CONSOLIDATED FINANCIAL STATEMENTS Page 99 of 173
At 30 June 2016
Level 1
$’000
Level 2
$’000
Level 3
$’000
Total
$’000
Liabilities Derivatives used for hedging - 1,663 - 1,663
Total liabilities 1,663
At 30 June 2015
Level 1
$’000
Level 2
$’000
Level 3
$’000
Total
$’000
Liabilities Derivatives used for hedging - 1,864 - 1,864
Total liabilities 1,864
The fair value of financial instruments that are not traded in an active market (for example, over-the counter derivatives) is determined using valuation techniques. These valuation techniques maximise the use of observable market data where it is available and rely as little as possible on entity specific estimates. If all significant inputs required to fair value an instrument are observable, the instrument is included in level 2. The fair value of interest rate swaps is calculated as the present value of the estimated future cash flows based on observable yield curves.
The carrying amounts of trade receivables and payables are assumed to approximate their fair values due to their short-term nature. The fair value of financial liabilities for disclosure purposes is estimated by discounting the future contractual cash flows at the current market interest rate that is available to the Group for similar financial instruments. The fair value of current borrowings approximates the carrying amount, as the impact of discounting is not significant.
3) Segment Information
Identification of reportable segments
The Group has identified its operating segments based on the internal reports that are reviewed and used by the Managing Director (chief operating decision maker) in assessing performance and determining the allocation of resources.
The Group is managed primarily on the basis of service offerings as the diversification of the Group’s operations inherently has notably different risk profiles and performance assessment criteria. Operating segments are therefore determined on the same basis.
Reportable segments disclosed are based on the aggregation of five cash generating operating units; refer to note 14. The cash generating units are based on the aggregation of cost centres. The Managing Director considers the business strategically and operationally from a service perspective and has identified the three reportable segments as being:
Waste Services
Industrial Services
Technical and Environmental Services
The three reportable segments remain unchanged from the previous financial year.

Notes to the Consolidated Financial Statements For the Year Ended 30 June 2016
TOX FREE SOLUTIONS LTD | Annual Report | 30 June 2016 NOTES TO THE CONSOLIDATED FINANCIAL STATEMENTS Page 100 of 173
Performance is measured based on segment earnings before interest, tax, depreciation and amortisation (EBITDA) as included in the internal financial reports. Interest income and expenditure are not allocated to segments as this type of activity is driven by the central treasury function which manages the cash position of the Group. Types of services by reportable segment
(i) Waste services Waste Services are provided primarily in regional areas of Australia as part of Toxfree’s total waste management service offering. Services are currently provided e.g. throughout the Kimberley, Pilbara and South West regions of Western Australia, Tasmania and throughout regional Queensland.
Waste Services includes the collection, resource recovery, recycling and disposal of solid, industrial, municipal and commercial wastes.
(ii) Industrial services Toxfree’s Industrial Services Division provides onsite industrial cleaning to the oil and gas, mining, heavy manufacturing, civil infrastructure, municipal and utilities sectors. Services include; tank and drain cleaning, high pressure water jetting, vacuum loading and liquid and industrial waste collection.
The provision of industrial services is an extremely important part of the Group’s integrated service offering. Not only are industrial services the main interface with our clients, they also harvest the waste that is subsequently managed through the Group’s treatment facilities.
Toxfree is a leading provider of industrial services in Australia, through ensuring the employment of competent and trained personnel, a commitment to the safe work practices, safe equipment and mobile vehicle fleet.
(iii) Technical and Environmental services Toxfree has a national network of liquid and hazardous waste management facilities throughout Australia. Services are provided from e.g. Kwinana, Henderson, Karratha, Port Hedland, Sydney, Brisbane, Sydney and Melbourne facilities. Toxfree uses a number of technologies to manage this waste stream including, thermal desorption, incineration, plasma arc, base catalytic de-chlorination, stabilisation and fixation, physiochemical treatment and reuse and recycling.
(a) Segment assets Where an asset is used across multiple segments, the asset is allocated to the segment that receives the majority of economic value from the asset. In the majority of instances, segment assets are clearly identifiable on the basis of their nature and physical location.
(b) Segment liabilities Liabilities are allocated to segments where there is direct nexus between the incurrence of the liability and the operations of the segment. Borrowings and tax liabilities are generally considered to relate to the Group as a whole and are not allocated. Segment liabilities include trade and other payables and certain direct borrowings.

Notes to the Consolidated Financial Statements For the Year Ended 30 June 2016
TOX FREE SOLUTIONS LTD | Annual Report | 30 June 2016 NOTES TO THE CONSOLIDATED FINANCIAL STATEMENTS Page 101 of 173
Waste Services
Industrial Services
Technical and
Environmental Services
Total
2016
$’000
2015
$’000
2016
$’000
2015
$’000
2016
$’000
2015
$’000
2016
$’000
2015
$’000
(c) Segment performance
Revenue
Total segment revenue 250,630 270,080 101,168 113,754 100,317 86,073 452,115 469,907
Inter-segment revenue (18,558) (19,997) (7,686) (9,926) (32,491) (32,706) (58,735) (62,629)
External customers 232,072 250,083 93,482 103,828 67,826 53,367 393,380 407,278
Depreciation and amortisation 17,306 17,039 7,818 8,194 6,687 5,252 31,811 30,485
Impairments / write-offs 175 - - - 3,483 - 3,658 -
Segment EBIT 38,684 45,045 8,884 9,902 9,594 14,631 57,162 69,578
Segment EBITDA 55,990 62,084 16,702 18,096 16,281 19,883 88,973 100,063
(d) Segment assets
Total segment assets 193,814 215,262 73,867 64,264 160,122 99,378 427,803 378,904
Capital Expenditure 16,660 21,220 4,814 5,947 8,606 6,448 30,080 33,615
(e) Segment liabilities
Total segment liabilities 18,130 23,139 6,511 11,050 26,318 18,562 50,959 52,751

TOX FREE SOLUTIONS LTD | Annual Report | 30 June 2016 NOTES TO THE CONSOLIDATED FINANCIAL STATEMENTS Page 102 of 173
Notes to the Consolidated Financial Statements For the Year Ended 30 June 2016
(f) Reconciliations
2016
$’000
2015
$’000
Reconciliation of segment EBITDA to operating profit before income tax:
Segment EBITDA 88,973 100,063
Share-based payments (605) (572)
Finance costs (6,154) (6,505)
Employee expenses (19,134) (20,168)
Acquisition, integration and rebranding costs (4,728) (1,395)
Site closure and restructuring costs (1,181) -
Travel and motor vehicle expenses (1,702) (2,048)
Depreciation and amortisation (33,508) (31,728)
Occupancy costs (735) (937)
Other corporate costs (2,587) (5,342)
Reduction to contingent consideration 1,067 -
Other income 337 880
Total net profit before tax 20,043 32,248
Reconciliation of segment assets to total assets per the Balance Sheet:
Segment assets 427,803 378,904
Cash and cash equivalents 31,952 19,709
Other receivables 2,588 415
Inventories 584 241
Prepayments 4,671 2,890
Prepaid tax 2,898 -
Deferred tax assets 8,516 7,954
Property, plant and equipment 11,962 11,251
Total assets per the Consolidated Balance Sheet 490,974 421,364
Reconciliation of segment liabilities to total liabilities per the Balance Sheet:
Segment liabilities 50,959 52,751
Other payables and derivative liabilities 11,310 1,966
Loans and borrowings 133,853 100,517
Employee benefits 10,346 8,487
Current tax payable - 542
Deferred tax liability 8,143 6,366
Total liabilities per the Consolidated Balance Sheet 214,611 170,629

Notes to the Consolidated Financial Statements For the Year Ended 30 June 2016
TOX FREE SOLUTIONS LTD | Annual Report | 30 June 2016 NOTES TO THE CONSOLIDATED FINANCIAL STATEMENTS Page 103 of 173
(a) Acquisition of PGM Refiners Pty Ltd
On 1 December 2015, Toxfree acquired a 91.4% controlling interest in PGM Refiners Pty Ltd (PGM) for an initial consideration of $2,079m. PGM are a well-regarded E-waste recycling company based in Melbourne and the acquisition of PGM will give Toxfree a service stream complimentary to our existing metropolitan hazardous waste sector services.
Toxfree had an option to acquire the remaining 8.6% non-controlling interest and on 31 May 2016 the remaining non-controlling interest was acquired for a consideration of $350,000. For additional details relating to acquiring the remaining 8.6%, please refer to (iv) below.
Details of the initial consideration, the net assets acquired and goodwill are as follows:
$’000 Purchase consideration Cash paid for the 91.4% controlling interest 2,079
Total Purchase consideration 2,079
The assets and liabilities recognised as a result of the acquisition are as follows:
Fair Value $’000
Cash 1,574 Trade receivables 405 Other receivables 62 Prepayments 42 Inventory 63 Plant and equipment 2,439 Deferred tax asset 10 Trade payables (200) Other payables and accruals (1,677) Employee Entitlements (65) Waste provision (93) Borrowings (966)
Net identifiable assets acquired 1,594 Less: Non-controlling interests (185)
1,409 Add: Goodwill 670
2,079
The goodwill is attributable to the strengthened foothold obtained in the area, increased workforce, business and market capabilities. None of the goodwill is expected to be deductible for tax purposes.
The Group has reported provisional amounts for goodwill and plant and equipment as part of the purchase of PGM.
4) Business Combinations

Notes to the Consolidated Financial Statements For the Year Ended 30 June 2016
TOX FREE SOLUTIONS LTD | Annual Report | 30 June 2016 NOTES TO THE CONSOLIDATED FINANCIAL STATEMENTS Page 104 of 173
(i) Acquisition-related costs
Acquisition-related costs for the acquisition of PGM of $0.110M are included in the Consolidated Profit or Loss.
(ii) Revenue and profit contribution PGM contributed revenues of $2.124m and net profit before tax of $0.186m to the Toxfree Group for the period 1 December 2015 to 30 June 2016. If the acquisition had occurred earlier on 1 July 2015, combined revenues of $3.847m and net profit before tax of $0.306m would have been the estimated contribution for the period 1 July 2015 to 30 June 2016.
(iii) Accounting policy choice for non-controlling interests The Group recognises non-controlling interests in an acquired entity either at fair value or at the non-controlling interest’s proportionate share of the acquired entity’s net identifiable assets. This decision is made on an acquisition-by-acquisition basis. For the non-controlling interests in PGM, the Group elected to recognise the non-controlling interests in at its proportionate share of the acquired net identifiable assets.
(iv) Transactions with Non-controlling Interests (NCI) Toxfree had an option to acquire the remaining 8.6% non-controlling interest. On 31 May 2016, Toxfree acquired the additional non-controlling interest for a consideration of $350,000. The net asset value of the non-controlling interest was $196,000 which resulted in an adjustment of $154,000 to the Toxfree Equity Reserve.
$’000 Transactions with NCI:
NCI arising on business combination 185 NCI share of profit 1 December 2015 to 31 May 2016 11 Acquisition of additional 8.6% non-controlling interest (196)
Non-controlling interests - carrying value 31 May 2016 -
(b) Acquisition of HKD Process Cleaning Pty Ltd
On 14 December 2015, Toxfree acquired 100% interest in HKD Process Cleaning Pty Ltd (HKD) for a
cash consideration of $2.13M. HKD is a chemical cleaning business, servicing industrial sectors such
as Oil & Gas, Mining, Power Plants, Automotive, Chemical Processing and Refineries.
There is a potential deferred payment payable of $1M, subject to the below conditions being satisfactorily met:
within 12 months after completion occurs,
Toxfree enters into an unconditional contract with a customer to provide chemical cleaning
and other industrial services,
realising a Project EBIT Margin under the project contract in excess of 25%; and
receiving Project Revenues under the project contract in excess of $10,000,000 excluding GST. No contingent consideration has been recognised to date as the likelihood of making the payment is currently regarded as uncertain.

Notes to the Consolidated Financial Statements For the Year Ended 30 June 2016
TOX FREE SOLUTIONS LTD | Annual Report | 30 June 2016 NOTES TO THE CONSOLIDATED FINANCIAL STATEMENTS Page 105 of 173
Details of the purchase consideration, the net assets acquired and goodwill are as follows:
$’000 Purchase consideration Cash paid 2,130
Total Purchase consideration 2,130
The assets and liabilities recognised as a result of the acquisition are as follows: Fair Value
$’000 Cash 698 Trade receivables 45 Other receivables 470 Inventory 52 Plant and equipment 606 Other payables (12) Income tax payable (74)
Net identifiable assets acquired 1,785 Add: Goodwill 345
2,130
The goodwill is attributable to the benefits derived from broadening the capabilities of our existing industrial services business. None of the goodwill is expected to be deductible for tax purposes.
The Group has reported provisional amounts for goodwill and plant and equipment acquired as part of the purchase of HKD as fair value assessments have not been finalised.
The Group has reported provisional amounts for goodwill and plant and equipment acquired as part of the purchase of the business.
(i) Acquisition-related costs Acquisition-related costs for the acquisition of HKD of $0.066M are included in the Consolidated Profit or Loss.
(ii) Revenue and profit contribution The HKD operations were incorporated into Tox Free Australia Pty Ltd from the date of acquisition.
(c) Acquisition of Worth Corporation Pty Ltd
On 31 March 2016, Toxfree acquired 100% interest in Worth Corporation Pty Ltd (Worth) for a cash
consideration of $70m. Worth is a leading New South Wales (NSW) based industrial waste treatment
and industrial services business. The acquisition of Worth represents a major expansion in the NSW
liquid and industrial waste market for Toxfree.

Notes to the Consolidated Financial Statements For the Year Ended 30 June 2016
TOX FREE SOLUTIONS LTD | Annual Report | 30 June 2016 NOTES TO THE CONSOLIDATED FINANCIAL STATEMENTS Page 106 of 173
Details of the purchase consideration, the net assets acquired and goodwill are as follows:
$’000 Purchase consideration Cash paid 70,000
Total Purchase consideration 70,000
The assets and liabilities recognised as a result of the acquisition are as follows:
Fair Value $’000
Cash 3,733 Trade receivables 11,972 Other receivables 1,948 Prepaid tax 433 Other prepayments 1,374 Inventory 220 Property, plant and equipment 31,003 Intangibles – customer contracts and relationships 3,760 Deferred tax assets 656 Trade Payables (3,572) Other payables and accruals (4,414) Employee entitlements (1,360) Deferred tax liabilities (1,128) Waste provision (628)
Net identifiable assets acquired 43,997 Add: Goodwill 26,003
70,000
The goodwill is primarily attributable to the benefits derived from the diversification of Toxfree’s industry, geographic exposure, customer and market base; access to licenced liquid treatment and soil remediation facilities; synergies derived from gained technical, managerial and intellectual capabilities and the alignment and rationalisation of facilities. None of the goodwill is expected to be deductible for tax purposes.
The Group has reported provisional amounts for goodwill, customer contracts, customer relationships and property, plant and equipment acquired as part of the purchase of Worth.
(i) Acquisition-related costs Acquisition-related costs for the acquisition of Worth of $2.519m are included in the Consolidated Profit or Loss.
(ii) Revenue and profit contribution Worth contributed revenues of $16.454m and net profit before tax of $3.427m to the Toxfree Group for the period 1 April 2016 to 30 June 2016. If the acquisition had occurred earlier on 1 July 2015, combined revenues of $64.255m and net profit before tax of $6.244m would have been the estimated contribution for the period 1 July 2015 to 30 June 2016.
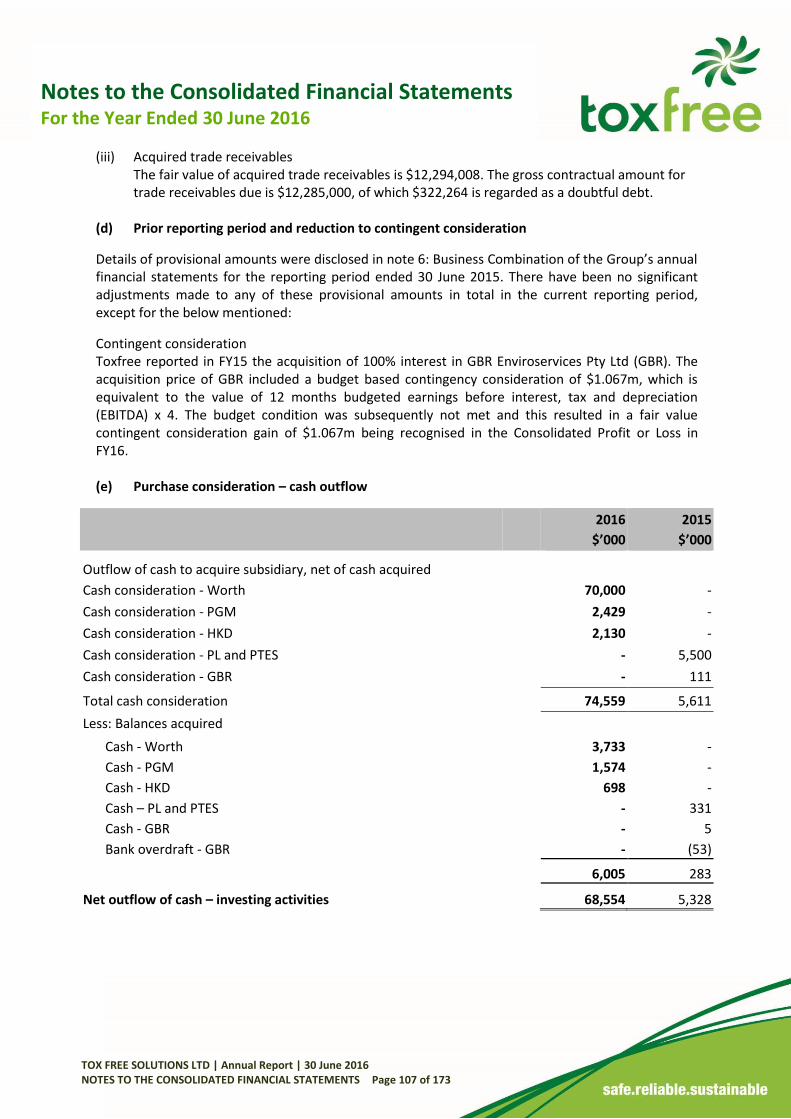
Notes to the Consolidated Financial Statements For the Year Ended 30 June 2016
TOX FREE SOLUTIONS LTD | Annual Report | 30 June 2016 NOTES TO THE CONSOLIDATED FINANCIAL STATEMENTS Page 107 of 173
(iii) Acquired trade receivables
The fair value of acquired trade receivables is $12,294,008. The gross contractual amount for trade receivables due is $12,285,000, of which $322,264 is regarded as a doubtful debt.
(d) Prior reporting period and reduction to contingent consideration
Details of provisional amounts were disclosed in note 6: Business Combination of the Group’s annual financial statements for the reporting period ended 30 June 2015. There have been no significant adjustments made to any of these provisional amounts in total in the current reporting period, except for the below mentioned:
Contingent consideration Toxfree reported in FY15 the acquisition of 100% interest in GBR Enviroservices Pty Ltd (GBR). The acquisition price of GBR included a budget based contingency consideration of $1.067m, which is equivalent to the value of 12 months budgeted earnings before interest, tax and depreciation (EBITDA) x 4. The budget condition was subsequently not met and this resulted in a fair value contingent consideration gain of $1.067m being recognised in the Consolidated Profit or Loss in FY16. (e) Purchase consideration – cash outflow
2016
$’000
2015
$’000
Outflow of cash to acquire subsidiary, net of cash acquired
Cash consideration - Worth 70,000 -
Cash consideration - PGM 2,429 -
Cash consideration - HKD 2,130 -
Cash consideration - PL and PTES - 5,500
Cash consideration - GBR - 111
Total cash consideration 74,559 5,611
Less: Balances acquired
Cash - Worth 3,733 -
Cash - PGM 1,574 -
Cash - HKD 698 -
Cash – PL and PTES - 331
Cash - GBR - 5
Bank overdraft - GBR - (53)
6,005 283
Net outflow of cash – investing activities 68,554 5,328

Notes to the Consolidated Financial Statements For the Year Ended 30 June 2016
TOX FREE SOLUTIONS LTD | Annual Report | 30 June 2016 NOTES TO THE CONSOLIDATED FINANCIAL STATEMENTS Page 108 of 173
5) Revenue
2016
$’000
2015
$’000
The Group derives the following types of revenue:
Sales revenue
Provision of services 393,380 407,278
393,380 407,278
Other Revenue:
Interest received 344 222
Rental income 1 32
345 254
Total Revenue 393,725 407,532
6) Other Income
Note
2016
$’000
2015
$’000
Other Income comprises the following items:
Other 216 501
Net gain - disposal of property, plant and equipment 279 -
Reduction to contingent consideration 4(d) 1,067 -
1,562 501

Notes to the Consolidated Financial Statements For the Year Ended 30 June 2016
TOX FREE SOLUTIONS LTD | Annual Report | 30 June 2016 NOTES TO THE CONSOLIDATED FINANCIAL STATEMENTS Page 109 of 173
7) Expenses Profit before income tax includes the following specific expenses:
2016
$’000
2015
$’000
Interest and finance charges paid/payable 4,599 4,860
Establishment and other fees 1,555 1,645
Total finance costs 6,154 6,505
Amortisation 1,914 2,073
Bad debts 227 440
Depreciation 31,594 29,655
Impairment losses and write-offs 3,658 -
Insurance and workers compensation costs 4,392 4,147
Labour costs 125,456 129,747
Motor vehicle expenses 20,870 22,192
Net loss - disposal of property, plant and equipment - 323
Hire of equipment and operating lease rental expenses 23,787 24,488
Share-based payments expense ^ 605 572
Superannuation contributions 8,478 8,986
Travel expenses 4,452 5,477
^ The valuation of Share-based payments involves making estimates and assumptions about the number of options and rights being issued. The issue of some options and rights are subject to the achievement of predetermined market and non-market performance conditions. If the non-market performance conditions are not met during the vesting period then the estimated number of share options and rights can be revised, reducing the share-based payment expense.

Notes to the Consolidated Financial Statements For the Year Ended 30 June 2016
TOX FREE SOLUTIONS LTD | Annual Report | 30 June 2016 NOTES TO THE CONSOLIDATED FINANCIAL STATEMENTS Page 110 of 173
8) Income Tax Expense
(a) The components of current income tax expense comprise:
2016
$’000
2015
$’000
Current tax expense
Current tax 6,693 7,572
Deferred tax 200 2,525
Adjustment to current tax expense - -
Over provision in prior years 96 157
6,989 10,254
Deferred income tax expense / (revenue) included in the income tax expense comprises:
Decrease in deferred tax assets 96 558 Increase in deferred tax liabilities 104 1,967
200 2,525
(b) Numerical reconciliation of income tax expense to prima facie tax payable:
2016
$’000
2015
$’000
Profit from continuing operations before income tax expense 20,043 32,248
Tax at the Australian tax rate of 30% (2015: 30%)
Consolidated Group 6,013 9,674
6,013 9,674
Add: Tax effect of:
Entertainment 56 79
Share-based payments 182 172
Other 286 189
6,537 10,114
Less: Tax effect of:
Adjustment for current tax of prior period 96 140
Deferred taxes: previously unrecognised - acquisitions 356 -
Income tax expense 6,989 10,254
The applicable weighted average effective tax rates are as follows: 35% 32%

Notes to the Consolidated Financial Statements For the Year Ended 30 June 2016
TOX FREE SOLUTIONS LTD | Annual Report | 30 June 2016 NOTES TO THE CONSOLIDATED FINANCIAL STATEMENTS Page 111 of 173
(c) Tax expense (income) relating to items of other comprehensive income
Note
2016
$’000
2015
$’000
Cash flow hedges 21 60 (230)
9) Cash and Cash Equivalents
(a) Reconciliation to cash at the end of the year The below figures are reconciled to cash at the end of the financial year as shown in the Consolidated Statement of Cash Flows as follows:
Current assets
2016
$’000
2015
$’000
Cash at Bank and in hand 31,952 19,709
Balance per Consolidated Statement of Cash Flows 31,952 19,709
(b) Risk exposure The Group’s exposure to interest rate risk is discussed in note 2. The maximum exposure to credit risk at the end of the reporting period is the carrying amount of each class of cash and cash equivalents mentioned above.
10) Trade and Other Receivables
Current assets Note
2016
$’000
2015
$’000
Trade receivables 76,895 60,623
Provision for impairment of receivables 10(a) (873) (264)
76,022 60,359 Other receivables – accrued revenue 7,358 24,901 Other sundry receivables 2,857 436 Prepayments 4,671 2,890
90,908 88,586
Due to the short-term nature of the current receivables, their carrying amounts are assumed to approximate their fair value.

Notes to the Consolidated Financial Statements For the Year Ended 30 June 2016
TOX FREE SOLUTIONS LTD | Annual Report | 30 June 2016 NOTES TO THE CONSOLIDATED FINANCIAL STATEMENTS Page 112 of 173
(a) Provision for impairment of receivables Movement in the Provision for impairment of receivables is as follows:
2016
$’000
2015
$’000
Balance at beginning of the year (264) (1,287)
Provision for impairment (836) -
Unused amount reversed - 583
Receivables written off during the year as uncollectible 227 440
Balance at end of the year (873) (264)
The creation and release of the Provision for Impaired Receivables has been included in Administrative expenses in the Consolidated Statement of Profit or Loss. Amounts charged to the allowance account are generally written off when there is no expectation of recovering additional cash.
(b) Credit risk - Trade and Other Receivables The following table details the Group’s Trade and Other Receivables exposure to credit risk (prior to collateral and other credit enhancements) with ageing analysis and impairment provided for thereon. Amounts are considered as ‘past due’ when the debt has not been settled within the terms and conditions agreed between the Group and the customer or counter-party to the transaction.
Receivables that are past due are assessed for impairment by ascertaining solvency of the debtors and are provided for where there is objective evidence indicating that the debt may not be fully repaid to the Group.
The balances of receivables that remain within initial trade terms (as detailed in the table) are considered to be of high credit quality.
Gross receivables
$’000
Past due and
impaired
$’000
< 30
$’000
31-60
$’000
61-90
$’000
> 90
$’000
2016
Trade receivables 76,895 (873) 50,576 20,115 3,225 2,979
2015
Trade receivables 60,623 (264) 36,468 17,998 3,822 2,335
The Group does not hold any financial assets with terms that have been renegotiated, but which would otherwise be past due or impaired.

Notes to the Consolidated Financial Statements For the Year Ended 30 June 2016
TOX FREE SOLUTIONS LTD | Annual Report | 30 June 2016 NOTES TO THE CONSOLIDATED FINANCIAL STATEMENTS Page 113 of 173
Impairment losses Based on historic default rates the Group believes that no general impairment allowance is necessary in respect of trade receivables not past due or past due up to 90 days. Amounts due from customers which are past due 91 days and over generally relate to customers who are traditional late payers but not an impairment risk. Where there is a specific customer related impairment risk then an impairment allowance is made against that customer receivable.
The credit quality of financial assets that are not past due or impaired are considered robust and all amounts deemed recoverable with no impairment issues noted by management.
The other classes of receivables do not contain impaired assets.
For additional information on the Group’s exposure to credit risk please refer to note 2.
11) Tax Assets and Tax Liabilities (a) Current tax liability
2016
$’000
2015
$’000
Current tax assets / (liabilities) 2,898 (542)
(b) Recognised deferred tax assets
Note
2016
$’000
2015
$’000
Deferred tax assets 11(d) 8,516 7,954
Deferred tax assets to be recovered within 12 months 6,639 6,379
Deferred tax assets after 12 months 1,877 1,575 (c) Recognised deferred tax liabilities
Note
2016
$’000
2015
$’000
Deferred tax liabilities 11(d) 8,143 6,366
Deferred tax liabilities to be recovered within 12 months 1,756 394 Deferred tax liabilities to be recovered after 12 months 6,387 5,972

Notes to the Consolidated Financial Statements For the Year Ended 30 June 2016
TOX FREE SOLUTIONS LTD | Annual Report | 30 June 2016 NOTES TO THE CONSOLIDATED FINANCIAL STATEMENTS Page 114 of 173
(d) Deferred tax assets and liabilities - consolidated
Note
Opening
Balance
$’000
Charged to
Provision
$’000
Charged to
Income
$’000
Business Acquisitions
$’000
Other
Compre-
hensive
Income
$’000
Closing Balance
$’000
Deferred tax assets
Provisions - employee benefits
2,791 - 113 451 - 3,355
Transaction costs on equity issue
311 (3) 26 - - 334
Borrowing costs 67 - (24) - - 43 Cash Flow Hedging Reserve
559 - - - (60) 499
Other 4,226 (3) (212) 274 - 4,285
Balance at 30 June 2016
11(b) 7,954 (6) (97) 725 (60) 8,516
PPE - Timing differences
184 10 (194) - - -
Provisions - employee benefits
2,460 - 170 161 - 2,791
Transaction costs on equity issue
589 (135) (143) - - 311
Borrowing costs 110 (19) (24) - - 67 Cash Flow Hedging Reserve
329 - - - 230 559
Other 4,495 25 (366) 72 - 4,226
Balance at 30 June 2015
8,167 (119) (557) 233 230 7,954
Deferred tax liabilities
PPE 5,972 545 670 - - 7,187 Other 394 - (566) 1,128 - 956
Balance at 30 June 2016
11(c) 6,366 545 104 1,128 - 8,143
PPE
2,090 1,887 1,769 226 - 5,972 Other 311 (116) 199 - - 394
Balance at 30 June 2015
2,401 1,771 1,968 226 - 6,366

Notes to the Consolidated Financial Statements For the Year Ended 30 June 2016
TOX FREE SOLUTIONS LTD | Annual Report | 30 June 2016 NOTES TO THE CONSOLIDATED FINANCIAL STATEMENTS Page 115 of 173
12) Inventories
Current assets
2016
$’000
2015
$’000
At cost:
Finished goods 472 241
Raw materials and consumables 112 241
Total Inventories 584 241
For accounting policy please refer to note 34(g).
13) Property, Plant and Equipment
Non-current assets
2016
$’000
2015
$’000
Plant and equipment
At cost 281,298 237,594
Accumulated depreciation (129,023) (106,868)
Total plant and equipment 152,275 130,726
Land, buildings and leasehold improvements
At cost 33,250 31,784
Accumulated depreciation (9,582) (9,024)
Total land, buildings and leasehold improvements 23,668 22,760
Total Property, Plant and Equipment 175,943 153,486
For accounting policy please refer to note 34(e).

Notes to the Consolidated Financial Statements For the Year Ended 30 June 2016
TOX FREE SOLUTIONS LTD | Annual Report | 30 June 2016 NOTES TO THE CONSOLIDATED FINANCIAL STATEMENTS Page 116 of 173
(a) Movements in carrying amounts Movement in the carrying amounts for each class of property, plant and equipment between the beginning and the end of the current financial year:
Plant and Equipment
$’000
Land, Buildings and Leasehold Improvements
$’000
Total
$’000
Balance at 30 June 2016
Balance - beginning of year 130,726 22,760 153,486
Additions 29,313 2,694 32,007
Additions - Business combinations 26,088 7,960 34,048
Disposals (1,003) (7,343) (8,346)
Impairments and write-offs (2,823) (835) (3,658)
Transfers and reclassifications (122) 122 -
Depreciation expense (29,904) (1,690) (31,594)
152,275 23,668 175,943
Balance at 30 June 2015
Balance - beginning of year 113,291 21,567 134,858
Additions 41,815 1,578 43,393
Additions - Business combinations 8,232 - 8,232
Disposals (3,342) - (3,342)
Transfers and reclassifications (1,422) 1,422 -
Depreciation expense (27,848) (1,807) (29,655)
130,726 22,760 153,486
(b) Leased assets The Group leases a number of vehicles under finance lease agreements and some leases provide the Group with the option to purchase the equipment at a beneficial price at the end of the lease term. The leased vehicles secure the lease obligations. (c) Assets in the course of construction The carrying amount of the assets disclosed above include $7,831M (2014: $3.527M) in relation to property, plant and equipment which is in the course of construction.

Notes to the Consolidated Financial Statements For the Year Ended 30 June 2016
TOX FREE SOLUTIONS LTD | Annual Report | 30 June 2016 NOTES TO THE CONSOLIDATED FINANCIAL STATEMENTS Page 117 of 173
14) Intangible Assets
Non-current assets
2016
$’000
2015
$’000
Goodwill
Cost 169,592 142,653
Net carrying value 169,592 142,653
Intellectual Property
Cost 3,325 3,325
Accumulated amortisation and impairments (2,766) (2,666)
Net carrying value 559 659
Business Licenses
Cost 3,878 3,878
Net carrying value 3,878 3,878
Customer Contracts and Relationships
Cost 15,196 11,436
Accumulated amortisation (9,052) (7,238)
Net carrying value 6,144 4,198
Total Intangibles 180,173 151,388
For accounting policy please refer to note 34(f).

Notes to the Consolidated Financial Statements For the Year Ended 30 June 2016
TOX FREE SOLUTIONS LTD | Annual Report | 30 June 2016 NOTES TO THE CONSOLIDATED FINANCIAL STATEMENTS Page 118 of 173
Intellectual Property
$’000
Customer Contracts
$’000
Business Licenses
$’000
Goodwill
$’000
Total
$’000
Year ended 30 June 2016
Balance - beginning of the year 659 4,198 3,878 142,653 151,388
Additions through business combinations - 3,760 - 27,018 30,778
Adjustments - - - (79) (79)
Amortisation (100) (1,814) - - (1,914)
Closing value at 30 June 2016 559 6,144 3,878 169,592 180,173
Intellectual Property
$’000
Customer Contracts
$’000
Business Licenses
$’000
Goodwill
$’000
Total
$’000
Year ended 30 June 2015
Balance - beginning of the year 759 5,503 3,878 139,432 149,572
Additions through business combinations - 668 - 3,221 3,889
Reclassification - - - - -
Amortisation and impairment (100) (1,973) - - (2,073)
Closing value at 30 June 2015 659 4,198 3,878 142,653 151,388
Intangible assets, other than Goodwill and Business Licenses have finite useful lives. The current amortisation charges for intangible assets are included under the amortisation expense in the Consolidated Income Statement. Goodwill and Business Licenses have an indefinite life and are not amortised; they are tested for indications of impairment on an annual basis.
(a) Impairment disclosures
The aggregate carrying amount of Intangibles allocated to the Group’s reportable segments is:
2016
$’000
2015
$’000
Technical and Environmental Services 76,457 60,260
Industrial Services 29,613 22,261
Waste Services 74,103 68,867
Total 180,173 151,388
For the purpose of impairment testing, intangibles are allocated to five (2015: five) cash-generating units (CGU). The CGU and aggregate carrying amounts are structured to fall in line with the Group operations, cash-flow, management and reporting changes.

Notes to the Consolidated Financial Statements For the Year Ended 30 June 2016
TOX FREE SOLUTIONS LTD | Annual Report | 30 June 2016 NOTES TO THE CONSOLIDATED FINANCIAL STATEMENTS Page 119 of 173
2016: The aggregate carrying amounts allocate to the five CGUs are:
2016
$’000
Waste Services – East (WSE) 44,494
Waste Services – West (WSW) 29,609
Industrial Services – East (ISE) 26,419
Industrial Services – West (ISW) 3,194
Technical and Environmental Services (TES) 76,457
Closing value at 30 June 2016 180,173
2015: The aggregate carrying amounts allocate to the seven CGUs are:
2015
$’000
Waste Services – East 45,273
Waste Services – West 23,594
Industrial Services – East 19,067
Industrial Services – West 3,194
Technical and Environmental Services 60,260
Closing value at 30 June 2015 151,388
The recoverable amount of each CGU is determined based on value-in-use calculations. Value-in-use calculations use cash flow projections based on financial budgets excluding growth initiatives, covering a projected five year period and then estimating a year five terminal value. The cash flows are discounted using a discount rate of 7% (2015: 7%). (b) Significant estimate: key assumptions used for value-in-use calculations
The following table sets out the key assumptions for CGU value-in-use calculations:
WSE WSW ISE ISW TES
FY17 – FY21 EBITDA (% annual growth rate) 3-12% nil 3-50% 3-23% 4-33%
Annual capital expenditure ($’000) 4,765 295 695 4,464 6,136
Management has determined the values assigned to each of the above key estimates as follows:
Assumption Approach used to determine values
EBITDA Based on past performance and management’s expectation for the future, excluding
any growth initiatives.
Annual Capital
Expenditure
Expected cash costs to maintain assets in current condition.

Notes to the Consolidated Financial Statements For the Year Ended 30 June 2016
TOX FREE SOLUTIONS LTD | Annual Report | 30 June 2016 NOTES TO THE CONSOLIDATED FINANCIAL STATEMENTS Page 120 of 173
(c) Sensitivity to change in assumptions
The Directors and management have considered and assessed reasonably possible changes to key assumptions that result in a change to the recoverable amount for each CGU. With regard to the assessment, management recognises that the actual time value of money may vary from the estimated and the discount rate used. Management note that the discount rate would have to increase by over 1% (2015: 1%) for any of the CGU recoverable amounts to fall below their carrying amount.
15) Trade and Other Payables
2016
$’000
2015
$’000
Current liabilities Trade payables 34,529 30,922 Other payables 18,675 15,529
53,204 46,451
Non-current liabilities
Government grants received 972 - Less: current portion included in other payables (47) -
925 -
Total trade and other payables 54,129 46,451
Information about the Group's exposure to liquidity risk is provided in Note 2.
16) Borrowings
Secured liabilities Note
2016
$’000
2015
$’000
Current liabilities
Bank cash advance facility ^ (290) 7,550 Lease liabilities 26 3,888 4,764
Current borrowings 3,598 12,314
Non-current liabilities
Bank cash advance facility ^ 125,862 79,788 Lease liabilities 26 4,393 8,415
Non-current borrowings 130,255 88,203
Total borrowings 133,853 100,517
^ Prepaid bank establishment costs of $677,938 (2015: $nil) have been offset against the bank cash advance facility liability. There is no contractual current portion payable on the cash advance facility.

Notes to the Consolidated Financial Statements For the Year Ended 30 June 2016
TOX FREE SOLUTIONS LTD | Annual Report | 30 June 2016 NOTES TO THE CONSOLIDATED FINANCIAL STATEMENTS Page 121 of 173
(a) Banking Security and Covenants The banking syndicated facility agreement is secured by certain Group company guarantees and in addition, the Group is required to operate within certain covenant ratios at each calculation date, i.e. a Net Debt to Earnings before Interest, Tax, Depreciation and Amortisation (EBITDA) Ratio (is not greater than 2.75:1) and a Fixed Charge Cover Ratio (in respect of the previous 12 month period is no less than 2:1). The Group has complied with these covenants throughout the reporting period. Lease liabilities are secured by the underlying leased assets. (b) Interest rate swap agreements The Cash Advance Facilities have been drawn as a source of long-term finance. They have a rolling maturity period within the facility. The Cash Advance Facilities bear interest at variable rates ranging from 2.64% to 2.81%, payable in arrears (2015: 2.79% to 3.01%). Per the terms and conditions of the new banking facility arrangement, from FY16 there is no longer a requirement to repay any current portion of the banking facilities (2015: $1.888m).
It is Group policy to protect part of the loans from exposure to increasing interest rates. Accordingly, the Group has entered into interest swap contracts under which it is obliged to receive interest at variable rates and to pay interest at fixed rates. Swaps currently in place cover 37% (2015: 58%) of the variable loan principal outstanding. The contracts require settlement of net interest receivable or payable each 30 days. The settlement dates coincide with the dates on which interest is payable on the underlying debt. The contracts are settled on a net basis.
For additional information of the swaps please refer to note 19 “Derivative Financial Instruments.”
The Group's exposure to interest rate and liquidity risk is detailed in note 2.
(c) Finance leases Finance lease liabilities are financed at fixed interest rates. The average fixed interest rate for the 2016 financial year was approximately 6.13% (2015: 6.5%). Estimated monthly repayments including finance charges for the next financial year are $356,000 (2015: $456,000).
(d) Defaults and breaches During the current and prior year, there were no defaults or breaches on any of the loans.
(e) Fair value The carrying amounts and fair values of borrowings at the end of the reporting period are disclosed in note 2.

Notes to the Consolidated Financial Statements For the Year Ended 30 June 2016
TOX FREE SOLUTIONS LTD | Annual Report | 30 June 2016 NOTES TO THE CONSOLIDATED FINANCIAL STATEMENTS Page 122 of 173
(f) Bank loan facilities utilised / available
2016
$’000 2015
$’000
Total loan facilities 190,000 148,338
Loan facilities - utilised (140,580) (107,189)
Loan facilities - available 49,420 41,149
The Group has access to an interchangeable facility from its bankers. The purpose of the facility is to assist with acquisitions, purchasing and leasing of assets and for general operating requirements. Finance will be provided under all facilities provided the Group has not breached any borrowing requirements and the required financial ratios are met. Please refer to note 16(a) above, for additional information on banking covenants.
17) Employee Benefits
2016
$’000 2015
$’000
Current liabilities
Annual and long service leave 10,346 8,487
Amounts not expected to be settled within the next 12 months
Leave obligations expected to be settled after 12 months 3,985 2,555
The current provision for employee benefits includes accrued annual and long-service leave. For long-service leave it covers all unconditional entitlements where employees have completed the required period of service and also those where employees are entitled to pro-rata payments. The entire amount of the provision of $10.346M (2015: $8.487M) is presented as current since the Group does not have an unconditional right to defer settlement. The amounts reflect leave that is not expected to be taken or paid within the next 12 months.

Notes to the Consolidated Financial Statements For the Year Ended 30 June 2016
TOX FREE SOLUTIONS LTD | Annual Report | 30 June 2016 NOTES TO THE CONSOLIDATED FINANCIAL STATEMENTS Page 123 of 173
18) Provisions
Current liabilities
2016
$’000
2015
$’000
Site testing and remediation - 28
Waste destruction 6,477 6,374
6,477 6,402
Waste Destruction Management have provided for the estimated costs to process, transport and dispose of various legacy waste streams. All waste is sorted and quantities determined as soon as received so the customers can be billed appropriately and the revenue recognised. The waste is then grouped according to its end destination and then further broken down into waste type. The value attributed to the waste is a combination of the internal processing costs, made up of labour, as well as the cost to transport the waste to its end destination and the cost to treat the waste by the receiver at that end destination. This could be an external supplier or another Toxfree facility. Waste treated in Toxfree facilities is carried at the standard processing cost attributed to that category of waste. Standard processing costs are set annually but are continuously re-evaluated during the year to pick up cost differentials. At each quarter, a full stocktake is conducted to measure waste on hand, and actual costs to remediate are recalculated. Any difference between the carrying value of the waste and that of the provision is charged to profit or loss. The total of the quantity on hand and the cost to remediate that category of waste represents the value of the provision for Waste Destruction.

Notes to the Consolidated Financial Statements For the Year Ended 30 June 2016
TOX FREE SOLUTIONS LTD | Annual Report | 30 June 2016 NOTES TO THE CONSOLIDATED FINANCIAL STATEMENTS Page 124 of 173
19) Derivative Financial Instruments
2016
$’000
2015
$’000
Current liability
Interest rate swap contracts – cash flow hedges - -
Long-term liability
Interest rate swap contracts – cash flow hedges 1,663 1,864
1,663 1,864
Instruments used by the Group The Group is party to derivative financial instruments in the normal course of business in order to hedge exposure to fluctuations in interest rates in accordance with the Group’s financial risk management policies (refer to note 2).
Interest rate swap contracts – cash flow hedges Bank loans of the Group currently bear an average variable interest rate of 2.72% (2015: 2.85%). It is policy to protect part of the loans from exposure to increasing interest rates. Accordingly, the Group has entered into interest rate swap contracts under which it is obliged to receive interest at variable rates and to pay interest at fixed rates.
Details of interest rate swaps as at 30 June 2016 are as follows:
1. $36,250,000 hedging instrument The interest cash flows under an “in arrears” bullet interest rate swap with a notional value of AUD $36,250,000.
Counterparty
Notional
Value - Start
Notional Value
- Maturity
Fixed
Rate
Floating Rate
Basis Start Date Maturity Date
ANZ $36,250,000 $22,000,000 3.97% 1 month BBSY 13 May 2013 10 April 2018
The notional amount at 30 June 2016 was $27,250,000 (2015: $30,250,000). 2. $20,000,000 hedging instrument The interest cash flows under an “in arrears” bullet interest rate swap with a notional value of AUD $20,000,000.
Counterparty
Notional
Value - Start
Notional Value
- Maturity
Fixed
Rate
Floating Rate
Basis Start Date Maturity Date
ANZ $20,000,000 $20,000,000 3.27% 1 month BBSY 18 May 2015 17 May 2018

Notes to the Consolidated Financial Statements For the Year Ended 30 June 2016
TOX FREE SOLUTIONS LTD | Annual Report | 30 June 2016 NOTES TO THE CONSOLIDATED FINANCIAL STATEMENTS Page 125 of 173
The notional amount at 30 June 2016 was $20,000,000 (2015: $20,000,000).
The Swaps in place currently cover over 37% (2015: 58%) of the variable loan principal outstanding. The contracts require settlement of net interest receivable or payable each 30 days. The settlement dates primarily coincide with the dates on which interest is payable on the underlying debt. The contracts are settled on a net basis.
The effective portion of changes in the fair value of derivatives that are designated and qualify as cash flow hedges is recognised in Other Comprehensive Income and Accumulated in Reserves in Equity. The gain or loss relating to the ineffective portion is recognised immediately in profit or loss within Other income or Other expenses.
There was no hedge ineffectiveness in the current year.
During the year, the following gains / (losses) were recognised in profit or loss and other comprehensive income in relation to the interest rate swaps:
Note
2016
$’000
2015
$’000
Net gain / (loss) recognised in other comprehensive income 21 141 (536)
Gains reclassified from other comprehensive income to profit or loss - -
For accounting policy refer to note 34(r).
Risk exposures and fair value measurements Information about the Group’s exposure to interest rate risk and about the methods and assumptions used in determining fair values is provided in note 2.
20) Contributed Equity
2016 2015 2016 2015 Notes Shares Shares $’000 $’000
(a) Share capital Ordinary shares Fully paid (c) 143,919,669 134,013,376 195,457 170,900
(b) Other equity securities Treasury shares – Tox Free Employee Share Trust (d) - (6,536) - (15)
Total contributed equity 143,919,669 134,006,840 195,457 170,885

Notes to the Consolidated Financial Statements For the Year Ended 30 June 2016
TOX FREE SOLUTIONS LTD | Annual Report | 30 June 2016 NOTES TO THE CONSOLIDATED FINANCIAL STATEMENTS Page 126 of 173
(c) Movements in Ordinary Share Capital
2016 2015 2016 2015
Date Details Notes Number Number $’000 $’000
On issue at 1 July 134,013,376 133,752,359 170,900 170,885
Movements:
05/09/2014 Settlement of vested executive rights - - - (760)
26/03/2015 Dividend reinvestment plan issue (e) - 197,525 - 575
27/05/2015 500,000 cashless share options exercised at $2.75 - 63,492 - 200
26/08/2015 Settlement of vested executive rights (d) - - (180) -
29/09/2015 Dividend reinvestment plan issue (e) 353,910 - 952 -
29/03/2016 Dividend reinvestment plan issue (e) 139,079 - 342 -
29/03/2016 7,843,137 Share placement @ $2.55 7,843,137 - 20,000 -
29/04/2016 1,570,167 Share purchase plan @ $2.55 1,570,167 - 4,003 -
30/06/2016 Capital raising transaction costs during the year - - (800) -
30/06/2016 Deferred tax asset on transaction costs - - 240 -
On issue at 30 June 143,919,669 134,013,376 195,457 170,900
The holders of ordinary shares are entitled to participate in dividends and the proceeds on winding up of the Group. One a show of hands at meetings of the of the Group, each holder of ordinary shares has one vote in person or by proxy, and upon a poll each share is entitled to one vote.

Notes to the Consolidated Financial Statements For the Year Ended 30 June 2016
TOX FREE SOLUTIONS LTD | Annual Report | 30 June 2016 NOTES TO THE CONSOLIDATED FINANCIAL STATEMENTS Page 127 of 173
(d) Treasury Shares – Toxfree Employee Share Trust
Number Details of shares $’000 Opening balance 1 July 2015 (6,536) (15) Acquisition of shares (average share price $2.63 per share) (62,756) (165) Executive LTI Plan issue 69,292 180
Closing balance 30 June 2016 - -
(e) Dividend Reinvestment Plan
The Company has established a dividend reinvestment plan under which holders of ordinary shares may elect to have all or part of their dividend entitlements satisfied by the issue of new ordinary shares rather than by being paid in cash. Shares are issued under the plan at no discount to the market price. (f) Employee Share Schemes Information relating to Toxfree employee share schemes is set out in note 24 Share-based payment. (g) Options and Rights
(i) Information relating to Options and Rights granted, exercised and lapsed during the financial year and the Options and Rights outstanding at the end of the financial year, is set out in note 24 “Share-based payments”.
(ii) Information relating to Options and Rights granted to Key Management Personnel during the financial year, please refer to the Remuneration Report.
(h) Capital Management
Management controls the capital of the Group in order to ensure the entity continues as a going concern as well as to maintain optimal returns to Shareholders and benefits for other Stakeholders and to maintain an optimal capital structure to reduce the cost of capital. The Group monitors capital through the gearing ratio. This ratio is calculated as finance debt divided by EBITDA for the previous 12 months. During 2016, the Group’s strategy was to maintain a gearing ratio of no greater than 2.75 times (2015: 2.75 times) EBITDA.
Consolidated 2016 2015
Note $’000 $’000 Finance debt 16 134,531 ^ 100,517 EBITDA 59,705 70,481 Gearing ratio 2.25 times 1.43 times
^ excludes prepaid establishment costs
There have been no significant changes in the strategy adopted by management during the year.

Notes to the Consolidated Financial Statements For the Year Ended 30 June 2016
TOX FREE SOLUTIONS LTD | Annual Report | 30 June 2016 NOTES TO THE CONSOLIDATED FINANCIAL STATEMENTS Page 128 of 173
21) Other Reserves and Retained Earnings
(a) Other Reserves
2016
$’000
2015
$’000
Share-based Payment Reserve 7,538 7,155
Cash Flow Hedging Reserve (1,164) (1,305)
Equity Reserve (1,687) (1,474)
4,687 4,376
Share-Based Payments Reserve
2016
$’000
2015
$’000
Opening balance 7,155 7,145
Share- based payments expense – current year 605 572
Transfers to contributed equity - (200)
Transfers to retained earnings (222) (362)
Closing balance 7,538 7,155
The Share-Based Payments Reserve is used to recognise the grant date fair value of Options and Rights issued to employees but not exercised.
Cash Flow Hedging Reserve
2016
$’000
2015
$’000
Opening balance (1,305) (769)
Revaluation - gross 201 (766)
Deferred tax (60) 230
Closing balance (1,164) (1,305)
The Cash Flow Hedging Reserve is used to record gains and losses on hedging instruments in a cash flow hedge that are recognised in other comprehensive income; as described in note 34(r). Amounts are reclassified to profit or loss when the associated hedge transaction affects profit or loss.
Equity Reserve
2016
$’000
2015
$’000
Opening balance (1,474) -
Transactions with non-controlling interests (213) (1,474)
Closing balance (1,687) (1,474)
The Equity Reserve represents a change in ownership interest, being the difference between the amount by which the non-controlling interest is adjusted and the fair value of the consideration paid. Refer to accounting policy 34(c)(iv) for additional details.

Notes to the Consolidated Financial Statements For the Year Ended 30 June 2016
TOX FREE SOLUTIONS LTD | Annual Report | 30 June 2016 NOTES TO THE CONSOLIDATED FINANCIAL STATEMENTS Page 129 of 173
(b) Retained Earnings
2016
$’000
2015
$’000
Opening balance 72,488 59,721
Profit for the year 12,608 21,768
Transfers from share-based payments reserve 222 362
Dividends (12,078) (9,363)
Closing balance 73,240 72,488
22) Dividends
Dividends provided for or paid
2016
$’000
2015
$’000
The following dividends were declared and paid:
Final ordinary dividend for the year ended 30 June 2015 of 4.5 cents (2014: 3 cents) per share 6,031 4,013
Interim ordinary dividend for the year ended 30 June 2016 of 4.5 cents (2015: 4 cents) per share 6,047 5,350
Total dividends provided for or paid 12,078 9,363
Dividends paid in cash or satisfied by the issue of shares under the dividend reinvestment plan during the years ended 30 June 2016 and 30 June 2015 were as follows:
Paid in cash 10,784 8,788
Satisfied by the issue of shares – dividend reinvestment plan 1,294 575
12,078 9,363
Franked dividends declared or paid during the year were franked at the tax rate of 30%.
Proposed dividends
2016
$’000
2015
$’000
Proposed final 2016 fully franked ordinary dividend of 4.5 cents (2015: 4.5 cents) per share to be paid on 29 September 2016 6,476 6,031
The proposed final dividend for 2016 was declared after the end of the reporting period and therefore has not been provided for in the financial statements. There are no income tax consequences arising from this dividend at 30 June 2016.
Franking account
2016
$’000
2015
$’000
30 June:
Franking credits available for subsequent financial years at a tax rate of 30% 33,283 31,529

Notes to the Consolidated Financial Statements For the Year Ended 30 June 2016
TOX FREE SOLUTIONS LTD | Annual Report | 30 June 2016 NOTES TO THE CONSOLIDATED FINANCIAL STATEMENTS Page 130 of 173
The above available balance is based on the dividend franking account at year-end adjusted for:
(a) Franking credits that will arise from the payment of the current tax liabilities;
(b) Franking debits that will arise from the payment of dividends recognised as a liability at the year-end;
(c) Franking credits that will arise from the receipt of dividends recognised as receivables at the end of the year.
The impact on the franking credit of the dividends proposed after the end of the reporting period is to reduce it by $2.776M (2015 $2.585M).
The ability to use the franking credits is dependent upon the entity's future ability to declare dividends.
23) Cash Flow Information (a) Reconciliation of profit after income tax to net cash inflow from operating activities
2016
$’000
2015
$’000
Profit for the year 13,054 21,994
Cash flows excluded from profit attributable to operating activities
Non-cash flows in profit:
- gain on equity interest - (258)
- reversal of contingent consideration (1,067) -
- amortisation 1,914 2,073
- bad and doubtful debts 433 (8)
- depreciation 31,594 29,655
- net (gain) / loss on disposal of property, plant and equipment (279) 323
-impairment losses and write-offs 3,658 -
- share-based payments transactions 605 572
Changes in assets and liabilities, net of the effects of purchase and disposal of subsidiaries:
- decrease / (increase) in trade and other receivables 13,623 (3,595)
- (increase) / decrease in inventories (8) 55
- (decrease) / increase in trade and other payables (2,190) 6,301
- (increase) / decrease in net tax assets (2,089) 3,900
- (decrease)/increase in provisions (212) (67)
Net cash inflow from operating activities 59,036 60,945

Notes to the Consolidated Financial Statements For the Year Ended 30 June 2016
TOX FREE SOLUTIONS LTD | Annual Report | 30 June 2016 NOTES TO THE CONSOLIDATED FINANCIAL STATEMENTS Page 131 of 173
(b) Non-cash Financing and Investing Activities
2016 2015 $’000 $’000
Acquisition of property, plant and equipment by means of finance lease
-
(1,096)
Issue of shares – dividend reinvestment plan 1,294 575
1,294 (521)
24) Share-based Payment
At 30 June 2016, the Group has the following share-based payment schemes: I. Tox Free Employee Share Option Program (ESOP) The ESOP was designed as an incentive for Executives to deliver long-term Shareholder returns. Under the plan, Executives are entitled to purchase shares in the Company. Participation in the program is at the Board's discretion and no individual has a contractual right to participate in the plan or to receive any guaranteed benefits.
The Options vest on a time scale basis as specified in the ESOP and is granted for no consideration. Options granted under the plan carry no dividend or voting rights. When exercisable, each option is converted into one ordinary share. The maximum term of an option is 5 years from grant date and options are settled in cash. No Options were granted to Executives during the financial year under review. II. Tox Free Executive Long-Term Incentive (LTI) Plan On 24 November 2011, the Shareholders approved the adoption of an additional LTI Plan that provides the Board with the discretion to grant Performance Rights (PR) and/or Share Appreciation Rights (SAR) to Executives that will vest subject to the satisfaction of performance hurdles i.e. Earnings per Share (EPS) and Total Shareholder Return (TSR) performance. The LTI Plan grants will vest subject to satisfaction of TSR (50% of the grant value) and EPS (50% of the grant value) performance hurdles. These performance hurdles are mutually exclusive so that if only one of the hurdles is satisfied, vesting will still occur for that portion of the grant but not the other if the other hurdle is not met. EPS performance will be assessed against compound annual growth rate targets set by the Board. The target set for LTI Plan grants is currently 10% compound average growth rate. If the compound average growth rate over the 3-year performance period is 10% or greater, the grant will become 100% performance qualified. Performance vesting is staggered; however no rights will vest for less than 5% compound annual growth over the 3-year performance period.

Notes to the Consolidated Financial Statements For the Year Ended 30 June 2016
TOX FREE SOLUTIONS LTD | Annual Report | 30 June 2016 NOTES TO THE CONSOLIDATED FINANCIAL STATEMENTS Page 132 of 173
TSR performance of the Group is measured against selected Companies on the ASX 300. The minimum award is at the 50th percentile (50% vests) and it increments up to the 75th percentile, at which point, or above, 100% vests. The value of Rights that an executive is entitled to receive per annum is set at a fixed percentage of their annual fixed remuneration and ranges from 25% to 60% depending their executive level and seniority.
The LTI Plan is administered by the Tox Free Solutions Employee Share Trust (Trust). The Trust is consolidated in accordance with note 34(c). Shares issued by the Trust to the employees are acquired on-market prior to the issue. Shares held by the Trust and not yet issued to employees at the end of the reporting period are shown as Treasury shares in the financial statements. Please refer to note 20(d). Equity instruments granted as a result of exercise of Rights:
Details 2016 2015 Number of shares issued under the Plan to participating employees
69,292
271,580
Please refer to the Remuneration Report for additional information.

Notes to the Consolidated Financial Statements For the Year Ended 30 June 2016
TOX FREE SOLUTIONS LTD | Annual Report | 30 June 2016 NOTES TO THE CONSOLIDATED FINANCIAL STATEMENTS Page 133 of 173
(a) Options At 30 June 2016, a summary of the Group Options issued and not exercised are as follows. Options are settled by the physical delivery of shares:
2016
Grant Date
Vesting date Expiry Date Exercise
price Start of the
year Granted during the
year
Exercised during the
year
Forfeited / Expired during
the year Balance at the end of the year
Vested and exercisable at the end of the
year
26/02/2010 26/02/2010 15/01/2016 $2.39 20,000 - - (20,000) - -
23/11/2010 01/09/2013 01/11/2016 $3.00 500,000 - - - 500,000 500,000
Total 520,000 - - (20,000) 500,000 500,000
During the year ended 30 June 2016, 20,000 (2015: 20,000) options expired. The weighted average remaining contractual life of options outstanding at year end was 0.34 years (2015: 1.31 years). The weighted average exercise price of outstanding shares at the end of the reporting period was $3.00 (2015: $2.98). The fair value of the options granted to employees is deemed to represent the value of the employee services received over the vesting period. No options were granted to employees during the year (2015: Nil).

Notes to the Consolidated Financial Statements For the Year Ended 30 June 2016
TOX FREE SOLUTIONS LTD | Annual Report | 30 June 2016 NOTES TO THE CONSOLIDATED FINANCIAL STATEMENTS Page 134 of 173
At 30 June 2015, a summary of the Group options issued and not exercised are as follows:
2015
Grant Date
Vesting date Expiry Date Exercise
price Start of the
year Granted during the
year
Exercised during the
year
Forfeited / Expired during
the year Balance at the end of the year
Vested and exercisable at the end of the
year
26/02/2010 26/02/2010 15/01/2015 $2.64 20,000 - - (20,000) - -
26/02/2010 26/02/2010 15/01/2016 $2.39 20,000 - - - 20,000 20,000
23/11/2010 01/09/2012 01/11/2015 $2.75 500,000 - (500,000) - - -
23/11/2010 01/09/2013 01/11/2016 $3.00 500,000 - - - 500,000 500,000
Total 1,040,000 - (500,000) (20,000) 520,000 520,000

Notes to the Consolidated Financial Statements For the Year Ended 30 June 2016
TOX FREE SOLUTIONS LTD | Annual Report | 30 June 2016 NOTES TO THE CONSOLIDATED FINANCIAL STATEMENTS Page 135 of 173
(b) Rights
At 30 June 2016, a summary of the Group’s Performance Rights (PR) issued and not exercised are as follows:
Grant Date End of performance
period Tranche Start of year Granted
during year Exercised during
year
Forfeited during the
year ^
Balance at end of
year
Vested and exercisable at the end of the
year
3 October 2012 30 June 2015 2 21,549 - (21,549) - - - 14 November 2012 30 June 2015 2 16,196 - (16,196) - - -
1 July 2013 30 June 2016 1 68,665 - - (68,665) - - 1 July 2013 30 June 2016 2 113,263 - - (113,263) - - 1 July 2014 30 June 2017 1 83,033 - - 83,033 - 1 July 2014 30 June 2017 2 129,841 - - 129,841 - 1 July 2015 30 June 2018 1 - 105,102 - - 105,102 - 1 July 2015 30 June 2018 2 - 163,111 - 163,111 -
Total 432,547 268,213 (37,745) (181,928) 481,087 -
^ FY14 grant - forfeited: EPS and TSR performance conditions were not met at the end of the performance period i.e. 30 June 2016.
Each PR represents a right to be issued one ordinary share at the end of the performance period. No exercise price will be payable and the applicable performance hurdles must be met in order to be eligible to receive the shares. The PR grants will vest subject to satisfaction of TSR (50% of the grant) and the EPS (50% of the grant). These performance hurdles are mutually exclusive so that if only one of the hurdles is satisfied, vesting will still occur for that portion of the grant but not the other if the other hurdle is not met.
During the year ended 30 June 2016, 268,213 (2015: 212,874) PR were granted and 181,928 (2015: 64,109) PR were forfeited. The weighted average remaining contractual life of PR outstanding at year end was 3.56 years (2015: 3.43 years). The Rights expire 5 years after the grant date.

Notes to the Consolidated Financial Statements For the Year Ended 30 June 2016
TOX FREE SOLUTIONS LTD | Annual Report | 30 June 2016 NOTES TO THE CONSOLIDATED FINANCIAL STATEMENTS Page 136 of 173
At 30 June 2015, a summary of the Group’s Performance Rights (PR) issued and not exercised are as follows:
Grant Date End of performance
period Tranche Start of year Granted
during year Exercised during
year
Forfeited during the
year
Balance at end of
year
Vested and exercisable at the end of the
year€
24 November 2011 30 June 2014 1 44,843 - (44,843) - - - 24 November 2011 30 June 2014 2 59,595 - (59,595) - - - 3 October 2012 30 June 2015 1€ 22,093 - - (22,093) - - 3 October 2012 30 June 2015 2€ 34,756 - - (13,207) 21,549 21,549 14 November 2012 30 June 2015 1€ 18,882 - - (18,882) - - 14 November 2012 30 June 2015 2€ 26,123 - - (9,927) 16,196 16,196 1 July 2013 30 June 2016 1 68,665 - - - 68,665 - 1 July 2013 30 June 2016 2 113,263 - - - 113,263 - 1 July 2014 30 June 2017 1 - 83,033 - 83,033 - 1 July 2014 30 June 2017 2 - 129,841 - 129,841 -
Total 388,220 212,874 (104,438) (64,109) 432,547 37,745
€ EPS performance condition (tranche 1) >10% compound annual growth rate target over the 3 year performance period not met. Vesting % = nil. TSR performance condition (tranche 2) only partially met. TSR outcome was at the 56th percentile in the Peer Group – 62% of the rights allocation will vest.

Notes to the Consolidated Financial Statements For the Year Ended 30 June 2016
TOX FREE SOLUTIONS LTD | Annual Report | 30 June 2016 NOTES TO THE CONSOLIDATED FINANCIAL STATEMENTS Page 137 of 173
At 30 June 2016, a summary of the Group’s Share Appreciation Rights (SAR) issued and not exercised are as follows:
Grant Date
End of performance
period Tranche Start of
year
Granted during year
Exercised during year
Forfeited during the
year ^ Balance at end of
year Vested and exercisable at the end of the year
3 October 2012 30 June 2015 2 73,625 - (73,625) - - - 14 November 2012 30 June 2015 2 58,533 - (58,533) - - -
1 July 2013 30 June 2016 1 348,776 - - (348,776) - - 1 July 2013 30 June 2016 2 372,424 - - (372,424) - - 1 July 2014 30 June 2017 1 481,591 - - - 481,591 - 1 July 2014 30 June 2017 2 509,375 - - - 509,375 - 1 July 2015 30 June 2018 1 - 648,900 - 648,900 - 1 July 2015 30 June 2018 2 - 694,172 - 694,172 -
Total 1,844,324 1,343,072 (132,158) (721,200) 2,334,038 -
^ FY14 grant - forfeited: EPS and TSR performance conditions were not met at the end of the performance period i.e. 30 June 2016.
Each SAR represents a right to receive a payment equal to the positive difference between the share price at grant date and the share price at vesting date. The total value of all SAR on vesting date will be settled via the provision of shares of an equivalent value payable and the applicable performance hurdles must be met in order to be eligible to receive the shares. The SAR grants will vest subject to satisfaction of TSR (50% of the grant) and EPS (50% of the grant). These performance hurdles are mutually exclusive so that if only one of the hurdles is satisfied, vesting will still occur for that portion of the grant but not the other if the other hurdle is not met.
During the year ended 30 June 2016, 1,343,072 (2015: 990,966) SAR were granted and 721,200 (2015: 286,208) SAR were forfeited. The weighted average remaining contractual life of SAR outstanding at year end was 3.58 years (2015: 3.49 years). The Rights expire 5 years after the grant date.

Notes to the Consolidated Financial Statements For the Year Ended 30 June 2016
TOX FREE SOLUTIONS LTD | Annual Report | 30 June 2016 NOTES TO THE CONSOLIDATED FINANCIAL STATEMENTS Page 138 of 173
At 30 June 2015, a summary of the Group’s Share Appreciation Rights (SAR) issued and not exercised are as follows:
Grant Date
End of performance
period Tranche Start of
year
Granted during year
Exercised during year
Forfeited during the
year Balance at end of
year Vested and exercisable at the end of the year€
24 November 2011 30 June 2014 1 215,675 - (215,675) - - - 24 November 2011 30 June 2014 2 232,265 - (232,265) - - - 3 October 2012 30 June 2015 1€ 114,000 - - (114,000) - - 3 October 2012 30 June 2015 2€ 118,750 - - (45,125) 73,625 73,625 14 November 2012 30 June 2015 1€ 91,208 - - (91,208) - - 14 November 2012 30 June 2015 2€ 94,408 - - (35,875) 58,533 58,533 1 July 2013 30 June 2016 1 348,776 - - - 348,776 - 1 July 2013 30 June 2016 2 372,424 - - - 372,424 - 1 July 2014 30 June 2017 1 - 481,591 - - 481,591 - 1 July 2014 30 June 2017 2 - 509,375 - - 509,375 -
Total 1,587,506 990,966 (447,940) (286,208) 1,844,324 132,158
€ EPS performance condition (tranche 1) >10% compound annual growth rate target over the 3 year performance period not met. Vesting % = nil. TSR performance condition (tranche 2) only partially met. TSR outcome was at the 56th percentile in the Peer Group – 62% of the rights allocation will vest.

Notes to the Consolidated Financial Statements For the Year Ended 30 June 2016
TOX FREE SOLUTIONS LTD | Annual Report | 30 June 2016 NOTES TO THE CONSOLIDATED FINANCIAL STATEMENTS Page 139 of 173
Details of Rights issued for the year ended 30 June 2016 are as follows: On 1 July 2015, 268,213 Performance Rights and 1,343,072 Share Appreciation Rights were granted to Key Management Personnel and to Senior Management under the Executive LTI Plan. The rights vest on 30 June 2018. Specific disclosure details of the 1 July 2015 grant are as follows:
Details
Performance Rights Granted
Share
Appreciation Rights Granted
Total
Value of Rights Granted ($)
Directors S Gostlow^ 77,231 386,732 463,963 343,800 KMP E Goodwin 50,993 255,346 306,339 227,000 M Constable 23,452 117,437 140,889 104,400 J Dixon 23,452 117,437 140,889 104,400 S Bagshawe 13,759 68,899 82,658 61,250 J Bovell 15,163 75,929 91,092 67,500 Senior Management 64,163 321,292 385,455 285,625
268,213 1,343,072 1,611,285 1,193,975
^ The grant to Mr S Gostlow was approved by the shareholders at the Annual General Meeting held on 20 November 2015. The above grants made under the Executive LTI Plan will vest subject to the satisfaction of Relative Total Shareholder Return (TSR) (50% of the grant) and Absolute Earnings Per Share (EPS) (50% of the grant) hurdles. These performance hurdles are mutually exclusive so that if only one of the hurdles is satisfied, vesting will still occur for that portion of the grant but not the other if that other hurdle is not met. The valuation of the Rights is based on an adjusted form of the Black Scholes Option Pricing Model (BSM) that includes a Monte Carlo Simulation model to value the TSR right. The Monte Carlo model has been modified to incorporate an estimate of the probability of achieving the TSR hurdle and the number of associated Rights vesting. The fair market value of the Rights at valuation date is as follows:
Fair Market Value
Tranche 1
PR (EPS)
$
Tranche 2
PR(TSR)
$
Tranche 1
SAR (EPS)
$
Tranche 2
SAR (TSR)
$
Grant – 1 July 2015 2.84 1.83 0.46 0.43

Notes to the Consolidated Financial Statements For the Year Ended 30 June 2016
TOX FREE SOLUTIONS LTD | Annual Report | 30 June 2016 NOTES TO THE CONSOLIDATED FINANCIAL STATEMENTS Page 140 of 173
Key valuation assumptions made at grant date are summarised below:
Key value assumptions 1 July 2015
Share price $3.06 Effective exercise price (SAR only) $3.09 Annualised volatility (midpoint) 25.0% Annual dividend yield 2.50% Risk free rate 2.04% (a) Expenses arising from Share-based payments transactions:
2016
$’000
2015
$’000
Performance Rights 522 397
Share Appreciation Rights 522 397
Reversal of unvested non-market related performance rights (439) (222)
605 572
25) Parent entity financial information
The financial information for Tox Free Solutions Limited has been extracted from the books and records of the parent and has been prepared on the same basis as the consolidated financial statements except as described below:
Investments in subsidiaries, associates and joint ventures Investments in subsidiaries, associates and joint venture entities are accounted for at cost in the financial statements of the parent entity. Dividends received from associates are recognised in the parent entity profit or loss, rather than being deducted from the carrying amount of these investments.
Tax consolidation legislation Tox Free Solutions Limited and its wholly-owned Australian subsidiaries have formed an income tax consolidated Group.
Each entity in the tax consolidated Group accounts for their own current and deferred tax amounts. These tax amounts are measured using the ‘stand-alone taxpayer’ approach to allocation.
Current tax liabilities (assets) and deferred tax assets arising from unused tax losses and tax credits in the subsidiaries are immediately transferred to the parent entity.
The tax consolidated Group has entered into a tax funding agreement whereby each entity within the Group contributes to the income tax payable by the Group in proportion to their contribution to the Group’s taxable income. Differences between the amounts of net tax assets and liabilities derecognised and the net amounts recognised pursuant to the funding agreement are recognised as either a contribution by, or distribution to the parent entity.

Notes to the Consolidated Financial Statements For the Year Ended 30 June 2016
TOX FREE SOLUTIONS LTD | Annual Report | 30 June 2016 NOTES TO THE CONSOLIDATED FINANCIAL STATEMENTS Page 141 of 173
Guarantees entered into by the parent entity Tox Free Solutions Limited has provided bank guarantees of $5.94M (2015: $5.99M). Please refer to note 29 for additional information. Tox Free Solutions Limited is a party to a deed of cross-guarantee. Please refer to note 32 for additional information. Contingent liabilities of the parent entity Tox Free Solutions Limited did not have any contingent liabilities as at 30 June 2016. Please refer to note 29 for details of Group contingencies. Capital expenditure commitments of the parent entity As at 30 June 2016, the parent entity had no contractual commitments for the acquisition of property, plant or equipment. Please refer to Note 26 for additional information on Group Commitments. The individual statements for the parent entity show the following aggregate amounts:
Balance Sheet
2016
$’000
2015
$,000
Current assets 17,599 24,645
Non-current assets 352,057 325,109
Total assets 369,656 349,754
Current liabilities 3,812 13,802
Non-current liabilities 131,769 149,188
Total liabilities 135,581 162,990
Net assets 234,075 186,764
Contributed equity 195,457 170,900
Retained earnings 32,244 10,014
Cash Flow Hedging Reserves (1,164) (1,305)
Share-based payment Reserve 7,538 7,155
Total Shareholders’ Equity 234,075 186,764
Profit for the year 34,086 29,295
Total comprehensive income for the year 34,227 28,759

Notes to the Consolidated Financial Statements For the Year Ended 30 June 2016
TOX FREE SOLUTIONS LTD | Annual Report | 30 June 2016 NOTES TO THE CONSOLIDATED FINANCIAL STATEMENTS Page 142 of 173
26) Commitments
(a) Finance lease commitments
2016
$’000
2015
$’000
Payable - minimum lease payments:
- no later than 1 year 4,277 5,470
- between 1 year and 5 years 4,696 9,081
- greater than 5 years - -
Minimum lease payments 8,973 14,551
Less: finance changes (692) (1,372)
Present value of minimum lease payments 8,281 13,179
Finance leases are in place for fleet acquisitions and normally have a lease term between 5 and 7 years. (b) Operating lease commitments
Non-cancellable operating leases contracted for but not capitalised in the financial statements.
2016
$’000
2015
$’000
Payable - minimum lease payments:
- no later than 1 year 11,948 9,390
- between 1 year and 5 years 24,104 23,861
- greater than 5 years 6,689 4,218
42,741 37,469
Operating leases have been have been taken out for a number of sites, office facilities and a fleet of light and heavy motor vehicles. Operating leases typically run for a period of between 3 and 7 years with an option to renew the lease after that date. Lease payments for sites and office facilities are generally increased on an annual basis in line with market related / consumer price index increases. (c) Capital expenditure commitments
2016
$’000
2015
$’000
Capital expenditure commitments contracted for:
Capital – no later than 1 year 2,000 4,134
Total Capital contracted for 2,000 4,134

Notes to the Consolidated Financial Statements For the Year Ended 30 June 2016
TOX FREE SOLUTIONS LTD | Annual Report | 30 June 2016 NOTES TO THE CONSOLIDATED FINANCIAL STATEMENTS Page 143 of 173
27) Interests in other entities
(a) Parent and ultimate controlling entity The parent and ultimate controlling entity is Tox Free Solutions limited, incorporated in Australia.
(b) Controlled entities
Subsidiaries: Country of
Incorporation
Holding %
2016
Holding %
2015
Aframe Investments Pty Ltd Ϡ Australia 100 100
BCD Technologies Pty Ltd Ϡ Australia 100 100
Barry Bros. Specialised Services Pty Ltd Ϡ Australia 100 100
DoloMatrix Australia Pty Ltd ¥ Australia 100 100
DoloMatrix Environmental Solutions Pty Ltd ¥ Australia 100 100
MMS Enterprises (QLD) Pty Ltd Ϡ Australia 100 100
Oil Energy Corporation Pty Ltd Ϡ Australia 100 100
Pilbara Logistics Pty Ltd Australia 60 60
Entities controlled by Pilbara Logistics Pty Ltd
PTW Environmental Services Pty Ltd ^ Australia 49 100
PTES Environmental Services Pty Ltd Ω Australia 75 80
SRL Plasma Pty Ltd π Australia - 100
Tox Free (Australia) Pty Ltd Australia 100 100
Entities controlled by Tox Free Australia Pty Ltd
HKD Process Cleaning Pty Ltd ¥ Australia 100 -
GBR Enviroservices Pty Ltd Ϡ Australia 100 100
PGM Refiners Pty Ltd Australia 100 -
Tox Free (Henderson) Pty Ltd Ϡ Australia 100 100
Tox Free (Kwinana) Pty Ltd ¥ Australia 100 100
Tox Free (New South Wales) Pty Ltd ¥ Australia 100 100
Tox Free (Queensland) Pty Ltd Ϡ Australia 100 100
Tox Free (Victoria) Pty Ltd Ϡ Australia 100 100
Waste Services Australia Pty Ltd Ϡ Australia 100 100
Waste Solutions (NT) Pty Ltd Ϡ Australia 100 100
Worth Corporation Pty Ltd Australia 100 -
Entities controlled by Worth Corporation Pty Ltd
Worth Recycling Pty Ltd Australia 100 -
π Entity liquidated during the year. Ϡ Entity is dormant and is in the process of being liquidated. ¥ Entity is dormant. ^ Formerly Pilbara Waste Pty Ltd; 65.6% (2015: 100%) held directly by Pilbara Logistics Pty Ltd and 9.4% (2015: nil) held by Tox Free Solutions Limited. Ω 46.87% (2015: 50%) held by Tox Free Solutions Limited and 46.87% (2015: 50%) held by Pilbara Logistics Pty Ltd.

Notes to the Consolidated Financial Statements For the Year Ended 30 June 2016
TOX FREE SOLUTIONS LTD | Annual Report | 30 June 2016 NOTES TO THE CONSOLIDATED FINANCIAL STATEMENTS Page 144 of 173
The investments in subsidiaries are measured at cost in the parent company financial statements. (c) Non-controlling interests (NCI)
Set out below is summarised financial information for the Pilbara Logistics Group that has non-controlling interests that are significant to the Group. The amounts disclosed are before inter-company eliminations.
Summarised balance sheet:
2016
$’000
2015
$’000
Current assets 7,128 8,976
Current liabilities 3,833 5,202
Current net assets 3,295 3,774
Non-current assets 4,123 4,698
Non-current liabilities - 144
Non-current net assets 4,123 4,554
Net assets 7,418 8,328
Accumulated NCI 2,979 2,986
Summarised statement of comprehensive income:
2016
$’000
2015
$’000
Revenue 31,600 34,174
Profit for the period after tax 1,337 1,289
Other comprehensive income - -
Total comprehensive income 1,337 1,289
Profit allocated to NCI 435 226
Dividends paid to NCI 503 2,240
Summarised cash flows:
2016
$’000
2015
$’000
Cash inflows from operating activities 3,808 702
Cash inflows from investing activities 30 4,860
Cash outflows from financing activities (2,247) (5,665)
Net increase / (decrease) in cash and cash equivalents 1,591 (103)
(d) Transactions with non-controlling interests
Please refer to note 4(a)(iv) “Business Combinations” for details of non-controlling interest transactions with new acquisition PGM Refiners Pty Ltd during the year.

Notes to the Consolidated Financial Statements For the Year Ended 30 June 2016
TOX FREE SOLUTIONS LTD | Annual Report | 30 June 2016 NOTES TO THE CONSOLIDATED FINANCIAL STATEMENTS Page 145 of 173
28) Related Party Transactions
(a) Key Management Personnel (KMP) compensation
Any person(s) having authority and responsibility for planning, directing and controlling the activities of the entity, directly or indirectly, including any Director (whether Executive or otherwise) of that entity are considered KMP.
The totals of remuneration paid to KMP of the Group during the year are as follows:
2016
$’000
2015
$’000
Short-term employee benefits 3,280 3,475
Post-employment benefits 307 309
Long-term benefits 119 13
Share-based payments 458 427
4,164 4,224
Detailed remuneration disclosures are provided in the Remuneration Report.
(i) Subsidiaries The consolidated financial statements include the financial statements of Tox Free Solutions Limited and the controlled entities which are listed in note 27(b). (b) Other transactions with Related parties
Dividend revenue During the year, the parent company received dividend revenue of $1.75m (2015: $3.01m) from the Pilbara Logistics Group and $40m (2015: $45m) from Tox Free Australia Pty Ltd. These transactions are eliminated on consolidation. (c) Loans to Key Management Personnel
2016
$’000
2015
$’000
CURRENT
Beginning of year - 116
Loans advanced - -
Loan and interest repayments received - (116)
Interest charged - -
End of year - -
There were no loans made to Directors and other Key Management Personnel during the financial year under review. In addition, there were no loan balances outstanding at the end of the year.

Notes to the Consolidated Financial Statements For the Year Ended 30 June 2016
TOX FREE SOLUTIONS LTD | Annual Report | 30 June 2016 NOTES TO THE CONSOLIDATED FINANCIAL STATEMENTS Page 146 of 173
29) Contingencies
The Group had the following contingencies at the end of the reporting period:
Contingent Instruments Bank Guarantees to the value of $7.828M (2015: $5.99M), all of which are expected to be recovered without claim. Bank guarantees are provided in certain customer contracts and property rental agreements as a percentage of the contract sum. Generally, bank guarantees are provided to guarantee the performance of contractual terms until practical completion. There is no liability that should be recognised in relation to these guarantees. Contingent Liabilities
During the 2016 financial year, Tox Free continued to monitor facilities for compliance with legal and other requirements and to assess for contingent liabilities. Based on our ongoing monitoring program there are two sites with potential contingent liabilities; Kwinana and Port Hedland.
If Tox Free were to vacate the current Kwinana facility, then Tox Free would have an obligation to remediate contaminated soil on the Kwinana site, to decontaminate equipment and to treat and dispose of accumulated waste product to the vendor of the business. This site is currently classified by the Department of Environment Regulation as “Contaminated - Restricted Use.” This does not affect the current use of the site, as the soil is capped and enabling ongoing monitoring of the risk. Remediation of the site must be completed prior to vacating the site.
Tox Free remains committed to this facility and has no current plan to vacate the site. In 2016 as part of our ongoing improvement program, a range of developments commenced at the site to improve productivity capacity and as part of these works, remediation of the previous tank farm location commenced under the guidance of a suitably qualified environmental consultancy. It is expected that any contingent liability for this site will be remediated through this program to an immaterial level.
The Port Hedland facility has been changed to “Contaminated – Remediation Required” The facility was previously assessed by the Department of Environment Regulation as “Possibly Contaminated - Investigation Required.” Toxfree has continued its groundwater monitoring program over the past 12 months as part of its investigation program of the site contamination. A Contaminated Sites Auditor has been engaged to review all investigation studies, the existing monitoring program and provide advice on remediation and the contingent liability. The contingent liability for this site is not yet determined.
The Directors are of the opinion that a provision is not required for these as the expected costs are not capable of reliable measurement at this point and there is also no set timeframe to remediate the soil.
Apart from those contingencies detailed above, there are no further contingent assets and/or liabilities at the reporting date.

Notes to the Consolidated Financial Statements For the Year Ended 30 June 2016
TOX FREE SOLUTIONS LTD | Annual Report | 30 June 2016 NOTES TO THE CONSOLIDATED FINANCIAL STATEMENTS Page 147 of 173
30) Remuneration of Auditor
2016
$’000
2015
$’000
Remuneration of the auditor of the parent entity, BDO Audit (WA) Pty Ltd:
Audit and assurance services
Audit and review of the financial statements
300
290
Taxation Services
Tax advice and compliance services (BDO Corporate Tax (WA) Pty Ltd)
214
234
Other services
Accounting advice and review of information 8 13
Business combinations and acquisitions 36 21
Total other services 44 34
Total Remuneration of Auditor 558 558
31) Earnings per Share (a) Reconciliation of earnings used in calculating earnings per share:
2016
$’000
2015
$’000
Basic earnings per share
Profit from continuing operations attributable to ordinary equity holders of the Company 12,608 21,768
Diluted earnings per share
Profit from continuing operations attributable to ordinary equity holders of the Company 12,608 21,768
Add: Potential interest earned on proceeds from the conversion of share options - 19
Profit attributable to the ordinary equity holders of the Company used in calculating diluted earnings per share 12,608 21,787

Notes to the Consolidated Financial Statements For the Year Ended 30 June 2016
TOX FREE SOLUTIONS LTD | Annual Report | 30 June 2016 NOTES TO THE CONSOLIDATED FINANCIAL STATEMENTS Page 148 of 173
(b) Weighted average number of ordinary shares used as the denominator
2016
Number
2015
Number
Weighted average number of ordinary shares used as the denominator in calculating basic earnings per share 136,572,652 133,806,268
Adjustments for calculation of diluted earnings per share:
Weighted average number of dilutive options and rights 231,136 781,432
Weighted average number of ordinary shares and potential ordinary shares used as the denominator in calculating diluted earnings per share 136,803,788 134,587,700
32) Deed of Cross-Guarantee
Tox Free Solutions Limited and wholly-owned operating subsidiaries listed in note 27 are parties to a deed of cross-guarantee under which each company guarantees the debt of others. By entering into the deed, the wholly-owned entities have been relieved from the requirement to prepare a financial report and Directors' report under Class Order 98/1418 (as amended) issued by the Australian Securities and Investment Commission.
33) Events occurring after the Reporting Period Acquisition of Active Industrial Solutions On 1 August 2016, Tox Free acquired 100% of the shares in Active Industrial Solutions Pty Ltd and 100% of the units in the Active Industrial Solutions Unit Trust (AIS) for a consideration of $6.4m including working capital. AIS are an industrial services business operating in Melbourne, Victoria. The acquisition of AIS creates the opportunity to strengthen Toxfree’s position in the metropolitan and municipal services market.
At the date the financial statements were authorised for issue, the Group had not yet completed the accounting for the transaction. Recommended Dividend The Directors of Tox Free Solutions Limited declared a final dividend on ordinary shares in respect of the 2016 financial year. The total amount of the dividend is $6,476,385 which represents a fully franked dividend of 4.5 cents per share. No other matters or circumstances have arisen since the end of the financial year which significantly affected or could significantly affect the operations of the Group, the results of those operations, or the state of affairs of the Group in future financial years.

Notes to the Consolidated Financial Statements For the Year Ended 30 June 2016
TOX FREE SOLUTIONS LTD | Annual Report | 30 June 2016 NOTES TO THE CONSOLIDATED FINANCIAL STATEMENTS Page 149 of 173
34) Summary of Significant Accounting Policies
(a) Basis of preparation (i) Reporting basis and conventions The financial statements are general purpose financial statements which have been prepared in accordance with Australian Accounting Standards and Interpretations issued by the Australian Accounting Standards Board and the Corporations Act 2001.
The consolidated financial statements of the Tox Free Solutions Limited Group also comply with International Financial Reporting Standards (IFRS) as issued by the International Accounting Standards Board (IASB).
Material accounting policies adopted in the preparation of these financial statements are presented below and have been consistently applied unless otherwise stated.
The financial statements have been prepared on an accruals basis and are based on historical costs, modified, where applicable, by the measurement at fair value of selected non-current assets, financial assets and financial liabilities.
New and amended standards adopted by the Group, refer to note 34(u).
New accounting standards for application in future periods, refer to note 34(v).
(b) Comparative figures When required by Accounting Standards, comparative figures have been restated to conform to changes in presentation for the current financial year.
(c) Principles of consolidation and equity accounting (i) Subsidiaries Subsidiaries are all entities over which the Group has control. The Group controls an entity when the Group is exposed to, or has rights to, variable returns from its involvement with the entity and has the ability to affect those returns through its power to direct the activities of the entity. Subsidiaries are fully consolidated from the date on which control is transferred to the Group. They are deconsolidated from the date that control ceases.
Intercompany transactions, balances and unrealised gains on transactions between Group companies are eliminated. Unrealised losses are also eliminated unless the transaction provides evidence of an impairment of the transferred asset. Accounting policies of subsidiaries have been changed where necessary to ensure consistency with policies adopted by the Group.
Non-controlling interests in the results and equity of subsidiaries are shown separately in the consolidated statement of profit or loss, statement of comprehensive income, statement of changes in equity and balance sheet respectively.
A list of controlled entities is contained in Note 27(b) to the financial statements.

Notes to the Consolidated Financial Statements For the Year Ended 30 June 2016
TOX FREE SOLUTIONS LTD | Annual Report | 30 June 2016 NOTES TO THE CONSOLIDATED FINANCIAL STATEMENTS Page 150 of 173
(ii) Associates Associates are all entities over which the Group has significant influence but not control or joint control. This is generally the case where the Group holds between 20% and 50% of the voting rights. Investments in associates are accounted for using the equity method of accounting, after initially being recognised at cost. (iii) Equity method Under the equity method of accounting, the investments are initially recognised at cost and adjusted thereafter to recognise the Group’s share of the post-acquisition profits or losses of the investee in profit or loss, and the Group’s share of movements in other comprehensive income of the investee in other comprehensive income. Dividends received or receivable from associates and joint ventures are recognised as a reduction in the carrying amount of the investment.
When the Group’s share of losses in an equity-accounted investment equals or exceeds its interest in the entity, including any other unsecured long-term receivables, the Group does not recognise further losses, unless it has incurred obligations or made payments on behalf of the other entity.
Unrealised gains on transactions between the Group and its associates and joint ventures are eliminated to the extent of the Group’s interest in these entities. Unrealised losses are also eliminated unless the transaction provides evidence of an impairment of the asset transferred. Accounting policies of equity accounted investees have been changed where necessary to ensure consistency with the policies adopted by the Group.
The carrying amount of equity-accounted investments is tested for annually for impairment. (iv) Changes in ownership interest The Group treats transactions with non-controlling interests that do not result in a loss of control as transactions with equity owners of the Group. A change in ownership interest results in an adjustment between the carrying amounts of the controlling and non-controlling interests to reflect their relative interests in the subsidiary. Any difference between the amount of the adjustment to non-controlling interests and any consideration paid or received is recognised in an Equity Reserve.
When the Group ceases to consolidate or equity account for an investment because of a loss of control or significant influence, any retained interest in the entity is remeasured to its fair value with the change in carrying amount recognised in profit or loss. This fair value becomes the initial carrying amount for the purposes of subsequently accounting for the retained interest as an associate or financial asset.
In addition, any amounts previously recognised in other comprehensive income in respect of that entity are accounted for as if the group had directly disposed of the related assets or liabilities. This may mean that amounts previously recognised in other comprehensive income are reclassified to profit or loss.
If the ownership interest in an associate is reduced but significant influence is retained, only a proportionate share of the amounts previously recognised in other comprehensive income are reclassified to profit or loss where appropriate.

Notes to the Consolidated Financial Statements For the Year Ended 30 June 2016
TOX FREE SOLUTIONS LTD | Annual Report | 30 June 2016 NOTES TO THE CONSOLIDATED FINANCIAL STATEMENTS Page 151 of 173
(v) Business combinations The acquisition method of accounting is used to account for all business combinations, regardless of whether equity instruments or other assets are acquired. The consideration transferred for the acquisition of a subsidiary comprises the:
fair values of the assets transferred
liabilities incurred to the former owners of the acquired business
equity interests issued by the group
fair value of any asset or liability resulting from a contingent consideration arrangement, and
fair value of any pre-existing equity interest in the subsidiary
Identifiable assets acquired and liabilities and contingent liabilities assumed in a business combination are, with limited exceptions, measured initially at their fair values at the acquisition date. The Group recognises any non-controlling interest in the acquired entity on an acquisition-by-acquisition basis either at fair value or at the non-controlling interest’s proportionate share of the acquired entity’s net identifiable assets.
Acquisition-related costs are expensed as incurred.
The excess of the:
consideration transferred,
amount of any non-controlling interest in the acquired entity, and
acquisition-date fair value of any previous equity interest in the acquired entity
over the fair value of the net identifiable assets acquired is recorded as goodwill. If those amounts are less than the fair value of the net identifiable assets of the subsidiary acquired, the difference is recognised directly in profit or loss as a bargain purchase.
Where settlement of any part of cash consideration is deferred, the amounts payable in the future are discounted to their present value as at the date of exchange. The discount rate used is the entity’s incremental borrowing rate, being the rate at which a similar borrowing could be obtained from an independent financier under comparable terms and conditions.
Contingent consideration is classified either as equity or a financial liability. Amounts classified as a financial liability are subsequently remeasured to fair value with changes in fair value recognised in profit or loss.
If the business combination is achieved in stages, the acquisition date carrying value of the acquirer’s previously held equity interest in the acquire is remeasured to fair value at the acquisition date. Any gains or losses arising from such remeasurement are recognised in profit or loss.
(d) Financial instruments
Initial recognition and measurement Financial assets and financial liabilities are recognised when the entity becomes a party to the contractual provisions of the instrument. For financial assets, this is the equivalent to the date that the Group commits itself to either the purchase or sale of the asset i.e. trade date accounting is adopted.

Notes to the Consolidated Financial Statements For the Year Ended 30 June 2016
TOX FREE SOLUTIONS LTD | Annual Report | 30 June 2016 NOTES TO THE CONSOLIDATED FINANCIAL STATEMENTS Page 152 of 173
Financial instruments are initially measured at fair value plus transactions costs, except where the instrument is classified 'at fair value through profit or loss' in which case transaction costs are expensed to profit or loss immediately.
Classification and subsequent measurement Financial instruments are subsequently measured at either fair value or cost. Fair value is the price that would be received to sell an asset or paid to transfer a liability in an orderly transaction between market participants at the measurement date.
Fair value is measured using the assumption that market participants would act in their best economic interest when pricing the asset or liability, by using the assets at its highest and best use. When available, quoted prices in an active market are used to determine fair value. In other circumstances, valuation techniques are adopted.
Amortised cost is calculated as: (a) the amount at which the financial asset or financial liability is measured at initial recognition; (b) less principal repayments; (c) less any reduction for impairment. (i) Non-derivative financial instruments Non-derivative financial instruments comprise trade and other receivables, cash and cash equivalents, loans and borrowings, and trade and other payables.
Non-derivative financial instruments are recognised initially at fair value plus, for instruments not at fair value through profit or loss, any directly attributable transaction costs. Subsequent to initial recognition, non-derivative financial instruments are measured as described below.
A financial instrument is recognised if the Group becomes party to the contractual provisions of the instrument. Financial assets are derecognised if the Group's contractual rights to the cash flows from the financial asset expire or if the Group transfers the financial asset to another party without retaining control or substantially all risks and rewards of the asset. Regular way purchases and sales of financial assets are accounted for at trade date, i.e. at the date the Group commits itself to purchase or sell the asset. Financial liabilities are derecognised if the Group's obligations specified in the contract expire or are discharged or cancelled.
Trade receivables are recognised initially at fair value and subsequently measured at amortised cost using the effective interest rate method, less provision for impairment. Collectability of trade receivables is reviewed on an ongoing basis. Debts which are known to be uncollectable are written off by reducing the carrying amount directly. An allowance account (provision for impairment of trade receivables) is used when there is objective evidence that the Group will not be able to collect all amounts due according to the original terms of the receivable in question.
Significant financial difficulties of the debtor, probability that the debtor will enter bankruptcy or financial reorganisation, and default or delinquency in payments (more than 60 days overdue) are considered indicators that the trade receivable is impaired. The amount of the carrying allowance is the difference between the assets carrying amount and the present value of estimated future cash flows, discounted at the original effective interest rate.
Cash flows relating to short-term receivables are not discounted if the effect of discounting is immaterial.

Notes to the Consolidated Financial Statements For the Year Ended 30 June 2016
TOX FREE SOLUTIONS LTD | Annual Report | 30 June 2016 NOTES TO THE CONSOLIDATED FINANCIAL STATEMENTS Page 153 of 173
Cash and cash equivalents comprise cash balances and call deposits. Bank overdrafts that are repayable on demand and form part of an integral part of the Group's cash management are included as a component of cash and cash equivalents for the purposes of the Statement of Cash Flows.
Finance income comprises interest income on funds invested. Interest income is recognised as it is accrued in profit or loss, using the effective interest method. Finance expenses comprise interest expense on borrowings. All borrowing costs are recognised in profit or loss using the effective interest method.
(ii) Share capital Ordinary shares are classified as equity. Incremental costs directly attributable to the issue of ordinary shares and share options are recognised as a deduction from equity, net of any tax effects.
(iii) Impairment of financial assets Objective evidence that a financial asset is impaired includes default by a debtor, evidence that the debtor is likely to enter bankruptcy or adverse economic conditions in the securities exchange. At the end of each reporting period, the Group assess whether there is objective evidence that a financial asset has been impaired through the occurrence of a loss event. In the case of available-for-sale financial instruments, a significant or prolonged decline in the value of the instrument is considered to indicate that impairment has arisen.
Where a subsequent event causes the amount of the impairment loss to decrease (e.g. payment received), the reduction in the allowance account (provision for impairment of receivables) is taken through profit or loss.
Impairment losses are recognised through an allowance account for loans and receivables in the Consolidated Statement of Profit or Loss.
(e) Property, plant and equipment (i) General information Each class of property, plant and equipment is carried at cost or fair value as indicated less, where applicable, any accumulated depreciation and impairment losses.
(ii) Property Land and buildings are measured at cost less accumulated depreciation and impairment losses.
(iii) Plant and equipment Plant and equipment are measured on the cost basis. Cost includes expenditure that is directly attributable to the asset.
(iv) Depreciation The depreciable amount of all fixed assets including buildings and capitalised leased assets, but excluding freehold land, is depreciated on a straight-line basis over the asset's useful life to the Group commencing from the time the asset is held ready for use. Leasehold improvements are depreciated over the shorter of either the unexpired period of the lease or the estimated useful lives of the improvements. Land is not depreciated.

Notes to the Consolidated Financial Statements For the Year Ended 30 June 2016
TOX FREE SOLUTIONS LTD | Annual Report | 30 June 2016 NOTES TO THE CONSOLIDATED FINANCIAL STATEMENTS Page 154 of 173
The estimated useful lives used for each category of depreciable assets are:
Category of Fixed Asset Useful Life
Buildings 10 - 40 years
Plant and Equipment 3 - 12 years
Motor Vehicles 4 - 10 years
Leasehold Improvements Period of lease
The assets' residual values, depreciation methods and useful lives are reviewed, and adjusted if appropriate, at the end of each reporting period. (v) Subsequent costs The cost of replacing part of an item of property, plant and equipment is recognised in the carrying amount of the item if it is probable that the future economic benefits embodied within the part will flow to the Group and its cost can be measured reliably. The carrying amount of the replaced part is derecognised. The costs of day to day servicing of property, plant or equipment are recognised in profit and loss as incurred. (vi) Depreciation – gains and losses on disposal Gains and losses on disposals are determined by comparing proceeds with the carrying amount. These gains and losses are included within "Other Income (gains) or Other Expenses (losses)” in the Consolidated Statement of Profit or Loss.
(f) Intangibles (i) Goodwill Goodwill arises on the acquisition of subsidiaries and represents the excess of cost of the acquisition over the Group’s interest in the net fair value of the identifiable assets, liabilities and contingent liabilities. When the excess is negative (bargain purchase), it is recognised immediately in profit or loss. Goodwill is not amortised. Instead, Goodwill is tested for impairment annually or more frequently if events or changes in circumstances indicate that it might be impaired, and is carried at cost less accumulated impairment losses. Gains and losses on the disposal of an entity include the carrying amount of Goodwill relating to the entity sold.
Goodwill is allocated to one of five cash generating units for the purpose of impairment testing. Each of those cash generating units is represented in the Group's operating segments. Please refer to note 14 for additional information. (ii) Business licenses Business licences acquired as part of a business combination are recognised separately from Goodwill. The Business licences are carried at their fair value at the date of acquisition less impairment losses. Business licences have an indefinite useful life on the basis that they will continue to be renewed and future cash flows cannot be earned without them.
Business licences are allocated to cash generating units for the purpose of impairment testing. Each of those cash generating units represents the Group's operating segments.

Notes to the Consolidated Financial Statements For the Year Ended 30 June 2016
TOX FREE SOLUTIONS LTD | Annual Report | 30 June 2016 NOTES TO THE CONSOLIDATED FINANCIAL STATEMENTS Page 155 of 173
(iii) Intellectual property and Customer contracts and relationships Both Intellectual Property and Customer Contracts and Relationships have a finite useful life and are carried at cost less accumulated amortisation and impairment losses.
Amortisation is recognised in profit or loss from the date that the intangibles are available for use on either a straight-line basis over their estimated useful life or based on the expected revenue contribution profile. The estimated useful lives for each category are:
Category of Intangible Useful Life
Intellectual Property 10 years
Customer Contracts 3-10 years
Customer Relationships^ 1-9 years
^ based on the expected revenue contribution profile
(g) Inventories Raw Materials, consumables and finished goods are stated at the lower of cost and net realisable value. Net realisable value is the estimated selling price in the ordinary course of business less the estimated costs of completion and the estimated costs necessary to make the sale. Inventories are measured at the lower of cost and net realisable value. Consumables including fuels paid for and on-hand at year end and are not for resale, rather for consumption in providing services.
(h) Impairment of non-financial assets The carrying amount of the Group's non-financial assets, other than inventories and deferred tax assets, are reviewed at each reporting date to determine whether there is any indication of impairment. If any such indication exists then the asset's recoverable amount is estimated. For Goodwill, the recoverable amount is estimated at each reporting date.
The recoverable amount of an asset or cash generating unit is the greater of its value in use and its fair value less costs to sell. In assessing value in use, the estimated future cash flows are discounted to their present value using the pre-tax discount rate that reflects current market assessments of the time value of money and the risks specific to the asset. For the purpose of impairment testing, assets are grouped together into the smallest group of assets that generates cash inflows from continuing use that are largely independent of the cash inflows of other assets or groups of assets (the "cash generating unit").
The Goodwill and Business licences acquired in a business combination, for the purpose of impairment testing, are allocated to cash generating units that are expected to benefit from the synergies of combination.
An impairment loss is recognised if the carrying amount of the asset or its cash generating unit exceeds its recoverable amount. Impairment losses are recognised in profit or loss. Impairment losses recognised in respect of cash generating units are allocated first to reduce the carrying amount of any Goodwill allocated to the units and then to reduce the carrying amount of the other assets in the unit (group of units) on a pro-rata basis.
An impairment loss in respect of Goodwill is not reversed. In respect of other assets, impairment losses recognised in prior periods are assessed at each reporting date for any indications that the loss has decreased or no longer exists.

Notes to the Consolidated Financial Statements For the Year Ended 30 June 2016
TOX FREE SOLUTIONS LTD | Annual Report | 30 June 2016 NOTES TO THE CONSOLIDATED FINANCIAL STATEMENTS Page 156 of 173
An impairment loss is reversed only to the extent that the asset's carrying amount does not exceed the carrying amount that would have been determined, net of depreciation or amortisation, if no impairment loss had been recognised.
Impairment testing is performed annually for Goodwill and intangible assets with indefinite lives.
(i) Employee benefits (i) Employee benefits Provision is made for the Group's liability for employee benefits arising from services rendered by employees to the end of the reporting period. Employee benefits that are expected to be settled within one year have been measured at the amounts expected to be paid when the liability is settled.
Employee benefits payable later than one year have been measured at the present value of the estimated future cash outflows to be made for those benefits. In determining the liability, consideration is given to employee wage increases and the probability that the employee may satisfy vesting requirements. Those cash flows are discounted using market yields on corporate bond rates with terms to maturity that match the expected timing of cash flows. (ii) Defined contribution schemes A defined contribution plan is a post-employment benefit plan under which an entity pays fixed contributions into a separate entity and will have no legal or constructive obligation to pay further amounts. Obligations for contributions to defined contribution superannuation plans are recognised as an employee benefit expense in profit or loss in the periods in which services are provided by employees. Prepaid contributions are recognised as an asset to the extent that a cash refund or reduction in future payments is available. (iii) Termination benefits Termination benefits are recognised as an expense when the Group is demonstrably committed, without realistic possibility of withdrawal, to a formal detailed plan to either terminate employment before the normal retirement date, or to provide termination benefits as a result of an offer made to encourage voluntary redundancy. Termination benefits for voluntary redundancies are recognised as an expense if the Group has made an offer encouraging voluntary redundancy, it is probable that the offer is accepted, and the number of acceptances can be estimated reliably. (iv) Short-term benefits Liabilities for employee benefits for wages, salaries, annual leave and personal leave represent present obligations resulting from employee's services provided to reporting date, expected to be settled wholly within 12 months after the reporting date and are calculated at undiscounted amounts based on remuneration wage and salary rates that the Group expects to pay as at reporting date including related on-costs, such as workers compensation, insurance and payroll tax.
A liability is recognised for the amount expected to be paid under short-term cash bonus or profit-sharing plans if the Group has present legal or constructive obligation to pay this amount as a result of past service provided by the employee and the obligation can be estimated reliably. This liability is included in the provisions in the Consolidated Balance Sheet.

Notes to the Consolidated Financial Statements For the Year Ended 30 June 2016
TOX FREE SOLUTIONS LTD | Annual Report | 30 June 2016 NOTES TO THE CONSOLIDATED FINANCIAL STATEMENTS Page 157 of 173
(v) Other long-term benefits The Group's net obligation in respect of long-term employee benefits and not expected to be settled wholly within 12 months after reporting date, is the amount of future benefit that employees have earned in return for their service in the current and prior periods plus related on-costs; that benefit is discounted to determine its present value, and the fair value of any related assets is deducted.
This discount rate is the yield at the reporting date on corporate bond rates that have maturity dates approximating the terms of the Group's obligation. The calculation is performed using the projected unit credit method. These obligations are included in provisions in the Consolidated Balance Sheet. (vi) Share-based payment transactions The Group provides benefits to senior management personnel with a combination of Options, Performance Rights and Share Appreciation Rights in exchange for them rendering their services. Details of the Long-Term Incentive (LTI) are disclosed in the Remuneration Report.
The grant date fair value of Options and/or Rights granted to employees is valued by a Black Scholes Option Pricing Model and is recognised as an employee expense, with a corresponding increase in equity, over the period that the employees become unconditionally entitled to the Options and/or Rights. No ongoing adjustment is made to the expense except where an employee leaves the business.
Rights subject to a total shareholders return (TSR) performance condition, an adjusted Black Scholes Option Pricing Model that includes a Monte Carlo simulation model is utilised to value the Rights.
(j) Revenue and Other Income (i) Services
The Group recognises Service revenue in the following three categories:
Waste Services
Industrial Services
Technical and Environmental Services
Revenue is measured at the fair value of the consideration received or receivable after taking into account any trade discounts and volume rebates allowed. The Group recognises revenue when the amount of revenue can be reliably measured and it is probable that future economic benefits will flow to the entity. Revenue is generally recognised upon delivery of the waste treatment service to the customer. For contract variations this requires estimates and judgements based on future economic benefit and is typically when the variations / overruns have been agreed with the customer.
(ii) Interest revenue Interest revenue is recognised using the effective interest rate method, which for floating rate financial assets is the rate inherent in the instrument.
(iii) Dividends Dividends are recognised as revenue when the right to receive payment is established. This applies even if they are paid out of pre-acquisition profits. However the investment may need to be tested for impairment as a consequence.

Notes to the Consolidated Financial Statements For the Year Ended 30 June 2016
TOX FREE SOLUTIONS LTD | Annual Report | 30 June 2016 NOTES TO THE CONSOLIDATED FINANCIAL STATEMENTS Page 158 of 173
(iv) Revenue – net of tax All revenue is stated net of the amount of goods and services tax (GST).
(k) Income tax The income tax expense or revenue for the period is the tax payable on the current period’s taxable income based on the applicable income tax rate for each jurisdiction adjusted by changes in deferred tax assets and liabilities attributable to temporary differences and to unused tax losses.
The current income tax charge is calculated on the basis of the tax laws enacted or substantively enacted at the end of the reporting period in the countries where the company’s subsidiaries and associates operate and generate taxable income. Management periodically evaluates positions taken in tax returns with respect to situations in which applicable tax regulation is subject to interpretation. It establishes provisions where appropriate on the basis of amounts expected to be paid to the tax authorities.
Deferred income tax is provided in full, using the liability method, on temporary differences arising between the tax bases of assets and liabilities and their carrying amounts in the consolidated financial statements. However, deferred tax liabilities are not recognised if they arise from the initial recognition of goodwill. Deferred income tax is also not accounted for if it arises from initial recognition of an asset or liability in a transaction other than a business combination that at the time of the transaction affects neither accounting nor taxable profit or loss. Deferred income tax is determined using tax rates (and laws) that have been enacted or substantially enacted by the end of the reporting period and are expected to apply when the related deferred income tax asset is realised or the deferred income tax liability is settled.
The deferred tax liabilities in relation to investment property that is measured at fair value is determined assuming the property will be recovered entirely through sale.
Deferred tax assets are recognised only if it is probable that future taxable amounts will be available to utilise those temporary differences and losses.
Deferred tax liabilities and assets are not recognised for temporary differences between the carrying amount and tax bases of investments in foreign operations where the company is able to control the timing of the reversal of the temporary differences and it is probable that the differences will not reverse in the foreseeable future.
Deferred tax assets and liabilities are offset when there is a legally enforceable right to offset current tax assets and liabilities and when the deferred tax balances relate to the same taxation authority. Current tax assets and tax liabilities are offset where the entity has a legally enforceable right to offset and intends either to settle on a net basis, or to realise the asset and settle the liability simultaneously.
Tox Free Solutions Limited and its wholly-owned Australian controlled entities have implemented the tax consolidation legislation as of 1 July 2003. As a consequence, these entities are taxed as a single entity and the deferred tax assets and liabilities of these entities are set off in the consolidated financial statements.
Notes to the Consolidated Financial Statements For the Year Ended 30 June 2016
TOX FREE SOLUTIONS LTD | Annual Report | 30 June 2016 NOTES TO THE CONSOLIDATED FINANCIAL STATEMENTS Page 159 of 173
Current and deferred tax is recognised in profit or loss, except to the extent that it relates to items recognised in other comprehensive income or directly in equity. In this case, the tax is also recognised in other comprehensive income or directly in equity, respectively.
Companies within the Group may be entitled to claim special tax deductions for investments in qualifying assets or in relation to qualifying expenditure (e.g. the Research and Development Tax Incentive regime in Australia or other investment allowances). The Group accounts for the allowances as tax credits, which means that the allowances reduces the income tax payable and current tax expense. A deferred tax asset is recognised for unclaimed tax credits that are carried forward as deferred tax assets.
(l) Goods and services tax (GST) Revenues, expenses and assets are recognised net of the amount of GST, except where the amount of GST incurred is not recoverable from the Australian Taxation Office. In these circumstances the GST is recognised as part of the cost of acquisition of the asset or as part of an item of the expense. Receivables and payables in the Consolidated Balance Sheet are shown inclusive of GST. The Group was GST Consolidated from 1 April 2013.
Cash flows are presented in the Consolidated Statement of Cash Flows on a gross basis, except for the GST component of investing and financing activities, which are disclosed as operating cash flows.
(m) Earnings per share The Group presents basic and diluted earnings per share information for its ordinary shares. The basic earnings per share is calculated by dividing the profit attributable to owners of the Group by the weighted average number of ordinary shares outstanding during the year. Diluted earnings per share adjusts the basic earnings per share to take into account the after income tax effect of interest and other financing costs associated with dilutive potential ordinary shares and the weighted average number of additional ordinary shares that would have been outstanding assuming the conversion of all dilutive potential ordinary shares.
(n) Trade and other payables Trade and other payables represent the liability outstanding at the end of the reporting period for goods and services received by the Group during the reporting period which remain unpaid. The balance is recognised as an unsecured current liability with the amounts normally paid within 30 days of recognition of the liability.
(o) Borrowing costs Borrowing costs directly attributable to the acquisition, construction or production of assets that necessarily take a substantial period of time to prepare for their intended use or sale, are added to the cost of those assets, until such time as the assets are substantially ready for their intended use or sale.
All other borrowing costs are recognised in profit or loss in the period in which they are incurred.

Notes to the Consolidated Financial Statements For the Year Ended 30 June 2016
TOX FREE SOLUTIONS LTD | Annual Report | 30 June 2016 NOTES TO THE CONSOLIDATED FINANCIAL STATEMENTS Page 160 of 173
(p) Cash and cash equivalents Cash and cash equivalents include cash on hand, deposits held at call with banks, other short-term highly liquid investments with original maturities of three months or less which are convertible to a known amount of cash and subject to an insignificant risk of change in value, and bank overdrafts. Bank overdrafts are shown within short-term borrowings in current liabilities in the Consolidated Balance Sheet.
(q) Provisions Provisions are recognised when the Group has a legal or constructive obligation, as a result of past events, for which it is probable that an outflow of economic benefits will result and that outflow can be reliably measured.
Provisions are measured at the present value of management's best estimate of the outflow required to settle the obligation at the end of the reporting period. The discount rate used is a pre-tax rate that reflects current market assessments of the time value of money and the risks specific to the liability. The increase in the provision due to the unwinding of the discount is taken to finance costs in the Consolidated Statement of Profit or Loss.
(r) Derivatives and hedging activities Derivatives are initially recognised at fair value on the date a derivative contract is entered into and are subsequently remeasured to their fair value at the end of each reporting period. The accounting for subsequent changes in fair value depends on whether the derivative is designated as a hedging instrument, and if so, the nature of the item being hedged. The Group designates certain derivatives as either:
hedges of the fair value of recognised assets or liabilities or a firm commitment (fair value hedges)
hedges of a particular risk associated with the cash flows of recognised assets and liabilities and highly probable forecast transactions (cash flow hedges), or
hedges of a net investment in a foreign operation (net investment hedges).
The Group documents at the inception of the hedging transaction the relationship between hedging instruments and hedged items, as well as its risk management objective and strategy for undertaking various hedge transactions. The Group also documents its assessment, both at hedge inception and on an ongoing basis, of whether the derivatives that are used in hedging transactions have been and will continue to be highly effective in offsetting changes in fair values or cash flows of hedged items.
The fair values of the derivative financial instruments used for hedging purposes are disclosed in note 19. Movements in the Hedging Reserve in Shareholders’ Equity are shown in note 21. The full fair value of a hedging derivative is classified as a non-current asset or liability when the remaining maturity of the hedged item is more than 12 months. The remaining maturity of the hedged item is classified as a current asset or liability when the remaining maturity of the hedged item is less than 12 months. Trading derivatives are classified as a current asset or liability. (i) Fair value hedge Changes in the fair value of derivatives that are designated and qualify as fair value hedges are recorded in profit or loss, together with any changes in the fair value of the hedged asset or liability that are attributable to the hedged risk.
Notes to the Consolidated Financial Statements For the Year Ended 30 June 2016
TOX FREE SOLUTIONS LTD | Annual Report | 30 June 2016 NOTES TO THE CONSOLIDATED FINANCIAL STATEMENTS Page 161 of 173
The gain or loss relating to the effective portion of interest rate swaps hedging fixed rate borrowings is recognised in profit or loss within finance costs, together with changes in the fair value of the hedged fixed rate borrowings attributable to interest rate risk. The gain or loss relating to the ineffective portion is recognised in profit or loss within Other Income or Other Expense.
If the hedge no longer meets the criteria for hedge accounting, the adjustment to the carrying amount of a hedged item for which the effective interest method is used is amortised to profit or loss over the period to maturity using a recalculated effective interest rate. (ii) Cash flow hedge The effective portion of changes in the fair value of derivatives that are designated and qualify as a cash flow hedge is recognised in Other Comprehensive Income and accumulated in Reserves in Equity. The gain or loss relating to the ineffective portion is recognised immediately in profit or loss within Other Income or Other Expense.
Amounts accumulated in equity are reclassified to profit or loss in the periods when the hedged item affects profit or loss (for instance when the forecast sale that is hedged takes place). The gain or loss relating to the effective portion of interest rate swaps hedging variable rate borrowings is recognised in profit or loss within ‘finance costs’.
When a hedging instrument expires or is sold or terminated, or when a hedge no longer meets the criteria for hedge accounting, any cumulative gain or loss existing in equity at that time remains in equity and is recognised when the forecast transaction is ultimately recognised in profit or loss. When a forecast transaction is no longer expected to occur, the cumulative gain or loss that was reported in equity is immediately reclassified to profit or loss. (iii) Net investment hedges Hedges of net investments in foreign operations are accounted for similarly to cash flow hedges. Any gain or loss on the hedging instrument relating to the effective portion of the hedge is recognised in Other Comprehensive income and accumulated in reserves in equity. The gain or loss relating to the ineffective portion is recognised immediately in profit or loss within Other income or Other expenses.
Gains and losses accumulated in equity are reclassified to profit or loss when the foreign operation is partially disposed of or sold. (iv) Derivatives that do not qualify for hedge accounting Certain derivative instruments do not qualify for hedge accounting. Changes in the fair value of any derivative instrument that does not qualify for hedge accounting are recognised immediately in profit or loss and are included in Other income or Other expenses.
(s) Leases (i) Finance leases Leases of property, plant and equipment, where substantially all the risks and benefits incidental to the ownership of the assets, but not the legal ownership that are transferred to entities in the Group are classified as finance leases. Please refer to note 16 and note 26 for additional details.

Notes to the Consolidated Financial Statements For the Year Ended 30 June 2016
TOX FREE SOLUTIONS LTD | Annual Report | 30 June 2016 NOTES TO THE CONSOLIDATED FINANCIAL STATEMENTS Page 162 of 173
Finance leases are capitalised by recording an asset and a liability at the lower of the amounts equal to the fair value of the leased property or the present value of the minimum lease payments, including any guaranteed residual values. Lease payments are allocated between the reduction of the lease liability and the lease interest expense for the period.
Leased assets are depreciated on a straight-line basis over the shorter of their estimated useful lives or the lease term. (ii) Operating leases - expense on straight-line basis over lease life Lease payments for operating leases, where substantially all of the risks and benefits remain with the lessor, are charged as expenses on a straight-line basis over the life of the lease term. Please refer to note 26 for additional details. Lease incentives received are recognised as an integral part of the total lease expense, over the term of the lease.
(t) Segment reporting Operating segments are reported in a manner consistent with the internal reporting provided by the chief operating decision maker. The chief operating decision maker, who is responsible for allocating resources and assessing performance of the operating segments, has been identified as the Managing Director. Please refer to note 3 for additional details.
(u) New and amended standards adopted by the Group The Group has applied and early adopted the following standards and amendments for the first time for their annual reporting period commencing 1 July 2015:
AASB 1057 Application of Australian Accounting Standards and AASB 2015-9 Amendments to Australian Accounting Standards – Scope and Application Paragraphs.
None of the new Standards and amendments to Standards that are mandatory or early adopted for the first time for the financial year beginning 1 July 2015 affected any of the amounts recognised in the current period or any prior period and are not likely to affect future periods. Additionally, they did not significantly affect the Group’s accounting policies or any of the disclosures.
(v) New accounting standards for application in future periods Certain new accounting Standards and Interpretations have been published that are not mandatory for 30 June 2016 reporting periods and have not been early adopted by the Group. The Group’s assessment of the impact of these new Standards and Interpretations is set out below. In all cases the Group intends to apply these standards from the application date as indicated in the table below.

Notes to the Consolidated Financial Statements For the Year Ended 30 June 2016
TOX FREE SOLUTIONS LTD | Annual Report | 30 June 2016 NOTES TO THE CONSOLIDATED FINANCIAL STATEMENTS Page 163 of 173
Reference Title Standard
application date
Group application
date Key Requirements Impact
AASB 9 Financial Instruments
1 January 2018
1 July 2018
AASB 9 addresses the classification, measurement and derecognition of financial assets and financial liabilities and introduces new rules for hedge accounting. In December 2014, the AASB made further changes to the classification and measurement rules and also introduced a new impairment model. These latest amendments now complete the financial instruments standard.
As reported in FY15, on adoption of this standard, there is no significant impact expected on the Group’s results and disclosures.
AASB 2015-2 Amendments to Australian Accounting Standards - Disclosure Initiative: Amendments to AASB 101
1 January 2016
1 July 2016
This standard makes amendments to AASB 101 Presentation of Financial Statements arising from the IASB’s Disclosure Initiative Project. The amendments are designed to further encourage companies to apply professional judgment in determining what information to disclose in the financial statements. The amendments also clarify that companies should use professional judgment in determining where and in what order in formation is to be presented in the financial disclosures.
There will be no significant impact on the Group’s results on the adoption of this standard.
The Group is currently reviewing financial report structures and disclosures.

Notes to the Consolidated Financial Statements For the Year Ended 30 June 2016
TOX FREE SOLUTIONS LTD | Annual Report | 30 June 2016 NOTES TO THE CONSOLIDATED FINANCIAL STATEMENTS Page 164 of 173
Reference Title Standard
application date
Group application
date Key Requirements Impact
AASB 15 Revenue from Contracts with Customers
1 January 2018
1 July 2018
The AASB has issued a new standard for the recognition of revenue. This will replace AASB 118 which covers contracts for goods and services and AASB111 which covers construction contracts.
The new standard is based on the principle that revenue is recognised when control of a good or service transfers to a customer, so the notion of control replaces the existing notion of risks and rewards.
The standard permits a modified retrospective approach for the adoption. Under this approach entities will recognise any applicable transitional adjustments in retained earnings on the date of the initial application (i.e. 1 July 2018) without restating the comparative period.
Entities will only need to apply the new rules to contracts that are not completed as of the date of initial application.
AASB 2015-8 amended the AASB 15 effective date so it is now effective for annual reporting periods commencing on or after 1 Janauary2018. Early application is permitted. AASB 2014-5 incorporates the consequential amendments to a number of Australian Accounting Standards (including interpretations) arising from the issuance of AASB 15. AASB 2016-3 provides additional guidance and examples on identifying performance obligations; principal v agent considerations and licensing.
The entity operates in the industrial services and waste management industry and recognises revenue for services when the amount of revenue can be reliably measured and it is probable that future economic benefits will flow to the entity.
Revenue is generally recognised upon delivery of the waste treatment service to the customer. For contract variations this requires estimates and judgements based on future economic benefit and is typically when the variations / overruns have been agreed with the customer.
When this standard is first adopted, revenue for services will instead be recognised when the transfer of promised services to customers depicts in an amount that reflects the fair consideration to which the entity expects to be entitled in exchange for those services.

Notes to the Consolidated Financial Statements For the Year Ended 30 June 2016
TOX FREE SOLUTIONS LTD | Annual Report | 30 June 2016 NOTES TO THE CONSOLIDATED FINANCIAL STATEMENTS Page 165 of 173
Reference Title Standard
application date
Group application
date Key Requirements Impact
(continued)
AASB 15
Revenue from Contracts with Customers
1 January 2018
1 July 2018
For routines and recurring types of performance obligations, the assessment of whether a customer receives the benefits of an entity’s performance as the entity performs and simultaneously consumes those benefits as they are received will be straightforward, in which the receipt and simultaneous consumption by the customer of the benefits of the entity’s performance can be readily identified.
Management is currently assessing the impact of the new standard on contract variations /overruns.
Comparatives will need to be retrospectively restated, either back to 1 July 2016 if the full retrospective transitional requirements are applied, or to 1 July 2017 if the modified retrospective transitional requirements are applied. Modified retrospective restatement requires that the cumulative effect of applying AASB 15 for the first time be recognised as an adjustment to the opening balance of retained earnings.

Notes to the Consolidated Financial Statements For the Year Ended 30 June 2016
TOX FREE SOLUTIONS LTD | Annual Report | 30 June 2016 NOTES TO THE CONSOLIDATED FINANCIAL STATEMENTS Page 166 of 173
Reference Title Standard
application date
Group application
date Key Requirements Impact
AASB 16 Leases 1 January 2019
1 July 2019
The key features of AASB 16 are as follows: Lessee accounting
Lessees are required to recognise assets and liabilities for all leases with a term of more than 12 months, unless the underlying asset is of a low value.
A lessee measures right-of-use assets similarly to other non-financial assets and lease liabilities similarly to other financial liabilities.
Assets and liabilities arising from a lease are initially measured on a present value basis. The measurement includes non-cancellable lease payments, and also includes payments to be made in optional periods if the lessee is reasonably certain to exercise an option to extend the lease, or not to exercise an option to terminate the lease.
AASB 16 contains disclosure requirements for leases. Lessor accounting
AASB 16 substantially carries forward the lessor accounting requirements in AASB 117. Accordingly, a lessor continues to classify its leases as operating leases or finance leases, and to account for those two types of leases differently.
AASB 16 also requires enhanced disclosures to be provided by lessors that will improve information disclosed about a lessor’s risk exposure, particularly to residual value risk.
To the extent that the entity, as lessee, has significant operating leases outstanding at the date of initial application, 1 July 2019, right-of-use assets will be recognised for the amount of the unamortised portion of the useful life, and lease liabilities will be recognised at the present value of the outstanding lease payments.
Thereafter, earnings before interest, depreciation, amortisation and tax (EBITDA) will increase because operating lease expenses currently included in EBITDA will be recognised instead as amortisation of the right-of-use asset, and interest expense on the lease liability. However, there will be an overall reduction in net profit before tax in the early years of a lease because the amortisation and interest charges will exceed the current straight-line expense incurred under AASB 117 Leases. This trend will reverse in the later years.
There will be no change to the accounting treatment for short-term leases less than 12 months and leases of low value items, which will continue to be expensed on a straight-line basis.

Notes to the Consolidated Financial Statements For the Year Ended 30 June 2016
TOX FREE SOLUTIONS LTD | Annual Report | 30 June 2016 NOTES TO THE CONSOLIDATED FINANCIAL STATEMENTS Page 167 of 173
Reference Title Standard
application date
Group application
date Key Requirements Impact
AASB 2016-1 Amendments to Australian Accounting Standards - Recognition of Deferred Tax Assets for Unrealised Losses (AASB 112)
1 January 2017
1 July 2017
This standard amends AASB 112 Income Taxes to clarify the requirements on recognition of deferred tax assets for unrealised losses on debt instruments measured at fair value.
There will be no significant impact on the Group’s results on the adoption of this standard.
AASB 2016-2 Amendments to Australian Accounting Standards - Disclosure Initiative: Amendments to AASB 107
1 January 2017
1 July 2017
This standard amends AASB 107 Statement of Cash Flows to require entities preparing financial statements in accordance with Tier 1 reporting requirements to provide disclosures that enable users of financial statements to evaluate changes in liabilities arising from financing activities, including both changes arising from cash flows and non-cash changes.
There will be no significant impact on the Group’s results on the adoption of this standard.
There are no other standards that are not yet effective and that would be expected to have a material impact on Toxfree in the current or future period and on foreseeable future transactions.

TOX FREE SOLUTIONS LTD | Annual Report | 30 June 2016 DIRECTORS’ DECLARATION Page 168 of 173
Director’s Declaration For the Year Ended 30 June 2016
The Directors of the Group declare that: 1. The financial statements and notes, as set out on pages 84 to 167, are in accordance with the
Corporations Act 2001, and:
a. comply with Accounting Standards, which, as stated in accounting policy note 34 to the financial statements, constitutes explicit and unreserved compliance with International Financial Reporting Standards (IFRS); the Corporations Regulations 2001; and other mandatory reporting requirements; and
b. give a true and fair view of the financial position as at 30 June 2016 and of the performance for
the year ended on that date of the Group; 2. the Chief Executive Officer and Chief Financial Officer have each declared that:
a. the financial records of the Group for the financial year have been properly maintained in accordance with section 286 of the Corporations Act 2001;
b. the financial statements and notes for the financial year comply with the Accounting Standards;
and
c. the financial statements and notes for the financial year give a true and fair view. 3. In the Directors' opinion, there are reasonable grounds to believe that the Group will be able to pay
its debts as and when they become due and payable. The Group and its wholly-owned subsidiaries have entered into a deed of cross-guarantee under which the Group and its subsidiaries guarantee the debts of each other. At the date of this declaration, there are reasonable grounds to believe that the companies which are party to this deed of cross guarantee will be able to meet any obligations or liabilities to which they are, or may become subject to, by virtue of the deed. This declaration is made in accordance with a resolution of the Board of Directors.
Director- Chairman Robert McKinnon
Director - Stephen Gostlow
Dated: 22nd August 2016

38 Station Street Subiaco, WA 6008 PO Box 700 West Perth WA 6872 Australia
Tel: +61 8 6382 4600 Fax: +61 8 6382 4601 www.bdo.com.au
BDO Audit (WA) Pty Ltd ABN 79 112 284 787 is a member of a national association of independent entities which are all members of BDO Australia Ltd ABN 77 050 110 275, an Australian company limited by guarantee. BDO Audit (WA) Pty Ltd and BDO Australia Ltd are members of BDO International Ltd, a UK company limited by guarantee, and form part of the international BDO network of independent member firms. Liability limited by a scheme approved under Professional Standards Legislation other than for the acts or omissions of financial services licensees
TOX FREE SOLUTIONS LTD | Annual Report | 30 June 2016 INDEPENDENT AUDITOR’S REPORT Page 169 of 173
INDEPENDENT AUDITOR’S REPORT
To the members of Tox Free Solutions Limited
Report on the Financial Report
We have audited the accompanying financial report of Tox Free Solutions Limited, which comprises the
consolidated balance sheet as at 30 June 2016, the consolidated statement of profit or loss,
consolidated statement of comprehensive income, the consolidated statement of changes in equity and
the consolidated statement of cash flows for the year then ended, notes comprising a summary of
significant accounting policies and other explanatory information, and the directors’ declaration of the
consolidated entity comprising the company and the entities it controlled at the year’s end or from
time to time during the financial year.
Directors’ Responsibility for the Financial Report
The directors of the company are responsible for the preparation of the financial report that gives a
true and fair view in accordance with Australian Accounting Standards and the Corporations Act 2001
and for such internal control as the directors determine is necessary to enable the preparation of the
financial report that gives a true and fair view and is free from material misstatement, whether due to
fraud or error. In Note 34(a), the directors also state, in accordance with Accounting Standard AASB
101 Presentation of Financial Statements, that the financial statements comply with International
Financial Reporting Standards.
Auditor’s Responsibility
Our responsibility is to express an opinion on the financial report based on our audit. We conducted our
audit in accordance with Australian Auditing Standards. Those standards require that we comply with
relevant ethical requirements relating to audit engagements and plan and perform the audit to obtain
reasonable assurance about whether the financial report is free from material misstatement.
An audit involves performing procedures to obtain audit evidence about the amounts and disclosures in
the financial report. The procedures selected depend on the auditor’s judgement, including the
assessment of the risks of material misstatement of the financial report, whether due to fraud or error.
In making those risk assessments, the auditor considers internal control relevant to the company’s
preparation of the financial report that gives a true and fair view in order to design audit procedures
that are appropriate in the circumstances, but not for the purpose of expressing an opinion on the
effectiveness of the company’s internal control. An audit also includes evaluating the appropriateness
of accounting policies used and the reasonableness of accounting estimates made by the directors, as
well as evaluating the overall presentation of the financial report.
We believe that the audit evidence we have obtained is sufficient and appropriate to provide a basis
for our audit opinion.

TOX FREE SOLUTIONS LTD | Annual Report | 30 June 2016 INDEPENDENT AUDITOR’S REPORT Page 170 of 173
Independence
In conducting our audit, we have complied with the independence requirements of the
Corporations Act 2001. We confirm that the independence declaration required by the Corporations
Act 2001, which has been given to the directors of Tox Free Solutions Limited, would be in the
same terms if given to the directors as at the time of this auditor’s report.
Opinion
In our opinion:
(a) the financial report of Tox Free Solutions Limited is in accordance with the Corporations Act
2001, including:
(i) giving a true and fair view of the consolidated entity’s financial position as at 30 June
2016 and of its performance for the year ended on that date; and
(ii) complying with Australian Accounting Standards and the Corporations Regulations 2001;
and
(b) the financial report also complies with International Financial Reporting Standards as
disclosed in Note 34(a).
Report on the Remuneration Report
We have audited the Remuneration Report included in pages 46 to 68 of the directors’ report for
the year ended 30 June 2016. The directors of the company are responsible for the preparation and
presentation of the Remuneration Report in accordance with section 300A of the Corporations Act
2001. Our responsibility is to express an opinion on the Remuneration Report, based on our audit
conducted in accordance with Australian Auditing Standards.
Opinion
In our opinion, the Remuneration Report of Tox Free Solutions Limited for the year ended 30 June
2016 complies with section 300A of the Corporations Act 2001.
BDO Audit (WA) Pty Ltd
Dean Just
Director
Perth, 22 August 2016

1
Shareholder Information For the Year Ended 30 June 2016
TOX FREE SOLUTIONS LTD | Annual Report | 30 June 2016 SHAREHOLDER INFORMATION Page 171 of 173
SHAREHOLDER INFORMATION
The shareholder information set out below was applicable as at 31 July 2016: 1. Distribution of Equity Securities
Range Total Holders Ordinary Shares % of Issued Capital
1 - 1,000 1,037 443,025 0.30
1,001 - 5,000 1,537 4,112,903 2.86
5,001 - 10,000 686 5,045,071 3.51
10,001 - 100,000 790 17,972,562 12.49
100,000 and over 50 116,346,108 80.84
Total 4,100 143,919,669 100.00
There were 309 holders of less than a marketable parcel of ordinary shares. 2. Twenty Largest Shareholders
Ordinary shares
Number held % of issued
shares
HSBC Custody Nominees (Australia) Limited 30,657,959 21.30
J P Morgan Nominees Australia Limited 26,908,980 18.70
Citicorp Nominees Pty Limited 11,125,505 7.73
National Nominees Limited 10,912,373 7.58
RBC Investor Services Australia Nominees Pty Ltd >BKCust A/C 9,160,000 6.36
Australian Foundation Investment Company Limited 8,645,268 6.01
BNP Paribas Noms Pty Ltd < DRP> 3,072,781 2.14
BNP Paribas Nominees Pty Ltd < Agency Lending DRP A/C> 1,351,344 0.94
Citicorp Nominees Pty Limited > Colonial First State Inv A/C 1,199,195 0.83
The Trust Company Superannuation Limited<GPMSF2> - Future Super A/C 1,102,800 0.77
Mirrabooka Investments Limited 1,000,000 0.69
Australian Executor Trustees Limited < No 1 Account > 863,475 0.60
Netwealth Investments Limited <Wrap Services A/C 827,884 0.58
Brispot Nominees Pty Ltd <House Head Nominee No 1 A/C> 795,271 0.55
Spar Nominees Pty Ltd 703,464 0.49
Stephen James Gostlow 653,387 0.45
Netwealth Investments Limited <Super Services A/C> 517,264 0.36
Venue Holdings Pty Ltd 500,000 0.35
Sareswood Proprietary Limited <MH Superannuation A/C> 444,437 0.31
Mowbray Pty Ltd <Robert Hallas S/Fund A/C> 400,857 0.28

Shareholder Information For the Year Ended 30 June 2016
TOX FREE SOLUTIONS LTD | Annual Report | 30 June 2016 SHAREHOLDER INFORMATION Page 172 of 173
3. Substantial Shareholders
The announced substantial Shareholders are set out below:
Shareholders
Number of shares
Australian Foundation Investment Company Limited 8,645,268
Investors Mutual Limited 10,760,000
Wellington Management Group LLP 13,467,722
4. Voting rights
Ordinary Shares On a show of hands, every member present at a meeting in person or by proxy shall have one vote and upon a poll, every member present or by proxy shall have one vote for every share held. Options and Rights No voting rights. 5. Options
Grant date
Number
No. of holders
Expiry date
Exercise price
23/11/10 500,000 1 01/11/16 $3.00
There are 500,000 Options issued to 1 executive under the Tox Free Solutions Long-Term Option Plan to take up ordinary shares. 6. Rights There are 481,087 Performance Rights issued to 11 executives under the Tox Free Solutions Limited free Long-Term Incentive Plan to take up ordinary shares. There are 2,334,038 Share Appreciation Rights issued to 11 executives under the Tox Free Solutions Limited Long-Term Incentive Plan to take up ordinary shares. 7. Securities Exchange Listing
Securities in Tox Free Solutions Limited (TOX) are quoted on the Australian Securities Exchange.

Shareholder Information For the Year Ended 30 June 2016
TOX FREE SOLUTIONS LTD | Annual Report | 30 June 2016 SHAREHOLDER INFORMATION Page 173 of 173
8. Shareholder Inquiries
Shareholders can obtain information about their shares or dividend payments by contacting the Company’s share registry: Computershare Investor Services Pty Ltd Level 11 172 St Georges Terrace PERTH WA 6000
TEL: 1300 787 272 9. Publications
The annual report is the main source of information for shareholders. 10. Tox Free Solutions Limited Website
Tox Free Solutions Limited has an internet address at www.toxfree.com.au
This contains the Company’s latest annual report and media statements released through the Australian Securities Exchange.