Embed Size (px)
Citation preview

2014 Annual Report of the Thrift Savings Plan Required by §105 of the
TSP Enhancement Act of 2009
March 1, 2016

Introduction In compliance with §105 of the TSP Enhancement Act of 2009, Public Law 111-
31, the Federal Retirement Thrift Investment Board (FRTIB) has prepared this annual report which outlines the status of the development and implementation of the mutual fund window in the Thrift Savings Plan (TSP) and provides participant statistics and diversity demographics of the investment manager of the assets in the Thrift Savings Fund as of December 31, 2014.
Mutual Fund Window
The FRTIB initiated discussions with the FRTIB Board Members (Board) and the Employee Thrift Advisory Council (ETAC) about the addition of a self-directed mutual fund option to the TSP investment lineup in 2009. In April of that year, the Board deadlocked on the decision to adopt a resolution in support of the mutual fund window (MFW) by a vote of two to two. The fifth Board member was not in attendance. ETAC members were similarly divided in their support for the mutual fund window.
In 2013, the FRTIB refocused its attention on the MFW option and assembled a cross-functional team with representation from its operations, legal, investment, finance, communications, research, and technology offices. The team presented its findings on industry offerings, participant interest, costs, and operational considerations to the Board and ETAC in May 2014. In November 2014, the FRTIB presented the results of additional research on the possible impact of a MFW option on the TSP.
As part of its research, the FRTIB surveyed 30,000 participants from a total of 96,500 participants who took a post-separation partial or full withdrawal in the first half of 2014. Also surveyed were the 10,200 participants who made an in-service age-based withdrawal during that same period. In addition to the survey, the FRTIB conducted focus group sessions to obtain additional color from survey respondents. Among those participants who took a post-separation withdrawal and responded to the survey, the top reason1 for withdrawing money was to access funds for a major expenditure or life event (36%). Interest in withdrawal flexibility not currently available through the TSP was mentioned as a reason by 27% and interest in additional investment options was cited as one of the top reasons by 23% of respondents. About one-fifth said they withdrew their money because they wanted a managed account; wanted investment advice; received a recommendation from a financial advisor to make the withdrawal; or had other reasons, such as account consolidation or a required minimum distribution. As a result of the survey and other information that had been gathered, the FRTIB concluded that there are three plan-design opportunities to improve customer satisfaction – more flexible withdrawal options, improved services related to investment guidance and advice, and the creation of greater investment flexibility. The creation of a MFW would address the concerns of limited investment flexibility
1 Respondents were allowed to select more than one reason for making a withdrawal from the TSP. Annual Report of the Thrift Savings Plan Page 2

expressed by 23% of those participants that executed post-separation and age-based in service withdrawals.
Through a MFW, the TSP could offer virtually any fund available in the
marketplace. However, some concern was expressed by ETAC about the potential cost of the funds available in the MFW option. In response to this concern, the FRTIB investigated the impact of placing a screen on funds based on costs, i.e., funds with expense ratios above 1.00% (100 basis points) would fail a screening test and be designated as unavailable for purchase. Focused particularly on those sectors where participants and/or advocacy groups have indicated an interest in adding a particular fund to the TSP’s core line-up, the chart below illustrates the impact of that screen:
Potential Impact of Restrictions on Fund Offerings
SECTOR FUND RESTRICTION
No Restriction
Net Expense Ratio 1% or less
Emerging Markets 221 9
Real Estate 95 14
Socially Responsible 85 15
The result of placing a screen on expense ratios was meaningful and would limit the availability of funds in some of the primary sectors that the FRTIB was seeking to make available. Accordingly, the FRTIB concluded that adding a screen is not desired.
After evaluating the information of these two in-depth studies, the Board asked the FRTIB to refine the $6 to $10 million implementation cost estimate from the initial study. This refinement required the examination of the business objectives for implementing a MFW, the identification of the business rules that apply to participants using the MFW and the changes required to the recordkeeping system to accommodate these rules, and the understanding of the costs and technology required to integrate a MFW platform with the TSP. The results of this third study were not completed by the end of 2014.
Investment Manager Diversity Demographics
The attached report (Appendix A) from TSP investment manager, BlackRock, provides a breakdown of its employee diversity.
TSP Participant Behavior and Demographics Report The 2014 Participant Behavior and Demographics Report is attached to this report as Appendix B. This report is an analysis of data extracted from the TSP and enhanced with additional indicative data provided by the Office of Personnel Management.
Annual Report of the Thrift Savings Plan Page 3

Appendix A
Annual Report of the Thrift Savings Plan Page 4

Thrift Savings Plan
Participant Behavior and Demographics
Analysis of 2010 – 2014
Appendix B

Introduction This analysis of Thrift Savings Plan (TSP) participant demographics prepared by the Federal Retirement Thrift Investment Board is based on participant data enhanced with additional indicative data from the Office of Personnel Management (OPM). The analysis of calendar year 2014 data is similar to analysis of data conducted in previous years. As with the 2013 report, the 2014 analysis will focus solely on participants in FERS, the Federal Employee Retirement System, as the participant population in the Civil Service Retirement System (CSRS) is a very small and declining segment of the TSP. Information from this analysis provides insight on demographics, investment behaviors and how plan design changes may influence participation and contribution behaviors. Finally, this analysis helps us identify trends with the participant usage of benefit options. Background The Federal Retirement Thrift Investment Board is an independent Federal agency that was established to administer the Thrift Savings Plan (TSP) under the Federal Employees’ Retirement System Act of 1986 (See 5 U.S.C. §§ 8351; 8401 et seq.). Similar to the type of savings and tax benefits that many private corporations offer their employees under I.R.C. §401(k) plans, the TSP provides Federal civilian employees and members of the uniformed services the opportunity to save for additional retirement security. The Agency’s mission is to act solely in the interest of its participants and beneficiaries. TSP participants can invest their employee and employer contributions in the following core funds:
• Government Securities Investment Fund (G Fund) • Fixed Income Index Investment Fund (F Fund) • Common Stock Index Investment Fund (C Fund) • Small Cap Stock Index Investment Fund (S Fund) • International Stock Index Investment Fund (I Fund)
In addition to these indexed core funds, participants may also invest in five Lifecycle Funds (L Funds). The L Funds are custom target-date funds invested exclusively in the G, F, C, S, and I Funds. During the period covered by this report, the TSP underwent two major plan design changes. The implementation of automatic enrollment occurred in August 2010, and the acceptance of Roth contributions commenced in May 2012. The ongoing impact of these changes on participant behavior will be discussed in this analysis.
2 | P a g e

Data Collection and Methodology This report is based on data extracted from the TSP recordkeeping system, which was enhanced with information from OPM. In each year covered by this report, the TSP provided extract data on the accounts of all TSP participants identified as active civilian Federal employees. OPM enhanced the data by comparing it to their database of Executive Branch and Postal Service employees and added data on participants’ annual salary, length of Federal service, employment (full-time vs. part-time) status, gender, race and ethnicity, and education.
Not all records for participants on the TSP extract can be matched with OPM data. In 2014, a total of over 2.6 million participants were identified by the TSP, and OPM returned data on approximately 2.4 million employees. A similar ratio of total records extracted to records matched was seen in other years covered by this report. The inability to match some TSP records to OPM data occurs when OPM or TSP data is incomplete. Additionally, since OPM does not collect data on employees of the Legislative and Judicial Branches, OPM is not able to match against those records. Part-time or intermittent employees are identified in the dataset; however, they are excluded from the analysis because their hourly work schedule (and therefore their actual compensation) is not known. While the TSP maintains records for a large number of retired or otherwise separated participants, such participants are not active and are therefore not considered within the context of this report. Lastly as previously noted, this report focuses solely on the FERS population, and records for approximately 129,000 CSRS participants were excluded from the analysis. See the table in Appendix A for a summary of the demographics of fulltime FERS participants included in this analysis. The tables in Appendices B and C provide additional demographic summaries of fulltime FERS participants based on their contributing or non-contributing status.
In this report, salaries are shown in quintiles. The first quintile represents the 20% of all records in the lowest annual salary band; the fifth quintile represents the 20% of records in the highest salary band. Data on salary ranges for the quintiles in each year can be found in Appendix D.
In summary, the analysis provided in this report is subject to the following limitations:
The exclusion of TSP accounts for employees of the Legislative and Judicial Branches may modestly distort the findings.
The exclusion of TSP accounts that cannot be matched with OPM data may modestly distort the findings.
The exclusion of TSP accounts for part-time and intermittent workers is likely to have a more meaningful impact on the findings. Since this group is likely to participate and contribute at lower rates than full-time employees, the findings may marginally overestimate the rates of participation and deferral of the total TSP participant base.
Employees’ actual deferral rates are not included in the TSP or OPM databases. Therefore, an approximation of annualized deferral rate is calculated by comparing the total employee contributions to the annual salary rate for each calendar year.
Analysis The following sections of this report examine the behaviors of FERS participants across a five-year timeframe ending December 31, 2014 and through the lens of six demographic filters –
3 | P a g e
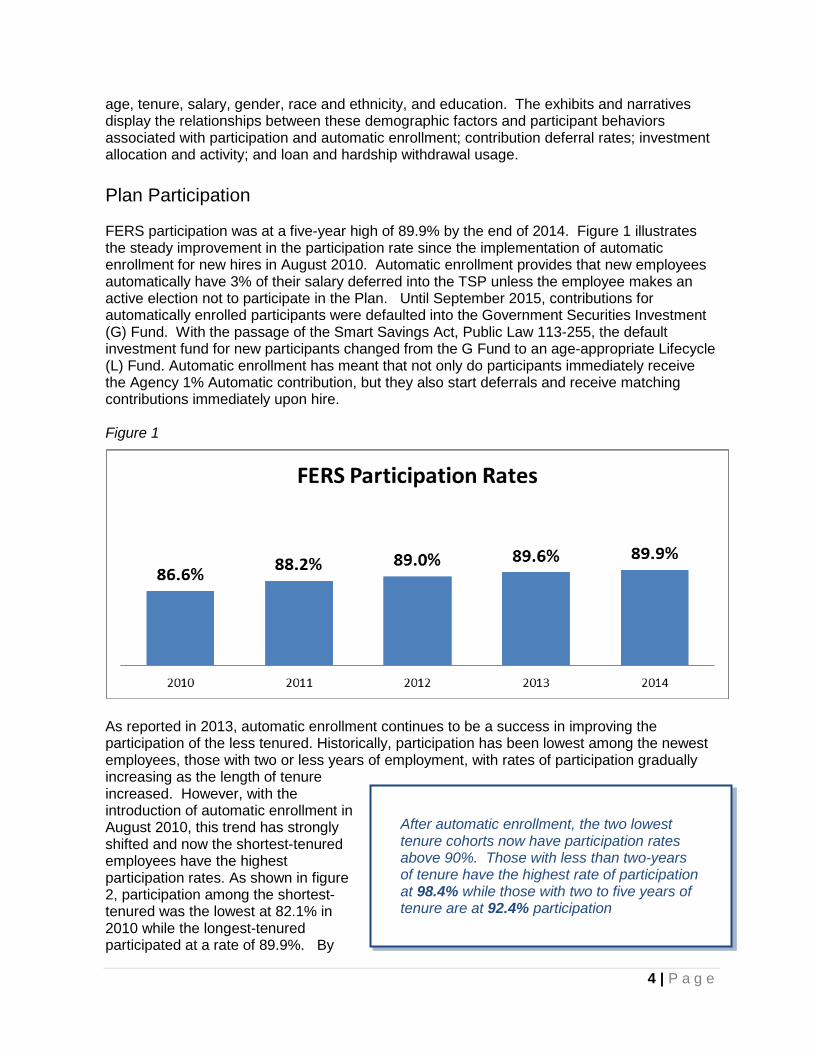
age, tenure, salary, gender, race and ethnicity, and education. The exhibits and narratives display the relationships between these demographic factors and participant behaviors associated with participation and automatic enrollment; contribution deferral rates; investment allocation and activity; and loan and hardship withdrawal usage. Plan Participation FERS participation was at a five-year high of 89.9% by the end of 2014. Figure 1 illustrates the steady improvement in the participation rate since the implementation of automatic enrollment for new hires in August 2010. Automatic enrollment provides that new employees automatically have 3% of their salary deferred into the TSP unless the employee makes an active election not to participate in the Plan. Until September 2015, contributions for automatically enrolled participants were defaulted into the Government Securities Investment (G) Fund. With the passage of the Smart Savings Act, Public Law 113-255, the default investment fund for new participants changed from the G Fund to an age-appropriate Lifecycle (L) Fund. Automatic enrollment has meant that not only do participants immediately receive the Agency 1% Automatic contribution, but they also start deferrals and receive matching contributions immediately upon hire. Figure 1
As reported in 2013, automatic enrollment continues to be a success in improving the participation of the less tenured. Historically, participation has been lowest among the newest employees, those with two or less years of employment, with rates of participation gradually increasing as the length of tenure increased. However, with the introduction of automatic enrollment in August 2010, this trend has strongly shifted and now the shortest-tenured employees have the highest participation rates. As shown in figure 2, participation among the shortest-tenured was the lowest at 82.1% in 2010 while the longest-tenured participated at a rate of 89.9%. By
After automatic enrollment, the two lowest tenure cohorts now have participation rates above 90%. Those with less than two-years of tenure have the highest rate of participation at 98.4% while those with two to five years of tenure are at 92.4% participation
4 | P a g e

2014, those with less than two years of tenure participated at a rate of 98.4% - the highest rate of participation among all tenure bands and more than 9% higher than the longest-tenured cohort. As times elapses since the implementation of automatic enrollment, its impact on other tenure cohorts becomes apparent. Participants with two to five years of tenure (92.4%) now participate at a rate higher than the longest-tenured (89.1%)
Figure 2
Automatic enrollment has also led to similar improvements in the participation of the youngest and lowest-paid. In 2010, the participation rate for the under age 29 cohort was the lowest among all age cohorts at 83.9%, while the age 60-69 cohort had the highest participation at 89.0%. By 2014, the youngest cohort had surpassed all other age cohorts and had the highest rate of participation – 94.6% while the second youngest cohort (age 30-39) trailed closed behind with a participation rate of 92.4%. In 2010, participation rates among the lowest-paid quintile trailed that of the highest paid by approximately 20%. By 2014, the difference between the two quintiles was reduced to 10%. However, it is worth noting that rate of improvement was not as significant among the second salary quintile – the lower paid. Participation among this group increased 0.8% from 83.4% in 2010 to 84.2% in 2014. When examining participation by race and ethnicity cohorts, participation among black, Native American, and multi-racial cohorts had the most improvement during this report period. However, participation among blacks at 83.7% lags significantly behind Asians who have the highest participation rate of 95.3%. It should be noted that males and females have consistently participated at nearly the same rate for each year in this reporting period. See Table 1 below:
Automatic enrollment has improved participation among the lowest paid by nearly 10%, growing from 76.2% in 2010 to 85.8% in 2014.
5 | P a g e
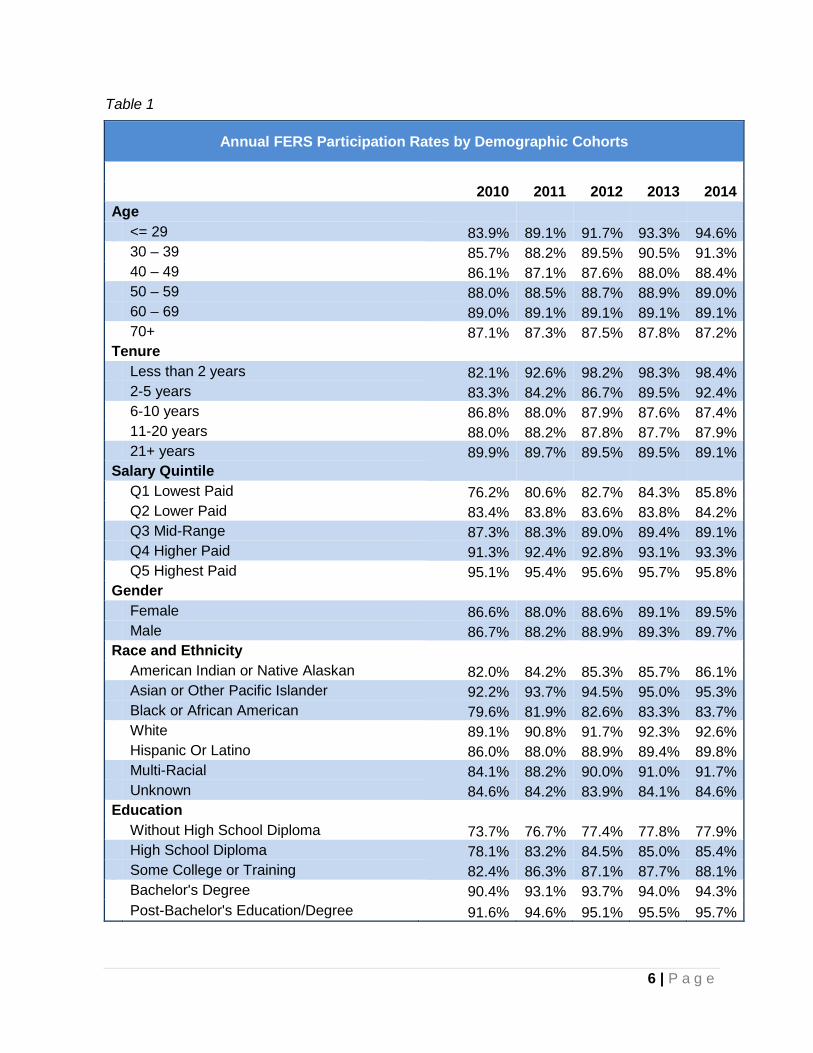
Table 1
Annual FERS Participation Rates by Demographic Cohorts
2010 2011 2012 2013 2014
Age <= 29 83.9% 89.1% 91.7% 93.3% 94.6% 30 – 39 85.7% 88.2% 89.5% 90.5% 91.3% 40 – 49 86.1% 87.1% 87.6% 88.0% 88.4% 50 – 59 88.0% 88.5% 88.7% 88.9% 89.0% 60 – 69 89.0% 89.1% 89.1% 89.1% 89.1% 70+ 87.1% 87.3% 87.5% 87.8% 87.2% Tenure
Less than 2 years 82.1% 92.6% 98.2% 98.3% 98.4% 2-5 years 83.3% 84.2% 86.7% 89.5% 92.4% 6-10 years 86.8% 88.0% 87.9% 87.6% 87.4% 11-20 years 88.0% 88.2% 87.8% 87.7% 87.9% 21+ years 89.9% 89.7% 89.5% 89.5% 89.1% Salary Quintile Q1 Lowest Paid 76.2% 80.6% 82.7% 84.3% 85.8% Q2 Lower Paid 83.4% 83.8% 83.6% 83.8% 84.2% Q3 Mid-Range 87.3% 88.3% 89.0% 89.4% 89.1% Q4 Higher Paid 91.3% 92.4% 92.8% 93.1% 93.3% Q5 Highest Paid 95.1% 95.4% 95.6% 95.7% 95.8% Gender Female 86.6% 88.0% 88.6% 89.1% 89.5% Male 86.7% 88.2% 88.9% 89.3% 89.7% Race and Ethnicity
American Indian or Native Alaskan 82.0% 84.2% 85.3% 85.7% 86.1% Asian or Other Pacific Islander 92.2% 93.7% 94.5% 95.0% 95.3% Black or African American 79.6% 81.9% 82.6% 83.3% 83.7% White 89.1% 90.8% 91.7% 92.3% 92.6% Hispanic Or Latino 86.0% 88.0% 88.9% 89.4% 89.8% Multi-Racial 84.1% 88.2% 90.0% 91.0% 91.7% Unknown 84.6% 84.2% 83.9% 84.1% 84.6% Education
Without High School Diploma 73.7% 76.7% 77.4% 77.8% 77.9% High School Diploma 78.1% 83.2% 84.5% 85.0% 85.4% Some College or Training 82.4% 86.3% 87.1% 87.7% 88.1% Bachelor's Degree 90.4% 93.1% 93.7% 94.0% 94.3% Post-Bachelor's Education/Degree 91.6% 94.6% 95.1% 95.5% 95.7%
6 | P a g e

While automatic enrollment has significantly increased participation among the newly hired, it has not, thus far, resulted in a significant increase in the number of participants who remain “unengaged” or otherwise make no investment/deferral election. The vast majority of auto-enrolled participants are remaining in the Plan, and of this population, 62.3% are actively making deferral rate changes, while others are showing signs of life by having made interfund transfers or other transactions. However, as shown in figure 3, those who remain in the auto-enrolled status (no deferral change or investment activity) are mostly in the lowest salary quintiles. Figure 3
Contribution Deferral Rates The FERS contribution deferral rate (includes employee Roth, traditional and catch-up contributions) has remained relatively flat during the five years since the implementation of automatic enrollment, dropping slightly to 8.1% in 2014 as shown in figure 4. While the FERS rate exceeds the 5.9% average deferral percent (ADP)2 of other defined contribution plans, it is significantly lower than the 9.5% FERS deferral rates of the mid-2000s. Although there may be a number of factors causing the decline in deferral rates, it must be noted that current rates are even lower than they were in 2008 and 2009 at the height of the economic downtown. In comparison, participation rates have improved steadily since the economic
2 “For [Non-highly compensated employees], the median ADP was 5.9% . . ., while the median ADP for [highly compensated employees was 7.0%. . . .” Deloitte, Annual Defined Contribution Benchmarking Survey – Ease of Use Drives Engagement in Saving for Retirement, 2015 Edition
Figure 4
7 | P a g e

downturn, largely attributable to automatic enrollment. While 62.3% of automatically-enrolled participants change their deferrals from the 3% default rate, automatic enrollment, nevertheless, appears to have had an overall dampening effect on deferral rates. Figure 5 illustrates the power of plan design on participant behavior. FERS participants receive dollar-for-dollar matching contributions on the first 3% of pay and 50 cents on the dollar on the next 2%. The full match is achieved with a 5% contribution. Consequently, deferral rates aggregate in the 5-6% range, with 30.5% of TSP contributors being in this range in 2014. Of significant note, 25.6% of participants are not receiving the full matching contribution as they are contributing less than 5%. Figure 5
As expected, the lowest-paid participants are deferring the least – 4.7% less than the highest paid. See table 2. However, with an average deferral rate of 5.1%, the lowest paid are receiving the full match. Also as expected, the youngest and shortest-tenured participants have the lowest deferral rates with deferrals steadily increasing with age and tenure. Deferral rates also increase in correlation with education level. During each year in this report period, males have contributed about six-tenths of one percent more than females. Deferral rates among blacks at 6.2%, significantly lags behind Asians who have the highest deferral rate of 10.0%, whites at 8.1% and Latinos at 7.5%.
Participants with less than two years of tenure had an average deferral rate of 3.7% in 2014. They are the only tenure cohort that is not, on average, receiving the full match.
8 | P a g e

Table 2
Annual FERS Deferral Rates by Demographic Cohorts
2010 2011 2012 2013 2014
Age <= 29 4.7% 5.0% 5.2% 4.9% 4.9% 30 – 39 6.1% 6.2% 6.3% 6.1% 6.1% 40 – 49 7.4% 7.4% 7.4% 7.1% 7.2% 50 – 59 9.1% 9.2% 9.2% 9.0% 9.0% 60 – 69 10.5% 10.5% 10.5% 10.3% 10.2% 70+ 11.9% 11.8% 11.9% 11.6% 11.4% Tenure
Less than 2 years 3.9% 4.2% 4.1% 3.8% 3.7% 2-5 years 6.4% 6.6% 6.6% 6.3% 6.4% 6-10 years 7.8% 7.9% 7.9% 7.6% 7.6% 11-20 years 8.6% 8.8% 8.7% 8.6% 8.7% 21+ years 9.4% 9.4% 9.5% 9.4% 9.4% Salary Quintile Q1 Lowest Paid 5.1% 5.2% 5.4% 5.1% 5.1% Q2 Lower Paid 7.3% 7.5% 7.5% 7.4% 7.4% Q3 Mid-Range 7.6% 7.5% 7.5% 7.3% 7.5% Q4 Higher Paid 8.4% 8.7% 8.8% 8.6% 8.7% Q5 Highest Paid 9.7% 9.7% 9.8% 9.7% 9.8% Gender Female 7.4% 7.4% 7.5% 7.4% 7.4% Male 8.0% 8.1% 8.1% 8.0% 8.0% Race and Ethnicity
American Indian or Native Alaskan 6.2% 6.2% 6.2% 6.1% 6.2% Asian or Other Pacific Islander 9.6% 9.7% 9.9% 9.8% 10.0% Black or African American 5.7% 5.8% 5.9% 5.8% 5.9% White 8.0% 8.1% 8.2% 8.0% 8.1% Hispanic Or Latino 7.3% 7.5% 7.6% 7.4% 7.5% Multi-Racial 6.5% 6.7% 6.9% 6.7% 6.8% Unknown 8.1% 8.1% 8.0% 7.9% 7.8% Education
Without High School Diploma 5.8% 5.9% 5.9% 5.7% 5.8% High School Diploma 6.6% 6.7% 6.8% 6.5% 6.6% Some College or Training 7.1% 7.1% 7.2% 6.9% 7.0% Bachelor's Degree 8.2% 8.4% 8.5% 8.3% 8.5% Post-Bachelor's Education/Degree 8.7% 8.8% 8.9% 8.8% 8.9%
9 | P a g e

Roth TSP was introduced in May 2012. With Roth TSP, paticipants make contributions from after-tax dollars, and their earnings on these contributions are tax-free at withdrawal as long as certain IRS requirements are met. While the majority of participants continue to defer only traditional (pre-tax) contributions, deferrals to Roth TSP are increasing. For those contributing to Roth, their average deferrals were 4.9% as opposed to the average traditional deferral of 7.6%. (Roth and traditional average deferral rates do not include catch-up contributions which are reflected in the deferral rates shown in Figures 4 and 5.) Roth deferral rates are highest among older participants, as well as the most-tenured and highest-paid. However, all demographic cohorts experienced an increase in Roth deferrals in 2014. Table 3
FERS Traditional and Roth Deferral Rates
by Demographic Cohorts
2013 2014
Traditional Roth Traditional Roth
Age <= 29 4.6% 3.5% 4.5% 3.9% 30 – 39 5.8% 3.5% 5.8% 3.9% 40 – 49 7.0% 3.5% 6.9% 3.9% 50 – 59 8.4% 4.2% 8.4% 4.7% 60 – 69 9.5% 5.6% 9.4% 6.0% 70+ 10.6% 6.1% 10.4% 6.8% Tenure
Less than 2 years 3.4% 3.1% 3.2% 3.2% 2-5 years 6.0% 3.8% 5.9% 4.4% 6-10 years 7.2% 3.8% 7.2% 4.2% 11-20 years 8.2% 4.0% 8.3% 4.4% 21+ years 8.9% 4.2% 8.9% 4.6% Salary Quintile Q1 Lowest Paid 5.0% 3.0% 4.8% 3.4% Q2 Lower Paid 7.2% 3.7% 7.1% 4.1% Q3 Mid-Range 7.0% 3.7% 7.2% 4.3% Q4 Higher Paid 8.2% 4.1% 8.3% 4.5% Q5 Highest Paid 9.1% 4.4% 9.1% 4.8%
10 | P a g e

Investment Allocation and Inactivity In Figure 6, we note that allocations to the G Fund appropriately increase as the age of the TSP’s population increases. This behavior is consistent with the expectation that participants shift their investment allocation toward the relative safety of income producing assets as they approach retirement age. The noteworthy exception to this observation is in the grouping of participants aged 29 and under. In this age cohort, we note that participants invest a disproportionate percentage (41.7%) of their accounts in the G Fund, probably as a result of the default investment option being the G Fund. This is an improvement from 2013 when the youngest participants held 43.6% of their assets in the G Fund. Figure 6
We note that the shortest-tenured participants, those with less than two years of tenure, have the highest allocation to the G Fund, approximately 54.9%. Although we previously noted that the majority of automatically enrolled participants changed their contribution deferral rate, this concentration in the G Fund suggests that these participants are not “engaging” and shifting their investments away from the default allocation of the G Fund. Further, the lowest-paid participants have approximately 53.8% allocated to the G fund as compared to the highest paid who allocated only 25.6% to the G Fund. Females had a slightly higher allocation to the G Fund at 34.4% as compared to males at 30.8%. Additionally, blacks are allocated 41.4% to the G Fund, well above the allocation levels Asians at 30.2% and whites at 27.9%. See Table 4. When examining L Fund allocations, the two youngest age cohorts had the highest level of usage at 29.2% and 28.7% while the two oldest age cohorts had L Fund allocations of 14.0% and 8.5%. We also want to note that L Fund usage is highest among the 2-5 years tenure cohort (26.8%) and the 6-10 years group (27.3%). The majority of the participants in these two cohorts began Federal service after the implementation of the L Funds in 2005. Usage of the L Funds drops off somewhat with the less than two years tenure cohort (19.2%), where the
The youngest participants who have the longest time horizon to reap the benefits of compounding returns have 41.7% of their assets invested in the G Fund.
11 | P a g e

impact of auto-enrollment and inertia are likely factors. This group was also the only cohort that did not experience an uptick in L Fund allocations in 2014. With the change to the default investment fund in 2015, the L Funds allocation for this cohort is likely to change. See Table 4. Table 4
2014 Investment Allocations by Demographic Cohorts
G Fund F Fund C Fund S Fund I Fund L Funds
Age <= 29 41.7% 1.7% 12.4% 10.1% 4.9% 29.2% 30 – 39 28.2% 2.7% 19.4% 13.4% 7.7% 28.7% 40 – 49 24.9% 4.1% 32.6% 13.1% 6.5% 18.8% 50 – 59 33.4% 5.1% 30.1% 10.3% 4.7% 16.4% 60 – 69 41.6% 6.0% 26.2% 8.4% 3.8% 14.0% 70+ 47.5% 6.2% 26.9% 7.5% 3.3% 8.5% Tenure
Less than 2 years 54.9% 1.9% 12.5% 7.8% 3.7% 19.2% 2-5 years 42.1% 3.0% 13.6% 9.9% 4.7% 26.8% 6-10 years 34.9% 3.2% 15.8% 12.0% 6.8% 27.3% 11-20 years 27.6% 5.0% 30.9% 12.7% 6.4% 17.4% 21+ years 33.1% 5.2% 32.6% 9.9% 4.3% 14.9% Salary Quintile Q1 Lowest Paid 53.8% 3.5% 17.7% 7.5% 4.1% 13.4% Q2 Lower Paid 43.8% 4.8% 27.0% 8.3% 4.1% 12.0% Q3 Mid-Range 38.6% 4.6% 25.6% 9.9% 4.9% 16.4% Q4 Higher Paid 31.1% 4.4% 26.1% 12.1% 5.9% 20.4% Q5 Highest Paid 25.6% 5.1% 32.9% 11.9% 5.5% 19.0% Gender Female 34.4% 5.1% 28.4% 9.4% 4.9% 17.7% Male 30.8% 4.5% 29.4% 11.9% 5.5% 17.8% Race and Ethnicity
American Indian or Native Alaskan 39.2% 4.7% 25.9% 10.1% 4.7% 15.4% Asian or Other Pacific Islander 30.2% 4.6% 29.1% 13.1% 6.3% 16.6% Black or African American 41.4% 4.7% 25.5% 9.6% 5.0% 13.8% White 27.9% 4.7% 29.9% 11.5% 5.5% 20.4% Hispanic Or Latino 34.1% 4.0% 26.4% 12.5% 6.1% 16.9% Multi-Racial 31.8% 4.2% 24.2% 12.4% 6.2% 21.3% Unknown 42.1% 5.2% 29.1% 8.5% 3.9% 11.1% Education
Without High School Diploma 48.2% 4.3% 24.0% 8.1% 4.4% 11.1% High School Diploma 38.7% 3.9% 23.7% 10.9% 5.5% 17.3% Some College or Training 37.0% 4.3% 25.6% 10.9% 5.1% 17.0%
12 | P a g e
Bachelor's Degree 27.4% 4.5% 30.8% 12.2% 5.6% 19.4% Post-Bachelor's Education/Degree 25.9% 5.3% 31.1% 11.3% 5.7% 20.7%
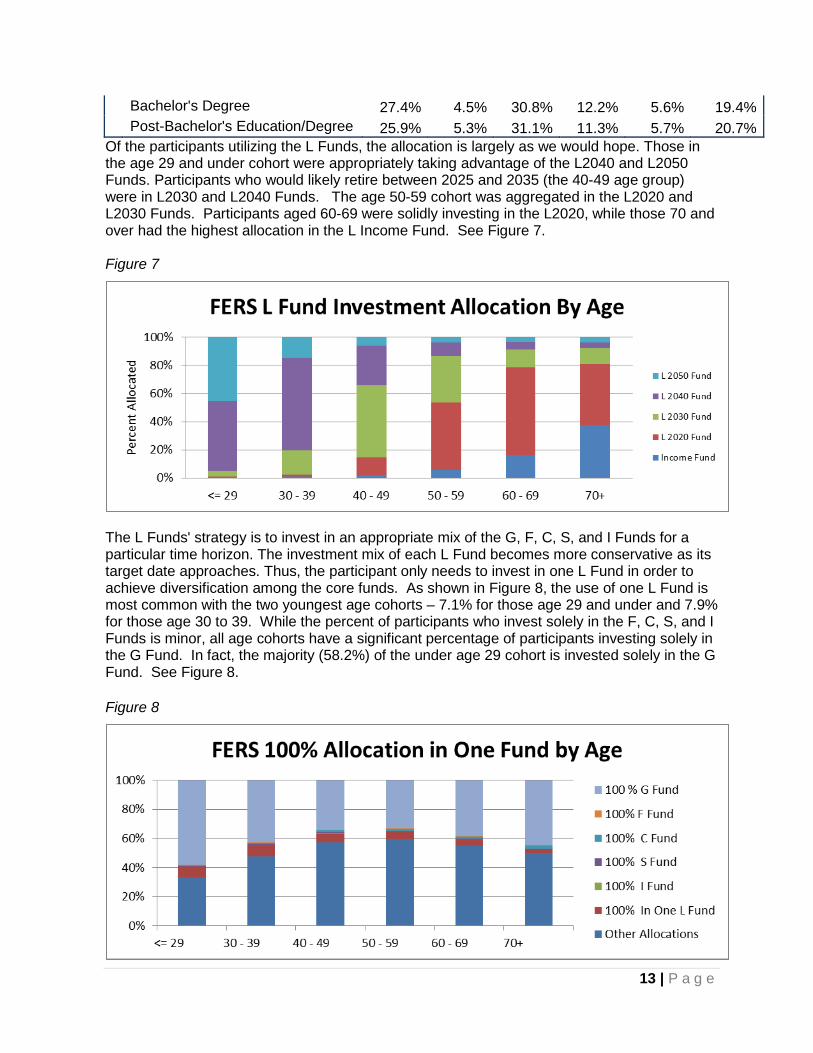
Of the participants utilizing the L Funds, the allocation is largely as we would hope. Those in the age 29 and under cohort were appropriately taking advantage of the L2040 and L2050 Funds. Participants who would likely retire between 2025 and 2035 (the 40-49 age group) were in L2030 and L2040 Funds. The age 50-59 cohort was aggregated in the L2020 and L2030 Funds. Participants aged 60-69 were solidly investing in the L2020, while those 70 and over had the highest allocation in the L Income Fund. See Figure 7. Figure 7
The L Funds' strategy is to invest in an appropriate mix of the G, F, C, S, and I Funds for a particular time horizon. The investment mix of each L Fund becomes more conservative as its target date approaches. Thus, the participant only needs to invest in one L Fund in order to achieve diversification among the core funds. As shown in Figure 8, the use of one L Fund is most common with the two youngest age cohorts – 7.1% for those age 29 and under and 7.9% for those age 30 to 39. While the percent of participants who invest solely in the F, C, S, and I Funds is minor, all age cohorts have a significant percentage of participants investing solely in the G Fund. In fact, the majority (58.2%) of the under age 29 cohort is invested solely in the G Fund. See Figure 8. Figure 8
13 | P a g e

Figure 9 below reports on the percentage of participants who have not engaged in any investment activity, i.e., they did not change how their contributions are invested or make a change to their existing investment allocation in 2014. As illustrated in the chart, the majority of participants do not actively manage their TSP accounts. In 2014, there was nearly a two percent increase in the number of participants who did initiate any investment activity. When examining investment inactivity by other demographic filters, only two cohorts had less than 80% inactive participants – highest paid at 78.2% and tenured 21 or more years at 79.9%. Figure 9
Loan and Hardship Withdrawal Usage The TSP allows two types of loans – general purpose and residential. A general purpose loan has a repayment term of 1 to 5 years, while a residential loan for the purchase of a primary residence has a repayment term of 1 to 15 years. Participants may have only one of each loan type outstanding at the same time. Participants may only borrow their employee contributions and the minimum loan amount is $1,000. Loan usage has consistently been highest among the 30-39 and 40-49 age cohorts, with approximately 11% of the participants in each cohort receiving a loan in 2014. This is approximately a one percent drop from 2013 loan usage rates for both cohorts. In fact, all age groups experienced a decrease in loan usage in 2014. See figure 10 for loan usage by age cohort for each year in the reporting period.
14 | P a g e

Figure 10
When automatic enrollment was introduced to the Plan, there was residual concern that participants who could not truly afford to contribute would access their TSP funds via a loan or hardship withdrawal at higher rates than those who intentionally elected to contribute. However, as illustrated in Figure 11, loan usage among those were auto-enrolled is miniscule. (Note: Chart does not include 2010 data because automatic enrollment was not introduced until August of that year.) Loan usage is higher among those participants who opted out of automatic enrollment, suggesting that this is population that could not afford to contribute. Nonetheless, only 2.8 of this cohort received a loan in 2014 as compared to 7.7 loan usage rate for those participants who elected to contribute to the Plan. Figure 11
Loan usage is fairly low among the least-tenured at 3.7%. However, as participants move into the 2-5 year tenure cohort and accrue assets, loan usage jumps to 9.4% and remains at approximately 10% for all other cohorts. Loan usage is fairly even among all salary quintiles, ranging from approximately 10% to 11% for four out of the five quintiles. The loan usage rate
15 | P a g e

among the highest paid was at 7.1% in 2014. Males and females also had similar rates of loan usage with 9.1% of males and10.2% of females receiving loans in 2014. However, there is noticeable difference in loan usage among educational and racial/ethnic cohorts. Loan usage drops off with an increased level of education. Only 6.4% of participants with post-bachelor’s education received a loan in 2014 as compared to nearly double that amount among those without a high school diploma (12.4%). There is a similar disparity in loan usage among racial and ethnic cohorts with whites and Asians having significantly lower loan usage than other groups. Participants may take a hardship withdrawal if they have a financial need as the result of a recurring negative cash flow, medical expenses, a personal casualty loss, or legal expenses associated with a divorce. Participants may only withdraw their employee contributions, and the minimum withdrawal amount is $1,000. In addition to a 10% early withdrawal penalty if the participant is younger than 59 ½, employee contributions are suspended for six months after a hardship withdrawal. As a result of the employee contribution suspension, FERS participants do not receive any Agency Matching Contributions during this period. Hardship withdrawal usage is consistently highest among the age 40-49 cohort, with 4% to 5% of participants in this cohort receiving a hardship withdrawal during the five years covered in this report. All cohorts experienced a slight decrease in hardship withdrawal usage in 2014 over the previous year. Figure 12
There is a stair-step pattern of hardship withdrawal usage among the salary quintiles, with usage generally declining as salary levels increase. See figure 13. However, the first quintile presents an exception to this pattern, as hardship withdrawals were lower than those of the next highest quintile in each of the years examined. It is important to note that hardship withdrawal usage is lower than loan usage among all salary quintiles. In 2014, the second salary quintile had the highest usage rate at 5.5%, which is half percent drop from the previous
16 | P a g e

year. When examining tenure cohorts, there is also a stair-step pattern with usage steadily increasing with tenure until it drops off for those with 21 plus years. Among other cohorts, more females (4.5%) than males (2.8%) received hardship withdrawals in 2014, while blacks (7.3%) received more hardship withdrawals than other racial and ethnic cohorts. Figure 13
As with loan usage, hardship withdrawal usage among those who were auto-enrolled is miniscule. (Note: Chart does not include 2010 data because automatic enrollment was not introduced until August of that year.) However, hardship withdrawal usage is highest (4.6%) among those participants who opted out of automatic enrollment, again suggesting that this is population that could not afford to contribute. It is important to note that since the implementation of automatic enrollment, the opt-out rate has not exceeded 4% of participants. Defined contribution surveys indicate that 68% of plans have an opt-out rate of 5% or less.3
3Deloitte, Annual Defined Contribution Benchmarking Survey – Ease of Use Drives Engagement in Saving for Retirement, 2015 Edition
17 | P a g e

Figure 14
18 | P a g e

Summary The analysis reveals an improvement in the FERS participation with a five-year high of 89.9% by the end of 2014. However, the average contribution deferral rate dropped to 8.1% - the lowest rate in this reporting period. Automatic enrollment was a contributing factor to both of these observations. Automatic enrollment continues to improve participation among the shortest-tenured participants. Participants with less than two-years of tenure now participate at a rate of 98.4% – the highest rate of participation among all tenure bands. When examining participation through salary, gender, race/ethnicity, and education filters, virtually every cohort experienced an improved participation rate in 2014. The analysis also revealed that the vast majority of auto-enrolled participants have “engaged” with 62.3% making deferral changes. Nevertheless, the only participant cohort that was hired entirely after the introduction of automatic enrollment in August 2010 has experienced a dip in deferral rates, down to 3.7% in 2014. This lowest tenured cohort is the only cohort not contributing at a level which results in receiving the full Agency match. While deferral rates continue to aggregate in the 5-6% range, with 30.5% of TSP contributors falling in this range, nearly 75% of FERS participants are estimated to be receiving the full match. Participants are gradually increasing their contributions to Roth TSP with average Roth deferral rates growing by a half percent to 4.9% in 2014. Participants aged 29 and under continue to have a disproportionate percentage (41.7%) of their account balances in the G Fund although this is an improvement from 2013 when 43.6% of their balances where in the G Fund. However, this group also has the highest utilization of the L Funds (29.2%). We further note that L Fund usage is highest among the 2-5 year tenure cohort (26.8%) and the 6-10 years group (27.39%). The majority of these cohorts were hired after the implementation of the L Funds in August 2005. Overall, participants are investing in the L Fund in a manner appropriate for their age cohort. Loan usage rates are evenly distributed among salary quintiles and between males and females. However, noticeable differences were identified among educational and racial/ethnic cohorts. Among age cohorts, the 30-39 and 40-49 age cohorts have the highest loan usage rate at approximately 11% each although loan usage dropped among all age cohorts in 2014. The age 40-49 cohort also had the highest hardship withdrawal usage, with 4% to 5% of participants in this cohort receiving a hardship withdrawal in each year of this reporting period. It was also found that Blacks utilize loans and hardship withdrawals significantly more than white and Asian participants. Participants who were auto-enrolled and continue to contribute have loan and hardship usage withdrawal rate significantly lower than those who elected to contribute to the Plan. However, those participants who opted out of automatic enrollment had the highest rate of hardship withdrawal usage, with 4.6% of these participants taking a withdrawal.
19 | P a g e

Appendix A
Summary of FERS Demographic Statistics All FERS Fulltime
2010 2011 2012 2013 2014
Participant Count 2,115,082 2,155,342 2,136,325 2,157,260 2,164,712 Age <=29 10.5% 7.3% 5.2% 4.0% 3.1% 30-39 21.3% 19.8% 18.4% 18.1% 17.2% 40-49 34.3% 34.5% 33.8% 32.8% 31.5% 50-59 26.5% 29.7% 32.5% 34.2% 36.1% 60-69 7.0% 8.2% 9.5% 10.2% 11.4% 70+ 0.4% 0.5% 0.6% 0.6% 0.8% Tenure < 2 years 14.9% 6.4% 1.2% 1.2% 1.1% 2-5 years 24.3% 28.7% 26.6% 20.6% 13.8% 6-10 years 19.6% 19.8% 21.8% 23.7% 27.1% 11-20 years 23.5% 24.8% 27.6% 31.0% 32.5% 21+ years 17.8% 20.2% 22.9% 23.6% 25.5% Gender Female 41.9% 41.7% 41.7% 41.7% 41.7% Male 58.1% 58.3% 58.3% 58.3% 58.3% Race and Ethnicity American Indian or Native Alaskan 1.4% 1.4% 1.4% 1.3% 1.3% Asian or Other Pacific Islander 4.7% 4.8% 4.9% 5.0% 5.1% Black or African American 13.9% 13.9% 14.0% 14.3% 14.3% White 52.3% 52.4% 52.4% 52.5% 52.1% Hispanic Or Latino 6.3% 6.4% 6.5% 6.6% 6.6% Multi-Racial 0.7% 0.9% 1.0% 1.1% 1.2% Unknown 20.7% 20.2% 19.8% 19.1% 19.3% Education Without High School Diploma 0.4% 0.4% 0.4% 0.4% 0.4% High School Diploma 21.5% 21.4% 20.8% 20.6% 20.5% Some College or Training 19.2% 19.1% 19.1% 19.0% 18.7% Bachelor's Degree 20.9% 21.2% 21.4% 21.7% 21.7% Post-Bachelor's Education/Degree 17.2% 17.8% 18.4% 19.2% 19.4% Unknown 20.7% 20.1% 19.8% 19.1% 19.4% Average Age 48.6 47.9 47.4 46.7 47.0 Average Tenure 12.1 11.9 12.4 12.7 13.0 Average Salary $70,065 $71,425 $72,472 $73,892 $74,695 Average TSP Balance $77,617 $81,924 $93,445 $109,631 $117,946
20 | P a g e

Appendix B
Summary of FERS Demographic Statistics FERS Fulltime Contributing
2010 2011 2012 2013 2014
Participant Count 1,946,863 2,003,804 2,001,235 2,026,044
2,041,875 Age <=29 8.7% 8.4% 7.6% 7.0% 6.7% 30-39 19.8% 20.0% 20.1% 20.7% 21.0% 40-49 32.5% 31.4% 30.1% 28.8% 27.6% 50-59 29.7% 30.6% 31.8% 32.6% 33.3% 60-69 8.7% 9.1% 9.8% 10.2% 10.8% 70+ 0.5% 0.5% 0.6% 0.6% 0.7% Tenure < 2 years 10.9% 11.6% 9.0% 8.8% 8.6% 2-5 years 19.5% 21.0% 22.1% 21.3% 19.5% 6-10 years 19.7% 19.6% 20.0% 20.1% 21.6% 11-20 years 26.3% 24.7% 24.9% 26.3% 26.9% 21+ years 23.6% 23.1% 24.0% 23.4% 23.4% Gender Female 42.9% 42.5% 42.6% 42.6% 42.4% Male 57.1% 57.5% 57.4% 57.4% 58.3% Race and Ethnicity American Indian or Native Alaskan 1.4% 1.4% 1.4% 1.4% 1.3% Asian or Other Pacific Islander 5.0% 5.1% 5.2% 5.3% 5.4% Black or African American 12.5% 12.8% 12.9% 13.3% 13.2% White 53.3% 53.7% 53.9% 54.3% 53.7% Hispanic Or Latino 6.1% 6.4% 6.5% 6.6% 6.6% Multi-Racial 0.7% 0.9% 1.0% 1.2% 1.3% Unknown 21.1% 19.8% 19.1% 17.9% 18.5% Education Without High School Diploma 0.4% 0.4% 0.4% 0.3% 0.3% High School Diploma 20.0% 20.2% 19.9% 20.0% 19.8% Some College or Training 18.4% 18.6% 18.6% 18.6% 18.2% Bachelor's Degree 21.6% 21.9% 22.2% 22.5% 22.4% Post-Bachelor's Education/Degree 18.5% 19.1% 19.8% 20.6% 20.7% Unknown 21.1% 19.8% 19.1% 17.9% 18.5% Average Age 48.7 47.9 47.4 46.6 46.9 Average Tenure 12.1 11.8 12.2 12.4 12.8 Average Salary $72,107 $73,143 $74,055 $75,374 $76,073 Average TSP Balance $88,299 $91,012 $102,937 $120,163 $128,457
21 | P a g e

Appendix C
Summary of FERS Demographic Statistics FERS Fulltime Non-contributing
2010 2011 2012 2013 2014
Participant Count 323,529 279,948 259,894 249,699 238,470 Age <=29 12.1% 8.1% 5.8% 4.5% 3.5% 30-39 21.6% 20.0% 18.7% 18.3% 17.4% 40-49 33.0% 33.9% 33.3% 32.2% 31.1% 50-59 25.5% 29.0% 31.8% 33.6% 35.5% 60-69 7.2% 8.3% 9.6% 10.5% 11.6% 70+ 0.6% 0.7% 0.8% 0.9% 1.0% Tenure < 2 years 16.6% 6.9% 1.4% 1.4% 1.4% 2-5 years 26.8% 30.4% 28.1% 21.9% 14.7% 6-10 years 18.9% 19.9% 22.1% 24.2% 27.7% 11-20 years 21.8% 23.9% 26.8% 30.2% 31.9% 21+ years 15.9% 19.0% 21.6% 22.3% 24.4% Gender Female 44.3% 43.3% 43.4% 43.6% 43.6% Male 55.7% 56.7% 56.6% 56.4% 56.4% Race and Ethnicity American Indian or Native Alaskan 2.0% 2.0% 2.0% 2.0% 2.0% Asian or Other Pacific Islander 2.9% 2.7% 2.5% 2.5% 2.4% Black or African American 20.7% 20.7% 21.3% 21.9% 22.3% White 42.9% 40.3% 38.6% 38.4% 37.6% Hispanic Or Latino 6.9% 6.6% 6.5% 6.8% 6.8% Multi-Racial 0.9% 0.9% 0.9% 1.0% 1.0% Unknown 23.6% 26.8% 28.3% 27.4% 28.0% Education Without High School Diploma 0.8% 0.8% 0.8% 0.8% 0.8% High School Diploma 32.1% 30.5% 29.2% 29.8% 29.5% Some College or Training 22.1% 21.6% 21.5% 21.6% 21.4% Bachelor's Degree 12.4% 12.0% 11.8% 12.0% 11.9% Post-Bachelor's Education/Degree 8.8% 8.4% 8.3% 8.3% 8.3% Unknown 23.8% 26.8% 28.3% 27.4% 28.0% Average Age 47.4 47.8 47.9 47.5 48.2 Average Tenure 9.6 10.8 12.2 13.0 14.3 Average Salary $56,461 $59,248 $60,574 $61,394 $63,616 Average TSP Balance $13,333 $16,877 $20,355 $24,182 $27,949
22 | P a g e

Appendix D
FERS Salary Quintiles
FERS Salary Quintiles
Year
Count Salary
Number of Participant
s Quintile 1
Lowest Paid Quintile 2
Lower Paid Quintile 3
Mid-Range Quintile 4
Higher Paid Quintile 5
Highest Paid
Bottom Top Bottom Top Bottom Top Bottom Top Bottom Top 2014
EE Count 2,156,644 1 431,32
9 431,33
0 862,65
8 862,65
9 1,293,98
7 1,293,98
8 1,725,31
6 1,725,31
7 2,156,64
4
Salary $10,000
$50,932
$50,932 58446 58446 $74,560 $74,560 $98,916 $98,916 $230,700
2013 Count 2,150,861 1 430,17
2 430,17
3 860,34
4 860,34
5 1,290,51
6 1,290,51
7 1,720,68
8 1,720,68
9 2,150,56
0
Salary $10,000
$50,611
$50,611
$57,219
$57,219 $73,420 $73,420 $97,701 $97,701 $230,700
2012 Count 2,130,944 1 426,18
9 426,19
0 852,37
8 852,37
8 1,278,56
7 1,278,56
8 1,704,75
6 1,704,75
7 2,130,94
4
Salary $10,000
$48,775
$49,775
$56,508
$56,508 $71,201 $71,201 $95,459 $95,459 $230,700
2011 Count 2,150,461 1 430,09
3 430,09
4 860,18
5 860,18
6 1,290,27
7 1,290,27
8 1,720,36
9 1,720,37
0 2,150,46
1
Salary $10,000
$49,075
$49,075
$56,508
$56,508 $70,062 $70,062 $94,551 $94,551 $230,700
2010 Count 2,110,401 1 422,08
1 422,08
2 844,16
1 844,16
2 1,266,24
1 1,266,24
2 1,688,32
1 1,688,32
2 2,110,40
0
Salary $10,000
$47,900
$47,900
$55,530
$55,530 $67,762 $67,762 $92,431 $92,431 $230,700
23 | P a g e