Embed Size (px)
Citation preview

1
Incorporating Financial Results for the twelve months ended 31 December 2014
ANNUALREPORT

2

3

4

5
01 STRATEGIC REPORTFinancial Highlights 8
Galasys At a Glance 10
Products and Services 11
Chairman’s Statement 16
Chief Executive Officer’s Statement 18
Principal Risks and Uncertainties 21
02 CORPORATE GOvERnAnCEBoard of Directors 26
Directors’ Report 28
Remuneration Committee Report 32
Corporate Governance Report 34
03 FInAnCIAl STATEmEnTSIndependent Auditor’s Report to the Members of Galasys Plc 38
Consolidated Statement of Comprehensive Income 40
Consolidated Statement of Financial Position 41
Consolidated Statement of Changes in Equity 43
Consolidated Statement of Cash Flows 45
Notes to the Financial Statements 47
TABLE OFCONTENTS

6

7
8Financial Highlights
10Galasys At a Glance
11Products and Services
16Chairman’s Statement
18Chief Executive Officer’s Statement
21Principal Risks and Uncertainties
STRATEGIC REPORT

8
01 STRATEGIC REPORT
RM (GBP) ‘in millions 2014 2013 Variance %
Revenue 38.62 (7.13) 26.67 (4.92) 45%
Gross Profit 19.52 (3.60) 10.64 (1.96) 83%
PBT 11.34 (2.09) 8.38 (1.55) 35%
PAT 9.40 (1.73) 7.21 (1.33) 30%
EBITDA 12.58 (2.34) 8.50 (1.57) 48%
Cash and cash equivalents (includes net proceedsfrom IPO of c. RM10.5m) 12.22 (2.25) 2.16 (0.39) 466%
Repeat & recurring revenue 66% of Sales Revenue 60% of Sales Revenue 10%
Additional Highlights
^Earnings per share (EPS) RM 15.79 sen or GBP 2.91 pence
* The comparative figures for the 12 months to 31 December 2013 (refer to note 24) included above were on the basis that Galasys GLT (formally known as Green Laser Technology) was part of Galasys Group from 1 January 2013
^Earnings per share has been calculated by dividing the consolidated profit after taxation attributable to ordinary shareholders by the weighted average number of ordinary shares in issue during the period
Financial highlights
FINANCIALHIGHLIGHTS
2013 2014
Revenue
Gross Profit
Profit Before Tax
Profit After Tax
EBITDA

9
01 STRATEGIC REPORT
Cash and cash equivalents
2014
2013
0 2 4 6 8 10 12 14
RM in Millions
Recurring, Repeat & New Business 2013
Repeating & Recurring Revenue60%
New Business40%
Recurring, Repeat & New Business 2014
Repeating & Recurring Revenue66%
New Business34%
Software, Maintenance Services& Consultancy
51%
Hardware49%
Revenue Breakdown 2014
Revenue Breakdown 2013
Software, Maintenance Services& Consultancy
58%
Hardware30%
Others12%

10
01 STRATEGIC REPORT
GALASySAT A GLANCE
Our Story• Galasys Global (Suzhou) Co., Ltd founded in 2005• Merger with Galasys Solutions (MSC) Sdn Bhd in 2010• Acquisition of Galasys GLT Sdn Bhd in 2013• Listed on AIM, May 2014 (Galasys PLC)• Acquisition of I Logic Sdn Bhd in 2014
A leading integrated and modular amusement-park solutions and services provider to premier amusement parks in China and South East Asia
Operational Highlights• Successful AIM IPO in May 2014, raising gross proceeds of £3.10 million at a placing price of
22.5p (net proceeds of RM10.50m / £2.20m)• 46 new installed sites since IPO roadshow in April 2014• Secured various new clients including Dalian Wanda Group in China and Enchanted Kingdom
in the Philippines which are significant new wins• Extended our sales network and channels into the Philippines, Indonesia, Vietnam and the UK• Completed R&D for a number of new modules including eWallet on RFID, Mobile Ticketing,
Park Map & Navigation and Smart-Q Apps and Ticketing Redemption & Vending Kiosk• Successfully launched our Cloud Online Travel Agency (“CLOTA”) platform for theme park
ticketing• Galasys GLT (formerly Green Laser Technology) successfully integrated into the Group and
performing ahead of management expectations• Successful acquisition of ILogic Solutions Sdn Bhd (“ILogic”), a leisure and entertainment
solutions provider in Malaysia • Total staff strength increased by 40% to more than 140 as of 31 December 2014
Key strengths• Reputable clients with long-term relationships• Chimelong Group and OCT Group: >7 years• To date, 108 installed sites in Asia• Products are developed in-house• 37 software IPs registered to-date• Over 50 man-years of development time & over US$1 mil R&D• > 60% annual repeat and recurring revenue

11
01 STRATEGIC REPORT
ProPrietary SoftwareThe Group provides information technologies solutions and management services through its "Galasys Ticketing System" ("GSET"), a system developed by and continually updated within the Group to manage and analyse tickets, visitors, merchandise sales and amusement park operations. GSET is a system to manage and analyze visitors, merchandise sales and amusement-park business operations within the complex information flow. GSET can be divided into two parts: the front-end interface and back-end system. The front-end is designed for, amongst other things, ticketing-counters, merchandise points of sale and kiosks, in which all transactions and ticket printings take place. The back-end contains the GSET servers that process and store the incoming data from the front-end. As the front-end and back-end communicate, data is compiled allowing for historical and real-time management reports to be generated. Modular BaSiSThe Group's services and solutions have been designed on a modular basis, enabling the up sale of "add-on" modules, without the need of further implementation expenditure once Galasys is undertaking the ticketing operations. These modules can be split into two categories:
1. Ticketing – The Group's key product package modules which cover Ticketing Management Systems, including Admission Control, Online Ticketing Systems and Intelligent Cloud Systems; and
2. Add-on Modules – Modules that are still serviced through GSET, and are upsold to customers during or after implementation of the Ticketing services, covering, Point of Sales Management System, Customer Relationship Management System, E-Wallet System, Memberships System, Shop Management System, Theatre Ticket Management System, Linking System and Reporting System.
PRODUCTSAND SERVICES

12
01 STRATEGIC REPORT
A full list of modules offered are set out below:
Online/Mobile Ticketing System (B2C)
Online/Mobile Individual Ticket Booking Online/Mobile Point Redeem Management
Online Group Ticket Booking Online/Mobile User Management
Online E-mail System Online/Mobile Booking Management
Mobile APPS Smart Q
Intelligent Cloud System (B2B2C)
Cloud Products Management Cloud Credit or Debit Managament Online Distributors System Online Travel Agencies Management
Cloud Agreement Management Third Party Payment Gateway Online Distributors Management Online Travel Agencies Interface
SMS or MMS Gateway Online 2 Offline Interface Wholesales or Retail Management Reseller APP System
Ticketing Management System
Ticket Setup Potential Customer Management Admission Management Turnstile Control
Individual Ticket Sales Order Management Wireless Admission Control Park Capacity Control
Group Ticket Sales Event Management 2D Handphone Barcode Admisson Crowd Control
Agent Management Voucher Management Sub Parks Control Exits Control
Reseller Sales Management Void Management Refund Management Staff Entry Control
GPOS (Point of Sales System)
Purchase Management Merchandise Entries Merchandise Sales Terminal
POS Sales Management Package Sales Setting Fast Food Sales Terminal
Inventory Management Stock Setting Supplier Entries
Costing Management Account Setting Sales Finance Control
Group Purchase Group Distribution Group Analysis
Membership System
Membership Policies Setting Membership Detail Entries Membership e-Credit Policies
Membership Point Collection Annual Pass Policy Setting Membership Top-Up Sales
Membership Activities Various Type Annual Pass Setting Membership Top-Up Management
Shopping Mall Management System
Property Shop Policies Potential Customer Management
Property Shop Rental Policies Customer Contract Management
Property Activities Management Shop Collection Management
Theatre Tickets & Seats Management System
Organizers, Performer Management Ticket Sales (Individual/Group)
Shows or Event Management Wireless Admission Control
Seat Pricing Management Joint Marketing Management
Area Pricing Management Ticket Setup (with Combo)
CRM Management System
Customer Relationship Policies Setting
Customer Relationship Entries
Customer Relationship Management
Customer Relationship Analysis
e-Wallet System
e-Credit Policies Setting
Cash Card Top-Up Management
Cash Card Refund Management
Linking System
Finance System Property Sales System
Human Resource System Property System
QA System GPS System
Hotel System Others System
Reporting & Analysis System
Ticketing Analysis POS Management Analysis Membership Analysis CRM Analysis Business Intelligent (BI)

13
01 STRATEGIC REPORT
ticketing ManageMentThe Group's Ticketing Management System allows the processing of all types of tickets (e.g. agent ticket sales, membership entry tickets, pre-sold tickets, discount cardholders, special passes and wrist bands using 2D-barcode and Radio Frequency Identification ("RFID"). In addition, the system also allows for all types of payment to be made by the visitors (e.g. credit cards, debit cards, cash and gift vouchers). adMiSSion control ManageMentOnce a ticket has been acquired, GSET then manages the process by which the holder of such ticket enters the park. This can take the form of physical possession of a paper ticket which requires being fed into an automated clearance system (full height turnstile, tripod turnstile, flat barrier or manual ticket reader), affording quicker entry than the more dated ticket check point. If the park user is part of a membership program, or is in possession of an RFID wristband, the purchased ticket will be recorded on their card or wristband, without the need for actual printing, which the turnstile reader will recognise. The GSET is then able to track the entry and exit requirements of each Theme Park User ensuring that expired or used wristbands are not accepted.
e-walletFollowing entry into a Theme Park, the GSET oversees all transactions that take place in the Theme Park. These transactions, just like the acquisition of tickets, can take place via all types of payment (e.g. cash or e-wallet) are recorded on the GSET server for real-time analysis.
E-Wallet (using either 2D-Barcode or RFID technology) acts as electronic wallet can be reloaded with cash credits. Theme Park visitors use their e-Wallet to pay for food & beverages, merchandizes and also as an electronic key for their lockers and hotel rooms. This reduces the problem of making cash payment frequently, which directly discourages visitors to spend more. GSET payment functions are highly secured. All payments go through the process of validation and recognition.
Point of SaleS (PoS)Galasys Point-of-Sales (GPOS) system is a solution that automates daily sales transactions, track customer spending behaviours, provide an integrated web storefront as well as provide a real-time balance sheet and profit & loss statement at days end. GPOS keeps track of this information in a back-end database. GPOS on the front-end allows users to sell, void and skim transaction.
GPOS system runs on a network which would allow an on-line real time information on the operations from the number of visitors to the point of sales at any one point in time.
An added benefit from the Theme Park Operator's perspective is that the cash float is monitored on a real-time basis so that treasury departments can be alerted. Any excess cash held above the daily float will trigger an alert so that the cashier is instructed to transfer any excess cash to the supervisor for safekeeping.

14
01 STRATEGIC REPORT
linking SySteMS and ManageMent and analySiS rePortSAll of the above modules described in 5.3 to 5.6 feed into the central GSET server. Combined with the Linking Systems module, in which all transactions are recorded and compiled, management and analysis reports can be generated on a real-time basis. Currently, the GSET can offer 200 types of standard built in reports, allowing amusement park operators quick access to the number of visitors (daily, monthly and annually), point of sales reports, reports detailing the movement and spend per member (if the Membership Systems add-on module has been deployed) or simply footfall reports on a particular attraction. Real time data is crucial for Theme Park Operators to tailor their marketing and promotional efforts, although as will be discussed later, Galasys have identified further scope for their software to be used in conjunction with Theme Park Operator's marketing and sales departments.
clota CLOTA is a middleware platform that allows theme park operators and owners to open up new sales channels, in addition to the traditional offline channels, by connecting their ticketing systems with the OTAs enabling the sale of tickets online, via the OTAs in real time, direct to the end customer.
CLOTA(CLOUD OTA PLATFORM)
Dry Parks/Theme Parks
Water Parks
Qunar
MAJOR OTAONLINE TRAVEL AGENCIES TRAVEL AGENCIES
Ctrip Lvmama Tuniu OTA..n Online Travel Agencies
Hot Spring Parks
Zoos/MuseumsHotels/Resorts

15
01 STRATEGIC REPORT
galotaSAn Internet platform that targets end customers directly and provides flexibility in making bookings within their theme park visit e.g. enabling the consumers to organize theme park entrance packages and accommodation as the ticketing system links into the hotel reservation system.
MoBile aPPS (MaPPS) Galasys is working with clients to introduce mobile applications (apps) that will allow increased interaction between amusement park visitors and operators during their visit. The apps will provide visitors with useful information like a map of the site and additionally will help operators advertise promotions, discounts and offers, with the aim of increasing visitor’s in park spending. Galasys believes it can receive a share of this additional in park spend.
M-Commerce Park Map & Navigation Attraction details,real-time waiting time
and reserve rides

16
01 STRATEGIC REPORT
Strategy & BuSineSS reviewThe Group’s key event for 2014 was undoubtedly our successful IPO debut on AIM on 12 May 2014. This is a momentous event for the Group, all our staff, shareholders, customers and partners alike after an almost 10-year build-up of the business from 2005. The IPO injected much needed new energy and direction for the Group. It also brought in enhanced corporate governance and strengthened management and enabled the Group to nearly double its staff headcount from a year ago. All these have resulted in the Group’s much stronger position in Asia, our home turf, and are shown in the new markets and customers we have added, new products and services we have developed and launched and the completion of our first acquisition following our IPO.
Through our newly launched CLOTA platform and Ticketing IT Outsourcing (“TiTo”) engagement model, we have ventured beyond our traditional project sales revenue model and into the transformational strategy we have spoken about since our IPO. We expect to pivot more on the available mobile and internet infrastructures to refine and accelerate both our Business to Business to Consumer (“B2B2C”) and Business to Consumer (“B2C”) business models and strategies. In time to come, we seek to correlate our growth more directly with the numbers of visitors to the parks whilst continuing to build our market share in the number of parks using our technology and solutions.
Following on from the acquisition of Galasys GLT in 2013, we made a small acquisition in 2014. Galasys GLT’s integration has been successful and we look forward to seeing more synergies being realised in the coming years. Since inception, Galasys has undertaken and successfully integrated three acquisitions and M&A continues to be an
CHAIRMAN’SSTATEMENT
integral part of the Group’s strategy to accelerate growth and stay abreast of trends and innovations. We continue to be on the lookout for other potential businesses that could complement us and accelerate our growth plan.
The Galasys team has been busy since IPO implementing this strategy and I am pleased that the efforts are reflected in the Group’s full year results for 2014, which have shown significant improvements compared to 2013 and which have exceeded expectations.
ProSPectSThe Group is in an important phase of our technology and product development and 2015 will see the continuing efforts to enhance the existing core ticketing platform and its associated modules including mobile apps and solutions. We expect more exciting product development and launches during the course of the year and to see more financial contribution arising from the commercialization of products and services launched in 2014. In particular, as part of the transformational growth plan, we will develop and launch more products and services that will be mobile and internet based so that our revenue base is broadened and to enable us to reach out more directly to the park visitors.
As a testament to the reliability and quality of our products and services, we have not lost any clients in the last 3 years and continue to secure new and highly reputable ones, such as the Dalian Wanda Group from China and the Enchanted Kingdom from the Philippines.
Our strategy of introducing different engagement and therefore, revenue models has borne fruit as we have, through the TiTo model, successfully secured more clients of different sizes, some of whom we would not have been

17
01 STRATEGIC REPORT
in a position to engage before our IPO. A number of the engagements under the TiTo model have given us significantly higher gross margins. We will continue to pursue this strategy of customer engagement to penetrate further into different segments of the ticketing industry including the broader sub-segment of leisure and entertainment.
In terms of marketing and business development, the Group has invested and increased the size and capability of the sales and marketing team and the additional resources available are being successfully deployed in reaching out to new business prospects in the whole of Asia.
We expect to maintain the positive trends in the business in the coming financial year as we deliver on our long term strategic objective of transforming our current project based business and revenue model into one which correlates our revenue and profits more directly to the number of visitors to our theme-park customers.
dividendAs a result of the positive growth achieved both organically and through acquisition, the Board intends to bring forward its plans to implement a progressive dividend policy by proposing a maiden dividend for 2014, whilst recognising the need for Galasys to continue investing in its expansion and product development plans throughout 2015 and beyond. Consequently, the Board is recommending a final dividend of 1.084sen, c. 0.2 pence per share subject to shareholder approval at the Company’s Annual General Meeting. The final dividend will be payable on 3 July 2015 to shareholders on the register on 5 June 2015.
aPPreciationOn behalf of the Board I would like to express my deep appreciation to the management and staff for their dedication and hard work for the past year and congratulate them on the successful completion of our IPO. Last but not least, I would also like to thank our investors, shareholders, customers and partners for their strong support and patience throughout the year and we look forward to working cohesively with each and every one of you in the months to come.
Kim Seng TehNon-Executive Chairman15 April 2015

18
01 STRATEGIC REPORT
I am very pleased to provide my first full year review since the Group joined AIM on 12 May 2014.
reSultSGalasys has delivered a strong financial performance with revenues up 45% at RM38.62m (FY2013: RM26.7m^). We have seen continued growth in demand for our products and services from existing customers as well as successfully adding new large customers such as Dalian Wanda in China and Enchanted Kingdom in the Philippines. Our earnings before interest, tax, depreciation and amortization (EBITDA) also saw significant improvement being up 48% at RM12.58m (FY2013: RM8.5m^) and this was reflected in both pre-tax profit being up 35% at RM11.34m (FY2013: RM8.38m^) and cash up to RM12.22m* (FY2013: RM2.16m^). The net proceeds from our successful IPO were RM10.50m.
^The comparative figures for the 12 months to 31 December 2013 (refer to note 24) included above were on the basis that Galasys GLT (formally known as Green Laser Technology) was part of Galasys Group from 1 January 2013
*includes net proceeds from IPO of RM10.50m (£2.20m)
Market overviewAccording to Global Attractions Attendance Report published by Themed Attraction Association and AECOM, the outlook for the theme park industry in Asia is very strong with annual growth in attendance numbers of 7.5% is almost double that in the Americas whilst zero growth is expected in Europe. The report also stated that attendance total for the top 15 Asian water-parks has, for the first time, surpassed attendance for the top 15 water-parks in North America. AECOM further predicts the total attendance for the top 20 Asia Pacific theme parks will also surpass those of North America in the not-too-distant future. Against this backdrop of high growth, we intend to continue building on our market leading position across Asia and have made good progress entering into new and emerging South East Asian markets such as the Philippines, Thailand, Vietnam and Indonesia.
new winS, ParkS and titoWe are pleased with the number of new project wins throughout 2014. In particular, we are especially proud to have secured the first ever theme park related contract awarded by the Dalian Wanda Group in the face of keen international competition for this landmark deal. As reported in our interim results announcement, the Group has to-date signed up two key projects with the Dalian Wanda Group, namely Wuhan Movie Park and Wanda Indoor Kids’ Park. We believe there are many more contracts to come in the following years and will work closely with the Wanda team.
Outside China, the Group has made significant progress by entering into new and emerging South East Asia markets. The Group secured contracts with the Enchanted Kingdom, which is the largest
CHIEF ExECUTIVE OFFICER’S STATEMENT

19
01 STRATEGIC REPORT
theme park in the Philippines. This contract was a direct replacement of the client’s existing solution provided by a European ticketing solutions provider and further validates the Group’s standing amidst its international competitors.
Whilst theme parks remain the core segment, the Group is making strides in diversifying into other segments within the leisure and entertainment industry. This is reflected in the contracts secured with museums, tourism and cultural centres. The Group has also added exciting sites such as Zoo Negara and the Sepang International Circuit in Malaysia as part of the portfolio of sites incorporated into the Group following the acquisition of iLogic.
The four TiTo projects signed by the Group in 2014 are also significant as they mark the Group’s move toward the new revenue model, whereby the Group’s clients are engaged with a revenue model that brings both higher profit margins and a recurring revenue stream that is correlated more to ticket sales than the total number of installed sites.
clotaWe are delighted to have completed this significant product development and taken an important step towards positioning Galasys in the heart of the online market segment. After nearly a year of intensive development by the R&D team, we are proud to add a key component to our product platform that offers a fully integrated B2B online sales and distribution network connecting online travel agencies with theme park operators and owners in Asia.
To-date, Galasys has signed up ten online travel agents (OTAs), including Beijing Qunar Software Technology (“Qunar”), Ctrip.com International Ltd (“Ctrip”), Shanghai Lvmama International Travel Agency Co. Ltd (“Lvmama”), Sichuan Brigade Butler Network Technology (“Lvxiaobao”), Tuniu Corporation (“Tuniu”) and Chengdu Chenyu Culture Communication Co., Ltd. These OTAs account for most of the online travel traffic in China with Ctrip alone commanding 54.2% of the market.
There are nine theme parks which have signed up so far and are now fully integrated into CLOTA including Wugang Xianglong Valley Water Park, Gui Lin Yugui Park Universal theme park, Seven Colour Sand River Water Park, Wuhan Mulan Park and Shanxi Water Park.
We will continue to grow the revenues from our CLOTA platform by signing up more parks and OTA partners in the coming months. The tie up with Qunar, Ctrip, Tuniu and Lvmama, the four OTA giants in China, is a testament to the Group’s track record in China and a powerful endorsement of our CLOTA platform.
reSearch and develoPMentResearch and development (“R&D”) remains a key business driver for the Group in order to maintain its competitive advantage in delivering innovative solutions ahead of the market and creating new business trends. The Group has strong and proven R&D capability, which we will continue to deploy to bring new products and services to the market.
The R&D team has successfully played their part and amongst the highlights is CLOTA that was officially launched last year as well as the eWallet on RFID. Furthermore, the R&D for Mobile Ticketing, Park Map & Navigation Apps and Smart-Q MAPPs has been completed and is now ready for deployment.
Through the acquisition of iLogic, the development of GALOTAS has been fast-tracked and further refinements are ongoing with a scheduled launch in later in 2015.
The Group also intends to sell and ship Galasys GLT’s kiosk products (Ticketing Redemption / Vending Kiosk) for amusement park customers in China and South East Asia. Galasys’ kiosk software program is localised to support multi-language and multi currencies payment.
reSourceSTo strengthen our team further, we have recruited more than 40 new staff since the IPO. These new hires will focus on customer generation, developing new technologies

20
01 STRATEGIC REPORT
including GALOTAS and deployment of new installations on new client wins. The Group will continue to hire new sales and technical talents as our business expands.
At the end of 2014, we also announced the appointment of WH Ireland Limited as our new Nominated Adviser (NOMAD) and Broker.
outlook for 2015The Group currently operates in Asia, the strongest growth market for amusement parks and visitor numbers. The Group’s growth strategy is built on new key customer acquisitions, new products through continuous R&D and technology partnership, the rollout of the TiTo engagement model to increase recurring revenue, the execution of the CLOTA sales and distribution platform to correlate our revenue and growth more closely to the number of visitors to our installed sites, and geographical expansion into new territories.
The Group is also exploring collaborations with various technology partners to realise mutual synergies and will keep the market and our shareholders informed in due course.
The Group continues to expand into new territories by signing up partners in countries such as the Philippines, Vietnam, Indonesia, Hong Kong, Japan and the UK. Additionally, the Group is acquiring new clients while continuing to serve and deepen ties to its existing client base.
Asia remains the fastest growing market for the global amusement park industry and Galasys is well positioned to continue its growth in this region. The Group is working on a strong sales pipeline of projects for financial year 2015 and the Board is confident of delivering another year of good progress and financial performance.
Sean SeahChief Executive Officer15 April 2015

21
01 STRATEGIC REPORT
The risk management framework of the Group is designed to identify, manage and mitigate material risks to the achievement of the Group’s strategic and business objectives.
Operational riskDependence on key executives and personnel and the ability to attract, motivate and retain employeesThe Group’s development and prospects are dependent upon the continued services and performance of its senior management and other key personnel. The Group is very dependent on CEO, COO, CFO, MD for China, Sales Director for China, MD of I Logic Solutions and MD of GLT. The loss of the services of any of these executive, the senior management or key personnel may have an adverse impact on the Group.
Attracting, retaining and motivating employees, including individuals with significant relevant technical expertise and associated managed services, is a critical component of the future success of the Group’s business. Competition for qualified technical personnel is intense and is likely to remain so for the foreseeable future and could cause the Group to offer higher compensation and other benefits in order to attract and retain them, which could materially and adversely affect the Group’s financial condition and results of operations. If the Group is unsuccessful in attracting qualified employees or retaining or motivating existing employees, it may be unable to grow its business effectively.
MitigationRetaining qualifying employees especially the technical team has always been a challenge to any software companies. However, the Group has adopted employee share option plan and periodic review of key management team total remuneration to ensure it remains competitive in order to retain them.
Business and market risksTechnology riskAs software technology is evolving daily, the company’s products are subject to technology going obsolete therefore, shortening the product life cycle.
PRINCIPAL RISkSAND UNCERTAINTIES

22
01 STRATEGIC REPORT
MitigationThe Company places a high focus on R&D initiatives and continuously strives to develop better and innovative software solutions The Group continues to invests in R&D and market research to realise the potential of new and existing products, and maintain its market-leading position. With continuous investment in R&D, technical staffs make up to 70% of the total staff strength.
Project-based customersThe Group is an integrated services and solutions provider that provides information technologies solutions and management services for the amusement industry globally. The Group tends to be project-based and as a result long-term customer contracts amount for a relatively small part of the Group’s revenue; however, a substantial part of revenue is recurring or repeated in nature. There may also be lag periods (usually 6-9 months) before the repeat customer purchases additional modules once a project is completed. The Directors believe that Recurring Revenues and Repeat Revenues give some revenue certainty for the Group. However, given the largely project- based nature of certain sales, there is no assurance that the Company will be able to leverage on these existing customers for on-going revenue. In addition, a significant increase in turnover rates from the current levels or any failure to recruit new customers or to retain existing customers could have a material adverse effect on the Group’s business, financial condition and results of operations.
MitigationDue to the need of retaining customers for a longer period of time and also strengthening financials, the Group had already role out a new engagement model call Ticket IT Outsourcing (“TiTo”). Essentially TiTo is an engagement model where the customer will pay Galasys for the infrastructure installed via tickets. The customer, i.e. theme park, will provide Galasys steep discounted tickets, for example at 50% discounted price per ticket. Galasys will then sell these tickets to online travel agencies, travel agencies as well as through Cloud Online Travel Agency (“CLOTA”) to end customers.
Market risk The Group may be affected by general market trends that are unrelated to the performance of the Group. The success of the Group is dependent on the market acceptance of its products, of which there can be no guarantee.
MitigationThe Group conducts ongoing studies of general market trends and developments, in order to enable it to make responsive changes to its business plan when necessary.
Fluctuation in the exchange rates of the Chinese Renminbi or Ringgit may have a material adverse effect on an investor’s investment.Currency fluctuations may affect the cashflow which the Group will realise from its operations, as it is likely to receive payment for the services it provides in the currencies of the countries in which it operates, whilst certain of the Group’s costs are likely to be incurred in other currencies.

23
01 STRATEGIC REPORT
MitigationNotwithstanding that this is an inherent risk for any multi-national organization, the Group endeavors to match as far as possible its revenue and cost with the same currency within the respective jurisdictions as well as closely monitor FOREX fluctuations.
Compliance riskMandatory reporting and announcementPossible delays in reporting could arise due to untimely or unavailable information or a failure in internal procedures for mandatory reporting.
MitigationInternal procedures monitor mandatory reporting and other regulatory requirements closely and consistently. The company has compliance policy in place by have appointing a compliance officer responsible to ensure comply with all the necessary regulations including reporting and announcements.

24

25
CORPORATEGOVERNANCE
26Board of Directors
28Directors’ Report
32Remuneration Committee Report
34Corporate Governance Report

26
02 CORPORATE GOVERNANCE
Kim Seng Teh (Age 49)Non-Executive Chairman
• Executive Chairman of Netrove Ventures Group, a boutique regional venture capital and corporate finance firm that is focused primarily on Asian technology companies
• Sits on various advisory panels and boards including boards of publicly listed companies, and their remuneration and audit committees
• LL.B. (Hons) from Leeds University, England and an LL.M. (Hons) from Queens' College, University of Cambridge, England
BOARD OFDIRECTORS
Sean Seah (Age 48)CEO and Founder, Executive Director
• Co-founder of the Group in 2010 and a shareholder
• Master in Computer Science, California State University, USA
• Started career in Silicon Valley as a software applications developer for Software Publishing Corporation listed on NASDAQ
• Worked at Sun Microsystems Inc. between 1997-2003 and held position of Sun Professional Services Business Operation & Channels Management of Greater China
• He co-founded several companies including Afor Pte Ltd Singapore which went IPO in 2008 and subsequently rebranded as “EpiCentre Holdings Ltd”
Chee Keong Hee (Age 44)CFO, Executive Director
• Chartered Accountant of the Malaysian Institute of Accountants (MIA) and a fellow member of Association of Chartered Certified Accountants (FCCA)
• Experience in both private and public companies. Hee was the Finance Director of a listed company Global Soft in Malaysia
• Actively involved in various industries including IT, property development, leisure and entertainment
• Hands-on experience in corporate compliance and financial reporting.

27
02 CORPORATE GOVERNANCE
Chee Seong Chin (Age 55)Non-Executive Director
• Currently the elected Deputy Chairman of PIKOM, the National ICT Association of Malaysia.
• Served as an independent non-executive director of M-Mode Bhd (2009-2012) (KLSE: MMB) listed on the Ace Market. Over the years, Mr Chin has provided, and continues to provide, significant business network opportunities to the Group.
Garry Peagam (Age 59)Independent Non-Executive Director
• His previous appointments include Group Finance Director of Good Energy Group plc and Blick Group plc (which was sold to The Stanley Works Inc.)
• Was also a Managing Director of M-Netics Ltd, a private company. His experience encompasses large multinational companies in the IT and energy sectors.
Teong Ming Chuah (Age 37)Head of China, Executive Director
• Has over 8 years of working experience in the IT industry and provides significant business knowhow and advice to the management team of the company.
• A Malaysian national, he has headed the Group’s expansion in China since the group was reorganized in 2010.
• Graduated as a Bachelor of Engineering Technology in University of Southern Queensland.

28
02 CORPORATE GOVERNANCE
The Directors submit their report together with the audited consolidated financial statements of the Galasys Plc group of companies for the year ended 31 December 2014. This Directors’ Report includes the Chairman’s Statement, the Chief Executive’s Overview, the Strategic Report, the Corporate Governance section and the Directors’ responsibility statement. The Company is required to set out a fair review of the business of the Group and a description of the principal risks and uncertainties facing the business, which can be found in the Strategic Report. This requirement includes an analysis of the development and performance of the Company’s business during the reporting period, and the position of the Group at the end of the reporting period consistent with our size and complexity. The Directors’ Report has been prepared, and is published, in accordance with, and in reliance upon, applicable Jersey company law and the liabilities of the Directors in relation to that report are subject to the limitations and restrictions provided by such law.
Principal activityThe Company is a holding company and its principal activity is the holding of investment in its subsidiaries. The Group is an Amusement Park solutions and services provider that provides information technology solutions and management services to Amusement Park operators in Asia.
The Company’s registered office address is Queensway House, Hilgrove Street, St. Helier, Jersey JE1 1ES.
Capital StructureThe Group is financed through equity share capital. There is about RM700,000 in debt for working capital purposes. The Company do not need to leverage on debt financing as many of the operating subsidiaries are enjoying tax holidays and this is expected to continue in near future (see note 22 to the financial statements).
Business review and future developmentsGalasys Plc has continued to perform strongly across all its business areas throughout 2014. Full details of the Group’s performance and future developments can be found in the Chairman’s Overview.
Financial results• Revenue for 2014 up 45% at RM38.62m (2013: RM26.67m^)• Gross Profit up 83% at RM19.52m (2013: RM10.64m^)• EBITDA up 48% at RM12.58m (2013: RM8.5m^)
DIRECTORS’REPORT

29
02 CORPORATE GOVERNANCE
• Profit Before Tax up 35% at RM11.34m (2013: RM8.38m^)• Profit After Tax up 30% at RM9.40m (2013: RM7.21m^)• Cash RM12.22m* (2013: RM2.16m^)• EPS RM0.16, or c. 2.91 pence • Repeat and recurring revenue increased to 66% of sales (2013: 60%)
^The comparative figures for the 12 months to 31 December 2013 (refer to note 24) included above were on the basis that Galasys GLT (formally known as Green Laser Technology) was part of Galasys Group from 1 January 2013
* includes net proceeds from IPO of RM10.50m (£2.20m)
DividendsThe Board is recommending a final dividend of 1.084sen, c. 0.2 pence per share subject to shareholder approval at the Company’s Annual General Meeting. The final dividend will be payable on 3 July 2015 to shareholders on the register on 5 June 2015.
Significant shareholdersSignificant shareholders holding over 3% of the issued share capital as at 31 December 2014, other than any Directors and their family as defined in the AIM rules, whose holdings are detailed below:
Ordinary shares As at 31 December 2014 %
Well Oriental Investments Limited (“WOI”)* 26,783,984 40.23
Netrove Ventures Corporation^ 11,417,566 17.15
Soo Choon Meng 7,842,989 11.78
WGLS Foundation 2,151,201 3.23
*WOI is an investment vehicle incorporated in the British Virgin Islands, the shareholders of which are Mr Sean Seah (Company’s Chief Executive Officer), holding 20,709 ordinary shares in WOI (representing a 41.42 per cent. Shareholding interest), Mr Teong Ming Chuah (an executive director of the Company), holding 15,198 ordinary shares in WOI (representing a 30.40 per cent. shareholding interest), Mr Low Kok Thai, holding 10,843 ordinary shares in WOI (representing a 21.69 per cent. shareholding interest) and Mr Chee Keong Hee (the Company’s Chief Finance Officer), holding 3,250 ordinary shares in WOI (representing a 6.50 per cent. shareholding interest).
^Netrove Ventures Corporation, incorporated in the British Virgin Islands, is wholly owned by Kim Seng Teh, the Company’s Non-Executive Chairman
Directors and Directors’ shareholdingsThe Directors during the period under review were:
Kim Seng Teh, Non-Executive ChairmanSean Seah, Executive Director, CEOChee Keong Hee, Executive Director, CFOTeong Ming Chuah, Executive DirectorChee Seong Chin, Non-Executive DirectorGarry Peagam, Independent Non-Executive Director
The Directors’ beneficial interests in the share capital of the Company and remuneration are set out in the Remuneration Committee Report.

30
02 CORPORATE GOVERNANCE
The company paid for sufficient directors and officer’s indemnity insurance during the period, and to the date of approval of these financial statements, to enable the directors to carry out their duties.
Directors’ responsibilitiesThe Directors are responsible for preparing the financial statements in accordance with applicable laws and International Financial Reporting Standards (IFRS) as adopted by the European Union. Company law requires the Directors to prepare financial statements for each financial year which give a true and fair view of the state of affairs of the Company and of the profit or loss of the Company for that year.
In preparing those financial statements, the Directors are required to: • select suitable accounting policies and then apply them consistently; • make judgements and estimates that are reasonable and prudent; • state whether applicable accounting standards have been followed, subject to any material departures disclosed and explained in the financial statements; and • prepare the financial statements on the going concern basis (unless it is inappropriate to presume that the Group will continue in business).
The Directors are responsible for keeping adequate accounting records that disclose with reasonable accuracy of any time the financial position of the Company and to enable them to ensure that the financial statements comply with the Companies (Jersey) Law 1991. They are also responsible for safeguarding the assets of the Company and hence for taking reasonable steps for them prevention and detection of fraud and other irregularities. The Directors are responsible for the maintenance and integrity of the corporate and financial information included on the Group’s website. Legislation in Jersey governing the preparation and dissemination of financial statements may differ from legislation in other jurisdictions.
Research and developmentAs previously mentioned the Directors estimate that the Group has invested over 50 man years and over USD1 million in developing and updating the Group’s proprietary systems and software. The Directors believe that by continuingly investing in R&D, the Group will be able to improve service offerings to its customers and therefore look to distinguish itself from its competitors. It is the Directors’ intention that the Group will continue to invest progressively in R&D.
EmployeesThe Group’s policy is to have a competitive remuneration and benefits provision to attract and retain the best and brightest talent. The Group is committed to ensuring that equal opportunities are accorded to all of its employees irrespective of age, gender and nationality in training, career development and advancement in an effort towards ensuring that the Group employs the most skilled workforce.
The Company recognises that on-going share ownership is an important part of the Group’s incentivisation and retention policy. The Company has therefore adopted the Share Option Plan. Options may be granted to employees of the Company and any Participating Company.

31
02 CORPORATE GOVERNANCE
Risks relating to the Group and its businessA review of the risks associated with the Group and the nature of its business is set out in the Principal Risks and Uncertainties section.
Going concernThe Company’s activities and developments of its products, services and markets are set out in the CEO’s statement. The performance of the Company in terms of revenue, profitability and cash flows is explained in the Financial Statements.
After the assessment of the available financial information, and taking into account the nature of the business, which has recurring revenue with high cash conversion, as reflected in the current financial position of the Group with cash position of RM12.2 million as at 31 December 2014, the Directors believe that the Group has adequate resources to continue to operate for the foreseeable future. Therefore, it is appropriate to continue to adopt the going concern basis of accounting in the preparation of the Company consolidated financial statements.
Auditor and disclosure of information to auditor The Directors who held office on the date of approval of this Directors’ Report confirm that, so far as they are aware, there is no relevant audit information of which the Company’s auditor is unaware. The Directors have confirmed that they have taken all steps that they ought to have taken as Directors in order to make themselves aware of any relevant audit information and to establish that the Company’s auditor is aware of that information. Crowe Clark Whitehill LLP has been appointed as the auditor of the Company during the year.
This report was approved by the Board and signed on its behalf.
Sean SeahChief Executive Officer15 April 2015

32
02 CORPORATE GOVERNANCE
Galasys Plc, being an AIM quoted company, has adopted the general principles of the Remuneration Committee Guide for Smaller Quoted Companies of The Quoted Companies Alliance.
Remuneration CommitteeThe remuneration Committee comprises the Chairman of Committee, Kim Seng Teh (Non-Executive Chairman), Garry Peagam (Non-Executive Director), and Chee Seong Chin (Non-Executive Director). The terms of reference of the Committee are available on the Company’s website and are reviewed annually by the Board. The Remuneration Committee is responsible for determining the Group’s policy on the remuneration of senior executives and specific remuneration packages for Executive Directors, including pension rights and compensation payments.
Remuneration PolicyThe objective of the remuneration policy is to attract, retain and motivate high caliber Executives as well as to achieve the overall objective of promoting teamwork in delivering outstanding shareholder returns while maintaining an appropriate compensation balance for all the employees of the Group.
Directors’ remunerationThe normal remuneration arrangements for Executive Directors consist of base salary, annual performance-related bonuses and other benefits as determined by the Board. Each of the Executive Directors has a service agreement that can be terminated at any time by either party giving to the other 6 months’ written notice.
Non-Executive DirectorsNon-Executive Directors are remunerated solely in the form of director fees determined by the Board and are not entitled to pensions, annual bonuses or employee benefits. They are entitled to participate in share option arrangements relating to the Company’s shares but as there are no such share option arrangements in place at this time, there is no participation from the Non-Executive Directors from this form of remuneration. Each of the Non-Executive Directors has a letter of appointment stating his annual fee and that the appointments are to continue unless terminated by the Company by giving 1 month’ written notice or at any time by a resolution of the Shareholders and subject to reappointment at the first annual general meeting following his appointment.
Directors are not involved in specific discussions on their own remuneration.
REMUNERATION COMMITTEE REPORT

33
02 CORPORATE GOVERNANCE
Directors' interests
Ordinary shares As at 31 December 2014 %
Sean Seah* 26,783,984 40.23
Chee Keong Hee* 26,783,984 40.23
Teong Ming Chuah* 26,783,984 40.23
Kim Seng Teh^ 11,862,010 17.82
Chee Seong Chin 660,462 0.99
*Sean Seah, Chee Keong Hee and Teong Ming Chuah’s shareholding is held indirectly through Well Oriental Investments Ltd. They are therefore deemed or taken to be interested in 100 per cent. of the Ordinary Shares held by Well Oriental Investments Ltd.
^Kim Seng Teh’s shareholding is held indirectly through Netrove Ventures Corporation and Netrove Strategic Corporation. He is therefore deemed or taken to be interested in 100 per cent. of the Ordinary Shares held by Netrove Ventures Corporation and Netrove Strategic Corporation.
Directors’ remuneration
FY2014 Salary Fees (RM’000)
Bonus(RM’000)
Benefits(RM’000)
Total(RM’000)
Executive Directors
Sean Seah 202 - 117 319
Chee Keong Hee 92 - 43 135
Teong Ming Chuah 125 - 3 128
Non-Executive Directors
Kim Seng Teh 103 - - 103
Garry Peagam 82 - - 82
Chee Seong Chin 21 - - 21

34
02 CORPORATE GOVERNANCE
The Directors recognise the importance of sound corporate governance and intend for the Company to comply with the provisions of the UK Corporate Governance Code insofar as they are appropriate given the Company’s size and stage of development. In any event, the Directors intend to comply with the provisions of the Quoted Companies Alliance (QCA) Guidelines.
The Board is responsible for formulating, reviewing and approving the Company’s strategy, budgets and corporate actions. Following Admission, the Directors intend to hold Board meetings at least quarterly and at such other times as they deem necessary. The Board has established a remuneration committee, an audit committee and a nomination committee.
Board of Directors and Board CommitteesThe Board of Directors consists of 3 Executive and 3 Non-Executive members that include a Non-Executive Chairman. The respective appointments of the Board members provide an appropriate balance of skills and experience for the Board to lead the Group in the interests of all shareholders.
The roles of Chairman and Chief Executive are separate and clear. The Chairman’s role is to lead the Board in Board meetings and ensure the effectiveness of the Board. The role to ensure that the Group’s long term strategic and financial objectives are achieved with the Group’s resources and in accordance to the risk level of the Group is the responsibility of the Chief Executive.
The Board is responsible to shareholders by providing leadership and direction to the Group. The role of the Board is to set the strategic direction and goals of the Group within its expertise and risk framework. The Board has a schedule of matters reserved for its decision which include, but are not limited to, decisions on strategy and risk management, approval of financial budgets, major capital expenditure, material acquisitions and disposals, the interim and annual results and the interim and final dividend recommendations. The Board Committees that have been established to assume some of the responsibilities of the Board with clearly defined terms of reference are the Audit, Nomination, Remuneration Committees.
The Board has had regular Board meetings for the financial year ended 31 December 2014. For the period, 5 board meetings have been conducted by the Company. Formal agendas and reports are provided to the Board for the Board meetings and all Directors are properly briefed on the matters to be discussed and deliberated. All Directors in carrying out their duties as members of the Board
CORPORATEGOVERNANCEREPORT

35
02 CORPORATE GOVERNANCE
are able to obtain further advice and information from within the Company or from independent professional advisers. The Company maintains an appropriate directors’ and officers’ insurance policy cover in respect of any legal actions against the Directors.
The performance of the Board is currently assessed by the Chairman with respect to the various operations of the Board that include, among others, the appropriate skill level of the members, the conduct of Board meetings and the decisions achieved, the guidance with regard to the Group’s strategy and objectives, and the effectiveness of the 3 standing Board Committees in carrying out their responsibilities in accordance to the set terms of reference.
The table below sets out the Board meetings as well as the Audit, Remuneration and Nomination Committee meetings respectively held by the Company for the financial year ended 31 December 2014 and attendance of each Director:
Board meetingsAudit Committee
meetings
RemunerationCommittee
meetings
NominationCommittee
meetings
Executive Directors
Sean Seah 5/5 - - -
Chee Keong Hee 5/5 - - -
Teong Ming Chuah 5/5 - - -
Non-Executive Directors
Kim Seng Teh 5/5 1/1 - -
Garry Peagam 5/5 1/1 - -
Chee Seong Chin 5/5 1/1 - -
Board CommitteesThe Board has established 3 Committees with clearly defined terms of reference and detailed below are the members of the Committees and their duties and responsibilities.
Audit CommitteeThe audit committee will initially consist of Garry Peagam as chairman and Kim Seng Teh and Chee Seong Chin. It will meet at least twice each year and will be responsible for ensuring that the financial performance of the Group is properly monitored and reported on and for meeting with the auditors and reviewing findings of the audit with the external auditor. It is authorised to seek any information it properly requires from any employee and may ask questions of any employee. It will meet with the auditors once a year without any members of management being present and is also responsible for considering and making recommendations regarding the identity and remuneration of such auditors.
Remuneration CommitteeThe remuneration committee will initially consist of Kim Seng Teh as chairman and Garry Peagam

36
02 CORPORATE GOVERNANCE
and Chee Seong Chin. It will meet at least once each year and will consider and recommend to the Board the framework for the remuneration of the executive Directors and any other senior management. It will further consider and recommend to the Board the total individual remuneration package of each executive Director including bonuses, incentive payments and share options or other share awards. In addition, subject to existing contractual obligations, it will review the design of all share incentive plans for approval by the Board and the Company’s shareholders and, for each such plan, will recommend whether awards are made and, if so, the overall amount of such awards, the individual awards to executive Directors and the performance targets to be used. No Director will be involved in decisions concerning his own remuneration.
Nomination CommitteeThe nomination committee will initially consist of Kim Seng Teh as chairman and Sean Seah and Garry Peagam. The nomination committee will meet at least once each year and will consider the selection and re-appointment of Directors. It will identify and nominate candidates to all Board vacancies and will regularly review the structure, size and composition of the Board (including the skills, knowledge and experience) and will make recommendations to the Board with regard to any changes.
Investor relationsCompany following the interim and annual results announcements and on an as-needed basis are attended by the Non-Executive Chairman, Chief Executive Officer and Chief Financial Officer to update the shareholders on the progress of the Group in terms of its business, financial performance and strategic direction. The annual report and accounts is published on the Company’s website and can be accessed by shareholders.
Internal control and risk managementThe Board is responsible for the Group’s systems of internal controls and for reviewing the effectiveness of the systems. The systems can only provide reasonable but not absolute assurance against material misstatements
or losses as the systems are put in place to manage and minimise the risks but not to eliminate them.
With the active involvement of the Executive Directors of the Company in the daily operations and management of the Group, and with regular meetings with staff, business risks are identified and appropriate control systems implemented to manage the risks. The effectiveness of the control systems are reviewed and updated periodically by the Principal Management Office.
The Group’s internal financial control procedures and monitoring systems include: • financial policies and approval procedures with proper authorization level and segregation of duties for financial management; • maintenance of proper records for the production of accurate and timely financial management information; • an annual budgetary process to set the appropriate target for monitoring of the progress of the Group; • a detailed monthly financial reporting system that reports on operating results, cash flow, assets and liabilities with comparisons against budgets; • reporting on any non-compliance with internal financial controls and procedures; and • a review of the Audit Committee report issued by external auditor.
The Audit Committee on behalf of the Board reviews reports from the external auditor together with management’s response regarding proposed actions. Through such review, they have reviewed the effectiveness of the internal control systems for the period covered by the accounts.

37
FINANCIALSTATEMENTS
38Independent Auditor’s Report to the Members of Galasys Plc
40Consolidated Statement of Comprehensive Income
41Consolidated Statement of Financial Position
43Consolidated Statement of Changes in Equity
45Consolidated Statement of Cash Flows
47Notes to the Financial Statements

38
03 FINANCIAL STATEMENTS
INDEPENDENTAUDITOR’S REPORTTO THE MEMBERS OF GALASyS PLC
We have audited the Financial Statements of Galasys plc for the year ended 31 December 2014 which comprise the Group Statement of Comprehensive Income, Group Statements of Financial Position, Group Statement of Cash flows, Group Statement of Changes in Equity and their related notes.
The financial reporting framework that has been applied in their preparation is applicable law and International Financial Reporting Standards (“IFRS”) as adopted by the European Union.
This report is made solely to the company’s members, as a body, in accordance with Article 113A of the Companies (Jersey) Law, 1991. Our audit work has been undertaken so that we might state to the Company’s members those matters we are required to state to them in an auditor’s report and for no other purpose. To the fullest extent permitted by law, we do not accept or assume responsibility to anyone other than the Company and the Company’s members as a body, for our audit work, for this report, or for the opinions we have formed.
Respective responsibilities of directors and auditorAs explained more fully in the Statement of Directors’ Responsibilities, the Directors are responsible for the preparation of the financial statements and for being satisfied that they give a true and fair view. Our responsibility is to audit and express an opinion on the financial statements in accordance with applicable law and International Standards on Auditing (UK and Ireland). Those standards require us to comply with the Auditing Practices Board’s Ethical Standards for Auditors.
Scope of the audit of the financial statementsAn audit involves obtaining evidence about the amounts and disclosures in the financial statements sufficient to give reasonable assurance that the financial statements are free from material misstatement, whether caused by fraud or error. This includes an assessment of: whether the accounting policies are appropriate to the company's circumstances and have been consistently applied and adequately disclosed; the reasonableness of significant accounting estimates made by the directors; and the overall presentation of the financial statements.

39
03 FINANCIAL STATEMENTS
In addition, we read all the information in the Annual Report to identify material inconsistencies with the audited financial statements and to identify any information that is apparently materially incorrect based on, or materially inconsistent with, the knowledge acquired by us in the course of performing the audit. If we become aware of any apparent material misstatements or inconsistencies we consider the implications for our report.
OpinionIn our opinion: • the financial statements give a true and fair view of the state of the group and parent company’s affairs as at 31 December 2014 and of the group’s profit for the year then ended;• the financial statements have been properly prepared in accordance with IFRSs as adopted by the European Union; and • the financial statements have been prepared in accordance with the requirements of the Companies (Jersey) Law 1991.
Matters on which we are required to report by exception We have nothing to report to you in respect of the following matters where the Companies (Jersey) Law 1991 requires us to report to you if, in our opinion:• proper accounting records have not been kept by the parent company, or • proper returns adequate for our audit have not been received from branches not visited by us; or• the parent company financial statements are not in agreement with the accounting records and returns; or• we have not received all the information and explanations we require for our audit.
Stephen Bullock St Brides HouseSenior Statutory Auditor 10 Salisbury SquareFor and on behalf of LondonCrowe Clark Whitehill LLP EC4Y 8EHStatutory Auditor15 April 2015

40
03 FINANCIAL STATEMENTS
CONSOLIDATED STATEMENT OF COMPREHENSIVE INCOME
Proforma2014 2013
Note RM RM
Revenue 19 38,621,893 9,394,752Cost of sales (19,099,021) (2,913,438)
Gross profit 19,522,872 6,481,314
Other operating income 20 611,722 2,907,885Selling and distribution expenses (725,596) (524,750)Administrative expenses (6,907,528) (1,479,765)Other operating expenses (1,082,203) (235,663)
Operating profit 11,419,267 7,149,021
Finance costs (80,705) (42,001)
Profit before taxation 21 11,338,562 7,107,020
Income tax expense 22 (1,942,803) (350,155)
Profit after taxation 9,395,759 6,756,865
Other comprehensive income:- Items that will or may be reclassified to profit or loss- Foreign currency translation 657,793 581,900
Total comprehensive income for the financial year 10,053,552 7,338,765
Profit after taxation attributable to:-Owners of the Company 9,395,759 6,756,865
Total comprehensive income attributable to:-Owners of the Company 10,053,552 7,338,765
Earnings per share:- Basic (sen) 23 15.79 12.82
- Diluted (sen) 23 15.79 12.82

41
03 FINANCIAL STATEMENTS
CONSOLIDATED STATEMENT OFFINANCIAL POSITION
Proforma2014 2013
Note RM RMNon-current assets Plant and equipment 4 493,095 211,972Intangible assets 5 6,085,901 2,769,538Goodwill on consolidation 6 550,356 515,913Investment in quoted shares - 112,674Deferred tax assets 14,570 -
7,143,922 3,610,097Current assets Inventories 7 1,037,779 2,169,289Trade and other receivables 8 17,233,262 12,672,204Amount owing by contract customers 9 8,564,195 1,368,794Amount owing by related parties 10 - 346,258Fixed deposits with licensed banks 11 477,289 463,362Cash and bank balances 11,739,417 1,700,823
39,051,942 18,720,730
Total Assets 46,195,864 22,330,827
Current liabilities Trade and other payables 12 5,225,181 1,728,352Amount owing to related parties - 560,485Amount owing to directors 13 - 1,667Short-term borrowings 14 467,871 615,618Finance lease payables 15 29,660 29,660Redeemable convertible preference shares 16 - 1,173,564Provision for taxation 1,738,971 1,490,878
7,461,683 5,600,224EquityStated capital account 17 25,406,103 -Foreign currency translation reserves 18 1,294,500 636,707Capital reserve 18 671,556 543,224Share option reserve 172,792 -Retained profits 21,853,473 12,586,046Merger reserve 18 (10,851,562) 2,707,972
38,546,862 16,473,949

42
03 FINANCIAL STATEMENTS
CONSOLIDATED STATEMENT OF FINANCIAL POSITION - CONTINUED
Proforma2014 2013
Note RM RMNon-current liabilities Deferred tax liabilities - 3,038Long term borrowings 14B 81,984 118,621Finance lease payables 15 105,335 134,995
187,319 256,654
Total Equity and Liabilities 46,195,864 22,330,827
The financial statements were approved by the Board of Directors and authorised for issue on 15 April 2015 and are signed on its behalf by:
Sean SeahChief Executive Officer

43
03 FINANCIAL STATEMENTS
CONSOLIDATED STATEMENT OFCHANGES IN EqUITy
NON-DISTRIBUTABLE DISTRIBUTABLE
Stated capitalaccount
Foreigncurrency
translationreserve Capital reserve
Merger Reserve/(deficit) Retained profits
Attributableto owners
of the Group Total
RM ('000) RM ('000) RM ('000) RM ('000) RM ('000) RM ('000) RM ('000)
Balance at 1 January 2013 (Proforma) - 55 304 - 6,068 6,427 6,427
Profit after tax for the year - - - - 6,757 6,757 6,757
Other comprehensive income, net of tax- Foreign currency transalation differences for foreign operations - 582 - - - 582 582
Total comprehensive income for the year - 582 - - 6,757 7,339 7,339
Transfer to capital reserve - - 239 - (239) - -
Issuance of shares on group reorganisation - - - 2,708 - 2,708 2,708
Balance at 31 December 2013 (Proforma) - 637 543 2,708 12,586 16,474 16,474

44
03 FINANCIAL STATEMENTS
NON-DISTRIBUTABLE DISTRIBUTABLE
Stated capitalaccount
Foreigncurrency
translationreserve
Share optionreserve
Capitalreserve
MergerReserve/
(deficit)Retained
profits
Attributableto owners
of the Group Total
RM ('000) RM ('000) RM ('000) RM ('000) RM ('000) RM ('000) RM ('000) RM ('000)
Balance at 1 January 2014 - 637 - 543 2,708 12,586 16,474 16,474
Profit after tax for the year - - - - - 9,396 9,396 9,396
Other comprehensive income, net of tax- Foreign currencytransalation differences for foreign operations - 658 - - - - 658 658
Total comprehensive income for the year - 658 - - - 9,396 10,054 10,054
Transfer to capital reserve - - - 128 - (128) - -
Issuance of shares - - - - 3,939 - 3,939 3,939
Share based payment - - 173 - - - 173 173
Issuance of shares ongroup reconstruction 17,478 - - - (17,478) - - -
Issuance of placing shares 17,076 - - - - - 17,076 17,076
Share issuance expenses (9,148) - - - - - (9,148) (9,148)
Transfer to merger deficit - - - - (20) - (20) (20)
Balance at31 December 2014 (Proforma) 25,406 1,295 173 671 (10,851) 21,854 38,548 38,548
CONSOLIDATED STATEMENT OF CHANGES IN EqUITy- CONTINUED

45
03 FINANCIAL STATEMENTS
CONSOLIDATED STATEMENT OFCASH FLOwS
Proforma2014 2013
Note RM RMCash flow from operating activitiesProfit before taxation 11,338,562 7,107,020 Adjustments for:Depreciation of plant and equipment 4 128,952 29,476 Amortisation charge 5 1,027,328 677,481 Interest income (13,927) (287)Interest expense 80,705 42,001 Fair value loss on receivables - 16,382Write back on impairment loss of receivables (109,679) -Written off of tenancy deposits - 5,169 Written off of trade and other receivables 247,048 184,636 Impairment allowance on trade receivables 299,011 -Share based payments 172,792 -Loss on sales of unquoted shares 48,632 -Unrealised loss on foreign exchange 319,036 -Gain on disposal of plant and equipment - (2,360)Negative goodwill - (2,055,505)
Operating profit before working capital changes 13,538,460 6,004,013 Decrease in inventories 1,188,210 74,417 Increase in trade and other receivables (4,359,113) (2,944,420)Increase/(decrease) in trade and other payables 2,548,887 (1,151,418)Increase in amount owing by contract customers (6,665,732) (319,486)
Cash flow from operations 6,250,712 1,663,106 Interest received 13,927 287 Interest paid (80,705) (9,078)Income tax paid (1,749,913) (350,155)
Net cash flow from operating activities 4,434,021 1,304,160
Cash flow used in investing activitiesAcquisition of plant and equipment (404,974) (34,942)Proceed from disposal of plant and equipment - 22,051 Proceed from sales of unquoted shares 64,042 -Acquisition of a subsidiary, net of cash acquired - 290,719 Addition of intangible assets (4,143,961) (1,763,139)Repayment from holding company - 386,393 Repayment to related parties - (29,030)Repayment of advances from a director - 34,976

46
03 FINANCIAL STATEMENTS
Proforma
2014 2013
Note RM RM
Net cash flow used in investing activities (4,484,893) (1,092,972)
Balance carried forward (50,872) 211,188
Cash flow from financing activities
Repayment of borrowings (36,637) (244,590)
Repayment of finance lease payables (29,660) -
Cash restricted in use (13,927) (463,362)
Net proceeds from issuance of shares 10,673,005 -
Issuance of preference shares - 1,173,564
Repayment to a director - (24,878)
(Repayment to)/ Advances from related parties - 273,332
Net cash from financing activities 10,592,781 714,066
Net Increase in cash and cash equivalents 10,541,909 925,254
Effects of foreign exchange translation (355,568) 17,825
Opening balance 1,134,271 191,192
Closing balance 11B 11,320,612 1,134,271
CONSOLIDATED STATEMENT OF CASH FLOwS - CONTINUED

47
03 FINANCIAL STATEMENTS
1. General InformationGalasys PLC was incorporated in Jersey on 23 January 2014 as a public limited company with registration number 114827. It is listed on the AIM Market of the London Stock Exchange. The registered office of the Company is Queensway House, Hilgrove Street, St Helier, Jersey, JE1 1ES. The principal activity of the Company is to act as the holding company of a group involved in the provision of IT solutions and management services to customers operating in the amusement park industry.
The subsidiaries are principally engaged in providing integrated services and theme-park solutions, information technologies solutions and management services to third parties operating in the amusement park industry in Asia.
2. Summary of significant accounting policies
2.1. Basis of preparation Statement of Compliance The consolidated financial information has been prepared in accordance with International Financial Reporting Standards as adopted by the EU (“IFRS”) issued by the International Accounting Standards Board (“IASB”), including related Interpretations issued by the International Financial Reporting Interpretations Committee (“IFRIC”). The consolidated financial information has been prepared using the accounting policies which are consistent with those adopted in Part IV of the AIM Admission Document of Galasys plc dated 7 May 2014 as well as applying the below accounting policy in respect of the basis of consolidation as extracted from the draft financial statements.
The individual financial information of each entity is measured and presented in the currency of the primary economic environment in which the entity operates (its functional currency). The consolidated financial statements of the Group are presented in Ringgit Malaysia (RM), which is the presentation currency for the consolidated financial statements. The functional currency of each individual entity is the local currency of each individual entity. The primary economic environment for the Group is Malaysia.
The financial information set out in this preliminary announcement does not constitute audited financial statements for the year ended 31 December 2014. The financial information for the year
NOTES TO THEFINANCIALSTATEMENTS

48
03 FINANCIAL STATEMENTS
ended 31 December 2014 is derived from draft financial statements. The audit of the statutory accounts for the year ended 31 December 2014 is not yet complete. These accounts are expected to be finalised on the basis of the financial information presented by the directors in this preliminary announcement and will be delivered to the Jersey Companies Registry following the company's Annual General Meeting. Although the auditors have not yet reported on the financial statements for the year ended 31 December 2014, they currently anticipate issuing an unqualified report.
The financial information set out in this announcement was approved and authorised for issue by the board of directors on 13 April 2015.
2.2. Basis of consolidationBusiness Combinations The consolidated financial statements include the financial statements of the Company and its subsidiaries made up to 31 December each year. On 7 March 2014 the Company acquired the entire share capital of Galasys Holdings Limited (“Galasys Holdings”) via a share swap agreement. As a result of this transaction, the ultimate shareholders in Galasys Holdings received shares in the Company in direct proportion to their original shareholdings in Galasys Holdings.
IFRS does not provide specific guidance on accounting for common control transactions. Therefore, the Directors have selected an accounting policy using the “hierarchy” described in paragraphs 10-12 of IAS 8 Accounting Policies, Changes in Accounting Estimates and Errors. The hierarchy permits the consideration of pronouncement of other standard-setting bodies. The Directors have adopted a policy of accounting for business combinations between entities under common control in accordance with guidance under UK GAAP for guidance (FRS-Acquisitions and Mergers) which does not conflict with IFRS and reflects the economic substance of the transaction. This guidance produces a result that is similar to pooling.
Under UK GAAP, the assets and liabilities of both entities are recorded at book value, not fair value. Intangible assets and contingent liabilities are recognized only to the extent that they were recognized by the legal acquirer in accordance within applicable IFRS, no goodwill is recognised, any expenses of the combination are written off immediately to the income statement and comparative amounts, if applicable, are restated as if the combination had taken place at the beginning of the earliest accounting period presented. Therefore, the consolidated accounts have therefore been prepared as if the Group structure has always been in place, including activity from incorporation of the Group’s subsidiaries, although the Group reconstruction did not become unconditional until [7 March 2014].
Subsidiaries A subsidiary is an entity (including special purposes entities) over which the Company has the power to govern the financial operating policies, generally accompanied by a shareholding giving rise to the majority of the voting rights, as to obtain benefits from their activities. The consolidated financial statements present the results of the Group as if they formed a single entity.

49
03 FINANCIAL STATEMENTS
Intra-group balances and transactions and any income and expenses arising from intra-Group transactions are eliminated on consolidation. Unrealised gains and losses arising from transactions with associates and joint ventures are eliminated against the investment to the extent of the Group’s interest in the investee.
The principal activities of the subsidiaries are as follows:
NamePlace of incorporation/ establishment Principal activities
Issued and paid-up/registered capital
Effectiveinterests %
Galasys Holdings Limited British Virgin Island Investment holding. USD4,133,628 100
Galasys Solutions (MSC) Sdn Bhd * Malaysia Software development and maintenance with a specific focus on software relating to theme park visitor admittance.
RM500,000 100
Galasys Technologies (HK) Limited * Hong Kong Investment holding. HKD190 100
Galasys GLT Sdn Bhd(formerly known as Green Laser Technology Sdn Bhd) *
Malaysia Engaged in production, supplying, distribution of self-service kiosk and other computer related accessories and provide a wide range of business communication solutions.
RM400,000 100
Galasys Global (Suzhou) Co. Limited ^ People’s Republic of China
Software design and development, sale of software products of the company and provision of consulting and after-sale services and software services.
RMB5,379,725 100
Note: * Held through Galasys Holdings Limited ^ Held through Galasys Technologies (HK) Limited. Under Galasys Global (Suzhou) Co. Limited, there is a branch company in Beijing and four representative branch offices in Guangzhou, Chengdu, Shandong and Wuhan.
Purchase methodUnder the purchase method, the results of subsidiaries acquired or disposed of are included from the date of acquisition or up to the date of disposal. At the date of acquisition, the fair values of the subsidiaries’ net assets are determined and these values are reflected in the consolidated financial statements. The cost of acquisition is measured at the aggregate of the fair values, at the date of exchange, of assets given, liabilities incurred or assumed, and equity instruments issued by the Group in exchange for control of the acquiree, plus any costs directly attributable to the business combination.
Intragroup transactions, balances and unrealised gains on transactions are eliminated; unrealised losses are also eliminated unless cost cannot be recovered. Where necessary, adjustments are made to the financial information of subsidiaries to ensure consistency of accounting policies with those of the Galasys Group.

50
03 FINANCIAL STATEMENTS
2.3 Goodwill Goodwill represents the excess of the cost of an acquisition over the fair value of the Group’s share of the net identifiable assets of the acquired subsidiary at the date of acquisition. If the cost of an acquisition is less than the fair value of the Group’s share of net identifiable assets of the acquired subsidiary and the measurement of all amounts has been reviewed, the difference is recognised directly in profit or loss as a bargain purchase (negative goodwill).
During the financial year ended 31 December 2013, Galasys Holdings acquired the entire share capital of Galasys GLT Sdn. Bhd. (formerly known as Green Laser Technology Sdn. Bhd.) (“Galasys GLT”). The purchase consideration of RM2,707,895 was fully satisfied by way of issuance of 16,511,566 ordinary shares of Galasys Holdings. The fair value of Galasys GLT’s net identifiable assets as at the date of acquisition was RM4,763,400, resulted in negative goodwill of RM2,055,505. Such goodwill was recognised in profit or loss in the same year.
Goodwill is tested annually for impairment and carried at cost less accumulated impairment losses. Impairment losses on goodwill are not reversed. Gains and losses on the disposal of an entity include the carrying amount of goodwill relating to the entity sold. After initial recognition, goodwill acquired in a business combination is measured at cost less any accumulated impairment losses. Goodwill is not amortised. Irrespective of whether there is any indication of impairment, goodwill (and also an intangible asset with an indefinite useful life or an intangible asset not yet available for use) is tested for impairment, at least annually. Goodwill impairment is not reversed in any circumstances.
For the purpose of impairment testing and since the acquisition date of the business combination, goodwill is allocated to each cash-generating unit, or groups of cash-generating units that are expected to benefit from the synergies of the combination, irrespective of whether other assets or liabilities of the acquiree were assigned to those units or groups of units. Each unit or group of units to which the goodwill is so allocated represents the lowest level within the entity at which the goodwill is monitored for internal management purposes and is not larger than a segment.
2.4. Intangible assetsResearch and development expenditureResearch expenditure is recognised as an expense when it is incurred.
Development expenditure is recognised as an expense except that costs incurred on development projects are capitalised as long term assets to the extent that such expenditure is expected to generate future economic benefits. Development expenditure is capitalised if, and only if, an entity can demonstrate all of the following:(i) its ability to measure reliably the expenditure attributable to the asset under development;(ii) the product or process is technically and commercially feasible;(iii) its future economic benefits are probable;(iv) its ability to use or sell the developed asset; and(v) the availability of adequate technical, financial and other resources to complete the asset under development.

51
03 FINANCIAL STATEMENTS
Capitalised development expenditure is measured at cost less accumulated amortisation and impairment losses, if any. Development expenditure initially recognised as an expense is not recognised as assets in the subsequent year.
The development expenditure is amortised on a straight-line method over a period of 5 years when the products are ready for sale or use. In the event that the expected future economic benefits are no longer probable of being recovered, the development expenditure is written down to its recoverable amount.
2.5. Plant and equipmentPlant and equipment are stated at cost less accumulated depreciation and any accumulated impairment losses. The cost of plant and equipment includes its purchase price and any costs directly attributable to bringing the asset to the location and condition necessary for it to be capable of operating in the manner intended by management. Dismantlement, removal or restoration costs are included as part of the cost of plant and equipment if the obligation for dismantlement, removal or restoration is incurred as a consequence of acquiring or using the plant and equipment. Depreciation of plant and equipment is calculated using the straight-line method to allocate their depreciable amounts over their estimated useful lives as follows:
Motor vehicle 25%Leasehold improvements 33.33%Computer and office equipment 10-33.33%Furniture and fittings 10%Machineries 20%
The carrying values of plant and equipment are reviewed for impairment when events or changes in circumstances indicate that the carrying value may not be recoverable.
The estimated useful lives, residual values and depreciation methods are reviewed, and adjusted as appropriate, at the end of each financial year.
The gain or loss arising on disposal or retirement of an item of plant and equipment is determined as the difference between the sales proceeds and the carrying amount of the asset and is recognised in comprehensive income statement. Fully depreciated plant and equipment are retained in the financial statements until they are no longer in use.
2.6. Impairment of tangible and intangible assets excluding goodwillAt the end of each financial year, the Group reviews the carrying amounts of its tangible and intangible assets to determine whether there is any indication that those assets have suffered an impairment loss. If any such indication exists, the recoverable amount of the asset is estimated in order to determine the extent of the impairment loss (if any). Where it is not possible to estimate the recoverable amount of an individual asset, the Group estimates the recoverable amount of the cash-generating unit to which the asset belongs. Intangible assets with indefinite useful lives and

52
03 FINANCIAL STATEMENTS
intangible assets not yet available for use are tested for impairment annually, and whenever there is an indication that the asset may be impaired.
The recoverable amount of an asset or cash-generating unit is the higher of its fair value less costs to sell and its value in use. In assessing value in use, the estimated future cash flows are discounted to their present value using a pre-tax discount rate that reflects current market assessments of the time value of money and the risks specific to the asset.
If the recoverable amount of an asset (or cash-generating unit) is estimated to be less than its carrying amount, the carrying amount of the asset (cash-generating unit) is reduced to its recoverable amount. An impairment loss is recognised immediately in statement of comprehensive income, unless the relevant asset is carried at a revalued amount, in which case the impairment loss is treated as a revaluation decrease.
Where an impairment loss subsequently reverses, the carrying amount of the asset (cash-generating unit) is increased to the revised estimate of its recoverable amount, but so that the increased carrying amount does not exceed the carrying amount that would have been determined had no impairment loss been recognised for the asset (cash-generating unit) in prior years. A reversal of an impairment loss is recognised immediately in comprehensive income statement, unless the relevant asset is carried at a revalued amount, in which case the reversal of the impairment loss is treated as a revaluation increase.
2.7. Income TaxIncome tax expense represents the sum of the tax currently payable and deferred tax.
The tax currently payable is based on taxable profit for the year. Taxable profit differs from profit as reported comprehensive income statement because it excludes items of income or expense that are taxable or deductible in other years and it further excludes items that are not taxable or tax deductible. The Group’s liability for current tax is calculated using tax rates (and tax laws) that have been enacted or substantively enacted in countries where the Group and its subsidiaries operate by the end of the financial period.
Deferred tax is recognised on the differences between the carrying amounts of assets and liabilities in the financial information and the corresponding tax bases used in the computation of taxable profit, and are accounted for using the balance sheet liability method.
Deferred tax liabilities are generally recognised for all taxable temporary differences and deferred tax assets are recognised to the extent that it is probable that taxable profits will be available against which deductible temporary differences can be utilised. Such assets and liabilities are not recognised if the temporary difference arises from goodwill or from the initial recognition (other than in a business combination) of other assets and liabilities in a transaction that affects neither the taxable profit nor the accounting profit.
Deferred tax liabilities are recognised on taxable temporary differences arising on investment in

53
03 FINANCIAL STATEMENTS
subsidiary, except where the Group is able to control the reversal of the temporary difference and it is probable that the temporary difference will not reverse in the foreseeable future.
The carrying amount of deferred tax assets is reviewed at the end of each financial year and reduced to the extent that it is no longer probable that sufficient taxable profits will be available to allow all or part of the asset to be recovered.
Deferred tax is calculated at the tax rates that are expected to apply in the period when the liability is settled or the asset realised based on the tax rates (and tax laws) that have been enacted or substantively enacted by the end of the financial year. Deferred tax is charged or credited to comprehensive income statement, except when it relates to items charged or credited directly to equity, in which case the deferred tax is also dealt with in equity, or where they arise from the initial accounting for a business combination. In the case of a business combination, the tax effect is taken into account in calculating goodwill or determining the excess of the acquirer’s interest in the net fair value of the acquire’s identifiable assets, liabilities and contingent liabilities over cost.
Deferred tax assets and liabilities are offset when there is a legally enforceable right to set off current tax assets against current tax liabilities and when they relate to income taxes levied by the same taxation authority and the Group intends to settle its current tax assets and liabilities on a net basis.
2.8. Financial instrumentsFinancial assets and financial liabilities are recognised on the Group’s consolidated statement of financial position when the Group becomes a party to the contractual provisions of the instrument.
Effective interest methodThe effective interest method is a method of calculating the amortised cost of a financial instrument and allocating the interest income or expense over the relevant period. The effective interest rate is the rate that exactly discounts estimated future cash receipts or payments (including all fees on points paid or received that form an integral part of the effective interest rate, transaction costs and other premiums or discounts) through the expected life of the financial instrument, or where appropriate, a shorter period, to the net carrying amount of the financial instrument. Income and expense are recognised on an effective interest basis for debt instruments other than those financial instruments at fair value through comprehensive income statement.
Financial assetsFinancial assets within the scope of IAS 39 are classified as either:(i) financial assets at fair value through profit or loss(ii) loans and receivables(iii) held-to-maturity investments(iv) available-for-sale financial assets
The classification depends on the purpose for which the financial assets were acquired.

54
03 FINANCIAL STATEMENTS
Management determines the classification of its financial assets at initial recognition and re-evaluates this classification at every reporting date. As at the balance sheet date, the Group did not have any financial assets at fair value through profit or loss, and in the categories of held-to-maturity investments and available-for-sale financial assets.
All regular way purchases and sales of financial assets are recognised on the trade date, i.e. the date that the Group commits to purchase the asset. Regular way purchases and sales are purchases or sales of financial assets that require delivery of the financial assets within the period generally established by regulation or convention of the market place concerned.
Financial assets are derecognised when the rights to receive cash flow from the financial assets have expired or have been transferred and the Group has transferred substantially all risks and rewards of ownership.
Financial assets at fair value through profit or loss (“FVTPL”) Financial assets are classified in this category if they are acquired for the purpose of selling in the short term. Gains or losses on investments held for trading are recognised in the comprehensive income statement.
Loans and receivablesTrade receivables, loans and other receivables that have fixed or determinable payments that are not quoted in active market are classified as loans and receivables. Loans and receivables are measured at amortised cost, using the effective interest method less impairment. Interest is recognised by applying the effective interest method, except for short-term receivables when the recognition of interest would be immaterial.
Impairment of financial assetsFinancial assets, other than FVTPL, are assessed for indicators of impairment at the end of each financial year. Financial assets are impaired where there is objective evidence that, as a result of one or more events that occurred after the initial recognition of the financial asset, the estimated future cash flows of the investment have been impacted.
For financial assets carried, at amortised cost, the amount of the impairment is the difference between the asset’s carrying amount and the present value of estimated future cash flows, discounted at the original effective interest rate.
The carrying amounts of all financial assets are reduced by the impairment loss directly with the exception of trade receivables where the carrying amount is reduced through the use of an allowance account. Changes in the carrying amount of the allowance account are recognised in comprehensive income statement.
If, in a subsequent period, the amount of the impairment loss decreases and the decrease can be related objectively to an event occurring after the impairment loss was recognised, the previously recognised impairment loss is reversed through comprehensive income statement to the extent

55
03 FINANCIAL STATEMENTS
the carrying amount of the investment at the date the impairment is reversed does not exceed what the amortised cost would have been had the impairment not been recognised.
In respect of available-for-sale equity instruments, any subsequent increase in fair value after an impairment loss is recognised directly in equity.
Derecognition of financial assets The Group derecognises a financial asset only when the contractual rights to the cash flows from the asset expire, or it transfers the financial asset and substantially all the risks and rewards of ownership of the asset to another entity. If the Group neither transfers nor retains substantially all the risks and rewards of ownership of the financial asset and continues to control the transferred asset, the Group recognises its retained interest in the asset and an associated liability for amounts it may have to pay. If the Group retains substantially all the risks and rewards of ownership of a transferred financial asset, the Group continues to recognise the financial asset and also recognises a collateralised borrowing for the proceeds receivables.
Financial liabilities and equity instruments Classification as debt or equity Financial liabilities and equity instruments issued by the Group are classified according to the substance of the contractual arrangements entered into and the definitions of a financial liability and an equity instrument.
Equity instrumentsAn equity instrument is any contract that evidences a residual interest in the assets of the Group after deducting all of its liabilities. Equity instruments are recorded at the proceeds received, net of direct issue costs.
Financial liabilities Financial liabilities are classified as either financial liabilities at fair value through comprehensive income statement or other financial liabilities.Financial liabilities are classified as at fair value through comprehensive income statement if the financial liability is either held for trading or it is designated as such upon initial recognition.
Other financial liabilities Trade and other payables: Trade and other payables are initially measured at fair value, net of transaction costs, and are subsequently measured at amortised cost, where applicable, using the effective interest method, with interest expense recognised on an effective yield basis.
Derecognition of financial liabilities The Group derecognises financial liabilities when, and only when, the Group’s obligations are discharged, cancelled or they expire.

56
03 FINANCIAL STATEMENTS
2.9. InventoriesInventories are stated at the lower of cost and net realisable value. Costs comprise direct materials and, where applicable, direct labour costs and those overheads that have been incurred in bringing inventories to their present location and condition. Cost is calculated using the weighted average method. Net realisable value represents the estimated selling price less all estimated costs of completion and costs to be incurred in marketing, selling and distribution.
2.10. Cash and cash equivalentsCash and cash equivalents comprise cash on hand and demand deposits, and other short-term highly liquid investments which are readily convertible to known amounts of cash and are subject to insignificant risk of changes in value.
2.11. Employee benefitsShort term benefitsWages, salaries, paid annual leave and sick leave, bonuses and non-monetary benefits are accrued in the period in which the associated services are rendered by employees of the Group.
For employee leave entitlement the expected cost of short-term employee benefits in the form of compensated absences is recognised in the case of accumulating compensated absences, when the employees render service that increases their entitlement to future compensated absences; and in the case of non-accumulating compensated absences, when the absences occur. A liability for bonuses is recognised where the entity is contractually obliged or where there is constructive obligation based on past practice.
Defined contribution plansThe Group’s contributions to defined contribution plans are recognised in profit or loss in the period to which they relate. The entity’s legal or constructive obligation is limited to the amount that it agrees to contribute to an independently administered fund. Once the contributions have been paid, the Group has no further liability in respect of the defined contribution plans.
Share-based payment transactionsThe Group operates share-based compensation plans for remuneration of its employees. All employee services received in exchange for the grant of any share-based compensation are measured at their fair values.
The grant-date fair value of share-based payment awards granted to employees is recognised as an employee expense, with a corresponding increase in equity, over the period that the employees become unconditionally entitled to the awards. The amount recognised as an expense is adjusted to reflect the number of awards for which the related service and non-market performance conditions are expected to be met, such that the amount ultimately recognised as an expense is based on the number of awards that meet the related service and non-market performance conditions at the vesting date. For share-based payment awards with non-vesting conditions, the grant-date fair value of the share-based payment is measured to reflect such conditions and there is no true-up for differences between expected and actual outcomes.

57
03 FINANCIAL STATEMENTS
The fair value of the amount payable to employees in respect of share appreciation rights, which are settled in cash, is recognised as an expense with a corresponding increase in liabilities, over the period that the employees become unconditionally entitled to payment. The liability is remeasured at each reporting date and at settlement date. Any changes in the fair value of the liability are recognised as personnel expenses in profit or loss. The Group’s share option schemes provide for an exercise price at which an option may be exercised is determined by the Board of Directors at the time of grant and will be not less than [the average of the mid-market price for the last five dealing days prior to the date of grant or par value, whichever is higher]. The vesting period ranges from the date of grant up to [ten years]. If options remain unexercised after a period of [ten years] from the date of grant, the options expire and are returned to the unused share option pool.
An option may be exercised for a period of 30 days if the option holder’s employment terminates by reason of injury, disability, redundancy, the option holder's employer ceasing to be a member of the group, because the business in which the option holder is employed is transferred out of the Group or for any other reason which may be determined by the Board. In such cases, options will be exercisable to the extent vested at the date on which the option holder ceases to hold an office or employment with the Group and to the extent any condition has been met at that time, with such condition to be modified by the Board of Directors as may be appropriate to reflect any reduced time for its fulfilment. In the event of an option holder’s death, an option may be exercised by his personal representatives within 12 months following the date of death. The option may be exercised to the extent vested at the date of death and to the extent any condition has been met at such time, with such condition to be modified by the Board as may be appropriate to reflect any reduced time for its fulfilment.
If an option holder ceases to be employed for any reason other than those set out above, his options will lapse on the date of such cessation.
Options will lapse to the extent unexercised at the expiry of ten years from the date of grant.
The Group has a current share option scheme under which options have been granted on various exercise periods between 12 May 2018 to 12 May 2024.
2.12. ContractsWhere the outcome of a contract can be reliably estimated, contract revenue and contract costs are recognised as revenue and expenses respectively by using the stage of completion method. The stage of completion is measured by reference to the proportion of cost of work accepted by the customers to date to the estimated total contract cost.
Where the outcome of a contract cannot be reliably estimated, contract revenue is recognised to the extent of contract costs incurred that are likely to be recoverable. Contract costs are recognised as expenses in the period in which they are incurred.

58
03 FINANCIAL STATEMENTS
When it is probable that total contract costs will exceed total contract revenue, the expected loss is recognised as an expense immediately.
Contract revenue comprises the initial amount of revenue agreed in the contract and variations in contract work to the extent that it is probable that they will result in revenue and they are capable of being reliably measured.
When the total of costs incurred on contracts plus recognised profits (less recognised losses) exceeds progress billings, the balance is classified as amount due from customers on contracts. When progress billings exceed costs incurred plus recognised profits (less recognised losses), the balance is classified as amount due to customers on contracts.
2.13. Provisions, contingent liabilities, contingent assetsProvisions are recognised when the Group has a present or constructive obligation as a result of past events, when it is probable that an outflow of resources embodying economic benefits will be required to settle the obligation, and when a reliable estimate of the amount can be made.
Provisions are reviewed at the end of each financial reporting period and adjusted to reflect the current best estimate. Where effect of the time value of money is material, the provision is the present value of the estimated expenditure required to settle the obligation.
A contingent liability is a possible obligation that arises from past events and whose existence will only be confirmed by the occurrence of one or more uncertain future events not wholly within the control of the Group. It can also be a present obligation arising from past events that is not recognised because it is not probable that outflow of economic resources will be required or the amount of obligation cannot be measured reliably.
A contingent liability is not recognised but is disclosed in the notes to the financial information. When a change in the probability of an outflow occurs so that the outflow is probable, it will then be recognised as a provision.A contingent asset is a probable asset that arises from past events and whose existence will be confirmed only by the occurrence or non-occurrence of one or more uncertain events not wholly within the control of the Group. The Group does not recognise contingent assets but discloses their existence where inflows of economic benefits are probable, but not virtually certain.
2.14. BorrowingsBorrowings are presented as current liabilities unless the Group has an unconditional right to defer settlement for at least twelve months after the reporting date, in which case they are presented as non-current liabilities.
Borrowing costs, directly attributable to the acquisition and construction of plant and equipment, are capitalised as part of the cost of those assets, until such time as the assets are ready for their intended use or sale. Capitalisation of borrowing costs is suspended during extended periods in which active development is interrupted.

59
03 FINANCIAL STATEMENTS
All other borrowing costs are recognised in profit or loss as expenses in the period in which they incurred.
2.15. Leases Assets acquired under hire purchase are capitalised in the financial statements and are depreciated in accordance with the policy set out in note 2.6 above. Each hire purchase payment is allocated between the liability and finance charges so as to achieve a constant rate on the finance balance outstanding. Finance charges are recognised in profit or loss over the period of the respective hire purchase agreements.
Hire purchases are classified as finance leases as the terms of the lease transfer substantially all of the risk and rewards of ownership to the lessee.
Payments made under operating leases are recognised as an expense in the profit or loss on a straight-line basis over the term of the lease unless another systematic basis is representative of the time pattern of the user's benefit, even if the payments are not on that basis. Lease incentives received are recognised in profit or loss as an integral part of the total lease expense.
2.16. Related partiesA party is related to an entity if:
(i) directly, or indirectly through one or more intermediaries, the party: • controls, is controlled by, or is under common control with the entity (this includes parents, subsidiaries and fellow subsidiaries);• has an interest in the entity that gives it significant influence over the entity; or• has joint control over the entity;(ii) the party is an associate of the entity;(iii) the party is a joint venture in which the entity is a venturer;(iv) the party is a member of the key management personnel of the entity or its parent;(v) the party is a close member of the family of any individual referred to in (i) or (iv);(v) the party is an entity that is controlled, jointly controlled or significantly influenced by, or for which significant voting power in such entity resides with, directly or indirectly, any individual referred to in (iv) or (v); or(vii) the party is a post-employment benefit plan for the benefit of employees of the entity, or of any entity that is a related party of the entity.
Close members of the family of an individual are those family members who may be expected to influence, or be influenced by, that individual in their dealings with the entity.
2.17. Share capital Ordinary shares Proceeds from issuance of ordinary shares are classified as share capital in equity. Incremental costs directly attributable to the issuance of new ordinary shares are deducted against share capital.

60
03 FINANCIAL STATEMENTS
Redeemable convertible preference sharesRedeemable convertible preference shares are classified as equity if it is non-redeemable, or redeemable only at the Company’s option, and any dividends are discretionary. Dividends thereon are recognised as distributions within equity on approval by the Company’s shareholders.
Redeemable convertible preference shares are classified as financial liability if it is redeemable on a specific date or at the option of the shareholders, or if dividend payments are not discretionary. Dividends thereon are recognised as interest expense in profit or loss as accrued.
2.18. Revenue and other incomeThe Group’s revenue is earned through the sale of software, software related services and the sale of associated products.
Sale of goodsRevenue is recognised upon delivery of goods and customers’ acceptance and, where applicable, net of returns and trade discounts.ServicesRevenue is recognised on the percentage of completion method as disclosed in notes 2.12.
Interest income Interest income is accrued on a time basis, by reference to the principal outstanding and at the applicable effective interest rate.
2.19. Foreign currency transactions and translationTransactions and balancesTransactions in foreign currencies are converted into the respective functional currencies on initial recognition, using the exchange rates approximating those ruling at the transaction dates. Monetary assets and liabilities at the end of the reporting period are translated at the rates ruling as of that date. Non-monetary assets and liabilities are translated using exchange rates that existed when the values were determined. All exchange differences are recognised in profit or loss.
The translations of Sterling (“GBP”) amounts into RM amounts are included solely for the convenience of readers. The reporting year end rates used are GBP to RM5.4396 (2013: Nil) which approximate the rate of exchange at the end of the reporting year. The average rates of exchange for exchange for the reporting year were GBP to RM5.3935 (2013: Nil). Such translation should not be construed as a representation that the dollar amounts could be converted into RM at the above rate or other rate. Foreign operationsAssets and liabilities of foreign operations are translated to RM at the rates of exchange ruling at the end of the reporting period. Revenues and expenses of foreign operations are translated at exchange rates approximating those ruling at the dates of the transactions. All exchange differences arising from translation are taken directly to other comprehensive income and accumulated in equity under the foreign exchange translation reserve. On the disposal of a foreign operation, the

61
03 FINANCIAL STATEMENTS
cumulative amount recognised in other comprehensive income relating to that particular foreign operation is reclassified from equity to profit or loss.
Goodwill and fair value adjustments arising from the acquisition of foreign operations are treated as assets and liabilities of the foreign operations and are recorded in the functional currency of the foreign operations and translated at the closing rate at the end of the reporting period.
2.20. Operating segmentsAn operating segment is a component of the Group that engages in business activities from which it may earn revenues and incur expenses, including revenues and expenses that relate to transactions with any of the Group’s other components. An operating segment’s operating results are reviewed regularly by the chief operating decision maker (which takes the form of the Board of Directors of the Company) to make decisions about resources to be allocated to the segments and assess its performance, and for which discrete financial information is available.
3. Critical accounting judgements and key sources of estimation uncertaintyIn the application of the Group’s accounting policies, which are described in Note 2, management made judgements, estimates and assumptions about the carrying amounts of assets and liabilities that were not readily apparent from other sources. These judgements are continually evaluated by the directors and management and are based on historical experience and other factors, including expectations of future events that are believed to be reasonable under the circumstances. However, this does not prevent actual figures differing from estimates.
Revisions to accounting estimates are recognised in the period in which the estimate is revised if the revision affects only that period or in the period of the revision and future periods if the revision affects both current and future periods.
The key estimates and assumptions concerning the future and other key sources of estimation uncertainty at the end of the financial year, that have significant risk of causing a material adjustment to the carrying amounts of assets and liabilities within the next financial year are reviewed are as stated below.
Amortisation of intangible assets Development costs are amortised on a straight-line method over a period of 5 years. Useful lives are based on management’s estimates of the period that the assets will generate revenue, with such periods being periodically reviewed for continued appropriateness.
The Group assesses the impairment of intangible assets subject to amortisation whenever events or changes in circumstances indicate that the carrying value may not be recoverable. Factors considered important that could trigger an impairment review include the following:• significant underperformance relative to historical or projected future operating results;• significant changes in the manner of the use of the acquired assets or the strategy for the overall business; and

62
03 FINANCIAL STATEMENTS
• significant negative industry or economic trends.
The complexity of the estimation process and issues related to the assumptions, risks and uncertainties inherent in the application of the Group’s accounting estimates in relation to intangible assets affect the amounts reported in the financial statements, especially the estimates of the expected useful economic lives and the carrying values of those assets. If business conditions were different, or if different assumptions were used in the application of this and other accounting estimates, it is likely that materially different amounts could be reported in the Group’s financial statements. The carrying amount of the development costs at the end of the financial year affected by the assumption is RM6,085,901 (2013: RM2,769,538) in Note 5.
Allowance for trade and other receivablesManagement reviews its loans and receivables for objective evidence of impairment at least quarterly. Significant financial difficulties of the debtor, the probability that the debtor will enter bankruptcy, and default or significant delay in payments are considered objective evidence that a receivable is impaired. In determining this, management makes judgment as to whether there is observable data indicating that there has been a significant change in the payment ability of the debtor, or whether there have been significant changes with adverse effect in the technological, market, economic or legal environment in which the debtor operates in.
The allowance policy for doubtful debts of the Group is based on the ageing analysis and management’s on-going evaluation of the recoverability of the outstanding receivables. Once debtors have been identified as having evidence of impairment, it is regularly reviewed and appropriate impairment position applied. The carrying amount of the Group’s trade and other receivables as at 31 December 2014 are disclosed in Note 8.
Impairment of non-financial assetsAn impairment exists when the carrying value of non-financial assets or cash generating unit exceeds its recoverable amount, which is the higher of its fair value less costs to sell and its value in use. The fair value less costs to sell calculation is based on available data from binding sales transactions in an arm’s length transaction of similar assets or observable market prices less incremental costs for disposing the asset. The value in use calculation is based on a discounted cash flow model. The cash flows are derived from internal budgets and do not include significant future investments that will enhance the asset’s performance of the cash generating unit being tested. The recoverable amount is most sensitive to the discount rate used for the discounted cash flow model as well as the expected future cash inflows and the growth rate used for extrapolation purposes.
An assessment is made annually whether goodwill and franchise fees have suffered any impairment losses. The assessment process is complex and highly judgemental and is based on assumptions that are affected by expected future market or economic conditions. Judgement is required in identifying the cash generating units (“CGU”) and the use of estimates as disclosed in Note 5 and 6. Projections of future revenues were a critical estimate in determining fair value. Actual outcomes could vary from these estimates as disclosed in Notes 5 and 6.

63
03 FINANCIAL STATEMENTS
Provision for income taxes The amount of income tax is being calculated on estimated assessable profits based on the completed contract method which is in accordance with the tax rules and regulations applicable in the People’s Republic China. Where the final tax outcome of these matters is different from the amounts that were initially recognised, such differences will impact the income tax and deferred tax provisions in the period in which such determination is made. The amounts are disclosed in Note 22.
Net realisable value of inventoriesNet realisable value of inventories is the estimated selling price in the ordinary course of business, less estimated costs of completion and selling expenses. These estimates are based on the current market condition and the historical experience of manufacturing and selling products of similar nature. It could change significantly as a result of changes in customer demand and competitor actions in response to severe industry cycle. Management reassesses these estimates at each balance sheet date. The carrying amounts of the Group’s inventories as at 31 December 2014 are disclosed in Note 7.
4. Plant and equipment
Motor vehiclesLeasehold
improvements
Computer, Machinery, Office equipment and furniture and fittings Total
RM RM RM RM
As at 31 December 2014
Cost
At 1 January 2014 252,186 18,308 517,943 788,437
Additions - 182,307 222,667 404,974
Effect in foreign exchange translation - 1,437 12,452 13,889
At 31 December 2014 252,186 202,052 753,062 1,207,300
Accumulated depreciation
At 1 January 2014 115,421 9,662 451,382 576,465
Charge for the year 50,437 24,590 53,925 128,952
Effect in foreign exchange translation - 841 7,947 8,788
At 31 December 2014 165,858 35,093 513,254 714,205
Net book value
At 31 December 2014 86,328 166,959 239,808 493,095

64
03 FINANCIAL STATEMENTS
4. Plant and equipment - continued
Motor vehiclesLeasehold
improvements
Computer, Machinery, Office equipment and furniture and fittings Total
RM RM RM RM
As at 31 December 2013 (Proforma)
Cost
At 1 January 2013 34,208 16,564 152,673 203,445
Additions - - 34,942 34,942Addition through acquisitionof a subsidiary 252,186 - 313,099 565,285
Disposal (36,143) - - (36,143)
Effect in foreign exchange translation 1,935 1,744 17,229 20,908
At 31 December 2013 252,186 18,308 517,943 788,437
Accumulated depreciation
At 1 January 2013 15,572 3,221 113,158 131,951
Charge for the year - 5,833 23,643 29,476Addition through acquisitionof a subsidiary 115,421 - 301,653 417,074
Disposal (16,452) - - (16,452)
Effect in foreign exchange translation 880 608 12,928 14,416
At 31 December 2013 115,421 9,662 451,382 576,465
Net book value
At 31 December 2013 (Proforma) 136,765 8,646 66,561 211,972
The depreciation expense is charged to administrative expenses within the Consolidated Statement of Comprehensive Income as disclosed in Note 21.
Assets under hire purchaseThe carrying amount of motor vehicles held under finance leases amounted to RM86,328 (2013: RM136,765).

65
03 FINANCIAL STATEMENTS
5. Intangible assets
Proforma
2014 2013
RM RM
At cost:
At 1 January 4,253,849 2,179,984
Addition during the year 4,143,961 1,763,139
Effect in foreign exchange translation 323,285 310,726
8,721,095 4,253,849
Accumulated amortisation:
At 1 January (1,484,311) (701,740)
Addition during the year (1,027,328) (677,481)
Effect in foreign exchange translation (123,555) (105,090)
(2,635,194) (1,484,311)
At 31 December 6,085,901 2,769,538
Intangible assets comprise software development costs and additions comprise internally generated assets. Development costs principally comprise internally generated expenditure on development costs on major software development projects where it is reasonably anticipated that the costs will be recovered through future commercial activity. It mainly consists of staff costs and outsourcing professional fees.
Of those assets that are ready for use, the development costs are amortised over the estimated useful life of 5 years. The amortisation charge is recognised in cost of sales.
Key sources of estimation uncertaintyOf those assets that are not ready for us, the recoverable amount of a cash-generating unit (“CGU”) is determined using the value-in-use approach, and this is derived from the present value of the future cash flows from this segment computed based on the projections of financial budgets approved by management covering a period of five years with assumptions for revenues, margins and growth rates. These assumptions were used for the analysis of the CGU within the business on a consistent basis each year. Management determined budgeted gross margins based on its expectations of market developments. The weighted average growth rates used were consistent with forecasts included in industry reports. The discount rates used were pre-tax and reflected specific risks relating to the relevant segments.

66
03 FINANCIAL STATEMENTS
6. Goodwill on consolidation
Proforma
2014 2013
RM RM
At 1 January 515,913 481,836
Effect in foreign exchange translation 34,443 34,077
At 31 December 550,356 515,913
During the financial year, the Group assessed the recoverable amount of the goodwill and determined that no impairment is required.
This assessment of goodwill was done by comparing the gross profit to the value of goodwill for the entity whose acquisition gave rise to the goodwill.
Key sources of estimation uncertaintyThe recoverable amount of a cash-generating unit is determined based on value-in-use calculations using cash flow projections based on financial budgets approved by management covering a period of three years. The key assumptions used for value-in-use calculations are:-
Average growth rate Historical growth rate of the business
Gross margin 66 per cent
Discount rate 8%
Management determined the budgeted gross margin based on past and expected future performances. The growth rate used is based on the anticipated demand over the projection years. The discount rate used was pre-tax and was estimated based on the industry weighted average cost of capital.

67
03 FINANCIAL STATEMENTS
7. Inventories
Proforma
2014 2013
RM RM
At cost:
Finished goods 1,037,779 2,169,289
None of the inventories carried at below net realiasable value. There has been no impairment charge recognised in relation to inventory
8. Trade and other receivables
Proforma
2014 2013
RM RM
Trade receivables (Note 8A) 10,955,264 9,368,879
Advance payments to suppliers 2,286,867 1,834,730
Prepayments 300,156 127,124
Other receivables 3,690,975 1,341,471
17,233,262 12,672,204
Trade receivables
Proforma
2014 2013
RM RM
Trade receivables 11,170,991 9,478,558
Impairment allowances for receivables (215,727) (109,679)
10,955,264 9,368,879

68
03 FINANCIAL STATEMENTS
The change in impairment loss in respect of trade receivables balance during the year is as follows:
Proforma
2014 2013
Impairment Loss: RM RM
At 1 January 109,679 -
Impairment loss recognised 215,727 109,679
Amount reversed (109,679) -
215,727 109,679
The Company’s normal trade credit terms range from 30 to 180 days. Other credit terms are assessed and approved on a case-by-case basis.
Included in other receivables for the financial year ended 31 December 2013 was an outstanding amount for the purchase of Redeemable Convertible Preference Shares (“RCPS”) from its investor of approximately RM563,000.
The carrying amounts of trade and other receivables approximate to their fair values.

69
03 FINANCIAL STATEMENTS
9. Amounts owing by/ (to) contract customers
Proforma
2014 2013
RM RM
Cost incurred to date 8,956,553 3,396,636
Attribute profits 19,163,220 5,404,713
28,119,773 8,801,349
Progress billings (19,555,578) (7,432,555)
8,564,195 1,368,794
Represented by:
Amount owing by contract customers 8,564,195 1,368,794
Amount owing (to) contract customers - -
8,564,195 1,368,794
Amount of contract revenue recognised as revenue during the financial years 28,119,773 8,801,349
Amount of contract costs recognised as expenses during the financial years 8,956,553 3,396,636
10. Amounts owing by/ (to) related parties The amounts owing in previous financial year are non-trade in nature, unsecured, interest-free and repayable on demand. The amounts owing [have been] settled during the financial year in cash.
Several debt transfer agreements or letters and novation agreements were entered into between the Group and third parties on 20 December 2013 and on 31 December 2013. The debt has been settled during the financial year in cash.
11. Cash and cash equivalents
Proforma
2014 2013
RM RM
Cash at banks 11,658,539 1,600,058
Cash in hand 80,878 100,765
11,739,417 1,700,823

70
03 FINANCIAL STATEMENTS
11A. Cash and cash equivalents
Proforma
2014 2013
RM RM
Not restricted in use 11,739,417 1,700,823
Restricted in use (a) 477,289 463,362
12,216,706 2,164,185
(a) Cash restricted in use comprises of fixed deposits with licensed banks. The fixed deposits of the Group at the end of the reporting period bore effective interest rates ranging from 2.75% to 3.20% per annum. The fixed deposits have maturity periods ranging from 30 days to 365 days and pledged to bank as security for banking facilities granted to the Group.
11B. Cash and cash equivalents in the statement of cash flows
Proforma
2014 2013
RM RM
Amount as shown above 12,216,706 2,164,185
Bank overdrafts (Note 14A) (418,805) (566,552)
Cash restricted in use over 3 months (477,289) (463,362)
Cash and cash equivalents for statement of cash flows purposes at end of the year 11,320,612 1,134,271
12. Trade and other payables
Proforma
2014 2013
Note RM RM
Trade payables a 2,423,838 532,912
Accruals b 2,544,311 929,082
Other payables c 257,032 266,358
5,225,181 1,728,352
Note a: The normal trade credit terms granted to the Company is range from 30 to 60 days.Note b: Included in the accruals are mainly salaries payable and value-added tax payable at the end of the reporting period.Note c: Included in other payables is the amount owing to a research and development sub-contractor.
The carrying amounts of trade and other payables approximate to their fair values.

71
03 FINANCIAL STATEMENTS
13. Amount owing to directorsThe amount owning are non-trade in nature, unsecured, interest-free and repayable on demand. The amounts have been settled during the financial year in cash.
14. Short-term borrowings
Proforma
2014 2013
RM RM
Bank overdraft (Note 14A) 418,805 566,552
Term loan (Note 14B) 49,066 49,066
467,871 615,618
14A. Bank overdraftsThe bank overdrafts bore an interest rates of 2.00% per annum above the banks’ base lending rate at the end of the financial year and secured by:-
(i) fixed deposits up to RM200,000 with interest capitalised; and(ii) Joint and several guarantee by all directors of a subsidiary for RM500,000.
14B. Term loan
Proforma
2014 2013
RM RM
Current: Not later than 1 year 49,066 49,066
Non-current: Later than one year and not later than five years 81,984 118,621
131,050 167,687
The term loan bore an effective interest rate of 8.35% per annum at the end of the reporting period and repayable by 60 monthly installments of RM4,089 and is secured by:-
(i) fixed deposits up to RM200,000; and(ii) Joint and several guarantee by all directors of a subsidiary for RM500,000.

72
03 FINANCIAL STATEMENTS
15. Finance lease payables
Proforma
2014 2013
RM RM
Minimum hire purchase payables:
- not later than one year 35,916 35,916
- later than one year and not later than five year 127,836 163,757
163,752 199,673
Less: Future finance charges (28,757) (35,018)
Present value of hire purchase payable 134,995 164,655
Current: Not later than 1 year 29,660 29,660
Non-current: Later than one year and not later than five years 105,335 134,995
Present value of hire purchase available 134,995 164,655
The hire purchase payables of the Group related to motor vehicles, and bore effective interest rates ranging from 4.56% to 8.55% per annum at the end of the financial year.
The obligations under finance lease payables are secured by the lessor's charge over the leased assets.
16. Redeemable convertible preference shares
Proforma
2014 2013
RM RM
Authorised
Redeemable convertible preference shares 3,280,000 3,280,000
Issued and fully paid-up:
Redeemable convertible preference A shares - 1,173,564
The Redeemable Convertible Preference Shares (“RCPS”) at a nominal value of US$0.01 were constituted by the subscription agreement dated 26 December 2013. The issue price of the RCPS was US$1.00. The main feature of the RCPS is that each holder shall, when all shares of the Company acceptable to all the holders of the RCPS, be entitled to require the Company to convert

73
03 FINANCIAL STATEMENTS
all or any of the RCPS registered under the name of the holder into such number of fully paid ordinary shares of US$1.00 each, at the conversion price as computed in the agreement therein.
The salient features of RCPS were as follows:-
(a) The RCPS shall be converted at the option of RCPS holders into ordinary shares of the Company at a specified conversion ratio for every RCPS held when the Company received approval for a public listing and there is an underwriter committed to underwrite the public listing and the Company proceeds with the listing exercise.
(b) The RCPS holders do not carry any right to vote at any general meeting of the Company except on resolutions to amend the RCPS holder’s rights, to declare dividends to other classes of shares whist there remain preference dividends in arrears, or to commence dissolution of the Company.
(c) The RCPS do not carry any right to participate in the profits or surplus assets of the Company.
The entire RCPS were converted into 22,835,131 ordinary shares of Galasys Holdings on 7 March 2014. 17. Stated capital account
2014
Note Number of shares RM
On incorporation a 2 -
Issuance of shares:
On 7 March 2014 b 52,696,454 17,478,074
On 12 May 2014 c 13,874,582 17,076,142
Less: Share issuance expenses - (9,148,113)
At the end of the financial year 66,571,038 25,406,103
Note a The Company was incorporated on 23 January 2014 with an unlimited share capital which is divided into Ordinary Shares with no par value of which 2 ordinary shares have been allotted and issued to the subscribers of the memorandum of the Company.
Note bOn 7 March 2014, the Company issued and allotted an aggregate of 52,696,454 ordinary shares to the holders of shares in Galasys Holdings Limited (“Galasys Holdings”) pursuant to the Share Swap Agreement dated 7 March 2014 in consideration for the transfer of the entire issued share capital of Galasys Holdings to the Company.
Note cAn initial public offer being completed on admission of relevant shares to trading on AIM on 12 May 2015, resulted in the issuance of 13,874,582 ordinary shares (“Placing Shares”) at 22.5 pence per share to the subscribers of the Placing Shares raising approximately £3,121,781 before share issuance expenses.
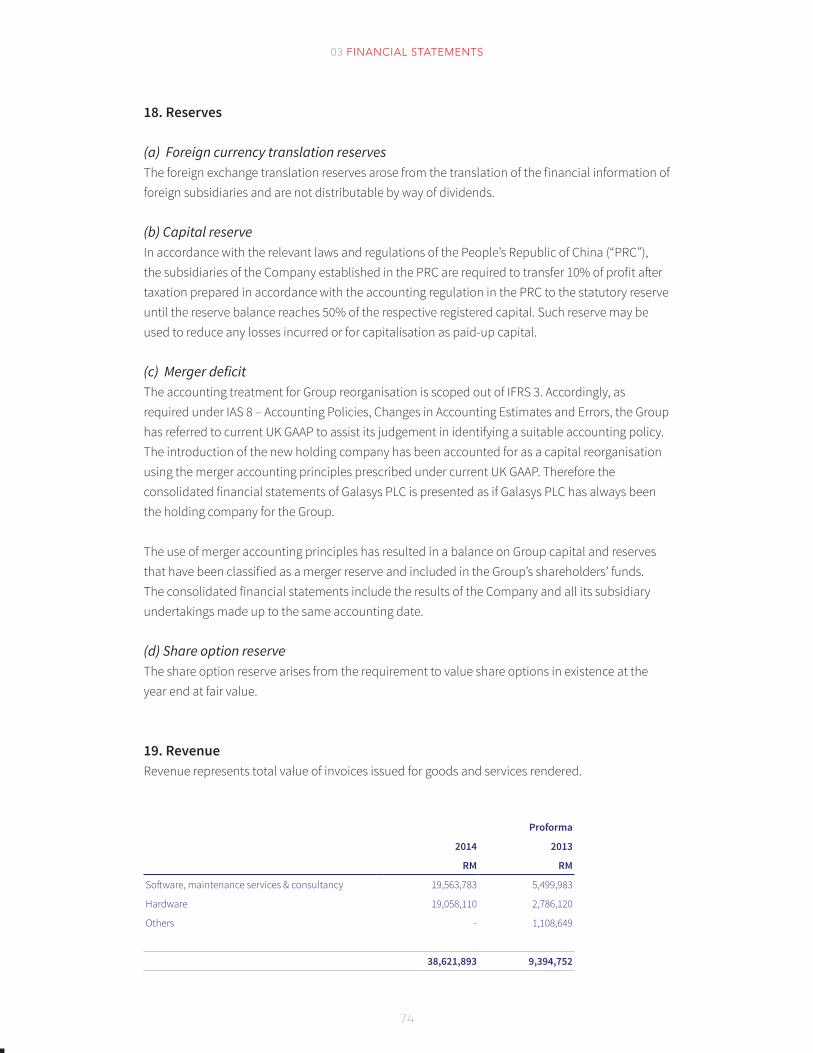
74
03 FINANCIAL STATEMENTS
18. Reserves
(a) Foreign currency translation reservesThe foreign exchange translation reserves arose from the translation of the financial information of foreign subsidiaries and are not distributable by way of dividends.
(b) Capital reserveIn accordance with the relevant laws and regulations of the People’s Republic of China (“PRC”), the subsidiaries of the Company established in the PRC are required to transfer 10% of profit after taxation prepared in accordance with the accounting regulation in the PRC to the statutory reserve until the reserve balance reaches 50% of the respective registered capital. Such reserve may be used to reduce any losses incurred or for capitalisation as paid-up capital.
(c) Merger deficitThe accounting treatment for Group reorganisation is scoped out of IFRS 3. Accordingly, as required under IAS 8 – Accounting Policies, Changes in Accounting Estimates and Errors, the Group has referred to current UK GAAP to assist its judgement in identifying a suitable accounting policy. The introduction of the new holding company has been accounted for as a capital reorganisation using the merger accounting principles prescribed under current UK GAAP. Therefore the consolidated financial statements of Galasys PLC is presented as if Galasys PLC has always been the holding company for the Group.
The use of merger accounting principles has resulted in a balance on Group capital and reserves that have been classified as a merger reserve and included in the Group’s shareholders’ funds. The consolidated financial statements include the results of the Company and all its subsidiary undertakings made up to the same accounting date.
(d) Share option reserveThe share option reserve arises from the requirement to value share options in existence at the year end at fair value.
19. RevenueRevenue represents total value of invoices issued for goods and services rendered.
Proforma
2014 2013
RM RM
Software, maintenance services & consultancy 19,563,783 5,499,983
Hardware 19,058,110 2,786,120
Others - 1,108,649
38,621,893 9,394,752

75
03 FINANCIAL STATEMENTS
20. Other operating income
Proforma
2014 2013
RM RM
Interest income from cash restricted in use 13,927 13,362
Other interest income 21,390 335,000
Tax refund 380,402 415,000
Reversal of impairment 109,679 -
Others 86,324 89,018
Negative goodwill (Note 24) - 2,055,505
611,722 2,907,885
21. Profit before taxation
Proforma
2014 2013
RM RM
Profit before taxation is arrived at after charging/(crediting):-
Amortisation of intangible assets 1,027,328 677,481
Auditors' remuneration:
- current year 315,000 18,202
- under provision in prior year - -
Depreciation of plant and equipment 128,952 29,476
Fair value loss on trade receivables - 16,382
Bad debts written off 247,048 -
Impairment allowance on trade receivables 215,727 -
Directors' remuneration:
- Salary and other emolument 588,389 148,604
- Defined contribution plan 77,454 -
Interest expense on:
- Revolving credit - 9,078
- Others 80,705 32,923
Written off of tenancy deposit - 5,169
Written off of others receivables - 184,636
Rental of premises 501,141 265,335
Staff costs:
- salary and allowances 2,611,740 799,667
- defined contribution plan 197,093 119,275
Unrealised gain on foreign exchange 319,036 -
Gain on disposal of plant and equipment - (2,360)

76
03 FINANCIAL STATEMENTS
22. Taxes Components of tax expenses recognized in profit or loss include:
Proforma
2014 2013
RM RM
Current tax expense:
Current tax expense 1,510,183 347,117
Under/(overprovision) in the previous financial year 40,439 -
1,550,622 347,117
Deferred tax (income) expense:
Deferred tax (income) expense 392,181 3,038
Under/(overprovision) in the previous financial year - -
392,181 3,038
Total income tax expense 1,942,803 350,155
The charge for each period can be reconciled to the profit or loss per the consolidated statements of profit or loss as follows:
Proforma
2014 2013
RM RM
Profit before taxation 11,338,562 7,107,020
Tax at the applicable statutory local tax rate of 25% 2,834,641 1,776,755
Effects of:
Tax effect on non-deductible expenses 147,953 4,387
Tax effect on IFRS adjustments not adjusted 52,421 (828,547)
Different tax rates in different countries (1,074,604) (602,440)
Deferred tax recognised during the year (17,608)
1,942,803 350,155
A subsidiary, Galasys Solutions (MSC) Sdn. Bhd. was granted Multimedia Super Corridor (“MSC”) status by Malaysia government, and was accorded the Pioneer Status under Section 4A of the Promotion of Investments Act 1986, which provides for a 100% tax exemption on the statutory

77
03 FINANCIAL STATEMENTS
business income earned for a maximum period of five years. By virtue of this status, Galasys Solutions (MSC) Sdn. Bhd. will enjoy full exemption from income tax in its statutory income for pioneer activities.
A subsidiary of Galasys Group, Galasys Global (Suzhou) Co. Limited (“GGSZ”), was established in the Suzhou Province State as a foreign investment enterprise. Pursuant to the tax legislations applicable to foreign investment enterprises, it is entitled to full exemption from the PRC income tax for the two years commencing from their first profit-making year of operations and thereafter, is entitled to a 50% relief from the PRC income tax for the next three years, whereby the current statutory tax rate is 25%. GGSZ is in the third profit-making year and thus, enjoys a 50% relief from the PRC income tax for the current financial year.
23. Earnings per share The basic earnings per share is calculated by dividing the profit after tax attributable to owners by the weighted average number of ordinary shares in issue during the period.
Diluted earnings per share is calculated by adjusting the weighted average number of ordinary shares outstanding to assume conversion of all dilutive potential shares adjusted to reflect the conversion as mentioned above.
Proforma
2014 2013
RM RM
Profit after tax attributable to owners 9,395,759 6,756,865
Weighted average number of shares
Basic 59,488,835 52,696,456
Adjustment for:
Share options 27,521 -
Diluted 59,516,356 52,696,456
Earnings per share (sen)
Basic 15.79 12.82
Diluted 15.79 12.82

78
03 FINANCIAL STATEMENTS
24. Acquisition of a subsidiary, net of cash acquired On 27 December 2013, Galasys Holdings completed the acquisition of the 100 per cent equity interest in Galasys GLT. Pursuant to the acquisition, Galasys GLT became a wholly owned subsidiary of the Group. Galasys GLT was incorporated as a private limited company in Malaysia pursuant to the Companies Act 1965 on 6 February 2004. Galasys GLT is principally involved in production, supplying, distributing of kiosk and other computer related accessories and provide wide range of business communication solutions.
The fair values of the identifiable assets and liabilities of Green Laser as at the date of acquisition were:
Pre-acquisition carrying amounts
Recognised fair value adjustments
Values on acquisition
RM RM RM
Property, plant and equipment 148,211 - 148,211
Investment in quoted shares 112,674 - 112,674
Inventories 1,422,027 - 1,422,027
Trade Receivables 3,219,689 - 3,219,689
Other receivables, deposits and prepayments 1,826,233 - 1,826,233
Fixed deposits with licensed bank 463,362 - 463,362
Cash and bank balances 393,909 - 393,909
Trade Payables (259,153) - (259,153)
Other Payables and accruals (170,742) - (170,742)
Bank overdraft (566,552) - (566,552)
Short-term borrowing (78,726) - (78,726)
Provision for taxation (1,490,878) - (1,490,878)
Deferred tax liabilities (3,038) - (3,038)
Long term borrowing (253,616) - (253,616)
Net identifiable assets and liabilities 4,763,400 - 4,763,400
Goodwill on acquisition (2,055,505)
Fair value of consideration transferred 2,707,895
Galasys Holdings issued 16,511,566 new ordinary shares at par to acquire the equity interest in Galasys GLT.

79
03 FINANCIAL STATEMENTS
The effect of the acquisition on cash flow is as follows:
RM
Net assets acquired 4,763,400
Less: Non-cash consideration
- Issuance of shares (2,707,895)
Negative goodwill 2,055,505
Consideration settled in cash -
Less: Cash and cash equivalents of subsidiary acquired (290,719)
Net cash inflow on acquisition 290,719
The effective accounting acquisition date for Green Laser’s acquisition by Galasys Holdings was 31 December 2013. Set out below is an extract of the aggregation of the results of Green Laser and the Galasys Group for the year ended 31 December 2013, which is included for illustrative purposes only.
2013 Proforma
Galasys Group RM’000 Green Laser RM’000 Total RM’000
Revenue 9,395 17,276 26,671
Operating Profit 5,093 3,409 8,502
Profit before tax 5,051 3,330 8,381
Profit after tax 4.701 2,514 7,215
The financial information for Green Laser has been extracted from that company’s audited financial statements for the year ended 31 December 2013. For the purposes of this illustration, negative goodwill on the acquisition of Green Laser has been excluded from operating profit and the profit after tax of the Galasys Group.
25. Related party disclosure (a) Identities of related parties (i) The Company had related party relationships with its subsidiaries as disclosed in Note 2.2; (ii) the directors who are the key management personnel; and (iii) entitles controlled by certain key management personnel and directors.
(b) The Group carried out the following transactions with related parties during the financial years: (i) Related parties

80
03 FINANCIAL STATEMENTS
Proforma
2014 2013
RM RM
Research and development costs paid to a related party - 952,883
Sales to related parties - 342,288
- 1,295,171
Research and development costs paid to Bejing Galasys Taike Software Technologies Co. Ltd (“Beijing Taike”) to develop Galasys Suzhou’s intellectual properties. Beijing Taike is owned by Li Zhan, who is the wife of Mr Teong Ming Chuah (the Executive Director), and Wang Guan, the director of Galasys Suzhou.
(ii) Key management personnel
Key management personnel consists of the directors of the group
Salaries and other short term
employee benefits
2014 2013
RM RM
Executive Directors 582,525 148,604
Non-Executive Directors 206,000 -
788,525 148,604
26. Share options The Company established a Share Option Plan upon its admission to AIM as part of the Group’s incentivisation and retention policy. The options may be granted to employees of the Company and:
(a) any company which the Company owns 50% or more of the issued shares in; and (b) any company which the Company has an indirect interest in, provided that the shareholding held in each intermediate company between the Company and that company is more than 50 per cent of the issued shares (each a “Participating Company”). New options over a total of 2,330,000 ordinary shares have been granted on its admission to employees with an exercise price of 22.5 pence each. The weighted fair value of the options granted was 12.6 pence per share.

81
03 FINANCIAL STATEMENTS
Details of the options outstanding at the year end are as follows:
Number
2014
Outstanding as at 1 January -
Granted on 12 May 2014
(a) Exercise Period from 12 May 2018 to 12 May 2024 1,955,000
(b) Exercise Period from 12 May 2019 to 12 May 2024 375,000
Options outstanding at 31 December 2,330,000
A charge of RM173,000 (2013: RM Nil) has been made to the statement of comprehensive income for the year relating to these options. The charge was calculated using fair values determined using the Black Scholes option pricing model. The principal inputs into the model were as follows:
• Stock price: 24.5 pence • Exercise price: 22.5 pence • Risk free rate: 2.82% • Volatility: 41.35% •Time to maturity: 10 years
The expected volatility was determined by reference to similar entities trading on the AIM market. No expected dividends have been used in the option pricing model.
The charge represents the total fair value of the share options spread over the vesting period.
27. Financial risk managementThe Group’s activities are exposed to a variety of market risk (including foreign currency risk and interest risk), credit risk and liquidity risk. The Group’s overall financial risk management policy focuses on the unpredictability of financial markets and seeks to minimize potential adverse effects on the Group’s financial performance.
Credit riskCredit risk refers to the risk that counterparty will default on its contractual obligations resulting in a loss to the Group. The Group has adopted a policy of only dealing with creditworthy counterparties and obtaining sufficient collateral where appropriate, as a means of mitigating the risk of financial loss from defaults.
The Group performs ongoing credit evaluation of its counterparties’ financial condition and does not hold any collateral as security over its customers. The Galasys Group’s major classes of financial assets are cash and bank balances, trade receivables, prepayments and amounts due to a shareholder.

82
03 FINANCIAL STATEMENTS
As at the end of the financial year, the Group’s maximum exposure to credit risk is represented by the carrying amount of each class of financial assets recognised in the consolidated statements of financial position.
As at the end of the financial year, substantially all the cash and bank balances as detailed in Note 11 to the consolidated financial information are held in major financial institutions which are regulated and located in the PRC, which management believes are of high credit quality. The management does not expect any losses arising from non-performance by these counterparties. As at 31 December 2014, the Company’s concentration on credit risk relates to its trade receivables which made up 58% of its total receivables (2013: 72%).
Cash is placed with established financial institutions. The maximum exposure to credit risk is represented by the carrying amount of each financial asset in the consolidated statements of financial position.
The exposure of credit risk for trade receivables by geographical region is as follows:-
Proforma
2014 2013
RM RM
Malaysia 8,087,930 4,570,120
PRC 1,336,466 3,471,609
Hong Kong 1,530,868 1,083,456
Singapore - 243,694
10,955,264 9,368,879
Aging analysisGalasys Group’s trade receivables that are not impaired are as follows:
Proforma
2014 2013
RM RM
Current 6,241,554 3,282,166
31 – 60 days 2,644,812 3,044,832
61 – 90 days 44,045 376,961
More than 90 days 1,576,200 2,664,920
10,506,611 9,368,879

83
03 FINANCIAL STATEMENTS
Currency riskThe Group is exposed to foreign currency risk on transactions and balances that are denominated in currencies other than Ringgit Malaysia. The currencies giving rise to this risk are primarily Chinese Renminbi and Hong Kong Dollar. Foreign currency risk is monitored closely on an ongoing basis to ensure that the net exposure is at an acceptable level.
Ringgit Malaysia RenminbiHong Kong
DollarUnited States
Dollar GBP Total
RM RM RM RM RM RM
2014
Financial Assets
Trade receivables 8,087,930 1,336,466 1,530,868 - - 10,955,264
Other receivables and deposits 2,995,801 3,229,646 - - 52,557 6,278,004
Fixed deposits with licensed bank 477,289 - - - - 477,289
Cash and bank balances 4,934,207 2,465,409 99,507 192,796 4,047,498 11,739,417
16,495,227 7,031,521 1,630,375 192,796 4,100,055 29,449,974
Ringgit Malaysia RenminbiHong Kong
DollarUnited States
Dollar GBP Total
RM RM RM RM RM RM
2014
Financial Liabilities
Trade payables 2,209,922 213,916 - - - 2,423,838
Other payables and accruals 289,009 1,917,960 5,368 71,305 517,701 2,801,343
2,498,931 2,131,876 5,368 71,305 517,701 5,225,181
Net financial assets/(liabilities) 13,996,296 4,899,644 1,625,007 121,491 3,582,354 24,224,793
Less: Net financial (assets)/liabilities denominated in the respective entities’ functional currencies (13,996,296) (4,899,644) (1,625,007) (121,491) (3,582,354) (24,224,793)
Currency Exposure - - - - - -

84
03 FINANCIAL STATEMENTS
Currency risk - continued
Ringgit Malaysia Renminbi
Hong Kong Dollar
United States Dollar Total
RM RM RM RM RM
2013
Financial Assets
Trade receivables 5,897,270 2,329,988 1,141,621 - 9,368,879
Other receivables and deposits 1,831,233 443,758 - 901,210 3,176,201
Amount owing by related parties 62,288 283,970 - - 346,258
Cash and bank balances 775,496 399,832 - 525,495 1,700,823
Fixed deposits with licensed banks 463,362 - - - 463,362
9,029,649 3,457,548 1,141,621 1,426,705 15,055,523
Ringgit Malaysia Renminbi
Hong Kong dollar
United States Dollar Total
RM RM RM RM RM
2013
Financial Liabilities
Trade payables 465,873 67,039 - - 532,912
Other payables and accruals 242,183 941,675 - 11,582 1,195,440
Amount owing to directors - 1,667 - - 1,667
Amount owing to related parties - 552,584 7,901 - 560,485
Term loan 167,687 - - - 167,687
Hire purchase payables 164,655 - - - 164,655
Bank overdrafts 566,552 - - - 566,552
RCPS - - - 1,173,564 1,173,564
1,606,950 1,562,965 7,901 1,185,146 4,362,962
Net financial assets 7,422,699 1,894,583 1,133,720 241,559 10,692,561
Less: Net financial (assets) denominated in the respective entities’ functional currencies (7,422,699) (1,894,583) (7,901) (241,559) (9,566,742)
Currency Exposure - - 1,125,819 - 1,125,819

85
03 FINANCIAL STATEMENTS
Currency risk sensitivity analysis As detailed above, the net exposure of the Group to changes in foreign currency is minimal. Therefore, a strengthening or weakening or the most significant foreign currencies of +/- 10% to which the Group is exposed (Chinese Renminbi and Hong Kong Dollar) would not have a material impact on the Group’s results.
Interest rate riskInterest rate risk is the risk that the fair value or future cash flows of a financial instrument will fluctuate because of changes in market interest rates. The Group’s exposure to interest rate risk arises mainly from interest-bearing financial assets and liabilities. The Group’s policy is to obtain the most favourable interest rates available. Any surplus funds of the Group will be placed with licensed financial institutions to generate interest income.
The Group has interest rate risk with the banks for banking facilities as set out in Note 14, 15 and 20 respectively.
Liquidity riskLiquidity risk arises from the Group’s management of working capital. It is the risk that the Group will encounter difficulty in meeting its financial obligations as they fall due.
The Group’s policy is to ensure that it will always have sufficient cash to allow it to meet its liabilities when they become due. The principal liabilities of the Galasys Group arise in respect of the on-going research and development programs, trade and other payables. Trade and other payables are all payable within 12 months.
The Board receives cash flow projections on a regular basis as well as information on cash balances.
Derivatives, financial instruments and risk managementThe Group does not use derivative instruments or other financial instruments to manage its exposure to fluctuations in foreign currency exchange rates, interest rates and commodity prices.
Capital risk managementThe Group manages its capital to ensure that entities within the Group will be able to maintain an optimal capital structure so as to support their businesses and maximise shareholder(s) value. To achieve this objective, the Group may make adjustments to the capital structure in view of changes in economic conditions, such as adjusting the amount of dividend payment, returning of capital to shareholders or issuing new shares.
The Group manages its capital based on debt-to-equity ratio that complies with debt covenants and regulatory, if any. The debt-to-equity ratio is calculated as total borrowings from financial institutions divided by total equity.
There was no change in the Group’s approach to capital management during the financial year.

86
03 FINANCIAL STATEMENTS
The debt-to-equity ratio of the Group at the end of the reporting period was as follows:-
Proforma
2014 2013
RM RM
Total debts
Bank overdrafts 418,805 566,552
Revolving credit - -
Term loan 131,050 167,687
Hire purchase payables 134,995 164,655
RCPS - 1,173,564
684,850 2,072,458
Less: Cash and cash equivalents (11,739,417) (1,700,823)
Less: Fixed deposits with licensed banks (477,289) (463,362)
Net debt - -
Total equity 38,637,505 16,473,949
Debt-to-equity ratio - -

87
03 FINANCIAL STATEMENTS
27.1 Classification of financial instruments
Proforma
2014 2013
RM RM
Financial Assets
Available-for-sale financial asset
Quoted investments - 112,674
- 112,674
Loans and receivables financial assets
Trade receivables and others receivables 17,689,133 12,672,204
Amount owing by related parties - 346,258
Fixed deposits with licensed banks 477,289 463,362
Cash and bank balances 11,739,417 1,700,823
29,905,839 15,182,647
Financial Liabilities
Financial liabilities at amortised cost
RCPS - 1,173,564
Hire purchase payables 134,995 164,655
Term loans 131,050 167,687
Revolving credit - -
Trade payables and others payables 7,081,420 1,728,352
Amount owing to related parties - 560,485
Amount owing to directors - 1,667
Bank overdrafts - 566,552
7,347,465 4,362,962
28. Fair value of financial instrumentsThe carrying amount of the financial assets and financial liabilities in the financial statements approximate their fair values due to the relative short-term maturity of these financial instruments. The fair values of other classes of financial assets and liabilities are disclosed in the respective notes to the financial information.
The fair values of financial assets and financial liabilities are determined as follows:
(i) the fair value of financial assets and financial liabilities with standard terms and conditions and trade on active liquid markets are determined with reference to quoted market prices;(ii) the fair value of other financial assets and financial liabilities (excluding derivative instruments) are determined in accordance with generally accepted pricing models based on

88
03 FINANCIAL STATEMENTS
discounted cash flow; and(iii) the fair value of derivative instruments are calculated using quoted prices. Where such prices are not available, discounted cash flow analysis is used, based on the applicable yield curve of the duration of the instruments for non-optional derivatives, and option pricing models for optional derivatives.
29. Segment InformationIFRS 8 requires operating segments to be identified on the basis of internal reports about components of the Group that are regularly reviewed by the chief operating decision maker, as defined in IFRS 8, in order to allocate resources to the segment and to assess its performance.
All other segments primarily comprise income and expenses relating to the Group’s administrative functions. Interest income and interest expense are not allocated to segments, as this type of activity is driven by the central treasury function which manages the cash position of the Group. Accordingly, this information is not separately reported to the Board for each reportable segment.
Operating segments are prepared in a manner consistent with the internal reporting provided to the Executive Directors as its chief operating decision maker in order to allocate resources to segments and to assess their performance. For management purposes, the Group is organised into business units based on business and geographical segments.
Unallocated item comprise mainly related loans and borrowings and related expenses, corporate assets, office expenses, tax assets and liabilities.
Business segmentsThe Group’s primary format for reporting segment information is business segments, with each segment representing a product category.
The Group comprises the following main segments: (1) Software - The provision of internal developed software.(2) Hardware - Retailing activities of hardware.(3) Maintenance services and consultancy - Provision of maintenance services and consultancy to theme park operator.(4) Others - Dealer and agent services.
Geographical segmentsThe professional services and sales segment of the Group operated in the PRC, Singapore and Hong Kong which apart from its home country, Malaysia.
In presenting information on the basis of geographical segments, segment revenue is based on the geographical location of customers.
Segments assets and capital expenditure are based on geographical location of the assets.

89
03 FINANCIAL STATEMENTS
Segments Information for Financial year ended 31 December 2014
(a) Business segmentsThe segment information provided to management for the reportable segments for the year ended 31 December 2014 is as follows:
Software, Maintenance Services and Consultancy
Hardware Others
Group
RM RM RM RM
Revenue 19,563,783 19,058,110 38,621,893
Results 19,522,872
Unallocated corporate expenses (8,715,327)
Other income 611,722
Finance costs (80,705)
Income tax expense (1,942,803)
Profit after taxation for the year 9,395,759
Other information
Segment assets * 46,195,864 - - 46,195,864
Segment liabilities 7,649,002 - - 7,649,002
Capital expenditure 4,886,110 - 4,886,110
Depreciation and amortisation 1,279,836 - - 1,279,836
The top customer which contributed more than 10% of the revenue for the Group:
Name Amount RM PercentageCustomer A 4,780,450 12%
(b) Geographical segmentsRevenues from the highest geographical segment represent approximately 62% of the Group’s revenues.

90
03 FINANCIAL STATEMENTS
The segment information provided to management for the reportable segments for the year ended 31 December 2014 is as follows:
PRC Malaysia BVI Hong Kong UK Group
RM RM RM RM RM RM
Revenue 12,505,034 23,766,563 - 2,350,296 - 38,621,893
Segmental assets 21,455,810 18,721,193 4,192,903 1,630,375 195,583 46,195,864
Capital expenditure 2,726,988 2,053,451 - - 105,671 4,886,110
Segmental liabilities 2,671,860 4,313,388 71,305 74,748 517,701 7,649,002
Segments Information for Financial year ended 31 December 2013
(a) Business segmentsThe segment information provided to management for the reportable segments for the year ended 31 December 2013 is as follows:
Software
Hardware
Maintenance Services and Consultancy Others
Galasys Group
RM RM RM RM RM
Revenue 4,752,938 2,786,120 747,045 1,108,649 9,394,752
Results 6,481,314
Unallocated corporate expenses (2,240,178)
Other income 2,907,885
Finance costs (42,001)
Income tax expense (350,155)
Profit after taxation for the year 6,756,865
Other information
Segment assets 22,330,827 - - - 22,330,827
Segment liabilities 5,856,878 - - - 5,856,878
Capital expenditure 2,363,366 - - - 2,363,366
Depreciation and amortisation 706,957 - - - 706,957

91
03 FINANCIAL STATEMENTS
(b) Geographical segmentsRevenues from the highest geographical segment represent approximately 78% of the Group’s revenues.
The segment information provided to management for the reportable segments for the year ended 31 December 2013 is as follows:
PRC Malaysia Singapore Hong Kong Galasys Group
RM RM RM RM RM
Revenue 7,367,559 1,483,499 243,694 300,000 9,394,752
Segmental assets 8,649,886 13,680,941 - - 22,330,827
Capital expenditure 1,796,605 566,761 - - 2,363,366
30. Subsequent event
Acquisition of a subsidiaryOn 5 January 2015, the Company’s wholly owned subsidiary, Galasys Holdings acquired 100% equity interest in I Logic Solutions Sdn Bhd (“iLogic”), for a total consideration that is based on the aggregate of multiple of its audited profit after tax for each of the financial years 2014, 2015 and 2016 with a maximum amount payable of RM7,000,000 (the “Consideration”). iLogic is a private limited company incorporated in Malaysia with principal activities of providing consultancy, system study and design, implementation and training of leisure and entertainment software solutions in Malaysia. Upon the acquisition, iLogic became a wholly owned subsidiary of the Group.

92
03 FINANCIAL STATEMENTS
The provisional fair values of the identifiable assets and liabilities of iLogic as at the date of acquisition were:-
Pre-acquisition carrying amounts
Fair valueadjustments
Recognised valueson acquisition
RM RM RM
Property, plant and equipment 297,440 - 297,440
Trade receivables 693,932 - 693,932
Other receivables, deposits and prepayments 26,855 - 26,855
Cash and bank balances 145,424 - 145,424
Trade payables (119,101) (119,101)
Other payables and accruals (15,053) - (15,053)
Net identifiable assets and liabilities 1,029,497 - 1,029,497
Goodwill on acquisition 5,970,503
Fair value of consideration transferred 7,000,000
The Consideration is to be satisfied by way of:
(a) Earn-out payment based on financial year 2014 in cash payable upon closing of the acquisition. An initial deposit of RM200,000 was paid as part of the fulfilment of purchase consideration; and
(b) 50% earn-out payment based on the financial year 2015 and 2016 payable in cash and remaining 50% in the form of new shares of the Company.
The effect of the acquisition on cash flows is as follows:-
RM
Fair value of the consideration transferred 1,029,497
Less: Consideration settled in cash (7,000,000)
Goodwill 5,970,503
Consideration settled in cash 7,000,000
Less: Cash and cash equivalents of iLogic acquired (145,424)
Net cash outflow on acquisition 6,854,576

93

94

95

96