Embed Size (px)
Citation preview

Annual Report for Allington Energy from Waste Facility
Permit Number: BR4551IC
Report prepared by
Kent Enviropower Ltd
2018

Annual report template V2.0
Annual performance report for: Kent Enviropower Limited, Allington Incinerator,
Allington Quarry
Permit Number: EPR/BR4551IC
Year: 2018
This report is required under the Industrial Emissions Directive’s Article 55(2) requirements
on reporting and public information on waste incineration plants and co-incineration plants,
which require the operator to produce an annual report on the functioning and monitoring of
the plant and make it available to the public.
1. Introduction
Name and address of plant
Allington Incinerator. Allington Quarry, Laverstoke Road, Maidstone, Kent. ME16 0LE
Description of waste input Municipal Solid Waste (MSW) collected from households by Kent County Council (KCC) and trade waste collected from industry
Operator contact details if members of the public have any questions
Community information line 0844 736 9990 (staffed 9am to 5.30pm weekdays)
2. Plant description
Installation Description The Installation receives non hazardous municipal and industrial waste, recovers recyclable elements for reuse and eliminates the combustible element of the residue by burning in a fluidised bed furnace. Energy is recovered from the process and converted to electricity in place of non-renewable fossil fuels. The combustion gases are cleaned to meet the standards required by the Directive before discharge from a tall chimney. Ashes and other solid residues are removed from the installation. The Installation covers the site and the entire EfW plant including all EfW lines, waste reception, storage, on-site pre-treatment facilities, water, fuel and air supply systems, boiler, facilities for the treatment of exhaust gases, on-site facilities for treatment or storage of residues and waste water, stack, devices and systems for controlling combustion operations, recording and monitoring conditions. The Installation has a design throughput of approx 580,000 tonnes per annum with an EfW capacity approx 560,000 tonnes per annum. The transfer loading station receives food waste and clean source separated recyclables which it reloads for onward transport and recovery. There is a single waste reception followed by three independent waste treatment lines each complete with a heat recovery boiler, acid gas abatement, bag filter and a separate flue in the chimney. The heat produced from the combustion of the waste is used to generate steam in the boilers and the steam is then combined and passed to a steam turbine which generates approx 34.5 MW of electrical energy for export to the National Grid.

Annual report template V2.0
Raw Materials Waste is delivered to the plant in road vehicles which are weighed before proceeding to the tipping hall. This is a fully enclosed building with controlled airflow to reduce the likelihood of odours, dust or litter escaping the building. The municipal solid waste (MSW) is tipped into an appropriate storage bunker. The MSW waste (black bag) is transferred by crane grab to a waste shredding line, it then moves forward through a metals extraction section where ferrous metals are removed for recycling before moving to the prepared fuel bunker. Crane grabs in the prepared fuel bunker both mix the waste and feed the hoppers of the three lines. General Hydrated lime for the flue gas cleaning process is delivered by bulk tanker and offloaded pneumatically into three 125m3 silos vented through a reverse pulse jet filter. Activated carbon for the flue gas cleaning process is stored in dedicated silos that are pneumatically filled from delivery trucks. There are three silos, one for each line and one common silo each equipped with filters to prevent dust emissions during filling. Urea, dissolved in water is stored in a fully bunded tank and is injected into the furnaces as necessary to control Nox emissions. Caustic soda for water treatment resin regeneration is delivered by bulk tanker and offloaded into a 5.5m3 tank with scrubber, inside the demineralisation area. Hydrochloric acid for water treatment resin regeneration is delivered by bulk tanker and offloaded into a 5.5m3 tank vented through caustic soda scrubber in a bund outside the demineralisation area. Various other water treatment chemicals are delivered in appropriate containers and stored in bunded areas. Gas oil for the combustion chamber burners and on-site vehicles is stored in a fully bunded 100m3 tank. Sand for the fluidised bed furnaces is stored in 3 silos each of 55m3 capacity and a further ‘common’ sand silo with a capacity of 71m3 (approx. 80 tonnes). Various maintenance materials (oils, greases, insulants, antifreezes, welding and fire fighting gases etc.) are stored in the appropriate manner. Combustion Process The ROWITEC unit uses a twin interchanging fluidised bed process. The design has an inclined air distributor plate with a number of separate air supply nozzles providing differential air flows across the bed, causing a revolving action of the sand. This technique promotes rapid and uniform combustion of the waste and ensures that heavy

Annual report template V2.0
inert and non-combustible material migrates to the sides of the bed where they can easily be removed. An angled furnace wall above the fluidised bed zone restrains bed expansion under high fluidising air flows and so minimises particulate carry over. The elliptical patterns of air flow converge in the centre of the combustion area ensuring effective vertical and lateral turbulent mixing and high combustion efficiency and uniformity. The material is burned above and on a bed consisting of sand, fuel and ash that is held in suspension by an upward flow of primary air that maintains the sand in suspension. The furnace operating design is based on a thermal capacity of 53.8MW at full load and this can be achieved over a typical range of waste calorific values expected with municipal waste. The combustion air system provides the furnace with the total air requirements for fluidisation and combustion. Primary air is supplied to the bottom of the combustion chamber and fluidises the bottom bed. This air is extracted from the tipping hall and waste storage areas and burnt in the combustion chamber. Each furnace is equipped with two lance burners for use at start-up to heat the furnace and also during extreme reductions in waste fuel calorific value when the temperature of the furnace would otherwise fall below 850 degrees Centigrade. Combustion control of the furnace will be achieved through a combination of furnace bed and freeboard temperature control, primary air flow control, oxygen control within the flue gas and furnace load. Recirculated flue gas is fed to the furnace bed as a cooling medium to control the furnace bed temperature and also to assist the control of Nox by influencing the combustion temperature conditions within the furnace. The furnace bed is managed to remove non-combustible material (bottom ash) from the bed and maintain the sand level within the optimum operating range. Bottom ashes produced in the furnace together with sand migrate down the slope of the furnace to the discharge section located at each side of the bed. The bottom ash and sand are both withdrawn from the discharge sections of the bed by water-cooled discharge screw conveyors, operating on an alternating basis. Material passing out of the screw conveyors is discharged to a vibrating screen. Material of a suitable size is returned to the sand hopper for re-use within the furnace while the oversized material is sent off site for use as a secondary aggregate. Energy Recovery Hot gases from the furnace pass through to a boiler designed to generate steam. The boiler comprises two water tubed steam generating vertical gas passes, and a single pass horizontal section incorporating an evaporator, three stage superheater, and a plain tube economiser sections.
Steam is generated at 65 bar and a final temperature of 420⁰C. The high pressure steam from all three boilers feeds into a common header which in turn feeds a condensing steam turbine that generates electricity. Steam exiting the turbine is condensed in an air cooled condenser and the condensate returned to the boilers.

Annual report template V2.0
Gas Cleaning The Facility is designed to meet the requirements of the Waste Incineration Directive as a minimum for releases to air by a combination of main process design and operation and abatement equipment. Flue gases pass from the boiler to the gas cleaning equipment. The gas passes to an electrostatic precipitator (ESP) for the separation of ash carried over from the furnace with the flue gas. Material collected in the ESP will be discharged by means of rotary valves and chain conveyors and then pneumatically fed to the residual ash silos. Gases leaving the ESP enter the gas cleaning system. This comprises a Circulating Fluidised Bed (Circoclean) reactor and bag filter system. Gases entering the core will be
at a temperature of 170⁰C to 230⁰ C and come into contact with a mixture of water, hydrated lime and activated carbon that have been injected into the reactor. The reactor is designed to reduce or remove acidic pollutants such as HCl, SO2 and HF by the use of the hydrated lime and dioxins and furans, PCBs, PAHs, mercury vapour and heavy metal salts such as mercury chloride by the use of the activated carbon. The injected water cools the gas and enhances the reactions and cools the gas. The control system of the CFB optimises the use of reagents by balancing the feed rate with the concentration of the pollutants entering the circoclean. The final stage of the gas cleaning system is the bag filter unit which separates the particulate material from the flue gas. The baghouse filter consists of 4 compartments each of which contains 427 tubular filter bags. A thick porous layer of particulate builds on the bag surfaces to form a filter cake which efficiently removes ultra fine particles from the gas stream and the excess lime continues to react with the acid gases. Bag house residue is discharged from the compartments via the integrated buffer storage by a closed pneumatic conveying system into the reaction product silos. Silos are equipped with a filter, hopper heating and fluidisation system to assist discharge. The residue is then discharged directly into road vehicles under dust free conditions for transport off site to a licensed landfill. Nitrogen oxides (NOx) abatement is achieved by the use of both flue gas recirculation (FGR) and selective non-catalytic reduction (SNCR). The SNCR is based on the injection of urea into the furnace chambers before the boilers. The cleaned gas then discharges to atmosphere via three 80-metre flues in a common stack both at an efflux velocity in excess of 15 ms-1 at maximum throughput. Ancillary Operations Demineralised water is required to compensate for boiler blowdown losses. A package demineralisation plant provides this water. The ion exchange resins are regenerated using sodium hydroxide and hydrochloric acid and the regeneration effluent is routed through a neutralisation tank to the collection pit for reuse where possible. Ash Handling Bottom ash, the combined boiler and ESP ash and the flue gas treatment residue (FGT) from the bag filter system, are each sent for disposal off site by licensed contractors subject to environmental permitting and waste legislation. The bottom ash is subject to

Annual report template V2.0
ferrous and non-ferrous metals extraction by the contractors before reuse. All operations are subject to waste legislation regulated by the Environment Agency. At least quarterly sampling of the bottom ash is being carried out to ensure effective burn out is being achieved by testing for the “loss on ignition” of the residual ash. All other solid waste residues arising from the operation of the process will be removed from site, in enclosed containers, for disposal by suitably licensed contractors. Liquid Effluent and Site Drainage Uncontaminated surface water from roads and parking area within the process is discharged to sewer or to the conservation area on site. Emissions Monitoring Emissions from the stack are continuously monitored for: particulate, carbon monoxide (CO), ammonia (NH3), sulphur dioxide (SO2), hydrogen chloride (HCl), oxygen (O2), nitrogen oxides (NOx) and volatile organic compounds (VOC). In addition periodic sampling and measurement will be carried out for metals; cadmium (Cd), thallium (Tl), mercury (Hg), antimony (Sb), arsenic (As), lead (Pb), chromium (Cr), cobalt (Co), copper (Cu), manganese (Mn), nickel (Ni), vanadium (V), dioxins and furans, dioxin like PCBs, hydrogen fluoride (HF) and nitrous oxide (N2O). Periodic measurements will be carried out four times in the first year and thereafter either at the same frequency or twice per year dependant on the substances.
3. Summary of Plant Operation
Municipal waste received 513,098.50 tonnes
Other waste received 16,413.38 Recyclates waste
4,843.78 Food waste
Total waste received 534,355.66 tonnes
Total plant operational hours
22,153.61 hours
Total hours of “abnormal operation” (see permit for definition)
1.5 hours
Total quantity of incinerator bottom ash (IBA) produced
51,916.12 tonnes
Disposal or recovery route for IBA
Recovered as Incinerator Bottom Ash
Aggregate (IBBA)
Did any batches of IBA test as hazardous? If yes, state quantity
No
Total quantity of air pollution control (APC) residues produced
48,151.02 tonnes
Disposal or recovery route for APC residues
7,405.48 recycle
40,745.54 landfill
Total electricity generated for export to the National Grid
222,989 MWh

Annual report template V2.0
4. Summary of Plant Emissions
4.1 Summary of continuous emissions monitoring results for emissions to air
The following charts show the performance of the plant against its emission limit values
(ELVs) for substances that are continuously monitored.
LINE 1
Line 1 Particulates
Line 1 HCL
Jan Feb Mar Apr May Jun Jul Aug Sep Oct Nov Dec
1/2 hourly PM ELV 30 30 30 30 30 30 30 30 30 30 30 30
Monthly 1/2 hourly mean 1.5 3.6 3 2.1 0.8 0.4 2.6 3.1 3.1 3.8 2.8 4.5
Monthly 1/2 hourly maximum 5.5 12.4 18.4 10.3 8.4 1.7 9.8 17.6 12.5 12.6 11 14.8
Daily PM ELV 10 10 10 10 10 10 10 10 10 10 10 10
Monthly daily mean 1.5 3.7 2.9 2.1 0.8 0.4 2.6 3.1 3.1 3.8 3 4.5
Monthly daily maximum 2.7 7.4 5.3 7.1 1.3 1 5.7 7.6 7 6.8 6.7 8.3
0
5
10
15
20
25
30
35
Co
nce
ntr
atio
n m
g/N
m3
Jan Feb Mar Apr May Jun Jul Aug Sep Oct Nov Dec
1/2 hourly HCl ELV 60 60 60 60 60 60 60 60 60 60 60 60
Monthly 1/2 hourly mean 6.7 6.8 7.8 9 8.6 8.5 7 7.9 8.3 6.5 5.1 6.8
Monthly 1/2 hourly maximum 27.2 27.9 32 22.2 21.1 24.7 18.6 28.4 23.1 58.9 14.5 26.2
Daily HCl ELV 10 10 10 10 10 10 10 10 10 10 10 10
Monthly daily mean 6.7 6.8 7.8 9 8.6 8.4 7.1 7.9 8.3 6.5 5.1 6.9
Monthly daily maximum 9 8.9 9.6 9.7 9.2 9.3 9 9.4 9.4 8.8 6.7 9.5
0
10
20
30
40
50
60
70
Co
nce
ntr
atio
n m
g/N
m3

Annual report template V2.0
Line 1 SO2
Line 1 NOx
Jan Feb Mar Apr May Jun Jul Aug Sep Oct Nov Dec
1/2 hourly SO2 ELV 200 200 200 200 200 200 200 200 200 200 200 200
Monthly 1/2 hourly mean 3.4 3.6 2.8 3 3.1 3.8 4.7 3.8 3.1 1.9 0 0.1
Monthly 1/2 hourly maximum 7 8.9 7.9 10.9 5.8 11.5 14.1 12.3 6.3 33.5 2.8 55.8
Daily SO2 ELV 50 50 50 50 50 50 50 50 50 50 50 50
Monthly daily mean 3.4 3.6 2.8 3 3.2 3.8 4.7 3.8 3.2 1.9 0 0
Monthly daily maximum 4.7 4.4 3.7 3.8 3.6 4.9 5.2 5.2 3.6 3.3 0.1 0.2
0
50
100
150
200
250
Co
nce
ntr
atio
n m
g/N
m3
Jan Feb Mar Apr May Jun Jul Aug Sep Oct Nov Dec
1/2 hourly NOx ELV 400 400 400 400 400 400 400 400 400 400 400 400
Monthly 1/2 hourly mean 165 162 157 152 149 167 155 162 156 158 136 143
Monthly 1/2 hourlymaximum
247 222 222 235 274 211 195 221 214 204 205 215
Daily NOx ELV 200 200 200 200 200 200 200 200 200 200 200 200
Monthly daily mean 165 162 157 152 148 167 155 162 157 158 136 144
Monthly daily maximum 176 178 185 163 157 187 170 177 170 169 161 167
050
100150200250300350400450
Co
nce
ntr
atio
n m
g/N
m3

Annual report template V2.0
Line 1 TOC
Line 1 CO
Jan Feb Mar Apr May Jun Jul Aug Sep Oct Nov Dec
1/2 hourly TOC ELV 20 20 20 20 20 20 20 20 20 20 20 20
Monthly 1/2 hourly mean 1.15 1.12 1.38 1.05 0.86 0.85 0.96 1.41 0.91 0.4 0.26 0.61
Monthly 1/2 hourly maximum 4.86 13.65 9.41 8.57 6.06 6.92 33.33 10.92 6.25 8.93 3.45 70.95
Daily TOC ELV 10 10 10 10 10 10 10 10 10 10 10 10
Monthly daily mean 1.15 1.12 1.39 1.04 0.88 0.88 0.93 1.43 0.97 0.4 0.24 0.47
Monthly daily maximum 2.06 1.88 2.98 1.76 1.87 1.54 1.61 2.89 2.15 0.61 0.86 1.57
0
10
20
30
40
50
60
70
80
Co
nce
ntr
atio
n m
g/N
m3
Jan Feb Mar Apr May Jun Jul Aug Sep Oct Nov Dec
10 minute CO ELV (95%) 150 150 150 150 150 150 150 150 150 150 150 150
Monthly 95% 10 minutemaximum
Monthly 10 minute mean 1.16 2.28 2.53 4.27 3.76 2.67 3.46 3.76 2.23 1.28 0.26 1.76
Monthly 10 minute maximum 176 3088 1482 544 1169 354 452 775 303 1126 124 865
Daily CO ELV 50 50 50 50 50 50 50 50 50 50 50 50
Monthly daily mean 1 2 2 4 3 2 3 4 2 1 0 1
Monthly daily maximum 2 23 17 11 13 6 10 18 7 9 2 5
0
500
1000
1500
2000
2500
3000
3500
Co
nce
ntr
atio
n m
g/N
m3

Annual report template V2.0
Line 1 NH3
LINE 2
Line 2 Particulates
Jan Feb Mar Apr May Jun Jul Aug Sep Oct Nov Dec
1/2 hourly NH3 ELV 20 20 20 20 20 20 20 20 20 20 20 20
Monthly 1/2 hourly mean 0.51 0.83 0.56 0.68 0.5 0.57 0.63 0.58 0.54 0.54 0.45 0.51
Monthly 1/2 hourly maximum 1.28 3.56 1.57 3.35 2.17 1.29 2.51 1.99 1.51 8.15 0.91 16.94
Daily NH3 ELV 10 10 10 10 10 10 10 10 10 10 10 10
Monthly daily mean 0.51 0.81 0.56 0.67 0.49 0.57 0.63 0.58 0.54 0.54 0.45 0.49
Monthly daily maximum 0.69 1.41 1.11 0.86 0.61 0.74 0.78 0.68 0.64 0.81 0.61 0.66
0
5
10
15
20
25
Co
nce
ntr
atio
n m
g/N
m3
Jan Feb Mar Apr May Jun Jul Aug Sep Oct Nov Dec
1/2 hourly PM ELV 30 30 30 30 30 30 30 30 30 30 30 30
Monthly 1/2 hourly mean 2.9 3.4 3.3 1.9 2 3.7 3.4 3.4 3.9 4.6 4 2.6
Monthly 1/2 hourly maximum 8.1 10.4 9.7 11.1 16.3 15.4 17.8 13.2 15.6 16.7 23 15.3
Daily PM ELV 10 10 10 10 10 10 10 10 10 10 10 10
Monthly daily mean 2.7 3.3 3.4 2 1.9 3.7 3.5 3.5 3.7 4.6 4 2.5
Monthly daily maximum 6 7.3 5.6 7 7 7.1 6.1 6.6 8 8.3 8.3 6.2
0
5
10
15
20
25
30
35
Co
nce
ntr
atio
n m
g/N
m3

Annual report template V2.0
Line 2 HCL
Line 2 SO2
Jan Feb Mar Apr May Jun Jul Aug Sep Oct Nov Dec
1/2 hourly HCl ELV 60 60 60 60 60 60 60 60 60 60 60 60
Monthly 1/2 hourly mean 4.6 4 5.4 8.1 8.5 8.5 7.5 7.9 8.1 7.1 5.1 6.5
Monthly 1/2 hourly maximum 13.4 13.7 23.6 25.6 30.3 35.2 28.4 20.1 36.6 18.2 29.9 20
Daily HCl ELV 10 10 10 10 10 10 10 10 10 10 10 10
Monthly daily mean 4.6 4 5.5 8.2 8.6 8.4 7.5 8 8.2 7.1 5.1 6.5
Monthly daily maximum 6.4 6.2 8.7 9.4 9.2 9.5 8.9 9.7 9.2 8.4 7.7 7.6
0
10
20
30
40
50
60
70
Co
nce
ntr
atio
n m
g/N
m3
Jan Feb Mar Apr May Jun Jul Aug Sep Oct Nov Dec
1/2 hourly SO2 ELV 200 200 200 200 200 200 200 200 200 200 200 200
Monthly 1/2 hourly mean 1.3 1.1 1.7 1.9 1.8 2.3 7.4 2.3 2.1 2.3 0.8 0.5
Monthly 1/2 hourly maximum 8.8 20.1 8.5 13.4 17.1 9.3 2106.4 12.3 12.4 13.8 4.7 19.5
Daily SO2 ELV 50 50 50 50 50 50 50 50 50 50 50 50
Monthly daily mean 1.3 1.1 1.8 1.9 1.8 2.3 2.1 2.3 2.1 2.3 0.8 0.5
Monthly daily maximum 1.8 1.5 2.3 2.6 2.2 2.9 2.3 3.2 3 3.8 2.4 1.1
0
500
1000
1500
2000
2500
Co
nce
ntr
atio
n m
g/N
m3
Annual report template V2.0
Line 2 NOx
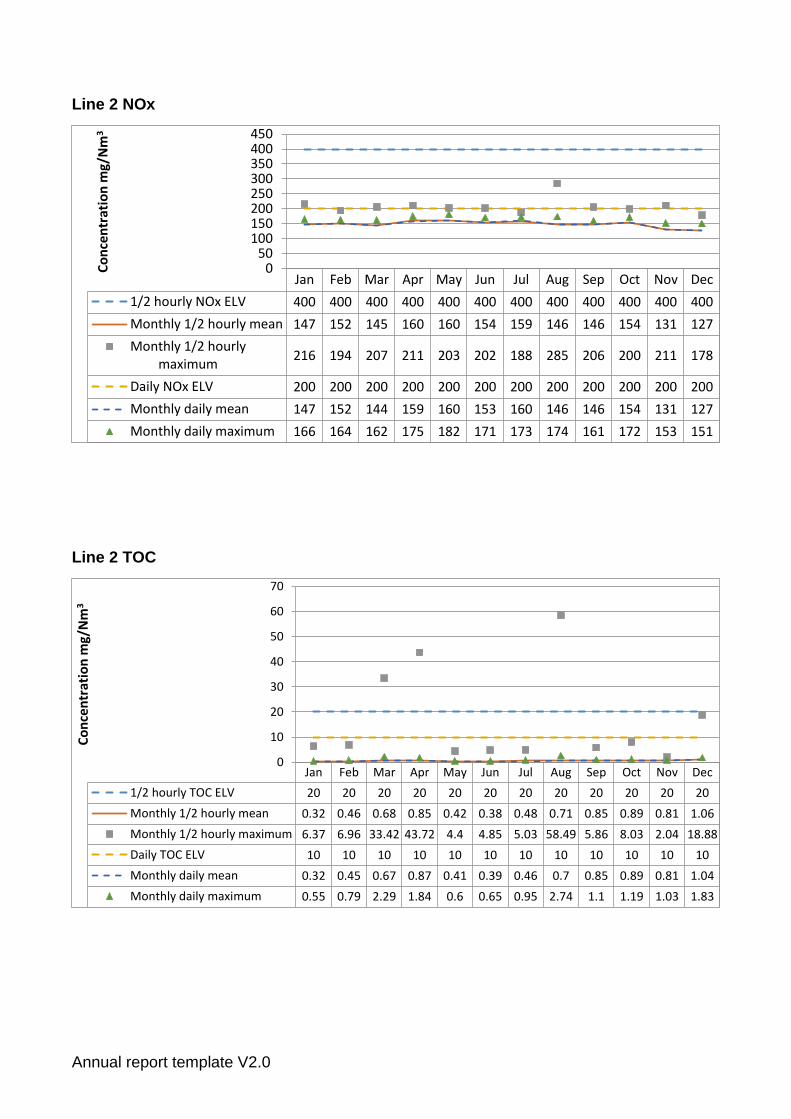
Line 2 TOC
Jan Feb Mar Apr May Jun Jul Aug Sep Oct Nov Dec
1/2 hourly NOx ELV 400 400 400 400 400 400 400 400 400 400 400 400
Monthly 1/2 hourly mean 147 152 145 160 160 154 159 146 146 154 131 127
Monthly 1/2 hourlymaximum
216 194 207 211 203 202 188 285 206 200 211 178
Daily NOx ELV 200 200 200 200 200 200 200 200 200 200 200 200
Monthly daily mean 147 152 144 159 160 153 160 146 146 154 131 127
Monthly daily maximum 166 164 162 175 182 171 173 174 161 172 153 151
050
100150200250300350400450
Co
nce
ntr
atio
n m
g/N
m3
Jan Feb Mar Apr May Jun Jul Aug Sep Oct Nov Dec
1/2 hourly TOC ELV 20 20 20 20 20 20 20 20 20 20 20 20
Monthly 1/2 hourly mean 0.32 0.46 0.68 0.85 0.42 0.38 0.48 0.71 0.85 0.89 0.81 1.06
Monthly 1/2 hourly maximum 6.37 6.96 33.42 43.72 4.4 4.85 5.03 58.49 5.86 8.03 2.04 18.88
Daily TOC ELV 10 10 10 10 10 10 10 10 10 10 10 10
Monthly daily mean 0.32 0.45 0.67 0.87 0.41 0.39 0.46 0.7 0.85 0.89 0.81 1.04
Monthly daily maximum 0.55 0.79 2.29 1.84 0.6 0.65 0.95 2.74 1.1 1.19 1.03 1.83
0
10
20
30
40
50
60
70
Co
nce
ntr
atio
n m
g/N
m3

Annual report template V2.0
Line 2 CO
Line 2 NH3
Jan Feb Mar Apr May Jun Jul Aug Sep Oct Nov Dec
10 minute CO ELV (95%) 150 150 150 150 150 150 150 150 150 150 150 150
Monthly 95% 10 minutemaximum
Monthly 10 minute mean 0.58 1.31 1.9 3.33 0.92 3.01 2.86 1.88 1.41 1.84 1.82 3.32
Monthly 10 minute maximum 426 1608 288 386 186 1058 367 1256 450 623 1234 2518
Daily CO ELV 50 50 50 50 50 50 50 50 50 50 50 50
Monthly daily mean 1 1 2 3 1 3 2 2 1 2 1 3
Monthly daily maximum 7 15 7 12 5 16 4 12 8 15 11 26
0
500
1000
1500
2000
2500
3000
Co
nce
ntr
atio
n m
g/N
m3
Jan Feb Mar Apr May Jun Jul Aug Sep Oct Nov Dec
1/2 hourly NH3 ELV
Monthly 1/2 hourly mean 0.24 0.24 0.24 0.25 0.24 0.24 0.25 0.26 0.25 0.25 0.18 0.21
Monthly 1/2 hourly maximum 0.99 0.55 1.74 3.06 0.41 0.71 0.52 4.16 2.4 5.17 0.41 15.56
Daily NH3 ELV 10 10 10 10 10 10 10 10 10 10 10 10
Monthly daily mean 0.24 0.24 0.24 0.25 0.25 0.24 0.25 0.26 0.25 0.25 0.18 0.21
Monthly daily maximum 0.26 0.26 0.29 0.31 0.26 0.27 0.26 0.43 0.33 0.38 0.18 0.67
0
2
4
6
8
10
12
14
16
18
Co
nce
ntr
atio
n m
g/N
m3

Annual report template V2.0
LINE 3
Line 3 Particulates
Line 3 HCL
Jan Feb Mar Apr May Jun Jul Aug Sep Oct Nov Dec
1/2 hourly PM ELV 30 30 30 30 30 30 30 30 30 30 30 30
Monthly 1/2 hourly mean 2.5 5.1 3.6 1.5 2.5 4.2 4.2 2.1 4.4 0.3 1.1 0.6
Monthly 1/2 hourly maximum 10.8 10.7 14.1 15.5 15.1 10.9 19 28.5 19.7 1.5 228.2 1.5
Daily PM ELV 10 10 10 10 10 10 10 10 10 10 10 10
Monthly daily mean 2.6 5 3.8 1.6 2.5 4.1 4.2 2.2 4.3 0.3 0.5 0.6
Monthly daily maximum 6.5 7.4 7.1 8.6 6.9 6.2 7.7 8.7 7.4 0.4 0.6 0.7
0
50
100
150
200
250
Co
nce
ntr
atio
n m
g/N
m3
Jan Feb Mar Apr May Jun Jul Aug Sep Oct Nov Dec
1/2 hourly HCl ELV 60 60 60 60 60 60 60 60 60 60 60 60
Monthly 1/2 hourly mean 7.4 6.7 7.8 8.9 8.9 9.1 8.7 9 9 8.4 7.2 6.4
Monthly 1/2 hourly maximum 16.3 19.1 19.1 20.6 22.9 20.6 25.2 23.4 20.1 24.4 16.7 19.8
Daily HCl ELV 10 10 10 10 10 10 10 10 10 10 10 10
Monthly daily mean 7.4 6.8 7.8 8.9 8.9 9.1 8.7 9.1 9.1 8.7 7.2 6.4
Monthly daily maximum 9.1 8.7 9.5 9.3 9.4 9.4 9.3 9.8 9.6 9.3 8.6 8.5
0
10
20
30
40
50
60
70
Co
nce
ntr
atio
n m
g/N
m3

Annual report template V2.0
Line 3 SO2
Line 3 NOx
Jan Feb Mar Apr May Jun Jul Aug Sep Oct Nov Dec
1/2 hourly SO2 ELV 200 200 200 200 200 200 200 200 200 200 200 200
Monthly 1/2 hourly mean 2.1 2.2 1.7 1.9 2.6 3.3 3.7 3.6 2.6 2.8 0.2 0
Monthly 1/2 hourly maximum 16.3 11.7 36.7 13.3 18 24.8 35.3 14.1 15.9 21.3 13.4 3.4
Daily SO2 ELV 50 50 50 50 50 50 50 50 50 50 50 50
Monthly daily mean 2.1 2.2 1.6 1.9 2.6 3.3 3.7 3.6 2.6 2.8 0.2 0
Monthly daily maximum 3 2.6 2.5 2.8 3.7 4.2 4.5 4.4 3.2 3.7 0.7 0.2
0
50
100
150
200
250
Co
nce
ntr
atio
n m
g/N
m3
Jan Feb Mar Apr May Jun Jul Aug Sep Oct Nov Dec
1/2 hourly NOx ELV 400 400 400 400 400 400 400 400 400 400 400 400
Monthly 1/2 hourly mean 148 153 160 165 150 164 168 170 172 162 108 108
Monthly 1/2 hourlymaximum
218 210 307 213 210 225 214 243 228 245 169 143
Daily NOx ELV 200 200 200 200 200 200 200 200 200 200 200 200
Monthly daily mean 147 152 161 165 150 163 168 170 170 160 106 108
Monthly daily maximum 164 165 183 181 171 181 183 184 184 184 117 126
050
100150200250300350400450
Co
nce
ntr
atio
n m
g/N
m3

Annual report template V2.0
Line 3 TOC
Line 3 CO
Jan Feb Mar Apr May Jun Jul Aug Sep Oct Nov Dec
1/2 hourly TOC ELV 20 20 20 20 20 20 20 20 20 20 20 20
Monthly 1/2 hourly mean 0.99 1.48 1.87 2.36 1.63 1.5 1.31 1.54 1.12 0.76 0.61 0.54
Monthly 1/2 hourly maximum 38.21 52.06 178.31 41.43 44.07 25.7 31.87 46.54 34.59 5.42 17.74 9.43
Daily TOC ELV 10 10 10 10 10 10 10 10 10 10 10 10
Monthly daily mean 0.91 1.48 1.71 2.2 1.63 1.51 1.3 1.48 1.09 0.7 0.56 0.53
Monthly daily maximum 1.62 4.01 3.25 3.7 2.97 2.78 2.33 2.65 1.58 1.01 1.19 0.9
0
20
40
60
80
100
120
140
160
180
200
Co
nce
ntr
atio
n m
g/N
m3
Jan Feb Mar Apr May Jun Jul Aug Sep Oct Nov Dec
10 minute CO ELV (95%) 150 150 150 150 150 150 150 150 150 150 150 150
Monthly 95% 10 minutemaximum
Monthly 10 minute mean 4.87 5.32 4.87 5.99 5.96 6.52 4.06 6.49 7.34 2.19 2.38 0.78
Monthly 10 minute maximum 643 277 980 968 682 669 1326 1352 890 562 258 586
Daily CO ELV 50 50 50 50 50 50 50 50 50 50 50 50
Monthly daily mean 5 5 4 5 6 7 4 6 6 1 2 1
Monthly daily maximum 11 16 9 10 16 15 12 14 15 3 6 5
0
200
400
600
800
1000
1200
1400
1600
Co
nce
ntr
atio
n m
g/N
m3

Annual report template V2.0
Line 3 NH3
4.2 Summary of periodic monitoring results for emissions to air
The table below shows the results of periodically monitored substances.
Substance Emission
limit value
Results Line 1
January to June
2018
July to December
2018
Mercury and its
compounds
0.05 mg/m3 <0.00083 mg/m3 0.001 mg/m3
Cadmium & thallium
and their compounds
(total)
0.05 mg/m3 <0.0016 mg/m3 0.002 mg/m3
Sb, As, Pb, Cr, Co, Cu,
Mn, Ni and V and their
compounds (total)
0.5 mg/m3 0.18 mg/m3 0.240 mg/m3
Dioxins and furans (I-
TEQ)
0.1 ng/m3 0.0091 ng/m3 0.0070 ng/m3
Hydrogen Fluoride 1 mg/m3 0.14 mg/m3 <0.04 mg/m3
Jan Feb Mar Apr May Jun Jul Aug Sep Oct Nov Dec
1/2 hourly NH3 ELV
Monthly 1/2 hourly mean 0.43 0.49 0.56 0.44 0.46 0.43 0.41 0.54 0.49 0.4 0.46 0.43
Monthly 1/2 hourly maximum 8.52 3.84 10.49 3.91 3.58 2.96 4.78 4.1 5.99 1.17 2.12 1.4
Daily NH3 ELV 10 10 10 10 10 10 10 10 10 10 10 10
Monthly daily mean 0.41 0.49 0.54 0.42 0.46 0.43 0.41 0.53 0.49 0.39 0.45 0.43
Monthly daily maximum 0.64 0.82 0.92 0.65 0.78 0.82 0.67 0.89 0.62 0.44 0.55 0.54
0
2
4
6
8
10
12C
on
cen
trat
ion
mg/
Nm
3

Annual report template V2.0
Substance Emission
limit value
Results Line 2
January to June
2018
July to December
2018
Mercury and its
compounds
0.05 mg/m3 <0.00066 mg/m3 0.001 mg/m3
Cadmium & thallium
and their compounds
(total)
0.05 mg/m3 <0.0011 mg/m3 0.001 mg/m3
Sb, As, Pb, Cr, Co, Cu,
Mn, Ni and V and their
compounds (total)
0.5 mg/m3 0.095 mg/m3 0.169 mg/m3
Dioxins and furans (I-
TEQ)
0.1 ng/m3 0.0075 ng/m3 0.0129 ng/m3
Hydrogen Fluoride 1 mg/m3 <0.040 mg/m3 <0.04 mg/m3
Substance Emission
limit value
Results Line 3
January to June
2018
July to December
2018
Mercury and its
compounds
0.05 mg/m3 0.0017 mg/m3 0.001 mg/m3
Cadmium & thallium
and their compounds
(total)
0.05 mg/m3 0.0011 mg/m3 <0.001 mg/m3
Sb, As, Pb, Cr, Co, Cu,
Mn, Ni and V and their
compounds (total)
0.5 mg/m3 0.018 mg/m3 0.034 mg/m3
Dioxins and furans (I-
TEQ)
0.1 ng/m3 0.015 ng/m3 0.0082 ng/m3
Hydrogen Fluoride 1 mg/m3 <0.038 mg/m3 <0.04 mg/m3

Annual report template V2.0
4.3 Summary of monitoring results for emissions to water
There are no emissions to water from the process
5. Summary of Permit Compliance
5.1 Compliance with permit limits for continuously monitored pollutants
The plant met its emission limits as shown in the table below.
Substance Percentage time compliant during operation
Half-hourly limit Daily limit
Particulates 99.996 % 100 %
Oxides of nitrogen 100 % 100%
Sulphur dioxide 100 % 100 %
Carbon monoxide
100 % 95% of 10-min averages
(delete as appropriate)
100 %
Total organic carbon 100 % 100 %
Hydrogen chloride 100 % 100 %
Hydrogen fluoride 100 % 100 %
5.2 Summary of any notifications or non-compliances under the permit
Date Summary of notification or non-compliance
Reason Measures taken to prevent reoccurrence
15/02/2018 Schedule 1: Furnace Pressure Relief Valve operated for one second between 14:52:42 and 14:52:43
A sudden increase in pressure did occur but there is reasonable concern that there was a failure of the PRV proximity switch and/or the pressure measuring devices.
Actions taken:- 1. Doubled the sampling rate of the furnace pressure data to provide improved data going forward. 2. Replaced key components, namely the proximity switch and the pressure gauges at the next opportunity
09/07/2018 Abnormal Operation: SO2 half hour
The moisture level recorded at the stack during this event caused a significant disturbance of the SO2 CEMS analyser that became unreliable and gave a falsely high reading.
Our aspiration is to alter the definition or shutdown / effective operating time so these periods of transition are not included in the effective operating period as we are clearly not operating normally.

Annual report template V2.0
03/08/2018 Schedule 1: The Furnace Pressure Relief Valve Operated on three occasions. 07.02 for 1 second 07.15 for 1 second 07.22 for 2 seconds
Pressure relief valve is opening below design pressure. Design pressure = 40 mbar
These events occurred below 20 mbar and work shall be required during the forthcoming outage in October to test the exiting hatch
08/08/2018 Schedule 1: Furnace Pressure Relief Valve operated for 2 seconds
Pressure relief valve is opening below design pressure. Design pressure = 40 mbar
These events occurred below 20 mbar and work shall be required during the forthcoming outage in October to test the exiting hatch
10/11/2018 Abnormal Operation: Dust half hour
Filter bag failure Filter bag replaced immediately
11/11/2018 Abnormal Operation: Dust half hour
Filter bag failure Filter bag replaced immediately
13/11/2018 Schedule 1: Dust half hour
Filter bag failure All Filter bags replaced immediately
18/11/2018 Schedule 1: Dust half hour
Filter bag failure Filter bag replaced immediately. Air blower system refitted.
13/12/2018 Schedule 1: Shredder Fire
High probability of lithium batteries in waste
No emission released – shredder shut down for repair.
5.3 Summary of any complaints received and actions to taken to resolve them.
Date of complaint
Summary of complaint
Reason for complaint including whether substantiated by the operator or the EA
If substantiated, measures to prevent reoccurrence
27/01/2018 Odour Not Substantiated N/A
19/04/2018 Noise Substantiated Identified an open condensate trap bypass which was then closed.
10/05/2018 Odour Substantiated See below
30/05/2018 Flies Not Substantiated N/A
18/06/2018 Odour Substantiated See below
19/06/2018 Odour Substantiated See below
29/06/2018 Noise Not Substantiated N/A
17/07/2018 Odour Substantiated Note: The facility substantiates the odour when the wind direction is towards the complainant. The facility is currently engaged in substantial integrity testing of the buildings that hold waste and are undertaking significant repairs and replacement of roof louvers.
31/07/2018 Odour Substantiated
08/08/2018 Odour Substantiated
14/08/2018 Odour Substantiated
24/08/2018 Odour Substantiated
01/10/2018 Odour Substantiated
14/10/2018 Odour Substantiated
19/10/2018 Odour Substantiated
27/10/2018 Odour Substantiated

Annual report template V2.0
6. Summary of plant improvements
Summary of any permit improvement conditions that have been completed within the year and the resulting environmental benefits.
None (all permit improvement conditions complete)
Summary of any changes to the plant or operating techniques which required a variation to the permit and a summary of the resulting environmental impact.
None (no permit variations approved)
Summary of any other improvements made to the plant or planned to be made and a summary of the resulting environmental benefits. 1. Boiler: A new design of Superheater 3 was installed with the aim of reducing the likelihood
of boiler tube leaks. Resulting Environmental Benefit:- Tube leaks create increased emissions for a short period of time. A reduction of the number of tube leaks will reduce emissions to air. 2. Circoclean: Line 3 had a new lance system installed with the aim of reducing the likelihood
of Circoclean blockages and reducing the number of times that the lance has to be changed. The former aim will take a little while longer to judge if it’s successful, but the latter has so far been successful. We now change the lance 3 times less frequently than previously.
Resulting Environmental Benefit:- The facility has not exceeded its permitted limits for HCL but Circoclean lance changes increase the amount of HCL released over a short period of time. This improvement will result in reduced HCL emissions. 3. Filter bags: New design of bags installed – extra reinforcements where majority of failures
occur. This will reduce the number of failures. Resulting Environmental Benefit:- Bag failures increase emissions of dust and these filter bags will significantly reduce this. 4. Rowitec: Pressure relief valve on Line 3 checked and modified so that it will not lift
prematurely. Line 2 and Line 1 to complete next year. Resulting Environmental Benefit:- Pressure relief valve lifting allows unabated emissions to be released. These modifications will prevent this occurring. 5. Fuel use: Burner cut in value reduced by 5 degrees, considerable fuel savings resultant Resulting Environmental Benefit:- A reduction of fossil fuel usage has significant environmental impact and reduces energy use.

Annual report template V2.0
6. Details of any public liaison planned for 2019:
Date and time Description Location
26th February 2019 Community Liaison Meeting FCC Allington, Laverstoke Road
June 2019 Community Liaison Meeting FCC Allington, Laverstoke Road
October 2019 Community Liaison Meeting FCC Allington, Laverstoke Road
The Facility has an active liaison group involving representatives from the following stakeholders:
Environment Agency 10 Local Residents Councillors Walker and Hammond (TMBC members) Councillors Robertson, Harwood and Daley (MBC members). Cllr Daley is also a
member of KCC. Councillors Homewood and Bird (KCC members) Maidstone Borough Council Environmental Health, Wilcock Councillors Walker and Balcombe (Aylesford Parish Council) Tonbridge & Malling & Maidstone Borough Council Environmental Health Kent County Council Waste Management Kent Enviropower
The liaison group currently meets approx every 16 weeks. For further information please
contact:
Brian White (Chairman) - Email: [email protected]

Reporting of Waste Disposal and Recovery for the year 2018 Permit Reference Number: BR4551 Operator: Kent Enviropower Ltd Reporting of Water Usage for the year 2018
Waste Description
Disposal Recovery Trends in Waste Disposal and Recovery
Route Tonnes Tonnes Year Parameter
Named Waste
Total Waste
Waste per unit output
1) Hazardous Wastes Total Haz 2006 APC Residue 6939
APC residues Recycle Landfill
7,405.48 40,745.54
7,405.48 Total Haz 2007 APC Residue 23184
Other haz wastes (bottom ash) Landfill 0 0 Total Haz 2008 APC Residue 15619
Total Haz 2009 APC Residue 41303
Total hazardous waste 48,151.02 0 Total Haz 2010 APC Residue 34301
Total Haz 2011 APC Residue 40848
Total Haz 2012 APC Residue 40,741
Total Haz 2013 APC Residue & IBA 59,855
Total Haz 2014 APC Residue 48,989
Total Haz 2015 APC Residue 51,740
Total Haz 2016 APC Residue 51,933
Total Haz 2017 APC Residue 46,355
2) Non-Hazardous Wastes Total Haz 2018 APC Residue 48,151
Bottom Ash Recycle 51,916.12 51,916.12 Total Non Haz 2006 Bottom Ash & MRF 20365
Dirty Ferrous Recycle Landfill
14,703.40 0
14,703.40 Total Non Haz 2007 Bottom Ash & MRF 39487
MRF Materials Transfer 16,413.38 16,413.38 Total Non Haz 2008 Bottom Ash & MRF 34127
Other non-haz wastes (food waste) Transfer 4,843.78 4,843.78 Total Non Haz 2009 Bottom Ash & MRF 64560
Reject MSW to landfill Transfer 18.98 Total Non Haz 2010 Bottom Ash & MRF 67092
Bypass MSW to landfill Transfer 0 Total Non Haz 2011 Bottom Ash & MRF 73083
Linings & refractory to landfill Transfer 76.62 Total Non Haz 2012 Bottom Ash & MRF 85,550
Mixed Metal Transfer 163.52 Total Non Haz 2013 Bottom Ash & MRF 62,288
Total Non Haz 2014 Bottom Ash & MRF 89,819
Total non-hazardous waste 88,135.80 Total Non Haz 2015 Bottom Ash & MRF 92,132
Total Non Haz 2016 Bottom Ash & MRF 92,794
TOTAL WASTE 136,286.82 95,282.16 Total Non Haz 2017 Bottom Ash & MRF 85,999
Total Non Haz 2018 Bottom Ash & MRF 88,135

Annual report template V2.0
Permit Reference Number: BR4551 Operator: Kent Enviropower Ltd
Installation: Allington Quarry Form Number: Agency Form / BR4551 / WU1 / Form Dated 12 January 2006.
Water Source Usage
(m3) Specific Usage (m3/t)
Trends in Water Usage
Year Parameter
Named Water source
Total Water usage
Water per unit output Mains water 138,225 N/A
Site borehole N/A N/A 2011 Mains 116,563
River abstraction N/A N/A 2012 Mains 158,806
2013 Mains 224,751
2014 Mains 142,568
TOTAL WATER USAGE 138,225 2015 Mains 164,472
2016 Mains 156,225
2017 Mains 135,204
2018 Mains 138,225
Operator’s comments :

Annual report template V2.0
Reporting of Energy Usage for the year 2018 Permit Reference Number: BR4551 Operator: Kent Enviropower Ltd
Installation: Allington Quarry Form Number: Agency Form / BR4551 / E1 / Form Dated 12 January 2006.
Energy Source
Energy Usage CO2 Produced (tonnes)
Trends in Energy Usage
Quantity Primary Energy
(MWh)
Year Parameter
Primary Energy usage
CO2
produced CO2 per unit output
2011 81,575 26,604
Electricity MWh 1,839 753.2 2012 39,833 11,728
Gas/Fuel Oil tonnes 12,355 3,308 2013 46,360 12,599
Recovered Fuel Oil tonnes N/A N/A 2014 49,225 14,451
2015 23,179 6,363
2016 20,183 5,835
2017 19,576 5,308
2018 14,194 4,061
Operator’s comments : CO2 based on Carbon Trust conversion of 0.40957 KgCO2/Kwh for Electricity and 0.26782 KgCO2/Kwh for gas/fuel oil Gas/Fuel oil conversion from Ltrs used (1,200,390) to tonnes based on density 885 Kg/m3 www.thecalculatorsite.com/conversions/common/liters-to-metric-tons.php & then converted from tonnes to MWh DEFRA Carbon Factors

Annual report template V2.0
Reporting of Performance Indicators for the period Jan 2018 to Dec 2018 Permit Reference Number: BR4551 Operator: Kent Enviropower Ltd
Installation: Allington Quarry Form Number: Agency Form / BR4551 / PI1 / Form Dated 12 January 2006.
Annual Production/Treatment
Total waste incinerated
492,249 Tonnes
Environmental Performance Indicators Parameter Quarterly
Average Units Trends in Environmental Performance
Year Parameter
Supplementary Fuel Oil 300,097.5 litres
Mass of bottom ash produced 12,979 Tonnes
Mass of boiler, FGT & ESP Ash. 12,037 Tonnes
Mass of other solid residues 0 Tonnes
Mass of carbon used 69.8 Tonnes
Mass of lime used 895.7 Tonnes
Mass of urea used 1.8 Tonnes
Potable Water Use 34,556 M3
Waste Hazard Score N/A
Waste Disposal Score N/A
Operator’s comments :

Permit Number : BR4551IC Operator : Kent Enviropower Ltd Facility : Allington Form Number : performance 1 / 30/01/2019 Reporting of other performance indicators for the period: January to December 2018
Parameter
Result
Operating hours for the year
22,153.61 hours
Number of periods of abnormal operation
3
Cumulative hours of abnormal operation for this calendar year
1.5 hours
Operator’s comments : The 2017 operating hours were 21,173 hours.
Signed ………………………………………………………………….. Date: 30th January 2018 (authorised to sign as representative of Kent Enviropower)

Prepared by Approved by
Name
Trevor Ellis
Name
Paul Newton
Date:
31st January 2019
Signature
Signature