Embed Size (px)
Citation preview

Annual ReportJune 30, 2009
COUNTRY Growth Fund
COUNTRY Bond Fund


INVESTMENT ADVISOR’S LETTER TO SHAREHOLDERSJuly 2009
Dear Shareholders:
When recently asked about anything that keeps me awake at night, I had to respond that it was Everett Dirksen. In referring togovernment spending, the late Senator from Illinois once said “A billion here, a billion there, and pretty soon you’re talking aboutreal money”. I’m not entirely sure what we are talking about now, but I do know that in the 40 plus years since Dirksen’scomments, we have substituted the word “trillion” for “billion” – and the potential implications of the change are very sobering.
The Congressional Budget Office estimates that the federal budget deficit for 2009 will be just over $1.8 trillion, quadruplingthe 2008 deficit. Projecting further, the CBO estimates that the deficits for 2010 – 2012 will be $1.4 trillion, $970 billion, and $658billion. At the end of 2012, this would bring the total national debt to more than $11 trillion and represent more than 70% of GrossDomestic Product as compared to approximately 45% currently. If the projected liabilities for Social Security, Medicare, andMedicaid totaling some $40 trillion are included, our national debt load will look more like Latin American economies of the 20thcentury than modern, developed economies of the present.
The rapidly growing debt situation is one that must be addressed. Consider what happens as total debt approaches the level ofannual GDP. Interest on the debt under optimistic scenarios would be at least 5-6%, likely exceeding annual economic growth. Thisinterest would begin to compound and result in exponential growth in debt. We see two ways that these deficits can be financed.1) Inflation returns to erode the nominal value of the obligations. 2) Tax rates increase significantly and broadly, beyond theexpiration of the Bush tax cuts and impacting all taxpayers – not just the “wealthy”. A third possibility, reducing expenditures, doesnot seem likely given the current administration’s propensity to spend.
Given this background, markets appear to be in the early stage of recognizing a looming problem. Long-term interest rates asmeasured by the 10 year Treasury have risen more than 75% this year from 2.2% to 3.9% anticipating accelerating inflation. TheUnited States’ largest creditor, China, has expressed concern about our inflationary polices. They have indicated a willingness toconsider using currencies other than the dollar in world trade and hinted that they would not have to buy U.S. Treasuries as muchin the future as an investment for their surpluses. The administration has been “floating trial balloons” about various tax strategiesincluding a possible value-added tax in addition to raising income tax rates and eliminating various deductions.
While we are clearly facing a problem in the long-term, in the near-term markets are focused on prospects for recovery. Short-term interest rates are being anchored by the Federal Reserve near 0% and are not likely to increase substantially for some time.While long rates have risen, there may be some artificial pressure brought to bear to keep them low enough so as to not choke offrecovery possibilities. Equity markets have reacted favorably to an easing of the crisis in the banking industry and moved awayfrom the panic mode seen in late 2008 and early 2009. From early March through the end of June, stocks have advanced by morethan 35% and are now higher than year-end levels, but still well below the all time highs.
In this environment we are continuing to invest our fixed income assets in quality corporate issues and Build America bonds(a new class of fixed income investment) with little activity in Treasuries. Our equity portfolios are finding opportunities inindividual issues that are based on fundamental valuations rather than overall stock market psychology. We are keeping our eyeswide open for opportunities during the day even though we may be kept awake at night by longer term considerations.
Performance data quoted represents past performance; past performance does not guarantee future results. The investmentreturn and principal value of an investment will fluctuate so that an investor’s shares, when redeemed, may be worth more or lessthan their original cost. Current performance of the Funds may be lower or higher than the performance quoted. Performancedata current to the most recent month end may be obtained by calling 800-422-8261 or visiting www.countryinvestment.com.
COUNTRY Growth FundInception Date 04/21/66 (Class Y)
The annualized returns for the Fund for the period ended June 30, 2009 are as follows:
1 Year 5 Years 10 Years_____ _______ _______-22.77% -1.65% -0.18%
Gross Expense Ratio — 1.19%
These returns assume all dividends and capital gains distributions were re-invested in the Fund and reflect voluntary feewaivers in effect. In the absence of fee waivers, returns would be reduced.
Over the past year, domestic equity markets as measured by the S&P 500 Index had a total return of -26.21%. The averagemutual fund with similar characteristics as the Growth Fund (represented by Lipper, Inc.’s Large Cap Core Funds Average) returned-25.91% during this same time period. As of June 30, 2009, based on total returns, the Growth Fund (Class Y) ranked in the 20thpercentile compared to the Lipper peer group for the past year and in the 37th and top 21st percentiles for the past five and tenyears, out of 936, 673 and 379, respectively.

The first half of 2009 was a period of contrasts. From year-end through early March, the market continued the declines of late2008 dropping by more than 25%. However the market then reversed course to finish the first half with a gain of 3.16%. As thefederal government’s massive commitment to address the financial crisis gained traction, some observers began to see signs of“green shoots” that were thought to bode well for recovery. While these signs were not necessarily showing improving conditions,they did indicate a slowing of the rate of decline along with potential for a bottoming of the economy. Most observers feel thatunemployment will continue to rise through the end of 2009, but that slow recovery will begin in the second half. The pace andextent of that recovery may be tempered by longer-term structural problems related to federal budget deficits in combination withcontinued de-leveraging of the US consumer.
The Growth Fund lagged the performance of the S&P 500 for the first half as our longer term concerns kept us in a defensiveposture. We did not anticipate the strength and suddenness of the rally in the second quarter, and even if we had it would havebeen difficult to re-position the portfolio for what we believe is a short-term bounce. We have been finding some opportunitiesbased on individual company fundamentals and we are starting to take a more neutral stance on the economy and market.However, we still feel that caution is warranted and that fundamental analysis will be key to success for the foreseeable future.
COUNTRY Bond FundInception Date 01/02/97 (Class Y)
The annualized total returns for the Fund for the period ending June 30, 2009 are as follows:
1 Year 5 Years 10 Years_____ _______ _______7.51% 4.81% 5.75%
Gross Expense Ratio — 0.91%
These returns assume all dividend and capital gain distributions were re-invested in the Fund and reflect voluntary fee waiversin effect. In the absence of fee waivers, returns would be reduced.
The debt markets are inching back to normal after last year’s credit crisis. Credit yield spreads have contracted sharply fromlevels seen earlier in the year. However, conflicting signals persist. While demand is outstripping supply for new deals, the creditworthiness of the market as a whole continues to slide. Investors are buying increasing amounts of high yield bonds and lower-rated investment grade bonds, just as the ratings firms dish out record levels of downgrades. Our feeling is that the credit marketshave come too far and are due for a possible correction.
The Fund’s overweight position in corporate debt has been the main driver for its good relative performance. Currently, theFund’s duration is neutral versus its benchmarks. Over the near term inflation appears under control. If inflation pressures start tobuild, our next strategic move could be to lower duration and reduce our corporate bond position.
Sincerely,
Bruce D. FinksVice President
Please refer to the Portfolio Highlights sections for index and peer averages, including descriptions and performance. TheS&P 500 Index is an unmanaged index that contains securities typically selected by growth managers as being representative ofthe U.S. stock market. The Index does not reflect investment management fees, brokerage commission and other expensesassociated with investing in equity securities. You cannot invest directly in an Index.
The Lipper Large Cap Core Funds Average consist of Funds that, by portfolio practice, invest at least 75% of their equity assetsin companies with market capitalizations (on a three-year weighted basis) greater than 300% of the dollar-weighted median marketcapitalization of the middle 1,000 securities of the S&P SuperComposite 1500 Index. Large-cap core funds have more latitude inthe companies in which they invest. These funds typically have an average price-to-earnings ratio, price-to-book ratio and three-year sales-per-share growth value, compared to the S&P 500 Index.
The Lipper Intermediate Investment Grade Debt Funds Average consists of funds that, by portfolio practice, invest at least 65%of their assets in investment-grade debt issues (rated in the top four grades) with dollar weighted average maturities of five to tenyears.

Lipper Analytical Services, Inc. is an independent mutual fund research and ranking agency. Each Lipper average represents auniverse of funds with similar investment objectives. Rankings for the periods shown are based on fund total returns withdividends and distributions reinvested and do not reflect sales charges.
Mutual fund investing involves risk; principal loss is possible.
Investments in debt securities typically decrease in value when interest rates rise. This risk is usually greater for longer-term debt securities. Investments in foreign securities involve greater volatility and political, economic and currency risks anddifferences in accounting methods. Investments in Asset Backed and Mortgage Backed Securities include additional risks thatinvestors should be aware of such as credit risk, prepayment risk, possible illiquidity and default, as well as increasedsusceptibility to adverse economic developments.
Please refer to the Schedule of Investments in this report for holding information. Fund holdings are subject to change at anytime and should not be considered recommendations to buy or sell any security.

4
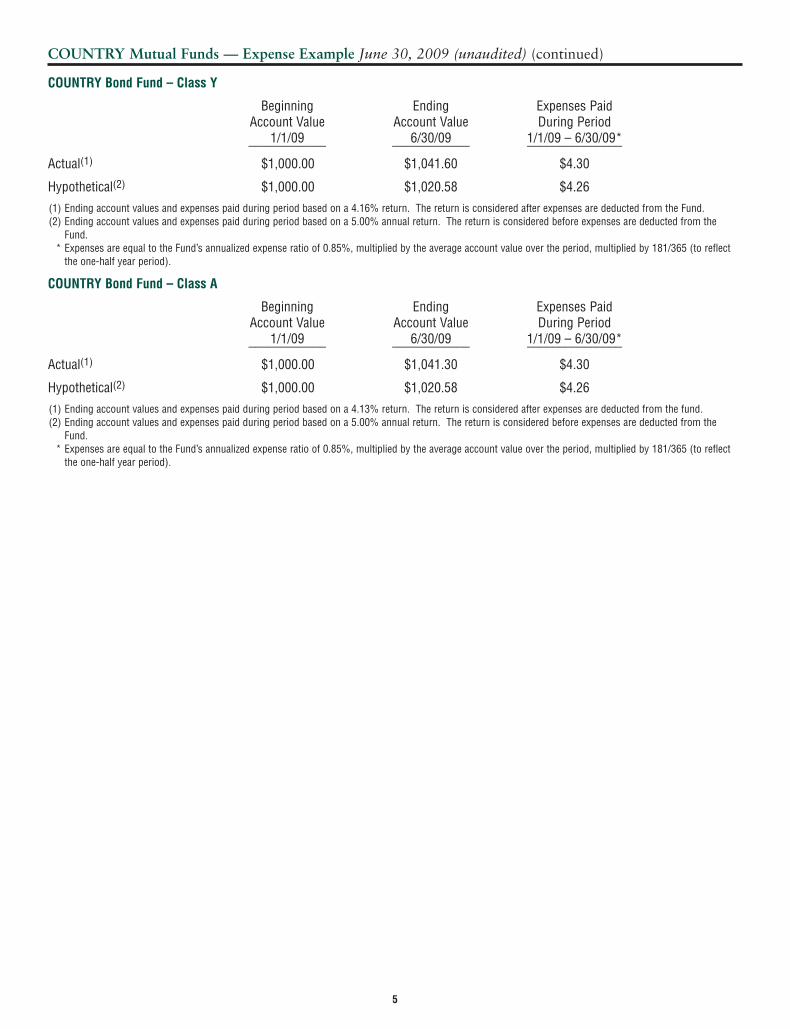
As a shareholder of the COUNTRY Growth Fund or COUNTRY Bond Fund, you incur ongoing costs, including management fees;distribution and/or service fees; and other Fund expenses. This Example is intended to help you understand your ongoing costs (indollars) of investing in the Funds and to compare these costs with the ongoing costs of investing in other mutual funds. TheExample is based on an investment of $1,000 invested for the period 1/01/09 – 6/30/09.
Actual Expenses
The first line of the table below provides information about actual account values and actual expenses. Although the Funds chargeno transaction fees, you will be assessed fees for outgoing wire transfers, returned checks and stop payment orders at prevailingrates charged by U.S. Bancorp Fund Services, LLC, the Funds’ transfer agent. If you request that a redemption be made by wiretransfer, currently a $15.00 fee is charged by the Funds’ transfer agent. Individual retirement accounts will be charged a $15.00annual maintenance fee. To the extent the Funds invest in shares of other investment companies as part of its investment strategy,you will indirectly bear your proportionate share of any fees and expenses charged by the underlying funds in which the Fundsinvest in addition to the expenses of the Funds. Actual expenses of the underlying funds are expected to vary among the variousunderlying funds. These expenses are not included in the example below. The example below includes, but is not limited to,management fees, shareholder servicing fees, fund accounting, custody and transfer agent fees. However, the example below doesnot include portfolio trading commissions and related expenses or other extraordinary expenses as determined under generallyaccepted accounting principles. You may use the information in this line, together with the amount you invested, to estimate theexpenses that you paid over the period. Simply divide your account value by $1,000 (for example, an $8,600 account value dividedby $1,000 = 8.6), then multiply the result by the number in the first line under the heading entitled “Expenses Paid During Period”to estimate the expenses you paid on your account during this period.
Hypothetical Example for Comparison Purposes
The second line of the table below provides information about hypothetical account values and hypothetical expenses based on theFunds’ actual expense ratio and an assumed rate of return of 5% per year before expenses, which are not the Funds’ actual returns.The hypothetical account values and expenses may not be used to estimate the actual ending account balance or expenses youpaid for the period. You may use this information to compare the ongoing costs of investing in the Funds and other funds. To doso, compare this 5% hypothetical example with the 5% hypothetical examples that appear in the shareholder reports of the otherfunds. Please note that the expenses shown in the table are meant to highlight your ongoing costs only and do not reflect anytransactional costs, such as sales charges (loads), redemption fees, or exchange fees. Therefore, the second line of the table isuseful in comparing ongoing costs only, and will not help you determine the relative total costs of owning different funds. Inaddition, if these transactional costs were included, your costs would have been higher.
COUNTRY Growth Fund – Class Y
Beginning Ending Expenses PaidAccount Value Account Value During Period
1/1/09 6/30/09 1/1/09 – 6/30/09*____________ ____________ _______________
Actual(1) $1,000.00 $1,022.30 $6.27
Hypothetical(2) $1,000.00 $1,018.59 $6.26
(1) Ending account values and expenses paid during period based on a 2.23% return. The return is considered after expenses are deducted from the Fund.(2) Ending account values and expenses paid during period based on a 5.00% annual return. The return is considered before expenses are deducted from the
Fund.* Expenses are equal to the Fund’s annualized expense ratio of 1.25%, multiplied by the average account value over the period, multiplied by 181/365 (to reflect
the one-half year period).
COUNTRY Growth Fund – Class A
Beginning Ending Expenses PaidAccount Value Account Value During Period
1/1/09 6/30/09 1/1/09 – 6/30/09*____________ ____________ _______________
Actual(1) $1,000.00 $1,021.70 $6.27
Hypothetical(2) $1,000.00 $1,018.59 $6.26
(1) Ending account values and expenses paid during period based on a 2.17% return. The return is considered after expenses are deducted from the Fund.(2) Ending account values and expenses paid during period based on a 5.00% annual return. The return is considered before expenses are deducted from the
Fund.* Expenses are equal to the Fund’s annualized expense ratio of 1.25%, multiplied by the average account value over the period, multiplied by 181/365 (to reflect
the one-half year period).
COUNTRY Mutual Funds — Expense Example June 30, 2009 (unaudited)
5
COUNTRY Bond Fund – Class Y
Beginning Ending Expenses PaidAccount Value Account Value During Period
1/1/09 6/30/09 1/1/09 – 6/30/09*____________ ____________ _______________
Actual(1) $1,000.00 $1,041.60 $4.30
Hypothetical(2) $1,000.00 $1,020.58 $4.26
(1) Ending account values and expenses paid during period based on a 4.16% return. The return is considered after expenses are deducted from the Fund.(2) Ending account values and expenses paid during period based on a 5.00% annual return. The return is considered before expenses are deducted from the
Fund.* Expenses are equal to the Fund’s annualized expense ratio of 0.85%, multiplied by the average account value over the period, multiplied by 181/365 (to reflect
the one-half year period).
COUNTRY Bond Fund – Class A
Beginning Ending Expenses PaidAccount Value Account Value During Period
1/1/09 6/30/09 1/1/09 – 6/30/09*____________ ____________ _______________
Actual(1) $1,000.00 $1,041.30 $4.30
Hypothetical(2) $1,000.00 $1,020.58 $4.26
(1) Ending account values and expenses paid during period based on a 4.13% return. The return is considered after expenses are deducted from the fund.(2) Ending account values and expenses paid during period based on a 5.00% annual return. The return is considered before expenses are deducted from the
Fund.* Expenses are equal to the Fund’s annualized expense ratio of 0.85%, multiplied by the average account value over the period, multiplied by 181/365 (to reflect
the one-half year period).
COUNTRY Mutual Funds — Expense Example June 30, 2009 (unaudited) (continued)

6
B
B
B
BB
B
BB
BB
B
F
F
F
FF
F
FF
F
FF
H
H
H
HH
H
HH
H
H
H
$0
$5,000
$10,000
$15,000
$20,000
1999 2000 2001 2002 2003 2004 2005 2006 2007 2008 2009
B Growth(1)
F S&P 500
H Lipper Large Cap Core
$9,826
$7,584$7,987
Illustration of $10,000 Investment June 30, 2009
GROWTH FUND vs. STANDARD & POOR’S 500 INDEX AND LIPPER LARGE CAP CORE FUNDS AVERAGE
Past performance is not indicative of future results.
(1) The above graph represents the growth of $10,000 of Class Y shares of the Growth Fund. Class A shares of the Fundcommenced on March 1, 2002. Since inception returns for Class Y and Class A shares are provided below.
Average Annual Returns*Class Y - 1 Year -22.77%Class Y - 5 Years -1.65%Class Y - 10 Years -0.18%Class Y - Since Inception (04/21/66) 8.01%Class A - 1 Year (No Load) -22.79%Class A - 5 Years (No Load) -1.65%Class A - Since Inception (03/01/02) (No Load) -0.52%Class A - 1 Year (Load)** -27.06%Class A - 5 Years (Load)** -2.76%Class A - Since Inception (03/01/02) (Load)** -1.28%
* Fund returns are net of all fees and transaction costs, while the Index returns are based solely on market returns withoutdeduction for fees or transaction costs for rebalancing. The Index is unmanaged.
** Reflects maximum sales charge of 5.50%.
Performance data quoted represents past performance; past performance does not guarantee future results. The graph and tabledo not reflect the deduction of taxes that a shareholder would pay on fund distributions or the redemption of fund shares. Theinvestment return and principal value of an investment will fluctuate so that an investor’s shares, when redeemed, may be worthmore or less than their original cost. Current performance of the Fund may be lower or higher than the performance quoted.Performance data current to the most recent month end may be obtained by calling 800-422-8261 or visitingwww.countryinvestment.com

7
B
B
BBB
BB
B
B
BB
F
F
F
FF
FF
F
F
FF
HHH
HHHH
HH
HH
J
J
J
JJ
JJ
J
J
JJ
$0
$2,000
$4,000
$6,000
$8,000
$10,000
$12,000
$14,000
$16,000
$18,000
$20,000
1999 2000 2001 2002 2003 2004 2005 2006 2007 2008 2009
B Bond(1)
FMerrill Lynch U.S. DomesticMaster Bond Index
HLipper IntermediateInvestment Grade Debt
JBarclays CapitalAggregate Bond Index
$18,059$17,871
$17,489$15,590
Illustration of $10,000 Investment June 30, 2009
BOND FUND vs. MERRILL LYNCH U.S. DOMESTIC MASTER BOND INDEX, BARCLAYS CAPITAL AGGREGATE BOND INDEX ANDLIPPER INTERMEDIATE INVESTMENT GRADE DEBT FUNDS AVERAGE
Past performance is not indicative of future results.
(1) The above graph represents the growth of $10,000 of Class Y shares of the Bond Fund. Class A shares of the Fundcommenced on March 1, 2002. Since inception returns for Class Y and Class A shares are provided below.
Average Annual Returns*Class Y - 1 Year 7.51%Class Y - 5 Years 4.81%Class Y - 10 Years 5.75%Class Y - Since Inception (01/02/97) 5.87%Class A - 1 Year (No Load) 7.55%Class A - 5 Years (No Load) 4.79%Class A - Since Inception (03/01/02) (No Load) 4.92%Class A - 1 Year (Load)** 3.01%Class A - 5 Years (Load)** 3.88%Class A - Since Inception (03/01/02) (Load)** 4.30%
* Fund returns are net of all fees and transaction costs, while the Index returns are based solely on market returns withoutdeduction for fees or transaction costs for rebalancing. The Index is unmanaged.
** Reflects maximum sales charge of 4.25%.
Performance data quoted represents past performance; past performance does not guarantee future results. The graph and tabledo not reflect the deduction of taxes that a shareholder would pay on fund distributions or the redemption of fund shares. Theinvestment return and principal value of an investment will fluctuate so that an investor’s shares, when redeemed, may be worthmore or less than their original cost. Current performance of the Fund may be lower or higher than the performance quoted.Performance data current to the most recent month end may be obtained by calling 800-422-8261 or visitingwww.countryinvestment.com

8
COUNTRY Growth Fund*
COUNTRY Bond Fund*
* Expressed as a percentage of total investments.
COUNTRY Mutual Funds — Allocation of Portfolio Assets June 30, 2009
Consumer Discretionary10.45%
Consumer Staples13.82%
Energy13.07%
Financials10.01%
Health Care16.08%
Industrials11.19%
Information Technology16.24%
Materials 1.41%
Telecommuncation Services 3.44%
Utilities 2.80%
Mortgage Backed Securities 0.17%Money Market Funds 1.32%
Asset Backed Securities 4.21%
Corporate Bonds34.46%
Mortgage BackedSecurities
36.90%Municipal Bonds 6.66%
U.S. Government Agency Issues 1.17%
U.S. Treasury Obligations 7.10%
Commercial Paper 1.42%
Money Market Funds 7.81%
Investment Companies 0.27%

9
COUNTRY Mutual Funds — Portfolio Highlights
COUNTRY Bond Fund
Average Annual Returns June 30, 20091 Year 5 Years 10 Years______ ______ _______
COUNTRY Bond Fund — Class Y (01/02/97) . . . . . . . . . . . . . . . . . . . . . . . . . . . . . . . . . . 7.51% 4.81% 5.75%Barclays Capital Aggregate Bond Index(1) . . . . . . . . . . . . . . . . . . . . . . . . . . . . . . . . . . . . . 6.05% 5.01% 5.98%Merrill Lynch U.S. Domestic Master Bond Index(2) . . . . . . . . . . . . . . . . . . . . . . . . . . . . . . 6.48% 5.21% 6.09%Lipper Intermediate Investment Grade Debt Funds Average(3) . . . . . . . . . . . . . . . . . . . . . 2.12% 3.26% 4.84%_______________(1) The Barclays Capital Aggregate Bond Index covers the USD-denominated, investment-grade, fixed-rate, taxable bond market of SEC-
registered securities. The index includes bonds from the Treasury, Government-Related, Corporate, MBS (agency fixed-rate and hybridARM passthroughs), ABS, and CMBS sectors.
(2) The Merrill Lynch U.S. Domestic Master Bond Index is a basket of publicly issued Government Bonds, Corporate Bonds and MortgagePass Through Securities with maturities greater than one year.
(3) The Lipper Intermediate Investment Grade Debt Funds Average consists of funds that, by portfolio practice, invest at least 65% of theirassets in investment grade debt issues (rated in the top four grades) with dollar weighted average maturities of five to ten years.
Ten Largest Holdings (excludes short-term investments) June 30, 2009Value Percent of Fund___________ _______________
Government National Mortgage Association, 5.500%, 01/15/2038 . . . . . . . . . . . . . . . . . . . . . . $ 2,402,752 1.57%Federal National Mortgage Association, 5.000%, 05/01/2023 . . . . . . . . . . . . . . . . . . . . . . . . . . 2,384,167 1.56%Government National Mortgage Association, 5.000%, 01/15/2038 . . . . . . . . . . . . . . . . . . . . . . 2,256,828 1.48%U.S. Treasury Inflation Index, 3.125%, 05/15/2019 . . . . . . . . . . . . . . . . . . . . . . . . . . . . . . . . . . 1,934,380 1.27%Federal Home Loan Mortgage Corp., 5.500%, 03/01/2022 . . . . . . . . . . . . . . . . . . . . . . . . . . . . 1,899,773 1.24%Federal Home Loan Mortgage Corp., 6.000%, 05/01/2037 . . . . . . . . . . . . . . . . . . . . . . . . . . . . 1,705,971 1.12%Federal National Mortgage Association, 5.500%, 07/01/2038 . . . . . . . . . . . . . . . . . . . . . . . . . . 1,652,489 1.08%Federal National Mortgage Association, 5.000%, 06/01/2038 . . . . . . . . . . . . . . . . . . . . . . . . . . 1,630,781 1.07%Federal Home Loan Mortgage Corp., 6.000%, 01/01/2038 . . . . . . . . . . . . . . . . . . . . . . . . . . . . 1,570,258 1.03%Federal Home Loan Mortgage Corp., 6.000%, 08/01/2037 . . . . . . . . . . . . . . . . . . . . . . . . . . . . 1,553,451 1.02%__________ ______
$18,990,850 12.44%__________ ________________ ______
COUNTRY Growth Fund
Average Annual Returns June 30, 20091 Year 5 Years 10 Years______ ______ _______
COUNTRY Growth Fund — Class Y (04/21/66) . . . . . . . . . . . . . . . . . . . . . . . . . . . . . . . . -22.77% -1.65% -0.18%S&P 500 Index(1) . . . . . . . . . . . . . . . . . . . . . . . . . . . . . . . . . . . . . . . . . . . . . . . . . . . . . . . . -26.21% -2.24% -2.22%Lipper Large Cap Core Funds Average(2) . . . . . . . . . . . . . . . . . . . . . . . . . . . . . . . . . . . . . . -25.91% -2.21% -1.82%_______________(1) The S&P 500 Index is an unmanaged index that contains securities typically selected by growth managers as being representative of
the U.S. stock market. The Index does not reflect investment management fees, brokerage commissions and other expensesassociated with investing in equity securities.
(2) The Lipper Large Cap Core Funds Average consists of funds that, by portfolio practice, invest at least 75% of their equity assets incompanies with market capitalizations (on a three-year weighted basis) greater than 300% of the dollar-weighted median marketcapitalization of the middle 1,000 securities of the S&P SuperComposite 1500 Index. Large-cap core funds have more latitude in thecompanies in which they invest. These funds typically have an average price-to-earnings ratio, price-to-book ratio and three-yearsales-per-share growth value, compared to the S&P 500 Index.
Ten Largest Holdings (excludes short-term investments) June 30, 2009Value Percent of Fund___________ _______________
Exxon Mobil Corporation . . . . . . . . . . . . . . . . . . . . . . . . . . . . . . . . . . . . . . . . . . . . . . . . . . . . . . $ 6,235,972 3.93%Wal-Mart Stores, Inc. . . . . . . . . . . . . . . . . . . . . . . . . . . . . . . . . . . . . . . . . . . . . . . . . . . . . . . . . 3,947,860 2.49%WellPoint Inc. . . . . . . . . . . . . . . . . . . . . . . . . . . . . . . . . . . . . . . . . . . . . . . . . . . . . . . . . . . . . . . 3,811,661 2.40%CVS Caremark Corporation . . . . . . . . . . . . . . . . . . . . . . . . . . . . . . . . . . . . . . . . . . . . . . . . . . . . 3,811,652 2.40%The Procter & Gamble Company . . . . . . . . . . . . . . . . . . . . . . . . . . . . . . . . . . . . . . . . . . . . . . . . 3,740,520 2.36%Gentex Corporation . . . . . . . . . . . . . . . . . . . . . . . . . . . . . . . . . . . . . . . . . . . . . . . . . . . . . . . . . . 3,561,200 2.25%Microsoft Corporation . . . . . . . . . . . . . . . . . . . . . . . . . . . . . . . . . . . . . . . . . . . . . . . . . . . . . . . . 3,377,717 2.13%General Electric Company . . . . . . . . . . . . . . . . . . . . . . . . . . . . . . . . . . . . . . . . . . . . . . . . . . . . . 3,316,760 2.09%AT&T, Inc . . . . . . . . . . . . . . . . . . . . . . . . . . . . . . . . . . . . . . . . . . . . . . . . . . . . . . . . . . . . . . . . . . 3,303,720 2.08%Intuit Inc. . . . . . . . . . . . . . . . . . . . . . . . . . . . . . . . . . . . . . . . . . . . . . . . . . . . . . . . . . . . . . . . . . . 3,263,744 2.06%__________ ______
$38,370,806 24.19%__________ ________________ ______

10
COUNTRY Growth Fund
Shares Value_______ _________COMMON STOCKS — 98.75%Consumer Discretionary — 10.47%Abercrombie & Fitch Co. — Class A . . . . . . . . 58,500 $ 1,485,315Comcast Corporation . . . . . . . . . . . . . . . . . . . . 98,300 1,424,367Darden Restaurants, Inc. . . . . . . . . . . . . . . . . 18,500 610,130Gentex Corporation . . . . . . . . . . . . . . . . . . . . . 307,000 3,561,200The Home Depot, Inc. . . . . . . . . . . . . . . . . . . . 95,200 2,249,576Kohl’s Corporation (a) . . . . . . . . . . . . . . . . . . . 17,100 731,025Limited Brands . . . . . . . . . . . . . . . . . . . . . . . . . 245,000 2,932,650News Corporation — Class A . . . . . . . . . . . . . 148,500 1,352,835Target Corporation . . . . . . . . . . . . . . . . . . . . . . 57,000 2,249,790___________
16,596,888___________Consumer Staples — 13.86%Archer-Daniels-Midland Company . . . . . . . . . . 94,000 2,516,380CVS Caremark Corporation . . . . . . . . . . . . . . . 119,600 3,811,652The Kroger Co. . . . . . . . . . . . . . . . . . . . . . . . . 71,000 1,565,550McCormick & Company . . . . . . . . . . . . . . . . . . 64,700 2,104,691Philip Morris International, Inc. . . . . . . . . . . . 60,000 2,617,200The Procter & Gamble Company . . . . . . . . . . . 73,200 3,740,520Sysco Corporation . . . . . . . . . . . . . . . . . . . . . . 74,000 1,663,520Wal-Mart Stores, Inc. . . . . . . . . . . . . . . . . . . . 81,500 3,947,860___________
21,967,373___________Energy — 13.10%Apache Corporation . . . . . . . . . . . . . . . . . . . . . 37,500 2,705,625Chesapeake Energy Corp. . . . . . . . . . . . . . . . . 154,300 3,059,769ChevronTexaco Corp. . . . . . . . . . . . . . . . . . . . 35,000 2,318,750ConocoPhillips . . . . . . . . . . . . . . . . . . . . . . . . . 31,000 1,303,860Exxon Mobil Corporation . . . . . . . . . . . . . . . . . 89,200 6,235,972Halliburton Company . . . . . . . . . . . . . . . . . . . . 124,700 2,581,290Schlumberger Limited (b) . . . . . . . . . . . . . . . . 47,300 2,559,403___________
20,764,669___________Financials — 10.03%ACE Limited (b) . . . . . . . . . . . . . . . . . . . . . . . . 57,000 2,521,110AFLAC INCORPORATED . . . . . . . . . . . . . . . . . . 100,000 3,109,000American Express Company . . . . . . . . . . . . . . 60,000 1,394,400The Bank of New York Mellon Corporation . . . 66,600 1,952,046JPMorgan Chase & Co. . . . . . . . . . . . . . . . . . . 91,000 3,104,010State Street Corp. . . . . . . . . . . . . . . . . . . . . . . 49,500 2,336,400Wells Fargo & Company . . . . . . . . . . . . . . . . . 61,300 1,487,138___________
15,904,104___________Health Care — 16.11%Abbott Laboratories . . . . . . . . . . . . . . . . . . . . . 40,000 1,881,600Amgen Inc. (a) . . . . . . . . . . . . . . . . . . . . . . . . . 49,000 2,594,060Baxter International Inc. . . . . . . . . . . . . . . . . . 30,900 1,636,464Covance, Inc. (a) . . . . . . . . . . . . . . . . . . . . . . . 43,100 2,120,520Gilead Sciences, Inc. (a) . . . . . . . . . . . . . . . . . 34,800 1,630,032Hologic, Inc. (a) . . . . . . . . . . . . . . . . . . . . . . . . 136,300 1,939,549Johnson & Johnson . . . . . . . . . . . . . . . . . . . . . 50,000 2,840,000Medco Health Solutions, Inc. (a) . . . . . . . . . . . 47,200 2,152,792Medtronic, Inc. . . . . . . . . . . . . . . . . . . . . . . . . 83,600 2,916,804Pfizer Inc. . . . . . . . . . . . . . . . . . . . . . . . . . . . . 135,000 2,025,000WellPoint Inc. (a) . . . . . . . . . . . . . . . . . . . . . . . 74,900 3,811,661___________
25,548,482___________Industrials — 11.22%3M Co. . . . . . . . . . . . . . . . . . . . . . . . . . . . . . . 39,500 2,373,950Caterpillar Inc. . . . . . . . . . . . . . . . . . . . . . . . . . 44,700 1,476,888Emerson Electric Co. . . . . . . . . . . . . . . . . . . . . 59,900 1,940,760FedEx Corp. . . . . . . . . . . . . . . . . . . . . . . . . . . . 43,200 2,402,784General Dynamics Corp. . . . . . . . . . . . . . . . . . 37,900 2,099,281General Electric Company . . . . . . . . . . . . . . . . 283,000 3,316,760
Shares Value_______ _________Ingersoll-Rand PLC . . . . . . . . . . . . . . . . . . . . . 56,000 $ 1,170,400Iron Mountain, Inc. (a) . . . . . . . . . . . . . . . . . . . 104,400 3,001,500___________
17,782,323___________Information Technology — 16.28%Cisco Systems, Inc. (a) . . . . . . . . . . . . . . . . . . 112,000 2,087,680EMC Corporation (a) . . . . . . . . . . . . . . . . . . . . 180,500 2,364,550Intel Corporation . . . . . . . . . . . . . . . . . . . . . . . 194,000 3,210,700International Business Machines Corporation . 24,400 2,547,848Intuit Inc. (a) . . . . . . . . . . . . . . . . . . . . . . . . . . 115,900 3,263,744Microsoft Corporation . . . . . . . . . . . . . . . . . . . 142,100 3,377,717Nokia Corp. — ADR . . . . . . . . . . . . . . . . . . . . . 155,000 2,259,900Oracle Corp. . . . . . . . . . . . . . . . . . . . . . . . . . . 92,300 1,977,066QUALCOMM Inc. . . . . . . . . . . . . . . . . . . . . . . . 47,100 2,128,920Western Union Company . . . . . . . . . . . . . . . . . 158,000 2,591,200___________
25,809,325___________Materials — 1.42%BHP Billiton Limited — ADR . . . . . . . . . . . . . . 21,500 1,176,695Newmont Mining Corporation . . . . . . . . . . . . . 26,200 1,070,794___________
2,247,489___________Telecommunication Services — 3.45%American Tower Corporation — Class A (a) . . 26,100 822,933AT&T, Inc. . . . . . . . . . . . . . . . . . . . . . . . . . . . . 133,000 3,303,720Verizon Communications Inc. . . . . . . . . . . . . . 43,500 1,336,755___________
5,463,408___________Utilities — 2.81%Dominion Resources Inc. . . . . . . . . . . . . . . . . 46,300 1,547,346Exelon Corp. . . . . . . . . . . . . . . . . . . . . . . . . . . 15,100 773,271FPL Group, Inc. . . . . . . . . . . . . . . . . . . . . . . . . 37,600 2,137,936___________
4,458,553___________TOTAL COMMON STOCKS
(Cost $152,040,065) . . . . . . . . . . . . . . . . . . . 156,542,614___________
PrincipalAmount_______
MORTGAGE BACKED SECURITIES — 0.17%Citicorp Mortgage Securities, Inc.
5.000%, 08/25/2020 . . . . . . . . . . . . . . . . . . . $ 53,160 49,688Federal Home Loan Mortgage Corp.
7.150%, 09/25/2028 (d) . . . . . . . . . . . . . . . . 145,124 144,904Government National Mortgage Association
9.000%, 07/15/2016 . . . . . . . . . . . . . . . . . . . 2,074 2,2466.500%, 07/15/2029 . . . . . . . . . . . . . . . . . . . 8,387 9,053
Mortgage IT Trust4.250%, 02/25/2035 (d) . . . . . . . . . . . . . . . . 50,932 38,482
Nomura Asset Acceptance Corporation6.500%, 10/25/2034 (Acquired 08/18/2004,Cost $31,829) (c) . . . . . . . . . . . . . . . . . . . . . 30,660 25,541___________
TOTAL MORTGAGE BACKED SECURITIES(Cost $289,614) . . . . . . . . . . . . . . . . . . . . . . . 269,914___________
The accompanying notes are an integral part of these financial statements.
COUNTRY Mutual Funds — Schedule of Investments June 30, 2009

11
COUNTRY Growth Fund (continued)
Shares Value_______ _________SHORT-TERM INVESTMENTS — 1.32%Money Market Funds — 1.32%Federated Prime Obligations Fund . . . . . . . . . . 2,096,606 $ 2,096,606___________TOTAL SHORT-TERM INVESTMENTS
(Cost $2,096,606) . . . . . . . . . . . . . . . . . . . . . 2,096,606___________TOTAL INVESTMENTS — 100.24%
(Cost $154,426,285) . . . . . . . . . . . . . . . . . . . 158,909,134LIABILITIES IN EXCESSOF OTHER ASSETS — (0.24)% . . . . . . . . . . (374,610)___________
TOTAL NET ASSETS — 100.00% . . . . . . . . . . $158,534,524______________________
Percentages are stated as a percent of net assets.ADR – American Depository Receipt(a) Non-income producing.(b) Foreign issuer.(c) Security exempt from registration under Rule 144A of the Securities Act of
1933. These securities may be resold in transactions exempt fromregistration normally to qualified institutional buyers. As of June 30, 2009these securities represented 0.02% of total net assets.
(d) The coupon rate shown on variable rate securities represents the rates atJune 30, 2009.
The accompanying notes are an integral part of these financial statements.
COUNTRY Mutual Funds — Schedule of Investments June 30, 2009

12
COUNTRY Bond Fund
Shares Value_______ _________INVESTMENT COMPANIES — 0.27%iShares High Yield Corporate Bond Fund . . . . . 3,000 $ 239,130SPDR Barclays Capital
High Yield Bond Fund . . . . . . . . . . . . . . . . . . 5,000 175,950___________TOTAL INVESTMENT COMPANIES
(Cost $375,798) . . . . . . . . . . . . . . . . . . . . . . . 415,080___________
PrincipalAmount_______
ASSET BACKED SECURITIES — 4.18%AEP Texas Central Transportation
5.170%, 01/01/2020 . . . . . . . . . . . . . . . . . . . $1,000,000 1,025,118Capital Auto Receivables Asset Trust
5.210%, 03/17/2014 . . . . . . . . . . . . . . . . . . . 500,000 512,619Caterpillar Financial Asset Trust
4.940%, 04/25/2014 . . . . . . . . . . . . . . . . . . . 500,000 500,132CIT Equipment Collateral
5.050%, 04/20/2014 . . . . . . . . . . . . . . . . . . . 771,561 776,126Citibank Credit Card Issuance Trust
4.150%, 07/07/2017 . . . . . . . . . . . . . . . . . . . 200,000 191,807Countrywide Asset-Backed Certificates
5.549%, 08/25/2021 . . . . . . . . . . . . . . . . . . . 576,920 415,0235.363%, 03/25/2030 . . . . . . . . . . . . . . . . . . . 338,686 246,1704.931%, 05/25/2032 (b) . . . . . . . . . . . . . . . . 223,266 152,075
FedEx Corp.6.720%, 01/15/2022 . . . . . . . . . . . . . . . . . . . 280,164 288,393
Green Tree Financial Corporation6.870%, 01/15/2029 . . . . . . . . . . . . . . . . . . . 48,642 43,952
Harley-Davidson Motorcycle Trust5.520%, 11/15/2013 . . . . . . . . . . . . . . . . . . . 500,000 513,618
John Deere Owner Trust4.890%, 03/16/2015 . . . . . . . . . . . . . . . . . . . 400,000 393,380
PG&E Energy Recovery Funding LLC4.470%, 12/25/2014 . . . . . . . . . . . . . . . . . . . 400,000 412,356
Residential Asset Securities Corporation4.767%, 10/25/2032 . . . . . . . . . . . . . . . . . . . 593,372 379,1145.600%, 06/25/2034 (b) . . . . . . . . . . . . . . . . 1,000,000 524,168___________
TOTAL ASSET BACKED SECURITIES(Cost $7,299,674) . . . . . . . . . . . . . . . . . . . . . 6,374,051___________
CORPORATE BONDS — 34.71%Abbott Laboratories
5.600%, 05/15/2011 . . . . . . . . . . . . . . . . . . . 400,000 427,3576.150%, 11/30/2037 . . . . . . . . . . . . . . . . . . . 500,000 544,116
ABX Financing Co.5.750%, 10/15/2016 (Acquired 01/22/2009,Cost $203,453 (a)(d) . . . . . . . . . . . . . . . . . . . 225,000 229,891
Alabama Power Co.5.500%, 10/15/2017 . . . . . . . . . . . . . . . . . . . 250,000 264,070
Alcoa, Inc.5.550%, 02/01/2017 . . . . . . . . . . . . . . . . . . . 400,000 337,820
American Express Credit Corp.5.875%, 05/02/2013 . . . . . . . . . . . . . . . . . . . 150,000 148,945
American Express Travel5.250%, 11/21/2011 (Acquired 07/27/2007,Cost $644,556) (a) . . . . . . . . . . . . . . . . . . . . 650,000 646,120
American Honda Finance Corporation6.700%, 10/01/2013 (Acquired 09/24/2008,Cost $499,520) (a) . . . . . . . . . . . . . . . . . . . . 500,000 504,262
American International Group, Inc.5.850%, 01/16/2018 . . . . . . . . . . . . . . . . . . . 500,000 264,524
PrincipalAmount Value_______ _________
Anadarko Petroleum Corp.5.950%, 09/15/2016 . . . . . . . . . . . . . . . . . . . $ 500,000 $ 493,312
ANZ National International Ltd.6.200%, 07/19/2013 (Acquired 07/09/2008,Cost $249,765) (a)(d) . . . . . . . . . . . . . . . . . . 250,000 257,543
Apache Corp.6.900%, 09/15/2018 . . . . . . . . . . . . . . . . . . . 600,000 686,940
Archer-Daniels-Midland Company5.450%, 03/15/2018 . . . . . . . . . . . . . . . . . . . 400,000 420,592
ASIF Global Financing XIX4.900%, 01/17/2013 (Acquired 01/10/2003,Cost $249,218) (a) . . . . . . . . . . . . . . . . . . . . 250,000 212,683
AT&T Inc.5.625%, 06/15/2016 . . . . . . . . . . . . . . . . . . . 500,000 514,5495.500%, 02/01/2018 . . . . . . . . . . . . . . . . . . . 500,000 499,268
Baker Hughes, Inc.6.500%, 11/15/2013 . . . . . . . . . . . . . . . . . . . 250,000 277,286
Baltimore Gas and Electric Company6.730%, 06/12/2012 . . . . . . . . . . . . . . . . . . . 650,000 684,349
Bank of America Corporation5.300%, 03/15/2017 . . . . . . . . . . . . . . . . . . . 1,000,000 848,4476.975%, 03/07/2037 . . . . . . . . . . . . . . . . . . . 250,000 249,953
The Bank of New York Mellon Corporation4.500%, 04/01/2013 . . . . . . . . . . . . . . . . . . . 200,000 203,526
BHP Billiton Finance5.125%, 03/29/2012 (d) . . . . . . . . . . . . . . . . 500,000 525,196
BP America Leasing, Inc.5.523%, 05/08/2019 (Acquired 05/28/2009,Cost $489,370) (a) . . . . . . . . . . . . . . . . . . . . 500,000 513,279
Burlington Northern Santa Fe5.750%, 03/15/2018 . . . . . . . . . . . . . . . . . . . 500,000 511,6195.720%, 01/15/2024 . . . . . . . . . . . . . . . . . . . 391,042 400,873
Burlington Resources, Inc.6.875%, 02/15/2026 . . . . . . . . . . . . . . . . . . . 250,000 247,902
Canadian Pacific Railroad Company5.750%, 05/15/2013 (d) . . . . . . . . . . . . . . . . 300,000 300,920
Caterpillar Financial Services Corp.7.050%, 10/01/2018 . . . . . . . . . . . . . . . . . . . 250,000 263,426
Caterpillar Inc.5.700%, 08/15/2016 . . . . . . . . . . . . . . . . . . . 500,000 508,527
Central Illinois Public Service Co.7.610%, 06/01/2017 . . . . . . . . . . . . . . . . . . . 300,000 293,012
Cisco Systems Inc5.250%, 02/22/2011 . . . . . . . . . . . . . . . . . . . 500,000 527,220
Citigroup, Inc.5.250%, 02/27/2012 . . . . . . . . . . . . . . . . . . . 1,000,000 976,5005.500%, 08/27/2012 . . . . . . . . . . . . . . . . . . . 250,000 242,2565.850%, 09/15/2016 . . . . . . . . . . . . . . . . . . . 250,000 141,138
Clorox Company5.950%, 10/15/2017 . . . . . . . . . . . . . . . . . . . 200,000 203,902
Coca Cola Enterprises, Inc.7.375%, 03/03/2014 . . . . . . . . . . . . . . . . . . . 400,000 457,560
Comcast Corporation6.500%, 01/15/2017 . . . . . . . . . . . . . . . . . . . 750,000 795,647
Commonwealth Edison Co.5.950%, 08/15/2016 . . . . . . . . . . . . . . . . . . . 400,000 415,903
ConocoPhillips6.650%, 07/15/2018 . . . . . . . . . . . . . . . . . . . 600,000 661,117
Credit Suisse New York5.000%, 05/15/2013 . . . . . . . . . . . . . . . . . . . 400,000 408,929
The accompanying notes are an integral part of these financial statements.
COUNTRY Mutual Funds — Schedule of Investments June 30, 2009

13
COUNTRY Bond Fund (continued)PrincipalAmount Value_______ _________
CSX Transportation, Inc.6.420%, 06/15/2010 . . . . . . . . . . . . . . . . . . . $ 250,000 $ 250,8456.500%, 04/15/2014 . . . . . . . . . . . . . . . . . . . 600,000 574,899
Devon Energy Corp.6.300%, 01/15/2019 . . . . . . . . . . . . . . . . . . . 400,000 427,448
Diamond Offshore Drilling Inc.5.875%, 05/01/2019 . . . . . . . . . . . . . . . . . . . 500,000 509,480
Duke Energy Carolinas LLC5.750%, 11/15/2013 . . . . . . . . . . . . . . . . . . . 400,000 430,072
E. I. Du Pont De Nemours5.250%, 12/15/2016 . . . . . . . . . . . . . . . . . . . 250,000 260,238
Eaton Corp.8.875%, 06/15/2019 . . . . . . . . . . . . . . . . . . . 300,000 353,006
Ecolab, Inc.4.875%, 02/15/2015 . . . . . . . . . . . . . . . . . . . 450,000 444,848
EOG Resources, Inc.5.625%, 06/01/2019 . . . . . . . . . . . . . . . . . . . 300,000 313,987
Florida Power Corporation4.800%, 03/01/2013 . . . . . . . . . . . . . . . . . . . 300,000 311,082
General Electric Capital Corporation5.625%, 05/01/2018 . . . . . . . . . . . . . . . . . . . 500,000 472,8925.000%, 06/27/2018 (b) . . . . . . . . . . . . . . . . 356,000 342,123
General Electric Company5.000%, 02/01/2013 . . . . . . . . . . . . . . . . . . . 300,000 312,155
General Mills, Inc.5.700%, 02/15/2017 . . . . . . . . . . . . . . . . . . . 225,000 236,847
General Motors Corporation8.375%, 07/15/2033 (e) . . . . . . . . . . . . . . . . 300,000 38,250
Georgia Power Company5.700%, 06/01/2017 . . . . . . . . . . . . . . . . . . . 500,000 535,355
GlaxoSmithKline Capital Inc.4.850%, 05/15/2013 . . . . . . . . . . . . . . . . . . . 500,000 523,022
Goldman Sachs Group, Inc.6.250%, 09/01/2017 . . . . . . . . . . . . . . . . . . . 400,000 395,771
Halliburton Company6.750%, 02/01/2027 . . . . . . . . . . . . . . . . . . . 100,000 100,198
Harley-Davidson Funding5.250%, 12/15/2012 (Acquired 12/05/2007,Cost $199,772) (a) . . . . . . . . . . . . . . . . . . . . 200,000 187,374
Home Depot, Inc.5.250%, 12/16/2013 . . . . . . . . . . . . . . . . . . . 500,000 513,724
Honeywell International, Inc.4.250%, 03/01/2013 . . . . . . . . . . . . . . . . . . . 400,000 415,384
HSBC Holdings6.800%, 06/01/2038 (d) . . . . . . . . . . . . . . . . 500,000 502,482
IBM Corp.7.625%, 10/15/2018 . . . . . . . . . . . . . . . . . . . 250,000 298,819
Ingersoll-Rand Co.6.015%, 02/15/2028 (d) . . . . . . . . . . . . . . . . 500,000 506,736
John Deere Capital Corporation4.950%, 12/17/2012 . . . . . . . . . . . . . . . . . . . 200,000 206,097
JP Morgan Chase & Co.5.375%, 10/01/2012 . . . . . . . . . . . . . . . . . . . 750,000 785,4567.900%, 04/30/2049 (b) . . . . . . . . . . . . . . . . 200,000 175,020
Kellogg Co.5.125%, 12/03/2012 . . . . . . . . . . . . . . . . . . . 500,000 534,483
Keycorp6.500%, 05/14/2013 . . . . . . . . . . . . . . . . . . . 200,000 199,264
Kimberly Clark Corp.6.125%, 08/01/2017 . . . . . . . . . . . . . . . . . . . 500,000 548,427
PrincipalAmount Value_______ _________
Kraft Foods, Inc.6.750%, 02/19/2014 . . . . . . . . . . . . . . . . . . . $ 350,000 $ 383,8706.125%, 02/01/2018 . . . . . . . . . . . . . . . . . . . 300,000 310,177
Lowe’s Companies, Inc.6.650%, 09/15/2037 . . . . . . . . . . . . . . . . . . . 500,000 545,323
Marshall & Ilsley Bank2.900%, 08/18/2009 . . . . . . . . . . . . . . . . . . . 27,273 27,271
McKesson Corp.7.500%, 02/15/2019 . . . . . . . . . . . . . . . . . . . 400,000 450,460
Merck & Co. Inc.5.760%, 05/03/2037 . . . . . . . . . . . . . . . . . . . 200,000 209,767
Merrill Lynch Co. Inc.6.050%, 08/15/2012 . . . . . . . . . . . . . . . . . . . 300,000 300,7935.450%, 02/05/2013 . . . . . . . . . . . . . . . . . . . 500,000 486,649
Morgan Stanley5.750%, 08/31/2012 . . . . . . . . . . . . . . . . . . . 200,000 206,6445.450%, 01/09/2017 . . . . . . . . . . . . . . . . . . . 300,000 280,135
National City Corp.4.900%, 01/15/2015 . . . . . . . . . . . . . . . . . . . 175,000 165,954
National Rural Utilities Collective Trust10.375%, 11/01/2018 . . . . . . . . . . . . . . . . . . 300,000 376,147
New York Life Global Funding4.650%, 05/09/2013 (Acquired 05/02/2008,Cost $998,282) (a) . . . . . . . . . . . . . . . . . . . . 1,000,000 1,014,311
New Valley Generation IV4.687%, 01/15/2022 . . . . . . . . . . . . . . . . . . . 287,297 275,888
Nokia Corp.5.375%, 05/15/2019 (d) . . . . . . . . . . . . . . . . 250,000 252,934
Northern States Power Co.8.000%, 08/28/2012 . . . . . . . . . . . . . . . . . . . 500,000 575,850
Oracle Corp.6.500%, 04/15/2038 . . . . . . . . . . . . . . . . . . . 300,000 319,544
Overseas Private Investment Company3.420%, 01/15/2015 . . . . . . . . . . . . . . . . . . . 212,625 220,575
Pepperdine University5.450%, 08/01/2019 . . . . . . . . . . . . . . . . . . . 250,000 258,805
PepsiAmericas, Inc.4.875%, 01/15/2015 . . . . . . . . . . . . . . . . . . . 500,000 475,147
Perforadora Centrale5.240%, 12/15/2018 (d) . . . . . . . . . . . . . . . . 253,377 265,711
Pfizer, Inc.5.350%, 03/15/2015 . . . . . . . . . . . . . . . . . . . 350,000 376,110
Pitney Bowes Inc.5.250%, 01/15/2037 . . . . . . . . . . . . . . . . . . . 250,000 249,964
Private Export Funding5.685%, 05/15/2012 . . . . . . . . . . . . . . . . . . . 250,000 276,620
Regions Bank7.500%, 05/15/2018 . . . . . . . . . . . . . . . . . . . 200,000 176,256
Rio Tinto Financial5.875%, 07/15/2013 (d) . . . . . . . . . . . . . . . . 450,000 452,820
Rowan Companies, Inc.5.880%, 03/15/2012 . . . . . . . . . . . . . . . . . . . 423,000 440,939
Shell International Finance5.625%, 06/27/2011 (d) . . . . . . . . . . . . . . . . 500,000 537,742
Simon Property Group LP5.750%, 12/01/2015 . . . . . . . . . . . . . . . . . . . 300,000 276,295
SLM Inc.8.450%, 06/15/2018 . . . . . . . . . . . . . . . . . . . 200,000 171,097
Southern California Edison5.750%, 03/15/2014 . . . . . . . . . . . . . . . . . . . 400,000 433,957
The accompanying notes are an integral part of these financial statements.
COUNTRY Mutual Funds — Schedule of Investments June 30, 2009

14
COUNTRY Bond Fund (continued)PrincipalAmount Value_______ _________
Stanford University4.750%, 05/01/2019 . . . . . . . . . . . . . . . . . . . $ 400,000 $ 403,100
Staples, Inc.9.750%, 01/15/2014 . . . . . . . . . . . . . . . . . . . 250,000 279,233
State Street Corporation5.375%, 04/30/2017 . . . . . . . . . . . . . . . . . . . 400,000 384,708
StatoilHydro ASA5.250%, 04/15/2019 (d) . . . . . . . . . . . . . . . . 400,000 411,648
Suncor Energy, Inc.6.100%, 06/01/2018 (d) . . . . . . . . . . . . . . . . 500,000 502,657
SunTrust Banks, Inc.6.000%, 09/11/2017 . . . . . . . . . . . . . . . . . . . 200,000 181,070
Target Corporation5.875%, 07/15/2016 . . . . . . . . . . . . . . . . . . . 750,000 811,943
Time Warner Cable, Inc.8.750%, 02/14/2019 . . . . . . . . . . . . . . . . . . . 200,000 232,988
Time Warner, Inc.6.875%, 05/01/2012 . . . . . . . . . . . . . . . . . . . 500,000 534,872
Transocean, Inc.5.250%, 03/15/2013 (d) . . . . . . . . . . . . . . . . 300,000 311,0867.500%, 04/15/2031 (d) . . . . . . . . . . . . . . . . 160,000 177,280
U.S. Central Credit Union2.700%, 09/30/2009 . . . . . . . . . . . . . . . . . . . 45,455 44,576
U.S. Trade Funding Corp.4.260%, 11/15/2014 (Acquired 12/14/2004,Cost $192,874) (a) . . . . . . . . . . . . . . . . . . . . 193,782 203,324
Union Pacific Railroad Company6.630%, 01/27/2022 . . . . . . . . . . . . . . . . . . . 350,741 367,4715.866%, 07/02/2030 . . . . . . . . . . . . . . . . . . . 487,690 442,228
United Parcel Service, Inc.4.500%, 01/15/2013 . . . . . . . . . . . . . . . . . . . 800,000 838,978
United Technologies Corp.5.375%, 12/15/2017 . . . . . . . . . . . . . . . . . . . 600,000 635,420
University Of Notre Dame4.141%, 09/01/2013 . . . . . . . . . . . . . . . . . . . 250,000 250,000
Verizon Communications Inc.5.500%, 02/15/2018 . . . . . . . . . . . . . . . . . . . 400,000 397,244
Vessel Management Services Inc.4.960%, 11/15/2027 . . . . . . . . . . . . . . . . . . . 296,000 298,631
Viacom, Inc.5.750%, 04/30/2011 (Acquired 04/05/2006,Cost $496,980) (a) . . . . . . . . . . . . . . . . . . . . 500,000 514,171
Virginia Electric & Power Co.4.500%, 12/15/2010 . . . . . . . . . . . . . . . . . . . 500,000 512,128
Wachovia Corp.5.750%, 06/15/2017 . . . . . . . . . . . . . . . . . . . 500,000 493,280
Wal-Mart Stores, Inc.4.125%, 02/15/2011 . . . . . . . . . . . . . . . . . . . 1,074,000 1,114,5946.200%, 04/15/2038 . . . . . . . . . . . . . . . . . . . 400,000 429,864
Walt Disney Company4.700%, 12/01/2012 . . . . . . . . . . . . . . . . . . . 500,000 537,226
Well Fargo Capital X5.950%, 12/01/2036 . . . . . . . . . . . . . . . . . . . 200,000 148,000
Wells Fargo Company4.875%, 01/12/2011 . . . . . . . . . . . . . . . . . . . 800,000 823,6595.625%, 12/11/2017 . . . . . . . . . . . . . . . . . . . 500,000 492,167
William Wrigley Junior Co.4.650%, 07/15/2015 . . . . . . . . . . . . . . . . . . . 225,000 198,563
XTO Energy, Inc.4.625%, 06/15/2013 . . . . . . . . . . . . . . . . . . . 400,000 401,417___________
TOTAL CORPORATE BONDS(Cost $50,965,630) . . . . . . . . . . . . . . . . . . . . 52,983,544___________
PrincipalAmount Value_______ _________
MORTGAGE BACKED SECURITIES — 36.64%American Tower Trust
5.420%, 04/15/2037 (Acquired 05/01/2007,Cost $500,000) (a) . . . . . . . . . . . . . . . . . . . . $ 500,000 $ 455,000
Bank of America Commercial Mortgage Inc.7.333%, 11/15/2031 . . . . . . . . . . . . . . . . . . . 532,971 534,673
Bank of America Mortgage Securities5.250%, 10/25/2020 . . . . . . . . . . . . . . . . . . . 485,582 452,965
Chase Funding Mortgage Loan4.515%, 02/25/2014 . . . . . . . . . . . . . . . . . . . 254,579 239,275
Chase Mortgage Finance Corporation5.500%, 11/25/2035 . . . . . . . . . . . . . . . . . . . 348,467 325,215
Citicorp Mortgage Securities, Inc.5.000%, 08/25/2020 . . . . . . . . . . . . . . . . . . . 372,118 347,8146.000%, 11/25/2036 . . . . . . . . . . . . . . . . . . . 400,000 286,598
Countrywide Alternative Loan Trust6.000%, 05/25/2033 . . . . . . . . . . . . . . . . . . . 482,468 418,6025.500%, 05/25/2036 . . . . . . . . . . . . . . . . . . . 500,000 231,172
CS First Boston MortgageSecurities Corporation4.980%, 02/25/2032 . . . . . . . . . . . . . . . . . . . 700,000 576,4697.290%, 09/15/2041 . . . . . . . . . . . . . . . . . . . 53,237 53,314
Deutsche Alternative Mortgage Securities, Inc.5.500%, 02/25/2036 . . . . . . . . . . . . . . . . . . . 90,873 83,535
Deutsche Mortgage Securities, Inc.5.127%, 06/26/2035 (Acquired 09/22/2005,Cost $127,913) (a)(b) . . . . . . . . . . . . . . . . . . 127,974 122,254
Federal Home Loan Mortgage Corp.7.000%, 03/01/2012 . . . . . . . . . . . . . . . . . . . 41,795 43,7754.500%, 05/01/2013 . . . . . . . . . . . . . . . . . . . 260,178 266,8475.125%, 12/15/2013 . . . . . . . . . . . . . . . . . . . 196,197 202,4265.500%, 10/01/2014 . . . . . . . . . . . . . . . . . . . 48,580 51,1355.000%, 03/01/2015 . . . . . . . . . . . . . . . . . . . 165,324 171,2976.500%, 03/01/2015 . . . . . . . . . . . . . . . . . . . 105,272 111,6925.000%, 12/15/2017 . . . . . . . . . . . . . . . . . . . 750,000 796,9585.000%, 11/15/2018 . . . . . . . . . . . . . . . . . . . 600,000 636,5805.750%, 12/15/2018 . . . . . . . . . . . . . . . . . . . 285,512 295,1295.000%, 10/01/2020 . . . . . . . . . . . . . . . . . . . 294,646 306,5985.500%, 03/01/2022 . . . . . . . . . . . . . . . . . . . 1,811,032 1,899,7735.000%, 03/01/2023 . . . . . . . . . . . . . . . . . . . 795,771 823,9024.500%, 04/01/2023 . . . . . . . . . . . . . . . . . . . 440,385 444,6754.500%, 11/15/2023 . . . . . . . . . . . . . . . . . . . 1,000,000 1,013,8995.500%, 10/15/2025 . . . . . . . . . . . . . . . . . . . 500,000 516,5217.150%, 09/25/2028 (b) . . . . . . . . . . . . . . . . 290,248 289,8096.500%, 10/01/2029 . . . . . . . . . . . . . . . . . . . 154,596 166,1935.000%, 10/15/2031 . . . . . . . . . . . . . . . . . . . 400,000 413,7385.311%, 02/01/2037 (b) . . . . . . . . . . . . . . . . 597,677 623,1716.000%, 05/01/2037 . . . . . . . . . . . . . . . . . . . 1,632,721 1,705,9716.000%, 08/01/2037 . . . . . . . . . . . . . . . . . . . 1,486,751 1,553,4516.000%, 01/01/2038 . . . . . . . . . . . . . . . . . . . 1,502,835 1,570,258
Federal National Mortgage Association5.000%, 03/01/2010 . . . . . . . . . . . . . . . . . . . 58,443 60,0664.750%, 02/21/2013 . . . . . . . . . . . . . . . . . . . 300,000 322,5295.000%, 03/01/2013 . . . . . . . . . . . . . . . . . . . 75,382 77,6274.500%, 04/01/2013 . . . . . . . . . . . . . . . . . . . 88,378 90,5595.000%, 04/01/2013 . . . . . . . . . . . . . . . . . . . 65,594 67,5725.000%, 05/01/2013 . . . . . . . . . . . . . . . . . . . 122,396 126,1315.500%, 06/01/2013 . . . . . . . . . . . . . . . . . . . 62,028 64,2904.700%, 06/25/2013 . . . . . . . . . . . . . . . . . . . 151,381 156,9683.500%, 09/01/2013 . . . . . . . . . . . . . . . . . . . 267,330 269,3234.500%, 09/01/2013 . . . . . . . . . . . . . . . . . . . 116,773 119,7395.500%, 10/01/2013 . . . . . . . . . . . . . . . . . . . 147,740 153,558
The accompanying notes are an integral part of these financial statements.
COUNTRY Mutual Funds — Schedule of Investments June 30, 2009

15
COUNTRY Bond Fund (continued)PrincipalAmount Value_______ _________
Federal National Mortgage Association (continued)5.000%, 02/01/2014 . . . . . . . . . . . . . . . . . . . $ 393,726 $ 406,7814.000%, 05/01/2015 . . . . . . . . . . . . . . . . . . . 585,901 593,0246.000%, 06/25/2016 . . . . . . . . . . . . . . . . . . . 268,818 279,3184.500%, 06/25/2018 . . . . . . . . . . . . . . . . . . . 1,250,000 1,310,8074.500%, 01/01/2019 . . . . . . . . . . . . . . . . . . . 589,431 611,5106.500%, 05/01/2019 . . . . . . . . . . . . . . . . . . . 68,503 72,5424.472%, 01/01/2020 (b) . . . . . . . . . . . . . . . . 171,583 175,5114.500%, 04/01/2020 . . . . . . . . . . . . . . . . . . . 536,105 552,8365.500%, 04/25/2023 . . . . . . . . . . . . . . . . . . . 500,000 514,0535.000%, 05/01/2023 . . . . . . . . . . . . . . . . . . . 2,300,681 2,384,1675.500%, 09/01/2025 . . . . . . . . . . . . . . . . . . . 383,286 398,5075.500%, 02/01/2033 . . . . . . . . . . . . . . . . . . . 212,944 221,1605.500%, 07/01/2033 . . . . . . . . . . . . . . . . . . . 688,114 714,0195.290%, 11/25/2033 . . . . . . . . . . . . . . . . . . . 992,297 1,034,1604.124%, 05/01/2034 (b) . . . . . . . . . . . . . . . . 152,474 155,2665.500%, 07/01/2035 . . . . . . . . . . . . . . . . . . . 930,884 964,4745.500%, 12/01/2035 . . . . . . . . . . . . . . . . . . . 349,988 362,6175.000%, 06/01/2038 . . . . . . . . . . . . . . . . . . . 1,599,199 1,630,7815.500%, 07/01/2038 . . . . . . . . . . . . . . . . . . . 1,598,641 1,652,4896.500%, 02/25/2044 . . . . . . . . . . . . . . . . . . . 246,942 254,9296.500%, 05/25/2044 . . . . . . . . . . . . . . . . . . . 288,269 309,844
GE Capital Commercial Mortgage Corporation6.531%, 05/15/2033 . . . . . . . . . . . . . . . . . . . 500,000 514,5704.706%, 05/10/2043 . . . . . . . . . . . . . . . . . . . 916,031 901,010
Government National Mortgage Association4.500%, 05/20/2014 . . . . . . . . . . . . . . . . . . . 201,015 207,9704.140%, 03/16/2018 . . . . . . . . . . . . . . . . . . . 73,003 73,0044.116%, 03/16/2019 . . . . . . . . . . . . . . . . . . . 444,809 449,0304.031%, 01/16/2021 . . . . . . . . . . . . . . . . . . . 951,422 966,8956.500%, 04/15/2026 . . . . . . . . . . . . . . . . . . . 78,544 84,3278.000%, 07/15/2026 . . . . . . . . . . . . . . . . . . . 38,458 42,4224.130%, 02/16/2027 . . . . . . . . . . . . . . . . . . . 371,326 376,8373.727%, 03/16/2027 . . . . . . . . . . . . . . . . . . . 802,086 815,7196.500%, 07/15/2029 . . . . . . . . . . . . . . . . . . . 47,556 51,3337.500%, 11/15/2029 . . . . . . . . . . . . . . . . . . . 47,728 52,3916.000%, 06/15/2031 . . . . . . . . . . . . . . . . . . . 451,638 475,1206.000%, 02/15/2032 . . . . . . . . . . . . . . . . . . . 73,323 77,0675.000%, 01/15/2033 . . . . . . . . . . . . . . . . . . . 975,940 1,001,4063.998%, 10/16/2033 . . . . . . . . . . . . . . . . . . . 1,219,732 1,242,3164.920%, 05/16/2034 . . . . . . . . . . . . . . . . . . . 600,000 622,9656.000%, 10/15/2036 . . . . . . . . . . . . . . . . . . . 582,179 606,1895.000%, 01/15/2038 . . . . . . . . . . . . . . . . . . . 2,208,854 2,256,8285.500%, 01/15/2038 . . . . . . . . . . . . . . . . . . . 2,322,727 2,402,7526.000%, 01/15/2038 . . . . . . . . . . . . . . . . . . . 1,328,533 1,385,567
Heller Financial Commercial Mortgage7.750%, 01/15/2034 . . . . . . . . . . . . . . . . . . . 193,921 194,609
JP Morgan CommercialMortgage Finance Corp.5.050%, 12/12/2034 . . . . . . . . . . . . . . . . . . . 300,000 284,722
LB-UBS Commercial Mortgage Trust6.058%, 06/15/2020 . . . . . . . . . . . . . . . . . . . 47,167 47,7614.799%, 12/15/2029 . . . . . . . . . . . . . . . . . . . 1,000,000 737,801
Master Adjustable Rate Mortgages Trust4.362%, 04/21/2034 (b) . . . . . . . . . . . . . . . . 207,256 181,308
Master Alternative Loan Trust5.000%, 06/25/2015 . . . . . . . . . . . . . . . . . . . 174,407 136,855
Mortgage IT Trust4.250%, 02/25/2035 . . . . . . . . . . . . . . . . . . . 458,390 346,334
PrincipalAmount Value_______ _________
Nomura Asset Acceptance Corporation6.500%, 03/25/2034 (Acquired 01/20/2004,Cost $83,535) (a) . . . . . . . . . . . . . . . . . . . . . $ 79,790 $ 67,5566.500%, 10/25/2034 (Acquired 08/18/2004,Cost $302,371) (a) . . . . . . . . . . . . . . . . . . . . 291,270 242,644
Residential Asset Securitization Trust4.750%, 02/25/2019 . . . . . . . . . . . . . . . . . . . 282,364 278,040
Small Business AdministrationCombination Trust5.314%, 11/15/2036 (Acquired 10/30/2006,Cost $999,961) (a) . . . . . . . . . . . . . . . . . . . . 1,000,000 935,000
Small Business AdministrationParticipation Certificates3.530%, 05/01/2013 . . . . . . . . . . . . . . . . . . . 171,477 174,6035.080%, 11/01/2022 . . . . . . . . . . . . . . . . . . . 312,971 327,2074.640%, 05/01/2023 . . . . . . . . . . . . . . . . . . . 401,363 413,5365.570%, 03/01/2026 . . . . . . . . . . . . . . . . . . . 314,932 336,017
Structured Asset Securities Corporation6.290%, 11/25/2032 (b) . . . . . . . . . . . . . . . . 92,255 34,628
Vendee Mortgage Trust5.750%, 11/15/2032 . . . . . . . . . . . . . . . . . . . 200,000 176,633
Wachovia Bank Commercial Mortgage Trust5.426%, 07/15/2041 (b) . . . . . . . . . . . . . . . . 250,000 223,6575.509%, 04/15/2047 . . . . . . . . . . . . . . . . . . . 500,000 331,626
Washington Mutual4.522%, 01/25/2033 (b) . . . . . . . . . . . . . . . . 48,839 39,6674.823%, 10/25/2035 (b) . . . . . . . . . . . . . . . . 260,785 203,014
Wells Fargo Mortgage Backed Securities Trust5.500%, 02/25/2018 . . . . . . . . . . . . . . . . . . . 353,628 352,4134.441%, 10/25/2033 . . . . . . . . . . . . . . . . . . . 557,504 516,8625.594%, 07/25/2036 . . . . . . . . . . . . . . . . . . . 883,976 597,019___________
TOTAL MORTGAGE BACKED SECURITIES(Cost $56,026,538) . . . . . . . . . . . . . . . . . . . . 55,923,071___________
MUNICIPAL BONDS — 6.61%California State Unlimited General Obligation
7.500%, 04/01/2034 . . . . . . . . . . . . . . . . . . . 500,000 459,615Florida State Turnpike Revenue Bond
6.140%, 07/01/2025 . . . . . . . . . . . . . . . . . . . 300,000 299,697Georgia State Unlimited General Obligation
5.000%, 07/01/2019 . . . . . . . . . . . . . . . . . . . 1,000,000 1,096,450Illinois State Unlimited General Obligation
5.375%, 04/01/2016 . . . . . . . . . . . . . . . . . . . 1,000,000 1,119,820Kentucky State Property & Buildings
Community Revenue Bond5.100%, 10/01/2015 . . . . . . . . . . . . . . . . . . . 500,000 469,700
Maryland State Unlimited General Obligation5.000%, 08/01/2018 . . . . . . . . . . . . . . . . . . . 615,000 660,633
Massachusetts StateUnlimited General Obligation5.000%, 09/01/2032 . . . . . . . . . . . . . . . . . . . 400,000 406,444
Metropolitan Transit AuthorityNew York Revenue Bond7.336%, 11/15/2039 . . . . . . . . . . . . . . . . . . . 400,000 475,516
Minnesota Highway & VariablePurpose General Obligation5.000%, 08/01/2020 . . . . . . . . . . . . . . . . . . . 1,000,000 1,109,800
New York State UrbanDevelopment Revenue Bond6.500%, 12/15/2018 . . . . . . . . . . . . . . . . . . . 300,000 331,671
The accompanying notes are an integral part of these financial statements.
COUNTRY Mutual Funds — Schedule of Investments June 30, 2009

16
COUNTRY Bond Fund (continued)PrincipalAmount Value_______ _________
Northern California TransmissionAgency Revenue Bond5.880%, 05/01/2016 . . . . . . . . . . . . . . . . . . . $ 500,000 $ 510,575
Ohana Military Commercial LLC Notes5.675%, 10/01/2026 . . . . . . . . . . . . . . . . . . . 1,000,000 888,950
South Carolina State Public ServiceAuthority Revenue Bond6.224%, 01/01/2029 . . . . . . . . . . . . . . . . . . . 300,000 303,267
South Carolina University Revenue Bond3.000%, 11/01/2019 . . . . . . . . . . . . . . . . . . . 400,000 380,292
University of Michigan Revenue Bond6.172%, 04/01/2030 . . . . . . . . . . . . . . . . . . . 400,000 407,048
University of Texas Revenue Bond6.276%, 08/15/2041 . . . . . . . . . . . . . . . . . . . 500,000 521,260
University of Washington Revenue Bond6.060%, 07/01/2039 . . . . . . . . . . . . . . . . . . . 400,000 404,436
Utah Transit Authority Revenue Bond5.937%, 06/15/2039 . . . . . . . . . . . . . . . . . . . 250,000 247,890___________
TOTAL MUNICIPAL BONDS(Cost $9,865,118) . . . . . . . . . . . . . . . . . . . . . 10,093,064___________
U.S. GOVERNMENT AGENCY ISSUES — 0.65% (c)Federal Home Loan Bank
4.840%, 01/25/2012 . . . . . . . . . . . . . . . . . . . 446,373 459,3814.720%, 09/20/2012 . . . . . . . . . . . . . . . . . . . 324,876 340,3195.000%, 06/26/2018 (b) . . . . . . . . . . . . . . . . 200,000 201,506___________
TOTAL U.S. GOVERNMENT AGENCY ISSUES(Cost $961,292) . . . . . . . . . . . . . . . . . . . . . . . 1,001,206___________
U.S. TREASURY OBLIGATIONS — 7.05%U.S. Treasury Bonds — 2.73%
5.375%, 02/15/2031 . . . . . . . . . . . . . . . . . . . 1,000,000 1,147,8124.500%, 02/15/2036 . . . . . . . . . . . . . . . . . . . 1,000,000 1,030,1564.375%, 02/15/2038 . . . . . . . . . . . . . . . . . . . 500,000 504,9224.250%, 05/15/2039 1,500,000 1,484,760___________
4,167,650___________U.S. Treasury Inflation Index Bond — 0.93%
1.750%, 01/15/2028 . . . . . . . . . . . . . . . . . . . 1,501,358 1,416,907___________U.S. Treasury Inflation Index Notes — 3.39%
3.000%, 07/15/2012 . . . . . . . . . . . . . . . . . . . 1,423,176 1,507,6771.875%, 07/15/2013 . . . . . . . . . . . . . . . . . . . 348,309 357,2352.000%, 01/15/2014 . . . . . . . . . . . . . . . . . . . 403,921 413,1352.625%, 04/30/2016 . . . . . . . . . . . . . . . . . . . 1,000,000 966,8753.125%, 05/15/2019 . . . . . . . . . . . . . . . . . . . 2,000,000 1,934,380___________
5,179,302___________TOTAL U.S. TREASURY OBLIGATIONS
(Cost $10,353,760) . . . . . . . . . . . . . . . . . . . . 10,763,859___________
PrincipalAmount Value_______ _________
SHORT-TERM INVESTMENTS — 9.16%Commercial Paper — 1.41%American Express Company . . . . . . . . . . . . . . $ 500,000 $ 499,809Chevron Corp. . . . . . . . . . . . . . . . . . . . . . . . . . 300,000 299,953General Electric Company . . . . . . . . . . . . . . . . 350,000 349,970Household Finance Corp. . . . . . . . . . . . . . . . . . 250,000 249,981Prudential Funding Corp. . . . . . . . . . . . . . . . . . 250,000 249,924Toyota Motor Corp. . . . . . . . . . . . . . . . . . . . . . 500,000 499,984___________
2,149,621___________
Shares_______Money Market Funds — 7.75%Federated Prime Obligations Fund . . . . . . . . . . 6,830,919 6,830,919Virtus Insight Money Market Fund . . . . . . . . . . 5,000,000 5,000,000___________
11,830,919___________TOTAL SHORT-TERM INVESTMENTS
(Cost $13,980,540) . . . . . . . . . . . . . . . . . . . . 13,980,540___________TOTAL INVESTMENTS — 99.27%
(Cost $149,828,350) . . . . . . . . . . . . . . . . . . . 151,534,415OTHER ASSETS IN EXCESSOF LIABILITIES — 0.73% . . . . . . . . . . . . . . . 1,107,299___________
TOTAL NET ASSETS — 100.00% . . . . . . . . . . $152,641,714______________________
Percentages are stated as a percent of net assets.(a) Security exempt from registration under Rule 144A of the Securities Act of
1933. These securities may be resold in transactions exempt fromregistration normally to qualified institutional buyers. As of June 30, 2009these securities represented 4.00% of total net assets.
(b) The coupon rate shown on variable rate securities represents the rates atJune 30, 2009.
(c) The obligations of certain U.S. Government-Sponsored entities are neitherissued nor guaranteed by the United States Treasury.
(d) Foreign issuer.(e) Default or other conditions exist and security is not presently accruing
income.
The accompanying notes are an integral part of these financial statements.
COUNTRY Mutual Funds — Schedule of Investments June 30, 2009

17
COUNTRY COUNTRYGrowth BondFund Fund____________ ___________
Assets:
Investments in securities:
At cost . . . . . . . . . . . . . . . . . . . . . . . . . . . . . . . . . . . . . . . . . . . . . . . . . . . . . . . . . . . . . . . . . . . . . . . . . . . . . . . . . . . . . . $154,426,285 $149,828,350___________ ______________________ ___________
At value . . . . . . . . . . . . . . . . . . . . . . . . . . . . . . . . . . . . . . . . . . . . . . . . . . . . . . . . . . . . . . . . . . . . . . . . . . . . . . . . . . . . . $158,909,134 $151,534,415
Cash . . . . . . . . . . . . . . . . . . . . . . . . . . . . . . . . . . . . . . . . . . . . . . . . . . . . . . . . . . . . . . . . . . . . . . . . . . . . . . . . . . . . . . . . . . — 278,850
Receivable for investments sold . . . . . . . . . . . . . . . . . . . . . . . . . . . . . . . . . . . . . . . . . . . . . . . . . . . . . . . . . . . . . . . . . . . . . 892,043 25,963
Receivable for capital stock sold . . . . . . . . . . . . . . . . . . . . . . . . . . . . . . . . . . . . . . . . . . . . . . . . . . . . . . . . . . . . . . . . . . . . 81,476 201,659
Dividends receivable . . . . . . . . . . . . . . . . . . . . . . . . . . . . . . . . . . . . . . . . . . . . . . . . . . . . . . . . . . . . . . . . . . . . . . . . . . . . . . 131,136 —
Interest receivable . . . . . . . . . . . . . . . . . . . . . . . . . . . . . . . . . . . . . . . . . . . . . . . . . . . . . . . . . . . . . . . . . . . . . . . . . . . . . . . . 3,675 1,320,877
Receivable from Advisor . . . . . . . . . . . . . . . . . . . . . . . . . . . . . . . . . . . . . . . . . . . . . . . . . . . . . . . . . . . . . . . . . . . . . . . . . . . — 17,326
Prepaid expenses and other assets . . . . . . . . . . . . . . . . . . . . . . . . . . . . . . . . . . . . . . . . . . . . . . . . . . . . . . . . . . . . . . . . . . 20,230 11,436___________ ___________
Total assets . . . . . . . . . . . . . . . . . . . . . . . . . . . . . . . . . . . . . . . . . . . . . . . . . . . . . . . . . . . . . . . . . . . . . . . . . . . . . . . . . . 160,037,694 153,390,526___________ ___________
Liabilities:
Payable for investments purchased . . . . . . . . . . . . . . . . . . . . . . . . . . . . . . . . . . . . . . . . . . . . . . . . . . . . . . . . . . . . . . . . . . 1,172,487 300,000
Payable for capital stock redeemed . . . . . . . . . . . . . . . . . . . . . . . . . . . . . . . . . . . . . . . . . . . . . . . . . . . . . . . . . . . . . . . . . . 24,901 186,878
Payable to Advisor . . . . . . . . . . . . . . . . . . . . . . . . . . . . . . . . . . . . . . . . . . . . . . . . . . . . . . . . . . . . . . . . . . . . . . . . . . . . . . . 98,692 61,968
Payable to Custodian . . . . . . . . . . . . . . . . . . . . . . . . . . . . . . . . . . . . . . . . . . . . . . . . . . . . . . . . . . . . . . . . . . . . . . . . . . . . . 7,552 —
Payable to Directors . . . . . . . . . . . . . . . . . . . . . . . . . . . . . . . . . . . . . . . . . . . . . . . . . . . . . . . . . . . . . . . . . . . . . . . . . . . . . . 3,374 3,492
Accrued expenses and other liabilities . . . . . . . . . . . . . . . . . . . . . . . . . . . . . . . . . . . . . . . . . . . . . . . . . . . . . . . . . . . . . . . . 196,164 196,474___________ ___________
Total liabilities . . . . . . . . . . . . . . . . . . . . . . . . . . . . . . . . . . . . . . . . . . . . . . . . . . . . . . . . . . . . . . . . . . . . . . . . . . . . . . . . . 1,503,170 748,812___________ ___________
Net Assets . . . . . . . . . . . . . . . . . . . . . . . . . . . . . . . . . . . . . . . . . . . . . . . . . . . . . . . . . . . . . . . . . . . . . . . . . . . . . . . . . . . . . . . . $158,534,524 $152,641,714___________ ______________________ ___________
Net Assets Consist of:
Paid in capital . . . . . . . . . . . . . . . . . . . . . . . . . . . . . . . . . . . . . . . . . . . . . . . . . . . . . . . . . . . . . . . . . . . . . . . . . . . . . . . . . . . $164,456,141 $149,709,014
Undistributed net investment income . . . . . . . . . . . . . . . . . . . . . . . . . . . . . . . . . . . . . . . . . . . . . . . . . . . . . . . . . . . . . . . . . 905,757 163,072
Accumulated net realized gain (loss) on investments . . . . . . . . . . . . . . . . . . . . . . . . . . . . . . . . . . . . . . . . . . . . . . . . . . . . . (11,310,223) 1,063,563
Net unrealized appreciation on investments . . . . . . . . . . . . . . . . . . . . . . . . . . . . . . . . . . . . . . . . . . . . . . . . . . . . . . . . . . . . 4,482,849 1,706,065___________ ___________
Total — representing net assets applicable to outstanding capital stock . . . . . . . . . . . . . . . . . . . . . . . . . . . . . . . . . . . . $158,534,524 $152,641,714___________ ______________________ ___________
Class Y:
Net assets . . . . . . . . . . . . . . . . . . . . . . . . . . . . . . . . . . . . . . . . . . . . . . . . . . . . . . . . . . . . . . . . . . . . . . . . . . . . . . . . . . . . . . $145,422,682 $146,167,538
Shares outstanding . . . . . . . . . . . . . . . . . . . . . . . . . . . . . . . . . . . . . . . . . . . . . . . . . . . . . . . . . . . . . . . . . . . . . . . . . . . . . . . 8,830,997 14,149,780
Net asset value, redemption price and offering price per share . . . . . . . . . . . . . . . . . . . . . . . . . . . . . . . . . . . . . . . . . . . . . $ 16.47 $ 10.33
Class A:
Net assets . . . . . . . . . . . . . . . . . . . . . . . . . . . . . . . . . . . . . . . . . . . . . . . . . . . . . . . . . . . . . . . . . . . . . . . . . . . . . . . . . . . . . . $ 13,111,842 $ 6,474,176
Shares outstanding . . . . . . . . . . . . . . . . . . . . . . . . . . . . . . . . . . . . . . . . . . . . . . . . . . . . . . . . . . . . . . . . . . . . . . . . . . . . . . . 795,558 621,231
Net asset value and redemption price per share . . . . . . . . . . . . . . . . . . . . . . . . . . . . . . . . . . . . . . . . . . . . . . . . . . . . . . . . . $ 16.48 $ 10.42
Maximum offering price per share . . . . . . . . . . . . . . . . . . . . . . . . . . . . . . . . . . . . . . . . . . . . . . . . . . . . . . . . . . . . . . . . . . . $ 17.44 $ 10.88
The accompanying notes are an integral part of these financial statements.
Statements of Assets and Liabilities June 30, 2009
18
COUNTRY COUNTRYGrowth BondFund Fund____________ ___________
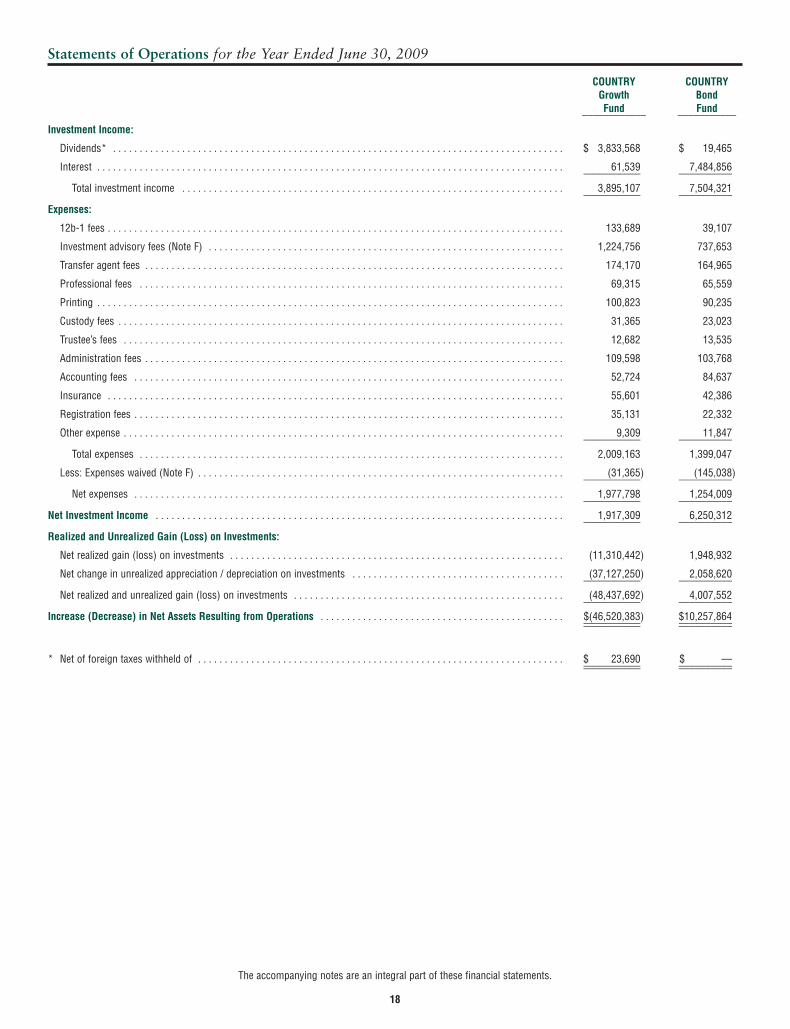
Investment Income:
Dividends* . . . . . . . . . . . . . . . . . . . . . . . . . . . . . . . . . . . . . . . . . . . . . . . . . . . . . . . . . . . . . . . . . . . . . . . . . . . . . . . . . . . . . $ 3,833,568 $ 19,465
Interest . . . . . . . . . . . . . . . . . . . . . . . . . . . . . . . . . . . . . . . . . . . . . . . . . . . . . . . . . . . . . . . . . . . . . . . . . . . . . . . . . . . . . . . . 61,539 7,484,856___________ __________
Total investment income . . . . . . . . . . . . . . . . . . . . . . . . . . . . . . . . . . . . . . . . . . . . . . . . . . . . . . . . . . . . . . . . . . . . . . . . 3,895,107 7,504,321___________ __________
Expenses:
12b-1 fees . . . . . . . . . . . . . . . . . . . . . . . . . . . . . . . . . . . . . . . . . . . . . . . . . . . . . . . . . . . . . . . . . . . . . . . . . . . . . . . . . . . . . . 133,689 39,107
Investment advisory fees (Note F) . . . . . . . . . . . . . . . . . . . . . . . . . . . . . . . . . . . . . . . . . . . . . . . . . . . . . . . . . . . . . . . . . . . 1,224,756 737,653
Transfer agent fees . . . . . . . . . . . . . . . . . . . . . . . . . . . . . . . . . . . . . . . . . . . . . . . . . . . . . . . . . . . . . . . . . . . . . . . . . . . . . . . 174,170 164,965
Professional fees . . . . . . . . . . . . . . . . . . . . . . . . . . . . . . . . . . . . . . . . . . . . . . . . . . . . . . . . . . . . . . . . . . . . . . . . . . . . . . . . 69,315 65,559
Printing . . . . . . . . . . . . . . . . . . . . . . . . . . . . . . . . . . . . . . . . . . . . . . . . . . . . . . . . . . . . . . . . . . . . . . . . . . . . . . . . . . . . . . . . 100,823 90,235
Custody fees . . . . . . . . . . . . . . . . . . . . . . . . . . . . . . . . . . . . . . . . . . . . . . . . . . . . . . . . . . . . . . . . . . . . . . . . . . . . . . . . . . . . 31,365 23,023
Trustee’s fees . . . . . . . . . . . . . . . . . . . . . . . . . . . . . . . . . . . . . . . . . . . . . . . . . . . . . . . . . . . . . . . . . . . . . . . . . . . . . . . . . . . 12,682 13,535
Administration fees . . . . . . . . . . . . . . . . . . . . . . . . . . . . . . . . . . . . . . . . . . . . . . . . . . . . . . . . . . . . . . . . . . . . . . . . . . . . . . . 109,598 103,768
Accounting fees . . . . . . . . . . . . . . . . . . . . . . . . . . . . . . . . . . . . . . . . . . . . . . . . . . . . . . . . . . . . . . . . . . . . . . . . . . . . . . . . . 52,724 84,637
Insurance . . . . . . . . . . . . . . . . . . . . . . . . . . . . . . . . . . . . . . . . . . . . . . . . . . . . . . . . . . . . . . . . . . . . . . . . . . . . . . . . . . . . . . 55,601 42,386
Registration fees . . . . . . . . . . . . . . . . . . . . . . . . . . . . . . . . . . . . . . . . . . . . . . . . . . . . . . . . . . . . . . . . . . . . . . . . . . . . . . . . . 35,131 22,332
Other expense . . . . . . . . . . . . . . . . . . . . . . . . . . . . . . . . . . . . . . . . . . . . . . . . . . . . . . . . . . . . . . . . . . . . . . . . . . . . . . . . . . . 9,309 11,847___________ __________
Total expenses . . . . . . . . . . . . . . . . . . . . . . . . . . . . . . . . . . . . . . . . . . . . . . . . . . . . . . . . . . . . . . . . . . . . . . . . . . . . . . . . 2,009,163 1,399,047
Less: Expenses waived (Note F) . . . . . . . . . . . . . . . . . . . . . . . . . . . . . . . . . . . . . . . . . . . . . . . . . . . . . . . . . . . . . . . . . . . . . (31,365) (145,038)___________ __________
Net expenses . . . . . . . . . . . . . . . . . . . . . . . . . . . . . . . . . . . . . . . . . . . . . . . . . . . . . . . . . . . . . . . . . . . . . . . . . . . . . . . . . 1,977,798 1,254,009___________ __________
Net Investment Income . . . . . . . . . . . . . . . . . . . . . . . . . . . . . . . . . . . . . . . . . . . . . . . . . . . . . . . . . . . . . . . . . . . . . . . . . . . . . 1,917,309 6,250,312___________ __________
Realized and Unrealized Gain (Loss) on Investments:
Net realized gain (loss) on investments . . . . . . . . . . . . . . . . . . . . . . . . . . . . . . . . . . . . . . . . . . . . . . . . . . . . . . . . . . . . . . . (11,310,442) 1,948,932
Net change in unrealized appreciation / depreciation on investments . . . . . . . . . . . . . . . . . . . . . . . . . . . . . . . . . . . . . . . . (37,127,250) 2,058,620___________ __________
Net realized and unrealized gain (loss) on investments . . . . . . . . . . . . . . . . . . . . . . . . . . . . . . . . . . . . . . . . . . . . . . . . . . . (48,437,692) 4,007,552___________ __________
Increase (Decrease) in Net Assets Resulting from Operations . . . . . . . . . . . . . . . . . . . . . . . . . . . . . . . . . . . . . . . . . . . . . . $(46,520,383) $10,257,864___________ _____________________ __________
* Net of foreign taxes withheld of . . . . . . . . . . . . . . . . . . . . . . . . . . . . . . . . . . . . . . . . . . . . . . . . . . . . . . . . . . . . . . . . . . . . . $ 23,690 $ —___________ _____________________ __________
The accompanying notes are an integral part of these financial statements.
Statements of Operations for the Year Ended June 30, 2009

19
COUNTRY Growth Fund COUNTRY Bond Fund___________________________ __________________________Year Ended Year Ended Year Ended Year Ended6/30/09 6/30/08 6/30/09 6/30/08____________ ___________ ____________ ___________
Operations:
Net investment income . . . . . . . . . . . . . . . . . . . . . . . . . . . . . . . . . . . . . . . . . . . . . . . . $ 1,917,309 $ 1,590,337 $ 6,250,312 $ 6,127,596
Net realized gain (loss) on investments . . . . . . . . . . . . . . . . . . . . . . . . . . . . . . . . . . . (11,310,442) 5,713,266 1,948,932 979,006
Net change in unrealized appreciation / depreciation on investments . . . . . . . . . . . . (37,127,250) (27,637,383) 2,058,620 1,873,769___________ ___________ ___________ ___________
Net increase (decrease) in net assets resulting from operations . . . . . . . . . . . . . . . . (46,520,383) (20,333,780) 10,257,864 8,980,371___________ ___________ ___________ ___________
Dividends and Distributions to Shareholders from Class Y (Note B):
Net investment income . . . . . . . . . . . . . . . . . . . . . . . . . . . . . . . . . . . . . . . . . . . . . . . . (1,758,847) (1,306,304) (5,965,184) (5,864,292)
Net realized gains on investments . . . . . . . . . . . . . . . . . . . . . . . . . . . . . . . . . . . . . . . (2,829,312) (16,512,888) (1,266,287) —___________ ___________ ___________ ___________
Total distributions — Class Y . . . . . . . . . . . . . . . . . . . . . . . . . . . . . . . . . . . . . . . . . . . (4,588,159) (17,819,192) (7,231,471) (5,864,292)___________ ___________ ___________ ___________
Dividends and Distributions to Shareholders from Class A (Note B):
Net investment income . . . . . . . . . . . . . . . . . . . . . . . . . . . . . . . . . . . . . . . . . . . . . . . . (162,615) (131,240) (292,792) (302,566)
Net realized gains on investments . . . . . . . . . . . . . . . . . . . . . . . . . . . . . . . . . . . . . . . (265,397) (1,656,116) (64,795) —___________ ___________ ___________ ___________
Total distributions — Class A . . . . . . . . . . . . . . . . . . . . . . . . . . . . . . . . . . . . . . . . . . . (428,012) (1,787,356) (357,587) (302,566)___________ ___________ ___________ ___________
Capital Stock Transactions — (Net) (Note C) . . . . . . . . . . . . . . . . . . . . . . . . . . . . . . . . 3,489,623 21,200,920 (2,843,429) 11,842,528___________ ___________ ___________ ___________
Total increase (decrease) in net assets . . . . . . . . . . . . . . . . . . . . . . . . . . . . . . . . . . . . (48,046,931) (18,739,408) (174,623) 14,656,041
Net Assets:
Beginning of year . . . . . . . . . . . . . . . . . . . . . . . . . . . . . . . . . . . . . . . . . . . . . . . . . . . . 206,581,455 225,320,863 152,816,337 138,160,296___________ ___________ ___________ ___________
End of year* . . . . . . . . . . . . . . . . . . . . . . . . . . . . . . . . . . . . . . . . . . . . . . . . . . . . . . . . $158,534,524 $206,581,455 $152,641,714 $152,816,337___________ ___________ ___________ ______________________ ___________ ___________ ___________
* Including undistributed net investment income of . . . . . . . . . . . . . . . . . . . . . . . . . . . $ 905,757 $ 910,223 $ 163,072 $ 112,668___________ ___________ ___________ ______________________ ___________ ___________ ___________
The accompanying notes are an integral part of these financial statements.
Statements of Changes in Net Assets

20
The tables below set forth financial data for a share of capital stock outstanding throughout each period presented.
COUNTRY Growth Fund______________________________________________________________
Years Ended June 30,______________________________________________________________2009 2008 2007 2006 2005________ ________ ________ ________ ________
Class Y SharesNet asset value, beginning of year . . . . . . . . . . . . . . . . . . . . . . . . . . . . . . . . . . . . $ 21.89 $ 26.38 $ 24.16 $ 23.44 $ 22.28________ ________ ________ ________ ________
Income from investment operationsNet investment income . . . . . . . . . . . . . . . . . . . . . . . . . . . . . . . . . . . . . . . . . . 0.20 0.17 0.21 0.26 0.21Net realized and unrealized gains (losses) . . . . . . . . . . . . . . . . . . . . . . . . . . . (5.09) (2.40) 3.53 1.16 1.17________ ________ ________ ________ ________
Total from investment operations . . . . . . . . . . . . . . . . . . . . . . . . . . . . . . . . (4.89) (2.23) 3.74 1.42 1.38________ ________ ________ ________ ________Less DistributionsDividends from net investment income . . . . . . . . . . . . . . . . . . . . . . . . . . . . . . (0.20) (0.16) (0.28) (0.20) (0.22)Distributions from capital gains . . . . . . . . . . . . . . . . . . . . . . . . . . . . . . . . . . . (0.33) (2.10) (1.24) (0.50) —________ ________ ________ ________ ________
Total distributions . . . . . . . . . . . . . . . . . . . . . . . . . . . . . . . . . . . . . . . . . . . . (0.53) (2.26) (1.52) (0.70) (0.22)________ ________ ________ ________ ________Net asset value, end of year . . . . . . . . . . . . . . . . . . . . . . . . . . . . . . . . . . . . . . . . . $ 16.47 $ 21.89 $ 26.38 $ 24.16 $ 23.44________ ________ ________ ________ ________________ ________ ________ ________ ________Total investment return . . . . . . . . . . . . . . . . . . . . . . . . . . . . . . . . . . . . . . . . . . . . -22.77% -9.02% 16.22% 6.10% 6.23%Ratios/Supplemental Data
Net assets, end of year (in 000’s) . . . . . . . . . . . . . . . . . . . . . . . . . . . . . . . . . . $145,423 $188,863 $204,771 $197,245 $190,955Ratio of expenses to average net assets:
Before expense waiver . . . . . . . . . . . . . . . . . . . . . . . . . . . . . . . . . . . . . . . . 1.23% 1.19% 1.20% 1.25% 1.25%After expense waiver . . . . . . . . . . . . . . . . . . . . . . . . . . . . . . . . . . . . . . . . . . 1.21% 1.17% 1.19% 1.23% 1.24%
Ratio of net investment income to average net assets:Before expense waiver . . . . . . . . . . . . . . . . . . . . . . . . . . . . . . . . . . . . . . . . 1.15% 0.71% 0.83% 1.03% 0.92%After expense waiver . . . . . . . . . . . . . . . . . . . . . . . . . . . . . . . . . . . . . . . . . . 1.17% 0.73% 0.84% 1.05% 0.93%
Portfolio turnover rate(1) . . . . . . . . . . . . . . . . . . . . . . . . . . . . . . . . . . . . . . . . . 26.11% 17.73% 33.17% 18.82% 14.57%
COUNTRY Growth Fund______________________________________________________________
Years Ended June 30,______________________________________________________________2009 2008 2007 2006 2005________ ________ ________ ________ ________
Class A SharesNet asset value, beginning of year . . . . . . . . . . . . . . . . . . . . . . . . . . . . . . . . . . . . $ 21.91 $ 26.40 $ 24.18 $ 23.46 $ 22.30________ ________ ________ ________ ________
Income from investment operationsNet investment income . . . . . . . . . . . . . . . . . . . . . . . . . . . . . . . . . . . . . . . . . . 0.20 0.19 0.22 0.25 0.23Net realized and unrealized gains (losses) . . . . . . . . . . . . . . . . . . . . . . . . . . . (5.10) (2.42) 3.52 1.17 1.15________ ________ ________ ________ ________
Total from investment operations . . . . . . . . . . . . . . . . . . . . . . . . . . . . . . . . (4.90) (2.23) 3.74 1.42 1.38________ ________ ________ ________ ________Less DistributionsDividends from net investment income . . . . . . . . . . . . . . . . . . . . . . . . . . . . . . (0.20) (0.16) (0.28) (0.20) (0.22)Distributions from capital gains . . . . . . . . . . . . . . . . . . . . . . . . . . . . . . . . . . . (0.33) (2.10) (1.24) (0.50) —________ ________ ________ ________ ________
Total distributions . . . . . . . . . . . . . . . . . . . . . . . . . . . . . . . . . . . . . . . . . . . . (0.53) (2.26) (1.52) (0.70) (0.22)________ ________ ________ ________ ________Net asset value, end of year . . . . . . . . . . . . . . . . . . . . . . . . . . . . . . . . . . . . . . . . . $ 16.48 $ 21.91 $ 26.40 $ 24.18 $ 23.46________ ________ ________ ________ ________________ ________ ________ ________ ________Total investment return(2) . . . . . . . . . . . . . . . . . . . . . . . . . . . . . . . . . . . . . . . . . . -22.79% -9.02% 16.21% 6.10% 6.22%Ratios/Supplemental Data
Net assets, end of year (in 000’s) . . . . . . . . . . . . . . . . . . . . . . . . . . . . . . . . . . $13,112 $17,718 $20,550 $12,981 $9,594Ratio of expenses to average net assets:
Before expense waiver . . . . . . . . . . . . . . . . . . . . . . . . . . . . . . . . . . . . . . . . 1.23% 1.19% 1.20% 1.25% 1.25%After expense waiver . . . . . . . . . . . . . . . . . . . . . . . . . . . . . . . . . . . . . . . . . . 1.21% 1.17% 1.19% 1.23% 1.24%
Ratio of net investment income to average net assets:Before expense waiver . . . . . . . . . . . . . . . . . . . . . . . . . . . . . . . . . . . . . . . . 1.15% 0.71% 0.83% 1.03% 0.92%After expense waiver . . . . . . . . . . . . . . . . . . . . . . . . . . . . . . . . . . . . . . . . . . 1.17% 0.73% 0.84% 1.05% 0.93%
Portfolio turnover rate(1) . . . . . . . . . . . . . . . . . . . . . . . . . . . . . . . . . . . . . . . . . 26.11% 17.73% 33.17% 18.82% 14.57%
(1) Calculated on the basis of the Fund as a whole without distinguishing between the classes of shares issued.(2) Total investment return does not reflect sales load.
The accompanying notes are an integral part of these financial statements.
Financial Highlights

21
The tables below set forth financial data for a share of capital stock outstanding throughout each period presented.
COUNTRY Bond Fund______________________________________________________________
Years Ended June 30,______________________________________________________________2009 2008 2007 2006 2005________ ________ ________ ________ ________
Class Y SharesNet asset value, beginning of year . . . . . . . . . . . . . . . . . . . . . . . . . . . . . . . . . . . . $ 10.12 $ 9.91 $ 9.84 $ 10.34 $ 10.28________ ________ ________ ________ ________
Income from investment operationsNet investment income . . . . . . . . . . . . . . . . . . . . . . . . . . . . . . . . . . . . . . . . . . 0.44 0.43 0.42 0.42 0.41Net realized and unrealized gains (losses) . . . . . . . . . . . . . . . . . . . . . . . . . . . 0.29 0.21 0.07 (0.49) 0.17________ ________ ________ ________ ________
Total from investment operations . . . . . . . . . . . . . . . . . . . . . . . . . . . . . . . . 0.73 0.64 0.49 (0.07) 0.58________ ________ ________ ________ ________Less DistributionsDividends from net investment income . . . . . . . . . . . . . . . . . . . . . . . . . . . . . . (0.43) (0.43) (0.42) (0.42) (0.42)Distributions from capital gains . . . . . . . . . . . . . . . . . . . . . . . . . . . . . . . . . . . (0.09) — (0.00)(3) (0.01) (0.10)________ ________ ________ ________ ________
Total distributions . . . . . . . . . . . . . . . . . . . . . . . . . . . . . . . . . . . . . . . . . . . . (0.52) (0.43) (0.42) (0.43) (0.52)________ ________ ________ ________ ________Net asset value, end of year . . . . . . . . . . . . . . . . . . . . . . . . . . . . . . . . . . . . . . . . . $ 10.33 $ 10.12 $ 9.91 $ 9.84 $ 10.34________ ________ ________ ________ ________________ ________ ________ ________ ________Total investment return . . . . . . . . . . . . . . . . . . . . . . . . . . . . . . . . . . . . . . . . . . . . 7.51% 6.58% 5.08% -0.67% 5.74%Ratios/Supplemental Data
Net assets, end of year (in 000’s) . . . . . . . . . . . . . . . . . . . . . . . . . . . . . . . . . . $146,168 $145,405 $131,593 $60,151 $48,166Ratio of expenses to average net assets:
Before expense waiver . . . . . . . . . . . . . . . . . . . . . . . . . . . . . . . . . . . . . . . . 0.95% 0.89% 0.91% 1.22% 1.24%After expense waiver . . . . . . . . . . . . . . . . . . . . . . . . . . . . . . . . . . . . . . . . . . 0.85% 0.85% 0.85% 0.85% 0.85%
Ratio of net investment income to average net assets:Before expense waiver . . . . . . . . . . . . . . . . . . . . . . . . . . . . . . . . . . . . . . . . 4.14% 4.18% 4.16% 3.88% 3.61%After expense waiver . . . . . . . . . . . . . . . . . . . . . . . . . . . . . . . . . . . . . . . . . . 4.24% 4.22% 4.22% 4.25% 4.00%
Portfolio turnover rate(1) . . . . . . . . . . . . . . . . . . . . . . . . . . . . . . . . . . . . . . . . . 40.72% 50.14% 25.97% 17.46% 27.37%
COUNTRY Bond Fund______________________________________________________________
Years Ended June 30,______________________________________________________________2009 2008 2007 2006 2005________ ________ ________ ________ ________
Class A SharesNet asset value, beginning of year . . . . . . . . . . . . . . . . . . . . . . . . . . . . . . . . . . . . $ 10.20 $ 9.99 $ 9.92 $ 10.42 $ 10.36________ ________ ________ ________ ________
Income from investment operationsNet investment income . . . . . . . . . . . . . . . . . . . . . . . . . . . . . . . . . . . . . . . . . . 0.44 0.43 0.42 0.42 0.41Net realized and unrealized gains (losses) . . . . . . . . . . . . . . . . . . . . . . . . . . . 0.30 0.21 0.07 (0.49) 0.17________ ________ ________ ________ ________
Total from investment operations . . . . . . . . . . . . . . . . . . . . . . . . . . . . . . . . 0.74 0.64 0.49 (0.07) 0.58________ ________ ________ ________ ________Less DistributionsDividends from net investment income . . . . . . . . . . . . . . . . . . . . . . . . . . . . . . (0.43) (0.43) (0.42) (0.42) (0.42)Distributions from capital gains . . . . . . . . . . . . . . . . . . . . . . . . . . . . . . . . . . . (0.09) — (0.00)(3) (0.01) (0.10)________ ________ ________ ________ ________
Total distributions . . . . . . . . . . . . . . . . . . . . . . . . . . . . . . . . . . . . . . . . . . . . (0.52) (0.43) (0.42) (0.43) (0.52)________ ________ ________ ________ ________Net asset value, end of year . . . . . . . . . . . . . . . . . . . . . . . . . . . . . . . . . . . . . . . . . $ 10.42 $ 10.20 $ 9.99 $ 9.92 $ 10.42________ ________ ________ ________ ________________ ________ ________ ________ ________Total investment return(2) . . . . . . . . . . . . . . . . . . . . . . . . . . . . . . . . . . . . . . . . . . 7.55% 6.52% 5.15% -0.76% 5.69%Ratios/Supplemental Data
Net assets, end of year (in 000’s) . . . . . . . . . . . . . . . . . . . . . . . . . . . . . . . . . . $6,474 $7,411 $6,567 $3,479 $2,804Ratio of expenses to average net assets:
Before expense waiver . . . . . . . . . . . . . . . . . . . . . . . . . . . . . . . . . . . . . . . . 0.95% 0.89% 0.91% 1.22% 1.24%After expense waiver . . . . . . . . . . . . . . . . . . . . . . . . . . . . . . . . . . . . . . . . . . 0.85% 0.85% 0.85% 0.85% 0.85%
Ratio of net investment income to average net assets:Before expense waiver . . . . . . . . . . . . . . . . . . . . . . . . . . . . . . . . . . . . . . . . 4.14% 4.18% 4.16% 3.88% 3.61%After expense waiver . . . . . . . . . . . . . . . . . . . . . . . . . . . . . . . . . . . . . . . . . . 4.24% 4.22% 4.22% 4.25% 4.00%
Portfolio turnover rate(1) . . . . . . . . . . . . . . . . . . . . . . . . . . . . . . . . . . . . . . . . . 40.72% 50.14% 25.97% 17.46% 27.37%
(1) Calculated on the basis of the Fund as a whole without distinguishing between the classes of shares issued.(2) Total investment return does not reflect sales load.(3) Amount less than $0.005 per share.
The accompanying notes are an integral part of these financial statements.
Financial Highlights

22
Note (A) Organization and Significant Accounting Policies: TheCOUNTRY Mutual Funds Trust represent a series of four funds(referred to herein as “COUNTRY Funds”). Each of theCOUNTRY Funds has distinct investment objectives andpolicies. These financial statements contain two of the fourCOUNTRY Funds. The two COUNTRY Funds are as follows:COUNTRY Growth Fund (“Growth Fund”) and COUNTRYBond Fund (“Bond Fund”) (referred to herein as “Funds”). TheCOUNTRY Mutual Funds Trust was organized as a businesstrust under the laws of Delaware on August 13, 2001. TheFunds were reorganized as a series of the trust effective October31, 2001. The Funds are registered under the InvestmentCompany Act of 1940 (the “Act”), as amended, as diversified,open-ended management investment companies.
The Funds offer Class A and Class Y shares. Class A shares aresold with a front-end sales charge. Class Y shares have no salescharge and are offered only to qualifying institutional investorsand shareholders of any COUNTRY Fund on or before March1, 2002 who have continuously owned shares of anyCOUNTRY Fund since that date and to certain others whomeet the standards set out in the Funds’ Prospectus.
Class A shares sales charge is calculated as follows:
Sales Chargeas % of
Amount of Transaction Offering Price________________________________________________ ____________Growth FundUp to $49,999 . . . . . . . . . . . . . . . . . . . . . . . . . . . . . . . 5.50%$50,000-$99,999 . . . . . . . . . . . . . . . . . . . . . . . . . . . . . 4.50%$100,000-$249,999 . . . . . . . . . . . . . . . . . . . . . . . . . . . 3.50%$250,000-$499,999 . . . . . . . . . . . . . . . . . . . . . . . . . . . 2.50%$500,000-$999,999 . . . . . . . . . . . . . . . . . . . . . . . . . . . 2.00%$1,000,000 & Above . . . . . . . . . . . . . . . . . . . . . . . . . . 0%
Bond FundUp to $49,999 . . . . . . . . . . . . . . . . . . . . . . . . . . . . . . . 4.25%$50,000-$99,999 . . . . . . . . . . . . . . . . . . . . . . . . . . . . . 4.00%$100,000-$249,999 . . . . . . . . . . . . . . . . . . . . . . . . . . . 3.50%$250,000-$499,999 . . . . . . . . . . . . . . . . . . . . . . . . . . . 2.50%$500,000-$999,999 . . . . . . . . . . . . . . . . . . . . . . . . . . . 2.00%$1,000,000 & Above . . . . . . . . . . . . . . . . . . . . . . . . . . 0%The Funds’ prospectus provides descriptions of each Fund’sinvestment goals and principal strategies. Both classes of shareshave identical voting, dividend, liquidation and other rights,and the same terms and conditions.
The preparation of financial statements in conformity with U.S.generally accepted accounting principles (“GAAP”) requiresmanagement to make estimates and assumptions that affect thereported amounts of assets and liabilities at the date of thefinancial statements and the reported amounts of revenues andexpenses during the reporting period. Actual results may differfrom those estimates.
(1) Security Valuation: In valuing a Fund’s assets forcalculating net asset value, readily marketable portfoliosecurities listed on a national securities exchange are valuedat the last sale price on the business day as of which suchvalue is being determined. If there has been no sale on suchexchange on such day, the security is valued at the closingbid price on such day. Securities primarily traded in theNasdaq National Market System for which marketquotations are readily available are valued using the NasdaqOfficial Closing Price (“NOCP”). If the NOCP is notavailable, such securities are valued at the last bid price onthe day of valuation. Over-the-counter securities not listedon the Nasdaq National Market System are valued at themean of the current bid and asked prices. Securities other
than short-term securities may also be valued on the basis ofprices provided by a pricing service when such prices arebelieved by the Advisor to reflect the fair value of suchsecurities. Short-term investments, such as those with aremaining maturity of 60 days or less at the time ofpurchase, are valued at amortized cost, which approximatesfair market value. Securities may be valued at fair value asdetermined in good faith by the Board of Trustees.
The Funds adopted Statement of Financial AccountingStandard No. 157, Fair Value Measurements (“FAS 157”)and FASB Staff Position No. 157-4 (“FSP 157-4”). FSP157-4 clarifies FAS 157 and requires an entity to evaluatecertain factors to determine whether there has been asignificant decrease in volume and level of activity for theasset or liability such that recent transactions and quotedprices may not be determinative of fair value and furtheranalysis and adjustment may be necessary to estimate fairvalue. The FSP 157-4 also requires enhanced disclosureregarding the inputs and valuation techniques used tomeasure fair value in those instances as well as expandeddisclosure of valuation levels for major security types. FAS157 requires each Fund to classify its securities based onvaluation method, using the following three levels:
Level 1 — Quoted prices in active markets for identicalsecurities.
Level 2 — Other significant observable inputs (includingquoted prices for similar securities, interestrates, prepayment speeds, credit risk, etc.)
Level 3 — Significant unobservable inputs (including theFund's own assumptions in determining the fairvalue of investments)
The inputs or methodology used for valuing securities arenot an indication of the risk associated with investing inthose securities.
The following is a summary of the inputs used to value theFund’s net assets as of June 30, 2009:
Growth Fund______________________________________Level 1 Level 2 Level 3 Total_______ _______ _______ _____
Common StocksConsumer
Discretionary $ 16,596,888 $ — $— $ 16,596,888Consumer Staples 21,967,373 — — 21,967,373Energy 20,764,669 — — 20,764,669Financials 15,904,104 — — 15,904,104Health Care 25,548,482 — — 25,548,482Industrials 17,782,323 — — 17,782,323Information
Technology 25,809,325 — — 25,809,325Materials 2,247,489 — — 2,247,489Telecommunication
Services 5,463,408 — — 5,463,408Utilities 4,458,553 — — 4,458,553Mortgage BackedSecurities — 269,914 — 269,914
Short-TermInvestments 2,096,606 — — 2,096,606___________ ________ ____ ___________
Total Investmentsin Securities $158,639,220 $269,914 $— $158,909,134___________ ________ ____ ______________________ ________ ____ ___________
COUNTRY Mutual Funds — Notes to Financial Statements June 30, 2009

23
COUNTRY Mutual Funds — Notes to Financial Statements June 30, 2009 (continued)
Note (C) Capital Stock: At June 30, 2009, each of the Funds is authorized to issue an unlimited number of shares.
Transactions in capital stock were as follows:Growth Fund____________________________________________________________
Year Ended Year EndedJune 30, 2009 June 30, 2008__________________________ __________________________
Shares Amount Shares Amount_________ ___________ _________ ___________Class Y
Shares sold . . . . . . . . . . . . . . . . . . . . . . . . . . . . . . . . . . . . . . . . . . . . . . . . . . . . . . . 1,320,787 $ 21,694,324 1,211,651 $ 28,416,551Shares issued through reinvestment of dividends . . . . . . . . . . . . . . . . . . . . . . . . . . 217,241 4,384,331 715,860 17,053,670Shares redeemed . . . . . . . . . . . . . . . . . . . . . . . . . . . . . . . . . . . . . . . . . . . . . . . . . . . (1,334,498) (22,327,756) (1,062,741) (25,044,901)_________ ___________ _________ ___________
Total Class Y transactions . . . . . . . . . . . . . . . . . . . . . . . . . . . . . . . . . . . . . . . . . . . . . . . 203,530 3,750,899 864,770 20,425,320_________ ___________ _________ ___________Class A
Shares sold . . . . . . . . . . . . . . . . . . . . . . . . . . . . . . . . . . . . . . . . . . . . . . . . . . . . . . . 132,954 $ 2,172,271 138,490 $ 3,262,786Shares issued through reinvestment of dividends . . . . . . . . . . . . . . . . . . . . . . . . . . 21,129 427,366 74,951 1,787,035Shares redeemed . . . . . . . . . . . . . . . . . . . . . . . . . . . . . . . . . . . . . . . . . . . . . . . . . . . (167,133) (2,860,913) (183,200) (4,274,221)_________ ___________ _________ ___________
Total Class A transactions . . . . . . . . . . . . . . . . . . . . . . . . . . . . . . . . . . . . . . . . . . . . . . . (13,050) (261,276) 30,241 775,600_________ ___________ _________ ___________Net increase in capital stock . . . . . . . . . . . . . . . . . . . . . . . . . . . . . . . . . . . . . . . . . . . . . 190,480 $ 3,489,623 895,011 $ 21,200,920_________ ___________ _________ ____________________ ___________ _________ ___________
COUNTRY Bond Fund______________________________________Level 1 Level 2 Level 3 Total_______ _______ _______ _____
InvestmentCompanies $ 415,080 $ — $— $ 415,080
Fixed IncomeAsset Backed
Securities — 6,374,051 — 6,374,051Corporate Bonds — 52,983,544 — 52,983,544Mortgage Backed
Securities — 55,923,071 — 55,923,071Municipal Bonds — 10,093,064 — 10,093,064U.S. Government
Agency Issues 1,001,206 — — 1,001,206U.S. Treasury
Obligations 10,763,859 — — 10,763,859Commercial Paper — 2,149,621 — 2,149,621Money Market
Funds 11,830,919 — — 11,830,919__________ ___________ ____ ___________Total Investments $24,011,064 $127,523,351 $— $151,534,415__________ ___________ ____ _____________________ ___________ ____ ___________
(2) Investment Income and Securities Transactions:Dividend income, less foreign taxes withheld, if any, isrecorded on the ex-dividend date. Interest income isaccrued daily and adjusted, if necessary, for accretion ofdiscount and amortization of premium. Securitiestransactions are accounted for on the trade date basis.Gains or losses on the sale of securities are determined byuse of the specific identification method for both financialreporting and income tax purposes.
(3) Federal Income Taxes: The Funds have elected to betreated as “regulated investment companies” underSubchapter M of the Internal Revenue Code and intend todistribute substantially all of their net taxable incomeannually. Accordingly, no provisions for Federal incometaxes have been recorded in the accompanying financialstatements.
Additionally, U.S. GAAP require that certain componentsof net assets relating to permanent differences bereclassified between financial and tax reporting. Thesereclassifications have no effect on net assets or net assetvalue per share. For the year ended June 30, 2009, thefollowing table shows the reclassifications made:
Undistributed AccumulatedNet Investment Net Realized Paid In
Income Gain (Loss) Capital_____________ ___________ _______Growth Fund $ (313) $ 313 $—Bond Fund 58,068 (58,068) —
(4) Dividends and Distributions: Dividends anddistributions to shareholders are recorded on the ex-dividenddate. Income and capital gain distributions are determined inaccordance with income tax regulations, which may differfrom GAAP.
(5) Other: Expenses shared by the Trust are generallyallocated to each Fund based upon relative net assets.Expenses directly attributable to a specific Fund areallocated directly to that Fund. Income, expenses (otherthan expenses attributable to a specific class), and realizedand unrealized gains or losses on investments are allocatedto each class of shares based upon relative net assets.Expenses directly attributable to a specific class of sharesare allocated directly to that class.
Note (B) Dividends from Net Investment Income andDistributions of Capital Gains: The Growth Fund declares anddistributes net investment income dividends to shareholderstwice a year. The Bond Fund declares and distributes netinvestment income dividends to shareholders monthly.Dividends are automatically reinvested in additional Fundshares, at the then current net asset value, for thoseshareholders that have elected the reinvestment option. Netrealized gains from investment transactions, if any, of all Fundsare distributed at least annually.

24
COUNTRY Mutual Funds — Notes to Financial Statements June 30, 2009 (continued)
Bond Fund____________________________________________________________Year Ended Year Ended
June 30, 2009 June 30, 2008__________________________ __________________________Shares Amount Shares Amount_________ ___________ _________ ___________
Class YShares sold . . . . . . . . . . . . . . . . . . . . . . . . . . . . . . . . . . . . . . . . . . . . . . . . . . . . . . . 4,763,620 $ 48,074,577 5,887,868 $ 60,087,521Shares issued through reinvestment of dividends . . . . . . . . . . . . . . . . . . . . . . . . . . 687,178 6,916,450 551,497 5,588,364Shares redeemed . . . . . . . . . . . . . . . . . . . . . . . . . . . . . . . . . . . . . . . . . . . . . . . . . . . (5,672,824) (56,761,786) (5,345,933) (54,535,116)_________ ___________ _________ ___________
Total Class Y transactions . . . . . . . . . . . . . . . . . . . . . . . . . . . . . . . . . . . . . . . . . . . . . . . (222,026) (1,770,759) 1,093,432 11,140,769_________ ___________ _________ ___________Class A
Shares sold . . . . . . . . . . . . . . . . . . . . . . . . . . . . . . . . . . . . . . . . . . . . . . . . . . . . . . . 109,033 $ 1,109,897 202,041 $ 2,075,412Shares issued through reinvestment of dividends . . . . . . . . . . . . . . . . . . . . . . . . . . 35,173 356,759 29,610 302,501Shares redeemed . . . . . . . . . . . . . . . . . . . . . . . . . . . . . . . . . . . . . . . . . . . . . . . . . . . (249,309) (2,539,326) (162,579) (1,676,154)_________ ___________ _________ ___________
Total Class A transactions . . . . . . . . . . . . . . . . . . . . . . . . . . . . . . . . . . . . . . . . . . . . . . . (105,103) (1,072,670) 69,072 701,759_________ ___________ _________ ___________Net increase in capital stock . . . . . . . . . . . . . . . . . . . . . . . . . . . . . . . . . . . . . . . . . . . . . (327,129) $ (2,843,429) 1,162,504 $ 11,842,528_________ ___________ _________ ____________________ ___________ _________ ___________
Note (D) Investment Transactions: Purchases and sales ofinvestment securities, other than U.S. government obligationsand short-term investments, for the year ended June 30, 2009,were as follows:
Purchases Sales__________ __________Growth Fund . . . . . . . . . . . . . . . . . . $44,303,990 $42,462,141Bond Fund . . . . . . . . . . . . . . . . . . . . 46,896,060 40,288,143
For the year ended June 30, 2009, the aggregate cost ofpurchases and proceeds from sales of long-term U.S.government obligations were as follows:
Purchases Sales__________ __________Growth Fund . . . . . . . . . . . . . . . . . . $ — $ —Bond Fund . . . . . . . . . . . . . . . . . . . . 9,009,079 15,342,027
Note (E) Income Tax Information: As of June 30, 2009, the components of accumulated earnings (losses) for income tax purposeswere as follows:
Growth Fund Bond Fund___________ ___________Cost of investments . . . . . . . . . . . . . . . . . . . . . . . . . . . . . . . . . . . . . . . . . . . . . . . . . . . . . . . . . . . . . . . . $154,426,285 $149,852,440___________ ______________________ ___________Unrealized appreciation . . . . . . . . . . . . . . . . . . . . . . . . . . . . . . . . . . . . . . . . . . . . . . . . . . . . . . . . . . . . . $ 29,163,813 $ 5,599,963Unrealized depreciation . . . . . . . . . . . . . . . . . . . . . . . . . . . . . . . . . . . . . . . . . . . . . . . . . . . . . . . . . . . . . (24,680,964) (3,917,988)___________ ___________Net unrealized appreciation . . . . . . . . . . . . . . . . . . . . . . . . . . . . . . . . . . . . . . . . . . . . . . . . . . . . . . . . . . $ 4,482,849 $ 1,681,975___________ ______________________ ___________Undistributed ordinary income . . . . . . . . . . . . . . . . . . . . . . . . . . . . . . . . . . . . . . . . . . . . . . . . . . . . . . . $ 905,757 $ 981,974Undistributed long-term capital gains . . . . . . . . . . . . . . . . . . . . . . . . . . . . . . . . . . . . . . . . . . . . . . . . . . — 268,751___________ ___________Distributable earnings . . . . . . . . . . . . . . . . . . . . . . . . . . . . . . . . . . . . . . . . . . . . . . . . . . . . . . . . . . . . . . $ 905,757 $ 1,250,725___________ ______________________ ___________Other accumulated losses . . . . . . . . . . . . . . . . . . . . . . . . . . . . . . . . . . . . . . . . . . . . . . . . . . . . . . . . . . . $ (11,310,223) $ —___________ ___________Total accumulated gains/(losses) . . . . . . . . . . . . . . . . . . . . . . . . . . . . . . . . . . . . . . . . . . . . . . . . . . . . . . $ (5,921,617) $ 2,932,700___________ ______________________ ___________The difference between cost of investments for financial reporting and cost of investments for Federal income tax is due primarily totiming differences in recognizing certain gains and losses on security transactions (e.g., wash sale deferrals).
The tax character of distributions paid during the year ended June 30, 2009 and the year ended June 30, 2008 was as follows:
Year Ended Year EndedJune 30, 2009 June 30, 2008_____________ _____________
Growth FundOrdinary income . . . . . . . . . . . . . . . . . . . . . . . . . $1,921,556 $ 2,604,051Long-term capital gains . . . . . . . . . . . . . . . . . . . . 3,094,615 17,002,697_________ __________
$5,016,171 $19,606,548_________ ___________________ __________
Year Ended Year EndedJune 30, 2009 June 30, 2008_____________ _____________
Bond FundOrdinary income . . . . . . . . . . . . . . . . . . . . . . . . . $6,696,210 $6,166,858Long-term capital gains . . . . . . . . . . . . . . . . . . . . 892,848 —_________ _________
$7,589,058 $6,166,858_________ __________________ _________

25
The Funds designated as long-term capital gain dividend,pursuant to Internal Revenue Code Section 852(b)(3), theamount necessary to reduce the earnings and profits of theFunds related to net capital gains to zero for the tax year endedJune 30, 2009. Capital loss carryovers and post-October lossdeferrals as of June 30, 2009 were as follows:
Capital Loss Post-OctoberCapital Loss Carryover LossCarryover(1) Expiration Deferral__________ __________ ___________
Growth Fund . . . . . . . . . (2,098,306) 06/30/17 (9,211,917)Bond Fund . . . . . . . . . . — — —(1) Capital gain distributions will resume in the future to the extent gains are
realized in excess of the available carryovers.
FASB Interpretation No. 48, “Accounting For Uncertainty inIncome Taxes” (“FIN 48”), requires the Funds to analyze allopen tax years. Open tax years are those years that are openfor examination by the relevant taxing authority. As of June30, 2009, open Federal and state income taxes include the taxyears ended June 30, 2006 through 2009. The Funds have noexaminations in progress.
The Funds have reviewed all open tax years and majorjurisdictions and concluded that FIN 48 results in no effect tothe Funds’ financial positions or results of operations. There isno tax liability resulting from uncertain income tax positionstaken or expected to be taken on the tax return for the fiscalyear-ends June 30, 2006 through 2009. The Funds are also notaware of any tax positions for which it is reasonably possiblethat the total amounts of unrecognized tax expense willsignificantly change in the next twelve months.
Note (F) Advisory and Other Related Party Transactions:Under its Advisory Agreement with the Funds, COUNTRYFund Management, a department of COUNTRY Trust Bank(the “Advisor”), provides investment advisory services for theFunds. The Funds pay the Advisor at the following annualpercentage rates of the average daily net assets of each Fund:Growth Fund 0.75% and Bond Fund 0.50%. These fees areaccrued daily and paid to the Advisor monthly. COUNTRYTrust Bank serves as the Funds’ Custodian, withoutcompensation after voluntary waivers. Custody fees waived forGrowth Fund and Bond Fund for the year ended June 30, 2009were $31,365 and $23,023, respectively.
The Advisor agreed to reduce its fees and reimburse the BondFund to the extent total annualized expenses exceed 0.85% ofaverage daily net assets. This agreement has been in effect forthe Bond Fund since November 1, 1997 as a non-contractualwaiver. Effective January 30, 2002, this agreement becamecontractual. These agreements may be terminated at any timeafter May 31, 2010.
Investment advisory fees paid to the Advisor, and expensesreimbursed by the Advisor, for the year ended June 30, 2009,were as follows:
ExpensesAdvisory Advisory ReimbursedRate Fee by Advisor*_______ _______ __________
Growth Fund . . . . . . . . . . . . 0.75% $1,224,756 $ —Bond Fund . . . . . . . . . . . . . 0.50% $ 737,653 $122,015* Excludes waiver of custody fees.
At June 30, 2009, 65.7% of the shares outstanding of theGrowth Fund and 94.9% of the shares outstanding of the BondFund are represented by omnibus accounts held for the benefitof the COUNTRY Trust Bank’s clients, including a definedcontribution benefit plan sponsored by COUNTRY Trust Bank.
The legal counsel to the Funds also serves as in-house counselto the Advisor and COUNTRY Trust Bank and as Secretary tothe Funds. Legal fees incurred by the Growth Fund and BondFund for the year ended June 30, 2009 were $40,093 and$34,366, respectively.
Legal fees are included in Professional fees in the Statements ofOperations. Certain officers of the Trust are also officers of theAdvisor. Trustees affiliated with the Advisor receive nocompensation from the Funds.
Note (G) Distribution Services Agreements: QuasarDistributors, LLC serves as the Funds’ Distributor. Pursuant toRule 12b-1 adopted by the Securities and ExchangeCommission under the Act, the Funds have each adopted a Planof Distribution (the “Plans”), effective October 31, 2001. ThePlans permit the Funds to pay certain expenses associated withthe distribution of their shares. The maximum annualcontractual fee under the Plans is 0.25% of the average dailynet assets of each Fund. For the year ended June 30, 2009, theRule 12b-1 expenses incurred by the Growth Fund and theBond Fund were 0.08% and 0.03%, respectively.
Note (H) Subsequent Events: In May 2009, the FASB issuedSFAS No. 165, “Subsequent Events” (“FAS No. 165”). TheFunds adopted SFAS No. 165 which requires an entity torecognize in the financial statements the effects of allsubsequent events that provide additional evidence aboutconditions that existed at the date of the balance sheet. Fornon-recognized subsequent events that must be disclosed tokeep the financial statements from being misleading, an entitywill be required to disclose the nature of the event as well as anestimate of its financial effect, or a statement that such anestimate cannot be made. In addition, SFAS No. 165 requiresan entity to disclose the date through which subsequent eventshave been evaluated. The Funds have evaluated subsequentevents through the issuance of their financial statements onAugust 28, 2009.
Note (I) Recent Accounting Pronouncements: In June 2009, theFASB issued Statement of Financial Accounting Standards No.168, “The FASB Accounting Standards Codification TM andthe Hierarchy of Generally Accepted Accounting Principles – areplacement of FASB Statement No. 162” (“SFAS 168”). SFAS168 replaces SFAS No. 162, “The Hierarchy of GenerallyAccepted Accounting Principles” and establishes the “FASBAccounting Standards Codification TM” (“Codification”) asthe source of authoritative accounting principles recognized bythe FASB to be applied by nongovernmental entities in thepreparation of financial statements in conformity with U.S.GAAP. All guidance contained in the Codification carries anequal level of authority. On the effective date of SFAS 168, theCodification will supersede all then-existing non-SECaccounting and reporting standards. All othernongrandfathered non-SEC accounting literature not included inthe Codification will become nonauthoritative. SFAS 168 iseffective for financial statements issued for interim and annualperiods ending after September 15, 2009. The Funds evaluatedthis new statement, and have determined that it will not have asignificant impact on the determination or reporting of theFunds’ financial statements.
COUNTRY Mutual Funds — Notes to Financial Statements June 30, 2009 (continued)
26
The Shareholders and Board of TrusteesCOUNTRY Mutual Funds Trust
We have audited the accompanying statements of assets and liabilities of COUNTRY Mutual Funds Trust, comprisingthe COUNTRY Growth Fund and the COUNTRY Bond Fund (the “Funds”), including the schedules of investments, asof June 30, 2009, and the related statements of operations for the year then ended, the statements of changes in netassets for each of the two years in the period then ended, and the financial highlights for each of the five years in theperiod then ended. These financial statements and financial highlights are the responsibility of the Funds’ management.Our responsibility is to express an opinion on these financial statements and financial highlights based on our audits.
We conducted our audits in accordance with the standards of the Public Company Accounting Oversight Board (UnitedStates). Those standards require that we plan and perform the audit to obtain reasonable assurance about whether thefinancial statements and financial highlights are free of material misstatement. We were not engaged to perform anaudit of the Funds’ internal control over financial reporting. Our audits included consideration of internal control overfinancial reporting as a basis for designing audit procedures that are appropriate in the circumstances, but not for thepurpose of expressing an opinion on the effectiveness of the Funds’ internal control over financial reporting.Accordingly, we express no such opinion. An audit also includes examining, on a test basis, evidence supporting theamounts and disclosures in the financial statements and financial highlights, assessing the accounting principles usedand significant estimates made by management, and evaluating the overall financial statement presentation. Ourprocedures included verification by examination of securities held by the custodian as of June 30, 2009, andconfirmation of securities not held by the custodian by correspondence with others. We believe that our audits providea reasonable basis for our opinion.
In our opinion, the financial statements and financial highlights referred to above present fairly, in all material respects,the financial position of the Funds at June 30, 2009, the results of their operations for the year then ended, the changesin their net assets for each of the two years in the period then ended, and the financial highlights for each of the fiveyears in the period then ended, in conformity with U.S. generally accepted accounting principles.
Milwaukee, WisconsinAugust 28, 2009
COUNTRY Mutual Funds — Report of Independent Registered Public Accounting Firm

27
Qualified Dividend Income/Dividends Received Deduction
For the fiscal year ended June 30, 2009, certain dividends paid by the Funds may be subject to a maximum tax rate of 15%, asprovided for by the Jobs and Growth Tax Relief Reconciliation Act of 2003. The percentage of dividends declared from ordinaryincome designated as qualified dividend income was as follows:
Growth Fund 100.00%Bond Fund 0.26%
For corporate shareholders, the percent of ordinary income distributions qualifying for the corporate dividends received deductionfor the fiscal year ended June 30, 2009, was as follows:
Growth Fund 100.00%Bond Fund 0.03%
Information Applicable to Foreign Shareholders Only:
The Funds hereby designate the following percentages of their ordinary income distributions for the fiscal year ended June 30, 2009as interest-related dividends under Internal Revenue Code Section 871(k)(1)(C):
Growth Fund 3.59%Bond Fund 86.09%
Short-Term Capital Gain
The percentage of taxable ordinary income distributions that are designated as short-term capital gain distributions under InternalRevenue Section 871(k)(2)(C) for each Fund for the fiscal year ended June 30, 2009, was as follows:
Growth Fund 0.00%Bond Fund 6.54%
Additional Tax Information (unaudited)

28
COUNTRY Mutual Funds Trust(1) Trustees and Officers
Name/ Principal Occupation During Past Five YearsAddress(2)/Birthday Age Position Held and Other Directorships Held by Trustee_________________ ____ ___________ _____________________________________William G. Beeler 70 Trustee since 2005 Chairman, Environment Committee to Study McLean County into the 21st(2/26/39) Century; Past Chairman, McLean County Cooperative Extension Council; Past
Member, McLean County Zoning Board of Appeals; McLean County RegionalPlanning Commission; Past Chairman, McLean County Livestock Association.Farmer.
Charlot R. Cole 68 Trustee since 1996 Property Developer, 1979 to date; Member Macoupin-Greene County Cooperation(6/12/41) Extension Council (formerly Macoupin County Cooperative Extension Council),
1992 to date and President, 1995 to date; Secretary/Treasurer, Cole Farms, Inc.,1980 to date. Farmer.
Robert D. Grace 62 Trustee since 2001 Director, Illini FS, Inc., 1990 to date; Secretary, Illini FS, Inc., 1997 to date.(3/20/47) Farmer.
Robert W. Weldon 75 Trustee since 2003 Retired. Board Member, Town of Normal Police Pension Fund Board, 2004 to(1/30/34) date.
William H. Olthoff* 65 Trustee since 2007 Director: Illinois Agricultural Association and Affiliated Companies(3), 2000 to(7/11/43) date; Director: COUNTRY Trust Bank(4), 2003 to date; Farmer.
Carson H. Varner, Jr. 64 Trustee since 2007 Professor of Business Law, College of Business, Illinois State University, 1984 to(5/18/45) date; Farm Manager, Varner Farms, Edgar County, Illinois, 1980 to date.
Alan K. Dodds 47 Treasurer since 2009 Treasurer(5): Illinois Agricultural Association and Affiliated Companies(3), 2009(12/11/61) to date; Finance Director: Flex-N-Gate Automotive Corporation, 2001 to 2009.
Peter J. Borowski 59 Controller since 2005 Vice President and Controller, COUNTRY Trust Bank(4) 2005 to date and(5/10/50) COUNTRY Financial(6) 2003 to date.
Barbara L. Mosson 57 Chief Compliance Chief Compliance Officer, COUNTRY Trust Bank(4), 2005 to date.(4/30/52) Officer since 2005,
Anti-Money LaunderingCompliance Officersince 2004
Bruce D. Finks 56 Vice President since 1996 Vice President – Investments: COUNTRY Trust Bank(4) to date.(1/31/53)
Erik Gravelle 33 Vice President since 2008 Director, Business Retirement Services; COUNTRY Trust Bank(4), Beginning(12/23/75) February 2008; Product Development Actuary; COUNTRY Life Insurance
Company, 1999 to 2008.
John D. Blackburn 61 Vice President since 2001 Chief Executive Officer: COUNTRY Financial(6), 2001 to date.(4/2/48)
Robert W. Rush, Jr. 63 Vice President since 1999 Senior Vice President & Trust Officer: COUNTRY Trust Bank(4), 1999 to date.(9/3/45)
Richard L. Guebert, Jr. 57 Vice President since 2004 Director and Vice President: Illinois Agricultural Association and Affiliated(8/9/51) Companies(3), 2003 to date; Vice President: COUNTRY Trust Bank(4), 2003 to
date; President-Randolph County Farm Bureau, 1997 to 2003. Farmer.
Derek C. Vogler 37 Vice President since 2006 Vice President; Investments and Trust Officer: COUNTRY Trust Bank(4), 2005 to(10/5/71) date.
Philip T. Nelson* 52 Trustee and President Director and President: Illinois Agricultural Association and Affiliated(6/12/57) since 2003 Companies(3), 2003 to date; Director and President and Chairman of the Board:
COUNTRY Trust Bank(4), 2003 to date; Director: American Farm BureauFederation and certain of its Affiliated Companies, 2004 to date; Chairman:Country Capital Management Company, 2003 to date; Farmer.
James M. Jacobs 43 General Counsel and General Counsel and Secretary: Illinois Agricultural Association and Affiliated(6/19/66) Secretary Companies(3), February 2008 to date; Various Attorney Positions: Illinois
since 2008 Agricultural Association and Affiliated Companies(3), April 2005 to February2008; General Counsel and Secretary: COUNTRY Trust Bank(4), February 2008to date; Director: Murphy, Rogers, Slass and Gambel, 1999 to 2005.
(1) All trustees represent all four portfolios of the COUNTRY Mutual Funds complex. COUNTRY Mutual Funds Trust currently is comprised of thefollowing four portfolios: COUNTRY Growth Fund, COUNTRY Bond Fund, COUNTRY VP Growth Fund, and COUNTRY VP Bond Fund.
(2) The mailing address for all officers and trustees of the Funds is c/o COUNTRY Trust Bank, 1705 N. Towanda Avenue, Bloomington, Illinois61702.
COUNTRY Mutual Funds — Trustees and Officers Information

29
(3) Affiliated Companies of the Illinois Agricultural Association include, without limitation, members of the COUNTRY Financial Group, IllinoisAgricultural Holding Co., AgriVisor Services, Inc., Illinois Agricultural Service Company and IAA Foundation.
(4) COUNTRY Trust Bank was formed on May 1, 2000 and is the successor to IAA Trust Company, an Illinois corporation with trust powers whichwas reorganized into a federal thrift.
(5) Alan K. Dodds additionally serves as Vice President-Finance of Illinois Agricultural Association and certain Affiliated Companies as well asDirector and Assistant Secretary of the Illinois Agricultural Service Company and Assistant Treasurer of the Midfield Corporation.
(6) COUNTRY Financial is a group of insurance and financial services companies which includes: COUNTRY Mutual Insurance Company,COUNTRY Preferred Insurance Company, COUNTRY Casualty Insurance Company, COUNTRY Life Insurance Company, COUNTRY InvestorsLife Assurance Company, COUNTRY Capital Management Company, COUNTRY Trust Bank and CC Services, Inc. and other AffiliatedCompanies.
* Interested Trustees
COUNTRY Mutual Funds — Trustees and Officers Information (continued)

30
Information regarding how the Funds vote proxies relating to portfolio securities is available without charge, upon request, bycalling toll-free at 1-800-245-2100 and the SEC’s website at www.sec.gov. Information regarding how the Funds voted proxiesrelating to portfolio securities during the twelve months ended June 30, 2009 is available on the SEC’s website at www.sec.gov or bycalling the toll-free number listed above.
Availability of Proxy Voting Information
The Funds file their complete schedule of portfolio holdings with the SEC on Form N-Q. The Funds will file Form N-Q for the firstand third quarters of each fiscal year. The Funds’ Form N-Q are on the SEC’s website at www.sec.gov and may be reviewed andcopied at the SEC’s Public Reference Room in Washington, DC. Information on the operation of the Public Reference Room may beobtained by calling 1-202-551-8090.
Availability of Quarterly Portfolio Schedule

(This Page Intentionally Left Blank.)


Statement of Additional Information (SAI):The SAI contains more detailed information on all aspects ofthe Funds. It has been filed with the Securities and ExchangeCommission and is incorporated by reference.
To request a free copy of the current SAI please write or call
COUNTRY FundsU.S. Bancorp Fund Services, LLCP.O. Box 701Milwaukee, WI 53201-0701(800) 245-2100
or contact
COUNTRY Fund Management,a department ofCOUNTRY Trust Bank(309) 821-4600
Information about the Funds (including the SAI) can bereviewed and copied at the SEC’s Public Reference Room inWashington D.C. Information on the operation of the PublicReference Room may be obtained by calling 1-202-551-8090.Reports and other information about the Funds are available onthe EDGAR Database on the SEC’s website at www.sec.gov.You may request documents from the SEC, upon payment of aduplicating fee, by electronic request at the following E-mailaddress: [email protected], or by calling the SEC at1-800-SEC-0330, or by writing the SEC’s Public ReferenceSection, Washington, D.C. 20549-0102. To aid you inobtaining this information, the Funds’ 1940 Act registrationnumber is 811-10475.
Investment management, retirement, trust and planning services
COUNTRY Trust Bank1705 N. Towanda Ave., PO Box 2020Bloomington, IL 61702-2020www.countryinvestment.com
SEC file # 811-10475

COUNTRY Mutual Funds TrustCOUNTRY Growth FundCOUNTRY Bond Fund
Board of TrusteesRobert W. WeldonPhilip T. NelsonWilliam G. BeelerCharlot R. ColeRoger D. GraceWilliam H. OlthoffCarson H. Varner Jr.
OfficersPhilip T. Nelson, PresidentRichard L. Guebert, Jr., Vice PresidentBruce D. Finks, Vice PresidentRobert W. Rush Jr., Vice PresidentJohn D. Blackburn, Vice PresidentErik Gravelle, Vice PresidentDerek C. Vogler, Vice PresidentJames M. Jacobs, Secretary andGeneral Counsel
Alan K. Dodds, TreasurerPeter J. Borowski, ControllerBarbara L. Mosson, Chief Compliance Officerand Anti-Money Laundering ComplianceOfficer
Investment AdvisorCOUNTRY Fund Management, a Department ofCOUNTRY Trust Bank
Bloomington, Illinois
DistributorQuasar Distributors, LLCMilwaukee, Wisconsin
Transfer AgentU.S. Bancorp Fund Services, LLCMilwaukee, Wisconsin
CustodianCOUNTRY Trust Bank1705 N. Towanda Ave.Bloomington, Illinois 61702-2020www.countryinvestment.com
Independent Registered Public Accounting FirmErnst & Young LLPMilwaukee, Wisconsin
General CounselJames M. Jacobs, Esq.Office of the General CounselBloomington, Illinois
This Report has been prepared for the generalinformation of shareholders of the Funds and isnot authorized for distribution to prospectiveinvestors unless preceded or accompanied by aneffective Prospectus which contains detailsconcerning the sales charge and other pertinentinformation.
F30-113-06 (08/09)


