Embed Size (px)
Citation preview

1
Annual Report

The company Hempel A/S
Lundtoftegårdsvej 91
DK-2800 Kgs. Lyngby
Denmark
Tel: +45 4593 3800
Fax: +45 4588 5518
Website: www.hempel.com
CVR no. 59946013
Financial year: 1 January - 31 December
Board of Directors Richard Sand, Chairman
Lars Aaen, Deputy Chairman
Peder Holk Nielsen
Ulf Lennart Holm
Anders Pettersson
Leif Jensen
Ann Louise Krüger Kofoed, elected by the employees
Henrik Bach Falkenberg, elected by the employees
Kim Scheibel, elected by the employees
Executive Board Pierre-Yves Jullien, Group President and CEO
Kim Junge Andersen, Group Executive Vice President and CFO
Auditors PricewaterhouseCoopers
Statsautoriseret Revisionspartnerselskab
Strandvejen 44
DK-2900 Hellerup
Denmark
Bankers Nordea Bank Danmark A/S
HSBC Gruppen
SEB (Skandinaviska Enskilda Banken)
BNP Paribas
2

3
About Hempel
Hempel coatings protect man-made structures – from
wind turbines and bridges to ships and houses – from the
corrosive forces of nature. They also make the world more
attractive by bringing colour to our homes, places of work
and many of the objects that we see everyday.
We maintain a strong focus on R&D, advanced production
techniques and professional coating advice in order to
help our customers reduce maintenance costs, increase
energy efficiency and speed up production processes.
We also provide a full colour palette and colour matching
services so that people can choose the ideal colour to
express their personality or brand.
Our coatings enable structures to remain in active ser-
vice for longer by extending product lifecycles. This helps
reduce the overall environmental impact of each struc-
ture, and increases the overall return on investment for
our customers. We are also committed to conducting
business in a socially responsible manner and we focus
on developing coating solutions that both add value to
our customers and help them achieve their environmental
targets.
Our fouling control systems for ships’ hulls, for example,
reduce vessel fuel consumption and CO2 emissions; we
produce advanced insulating house paints that reduce a
building’s carbon footprint; and our fast-curing protective
coatings ensure line producers use less energy on heat-
ing drying halls.
Hempel is present in more than 80 countries around the
world. We have over 5,200 employees, 24 factories, 48
sales offices and more than 150 stock points located
strategically around the globe – and make sure our cus-
tomers enjoy great service, no matter where they are.
Learn more about Hempel at www.hempel.com
Hempel is a world-leading supplier of protective coatings to the decorative, protective, marine, container and yacht markets.
The Hempel FoundationThe Hempel Foundation is the shareholder of the Hempel Group. Established in 1948, the Foundation’s main objectives are to provide a sound economic base for the operations of the Hempel Group and to ensure our work contributes to development around the world.
To this end, it supports educational projects around the globe, focusing on the education of children in need and research into environmentally sustainable technologies within the coatings industry.
Read more about the Hempel Foundation and its work at www.hempelfoundation.com


5
Report
CEO statement 6
Management’s statement 8
Board of Directors 9
Independent auditor’s report 10
Key �gures 13
Our segments 16
2013 in review 34
Strategy and objectives 38
Special risks 42
Research & Development 44
Corporate responsibility 46
Financial statements
Accounting policies 50
Income statement 60
Balance sheet as at 31 December 62
Statement of changes in equity as at 31 December 64
Cash �ow statement 66
Notes to the �nancial statements 68
Contents
REPORT FINANCIAL STATEMENTS

6
CEO statement: continuing to grow towards 2015
We reviewed and adjusted our One Hempel – One Ambition
strategy plans in 2013. Our goal remains to become one
of the world’s top-10 coatings manufacturers by 2015.
However, the worldwide growth we predicted when de-
veloping the strategy has been lower than anticipated
and, as a result, we now expect more growth will come
from acquisitions. We still know that nothing is bet-
ter than organic growth and we will continue to target
organic growth in the future in all our main segments and
regions. We know this is possible, as shown by the per-
formance of our Protective segment, where we effectively
grew by nine per cent in 2013.
I am confident that our updated strategy will enable us
to reach our goals for 2015 and beyond. The updated
strategy was approved by the Board of Directors in
August, and I would like to thank them for their continued
support and trust, as well as our employees for their
dedication and hard work throughout the year.
Hempel’s performance
Although we did not deliver top-line growth as anticipated,
2013 proved to be a decent year for the Group. Our
revenue reached the same level as 2012 despite a two
per cent increase in volume. This was partly due to the
negative exchange rate effect caused by the declining
US dollar against the euro, as well as a sharper decline
in the Marine Newbuilding segment than anticipated,
where overcapacity in several shipping segments led to
a drop in demand for marine coatings. Our other key
segments, however, performed well. The Protective and
Marine Maintenance segments proved to be our main
growth drivers, while our Decorative segment was on par
with 2012 after a slow start to the year.
In terms of earnings, we have reached a margin level
where we need to be. Our EBITDA of EUR 165 million
was the highest in the Group’s history, while net interest
bearing debt amounted to EUR 133 million, or a ratio of
0.8 to EBITDA. This gives us the room needed to acquire
new companies while also financing organic growth, and
will enable us to grow faster than the market over the
coming years. This strong performance in 2013 was
only possible thanks to the efficiency and productivity
measures implemented over the last few years. These
measures, combined with stable raw material prices and
a controlled change in our segment mix, led to a sig-
nificantly improved gross profit margin, which increased
from 37 per cent in 2012 to 41 per cent in 2013.
One Hempel – One Ambition: stage 3
The profitability we delivered in 2013 came without
compromising the key investments we are making to
ensure a sustainable future for the Group as part of our
One Hempel – One Ambition strategy.
In 2014, we will open new factories in Saudi Arabia and
India, as well as a new headquarters and warehouse
in the US and a high-speed filling line in the UK. We
are also working on new factories and factory expan-
sions in Malaysia, Kuwait and Russia. By 2015, we will
have the capacity to produce approximately 230 million
litres more per year compared to 2010, which will ensure
that we can maintain a steady and timely supply of high-
quality coatings to our customers anywhere on the globe.
We have continued to invest in new staff and better train-
ing for our employees in order to ensure that our sales
and service capabilities are in line with our customers’
expectations. In addition, as a result of our investment
in IT systems, such as our global Customer Relation-
ship Management system, we now better understand the
requirements of our customers and can provide them
with the products, service and technical support they need.
Despite stagnant revenue growth in 2013, our improved ef�ciency and pro�tability has placed us in a strong position to achieve our 2015 targets through a combination of organic and external growth.

With the acquisition of Crown Paints in 2011, we took
our first step towards establishing a strong Decorative
platform in Europe. In the coming years, we will continue
this expansion through the acquisition of a few carefully
selected companies. This work will complement our own
organic growth in Europe, the Middle East and China,
where we are investing in our Decorative brand and
expanding our network of distributors to reach more
customers in more regions.
Over the last few years, our Protective segment has
expanded in key geographical markets and into new sub-
segments to become one of the industry’s strongest global
suppliers. The first full year with Blome International Inc. as
part of the Hempel Group has been a great success and we
have seen significant growth in the Americas as a result.
The global launch of Versiline – a range of high-performance
coatings developed by Blome International Inc. for the
challenging environments encountered in many process
industries – has also helped many of our global customers
solve the challenges of asset protection in extreme condi-
tions. The global marine industry continued to slow down
in 2013, but we remain a key player in marine coatings
and our Marine Maintenance segment showed good growth
during the year. We have continued to invest in product
development and the launch of HEMPAGUARD® has proven
that we can win the technology battle. A new fouling de-
fence product that reduces vessel fuel bills and associated
CO2 emissions by six per cent compared to traditional an-
tifouling products, HEMPAGUARD® has been well accepted
by the industry and saw more than 60 full ship applications
in 2013 alone, despite being launched late in the year.
We still have more work to do as we optimise our Group
and develop our organisation. But we have shown that
we have the ability to adapt and change, and that we are
taking significant steps in the right direction.
The future
It is essential that we continue to focus on developing
the financial, business and organisational capabilities
needed to grow faster than the market. We have started
a number of initiatives in recent years to achieve this,
and I am convinced that we will see a return on our
investments in 2014. Our first priority remains to grow
organically. We have become better at spotting and
assessing opportunities for growth and we have proven
that we can adjust in order to meet changing market
requirements. Our product development already puts
us at the forefront of coatings technology, and we have
now become a more professional organisation and are
better placed to take advantage of opportunities as
they arise, in both new and existing markets. At the
same time, we want to focus more on finding potential
new partners and companies that can broaden our cus-
tomer, geographical and technology base. We will choose
these partners carefully, looking not only at the business
benefits and potential synergies, but also the culture.
We know that the alignment of the two companies’
cultures is essential to the success of any partnership
or acquisition and understand the added value that new
knowledge and skills from another company can bring
to our Group.
Finally, I would like to take this opportunity to thank every-
body who helped make 2013 a successful year for our
Group. I would also like to thank the Board of Directors
of Hempel A/S and the Board of the Hempel Foundation
for their continued support – and I would like to extend
my gratitude to all our customers, business partners and
other stakeholders. Your continued loyalty is extremely
important to us.
Pierre-Yves Jullien
Group President and CEO
7
REPORT FINANCIAL STATEMENTS

8
Management’s statement
The Board of Directors and the Executive Board have
today considered and adopted the Annual Report of
Hempel A/S for the financial year 1 January – 31 De-
cember 2013.
The Annual Report has been prepared in accordance
with the Danish Financial Statements Act.
In our opinion, the parent company’s financial statements
and the consolidated financial statements give a true and
fair view of the assets, liabilities and financial position at
31 December 2013 of the parent company and the Group
and of the results of the parent company’s and the Group’s
operations and the consolidated cash flows for 2013.
In our opinion, the management’s review includes a true
and fair account of the development of the Group and
the parent company’s operations and financial affairs,
the profit for the year and the Group’s and the parent
company’s financial position together with a description
of the principal risks and uncertainties that the Group
and the parent company face.
The Annual Report has been submitted for adoption at
the Annual General Meeting.
Kgs. Lyngby, 1 April 2014.
Board of Directors
Executive Board
Lars AaenDeputy Chairman
Kim Junge AndersenGroup Executive Vice President and CFO
Pierre-Yves JullienGroup President and CEO
Richard SandChairman
Peder Holk Nielsen
Ulf Lennart Holm Anders Pettersson Leif Jensen
Ann Louise Krüger KofoedElected by the employees
Henrik Bach FalkenbergElected by the employees
Kim ScheibelElected by the employees

Anders Pettersson Peder Holk Nielsen Leif Jensen Henrik Bach FalkenbergLars Aaen
Richard Sand Ulf Lennart HolmKim Scheibel Ann Louise Krüger Kofoed
Board of Directors
9
REPORT FINANCIAL STATEMENTS

10
Report on consolidated financial statements and parent company financial statementsWe have audited the consolidated financial statements
and the parent company financial statements of Hempel
A/S for the financial year 1 January to 31 December
2013, which comprise accounting policies, income state-
ment, balance sheet, statement of changes in equity and
notes for both the Group and the parent company, as well
as consolidated cash flow statement. The consolidated
financial statements and the parent company financial
statements are prepared in accordance with the Danish
Financial Statements Act.
Management’s responsibility for the consolidated
financial statements and the parent company
financial statements
Management is responsible for the preparation of consol-
idated financial statements and parent company financial
statements that give a true and fair view in accordance
with the Danish Financial Statements Act, and for such
internal control as management determines is necessary
to enable the preparation of consolidated financial state-
ments and parent company financial statements that are
free from material misstatement, whether due to fraud
or error.
Auditor’s responsibility
Our responsibility is to express an opinion on the con-
solidated financial statements and the parent company
financial statements based on our audit. We conducted
our audit in accordance with International Standards on
Auditing and additional requirements in accordance with
Danish audit regulation. This requires that we comply
with ethical requirements and plan and perform the audit
to obtain reasonable assurance whether the consolidated
financial statements and the parent company financial
statements are free from material misstatement.
An audit involves performing audit procedures to obtain
audit evidence about the amounts and disclosures in
the consolidated financial statements and the parent
company financial statements. The audit procedures
selected depend on the auditor’s judgment, including the
assessment of the risks of material misstatement of the
Independent auditor’s reportTo the shareholders of Hempel A/S

1111
REPORT FINANCIAL STATEMENTS
consolidated financial statements and the parent com-
pany financial statements, whether due to fraud or error.
In making those risk assessments, the auditor considers
internal control relevant to the company’s preparation of
consolidated financial statements and parent company
financial statements that give a true and fair view in or-
der to design audit procedures that are appropriate in
the circumstances, but not for the purpose of express-
ing an opinion on the effectiveness of the company’s
internal control. An audit also includes evaluating the
appropriateness of accounting policies used and the
reasonableness of accounting estimates made by man-
agement, as well as evaluating the overall presentation
of the consolidated financial statements and the parent
company financial statements.
We believe that the audit evidence we have obtained
is sufficient and appropriate to provide a basis for our
audit opinion.
The audit has not resulted in any qualification.
Opinion
In our opinion, the consolidated financial statements and
the parent company financial statements give a true and
fair view of the financial position of the Group and the
company at 31 December 2013 and of the results of
the Group and company operations as well as the con-
solidated cash flows for the financial year 1 January - 31
December 2013 in accordance with the Danish Financial
Statements Act.
Statement on management’s review We have read management’s review, pages 6-7 and 13-
49, in accordance with the Danish Financial Statements
Act. We have not performed any procedures additional to
the audit of the consolidated financial statements and
the parent company financial statements. On this basis,
in our opinion, the information provided in management’s
review is consistent with the consolidated financial state-
ments and the parent company financial statements.
Kgs. Lyngby, 1 April 2014.
PricewaterhouseCoopersStatsautoriseret Revisionspartnerselskab
Mads MelgaardState Authorised Public Accountant
Lars BaungaardState Authorised Public Accountant


13
Key �gures
Key figures in EUR million
Pro�t 2013 2012 2011 2010 2009
Revenue 1,239 1,242 1,077 889 714
EBITDA 165 126 105 118 93
Amortisation, depreciation and impairment 40 43 34 27 20
Operating pro�t 125 83 72 92 73
Income from investments in associates 2 3 2 2 4
Net �nancials (19) (21) (13) (7) (12)
Pro�t before tax 108 65 61 87 66
Net pro�t for the year 65 35 35 53 44
Balance
Balance sheet total 1,061 1,067 1,064 763 600
Equity 381 356 327 316 265
Cash �ows
Cash flow from:
Operating activities 146 128 63 31 127
Investing activities (44) (36) (192) (60) (103)– including net investments in property, plant and equipment and intangible assets (45) (28) (32) (40) (25)
Financing activities (59) (63) 127 (56) 67
Change in cash and cash equivalents 43 29 (2) (85) 91
Employees
Average number of employees 5,029 4,977 4,468 3,638 2,867
Ratios (%)
Gross margin 40.5 37.2 34.3 36.0 38.8
Operating pro�t margin 10.1 6.7 6.6 10.3 10.3
Return on assets 11.7 7.8 7.8 13.4 14.4
Solvency ratio 35.9 33.3 30.6 41.4 44.2
Return on equity 17.6 10.1 10.8 18.2 18.7
For de�nitions, see Accounting policies.
REPORT FINANCIAL STATEMENTS


16
Decorative: colourful coatings to protect and enhance homes, both inside and out
Hempel’s Decorative segment saw volume growth in
2013. In the Middle East, our investments paid off and
we experienced significant growth despite a highly com-
petitive market. In the UK, we exceeded market growth
significantly with a good result. In China, we delivered
satisfactory results in a declining market.
The UK is our largest Decorative market and in 2013 we
continued to build our Crown and Sandtex brands in the
country through the sponsorship of high profile TV pro-
grammes. These sponsorships reached over 13 million
targeted customers, helping reinforce our strong market
position. The Crown brand also introduced a new pack-
aging design that enhances its colour credentials while
introducing the iconic splash symbol.
As part of our growth plans in the UK, we extended our
network of Crown Decorating Centres to 133, and we
completed a new high-speed filling line at our site in Hull
in order to increase production efficiency.
In the Middle East, our second largest Decorative region,
we launched several products from the Contex family
targeted specifically to large real estate development
projects and saw an increase in sales in this important
sub-segment. We increased the number of Hempel re-
tailers in the region, mainly in Qatar and Saudi Arabia,
and launched an extensive branding campaign in Saudi
Arabia that included mall stands, outdoor posters and a
new Decorative webpage.
We continued work on our first factory dedicated solely
to the manufacture of waterborne coatings in the Middle
East. Located in Jeddah in Saudi Arabia, the factory will
open at the start of 2014 and will improve our capacity
and production efficiency in the region.
In China, we expanded our customer portfolio of large
real estate developers, despite a slowdown in the con-
struction industry. We also significantly extended our
distributor network. Many of these distributors will sell
both Decorative and Protective products and we expect
to see a clear growth from this initiative in the coming
years.
Our Decorative coatings help homeowners around the world express themselves through colour while protecting their homes against wear and tear.

REPORT FINANCIAL STATEMENTS

18
Decorative in focus: bringing colour to the Kuwaiti suburbs
85 kilometres south of the Kuwaiti capital, the desert
is being transformed into a new modern city. Owned
by the Kuwait Public Authority of Housing and financed
by the government of Kuwait, the Sabah al Ahmad City
project will turn two million square metres of land into a
vibrant, colourful living area – replete with villas, schools,
mosques, hospitals, recreational areas and shops – by
the end of 2014.
Hempel was chosen as a preferred coatings supplier for
the project thanks to our premium product assortment
and advanced production facilities, which can ensure the
long-term supply of high-quality coatings to projects in the
country. We have also been named a preferred supplier
for all major companies and ministries involved in projects
financed by the Kuwaiti government.
In 2013, we supplied all major development projects in
Kuwait, including two million litres of interior and exterior
coatings for the Sabah al Ahmad City project.
Hempel chosen as preferred supplier for a project that will turn an entire desert area into a new city.

19
REPORT FINANCIAL STATEMENTS

20
Protective: coatings that add value to businesses across the globe
Protective markets around the world continued to show
slow growth in 2013. Traditional high-growth markets –
such as China and India – stabilised at a lower level
than previously, while more mature markets settled into
single-digit growth rates.
Despite this, Hempel’s Protective segment continued its
strong growth trend, increasing its overall global market
share in 2013. This was mainly driven by China and the
US, where we further expanded market presence, as well
as satisfactory growth in Europe. The Middle East was
the only region where we experienced a negative trend,
due to the cancellation or delay of a number of projects.
Our traditional sub-segments, including Oil & Gas, Power
Generation and Infrastructure, all contributed to growth,
while our focus on new sub-segments achieved good re-
sults, especially Rail Cargo Wagons.
In 2013, we focused on establishing a network of third-
party distributors and further strengthening our position
as a global multi-segment provider. This included expand-
ing our Multinational Coordination Team to ensure that
any multinational client, anywhere in the world, has ac-
cess to cross-border project coordination and trouble-
free coatings delivery.
We increased our product portfolio during 2013, by con-
tinuing the global launch of HEMPACORE® (our passive
fire protection range) and launching the Versiline range
on the global market for the first time.
Already proven in the US, Versiline coatings offer superior
protection against extreme abrasion, high temperatures
and a wide range of chemicals – making them ideal for the
challenging environments encountered in many process
industries, from power generation to food processing.
Interest in the Versiline range has been strong and we
will continue to invest in helping our customers solve the
challenges of asset protection in extreme environments.
From bridges to power stations and oil rigs, our coatings help customers lower maintenance costs, increase production speeds and reduce energy use.

REPORT FINANCIAL STATEMENTS


23
Protective in focus: coating the cranes that load your cargo
Terminal Investment Limited (TIL) develops and manages
container terminals, often in joint ventures with other
major terminal operators, and is one of the largest and
most geographically spread terminal businesses in the
world.
Over the coming years, TIL plans to invest in new termi-
nals in Europe, the Americas and India. The terminals
require ship-to-shore cranes and rubber tyred gantry
cranes to move and load goods. TIL has specified Hempel
as its sole crane coatings supplier even though it will
source the cranes from a number of manufacturers.
As part of the agreement, we will provide comprehen-
sive technical service to the different manufacturers to
ensure efficient and accurate application of our coatings
during production, as well as on-site maintenance support.
Hempel signs agreement to coat all new terminal cranes for Terminal Investment Limited.
REPORT FINANCIAL STATEMENTS
The most efficient way to move goods
Shipping is seen as the most cost and energy ef�cient way of transporting goods. Around 160 million TEUs (twenty-foot equivalent units) of containerised cargo are transported by sea each year, making it the world’s most dominant form of cargo transport.

24
Marine: helping shipowners bring down the total cost of vessel operation
The global marine fleet grew significantly between 2009
and 2011. This has led to overcapacity in several ship-
ping segments and a drop in demand for new vessels.
Despite signs of the newbuilding industry stabilising
towards the end of 2013, industry focus remains clearly
on decreasing the total cost of vessel operation and
improving the fuel efficiency of existing and new vessels.
Our goal remains to offer efficient coating solutions that
provide significant cost-saving benefits for ship opera-
tors. As a result, our share of the marine market grew
in 2013, despite the overall market slowdown. This was
mainly driven by the Marine Maintenance sub-segment,
particularly drydock, where our fuel-saving hull coatings
have been very well accepted by the industry.
In 2013, we launched several new products aimed
at helping customers reduce operating costs. This in-
cluded HEMPAGUARD®, a fouling defence product that
promises to have the most significant impact on vessel
fuel consumption – and associated CO2 emissions – for
many years. The only product of its kind to come with
a Customer Satisfaction Guarantee, HEMPAGUARD®
delivers average fuel savings of six per cent a year
compared to conventional antifoulings, even during vessel
idle periods of up to 120 days, and has seen several dry-
dock applications each week since it was first launched
on the market in September 2013.
In 2013, we completed the launch of our high-solids
antifouling range with the introduction of GLOBIC 6000
and GLOBIC 9000. Based on proven NCT technology,
these products deliver outstanding antifouling perfor-
mance and contain less volatile organic compounds
than previous formulations. In total, more than 10,000
vessels have been coated with proven NCT technology
since it was first launched.
We also launched HEMPADUR IMPACT 47800 a new
cargo hold coating for bulk carriers that ensures ves-
sels spend less time in drydock and significantly reduces
maintenance costs for owners.
Hempel provides advanced coatings and technical service for every type of marine vessel, from large crude oil carriers to river-bound barges.

REPORT FINANCIAL STATEMENTS

26
Marine in focus:HYUNDAI GENERAL returns for even greater fuel savings
Hempel’s advanced fouling control coatings stop fouling
organisms – such as algae and biological slime – from
attaching to a ship’s hull. This ensures the ship main-
tains a smooth hull, which improves hydrodynamics
and helps reduce fuel consumption and associated CO2
emissions by up to eight per cent a year.
The HYUNDAI GENERAL started using Hempel’s fouling
control coatings back in February 2009 when it was
blasted to its bare steel at Sembawang Shipyard in
Singapore and coated with HEMPASIL 77500, a 2nd
generation biocide-free fouling release system.
Since then, the vessel owners have taken advantage of
standard repair stops to upgrade the vessel’s fouling
control system to new Hempel technology. The ship’s
hull was repaired with HEMPASIL X3 in 2011 and the
entire hull was recoated with HEMPAGUARD® X7 in
January 2014.
HEMPAGUARD® is the only fouling control product on the
market to come with a Customer Satisfaction Guarantee.
Combining silicone-hydrogel and full diffusion control
of biocides in a single coat, HEMPAGUARD® delivers
average fuel savings of six per cent a year compared to
standard antifouling systems, even during vessel idle
periods of up to 120 days. Unlike other systems, it also
retains its effectiveness if a vessel switches between
slow and fast steaming.
Keen to take advantage of the increased fuel savings
and operational flexibility promised by HEMPAGUARD®,
the owners brought the HYUNDAI GENERAL into the
Chengxi Shipyard in China in 2014. After high pressure
fresh water washing, the vessel’s hull coatings – both
HEMPASIL 77500 and HEMPASIL X3 – were in excellent
condition. Areas damaged by mooring and anchors were
repaired, and HEMPAGUARD® X7 was applied on the
entire underwater area.
For customers, switching to new fouling defence coat-
ings in order to take advantage of the increased fuel
savings offered by new technology is made easier
by Hempel’s state-of-the-art tie-coats. NEXUS is an
advanced three-component tie-coat designed specifically
to deliver perfect adhesion between epoxy and silicone
coatings; NEXUS X-SEAL creates perfect adhesion be-
tween antifouling and silicone coatings; and NEXUS
X-TEND enables the swift repair of old silicone systems
before applying a new coating.
68,000 DWT container vessel takes advantage of standard repair intervals to step up its fouling control system to HEMPAGUARD® X7.

REPORT FINANCIAL STATEMENTS


29
Container: high-performance coatings and solutions for the container industry
Shipping is seen as the most cost and energy efficient
way of transporting goods and around 160 million TEUs
(twenty-foot equivalent units) of containerised cargo
– from consumer and industrial products to liquids and
refrigerated goods – are transported by sea each year,
making it the dominant form of cargo transport in the
world.
However, the container market has been shrinking for a
number of years and the amount of containers produced
worldwide dropped again in 2013. Hempel’s Container
segment has been affected by this slowdown.
As well as working to help container manufacturers reduce
production costs, Hempel is driving the development of
environmentally sustainable solutions for the container
industry.
Launched in 2010, EcoBoxcoat is a fully waterborne
range of products for container manufacturers that has
proven to perform as well as, or better than, equivalent
solvent-borne systems. EcoBoxcoat ensures that Hempel
is well placed to lead the industry when it begins to
recover, especially if tougher environmental regulations
are introduced to reduce emissions of volatile organic
compounds from the container industry.
Hempel coatings protect containers around the globe from harsh cargoes, bad weather and rough treatment.
REPORT FINANCIAL STATEMENTS

30
Yacht: helping yachting enthusiasts keep sailing
Hempel’s Yacht business is concentrated in Europe,
and the European yacht newbuilding industry has been
declining for a number of years. Despite a stablisation
in the industry in Southern Europe in 2013, many yacht
construction companies closed during the year. There-
fore, we have concentrated on increasing our visibility
and accessibility among sailing enthusiasts, particularly
those looking for maintenance and boat care products.
In 2013, this included developing a new Hempel Yacht
website dedicated to providing sailing enthusiasts with
advice on how to maintain their boat. Launched at the
start of 2014, the website includes videos and tutorials
for a range of boat care tasks, as well as the latest in-
formation on our broad range of products.
We launched SILIC ONE, a new fouling release product
for yachts, at the start of 2013. Building on our exten-
sive experience from the marine industry, SILIC ONE
combines silicone and hydrogel to protect a yacht’s
hull against fouling organisms, such as barnacles and
biological slime. This ensures the yacht maintains a
smooth hydrodynamic hull to increase sailing speeds
and reduce fuel consumption. SILIC ONE is also easy to
clean and re-apply, making it ideal for both professional
users and sailing enthusiasts.
From large racing yachts to small motorboats, we produce the full range of yacht coatings and boat care products.
The new Hempel Yacht website gives sailing enthusiasts all the information they need to maintain their boats in perfect condition. You can see the site at: www.hempel.com/yacht

REPORT FINANCIAL STATEMENTS


34
2013 in reviewOne Hempel – One Ambition strategy continued in 2013
We saw lower sales growth in 2013 than anticipated.
However, the launch of new products and the resulting
change in the product mix led to increased profitability.
Due to the lower than planned organic growth, we have
now decided that more growth needs to come from stra-
tegic acquisitions.
In 2013, the Hempel Group’s revenue reached the same
level as 2012 despite an increase in volume of two per
cent. This was partly due to the negative exchange rate
effect caused by the declining US dollar against the euro.
Using exchange rates comparable to 2012, our revenue
grew three per cent in 2013.
The Protective and Marine Maintenance segments con-
tinued to grow during 2013 and proved to be our main
growth drivers. Our Decorative segment was on par with
2012, despite a slow start to the year. As anticipated,
sales in the Marine Newbuilding sub-segment fell due
to significant reductions in the Korean and Chinese
newbuilding markets. Our Container and Yacht seg-
ments both saw slight declines during 2013 and the
Hempel Group’s total organic revenue growth failed to
meet our ambitious targets.
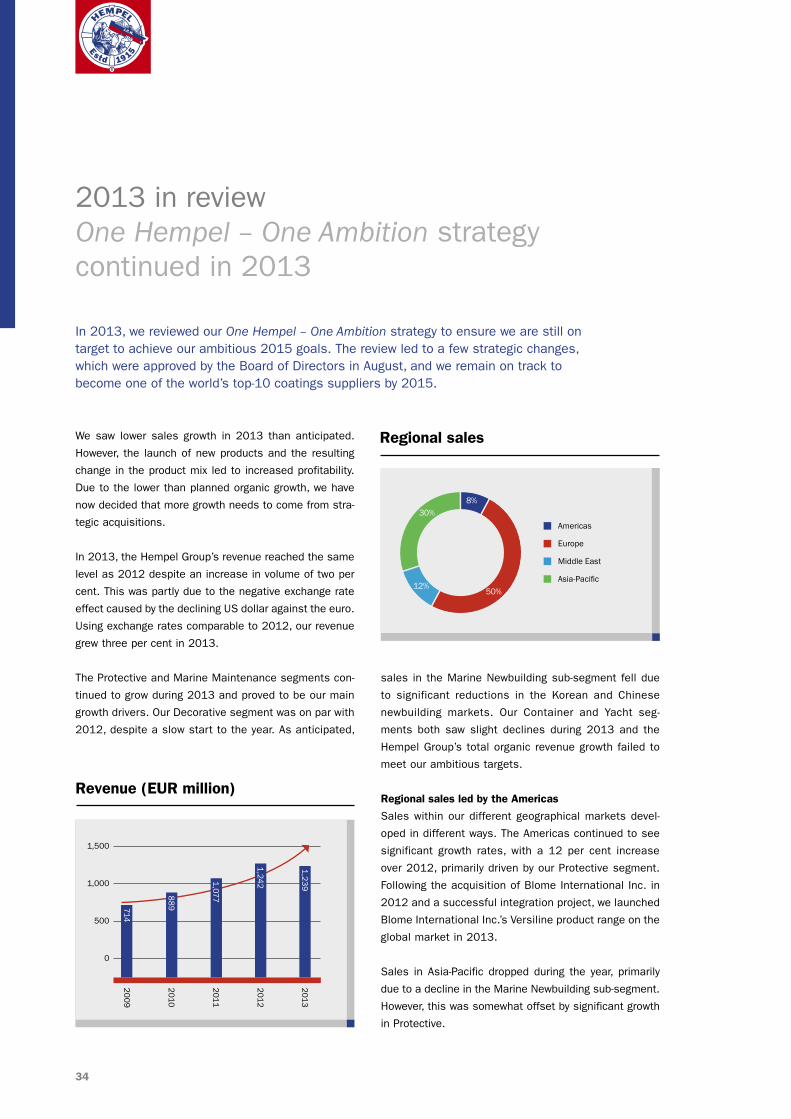
Regional sales led by the Americas
Sales within our different geographical markets devel-
oped in different ways. The Americas continued to see
significant growth rates, with a 12 per cent increase
over 2012, primarily driven by our Protective segment.
Following the acquisition of Blome International Inc. in
2012 and a successful integration project, we launched
Blome International Inc.’s Versiline product range on the
global market in 2013.
Sales in Asia-Pacific dropped during the year, primarily
due to a decline in the Marine Newbuilding sub-segment.
However, this was somewhat offset by significant growth
in Protective.
In 2013, we reviewed our One Hempel – One Ambition strategy to ensure we are still on target to achieve our ambitious 2015 goals. The review led to a few strategic changes, which were approved by the Board of Directors in August, and we remain on track to become one of the world’s top-10 coatings suppliers by 2015.
Regional sales
Americas
Europe
Middle East
Asia-Pacific
8%
50%12%
30%
0
500
1,000
1,500
2009
2010
2011
2012
2013
714
889
1,077
1,242
1,239
Revenue (EUR million)

35
REPORT FINANCIAL STATEMENTS
In the Middle East, revenue dropped slightly, mainly due
to the impact of exchange rates. Europe achieved similar
revenue to 2012.
Gross profit margin continues to grow
Our focus on restoring gross profit continued in 2013
with positive results. We increased focus on profit
margins when developing new product solutions as well
as the cost structures in our factories. Combined with
stable raw material prices and a controlled change in
our segment mix, this resulted in a significant improve-
ment in the Group’s gross profit. In 2013, the Hempel
Group achieved a gross profit margin of 40.5 per cent,
compared to 37.2 per cent in 2012.
We continued to increase efficiency and thereby im-
proved our control of fixed expenses. We further invested
in new employees, especially in sales, marketing and
R&D. However, the resulting increase in expense was
offset by declining amortisations, depreciations and
costs for bad debt and claims. We are continuing a
number of productivity and efficiency projects into 2014
to ensure that this positive trend continues.
An improving EBITDA margin
After a period of significant strategic investments, the
EBITDA margin rebounded in 2013 thanks to a significant
increase in gross margin and our control of expenses. The
EBITDA margin was 13.3 per cent compared to 10.2 per
cent in 2012.
The EBITDA amounted to EUR 165 million compared to
EUR 126 million in 2012. This is a significant improve-
ment and the highest EBITDA recorded in the Group’s
history.
The Hempel Group’s operating profit for 2013 amounted
to EUR 125 million compared to EUR 83 million in 2012.
The operating profit margin improved, rising from 6.7 per
cent in 2012 to 10.1 per cent in 2013. Interest rates
remained low and the net financials amounted to EUR
19 million, just below the 2012 level.
After income tax of EUR 30 million and minority interests
of EUR 13 million, the Hempel Group’s net profit amounted
to EUR 65 million. The Group’s effective tax rate was 29
per cent, compared to 30 per cent in 2012.
0
50
100
150
200
2009
2010
2011
2012
2013
93
118 105
126
165
EBITDA (EUR million)

36
Change in equity
The company’s equity increased to EUR 381 million from
EUR 356 million in 2012, corresponding to a solvency
ratio of 36 per cent. Equity was mainly affected by net
profit and the dividend of EUR 25 million paid to the
Group’s shareholders in 2013.
CAPEX: new factories and head office
Our planned expansion of production capacity continued
in 2013 with new factories in Jeddah, Saudi Arabia, and
Mumbai, India, which will open in 2014. We also began
construction of a new factory in Ulyanovsk, Russia, which
is planned to open in 2015. The Hempel Group’s new
head office was finalised and inaugurated in 2013 and
our former headquarters and production site were sold
with a booked profit of EUR 3 million, which is included
in 2013 under operating income.
Significant decrease in working capital
Working capital decreased significantly during 2013,
amounting to EUR 255 million compared to EUR 289
million at the end of 2012. The drop of EUR 34 mil-
lion was a result of our increased focus on accounts
receivable and stronger control of our inventories, which
continued to decline throughout 2013. Our focus on
accounts receivable will continue during 2014.
Strong cash flow
The Hempel Group’s cash flow continued to be strong.
The cash flow from operating activities ended 2013 at
EUR 146 million, EUR 18 million above 2012, or close to
19 per cent of EBITDA.
The high level of investment activities continued through-
out 2013. Our capacity expansion projects and new head
office were our most significant investments during the
year. In addition, we completed our global Enterprise Re-
source Planning system in Europe and Asia-Pacific and
continued rollout in the Americas.
Capital resources
Operational credit facilities provided by the relationship
banks of the Hempel Group amounted to EUR 180 million
at the end of 2013 compared to EUR 170 million at the
end of 2012. The facilities are a mix of current and non-
current agreements.
The term loan obtained in connection with acquisitions
in 2009 and 2011 amounted to EUR 194 million at the
end of 2013. The term loan is repaid with EUR 25 million
annually and matures in 2016 with a final repayment of
EUR 145 million.
At the end of 2013, net interest bearing debt amounted
to EUR 133 million compared to EUR 192 million at the
end of 2012, or a ratio of 0.8 to EBITDA.
Increasing number of employees
The average number of employees increased to 5,029
during 2013 from 4,977 in 2012.
0
50
100
150
2009
2010
2011
2012
2013
127
31
63
128
146
Cash flow from operating activities (EUR million)
2,500
3,500
4,500
5,500
2009
2010
2011
2012
2013
2,867
3,638
4,468
4,977
5,029
Average number of employees

REPORT FINANCIAL STATEMENTS

38
Strategy and objectives
The growth required in our five-year strategy is expected
to be achieved through three key areas: we will continue
to grow our Decorative segment, mainly through acquisi-
tions, and increase our market presence in the Protective
and Marine segments.
The acquisition of Crown Paints in 2011 was the first
step towards establishing a sustainable platform for
Hempel in Europe within the Decorative segment. Fol-
lowing a very successful integration, we are now ready
to take the next step in the expansion of our Decora-
tive business through the acquisition of a few carefully
selected companies in Europe. We will also continue to
grow our Decorative presence in the Middle East and
China, mainly by investing in our existing brand and
expanding our customer base.
Protective is our fastest-growing segment and we are
seeing the benefits of a strong and established global
Protective platform. Over the last few years, we have
expanded in key geographical markets and established
leading positions in well-established markets to become
one of the industry’s strongest global suppliers with the
capability to serve customers throughout the world. We
will continue to invest in developing new solutions and
enlarging our customer base with the aim of becoming
the world’s leading protective coatings supplier.
Traditionally, the Marine segment has been our strongest
business platform and it continues to be an important
strategic business for the company. Our Marine business
declined during 2013, mainly due to a sharp reduction in
the number of new vessels being built around the world,
as well as our decision to reduce business risk for a
period of time due to the financial uncertainties sur-
rounding many shipowners and shipyards.
Hempel is recognised as a reliable Marine supplier of
advanced coating technology. We have continued to
invest in cutting-edge technology and the recent launch
of our new fouling defence product, HEMPAGUARD®,
demonstrates our continuing ability to meet customer
demands for coating systems that add value to their
business. We plan to improve our market position in the
coming years by continuing to focus on technology devel-
opment and expanding our customer base.
Our growth strategy requires investment in our support
functions, from production to sales and training. We are
increasing production capacity in a number of countries,
including new factory projects in Russia, Saudi Arabia
and India. Our sales and service organisations are being
expanded and we are increasing our internal training pro-
grammes through the Hempel Academy to ensure that
our sales and service capabilities are in line with those
of a leading global coatings company.
Hempel is continuing its �ve-year strategy, One Hempel – One Ambition, with the goal of becoming one of the world’s top-10 largest coatings suppliers by 2015 in order to better leverage economies of scale across the Group.

39
REPORT FINANCIAL STATEMENTS
Over the coming years, we are planning to significantly
increase spending within marketing and R&D in order to
ensure we can deliver solutions and support that enable
us to gain market share in all our business segments.
Expectations for the year ahead
The marine market remains cautious and we do not
expect any significant improvements in the overall busi-
ness climate. However, we anticipate that the marine
newbuilding market will level off after the sharp decline
seen during 2013.
Market developments in many parts of the world have
been affected by the economic situation in China and
the US and our business and revenue in both markets
is expected to develop positively compared to 2013.
Our growth opportunities in Europe will be driven by the
German and Russian markets, which appear to be recov-
ering slowly after the global financial crisis.
Overall, we expect to see a growth in revenue and believe
that we will be able to maintain the level of earnings
achieved during 2013.


42
Special risks
Currency risks
As significant parts of the Hempel Group’s activities are
carried out beyond the Eurozone, there is considerable
currency risk relating to the US dollar, US dollar-linked
currencies and the British pound. It is our policy to hedge
our transactional currency risk, primarily by achieving a
natural balance between selling and purchasing cur-
rencies, but also through the use of standard financial
instruments.
Emerging market currency risk is hedged on a case-by-
case basis when possible and deemed cost effective.
As a general rule, translation risks relating to invest-
ments in foreign subsidiaries and associates are not
hedged. This is because we believe currency hedging of
this type of long-term investment is not optimal from an
overall risk and cost perspective.
Interest rate risks
The Hempel Group’s loan portfolio with banks is on a
floating interest rate basis. In order to reduce interest
cost fluctuations, part of our loan portfolio has been
swapped to fixed-term interest rates using standard fi-
nancial instruments.
Credit risks
Credit risk related to trade receivables is managed
locally in the operating entities and credit limits are set
as deemed appropriate for the customer. Our company
policy is to rate major customers and business partners
on a current basis. Hempel has no material risks relating
to single customers or business partners.
Credit risk related to cash, investments and financial
instruments is managed by Group Treasury. The Group’s
strategy is to set minimum credit ratings for financial
counterparties and monitor these on a regular basis.
Risk managementRisk management is characterised by systematic management practices that enable us to assess and monitor risk and improve the way identified risks are managed. The Risk Management Wheel is the effective framework that we use when we assess risks in the Hempel Group. To support this process, we have created the Risk Assessment Workshop (RAW) tool, which helps facilitate our risk management work. The RAW tool is consistent with the existing generic frameworks that are considered best practice.
Risk management
Risk identification
Risk assessment & prioritising
Risk analysis
Risk handling
Risk review & reporting
1
2
3
4
5

REPORT FINANCIAL STATEMENTS

44
Research & Development: constantly working to improve and innovate
At Hempel, we are constantly working to develop new
products and formulations that help customers achieve
additional benefits, from saving energy and reducing fuel
consumption to increasing line speeds. A consideration
for health, safety and the environment is also a natural
part of our work, and we develop products that meet or
exceed both technical specifications and environmental
legislation.
Decorative: focusing on sustainability
Hempel introduced Topaz Zero, a new range of environ-
mentally friendly products, in the Middle East in 2013.
Along with our Ecolabel products in Spain and the UK,
the new range underlines our commitment to developing
a greener product assortment.
We are committed to achieving sustainable operations
across the production process, from the choice of raw
materials to the recycling of excess post-consumer paint.
As a result of our work in this area, our UK Decorative
organisation won a number of sustainability awards in
2013, including being named Sustainable Manufacturer
of the Year by the UK Manufacturer’s Organisation.
Protective: the full coatings package
Developed by Blome International Inc., Versiline coatings
offer superior protection against extreme abrasion, high
temperatures and a wide range of chemicals – making
them ideal for the challenging environments encountered
in many process industries. In 2013, we worked exten-
sively to utilise these products for other markets and
the Versiline range was launched globally towards the
end of the year.
HEMPACORE®, our passive fire protection range, was
launched in Europe towards the end of 2012. In 2013,
HEMPACORE® was certified in the Middle East, the
Americas, China and Russia. We have also adjusted the
products to make them compatible with more substrates,
primers and topcoats and are now working on a new water-
borne passive fire protection product, HEMPACORE AQ.
Marine: reducing fuel consumption and CO2 emissions
Launched in 2013, HEMPAGUARD® is a fouling defence
product that promises to have the most significant im-
pact on vessel fuel consumption – and associated CO2
emissions – for many years. Based on ActiGuard® tech-
nology, HEMPAGUARD® coatings retain small amounts
of biocide on the hull’s surface, which activate hydrogel
polymers in the coating to keep fouling organisms at bay,
even under the toughest service conditions, while utilis-
ing a minimum amount of biocide.
The success of products such as HEMPAGUARD® partly
depends on the global fleet’s ability to measure and
benchmark fuel efficiency. We are an active player in
developing new ISO/TC 8/SC 2/WG 7 standards that
will create a framework for measuring changes in hull
and propeller performance in order to clarify how fuel
efficiency is measured across the industry.
In addition, HEMPADUR MULTI-STRENGTH GF 35870
achieved the Lloyd’s Register “Recognised Abrasion Re-
sistant Ice Coating” certificate in 2013 and the coating
has since been applied on more than 100 vessels, many
of which operate in tough ice conditions.
We also launched a new dedicated cargo hold coating,
HEMPADUR IMPACT 47800. With 76 per cent volume
solids, superior impact resistance, high abrasion re-
sistance and the shortest time-to-first-hard-cargo in the
industry, the product promises to extend major repair
intervals and reduce operating costs for bulk carrier
operators.
With a strong focus on R&D, our goal is to develop coatings that deliver extra value to customers.

45
HSE: the drive for sustainable products
Paints are, by nature, sustainable products, as they
prolong the service life of structures and equipment.
However, we believe that a prolonged lifetime is not
enough, and so we constantly work to develop safer and
more environmentally sustainable solutions.
In recent years, legislation has been driven by measures
such as the EU’s regulation on chemical use (REACH)
and limits on the use of volatile organic compounds.
Hempel is actively involved in this process. We were
among the first European companies to adopt REACH,
for example, and are in constant dialogue with the EU
Commission about industry issues.
As part of our work to develop sustainable products, we
focus on a number of areas:
•Increasing resource efficiency (raw materials,
energy and finished products)
•Increasing functionality, such as improving
energy efficiency or eradicating bacteria
•Increasing the life expectancy of our products
•Reducing the amount of volatile organic
compounds used
REPORT FINANCIAL STATEMENTS

46
We require that our employees follow the same Hempel
values wherever they work. Our Code of Conduct and
Business Ethics policy give our employees guidelines
to ensure they conduct business ethically and profes-
sionally at all times, and all our employees underwent
training in our Code of Conduct and Business Ethics
policy in 2012 and 2013. In 2013, we extended our
business ethics focus to our suppliers, external agents
and distributors to ensure that we only work with
external partners who share our business values.
As an employer, we are committed to eliminating any form
of negative discrimination in our places of work. We have
a policy in place that ensures all employment and career
development decisions are based on merit and are made
to support business goals. Currently, there are no female
Non-Executive Directors on the Board of Directors of
Hempel A/S, however a new policy states that the Board
will have a least one female Non-Executive Director before
the Annual General Meeting in spring 2017.
However, corporate responsibility is about more than just
setting guidelines and goals. We want all our employees
and partners to continually consider the effect of their
daily work on society and the environment, and there
were a number of examples of this in 2013.
In the UK, our Decorative organisation launched a num-
ber of initiatives to improve sustainability, including
asking employees to drive enthusiasm for environmental
practice by becoming Green Ambassadors – to date
more than 1,200 employees have taken the role – and
launching a “Kick Out the Can” campaign to encourage
consumers to gather and recycle unused paint. As a
result of these initiatives, our UK Decorative organisa-
tion won a number of awards in 2013, including being
named Sustainable Manufacturer of the Year by the UK
Manufacturer’s Organisation.
In addition, our factory in Dammam in Saudi Arabia im-
plemented new procedures that reduced wastewater by
21 per cent and hazardous waste by 15 per cent, and
we completed construction of our first factory dedicated
solely to producing waterborne coatings in the Middle
East. Located in Jeddah in Saudi Arabia, the factory will
begin operating early in 2014.
Our corporate donation through the Hempel Foundation
is also an integrated part of what we do and the way
we behave. We currently support 18 different projects
around the world, working with others to give more than
30,000 children in need the opportunity to get a good
education and the chance to build a better future for
themselves, their families and their communities.
Our Corporate Responsibility Report provides a detailed
account of our work and goals in these and other areas,
as well as additional information as required by the
Danish Financial Statements Act (Årsregnskabsloven)
§99a and §99b.
You can find the Hempel Corporate Responsibility Report
2013 at: www.corporate-responsibility.hempel.com
Corporate responsibility
As a company, we understand that being a good corporate citizen is essential to the success of our business.

REPORT FINANCIAL STATEMENTS


50
Accounting policies:General
The Annual Report of Hempel A/S for 2013 has been
prepared in accordance with the provisions of the Danish
Financial Statements Act (Årsregnskabsloven) applying
to large enterprises of reporting class C.
The accounting policies applied remain unchanged from
previous years. The Annual Report for 2013 is presented
in EUR millions.
Recognition and measurement
Revenues are recognised in the income statement as
earned. Furthermore, value adjustments of financial as-
sets and liabilities measured at fair value or amortised
costs are recognised.
Moreover, all expenses incurred to achieve the earnings
for the year are recognised in the income statement,
including depreciation, amortisation, impairment losses
and provisions as well as reversals due to changed
accounting estimates of amounts that have previously
been recognised in the income statement.
Assets are recognised in the balance sheet when it is
probable that future economic benefits attributable to
the asset will flow to the Group, and the value of the
asset can be measured reliably.
Liabilities are recognised in the balance sheet when it
is probable that future economic benefits will flow out of
the Group, and the value of the liability can be measured
reliably. Assets and liabilities are initially measured at
cost. Subsequently, assets and liabilities are measured
as described for each item below.
Recognition and measurement take into account predict-
able losses and risks occurring before the presentation
of the Annual Report which confirm or invalidate affairs
and conditions existing at the balance sheet date.
Euro (EUR) is used as the presentation currency. All oth-
er currencies are regarded as foreign currencies.
Basis of consolidation
The consolidated financial statements comprise the
parent company, Hempel A/S, and subsidiaries in which
the parent company directly or indirectly holds more than
50 per cent of the votes or in which the parent company,
through share ownership or otherwise, exercises control.
Enterprises in which the Group holds between 20 per cent
and 50 per cent of the votes and exercises significant
influence but not control are classified as associates.
On consolidation, items of a uniform nature are com-
bined. Elimination is made of intercompany income and
expenses, shareholdings, dividends and accounts as
well as of realised and unrealised profits and losses on
transactions between the consolidated enterprises.
The parent company’s investments in the consolidated
subsidiaries are set off against the parent company’s
share of the net asset value of subsidiaries stated at the
time of consolidation.
On acquisition of subsidiaries, the difference between
cost and net asset value of the enterprise acquired is
determined at the date of acquisition after the individual
assets and liabilities have been adjusted to fair value
(the purchase method). This includes allowing for any
restructuring provisions determined in relation to the
enterprise acquired. Any remaining positive differences
are recognised in intangible assets in the balance sheet
as goodwill, which is amortised in the income statement
on a straight-line basis over its estimated useful life, but
not exceeding 20 years. Any remaining negative differ-
ences are recognised in deferred income in the balance
sheet as negative goodwill. Amounts attributable to ex-
pected losses or expenses are recognised as income in
the income statement as the affairs and conditions to
which the amounts relate materialise. Negative goodwill
not related to expected losses or expenses is recognised
at an amount equal to the fair value of non-monetary
assets in the income statement over the average useful
life of the non-monetary assets.

51
REPORT FINANCIAL STATEMENTS
Positive and negative differences from enterprises
acquired may, due to changes to the recognition and
measurement of net assets, be adjusted until the end of
the financial year following the year of acquisition. These
adjustments are also reflected in the value of goodwill or
negative goodwill, including in amortisation already made.
Amortisation of goodwill is allocated in the consolidated
financial statements to administrative costs.
Minority interests
On the statement of Group results and Group equity, the
shares of results and equity of subsidiaries attributable
to minority interests are recognised as separate items
in the income statement and the balance sheet. Minority
interests are recognised on the basis of a remeasure-
ment of acquired assets and liabilities to fair value at
the time of acquisition of subsidiaries.
On subsequent changes to minority interests, the changed
share is included in results as of the date of change.
Leases
Leases in terms of which the Group assumes substan-
tially all the risks and rewards of ownership (finance
leases) are recognised in the balance sheet at the lower
of the fair value of the leased asset and the net present
value of the lease payments computed by applying the
interest rate implicit in the lease or an approximated val-
ue as the discount rate. Assets acquired under finance
leases are depreciated and written down for impairment
under the same policy as determined for the other fixed
assets of the Group.
The remaining lease obligation is capitalised and recog-
nised in the balance sheet under debt, and the interest
element on the lease payments is charged over the lease
term to the income statement.
All other leases are considered operating leases. Pay-
ments made under operating leases are recognised in
the income statement on a straight-line basis over the
lease term.
Foreign currency translation
Functional and presentation currency
Items included in the financial statements of each of
Hempel’s entities are measured using the currency of
the primary economic environment in which the entity op-
erates (functional currency). The consolidated financial
statements are presented in euro.
Translation of transactions and balances
Transactions in foreign currencies are translated at
the exchange rates at the dates of transaction. Gains
and losses arising due to differences between the
transaction date rates and the rates at the dates
of payment are recognised in financial income and
expenses in the income statement. Where foreign ex-
change transactions are considered hedging of future
cash flows, the value adjustments are recognised di-
rectly in equity.
Receivables, payables and other monetary items in
foreign currencies that have not been settled at the
balance sheet date are translated at the exchange rates
at the balance sheet date. Any differences between the
exchange rates at the balance sheet date and the trans-
action date rates are recognised in financial income and
expenses in the income statement.
Fixed assets acquired in foreign currencies are meas-
ured at the transaction date rates.
Translation of Group companies
Financial statements of foreign subsidiaries and asso-
ciates are translated into euro at the exchange rates
prevailing at the end of the reporting period for bal-
ance sheet items, and at average exchange rates for
income statement items. All effects of exchange rate
adjustment are recognised in the income statement,
with the exception of exchange rate adjustments of

52
investments in subsidiaries and associates arising
from:
•the translation of foreign subsidiaries’ and associ-
ates’ net assets at the beginning of the year at the
exchange rates at the end of the reporting period
•the translation of foreign subsidiaries’ and associ-
ates’ income statement from average exchange rates
to exchange rates at the end of the reporting period
•the translation of intra-Group receivables that are
considered to be an addition to net investments in
subsidiaries.
These specific exchange rate adjustments are recog-
nised directly in equity.
Derivative financial instruments
Derivative financial instruments are initially recognised in
the balance sheet at cost and are subsequently remeas-
ured at their fair values. Positive and negative fair values
of derivative financial instruments are classified as “Other
receivables” and “Other payables”, respectively.
Changes in the fair values of derivative financial instru-
ments are recognised in the income statement unless
the derivative financial instrument is designated and
qualified as hedge accounting.

53
Income statement
Revenue
Revenue from the sale of goods for resale and finished
goods is recognised in the income statement when
delivery and transfer of risk has been made before year
end.
Revenue is recognised exclusive of VAT and net of dis-
counts relating to sales.
Production costs
Production costs comprise costs incurred to achieve
revenue for the year. Cost comprises raw materials,
consumables, direct labour costs and indirect produc-
tion costs such as maintenance and depreciation, etc.,
as well as operation, administration and management
of factories.
Production costs also include research and development
costs that do not qualify for capitalisation as well as
amortisation of capitalised development costs. Finally,
provisions for losses on contract work are recognised.
Sales and distribution costs
Sales and distribution expenses comprise costs incurred
to distribute sales and for sales campaigns, including
costs for sales and distribution staff, advertising costs
and depreciation of sales equipment.
Administrative costs
Administrative costs comprise costs incurred for man-
agement and administration of the Group, including
costs for administrative staff and management as well
as office costs and depreciation and write-downs for bad
debt losses. Depreciation on goodwill, customer relation-
ships and brands are comprised in depreciation.
Other operating income and expenses
Other operating income and other operating expenses
comprise items of a secondary nature to the core activi-
ties of the enterprise, including gains and losses on the
sale of intangible assets and property, plant and equip-
ment.
Income from investments in subsidiaries and
associates
The items “Income from investments in subsidiaries”
and “Income from investments in associates” in the
income statement include the proportionate share of the
profit for the year less goodwill amortisation.
Financial income and expenses
Financial income and expenses are recognised in the
income statement at the amounts relating to the finan-
cial year.
Income tax
Income tax for the year consists of current tax for the
year and deferred tax for the year. The tax attributable to
the profit for the year is recognised in the income state-
ment, whereas the tax attributable to equity transactions
is recognised directly in equity.
The company is jointly taxed with wholly owned Danish
subsidiaries. The tax effect of the joint taxation is allo-
cated to Danish enterprises in proportion to their taxable
incomes.
REPORT FINANCIAL STATEMENTS

54
Balance sheet
Intangible assets
Goodwill acquired is measured at cost less accumulated
amortisation. Goodwill is amortised on a straight-line basis
over its useful life on the basis of management’s experience
within the individual areas, which is assessed at 5-20 years.
Development projects concerning products, processes
and software that are clearly defined and identifiable
and in respect of which technical feasibility, sufficient
resources and a potential future market or development
opportunity in the enterprise can be demonstrated, and
where it is the intention to manufacture, market or use
the product or process in question, are recognised as in-
tangible assets. The costs comprise expenses, including
salaries and amortisation, directly or indirectly attribut-
able to these development projects.
Upon completion of the development project, costs are
amortised on a straight-line basis over the estimated
useful life. The amortisation period is 3-10 years.
Other development costs and costs relating to rights
developed by the company are recognised in the income
statement as costs in the year of acquisition.
Customer relations are measured at cost less accumu-
lated amortisation and impairment losses. The period of
amortisation is 3-17 years.
Other intangible assets are measured at cost less ac-
cumulated amortisation and impairment losses. The
assets are amortised on a straight-line basis over their
estimated useful lives.
Property, plant and equipment
Property, plant and equipment are measured at cost less
accumulated depreciation and less any accumulated
impairment losses.
Cost comprises the cost of acquisition and expenses
directly related to the acquisition up until the time when
the asset is ready for use. In the case of assets of own
construction, cost comprises direct and indirect expens-
es for labour, materials, components and sub-suppliers.
Interest expenses on loans raised directly for financing
the construction of property, plant and equipment are
recognised in cost over the period of construction. All in-
directly attributable borrowing expenses are recognised
in the income statement.
Depreciation based on cost reduced by any residual
value is calculated on a straight-line basis over the ex-
pected useful lives of the assets, which are:
Leasehold improvements are included in other operating
equipment and are recognised at cost and depreciated
over the term of the lease; however, not exceeding 10
years.
Assets costing less than EUR 3,500 per unit are ex-
pensed in the year of acquisition.
Impairment of fixed assets
The carrying amounts of intangible assets and property,
plant and equipment are reviewed on an annual basis to de-
termine whether there is any indication of impairment other
than that expressed by amortisation and depreciation.
If so, the asset is written down to its lower recoverable
amount.
Investments in subsidiaries and associates
Investments in subsidiaries and associates are rec-
ognised and measured under the equity method. This
implies that the investments are measured in the balance
Buildings max. 50 years
Laboratory equipment 10 years
Plant and machinery 10 years
Other fixtures and fittings, tools and equipment 3-10 years

55
REPORT FINANCIAL STATEMENTS
sheet at the proportionate ownership share of the net
asset value of the enterprises with deduction or addition
of shares of unrealised intercompany profits and losses.
The total net revaluation of investments in subsidiaries
and associates is transferred upon distribution of profit
to “Reserve for net revaluation under the equity method”
under equity. The reserve is reduced by dividend distrib-
uted to the parent company and adjusted for other equity
movements in subsidiaries and associates.
Subsidiaries and associates with a negative net asset
value are recognised at EUR 0. Any legal or constructive
obligation of the parent company to cover the negative
balance of the enterprise is recognised in provisions.
Inventories
Inventories are measured at the lower of cost under the
FIFO method and net realisable value.
The net realisable value of inventories is calculated at
the amount expected to be generated by sale in the
process of normal operations with deduction of selling
expenses and costs of completion. The net realisable
value is determined allowing for marketability, obsoles-
cence and development in the expected sales sum.
The cost of goods for resale, raw materials and consum-
ables equals landed cost.
The cost of finished goods and work in progress com-
prises the cost of raw materials, consumables and direct
labour with addition of indirect production costs. Indirect
production costs comprise the cost of indirect materials
and labour as well as maintenance and depreciation of
the machinery, factory buildings and equipment used in
the manufacturing process as well as costs of factory
administration and management.
Receivables
Receivables are measured in the balance sheet at the
lower of amortised cost and net realisable value, which
corresponds to nominal value less provisions for bad
debts. Provisions for bad debts are determined on the
basis of an individual assessment of each receivable
and, in respect of trade receivables, a general provision
is also made based on the company’s experience from
previous years.
Receivables are recognised in the balance sheet at am-
ortised cost, which substantially corresponds to nominal
value. Provisions for estimated bad debts are made.
Prepayments
Prepayments comprise prepaid expenses concerning
rent, insurance premiums, subscriptions and interest.
Equity
Dividend distribution proposed by management for the
year is disclosed as a separate equity item.
Provisions
Provisions are recognised when – in consequence of an
event having occurred before or on the balance sheet
date – the Group has a legal or constructive obligation
and it is probable that economic benefits must be given
up to settle the obligation.
Pension and similar obligations are measured at net pre-
sent value based on an actuarial calculation. Actuarial
gains and losses are amortised and recognised in the
balance sheet over the remaining period until delivery
of the service.
Other provisions comprising provisions for environmen-
tal, warranty and restructuring obligations as well as
other obligations not covered by insurance are recog-
nised and measured based on a best estimate of the
expenses necessary to fulfil the obligations at the bal-
ance sheet date. Provisions with an expected maturity
exceeding one year from the balance sheet date are
discounted at the average bond yield.

56
Deferred tax assets and liabilities
Deferred income tax is measured using the balance
sheet liability method in respect of temporary differences
arising between the tax bases of assets and liabilities
and their carrying amounts for financial reporting pur-
poses on the basis of the intended use of the asset and
settlement of the liability, respectively.
Deferred tax assets, including the tax base of tax loss
carry-forwards, are measured at the value at which the
asset is expected to be realised, either by elimination in
tax on future earnings or by setoff against deferred tax
liabilities within the same legal tax entity.
Deferred tax is measured on the basis of the tax rules
and tax rates that will be effective under the legisla-
tion at the balance sheet date when the deferred tax is
expected to crystallise as current tax. Any changes in
deferred tax due to changes to tax rates are recognised
in the income statement.
Current tax receivables and liabilities
Current tax liabilities and receivables are recognised in
the balance sheet as the expected taxable income for
the year adjusted for tax on taxable incomes for prior
years and tax paid on account.
Extra payments and repayment under the on account
taxation scheme are recognised in the income statement
in financial income and expenses.
Financial debts
Fixed-interest loans, such as mortgage loans and loans
from credit institutions, are recognised initially at the
proceeds received net of transaction expenses incurred.
Subsequently, the loans are measured at amortised
cost; the difference between the proceeds and the nomi-
nal value is recognised as an interest expense in the
income statement over the loan period.
Mortgage loans are measured at amortised cost, which
for cash loans corresponds to the remaining loan. Am-
ortised cost of debenture loans corresponds to the
remaining loan calculated as the underlying cash value
of the loan at the date of raising the loan adjusted for
depreciation of the price adjustment of the loan made
over the term of the loan at the date of raising the loan.
Other debts are measured at amortised cost, substan-
tially corresponding to nominal value.

57
The cash flow statement for the Group shows the cash
flows for the year broken down by operating, investing
and financing activities, changes for the year in cash
and cash equivalents as well as cash and cash equiva-
lents for the Group at the beginning and end of the year.
Cash flows from operating activities
Cash flows from operating activities are calculated as
the net profit/loss for the year adjusted for changes in
working capital and non-cash operating items such as
depreciation, amortisation and impairment losses, and
provisions. Working capital comprises current assets
less short-term debt excluding items included in cash
and cash equivalents.
Cash flows from investing activities
Cash flows from investing activities comprise cash
flows from acquisitions and disposals of intangible as-
sets, property, plant and equipment as well as fixed
asset investments.
Cash flows from financing activities
Cash flows from financing activities comprise cash
flows from the raising and repayment of long-term debt
as well as payments to and from shareholders.
Cash and cash equivalents
The cash flow statement cannot be immediately derived
from the published financial records.
Cash �ow statement
Financial highlights
Financial ratios have
been calculated as
follows:
Gross margin = Gross profit x 100
Revenue
Operating profit margin = Operating profit x 100
Revenue
Return on assets = Operating profit x 100
Average assets
Solvency ratio = Equity at year-end x 100
Total assets
Return on equity = Net profit for the year x 100
Average equity
REPORT FINANCIAL STATEMENTS


60
Income statement
In EUR million GROUP PARENT COMPANY
Note 2013 2012 2013 2012
1 Revenue 1,239 1,242 82 82
Production costs -737 -780 -45 -42
Gross pro�t 502 462 37 40
Sales and distribution costs -277 -260 -11 -13
Administrative costs -104 -119 -24 -23
Other operating income 5 1 3 –
Other operating expenses -1 -1 – –
Operating pro�t 125 83 5 4
7 Income from investments in subsidiaries 65 37
8 Income from investments in associates 2 3 – –
Pro�t before �nancial income and expenses 127 86 70 41
2 Net �nancials -19 -21 -1 -2
Pro�t before tax 108 65 69 39
4 Income tax -30 -19 -4 -4
Pro�t after tax 78 46 65 35
Minority interests -13 -11 – –
Net pro�t for the year 65 35 65 35
PARENT COMPANY
Distribution of pro�t 2013 2012
Proposed distribution of profit:
Proposed dividend 40 25
Reserve for net revaluation under the equity method 67 37
Retained earnings -42 -27
65 35

REPORT FINANCIAL STATEMENTS

62
In EUR million GROUP PARENT COMPANY
Note 2013 2012 2013 2012
Goodwill 61 69 – –
Software 7 7 1 1
Software under development 2 3 2 2
Customer relationships 33 41 – –
Other intangible assets 55 46 4 5
5 Intangible assets 158 166 7 8
Land and buildings 92 109 – 9
Land and buildings for sale 19 6 19 6
Assets under construction 25 16 – 8
Plant and machinery 46 49 2 –
Other �xed assets 15 14 2 –
6 Property, plant and equipment 197 194 23 23
7 Investments in subsidiaries 312 294
8 Investments in associates 13 12 – –
Loans to Group enterprises 46 69
12 Deferred tax assets 23 26 – –
13 Pension assets 6 6 – –
Deposits etc. 3 3 1 1
Fixed asset investments 45 47 359 364
Total non-current assets 400 407 389 395
Raw materials and consumables 49 53 1 1
Work in progress 3 2 – –
Finished goods 107 110 4 5
Inventories 159 165 5 6
Trade receivables 314 324 4 4
Receivables from Group enterprises 91 110
Tax receivables 5 4 – –
Other receivables 28 29 15 14
10 Prepayments 11 11 2 2
9 Receivables 358 368 112 130
Cash at bank and in hand 144 127 27 4
Current assets 661 660 144 140
Total assets 1,061 1,067 533 535
Balance sheet as at 31 December – assets

63
In EUR million GROUP PARENT COMPANY
Note 2013 2012 2013 2012
11 Share capital 15 15 15 15
Reserve for net revaluation under the equity method 13 – 13 –
Retained earnings 313 316 313 316
Proposed dividend for the year 40 25 40 25
Total equity 381 356 381 356
Minority interests 47 43
12 Deferred tax liabilities 29 34 – –
13 Pension obligations and similar obligations 12 11 1 1
14 Other provisions 36 35 – 1
Provisions 77 80 1 2
15 Bank loans etc. 182 200 90 104
Other payables 6 10 4 7
Long-term debt 188 210 94 111
Overdraft facilities 66 92 3 19
15 Short-term part of bank loans etc. 29 27 14 14
Trade payables 133 124 2 2
Payables to Group enterprises – – 18 13
Tax liabilities 16 19 1 1
Other payables 124 116 19 17
Total current liabilities 368 378 57 66
Total liabilities 556 588 151 177
Total equity and liabilities 1,061 1,067 533 535
3 Staff 20 Change in working capital
16 Fee to the auditors appointed at the General Meeting 21 Balance sheet items of acquired enterprises
17 Contingent liabilities and other �nancial obligations 22 Cash and cash equivalents, net
18 Related parties and ownership 23 The Hempel Group including foreign branches
19 Adjustment for non-cash operating items
Balance sheet as at 31 December – equity and liabilities
REPORT FINANCIAL STATEMENTS

64
In EUR million GROUP
NoteShare
capital
Reserve for net
revaluationRetained earnings
Proposed dividend Total
Equity
Equity at 1 January 2012 15 311 – 326
Net pro�t for the year 35 35
Exchange adjustment at year-end rate – -2 -2
Hedging of future transactions -3 -3
Proposed dividend -25 25 –
11 Equity at 31 December 2012 15 – 316 25 356
Reclassi�cation at 1 January 2013 12 -12 –
Net pro�t for the year 2 63 65
Exchange adjustment at year-end rate – – -18 -18
Hedging of future transactions 4 4
Revaluation from purchased companies reversed -1 -1
Dividend distributed -1 1 -25 -25
Proposed dividend -40 40 –
11 Equity at 31 December 2013 15 13 313 40 381
Statement of changes in equity as at 31 December

65
In EUR million PARENT COMPANY
NoteShare
capital
Reserve for net
revaluationRetained earnings
Proposed dividend Total
Equity
Equity at 1 January 2012 15 11 300 – 326
Net pro�ts of subsidiaries 37 37
Dividend received -47 47 –
Exchange adjustment at year-end rate – -1 – -1
Hedging of future transactions -1 -2 -3
Retained earnings 1 -1 –
Net pro�t of parent company -3 -3
Proposed dividend -25 25 –
11 Equity at 31 December 2012 15 – 316 25 356
Net pro�ts of subsidiaries 67 67
Dividend received -36 36 –
Exchange adjustment at year-end rate – -18 – -18
Hedging of future transactions 1 3 4
Revaluation from purchased companies reversed -1 -1
Net loss of parent company -2 -2
Dividend distributed -25 -25
Proposed dividend -40 40 –
11 Equity at 31 December 2013 15 13 313 40 381
REPORT FINANCIAL STATEMENTS

66
In EUR million GROUP
Note 2013 2012
Cash �ows from operating activities
Operating pro�t 125 83
19 Adjustment for non-cash operating items 34 43
20 Change in working capital 21 24
Income tax paid -34 -22
Total cash �ows from operating activities 146 128
Cash �ows from investing activities
21 Acquisition of enterprises – -10
21 Divestment of enterprises – 1
6 Purchase of property, plant and equipment -38 -26
5 Purchase of intangible assets -19 -3
Sale of property, plant and equipment 12 1
8 Dividend received from associates 1 1
Total cash �ows from investing activities -44 -36
Cash �ows from �nancing activities
Change in bank borrowings etc. -14 -36
Interest income and expenses, net -13 -16
Change in minority shares (dividend distributed etc.) -7 -4
Other �nancial assets – -1
Dividend distributed to shareholders -25 –
Capital losses and gains, net – -6
Total cash �ows from �nancing activities -59 -63
Change in cash and cash equivalents 43 29
22 Cash at bank and in hand and current asset investments less overdraft facilities, beginning of year 35 6
22 Cash at bank and in hand and current asset investments less overdraft facilities, end of year 78 35
Bank facilities available 180 170
Capital resources available 258 205
Cash �ow statement

REPORT FINANCIAL STATEMENTS

68
In EUR million GROUP PARENT COMPANY
Note 2013 2012 2013 2012
1 Segment information
Geographical markets: 1)
Europe 614 615 82 82
Americas 104 93 – –
Asia-Paci�c 371 380 – –
Middle East 150 154 – –
1,239 1,242 82 82
2 Net �nancials
External interest income 2 2 – 1
Interest income from subsidiaries 6 7
External interest expenses -15 -18 -5 -7
Realised and unrealised exchange gains/losses, net -6 -5 -2 -3
-19 -21 -1 -2
3 Staff
Average number of employees 5,029 4,977 233 226
Staff expenses:
Directors’ fees 1 1
Remuneration of the Executive Board 2 2
Wages and salaries etc. 200 198 23 21
Pension contributions 13 12 2 2
213 210 28 26
Staff expenses have been recognised in the income statement as follows:
Production costs 50 51 8 8
Sales and distribution costs 120 116 7 6
Administrative costs 43 43 13 12
213 210 28 26
1) For competitive reasons, a breakdown of revenue on activities has been left out (in accordance with section 96 of the Danish Financial Statements Act).
Notes to the �nancial statements

69
In EUR million GROUP PARENT COMPANY
Note 2013 2012 2013 2012
4 Income tax
Hempel Group:
Pro�t before tax 108 65
Income from investments in associates -2 -3
106 62
Income tax on profit for the year:
Total tax -30 -19 -30 -19
Tax in respect of subsidiaries 26 15
-30 -19 -4 -4
Current tax for the year -32 -27 – –
Deferred tax for the year 3 5 – –
Adjustment in respect of previous years -1 3 – –
Income tax -30 -19 -4 -4
Effective tax rate of the Group 28.9% 30.0%
Reconciliation of tax rate:
Danish tax rate 25.0% 25.0%
Higher/(lower) tax rates of foreign subsidiaries -4.6% -4.0%
Weighted tax rate of the Group: 20.4% 21.0%
Permanent differences 2.1% 4.2%
Non-capitalised losses 2.5% 3.3%
Utilisation of non-capitalised losses -0.5% -2.1%
Adjustments in respect of previous years 0.7% -4.8%
Dividend tax and other taxes at source 3.7% 8.4%
Effective tax rate of the Group 28.9% 30.0%
At 31 December 2013, the Group has a non-recognised tax asset of EUR 26 million (2012: EUR 28 million), of which the parent company represents EUR 13 million (2012: EUR 13 million).
REPORT FINANCIAL STATEMENTS

70
In EUR million GROUP
Note Goodwill Software
Software under
develop-ment
Customer relation-
ships
Other intangible
assets Total
5 Intangible assets
Costs, beginning of year 86 16 3 78 55 238
Exchange adjustment at year-end rate -2 – – -2 -1 -5
Additions for the year – – 5 – 14 19
Disposals for the year – -1 – – – -1
Transfer to/from other items – 6 -6 – – –
Costs, end of year 84 21 2 76 68 251
Accumulated amortisation, beginning of year 17 9 – 38 9 73
Exchange adjustment at year-end rate -1 – – -2 – -3
Amortisation for the year 7 5 – 7 4 23
Accumulated amortisation, end of year 23 14 – 43 13 93
Carrying amount, end of year 61 7 2 33 55 158
Other intangible assets comprise brands, formulas, non-compete agreements and lease rights.
Notes to the �nancial statements

71
In EUR million PARENT COMPANY
Note Goodwill Software
Software under
develop-ment
Customer relation-
ships
Other intangible
assets Total
5 Intangible assets
Costs, beginning of year – 5 2 – 9 16
Additions for the year – – 5 – – 5
Disposals for the year – -1 -5 – – -6
Costs, end of year – 4 2 – 9 15
Accumulated amortisation, beginning of year – 3 – – 4 7
Amortisation for the year – 1 – – 1 2Reversal of amortisation of assets sold – -1 – – – -1
Accumulated amortisation, end of year – 3 – – 5 8
Carrying amount, end of year – 1 2 – 4 7
Other intangible assets comprise brands, formulas and non-compete agreements.
GROUP PARENT COMPANY
2013 2012 2013 2012
Amortisation and impairment are specified as follows:
Production costs 1 – – –
Administrative costs 22 25 2 1
23 25 2 1
REPORT FINANCIAL STATEMENTS

72
Notes to the �nancial statements
In EUR million GROUP
NoteLand and buildings
Land and buildings
for salePlant and
machineryOther �xed
assets
Assets under con-
struction Total
6 Property, plant and equipment
Costs, beginning of year 158 7 176 80 16 437
Exchange adjustment at year-end rate -7 – -6 -3 -1 -17
Additions for the year – – 4 6 28 38
Disposals for the year -3 -7 -4 -4 – -18
Transfer to/from other items -8 22 4 – -18 –
Costs, end of year 140 22 174 79 25 440
Accumulated depreciation, beginning of year 49 1 128 65 – 243
Exchange adjustment at year-end rate -2 – -4 -1 – -7
Depreciation for the year 5 – 8 4 – 17Reversal of depreciation of assets sold -1 -1 -4 -4 – -10
Transfer to/from other items -3 3 –
Accumulated depreciation, end of year 48 3 128 64 – 243
Carrying amount, end of year 92 19 46 15 25 197
including leased assets of 3 – – – – 3

73
In EUR million PARENT COMPANY
NoteLand and buildings
Land and buildings
for salePlant and
machineryOther �xed
assets
Assets under con-
struction Total
6 Property, plant and equipment
Costs, beginning of year 12 7 5 2 8 34
Exchange adjustment at year-end rate -1 – – – – -1
Additions for the year – – – 2 5 7
Disposals for the year – -7 – – – -7
Transfer to/from other items -11 22 2 – -13 –
Costs, end of year – 22 7 4 – 33
Accumulated depreciation, beginning of year 3 1 5 2 – 11
Depreciation for the year – – – – – –Reversal of depreciation of assets sold – -1 – – – -1
Transfer to/from other items -3 3 –
Accumulated depreciation, end of year – 3 5 2 – 10
Carrying amount, end of year – 19 2 2 – 23
GROUP PARENT COMPANY
2013 2012 2013 2012
Depreciation and impairment are specified as follows:
Production costs 10 10 – –
Sales and distribution costs 4 5 – –
Administrative costs 3 3 – –
17 18 – –
REPORT FINANCIAL STATEMENTS

74
Notes to the �nancial statements
In EUR million GROUP PARENT COMPANY
Note 2013 2012 2013 2012
7 Investments in subsidiaries
Costs, beginning of year 293 286
Additions for the year 4 7
Costs, end of year 297 293
Net revaluations, beginning of year -1 11
Exchange adjustment at year-end rate -18 -2
Hedging of future transactions 2 -1
Pro�t before tax 98 58
Amortisation of goodwill -7 -6
Tax for the year 1) -24 -14
Dividend received -36 -47
Reversed -1 –
Net revaluations, end of year 13 -1
Carrying amount, end of year 310 292
Recognised in the balance sheet as follows:
Subsidiaries with negative equity -2 -2
Investments in subsidiaries 312 294
310 292
Subsidiaries with negative equity are recognised in the balance sheet as follows:
Recognised in receivables from subsidiaries -2 -2
Net value, end of year -2 -2
1) Excluding EUR 2 million of taxes paid by Hempel A/S on behalf of subsidiaries.
REPORT FINANCIAL STATEMENTS

76
In EUR million GROUP PARENT COMPANY
Note 2013 2012 2013 2012
8 Investments in associates
Costs, beginning of year – – – –
Costs, end of year – – – –
Net revaluations, beginning of year 12 11 – –
Exchange adjustment at year-end rate – -1 – –
Net pro�t 2 3 – –
Dividend received -1 -1 – –
Net revaluations, end of year 13 12 – –
Carrying amount, end of year 13 12 – –
9 Receivables
Receivables 358 368 112 130of which due more than one year from the balance sheet date 1 6 – –
10 Prepayments
Prepayments comprise prepaid expenses relating to rent, insurance premium and interest as well as unrealised exchange adjustments relating to �nancial instruments.x
11 Share capital
The share capital amounts to DKK 115 million comprising 110 A shares of DKK 1 million each, one A share of DKK 900,000, four B shares of DKK 1 million each and four B shares of DKK 25,000 each. B shareholders have special dividend rights and no voting rights.
Notes to the �nancial statements

77
In EUR million GROUP PARENT COMPANY
Note 2013 2012 2013 2012
12 Deferred tax
Deferred tax (net) relates to the following items:
Intangible assets -15 -19
Property, plant and equipment – -1
Fixed asset investments -4 -1
Inventories 2 1
Trade receivables 2 2
Provisions and other payables 5 4
Tax losses 4 6
-6 -8 – –
The net value is recognised in the balance sheet as follows:
Deferred tax assets 23 26
Deferred tax liabilities -29 -34
-6 -8 – –
REPORT FINANCIAL STATEMENTS

78
Notes to the �nancial statements
In EUR million
Note
13 Pension and similar assets and obligations
The majority of the employees are covered by de�ned-contribution plans. Part of the employees are covered by
de�ned-bene�t plans. De�ned-bene�t plans are primarily used in the Middle East, UK, Ireland and Germany.
GROUP PARENT COMPANY
2013 2012 2013 2012
Pension and similar obligations comprise:
Pension and similar obligations 47 46 1 1
Fair value of assets related to the plans -36 -34 – –
Pension obligations (net) 11 12 1 1
Unrecognised actuarial gains/(losses) -5 -7 – –
Pension obligations recognised in the balance sheet (net) 6 5 1 1
Recognition in the balance sheet:
Assets -6 -6 – –
Liabilities 12 11 1 1
Pension obligations recognised in the balance sheet 6 5 1 1
De�ned-bene�t plans
Specification of plan assets:
Shares and properties 44% 42% – –
Fixed interest current asset investments 51% 53% – –
Cash at bank and in hand 5% 5% – –
Total 100% 100% – –
Weighted average assumptions:
Discount rate 4.0% 3.9% 4.3% 4.3%
Expected return 4.5% 4.6% – –
General wage in�ation 3.0% 2.9% – –
General price in�ation 1.9% 1.8% – –

79
In EUR million GROUP
Note
Environ-mental
obligations
Warranty commit-
mentsOther
provisions 2013 2012
14 Provisions
Total provisions, beginning of year 23 10 2 35 35
Reclassi�cation 1.1.2013 – – 2 2 –
Additions for the year – – 3 3 4
Reversed -1 – – -1 -2
Disposals for the year -1 -1 -1 -3 -2
Total provisions, end of year 21 9 6 36 35
Maturities are expected to be:
Within 1 year – – 1 1 –
Between 1 and 5 years 21 9 5 35 1
After 5 years – – – – 34
21 9 6 36 35
REPORT FINANCIAL STATEMENTS

80
Notes to the �nancial statements
In EUR million
Note
15 Bank loans and derivative �nancial instruments:Risk management policy of the Group:
Due to its operations, investments and �nancing, the Group is exposed to changes in exchange rates and interest
rates. The Group’s �nancial management is focused only on managing �nancial risks relating to operations and
�nancing. Accordingly, it is Group policy not to speculate actively in �nancial risks. For further information on the
Group’s exchange and interest rate risks and the management of these risks, see the management’s review on
page 42.
GROUP PARENT COMPANY
2013 2012 2013 2012
Long-term bank borrowings etc. including short-term part:
Due within 1 year 29 27 14 14
Due within 1 to 5 years 182 200 90 104
211 227 104 118
GROUP PARENT COMPANY
2013 2012 2013 2012
Bank borrowings etc. 3.5% 3.8% 3.9% 4.0%
Bank borrowings etc. Cash �ow Terms
Interest rate swaps 211
Average term to maturity
2 years
Average �xed interest rate
of 3.5%
Total payables of EUR 211 million comprise loans denominated in euro of EUR 108 million and loans denominated
in other currencies, primarily pound sterling, of EUR 103 million. The effect of interest rate swaps of EUR 104 mil-
lion and GBP 75 million (EUR 89 million), respectively, is included in the calculated interest. The fair value adjust-
ment of interest rate swaps of EUR -7 million in total at 31 December 2013 is recognised directly in equity. The
weighted average effective interest rates as at the balance sheet date were as follows:

81
REPORT FINANCIAL STATEMENTS
In EUR million
Note
15 Bank loans and derivative �nancial instruments (continued):Currency risks:
Open foreign currency hedges at 31 December 2013 entered into in order to hedge future purchases and sales
as well as receivables and payables in foreign currencies are speci�ed as follows:
EUR millionContract amount based
on exercise price1) Fair valueTerm to matu-
rity (months)
CZK 1.4 0.0 1
EUR -22.1 0.0 1
GBP 17.4 -0.2 1
KRW -8.1 0.1 1
KWD -11.7 0.1 3
PLN -18.4 -0.1 1
SGD -11.6 0.1 1
USD -33.1 0.5 1
ZAR -1.8 0.3 1
0.8
1) Positive principal amounts equal a purchase of the currency in question and negative amounts equal a sale.
Credit risks:
The Group has no material risks relating to a single customer or business partner. It is the Group’s credit policy to
rate major customers and other business partners on a current basis. For further information on the Group’s credit
risks and covering of these risks, see the Special risks section of the management’s review (page 42).

82
In EUR million GROUP PARENT COMPANY
Note 2013 2012 2013 2012
16 Fee to the auditors appointed at the General Meeting
Audit fee 1 1 – –
Other assurance engagements – – – –
Tax advice – – – –
Other fees – 1 – 1
1 2 – 1
17 Contingent liabilities and other �nancial obligations
Rental and lease obligations:
Due within 1 year from the balance sheet date 11 9 – –
Due within 1 to 5 years from the balance sheet date 25 23 1 1
Due more than 5 years from the balance sheet date 8 9 – –
44 41 1 1
Guarantees:
For local loans and bank credits to subsidiaries1) 213 215
Other guarantees 3 3 – –
3 3 213 215
1) Unutilised guarantees for local loans and bank credits to subsidiaries amount to EUR 19 million (2012: EUR 22 million).
Other contingent liabilities:
As part of its current operations, the Group is a party to certain legal disputes, and certain claims have been
advanced against the Group concerning complaints, pollution and environmental issues. It is management’s
assessment that these disputes and claims will have no material effect on the Group’s �nancial position.
Hempel A/S is jointly taxed with the Danish companies of the Hempel Holding Group.
The Group’s Danish enterprises are jointly and severally liable for Danish taxes at source and income taxes.
Notes to the �nancial statements

83
REPORT FINANCIAL STATEMENTS
In EUR million
Note Basis
18 Related parties and ownership
Controlling influence:
Hempel Foundation, Amaliegade 8, 1256 Copenhagen K, Denmark Ultimate parent companyHempel Holding A/S, Amaliegade 8, 1256 Copenhagen K, Denmark Majority shareholder
(100%)
Members of the Executive Board and Board of Directors of Hempel A/S as well
as the Board of Directors of the Hempel Foundation and Hempel Holding A/S
are also regarded as related parties. The members of the Boards of Directors of
the Hempel Foundation and Hempel Holding coincide.
Other related parties:
Saudi Arabian Packaging Industry W.L.L., P .O. Box 1966, Dammam 31441, Saudi Arabia Associate
Sapin United Arab Emirates L.L.C., P .O. Box 115132, United Arab Emirates Associate
Hempel’s Employee Foundation, Amaliegade 8, 1256 Copenhagen K, Denmark Related party
Hempel’s Cultural Foundation, Amaliegade 8, 1256 Copenhagen K, Denmark Related party
Brænderupvænge ApS, Amaliegade 8, 1256 Copenhagen K, Denmark Related party
Keldskov ApS, Amaliegade 8, 1256 Copenhagen K, Denmark Related party

84
Notes to the �nancial statements
In EUR million GROUP
Note 2013 2012
19 Adjustment for non-cash operating items
Amortisation, depreciation and impairment, including goodwill 40 43
Provisions – 1
Exchange rate adjustment, operating pro�t -3 -1
Gains and losses on the sale of �xed assets -3 –
34 43
20 Change in working capital
Change in receivables -5 15
Change in inventories -2 19
Change in trade payables 28 -10
21 24

85
In EUR million GROUP
Note 2013 2012
21 Balance sheet items of acquired enterprises
Intangible assets – 8
Inventories – 1
Receivables – 1
Cash at bank and in hand – 1
Long-term payables – -1
Short-term payables – -1
Net assets – 9
Intangible assets of parent company – 2
Acquisition costs – 11
Cash at bank and in hand – -1
Net cash �ows from acquisitions – 10
Balance sheet items of divested enterprises
Inventories – 1
Receivables – 1
Short-term payables – -1
Selling price – 1
Net cash �ows from divestment – 1
REPORT FINANCIAL STATEMENTS

86
Notes to the �nancial statements
In EUR million GROUP
Note 2013 2012
22 Cash and cash equivalents, net
Cash at bank and in hand, beginning of year 127 106
Overdraft facilities, beginning of year -92 -100
35 6
Cash, end of year 144 127
Overdraft facilities, end of year -66 -92
78 35

REPORT FINANCIAL STATEMENTS

88
The Hempel Group including foreign branches
Note 23 Name Currency Share capital Ownership
Denmark Hempel A/S DKK 115,000,000 100%
Argentina Hempel Argentina S.R.L. ARS 80,872,200 100%
Australia Hempel (Australia) Pty. Ltd. AUD 700,000 100%
Bahrain Hempel Paints (Bahrain) W.L.L. BHD 300,000 51%
Bahrain Dahna Paint Middle East Holding B.S.C. (closed) USD 65,637,500 51%
Brazil Hempel Tintas do Brasil Ltda. BRL 10,054,760 100%
Canada Hempel (Canada) Inc. CAD 1,776,005 100%
Chile Hempel A/S (Chile) Ltda. CLP 6,558,960 100%
China Hempel (China) Limited HKD 106,000,000 100%
China Hempel (Kunshan) Coatings Co. Ltd. CNY 38,400,015 100%
China Hempel (Yantai) Coatings Co. Ltd. CNY 17,860,466 100%
China Hempel (Guangzhou) Coatings Co. Ltd. CNY 185,327,620 100%
China Hempel-Hai Hong Coatings (Shenzhen) Co. Ltd. HKD 40,000,000 100%
China Hempel (Seagull) Coatings Co. Ltd. HKD 20,000,000 100%
Croatia Hempel Coatings (Croatia) Ltd. HRK 31,019,200 98%
Cyprus Hempel (Cyprus) Ltd. EUR 17,100 100%
Cyprus Hempel Coatings (Cyprus) Limited EUR 1,000 100%
Czech Republic Hempel (Czech Republic) s.r.o. CZK 30,000,000 100%
Denmark HSA (Danmark) A/S DKK 10,000,000 100%
Denmark Hempel Decorative Paints A/S DKK 1,000,000 100%
Denmark Hempel Properties A/S DKK 1,000,000 100%
Ecuador Hempel (Ecuador) S.A. USD 100,000 100%
Egypt Hempel Egypt L.L.C. EGP 200,000 100%
Finland OY Hempel (Finland) AB EUR 63,000 100%
France Hempel (France) S.A. EUR 1,220,000 100%
Germany Hempel (Germany) GmbH EUR 1,533,876 100%
Greece Hempel Coatings (Hellas) S.A. EUR 7,800,000 100%
India Hempel Paints (India) Pvt. Ltd. INR 400,000,000 100%
Indonesia P .T . Hempel Indonesia USD 2,000,000 100%
Ireland Crown Paints Ireland Ltd. EUR 127 100%
Italy Hempel (Italy) s.r.l. EUR 50,000 100%
Korea Hempel Korea Co. Ltd. KRW 1,450,000,000 100%
Kuwait Hempel Paints (Kuwait) K.S.C.C. KWD 600,000 51%
Malaysia Hempel (Malaysia) Sdn. Bhd. MYR 5,000,000 100%
Malaysia Hempel Manufacturing (Malaysia) Sdn. Bhd. MYR 9,500,000 100%
Mexico Pinturas Hempel de Mexico S.A. de C.V. MXN 9,943,450 100%
Morocco Hempel (Morocco) SARL MAD 2,500,000 99%
New Zealand Hempel (New Zealand) Ltd. NZD 300,000 100%
Norway Hempel (Norway) AS NOK 4,981,428 100%
Oman Hempel (Oman) L.L.C OMR 500,000 20%
Poland Hempel Paints (Poland) Sp. z o.o. PLN 60,500,000 100%

89
Note 23 Name Currency Share capital Ownership
Portugal Hempel (Portugal) Lda. EUR 1,246,995 100%
Qatar Hempel Paints (Qatar) W.L.L. QAR 4,000,000 29%
Romania Hempel (Romania) S.R.L. EUR 420,100 100%
Russia ZAO Hempel RUR 95,000 100%
Saudi Arabia Hempel Paints (Saudi Arabia) W.L.L. SAR 24,500,000 51%
Saudi Arabia Saudi Arabian Packaging Industry W.L.L.* SAR 20,000,000 18%
Singapore Hempel (Singapore) Pte. Ltd. SGD 2,700,000 100%
South Africa Hempel Paints (South Africa) Pty Ltd. ZAR 15,999,475 100%
Spain Pinturas Hempel S.A. (Spain) EUR 1,202,000 100%
Sweden Hempel (Sweden) AB SEK 2,500,000 100%
Syria Hempel Paints (Syria) L.L.C. SYP 121,600,000 49%
Taiwan Hempel (Taiwan) Co. Ltd. TWD 20,000,000 100%
Thailand Hempel (Thailand) Ltd. THB 3,000,000 100%
The Netherlands Hempel (The Netherlands) B.V. EUR 250,000 100%
Turkey Hempel Coatings San. Ve Tic Ltd. Sti. TRY 2,789,300 100%
UK Crown Brands Ltd. GBP 1 100%
UK Crown Darwen Ltd. GBP 200 100%
UK Crown Decorative Production Ltd. GBP 2 100%
UK Crown Paints Ltd. GBP 1 100%
UK Grown Paints Group Ltd. GBP 1,000,000 100%
UK Crown Paints Holding Ltd. GBP 1,000,000 100%
UK Donald Macpherson And Company Ltd. GBP 50,000 100%
UK Hempel Decorative Paints UK Ltd. GBP 2,000 100%
UK Hempel UK Ltd. GBP 4,100,000 100%
UK Reebor Ltd. GBP 100 100%
Ukraine Hempel Ukraine LLC UAH 656,291 100%
United Arab Emirates Hempel Paints (Abu Dhabi) L.L.C. AED 150,000 23%
United Arab Emirates Hempel Paints (Emirates) L.L.C. AED 4,000,000 29%
United Arab Emirates Sapin United Arab Emirates L.L.C.* AED 1,000,000 18%
Uruguay Hempel (Uruguay) S.A. UYU 8,000,000 100%
USA Hempel (USA) Inc. USD 9,000,000 100%
USA Blome International, Inc. USD 18,314 100%
Vietnam Hempel Vietnam Company Limited USD 2,690,017 100%
* Associate
Foreign branchesCaribbean Pinturas Hempel
Hungary Hempel (Czech Republic) s.r.o. Magyarorszagi Fioktelepe
India Hempel (India) Liaison Office
Slovakia Hempel (Czech Republic) s.r.o. org. zlozka Slovensko
Vietnam Hempel (Singapore) Pte. Ltd. Vietnam Representative Office


HEMPEL A/S
Lundtoftegårdsvej 91
DK-2800 Kgs. Lyngby
Denmark
Tel: +45 4593 3800
Fax: +45 4588 5518
www.hempel.com