Embed Size (px)
Citation preview

GREAT-WEST LIFECO
GREAT-WEST LIFE + LONDON LIFE + CANADA LIFE
GREAT-WEST LIFE & ANNUITY + PUTNAM
IGM FINANCIAL
INVESTORS GROUP + MACKENZIE
PARGESA
ANNUAL REPORT 2010

This Annual Report is designed to provide interested shareholders and other interested persons with selected information concerning Power Financial Corporation. For further information concerning the Corporation, share holders and other interested persons should consult the Corporation’s disclosure documents such as its Annual Information Form and Management’s Discussion and Analysis of Operating Results. Copies of the Corporation’s continuous disclosure documents can be obtained at www.sedar.com, on the Corporation’s Web site at www.powerfinancial.com or from the Office of the Secretary at the addresses shown at the end of this report.
Readers should also review the note further in this report, in the Review of Financial Performance section, concerning the use of Forward-Looking Statements, which applies to the entirety of this Annual Report.
In addition, selected information concerning the business, operations, financial condition, priorities, ongoing objectives, strategies and outlook of Power Financial Corporation’s subsidiaries and investment at equity is derived from public information published by such subsidiaries and investment at equity and is provided here for the convenience of the shareholders of Power Financial Corporation. For further information concerning such subsidiaries and investment at equity, shareholders and other interested persons should consult the Web sites of, and other publicly available information published by, such subsidiaries and investment at equity.
The selected performance measures shown on pages 2, 3, 5, 10, 12, 14, 16, 18, 20, 21, 22, 24, 25 and 26 are as of December 31, 2010 unless otherwise noted.
The following abbreviations are used throughout this report: Power Financial Corporation (Power Financial or the Corporation); Great-West Life & Annuity Insurance Company (Great-West Life & Annuity or GWL&A); Great-West Lifeco Inc. (Great-West Lifeco or Lifeco); Groupe Bruxelles Lambert (GBL); IGM Financial Inc. (IGM Financial or IGM); Imerys S.A. (Imerys); Investment Planning Counsel Inc. (Investment Planning Counsel); Investors Group Inc. (Investors Group); Lafarge S.A. (Lafarge); London Life Insurance Company (London Life); Mackenzie Financial Corporation (Mackenzie Financial or Mackenzie); Pargesa Holding SA (Pargesa); Parjointco N.V. (Parjointco); Pernod Ricard S.A. (Pernod Ricard); Power Corporation of Canada (Power Corporation); Putnam Investments, LLC (Putnam Investments or Putnam); Suez Environnement Company (Suez Environnement); The Canada Life Assurance Company (Canada Life); The Great-West Life Assurance Company (Great-West Life); Total S.A. (Total). In addition, Canadian GAAP or GAAP refers to Canadian generally accepted accounting principles, while EBITDA is the abbreviation used herein for earnings before interest, taxes, depreciation and amortization.
THE PHOTOGRAPHS IN THIS ANNUAL REPORT HIGHLIGHT EXAMPLES OF ARCHITECTURE IN SEVERAL OF THE COUNTRIES IN WHICH POWER FINANCIAL GROUP COMPANIES ARE PRESENT.
ON THE COVER
MONTREAL MUSEUM OF FINE ARTS, JEAN-NOËL DESMARAIS PAVILIONMONTRÉAL, QUÉBEC, CANADAPHOTOGRAPHY © ANDRÉ RIDER / 2M2 AGENCY
PAGE 7
GRANDE BIBLIOTHÈQUEMONTRÉAL, QUÉBEC, CANADAPHOTOGRAPHY © ANDRÉ RIDER / 2M2 AGENCY
PAGE 15
DENVER ART MUSEUM, FREDERIC C. HAMILTON BUILDINGDENVER, COLORADO, UNITED STATESPHOTOGRAPHY © ERNIE SANTELLA
PAGE 19
THE GREAT COURT, BRITISH MUSEUMLONDON, ENGLAND© THE TRUSTEES OF THE BRITISH MUSEUM
PAGE 23
UNION STATIONWINNIPEG, MANITOBA, CANADAPHOTOGRAPHY © DEZENE HUBER
PAGE 27
LA GRANDE ARCHEPARIS, FRANCE© JOHAN OTTO VON SPRECKELSENPHOTOGRAPHY © MASTERFILE
POWER FINANCIAL CORPORATION 2010 ANNUAL REPORT 1
TA B L E O F CO N T EN T S
F I N A N C I A L H I G H L I G H T S 1
G R O U P O R G A N I Z AT I O N C H A R T 2
B U S I N E S S S U M M A R Y 4
D I R E C T O R S ’ R E P O R T T O S H A R E H O L D E R S 6
G R E AT- W E S T L I F E C O 14
G R E AT- W E S T L I F E , L O N D O N L I F E , C A N A D A L I F E 16
C A N A D A L I F E — E U R O P E 18
G R E AT- W E S T L I F E & A N N U I T Y 2 0
P U T N A M I N V E S T M E N T S 2 1
I G M F I N A N C I A L 2 2
I N V E S T O R S G R O U P 24
M A C K E N Z I E F I N A N C I A L 2 5
P A R G E S A G R O U P 26
R E V I E W O F F I N A N C I A L P E R F O R M A N C E 29
F I N A N C I A L S TAT E M E N T S A N D N O T E S 47
F I V E - Y E A R F I N A N C I A L S U M M A R Y 89
B O A R D O F D I R E C T O R S 9 0
O F F I C E R S 91
C O R P O R AT E I N F O R M AT I O N 92
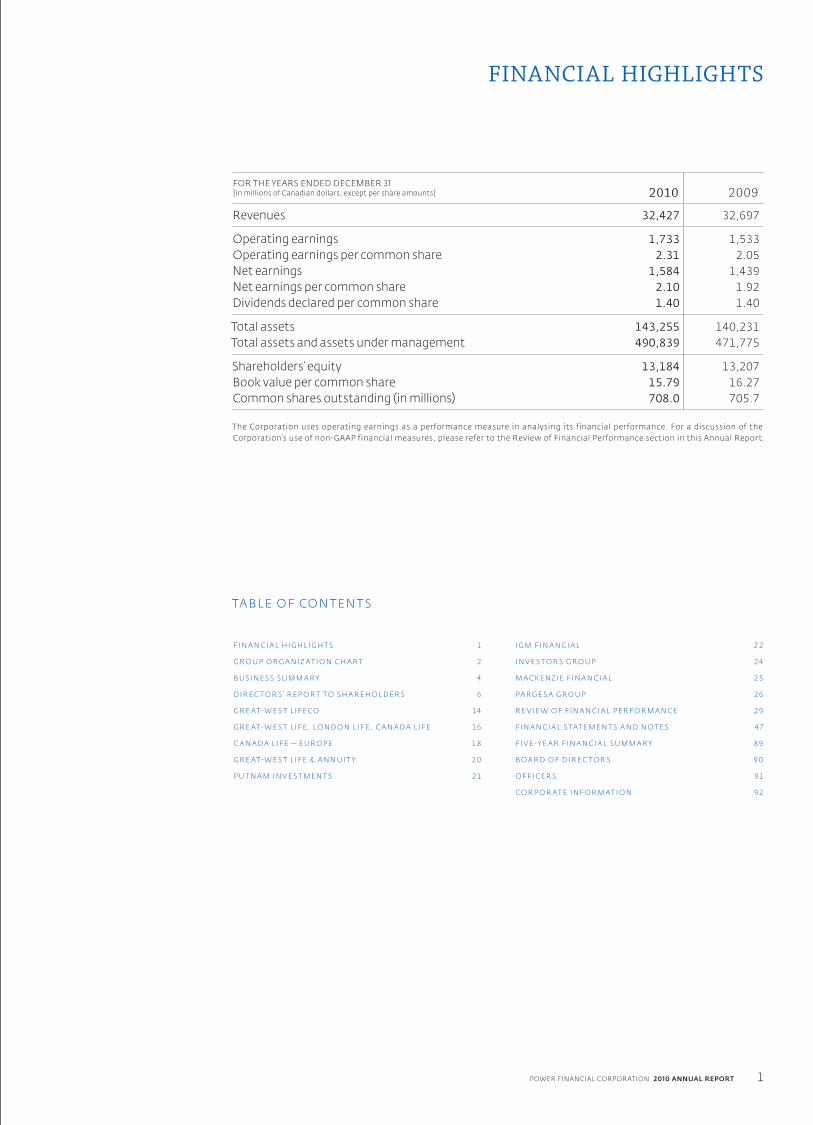
FINANCIAL HIGHLIGHTS
FOR THE YEARS ENDED DECEMBER 31[in millions of Canadian dollars, except per share amounts] 2010 2009
Revenues 32,427 32,697
Operating earnings 1,733 1,533Operating earnings per common share 2.31 2.05Net earnings 1,584 1,439Net earnings per common share 2.10 1.92Dividends declared per common share 1.40 1.40
Total assets 143,255 140,231Total assets and assets under management 490,839 471,775
Shareholders’ equity 13,184 13,207Book value per common share 15.79 16.27Common shares outstanding (in millions) 708.0 705.7
The Corporation uses operating earnings as a performance measure in analysing its financial performance. For a discussion of the Corporation’s use of non-GAAP financial measures, please refer to the Review of Financial Performance section in this Annual Report.

POWER FINANCIAL CORPORATION 2010 ANNUAL REPORT2
POWER FINANCIAL
Power Financial Corporation is a diversified management and holding company that has interests, directly or indirectly, in companies in the financial services sector in Canada, the United States and Europe. It also has substantial holdings in a diversified industrial group based in Europe.
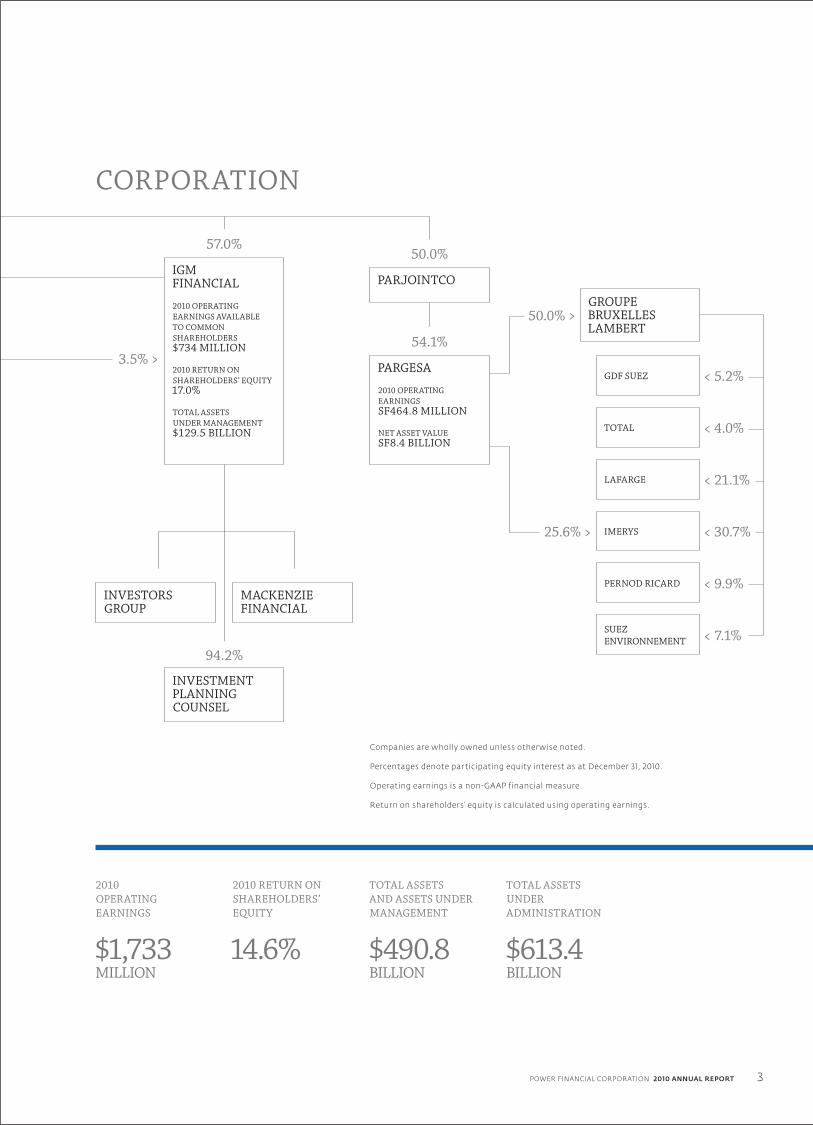
GROUP ORGANIZATION CHART
68.3%
< 4.0%GREAT‑WEST LIFECO
2010 OPERATING EARNINGS ATTRIBUTABLE TO COMMON SHAREHOLDERS$1,861 MILLION
2010 RETURN ON SHAREHOLDERS’ EQUITY16.0%
TOTAL ASSETS UNDER ADMINISTRATION$483.9 BILLION
PUTNAM INVESTMENTS
GREAT‑WEST LIFE & ANNUITY
LONDON LIFE CANADA LIFE GREAT‑WEST LIFE
POWER FINANCIAL CORPORATION 2010 ANNUAL REPORT 3
CORPORATION
Companies are wholly owned unless otherwise noted.
Percentages denote participating equity interest as at December 31, 2010.
Operating earnings is a non‑GAAP financial measure.
Return on shareholders’ equity is calculated using operating earnings.
2010 OPERATING EARNINGS
$1,733MILLION
2010 RETURN ON SHAREHOLDERS’ EQUITY
14.6%
TOTAL ASSETS AND ASSETS UNDER MANAGEMENT
$490.8BILLION
TOTAL ASSETS UNDER ADMINISTRATION
$613.4BILLION
57.0%50.0%
54.1%
94.2%
< 5.2%
< 4.0%
< 21.1%
< 30.7%
< 9.9%
< 7.1%
3.5% >
50.0% >
25.6% >
IGM FINANCIAL
2010 OPERATING EARNINGS AVAILABLE TO COMMON SHAREHOLDERS$734 MILLION
2010 RETURN ON SHAREHOLDERS’ EQUITY 17.0%
TOTAL ASSETS UNDER MANAGEMENT$129.5 BILLION
PARJOINTCO
PARGESA
2010 OPERATING EARNINGSSF464.8 MILLION
NET ASSET VALUESF8.4 BILLION
GROUPE BRUXELLES LAMBERT
INVESTMENT PLANNING COUNSEL
MACKENZIE FINANCIAL
GDF SUEZ
LAFARGE
IMERYS
PERNOD RICARD
SUEZ ENVIRONNEMENT
INVESTORS GROUP
TOTAL
POWER FINANCIAL CORPORATION 2010 ANNUAL REPORT4
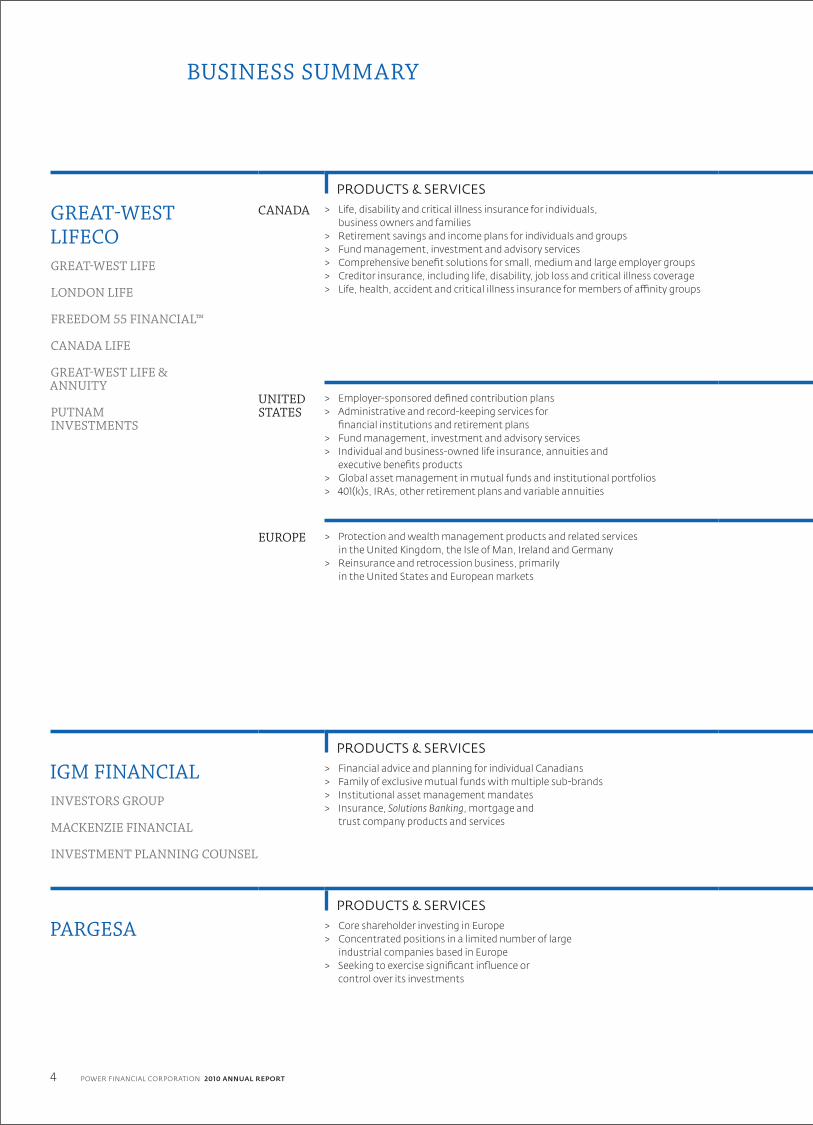
BUSINESS SUMMARY
PRODUCTS & SERVICES DISTRIBUTION CHANNELS MARKET POSITION
GREAT‑WEST LIFECO GREAT‑WEST LIFE
LONDON LIFE
FREEDOM 55 FINANCIAL™
CANADA LIFE
GREAT‑WEST LIFE & ANNUITY
PUTNAM INVESTMENTS
CANADA > Life, disability and critical illness insurance for individuals, business owners and families
> Retirement savings and income plans for individuals and groups> Fund management, investment and advisory services> Comprehensive benefit solutions for small, medium and large employer groups> Creditor insurance, including life, disability, job loss and critical illness coverage> Life, health, accident and critical illness insurance for members of affinity groups
> Gold Key financial security advisors associated with Great‑West Life
> Freedom 55 Financial™ and Wealth & Estate Planning Group financial security advisors associated with London Life
> Independent advisors associated with managing general agencies
> National accounts, including Investors Group> Great‑West Life group insurance and retirement
sales and service staff in offices across Canada that support independent advisors, brokers and benefit consultants distributing its group products
> Serves the financial security needs of more than 12 million Canadians> 26% market share of individual life insurance measured by premium [ 1 ]
> 26% market share of individual living benefits measured by premium [ 1 ]
> 26% market share of individual segregated funds [2]
> 22% market share of group insurance [3] > 20% market share of group capital accumulation plans,
serving 1.2 million member accounts [4]
> Leading market share for creditor insurance revenue premium
[ 1 ] As at September 30, 2010 [ 2 ] As at December 31, 2010 [ 3 ] As at December 31, 2009 [ 4 ] As at June 30, 2010; Benefits Canada 2010 CAP report data
UNITED STATES
> Employer‑sponsored defined contribution plans> Administrative and record‑keeping services for
financial institutions and retirement plans> Fund management, investment and advisory services> Individual and business‑owned life insurance, annuities and
executive benefits products> Global asset management in mutual funds and institutional portfolios> 401(k)s, IRAs, other retirement plans and variable annuities
> Brokers, consultants, advisors and third‑party administrators
> Financial institutions > Sales and service staff and specialized consultants> Services institutional and retail clients and
consultants worldwide through joint ventures, dedicated account management teams and intermediary relationships
> 10.9 million U.S. customers > 4.4 million U.S. participant accounts in defined contribution plans> Putnam earned the No. 1 ranking in the 2009 Lipper/Barron’s Fund Families Survey
based on dramatic gains by individual funds and advancements across the entire fund complex, and was again ranked among the top 15 U.S. mutual fund families by Lipper/Barron’s in their 2010 Fund Families report.
> Over 165,000 advisors distribute Putnam funds
EUROPE > Protection and wealth management products and related services in the United Kingdom, the Isle of Man, Ireland and Germany
> Reinsurance and retrocession business, primarily in the United States and European markets
> Independent financial advisors and employee benefit consultants in the U.K. and Isle of Man
> Independent brokers and direct sales force in Ireland> Independent brokers and multi‑tied agents
in Germany> Independent reinsurance brokers> Direct placements
U.K. and Isle of Man [ 1 ] > 33% share of group life market > 20% share of group income protection market > 16% share of offshore single premium investment
product market > Among the top insurers in payout annuities,
with 7% market shareIreland [ 1 ] > Among top six insurers by new business market share > 5% of life assurance marketGermany [ 1 ] > Among the top eight in the overall unit‑linked market
> Among top ten life reinsurers in the U.S. by assumed business
[ 1 ] Market shares for Europe as at September 30, 2010
PRODUCTS & SERVICES DISTRIBUTION CHANNELS MARKET POSITION
IGM FINANCIALINVESTORS GROUP
MACKENZIE FINANCIAL
INVESTMENT PLANNING COUNSEL
> Financial advice and planning for individual Canadians> Family of exclusive mutual funds with multiple sub‑brands> Institutional asset management mandates> Insurance, Solutions Banking, mortgage and
trust company products and services
> Investors Group network of 4,686 consultants> Mackenzie sales and service for financial advisors
across all wealth management channels (over 30,000 financial advisors)
> Investment Planning Counsel has over 900 independent financial planners
> Institutional asset management sales force> Relationship with Canadian Medical Association
> $129.5 billion in assets under management> Market‑share leader in long‑term mutual fund assets under management> $24.9 billion in institutional, sub‑advised and other mandates with Mackenzie
PRODUCTS & SERVICES GROUP HOLDINGS PERFORMANCE RECORD
PARGESA > Core shareholder investing in Europe> Concentrated positions in a limited number of large
industrial companies based in Europe> Seeking to exercise significant influence or
control over its investments
Lafarge > One of the world leaders in cement, aggregates, concrete and gypsum
Imerys > A world leader in industrial mineralsTotal > An international integrated oil and gas companyGDF Suez > A leading energy provider in electricity and natural gasSuez Environnement > An international water and waste management companyPernod Ricard > The world co‑leader in wines and spirits
> Strong and consistent dividend payout; $2.5 billion over 15 years
> Consistent outperformance of relevant equity market indices over the long term
> Fifteen‑year total return to shareholders of 10.2% (SF), compared with 6.9% (SF) for the Swiss SPI index and 7.7% (€) for the French CAC 40 index

POWER FINANCIAL CORPORATION 2010 ANNUAL REPORT 5
PRODUCTS & SERVICES DISTRIBUTION CHANNELS MARKET POSITION
GREAT‑WEST LIFECO GREAT‑WEST LIFE
LONDON LIFE
FREEDOM 55 FINANCIAL™
CANADA LIFE
GREAT‑WEST LIFE & ANNUITY
PUTNAM INVESTMENTS
CANADA > Life, disability and critical illness insurance for individuals, business owners and families
> Retirement savings and income plans for individuals and groups> Fund management, investment and advisory services> Comprehensive benefit solutions for small, medium and large employer groups> Creditor insurance, including life, disability, job loss and critical illness coverage> Life, health, accident and critical illness insurance for members of affinity groups
> Gold Key financial security advisors associated with Great‑West Life
> Freedom 55 Financial™ and Wealth & Estate Planning Group financial security advisors associated with London Life
> Independent advisors associated with managing general agencies
> National accounts, including Investors Group> Great‑West Life group insurance and retirement
sales and service staff in offices across Canada that support independent advisors, brokers and benefit consultants distributing its group products
> Serves the financial security needs of more than 12 million Canadians> 26% market share of individual life insurance measured by premium [ 1 ]
> 26% market share of individual living benefits measured by premium [ 1 ]
> 26% market share of individual segregated funds [2]
> 22% market share of group insurance [3] > 20% market share of group capital accumulation plans,
serving 1.2 million member accounts [4]
> Leading market share for creditor insurance revenue premium
[ 1 ] As at September 30, 2010 [ 2 ] As at December 31, 2010 [ 3 ] As at December 31, 2009 [ 4 ] As at June 30, 2010; Benefits Canada 2010 CAP report data
UNITED STATES
> Employer‑sponsored defined contribution plans> Administrative and record‑keeping services for
financial institutions and retirement plans> Fund management, investment and advisory services> Individual and business‑owned life insurance, annuities and
executive benefits products> Global asset management in mutual funds and institutional portfolios> 401(k)s, IRAs, other retirement plans and variable annuities
> Brokers, consultants, advisors and third‑party administrators
> Financial institutions > Sales and service staff and specialized consultants> Services institutional and retail clients and
consultants worldwide through joint ventures, dedicated account management teams and intermediary relationships
> 10.9 million U.S. customers > 4.4 million U.S. participant accounts in defined contribution plans> Putnam earned the No. 1 ranking in the 2009 Lipper/Barron’s Fund Families Survey
based on dramatic gains by individual funds and advancements across the entire fund complex, and was again ranked among the top 15 U.S. mutual fund families by Lipper/Barron’s in their 2010 Fund Families report.
> Over 165,000 advisors distribute Putnam funds
EUROPE > Protection and wealth management products and related services in the United Kingdom, the Isle of Man, Ireland and Germany
> Reinsurance and retrocession business, primarily in the United States and European markets
> Independent financial advisors and employee benefit consultants in the U.K. and Isle of Man
> Independent brokers and direct sales force in Ireland> Independent brokers and multi‑tied agents
in Germany> Independent reinsurance brokers> Direct placements
U.K. and Isle of Man [ 1 ] > 33% share of group life market > 20% share of group income protection market > 16% share of offshore single premium investment
product market > Among the top insurers in payout annuities,
with 7% market shareIreland [ 1 ] > Among top six insurers by new business market share > 5% of life assurance marketGermany [ 1 ] > Among the top eight in the overall unit‑linked market
> Among top ten life reinsurers in the U.S. by assumed business
[ 1 ] Market shares for Europe as at September 30, 2010
PRODUCTS & SERVICES DISTRIBUTION CHANNELS MARKET POSITION
IGM FINANCIALINVESTORS GROUP
MACKENZIE FINANCIAL
INVESTMENT PLANNING COUNSEL
> Financial advice and planning for individual Canadians> Family of exclusive mutual funds with multiple sub‑brands> Institutional asset management mandates> Insurance, Solutions Banking, mortgage and
trust company products and services
> Investors Group network of 4,686 consultants> Mackenzie sales and service for financial advisors
across all wealth management channels (over 30,000 financial advisors)
> Investment Planning Counsel has over 900 independent financial planners
> Institutional asset management sales force> Relationship with Canadian Medical Association
> $129.5 billion in assets under management> Market‑share leader in long‑term mutual fund assets under management> $24.9 billion in institutional, sub‑advised and other mandates with Mackenzie
PRODUCTS & SERVICES GROUP HOLDINGS PERFORMANCE RECORD
PARGESA > Core shareholder investing in Europe> Concentrated positions in a limited number of large
industrial companies based in Europe> Seeking to exercise significant influence or
control over its investments
Lafarge > One of the world leaders in cement, aggregates, concrete and gypsum
Imerys > A world leader in industrial mineralsTotal > An international integrated oil and gas companyGDF Suez > A leading energy provider in electricity and natural gasSuez Environnement > An international water and waste management companyPernod Ricard > The world co‑leader in wines and spirits
> Strong and consistent dividend payout; $2.5 billion over 15 years
> Consistent outperformance of relevant equity market indices over the long term
> Fifteen‑year total return to shareholders of 10.2% (SF), compared with 6.9% (SF) for the Swiss SPI index and 7.7% (€) for the French CAC 40 index

POWER FINANCIAL CORPORATION 2010 ANNUAL REPORT6
DIRECTORS’ REPORT TO SHAREHOLDERS
During 2010, Power Financial and its subsidiaries experienced higher sales, gains in market share
and increased levels of profitability. The companies in the group benefited by having continued
to invest in their distribution and product capabilities throughout the financial crisis and by the
financial strength and stability they have demonstrated during these past several years.
Strengthening economic activity and stronger financial market levels helped drive higher revenues
in 2010, which, coupled with the group’s long-standing focus on cost containment and good
investment quality, resulted in the increase in profitability.
The improvements in profitability and sales were experienced
across most business units of Great-West Lifeco and IGM
Financial. The companies in the Pargesa group also experienced
improvements in their operating results following the difficult
economic environment of the previous year.
While economic recovery and confidence continue to progress,
a number of structural challenges remain for the global economy.
Initiatives by financial regulators in developed nations to avoid
future financial crises, although well intentioned and in many
cases welcomed, have created their own uncertainty for financial
services companies with respect to a number of issues such
as required levels of capital in the future.
In this environment, the companies in the Power Financial group
have been focused on growing sales and profitability within
their given markets, while maintaining financial strength at all
times. In this regard, a number of capital market issues were
undertaken in 2010 to extend and diversify debt maturities and ensure healthy liquidity levels across
the group. Dividends paid in 2010 were also kept at the levels paid in 2009.
F I N A N C I A L R E S U LT SPower Financial’s operating earnings for the year ended December 31, 2010 were $1,733 million
or $2.31 per share, compared with $1,533 million or $2.05 per share in the corresponding period
in 2009. This represents an increase of 12.8 per cent on a per share basis.
The increase in operating earnings reflects primarily the increase in the contribution from the
Corporation’s subsidiaries, Great-West Lifeco and IGM Financial.
Other items for 2010 were a charge of $149 million and consisted mainly of Power Financial’s share
of a litigation provision established by Lifeco in the third quarter. In 2009, other items were a charge
of $94 million and consisted essentially of the Corporation’s share of non-recurring amounts
recorded by IGM and Pargesa.
Net earnings including other items were $1,584 million or $2.10 per share for the year ended
December 31, 2010, compared with $1,439 million or $1.92 per share in 2009.
Dividends paid by Power Financial Corporation totalled $1.40 per common share in 2010, unchanged
from 2009.
R. JEFFREY ORR
President and
Chief Executive Officer,
Power Financial Corporation

POWER FINANCIAL CORPORATION 2010 ANNUAL REPORT 7
During 2010, Power Financial and its subsidiaries experienced higher sales, gains in market share and increased levels of profitability.
G RO U P C O M PA N I E S ’ R E S U LT S
G R E AT- W E S T L I F E CO
Great-West Lifeco experienced strong earnings and sales results in 2010 from all business segments
despite the continued currency headwinds due to the strengthening of the Canadian dollar against
the U.S. dollar, British pound and euro during the year. Great-West Lifeco’s capital base and liquidity
position are strong, and the company is well positioned for continued growth.
Great-West Lifeco reported operating earnings attributable to common shareholders of
$1,861 million for 2010, compared with $1,627 million for 2009, an increase of 14.4 per cent. This
represents $1.964 per common share for 2010, compared with $1.722 per common share in 2009.
Operating earnings, a non-GAAP financial measure, exclude the impact of an incremental
litigation provision established in the third quarter of 2010 in the amount of $225 million after tax
($204 million attributable to the common shareholders of Great-West Lifeco and $21 million to its
non-controlling interests).
Return on common shareholders’ equity was 16.0 per cent based on operating earnings and
14.4 per cent on net earnings.

POWER FINANCIAL CORPORATION 2010 ANNUAL REPORT8
Premiums and deposits were $59.1 billion, compared with $56.7 billion in 2009. General fund assets
increased from $128.4 billion to $131.6 billion in 2010.
Total assets under administration at December 31, 2010 were $483.9 billion, compared with
$458.6 billion a year ago.
The dividend on Great-West Lifeco’s common shares remained unchanged in 2010.
Great-West Lifeco’s capital position remains very strong. Its Canadian operating subsidiary,
Great-West Life, reported a Minimum Continuing Capital
and Surplus Requirements (MCCSR) ratio of 203 per cent at
December 31, 2010. At December 31, 2010 Great-West Lifeco held,
at the holding company level, approximately $800 million in
liquid assets derived from capital-raising initiatives since the
fourth quarter of 2008, which is not reflected in the Great-West
Life MCCSR ratio.
In Canada, Great-West Lifeco’s companies maintained leading
market positions in their individual and group businesses. The
Canadian operations continue to experience strong organic
growth by focusing on diversified distribution, product and
service enhancements and expense management.
In Canada, net earnings attributable to Great-West Lifeco’s
common shareholders for 2010 were $940 million, compared
with $883 million in 2009. Total sales in Canada for 2010 were
up 23 per cent to $9.5 billion, compared with $7.7 billion after
adjusting the 2009 twelve-month period for the impact of the
group retirement assets acquired from Fidelity Investments Canada. This growth was driven by
strong sales of proprietary retail investment funds which were up 31 per cent, payout annuity
products which were up 11 per cent, and individual life product sales which increased 26 per cent,
compared to the twelve-month period in 2009.
Total assets under administration at December 31, 2010 were $125.5 billion, compared with
$114.6 billion at December 31, 2009.
In the United States, Great-West Lifeco’s Financial Services businesses continued to grow, with a
34 per cent increase in sales over 2009 on a constant currency basis. Strong sales across defined
contribution markets and of single-premium life and business-owned life insurance led to record
sales in both business segments. Net earnings attributable to common shareholders for 2010 were
$343 million, compared with $228 million in 2009. Total sales for 2010 were $38.1 billion, compared
with $32.4 billion in 2009. As a result of currency movement, net earnings were negatively impacted
by $32 million compared to 2009.
RAYMOND L. MCFEETORS
Vice‑Chairman,
Power Financial Corporation
and Chairman of the Board,
Great‑West Lifeco
DIRECTORS’ REPORT TO SHAREHOLDERS CONTINUED
POWER FINANCIAL CORPORATION 2010 ANNUAL REPORT 9
Total assets under administration at December 31, 2010 were $293.7 billion, compared with
$277.8 billion at December 31, 2009.
In 2010, Putnam Investments and its clients enjoyed another year of excellent investment
performance which, together with innovative product launches, resulted in very strong market
share gains in U.S. mutual fund sales. Putnam’s assets under management, including PanAgora,
increased to US$121 billion at year-end from US$115 billion a year earlier. Putnam’s suite of absolute
return funds, first offered in 2009, reached US$2.7 billion at the end of 2010. Putnam continued to
introduce new products and services across its offering in 2010. A key area of focus and investment
is the defined contribution marketplace, and in particular 401(k) plans, where Putnam’s award-
winning offering is experiencing strong momentum with U.S. employers.
In Europe, net earnings attributable to common shareholders increased to $578 million, compared
with $529 million in 2009, in spite of currency movements which negatively impacted results by
$71 million compared to 2009.
In 2010, Great-West Lifeco’s European Operations continued to face challenging credit markets
as well as a general loss of consumer confidence in investments, due to a sharp decline in equity
markets in late 2008 and early 2009. Although conditions continued to generally improve in 2010,
these pressures affected sales volumes in a number of areas. Earnings were impacted by the
required strengthening of reserves for future asset default risk and asset impairments.
Total sales for 2010 were $4.5 billion, compared with $4.0 billion in 2009. Sales increased by 27 per cent
in local currency; however, this was partly offset by the negative effect of currency movement.
Total assets under administration in Europe at December 31, 2010 were $64.7 billion, compared with
$66.2 billion at December 31, 2009.
I G M F IN A N C I A L
IGM Financial and its operating companies experienced an increase in total assets under
management during 2010. Net earnings for the company grew substantially compared with 2009.
Investors Group and Mackenzie Financial, IGM’s principal businesses, generated business growth
through product innovation, investment management success, resource management and
distribution expansion throughout the year.
Operating earnings available to common shareholders of IGM for 2010 were $734 million or
$2.79 per share, compared with $622 million or $2.35 per share in 2009. This represents an increase
of 18.7 per cent on a per share basis.
Net earnings available to common shareholders were $726 million or $2.76 per share in 2010,
compared with $559 million or $2.12 per share in 2009.
POWER FINANCIAL CORPORATION 2010 ANNUAL REPORT10
Total assets under management at December 31, 2010 were $129.5 billion, an increase of 7.4 per cent.
Return on average common equity based on operating earnings for 2010 was 17.0 per cent,
compared with 14.8 per cent in 2009. Dividends declared remained unchanged in 2010.
The Investors Group consultant network expanded to 4,686 consultants at December 31, 2010, up
from 4,633 at December 31, 2009.
Investors Group’s mutual fund sales for the year were $5.7 billion, compared with $5.0 billion in
the prior year, and mutual fund net sales were $253 million,
compared with $404 million a year ago. Mutual fund assets under
management at December 31, 2010 were $61.8 billion, compared
with $57.7 billion at December 31, 2009, an increase of 7.2 per cent.
Mackenzie’s total sales for 2010 were $12.2 billion, compared
with $11.6 billion in the prior year. Total net redemptions were
$1.5 billion, compared with total net redemptions of $1.4 billion
a year ago.
Investment performance of Mackenzie’s mutual fund family
remained strong, with 60 per cent of its fund assets ranked in
the first or second quartile of their respective asset categories
over the last three years.
Mackenzie’s total assets under management at December 31,
2010 were $68.3 billion, compared with $63.6 billion at
December 31, 2009, an increase of 7.5 per cent. Mutual fund
assets under management at the 2010 year-end were $43.5 billion,
compared with $40.6 billion a year earlier, an increase of
7.0 per cent.
PA RG E S A
The Pargesa group holds significant positions directly and through the Belgian holding company
Groupe Bruxelles Lambert (GBL) in six large companies based in Europe: Lafarge, which produces
cement and building materials; Imerys, a producer of industrial minerals; Total, in the oil and gas
industry; GDF Suez, in electricity and gas; Suez Environnement, in water and waste management;
and Pernod Ricard, a leading producer of wines and spirits.
The Pargesa group’s strategy is to establish a limited number of substantial interests in which it
can acquire a position of control or significant influence. In 2010, there were no major changes
in Pargesa’s investment portfolio. Overall, the companies in the group experienced improvements
in operating performance, following the very difficult economic conditions of 2009.
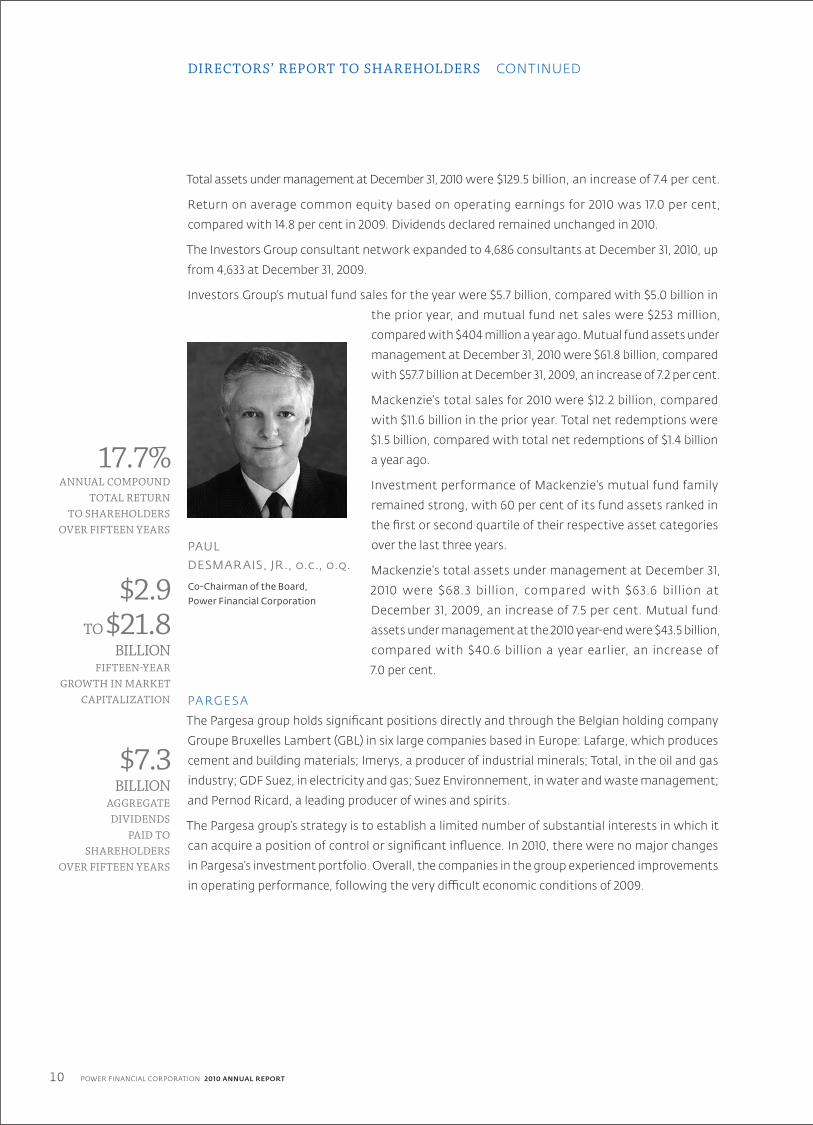
PAUL DESMARAIS, JR., o.c., o.q.
Co‑Chairman of the Board,
Power Financial Corporation
DIRECTORS’ REPORT TO SHAREHOLDERS CONTINUED
17.7%ANNUAL COMPOUND
TOTAL RETURN TO SHAREHOLDERS
OVER FIFTEEN YEARS
$2.9TO $21.8
BILLIONFIFTEEN‑YEAR
GROWTH IN MARKET CAPITALIZATION
$7.3BILLION
AGGREGATE DIVIDENDS
PAID TO SHAREHOLDERS
OVER FIFTEEN YEARS

POWER FINANCIAL CORPORATION 2010 ANNUAL REPORT 11
During 2010, Pargesa and GBL carried out several transactions designed to extend their debt
maturity profile and reduce borrowing costs. In June, GBL issued a €350 million 7.5-year 3.7 per cent
bond and, during the course of the year, repurchased convertible bonds for €126 million. In
October, Pargesa issued bonds bearing interest at 2.5 per cent per annum with a six-year term for
SF150 million, and repurchased convertible bonds for SF6 million due in 2013 and SF132 million due
in 2014. Also in 2010, GBL purchased €122 million of Pernod Ricard shares in the marketplace, raising
its equity interest to 9.9 per cent as at December 31, 2010.
Pargesa’s net operating earnings declined 9.2 per cent in 2010 to
€465 million, mainly due to an 8.5 per cent decrease in the euro
against the Swiss franc, the reporting currency used in Pargesa’s
financial statements. The 2009 results also reflected a number
of non-recurring items, including an exceptional dividend from
GDF Suez.
At the end of December 2010, Pargesa’s adjusted net asset value
was SF8.4 billion. This represents a value of SF99.8 per Pargesa
share, compared with SF127.1 at the end of 2009, a decrease of
21.5 per cent expressed in Swiss francs.
At the annual meeting of shareholders of Pargesa, scheduled for
May 5, 2011, its board of directors will propose maintaining the
dividend at SF2.72 per bearer share, for a total distribution
of SF230 million.
G RO U P D E V E LO P M E N T SThe companies in the Power Financial group were active in the
capital markets in 2010, with the goal of improving the quality
of capital or extending debt maturities.
In June, Power Financial issued $280 million of 4.40% non-cumulative rate reset First Preferred
Shares, Series P. In July, the Corporation redeemed all $150 million of its outstanding 4.70% Series J
First Preferred Shares, and in October it redeemed all $150 million of its outstanding 5.20% Series C
First Preferred Shares.
Great-West Lifeco issued 4.65% debentures in the amount of $500 million due in 2020, and redeemed
$200 million of outstanding 6.75% debentures due 2015. It also issued $250 million of First Preferred
Shares, Series M, and $150 million of First Preferred Shares, Series N, and redeemed $198 million
of First Preferred Shares, Series D. During 2010, IGM issued $200 million of 6.0% 30-year debentures.
ANDRÉ DESMARAIS, o.c., o.q.
Co‑Chairman of the Board,
Power Financial Corporation

POWER FINANCIAL CORPORATION 2010 ANNUAL REPORT12
I N D U S T RY M ATT E R SPower Financial and its subsidiaries are engaged in dialogue throughout Canada with regard to a
number of important topics which impact the well-being of Canadians and the financial services
industry. These topics include the public debate regarding the retirement readiness of Canadians
and a number of related matters.
Canada’s retirement system is among the strongest in the OECD, both in terms of income adequacy
and system sustainability. One of its key strengths is that it is well balanced between government-
provided programs, employer-sponsored plans and individual savings. Notwithstanding the
system’s relative strength, research suggests that a number of Canadians across different age
and income brackets may still not be adequately prepared for retirement. The public debate about
retirement is therefore required and welcome. Enhancements to the system can and should be
made, but should be based upon well-founded research and should seek to build upon the many
elements of the current system which are already working well.
Canadians’ use of financial advisors is an important factor in enabling them to plan for and live
comfortably in retirement. Research by the Investment Funds Institute of Canada demonstrates
that people who use a financial advisor have substantially higher investment assets than non-
advised households, in each income range and age bracket. Advised households also have
approximately double the participation rate in tax-advantaged programs such as RRSPs and are
more confident they will have enough money to retire comfortably.
Mutual funds are one of the principal investment vehicles used by Canadians to save.
A comprehensive research study commissioned by Mackenzie Financial and conducted by Bain
Consulting demonstrates that for mutual funds purchased with financial advice, the cost of
mutual fund ownership for the vast majority of investors in Canada is comparable with their
counterparts in the United States. A number of other published studies have failed to account for
the significant differences in the way in which mutual fund fees are reported in the two countries
and for differences in the manner in which mutual funds are distributed. The company believes
that mutual funds, together with the advice of a professional financial advisor, will remain a very
effective way for millions of Canadians to provide for their financial futures.
Power Financial and its subsidiaries believe the current public debate about the retirement readiness
of Canadians is important and beneficial. A combination of public and private initiatives can build
upon an already successful system to increase the number of Canadians who are financially
prepared for the future.
DIRECTORS’ REPORT TO SHAREHOLDERS CONTINUED
$1,733MILLIONOPERATING
EARNINGS IN 2010
$13,184MILLION
SHAREHOLDERS’ EQUITY
$490.8BILLION
TOTAL ASSETS AND ASSETS UNDER MANAGEMENT

POWER FINANCIAL CORPORATION 2010 ANNUAL REPORT 13
B OA R D O F D I R E C TO R SAt the May 2011 Annual Meeting, shareholders will be asked to elect Mr. Timothy Ryan to the
Board. Mr. Ryan is President and Chief Executive Officer of SIFMA, the Securities Industry
and Financial Markets Association, the leading trade association representing global financial
market participants. He is also a director of Great-West Lifeco and several of its major subsidiaries,
and has had broad international involvement in the financial services industry.
T H E P OW E R F I N A N C I A L G RO U PPower Financial is focused on the economic drivers underlying demand for protection products,
retirement savings, asset management and core shareholder investing. Our governance model
involves a high degree of engagement in all of our companies through their boards of directors.
And as we emerge from challenging times, your Directors believe that Power Financial’s business
model will continue to serve our shareholders well. Our companies have strong balance sheets,
strategic distribution channels, competitive products and effective growth strategies.
Your Directors and Management team seek to provide attractive long-term shareholder returns.
We believe that the results of this effort are reflected in the improvement in profitability, the
maintenance of our dividend throughout the crisis and our strong and very stable credit ratings.
Signed R. Jeffrey Orr President and Chief Executive Officer
March 10, 2011
ON BEHALF OF THE BOARD OF DIRECTORS,
Our companies have strong balance sheets, strategic distribution channels, competitive products and effective growth strategies.
Signed
Paul Desmarais, Jr., O.C., O.q.
Co-Chairman of the Board
Signed
André Desmarais, O.C., o.q.
Co-Chairman of the Board
Significant effort is being directed by the management teams throughout the group at pursuing
growth opportunities in their markets, while continuing to position their balance sheets and
liquidity positions prudently.
Your Directors wish to express gratitude on behalf of the shareholders for the important
contribution of the management and employees of our Corporation and its associated companies
to the successful results achieved in 2010 in an improving but challenging operating environment.
POWER FINANCIAL CORPORATION 2010 ANNUAL REPORT14
GREAT WEST LIFECO
Great-West Lifeco is a financial services holding company with interests in the life insurance, health
insurance, retirement savings, investment management and reinsurance businesses. Lifeco has
operations in Canada, the United States, Europe and Asia through Great-West Life, London Life,
Canada Life, Great-West Life & Annuity and Putnam Investments. Lifeco and its companies have
approximately $484 billion in assets under administration.
Great-West Lifeco experienced strong earnings and sales results in 2010 from all business segments
despite the continued currency headwinds caused by the strengthening of the Canadian dollar
against the U.S. dollar, British pound and euro during the year.
Lifeco’s capital base and liquidity position remain strong, and the
company is well positioned for continued growth.
Operating earnings attributable to common shareholders were
$1.9 billion, or $1.964 per share, compared with $1.6 billion or $1.722
per share in 2009. Operating earnings, a non-GAAP financial
measure, exclude the impact of an incremental litigation provision.
Great-West Lifeco’s return on equity (ROE) of 16.0 per cent on
operating earnings and 14.4 per cent on net earnings for the
twelve months ended December 31, 2010 continued to rank
among the strongest in the financial services sector.
The quarterly dividend on Lifeco’s common shares remained
unchanged in 2010.
Other measures of Lifeco’s performance in 2010 include:
> Premiums and deposits were $59.1 billion, compared with $56.7 billion in 2009.
> General fund assets increased from $128.4 billion to $131.6 billion in 2010.
> Total assets under administration at December 31, 2010 were $483.9 billion,
compared with $458.6 billion a year ago.
Great-West Lifeco’s companies have benefited from their prudent and conservative investment
policies and practices with respect to the management of their consolidated assets. In addition,
conservative product underwriting standards and a disciplined approach to introducing new products
have proven beneficial for Lifeco and its companies over the long term. In Canada, Lifeco’s companies
continue to offer segregated fund guarantees in a prudent and disciplined manner, thereby limiting risk
exposure. As a result of these disciplines, Lifeco’s balance sheet is one of the strongest in the industry.
The Minimum Continuing Capital and Surplus Requirements (MCCSR) ratio for Great-West Life
was 203 per cent on a consolidated basis at December 31, 2010. This measure of capital strength
remains at the upper end of the company’s target operating range.
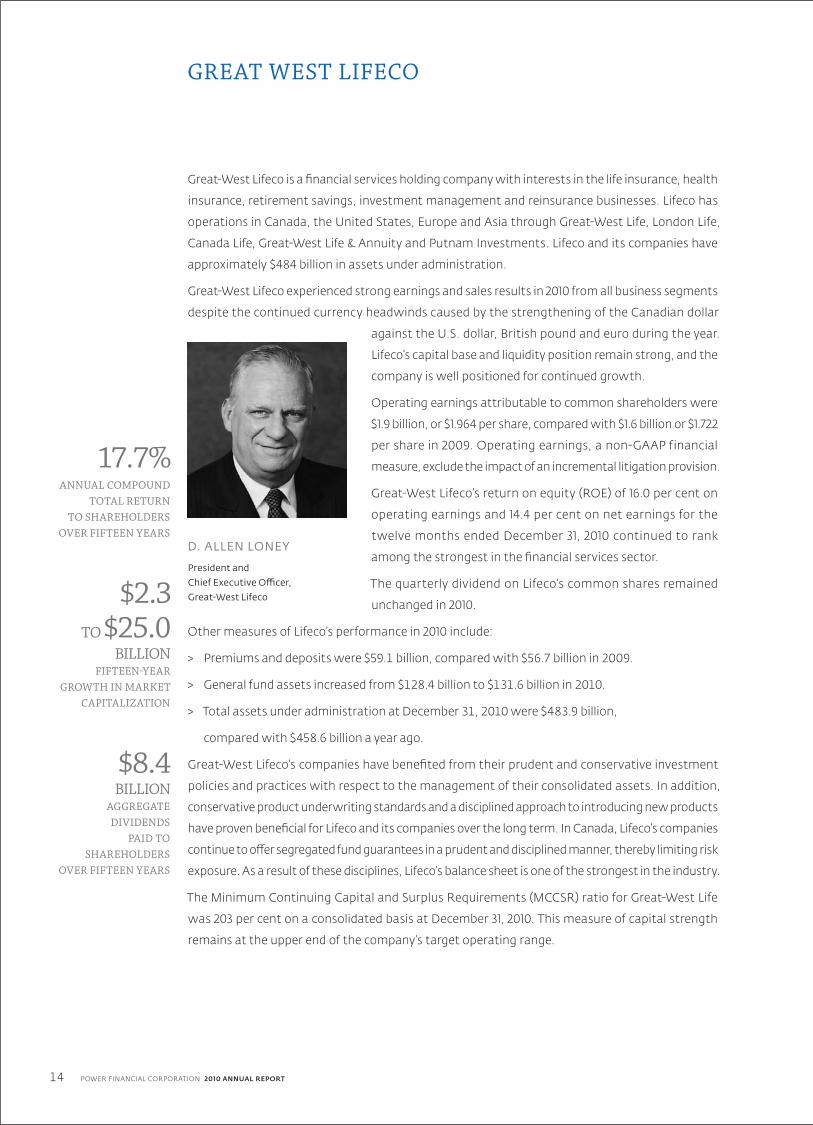
D. ALLEN LONEY
President and
Chief Executive Officer,
Great‑West Lifeco
17.7%ANNUAL COMPOUND
TOTAL RETURN TO SHAREHOLDERS
OVER FIFTEEN YEARS
$2.3TO $25.0
BILLIONFIFTEEN‑YEAR
GROWTH IN MARKET CAPITALIZATION
$8.4BILLION
AGGREGATE DIVIDENDS
PAID TO SHAREHOLDERS
OVER FIFTEEN YEARS
POWER FINANCIAL CORPORATION 2010 ANNUAL REPORT 15
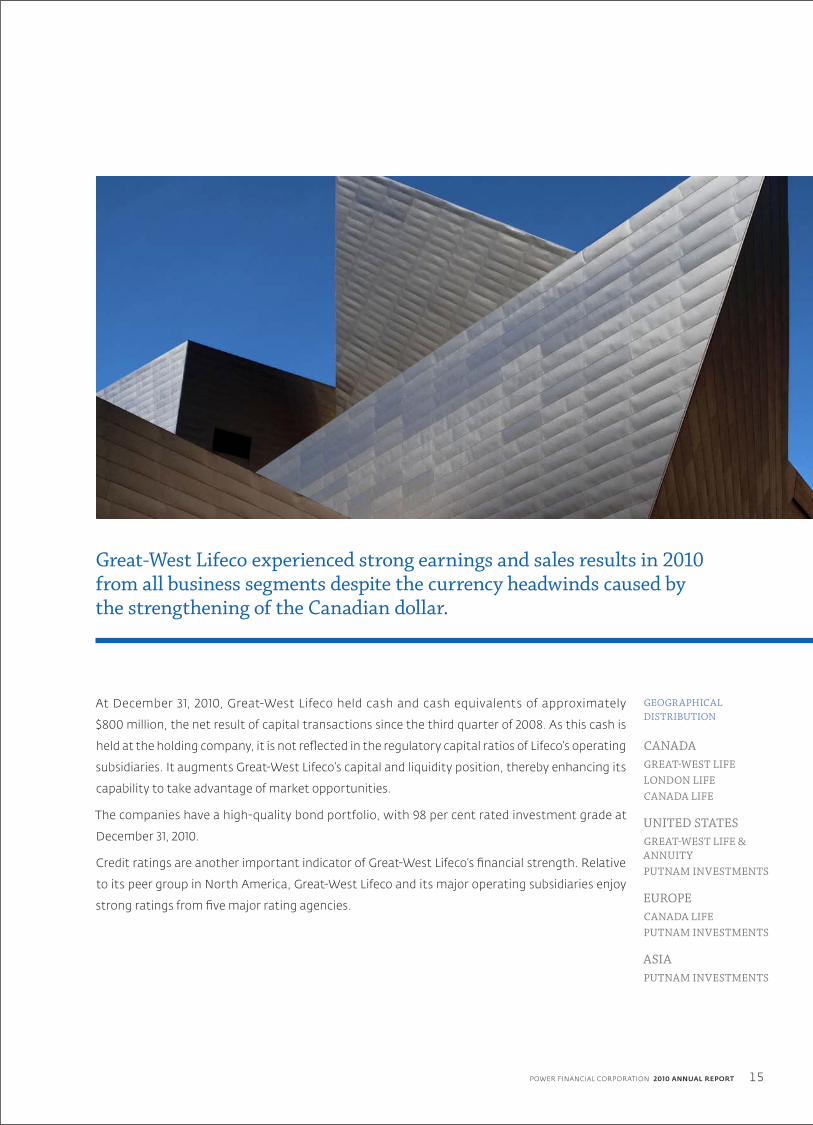
Great-West Lifeco experienced strong earnings and sales results in 2010 from all business segments despite the currency headwinds caused by the strengthening of the Canadian dollar.
At December 31, 2010, Great-West Lifeco held cash and cash equivalents of approximately
$800 million, the net result of capital transactions since the third quarter of 2008. As this cash is
held at the holding company, it is not reflected in the regulatory capital ratios of Lifeco’s operating
subsidiaries. It augments Great-West Lifeco’s capital and liquidity position, thereby enhancing its
capability to take advantage of market opportunities.
The companies have a high-quality bond portfolio, with 98 per cent rated investment grade at
December 31, 2010.
Credit ratings are another important indicator of Great-West Lifeco’s financial strength. Relative
to its peer group in North America, Great-West Lifeco and its major operating subsidiaries enjoy
strong ratings from five major rating agencies.
GEOGRAPHICAL DISTRIBUTION
CANADAGREAT‑WEST LIFELONDON LIFECANADA LIFE
UNITED STATESGREAT‑WEST LIFE & ANNUITYPUTNAM INVESTMENTS
EUROPECANADA LIFEPUTNAM INVESTMENTS
ASIAPUTNAM INVESTMENTS

POWER FINANCIAL CORPORATION 2010 ANNUAL REPORT16
GREAT‑WEST LIFE | LONDON LIFE | CANADA LIFE
G R E AT-W E S T L I F EGreat-West Life is a leading Canadian insurer, with interests in the life and health insurance,
investment, savings and retirement income and reinsurance businesses, primarily in Canada
and Europe.
In Canada, Great-West Life and its subsidiaries, London Life and Canada Life, offer a broad
portfolio of financial and benefit plan solutions and serve the financial security needs of more
than 12 million people.
Great-West Life’s products include a wide range of investment,
savings and retirement income plans, and payout annuities, as well
as life, disability, critical illness and health insurance for individuals
and families. These products and services are distributed through
a diverse network of financial security advisors and brokers
associated with Great-West Life; financial security advisors
associated with London Life’s Freedom 55 Financial™ division
and the Wealth & Estate Planning Group; and the channels
Canada Life supports, including independent advisors associated
with managing general agencies, as well as national accounts,
including Investors Group.
For large and small businesses and organizations, Great-West
Life offers a variety of group benefit plan solutions featuring
options such as life, healthcare, dental care, critical illness,
disability and wellness, and international benefit plans, plus
convenient online services. Great-West Life also offers group retirement and savings plans that
are tailored to the unique needs of businesses and organizations. These products and services are
distributed through financial security advisors associated with Great-West Life and its subsidiaries,
as well as independent advisors, brokers and consultants.
In 2010, Great-West Life and its subsidiaries continued to see strong sustained performance in
their Canadian businesses. Their individual life insurance business grew significantly faster than
the market; the group retirement services business recorded strong growth; the group insurance
business continued to experience strong persistency; and the individual segregated fund and
mutual fund businesses maintained positive net deposits.
The Canadian operations continued to focus on enhancing their distribution capabilities
throughout 2010 with refinement of their multi-channel strategy, including enhanced support for
advisors in the exclusive and independent distribution channels.
PAUL A. MAHON
President and
Chief Operating Officer,
Canada
$125.5BILLION
IN ASSETS UNDER ADMINISTRATION
IN CANADA
3.3MILLION
INDIVIDUAL POLICYHOLDERS
IN CANADA
CANADA

POWER FINANCIAL CORPORATION 2010 ANNUAL REPORT 17
LO N D O N L I F E London Life offers financial security advice and planning through its more than 3,300-member
Freedom 55 Financial division. Freedom 55 Financial offers London Life’s own brand of investment,
savings and retirement income, annuity, life insurance and mortgage products. Within Freedom
55 Financial, the Wealth & Estate Planning Group is a specialized segment of advisors focused on
meeting the complex needs of affluent Canadians.
In addition, financial security advisors associated with London Life offer a broad range of financial
products from other financial institutions. These include individual disability insurance and critical
illness insurance underwritten by Great-West Life. A London Life subsidiary, Quadrus Investment
Services Ltd., offers 43 exclusive mutual funds under the Quadrus Group of Funds™ brand and over
3,500 third-party mutual funds.
Recruiting and retention of financial security advisors continued to be a significant focus in 2010,
with Freedom 55 Financial showing consistent growth in the number of advisors year over year.
In 2010, London Life’s strong growth in individual life insurance sales significantly outpaced that
of the industry. Together, London Life, Great-West Life and Canada Life remain Canada’s number
one provider of individual life insurance. London Life has the largest number of participating life
insurance policies in Canada.
In addition to its domestic operations, London Life participates in international reinsurance
markets through London Reinsurance Group.
C A N A DA L I F EIn Canada, Canada Life offers a broad range of insurance and wealth management products
and services for individuals, families and business owners from coast to coast. These include
investments, savings and retirement income, and annuities, as well as life, disability and critical
illness insurance. Canada Life’s products are distributed through independent advisors associated
with managing general agencies, as well as national accounts, including Investors Group.
In 2010, Canada Life continued to see strong sustained performance in all lines of business. The
company’s individual life insurance and living benefits businesses grew faster than the market, while
its individual retirement and investment services businesses maintained positive net cash flows.
Together, Canada Life, Great-West Life and London Life remain Canada’s number one provider of
individual life insurance and a leading provider of individual segregated funds. Canada Life, together
with Great-West Life, is a leading provider of individual disability insurance and critical illness
insurance for Canadians. Canada Life is the leading provider of creditor insurance in Canada for
mortgages, loans, credit cards, lines of credit and leases through leading financial institutions,
automobile dealerships and other lending institutions. Canada Life is a leading provider of
traditional mortality, structured and annuity reinsurance solutions for life insurers in the U.S. and
in international markets through its Canada Life Reinsurance Division.

POWER FINANCIAL CORPORATION 2010 ANNUAL REPORT18
CANADA LIFEEUROPE
Canada Life, with roots in Europe dating back to 1903, provides individuals and their families with
a broad range of insurance and wealth management products. These include: payout annuities,
investments and group insurance in the United Kingdom, distributed through independent
financial advisors and employee benefit consultants; savings and individual insurance in the Isle of
Man, distributed through independent financial advisors in the United Kingdom and other selected
territories; individual insurance and savings, and pension products in Ireland, distributed through
independent brokers and a direct sales force; and fund-based pensions, critical illness and essential
ability insurance in Germany, distributed through independent
brokers and multi-tied agents.
In 2010, Canada Life continued to face challenging credit markets
as well as a general loss of consumer confidence in investments,
due to a sharp decline in equity markets in late 2008 and early
2009. Although conditions continued to generally improve in
2010, these pressures continued to affect sales volumes. As well,
earnings were again impacted by the required strengthening
of reserves for future asset default risk and asset impairments.
As a result of Canada Life’s continued focus on credit and expense
controls, Canada Life’s European operations were in a strong
position coming into 2010, and this focus was maintained
throughout the year. Additionally, there was a renewed focus
on risk and risk management as the company prepared for the
advent of Solvency II in Europe.
In Germany, Canada Life operates in the independent broker market and is one of the leading
insurers for guaranteed unit-linked products in the broker segment. In 2010, Canada Life launched
a series of new pension products which improved the company’s market competitiveness, and
increased sales towards the end of the year. Canada Life’s industry-leading guaranteed withdrawal
benefit product, launched in 2009, continued to gain support and became the leading product in
its category, as reported in a recent poll of insurance intermediaries.
In the U.K., Canada Life continued to grow premium volumes, especially in the Isle of Man product
range, despite economic challenges which adversely affected Canada Life’s Group insurance
business. Sales of payout annuities were very strong in the early part of 2010, though competitive
pressures and a lack of quality investment opportunities resulted in slower sales throughout the
rest of the year.
WILLIAM L. AC TON
President and
Chief Executive Officer,
Canada Life Capital Corporation
$64.7BILLION
IN ASSETS UNDER ADMINISTRATION
IN EUROPE
$9.3BILLION
IN ANNUAL PREMIUMS AND
DEPOSITS IN EUROPE IN 2010
4.2MILLION
INDIVIDUALS COVERED
IN EUROPE

POWER FINANCIAL CORPORATION 2010 ANNUAL REPORT 19
Canada Life is a leading provider of traditional mortality, financial and annuity reinsurance solutions
to life insurers in the U.S. and in international markets through its Canada Life Reinsurance
division. In 2010, reinsurance demand remained strong, although growth rates moderated in
light of improving economic and capital conditions. Canada Life continued to leverage its financial
strength, disciplined risk management practices and excellent client relationships to achieve strong
business results.
Great-West Lifeco’s companies have benefited from their prudent and conservative investment policies and practices.
POWER FINANCIAL CORPORATION 2010 ANNUAL REPORT20
GREAT-WEST LIFE & ANNUITY UNITED STATES
In the United States, Great-West Life & Annuity is a leading provider of employer-sponsored
retirement savings plans. It also provides annuities and life insurance for individuals and businesses,
as well as fund management, investment and advisory services. Its products and services are
marketed nationwide through its sales force, brokers, consultants, advisors, third-party
administrators and financial institutions.
In its Retirement Services segment, GWL&A offers retirement savings products and services for
public, non-profit and corporate employers, as well as private label record-keeping, administrative
and asset management services for other providers of defined
contribution plans. GWL& A also provides business-owned
life insurance, executive benefits products, and individual
life insurance and annuity products through its Individual
Markets segment.
In 2010, strong sales across defined contribution markets and
of single-premium life and business-owned life insurance led
to record sales results in both of GWL&A’s business segments.
Higher account balances resulting from an overall rise in the
U.S. equities market contributed to increased fee income.
Robust sales in the corporate 401(k) and large-case public/non-
profit markets helped increase GWL&A’s number of retirement
participant accounts to 4.4 million. Contracts with three
additional states resulted in an industry-leading total of 18 state
governmental 457 plans.
The introduction of Maxim® SecureFoundationSM funds, a guaranteed lifetime withdrawal benefit
product, builds upon a strategy to enhance GWL&A’s retirement product array and increase assets
under management. The Maxim Lifetime Asset Allocation Series®, a suite of target date funds
(TDFs) introduced in 2009, exceeded $1 billion in assets. Combined assets in those funds and the
Maxim SecureFoundation target date portfolios propelled GWL&A subsidiary Maxim Series Fund,
Inc. into the top 10 U.S. fund families by TDF net asset flow in 2010, according to Morningstar
Direct data.
GWL&A also completed a comprehensive planning process which identified a number of key
initiatives across the organization to accelerate the growth of the business.
Its asset portfolio continued to perform well, following a two-year period during which investment
losses from bonds and mortgages were among the lowest of U.S. life insurance companies
as a percentage of invested assets, according to Moody’s Investors Service.
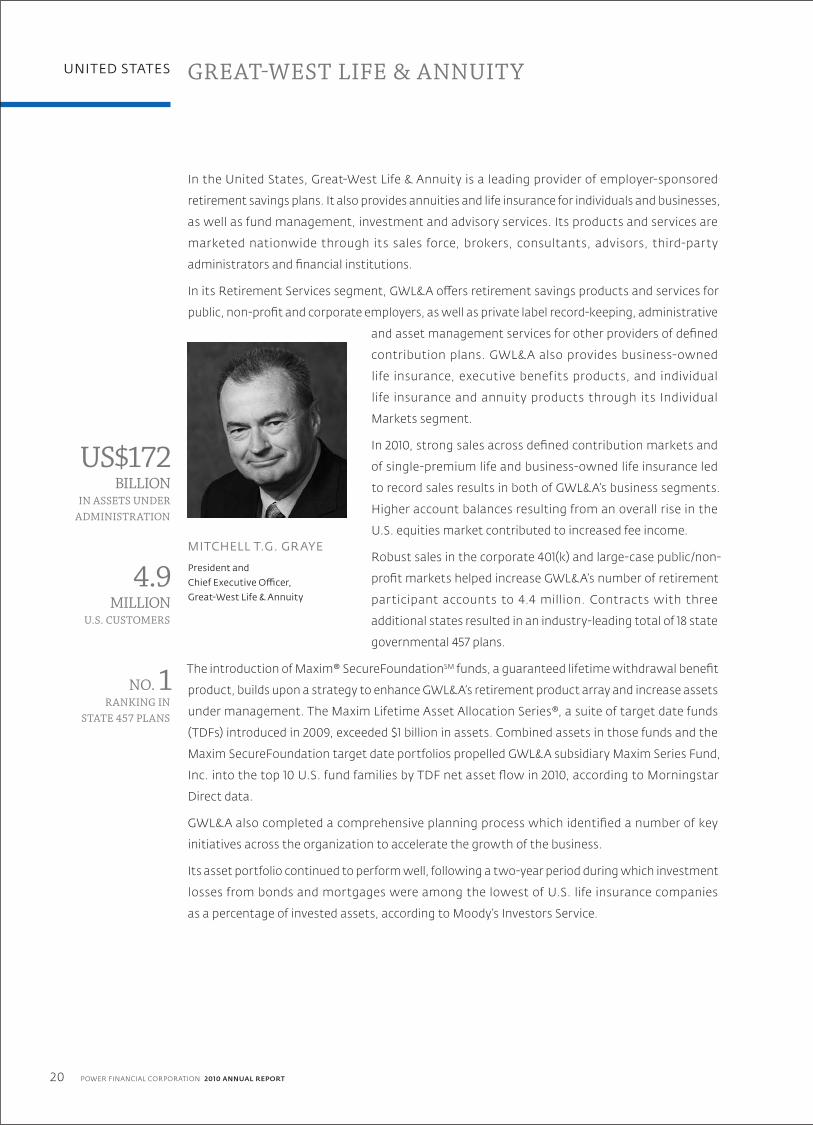
MITCHELL T.G. GRAYE
President and
Chief Executive Officer,
Great-West Life & Annuity
US$172BILLION
IN ASSETS UNDER ADMINISTRATION
4.9MILLION
U.S. CUSTOMERS
NO. 1RANKING IN
STATE 457 PLANS

POWER FINANCIAL CORPORATION 2010 ANNUAL REPORT 21
PUTNAM INVESTMENTS UNITED STATES EUROPE I A SIA
Putnam Investments is a global asset manager and retirement plan record keeper serving individual
and institutional investors worldwide through its offices and strategic alliances in North America,
Europe and Asia. Since 1937, the firm has practised an active approach to pursuing client mandates.
Today, Putnam provides investment services across a range of fixed income, equity, absolute
return and alternative strategies, and distributes those services primarily through intermediaries,
including pension consultants and financial advisors.
Putnam was recognized by a number of industry observers for excellent performance in 2010.
The firm was named “Mutual Fund Manager of the Year” by
Institutional Investor magazine, and—based on its asset-weighted
performance—was again ranked among the top 15 U.S. mutual
fund families by Barron’s in their “Best Fund Families in 2010” report.
Putnam enhanced its equity product line during the year with
the introduction of Putnam Global Sector Fund, a fund of funds
employing the full breadth of Putnam’s global sector expertise.
The firm also launched a suite of multi-cap equity funds that
provides investors with exposure to a dynamic array of U.S.
stocks within the value, core/blend and growth styles.
Building on its strategic alliances, Putnam signed an exclusive
agreement with the state of Nevada to manage its 529 college
savings plan, Putnam 529 for AmericaSM, on an advisor-sold
platform. Outside the United States, Putnam extended its
agreement to distribute funds in Japan through Nissay Asset
Management, and was awarded several new institutional
mandates by sovereign wealth managers.
Putnam strengthened its commitment to the retirement market in 2010 through new products
and services for 401(k)s and other defined contribution plans, earning 25 “Best-in-Class” awards
in PLANSPONSOR magazine’s 2010 survey of defined contribution plan sponsors. Putnam also
led the industry by announcing prior to a U.S. Department of Labor mandate that it will offer
comprehensive disclosure of fees and expenses to participants in the 401(k) plans it administers.
Upholding a heritage of service excellence, Putnam won a DALBAR Service Award for the
21st consecutive year for providing the highest levels of investor service to mutual fund shareholders.
US$121BILLIONTOTAL ASSETS UNDER MANAGEMENT
APPROXIMATELY
6 MILLIONSHAREHOLDERS AND RETIREMENT PLAN PARTICIPANTS
130 INSTITUTIONALMANDATES
OVER
165,000ADVISORSDISTRIBUTE PUTNAM PRODUCTS
ROBERT L. REYNOLDS
President and
Chief Executive Officer,
Putnam Investments

POWER FINANCIAL CORPORATION 2010 ANNUAL REPORT22
IGM FINANCIAL
IGM Financial and its operating companies experienced an increase in total assets under
management during 2010. Net earnings for the company grew substantially compared with 2009.
Investors Group and Mackenzie Financial, IGM Financial’s principal businesses, continued to
generate business growth through product innovation, investment management, resource
management and distribution expansion throughout the year.
The company is well diversified through its multiple distribution channels, product types,
investment management units and fund brands. Assets under management are diversified by
country of investment, industry sector, security type and management style.
A primary theme in IGM Financial’s business approach is to support financial advisors as they work
with clients to plan for and achieve their financial goals. The importance of financial advice became
clearer throughout the financial industry in 2010 based on emerging research and continued public
interest in enhanced financial literacy.
The scope of its business and association with other members of the Power Financial Corporation
group of companies have placed the company in a position of leadership and strength in the
financial services industry. Together, these elements will enable IGM Financial to create long-term
value for its clients, consultants, advisors, employees and shareholders over time.
Market fluctuations since 2008 have left investors with many questions on how best to manage
their resources for the future. In this context, a strong relationship with an advisor to keep focused
on long-term financial goals is important.
The significant role of an advisor in helping with financial planning is appreciated by the vast
majority of investing Canadians. The Investment Funds Institute of Canada (IFIC) has now published
five annual surveys since 2006 indicating that approximately 85 per cent of mutual fund investors
preferred to invest through an advisor and they highly rated the support and advice provided by
their advisors.
The positive impact that financial advisors have on Canadians’ preparations for retirement and
the lives of Canadians in retirement is particularly noteworthy. The Organization for Economic
Co-operation and Development (OECD) recently revealed that Canada is among the world leaders
in income replacement after retirement.
The Investors Group consultant network continued to expand to its highest level on record of
4,686 consultants at December 31, 2010. Since June 30, 2004, there has been 26 consecutive calendar
quarters of net growth in the consultant network. With a further six region office openings
announced in 2010, it has 101 region offices across Canada. Investors Group continued to respond
to the complex financial needs of its clients by delivering a diverse range of products and services
in the context of personalized financial advice.
15.3%ANNUAL COMPOUND
TOTAL RETURN TO SHAREHOLDERS
OVER FIFTEEN YEARS
$1.8 TO $11.3
BILLIONFIFTEEN-YEAR
GROWTH IN MARKET CAPITALIZATION
$4.1BILLION
AGGREGATE DIVIDENDS
PAID TO SHAREHOLDERS
OVER FIFTEEN YEARS

POWER FINANCIAL CORPORATION 2010 ANNUAL REPORT 23
Mackenzie Financial maintained its focus on delivering consistent long-term investment
performance true to the multiple styles deployed in the investment process, while emphasizing
product innovation and communication with advisors and investors. Its focus is evidenced by
the strength of Mackenzie’s relationships with financial advisors, the work undertaken with
investor and advisor education programs and its commitment to focusing on active investment
management strategies. During 2010, Mackenzie broadened its investment choices for Canadians
by adding several new funds and more options, including tax-deferred solutions.
IGM Financial continues to build its business through a strategic focus on multiple distribution
opportunities delivering high-quality advice, innovative investment and service solutions
for investors.
A primary theme in IGM Financial’s business approach is to support financial advisors as they work with clients to plan for and achieve their financial goals.
POWER FINANCIAL CORPORATION 2010 ANNUAL REPORT24
INVESTORS GROUP
Investors Group is committed to comprehensive planning delivered through long-term client
and consultant relationships. The company provides advice and services through a network of
approximately 4,700 consultants to nearly one million Canadians.
In 2010, Investors Group continued to make progress in a number of key areas. Growth in the
consultant network, combined with industry-low redemption rates, is strong evidence of client
and consultant satisfaction with the calm and steady approach being taken to their long-term
financial planning needs.
The company’s commitment to training and support is integral
to its consultants’ ability to deliver effective financial advice
in an increasingly complex and volatile market. The Investors
Group culture provides consultants with an entrepreneurial
environment and unique support structure to deliver person-
alized service and knowledgeable advice to their clients, who
enhance their financial literacy and gain financial confidence as
the company’s consultants assist them with the development
and deployment of their financial plans.
Investors Group is committed to the ongoing evolution and
expansion of its product and service offering. In November 2009,
working jointly with Great-West Life, Investors Group introduced
a new line of segregated fund policies known as Investors
Group Guaranteed Investment Funds which provide long-term
investment growth potential with protective guarantee features
to help minimize risk. In July two new equity mandates sub-
advised by Fidelity Investments Canada ULC, through its affiliate Pyramis Global Advisors, LLC,
were introduced. In December the company announced a new fixed income mandate—Investors
Fixed Income Flex Portfolio—which provides current income by investing in a diversified set of
underlying funds that invest primarily in fixed income securities with the flexibility to adapt to a
changing environment by adjusting the underlying type of investments as the interest rate and
credit environment evolves.
Investors Group continues to focus on its strengths as building blocks for the future. In 2010,
the consultant network growth, the active engagement of over 1,600 employees, increased
communication in response to the global financial situation, the continual refinement of
financial planning, and the expanding product and service offerings demonstrate the company’s
commitment to meet the evolving financial needs of Canadians.
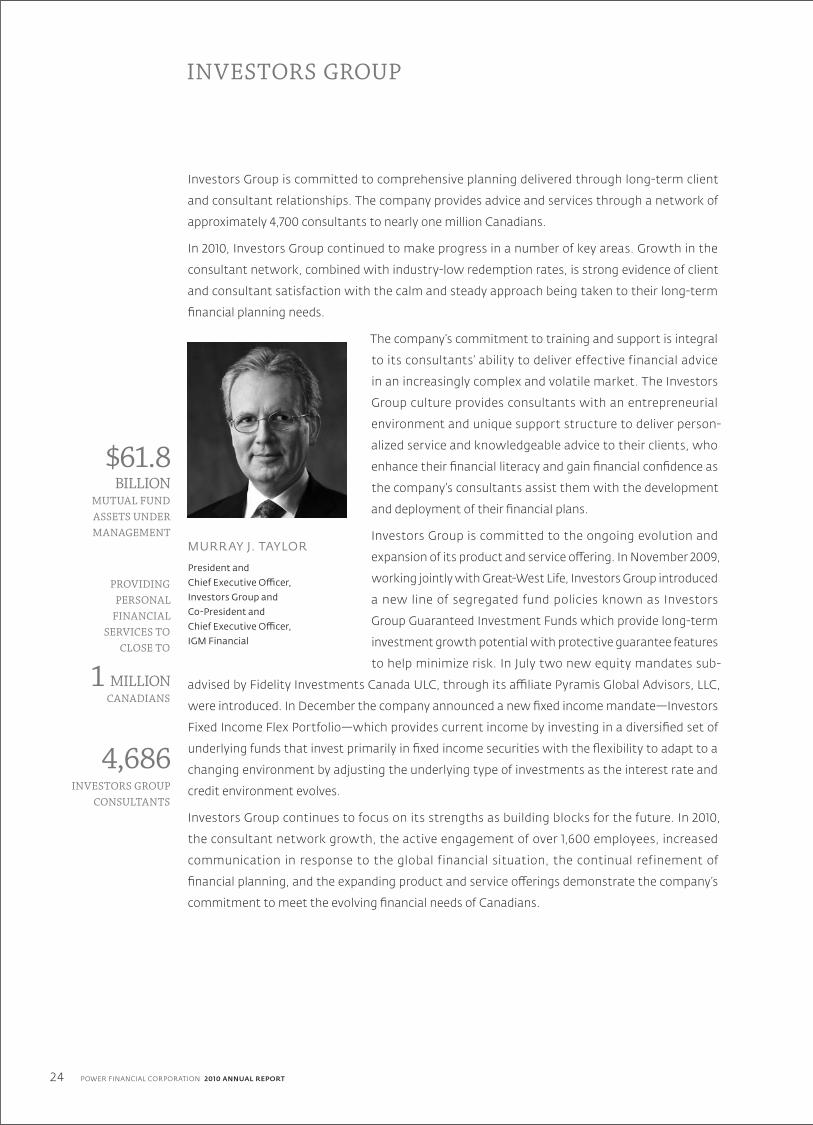
MURRAY J. TAYLOR
President and
Chief Executive Officer,
Investors Group and
Co-President and
Chief Executive Officer,
IGM Financial
$61.8BILLION
MUTUAL FUND ASSETS UNDER MANAGEMENT
PROVIDING PERSONAL
FINANCIAL SERVICES TO
CLOSE TO
1 MILLIONCANADIANS
4,686 INVESTORS GROUP
CONSULTANTS

POWER FINANCIAL CORPORATION 2010 ANNUAL REPORT 25
Mackenzie Financial provides investment advisory services utilizing proprietary investment
research and experienced investment professionals. The company distributes its services through
multiple distribution channels focused on the provision of independent financial planning through a
wide range of investment solutions to meet investor needs. In 2010, Mackenzie and its subsidiaries
continued to focus on business growth, product innovation, client service effectiveness and
strategic partnerships.
Mackenzie’s product lineup continued to evolve with a number of fund launches during the
year, including the Mackenzie Universal Gold Bullion Class, the
Mackenzie All-Sector Canadian Balanced Fund and three Saxon
corporate funds: Mackenzie Saxon Balanced Class, Mackenzie
Saxon Stock Class and Mackenzie Saxon Small Cap Class.
Specifically designed for taxable investors, the corporate funds
are designed to maximize after-tax returns by minimizing taxable
distributions and investors have the flexibility to switch between
more than 50 Mackenzie corporate funds on a tax-deferred
basis. The Mackenzie Founders Global Equity Class was added
to Mackenzie’s product shelf in November. Mackenzie expanded
its relationship with existing strategic partners by offering a
segregated fund offering in partnership with Canada Life.
The strength of Mackenzie’s retail distribution network is built on
long-standing and expanding relationships with financial advisors
and representatives across the breadth of distribution channels.
These relationships allow the company’s products to be efficiently
distributed through retail brokers, financial advisors, insurance
agents, banks, and financial institutions, giving Mackenzie one of the broadest retail distribution
platforms of any investment company in Canada. With the adjustments to the distribution model,
Mackenzie now has dedicated sales teams focused in the traditional retail wholesale channel
working with financial advisors; the platform, sub-advisory and strategic partnership group; and
its institutional team, focused on the needs of pension plan sponsors, foundations, trusts and other
institutional investors.
Mackenzie products are distributed widely through the financial advice channel and the company
is proud of the partnership it has established with financial advisors over its history. Through the
dedicated efforts of employees, these relationships continue to grow as Mackenzie now reaches
more than 30,000 advisors and 1.4 million investors across Canada.
MACKENZIE FINANCIAL
$68.3BILLIONTOTAL ASSETS UNDER MANAGEMENT
OVER
30,000INDEPENDENT FINANCIAL ADVISORS
PROVIDING INVESTMENT ADVISORY SERVICES TO MORE THAN
1.4MILLIONCANADIANS
CHARLES R. SIMS
President and
Chief Executive Officer,
Mackenzie Financial
and Co-President and
Chief Executive Officer,
IGM Financial

POWER FINANCIAL CORPORATION 2010 ANNUAL REPORT26
PARGESA GROUP
The Pargesa group holds significant positions in six large companies based in Europe: Lafarge
(cement and building materials), Imerys (industrial minerals), Total (oil and gas), GDF Suez
(electricity and gas), Suez Environnement (water and waste management) and Pernod Ricard
(wines and spirits).
Power Financial, through its wholly owned subsidiary, Power Financial Europe B.V., and the
Frère family group of Belgium each hold a 50 per cent interest in Parjointco, a Netherlands-based
company. Parjointco’s principal holding is a 54.1 per cent equity interest (62.9 per cent of the
voting rights) in Pargesa Holding SA, the Pargesa group’s parent
company based in Geneva, Switzerland.
The Pargesa group’s strategy is to establish a limited number of
substantial interests in which it can acquire a position of control
or significant influence. In 2010, there were no major changes
in Pargesa’s investment portfolio. Overall, the companies in
the Pargesa group experienced improvements in operating
performance, following the very difficult economic conditions
of 2009.
According to the economic presentation of the group’s
results, net operating earnings declined 9.2 per cent in 2010 to
€465 million, impacted by an 8.5 per cent decrease in the euro
against the Swiss franc, the reporting currency used in Pargesa’s
financial statements. The 2009 results also included a number of non-recurring items, including
an exceptional dividend from GDF Suez.
I M ERY S
A world leader in mineral processing, Imerys holds leading positions in each of its sectors:
Performance and Filtration Minerals; Materials and Monolithics; Pigments for Papers; Ceramics,
Refractaries, Abrasives and Foundry.
Imerys’ markets improved in 2010 even though, overall, 2010 volumes remained about 15 per cent
lower than pre-crisis levels. In these circumstances, sales grew by 20.7 per cent to €3.3 billion,
current operating income rose 68.4 per cent to €419 million and net income, after non-recurring
items, stood at €241 million, compared with €41 million in 2009.
L A FA RG E
With operations in more than 78 countries, Lafarge holds leading positions in each of its markets:
it is the world’s largest producer of cement, second largest producer of aggregates and third largest
producer of ready-mix concrete and gypsum.
JACQUES DRIJARD
Managing Director,
Pargesa
10.2%ANNUAL COMPOUND
TOTAL RETURN TO SHAREHOLDERS OVER
FIFTEEN YEARS (SF)
$7.2BILLION
MARKET CAPITALIZATION
$2.5BILLION
AGGREGATE DIVIDENDS
PAID TO SHAREHOLDERS
OVER FIFTEEN YEARS
POWER FINANCIAL CORPORATION 2010 ANNUAL REPORT 27
In 2010, sales edged up by 1.8 per cent to €16.2 billion, sustained by upward trending volumes for
the cement and aggregates branches, favourable exchange rates and new capacities in Brazil.
Current operating income slipped 1.5 per cent to €2.4 billion. Net income, after non-recurring items,
was €827 million, compared with €736 million in 2009.
TO TA L
Created from the successive mergers of Total, PetroFina and Elf Aquitaine, Total is one of the largest
international oil and gas groups and a major player in chemicals.
Conditions were more favorable to the oil business in 2010. The price of crude oil shot up 29 per cent
from the previous year to reach an average of $79.5/barrel, the European Refinery Margin Indicator
moved up to $27.4/tonne from $17.8/tonne in 2009 and the average gas selling price was stable.
Also fuelled by 4.3 per cent growth in hydrocarbon production, net income stood at €10.6 billion,
compared with €8.4 billion in 2009.
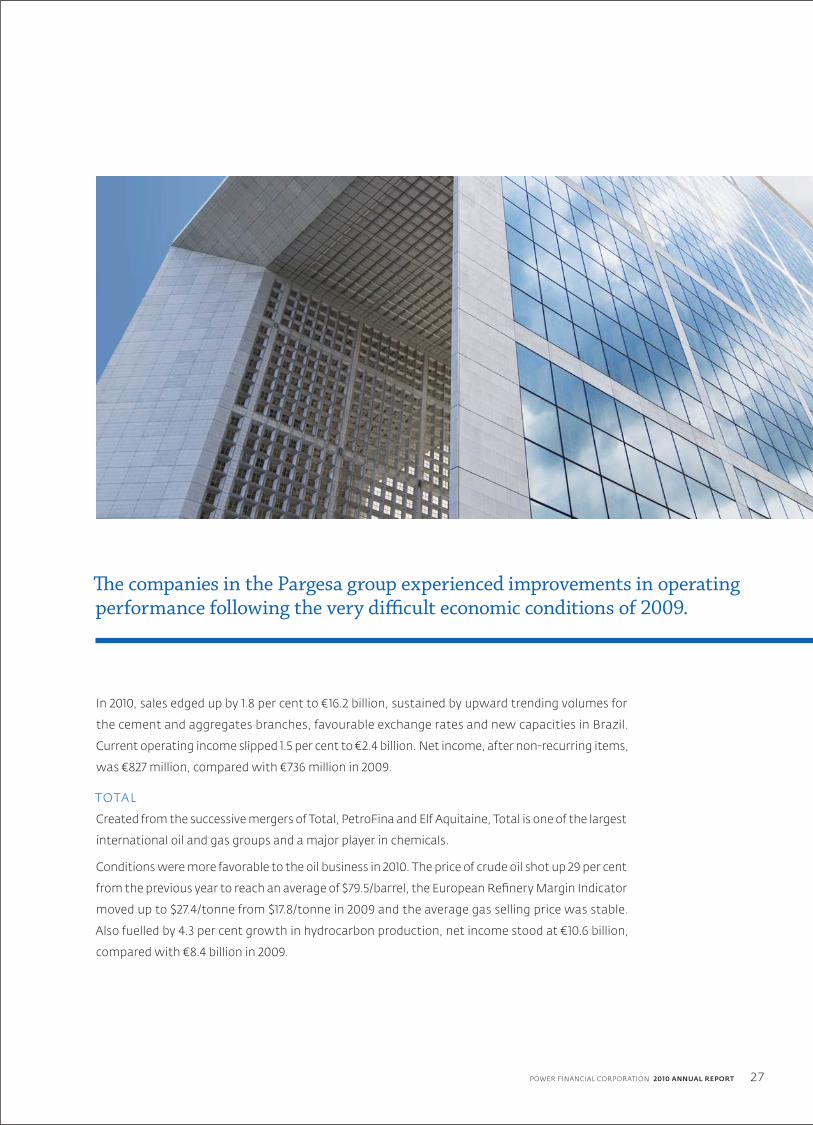
The companies in the Pargesa group experienced improvements in operating performance following the very difficult economic conditions of 2009.
POWER FINANCIAL CORPORATION 2010 ANNUAL REPORT28
PARGESA GROUP CONTINUED
G D F SU E Z
GDF Suez, created from the 2008 merger of Suez and Gaz de France, is an international industrial
and services group active across the entire energy value chain, in electricity and natural gas,
upstream to downstream. GDF Suez develops its core business in electricity and heat generation,
trading, transmission and distribution of electricity and gas (natural and liquified), and energy and
industrial services.
The company reported growth in results in 2010, despite the impact of the decorrelation of gas and
oil prices on the Global Gas and LNG business line. Sales grew by 5.7 per cent to €84.5 billion, EBITDA
reached €15.1 billion, a 7.7 per cent increase, and net income was up 3.1 per cent to €4.6 billion. With
key positions on domestic markets, GDF Suez stepped up its international development in 2010
and announced that it was combining its international operations with International Power plc,
a leading independent power generation company.
SU E Z EN V I RO N N EM EN T
Suez Environnement integrates water and waste management operations that were formerly
within the scope of Suez before it merged with Gaz de France. In the Water sector, the group
designs and manages drinking water production and distribution systems and wastewater
treatment systems, carries out engineering work and supplies a wide range of services to industry.
In the Waste sector, Suez Environnement is active in managing (collecting, sorting, recycling,
treating, recovering and storing) industrial and household waste.
In 2010, in a gradually reviving economy, the group’s sales stood at €13.9 billion, up 12.8 per cent
from the previous year. Net operating income totalled €2.3 billion, an increase of 13.6 per cent.
Net income, after non-recurring items, stood at €565 million, compared with €403 million in 2009.
P ER N O D R I C A R D
Since the creation of Pernod Ricard in 1975, significant organic growth and a series of acquisitions,
particularly Seagram in 2001, Allied Domecq in 2005 and Vin & Sprit in 2008, have made the company
the world co-leader in wines and spirits.
In 2009–2010, Pernod Ricard’s sales declined 1.7 per cent to €7.1 billion, up 1.8 per cent at constant
exchange rates and scope of consolidation. The gross margin after logistics costs was stable
at €4.2 billion. Net income stood at €951 million, compared with €945 million the previous year.
29POWER FINANCIAL CORPORATION 2010 ANNUAL REPORT
M A RC H 10, 2011
This Annual Report is designed to provide interested shareholders and others with selected information concerning Power Financial Corporation. For further
information concerning the Corporation, shareholders and other interested persons should consult the Corporation’s disclosure documents such as its Annual
Information Form and Management’s Discussion and Analysis of Operating Results (MD&A). Copies of the Corporation’s continuous disclosure documents can
be obtained at www.sedar.com, on the Corpo ration’s Web site at www.powerfinancial.com, or from the office of the Secretary at the addresses shown at the
end of this report.
FORWARD-LOOKING STATEMENTS > Certain statements in this document, other than statements of historical fact, are forward-looking statements based on certain assumptions and reflect the Corporation’s and its subsidiaries’ current expectations. Forward-looking statements are provided for the purposes of assisting the reader in understanding the Corporation’s financial position and results of operations as at and for the periods ended on certain dates and to present information about management’s current expectations and plans relating to the future and the reader is cautioned that such statements may not be appropriate for other purposes. These statements may include, without limitation, statements regarding the operations, business, financial condition, expected financial results, performance, prospects, opportunities, priorities, targets, goals, ongoing objectives, strategies and outlook of the Corporation and its subsidiaries, as well as the outlook for North American and international economies for the current fiscal year and subsequent periods. Forward-looking statements include statements that are predictive in nature, depend upon or refer to future events or conditions, or include words such as “expects”,
“anticipates”, “plans”, “believes”, “estimates”, “seeks”, “intends”, “targets”, “projects”, “forecasts” or negative versions thereof and other similar expressions, or future or conditional verbs such as “may”, “will”, “should”, “would” and “could”.
By its nature, this information is subject to inherent risks and uncertainties that may be general or specific and which give rise to the possibility that expectations, forecasts, predictions, projections or conclusions will not prove to be accurate, that assumptions may not be correct and that objectives, strategic goals and priorities will not be achieved. A variety of factors, many of which are beyond the Corporation’s and its subsidiaries’ control, affect the operations, performance and results of the Corporation and its subsidiaries and their businesses, and could cause actual results to differ materially from current expectations of estimated or anticipated events or results. These factors include, but are not limited to: the impact or unanticipated impact of general economic, political and market factors in North America and internationally, interest and foreign exchange
rates, global equity and capital markets, management of market liquidity and funding risks, changes in accounting policies and methods used to report financial condition (including uncertainties associated with critical accounting assumptions and estimates), the effect of applying future accounting changes (including adoption of International Financial Reporting Standards), business competition, operational and reputational risks, technological change, changes in government regulation and legislation, changes in tax laws, unexpected judicial or regulatory proceedings, catastrophic events, the Corporation’s and its subsidiaries’ ability to complete strategic transactions, integrate acquisitions and implement other growth strategies, and the Corporation’s and its subsidiaries’ success in anticipating and managing the foregoing factors. The reader is cautioned to consider these and other factors, uncertainties and potential events carefully and not to put undue reliance on forward-looking statements. Information contained in forward-looking statements is based upon certain material assumptions that were applied in drawing a conclusion or making a forecast or projection, including management’s perceptions of historical trends, current conditions and expected future developments, as well as other considerations that are believed to be appropriate in the circumstances, including that the foregoing list of factors, collectively, are not expected to have a material impact on the Corporation and its subsidiaries. While the Corporation considers these assumptions to be reasonable based on information currently available to management, they may prove to be incorrect.
Other than as specifically required by law, the Corporation undertakes no obligation to update any forward-looking statement to reflect events or circumstances after the date on which such statement is made, or to reflect the occurrence of unanticipated events, whether as a result of new information, future events or results, or otherwise.
Additional information about the risks and uncertainties of the Corporation’s business is provided in its disclosure materials, including its MD&A and its Annual Information Form, filed with the securities regulatory authorities in Canada, available at www.sedar.com.
REVIEW OF FINANCIAL PERFORMANCEAll tabular amounts are in millions of Canadian dollars, unless otherwise noted.

30
REVIEW OF FINANCIAL PERFORMANCE
POWER FINANCIAL CORPORATION 2010 ANNUAL REPORT
OV ERV I E W
Power Financial, a subsidiary of Power Corporation of Canada, is a holding
company with substantial interests in the financial services industry through
its controlling interests in Great-West Lifeco Inc. (Lifeco) and IGM Financial Inc.
(IGM). Power Financial also holds, together with the Frère group of Belgium,
an interest in Pargesa Holding SA (Pargesa).
As at December 31, 2010, Power Financial and IGM held 68.3% and 4.0%,
respectively, of Lifeco’s common shares, representing approximately 65%
of the voting rights attached to all outstanding Lifeco voting shares.
As at December 31, 2010, Power Financial and The Great-West Life Assurance
Company (Great-West Life), a subsidiary of Lifeco, held 57.0% and 3.5%,
respectively, of IGM’s common shares.
Power Financial Europe B.V., a wholly owned subsidiary of Power Financial, and
the Frère group each hold a 50% interest in Parjointco N.V. (Parjointco), which,
as at December 31, 2010, held a 54.1% equity interest in Pargesa, representing 62.9%
of the voting rights of that company. These numbers do not reflect the dilution
which could result from the potential conversion of outstanding debentures
convertible into new bearer shares issued by Pargesa in 2006 and 2007.
The Pargesa group has holdings in major companies based in Europe. These
investments are held by Pargesa directly or through its affiliated Belgian holding
company, Groupe Bruxelles Lambert (GBL). As at December 31, 2010, Pargesa
held a 50.0% equity interest in GBL, representing 52.0% of the voting rights.
As at December 31, 2010, Pargesa’s portfolio was composed of interests
in various sectors, including primarily oil, gas and chemicals through Total
S.A. (Total); energy and energy services through GDF Suez; water and waste
services through Suez Environnement Company (Suez Environnement);
industrial minerals through Imerys S.A. (Imerys); cement and building materials
through Lafarge S.A. (Lafarge); and wines and spirits through Pernod Ricard S.A.
(Pernod Ricard). In addition, Pargesa and GBL have also invested, or committed
to invest, in the area of private equity, including in the French private equity
funds Sagard 1 and Sagard 2, whose management company is a subsidiary
of Power Corporation of Canada.
B A SI S OF PR E SEN TAT ION A N D SU M M A RY OF ACCOU N T I NG P OL IC I E S
The Consolidated Financial Statements of the Corporation have been prepared
in accordance with generally accepted accounting principles in Canada
(Canadian GAAP or GAAP herein) and are presented in Canadian dollars.
CH A NGE S IN ACCOUN T ING P OL ICIE SThere were no changes in accounting policies adopted by the Corporation
in 2010. See also “Future Accounting Changes” section below.
INCLUSION OF PA RGE S A’ S RE SULT SThe investment in Pargesa is accounted for by Power Financial under the
equity method. As described above, the Pargesa portfolio currently consists
primarily of investments in Imerys, Total, GDF Suez, Suez Environnement,
Lafarge and Pernod Ricard, which are held by Pargesa directly or through
GBL. Imerys’ results are consolidated in the financial statements of Pargesa,
while the contribution from Total, GDF Suez, Suez Environnement and Pernod
Ricard to GBL’s operating earnings consists of the dividends received from
these companies. GBL accounts for its investment in Lafarge under the equity
method, and consequently, the contribution from Lafarge to GBL’s earnings
consists of GBL’s share of Lafarge’s net earnings.
The contribution from Pargesa to Power Financial’s earnings is based on the
economic (flow-through) presentation of results as published by Pargesa.
Pursuant to this presentation, operating income and non-operating income
are presented separately by Pargesa. Power Financial’s share of non-operating
income of Pargesa, after adjustments or reclassifications if necessary,
is included as part of other items in the Corporation’s financial statements.
NON - G A A P FINA NCIA L ME A SURE SIn analysing the financial results of the Corporation and consistent with the
presentation in previous years, net earnings are subdivided in the section
“Results of Power Financial Corporation” below into the following components:
> operating earnings; and
> other items, which include the after-tax impact of any item that
management considers to be of a non-recurring nature or that could
make the period-over-period comparison of results from operations less
meaningful, and also include the Corporation’s share of any such item
presented in a comparable manner by Lifeco or IGM. Please also refer
to the comments above related to the inclusion of Pargesa’s results.
Management has used these financial measures for many years in its
presentation and analysis of the financial performance of Power Financial,
and believes that they provide additional meaningful information to readers
in their analysis of the results of the Corporation.
Operating earnings and operating earnings per share are non-GAAP financial
measures that do not have a standard meaning and may not be comparable
to similar measures used by other entities. For a reconciliation of these
non-GAAP measures to results reported in accordance with GAAP, see
“Results of Power Financial Corporation – Earnings Summary – Condensed
Supplementary Statements of Earnings” section below.
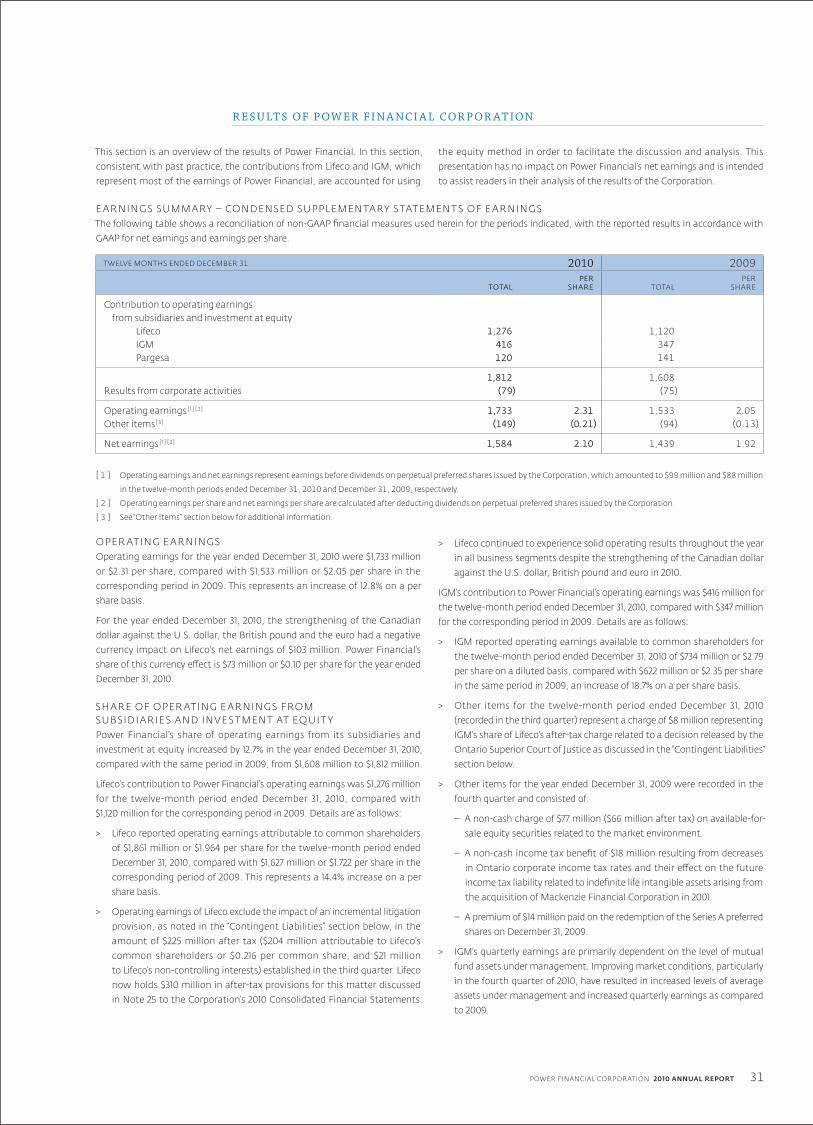
31POWER FINANCIAL CORPORATION 2010 ANNUAL REPORT
R E SU LT S OF P OW ER F I N A NC I A L COR P OR AT ION
This section is an overview of the results of Power Financial. In this section,
consistent with past practice, the contributions from Lifeco and IGM, which
represent most of the earnings of Power Financial, are accounted for using
the equity method in order to facilitate the discussion and analysis. This
presentation has no impact on Power Financial’s net earnings and is intended
to assist readers in their analysis of the results of the Corporation.
E A RNING S SUMM A RY – CONDENSED SUPPL EMEN TA RY S TAT EMEN T S OF E A RNING SThe following table shows a reconciliation of non-GAAP financial measures used herein for the periods indicated, with the reported results in accordance with
GAAP for net earnings and earnings per share.
TWELVE MONTHS ENDED DECEMBER 31 2010 2009
TOTALPER
SHARE TOTALPER
SHARE
Contribution to operating earnings from subsidiaries and investment at equity
Lifeco 1,276 1,120IGM 416 347Pargesa 120 141
1,812 1,608Results from corporate activities (79) (75)
Operating earnings [ 1 ] [ 2 ] 1,733 2.31 1,533 2.05Other items [ 3 ] (149) (0.21) (94) (0.13)
Net earnings [ 1 ] [ 2 ] 1,584 2.10 1,439 1.92
[ 1 ] Operating earnings and net earnings represent earnings before dividends on perpetual preferred shares issued by the Corporation, which amounted to $99 million and $88 million
in the twelve-month periods ended December 31, 2010 and December 31, 2009, respectively.
[ 2 ] Operating earnings per share and net earnings per share are calculated after deducting dividends on perpetual preferred shares issued by the Corporation.
[ 3 ] See “Other Items” section below for additional information.
OPER AT ING E A RNING SOperating earnings for the year ended December 31, 2010 were $1,733 million
or $2.31 per share, compared with $1,533 million or $2.05 per share in the
corresponding period in 2009. This represents an increase of 12.8% on a per
share basis.
For the year ended December 31, 2010, the strengthening of the Canadian
dollar against the U.S. dollar, the British pound and the euro had a negative
currency impact on Lifeco’s net earnings of $103 million. Power Financial’s
share of this currency effect is $73 million or $0.10 per share for the year ended
December 31, 2010.
SHA RE OF OPER AT ING E A RNING S FROM SUBSIDIA RIE S A ND IN V E S T MEN T AT EQUI T YPower Financial’s share of operating earnings from its subsidiaries and
investment at equity increased by 12.7% in the year ended December 31, 2010,
compared with the same period in 2009, from $1,608 million to $1,812 million.
Lifeco’s contribution to Power Financial’s operating earnings was $1,276 million
for the twelve-month period ended December 31, 2010, compared with
$1,120 million for the corresponding period in 2009. Details are as follows:
> Lifeco reported operating earnings attributable to common shareholders
of $1,861 million or $1.964 per share for the twelve-month period ended
December 31, 2010, compared with $1,627 million or $1.722 per share in the
corresponding period of 2009. This represents a 14.4% increase on a per
share basis.
> Operating earnings of Lifeco exclude the impact of an incremental litigation
provision, as noted in the “Contingent Liabilities” section below, in the
amount of $225 million after tax ($204 million attributable to Lifeco’s
common shareholders or $0.216 per common share, and $21 million
to Lifeco’s non-controlling interests) established in the third quarter. Lifeco
now holds $310 million in after-tax provisions for this matter discussed
in Note 25 to the Corporation’s 2010 Consolidated Financial Statements.
> Lifeco continued to experience solid operating results throughout the year
in all business segments despite the strengthening of the Canadian dollar
against the U.S. dollar, British pound and euro in 2010.
IGM’s contribution to Power Financial’s operating earnings was $416 million for
the twelve-month period ended December 31, 2010, compared with $347 million
for the corresponding period in 2009. Details are as follows:
> IGM reported operating earnings available to common shareholders for
the twelve-month period ended December 31, 2010 of $734 million or $2.79
per share on a diluted basis, compared with $622 million or $2.35 per share
in the same period in 2009, an increase of 18.7% on a per share basis.
> Other items for the twelve-month period ended December 31, 2010
(recorded in the third quarter) represent a charge of $8 million representing
IGM’s share of Lifeco’s after-tax charge related to a decision released by the
Ontario Superior Court of Justice as discussed in the “Contingent Liabilities”
section below.
> Other items for the year ended December 31, 2009 were recorded in the
fourth quarter and consisted of:
– A non-cash charge of $77 million ($66 million after tax) on available-for-
sale equity securities related to the market environment.
– A non-cash income tax benefit of $18 million resulting from decreases
in Ontario corporate income tax rates and their effect on the future
income tax liability related to indefinite life intangible assets arising from
the acquisition of Mackenzie Financial Corporation in 2001.
– A premium of $14 million paid on the redemption of the Series A preferred
shares on December 31, 2009.
> IGM’s quarterly earnings are primarily dependent on the level of mutual
fund assets under management. Improving market conditions, particularly
in the fourth quarter of 2010, have resulted in increased levels of average
assets under management and increased quarterly earnings as compared
to 2009.
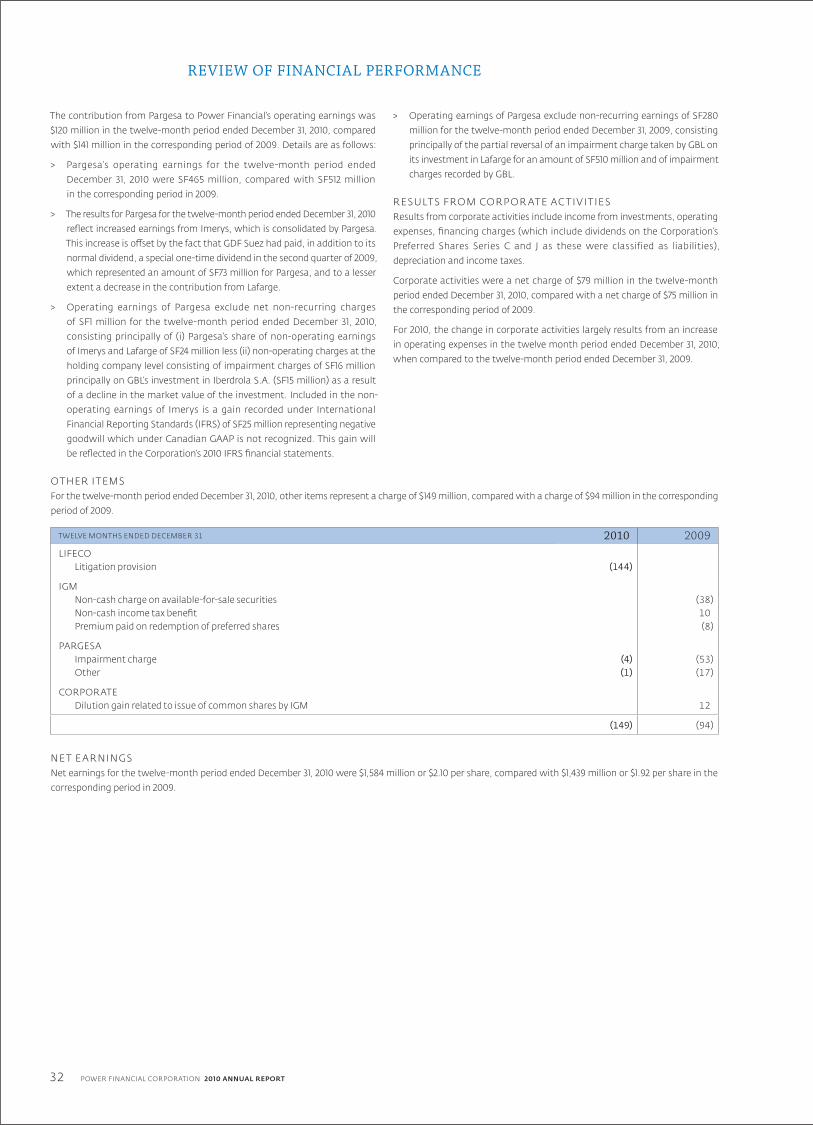
32
REVIEW OF FINANCIAL PERFORMANCE
POWER FINANCIAL CORPORATION 2010 ANNUAL REPORT
The contribution from Pargesa to Power Financial’s operating earnings was
$120 million in the twelve-month period ended December 31, 2010, compared
with $141 million in the corresponding period of 2009. Details are as follows:
> Pargesa’s operating earnings for the twelve-month period ended
December 31, 2010 were SF465 million, compared with SF512 million
in the corresponding period in 2009.
> The results for Pargesa for the twelve-month period ended December 31, 2010
reflect increased earnings from Imerys, which is consolidated by Pargesa.
This increase is offset by the fact that GDF Suez had paid, in addition to its
normal dividend, a special one-time dividend in the second quarter of 2009,
which represented an amount of SF73 million for Pargesa, and to a lesser
extent a decrease in the contribution from Lafarge.
> Operating earnings of Pargesa exclude net non-recurring charges
of SF1 million for the twelve-month period ended December 31, 2010,
consisting principally of (i) Pargesa’s share of non-operating earnings
of Imerys and Lafarge of SF24 million less (ii) non-operating charges at the
holding company level consisting of impairment charges of SF16 million
principally on GBL’s investment in Iberdrola S.A. (SF15 million) as a result
of a decline in the market value of the investment. Included in the non-
operating earnings of Imerys is a gain recorded under International
Financial Reporting Standards (IFRS) of SF25 million representing negative
goodwill which under Canadian GAAP is not recognized. This gain will
be reflected in the Corporation’s 2010 IFRS financial statements.
> Operating earnings of Pargesa exclude non-recurring earnings of SF280
million for the twelve-month period ended December 31, 2009, consisting
principally of the partial reversal of an impairment charge taken by GBL on
its investment in Lafarge for an amount of SF510 million and of impairment
charges recorded by GBL.
RE SULT S FROM CORP OR AT E AC T I V I T IE SResults from corporate activities include income from investments, operating
expenses, financing charges (which include dividends on the Corporation’s
Preferred Shares Series C and J as these were classified as liabilities),
depreciation and income taxes.
Corporate activities were a net charge of $79 million in the twelve-month
period ended December 31, 2010, compared with a net charge of $75 million in
the corresponding period of 2009.
For 2010, the change in corporate activities largely results from an increase
in operating expenses in the twelve month period ended December 31, 2010,
when compared to the twelve-month period ended December 31, 2009.
OT HER I T EMSFor the twelve-month period ended December 31, 2010, other items represent a charge of $149 million, compared with a charge of $94 million in the corresponding
period of 2009.
TWELVE MONTHS ENDED DECEMBER 31 2010 2009LIFECO
Litigation provision (144)
IGMNon-cash charge on available-for-sale securities (38)Non-cash income tax benefit 10Premium paid on redemption of preferred shares (8)
PARGESAImpairment charge (4) (53)Other (1) (17)
CORPORATEDilution gain related to issue of common shares by IGM 12
(149) (94)
NE T E A RNING SNet earnings for the twelve-month period ended December 31, 2010 were $1,584 million or $2.10 per share, compared with $1,439 million or $1.92 per share in the
corresponding period in 2009.

33POWER FINANCIAL CORPORATION 2010 ANNUAL REPORT
F I N A NC I A L P O SI T ION, L IQU I DI T Y A N D C A PI TA L R E S OU RC E S
CONDENSED SUPPL EMEN TA RY BA L A NCE SHEE T S
CONSOLIDATED BASIS EQUIT Y BASIS [1]
AS AT DECEMBER 31 2010 2009 2010 2009
ASSETSCash and cash equivalents [2] 3,656 4,855 713 756Investment at equity 2,279 2,675 13,019 13,306Investments 100,061 94,237Goodwill 8,726 8,655Intangible assets 4,238 4,366Other assets 24,295 25,443 94 85
Total 143,255 140,231 13,826 14,147
LIABILITIESPolicy liabilities
Actuarial liabilities 100,394 98,059Other 4,723 4,592
Other liabilities 9,015 8,485 392 390Preferred shares of the Corporation 300 300Preferred shares of subsidiaries 203Capital trust securities and debentures 535 540Debentures and other borrowings 6,348 5,967 250 250
121,015 118,146 642 940Non-controlling interests 9,056 8,878
SHAREHOLDERS’ EQUITYPerpetual preferred shares 2,005 1,725 2,005 1,725Common shareholders’ equity 11,179 11,482 11,179 11,482
13,184 13,207 13,184 13,207
Total 143,255 140,231 13,826 14,147
[ 1 ] Condensed supplementary balance sheets of the Corporation using the equity method to account for Lifeco and IGM.
[ 2 ] Under the equity basis presentation, cash equivalents include $470 million ($273 million at December 31, 2009) of fixed income securities with maturities of more than 90 days.
In the 2010 Consolidated Financial Statements, this amount of cash equivalents is classified in investments.
CONSOL IDAT ED BA SISThe consolidated balance sheets include Lifeco’s and IGM’s assets and liabilities.
Total assets of the Corporation increased to $143.3 billion at December 31, 2010,
compared with $140.2 billion at December 31, 2009.
The investment at equity of $2.3 billion represents the Corporation’s carrying
value in Parjointco. The decrease in the carrying value is mainly due to foreign
currency changes and a decrease in the market value of Pargesa’s investments
accounted for as available-for-sale assets.
Investments at December 31, 2010 were $100.1 billion, a $5.8 billion increase
from December 31, 2009.
Liabilities increased from $118.1 billion at December 31, 2009 to $121.0 billion
at December 31, 2010. Lifeco’s actuarial liabilities increased from $98.1 billion
to $100.4 billion over the same period.
Debentures and other borrowings increased by $381 million during the twelve-
month period ended December 31, 2010, while subsidiaries repurchased
preferred shares classified as liabilities for an amount of $203 million and the
Corporation repurchased $300 million of similar preferred shares. Details are
included in the “Cash Flows – Consolidated” section below.
The increase in perpetual preferred shares presented in the “Shareholders’ equity”
section below results from the issue of the Series P First Preferred Shares for
an amount of $280 million during the second quarter of 2010.
Non-controlling interests include the Corporation’s non-controlling interests
in the common equity of Lifeco and IGM as well as the participating account
surplus in Lifeco’s insurance subsidiaries and perpetual preferred shares issued
by subsidiaries to third parties.
Assets under administration, which are excluded from the Corporation’s
balance sheet, include segregated funds of Lifeco, proprietary mutual funds and
institutional net assets of Lifeco as well as other assets under administration
of Lifeco, and IGM’s assets under management, at market value:
> Assets under administration of Lifeco, excluding those included on the
balance sheet, increased from $330.2 billion at December 31, 2009
to $352.4 billion at December 31, 2010. Segregated funds and proprietary
mutual funds and institutional net assets increased by approximately
$7.1 billion from December 31, 2009, primarily as a result of improved equity
market levels. Other assets under administration by Lifeco increased
by $15.1 billion as a result of improved equity market levels and lower
interest rates.
> IGM’s assets under management, at market value, were $129.5 billion
at December 31, 2010, compared with $120.5 billion at December 31, 2009.
The increase is principally due to market and income appreciation.

34
REVIEW OF FINANCIAL PERFORMANCE
POWER FINANCIAL CORPORATION 2010 ANNUAL REPORT
EQUI T Y BA SISUnder the equity basis presentation, Lifeco and IGM are accounted for using
the equity method. This presentation has no impact on Power Financial’s
shareholders’ equity and is intended to assist readers in isolating the
contribution of Power Financial, as the parent company, to consolidated assets
and liabilities.
Cash and cash equivalents held by Power Financial amounted to $713 million
at December 31, 2010, compared with $756 million at the end of December 2009.
The amount of quarterly dividends declared by the Corporation but not yet paid
was $274 million at December 31, 2010. The amount of dividends declared by IGM
but not yet received by the Corporation was $76 million at December 31, 2010.
In managing its own cash and cash equivalents, Power Financial may hold
cash balances or invest in short-term paper or equivalents, as well as deposits,
denominated in foreign currencies and thus be exposed to fluctuations
in exchange rates. In order to protect against such fluctuations, Power Financial
may, from time to time, enter into currency-hedging transactions with financial
institutions with high credit ratings. As at December 31, 2010, essentially all
of the $713 million of cash and cash equivalents was denominated in Canadian
dollars or in foreign currencies with currency hedges in place.
The carrying value at equity of Power Financial’s investments in Lifeco, IGM and
Parjointco decreased to $13,019 million at December 31, 2010, compared with
$13,306 million at December 31, 2009. This decrease is mainly due to:
> Power Financial’s share of net earnings from its subsidiaries and investment
at equity for the twelve-month period ended December 31, 2010, net
of dividends received, amounting to $505 million.
> Power Financial’s share of other comprehensive income from its
subsidiaries and investment at equity for the twelve-month period ended
December 31, 2010 in the negative amount of $813 million. This amount
includes a net $832 million negative variation in foreign currency translation
adjustments, related to the Corporation’s indirect investments in Lifeco’s
and Pargesa’s foreign operations, a negative variation in the value
of investments classified as available for sale in the amount of $17 million,
and a $36 million positive variation for cash flow hedges.
SHA REHOL DER S’ EQUI T YCommon shareholders’ equity was $11,179 million at December 31, 2010,
compared with $11,482 million at December 31, 2009. The decrease
of $303 million is mainly due to:
> A $476 million increase in retained earnings, reflecting primarily net earnings
of $1,584 million, less dividends declared of $1,090 million.
> Changes to accumulated other comprehensive income in the negative
amount of $813 million.
In 2010, 2,287,000 Common Shares were issued by the Corporation pursuant
to the Corporation’s Employee Stock Option Plan for an aggregate amount
of $31 million.
As a result of the above, book value per common share of the Corporation was
$15.79 at December 31, 2010, compared with $16.27 at the end of 2009.
On June 29, 2010 the Corporation issued 11,200,000 4.40% Non-Cumulative
5-Year Rate Reset First Preferred Shares, Series P for gross proceeds
of $280 million. On July 30, 2010, the Corporation redeemed all of its $150 million
First Preferred Shares, Series J at a redemption price of $25.50 for each such
share, for an aggregate redemption amount of $153 million. On October 31, 2010,
the Corporation redeemed all of its $150 million First Preferred Shares Series C
at a redemption price of $25.40 for each such share, for an aggregate
redemption amount of $152 million. These two series of preferred shares were
classified as liabilities in the Consolidated Balance Sheet.
The Corporation filed a shor t-form base shelf prospectus dated
November 23, 2010, pursuant to which, for a period of 25 months thereafter,
the Corporation may issue up to an aggregate of $1.5 billion of First Preferred
Shares, Common Shares and debt securities, or any combination thereof. This
filing provides the Corporation with the flexibility to access debt and equity
markets on a timely basis to make changes to the Corporation’s capital
structure in response to changes in economic conditions and changes in its
financial condition.
OU T S TA NDING NUMBER OF COMMON SHA RE SAs of the date hereof, there were 708,013,680 Common Shares of the
Corporation outstanding, compared with 705,726,680 at December 31, 2009.
The increase in the number of outstanding Common Shares reflects the exercise
of options under the Corporation’s Employee Stock Option Plan. As of the
date hereof, options were outstanding to purchase up to an aggregate
of 8,480,115 Common Shares of the Corporation under the Corporation’s
Employee Stock Option Plan.
C A SH F L OW S
C A SH FLOW S — CONSOL IDAT ED
TWELVE MONTHS ENDED DECEMBER 31 2010 2009Cash flow from operating activities 6,572 4,553Cash flow from financing activities (1,530) (1,245)Cash flow from investing activities (6,026) (2,850)Effect of changes in exchange rates on cash and cash equivalents (215) (292)
Increase (decrease) in cash and cash equivalents (1,199) 166Cash and cash equivalents, beginning of period 4,855 4,689
Cash and cash equivalents, end of period 3,656 4,855
On a consolidated basis, cash and cash equivalents decreased by $1,199 million
in the twelve-month period ended December 31, 2010, compared with
an increase of $166 million in the corresponding period in 2009.
Operating activities produced a net inflow of $6,572 million in the twelve-month
period ended December 31, 2010, compared with a net inflow of $4,553 million
in the corresponding period in 2009.
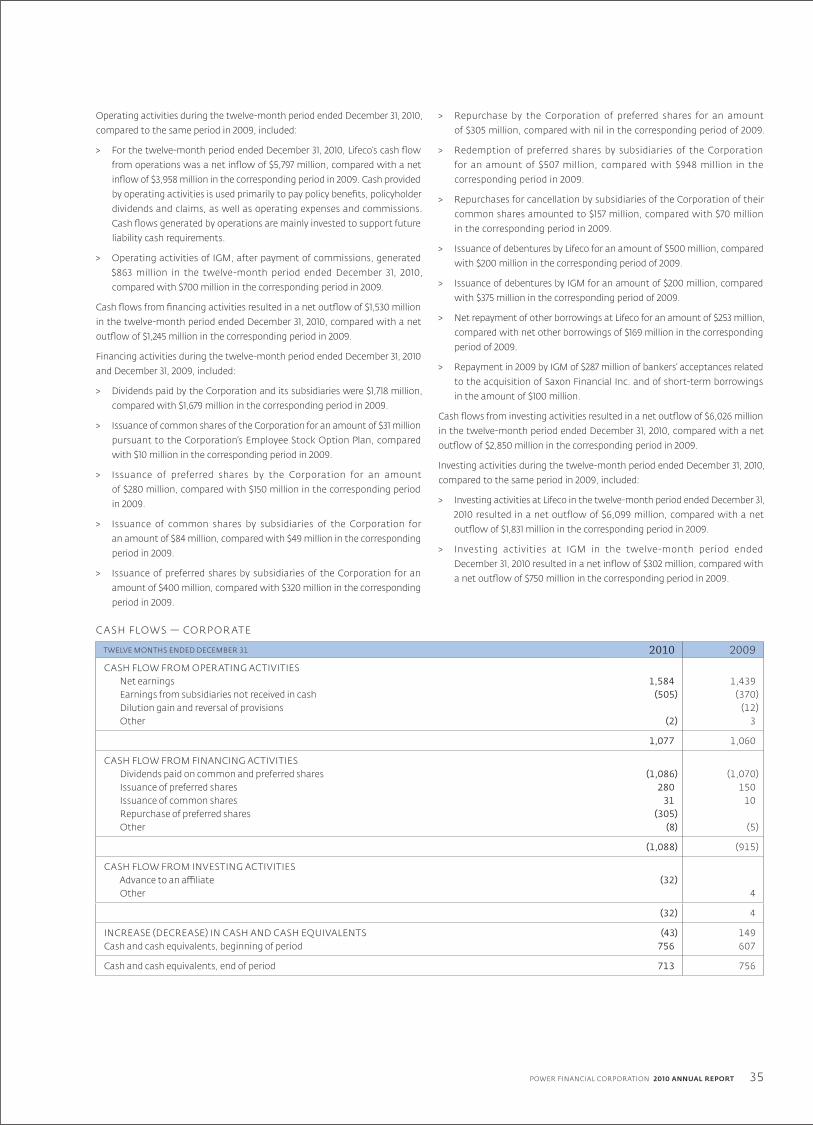
35POWER FINANCIAL CORPORATION 2010 ANNUAL REPORT
Operating activities during the twelve-month period ended December 31, 2010,
compared to the same period in 2009, included:
> For the twelve-month period ended December 31, 2010, Lifeco’s cash flow
from operations was a net inflow of $5,797 million, compared with a net
inflow of $3,958 million in the corresponding period in 2009. Cash provided
by operating activities is used primarily to pay policy benefits, policyholder
dividends and claims, as well as operating expenses and commissions.
Cash flows generated by operations are mainly invested to support future
liability cash requirements.
> Operating activities of IGM, after payment of commissions, generated
$863 million in the twelve-month period ended December 31, 2010,
compared with $700 million in the corresponding period in 2009.
Cash flows from financing activities resulted in a net outflow of $1,530 million
in the twelve-month period ended December 31, 2010, compared with a net
outflow of $1,245 million in the corresponding period in 2009.
Financing activities during the twelve-month period ended December 31, 2010
and December 31, 2009, included:
> Dividends paid by the Corporation and its subsidiaries were $1,718 million,
compared with $1,679 million in the corresponding period in 2009.
> Issuance of common shares of the Corporation for an amount of $31 million
pursuant to the Corporation’s Employee Stock Option Plan, compared
with $10 million in the corresponding period in 2009.
> Issuance of preferred shares by the Corporation for an amount
of $280 million, compared with $150 million in the corresponding period
in 2009.
> Issuance of common shares by subsidiaries of the Corporation for
an amount of $84 million, compared with $49 million in the corresponding
period in 2009.
> Issuance of preferred shares by subsidiaries of the Corporation for an
amount of $400 million, compared with $320 million in the corresponding
period in 2009.
> Repurchase by the Corporation of preferred shares for an amount
of $305 million, compared with nil in the corresponding period of 2009.
> Redemption of preferred shares by subsidiaries of the Corporation
for an amount of $507 million, compared with $948 million in the
corresponding period in 2009.
> Repurchases for cancellation by subsidiaries of the Corporation of their
common shares amounted to $157 million, compared with $70 million
in the corresponding period in 2009.
> Issuance of debentures by Lifeco for an amount of $500 million, compared
with $200 million in the corresponding period of 2009.
> Issuance of debentures by IGM for an amount of $200 million, compared
with $375 million in the corresponding period of 2009.
> Net repayment of other borrowings at Lifeco for an amount of $253 million,
compared with net other borrowings of $169 million in the corresponding
period of 2009.
> Repayment in 2009 by IGM of $287 million of bankers’ acceptances related
to the acquisition of Saxon Financial Inc. and of short-term borrowings
in the amount of $100 million.
Cash flows from investing activities resulted in a net outflow of $6,026 million
in the twelve-month period ended December 31, 2010, compared with a net
outflow of $2,850 million in the corresponding period in 2009.
Investing activities during the twelve-month period ended December 31, 2010,
compared to the same period in 2009, included:
> Investing activities at Lifeco in the twelve-month period ended December 31,
2010 resulted in a net outflow of $6,099 million, compared with a net
outflow of $1,831 million in the corresponding period in 2009.
> Investing activities at IGM in the twelve-month period ended
December 31, 2010 resulted in a net inflow of $302 million, compared with
a net outflow of $750 million in the corresponding period in 2009.
C A SH FLOW S — CORP OR AT E
TWELVE MONTHS ENDED DECEMBER 31 2010 2009CASH FLOW FROM OPERATING ACTIVITIES
Net earnings 1,584 1,439Earnings from subsidiaries not received in cash (505) (370)Dilution gain and reversal of provisions (12)Other (2) 3
1,077 1,060
CASH FLOW FROM FINANCING ACTIVITIESDividends paid on common and preferred shares (1,086) (1,070)Issuance of preferred shares 280 150Issuance of common shares 31 10Repurchase of preferred shares (305)Other (8) (5)
(1,088) (915)
CASH FLOW FROM INVESTING ACTIVITIESAdvance to an affiliate (32)Other 4
(32) 4
INCREASE (DECREASE) IN CASH AND CASH EQUIVALENTS (43) 149Cash and cash equivalents, beginning of period 756 607
Cash and cash equivalents, end of period 713 756

36
REVIEW OF FINANCIAL PERFORMANCE
POWER FINANCIAL CORPORATION 2010 ANNUAL REPORT
Power Financial is a holding company. As such, corporate cash flows from
operations, before payment of dividends, are principally made up of dividends
received from its subsidiaries and investment at equity and income from
investments, less operating expenses, financing charges, and income taxes.
The ability of Lifeco and IGM, which are also holding companies, to meet
their obligations generally and pay dividends depends in particular upon
receipt of sufficient funds from their subsidiaries. The payment of interest
and dividends by Lifeco’s principal subsidiaries is subject to restrictions set
out in relevant corporate and insurance laws and regulations, which require
that solvency and capital standards be maintained. As well, the capitalization
of Lifeco’s principal subsidiaries takes into account the views expressed by the
various credit rating agencies that provide ratings related to financial strength
and other measures relating to those companies. The payment of dividends
by IGM’s principal subsidiaries is subject to corporate laws and regulations
which require that solvency standards be maintained. In addition, certain
subsidiaries of IGM must also comply with capital and liquidity requirements
established by regulatory authorities.
Dividends declared by Lifeco and IGM in the twelve-month period ended
December 31, 2010 on their common shares amounted to $1.23 and $2.05 per
share, respectively, unchanged from the corresponding period in 2009.
Pargesa pays its annual dividends in the second quarter. The dividend paid
in 2010 amounted to SF2.72 per bearer share, an increase of 3.8% when
compared to the dividend paid in 2009.
In the twelve-month period ended December 31, 2010, dividends declared on the
Corporation’s Common Shares amounted to $1.40 per share, unchanged from
the corresponding period in 2009.
F U T U R E ACCOU N T I NG C H A NGE S
IN T ERNAT IONA L FINA NCIA L REP ORT ING S TA NDA RDSIn February 2008, the Canadian Institute of Chartered Accountants (CICA)
announced that Canadian GAAP for publicly accountable enterprises will
be replaced by IFRS for fiscal years beginning on or after January 1, 2011. The
Corporation will be required to begin reporting under IFRS for the quarter
ending March 31, 2011 and will be required to prepare an opening balance
sheet at January 1, 2010 and provide information that conforms to IFRS for
the comparative periods presented. The Corporation will include in the March
31, 2011 interim consolidated financial statements disclosures and explanation
of transition to IFRS in accordance with IFRS 1, First-Time Adoption of
International Financial Reporting Standards.
IFRS will require increased financial statement disclosure as compared
to Canadian GAAP and the Corporation’s accounting policies will be affected
by the change from Canadian GAAP to IFRS, which will impact the presentation
of the Corporation’s financial position and results of operations. On adoption
of IFRS, the financial position and results of operations reported in accordance
with IFRS may differ as compared to Canadian GAAP and these differences may
be material. Implementing IFRS will have an impact on accounting, financial
reporting and supporting information technology systems and processes.
Additionally, the International Accounting Standards Board (IASB) currently
has projects underway that are expected to result in new pronouncements
and, accordingly, the development of IFRS continues to evolve.
The Corporation’s IFRS changeover plan includes the modification of financial
reporting processes, disclosure controls and procedures, and internal controls
over financial reporting, as well as the education of key stakeholders,
including the Board of Directors, management and employees. The impact
on the Corporation’s information technology, data systems and processes
will be dependent upon the magnitude of change resulting from these and
other items. At this time, no significant impact on information or data
systems has been identified and the Corporation and its subsidiaries do not
expect to make changes which will materially affect internal controls over
financial reporting.
The Corporation is monitoring the potential impact of other IFRS-related
changes to financial reporting processes, disclosure controls and procedures,
and internal controls over financial reporting, though the Corporation does not
expect the initial adoption of IFRS will have a material impact on the disclosure
controls and procedures for financial reporting.
The impact of certain of the foregoing items will be reflected in the financial
statements of the Corporation. Consequently, the Corporation seeks
harmonization among group companies with respect to such items.
Information below regarding the publicly traded subsidiaries’ IFRS changeover
plans has been derived from their public disclosure.
The Corporation is in the final stages of aggregating and analysing potential
adjustments required to its opening balance sheet at January 1, 2010 for changes
to accounting policies resulting from identified differences noted between
Canadian GAAP and IFRS in the changeover project. The Corporation also
continues to analyse differences to net earnings and retained earnings under IFRS.
Adoption of IFRS requires that the IFRS standards be applied on a retroactive
basis with the exception of those specifically exempted under IFRS 1 for first-
time adopters. Absent an exemption, any changes to existing standards must
be applied retroactively and reflected in the opening balance sheet of the
comparative period.
Key adjustments to the Corporation’s opening balance sheet have been
identified and analysed, with estimates of the impact to the opening
balance sheet and shareholders’ equity at transition to IFRS presented in the
Reconciliations of the pro forma Consolidated Balance Sheet and the pro forma
Statement of Retained Earnings and Accumulated Other Comprehensive
Income below.
These estimated adjustments represent management’s best estimates and
may be subject to change, though not materially, prior to the issuance of
financial statements prepared in accordance with IFRS. These accounting
differences have been separated in the balance sheet, between items impacting
shareholders’ equity at transition and other items that represent a difference
between IFRS and Canadian GAAP with certain of these items resulting in a
change in financial statement presentation or reclassification. This discussion
has been prepared using the standards and interpretations currently issued
and expected to be effective at the end of the Corporation’s first annual IFRS
reporting period, December 31, 2011. The amounts have not been audited or
subject to review by our external audit.
37POWER FINANCIAL CORPORATION 2010 ANNUAL REPORT
CON V ER SION A DJUS T MEN T SThe following represents key changes identified in accounting policies that
will impact shareholders’ equity upon the transition to IFRS. The identified
differences represent management’s best estimate and these estimates and
decisions may be revised before the Corporation issues financial statements
prepared in accordance with IFRS.
INVESTMENT CONTRACTSThe majority of Canadian GAAP policyholder and reinsurance contract liabilities
will be classified as insurance contracts under IFRS. Contracts where significant
insurance risk does not exist will be classified as investment contracts under
IFRS and accounted for either at fair value or at amortized cost. If significant
insurance risk exists, the contract is classified as an insurance contract and will
be measured under the Canadian Asset Liability Method.
IFRS allows for the recognition of both deferred acquisition costs and deferred
income reserves related to investment contracts. Certain deferred acquisition
costs that were not incremental to the contract and were deferred and
amortized into consolidated net earnings over the anticipated period of benefit
under Canadian GAAP will now be recognized as an expense under IFRS in the
period incurred. Deferred acquisition costs that are incremental in nature will
continue to be deferred and amortized. On the balance sheet, the deferred
acquisition costs will be presented in other assets. Under Canadian GAAP,
actuarial liabilities were presented net of deferred acquisition costs.
The adjustment to decrease opening retained earnings for the adjustments
related to deferred acquisition costs and deferred income reserves
on investment contracts is expected to be approximately $327 million after tax.
INVESTMENT AT EQUITYThe Corporation will increase the carrying value of its investment at equity and
its opening retained earnings by an amount of $154 million to reflect amounts
previously recognized under IFRS by Pargesa which were not recognized under
Canadian GAAP. The largest component of this adjustment consists of the
Corporation’s share of the reversal in 2009 of an impairment charge recorded
by GBL for an amount of $139 million.
DEFERRED SELLING COMMISSIONSUnder IFRS, commissions paid on the sale of certain mutual fund units will
be considered as definite life intangible assets and amortized over their useful
life under Canadian GAAP. The IFRS standard for intangible assets more
specifically addresses the approach to record amortization and disposals of
intangible assets. When a mutual fund client redeems units in certain mutual
funds, a redemption fee is paid by the client that is recorded as revenue by
IGM. IFRS requires that the remaining deferred selling commission asset
related to those units be recorded as a disposal. The current estimate of
this difference is expected to be a decrease of $1 million in the Corporation’s
opening retained earnings.
REAL ESTATE PROPERTIESUnder IFRS, real estate properties have been classified as either investment
properties or owner-occupied properties.
INVESTMENT PROPERTIES
Real estate not classified as owner-occupied properties will be accounted for as
investment properties and measured at fair value. The resulting net decrease
to investment properties at transition is expected to be $85 million. Under
Canadian GAAP, these properties were carried at cost net of write-downs and
allowances for loss, plus a moving average market value adjustment which is
expected to total $133 million at transition to IFRS.
The change in measurement, including the derecognition of deferred net
realized gains on investment properties at January 1, 2010 will increase opening
retained earnings by approximately $100 million after tax.
OWNER-OCCUPIED PROPERTIES
For all owner-occupied properties, the Corporation has elected to measure
the fair value as its deemed cost at transition, resulting in a fair value increase
of $40 million. After transition, the cost model will be used to value such
properties, with depreciation expensed in the consolidated statements of
earnings.
The fair value election at transition is expected to result in an increase in
opening retained earnings of approximately $15 million after tax.
DERECOGNITION OF FINANCIAL ASSETSThe IFRS determination of whether a financial asset should be derecognized
is based to a greater extent on the transfer of risks and rewards of ownership;
whereas under Canadian GAAP, the focus is on the surrendering of control
over the transferred assets. IGM has disclosed that its analysis indicates most
of its securitization transactions will be accounted for as secured borrowings
under IFRS rather than sales, which will result in an increase in total assets and
liabilities recorded on its consolidated balance sheets. As these transactions
are to be treated as financing transactions rather than sale transactions,
a transitional adjustment to opening retained earnings is required to reflect
this change in accounting treatment.
IGM has disclosed that it has completed its analysis based on assumptions
that: (i) the mortgages are carried at amortized cost, (ii) mortgage origination
costs are capitalized and amortized, and (iii) the transactions are restated
on a retroactive basis. The estimated increase in the mortgage balances is
$3.3 billion with a corresponding increase in liabilities. Certain other mortgage-
related assets and liabilities, including retained interests, certain derivative
instruments and servicing liabilities, will be adjusted. The estimated decrease
in the Corporation’s opening retained earnings is approximately $45 million.
EMPLOYEE BENEFITS – CUMUL ATIVE UNAMORTIZED ACTUARIAL GAINS AND LOSSES The Corporation has elected to apply the exemption available to recognize
all cumulative unamortized actuarial gains and losses of the Corporation’s
defined benefit plans of $308 million in shareholders’ equity upon transition.
Subsequent to transition, the Corporation intends to apply the “corridor”
approach for deferring recognition of actuarial gains and losses that reside
within the corridor.
This adjustment, referred to as the “fresh start” adjustment, is expected to
decrease opening retained earnings by approximately $132 million after tax.

38
REVIEW OF FINANCIAL PERFORMANCE
POWER FINANCIAL CORPORATION 2010 ANNUAL REPORT
EMPLOYEE BENEFITS – PAST SERVICE COSTS AND OTHERDifferences exist between IFRS and Canadian GAAP in determining employee
benefits, including the requirement to recognize unamortized past service
costs and certain service awards. The adjustment for recognition of these
unamortized vested past service costs and other employee benefits under IFRS
are estimated to total $92 million.
These differences are expected to increase opening retained earnings
by approximately $41 million after tax.
UNCERTAIN INCOME TAX PROVISIONSThe difference in the recognition and measurement of uncertain tax provisions
between Canadian GAAP and IFRS is expected to decrease opening retained
earnings by approximately $170 million.
OTHER ADJUSTMENTSSeveral additional items have been identified where the transition from
Canadian GAAP to IFRS will result in recognition changes. These adjustments,
which include (i) the capitalization of transaction costs on other than held-for-
trading financial liabilities netted against the corresponding financial liability,
(ii) the adoption of the graded vesting method to account for all stock options,
and (iii) the measurement of Lifeco preferred shares previously recorded at fair
value will be recorded at amortized cost under IFRS, are expected to result
in an adjustment to increase opening retained earnings by approximately
$3 million after tax.
PRE SEN TAT ION A ND RECL A SSIFIC AT ION A DJUS T MEN T SThe following represents changes in key accounting policies that do not
impact shareholders’ equity upon the adoption of IFRS. The items below
include accounting policy differences under IFRS, certain of which require
financial statement presentation and reclassification changes upon transition.
The possible impact of the identified differences represents management’s
best estimates and these estimates and decisions may be revised before the
Corporation issues financial statements prepared in accordance with IFRS.
SEGREGATED FUNDSThe assets and liabilities of segregated funds, totalling $87.5 billion at January 1,
2010, will be included at fair value on the Consolidated Balance Sheets as a
single line within assets and liabilities under IFRS. There will be no impact on
the amount disclosed for shareholders’ equity.
PRESENTATION OF REINSURANCE ACCOUNTSReinsurance accounts will be presented on a gross basis on the Consolidated
Balance Sheets, totalling approximately $2.8 billion of reinsurance assets
and corresponding liabilities, with no impact on shareholders’ equity. Gross
presentation of the reinsurance revenues and expenses will also be required
within the Consolidated Statements of Earnings.
CUMUL ATIVE TRANSL ATION LOSSES OF FOREIGN OPERATIONSThe Corporation will reset the unrealized cumulative translation differences
of foreign operations to zero upon adoption of IFRS. The balance of the
cumulative loss to be reclassified from other comprehensive income to retained
earnings at January 1, 2010 is approximately $1,188 million.
REDESIGNATION OF FINANCIAL ASSETSLifeco has disclosed it will redesignate certain non-participating available-
for-sale financial assets to fair value through profit and loss. Also, certain
financial assets classified as held for trading under Canadian GAAP will be
redesignated as available for sale under IFRS. The redesignation will have no
overall impact on the Corporation’s opening shareholders’ equity at transition
but is expected to result in a reclassification within shareholders’ equity of
approximately $67 million between retained earnings and accumulated other
comprehensive income.
NON-CONTROLLING INTERESTSUnder Canadian GAAP non-controlling interests were presented between
liabilities and equity. IFRS requires presentation of non-controlling interests
within the equity section of the balance sheet.
BUSINESS COMBINATIONSThe Corporation does not plan to restate business combinations prior to
January 1, 2010, and therefore there is no expected impact on opening figures.
The Corporation will apply the IFRS 3 standard prospectively for business
combinations occurring after January 1, 2010.
GOODWILL AND INTANGIBLE ASSETSGoodwill and intangible assets under IFRS will be measured using the cost
model, based on the recoverable amount, which is the greater of value in use
or fair value less cost to sell. The recoverable amount calculated under IFRS
approximates the Canadian GAAP carrying value at December 31, 2009 and
therefore no adjustment is required at transition.
The above accounting policy differences (totalling a decrease of $1,616 million in
the opening retained earnings) have been reconciled from Canadian GAAP to
IFRS on the following page. It should be noted that the numbers provided in
this section are subject to change pending the completion of an audit. Numbers
are also subject to change in the event that newly issued international financial
reporting standards become effective prior to the completion of the audit.
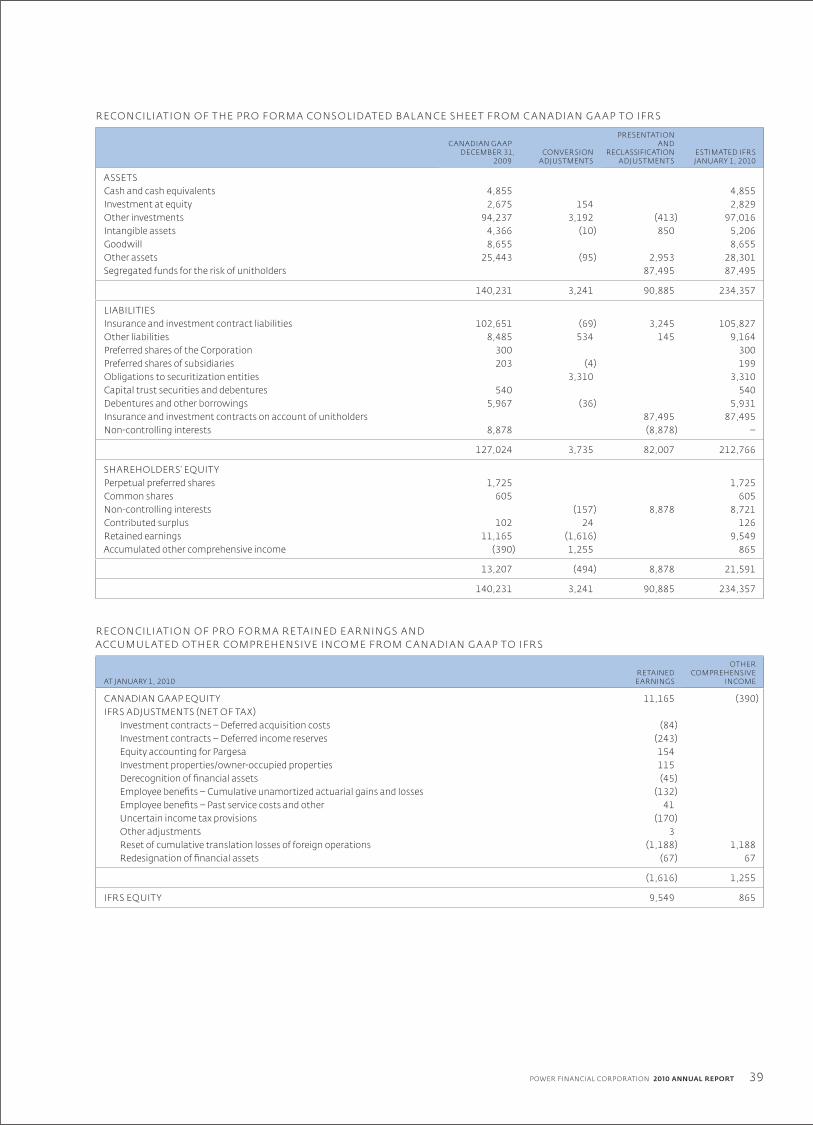
39POWER FINANCIAL CORPORATION 2010 ANNUAL REPORT
RECONCIL IAT ION OF T HE PRO F ORM A CONSOL IDAT ED BA L A NCE SHEE T FROM C A NA DIA N G A A P TO IFR S
CANADIAN GA APDECEMBER 31,
2009CONVERSION
ADJUSTMENTS
PRESENTATIONAND
RECLASSIFICATIONADJUSTMENTS
ESTIMATED IFRSJANUARY 1, 2010
ASSETSCash and cash equivalents 4,855 4,855Investment at equity 2,675 154 2,829Other investments 94,237 3,192 (413) 97,016Intangible assets 4,366 (10) 850 5,206Goodwill 8,655 8,655Other assets 25,443 (95) 2,953 28,301Segregated funds for the risk of unitholders 87,495 87,495
140,231 3,241 90,885 234,357
LIABILITIESInsurance and investment contract liabilities 102,651 (69) 3,245 105,827Other liabilities 8,485 534 145 9,164Preferred shares of the Corporation 300 300Preferred shares of subsidiaries 203 (4) 199Obligations to securitization entities 3,310 3,310Capital trust securities and debentures 540 540Debentures and other borrowings 5,967 (36) 5,931Insurance and investment contracts on account of unitholders 87,495 87,495Non-controlling interests 8,878 (8,878) –
127,024 3,735 82,007 212,766
SHAREHOLDERS’ EQUITYPerpetual preferred shares 1,725 1,725Common shares 605 605Non-controlling interests (157) 8,878 8,721Contributed surplus 102 24 126Retained earnings 11,165 (1,616) 9,549Accumulated other comprehensive income (390) 1,255 865
13,207 (494) 8,878 21,591
140,231 3,241 90,885 234,357
RECONCIL IAT ION OF PRO F ORM A RE TA INED E A RNING S A ND ACCUMUL AT ED OT HER COMPREHENSI V E INCOME FROM C A NA DIA N G A A P TO IFR S
AT JANUARY 1, 2010RETAINED
EARNINGS
OTHERCOMPREHENSIVE
INCOME
CANADIAN GAAP EQUITY 11,165 (390)IFRS ADJUSTMENTS (NET OF TAX)
Investment contracts – Deferred acquisition costs (84)Investment contracts – Deferred income reserves (243)Equity accounting for Pargesa 154Investment properties/owner-occupied properties 115Derecognition of financial assets (45)Employee benefits – Cumulative unamortized actuarial gains and losses (132)Employee benefits – Past service costs and other 41Uncertain income tax provisions (170)Other adjustments 3Reset of cumulative translation losses of foreign operations (1,188) 1,188Redesignation of financial assets (67) 67
(1,616) 1,255
IFRS EQUITY 9,549 865

40
REVIEW OF FINANCIAL PERFORMANCE
POWER FINANCIAL CORPORATION 2010 ANNUAL REPORT
The foregoing anticipated changes in accounting policies are not an exhaustive
list of all possible significant items that will occur upon the transition to IFRS.
The Corporation will continue to monitor developments in and interpretations
of standards as well as industry practices and may change the accounting
policies described above.
The Corporation continues to monitor the potential changes proposed by the
IASB and consider the impact changes in the standards would have on the
Corporation’s operations. In November 2009, the IASB issued IFRS 9 to amend
how financial instruments are classified and measured. The standard is effective
for annual periods beginning on or after January 1, 2013. The Corporation
is analysing the impact the new standard will have on its financial assets
and liabilities.
In April 2010, the IASB published for comment an exposure draft proposing
amendments to the accounting standard for post-employment benefits. The
exposure draft was open for comment until September 6, 2010, with a final
standard anticipated for release by the IASB at the end of the first quarter
of 2011. The exposure draft proposes to eliminate the corridor approach for
actuarial gains and losses, which would result in those gains and losses being
recognized immediately through other comprehensive income or earnings,
while the net pension asset or liability would reflect the full over- or under-
funded status of the plan on the Consolidated Balance Sheet. As well, the
exposure draft proposes changes to how the defined benefit obligation and the
fair value of the plan assets would be presented within the financial statements
of an entity. The Corporation is monitoring the proposed amendments to post-
employment benefits.
On July 30, 2010, the IASB published for comment an exposure draft proposing
changes to the accounting standard for insurance contracts. A final standard
is not expected to be implemented for several years. Lifeco has disclosed that
it will continue to measure insurance liabilities using the Canadian Asset
Liability Method until such time when a new IFRS standard for insurance
contract measurement is issued. The exposure draft proposes that an insurer
would measure insurance liabilities using a model focusing on the amount,
timing, and uncertainty of future cash flows associated with fulfilling its
insurance contracts. This is significantly different from the connection between
insurance assets and liabilities considered under the Canadian Asset Liability
Method and may cause significant volatility in the results of Lifeco. Lifeco has
disclosed that on November 30, 2010, it submitted a comment letter urging
the IASB to amend the exposure draft, particularly in the area of discounting.
On August 17, 2010, the IASB published for comment an exposure draft with
changes proposed to the accounting standards for leases. A final standard
is expected to be released in June 2011. The exposure draft proposes a new
accounting model where both lessees and lessors would record the assets
and liabilities on the balance sheet at the present value of the lease payments
arising from all lease contracts.
R I SK FAC T OR S
There are certain risks inherent in an investment in the securities of the
Corporation and in the activities of the Corporation, including the following
and others disclosed in the Corporation’s Management’s Discussion and
Analysis, which investors should carefully consider before investing in securities
of the Corporation. This description of risks does not include all possible risks,
and there may be other risks of which the Corporation is not currently aware.
Power Financial is a holding company that holds substantial interests in the
financial services industry through its controlling interest in each of Lifeco
and IGM. As a result, investors in Power Financial are subject to the risks
attributable to its subsidiaries, including those that Power Financial has as the
principal shareholder of each of Lifeco and IGM.
As a holding company, Power Financial’s ability to pay interest and other
operating expenses and dividends, to meet its obligations and to complete
current or desirable future enhancement opportunities or acquisitions
generally depends upon receipt of sufficient dividends from its principal
subsidiaries and other investments and its ability to raise additional capital.
The likelihood that shareholders of Power Financial will receive dividends will
be dependent upon the operating performance, profitability, financial position
and creditworthiness of the principal subsidiaries of Power Financial and on
their ability to pay dividends to Power Financial. The payment of interest and
dividends by certain of these principal subsidiaries to Power Financial is also
subject to restrictions set forth in insurance, securities and corporate laws and
regulations which require that solvency and capital standards be maintained
by such companies. If required, the ability of Power Financial to arrange
additional financing in the future will depend in part upon prevailing market
conditions as well as the business performance of Power Financial and its
subsidiaries. In recent years, global financial conditions and market events
have experienced increased volatility and resulted in the tightening of credit
that has reduced available liquidity and overall economic activity. There can
be no assurance that debt or equity financing will be available, or, together
with internally generated funds, will be sufficient to meet or satisfy Power
Financial’s objectives or requirements or, if the foregoing are available
to Power Financial, that they will be on terms acceptable to Power Financial.
The inability of Power Financial to access sufficient capital on acceptable terms
could have a material adverse effect on Power Financial’s business, prospects,
dividend paying capability and financial condition, and further enhancement
opportunities or acquisitions.
The market price for Power Financial’s securities may be volatile and subject
to wide fluctuations in response to numerous factors, many of which are
beyond Power Financial’s control. Economic conditions may adversely affect
Power Financial, including fluctuations in foreign exchange, inflation and
interest rates, as well as monetary policies, business investment and the
health of capital markets in Canada, the United States and Europe. In recent
years, financial markets have experienced significant price and volume
fluctuations that have affected the market prices of equity securities held
by the Corporation and its subsidiaries, and that have often been unrelated
to the operating performance, underlying asset values or prospects of such
companies. Additionally, these factors, as well as other related factors, may
cause decreases in asset values that are deemed to be other than temporary,
which may result in impairment losses. In periods of increased levels of volatility
and related market turmoil, Power Financial’s subsidiaries’ operations could
be adversely impacted and the trading price of Power Financial’s securities
may be adversely affected.
41POWER FINANCIAL CORPORATION 2010 ANNUAL REPORT
SU M M A RY OF C R I T IC A L ACCOU N T I NG E S T I M AT E S
The preparation of financial statements in conformity with Canadian GAAP
requires management to adopt accounting policies and to make estimates
and assumptions that affect amounts reported in the Corporation’s 2010
Consolidated Financial Statements. The major accounting policies and related
critical accounting estimates underlying the Corporation’s 2010 Consolidated
Financial Statements are summarized below. In applying these policies,
management makes subjective and complex judgments that frequently require
estimates about matters that are inherently uncertain. Many of these policies
are common in the insurance and other financial services industries; others
are specific to the Corporation’s businesses and operations. The significant
accounting estimates are as follows:
FA IR VA LUE ME A SUREMEN TFinancial and other instruments held by the Corporation and its subsidiaries
include portfolio investments, various derivative financial instruments, and
debentures and other debt instruments.
Financial instrument carrying values reflect the liquidity of the markets and the
liquidity premiums embedded in the market pricing methods the Corporation
relies upon.
In accordance with CICA Handbook Section 3862, Financial Instruments
– Disclosures, the Corporation’s assets and liabilities recorded at fair value have
been categorized based upon the following fair value hierarchy:
> Level 1 inputs utilize observable, quoted prices (unadjusted) in active
markets for identical assets or liabilities that the Corporation has the ability
to access.
> Level 2 inputs utilize other than quoted prices included in Level 1 that are
observable for the asset or liability, either directly or indirectly.
> Level 3 inputs are unobservable and include situations where there is little,
if any, market activity for the asset or liability.
In certain cases, the inputs used to measure fair value may fall into differ-
ent levels of the fair value hierarchy. In such cases, the level in the fair value
hierarchy within which the fair value measurement in its entirety falls has
been determined based on the lowest level input that is significant to the fair
value measurement in its entirety. The Corporation’s assessment of the signifi-
cance of a particular input to the fair value measurement in its entirety requires
judgment and considers factors specific to the asset or liability.
Please refer to Note 22 to the Corporation’s 2010 Consolidated Financial
Statements for disclosure of the Corporation’s financial instruments fair value
measurement as at December 31, 2010.
Fair values for bonds classified as held for trading or available for sale are
determined using quoted market prices. Where prices are not quoted
in a normally active market, fair values are determined by valuation models
primarily using observable market data inputs. Market values for bonds and
mortgages classified as loans and receivables are determined by discounting
expected future cash flows using current market rates.
Fair values for public stocks are generally determined by the last bid price
for the security from the exchange where it is principally traded. Fair values
for stocks for which there is no active market are determined by discounting
expected future cash flows based on expected dividends and where market
value cannot be measured reliably, fair value is estimated to be equal to cost.
Market values for real estate are determined using independent appraisal
services and include management adjustments for material changes in property
cash flows, capital expenditures or general market conditions in the interim
period between appraisals.
The preparation of financial statements in conformity with Canadian GAAP
requires management to make estimates and assumptions that affect the
reported amounts of assets and liabilities and disclosure of contingent assets
and liabilities at the balance sheet date and the reported amounts of revenues
and expenses during the reporting period. The results of the Corporation reflect
management’s judgments regarding the impact of prevailing global credit,
equity and foreign exchange market conditions.
IMPA IRMEN TInvestments are reviewed regularly on an individual basis to determine
impairment status. The Corporation considers various factors in the impairment
evaluation process, including, but not limited to, the financial condition of the
issuer, specific adverse conditions affecting an industry or region, decline in fair
value not related to interest rates, bankruptcy or defaults and delinquency
in payments of interest or principal. Investments are deemed to be impaired
when there is no longer reasonable assurance of timely collection of the full
amount of the principal and interest due or the Corporation does not have the
intent to hold the investment until the value has recovered. The market value
of an investment is not by itself a definitive indicator of impairment, as it may
be significantly influenced by other factors, including the remaining term
to maturity and liquidity of the asset. However, market price must be taken
into consideration when evaluating impairment.
For impaired mortgages and bonds classified as loans and receivables,
provisions are established or write-offs are recorded to adjust the carrying
value to the estimated realizable amount. Wherever possible, the fair value
of collateral underlying the loans or observable market price is used to establish
the estimated realizable value. For impaired available-for-sale loans, recorded at
fair value, the accumulated loss recorded in accumulated other comprehensive
income is reclassified to net investment income. Impairments on available-
for-sale debt instruments are reversed if there is objective evidence that
a permanent recovery has occurred. All gains and losses on bonds classified
or designated as held for trading are recorded in income. As well, when
determined to be impaired, interest is no longer accrued and previous interest
accruals are reversed.
Current market conditions have resulted in an increase in the inherent risks
of future impairment of invested assets. The Corporation monitors economic
conditions closely in its assessment of impairment of individual loans.

42
REVIEW OF FINANCIAL PERFORMANCE
POWER FINANCIAL CORPORATION 2010 ANNUAL REPORT
G O ODW IL L A ND IN TA NGIBL E S IMPA IRMEN T T E S T INGUnder GAAP, goodwill is not amortized, but is instead assessed for impair-
ment at the reporting unit level by applying a two-step fair value-based test
annually, or more frequently, if an event or change in circumstances indicates
that the asset might be impaired. In the first test, goodwill is assessed for
impairment by determining whether the fair value of the reporting unit
to which the goodwill is associated is less than its carrying value. When the
fair value of the reporting unit is less than its carrying value, the second test
compares the fair value of the goodwill in that reporting unit (determined
as a residual value after determining the fair value of the assets and liabilities
of the reporting unit) to its carrying value. If the fair value of goodwill is less
than its carrying value, goodwill is considered to be impaired and a charge for
impairment is recognized immediately.
For purposes of impairment testing, the fair values of the reporting units are
derived from internally developed valuation models using a market or income
approach consistent with models used when the business was acquired.
Acquired intangible assets are separately recognized if the benefits of the
intangible assets are obtained through contractual or other legal rights, or if the
intangible assets can be sold, transferred, licensed, rented or exchanged.
Intangible assets can have a finite life or an indefinite life. Determining the
useful lives of intangible assets requires judgment and fact-based analysis.
Intangible assets with an indefinite life are not amortized and are assessed for
impairment annually or more frequently if an event or change in circumstances
indicates that the asset might be impaired. Similar to goodwill impairment
testing, the fair value of the indefinite life intangible asset is compared to its
carrying value to determine impairment, if any.
Intangible assets with a finite life are amortized over their estimated useful lives.
These assets are tested for impairment whenever events or changes in circum-
stances indicate that the carrying value of the asset may not be recoverable.
In performing the review for recoverability, the future cash flows expected
to result from the use of the asset and its eventual disposition are estimated.
If the sum of the expected future undiscounted cash flows is less than the carry-
ing value of the asset, an impairment loss is recognized to the extent that fair
value is less than the carrying value. Amortization estimates and methods are
also reviewed. Indicators of impairment include such things as a significant
adverse change in legal factors or in the general business climate, a decline
in operating performance indicators, a significant change in competition,
or an expectation that significant assets will be sold or otherwise disposed of.
The fair value of intangible assets for customer contracts, the shareholder
portion of acquired future participating account profits and certain property
leases are estimated using an income approach, as described for goodwill
above. The fair value of brands and trademarks are estimated using a relief-
from-royalty approach using the present value of expected after-tax royalty cash
flows through licensing agreements. The key assumptions under this valuation
approach are royalty rates, expected future revenues and discount rates.
The fair value of intangible assets for distribution channels and technology
are estimated using the replacement cost approach. Management estimates
the time and cost of personnel required to duplicate the asset acquired.
P OL IC Y L IA BIL I T IE SPolicy liabilities represent the amounts required, in addition to future premiums
and investment income, to provide for future benefit payments, policyholder
dividends, commissions and policy administrative expenses for all insurance
and annuity policies in force with the Corporation’s subsidiaries. The Appointed
Actuaries of the Corporation’s subsidiary companies are responsible for
determining the amount of the policy liabilities to make appropriate provisions
for the Corporation’s subsidiaries’ obligations to policyholders. The Appointed
Actuaries determine the policy liabilities using generally accepted actuarial
practices, according to the standards established by the Canadian Institute
of Actuaries. The valuation uses the Canadian Asset Liability Method. This
method involves the projection of future events in order to determine the
amount of assets that must be set aside currently to provide for all future
obligations and involves a significant amount of judgment.
In the computation of Lifeco’s policy liabilities, valuation assumptions have
been made by Lifeco and its subsidiaries regarding rates of mortality/morbidity,
investment returns, levels of operating expenses, rates of policy termination
and rates of utilization of elective policy options or provisions. The valuation
assumptions use best estimates of future experience together with a margin
for adverse deviation. These margins are necessary to provide for possibilities
of misestimation and/or future deterioration in the best estimate assumptions
and provide reasonable assurance that policy liabilities cover a range of possible
outcomes. Margins are reviewed periodically for continued appropriateness.
Additional detail regarding these estimates can be found in Note 9 to the Corpo-
ra tion’s 2010 Consolidated Financial Statements.
INCOME TA XE SThe Corporation is subject to income tax laws in various jurisdictions.
The Corporation’s operations are complex and related tax interpretations,
regulations and legislation that pertain to its activities are subject to con-
tinual change. As multinational life insurance companies, the Corporation’s
primary Canadian operating subsidiaries are subject to a regime of specialized
rules prescribed under the Income Tax Act (Canada) for purposes of determining
the amount of the companies’ income that will be subject to tax in Canada.
Accordingly, the provision for income taxes represents the applicable company’s
management’s interpretation of the relevant tax laws and its estimate of cur-
rent and future income tax implications of the transactions and events during
the period. Future tax assets and liabilities are recorded based on expected
future tax rates and management’s assumptions regarding the expected timing
of the reversal of temporary differences. The Corporation has substantial future
income tax assets. The recognition of future tax assets depends on manage-
ment’s assumption that future earnings will be sufficient to realize the deferred
benefit. The amount of the asset recorded is based on management’s best
estimate of the timing of the reversal of the asset.
The audit and review activities of the Canada Revenue Agency and other
jurisdictions’ tax authorities affect the ultimate determination of the amounts
of income taxes payable or receivable, future income tax assets or liabilities
and income tax expense. Therefore, there can be no assurance that taxes will
be payable as anticipated and/or the amount and timing of receipt or use of the
tax-related assets will be as currently expected. Management’s experience
indicates the taxation authorities are more aggressively pursuing perceived tax
issues and have increased the resources they put to these efforts.
43POWER FINANCIAL CORPORATION 2010 ANNUAL REPORT
EMPLOY EE FU T URE BENEFI T SThe Corporation and its subsidiaries maintain contributory and non-
contributory defined benefit and defined contribution pension plans for certain
employees and advisors. The defined benefit pension plans provide pensions
based on length of service and final average pay. Certain pension payments
are indexed either on an ad hoc basis or a guaranteed basis. The defined
contribution pension plans provide pension benefits based on accumulated
employee and Corporation contributions. The Corporation and its subsidiaries
also provide post-retirement health, dental and life insurance benefits
to eligible employees, advisors and their dependents. For further information
on the Corporation’s pension plans and other post-retirement benefits refer
to Note 21 to the Corporation’s 2010 Consolidated Financial Statements.
Accounting for pension and other post-retirement benefits requires estimates
of future returns on plan assets, expected increases in compensation levels,
trends in healthcare costs, the period of time over which benefits will be paid,
as well as the appropriate discount rate for accrued benefit obligations. These
assumptions are determined by management using actuarial methods and
are reviewed and approved annually. Emerging experience, different from the
assumptions, will be revealed in future valuations and will affect the future
financial position of the plans and net periodic benefit costs.
DEFERRED SEL L ING COMMISSIONSCommissions paid on the sale of certain mutual fund products are deferred
and amortized over a maximum period of seven years. IGM regularly reviews
the carrying value of deferred selling commissions with respect to any events
or circumstances that indicate impairment. Among the tests performed
by IGM to assess recoverability is the comparison of the future economic
benefits derived from the deferred selling commission asset in relation to its
carrying value. At December 31, 2010, there were no indications of impairment
to deferred selling commissions.
OF F-B A L A NC E SH EE T A R R A NGEM EN T S
SECURI T IZ AT IONSThrough IGM’s mortgage banking operations, residential mortgages originated
by Investors Group mortgage planning specialists are sold to securitization
trusts sponsored by third parties that in turn issue securities to investors.
IGM retains servicing responsibilities and, in some cases, certain elements
of recourse with respect to credit losses on transferred loans. During 2010,
IGM entered into securitization transactions with Canadian bank-sponsored
securitization trusts and the Canada Mortgage Bond Program through its
mortgage banking operations with proceeds of $1.2 billion compared with
$1.3 billion in 2009 as discussed in Note 4 to the 2010 Consolidated Financial
Statements. Securitized loans serviced at December 31, 2010 totalled $3.5 billion
compared with $3.3 billion at December 31, 2009. The fair value of IGM’s retained
interest was $107 million at December 31, 2010 compared with $174 million
at December 31, 2009. Additional information related to IGM’s securitization
activities can be found in the “Financial Instruments” section below and
in Notes 1 and 4 of the 2010 Consolidated Financial Statements.
GUA R A N T EE SIn the normal course of their businesses, the Corporation and its subsidiaries
may enter into certain agreements, the nature of which precludes the
possibility of making a reasonable estimate of the maximum potential amount
the Corporation or subsidiary could be required to pay third parties, as some
of these agreements do not specify a maximum amount and the amounts
are dependent on the outcome of future contingent events, the nature and
likelihood of which cannot be determined.
L E T T ER S OF CREDI TIn the normal course of their reinsurance business, Lifeco’s subsidiaries provide
letters of credit to other parties or beneficiaries. A beneficiary will typically hold
a letter of credit as collateral in order to secure statutory credit for reserves
ceded to or amounts due from Lifeco’s subsidiaries. A letter of credit may be
drawn upon demand. If an amount is drawn on a letter of credit by a beneficiary,
the bank issuing the letter of credit will make a payment to the beneficiary for
the amount drawn, and Lifeco’s subsidiaries will become obligated to repay
this amount to the bank.
Lifeco, through certain of its operating subsidiaries, has provided letters
of credit to both external and internal parties, which are described in Note 26 to
the Corporation’s 2010 Consolidated Financial Statements.

44
REVIEW OF FINANCIAL PERFORMANCE
POWER FINANCIAL CORPORATION 2010 ANNUAL REPORT
CON T I NGEN T L I A BI L I T I E S
The Corporation’s subsidiaries are from time to time subject to legal actions,
including arbitrations and class actions, arising in the normal course
of business. It is inherently difficult to predict the outcome of any of these
proceedings with certainty, and it is possible that an adverse resolution
could have a material adverse effect on the consolidated financial position
of the Corporation. However, based on information presently known, it is not
expected that any of the existing legal actions, either individually or in the
aggregate, will have a material adverse effect on the consolidated financial
position of the Corporation.
Subsidiaries of Lifeco have declared partial windups in respect of certain Ontario
defined benefit pension plans which will not likely be completed for some time.
The partial windups could involve the distribution of the amount of actuarial
surplus, if any, attributable to the wound-up portion of the plans. However,
many issues remain unclear, including the basis of surplus measurement
and entitlement, and the method by which any surplus distribution would
be implemented. In addition to the regulatory proceedings involving these
partial windups, related proposed class action proceedings have been
commenced in Ontario related to certain of the partial windups. The provisions
for certain Canadian retirement plans in the amounts of $97 million after tax
established by Lifeco’s subsidiaries in the third quarter 2007 have been reduced
to $68 million. Actual results could differ from these estimates.
The Ontario Superior Court of Justice released a decision on October 1, 2010
in regard to the involvement of the participating accounts of Lifeco subsidiaries
London Life and Great-West Life in the financing of the acquisition of London
Insurance Group Inc. (LIG) in 1997. Lifeco believes there are significant aspects
of the lower court judgment that are in error and Notice of Appeal has been
filed. Notwithstanding the foregoing, Lifeco has established an incremental
provision in the third quarter of 2010 in the amount of $225 million after tax
($204 million and $21 million attributable to Lifeco’s common shareholder
and to Lifeco’s non-controlling interests, respectively). Lifeco now holds
$310 million in after-tax provisions for these proceedings. Regardless of the
ultimate outcome of this case, all of the participating policy contract terms
and conditions will continue to be honoured. Based on information presently
known, the original decision, if sustained on appeal, is not expected to have
a material adverse effect on the consolidated financial position of Lifeco.
Lifeco has entered into an agreement to settle a class action relating to the
provision of notice of the acquisition of Canada Life Financial Corporation
to certain shareholders of Canada Life Financial Corporation. The settlement
received Court approval on January 27, 2010 and is being implemented. Based
on information presently known, Lifeco does not expect this matter to have
a material adverse effect on its consolidated financial position.
Subsidiaries of Lifeco have an ownership interest in a U.S.-based private equity
partnership wherein a dispute has arisen over the terms of the partnership
agreement. Lifeco acquired the ownership interest in 2007 for purchase
consideration of US$350 million. Legal proceedings have been commenced
and are in their early stages. Legal proceedings have also commenced against
the private equity partnership by third parties in unrelated matters. Another
subsidiary of Lifeco has established a provision related to the latter proceedings.
While it is difficult to predict the final outcome of these proceedings, based
on information presently known, Lifeco does not expect these proceedings
to have a material adverse effect on its consolidated financial position.
In connection with the acquisition of its subsidiary Putnam, Lifeco has
an indemnity from a third party against liabilities arising from certain litigation
and regulatory actions involving Putnam. Putnam continues to have potential
liability for these matters in the event the indemnity is not honoured. Lifeco
expects the indemnity will continue to be honoured and that any liability
of Putnam would not have a material adverse effect on its consolidated
financial position.
R EL AT ED PA RT Y T R A NS AC T IONS
In the normal course of business, Great-West Life provides insurance benefits to other companies within the Power Financial Corporation group of companies.
In all cases, transactions were at market terms and conditions.
COM M I T M EN T S/CON T R AC T UA L OBL IG AT IONS
The following table provides a summary of future consolidated contractual obligations.
PAYMENTS DUE BY PERIOD
TOTALLESS THAN
1 YEAR 1–5 YEARSMORE THAN
5 YEARS
Long-term debt [ 1 ] 6,044 451 304 5,289Operating leases [ 2 ] 755 146 393 216Purchase obligations [ 3 ] 143 55 84 4Contractual commitments [ 4 ] 414 414
Total 7,356 1,066 781 5,509Letters of credit [ 5 ]
[ 1 ] Please refer to Note 10 to the Corporation’s 2010 Consolidated Financial Statements for further information.
[ 2 ] Includes office space and certain equipment used in the normal course of business. Lease payments are charged to operations in the period of use.
[ 3 ] Purchase obligations are commitments of Lifeco to acquire goods and services, essentially related to information services.
[ 4 ] Represents commitments by Lifeco. These contractual commitments are essentially commitments of investment transactions made in the normal course of operations,
in accordance with its policies and guidelines, which are to be disbursed upon fulfilment of certain contract conditions.
[ 5 ] Please refer to Note 26 to the Corporation’s 2010 Consolidated Financial Statements.

45POWER FINANCIAL CORPORATION 2010 ANNUAL REPORT
F I N A NC I A L I NS T RU M EN T S
FA IR VA LUE OF FINA NCIA L INS T RUMEN T SThe following table presents the fair value of the Corporation’s financial
instruments. Fair value represents the amount that would be exchanged
in an arm’s-length transaction between willing parties and is best evidenced
by a quoted market price, if one exists. Fair values are management’s estimates
and are generally calculated using market conditions at a specific point
in time and may not reflect future fair values. The calculations are subjective
in nature, involve uncertainties and matters of significant judgment (please
refer to Note 22 to the Corporation’s 2010 Consolidated Financial Statements).
AS AT DECEMBER 31 2010 2009
CARRYING
VALUEFAIR
VALUECARRYING
VALUEFAIR
VALUE
ASSETSCash and cash equivalents 3,656 3,656 4,855 4,855Investments (excluding real estate) 96,786 98,205 91,136 91,602Loans to policyholders 6,827 6,827 6,957 6,957Funds held by ceding insurers 9,860 9,860 10,839 10,839Receivables and other 2,599 2,599 2,601 2,601Derivative financial instruments 1,067 1,067 837 837
Total financial assets 120,795 122,214 117,225 117,691
LIABILITIESDeposits and certificates 835 840 907 916Debentures and other borrowings 6,348 6,821 5,967 6,180Capital trust securities and debentures 535 596 540 601Preferred shares of the Corporation – – 300 318Preferred shares of subsidiaries – – 203 203Other financial liabilities 5,976 5,976 5,321 5,321Derivative financial instruments 258 258 364 364
Total financial liabilities 13,952 14,491 13,602 13,903
DERI VAT I V E FINA NCIA L INS T RUMEN T SIn the course of their activities, the Corporation and its subsidiaries use
derivative financial instruments. When using such derivatives, they only act
as limited end-users and not as market-makers in such derivatives.
The use of derivatives is monitored and reviewed on a regular basis by senior
management of the companies. The Corporation and its subsidiaries have each
established operating policies and processes relating to the use of derivative
financial instruments, which in particular aim at:
> prohibiting the use of derivative instruments for speculative purposes;
> documenting transactions and ensuring their consistency with risk
management policies;
> demonstrating the effectiveness of the hedging relationships; and
> monitoring the hedging relationship.
There were no major changes to the Corporation’s and its subsidiaries’ policies
and procedures with respect to the use of derivative instruments in 2010. There
has been an increase in the notional amount outstanding ($18,337 million
at December 31, 2010, compared with $17,393 million at December 31, 2009) and
in the exposure to credit risk ($1,067 million at December 31, 2010, compared with
$837 million at December 31, 2009) that represents the market value of those
instruments, which are in a gain position. See Note 24 to the Corporation’s 2010
Consolidated Financial Statements for more information on the type of
derivative financial instruments used by the Corporation and its subsidiaries.

46
REVIEW OF FINANCIAL PERFORMANCE
POWER FINANCIAL CORPORATION 2010 ANNUAL REPORT
DI SC L O SU R E CON T ROL S A N D PRO C EDU R E S
Based on their evaluations as of December 31, 2010, the Chief Executive Officer and the Chief Financial Officer have concluded that the Corporation’s disclosure
controls and procedures were effective as at December 31, 2010.
I N T ER N A L CON T ROL OV ER F I N A NC I A L R EP ORT I NG
Based on their evaluations as of December 31, 2010, the Chief Executive Officer and the Chief Financial Officer have concluded that the Corporation’s internal
controls over financial reporting were effective as at December 31, 2010. During the fourth quarter of 2010, there have been no changes in the Corporation’s internal
control over financial reporting that have materially affected, or are reasonably likely to materially affect, the Corporation’s internal control over financial reporting.
SEL EC T ED A N N UA L I N FOR M AT ION
FOR THE YEARS ENDED DECEMBER 31 2010 2009 2008Revenues from continuing operations [ 1 ] 32,427 32,697 36,500Operating earnings before other items [ 2 ] 1,733 1,533 1,974
per share — basic 2.31 2.05 2.69Net earnings 1,584 1,439 1,337
per share — basic 2.10 1.92 1.79per share — diluted 2.10 1.91 1.78
Earnings from discontinued operations 503per share — basic 0.71per share — diluted 0.71
Earnings from continuing operations [ 3 ] 1,584 1,439 834per share — basic 2.10 1.92 1.08per share — diluted 2.10 1.91 1.07
Consolidated assets 143,255 140,231 141,546
Consolidated financial liabilities 13,952 13,602 15,316Debentures and other borrowings 6,348 5,967 5,658Shareholders' equity 13,184 13,207 13,419Book value per share 15.79 16.27 16.80Number of common shares outstanding [millions] 708.0 705.7 705.0
Dividends per share [declared]Common shares 1.4000 1.4000 1.3325First preferred shares
Series A 0.45238 0.42744 0.8431Series C [ 4 ] 0.9750 1.3000 1.3000Series D 1.3750 1.3750 1.3750Series E 1.3125 1.3125 1.3125Series F 1.4750 1.4750 1.4750Series H 1.4375 1.4375 1.4375Series I 1.5000 1.5000 1.5000Series J [ 5 ] 0.5875 1.1750 1.1750Series K 1.2375 1.2375 1.2375Series L 1.2750 1.2750 1.2750Series M [ 6 ] 1.5000 1.7538Series O [ 7 ] 1.4500 0.45288Series P [ 8 ] 0.6487
[ 1 ] Revenues from continuing operations represent consolidated revenues, excluding revenues of Lifeco’s U.S. healthcare business.
[ 2 ] Operating earnings and operating earnings per share are non-GAAP financial measures. Operating earnings include Power Financial’s share of Lifeco’s U.S. healthcare business of
$31 million in 2008.
[ 3 ] Earnings from continuing operations represent net earnings, excluding Power Financial’s share of Lifeco’s U.S. healthcare business.
[ 4 ] Redeemed in October 2010.
[ 5 ] Redeemed in July 2010.
[ 6 ] Issued in November 2008.
[ 7 ] Issued in October 2009.
[ 8 ] Issued in June 2010.

47POWER FINANCIAL CORPORATION 2010 ANNUAL REPORT
CONS OL I DAT ED B A L A NC E SH EE T S
AS AT DECEMBER 31[in millions of Canadian dollars] 2010 2009
ASSETSCash and cash equivalents 3,656 4,855
Investments [ Note 3 ]Shares 6,415 6,392Bonds 73,635 67,388Mortgages and other loans 16,736 17,356Real estate 3,275 3,101
100,061 94,237Loans to policyholders 6,827 6,957Funds held by ceding insurers 9,860 10,839Investment at equity [ Note 5 ] 2,279 2,675Intangible assets [ Note 6 ] 4,238 4,366Goodwill [ Note 6 ] 8,726 8,655Future income taxes [ Note 7 ] 1,174 1,268Other assets [ Note 8 ] 6,434 6,379
143,255 140,231
LIABILITIESPolicy liabilities [ Note 9 ]
Actuarial liabilities 100,394 98,059Other 4,723 4,592
Deposits and certificates 835 907Funds held under reinsurance contracts 152 186Debentures and other borrowings [ Note 10 ] 6,348 5,967Capital trust securities and debentures [ Note 11 ] 535 540Preferred shares of the Corporation [ Note 14 ] – 300Preferred shares of subsidiaries – 203Future income taxes [ Note 7 ] 1,167 1,098Other liabilities [ Note 12 ] 6,861 6,294
121,015 118,146
Non-controlling interests [ Note 13 ] 9,056 8,878
SHAREHOLDERS’ EQUITYStated capital [ Note 14 ]
Perpetual preferred shares 2,005 1,725Common shares 636 605
Contributed surplus 105 102Retained earnings 11,641 11,165Accumulated other comprehensive income (loss) [ Note 18 ] (1,203) (390)
13,184 13,207
143,255 140,231
Approved by the Board of Directors
Signed Signed
Raymond Royer R. Jeffrey Orr
Director Director
CONSOLIDATED FINANCIAL STATEMENTS

48 POWER FINANCIAL CORPORATION 2010 ANNUAL REPORT
CONS OL I DAT ED S TAT EM EN T S OF E A R N I NG S
FOR THE YEARS ENDED DECEMBER 31[in millions of Canadian dollars, except per share amounts] 2010 2009
REVENUESPremium income 17,748 18,033Net investment income
Regular net investment income 5,783 6,203Change in fair value on held-for-trading assets 3,646 3,463
9,429 9,666Fee income 5,250 4,998
32,427 32,697
EXPENSESPolicyholder benefits, dividends and experience refunds, and change in actuarial liabilities 23,063 23,809Commissions 2,277 2,088Operating expenses 3,834 3,607Financing charges [ Note 19 ] 427 494
29,601 29,998
2,826 2,699Share of earnings of investment at equity [ Note 5 ] 120 141Other income (charges), net [ Note 20 ] (5) (58)
Earnings before income taxes and non-controlling interests 2,941 2,782Income taxes [ Note 7 ] 497 565Non-controlling interests [ Note 13 ] 860 778
Net earnings 1,584 1,439
Earnings per common share [ Note 23 ]— Basic 2.10 1.92
— Diluted 2.10 1.91
CONS OL I DAT ED S TAT EM EN T S OF COM PR EH ENSI V E I NCOM E
FOR THE YEARS ENDED DECEMBER 31[in millions of Canadian dollars] 2010 2009
Net earnings 1,584 1,439
Other comprehensive income (loss)Net unrealized gains (losses) on available-for-sale assets
Unrealized gains (losses) 129 246Income tax (expense) benefit (55) (47)Realized (gains) losses to net earnings (88) 11Income tax expense (benefit) 18 3
4 213
Net unrealized gains (losses) on cash flow hedgesUnrealized gains (losses) 77 223Income tax (expense) benefit (27) (78)Realized (gains) losses to net earnings 2 1Income tax expense (benefit) (1) –
51 146
Net unrealized foreign exchange gains (losses) on translation of foreign operations (1,014) (1,328)
Other comprehensive income (loss) before non-controlling interests (959) (969)Non-controlling interests 146 232
Other comprehensive income (loss) (813) (737)
Comprehensive income 771 702
CONSOLIDATED FINANCIAL STATEMENTS
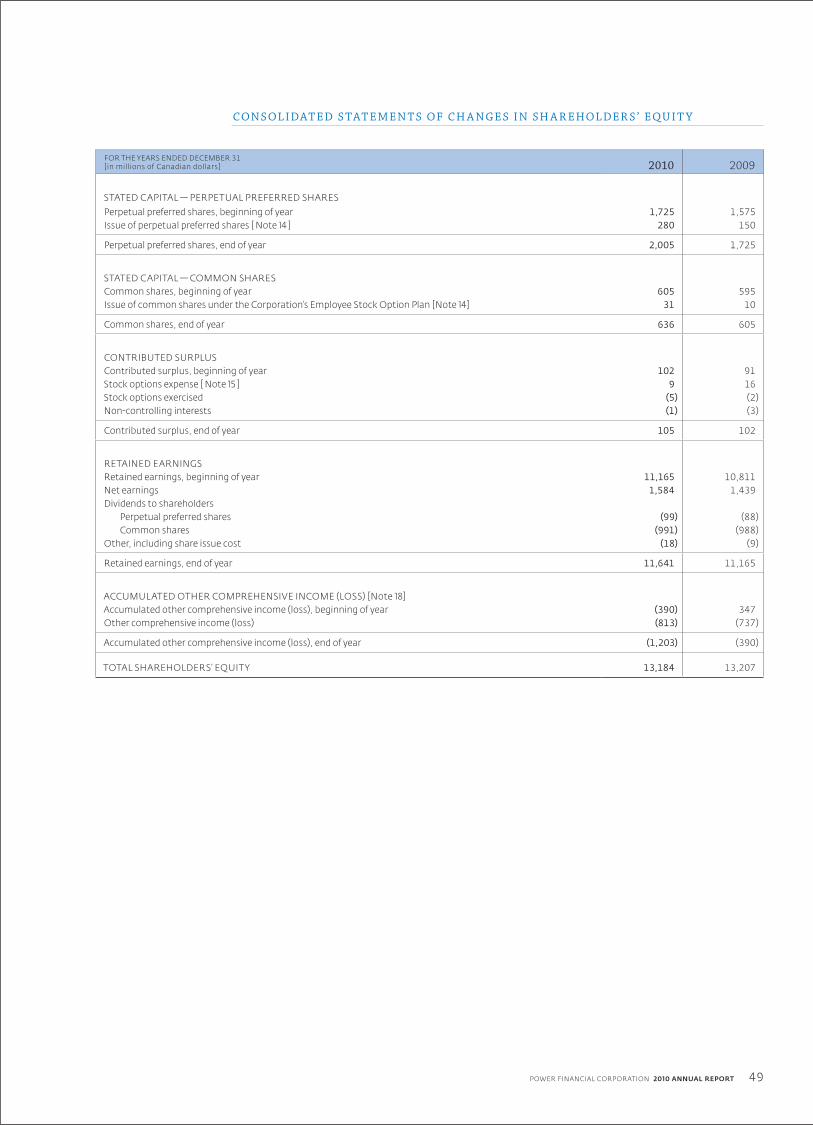
49POWER FINANCIAL CORPORATION 2010 ANNUAL REPORT
CONS OL I DAT ED S TAT EM EN T S OF C H A NGE S I N SH A R EHOL DER S ’ EQU I T Y
FOR THE YEARS ENDED DECEMBER 31[in millions of Canadian dollars] 2010 2009
STATED CAPITAL — PERPETUAL PREFERRED SHARESPerpetual preferred shares, beginning of year 1,725 1,575Issue of perpetual preferred shares [ Note 14 ] 280 150
Perpetual preferred shares, end of year 2,005 1,725
STATED CAPITAL — COMMON SHARES Common shares, beginning of year 605 595Issue of common shares under the Corporation’s Employee Stock Option Plan [Note 14] 31 10
Common shares, end of year 636 605
CONTRIBUTED SURPLUSContributed surplus, beginning of year 102 91Stock options expense [ Note 15 ] 9 16Stock options exercised (5) (2)Non-controlling interests (1) (3)
Contributed surplus, end of year 105 102
RETAINED EARNINGSRetained earnings, beginning of year 11,165 10,811Net earnings 1,584 1,439Dividends to shareholders
Perpetual preferred shares (99) (88)Common shares (991) (988)
Other, including share issue cost (18) (9)
Retained earnings, end of year 11,641 11,165
ACCUMULATED OTHER COMPREHENSIVE INCOME (LOSS) [Note 18]Accumulated other comprehensive income (loss), beginning of year (390) 347Other comprehensive income (loss) (813) (737)
Accumulated other comprehensive income (loss), end of year (1,203) (390)
TOTAL SHAREHOLDERS’ EQUITY 13,184 13,207
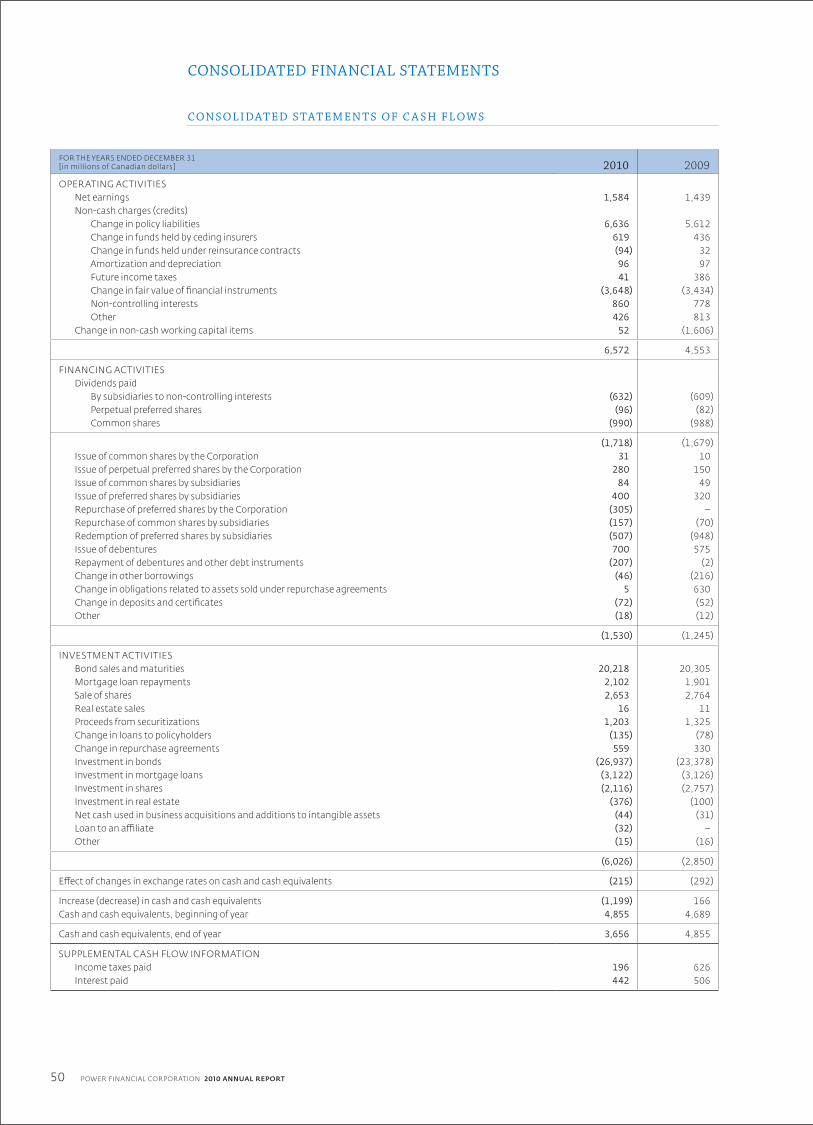
50 POWER FINANCIAL CORPORATION 2010 ANNUAL REPORT
CONS OL I DAT ED S TAT EM EN T S OF C A SH F L OW S
FOR THE YEARS ENDED DECEMBER 31[in millions of Canadian dollars] 2010 2009
OPERATING ACTIVITIESNet earnings 1,584 1,439Non-cash charges (credits)
Change in policy liabilities 6,636 5,612Change in funds held by ceding insurers 619 436Change in funds held under reinsurance contracts (94) 32Amortization and depreciation 96 97Future income taxes 41 386Change in fair value of financial instruments (3,648) (3,434)Non-controlling interests 860 778Other 426 813
Change in non-cash working capital items 52 (1,606)
6,572 4,553
FINANCING ACTIVITIESDividends paid
By subsidiaries to non-controlling interests (632) (609)Perpetual preferred shares (96) (82)Common shares (990) (988)
(1,718) (1,679)Issue of common shares by the Corporation 31 10Issue of perpetual preferred shares by the Corporation 280 150Issue of common shares by subsidiaries 84 49Issue of preferred shares by subsidiaries 400 320Repurchase of preferred shares by the Corporation (305) –Repurchase of common shares by subsidiaries (157) (70)Redemption of preferred shares by subsidiaries (507) (948)Issue of debentures 700 575Repayment of debentures and other debt instruments (207) (2)Change in other borrowings (46) (216)Change in obligations related to assets sold under repurchase agreements 5 630Change in deposits and certificates (72) (52)Other (18) (12)
(1,530) (1,245)
INVESTMENT ACTIVITIESBond sales and maturities 20,218 20,305Mortgage loan repayments 2,102 1,901Sale of shares 2,653 2,764Real estate sales 16 11Proceeds from securitizations 1,203 1,325Change in loans to policyholders (135) (78)Change in repurchase agreements 559 330Investment in bonds (26,937) (23,378)Investment in mortgage loans (3,122) (3,126)Investment in shares (2,116) (2,757)Investment in real estate (376) (100)Net cash used in business acquisitions and additions to intangible assets (44) (31)Loan to an affiliate (32) –Other (15) (16)
(6,026) (2,850)
Effect of changes in exchange rates on cash and cash equivalents (215) (292)
Increase (decrease) in cash and cash equivalents (1,199) 166Cash and cash equivalents, beginning of year 4,855 4,689
Cash and cash equivalents, end of year 3,656 4,855
SUPPLEMENTAL CASH FLOW INFORMATIONIncome taxes paid 196 626Interest paid 442 506
CONSOLIDATED FINANCIAL STATEMENTS

51POWER FINANCIAL CORPORATION 2010 ANNUAL REPORT
The Consolidated Financial Statements of Power Financial Corporation (the
Corporation) have been prepared in accordance with Canadian generally
accepted accounting principles and include the accounts of the Corporation
and its subsidiaries.
The principal subsidiaries of the Corporation are:
> Great-West Lifeco Inc. (Lifeco) (direct interest of 68.3% (2009 — 68.6%)),
whose major operating subsidiary companies are Great-West Life & Annuity
Insurance Company (GWL&A), London Life Insurance Company
(London Life), The Canada Life Assurance Company (Canada Life),
The Great-West Life Assurance Company (Great-West Life) and
Putnam Investments, LLC (Putnam).
> IGM Financial Inc. (IGM) (direct interest of 57.0% (2009 — 56.3%)),
whose major operating subsidiary companies are Investors Group Inc.
(Investors Group) and Mackenzie Financial Corporation (Mackenzie).
> IGM holds 4.0% (2009 — 4.0%) of the common shares of Lifeco, and
Great-West Life holds 3.5% (2009 — 3.5%) of the common shares of IGM.
The Corporation also holds a 50% (2009 — 50%) interest in Parjointco N.V.
(Parjointco). Parjointco holds a 54.1% (2009 — 54.1%) equity interest in Pargesa
Holding SA (Pargesa). The Corporation accounts for its investment in Parjointco
using the equity method.
USE OF E S T IM AT E S A ND ME A SUREMEN T UNCERTA IN T YThe preparation of financial statements in conformity with Canadian generally
accepted accounting principles (Canadian GAAP) requires management to
make estimates and assumptions that affect the amounts reported in those
financial statements and accompanying notes. In particular, the valuation
of goodwill and intangible assets, policy liabilities, income taxes, deferred
selling commissions, certain financial assets and liabilities, pension plans and
other post-retirement benefits are key components of the financial statements
requiring management to make estimates. The reported amounts and note
disclosures are determined using management’s best estimates.
The results of the Corporation reflect management’s judgments regarding
the impact of prevailing global credit, equity and foreign exchange market
conditions.
The estimation of policy liabilities relies upon investment credit ratings. Lifeco’s
practice is to use third-party independent credit ratings where available. Credit
rating changes may lag developments in the current environment. Subsequent
credit rating adjustments will impact policy liabilities.
RE V ENUE RECO GNI T IONFor Lifeco, premiums for all types of insurance contracts and contracts with
limited mortality or morbidity risk are generally recognized as revenue when
due and collection is reasonably assured. When premiums are recognized,
policy liabilities are computed with the result that benefits and expenses are
matched with such revenue.
Lifeco’s premium revenues, total paid or credited to policyholders and policy
liabilities are all shown net of reinsurance amounts ceded to, or including
amounts assumed from, other insurers.
For Lifeco, fee income is recognized when the service is performed, the amount
is collectible and can be reasonably estimated. Fee income primarily includes
fees earned from the management of segregated fund assets, proprietary
mutual fund assets, fees earned on the administration of administrative services
only (ASO) Group health contracts and fees earned from management services.
For IGM, management fees are based on the net asset value of mutual fund
assets under management and are recognized on an accrual basis as the service
is performed. Administration fees are also recognized on an accrual basis as
the service is performed. Distribution revenues derived from mutual fund
and securities transactions are recognized on a trade-date basis. Distribution
revenues derived from insurance and other financial services transactions are
recognized on an accrual basis.
Investment income is recognized on an accrual basis.
C A SH A ND C A SH EQUI VA L EN T SCash and cash equivalents include cash, current operating accounts, overnight
bank and term deposits with original maturity of three months or less, fixed
income securities with an original term to maturity of three months or less,
as well as other highly liquid investments with short-term maturities that are
readily convertible to known amounts of cash. Cash and cash equivalents are
recorded at fair value.
IN V E S T MEN T SInvestments are classified as held for trading, available for sale, held to maturity,
loans and receivables or as non-financial instruments based on management’s
intention or the investment’s characteristics.
Investments in bonds and shares normally actively traded on a public market
are either designated or classified as held for trading or classified as available for
sale, based on management’s intention. Fixed income securities are included
in bonds on the balance sheet. Held-for-trading investments are recognized
at fair value on the balance sheet with realized and unrealized gains and
losses reported in the statements of earnings. Available-for-sale investments
are recognized at fair value on the balance sheet with unrealized gains and
losses recorded in other comprehensive income. Realized gains and losses are
reclassified from other comprehensive income and recorded in the statements
of earnings when the available-for-sale investment is sold. Interest income
earned on both held-for-trading and available-for-sale bonds is recorded as
investment income in the statements of earnings.
Investments in equity instruments where a market value cannot be measured
reliably that are classified as available for sale are carried at cost. Investments in
shares for which the Corporation exerts significant influence over but does not
control are accounted for using the equity method of accounting (see Note 5).
Investments in mortgages and bonds not normally actively traded on a public
market and other loans are classified as loans and receivables and are carried
at amortized cost net of any allowance for credit losses. Interest income
earned and realized gains and losses on the sale of investments classified as
loans and receivables are recorded in net investment income in the statements
of earnings.
With respect to Lifeco, investments in real estate are carried at cost net of write-
downs and allowances for losses, plus an unrealized moving average market
value adjustment of $162 million ($164 million in 2009) in the consolidated
balance sheets. The carrying value is adjusted towards market value at a rate of
3% per quarter. Net realized gains and losses of $115 million ($133 million in 2009)
are included in deferred net realized gains classified in other liabilities on the
balance sheets and are deferred and amortized to income at a rate of 3% per
quarter on a declining balance basis.
Investments classified as available for sale and held for trading are recorded
on a trade-date basis.
NO T E 1 SIGN I F IC A N T ACCOU N T I NG P OL IC I E S
NOTES TO CONSOLIDATED FINANCIAL STATEMENTSALL TABULAR AMOUNTS ARE IN millionS OF CANADIAN DOLLARS, UNLESS OTHERWISE NOTED.
52
NOTES TO CONSOLIDATED FINANCIAL STATEMENTS
POWER FINANCIAL CORPORATION 2010 ANNUAL REPORT
FAIR VALUE MEASUREMENTFinancial instrument carrying values necessarily reflect the prevailing market
liquidity and the liquidity premiums embedded in the market pricing methods
the Corporation relies upon.
The following is a description of the methodologies used to value instruments
carried at fair value:
BONDS – HELD FOR TRADING AND AVAILABLE FOR SALE
Fair values for bonds classified as held for trading or available for sale are
determined with reference to quoted market bid prices primarily provided
by third-party independent pricing sources. Where prices are not quoted in
a normally active market, fair values are determined by valuation models.
The Corporation maximizes the use of observable inputs and minimizes the
use of unobservable inputs when measuring fair value. The Corporation obtains
quoted prices in active markets, when available, for identical assets at the
balance sheet date to measure bonds at fair value in its held-for-trading and
available-for-sale portfolios.
The Corporation estimates the fair value of bonds not traded in active
markets by referring to actively traded securities with similar attributes,
dealer quotations, matrix pricing methodology, discounted cash flow
analyses and/or internal valuation models. This methodology considers such
factors as the issuer’s industry, the security’s rating, term, coupon rate and
position in the capital structure of the issuer, as well as yield curves, credit
curves, prepayment rates and other relevant factors. For bonds that are not
traded in active markets, valuations are adjusted to reflect illiquidity, and such
adjustments are generally based on available market evidence. In the absence
of such evidence, management’s best estimate is used.
SHARES – HELD FOR TRADING AND AVAILABLE FOR SALE
Fair values for publicly traded shares are generally determined by the last
bid price for the security from the exchange where it is principally traded.
Fair values for shares for which there is no active market are determined by
discounting expected future cash flows. The Corporation maximizes the use
of observable inputs and minimizes the use of unobservable inputs when
measuring fair value. The Corporation obtains quoted prices in active markets,
when available, for identical assets at the balance sheet date to measure stocks
at fair value in its held-for-trading and available-for-sale portfolios.
MORTGAGES AND OTHER LOANS, BONDS CLASSIFIED AS LOANS AND RECEIVABLES, AND REAL ESTATE
Market values for bonds, and mortgages and other loans, classified as loans
and receivables are determined by discounting expected future cash flows
using current market rates. Market values for real estate are determined using
independent appraisal services and include management adjustments for
material changes in property cash flows, capital expenditures or general market
conditions in the interim period between appraisals.
IMPAIRMENTInvestments are reviewed regularly on an individual basis to determine
impairment status. The Corporation considers various factors in the impairment
evaluation process, including, but not limited to, the financial condition of the
issuer, specific adverse conditions affecting an industry or region, decline in fair
value not related to interest rates, bankruptcy or defaults, and delinquency in
payments of interest or principal. Investments are deemed to have an other
than temporary impairment when there is no longer reasonable assurance
of timely collection of the full amount of the principal and interest due. The
market value of an investment is not a definitive indicator of impairment, as
it may be significantly influenced by other factors, including the remaining
term to maturity and liquidity of the asset. However, market price must be
taken into consideration when evaluating other than temporary impairment.
For impaired mortgages and other loans, and bonds classified as loans and
receivables, provisions are established or write-downs made to adjust the
carrying value to the net realizable amount. Wherever possible the fair value
of collateral underlying the loans or observable market price is used to establish
net realizable value. For impaired available-for-sale loans, recorded at fair value,
the accumulated loss recorded in accumulated other comprehensive income
is reclassified to net investment income. Impairment on available-for-sale
debt instruments is reversed if there is objective evidence that a permanent
recovery has occurred. All gains and losses on bonds classified or designated
as held for trading are already recorded in earnings. As well, when determined
to be impaired, interest is no longer accrued and previous interest accruals
are reversed.
T R A NS AC T ION COS T STransaction costs are expensed as incurred for financial instruments classified or
designated as held for trading. Transaction costs for financial assets classified
as available for sale or loans and receivables are added to the value of the
instrument at acquisition and taken into net earnings using the effective
interest rate method. Transaction costs for financial liabilities classified as
other than held for trading are recognized immediately in net earnings.
LOA NS TO P OL IC Y HOL DER SLoans to policyholders are shown at their unpaid balance and are fully secured
by the cash surrender values of the policies. The carrying value of loans to
policyholders approximates fair value.
SECURI T IZ AT IONSIGM periodically sells residential mortgages through Canada Mortgage and
Housing Corporation (CMHC), utilizing the National Housing Act Mortgage-
Backed Securities program (NHA MBS), or through Canadian bank-sponsored
securitization trusts that in turn issue securities to investors. NHA MBS are
sold to a trust that issues securities to investors through the Canada Mortgage
Bond Program (CMB Program), which is sponsored by CMHC. IGM retains
servicing responsibilities and certain elements of recourse with respect to credit
losses on transferred loans. IGM also sells NHA-insured mortgages through the
issuance of mortgage-backed securities.
Transfers of loans are accounted for as sales provided that control over the
transferred loans has been surrendered and consideration other than beneficial
interests in the transferred loans has been received in exchange. The loans are
removed from the balance sheets and a gain or loss is recognized in earnings
immediately based on the carrying value of the loans transferred. The carrying
value is allocated between the assets transferred and the retained interests in
proportion to their fair values at the date of transfer. To obtain the fair value of
IGM’s retained interests, quoted market prices are used, if available. However,
since quotes are generally not available for retained interests, the estimated
fair value is based on the present value of future expected cash flows using
management’s best estimates of key assumptions such as prepayment rates,
excess spread, expected credit losses and discount rates commensurate with
the risks involved. Retained interests are classified as held for trading and any
realized or unrealized gains and losses are recorded in net investment income
in the statements of earnings. IGM continues to service the loans transferred.
As a result, a servicing liability is recognized and amortized over the expected
term of the transferred loans as servicing fees.
For all sales of loans, the gains or losses and the servicing fee revenue are
reported in net investment income in the statements of earnings. The retained
interests in the securitized loans are recorded in other assets and the servicing
liability is recorded in other liabilities on the balance sheets.
NO T E 1 SU M M A RY OF SIGN I F IC A N T ACCOU N T I NG P OL IC I E S (C O N T I N U E D)

53POWER FINANCIAL CORPORATION 2010 ANNUAL REPORT
FI XED A SSE T SFixed assets, which are included in other assets, are recorded at cost less
accumulated amortization computed on a straight-line basis over their
estimated useful lives, which vary from three to 50 years. Amortization of
fixed assets included in the Consolidated Statements of Earnings amounted
to $45 million ($52 million in 2009). Fixed assets are tested for recoverability
whenever events or changes in circumstances indicate that the carrying
amount may not be recoverable.
DEFERRED SEL L ING COMMISSIONSCommissions paid by IGM on the sale of certain mutual funds are deferred
and amortized over a maximum period of seven years. Commissions paid on
the sale of deposits are deferred and amortized over a maximum amortization
period of five years. IGM regularly reviews the carrying value of deferred selling
commissions with respect to any events or circumstances that indicate
impairment. Among the tests performed by IGM to assess recoverability is the
comparison of the future economic benefits derived from the deferred selling
commission asset in relation to its carrying value. At December 31, 2010, there
were no indications of impairment to deferred selling commissions.
G O ODW IL L A ND IN TA NGIBL E A SSE T SGoodwill represents the excess of purchase consideration over the fair value
of net assets acquired. Intangible assets represent finite life and indefinite
life intangible assets acquired and software acquired or internally developed.
Intangible assets with finite lives are amortized on a straight-line basis
over their estimated useful lives, for a period not exceeding 30 years. The
Corporation tests goodwill and indefinite life intangible assets for impairment
using a two-step fair value-based test annually, and when an event or change
in circumstances indicates that the asset might be impaired. Goodwill and
intangible assets are written down when impaired to the extent that the
carrying value exceeds the estimated fair value.
IMPAIRMENT TESTING – GOODWILLIn the first test, goodwill is assessed for impairment by determining whether
the fair value of the reporting unit to which the goodwill is associated is less
than its carrying value. When the fair value of the reporting unit is less than
its carrying value, the second test compares the fair value of the goodwill in
that reporting unit to its carrying value. If the fair value of goodwill is less
than its carrying value, goodwill is considered to be impaired and a charge for
impairment is recognized immediately. The fair value of the reporting units
is derived from internally developed valuation models consistent with those
used when the Corporation is acquiring businesses, using a market or income
approach. The discount rates used are based on an industry weighted cost
of capital and consider the risk-free rate, market equity risk premium, size
premium and operational risk premium for possible variations from projections.
IMPAIRMENT TESTING – INDEFINITE LIFE INTANGIBLESThe fair value of intangible assets for customer contracts, the shareholder
portion of acquired future participating account profits, certain property
leases, and mutual fund management contracts, is estimated using an
income approach as described for goodwill above. The fair value of brands and
trademarks is estimated using a relief-from-royalty approach using the present
value of expected after-tax royalty cash flows through licensing agreements.
P OL IC Y L IA BIL I T IE SPolicy liabilities represent the amounts required, in addition to future
premiums and investment income, to provide for future benefit payments,
policyholder dividends, commissions, and policy administrative expenses for
all insurance and annuity policies in force with Lifeco. The Appointed Actuaries
of Lifeco’s subsidiary companies are responsible for determining the amount
of the policy liabilities to make appropriate provision for Lifeco’s obligations to
policyholders. The Appointed Actuaries determine the policy liabilities using
generally accepted actuarial practices, according to standards established by
the Canadian Institute of Actuaries. The valuation uses the Canadian Asset
Liability Method. This method involves the projection of future events in order
to determine the amount of assets that must be set aside currently to provide
for all future obligations and involves a significant amount of judgment.
FINA NCIA L L IA BIL I T IE SFinancial liabilities, other than policy liabilities and certain preferred shares,
are classified as other liabilities. Other liabilities are initially recorded on the
balance sheets at fair value and subsequently carried at amortized cost using
the effective interest rate method with amortization expense recorded in the
statements of earnings.
Lifeco had designated certain preferred shares as held for trading with changes
in fair value reported in the statements of earnings. These preferred shares
were redeemed in 2009 and 2010.
S TO CK- BA SED COMPENS AT ION PL A NSThe fair value-based method of accounting is used for the valuation of
compensation expense for options granted to employees. Compensation
expense is recognized over the period that the stock options vest, with a
corresponding increase in contributed surplus. When the stock options
are exercised, the proceeds, together with the amount recorded in
contributed surplus, are added to the stated capital of the entity issuing the
corresponding shares.
REP URCH A SE AGREEMEN T SLifeco enters into repurchase agreements with third-party broker-dealers in
which Lifeco sells securities and agrees to repurchase substantially similar
securities at a specified date and price. Such agreements are accounted for as
investment financings.
DERI VAT I V E FINA NCIA L INS T RUMEN T SThe Corporation and its subsidiaries use derivative products as risk management
instruments to hedge or manage asset, liability and capital positions, including
revenues. The Corporation’s policy guidelines prohibit the use of derivative
instruments for speculative trading purposes.
All derivatives, including those that are embedded in financial and non-financial
contracts that are not closely related to the host contracts, are recorded at fair
value on the balance sheets in other assets and other liabilities. The method
of recognizing unrealized and realized fair value gains and losses depends on
whether the derivatives are designated as hedging instruments. For derivatives
that are not designated as hedging instruments, unrealized and realized
gains and losses are recorded in net investment income on the statements of
earnings. Non-qualifying derivatives or derivatives not designated as hedges
continue to be utilized on a basis consistent with the risk management policies
of the Corporation and are monitored by the Corporation for effectiveness as
economic hedges even if specific hedge accounting requirements are not met.
For derivatives designated as hedging instruments, unrealized and realized
gains and losses are recognized according to the nature of the hedged item.
Derivatives are valued using market transactions and other market evidence
whenever possible, including market-based inputs to models, broker or dealer
quotations or alternative pricing sources with reasonable levels of price
transparency. When models are used, the selection of a particular model
to value a derivative depends on the contractual terms of, and specific risks
inherent in the instrument, as well as the availability of pricing information
in the market. The Corporation generally uses similar models to value similar
instruments. Valuation models require a variety of inputs, including contractual
terms, market prices and rates, yield curves, credit curves, measures of volatility,
prepayment rates and correlations of such inputs.
NO T E 1 SU M M A RY OF SIGN I F IC A N T ACCOU N T I NG P OL IC I E S (C O N T I N U E D)

54
NOTES TO CONSOLIDATED FINANCIAL STATEMENTS
POWER FINANCIAL CORPORATION 2010 ANNUAL REPORT
To qualify for hedge accounting, the relationship between the hedged item and
the hedging instrument must meet several strict conditions on documentation,
probability of occurrence, hedge effectiveness and reliability of measurement. If
these conditions are not met, then the relationship does not qualify for hedge
accounting treatment and both the hedged item and the hedging instrument
are reported independently, as if there was no hedging relationship.
Where a hedging relationship exists, the Corporation documents all
relationships between hedging instruments and hedged items, as well as
its risk management objectives and strategy for undertaking various hedge
transactions. This process includes linking derivatives that are used in hedging
transactions to specific assets and liabilities on the balance sheet or to specific
firm commitments or forecasted transactions. The Corporation also assesses,
both at the hedge’s inception and on an ongoing basis, whether derivatives
that are used in hedging transactions are effective in offsetting changes in fair
values or cash flows of hedged items. Hedge effectiveness is reviewed quarterly
through a combination of critical terms matching and correlation testing.
For fair value hedges, changes in fair value of both the hedging instrument
and the hedged item are recorded in net investment income and con-
sequently any ineffective portion of the hedge is recorded immediately in net
investment income.
For cash flow hedges, the effective portion of the changes in fair value of the
hedging instrument is recorded in the same manner as the hedged item in
either net investment income or other comprehensive income, while the
ineffective portion is recognized immediately in net investment income. Gains
and losses that accumulate in other comprehensive income are recorded in net
investment income in the same period the hedged item affects net earnings.
Gains and losses on cash flow hedges are immediately reclassified from other
comprehensive income to net investment income if and when it is probable
that a forecasted transaction is no longer expected to occur.
Foreign exchange forward contracts are used to hedge net investment in
foreign operations. Changes in the fair value of these hedges are recorded
in other comprehensive income. Hedge accounting is discontinued when the
hedging no longer qualifies for hedge accounting.
IGM also enters into total return swaps to manage its exposure to fluctuations
in the total return of its common shares related to deferred compensation
arrangements. These total return swap agreements require the periodic
exchange of net contractual payments without the exchange of the notional
principal amounts on which the payments are based. These instruments are
not designated as hedges. Changes in fair value are recorded in operating
expenses in the statements of earnings.
F OREIGN CURRENC Y T R A NSL AT IONThe Corporation follows the current rate method of foreign currency translation
for its net investments in self-sustaining foreign operations. Under this method,
assets and liabilities are translated into Canadian dollars at the rate of exchange
prevailing at the balance sheet date and all income and expenses are translated
at an average of daily rates. Unrealized foreign currency translation gains
and losses on the Corporation’s net investment in its self-sustaining foreign
operations are presented separately as a component of other comprehensive
income. Unrealized gains and losses are recognized proportionately in earnings
when there has been a net permanent disinvestment in the foreign operations.
All other assets and liabilities denominated in foreign currency are translated
into Canadian dollars at exchange rates prevailing at the balance sheet date
for monetary items and at exchange rates prevailing at the transaction dates
for non-monetary items. Realized and unrealized exchange gains and losses
are included in net investment income and are not material to the financial
statements of the Corporation.
PENSION PL A NS A ND OT HER P OS T- RE T IREMEN T BENEFI T SThe Corporation and its subsidiaries maintain defined benefit pension plans as
well as defined contribution pension plans for certain employees and advisors.
The plans provide pension based on length of service and final average earnings.
The benefit obligation is actuarially determined and accrued using the projected
benefit method pro-rated on service. Pension expense consists of the aggregate
of the actuarially computed cost of pension benefits provided in respect of
the current year’s service, imputed interest on the accrued benefit obligation
less expected returns on plan assets which are valued at market value. Past
service costs, transitional assets and transitional obligations are amortized
over the expected average remaining service life of the employee/advisor group.
For the most part, actuarial gains or losses in excess of the greater of 10% of
the beginning-of-year plan assets or accrued benefit obligation are amortized
over the expected average remaining service life of the employee/advisor group.
The cost of pension benefits is charged to earnings using the projected benefit
method pro-rated on services.
The Corporation and its subsidiaries also have unfunded supplementary pension
plans for certain employees. Pension expense related to current services is
charged to earnings in the period during which the services are rendered.
In addition, the Corporation and its subsidiaries provide certain post-retirement
healthcare, dental, and life insurance benefits to eligible retirees, employees,
advisors and their dependents. The current cost of post-retirement health,
dental and life benefits is charged to earnings using the projected benefit
method pro-rated on services.
FUNDS HEL D BY CEDING INSURER S/ FUNDS HEL D UNDER REINSUR A NCE CON T R AC T SUnder certain forms of reinsurance contracts, it is customary for the ceding
insurer to retain possession of the assets supporting the liabilities ceded.
Lifeco records an amount receivable from the ceding insurer or payable to the
reinsurer representing the premium due. Investment revenue on these funds
withheld is credited by the ceding insurer.
INCOME TA XE SThe Corporation follows the liability method in accounting for income taxes,
whereby future income tax assets and liabilities reflect the expected future
tax consequences of temporary differences between the carrying amounts of
assets and liabilities and their tax bases. Future income tax assets and liabilities
are measured based on the enacted or substantively enacted tax rates which
are anticipated to be in effect when the temporary differences are expected
to reverse.
E A RNING S PER SHA REBasic earnings per share is determined by dividing net earnings available to
common shareholders by the average number of common shares outstanding
for the year. Diluted earnings per share is determined using the same method
as basic earnings per share, except that the average number of common shares
outstanding includes the potential dilutive effect of outstanding stock options
granted by the Corporation, as determined by the treasury stock method.
COMPA R AT I V E FIGURE SCertain of the 2009 amounts presented for comparative purposes have been
reclassified to conform with the presentation adopted in the current year.
NO T E 1 SU M M A RY OF SIGN I F IC A N T ACCOU N T I NG P OL IC I E S (C O N T I N U E D)
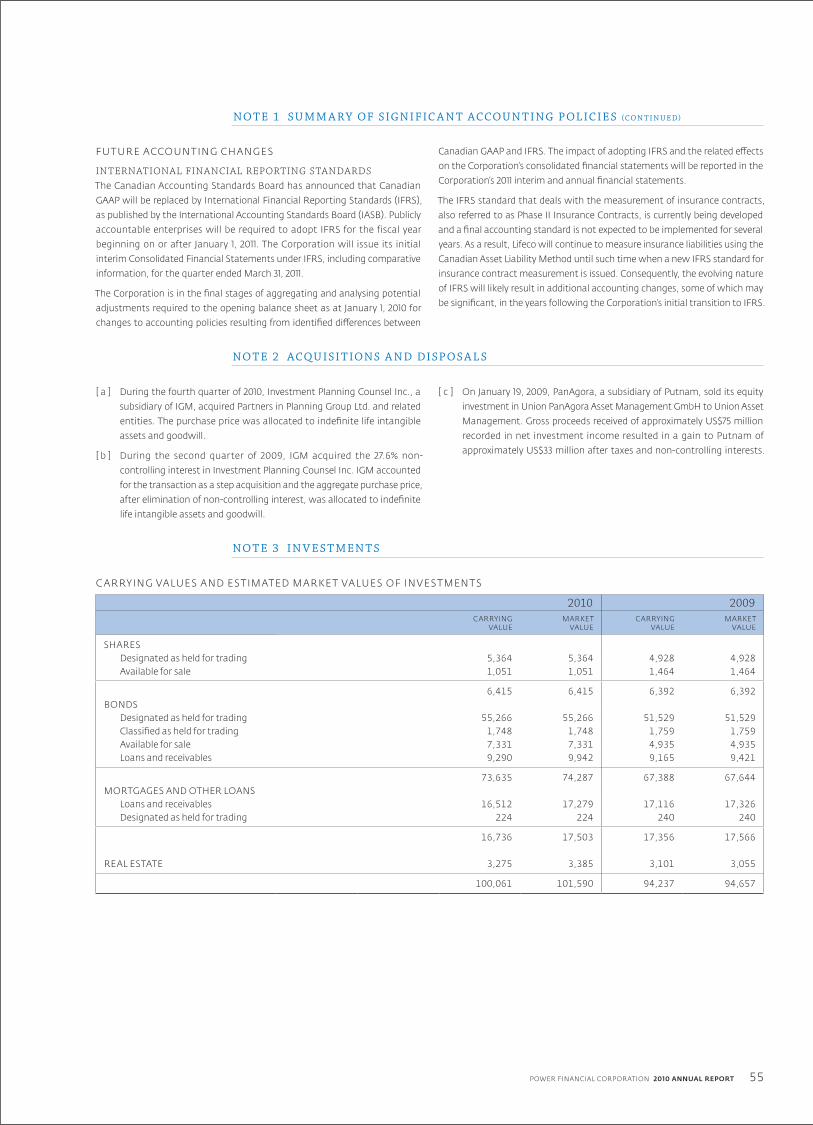
55POWER FINANCIAL CORPORATION 2010 ANNUAL REPORT
FU T URE ACCOUN T ING CHA NGE S
INTERNATIONAL FINANCIAL REPORTING STANDARDSThe Canadian Accounting Standards Board has announced that Canadian
GAAP will be replaced by International Financial Reporting Standards (IFRS),
as published by the International Accounting Standards Board (IASB). Publicly
accountable enterprises will be required to adopt IFRS for the fiscal year
beginning on or after January 1, 2011. The Corporation will issue its initial
interim Consolidated Financial Statements under IFRS, including comparative
information, for the quarter ended March 31, 2011.
The Corporation is in the final stages of aggregating and analysing potential
adjustments required to the opening balance sheet as at January 1, 2010 for
changes to accounting policies resulting from identified differences between
Canadian GAAP and IFRS. The impact of adopting IFRS and the related effects
on the Corporation’s consolidated financial statements will be reported in the
Corporation’s 2011 interim and annual financial statements.
The IFRS standard that deals with the measurement of insurance contracts,
also referred to as Phase II Insurance Contracts, is currently being developed
and a final accounting standard is not expected to be implemented for several
years. As a result, Lifeco will continue to measure insurance liabilities using the
Canadian Asset Liability Method until such time when a new IFRS standard for
insurance contract measurement is issued. Consequently, the evolving nature
of IFRS will likely result in additional accounting changes, some of which may
be significant, in the years following the Corporation’s initial transition to IFRS.
NO T E 2 ACQU I SI T IONS A N D DI SP O S A L S
[ a ] During the fourth quarter of 2010, Investment Planning Counsel Inc., a
subsidiary of IGM, acquired Partners in Planning Group Ltd. and related
entities. The purchase price was allocated to indefinite life intangible
assets and goodwill.
[ b ] During the second quarter of 2009, IGM acquired the 27.6% non-
controlling interest in Investment Planning Counsel Inc. IGM accounted
for the transaction as a step acquisition and the aggregate purchase price,
after elimination of non-controlling interest, was allocated to indefinite
life intangible assets and goodwill.
[ c ] On January 19, 2009, PanAgora, a subsidiary of Putnam, sold its equity
investment in Union PanAgora Asset Management GmbH to Union Asset
Management. Gross proceeds received of approximately US$75 million
recorded in net investment income resulted in a gain to Putnam of
approximately US$33 million after taxes and non-controlling interests.
NO T E 3 I N V E S T M EN T S
C A RRY ING VA LUE S A ND E S T IM AT ED M A RK E T VA LUE S OF IN V E S T MEN T S
2010 2009CARRYING
VALUEMARKET
VALUECARRYING
VALUEMARKET
VALUE
SHARES Designated as held for trading 5,364 5,364 4,928 4,928 Available for sale 1,051 1,051 1,464 1,464
6,415 6,415 6,392 6,392BONDS Designated as held for trading 55,266 55,266 51,529 51,529 Classified as held for trading 1,748 1,748 1,759 1,759 Available for sale 7,331 7,331 4,935 4,935 Loans and receivables 9,290 9,942 9,165 9,421
73,635 74,287 67,388 67,644MORTGAGES AND OTHER LOANS Loans and receivables 16,512 17,279 17,116 17,326 Designated as held for trading 224 224 240 240
16,736 17,503 17,356 17,566
REAL ESTATE 3,275 3,385 3,101 3,055
100,061 101,590 94,237 94,657
NO T E 1 SU M M A RY OF SIGN I F IC A N T ACCOU N T I NG P OL IC I E S (C O N T I N U E D)

56
NOTES TO CONSOLIDATED FINANCIAL STATEMENTS
POWER FINANCIAL CORPORATION 2010 ANNUAL REPORT
NO T E 3 I N V E S T M EN T S (C O N T I N U E D)
Included in investments are the following:
IMPA IRED IN V E S T MEN T S F OR L IFECO
2010 2009GROSS
AMOUNT IMPAIRMENTCARRYING
AMOUNTGROSS
AMOUNT IMPAIRMENTCARRYING
AMOUNT
Impaired amounts by type [ 1 ]
Held for trading 572 (270) 302 517 (278) 239Available for sale 58 (32) 26 55 (36) 19Loans and receivables 114 (64) 50 151 (81) 70
Total 744 (366) 378 723 (395) 328
[ 1 ] Excludes amounts in funds held by ceding insurers of $28 million and impairment of ($17) million at December 31, 2010 and $10 million and ($4) million at December 31, 2009.
Gross amount represents the amortized cost or the principal balance of the
impaired investments.
Impaired investments include $30 million gross amount of capital securities
that have deferred coupons on a non-cumulative basis.
With respect to Lifeco, the impairment charges, net of release of actuarial
default provision and other, amounted to $14 million in 2010 ($74 million
in 2009).
With respect to IGM, shares which have had an unrealized loss for a prolonged
period of time are considered to be other than temporarily impaired.
No impairment charge related to shares was recorded by IGM for the year
2010 ($77 million in 2009).
The allowance for credit losses and changes in the allowance for credit losses related to investments classified as loans and receivables are as follows:
2010 2009Balance, beginning of year 88 68Net provision (recovery) for credit losses (5) 38Write-offs, net of recoveries (8) (8)Other (including foreign exchange rate change) (7) (10)
Balance, end of year 68 88
Lifeco holds bonds and mortgages with restructured terms or which have been exchanged for securities with amended terms. These investments are performing
according to their new terms. As at December 31, 2010, their carrying value is $191 million ($206 million in 2009).
NO T E 4 SEC U R I T I Z AT IONS
IGM securitizes residential mortgages through CMHC utilizing the NHA MBS program or through Canadian bank-sponsored securitization trusts. NHA MBS are
sold to a trust that issues securities to investors through the CMHC-sponsored CMB Program. Pre-tax gains (losses) on the sale of mortgages are reported in net
investment income in the statements of earnings. Securitization activities for the years ended December 31, 2010 and 2009 were as follows:
2010 2009Residential mortgages securitized 1,211 1,332Net cash proceeds 1,203 1,325Fair value of retained interest 44 65Pre-tax gain on sales 24 49
IGM’s retained interest in the securitized loans includes cash reserve accounts and rights to future excess spread. This retained interest is subordinated to the
interests of the related CMHC or Canadian bank-sponsored securitization trusts (CP conduits) and NHA MBS holders (the purchasers). The purchasers do not
have recourse to IGM’s other assets for any failure of the borrowers to pay when due.

57POWER FINANCIAL CORPORATION 2010 ANNUAL REPORT
The present value of future expected cash flows are used to fair value the retained interests. The key economic assumptions at the date of securitization issuances
for CMHC or Canadian bank-sponsored securitization trusts transactions completed during 2010 and 2009 were as follows:
2010 2009Weighted-average
Remaining service life (in years) 4.5 4.4Excess spread 0.80% 1.16%Prepayment rate 15.00% 15.00%Discount rate 1.82% 1.66%Servicing fees 0.15% 0.15%Expected credit losses – –
At December 31, 2010, the fair value of the total retained interests was $107 million ($174 million in 2009). The sensitivity to immediate 10% or 20% adverse changes
to key assumptions was not considered material.
The total loans reported by IGM, the securitized loans serviced by IGM, as well as cash flows related to securitization arrangements are as follows:
2010 2009Mortages 3,819 3,641Investment loans 280 302
4,099 3,943Less: securitized loans serviced 3,478 3,271
Total on-balance sheet loans 621 672
Net cash proceeds 1,203 1,325Cash flows received on retained interests 88 90
NO T E 5 I N V E S T M EN T AT EQU I T Y
2010 2009Carrying value, beginning of year 2,675 2,814Share of operating earnings 120 141Share of Pargesa’s non-operating earnings [ Note 20 ] (5) (70)Share of other comprehensive income (loss) (454) (179)Dividends (57) (31)
Carrying value, end of year 2,279 2,675
Share of equity, end of year 2,278 2,674
At December 31, 2010, Parjointco, 50% held by the Corporation, held a 54.1% equity interest in Pargesa (2009 – 54.1%).
NO T E 6 G O ODW I L L A N D I N TA NGI BL E A S SE T S
G O ODW IL LThe carrying value of goodwill and changes in the carrying value of goodwill are as follows:
2010 2009Balance, beginning of year 8,655 8,613Acquisition[1] 37 32Other, including the effect of foreign exchange 34 10
Balance, end of year 8,726 8,655
[ 1 ] There is no tax-deductible goodwill in 2010 and 2009.
NO T E 4 SEC U R I T I Z AT IONS (C O N T I N U E D)
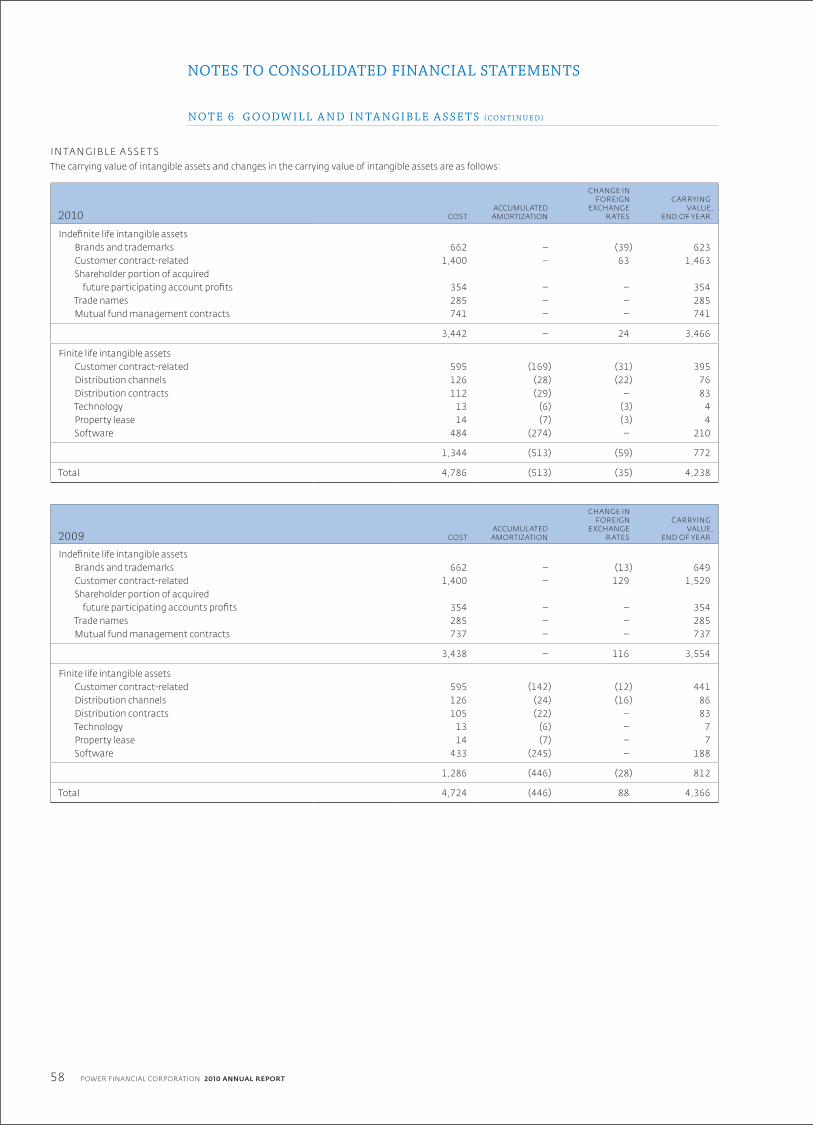
58
NOTES TO CONSOLIDATED FINANCIAL STATEMENTS
POWER FINANCIAL CORPORATION 2010 ANNUAL REPORT
IN TA NGIBL E A SSE T SThe carrying value of intangible assets and changes in the carrying value of intangible assets are as follows:
2010 COSTACCUMULATED
AMORTIZATION
CHANGE IN FOREIGN
EXCHANGE RATES
CARRYINGVALUE,
END OF YEAR
Indefinite life intangible assetsBrands and trademarks 662 – (39) 623Customer contract-related 1,400 – 63 1,463Shareholder portion of acquired
future participating account profits 354 – – 354Trade names 285 – – 285Mutual fund management contracts 741 – – 741
3,442 – 24 3,466
Finite life intangible assetsCustomer contract-related 595 (169) (31) 395Distribution channels 126 (28) (22) 76Distribution contracts 112 (29) – 83Technology 13 (6) (3) 4Property lease 14 (7) (3) 4Software 484 (274) – 210
1,344 (513) (59) 772
Total 4,786 (513) (35) 4,238
2009 COSTACCUMULATED
AMORTIZATION
CHANGE INFOREIGN
EXCHANGERATES
CARRYING VALUE,
END OF YEAR
Indefinite life intangible assetsBrands and trademarks 662 – (13) 649Customer contract-related 1,400 – 129 1,529Shareholder portion of acquired
future participating accounts profits 354 – – 354Trade names 285 – – 285Mutual fund management contracts 737 – – 737
3,438 – 116 3,554
Finite life intangible assetsCustomer contract-related 595 (142) (12) 441Distribution channels 126 (24) (16) 86Distribution contracts 105 (22) – 83Technology 13 (6) – 7Property lease 14 (7) – 7Software 433 (245) – 188
1,286 (446) (28) 812
Total 4,724 (446) 88 4,366
NO T E 6 G O ODW I L L A N D I N TA NGI BL E A S SE T S (C O N T I N U E D)
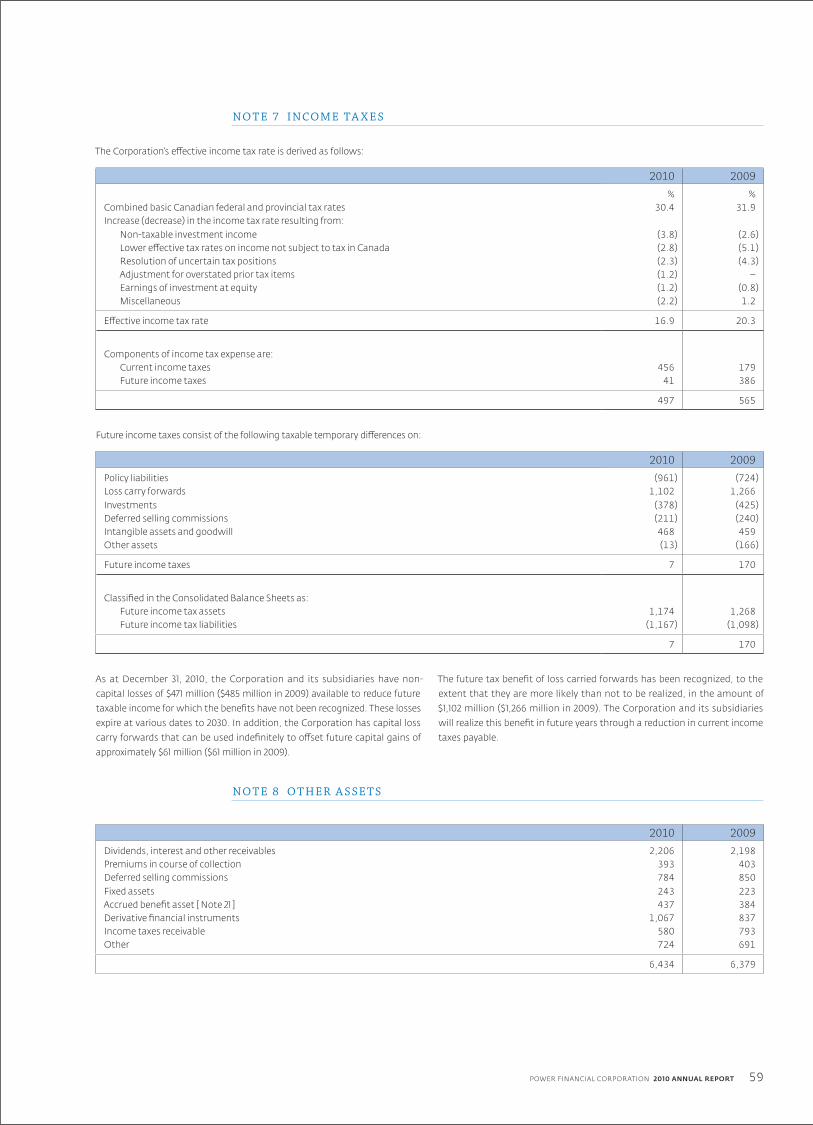
59POWER FINANCIAL CORPORATION 2010 ANNUAL REPORT
The Corporation’s effective income tax rate is derived as follows:
2010 2009% %
Combined basic Canadian federal and provincial tax rates 30.4 31.9Increase (decrease) in the income tax rate resulting from:
Non-taxable investment income (3.8) (2.6)Lower effective tax rates on income not subject to tax in Canada (2.8) (5.1)Resolution of uncertain tax positions (2.3) (4.3)Adjustment for overstated prior tax items (1.2) –Earnings of investment at equity (1.2) (0.8)Miscellaneous (2.2) 1.2
Effective income tax rate 16.9 20.3
Components of income tax expense are:Current income taxes 456 179Future income taxes 41 386
497 565
Future income taxes consist of the following taxable temporary differences on:
2010 2009Policy liabilities (961) (724)Loss carry forwards 1,102 1,266Investments (378) (425)Deferred selling commissions (211) (240)Intangible assets and goodwill 468 459Other assets (13) (166)
Future income taxes 7 170
Classified in the Consolidated Balance Sheets as:Future income tax assets 1,174 1,268Future income tax liabilities (1,167) (1,098)
7 170
As at December 31, 2010, the Corporation and its subsidiaries have non-
capital losses of $471 million ($485 million in 2009) available to reduce future
taxable income for which the benefits have not been recognized. These losses
expire at various dates to 2030. In addition, the Corporation has capital loss
carry forwards that can be used indefinitely to offset future capital gains of
approximately $61 million ($61 million in 2009).
The future tax benefit of loss carried forwards has been recognized, to the
extent that they are more likely than not to be realized, in the amount of
$1,102 million ($1,266 million in 2009). The Corporation and its subsidiaries
will realize this benefit in future years through a reduction in current income
taxes payable.
NO T E 8 O T H ER A S SE T S
2010 2009Dividends, interest and other receivables 2,206 2,198Premiums in course of collection 393 403Deferred selling commissions 784 850Fixed assets 243 223Accrued benefit asset [ Note 21 ] 437 384Derivative financial instruments 1,067 837Income taxes receivable 580 793Other 724 691
6,434 6,379
NO T E 7 I NCOM E TA X E S
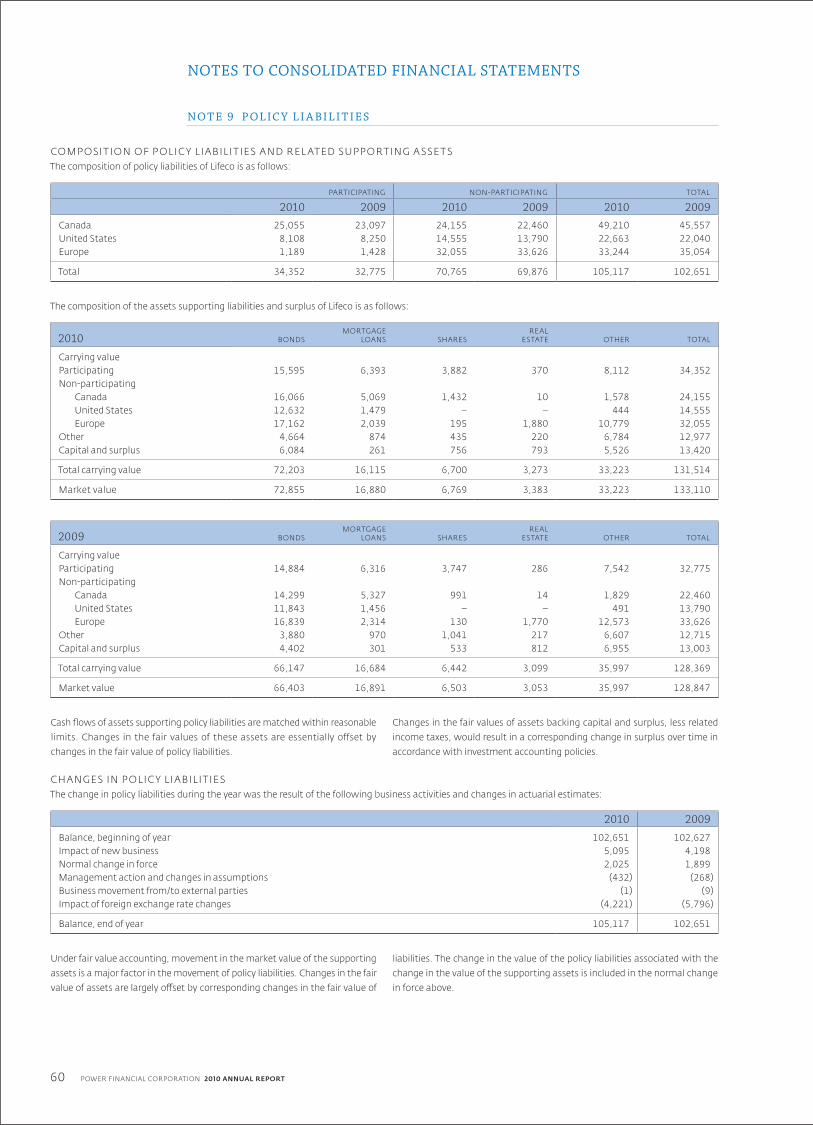
60
NOTES TO CONSOLIDATED FINANCIAL STATEMENTS
POWER FINANCIAL CORPORATION 2010 ANNUAL REPORT
COMP OSI T ION OF P OL IC Y L IA BIL I T IE S A ND REL AT ED SUPP ORT ING A SSE T SThe composition of policy liabilities of Lifeco is as follows:
PARTICIPATING NON-PARTICIPATING TOTAL
2010 2009 2010 2009 2010 2009Canada 25,055 23,097 24,155 22,460 49,210 45,557United States 8,108 8,250 14,555 13,790 22,663 22,040Europe 1,189 1,428 32,055 33,626 33,244 35,054
Total 34,352 32,775 70,765 69,876 105,117 102,651
The composition of the assets supporting liabilities and surplus of Lifeco is as follows:
2010 BONDS MORTGAGE
LOANS SHARESREAL
ESTATE OTHER TOTAL
Carrying value Participating 15,595 6,393 3,882 370 8,112 34,352Non-participating
Canada 16,066 5,069 1,432 10 1,578 24,155United States 12,632 1,479 – – 444 14,555Europe 17,162 2,039 195 1,880 10,779 32,055
Other 4,664 874 435 220 6,784 12,977Capital and surplus 6,084 261 756 793 5,526 13,420
Total carrying value 72,203 16,115 6,700 3,273 33,223 131,514
Market value 72,855 16,880 6,769 3,383 33,223 133,110
2009 BONDS MORTGAGE
LOANS SHARESREAL
ESTATE OTHER TOTAL
Carrying value Participating 14,884 6,316 3,747 286 7,542 32,775Non-participating
Canada 14,299 5,327 991 14 1,829 22,460United States 11,843 1,456 – – 491 13,790Europe 16,839 2,314 130 1,770 12,573 33,626
Other 3,880 970 1,041 217 6,607 12,715Capital and surplus 4,402 301 533 812 6,955 13,003
Total carrying value 66,147 16,684 6,442 3,099 35,997 128,369
Market value 66,403 16,891 6,503 3,053 35,997 128,847
Cash flows of assets supporting policy liabilities are matched within reasonable
limits. Changes in the fair values of these assets are essentially offset by
changes in the fair value of policy liabilities.
Changes in the fair values of assets backing capital and surplus, less related
income taxes, would result in a corresponding change in surplus over time in
accordance with investment accounting policies.
CHA NGE S IN P OL IC Y L IA BIL I T IE SThe change in policy liabilities during the year was the result of the following business activities and changes in actuarial estimates:
2010 2009
Balance, beginning of year 102,651 102,627Impact of new business 5,095 4,198Normal change in force 2,025 1,899Management action and changes in assumptions (432) (268)Business movement from/to external parties (1) (9)Impact of foreign exchange rate changes (4,221) (5,796)
Balance, end of year 105,117 102,651
Under fair value accounting, movement in the market value of the supporting
assets is a major factor in the movement of policy liabilities. Changes in the fair
value of assets are largely offset by corresponding changes in the fair value of
liabilities. The change in the value of the policy liabilities associated with the
change in the value of the supporting assets is included in the normal change
in force above.
NO T E 9 P OL IC Y L I A BI L I T I E S

61POWER FINANCIAL CORPORATION 2010 ANNUAL REPORT
In 2010, the major contributors to the increase in policy liabilities was the
impact of new business and the normal change in the in-force business
partially offset by the impact of foreign exchange rates.
Lifeco’s non participating policy liabilities decreased by $427 million in 2010 due
to management actions and assumption changes including a $246 million
decrease in Canada, a $126 million decrease in Europe and a $55 million
decrease in the United States. The decrease in Canada was primarily due to
updated expenses and taxes in individual insurance ($86 million decrease),
improved individual life mortality ($64 million decrease), improved group
insurance morbidity ($62 million decrease), modelling refinements across the
Canadian segment ($56 million decrease) and reduced provisions for asset
liability matching ($49 million decrease), partially offset by increased provisions
for policyholder behaviour in individual insurance ($69 million increase). The
decrease in Europe was primarily due to reduced provisions for asset liability
matching ($127 million decrease), modelling refinements across the division
($97 million decrease) and updated expenses ($23 million decrease), partially
offset by strengthened reinsurance life mortality ($71 million increase),
strengthened longevity ($16 million increase), strengthened group insurance
morbidity ($13 million increase), increased provisions for policyholder behaviour
($10 million increase) and asset default ($8 million increase). The decrease in
the United States was primarily due to improved life mortality ($52 million
decrease), improved longevity ($6 million decrease), modelling refinements
($4 million decrease), partially offset by increased provisions for policyholder
behaviour ($8 million increase).
Lifeco’s participating policy liabilities decreased by $5 million in 2010 due to
management actions and assumption changes. The decrease was primarily
due to updated expenses ($261 million decrease), improved investment returns
($20 million decrease), and improved individual life mortality ($13 million
decrease), partially offset by modelling refinements ($213 million increase),
increases in the provision for future policyholder dividends ($66 million increase)
and increased provisions for policyholder behaviour ($10 million increase).
In 2009, the major contributors to the increase in policy liabilities were the
impact of new business and the normal change in the in-force business, almost
totally offset by the impact of foreign exchange rates.
Lifeco’s non-participating policy liabilities decreased by $194 million in 2009
due to management actions and assumption changes, including a $135 million
decrease in Canada, a $58 million decrease in Europe and a $1 million decrease
in the United States. The decrease in Canada was primarily due to improved
individual life mortality ($115 million decrease) updated expenses ($48 million
decrease) and modelling refinements in individual life and annuities ($32 million
decrease), partially offset by the future tax impact of a change in asset mix
targets for long-tail liabilities ($52 million increase). The decrease in Europe was
primarily due to reduced provisions for asset liability matching ($199 million
decrease), modelling refinements in annuities ($97 million decrease) and
improved life mortality ($47 million decrease), partially offset by strengthening
of asset default and expense ($158 million increase), modelling refinements
in reinsurance ($77 million increase), strengthened administration expenses
in Europe ($30 million increase) and strengthened longevity ($20 million
increase). The decrease in the United States was primarily due to reduced
provisions for asset liability matching ($32 million decrease) and improved
life mortality ($18 million decrease), partially offset by strengthening of asset
default ($32 million increase) and strengthened longevity ($13 million increase).
Lifeco’s participating policy liabilities decreased by $74 million in 2009
due to management actions and assumption changes. This decrease was
primarily due to a decrease in the provision for future policyholder dividends
($1,495 million decrease) and improved life mortality ($168 million decrease),
partially offset by lowered investment returns ($1,588 million increase).
AC T UA RIA L A SSUMP T IONSIn the computation of policy liabilities, valuation assumptions have been
made regarding rates of mortality/morbidity, investment returns, levels of
operating expenses, rates of policy termination and rates of utilization of
elective policy options or provisions. The valuation assumptions use best
estimates of future experience together with a margin for adverse deviation.
These margins are necessary to provide for possibilities of misestimation and/or
future deterioration in the best estimate assumptions and provide reasonable
assurance that policy liabilities cover a range of possible outcomes. Margins
are reviewed periodically for continued appropriateness.
The methods for arriving at these valuation assumptions are outlined below:
MORTALITYA life insurance mortality study is carried out annually for each major block
of insurance business. The results of each study are used to update Lifeco’s
experience valuation mortality tables for that business. When there is
insufficient data, use is made of the latest industry experience to derive an
appropriate valuation mortality assumption. Although mortality improvements
have been observed for many years, for life insurance valuation the mortality
provisions (including margin) do not allow for future improvements. In addition,
appropriate provisions have been made for future mortality deterioration on
term insurance. A 2% increase in the best estimate assumption would increase
non-participating policy liabilities by approximately $216 million, causing a
decrease in net earnings of Lifeco of approximately $159 million (Power
Financial’s share – $112 million).
Annuitant mortality is also studied regularly and the results used to modify
established industry experience annuitant mortality tables. Mortality
improvement has been projected to occur throughout future years for
annuitants. A 2% decrease in the best estimate assumption would increase non-
participating policy liabilities by approximately $217 million, causing a decrease
in net earnings of Lifeco of approximately $172 million (Power Financial’s
share – $121 million).
MORBIDITYLifeco uses industry-developed experience tables modified to reflect emerging
Lifeco experience. Both claim incidence and termination are monitored regularly
and emerging experience is factored into the current valuation. For products
for which morbidity is a significant assumption, a 5% decrease in best estimate
termination assumptions for claim liabilities and a 5% increase in best estimate
incidence assumptions for active life liabilities would increase non-participating
policy liabilities by approximately $213 million, causing a decrease in net earnings
of Lifeco of approximately $151 million (Power Financial’s share – $107 million).
PROPERTY AND CASUALTY REINSURANCEPolicy liabilities for property and casualty reinsurance written by London
Reinsurance Group Inc. (LRG), a subsidiary of London Life, are determined
using accepted actuarial practices for property and casualty insurers in Canada.
Reflecting the long-term nature of the business, policy liabilities have been
established using cash flow valuation techniques, including discounting.
NO T E 9 P OL IC Y L I A BI L I T I E S (C O N T I N U E D)

62
NOTES TO CONSOLIDATED FINANCIAL STATEMENTS
POWER FINANCIAL CORPORATION 2010 ANNUAL REPORT
The policy liabilities are based on cession statements provided by ceding
companies. In certain instances, LRG management adjusts cession statement
amounts to reflect management’s interpretation of the treaty. Differences
will be resolved via audits and other loss mitigation activities. In addition,
policy liabilities also include an amount for incurred but not reported losses
which may differ significantly from the ultimate loss development. The
estimates and underlying methodology are continually reviewed and updated,
and adjustments to estimates are reflected in earnings. LRG analyses the
emergence of claims experience against expected assumptions for each
reinsurance contract separately and at the portfolio level. If necessary, a more
in-depth analysis is undertaken of the cedant experience.
INVESTMENT RETURNSThe assets which correspond to the different liability categories are segmented.
For each segment, projected cash flows from the current assets and liabilities
are used in the Canadian Asset Liability Method to determine policy liabilities.
Cash flows from assets are reduced to provide for asset default losses. Testing
under several interest rate and equity scenarios (including increasing and
decreasing rates) is done to provide for reinvestment risk (refer to Note 17).
EXPENSESContractual policy expenses (e.g., sales commissions) and tax expenses are
reflected on a best estimate basis. Expense studies for indirect operating
expenses are updated regularly to determine an appropriate estimate of future
operating expenses for the liability type being valued. Improvements in unit
operating expenses are not projected. An inflation assumption is incorporated
in the estimate of future operating expenses consistent with the interest rate
scenarios projected under the Canadian Asset Liability Method as inflation
is assumed to be correlated with new money interest rates. A 5% increase
in the best estimate maintenance unit expense assumption would increase
the non-participating policy liabilities by approximately $71 million, causing a
decrease in net earnings of Lifeco of approximately $51 million (Power Financial’s
share – $36 million).
POLICY TERMINATIONStudies to determine rates of policy termination are updated regularly to
form the basis of this estimate. Industry data is also available and is useful
where Lifeco has no experience with specific types of policies or its exposure is
limited. Lifeco has significant exposures in respect of the T-100 and Level Cost
of Insurance Universal Life products in Canada and policy termination rates at
the renewal period for renewable term policies in Canada and Reinsurance.
Industry experience has guided Lifeco’s persistency assumption for these
products as Lifeco’s own experience is very limited. A 10% adverse change
in the best estimate policy termination assumption would increase non-
participating policy liabilities by approximately $452 million, causing a decrease
in net earnings of Lifeco of approximately $320 million (Power Financial’s share
– $226 million).
UTILIZATION OF ELECTIVE POLICY OPTIONSThere are a wide range of elective options embedded in the policies issued by
Lifeco. Examples include term renewals, conversion to whole life insurance
(term insurance), settlement annuity purchase at guaranteed rates (deposit
annuities) and guarantee resets (segregated fund maturity guarantees). The
assumed rates of utilization are based on Lifeco or industry experience when it
exists and, when not, on judgment considering incentives to utilize the option.
Generally speaking, whenever it is clearly in the best interests of an informed
policyholder to utilize an option, then it is assumed to be elected.
POLICYHOLDER DIVIDENDS AND ADJUSTABLE POLICY FEATURESFuture policy holder dividends and other adjustable policy features are included
in the determination of policy liabilities with the assumption that policyholder
dividends or adjustable benefits will change in the future in response to the
relevant experience. The dividend and policy adjustments are determined
consistent with policyholders’ reasonable expectations, such expectations
being influenced by the participating policyholder dividend policies and/or
policyholder communications, marketing material and past practice. It is
Lifeco’s expectation that changes will occur in policyholder dividend scales
or adjustable benefits for participating or adjustable business respectively,
corresponding to changes in the best estimate assumptions, resulting in
an immaterial net change in policy liabilities. Where underlying guarantees
may limit the ability to pass all of this experience back to the policyholder,
the impact of this non-adjustability impacting shareholder earnings is reflected
in the impacts of changes in best estimate assumptions above.
CEDED REINSURANCEMaximum limits per insured life benefit amount (which vary by line of business)
are established for life and health insurance, and reinsurance is purchased for
amounts in excess of those limits.
Reinsurance costs and recoveries as defined by the reinsurance agreement are
reflected in the valuation with these costs and recoveries being appropriately
calibrated to the direct assumptions.
Reinsurance contracts do not relieve Lifeco from its obligations to policyholders.
Failure of reinsurers to honour their obligations could result in losses to Lifeco.
Lifeco evaluates the financial condition of its reinsurers to minimize its exposure
to significant losses from reinsurer insolvencies.
As a result of reinsurance, policy liabilities have been reduced by the following amounts:
2010 2009Participating 23 17Non-participating 2,508 2,768
2,531 2,785
Certain of the reinsurance contracts are on a funds-withheld basis where Lifeco retains the assets supporting the reinsured policy liabilities, thus minimizing the
exposure to significant losses from reinsurer insolvency on those contracts.
NO T E 9 P OL IC Y L I A BI L I T I E S (C O N T I N U E D)
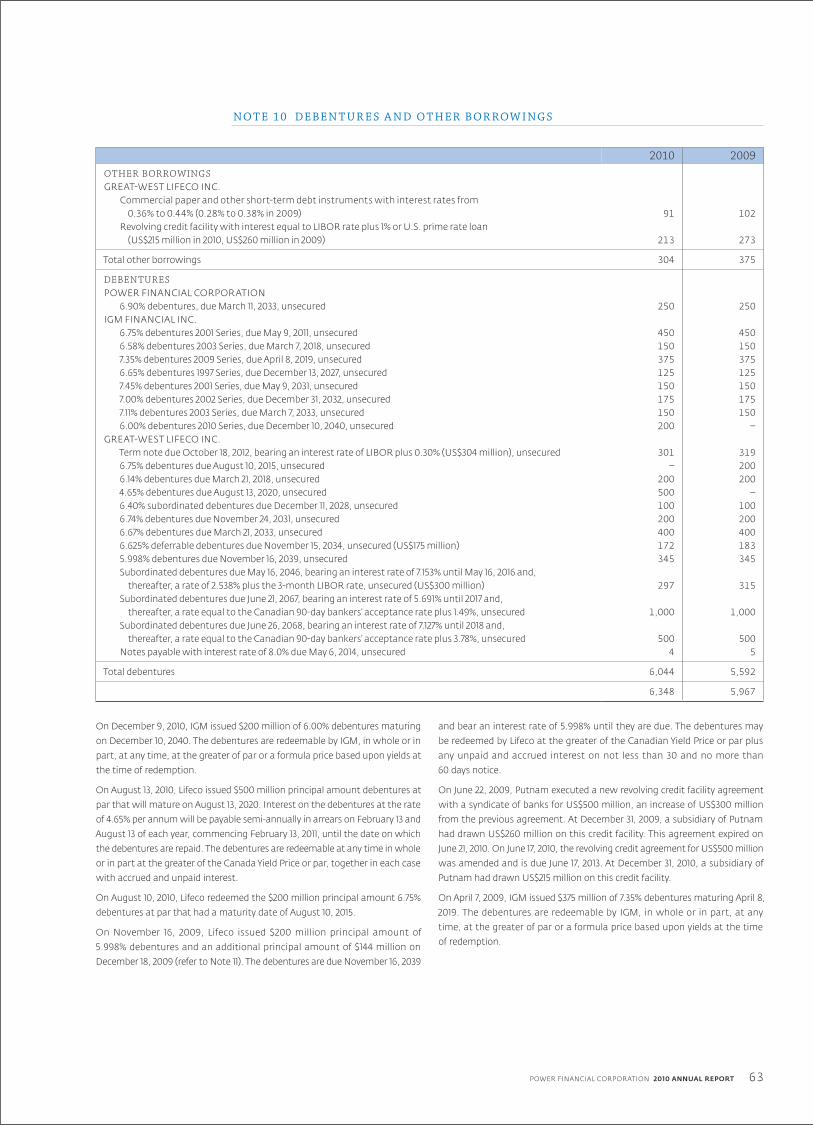
63POWER FINANCIAL CORPORATION 2010 ANNUAL REPORT
NO T E 10 DEBEN T U R E S A N D O T H ER B OR ROW I NG S
2010 2009OTHER BORROWINGSGREAT-WEST LIFECO INC.
Commercial paper and other short-term debt instruments with interest rates from 0.36% to 0.44% (0.28% to 0.38% in 2009) 91 102
Revolving credit facility with interest equal to LIBOR rate plus 1% or U.S. prime rate loan (US$215 million in 2010, US$260 million in 2009) 213 273
Total other borrowings 304 375
DEBENTURESPOWER FINANCIAL CORPORATION
6.90% debentures, due March 11, 2033, unsecured 250 250IGM FINANCIAL INC.
6.75% debentures 2001 Series, due May 9, 2011, unsecured 450 4506.58% debentures 2003 Series, due March 7, 2018, unsecured 150 1507.35% debentures 2009 Series, due April 8, 2019, unsecured 375 3756.65% debentures 1997 Series, due December 13, 2027, unsecured 125 1257.45% debentures 2001 Series, due May 9, 2031, unsecured 150 1507.00% debentures 2002 Series, due December 31, 2032, unsecured 175 1757.11% debentures 2003 Series, due March 7, 2033, unsecured 150 1506.00% debentures 2010 Series, due December 10, 2040, unsecured 200 –
GREAT-WEST LIFECO INC.Term note due October 18, 2012, bearing an interest rate of LIBOR plus 0.30% (US$304 million), unsecured 301 3196.75% debentures due August 10, 2015, unsecured – 2006.14% debentures due March 21, 2018, unsecured 200 2004.65% debentures due August 13, 2020, unsecured 500 –6.40% subordinated debentures due December 11, 2028, unsecured 100 1006.74% debentures due November 24, 2031, unsecured 200 2006.67% debentures due March 21, 2033, unsecured 400 4006.625% deferrable debentures due November 15, 2034, unsecured (US$175 million) 172 1835.998% debentures due November 16, 2039, unsecured 345 345Subordinated debentures due May 16, 2046, bearing an interest rate of 7.153% until May 16, 2016 and,
thereafter, a rate of 2.538% plus the 3-month LIBOR rate, unsecured (US$300 million) 297 315Subordinated debentures due June 21, 2067, bearing an interest rate of 5.691% until 2017 and,
thereafter, a rate equal to the Canadian 90-day bankers’ acceptance rate plus 1.49%, unsecured 1,000 1,000Subordinated debentures due June 26, 2068, bearing an interest rate of 7.127% until 2018 and,
thereafter, a rate equal to the Canadian 90-day bankers’ acceptance rate plus 3.78%, unsecured 500 500Notes payable with interest rate of 8.0% due May 6, 2014, unsecured 4 5
Total debentures 6,044 5,592
6,348 5,967
On December 9, 2010, IGM issued $200 million of 6.00% debentures maturing
on December 10, 2040. The debentures are redeemable by IGM, in whole or in
part, at any time, at the greater of par or a formula price based upon yields at
the time of redemption.
On August 13, 2010, Lifeco issued $500 million principal amount debentures at
par that will mature on August 13, 2020. Interest on the debentures at the rate
of 4.65% per annum will be payable semi-annually in arrears on February 13 and
August 13 of each year, commencing February 13, 2011, until the date on which
the debentures are repaid. The debentures are redeemable at any time in whole
or in part at the greater of the Canada Yield Price or par, together in each case
with accrued and unpaid interest.
On August 10, 2010, Lifeco redeemed the $200 million principal amount 6.75%
debentures at par that had a maturity date of August 10, 2015.
On November 16, 2009, Lifeco issued $200 million principal amount of
5.998% debentures and an additional principal amount of $144 million on
December 18, 2009 (refer to Note 11). The debentures are due November 16, 2039
and bear an interest rate of 5.998% until they are due. The debentures may
be redeemed by Lifeco at the greater of the Canadian Yield Price or par plus
any unpaid and accrued interest on not less than 30 and no more than
60 days notice.
On June 22, 2009, Putnam executed a new revolving credit facility agreement
with a syndicate of banks for US$500 million, an increase of US$300 million
from the previous agreement. At December 31, 2009, a subsidiary of Putnam
had drawn US$260 million on this credit facility. This agreement expired on
June 21, 2010. On June 17, 2010, the revolving credit agreement for US$500 million
was amended and is due June 17, 2013. At December 31, 2010, a subsidiary of
Putnam had drawn US$215 million on this credit facility.
On April 7, 2009, IGM issued $375 million of 7.35% debentures maturing April 8,
2019. The debentures are redeemable by IGM, in whole or in part, at any
time, at the greater of par or a formula price based upon yields at the time
of redemption.
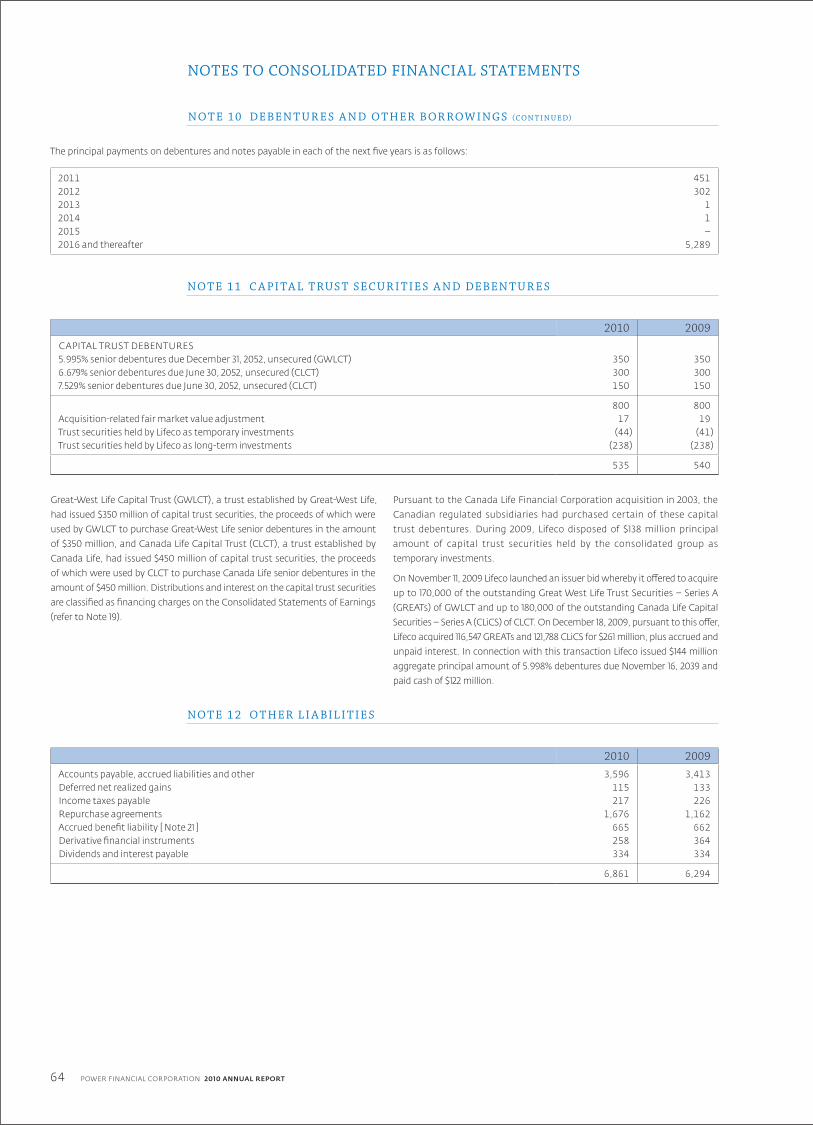
64
NOTES TO CONSOLIDATED FINANCIAL STATEMENTS
POWER FINANCIAL CORPORATION 2010 ANNUAL REPORT
The principal payments on debentures and notes payable in each of the next five years is as follows:
2011 4512012 3022013 12014 12015 –2016 and thereafter 5,289
NO T E 11 C A PI TA L T RUS T SEC U R I T I E S A N D DEBEN T U R E S
2010 2009CAPITAL TRUST DEBENTURES5.995% senior debentures due December 31, 2052, unsecured (GWLCT) 350 3506.679% senior debentures due June 30, 2052, unsecured (CLCT) 300 3007.529% senior debentures due June 30, 2052, unsecured (CLCT) 150 150
800 800Acquisition-related fair market value adjustment 17 19Trust securities held by Lifeco as temporary investments (44) (41)Trust securities held by Lifeco as long-term investments (238) (238)
535 540
Great-West Life Capital Trust (GWLCT), a trust established by Great-West Life,
had issued $350 million of capital trust securities, the proceeds of which were
used by GWLCT to purchase Great-West Life senior debentures in the amount
of $350 million, and Canada Life Capital Trust (CLCT), a trust established by
Canada Life, had issued $450 million of capital trust securities, the proceeds
of which were used by CLCT to purchase Canada Life senior debentures in the
amount of $450 million. Distributions and interest on the capital trust securities
are classified as financing charges on the Consolidated Statements of Earnings
(refer to Note 19).
Pursuant to the Canada Life Financial Corporation acquisition in 2003, the
Canadian regulated subsidiaries had purchased certain of these capital
trust debentures. During 2009, Lifeco disposed of $138 million principal
amount of capital trust securities held by the consolidated group as
temporary investments.
On November 11, 2009 Lifeco launched an issuer bid whereby it offered to acquire
up to 170,000 of the outstanding Great West Life Trust Securities – Series A
(GREATs) of GWLCT and up to 180,000 of the outstanding Canada Life Capital
Securities – Series A (CLiCS) of CLCT. On December 18, 2009, pursuant to this offer,
Lifeco acquired 116,547 GREATs and 121,788 CLiCS for $261 million, plus accrued and
unpaid interest. In connection with this transaction Lifeco issued $144 million
aggregate principal amount of 5.998% debentures due November 16, 2039 and
paid cash of $122 million.
NO T E 1 2 O T H ER L I A BI L I T I E S
2010 2009Accounts payable, accrued liabilities and other 3,596 3,413Deferred net realized gains 115 133Income taxes payable 217 226Repurchase agreements 1,676 1,162Accrued benefit liability [ Note 21 ] 665 662Derivative financial instruments 258 364Dividends and interest payable 334 334
6,861 6,294
NO T E 10 DEBEN T U R E S A N D O T H ER B OR ROW I NG S (C O N T I N U E D)

65POWER FINANCIAL CORPORATION 2010 ANNUAL REPORT
NO T E 13 NON- CON T ROL L I NG I N T ER E S T S
2010 2009Non-controlling interests include
Participating policyholders 2,013 2,004Preferred shareholders of subsidiaries 2,159 2,014Common shareholders of subsidiaries 4,884 4,860
9,056 8,878
Earnings attributable to non-controlling interests includeEarnings attributable to participating policyholders 2 15Dividends to preferred shareholders of subsidiaries 110 87Earnings attributable to common shareholders of subsidiaries 748 676
860 778
NO T E 14 S TAT ED C A PI TA L
AU T HORIZEDUnlimited number of first preferred shares, issuable in series, of second preferred shares, issuable in series and of common shares.
ISSUED A ND OU T S TA NDING
2010 2009NUMBER OF
SHARESSTATED
CAPITALNUMBER OF
SHARESSTATED
CAPITAL
PREFERRED SHARES (CLASSIFIED AS LIABILITIES)Series C First Preferred Shares [ i ] – – 6,000,000 150Series J First Preferred Shares [ ii ] – – 6,000,000 150
– 300
PREFERRED SHARES (PERPETUAL)Series A First Preferred Shares [ iii ] 4,000,000 100 4,000,000 100Series D First Preferred Shares [ iv ] 6,000,000 150 6,000,000 150Series E First Preferred Shares [ v ] 8,000,000 200 8,000,000 200Series F First Preferred Shares [ vi ] 6,000,000 150 6,000,000 150Series H First Preferred Shares [ vii ] 6,000,000 150 6,000,000 150Series I First Preferred Shares [ viii ] 8,000,000 200 8,000,000 200Series K First Preferred Shares [ ix ] 10,000,000 250 10,000,000 250Series L First Preferred Shares [ x ] 8,000,000 200 8,000,000 200Series M First Preferred Shares [ xi ] 7,000,000 175 7,000,000 175Series O First Preferred Shares [ xii ] 6,000,000 150 6,000,000 150Series P First Preferred Shares [ xiii ] 11,200,000 280 – –
2,005 1,725
Common Shares [ xiv ] 708,013,680 636 705,726,680 605
[ i ] On October 31, 2010, the Corporation redeemed all its outstanding 5.20%
Non-Cumulative, Series C First Preferred Shares at a redemption price of
$25.40 per share, for a total consideration of $152 million.
[ ii ] On July 30, 2010, the Corporation redeemed all its outstanding 4.70%
Non-Cumulative, Series J First Preferred Shares at a redemption price of
$25.50 per share, for a total consideration of $153 million.
[ iii ] The Series A First Preferred Shares are entitled to an annual cumulative
dividend at a floating rate equal to 70% of the prime rate of two major
Canadian chartered banks and are redeemable, at the Corporation’s
option, at $25.00 per share.
[ iv ] The 5.50% Non-Cumulative First Preferred Shares, Series D are entitled
to fixed non-cumulative preferential cash dividends at a rate equal to
$1.375 per share per annum. On and after January 31, 2013, the Corporation
may redeem for cash the Series D First Preferred Shares in whole or in
part, at the Corporation’s option, at $25.00 per share together with all
declared and unpaid dividends to, but excluding, the date of redemption.
[ v ] The 5.25% Non-Cumulative First Preferred Shares, Series E are entitled
to fixed non-cumulative preferential cash dividends at a rate equal to
$1.3125 per share per annum. The Corporation may redeem for cash the
Series E First Preferred Shares in whole or in part, at the Corporation’s
option, at $25.00 per share together with all declared and unpaid
dividends to, but excluding, the date of redemption.
66
NOTES TO CONSOLIDATED FINANCIAL STATEMENTS
POWER FINANCIAL CORPORATION 2010 ANNUAL REPORT
[ vi ] The 5.90% Non-Cumulative First Preferred Shares, Series F are entitled to
fixed non-cumulative preferential cash dividends at a rate equal to $1.475
per share per annum. The Corporation may redeem for cash the Series F
First Preferred Shares in whole or in part, at the Corporation’s option, at
$25.25 per share if redeemed prior to July 17, 2011 and $25.00 if redeemed
thereafter, in each case together with all declared and unpaid dividends
to, but excluding, the date of redemption.
[ vii ] The 5.75% Non-Cumulative First Preferred Shares, Series H are entitled to
fixed non-cumulative preferential cash dividends at a rate equal to $1.4375
per share per annum. The Corporation may redeem for cash the Series
H First Preferred Shares in whole or in part, at the Corporation’s option,
at $25.25 per share if redeemed prior to December 10, 2011 and $25.00 if
redeemed thereafter, in each case together with all declared and unpaid
dividends to, but excluding, the date of redemption.
[ viii ] The 6.00% Non-Cumulative First Preferred Shares, Series I are entitled
to fixed non-cumulative preferential cash dividends at a rate equal to
$1.50 per share per annum. The Corporation may redeem for cash the
Series I First Preferred Shares in whole or in part, at the Corporation’s
option, at $25.50 per share if redeemed prior to April 30, 2011, $25.25 if
redeemed thereafter and prior to April 30, 2012 and $25.00 if redeemed
thereafter, in each case together with all declared and unpaid dividends
to, but excluding, the date of redemption.
[ ix ] The 4.95% Non-Cumulative First Preferred Shares, Series K are entitled
to fixed non-cumulative preferential cash dividends at a rate equal to
$1.2375 per share per annum. The Corporation may redeem for cash the
Series K First Preferred Shares in whole or in part, at the Corporation’s
option, at $26.00 per share if redeemed prior to October 31, 2011, $25.75
if redeemed thereafter and prior to October 31, 2012, $25.50 if redeemed
thereafter and prior to October 31, 2013, $25.25 if redeemed thereafter and
prior to October 31, 2014 and $25.00 if redeemed thereafter, in each case
together with all declared and unpaid dividends to, but excluding, the
date of redemption.
[ x ] The 5.10% Non-Cumulative First Preferred Shares, Series L are entitled to
fixed non-cumulative preferential cash dividends at a rate equal to $1.2750
per share per annum. On and after October 31, 2011, the Corporation may
redeem for cash the Series L First Preferred Shares in whole or in part, at
the Corporation’s option, at $26.00 per share if redeemed prior to October
31, 2012, $25.75 if redeemed thereafter and prior to October 31, 2013, $25.50
if redeemed thereafter and prior to October 31, 2014, $25.25 if redeemed
thereafter and prior to October 31, 2015, $25.00 if redeemed thereafter,
in each case together with all declared and unpaid dividends to, but
excluding, the date of redemption.
[ xi ] The 6.00% Non-Cumulative First Preferred Shares, Series M are entitled
to fixed non-cumulative preferential cash dividends at a rate equal to
$1.50 per share per annum. On January 31, 2014 and on January 31 every
five years thereafter, the Corporation may redeem for cash the Series M
First Preferred shares in whole or in part, at the Corporation’s option, at
$25.00 per share plus all declared and unpaid dividends to the date fixed
for redemption, or the Series M First Preferred Shares are convertible to
Non-Cumulative Floating Rate First Preferred Shares, Series N, at the
option of the holders on January 31, 2014 or on January 31 every five years
thereafter.
[ xii ] The 5.80% Non-Cumulative First Preferred Shares, Series O are entitled to
fixed non-cumulative preferential cash dividends at a rate equal to $1.45
per share per annum. On and after October 31, 2014, the Corporation
may redeem for cash the Series O First Preferred Shares in whole or in
part, at the Corporation’s option, at $26.00 per share if redeemed prior to
October 31, 2015, $25.75 if redeemed on or after October 31, 2015 and prior
to October 31, 2016, $25.50 if redeemed on or after October 31, 2016 and
prior to October 31, 2017, $25.25 if redeemed on or after October 31, 2017
and prior to October 31, 2018 and $25.00 if redeemed on or after October
31, 2018, in each case together with all declared and unpaid dividends to,
but excluding, the date of redemption.
[ xiii ] In the second quarter of 2010, the Corporation issued 11,200,000 4.40%
Non-Cumulative 5-Year Rate Reset First Preferred Shares, Series P for
cash proceeds of $280 million. The 4.40% Non-Cumulative First Preferred
Shares, Series P are entitled to fixed non-cumulative preferential cash
dividends at a rate equal to $1.10 per share per annum. On January 31,
2016 and on January 31 every five years thereafter, the Corporation may
redeem for cash the Series P First Preferred Shares in whole or in part,
at the Corporation’s option, at $25.00 per share plus all declared and
unpaid dividends to the date fixed for redemption, or the Series P First
Preferred Shares are convertible to Non-Cumulative Floating Rate First
Preferred Shares, Series Q, at the option of the holders on January 31, 2016
or on January 31 every five years thereafter. Transaction costs incurred in
connection with the Series P First Preferred Shares of $8 million were
charged to retained earnings.
[ xiv ] During the year, 2,287,000 common shares (713,000 in 2009) were issued
under the Corporation’s Employee Stock Option Plan for a consideration
of $31 million ($10 million in 2009).
NO T E 15 S T O C K-B A SED COM PENS AT ION
[ i ] On October 1, 2000, the Corporation established a deferred share unit plan
for the Directors of the Corporation to promote a greater alignment of
interests between Directors and shareholders of the Corporation. Under
this plan, each Director may elect to receive his or her annual retainer and
attendance fees entirely in the form of deferred share units, entirely in
cash, or equally in cash and deferred share units. The number of deferred
share units granted is determined by dividing the amount of remuneration
payable by the five-day-average closing price on the Toronto Stock
Exchange of the Common Shares of the Corporation on the last five days
of the fiscal quarter (the value of a deferred share unit). A Director who
has elected to receive deferred share units will receive additional deferred
share units in respect of dividends payable on Common Shares, based
on the value of a deferred share unit at that time. A deferred share unit
shall be redeemable, at the time a Director’s membership on the Board
is terminated or in the event of the death of a Director, by a lump sum
cash payment, based on the value of a deferred share unit at that time.
At December 31, 2010, the value of the deferred share units outstanding
was $9.8 million ($8.8 million in 2009). In addition, Directors may also
participate in the Directors Share Purchase Plan.
[ ii ] Effective May 1, 2000, an Employee Share Purchase Program was
implemented, giving employees the opportunity to subscribe for up to
6% of their gross salary to purchase Subordinate Voting Shares of Power
Corporation of Canada on the open market and to have the Corporation
invest, on the employee’s behalf, up to an equal amount. The amount
paid on behalf of employees was $0.2 million in 2010 ($0.2 million in 2009).
NO T E 14 S TAT ED C A PI TA L (C O N T I N U E D)

67POWER FINANCIAL CORPORATION 2010 ANNUAL REPORT
[ iii ] Compensation expense is recorded for options granted under the
Corporation’s and its subsidiaries’ stock option plans based on the fair
value of the options at the grant date, amortized over the vesting period.
During the year ended December 31, 2010, 717,818 options (136,182 options
in 2009) were granted under the Corporation’s Employee Stock Option
Plan. The fair value of these options was estimated using the Black-Scholes
option-pricing model with the following weighted-average assumptions:
2010 2009Dividend yield 4.5% 3.7%Expected volatility 20.4% 16.7%Risk-free interest rate 2.8% 3.3%Expected life (years) 9 9Fair value per stock option ($/option) $3.61 $3.46Weighted-average exercise price ($/option) $28.36 $26.22
For the year ended December 31, 2010, compensation expense relating
to the stock options granted by the Corporation and its subsidiaries
amounted to $9 million ($16 million in 2009).
[ iv ] Under the Corporation’s Employee Stock Option Plan, 17,581,600 additional
shares are reserved for issuance. The plan requires that the exercise price
under the option must not be less than the market value of a share on
the date of the grant of the option. Generally, options granted vest on a
delayed basis over periods beginning no earlier than one year from date
of grant and no later than five years from date of grant. Options recently
granted have the following vesting conditions: grants of 972,395 options
in 2008 which vest equally over a period of five years beginning in 2009;
a grant of 136,182 options in 2009 which vest equally over a period of five
years beginning in 2010; grants of 38,293 options in 2010 which vest as
follows: the first 50% three years from the date of grant and the remaining
50% four years from the date of grant; a grant of 679,525 options in 2010
which vest equally over a period of five years beginning in 2011.
A summary of the status of the Corporation’s Employee Stock Option Plan as at December 31, 2010 and 2009, and changes during the years ended on those dates
is as follows:
2010 2009
OPTIONS
WEIGHTED-AVER AGE
EXERCISE PRICE OPTIONS
WEIGHTED-AVERAGE
EXERCISE PRICE
$ $Outstanding at beginning of year 10,049,297 24.48 10,626,115 23.72Granted 717,818 28.36 136,182 26.22Exercised (2,287,000) 13.50 (713,000) 13.50
Outstanding at end of year 8,480,115 27.77 10,049,297 24.48
Options exercisable at end of year 7,069,914 27.49 8,427,393 23.14
The following table summarizes information about stock options outstanding at December 31, 2010:
OPTIONS OUTSTANDING OPTIONS EXERCISABLE
RANGE OF EXERCISE PRICES OPTIONS
WEIGHTED-AVERAGE
REMAININGLIFE
WEIGHTED-AVERAGE
EXERCISE PRICE OPTIONS
WEIGHTED- AVERAGE
EXERCISE PRICE
$ (yrs) $ $16.87 160,000 0.8 16.87 160,000 16.8721.65 3,000,000 2.6 21.65 3,000,000 21.6526.22 – 28.13 865,707 9.1 27.76 77,236 26.7029.05 – 29.63 830,980 7.5 29.60 332,392 29.6031.59 – 32.46 2,567,777 5.1 32.11 2,529,484 32.1034.46 – 37.13 1,055,651 7.2 34.81 970,802 34.61
8,480,115 5.0 27.77 7,069,914 27.49
NO T E 15 S T O C K-B A SED COM PENS AT ION (C O N T I N U E D)

68
NOTES TO CONSOLIDATED FINANCIAL STATEMENTS
POWER FINANCIAL CORPORATION 2010 ANNUAL REPORT
As an investment holding company, Power Financial’s objectives in managing
its capital are:
> To provide sufficient financial flexibility to pursue its growth strategy and
support its group companies and other investments.
> To maintain an appropriate credit rating to achieve access to the capital
markets at the lowest overall cost of capital.
> To provide attractive long-term returns to shareholders of the Corporation
The Corporation manages its capital taking into consideration the risk
characteristics and liquidity of its holdings. In order to maintain or adjust its
capital structure, the Corporation may adjust the amount of dividends paid
to shareholders, return capital to shareholders or issue new forms of capital.
The capital structure of the Corporation consists of preferred shares, debentures
and shareholders’ equity composed of stated capital, retained earnings and
non-controlling interest in the equity of subsidiaries of the Corporation. The
Corporation utilizes perpetual preferred shares as a permanent and cost-
effective source of capital. The Corporation considers itself to be a long-term
investor and as such holds positions in long-term investments as well as cash
and short-term investments for liquidity purposes. As such, the Corporation
makes minimal use of leverage at the holding company level.
The Corporation is not subject to externally imposed regulatory capital
requirements.
The Corporation’s major operating subsidiaries are subject to regulatory capital
requirements along with capital standards set by peers or rating agencies.
Lifeco’s subsidiaries Great-West Life and GWL&A are subject to minimum
regulatory capital requirements. Lifeco’s practice is to maintain the
capitalization of its regulated operating subsidiaries at a level that will exceed
the relevant minimum regulatory capital requirements in the jurisdictions in
which they operate:
> In Canada, the Office of the Superintendent of Financial Institutions
has established a capital adequacy measurement for life insurance
companies incorporated under the Insurance Companies Act (Canada) and
their subsidiaries, known as the Minimum Continuing Capital and Surplus
Requirements (MCCSR). As at December 31, 2010, the MCCSR ratio for
Great-West Life was 203%.
> At December 31, 2010, the Risk Based Capital ratio (RBC) of GWL&A, Lifeco’s
regulated U.S. operating company, is estimated to be 393% of the Company
Action Level set by the National Association of Insurance Commissioners.
GWL&A reports its RBC ratio annually to U.S. insurance regulators.
> As at December 31, 2010 and 2009, Lifeco maintained capital levels above the
minimum local requirements in its other foreign operations.
IGM subsidiaries subject to regulatory capital requirements include trust
companies, securities dealers and mutual fund dealers. These subsidiaries are
in compliance with all regulatory capital requirements.
NO T E 17 R I SK M A N AGEM EN T
Power Financial and its subsidiaries have policies relating to the identification,
measurement, monitoring, mitigating and controlling of risks associated
with financial instruments. The key risks related to financial instruments are
liquidity risk, credit risk and market risk (currency, interest rate and equity).
The following sections describe how each segment manages these risks.
L IQUIDI T Y RISKLiquidity risk is the risk that the Corporation and its subsidiaries will not be able
to meet all cash outflow obligations as they come due.
Power Financial is a holding company. As such, corporate cash flows
from operations, before payment of dividends, are principally made up
of dividends received from its subsidiaries and investment at equity, and
income from investments, less operating expenses, financing charges
and income taxes. The ability of Lifeco and IGM, which are also holding
companies, to meet their obligations and pay dividends depends in
particular upon receipt of sufficient funds from their own subsidiaries.
Power Financial seeks to maintain a sufficient level of liquidity to meet all its
cash flow requirements. In addition, Power Financial and its parent, Power
Corporation of Canada, jointly have a $100 million uncommitted line of credit
with a Canadian chartered bank.
Principal payments on debentures (other than those of Lifeco and IGM discussed below) represent the only significant contractual liquidity requirement
of Power Financial.
AS AT DECEMBER 31, 2010LESS THAN 1
YEAR1–5
YEARSAFTER
5 YEARS TOTAL
Debentures – – 250 250
Power Financial’s liquidity position and its management of liquidity risk have
not changed materially since December 31, 2009.
For Lifeco, the following policies and procedures are in place to manage
liquidity risk:
> Lifeco closely manages operating liquidity through cash flow matching of
assets and liabilities and forecasting earned and required yields, to ensure
consistency between policyholder requirements and the yield of assets.
Approximately 70% of policy liabilities are non-cashable prior to maturity
or subject to market value adjustments.
> Management of Lifeco monitors the use of lines of credit on a regular basis,
and assesses the ongoing availability of these and alternative forms of
operating credit.
> Management of Lifeco closely monitors the solvency and capital positions
of its principal subsidiaries opposite liquidity requirements at the holding
company. Additional liquidity is available through established lines of credit
or the capital markets. Lifeco maintains a $200 million committed line of
credit with a Canadian chartered bank.
NO T E 16 C A PI TA L M A N AGEM EN T

69POWER FINANCIAL CORPORATION 2010 ANNUAL REPORT
In the normal course of business, Lifeco enters into contracts that give rise to commitments of future minimum payments that impact short-term and long-term
liquidity. The following table summarizes the principal repayment schedule of certain of Lifeco’s financial liabilities.
NO T E 17 R I SK M A N AGEM EN T (C O N T I N U E D)
PAYMENTS DUE BY PERIOD
AS AT DECEMBER 31, 2010 1 YEAR 2 YEARS 3 YEARS 4 YEARS 5 YEARSAFTER
5 YEARS TOTAL
Debentures and other debt instruments 305 302 1 1 – 3,714 4,323
Capital trust debentures [ 1 ] – – – – – 800 800Purchase obligations 55 26 27 15 16 4 143Pension contributions 130 – – – – – 130
490 328 28 16 16 4,518 5,396
[ 1 ] Payments due have not been reduced to reflect that Lifeco held capital trust securities of $275 million principal amount ($282 million carrying value).
IGM’s liquidity management practices include: controls over liquidity
management processes; stress testing of various operating scenarios; and
oversight over liquidity management by committees of the board of directors
of IGM.
For IGM, a key liquidity requirement is the funding of commissions paid on the
sale of mutual funds. Commissions on the sale of mutual funds continue to be
paid from operating cash flows.
IGM also maintains sufficient liquidity to fund and temporarily hold mortgages.
Through its mortgage banking operations, residential mortgages are sold to:
> Investors Mortgage and Short Term Income Fund;
> Third parties, including Canada Mortgage and Housing Corporation
(CMHC) or Canadian bank-sponsored securitization trusts; or
> Institutional investors through private placements.
Investors Group is an approved issuer of National Housing Act Mortgage-
Backed Securities (NHA MBS) and an approved seller into the Canada Mortgage
Bond Program (CMB Program). This issuer and seller status provides IGM with
additional funding sources for residential mortgages. IGM’s continued ability to
fund residential mortgages through Canadian bank-sponsored securitization
trusts and NHA MBS is dependent on securitization market conditions that
are subject to change.
Liquidity requirements for trust subsidiaries which engage in financial
intermediary activities are based on policies approved by committees of their
respective boards of directors. As at December 31, 2010, the trust subsidiaries’
liquidity was in compliance with these policies.
IGM’s contractual maturities were as follows:
AS AT DECEMBER 31, 2010 DEMANDLESS THAN
1 YEAR1–5
YEARSAFTER
5 YEARS TOTAL
Deposits and certificates 604 91 135 5 835Other liabilities – 50 43 – 93Long-term debt – 450 – 1,325 1,775Operation leases – 45 129 93 267
Total contractual obligations 604 636 307 1,423 2,970
In addition to IGM’s current balance of cash and cash equivalents, other
potential sources of liquidity include IGM’s lines of credit and portfolio of
securities. During the third quarter of 2010, IGM decreased its operating lines
of credit with various Schedule I Canadian chartered banks to $325 million
from $675 million as at December 31, 2009. The operating lines of credit as at
December 31, 2010 consist of committed lines of credit of $150 million (2009 –
$500 million) and uncommitted lines of $175 million (2009 – $175 million). As at
December 31, 2010 and 2009, IGM was not utilizing its committed lines of credit
or its uncommitted operating lines of credit.
In the fourth quarter of 2010, IGM accessed the domestic debt markets to raise
capital through the issue of $200 million in 30-year 6.0% debentures. IGM’s ability
to access capital markets to raise funds is dependent on market conditions.
IGM’s liquidity position and its management of liquidity risk have not changed
materially since December 31, 2009.
CREDI T RISKCredit risk is the potential for financial loss to the Corporation and its
subsidiaries if a counterparty in a transaction fails to meet its obligations.
For Power Financial, cash and cash equivalents, fixed income securities, and
derivatives are subject to credit risk. The Corporation monitors its credit risk
management policies continuously to evaluate their effectiveness.
Cash and cash equivalents amounting to $242 million and fixed income
securities amounting to $470 million consist primarily of highly liquid temporary
deposits with Canadian chartered banks as well as bankers’ acceptances
and short-term securities guaranteed by the Canadian government. The
Corporation regularly reviews the credit ratings of its counterparties.
The maximum exposure to credit risk on these financial instruments is their
carrying value. The Corporation mitigates credit risk on these financial
instruments by adhering to its Investment Policy which outlines credit risk
parameters and concentration limits.
The Corporation regularly reviews the credit ratings of derivative financial
instrument counterparties. Derivative contracts are over-the-counter traded
with counterparties that are highly rated financial institutions. The exposure
to credit risk is limited to the fair value of those instruments, which were in a
gain position, and which was $4 million at December 31, 2010.
For Lifeco, the following policies and procedures are in place to manage credit risk:
> Investment guidelines are in place that require only the purchase of
investment-grade assets and minimize undue concentration of assets in
any single geographic area, industry and company.
> Investment guidelines specify minimum and maximum limits for each asset
class. Credit ratings are determined by recognized external credit rating
agencies and/or internal credit review.

70
NOTES TO CONSOLIDATED FINANCIAL STATEMENTS
POWER FINANCIAL CORPORATION 2010 ANNUAL REPORT
> Investment guidelines also specify collateral requirements.
> Portfolios are monitored continuously, and reviewed regularly with the
board of directors of Lifeco or the investment committee of the board of
directors of Lifeco.
> Credit risk associated with derivative instruments is evaluated quarterly
based on conditions that existed at the balance sheet date, using practices
that are at least as conservative as those recommended by regulators.
> Lifeco is exposed to credit risk relating to premiums due from policyholders
during the grace period specified by the insurance policy or until the policy
is paid up or terminated. Commissions paid to agents and brokers are
netted against amounts receivable, if any.
> Reinsurance is placed with counterparties that have a good credit rating
and concentration of credit risk is managed by following policy guidelines
set each year by the board of directors of Lifeco. Management of Lifeco
continuously monitors and performs an assessment of creditworthiness
of reinsurers.
MAXIMUM EXPOSURE TO CREDIT RISK FOR LIFECOThe following table summarizes Lifeco’s maximum exposure to credit risk related to financial instruments. The maximum credit exposure is the carrying value of
the asset net of any allowances for losses.
AS AT DECEMBER 31 2010 2009Cash and cash equivalents 1,840 3,427Bonds
Held for trading 56,296 52,362Available for sale 6,617 4,620Loans and receivables 9,290 9,165
Mortgage loans 16,115 16,684Loans to policyholders 6,827 6,957Other financial assets [ 1 ] 13,317 14,385Derivative assets 984 717
Total balance sheet maximum credit exposure 111,286 108,317
[ 1 ] Other financial assets include $9,097 million of funds held by ceding insurers in 2010 ($10,146 million in 2009) where Lifeco retains the credit risk of the assets supporting the liabilities ceded.
Credit risk is also mitigated by entering into collateral agreements. The amount
and type of collateral required depends on an assessment of the credit risk of the
counterparty. Guidelines are implemented regarding the acceptability of types
of collateral and the valuation parameters. Management of Lifeco monitors the
value of the collateral, requests additional collateral when needed and performs an
impairment valuation when applicable. Lifeco has $24 million of collateral received
in 2010 ($35 million of collateral received in 2009) relating to derivative assets.
CONCENTRATION OF CREDIT RISK FOR LIFECOConcentrations of credit risk arise from exposures to a single debtor, a group of
related debtors or groups of debtors that have similar credit risk characteristics
in that they operate in the same geographic region or in similar industries. The
characteristics are similar in that changes in economic or political environments
may impact their ability to meet obligations as they come due.
The following table provides details of the carrying value of bonds of Lifeco by industry sector and geographic distribution:
AS AT DECEMBER 31, 2010 CANADAUNITED STATES EUROPE TOTAL
Bonds issued or guaranteed by:Canadian federal government 3,548 – 31 3,579Provincial, state and municipal governments 5,619 1,815 57 7,491U.S. Treasury and other U.S. agencies 335 2,851 976 4,162Other foreign governments 121 – 6,372 6,493Government-related 882 – 1,502 2,384Sovereign 651 22 770 1,443Asset-backed securities 2,728 3,450 842 7,020Residential mortgage-backed securities 25 745 111 881Banks 2,183 442 1,993 4,618Other financial institutions 1,057 1,359 1,470 3,886Basic materials 201 587 182 970Communications 589 246 477 1,312Consumer products 1,608 1,419 1,495 4,522Industrial products/services 544 726 181 1,451Natural resources 997 561 422 1,980Real estate 422 – 1,400 1,822Transportation 1,557 563 584 2,704Utilities 3,266 2,433 2,821 8,520Miscellaneous 1,728 628 232 2,588
Total long-term bonds 28,061 17,847 21,918 67,826Short-term bonds 2,822 816 739 4,377
Total bonds 30,883 18,663 22,657 72,203
NO T E 17 R I SK M A N AGEM EN T (C O N T I N U E D)

71POWER FINANCIAL CORPORATION 2010 ANNUAL REPORT
NO T E 17 R I SK M A N AGEM EN T (C O N T I N U E D)
AS AT DECEMBER 31, 2009 CANADAUNITED STATES EUROPE TOTAL
Bonds issued or guaranteed by:Canadian federal government 2,264 1 14 2,279Provincial, state and municipal governments 4,917 1,333 55 6,305U.S. Treasury and other U.S. agencies 240 2,620 758 3,618Other foreign governments 104 – 5,773 5,877Government-related 778 – 1,372 2,150Sovereign 783 4 762 1,549Asset-backed securities 2,636 3,306 851 6,793Residential mortgage-backed securities 46 842 60 948Banks 2,201 453 2,299 4,953Other financial institutions 1,021 1,336 1,507 3,864Basic materials 151 571 198 920Communications 598 276 473 1,347Consumer products 1,384 1,351 1,664 4,399Industrial products/services 516 651 206 1,373Natural resources 1,000 710 581 2,291Real estate 559 – 1,216 1,775Transportation 1,414 585 594 2,593Utilities 3,008 2,172 2,702 7,882Miscellaneous 1,489 562 182 2,233
Total long-term bonds 25,109 16,773 21,267 63,149Short-term bonds 2,406 455 137 2,998
Total bonds 27,515 17,228 21,404 66,147
The following table provides details of the carrying value of mortgage loans of Lifeco by geographic location:
AS AT DECEMBER 31, 2010SINGLE-FAMILY
RESIDENTIALMULTI-FAMILY
RESIDENTIAL COMMERCIAL TOTAL
Canada 1,622 3,528 6,691 11,841United States – 464 1,517 1,981Europe – 26 2,267 2,293
Total mortgage loans 1,622 4,018 10,475 16,115
AS AT DECEMBER 31, 2009SINGLE-FAMILY
RESIDENTIALMULTI-FAMILY
RESIDENTIAL COMMERCIAL TOTAL
Canada 1,695 3,965 6,371 12,031United States – 485 1,509 1,994Europe – 29 2,630 2,659
Total mortgage loans 1,695 4,479 10,510 16,684
ASSET QUALITY
BOND PORTFOLIO QUALITY
AS AT DECEMBER 31 2010 2009AAA 28,925 24,653AA 11,436 10,684A 19,968 19,332BBB 10,649 10,113BB and lower 1,225 1,365
Total bonds 72,203 66,147

72
NOTES TO CONSOLIDATED FINANCIAL STATEMENTS
POWER FINANCIAL CORPORATION 2010 ANNUAL REPORT
DERIVATIVE PORTFOLIO QUALITY
AS AT DECEMBER 31 2010 2009Over-the-counter contracts (counterparty ratings):AAA 5 5AA 491 338A 488 374
Total 984 717
LOANS OF LIFECO PAST DUE, BUT NOT IMPAIREDLoans that are past due but not considered impaired are loans for which scheduled payments have not been received, but management of Lifeco has reasonable
assurance of collection of the full amount of principal and interest due. The following table provides carrying values of the loans past due, but not impaired:
2010 2009Less than 30 days 7 4530 — 90 days 2 6Greater than 90 days 2 9
Total 11 60
PERFORMING SECURITIES SUBJECT TO DEFERRED COUPONS
PAYMENT RESUMPTION DATE
LESS THAN1 YEAR
1–2 YEARS
GREATER THAN 2 YEARS
Coupon payment receivable – 2 –
For IGM, cash and cash equivalents, securities holdings, mortgage and
investment loan portfolios, and derivatives are subject to credit risk. IGM
monitors its credit risk management practices continuously to evaluate
their effectiveness.
With respect to IGM, at December 31, 2010, cash and cash equivalents
of $1,574 million consisted of cash balances of $114 million on deposit with
Canadian chartered banks and cash equivalents of $1,460 million. Cash
equivalents are composed primarily of Government of Canada treasury bills
totalling $656 million, provincial government and government-guaranteed
commercial paper of $355 million and bankers’ acceptances issued by Canadian
chartered banks of $427 million. IGM regularly reviews the credit ratings of
its counterparties. The maximum exposure to credit risk on these financial
instruments is their carrying value.
With respect to IGM, available-for-sale fixed income securities at
December 31, 2010 are composed of bankers’ acceptances of $35 million,
Canadian chartered bank senior deposit notes and floating rate notes
of $82 million and $35 million, respectively, and corporate bonds and other of
$92 million. The maximum exposure to credit risk on these financial instru-
ments is their carrying value.
IGM manages credit risk related to cash and cash equivalents and available-for-
sale fixed income securities by adhering to its Investment Policy, which outlines
credit risk parameters and concentration limits.
Held-for-trading securities include Canada Mortgage Bonds with a fair value
of $638 million, NHA MBS with a fair value of $53 million, as well as fixed
income securities that comprise non-bank-sponsored ABCP with a fair value
of $28 million. These fair values represent the maximum exposure to credit
risk at December 31, 2010.
IGM regularly reviews the credit quality of the mortgage and investment loan
portfolios and the adequacy of the general allowance. As at December 31, 2010,
mortgages and investment loans totalled $342 million and $284 million, respect-
ively, compared with $373 million and $305 million as at December 31, 2009.
The allowance for credit losses was $4 million at December 31, 2010, compared
to $7 million in 2009, a decrease of $3 million. The decrease reflects changes
in the size and composition of the mortgage loan portfolio and continued
low default and loss trends. As at December 31, 2010, the mortgage portfolios
were geographically diverse, 100% residential (2009 – 100%) and 60% insured
(2009 – 74%). The credit risk on the investment loan portfolio is mitigated
through the use of collateral, primarily in the form of mutual fund investments.
As at December 31, 2010, impaired mortgages and investment loans were
$0.3 million, compared to $0.8 million in 2009. Uninsured non-performing loans
over 90 days in the mortgage and investment loan portfolios were $0.2 million
at December 31, 2010, unchanged from December 31, 2009. The characteristics
of the mortgage and investment loan portfolios have not changed significantly
during 2010.
IGM’s exposure to and management of credit risk related to cash and cash
equivalents, fixed income securities and mortgage and investment loan
portfolios have not changed materially since December 31, 2009.
NO T E 17 R I SK M A N AGEM EN T (C O N T I N U E D)
73POWER FINANCIAL CORPORATION 2010 ANNUAL REPORT
NO T E 17 R I SK M A N AGEM EN T (C O N T I N U E D)
IGM regularly reviews the credit quality of the mortgage loans securitized
through CMHC or Canadian bank-sponsored (Schedule I chartered banks)
securitization trusts. The fair value of the retained interests in the securitized
loans was $107 million at December 31, 2010, compared to $174 million at
December 31, 2009. Retained interests include:
> Cash reserve accounts and rights to future excess spread (securitization
receivables) which totalled $109 million at December 31, 2010.
The portion of this amount pertaining to Canadian bank-sponsored
securitization trusts of $23 million is subordinated to the interests of the
trust and represents the maximum exposure to credit risk for any failure of
the borrowers to pay when due. Credit risk on these mortgages is mitigated
by any insurance on these mortgages, as discussed below, and IGM’s credit
risk on insured loans is to the insurer. At December 31, 2010, 92.4% of the
$1.4 billion in outstanding mortgages securitized under these programs
was insured.
Rights to the future excess spread under the NHA MBS and CMB Program
totalled $87 million. Under the NHA MBS and CMB Program, IGM has
an obligation to make timely payments to security holders regardless of
whether amounts are received by mortgagors. All mortgages securitized
under the NHA MBS and CMB Program are insured by CMHC or another
approved insurer under the program, and IGM’s credit exposure is to the
insurer. Outstanding mortgages securitized under these programs are
$2.1 billion.
Since 2008, IGM has purchased portfolio insurance from CMHC on newly
funded qualifying conventional mortgage loans. At December 31, 2010,
94.2% of the total mortgage portfolio serviced by IGM related to its
mortgage banking operations was insured. Uninsured non-performing
loans over 90 days in the securitized portfolio were $0.1 million at
December 31, 2010, compared to nil at December 31, 2009. IGM’s expected
exposure to credit risk related to cash reserve accounts and rights to future
excess spread was not significant at December 31, 2010.
> Fair value of interest rate swaps which IGM enters into as a requirement of
the securitization programs that it participates in, had a negative fair value
of $2 million at December 31, 2010. The outstanding notional amount of
these interest rate swaps was $3.9 billion at December 31, 2010, compared
to $3.4 billion at December 31, 2009. The exposure to credit risk, which is
limited to the fair value of the interest rate swaps which were in a gain
position, totalled $40 million at December 31, 2010, compared to $76 million
at December 31, 2009.
IGM utilizes interest rate swaps to hedge interest rate risk related to the
securitization activities discussed above. The negative fair value of these
interest rate swaps totalled $27 million at December 31, 2010. The outstanding
notional amount was $2.5 billion at December 31, 2010, compared to $2.8 billion
at December 31, 2009. The exposure to credit risk, which is limited to the fair
value of the interest rate swaps which are in a gain position, totalled $23 million
at December 31, 2010, compared to $5 million at December 31, 2009.
IGM also utilizes interest rate swaps to hedge interest rate risk associated
with its investments in Canada Mortgage Bonds. The fair value of these
interest rate swaps totalled $15 million at December 31, 2010. The outstanding
notional amount was $0.5 billion at December 31, 2010 unchanged from
December 31, 2009. The exposure to credit risk, which is limited to the fair value
of the interest rate swaps which are in a gain position, totalled $15 million at
December 31, 2010, compared to $37 million at December 31, 2009.
In addition, IGM enters into other derivative contracts which consist primarily
of interest rate swaps utilized to hedge interest rate risk related to mortgages
held pending sale, or committed to, by IGM. The fair value of these interest
rate swaps totalled $1 million at December 31, 2010. The outstanding notional
amount of these derivative contracts was $118 million at December 31, 2010,
compared to $75 million at December 31, 2009. The exposure to credit risk,
which is limited to the fair value of those instruments which are in a gain
position, was $1 million at December 31, 2010, compared to $3 million at
December 31, 2009.
The aggregate credit risk exposure related to derivatives that are in a gain
position of $79 million does not give effect to any netting agreements or
collateral arrangements. The exposure to credit risk, considering netting
agreements and collateral arrangements, was $40 million at December 31, 2010.
Counterparties are all bank-sponsored securitization trusts and Canadian
Schedule I chartered banks and, as a result, management has determined
that IGM’s overall credit risk related to derivatives was not significant at
December 31, 2010. Management of credit risk has not changed materially
since December 31, 2009.
M A RK E T RISKMarket risk is the risk that the fair value or future cash flows of a financial
instrument will fluctuate as a result of changes in market factors. Market
factors include three types of risks: currency risk, interest rate risk and equity
price risk.
CURRENCY RISKCurrency risk relates to the Corporation, its subsidiaries and its investment at
equity operating in different currencies and converting non-Canadian earnings
at different points in time at different foreign exchange levels when adverse
changes in foreign currency exchange rates occur.
Power Financial’s financial assets are essentially cash and cash equivalents
and fixed income securities. In managing its own cash and cash equivalents,
Power Financial may hold cash balances denominated in foreign currencies
and thus be exposed to fluctuations in exchange rates. In order to protect
against such fluctuations, Power Financial may from time to time enter into
currency-hedging transactions with highly rated financial institutions. As at
December 31, 2010, essentially all of Power Financial’s cash and cash equivalents
were denominated in Canadian dollars or in foreign currencies with currency
hedges in place.
For Lifeco, if the assets backing policy liabilities are not matched by currency,
changes in foreign exchange rates can expose Lifeco to the risk of foreign
exchange losses not offset by liability decreases. The following policies and
procedures are in place to mitigate exposure to currency risk:
> Lifeco uses financial measures such as constant currency calculations to
monitor the effect of currency translation fluctuations.
> Investments are normally made in the same currency as the liabilities
supported by those investments. Segmented Investment Guidelines include
maximum tolerances for unhedged currency mismatch exposures.
> Foreign currency assets acquired to back liabilities are normally converted
back to the currency of the liability using foreign exchange contracts.
> A 10% weakening of the Canadian dollar against foreign currencies would be
expected to increase non-participating policy liabilities and their supporting
assets by approximately the same amount, resulting in an immaterial
change to net earnings. A 10% strengthening of the Canadian dollar against
foreign currencies would be expected to decrease non-participating policy
liabilities and their supporting assets by approximately the same amount,
resulting in an immaterial change in net earnings.
IGM’s financial instruments are generally denominated in Canadian dollars,
and do not have significant exposure to changes in foreign exchange rates.

74
NOTES TO CONSOLIDATED FINANCIAL STATEMENTS
POWER FINANCIAL CORPORATION 2010 ANNUAL REPORT
INTEREST RATE RISKInterest rate risk is the risk that the fair value of future cash flows of a financial
instrument will fluctuate because of changes in the market interest rates.
Power Financial’s financial instruments are essentially cash and cash
equivalents, fixed income securities, and long-term debt that do not have
significant exposure to interest rate risk.
For Lifeco, the following policies and procedures are in place to mitigate
exposure to interest rate risk:
> Lifeco utilizes a formal process for managing the matching of assets and
liabilities. This involves grouping general fund assets and liabilities into
segments. Assets in each segment are managed in relation to the liabilities
in the segment.
> Interest rate risk is managed by investing in assets that are suitable for
the products sold.
> Where these products have benefit or expense payments that are
dependent on inflation (inflation-indexed annuities, pensions and disability
claims), Lifeco generally invests in real return instruments to hedge its real
dollar liability cash flows. Some protection against changes in the inflation
index is achieved as any related change in the fair value of the assets will be
largely offset by a similar change in the fair value of the liabilities.
> For products with fixed and highly predictable benefit payments,
investments are made in fixed income assets or real estate whose cash
flows closely match the liability product cash flows. Where assets are
not available to match certain cash flows, such as long-tail cash flows, a
portion of these are invested in equities and the rest are duration matched.
Hedging instruments are employed where necessary when there is a lack of
suitable permanent investments to minimize loss exposure to interest rate
changes. To the extent these cash flows are matched, protection against
interest rate change is achieved and any change in the fair value of the
assets will be offset by a similar change in the fair value of the liabilities.
> For products with less predictable timing of benefit payments, investments
are made in fixed income assets with cash flows of a shorter duration than
the anticipated timing of benefit payments or equities, as described below.
> The risks associated with the mismatch in portfolio duration and cash flow,
asset prepayment exposure and the pace of asset acquisition are quantified
and reviewed regularly.
Projected cash flows from the current assets and liabilities are used in the
Canadian Asset Liability Method to determine policy liabilities. Valuation
assumptions have been made regarding rates of returns on supporting
assets, fixed income, equity and inflation. The valuation assumptions use
best estimates of future reinvestment rates and inflation assumptions with
an assumed correlation together with margins for adverse deviation set in
accordance with professional standards. These margins are necessary to
provide for possibilities of misestimation and/or future deterioration in the best
estimate assumptions and provide reasonable assurance that policy liabilities
cover a range of possible outcomes. Margins are reviewed periodically for
continued appropriateness.
Projected cash flows from fixed income assets used in actuarial calculations
are reduced to provide for potential asset default losses. The net effective yield
rate reduction averaged 0.21% (0.23% in 2009). The calculation for future credit
losses on assets is based on the credit quality of the underlying asset portfolio.
The following outlines the future asset credit losses provided for in policy liabilities. These amounts are in addition to the allowance for asset losses included
with assets:
2010 2009Participating 802 755Non-participating 1,516 1,712
2,318 2,467
Testing under several interest rate scenarios (including increasing and
decreasing rates) is done to assess reinvestment risk.
One way of measuring the interest rate risk associated with this assumption
is to determine the effect on the policy liabilities impacting the shareholder
earnings of Lifeco of a 1% immediate parallel shift in the yield curve. These
interest rate changes will impact the projected cash flows.
> The effect of an immediate 1% parallel increase in the yield curve would be
to increase these policy liabilities by approximately $29 million, causing
a decrease in net earnings of Lifeco of approximately $25 million. (Power
Financial’s share – $18 million).
> The effect of an immediate 1% parallel decrease in the yield curve would be
to increase these policy liabilities by approximately $410 million, causing
a decrease in net earnings of Lifeco of approximately $279 million. (Power
Financial’s share – $197 million).
In addition to the above, if this change in the yield curve persisted for an
extended period the range of the tested scenarios might change. The effect
of an immediate 1% parallel decrease or increase in the yield curve persisting for
a year would have immaterial additional effects on the reported policy liability.
IGM is exposed to interest rate risk on its loan portfolio, fixed income securities,
Canada Mortgage Bonds and on certain of the derivative financial instruments
used in IGM’s mortgage banking and intermediary operations.
The objective of IGM’s asset and liability management is to control interest rate
risk related to its intermediary operations by actively managing its interest rate
exposure. As at December 31, 2010, the total gap between one-year deposit
assets and liabilities was within IGM’s trust subsidiaries’ stated guidelines.
NO T E 17 R I SK M A N AGEM EN T (C O N T I N U E D)

75POWER FINANCIAL CORPORATION 2010 ANNUAL REPORT
IGM utilizes interest rate swaps with Canadian Schedule I chartered bank
counterparties in order to reduce the impact of fluctuating interest rates on
its mortgage banking operations, as follows:
> As part of the securitization transactions with bank-sponsored secu-
ritization trusts, IGM enters into interest rate swaps with the trusts, which
transfers the interest rate risk to IGM. IGM enters into offsetting interest
rate swaps with Schedule I chartered banks to hedge this risk. Under
these securitization transactions with bank-sponsored securitization
trusts, IGM is exposed to asset-backed commercial paper rates and, after
effecting its interest rate hedging activities, remains exposed to the basis
risk that asset-backed commercial paper rates are greater than bankers’
acceptance rates.
> As part of the securitization transactions under the CMB Program,
IGM enters into interest rate swaps with Schedule I chartered bank
counterparties that transfer the interest rate risk associated with the
program, including reinvestment risk, to IGM. To manage these interest
rate and reinvestment risks, IGM enters into offsetting interest rate swaps
with Schedule I chartered bank counterparties to reduce the impact of
fluctuating interest rates.
> IGM is exposed to the impact that changes in interest rates may have on
the value of its investments in Canada Mortgage Bonds. IGM enters into
interest rate swaps with Schedule I chartered bank counterparties to hedge
interest rate risk on these bonds.
> IGM is also exposed to the impact that changes in interest rates may have
on the value of mortgages held, or committed to, by IGM. IGM may enter
into interest rate swaps to hedge this risk.
As at December 31, 2010, the impact to net earnings of IGM of a 100-basis-point
change in interest rates would have been approximately $2.5 million (Power
Financial’s share – $1.5 million). IGM’s exposure to and management of interest
rate risk has not changed materially since December 31, 2009.
EQUITY PRICE RISKEquity price risk is the uncertainty associated with the valuation of assets
arising from changes in equity markets. To mitigate equity price risk, the
Corporation and its subsidiaries have investment policy guidelines in place that
provide for prudent investment in equity markets within clearly defined limits.
Power Financial’s financial instruments are essentially cash and cash
equivalents, fixed income securities, and long-term debt that do not have
exposure to equity price risk.
For Lifeco, the risks associated with segregated fund guarantees have been
mitigated through a hedging program for lifetime Guaranteed Minimum
Withdrawal Benefit guarantees consisting of purchasing equity futures,
currency forwards, and interest rate derivatives. For policies with segregated
fund guarantees, Lifeco generally determines policy liabilities at a CTE75
(conditional tail expectation of 75) level.
Some policy liabilities are supported by real estate, common stocks and
private equities, for example, segregated fund products and products with
long-tail cash flows. Generally these liabilities will fluctuate in line with equity
market values. There will be additional impacts on these liabilities as equity
market values fluctuate. A 10% increase in equity markets would be expected
to additionally decrease non-participating policy liabilities by approximately
$32 million, causing an increase in net earnings of Lifeco of approximately
$25 million (Power Financial’s share – $18 million). A 10% decrease in equity
markets would be expected to additionally increase non-participating policy
liabilities by approximately $72 million, causing a decrease in net earnings
of Lifeco of approximately $54 million (Power Financial’s share – $38 million).
The best estimate return assumptions for equities are primarily based on long-
term historical averages. Changes in the current market could result in changes
to these assumptions and will impact both asset and liability cash flows. A 1%
increase in the best estimate assumption would be expected to decrease non-
participating policy liabilities by approximately $333 million, causing an increase
in net earnings of Lifeco of approximately $242 million (Power Financial’s share
– $171 million). A 1% decrease in the best estimate assumption would be expected
to increase non-participating policy liabilities by approximately $386 million,
causing a decrease in net earnings of Lifeco of approximately $279 million
(Power Financial’s share – $197 million).
IGM is exposed to equity price risk on its investments in common shares
and proprietary investment funds which are classified as available-for-sale
securities. Unrealized gains and losses on these securities are recorded in other
comprehensive income until they are realized or until management of IGM
determines there is objective evidence of impairment in value that is other
than temporary, at which time they are recorded in the statements of earnings.
As at December 31, 2010, the impact of a 10% decrease in equity prices would
have been a $3.3 million unrealized loss recorded in other comprehensive
income (Power Financial’s share – $2 million). IGM’s management of equity
price risk has not changed materially since December 31, 2009. However, IGM’s
exposure to equity price risk has declined materially since December 31, 2009 as
a result of the reduction in its common share holdings during 2010.
NO T E 17 R I SK M A N AGEM EN T (C O N T I N U E D)

76
NOTES TO CONSOLIDATED FINANCIAL STATEMENTS
POWER FINANCIAL CORPORATION 2010 ANNUAL REPORT
FOR THE YEAR ENDED DECEMBER 31, 2010 UNREALIZED GAINS (LOSSES) ON
AVAILABLE-FOR- SALE ASSETS
CASH FLOWHEDGES
FOREIGNCURRENCY
TRANSL ATION TOTAL
Balance, beginning of year 834 (36) (1,188) (390)
Other comprehensive income (loss) 41 79 (1,014) (894)
Income taxes (37) (28) – (65)
4 51 (1,014) (959)
Non-controlling interests (21) (15) 182 146
(17) 36 (832) (813)
Balance, end of year 817 – (2,020) (1,203)
FOR THE YEAR ENDED DECEMBER 31, 2009 UNREALIZED GAINS (LOSSES) ON
AVAILABLE-FOR- SALE ASSETS
CASH FLOWHEDGES
FOREIGNCURRENCY
TRANSL ATION TOTAL
Balance, beginning of year 676 (140) (189) 347
Other comprehensive income (loss) 257 224 (1,328) (847)
Income taxes (44) (78) – (122)
213 146 (1,328) (969)
Non-controlling interests (55) (42) 329 232
158 104 (999) (737)
Balance, end of year 834 (36) (1,188) (390)
NO T E 19 F I N A NC I NG C H A RGE S
2010 2009
Interest on debentures and other borrowings 363 337
Preferred share dividends 12 72
Net interest on capital trust debentures and securities 32 42
Unrealized gain on preferred shares classified as held for trading (2) 29
Other 22 14
427 494
NO T E 18 ACC U M U L AT ED O T H ER COM PR EH ENSI V E I NCOM E (L O S S)

77POWER FINANCIAL CORPORATION 2010 ANNUAL REPORT
NO T E 20 O T H ER I NCOM E (C H A RGE S), N E T
2010 2009
Share of Pargesa’s non-operating earnings [ Note 5 ] (5) (70)Gain resulting from dilution of the Corporation’s interest in IGM – 12
(5) (58)
NO T E 21 PENSION PL A NS A N D O T H ER P O S T-R E T I R EM EN T BEN EF I T S
The Corporation and its subsidiaries maintain funded defined benefit pension plans for certain employees and advisors as well as unfunded supplementary
employee retirement plans (SERP) for certain employees. The Corporation’s subsidiaries also maintain defined contribution pension plans for certain
employees and advisors. The Corporation and its subsidiaries also provide post-retirement health, dental and life insurance benefits to eligible retirees,
advisors and their dependents.
CHA NGE S IN FA IR VA LUE OF PL A N A SSE T S A ND IN T HE ACCRUED BENEFI T OBL IG AT ION
2010 2009
PENSION PL ANS
OTHER POST-RETIREMENT
BENEFITSPENSION
PL ANS
OTHER POST-RETIREMENT
B ENEFITS
FAIR VALUE OF PLAN ASSETSBalance, beginning of year 3,155 2,802
Employee contributions 20 19Employer contributions 95 121Benefits paid (159) (175)Actual return on plan assets 304 457Other, including foreign exchange (52) (69)
Balance, end of year 3,363 3,155
ACCRUED BENEFIT OBLIGATIONBalance, beginning of year 3,106 382 2,808 359
Benefits paid (159) (18) (175) (19)Current service cost 59 3 47 3Employee contributions 20 – 19 –Interest cost 189 23 184 23Actuarial (gains) losses 376 51 324 34Settlement and curtailment (2) – (2) –Past service cost 27 2 (3) (15)Other, including foreign exchange (68) (1) (96) (3)
Balance, end of year 3,548 442 3,106 382
FUNDED STATUSFund surplus (deficit) [ i ] (185) (442) 49 (382)Unamortized past service costs (77) (50) (115) (64)Valuation allowance (63) – (75) –Unamortized transitional obligation and other 1 – 1 –Unamortized net actuarial losses (gains) 541 47 313 (5)
Accrued benefit asset (liability) [ ii ] 217 (445) 173 (451)
[ i ] The aggregate accrued benefit obligations and aggregate fair value of plan
assets of individual pension plans that had accrued benefit obligations in
excess of the fair value of their related plan assets at December 31, 2010
amounted to $1,317 million ($811 million in 2009) and $1,097 million
($622 million in 2009), respectively. In addition, the Corporation and
its subsidiaries maintain unfunded supplementary retirement plans for
certain employees. The obligation for these plans, which is included
above, was $315 million at December 31, 2010 ($286 million in 2009).

78
NOTES TO CONSOLIDATED FINANCIAL STATEMENTS
POWER FINANCIAL CORPORATION 2010 ANNUAL REPORT
[ ii ] The net accrued benefit asset (liability) shown above is presented in these financial statements as follows:
2010 2009
PENSIONPL ANS
OTHER POST-RETIREMENT
BENEFITS TOTALPENSION
PL ANS
OTHER POST-RETIREMENT
BENEFITS TOTAL
Accrued benefit asset [ Note 8 ] 437 – 437 384 – 384Accrued benefit liability [ Note 12 ] (220) (445) (665) (211) (451) (662)
Accrued benefit asset (liability) 217 (445) (228) 173 (451) (278)
COS T S RECO GNIZED
2010 2009
PENSION PL ANS
OTHER POST-RETIREMENT
BENEFITSPENSION
PL ANS
OTHER POST-RETIREMENT
BENEFITS
Amounts arising from events in the periodCurrent service cost 59 3 47 3Interest cost 189 23 184 23Actual return on plan assets (304) – (457) –Past service cost 27 2 (3) (15)Actuarial (gains) losses on accrued benefit obligation 376 51 324 34
347 79 95 45Adjustments to reflect costs recognized
Difference between actual and expected return on assets 108 – 268 –Difference between actuarial gains and losses arising during the period
and actuarial gains and losses amortized (350) (51) (319) (36)Difference between past service costs arising
in period and past service costs amortized (38) (12) (8) 4Amortization of transitional obligation 1 – 1 –Increase (decrease) in valuation allowance (12) – 1 –Defined contribution service cost 29 – 33 –
Net cost recognized for the year 85 16 71 13
Subsidiaries of Lifeco have declared partial windups in respect of certain defined benefit pension plans which will not likely be completed for some time. Amounts
relating to the partial windups may be recognized by Lifeco as the partial windups are completed.
ME A SUREMEN T A ND VA LUAT IONThe measurement dates, weighted by accrued benefit obligation, are November 30 for 90% of the plans and December 31 for 10% of the plans. The dates of actuarial
valuations for funding purposes for the funded defined benefit pension plans (weighted by accrued benefit obligation) are:
MOST RECENT VALUATION % OF PLANS NEXT REQUIRED VALUATION % OF PLANS
December 31, 2007 28 December 31, 2010 44
December 31, 2008 19 December 31, 2011 19
December 31, 2009 49 December 31, 2012 33
April 1, 2010 4 April 1, 2013 4
C A SH PAY MEN T S
ALL PENSION PL ANSOTHER POST-RETIREMENT
BENEFITS
2010 2009 2010 2009Benefit payments for unfunded plans 18 18 18 19Company contributions (defined benefit and contribution plans) 107 115 – –
125 133 18 19
NO T E 21 PENSION PL A NS A N D O T H ER P O S T-R E T I R EM EN T BEN EF I T S (C O N T I N U E D)
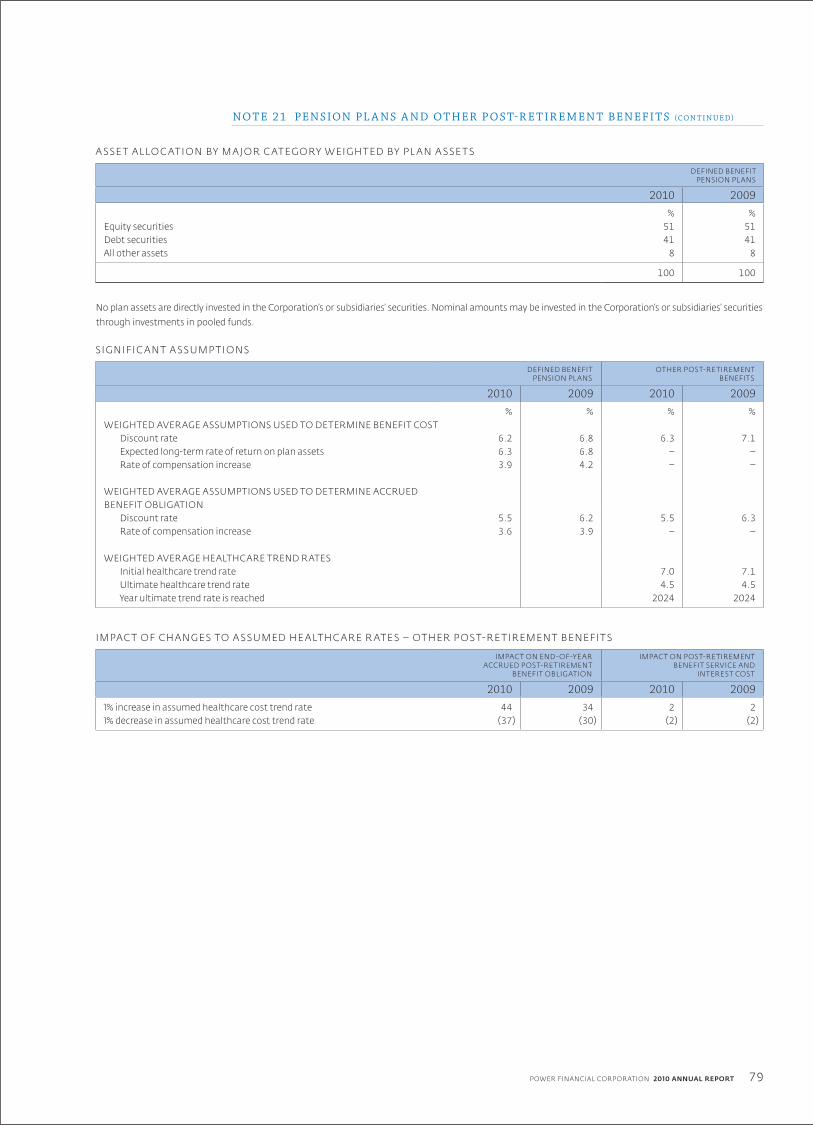
79POWER FINANCIAL CORPORATION 2010 ANNUAL REPORT
A SSE T A L LO C AT ION BY M A JOR C AT EG ORY W EIGH T ED BY PL A N A SSE T S
DEFINED BENEFIT PENSION PL ANS
2010 2009% %
Equity securities 51 51Debt securities 41 41All other assets 8 8
100 100
No plan assets are directly invested in the Corporation’s or subsidiaries’ securities. Nominal amounts may be invested in the Corporation’s or subsidiaries’ securities
through investments in pooled funds.
SIGNIFIC A N T A SSUMP T IONS
DEFINED BENEFIT PENSION PL ANS
OTHER POST-RETIREMENTBENEFITS
2010 2009 2010 2009% % % %
WEIGHTED AVERAGE ASSUMPTIONS USED TO DETERMINE BENEFIT COSTDiscount rate 6.2 6.8 6.3 7.1Expected long-term rate of return on plan assets 6.3 6.8 – –Rate of compensation increase 3.9 4.2 – –
WEIGHTED AVERAGE ASSUMPTIONS USED TO DETERMINE ACCRUED BENEFIT OBLIGATION
Discount rate 5.5 6.2 5.5 6.3Rate of compensation increase 3.6 3.9 – –
WEIGHTED AVERAGE HEALTHCARE TREND RATESInitial healthcare trend rate 7.0 7.1Ultimate healthcare trend rate 4.5 4.5Year ultimate trend rate is reached 2024 2024
IMPAC T OF CHA NGE S TO A SSUMED HE A LT HC A RE R AT E S – OT HER P OS T- RE T IREMEN T BENEFI T S
IMPAC T ON END-OF-YEARACCRUED POST-RETIREMENT
BENEFIT OBLIGATION
IMPAC T ON POST-RETIREMENTBENEFIT SERVICE AND
INTEREST COST
2010 2009 2010 20091% increase in assumed healthcare cost trend rate 44 34 2 21% decrease in assumed healthcare cost trend rate (37) (30) (2) (2)
NO T E 21 PENSION PL A NS A N D O T H ER P O S T-R E T I R EM EN T BEN EF I T S (C O N T I N U E D)

80
NOTES TO CONSOLIDATED FINANCIAL STATEMENTS
POWER FINANCIAL CORPORATION 2010 ANNUAL REPORT
The following table presents the fair value of the Corporation’s financial
instruments using the valuation methods and assumptions described below.
Fair value represents the amount that would be exchanged in an arm’s-length
transaction between willing parties under no compulsion to act, and best
evidenced by a quoted market price, if one exists. Fair values are management’s
estimates and are generally calculated using market conditions at a specific
point in time and may not reflect future fair values. The calculations are
subjective in nature, involve uncertainties and matters of significant judgment.
2010 2009CARRYING
VALUEFAIR
VALUECARRYING
VALUEFAIR
VALUE
ASSETSCash and cash equivalents 3,656 3,656 4,855 4,855Investments (excluding real estate) 96,786 98,205 91,136 91,602Loans to policyholders 6,827 6,827 6,957 6,957Funds held by ceding insurers 9,860 9,860 10,839 10,839Receivables and other 2,599 2,599 2,601 2,601Derivative financial instruments 1,067 1,067 837 837
Total financial assets 120,795 122,214 117,225 117,691
LIABILITIESDeposits and certificates 835 840 907 916Debentures and other borrowings 6,348 6,821 5,967 6,180Capital trust securities and debentures 535 596 540 601Preferred shares of the Corporation – – 300 318Preferred shares of subsidiaries – – 203 203Other financial liabilities 5,976 5,976 5,321 5,321Derivative financial instruments 258 258 364 364
Total financial liabilities 13,952 14,491 13,602 13,903
Fair value is determined using the following methods and assumptions:
> The fair value of short-term financial instruments approximates carrying
value due to their short-term maturities. These include cash and cash
equivalents, dividends, interest and other receivables, premiums in course
of collection, accounts payable, repurchase agreements, dividends and
interest payable, and income tax payable.
> Shares and bonds are valued at quoted market prices, when available.
When a quoted market price is not readily available, alternative valuation
methods may be used. Mortgage loans are determined by discounting the
expected future cash flows at market interest rates for loans with similar
credit risks and maturities (refer to Note 1).
> Deposits and certificates are valued by discounting the contractual cash
flows using market interest rates currently offered for deposits with similar
terms and credit risks and maturities.
> Debentures and other borrowings are determined by reference to current
market prices for debt with similar terms, risks and maturities.
> Preferred shares are valued using quoted prices from active markets.
> Derivative financial instruments’ fair values are based on quoted market
prices, where available, prevailing market rates for instruments with similar
characteristics and maturities, or discounted cash flow analysis.
In accordance with adopted amendments to Canadian Institute of Chartered
Accountants Handbook Section 3862, Financial Instruments – Disclosures, the
Corporation’s assets and liabilities recorded at fair value have been categorized
based upon the following fair value hierarchy:
> Level 1 inputs utilize observable, quoted prices (unadjusted) in active
markets for identical assets or liabilities that the Corporation has the ability
to access. Financial assets and liabilities utilizing Level 1 inputs include
actively exchange-traded equity securities and mutual and segregated
funds which have available prices in an active market with no redemption
restrictions, liquid open-end investment fund units, and investments in
Government of Canada Bonds and Canada Mortgage Bonds in instances
where there are quoted prices available from active markets.
> Level 2 inputs utilize other-than-quoted prices included in Level 1 that are
observable for the asset or liability, either directly or indirectly. Level 2 inputs
include quoted prices for similar assets and liabilities in active markets, and
inputs other-than-quoted prices that are observable for the asset or liability,
such as interest rates and yield curves that are observable at commonly
quoted intervals. The fair values for some Level 2 securities were obtained
from a pricing service. The pricing service inputs include, but are not limited
to, benchmark yields, reported trades, broker/dealer quotes, issuer spreads,
two-sided markets, benchmark securities, offers and reference data. Level
2 securities include those priced using a matrix which is based on credit
quality and average life, government and agency securities, restricted
stock, some private bonds and equities, most investment-grade and high-
yield corporate bonds, certain asset-backed securities and some over the
counter derivatives.
> Level 3 inputs are unobservable and include situations where there is little,
if any, market activity for the asset or liability. The prices of the majority
of Level 3 securities were obtained from single-broker quotes and internal
pricing models. Financial assets and liabilities utilizing Level 3 inputs include
certain bonds, some private equities and investments in mutual and
segregated funds where there are redemption restrictions and certain over-
the-counter derivatives, non-bank-sponsored asset-backed commercial
paper, securitization receivables and derivative instruments.
NO T E 2 2 FA I R VA LU E OF F I N A NC I A L I NS T RU M EN T S
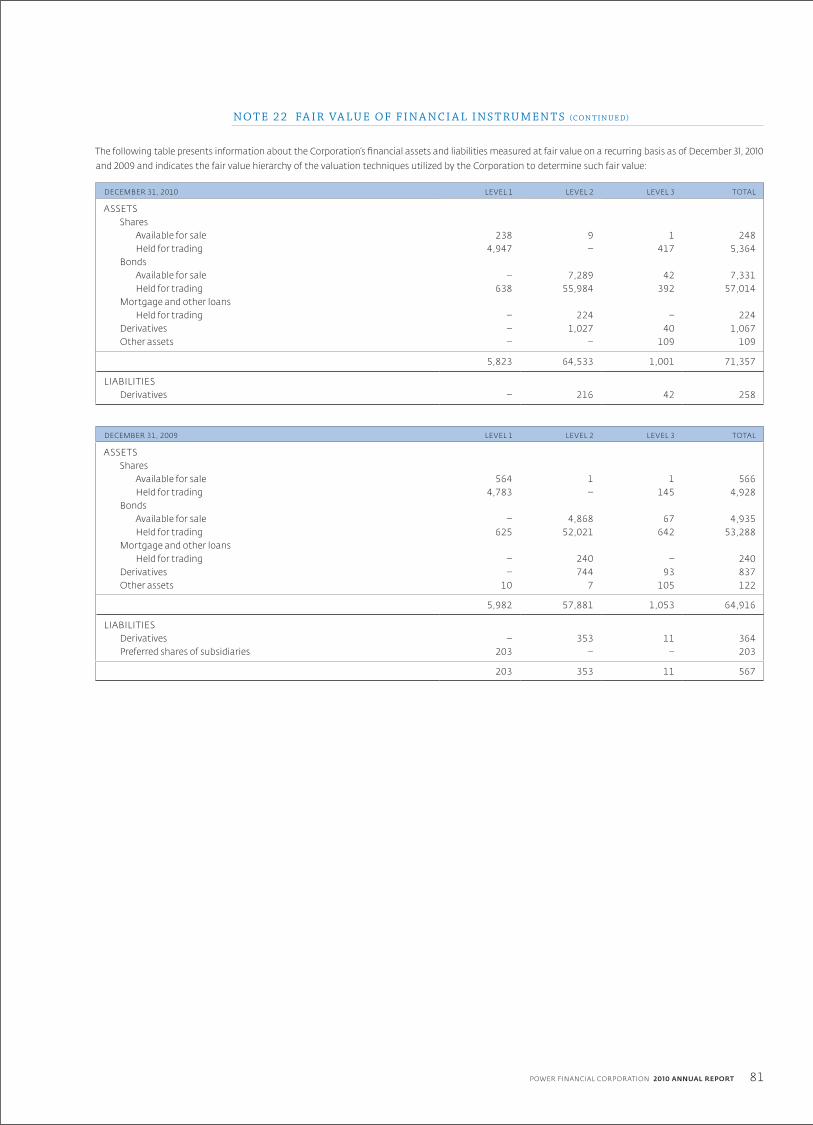
81POWER FINANCIAL CORPORATION 2010 ANNUAL REPORT
NO T E 2 2 FA I R VA LU E OF F I N A NC I A L I NS T RU M EN T S (C O N T I N U E D)
The following table presents information about the Corporation’s financial assets and liabilities measured at fair value on a recurring basis as of December 31, 2010
and 2009 and indicates the fair value hierarchy of the valuation techniques utilized by the Corporation to determine such fair value:
DECEMBER 31, 2010 LEVEL 1 LEVEL 2 LEVEL 3 TOTAL
ASSETSShares
Available for sale 238 9 1 248Held for trading 4,947 – 417 5,364
BondsAvailable for sale – 7,289 42 7,331Held for trading 638 55,984 392 57,014
Mortgage and other loansHeld for trading – 224 – 224
Derivatives – 1,027 40 1,067Other assets – – 109 109
5,823 64,533 1,001 71,357
LIABILITIESDerivatives – 216 42 258
DECEMBER 31, 2009 LEVEL 1 LEVEL 2 LEVEL 3 TOTAL
ASSETSShares
Available for sale 564 1 1 566Held for trading 4,783 – 145 4,928
BondsAvailable for sale – 4,868 67 4,935Held for trading 625 52,021 642 53,288
Mortgage and other loansHeld for trading – 240 – 240
Derivatives – 744 93 837Other assets 10 7 105 122
5,982 57,881 1,053 64,916
LIABILITIESDerivatives – 353 11 364Preferred shares of subsidiaries 203 – – 203
203 353 11 567
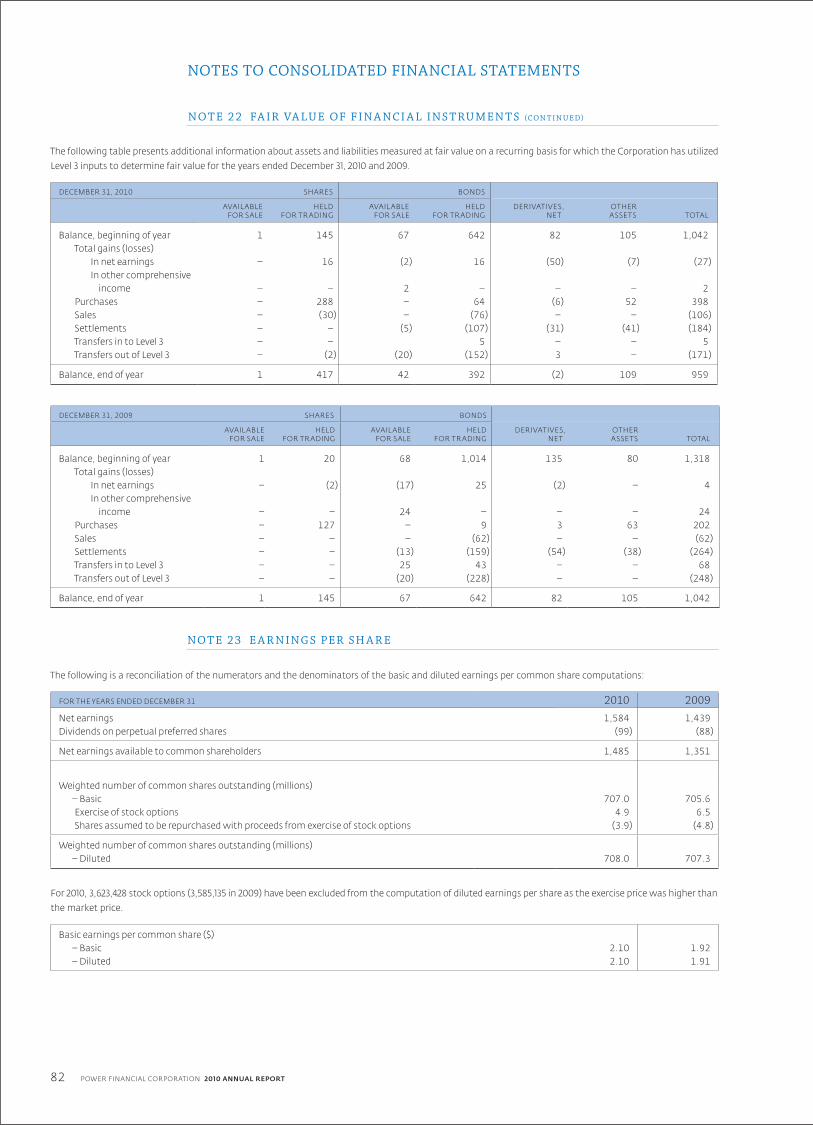
82
NOTES TO CONSOLIDATED FINANCIAL STATEMENTS
POWER FINANCIAL CORPORATION 2010 ANNUAL REPORT
The following table presents additional information about assets and liabilities measured at fair value on a recurring basis for which the Corporation has utilized
Level 3 inputs to determine fair value for the years ended December 31, 2010 and 2009.
DECEMBER 31, 2010 SHARES BONDS
AVAIL ABLEFOR SALE
HELDFOR TRADING
AVAIL ABLEFOR SALE
HELDFOR TRADING
DERIVATIVES,NET
OTHERASSETS TOTAL
Balance, beginning of year 1 145 67 642 82 105 1,042Total gains (losses)
In net earnings – 16 (2) 16 (50) (7) (27)In other comprehensive income – – 2 – – – 2
Purchases – 288 – 64 (6) 52 398Sales – (30) – (76) – – (106)Settlements – – (5) (107) (31) (41) (184)Transfers in to Level 3 – – 5 – – 5Transfers out of Level 3 – (2) (20) (152) 3 – (171)
Balance, end of year 1 417 42 392 (2) 109 959
DECEMBER 31, 2009 SHARES BONDS
AVAIL ABLEFOR SALE
HELDFOR TRADING
AVAIL ABLEFOR SALE
HELDFOR TRADING
DERIVATIVES,NET
OTHERASSETS TOTAL
Balance, beginning of year 1 20 68 1,014 135 80 1,318Total gains (losses)
In net earnings – (2) (17) 25 (2) – 4In other comprehensive income – – 24 – – – 24
Purchases – 127 – 9 3 63 202Sales – – – (62) – – (62)Settlements – – (13) (159) (54) (38) (264)Transfers in to Level 3 – – 25 43 – – 68Transfers out of Level 3 – – (20) (228) – – (248)
Balance, end of year 1 145 67 642 82 105 1,042
NO T E 23 E A R N I NGS PER SH A R E
The following is a reconciliation of the numerators and the denominators of the basic and diluted earnings per common share computations:
FOR THE YEARS ENDED DECEMBER 31 2010 2009Net earnings 1,584 1,439Dividends on perpetual preferred shares (99) (88)
Net earnings available to common shareholders 1,485 1,351
Weighted number of common shares outstanding (millions)– Basic 707.0 705.6Exercise of stock options 4.9 6.5Shares assumed to be repurchased with proceeds from exercise of stock options (3.9) (4.8)
Weighted number of common shares outstanding (millions)– Diluted 708.0 707.3
For 2010, 3,623,428 stock options (3,585,135 in 2009) have been excluded from the computation of diluted earnings per share as the exercise price was higher than
the market price.
Basic earnings per common share ($) – Basic 2.10 1.92– Diluted 2.10 1.91
NO T E 2 2 FA I R VA LU E OF F I N A NC I A L I NS T RU M EN T S (C O N T I N U E D)
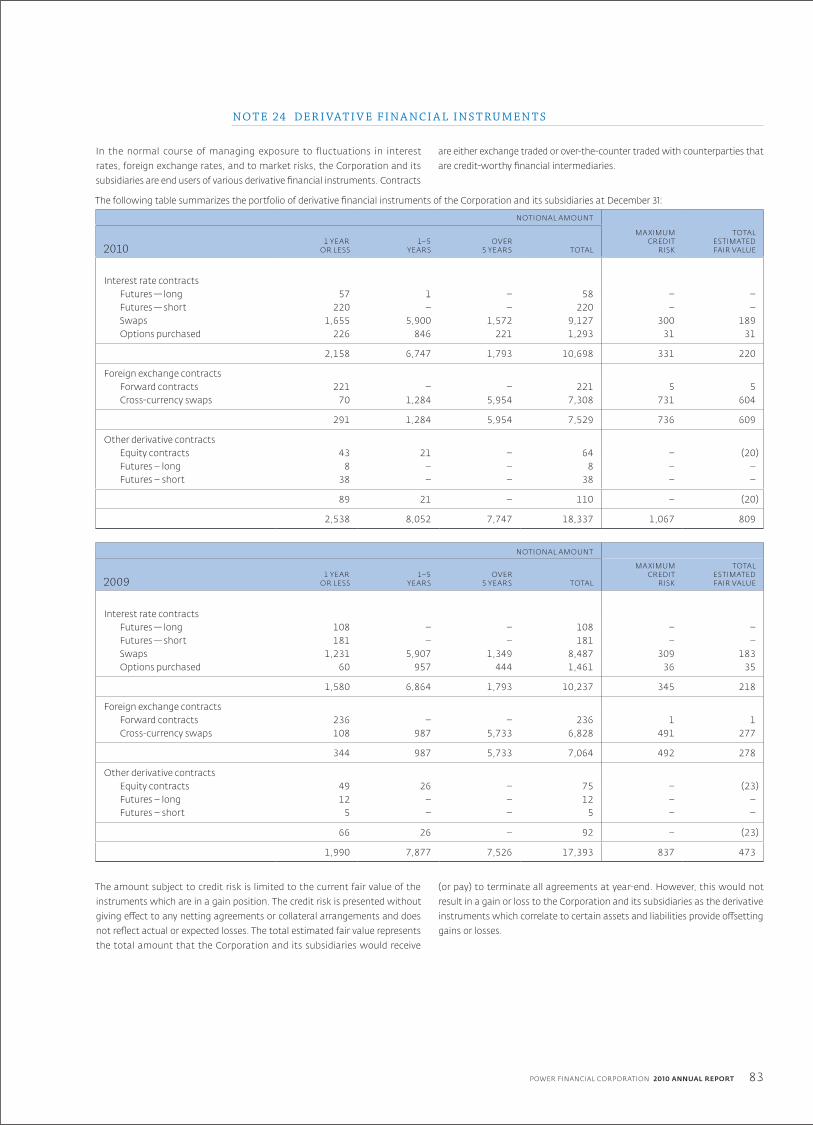
83POWER FINANCIAL CORPORATION 2010 ANNUAL REPORT
NO T E 24 DER I VAT I V E F I N A NC I A L I NS T RU M EN T S
In the normal course of managing exposure to fluctuations in interest
rates, foreign exchange rates, and to market risks, the Corporation and its
subsidiaries are end users of various derivative financial instruments. Contracts
are either exchange traded or over-the-counter traded with counterparties that
are credit-worthy financial intermediaries.
The following table summarizes the portfolio of derivative financial instruments of the Corporation and its subsidiaries at December 31:
NOTIONAL AMOUNT
20101 YEAR
OR LESS1–5
YEARSOVER
5 YEARS TOTAL
MA XIMUMCREDIT
RISK
TOTALESTIMATEDFAIR VALUE
Interest rate contractsFutures — long 57 1 – 58 – –Futures — short 220 – – 220 – –Swaps 1,655 5,900 1,572 9,127 300 189Options purchased 226 846 221 1,293 31 31
2,158 6,747 1,793 10,698 331 220
Foreign exchange contractsForward contracts 221 – – 221 5 5Cross-currency swaps 70 1,284 5,954 7,308 731 604
291 1,284 5,954 7,529 736 609
Other derivative contractsEquity contracts 43 21 – 64 – (20)Futures – long 8 – – 8 – –Futures – short 38 – – 38 – –
89 21 – 110 – (20)
2,538 8,052 7,747 18,337 1,067 809
NOTIONAL AMOUNT
20091 YEAR
OR LESS1–5
YEARSOVER
5 YEARS TOTAL
MA XIMUMCREDIT
RISK
TOTALESTIMATEDFAIR VALUE
Interest rate contractsFutures — long 108 – – 108 – –Futures — short 181 – – 181 – –Swaps 1,231 5,907 1,349 8,487 309 183Options purchased 60 957 444 1,461 36 35
1,580 6,864 1,793 10,237 345 218
Foreign exchange contractsForward contracts 236 – – 236 1 1Cross-currency swaps 108 987 5,733 6,828 491 277
344 987 5,733 7,064 492 278
Other derivative contractsEquity contracts 49 26 – 75 – (23)Futures – long 12 – – 12 – –Futures – short 5 – – 5 – –
66 26 – 92 – (23)
1,990 7,877 7,526 17,393 837 473
The amount subject to credit risk is limited to the current fair value of the
instruments which are in a gain position. The credit risk is presented without
giving effect to any netting agreements or collateral arrangements and does
not reflect actual or expected losses. The total estimated fair value represents
the total amount that the Corporation and its subsidiaries would receive
(or pay) to terminate all agreements at year-end. However, this would not
result in a gain or loss to the Corporation and its subsidiaries as the derivative
instruments which correlate to certain assets and liabilities provide offsetting
gains or losses.

84
NOTES TO CONSOLIDATED FINANCIAL STATEMENTS
POWER FINANCIAL CORPORATION 2010 ANNUAL REPORT
SWAPSInterest rate swaps, futures and options are used as part of a portfolio of
assets to manage interest rate risk associated with investment activities
and actuarial liabilities and to reduce the impact of fluctuating interest rates
on the mortgage banking operations and intermediary operations. Interest
rate swap agreements require the periodic exchange of payments without
the exchange of the notional principal amount on which payments are based.
Changes in fair value are recorded in net investment income in the Consolidated
Statements of Earnings.
Call options grant the Corporation and its subsidiaries the right to enter into
a swap with predetermined fixed-rate payments over a predetermined time
period on the exercise date. Call options are used to manage the variability
in future interest payments due to a change in credited interest rates and the
related potential change in cash flows due to surrenders. Call options are also
used to hedge minimum rate guarantees.
FOREIGN EXCHANGE CONTRACTSCross-currency swaps are used in combination with other investments
to manage foreign currency risk associated with investment activities
and actuarial liabilities. Under these swaps, principal amounts and fixed
and floating interest payments may be exchanged in different currencies.
The Corporation and its subsidiaries also enter into certain foreign exchange
forward contracts to hedge certain product liabilities.
OTHER DERIVATIVE CONTRACTSEquity index swaps, futures and options are used to hedge certain product
liabilities. Equity index swaps are also used as substitutes for cash instruments
and are used to periodically hedge the market risk associated with certain
fee income.
Lifeco may use credit derivatives to manage its credit exposure and for risk
diversification in its investment portfolio.
IGM manages its exposure to market risk on its securities by either entering
into forward sale contracts, purchasing a put option or by simultaneously
purchasing a put option and writing a call option on the same security.
NO T E 25 CON T I NGEN T L I A BI L I T I E S
The Corporation’s subsidiaries are from time to time subject to legal actions,
including arbitrations and class actions, arising in the normal course of business.
It is inherently difficult to predict the outcome of any of these proceedings with
certainty, and it is possible that an adverse resolution could have a material
adverse effect on the consolidated financial position of the Corporation.
However, based on information presently known, it is not expected that any
of the existing legal actions, either individually or in the aggregate, will have a
material adverse effect on the consolidated financial position of the Corporation.
Subsidiaries of Lifeco have declared partial windups in respect of certain
Ontario defined benefit pension plans which will not likely be completed
for some time. The partial windups could involve the distribution of the
amount of actuarial surplus, if any, attributable to the wound-up portion
of the plans. However, many issues remain unclear, including the basis of
surplus measurement and entitlement, and the method by which any surplus
distribution would be implemented. In addition to the regulatory proceedings
involving these partial windups, related proposed class action proceedings
have been commenced in Ontario related to certain of the partial windups. The
provisions for certain Canadian retirement plans in the amounts of $97 million
after tax established by Lifeco’s subsidiaries in the third quarter 2007 have been
reduced to $68 million. Actual results could differ from these estimates.
The Ontario Superior Court of Justice released a decision on October 1, 2010 in
regard to the involvement of the participating accounts of Lifeco subsidiaries
London Life and Great-West Life in the financing of the acquisition of London
Insurance Group Inc. (LIG) in 1997. Lifeco believes there are significant aspects of
the lower court judgment that are in error and Notice of Appeal has been filed.
Notwithstanding the foregoing, Lifeco has established an incremental provision
in the third quarter of 2010 in the amount of $225 million after tax ($204 million
and $21 million attributable to Lifeco’s common shareholder and to Lifeco’s non-
controlling interests, respectively). Lifeco now holds $310 million in after-tax
provisions for these proceedings. Regardless of the ultimate outcome of this
case, all of the participating policy contract terms and conditions will continue
to be honoured. Based on information presently known, the original decision,
if sustained on appeal, is not expected to have a material adverse effect on the
consolidated financial position of Lifeco.
Lifeco has entered into an agreement to settle a class action relating to the
provision of notice of the acquisition of Canada Life Financial Corporation
to certain shareholders of Canada Life Financial Corporation. The settlement
received Court approval on January 27, 2010 and is being implemented. Based
on information presently known, Lifeco does not expect this matter to have a
material adverse effect on its consolidated financial position.
Subsidiaries of Lifeco have an ownership interest in a U.S.-based private equity
partnership wherein a dispute has arisen over the terms of the partnership
agreement. Lifeco acquired the ownership interest in 2007 for purchase
consideration of US$350 million. Legal proceedings have been commenced
and are in their early stages. Legal proceedings have also commenced against
the private equity partnership by third parties in unrelated matters. Another
subsidiary of Lifeco has established a provision related to the latter proceedings.
While it is difficult to predict the final outcome of these proceedings, based on
information presently known, Lifeco does not expect these proceedings to have
a material adverse effect on its consolidated financial position.
In connection with the acquisition of its subsidiary Putnam, Lifeco has an
indemnity from a third party against liabilities arising from certain litigation
and regulatory actions involving Putnam. Putnam continues to have potential
liability for these matters in the event the indemnity is not honoured. Lifeco
expects the indemnity will continue to be honoured and that any liability
of Putnam would not have a material adverse effect on its consolidated
financial position.
NO T E 24 DER I VAT I V E F I N A NC I A L I NS T RU M EN T S (C O N T I N U E D)

85POWER FINANCIAL CORPORATION 2010 ANNUAL REPORT
NO T E 26 COM M I T M EN T S A N D GUA R A N T EE S
GUA R A N T EE SIn the normal course of operations, the Corporation and its subsidiaries execute
agreements that provide for indemnifications to third parties in transactions
such as business dispositions, business acquisitions, loans and securitization
transactions. The Corporation and its subsidiaries have also agreed to indemnify
their directors and certain of their officers. The nature of these agreements
precludes the possibility of making a reasonable estimate of the maximum
potential amount the Corporation and its subsidiaries could be required to
pay third parties as the agreements often do not specify a maximum amount
and the amounts are dependent on the outcome of future contingent events,
the nature and likelihood of which cannot be determined. Historically, the
Corporation has not made any payments under such indemnification
agreements. No amounts have been accrued related to these agreements.
S Y NDIC AT ED L E T T ER S OF CREDI TClients residing in the United States are required, pursuant to their insurance
laws, to obtain letters of credit issued on behalf of London Reinsurance Group
(LRG) from approved banks in order to further secure LRG’s obligations under
certain reinsurance contracts.
LRG has a syndicated letter of credit facility providing US$650 million in
letters of credit capacity. The facility was arranged in 2010 for a five-year term
expiring November 12, 2015. Under the terms and conditions of the facility,
collateralization may be required if a default under the letter of credit
agreement occurs. LRG has issued US$507 million in letters of credit under the
facility as at December 31, 2010 (US$612 million under a previous letter of credit
facility at December 31, 2009).
In addition, LRG has other bilateral letter of credit facilities totalling
US$18 million (US$18 million in 2009). LRG issued US$6 million in letters
of credit under these facilities as of December 31, 2010 (US$6 million at
December 31, 2009).
PL ED GING OF A SSE T SWith respect to Lifeco, the amounts of assets which have a security
interest by way of pledging is $9 million ($11 million in 2009) in respect of
derivative transactions and $554 million ($595 million in 2009) in respect
of reinsurance agreements.
COMMI T MEN T SThe Corporation and its subsidiaries enter into operating leases for office
space and certain equipment used in the normal course of operations. Lease
payments are charged to operations over the period of use. The future
minimum lease payments in aggregate and by year are as follows:
2011 2012 2013 2014 20152016 AND
THEREAFTER TOTAL
Future lease payments 146 129 107 86 71 216 755
NO T E 27 R EL AT ED PA RT Y T R A NS AC T IONS
In the normal course of business, Great-West Life provides insurance benefits to other companies within the Power Financial Corporation group of companies.
In all cases, transactions are done at market terms and conditions.
NO T E 28 SEGM EN T ED I N FOR M AT ION
The following strategic business units constitute the Corporation’s reportable
operating segments:
> Lifeco offers, in Canada, the United States and in Europe, a wide range of
life insurance, retirement and investment products, as well as reinsurance
and specialty general insurance products to individuals, businesses and
other private and public organizations.
> IGM offers a comprehensive package of financial planning services and
investment products to its client base. IGM derives its revenues from
a range of sources, but primarily from management fees, which are
charged to its mutual funds for investment advisory and management
services. IGM also earns revenue from fees charged to its mutual funds
for administrative services.
> Parjointco holds the Corporation’s interest in Pargesa, a holding company
which holds diversified interests in companies based in Europe active in
various sectors, including specialty minerals, water, waste services, energy,
and wines and spirits.
> The segment entitled Other is made up of corporate activities of the
Corporation and also includes consolidation elimination entries.
The accounting policies of the operating segments are those described in the
Significant Accounting Policies section above. The Corporation evaluates
the performance based on the operating segment’s contribution to
consolidated net earnings. Revenues and assets are attributed to geographic
areas based on the point of origin of revenues and the location of assets.
The contribution to consolidated net earnings of each segment is calculated
after taking into account the investment Lifeco and IGM have in each other.
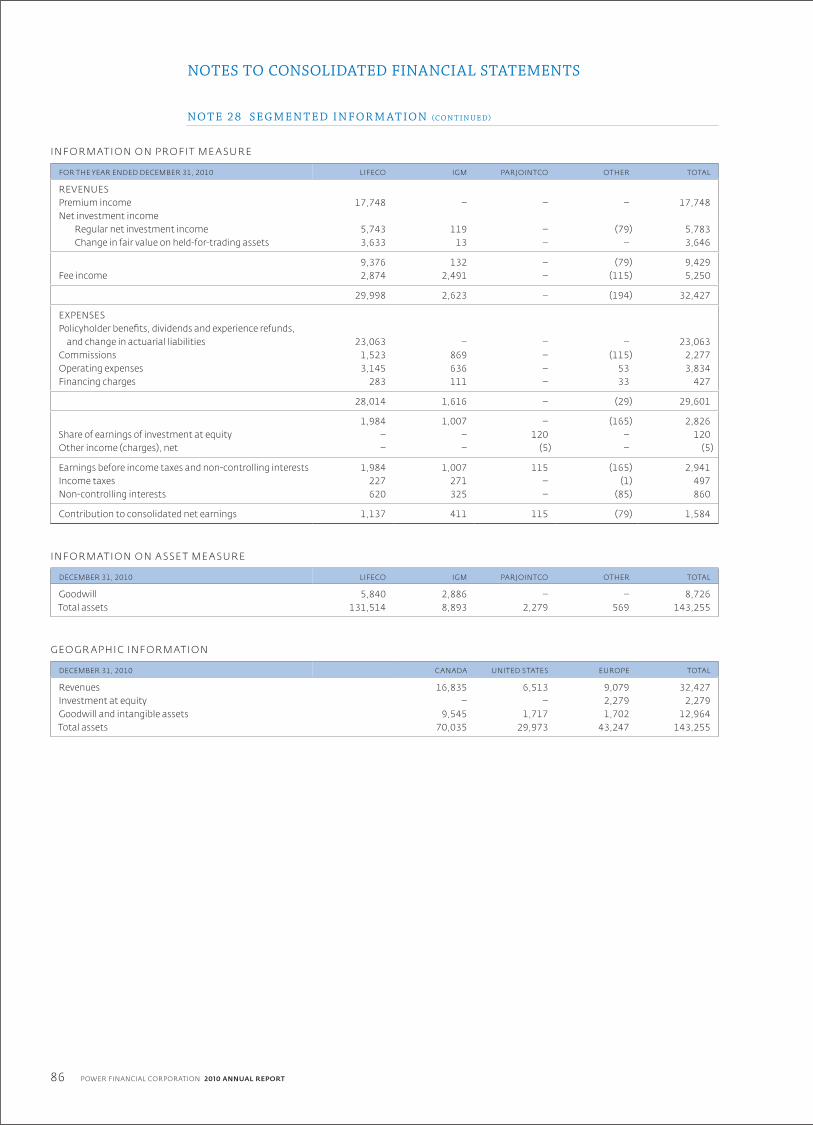
86
NOTES TO CONSOLIDATED FINANCIAL STATEMENTS
POWER FINANCIAL CORPORATION 2010 ANNUAL REPORT
NO T E 28 SEGM EN T ED I N FOR M AT ION (C O N T I N U E D)
INF ORM AT ION ON PROFI T ME A SURE
FOR THE YEAR ENDED DECEMBER 31, 2010 LIFECO IGM PARJOINTCO OTHER TOTAL
REVENUESPremium income 17,748 – – – 17,748Net investment income
Regular net investment income 5,743 119 – (79) 5,783Change in fair value on held-for-trading assets 3,633 13 – – 3,646
9,376 132 – (79) 9,429Fee income 2,874 2,491 – (115) 5,250
29,998 2,623 – (194) 32,427
EXPENSESPolicyholder benefits, dividends and experience refunds,
and change in actuarial liabilities 23,063 – – – 23,063Commissions 1,523 869 – (115) 2,277Operating expenses 3,145 636 – 53 3,834Financing charges 283 111 – 33 427
28,014 1,616 – (29) 29,601
1,984 1,007 – (165) 2,826Share of earnings of investment at equity – – 120 – 120Other income (charges), net – – (5) – (5)
Earnings before income taxes and non-controlling interests 1,984 1,007 115 (165) 2,941Income taxes 227 271 – (1) 497Non-controlling interests 620 325 – (85) 860
Contribution to consolidated net earnings 1,137 411 115 (79) 1,584
INF ORM AT ION ON A SSE T ME A SURE
DECEMBER 31, 2010 LIFECO IGM PARJOINTCO OTHER TOTAL
Goodwill 5,840 2,886 – – 8,726Total assets 131,514 8,893 2,279 569 143,255
GEO GR A PHIC INF ORM AT ION
DECEMBER 31, 2010 CANADA UNITED STATES EUROPE TOTAL
Revenues 16,835 6,513 9,079 32,427Investment at equity – – 2,279 2,279Goodwill and intangible assets 9,545 1,717 1,702 12,964Total assets 70,035 29,973 43,247 143,255

87POWER FINANCIAL CORPORATION 2010 ANNUAL REPORT
INF ORM AT ION ON PROFI T ME A SURE
FOR THE YEAR ENDED DECEMBER 31, 2009 LIFECO IGM PARJOINTCO OTHER TOTAL
REVENUESPremium income 18,033 – – – 18,033Net investment income
Regular net investment income 6,179 105 – (81) 6,203Change in fair value on held-for-trading assets 3,490 (27) – – 3,463
9,669 78 – (81) 9,666Fee income 2,839 2,250 – (91) 4,998
30,541 2,328 – (172) 32,697
EXPENSESPolicyholder benefits, dividends and experience refunds,
and change in actuarial liabilities 23,809 – – – 23,809Commissions 1,370 808 – (90) 2,088Operating expenses 2,946 614 – 47 3,607Financing charges 336 126 – 32 494
28,461 1,548 – (11) 29,998
2,080 780 – (161) 2,699Share of earnings of investment at equity – – 141 – 141Other income (charges), net – – (70) 12 (58)
Earnings before income taxes and non-controlling interests 2,080 780 71 (149) 2,782Income taxes 345 221 – (1) 565Non-controlling interests 617 247 – (86) 778
Contribution to consolidated net earnings 1,118 312 71 (62) 1,439
INF ORM AT ION ON A SSE T ME A SURE
DECEMBER 31, 2009 LIFECO IGM PARJOINTCO OTHER TOTAL
Goodwill 5,853 2,802 – – 8,655Total assets 128,369 8,646 2,675 541 140,231
GEO GR A PHIC INF ORM AT ION
DECEMBER 31, 2009 CANADA UNITED STATES EUROPE TOTAL
Revenues 15,989 6,715 9,993 32,697Investment at equity – – 2,675 2,675Goodwill and intangible assets 9,470 1,830 1,721 13,021Total assets 65,045 29,262 45,924 140,231
NO T E 28 SEGM EN T ED I N FOR M AT ION (C O N T I N U E D)

88 POWER FINANCIAL CORPORATION 2010 ANNUAL REPORT
INDEPENDENT AUDITOR’S REPORT
TO T HE SHA REHOL DER S OF P OW ER FINA NCIA L CORP OR AT IONWe have audited the accompanying consolidated financial statements of Power Financial Corporation, which comprise the consolidated balance sheets as at
December 31, 2010 and 2009, and the consolidated statements of earnings, comprehensive income, changes in shareholders’ equity and cash flows for the years
then ended, and a summary of significant accounting policies and other explanatory information.
M A NAGEMEN T ’ S RE SP ONSIBIL I T Y F OR T HE CONSOL IDAT ED FINA NCIA L S TAT EMEN T SManagement is responsible for the preparation and fair presentation of these consolidated financial statements in accordance with Canadian generally accepted
accounting principles and for such internal control as management determines is necessary to enable the preparation of consolidated financial statements that
are free from material misstatement, whether due to fraud or error.
AUDI TOR ’ S RE SP ONSIBIL I T YOur responsibility is to express an opinion on these consolidated financial statements based on our audits. We conducted our audits in accordance with Canadian
generally accepted auditing standards. Those standards require that we comply with ethical requirements and plan and perform the audit to obtain reasonable
assurance about whether the consolidated financial statements are free from material misstatement.
An audit involves performing procedures to obtain audit evidence about the amounts and disclosures in the consolidated financial statements. The procedures
selected depend on the auditor’s judgment, including the assessment of the risks of material misstatement of the consolidated financial statements, whether
due to fraud or error. In making those risk assessments, the auditor considers internal control relevant to the entity’s preparation and fair presentation of the
consolidated financial statements in order to design audit procedures that are appropriate in the circumstances, but not for the purpose of expressing an opinion
on the effectiveness of the entity’s internal control. An audit also includes evaluating the appropriateness of accounting policies used and the reasonableness of
accounting estimates made by management, as well as evaluating the overall presentation of the consolidated financial statements.
We believe that the audit evidence we have obtained in our audits is sufficient and appropriate to provide a basis for our audit opinion.
OPINIONIn our opinion, the consolidated financial statements present fairly, in all material respects, the financial position of Power Financial Corporation as at
December 31, 2010 and 2009, and the results of its operations and its cash flows for the years then ended in accordance with Canadian generally accepted
accounting principles.
March 10, 2011
Montréal, Québec
1 Chartered accountant auditor permit No. 18383
Signed
Deloitte & Touche LLP 1
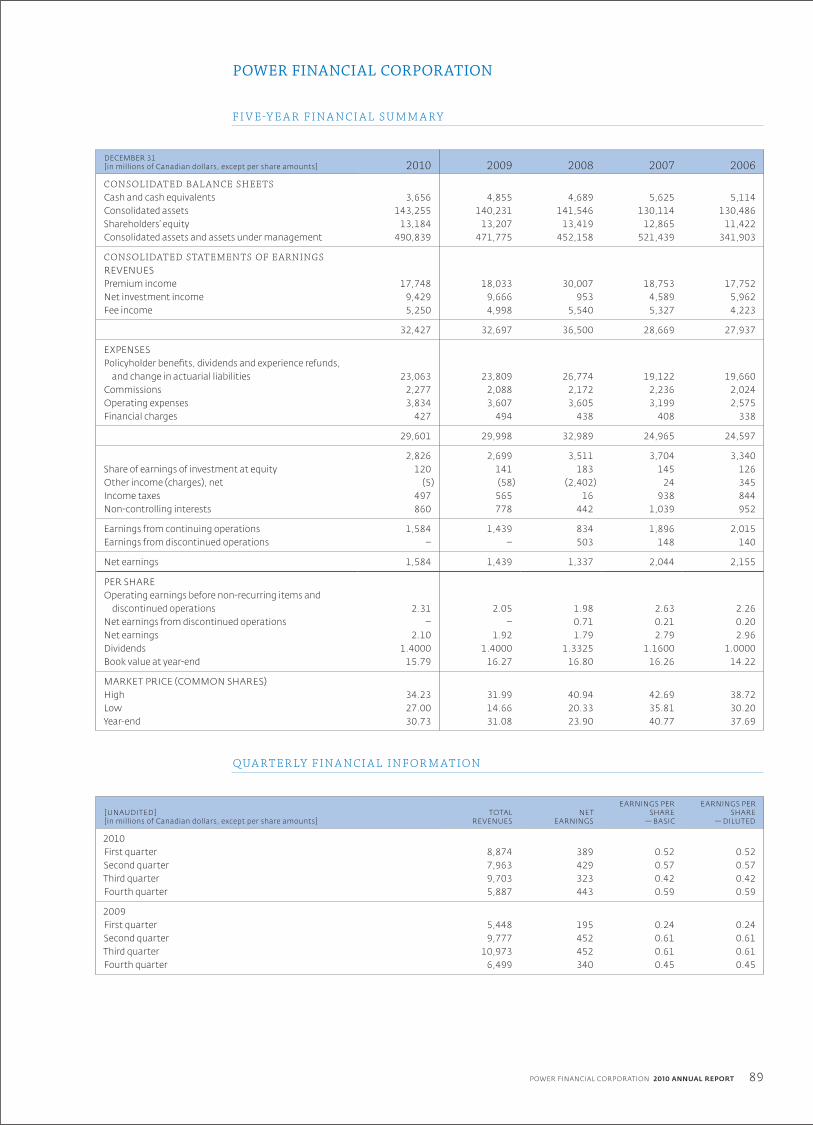
89POWER FINANCIAL CORPORATION 2010 ANNUAL REPORT
POWER FINANCIAL CORPORATION
F I V E-Y E A R F I N A NC I A L S U M M A RY
DECEMBER 31[in millions of Canadian dollars, except per share amounts] 2010 2009 2008 2007 2006
CONSOLIDATED BAL ANCE SHEETSCash and cash equivalents 3,656 4,855 4,689 5,625 5,114Consolidated assets 143,255 140,231 141,546 130,114 130,486Shareholders’ equity 13,184 13,207 13,419 12,865 11,422Consolidated assets and assets under management 490,839 471,775 452,158 521,439 341,903
CONSOLIDATED STATEMENTS OF EARNINGSREVENUESPremium income 17,748 18,033 30,007 18,753 17,752Net investment income 9,429 9,666 953 4,589 5,962Fee income 5,250 4,998 5,540 5,327 4,223
32,427 32,697 36,500 28,669 27,937
EXPENSESPolicyholder benefits, dividends and experience refunds,
and change in actuarial liabilities 23,063 23,809 26,774 19,122 19,660Commissions 2,277 2,088 2,172 2,236 2,024Operating expenses 3,834 3,607 3,605 3,199 2,575Financial charges 427 494 438 408 338
29,601 29,998 32,989 24,965 24,597
2,826 2,699 3,511 3,704 3,340Share of earnings of investment at equity 120 141 183 145 126Other income (charges), net (5) (58) (2,402) 24 345Income taxes 497 565 16 938 844Non-controlling interests 860 778 442 1,039 952
Earnings from continuing operations 1,584 1,439 834 1,896 2,015Earnings from discontinued operations – – 503 148 140
Net earnings 1,584 1,439 1,337 2,044 2,155
PER SHAREOperating earnings before non-recurring items and
discontinued operations 2.31 2.05 1.98 2.63 2.26Net earnings from discontinued operations – – 0.71 0.21 0.20Net earnings 2.10 1.92 1.79 2.79 2.96Dividends 1.4000 1.4000 1.3325 1.1600 1.0000Book value at year-end 15.79 16.27 16.80 16.26 14.22
MARKET PRICE (COMMON SHARES)High 34.23 31.99 40.94 42.69 38.72Low 27.00 14.66 20.33 35.81 30.20Year-end 30.73 31.08 23.90 40.77 37.69
QUA RT ER LY F I N A NC I A L I N FOR M AT ION
[UNAUDITED] [in millions of Canadian dollars, except per share amounts]
TOTAL REVENUES
NET EARNINGS
EARNINGS PER SHARE
— BASIC
EARNINGS PER SHARE
— DILUTED
2010First quarter 8,874 389 0.52 0.52Second quarter 7,963 429 0.57 0.57Third quarter 9,703 323 0.42 0.42Fourth quarter 5,887 443 0.59 0.59
2009First quarter 5,448 195 0.24 0.24Second quarter 9,777 452 0.61 0.61Third quarter 10,973 452 0.61 0.61Fourth quarter 6,499 340 0.45 0.45

90 POWER FINANCIAL CORPORATION 2010 ANNUAL REPORT
BOARD OF DIRECTORS
J. BRIAN AUNEPRESIDENT, ALDERVEST INC.
MARC A . BIBEAU[ 2 ]
PRESIDENT AND CHIEF EXECUTIVE OFFICER,
BEAUWARD SHOPPING CENTRES LTD.
ANDRÉ DESMARAIS, O.C., O.Q.[ 1, 5 ]
CO-CHAIRMAN OF THE CORPORATION
AND DEPUT Y CHAIRMAN, PRESIDENT AND
CO-CHIEF EXECUTIVE OFFICER,
POWER CORPORATION OF CANADA
THE HONOURABLE PAUL DESMARAIS, P.C., C.C., O.Q.[ 1,5 ]
CHAIRMAN OF THE EXECUTIVE COMMIT TEE,
POWER CORPORATION OF CANADA
PAUL DESMARAIS, JR ., O.C., O.Q.[ 1, 5 ]
CO-CHAIRMAN OF THE CORPORATION AND
CHAIRMAN AND CO-CHIEF EXECUTIVE OFFICER,
POWER CORPORATION OF CANADA
GÉRALD FRÈRE [ 3, 4 ]
MANAGING DIRECTOR, FRÈRE-BOURGEOIS S.A.
ANTHONY R . GRAHAM, LL.D.[ 5 ]
PRESIDENT, WIT TINGTON INVESTMENTS, LIMITED
ROBERT GRAT TONDEPUT Y CHAIRMAN,
POWER CORPORATION OF CANADA
V. PETER HARDER [ 3, 4 ]
SENIOR POLICY ADVISER,
FRASER MILNER CASGRAIN LLP
THE RIGHT HONOURABLE DONALD F. MAZANKOWSKI, P.C., O.C., A.O.E. [ 1 ]
COMPANY DIRECTOR
RAYMOND L . MCFEETORSVICE-CHAIRMAN OF THE CORPORATION
AND CHAIRMAN, GREAT-WEST LIFECO INC.
JERRY E.A . NICKERSON [ 2 ]
CHAIRMAN OF THE BOARD,
H.B. NICKERSON & SONS LIMITED
R . JEFFREY ORR [ 1 ]
PRESIDENT AND CHIEF EXECUTIVE OFFICER
OF THE CORPORATION
MICHEL PLESSIS-BÉL AIR , FCAVICE-CHAIRMAN,
POWER CORPORATION OF CANADA
HENRI-PAUL ROUSSEAU, Ph.D.VICE-CHAIRMAN OF THE CORPORATION
AND OF POWER CORPORATION OF CANADA
LOUISE ROY, O.Q.INVITED FELLOW, CENTRE INTERUNIVERSITAIRE
DE RECHERCHE EN ANALYSE DES ORGANISATIONS
AND PRESIDENT, CONSEIL DES ARTS DE MONTRÉAL
RAYMOND ROYER , O.C., O.Q., FCA [ 1, 2, 3, 4, 5 ]
COMPANY DIRECTOR
AMAURY DE SEZEVICE-CHAIRMAN OF THE CORPORATION
EMŐKE J.E. SZATHMÁRY, C.M., O.M., Ph.D. [ 2 ]
PRESIDENT EMERITUS,
UNIVERSIT Y OF MANITOBA
DIRECTORS EMERITUS
JAMES W. BURNS, O.C., O.M.
THE HONOURABLE P. MICHAEL PITFIELD, P.C., Q.C.
[ 1 ] MEMBER O F T HE E XEC U T I V E CO MMI T T EE
[ 2 ] MEMBER O F T HE AUDI T CO MMI T T EE
[ 3 ] MEMBER O F T HE COMPENS AT IO N CO MMI T T EE
[ 4 ] MEMBER O F T HE R EL AT ED PA RT Y A ND CONDUC T R E V IE W CO MMI T T EE
[ 5 ] MEMBER O F T HE G OV ER N A NCE A ND NO MIN AT ING CO MMI T T EE
91POWER FINANCIAL CORPORATION 2010 ANNUAL REPORT
OFFICERS
PAUL DESMARAIS, JR ., O.C., O.Q.
CO-CHAIRMAN
ANDRÉ DESMARAIS, O.C., O.Q.
CO-CHAIRMAN
R . JEFFREY ORRPRESIDENT AND CHIEF EXECUTIVE OFFICER
RAYMOND L . MCFEETORSVICE-CHAIRMAN
HENRI-PAUL ROUSSEAU, Ph.D.VICE-CHAIRMAN
AMAURY DE SEZEVICE-CHAIRMAN
PHILIP K . RYANEXECUTIVE VICE-PRESIDENT
AND CHIEF FINANCIAL OFFICER
EDWARD JOHNSONSENIOR VICE-PRESIDENT, GENERAL COUNSEL
AND SECRETARY
ARNAUD VIALSENIOR VICE-PRESIDENT
JOCELYN LEFEBVRE, C.A.MANAGING DIRECTOR,
POWER FINANCIAL EUROPE B.V.
DENIS LE VASSEUR , C.A.VICE-PRESIDENT AND CONTROLLER
STÉPHANE LEMAYVICE-PRESIDENT, ASSISTANT GENERAL
COUNSEL AND ASSOCIATE SECRETARY
RICHARD PANVICE-PRESIDENT
LUC RENY, CFAVICE-PRESIDENT
ISABELLE MORIN, C.A.TREASURER

92 POWER FINANCIAL CORPORATION 2010 ANNUAL REPORT
CORPORATE INFORMATION
Additional copies of this Annual Report, as well as copies of the annual report
of Power Corporation of Canada, are available from the Secretary:
POWER FINANCIAL CORPORATION
751 Victoria Square
Montréal, Québec
Canada H2Y 2J3
Suite 2600, Richardson Building
1 Lombard Place
Winnipeg, Manitoba
Canada R3B 0X5
STOCK LISTINGS
Shares of Power Financial Corporation are listed on the Toronto Stock Exchange,
under the following listings:
COMMON SHARES: PWF
FIRST PREFERRED SHARES:
Series A: PWF.PR.A
Series D: PWF.PR.E
Series E: PWF.PR.F
Series F: PWF.PR.G
Series H: PWF.PR.H
Series I: PWF.PR.I
Series K: PWF.PR.K
Series L: PWF.PR.L
Series M: PWF.PR.M
Series O: PWF.PR.O
Series P: PWF.PR.P
TRANSFER AGENT AND REGISTRAR
Computershare Investor Services Inc.
Offices in:
Montreal (QC); Toronto (ON)
www.computershare.com
SHAREHOLDER SERVICES
Shareholders with questions relating to the payment of dividends, change of address
and share certificates should contact the Transfer Agent:
Computershare Investor Services Inc.
Shareholder Services
100 University Avenue, 9th Floor
Toronto, Ontario M5J 2Y1
Telephone: 1-800-564-6253 (toll-free in Canada and the U.S.) or 514-982-7555
www.computershare.com
WEB SITE
www.powerfinancial.com
Si vous préférez recevoir ce rapport annuel en français, veuillez vous adresser au secrétaire,
CORPORATION FINANCIÈRE POWER
751, square Victoria
Montréal (Québec)
Canada H2Y 2J3
Bureau 2600, Richardson Building
1 Lombard Place
Winnipeg (Manitoba)
Canada R3B 0X5
The trademarks contained in this report are owned by Power Financial Corporation, or a member of the Power Corporation group of companies™. Trademarks that are not owned by Power Financial Corporation are used with permission.


PR
INT
ED
IN
CA
NA
DA