Embed Size (px)
Citation preview

ANNUAL REPORT AND FINANCIAL STATEMENTS
Company Registration N°5321714 (England and Wales)
2016

Page 2
Contents
Part I Board of Directors and secretary
Chairman’s statement
Chief Executive Officer’s review
Strategic report
Directors’ report
Statement of Directors’ responsibilities
Independent auditor’s report
Part II Statement of profit or loss
Statement of other comprehensive income
Statement of financial position
Statement of changes in equity
Statement of cash flows
Notes to the financial statements

Page 3
Part I
Board of Directors and secretary - 04
Chairman’s statement - 05
Chief Executive Officer’s review- 06
Strategic report - 07
Directors’ report - 14
Statement of Directors’ responsibilities - 15
Independent Auditor’s report - 16

Page 4
BOARD
Independent Non-executive Director - Chairman Executive Director – Chief Executive Officer
David SURATGAR Mohammed AFRINE
Independent Non-executive Director Non-executive Director Non-executive Director
Colin FISHER Brahim BENJELLOUN-TOUIMI Mohammed AGOUMI
SECRETARY
TMF Corporate Administration Services Limited
AUDITOR
Mazars LLP
Chartered accountants and statutory auditor
Tower Bridge House
St. Katharine’s Way
London
E1W 1DD
REGISTERED OFFICE
26 Upper Brook Street
London
W1K 7QE
BANKERS
Barclays Bank plc
1st Floor
99 Hatton Gardens
London
EC1N 8DN
BMCE BANK International plc
Registered in England No. 5321714
Bo
ard
of
Dir
ecto
rs a
nd
Sec
reta
ry

Page 5
Chairman’s statement
It is a pleasure to present the 2016 financial results of BMCE Bank International plc. Notwithstanding the challenges of the changing international economic and trade environment, the Bank has delivered a strong performance. Our progress is clearly continuing.
2016 was a year of evolving and more stringent regulation. It was also a year during which the United Kingdom somewhat unexpectedly voted to leave the European Union. ‘Brexit’ resulted in a significant devaluation of sterling and a degree of uncertainty in the plans of many foreign-owned banks in London with operations in other countries of the EU.
The election in the United States also created some concerns about interest rates and the potential problems for international trade. The emerging markets experienced a better performance than some observers had forecast and Africa, with certain exceptions, continued to prove a good market for a Bank such as BMCE Bank International with its focus on trade and project finance and treasury capital market transactions. The efforts of the Government of Morocco and our parent bank BMCE, and the whole BMCE-Bank of Africa Group, to develop close trade and economic development links in Africa has continued to provide us with a wealth of opportunities. We seek to foster the synergies for a solid well measured growth in the region.
BMCE Bank International plc recorded a net profit of £8,584k for the year ended 31 December 2016 producing a 14.1% return shareholder’s equity over the period. The capital adequacy ratio remained high at 16.9%.
Our corporate governance and the structure of the
operations of the BMCE-Bank of Africa Group in Europe are the subject of review in the light of the Brexit timetable. While we await the outcome of decisions affecting international banks operating in London and elsewhere in the EU, our business model remains valid.
We have moved to strengthen our Board by inviting two experienced bankers to join us : Ralph Snedden who has a background in accounting and regulatory affairs in both the UK and Europe, and Richard Parry with a wide background in project finance and African economic development. We welcome them as independent non-executive directors. We have also moved to strengthen the management resources of our Paris branch and our Compliance Department.
The Bank has what we believe is an experienced multinational team with the necessary experience and technical skills required to continue to be a profitable key arm of the BMCE-Bank of Africa Group active in international capital markets.
To summarise, the period of 2013 through 2016 has been a period characterised by BMCE Bank International’s recovery and implementation of a reconstruction plan following the financial crisis in international markets. We have recovered a considerable amount of the losses experienced in the period up to 2013. We are now moving into a period in which we have all the elements necessary for accelerating our progress and benefiting in every way possible from the synergies of the BMCE-Bank of Africa Group.
It is our ambition to use our important position to improve services to our clients, work within the regulatory framework in which we are required to operate and to operate within the agreed and carefully designed appetite for risk that we have put in place. The IT problems that beset us in recent years have now finally been brought under control of a new system designed to provide efficient and timely data to our regulators and to our parent.
Ch
airm
an’s
sta
tem
ent

Page 6
Chief Executive Officer’s review
Our bank, BMCE Bank International plc (BBI plc), is a London-based investment bank acting as the Gateway for Africa.
We are wholly owned by a pan-African Group, BMCE Bank of Africa, the 2nd largest private bank in Morocco and present in more than 30 countries all over the world.
Our Bank’s core businesses are Commodities Trade Finance, Project Finance and Treasury & Capital Markets.
2016 was affected by certain political events resulting in economic consequences. In United Kingdom, we dealt with the Brexit referendum and the decision to leave the European Union. Furthermore, widely, we can highlight the presidential elections in certain countries.
2016 was also the year in which the Federal Reserve System increased the interest rate for the second time since 2006, and a very difficult economic year for some African countries, especially those affected by the fall in prices of commodities.
Despite uncertainty of 2016 context, we have been able to demonstrate our business model sustainability, continuing to strengthen our structure by being more resilient and by reinventing ourselves for a high growth.
We were able to over-achieve our target and realise outstanding achievements.
For the 5th consecutive year, we recorded a positive Net Profit and reached £8,584k
for the year ended 31 December 2016, a 10.1% rise comparatively to 2015.
The Total shareholder’s equity increased by 17.9% to record £71,557k generating a 14.1%
return shareholder’s equity over the period.
Regulations
We ensure that our activities are led in accordance with all relevant regulations and laws and within a safe, secure and appropriate environment for the client.
We have been very receptive to obligations with regard to conduct risk and acquired new skills and expertise to ensure that the customer is at the heart of our business.
In a context of robust financial obligations and to comply with regulatory requirements, we maintained an adequate liquidity position. About this subject, we received strong support from our Parent Company.
2016 has been a successful year in terms of diversification. Our main concern was about our Solvency issue, which has been succesfully monitored and managed to ensure that the capital held was always adequate to support the businesses transacted.
Our bank continued to constantly keep an eye on new regulations and directives. We updated our anti-money laundering and sanction control procedures to ensure that BBI plc is fully compliant.
Furthermore, we launched and completed our IT Project. This project is a strategic investment for us, to enable a sustainable growth of our business model.
It is an Information System (IS) oriented and used essentially for the Regulatory Reporting intended for the PRA. Beyond regulatory reporting, this IS is our leverage to build new opportunities, for enhancing quality, reliability and the management of our reporting.
Our values promote Client focus, Ethical Behaviour, Boldness, Passion and Aspiration.
Development
We still pursue our strategy of business development and continue a geographical and sectorial diversification of our portfolio and commitments. We strongly believe that the challenges set will be successfully achieved.
We create wealth through our business diversification, supported by our most valuable asset, our people.
As our people are our key to success, we created in 2016 the Human Capital and Communication Department to sustain our growth through a strong HR vision and strategy.
“We create wealth through our business
diversification, supported by our most
valuable asset, our people.”
Mohammed AFRINE
Ch
ief
Exec
uti
ve O
ffic
er’s
rev
iew

Page 7
Strategic Report
The Directors present their Strategic Report for BMCE Bank International plc (“the Bank”) for the year ended 31 December 2016.
Our Strategic priorities and progress
❶ Organisation of governing bodies
Corporate Governance continues to be a key area focus. Its goal is to ensure an effective decision making process throughout the business. Governance within the Bank is achieved by the following bodies:
• The Board of Directors consisting of five Non-Executive Directors of which three are independent Non-Executive and the Chief Executive Officer, and others regularly invited including the Managing Director and Head of Risk, the Chief Financial Officer and the Head of Internal Audit. The Board approves the overall strategy and the broad guidelines of BBI plc.
• The Risk Committee consists of two non-executive Directors. The Managing Director and Head of Risk has a standing invitation. Other members of the Board, the Chief Executive Officer, the Chief Financial Officer and the Head of Internal Audit are invited. The Risk Committee monitors and assesses the adequacy and effectiveness of risk management policies and processes. It monitors the full range of risks, financial and non-financial, including credit, market, liquidity, funding, capital, operational and regulatory risks.
• The Audit Committee consists of two Non-Executive Directors. The Head of Internal Audit has a standing invitation. The Chairman of the Board, the Chief Executive Officer, other members of the Board, and Departmental Heads, example, the Chief Financial Officer, the Head of Risk are regularly invited. The committee monitors the adequacy and effectiveness of controls, processes, governance, integrity of financial statements and objectivity of internal and external auditors.
• The Remuneration Committee is headed by a non-executive Director. According to best practices, this committee is established to ensure that remuneration arrangements support our business strategic aims and enable the recruitment, motivation and retention of senior executives, while also complying with the requirements of regulation.
• Other committees involved in the decision making processes of BBI plc are:
– Executive Committee
– Asset and Liability Committee
– Credit Committee
– Steering and Control Committee for Paris branch
• Our upcoming committees in 2017 are:
– Human Capital and Communication Committee
– Compliance Committee
❷ Upgrading of information technology system
Our constant goal is to improve our IT system.
In 2016, the Bank has launched and completed the IT Project. This project is a strategic investment for us, for getting a sustainable growth of our business model. It is an Information System oriented and used essentially for the Regulatory Reporting intended for the PRA. Beyond regulatory reporting, this IS is our leverage to build new opportunities, for enhancing quality, reliability and the management of our reporting.
❸ Diversification of our investment bank
• BBI plc still continues its efforts to transition towards becoming an investment bank with a particular focus on developing African business.
• The business advisory, fund manager and brokerage of asset business streams are ongoing project to be fully established. We still aim to be the benchmark for investment in Africa with a complete portfolio of Banking products.
❹ Achievement of business objectives
• Achieving our goals was undoubtedly a result of continuing our sales oriented efforts with on-going cost control and further optimisation of the risk return.
• Commercial efforts: Remaining dynamic on marketing and communication by sponsoring several events, attending many meetings and conferences related to business in Africa.
• Group Synergies: Capitalising on the BMCE Bank of Africa brand for the acquisition of new customers and continually being a key player for creating synergies within the BMCE Bank of Africa Group. Several successful combined transactions with other entities of the Group generated substantial revenues at Group level. We are developing our network and co-financing projects with other subsidiaries of BMCE Bank of Africa. We are still expecting strong benefits from Group synergies for both of the components "Buy Side" and "Sell Side".
Stra
tegi
c re
po
rt
Page 8
Strategic Report (continued)
❹ Achievement of business objectives
• Diversification: Emphasising the geographic and sectoral diversification of our "Target Market”. BBI plc diversified its sources of funding including other banks outside the BMCE Group and in taking more deposits from corporate customers.
• Risks: Maintaining the level of "Risk Appetite" as approved by the Board. BBI plc Risk Appetite has been reviewed and we have delivered enhanced risk management practices with risk limits aligned to a carefully considered business strategy.
• Focusing in working to enhance our system of governance and control to ensure that we are operating in an efficient manner.
Economical overview
❶ Sub Sahara Environment
Sub-Saharan Africa is set to drop its GDP’s growth to its lowest level for a couple of decades, reflecting the adverse external environment, and a lacklustre policy response in many countries.
The aggregate picture is showing multispeed growth: while most of non-resource-intensive countries—half of the countries in the region—continue to perform well, as they benefit from lower oil prices, an improved business environment, and continued strong infrastructure investment, most commodity exporters are under severe economic strain. This is particularly the case for oil exporters whose near-term prospects have worsened significantly in recent months and have seen their ratings being downgraded. Sub-Saharan Africa remains a region of immense economic potential, but policy adjustment in the hardest-hit countries needs to be enacted promptly to allow for a growth rebound.
❷ International and Local Environment : Brexit…
The UK took a historic decision in 2016 by voting for Brexit. As a consequence, there was an initial drop in both Consumer Confidence and UK business confidence indexes which has since rebounded. The UK has been downgraded just after the Brexit vote.
The lack of confidence has increased significantly across western countries and more generally, advanced countries. This situation has delayed the interest rate rise in 2016.
Globally, 2016 left us with slight figures than expected. However, the rebound in the fourth quarter and the increase in commodities prices gave more hope for a better 2017.
Risk Management Framework
BBI plc adopts the risk management model known as the ‘three lines of defence’ governance model. This is the model of risk management that allows the Board to implement and control the decisions on strategy, risk and capital that are taken by the Board.
This model allows BBI plc to implement effective risk management and a risk culture.
The Board of Directors has ultimate accountability for risk management. Together, with various committees within BBI plc and risk policies , they are an integral part of BBI plc’s Risk management framework.
BBI plc is committed to ensure that its risk management framework is robust, up to date and in line with best practice.
BBI plc periodically reviews its risk appetite and ensures that it is in line with the current environment, the strategy of BBI plc and budgets. This is provided in both business as usual and stressed conditions.
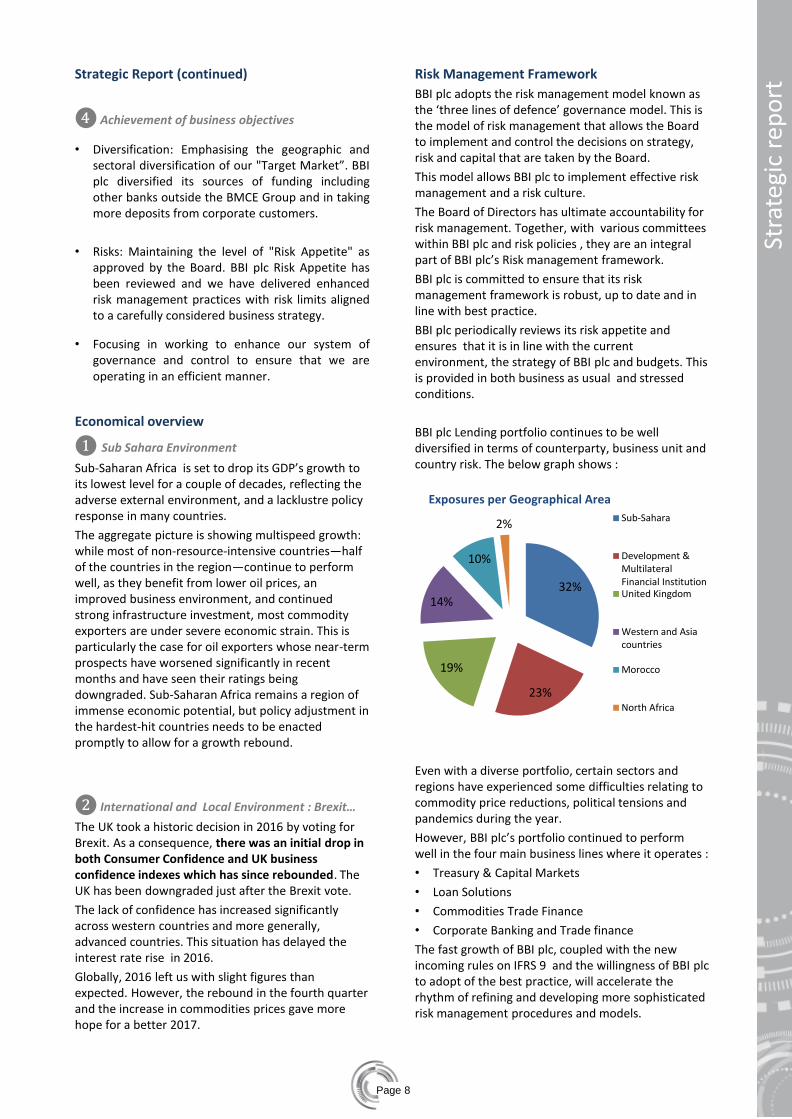
BBI plc Lending portfolio continues to be well diversified in terms of counterparty, business unit and country risk. The below graph shows :
Even with a diverse portfolio, certain sectors and regions have experienced some difficulties relating to commodity price reductions, political tensions and pandemics during the year.
However, BBI plc’s portfolio continued to perform well in the four main business lines where it operates :
• Treasury & Capital Markets
• Loan Solutions
• Commodities Trade Finance
• Corporate Banking and Trade finance
The fast growth of BBI plc, coupled with the new incoming rules on IFRS 9 and the willingness of BBI plc to adopt of the best practice, will accelerate the rhythm of refining and developing more sophisticated risk management procedures and models.
Stra
tegi
c re
po
rt
32%
23%
19%
14%
10%
2%
Exposures per Geographical Area
Sub-Sahara
Development &MultilateralFinancial InstitutionUnited Kingdom
Western and Asiacountries
Morocco
North Africa

Page 9
Strategic Report (continued)
❶ Credit Risk
Credit risk is the current or prospective risk to earnings or capital arising from an obligor’s failure to meet the terms of a contract with BBI plc or its failure to perform as agreed.
The credit risk includes counterparty risk, settlement risk and concentration risk.
BBI plc faces credit risk on its exposure to sovereigns and corporates from its capital markets, corporate banking and project finance businesses, and from its exposure to financial institutions and corporates from its trade finance and treasury activities.
BBI plc has a detailed credit policy and procedures manual providing operating model and information on how the credit risk management processes are embedded in the business and overseen at the highest level within BBI plc.
BBI plc continues to act on the financial market, providing solutions, products and services accordingly with the defined risk appetite and within the governance in place for approving any credit risk.
Credit risk is the main risk in BBI plc as shown here below:
The lending portfolio of BBI plc increased significantly during the last four years, whilst the non performing loan has managed to stay at a reasonable level.
In 2016, BBI plc have recorded £0.9 million provision related to a single exposure.
BBI plc do not have significant open positions on derivative products. The results coming from these products are mainly due to commercial transactions. BBI do only FX swaps or interest rate swaps. The Capital requirement related to counterparty exposure for these products is calculated based on the standard approach and is not material.
❷ Market Risk
Market risk covers the risks that arise from fluctuations in the values of, or income from tradable assets, in particular arising from changes in interest rates, foreign currency exchange rates, and the market prices of equities and commodities.
BBI is exposed to specific and general interest rate risk on its holdings of treasury and corporate bonds in the AFS book and the risk from trading foreign exchange.
The financial instruments (bond) portfolio is treated as a AFS book position for capital calculations.
The fixed income portfolio represents 30% of Total balance-sheet.
10% of the fixed income portfolio is classified as HTM and therefore is not considered as interest risk.
On the remaining portfolio, 35% is High Quality Liquid Assets and rated above AA-.
Only minimal currency risk will arise from BBI plc’s fixed income activity as the purchase of most securities denominated in foreign currency will be funded on a matched basis.
Currency risk will arise, however, from BBI plc’s trading in foreign exchange (mainly spot, forwards and at a later stage options). BBI plc manages an open position accordingly with its risk appetite.
Market risk in the banking book may arise from corporate banking activities; all market risk arising from this business will be passed to the trading book for active management and will therefore attract the additional capital requirements for interest rate and foreign exchange risk set out above.
❸ Operational Risk
Operational risk is the risk of loss resulting from inadequate or failed internal processes, people and systems, or from external events. BBI plc has been using the Basic Indicator Approach. It is the intention of BBI to move in due course to the new Approach. BBI plc is therefore implementing the risk assessment and monitoring techniques which are required by this approach.
BBI plc continue to have a sound reputation and to steer its operational risk carefully and according to best practices.
BBI plc is fully dedicated to the management of operational risks. The framework aims to:
• Master losses generated by operational risk;
• Improve control of operations where necessary;
• Putting in place adequate performance measurement and early warning signals; and
• Enhancing operational risk awareness and culture.
Stra
tegi
c re
po
rt
70%
23%
7%
Capital Requirement per kind of risk
Capital Requirementfor Credit Risk
Capital Requirementfor Market Risk
Capital requirementfor Operational Risk
Page 10
Stra
tegi
c re
po
rt
Strategic Report (continued)
❹ Liquidity Risk
Liquidity risk is the risk that a firm, although solvent, either does not have available sufficient financial resources to enable it to meet its obligations as they fall due, or can secure such resources only at excessive cost. The liquidity ratio of BBI plc has continued to be well above the regulatory requirement and also well above the internal constraint, showing a comfortable liquidity position.
BBI plc monitors its liquidity very closely and within the Risk Tolerance approved by the Board.
These internal limits are benchmarked against the Individual Liquidity Guidance to ensure they are at least as stringent.
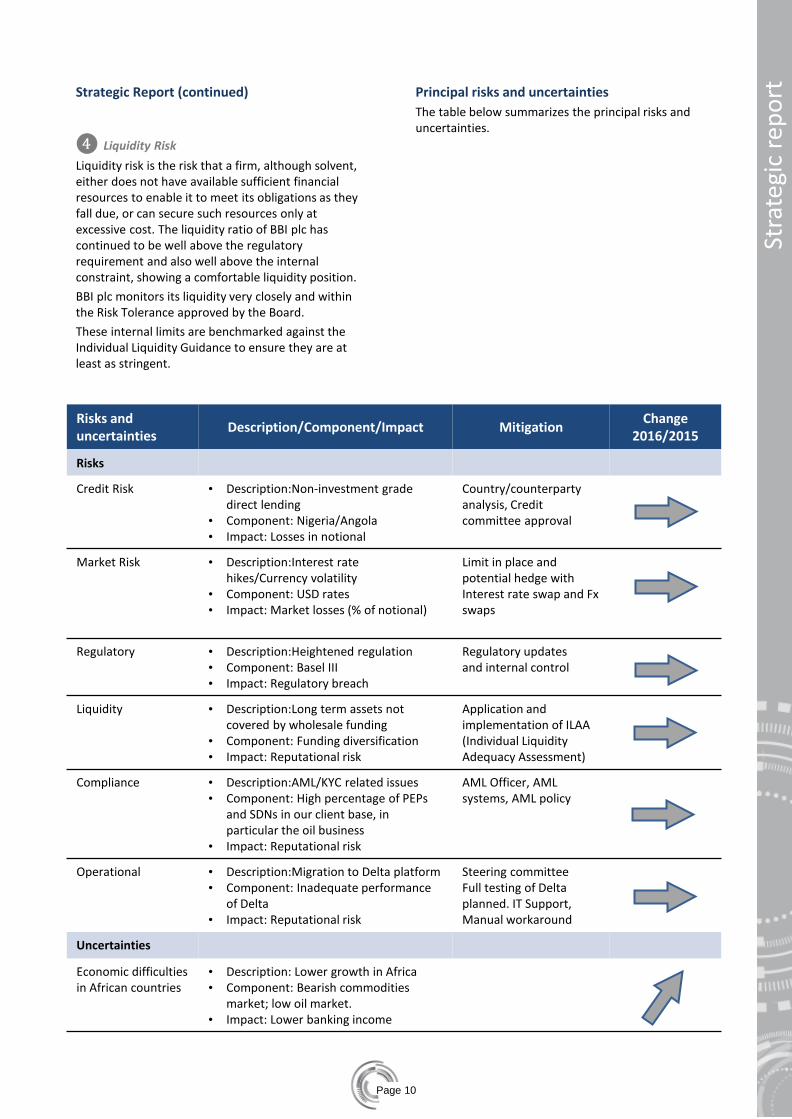
Principal risks and uncertainties
The table below summarizes the principal risks and uncertainties.
Risks and uncertainties
Description/Component/Impact Mitigation Change
2016/2015
Risks
Credit Risk
• Description:Non-investment grade direct lending
• Component: Nigeria/Angola • Impact: Losses in notional
Country/counterparty analysis, Credit committee approval
Market Risk • Description:Interest rate hikes/Currency volatility
• Component: USD rates • Impact: Market losses (% of notional)
Limit in place and potential hedge with Interest rate swap and Fx swaps
Regulatory • Description:Heightened regulation • Component: Basel III • Impact: Regulatory breach
Regulatory updates and internal control
Liquidity • Description:Long term assets not covered by wholesale funding
• Component: Funding diversification • Impact: Reputational risk
Application and implementation of ILAA (Individual Liquidity Adequacy Assessment)
Compliance • Description:AML/KYC related issues • Component: High percentage of PEPs
and SDNs in our client base, in particular the oil business
• Impact: Reputational risk
AML Officer, AML systems, AML policy
Operational • Description:Migration to Delta platform • Component: Inadequate performance
of Delta • Impact: Reputational risk
Steering committee Full testing of Delta planned. IT Support, Manual workaround
Uncertainties
Economic difficulties in African countries
• Description: Lower growth in Africa • Component: Bearish commodities
market; low oil market. • Impact: Lower banking income

Page 11
Treasury – Capital Market (TCM)
For the 3rd year in a row, the trend remained upwards. The TCM business 2016 closed the year-end with a £6,055k (2015: £4,334k) net operating income. This represented a 39.7% increase compared to 2015. This was the highest performance ever recorded for these activities in the history of BBI plc. TCM represented more than 29% of the net banking income. TCM continued to develop synergies with the Group. Amid difficult conditions on commodities and political upheavals such as Brexit and USA presidential election, TCM achieved a remarkable performance.
Corporate Banking
• Loan solutions – During 2016, Loans syndications and synergies and Project Structured Finance merged to create the Loan Solutions desk in order to optimize resources and to enhance its visibility. The merged performance increased significantly by 40.1% compared to 2015 to £8,647k (merged 2015: £6,172k) . Management aims to generate more origination and structuring transactions with the Group.
• Commodities and Trade Finance (CTF) – The 2016 performance was down by 36.4% to £2,201k compared to 2015. This underperformance is explained by difficult conditions on the commodities market combined with a revision of CTF exposures. Significant commercial efforts were made to reshape the client portfolio. On a positive note the level of profitability of live deals remained high. CTF will continue to have a dynamic and diversified commercial strategy in 2017.
• Paris branch – The Paris branch continued to contribute significantly to BBI plc’s revenues. In line with the global commercial strategy of BBI plc, the Paris Branch generated increased business on Trade Finance despite strong competition. The Paris Branch will continue to apply the current strategy in 2017 by stepping up business developments in East and Central African countries while maintaining the same levels of business on West Africa. Synergies with the Group remained a key element of the strategy mentioned above.
Stra
tegi
c re
po
rt
£’000 2016 2015
Profit on FX 1,130 1,035
Profit on bonds 4,196 2,883
Money Market 729 416
Treasury – Capital Market 6,055 4,334
Loan Solutions 8,647 6,172
Commodities Trade Finance 2,101 3,302
Paris branch 3,833 3,402
Corporate Banking 14,581 12,876
Other income / (expenses) not allocated 532 (557)
Subordinated debt interest not allocated (590) (489)
Net operating income 20,578 16,164
Strategic Report (continued)
Development and performance by business lines for the year 2016
Treasury - Capital Market Loan Solutions Commodities Trade Finance Paris Branch
6,055 8,647 2,101 3,833
39.7% 40.1% -36.4% 12.7%
Page 12
Strategic Report (continued)
Income analysis
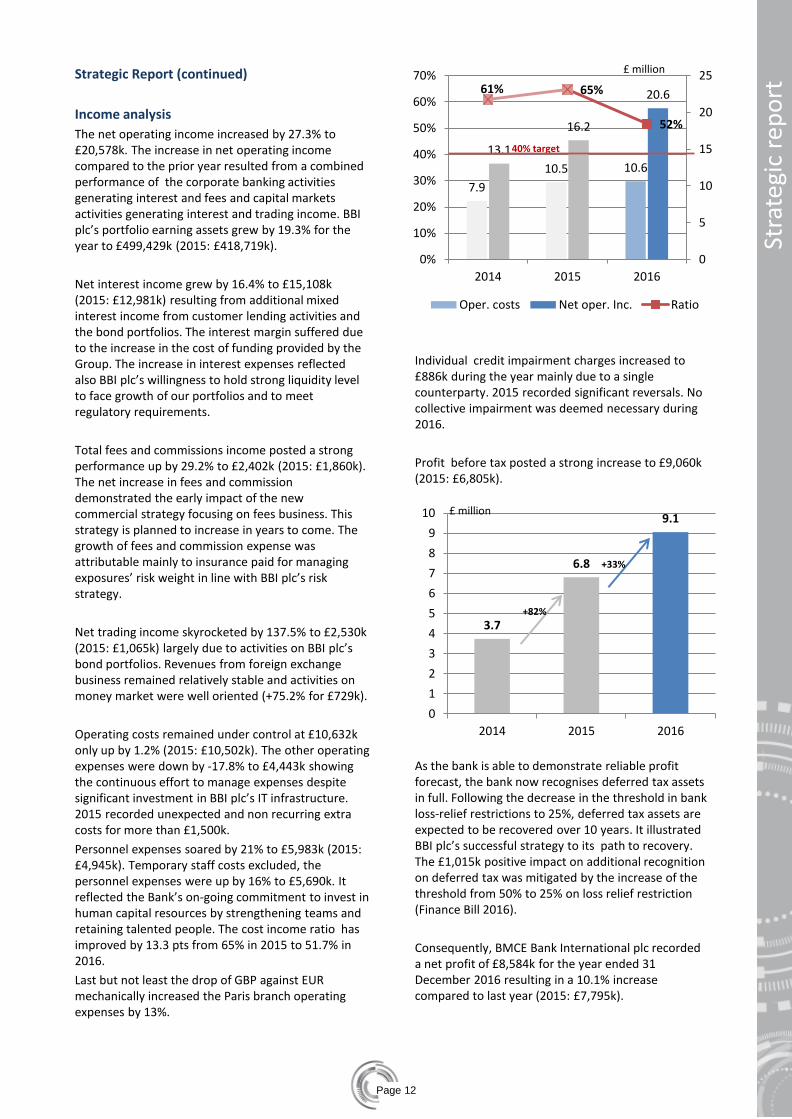
The net operating income increased by 27.3% to £20,578k. The increase in net operating income compared to the prior year resulted from a combined performance of the corporate banking activities generating interest and fees and capital markets activities generating interest and trading income. BBI plc’s portfolio earning assets grew by 19.3% for the year to £499,429k (2015: £418,719k).
Net interest income grew by 16.4% to £15,108k (2015: £12,981k) resulting from additional mixed interest income from customer lending activities and the bond portfolios. The interest margin suffered due to the increase in the cost of funding provided by the Group. The increase in interest expenses reflected also BBI plc’s willingness to hold strong liquidity level to face growth of our portfolios and to meet regulatory requirements.
Total fees and commissions income posted a strong performance up by 29.2% to £2,402k (2015: £1,860k). The net increase in fees and commission demonstrated the early impact of the new commercial strategy focusing on fees business. This strategy is planned to increase in years to come. The growth of fees and commission expense was attributable mainly to insurance paid for managing exposures’ risk weight in line with BBI plc’s risk strategy.
Net trading income skyrocketed by 137.5% to £2,530k (2015: £1,065k) largely due to activities on BBI plc’s bond portfolios. Revenues from foreign exchange business remained relatively stable and activities on money market were well oriented (+75.2% for £729k).
Operating costs remained under control at £10,632k only up by 1.2% (2015: £10,502k). The other operating expenses were down by -17.8% to £4,443k showing the continuous effort to manage expenses despite significant investment in BBI plc’s IT infrastructure. 2015 recorded unexpected and non recurring extra costs for more than £1,500k.
Personnel expenses soared by 21% to £5,983k (2015: £4,945k). Temporary staff costs excluded, the personnel expenses were up by 16% to £5,690k. It reflected the Bank’s on-going commitment to invest in human capital resources by strengthening teams and retaining talented people. The cost income ratio has improved by 13.3 pts from 65% in 2015 to 51.7% in 2016.
Last but not least the drop of GBP against EUR mechanically increased the Paris branch operating expenses by 13%.
Individual credit impairment charges increased to £886k during the year mainly due to a single counterparty. 2015 recorded significant reversals. No collective impairment was deemed necessary during 2016.
Profit before tax posted a strong increase to £9,060k (2015: £6,805k).
As the bank is able to demonstrate reliable profit forecast, the bank now recognises deferred tax assets in full. Following the decrease in the threshold in bank loss-relief restrictions to 25%, deferred tax assets are expected to be recovered over 10 years. It illustrated BBI plc’s successful strategy to its path to recovery. The £1,015k positive impact on additional recognition on deferred tax was mitigated by the increase of the threshold from 50% to 25% on loss relief restriction (Finance Bill 2016).
Consequently, BMCE Bank International plc recorded a net profit of £8,584k for the year ended 31 December 2016 resulting in a 10.1% increase compared to last year (2015: £7,795k).
Stra
tegi
c re
po
rt
7.9
10.5 10.6
13.1
16.2
20.6 61% 65%
52%
0
5
10
15
20
25
0%
10%
20%
30%
40%
50%
60%
70%
2014 2015 2016
Oper. costs Net oper. Inc. Ratio
40% target
3.7
6.8
9.1
0
1
2
3
4
5
6
7
8
9
10
2014 2015 2016
£ million
+82%
+33%
£ million
Page 13
Strategic Report (continued)
Balance sheet analysis
The balance sheet expanded by £86,036k to £527,718k (2015: £441,682k) which was above BBI plc’s expectations. Earning assets increased by £80,710k to £499,429k (2015: £418,719k). Loans to Banks increased by £12,304k to £149,004k (2015: £136,700k) and loans to customers increased by £8,232k to £175,945k (2015: £167,713k).
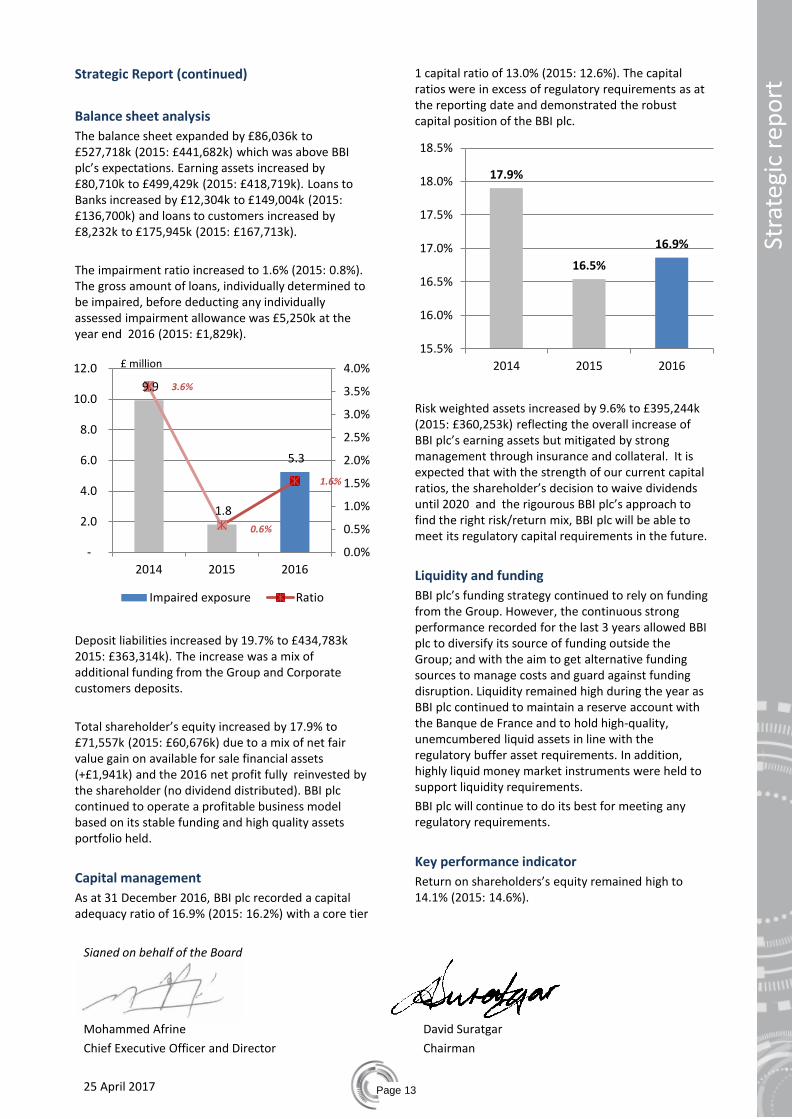
The impairment ratio increased to 1.6% (2015: 0.8%). The gross amount of loans, individually determined to be impaired, before deducting any individually assessed impairment allowance was £5,250k at the year end 2016 (2015: £1,829k).
Deposit liabilities increased by 19.7% to £434,783k 2015: £363,314k). The increase was a mix of additional funding from the Group and Corporate customers deposits.
Total shareholder’s equity increased by 17.9% to £71,557k (2015: £60,676k) due to a mix of net fair value gain on available for sale financial assets (+£1,941k) and the 2016 net profit fully reinvested by the shareholder (no dividend distributed). BBI plc continued to operate a profitable business model based on its stable funding and high quality assets portfolio held.
Capital management
As at 31 December 2016, BBI plc recorded a capital adequacy ratio of 16.9% (2015: 16.2%) with a core tier
1 capital ratio of 13.0% (2015: 12.6%). The capital ratios were in excess of regulatory requirements as at the reporting date and demonstrated the robust capital position of the BBI plc.
Risk weighted assets increased by 9.6% to £395,244k (2015: £360,253k) reflecting the overall increase of BBI plc’s earning assets but mitigated by strong management through insurance and collateral. It is expected that with the strength of our current capital ratios, the shareholder’s decision to waive dividends until 2020 and the rigourous BBI plc’s approach to find the right risk/return mix, BBI plc will be able to meet its regulatory capital requirements in the future.
Liquidity and funding
BBI plc’s funding strategy continued to rely on funding from the Group. However, the continuous strong performance recorded for the last 3 years allowed BBI plc to diversify its source of funding outside the Group; and with the aim to get alternative funding sources to manage costs and guard against funding disruption. Liquidity remained high during the year as BBI plc continued to maintain a reserve account with the Banque de France and to hold high-quality, unemcumbered liquid assets in line with the regulatory buffer asset requirements. In addition, highly liquid money market instruments were held to support liquidity requirements.
BBI plc will continue to do its best for meeting any regulatory requirements.
Key performance indicator
Return on shareholders’s equity remained high to 14.1% (2015: 14.6%).
Stra
tegi
c re
po
rt
9.9
1.8
5.3
3.6%
0.6%
1.6%
0.0%
0.5%
1.0%
1.5%
2.0%
2.5%
3.0%
3.5%
4.0%
-
2.0
4.0
6.0
8.0
10.0
12.0
2014 2015 2016
Impaired exposure Ratio
17.9%
16.5%
16.9%
15.5%
16.0%
16.5%
17.0%
17.5%
18.0%
18.5%
2014 2015 2016
Signed on behalf of the Board
Mohammed Afrine
Chief Executive Officer and Director
25 April 2017
David Suratgar
Chairman
£ million

Page 14
The Directors of BMCE Bank International plc present their Directors’ report for the year ended 31 December 2016. As permitted by Paragraph 1A of Schedule 7 to the Large and Medium sized Companies and Groups (Accounts and Reports) Regulations 2008 certain matters which are required to be disclosed in the Directors’ Report have been omitted as they are included in the Strategic Report on pages 7-13. These matters relate to
- Future Developments: and
- Financial Risk Management
Principal activities
The Bank is authorised and regulated by the Prudential Regulation Authority (PRA) and Financial Conduct Authority (FCA).
The Bank’s principal activities are Corporate and Investment Banking, focusing on trade, structured and project finance and corporate lending for target customers based in Africa or with an interest in the region and Treasury and Capital Markets, focusing on currency and interest rate markets of the region.
The Bank also maintains a branch in Paris.
Business review
BMCE Bank International plc is an authorised credit institution and provides a range of banking and financial services. There have not been any significant changes in the Bank’s main activities in the year under review.
The Directors are not aware, at the date of this report, of any likely changes in the Bank’s activities in the forthcoming period.
BMCE Bank International plc invests significantly in human capital and its IT systems which will improve its business and financial performances. The Directors regard such investment as necessary for shifting expectations on the future of the business.
Results and dividend
The Bank’s profit for the year after taxation amounted to £8,584k (2015: £7,795k).
No dividend was paid during the year (2015: £Nil). The Directors do not recommend the payment of a final dividend for this financial year (2015: £Nil).
Capital structure
The Bank’s capital structure remains unchanged.
However, the negative retained earnings have been decreased due to the shareholder’s commitment made during the Board held in December 2015 to waive dividend until 2020 to allow the Bank to reinvest in its business.
In 2015, the maturity of €17,700k subordinated debt was extended from 2020 to 2023.
Further information regarding the Bank’s approach to risk management and its capital adequacy is contained in the unaudited Pillar 3 disclosures made under the current regulatory capital requirements. These disclosures are published on the Bank’s website shortly after the approval of these financial statements at http://www.bmce-intl.co.uk/finance.
Directors
The Directors, who all served throughout the year, unless otherwise shown are as listed on page 4 of the report. Ian Plenderleith, CBE resigned as a director on 31 January 2016.
Directors’ interests
None of the Directors has, or had during the year under review, any beneficial interest in the shares of the Company.
Directors’ insurance and indemnities
The Directors have the benefit of the indemnity provisions contained in the Company’s Articles of Association (‘Articles’), and the Company has maintained throughout the year Directors’ liability insurance for the benefit of the Company and the Directors.
The Company has entered into qualifying third party indemnity arrangements for the benefit of all its Directors in a form and scope which comply with the requirements of the Companies Act 2006 and which were in force throughout
the year and remain in force.
Going concern basis of accounting
The Directors have a reasonable expectation that the Bank has adequate resources to continue in operational existence for the foreseeable future.
Thus they continue to adopt the going concern basis of accounting in preparing the annual financial statements.
Dir
ecto
rs’ r
epo
rt
Signed on behalf of the Board – 25 April 2017
Mohammed Afrine
Chief Executive Officer and Director
David Suratgar
Chairman
Directors’ report

Page 15
Statement of Directors’ responsibilities
This statement should be read in conjunction with the responsibilities of the auditor set out in their report on page 16.
The Directors are responsible for preparing the Strategic Report, the Directors’ Report and the financial statements in accordance with applicable law and regulations.
Company law requires the Directors to prepare financial statements for each financial year. Under that law the Directors have elected to prepare the financial statements in accordance with International Financial Reporting Standards (IFRSs) as adopted by the European Union. Under Company law the Directors must not approve the financial statements unless they are satisfied that they give a true and fair view of the state of affairs of the Company and the profit or loss of the Bank for that period.
In preparing these financial statements, the Directors are required to:
• select suitable accounting policies and then apply them consistently;
• make judgments and accounting estimates that are reasonable and prudent;
• state whether applicable International Financial Reporting Standards (IFRSs) have been followed, subject to any material departures disclosed and explained in the financial statements;
• provide additional disclosures when compliance with specific requirements in IFRS is insufficient to enable users to understand the impact of particular transactions, other events and conditions on the entity’s financial position and financial performance; and
• prepare the financial statements on a going concern basis unless it is inappropriate to presume that the Company will continue in business.
The Directors are responsible for keeping adequate accounting records that are sufficient to show and explain the Bank’s transactions and disclose with reasonable accuracy at any time the financial position of the Bank and enable them to ensure that the financial statements comply with the Companies Act 2006. They are also responsible for safeguarding the assets of the Bank and hence for taking reasonable steps for the prevention and detection of fraud and other irregularities.
Directors’ statement of disclosure to auditors
Each of the Directors confirms that:
• to the best of each Director’s knowledge and belief, there is no information relevant to the preparation of their report of which the Bank’s auditor is unaware; and
• each Director has taken all the steps a Director might reasonably be expected to have taken to be aware of relevant audit information and to establish that the Bank’s auditor is aware of that information.
This confirmation is given and should be interpreted in accordance with the provisions of section 418 of the Companies Act 2006.
Stat
emen
t o
f D
irec
tors
’ res
po
nsi
bili
ties
Signed on behalf of the Board
Mohammed Afrine
Chief Executive Officer and Director
25 April 2017
David Suratgar
Chairman

Page 16
Ind
epen
den
t au
dit
or’
s re
po
rt
Independent auditor’s report to the members of
BMCE Bank International plc
We have audited the financial statements of BMCE Bank International plc for the year ended 31 December 2016 which comprise the Statement of profit or loss, the Statement of other comprehensive income, the Statement of financial position, the
Statement of changes in equity, the Statement of cash flow, and the related notes. The financial reporting framework that has been applied in their preparation is applicable law and International Financial Reporting Standards (IFRSs) as adopted by the European Union.
Respective responsibilities of Directors and auditor
As explained more fully on page 15 in the Statement of Directors’ Responsibilities, the Directors are responsible for the preparation of the financial statements and for being satisfied that they give a true and fair view.
Our responsibility is to audit and express an opinion on the financial statements in accordance with applicable law and International Standards on Auditing (UK and Ireland). Those standards require us to comply with the Auditing Practices Board’s Ethical Standards for Auditors. This report is made solely to the Company’s members as a body in accordance with Chapter 3 of Part 16 of the Companies Act 2006. Our audit work has been undertaken so that we might state to the Company’s members those matters we are required to state to them in an auditor’s report and for no other purpose. To the fullest extent permitted by law, we do not accept or assume responsibility to anyone other than the Company and the Company’s members as a body for our audit work, for this report, or for the opinions we have formed.
Scope of the audit of the financial statements
A description of the scope of an audit of financial statements is provided on the Financial Reporting Council’s web-site at www.frc.org.uk/auditscopeukprivate.
Opinion on the financial statements
In our opinion the financial statements:
• give a true and fair view of the Company’s affairs as at 31 December 2016 and of its profit for the year then ended;
• have been properly prepared in accordance with IFRSs as adopted by the European Union;
• have been prepared in accordance with the requirements of the Companies Act 2006.
Opinion on other matter prescribed by the Companies Act 2006
In our opinion, based on the work undertaken in the course of the audit:
• the information given in the Strategic Report and Directors’ Report for the financial year for which the financial statements are prepared is consistent with the financial statements; and
• the Strategic Report and the Directors’ Report have been prepared in accordance with applicable legal requirements.
Matters on which we are required to report by exception
In light of the knowledge and understanding of the Company and its environment obtained in the course of the audit, we have not identified material misstatements in the Strategic Report or the Directors’ Report.
We have nothing to report in respect of the following matters where the Companies Act 2006 requires us to report to you if, in our opinion:
• adequate accounting records have not been kept, or returns adequate for our audit have not been received from branches not visited by us; or
• the financial statements are not in agreement with the accounting records and returns; or
• certain disclosures of Directors’ remuneration specified by law are not made; or
• we have not received all the information and explanations we require for our audit.
Greg Simpson (Senior Statutory Auditor)
for and on behalf of Mazars LLP
Chartered Accountants and Statutory Auditor
Mazars LLP
Tower Bridge House
St. Katharine’s Way
London
E1W 1DD
25 April 2017

Page 17
Part II
Statement of profit or loss - 18
Statement of other comprehensive income - 19
Statement of financial position - 20
Statement of changes in equity - 21
Statement of cash flows - 22
Notes to the financial statements - 23

Page 18
Stat
emen
t o
f p
rofi
t o
r lo
ss
£’000 Note 2016 2015
Interest and similar income 19,038 14,664
Interest expense and similar charges (3,930) (1,683)
Net interest income 6 15,108 12,981
Fee and commission income 3,889 3,170
Fee and commission expense (1,487) (1,310)
Net fee and commission income 7 2,402 1,860
Net trading income 8 2,530 1,065
Other operating income 9 538 258
Net operating income 20,578 16,164
Personnel expenses 10 (5,983) (4,945)
Depreciation of property and equipment 19 (71) (119)
Amortisation of intangible assets 20 (135) (30)
Other operating expenses 11 (4,443) (5,408)
Total operating expenses before impairment losses (10,632) (10,502)
Net impairment (losses) / recoveries 12 (886) 1,143
Profit before taxation 9,060 6,805
Taxation 13 (476) 990
Profit for the year 8,584 7,795
Statement of profit or loss for the year ended 31 December 2016
The notes on pages 23 – 67 form part of these financial statements.

Page 19
Stat
emen
t o
f o
ther
co
mp
reh
ensi
ve in
com
e
The notes on pages 23 – 67 form part of these financial statements.
£’000 Note 2016 2015
Profit for the year 8,584 7,795
Items that may quality for reclassification
Foreign currency translation differences for foreign operations 356 (88)
Net fair value gain / (loss ) on available for sale financial assets 2,603 (280)
Reclassification of available for sale investments to profit or loss (662) 14
Other comprehensive income for the year 14 2,297 (354)
Total comprehensive income for the year 10,881 7,441
Statement of other comprehensive income for the year ended 31 December 2016

Page 20
Stat
emen
t o
f fi
nan
cial
po
siti
on
£’000 Note 2016 2015
Assets
Cash and balances with central banks 15 13,339 4,369
Due from banks 15 149,004 136,700
Derivative financial instruments 37 32 222
Loans and advances to customers 16 175,945 167,713
Financial investments - available for sale 17 144,263 102,378
Financial investments - held to maturity 18 16,846 7,337
Property and equipment 19 300 226
Goodwill and other intangible assets 20 - 21 10,310 8,031
Deferred tax assets 13 6,966 6,418
Other assets 22 10,713 8,288
Total assets 527,718 441,682
Liabilities and equity
Due to banks 23 305,077 264,777
Derivative financial instruments 37 1,298 859
Due to customers 24 129,706 98,537
Other liabilities 25 4,577 3,517
Subordinated debt 26 15,503 13,316
Total liabilities 456,161 381,006
Equity attributable to equity holders of parent
Share capital 27 102,173 102,173
Other reserves 27 (692) (2,989)
Accumulated losses 27 (29,924) (38,508)
Total equity 71,557 60,676
Total liabilities and equity 527,718 441,682
Statement of financial position as at 31 December 2016
Mohammed Afrine
Chief Executive Officer and Director
David Suratgar
Chairman
The notes on pages 23 – 67 form part of these financial statements
Approved by the Board and authorised for issue on 25 April 2017.

Page 21
Stat
emen
t o
f ch
ange
s in
eq
uit
y
£’000 Note Share capital
Other reserves
Accumula-ted losses
Total
Balance as at 1 January 2015 102,173 (2,635) (46,303) 53,235
Profit for the year - - 7,795 7,795
Other comprehensive income - (354) - (354)
Total comprehensive income (354) 7,795 7,441
Balance as at 31 December 2015 27 102,173 (2,989) (38,508) 60,676
Balance as at 1 January 2016
Profit for the year 8,584 8,584
Other comprehensive income 2,297 2,297
Total comprehensive income 2,297 8,584 10,881
Balance as at 31 December 2016 102,173 (692) (29,924) 71,557
Statement of changes in equity for the year ended 31 December 2016
Other reserves category in the table above relates to changes in the fair value of financial instruments classified as available for sale and the effects of foreign currency retranslation on a foreign operation. The notes on pages 23 – 67 form part of these financial statements.

Page 22
Stat
emen
t o
f ca
sh f
low
s
£’000 note 2016 2015
Cash flows from continuing operating activities
Profit before tax 9,060 6,805
Adjustments for:
Net interest income 15,108 12,981
Interest received (7,638) (7,870)
Interest paid 3,725 1,719
Change in operating assets 28 (41,817) (25,324)
Change in operating liabilities 28 76,000 69,582
Other items included in profit before tax 28 970 1,586
Corporation tax paid (1,418) -
Net cash flows generated by continuing operating activities 53,990 59,479
Cash flows from investing activities
Purchase of financial investments (114,745) (48,498)
Proceeds from sales of financial investments 63,354 4,892
Purchase of property and equipment (115) (72)
Purchase of intangible assets (1,160) (724)
Net cash flows generated by investing activities (52,666) (44,402)
Net increase in cash and cash equivalents 1,324 15,077
Cash and cash equivalents as at 1 January 116,026 100,949
Cash and cash equivalents as at 31 December 15 117,350 116,026
Statement of cash flow for the year ended 31 December 2016
Net foreign exchange difference on cash is immaterial because foreign currency cash positions are settled and matured on a daily basis, hence foreign currency cash would only be revalued from the previous day. The notes on pages 23 – 67 form part of these financial statements.

Page 23
no
tes
to t
he
fin
anci
al s
tate
men
ts
1. Corporate Information
In these financial statements, BMCE Bank International plc is referred to as the “Bank”. The statements comprise the financial statements of BMCE Bank International plc as an individual entity. The Bank also maintains a foreign branch that is located in Paris.
The Bank provides Corporate and Investment Banking and Treasury services in Europe as well as North, East, West and Central Africa. The principal activities of the Bank are described in the strategic and Directors’ reports and note 5.
BMCE Bank International plc is incorporated and domiciled in England and Wales and is authorised and regulated by the Prudential Regulation Authority (PRA) and the Financial Conduct Authority (FCA). Its registered office is at 26 Upper Brook Street, London, W1K 7QE, United Kingdom.
The ultimate parent undertaking and ultimate controlling party is Banque Marocaine du Commerce Exterieur S.A. (BMCE Bank of Africa Group), a Company incorporated in Morocco. BMCE International (Holdings) plc, a Company incorporated in the United Kingdom and registered in England and Wales, is the immediate holding Company for the Bank.
Copies of the consolidated financial statements prepared in respect of Banque Marocaine du Commerce Exterieur S.A. may be obtained by request on the following address: 140 Avenue Hassan II 2100 Casablanca or on the website: http://www.bmcebank.ma/.
2. Presentation of accounts
A. Basis of preparation
The accounts are prepared on a going concern basis (see the Directors’ report on page 14) and in accordance with International Financial Reporting Standards issued by the International Accounting Standards Board (IASB) and interpretations issued by the IFRS Interpretations Committee of the IASB as adopted by the European Union (EU) (together IFRS).
The financial statements have been prepared on a historical cost basis, except for derivative financial instruments, financial assets and financial liabilities held at fair value through profit or loss and available for sale investments that have been measured at fair value.
The Bank presents its statement of financial position broadly in order of liquidity. An analysis regarding recovery or settlement within 12 months after the statement of financial position date (current) and more than 12 months after the statement of financial position date (non-current) is presented in note 34.
B. Significant accounting judgements and estimates
Information about judgements made in applying accounting policies that have the most significant effects on the amounts recognized in the financial statements is set out below.
Information about assumptions and estimation uncertainties that have a significant risk resulting in a material adjustment in the year ended 31 December 2016 is set out below in relation to the impairment of financial instruments and in relation to other areas such as:
- determination of the fair value of financial instruments with significant unobservable inputs;
- recognition of deferred tax assets: availability of future taxable profit against which carry forward tax losses can be used;
- impairment of financial assets;
- impairment testing for goodwill: key assumptions underlying recoverable amounts; and
- impairment of other intangible assets.
The most significant use of judgements and estimates are as follows:
• Fair value – The fair values of financial investments are determined based upon a combination of values derived from an external model and broker prices. The valuation of financial instruments is described in more detail in note 37. Management consider that, with the exception of held for trading financial instruments, derivatives and available for sale investments that are held at fair value, all other financial assets and financial liabilities are held on an amortised cost basis which approximates to fair value. Each of the financial assets and financial liabilities are assessed individually.

Page 24
no
tes
to t
he
fin
anci
al s
tate
men
ts
• Deferred tax assets – Deferred tax assets are recognised for all unused tax losses to the extent that it is probable that taxable profits will be available against which the losses can be utilised in the future. Significant management judgement is required to determine the amount of deferred tax assets that can be recognised, based upon the likely timing and level of future taxable profits together with future tax planning strategies. Detailed plans are produced for the following 10 financial years. Deferred tax assets and liabilities are measured at the tax rates that are expected to apply in the year when the asset is realised or the liability is settled, based on tax rates (and tax laws) that have been enacted or substantively enacted at the reporting date.
• Impairment of financial assets – Problem loans and advances, including financial investments which are held to maturity and debt securities classified as available for sale investments, are reviewed at each reporting date to assess whether an allowance for impairment should be recorded in the statement of profit and loss. In particular, judgement by management is required in the estimation of the amount and timing of future cash flows when determining the level of allowance required. Such estimates are based on assumptions about a number of factors and actual results may differ, resulting in future changes to the allowance. The method used to calculate impairment provisions is to estimate future cash flows and then discount these at the original effective interest rate for the loans and advances and financial instruments being considered. The impairment provision is calculated as the difference between the net present value and the carrying value.
The amounts of impairment provisions can be seen in note 16.
• Impairment of goodwill – Goodwill is tested at each reporting date for impairment and the evaluation requires significant management judgement in estimating the present value of future estimated cash flows expected to be derived from the cash generating units (CGU) to which goodwill has been allocated. Goodwill arising from business combination is allocated to CGU or group of CGU’s that are expected to benefit from the synergies of the combination.
Assets are grouped together into the smallest group of assets that generates cash inflows from continuing use that is largely independent of the cash inflows of other assets or CGUs. Refer to note 21.
Discount rate is within the range of rates used by the financial services industry and the growth rate is based on the growth rate of our main business geographical area (Africa).
• Impairment of other intangible assets – They are reviewed for any indication of impairment at each reporting date. Where there is such an indication, judgement is required in the estimation of the present value of the future cash flows expected to be derived from the asset or the cash generating unit to which it is allocated.
C. Foreign currency translation
The financial statements are presented in Pound Sterling, which is the Bank’s functional and presentational currency. The functional currency of the foreign branch in Paris is Euro.
Foreign currency transactions are translated into the functional currency using the exchange rate prevailing at the dates of the transactions. The foreign exchange gains and losses resulting from the settlement of such transactions are recognised in the statement of profit and loss. Unrealised gains and losses on unsettled transactions are also taken to the statement of profit and loss.
Non-monetary items measured in terms of historical cost in a foreign currency are translated using the exchange rates at the dates of the initial transactions. The results of the foreign branch are translated into the Bank’s presentational currency on a monthly basis at the month end market exchange rate. All balances at the end of the period are converted at the period end rate. Any foreign exchange differences arising are accounted through other comprehensive income and accumulated in ‘other reserves’ in equity.
D. Financial assets and liabilities – initial recognition and subsequent measurement
• Financial asset – The Bank classifies its financial assets into one of the following categories:
‒ loans and receivables;
‒ available for sale;
‒ held to maturity; and
‒ at fair value through profit and loss (held for trading or fair value through profit and loss).
• Financial liabilities – The Bank classifies its financial liabilities, other than financial guarantees and loan commitments, as measured at amortised cost or fair value through profit and loss.
Page 25
no
tes
to t
he
fin
anci
al s
tate
men
ts
• Date of recognition – Purchases or sales of financial assets that require delivery of assets within the time frame generally established by regulation or convention in the marketplace are recognised on the trade date. Derivatives are also recognised on a trade date basis.
• Initial recognition of financial instruments – The classification of financial instruments at initial recognition depends on the purpose for which the financial instruments were acquired and their characteristics. All financial instruments are measured initially at their fair value plus, in the case of financial assets and financial liabilities not at fair value through profit and loss, any directly attributable incremental cost of acquisition or issue.
• Derivatives recorded at fair value through profit or loss – Derivatives which include foreign exchange contracts are recorded at fair value and carried as assets when their fair value is positive and as liabilities when their fair value is negative. Changes in the fair value of derivatives held for trading are included in ‘Net trading income’.
• Available for sale financial investments – Available for sale financial investments which consist of bond instruments are those which are designated as available for sale or do not qualify to be classified as designated at fair value through profit or loss, held-to-maturity or loans and receivables.
After initial measurement, available for sale investments are subsequently measured at fair value. Unrealised gains and losses are recognised in other comprehensive income and are accumulated in ‘other reserves’ in equity. When the security is disposed of, the cumulative gain or loss previously recognised in equity is recognised in the statement of profit and loss in ‘net trading income’. Where the Bank holds more than one investment in the same security they are deemed to be disposed of on a first-in-first-out basis. Interest earned whilst holding available for sale financial investments is reported as interest income using the effective interest rate. Dividends earned whilst holding available for sale financial investments are recognised in the statement of profit and loss as ‘Other operating income’ when the right of the payment has been established. The losses arising from impairment of such investments are recognised in the statement of profit and loss in ‘Impairment losses on financial investments’ and
removed from the available for sale reserve.
• Held-to-maturity financial investments – Held to maturity investments are those which carry fixed or determinable payments and have fixed maturities and which the group has the intention and ability to hold to maturity. After initial measurement, held to maturity financial investments are subsequently measured at amortised cost using the effective interest rate method, less allowance for impairment. Amortised cost is calculated by taking into account any discount or premium on acquisition and fees that are an integral part of the effective interest rate. The amortisation is included in ‘Interest and similar income’ in the consolidated statement of profit and loss. The losses arising from impairment of such investments are recognised in the statement of profit and loss line ‘Impairment losses on financial investments’.
• Loans and advances to Banks and customers – These are financial assets with fixed or determinable payments and fixed maturities that are not quoted in an active market. They are not entered into with the intention of immediate or short-term resale and are not classified as ‘Financial assets held for trading’, designated as ‘Financial investment – available for sale’ or ‘Financial assets designated at fair value through profit or loss’.
After initial measurement, loans and advances to Banks and customers are subsequently measured at amortised cost using the effective interest rate method, less allowance for impairment. Amortised cost is calculated by taking into account any discount or premium on acquisition and fees and costs that are an integral part of the effective interest rate. The amortisation is included in ‘Interest and similar income’ in the statement of profit and loss.
• Subordinated debt – Subordinated debt is carried at amortised cost.
• ‘Day 1’ profit – Where the transaction price in a non-active market is different to the fair value from other observable current market transactions in the same instrument or based on a valuation technique whose variables include only data from observable markets, the Bank immediately recognises the difference between the transaction price and fair value (a Day 1 profit) in the statement of profit and loss in ‘Net trading income’.
In cases where use is made of data which is not observable, the difference between the transaction price and model value is only recognised in the statement of profit and loss when the inputs become observable, or when the instrument is derecognised.

Page 26
no
tes
to t
he
fin
anci
al s
tate
men
ts
• Financial guarantees – The Bank gives financial guarantees, consisting of letters of credit, guarantees and acceptances. Financial guarantees are initially recognised in the financial statements at fair value, in ‘Other liabilities’ being the premium received. Subsequent to initial recognition, the Bank’s liability under each guarantee is measured at the higher of the amortised premium and the best estimate of expenditure required settling any financial obligation arising as a result of the guarantee.
Any increase in liability relating to financial guarantees would be taken to the statement of profit and loss in ‘Credit loss expense’. The premium received is recognised in the statement of profit and loss in ‘Net fees and commission income’ on a straight line basis over the life of the guarantee.
E. Derecognition of financial assets and financial liabilities
• Financial assets - A financial asset is derecognised where:
- The rights to receive cash flows from the asset have expired; or
- The Bank has transferred its rights to receive cash flows from the asset or has assumed an obligation to pay the received cash flows in full without material delay to a third party under a ‘pass-through’ arrangement; and
- Either (a) the Bank has transferred substantially all the risks and rewards of the asset, or (b) the Bank has neither transferred nor retained substantially all the risks and rewards of the asset, but has transferred control of the asset.
- When the Bank has transferred its rights to receive cash flows from an asset or has entered into a pass-through arrangement, and has neither transferred nor retained substantially all the risks and rewards of the asset nor transferred control of the asset, the asset is recognised to the extent of the Bank’s continuing involvement in the assets. Continuing involvement that takes the form of a guarantee over the transferred asset is measured at the lower of the original carrying amount of the asset and the maximum amount of consideration that the Bank could be required to repay.
• Financial liabilities – A financial liability is derecognised when the obligation under the liability is discharged or cancelled or expires. Where an existing financial liability is replaced by another from the same counterparty on substantially different terms or the terms of an existing liability are substantially modified, such an
exchange or modification is treated as a derecognition of the original liability and the recognition of a new liability and the difference in the respective carrying amounts is recognised in profit or loss.
F. Determination of fair value
The fair value for financial instruments traded in active markets at the reporting date is based on their quoted market price or dealer price quotations (bid price for long positions and offer price for short positions), without any deduction for transaction costs.
For all other financial instruments not listed in an active market, the fair value is determined by using appropriate valuation techniques. Valuation techniques include net present value, comparison to similar instruments for which market observable prices exist and other relevant valuation models.
• Cash and balances with central banks - These consist of cash held in hand and balance with central banks which serve as liquid asset buffer. The carrying amount of the cash balances is deemed to be a reasonable representation of the fair value.
• Due from banks - These comprise loans granted to financial institutions, short-term placements with banks and balances held in nostro accounts with other banks. The carrying amount is deemed a reasonable approximation of their fair value.
• Derivative financial instruments-assets - These consist mainly of forward and swap foreign exchange contracts, of which the fair value is determined by applicable market forward rates. The fair value is determined by using the market spot rates as at the balance sheet date.
• Loans and advances to customers - These comprise loans and other facilities granted to non-bank customers. The carrying amount of the loans is deemed a reasonable approximation of their fair value.
• Financial investments- available for sale - These comprise mainly marketable debt securities. The basis of estimating the fair value of these assets is by ascertaining the market value as at the balance sheet date. The carrying amount is deemed to be a reasonable representation of the fair value.

Page 27
no
tes
to t
he
fin
anci
al s
tate
men
ts
F. Determination of fair value (continued)
• Financial investments- held to maturity - These comprise mainly marketable debt securities. The basis of estimating the fair value of these assets is by ascertaining the market value as at the balance sheet date. The carrying amount represents the total amortised cost of the asset as at the balance sheet date.
• Due to banks - These comprise mainly deposits taken from financial institutions and the carrying amount of these deposits is based on reasonable approximation of market value and in the absence of which the directors’ estimation is used.
• Derivative financial instruments-liabilities - These consist mainly of forward and swap foreign exchange contracts, of which the fair value is determined by applicable market forward rates. The fair value is determined by using the market spot rates as at the balance sheet date.
• Due to customers - These comprise mainly deposits taken from non-bank customers and the carrying amount of these deposits is based on reasonable approximation of market value and in the absence of which the directors’ estimation is used.
• Subordinated debt - These are long-term debt liabilities, fair value of which has been estimated using the market values.
G. Impairment of financial assets
The Bank assesses at each reporting date whether there is any objective evidence that a financial asset or a group of financial assets is impaired. A financial asset or a group of financial assets is deemed to be impaired if, and only if, there is objective evidence of impairment as a result of one or more events that has occurred after the initial recognition of the asset (an incurred ‘loss event’) and that loss event (or events) has an impact on the estimated future cash flows of the financial asset or the group of financial assets that can be reliably estimated.
Evidence of impairment may include indications that the borrower or a group of borrowers is experiencing significant financial difficulty, default or delinquency in interest or principal payments, the probability that they will enter Bankruptcy or other financial reorganisation and where observable data indicates that there is a measurable decrease in the estimated future cash flows, such as changes in arrears or economic conditions that correlate with defaults.
• Due from Banks and loans and advances to customers – For amounts that are carried at amortised cost, the Bank assesses whether objective evidence of impairment exists individually for financial assets that are individually significant, or collectively for financial assets that are not individually significant.
If there is objective evidence that an impairment loss has been incurred, the amount of the loss is measured as the difference between the asset carrying amount and the present value of estimated future cash flows (excluding future expected credit losses that have not yet been incurred).
The carrying amount of the asset is reduced through the use of an allowance account and the amount of the loss is recognised in the statement of profit and loss. Interest income continues to be accrued on the reduced carrying amount based on the original effective interest rate of the asset. Loans together with the associated allowance are written off when there is no realistic prospect of future recovery and all collateral has been realised or has been transferred to the Bank. If, in a subsequent year, the amount of the estimated impairment loss increases or decreases because of an event occurring after the impairment was recognised, the previously recognised impairment loss is increased or reduced by adjusting the allowance account. If a future write-off is later recovered, the recovery is credited to the ‘Impairment loss expense’.
The present value of the estimated future cash flows is discounted at the financial asset’s original effective interest rate. If a loan has a variable interest rate, the discount rate for measuring any impairment loss is the effective interest rate at the relevant reporting date. The calculation of the present value of the estimated future cash flows of a collateralised financial asset reflects the cash flows that may result from foreclosure less costs for obtaining and selling the collateral, whether or not foreclosure is probable.
The Bank’s impairment methodology for assets carried at amortised cost results in the recording of provisions
for:
• Specific impairment losses on individually significant or specifically identified exposures;
• Collective impairment of:
- Individually not significant exposures;
- Incurred but not yet identified losses (IBNI).
Details are provided in note 16.

Page 28
no
tes
to t
he
fin
anci
al s
tate
men
ts
• Available for sale financial instruments – For available for sale financial instruments, the Bank assesses at each reporting date whether there is objective evidence that an investment or a group of investments is impaired. Objective evidence would include a significant or prolonged decline in the fair value of the investment below its cost. Where there is evidence of impairment, the cumulative loss that had been recognised in other comprehensive income is removed from equity and recognised in the statement of profit and loss.
• Renegotiated loans – Where possible the Bank seeks to restructure loans rather than to take possession of collateral. This may involve extending the payment arrangements and the agreement of new loan conditions. Once the terms have been renegotiated, any impairment is measured using the original effective interest rate (EIR) as calculated before the modification of the terms and the loan is no longer considered past due. Management continually reviews renegotiated loans to ensure that all criteria are met and that future payments are likely to occur. The loans continue to be subject to an individual impairment assessment, calculated using the loan’s original EIR.
H. Offsetting financial instruments
Financial assets and financial liabilities are offset and the net amount reported in the statement of financial position only if there is a currently enforceable legal right to offset the recognised amounts and there is an intention to settle on a net basis, or to realise the asset and settle the liability simultaneously. This is not generally the case with master netting agreements, and the related assets and liabilities are presented gross in the statement of financial position.
I. Leasing
• Bank as a lessee – The leases entered into by the Bank as lessee are operating leases. Any rentals payable are charged to the statement of profit and loss on a straight line basis over the lease term and included in ‘Operating expenses’.
• Bank as a lessor – Leases where the Bank does not transfer substantially all the risks and benefits incidental to ownership of the leased items are operating leases. Operating lease receipts are recognised as income in the statement of profit and loss on a straight line basis over the leased term. All leases where the Bank is a lessor are sub-leases of operating leases where the Bank is the lessee.
J. Recognition of income and expenses
Revenue is recognised to the extent that it is probable that the economic benefits will flow to the Bank and the revenue can be reliably measured. The following specific recognition criteria must also be met before revenue is recognised:
• Interest and similar income and expense – For all financial instruments measured at amortised cost, and interest bearing financial instruments classified as available for sale financial investments, interest income or expense is recorded at the effective interest rate. This is the rate that exactly discounts estimated future cash payments or receipts through the expected life of the financial instrument or a shorter period, where appropriate, to the net carrying amount of the financial asset or financial liability.
The calculation takes into account all contractual terms of the financial instrument (for example, prepayment options) and includes any fees or incremental costs that are directly attributable to the instrument and are an integral part of the effective interest rate, but not future credit losses. The carrying amount of the financial asset or financial liability is adjusted if the Bank revises its estimates of payment or receipts. The adjusted carrying amount is calculated based on the original effective interest rate and the change in carrying amount is recorded as an impairment loss.
Once the recorded value of a financial asset (or a group of similar financial assets) has been reduced due to an impairment loss, interest income continues to be recognised using the original effective interest rate applied to the new carrying amount.
• Fee and commission income – The Bank earns fee and commission income from a diverse range of services it provides to its customers in connection with its principal activities, and providing corporate advisory services.
Fees and commission are recognised at point in time. However, some fees earned for the provision of services over a period of time are accrued over that period. These fees include commission income and advisory fees. Loan commitment fees for loans that are likely to be drawn down and other credit related fees are deferred (together with any incremental costs) and recognised as an adjustment to the effective interest rate on the loan.

Page 29
no
tes
to t
he
fin
anci
al s
tate
men
ts
• Fee income from providing transaction services – Fees arising from negotiating or participating in the negotiation of a transaction for a third party, such as the arrangement of the acquisition of shares or other securities or the purchase or sale of businesses, are recognised on completion of the underlying transaction. Fees or components of fees that are linked to a certain performance are recognised after fulfilling the corresponding criteria.
• Net trading income – All gains and losses from changes in fair value and related interest income or expense and dividends for financial assets and financial liabilities held for trading are included in net trading income.
K. Cash and cash equivalents
Cash and cash equivalents as referred to in the cash flow statement comprise cash on hand, balances with central Banks and amounts due from Banks on demand or with an original maturity of three months or less. Cash and cash equivalent are carried at amortised cost in the statement of financial position.
L. Property and equipment
Property and equipment, which consist of computer hardware and furniture and equipment are stated at cost less accumulated depreciation. Depreciation is calculated using the straight-line method to write down the cost of Property and equipment to their residual values over their estimated useful lives. The residual estimated useful lives from 1 January 2016 are as follows:
- Computer hardware - 3 to 5 years; and
- Furniture and equipment - 5 years to 9 years.
M. Other intangible assets
Intangible assets include the value of development costs and computer software. Expenditure on internally developed intangible assets, excluding development expenditure, is taken to the statement of profit and loss in the year in which it is incurred. Development expenditure is recognised as an intangible asset only after its technical feasibility and commercial viability can be demonstrated. Intangible assets acquired separately are measured on initial recognition at cost. Following the initial recognition, intangible assets are carried at cost less any accumulated amortisation and any accumulated impairment losses.
Amortisation is calculated using the straight-line method to write down the cost of intangible assets to their residual values over their estimated useful lives.
The residual estimated useful lives from 1 January 2016 are as follows:
- Licences: 5 to 10 years;
- Computer software - 3 to 10 years; and
- Development costs - 3 to 5 years.
N. Business combinations and goodwill
Business combinations are accounted for using the purchase method of accounting. This involves recognising identifiable assets (including previously unrecognised intangible assets) and liabilities (including contingent liabilities and excluding future restructuring) of the acquired business at fair value. Any excess of the cost of acquisition over the fair values of the identifiable net assets acquired is recognised as goodwill.
Goodwill acquired in a business combination is initially measured at cost, being the excess of the cost of the business combination over the Bank’s interest in the net fair value of the identifiable assets, liabilities and contingent liabilities acquired. Following initial recognition, goodwill is measured at cost less any accumulated impairment losses. Goodwill is reviewed for impairment, annually or more frequently if events or changes in circumstances indicate that the carrying value may be impaired.
For the purpose of impairment testing, goodwill acquired in a business combination is, from the acquisition date, allocated to each of the Bank’s cash-generating units that are expected to benefit from the synergies of the combination, irrespective of whether other assets or liabilities acquired are assigned to those units. Each unit or group of units to which the goodwill is allocated:
• represents the lowest level within the Bank at which the goodwill is monitored for internal management purposes; and
• is not larger than an operating segment as defined under IFRS 8 Operating Segments.
O. Impairment of non-financial assets
The Bank assesses at each reporting date, or more frequently if events or changes in circumstances indicate that the carrying value may be impaired, whether there is an indication that a non-financial asset may be impaired. If any such indication exists, or when annual impairment testing for an asset is required, the Bank makes an estimate of the asset’s recoverable amount. Where the carrying amount of an asset exceeds its recoverable amount, the asset is considered impaired and is written down to its recoverable amount.
Page 30
no
tes
to t
he
fin
anci
al s
tate
men
ts
P. Pension benefits
The Bank operates a defined contribution pension plan. The contribution payable to a defined contribution plan is in proportion to the services rendered to the Bank by the employees and is recorded as an expense under ‘Personnel expenses’.
Q. Provisions
Provisions are recognised when the Bank has a present obligation (legal or constructive) as a result of a past event and it is probable that an outflow of resources embodying economic benefits will be required to settle the obligation and a reliable estimate can be made of the amount of the obligation.
R. Taxes
• Current tax – Current tax and liabilities for the current and prior years are measured at the amount expected to be recovered from or paid to the taxation authorities. The tax rates and tax laws used to compute the amount are those that are enacted, or substantively enacted, by the reporting date.
• Deferred tax – Deferred tax is provided on temporary differences at the reporting date between the tax base of assets and liabilities and their carrying amounts for financial reporting purposes. Deferred tax liabilities are recognised for all taxable temporary differences.
Deferred tax assets are recognised for all deductible temporary differences, carry forward of unused tax credits and unused tax losses, to the extent that it is probable that taxable profit will be available against which the deductible temporary differences, and the carry forward of unused tax credits and unused tax losses can be utilised.
The carrying amount of deferred tax assets is reviewed at each reporting date and is reduced to the extent that it is no longer probable that sufficient taxable profit will be available to allow all or part of the deferred tax asset to be utilised. Unrecognised deferred tax assets are reassessed at each reporting date and are recognised to the extent that it has become probable that future taxable profit will allow the deferred tax asset to be recovered.
Detailed plans are produced for the next financial year, and using this as a basis, forecasts are produced for the following years.
Deferred tax assets and liabilities are measured at the tax rates that are expected to apply in the year when the asset is realised or the liability is settled, based on tax rates (and tax laws) that have been enacted or substantively enacted at the reporting date.
Current tax and deferred tax relating to items
recognised directly in equity are also recognised in equity and not in the statement of profit and loss.
S. Dividends on ordinary shares
Dividends on ordinary shares are recognised as a liability and deducted from equity when they are approved by the Bank’s shareholders.
Interim dividends are deducted from equity when they are declared and are no longer at the discretion of the Bank.
Dividends for the year that are approved after the reporting date are disclosed as an event after the reporting date.
3. Application of new and revised International Financial Reporting Standards (IFRSs)
In the current year, the Bank has applied a number of amendments to IFRSs and new interpretations issued by the International Accounting Standards Board (IASB) as endorsed by European Union that are mandatorily effective for an accounting period that begins on or after 1 January 2016.
A. Amendments to IFRS 10, IFRS 12 and IAS 28 Investment Entities: Applying the consolidation Exception
The amendments clarify the following aspects:
• Exemption from preparing consolidated financial statements. The amendments confirm that the exemption from preparing consolidated financial statements for an intermediate parent entity is available to a parent entity that is a subsidiary of an investment entity, even if the investment entity measures all of its subsidiaries at fair value.
• A subsidiary providing services that relate to the parent's investment activities. A subsidiary that provides services related to the parent's investment activities should not be consolidated if the subsidiary itself is an investment entity.
• Application of the equity method by a non-investment entity investor to an investment entity investee. When applying the equity method to an associate or a joint venture, a non-investment entity investor in an investment entity may retain the fair value measurement applied by the associate or joint venture to its interests in subsidiaries.
• Disclosures required. An investment entity measuring all of its subsidiaries at fair value provides the disclosures relating to investment entities required by IFRS 12.

Page 31
no
tes
to t
he
fin
anci
al s
tate
men
ts
B. Amendments to IAS 27 — Equity method in separate financial statements
The amendments reinstate the equity method as an accounting option for investments in subsidiaries, joint ventures and associates in an entity's separate financial statements.
C. Amendments to IAS 1 under the Disclosure initiative
Disclosure Initiative (Amendments to IAS 1) makes the following changes:
• Materiality. The amendments clarify that (1) information should not be obscured by aggregating or by providing immaterial information, (2) materiality considerations apply to the all parts of the financial statements, and (3) even when a standard requires a specific disclosure, materiality considerations do apply.
• Statement of financial position and statement of profit or loss and other comprehensive income. The amendments (1) introduce a clarification that the list of line items to be presented in these statements can be disaggregated and aggregated as relevant and additional guidance on subtotals in these statements and (2) clarify that an entity's share of OCI of equity-accounted associates and joint ventures should be presented in aggregate as single line items based on whether or not it will subsequently be reclassified to profit or loss.
• Notes. The amendments add additional examples of possible ways of ordering the notes to clarify that understandability and comparability should be considered when determining the order of the notes and to demonstrate that the notes need not be presented in the order so far listed in paragraph 114 of IAS 1. The IASB also removed guidance and examples with regard to the identification of significant accounting policies that were perceived as being potentially unhelpful.
D. Annual Improvements 2012–2014 Cycle makes amendments to the following standards
The IASB has issued 'Annual Improvements to IFRSs 2012–2014 Cycle', a collection of amendments to IFRSs, in response to issues addressed during the 2012–2014 cycle. Four standards are affected by the amendments.:
• IFRS 5 Non-current Assets Held for Sale and Discontinued Operations. The amendments add specific guidance in IFRS 5 for cases in which an entity reclassifies an asset from held for sale to held for distribution or vice versa and cases in which held-for-distribution accounting is
discontinued.
• IFRS 7 Financial Instruments: Disclosures (with consequential amendments to IFRS 1). - Services contracts. The amendments provide additional guidance to clarify whether a servicing contract is continuing involvement in a transferred asset for the purpose of determining the disclosures required. - Applicability of the amendments to IFRS 7 to condensed interim financial statements. The amendments clarify the applicability of the amendments to IFRS 7 on offsetting disclosures to condensed interim financial statements.
• IAS 19 Employee Benefits Discount rate: regional market issue. The amendments clarify that the high quality corporate bonds used in estimating the discount rate for post-employment benefits should be denominated in the same currency as the benefits to be paid (thus, the depth of the market for high quality corporate bonds should be assessed at currency level).
• IAS 34 Interim Financial Reporting Disclosure of information 'elsewhere in the interim financial report'. The amendment clarify the meaning of 'elsewhere in the interim report' and requires a cross-reference
E. IAS 16/IAS 38 — Acceptable methods of depreciation and amortisation The amendments clarify that a revenue-based method is not considered to be an appropriate manifestation of consumption.
F. IFRS 11 — Acquisition of an interest in a joint operation The amendments require an investor to apply the principles of business combination accounting under IFRS 3 when it acquires an interest in a joint operation that constitutes a ‘business’ (as defined in IFRS 3).

Page 32
no
tes
to t
he
fin
anci
al s
tate
men
ts
4. New and revised IFRSs in issue but not yet effective
The standards, amendments, and interpretations, which are relevant to the Company, and may have a material effect on the Company's forthcoming financial statements are as follows. The adoption of all other standards, amendments, and interpretations are not expected to have a material impact (IFRS 9 excluded see dedicated paragraph hereafter).
Below is a list of new and revised IFRSs that are not yet mandatorily effective (but allow early application) for the year ending 31 December 2016:
- Standards effective date: 01/01/2018
• IFRS 9 Financial Instruments;
• IFRS 15 Revenue from Contracts with Customers;
- Standards effective date: unknown
• IFRS 14 Regulatory Deferral Accounts;
• IFRS 16 Leases
• Amendments to IFRS 10 and IAS 28 Sale or Contribution of Assets between an investor and its Associate or Joint Venture;
• Amendments to IAS 12 Recognition of deferred tax assets for unrealised losses;
• Amendments to IAS 7 Disclosure initiative;
• Clarification to IFRS 15 Revenue from contract with customers;
• Amendments to IFRS 2 Classification and measurement of share based payment transactions;
• Amendments to IFRS 4 Applying IFRS 9 Financial instruments with IFRS 4 insurance contracts;
• Annual improvements to IFRS standards 2014-2016 cycle;
• IFRIC Interpretation 22 Foreign currency transaction and advance consideration; and
• Amendments to IAS 40 Transfer of investment property.
• IFRS 9 Financial Instruments: Classification and Measurement, published in July 2014, replaces the existing guidance in IAS 39 Financial instruments. IFRS 9 includes revised guidance on the classification and measurement of financial instruments including a new expected loss model for calculating impairment on financial assets, and the new general hedge accounting requirements. It also carries forward guidance on recognition of and derecognition of financial instruments from IAS39.
IFRS 9 project as this has now been completed, and was endorsed by the European Union on November 2016. The effective date of the standard is 1st January 2018.
The Bank is currently assessing the impact of adopting IFRS 9, however, the impact of adoption depends on the assets held by the Bank at the date of adoption, and it is not practical to quantify the effect.
• The adoption of all other standards is not expected to have material impact, however, the Bank has not yet completed full assessment of these changes.
5. Segment reporting
The primary segment reporting format is determined to be business segments as the Bank’s risks and rates of return are affected predominantly by differences in the products and services provided. The operating businesses are organised and managed according to the nature of the products and services, with each segment representing a strategic business unit that offers different products and serves different markets.
For management purposes, the Bank is organised into three business segments:
• Treasury and Capital Markets (TCM) – Principally engaged in sales and market making activities in the treasury sector. Provides market and product access for a range of corporate and institutional customers and trading on our own account. Provides internal cash funding at market rates for Corporate and Investment Banking activities.
• Corporate and Investment Banking (CIB) – Principally providing Investment Banking services including structured and project finance, corporate finance, loan advisory and structuring services and other credit facilities for corporate and institutional customers.
• Other – Other central functions which are not directly attributable to Corporate and Investment Banking nor Treasury and Capital Markets and which are managed and controlled centrally are presented as ‘other’.
The Bank’s geographical segments are based on the location of the clients with whom business has been conducted for Corporate and Investment Banking and for the individual markets accessed for Treasury and Capital Markets activities.

Page 33
no
tes
to t
he
fin
anci
al s
tate
men
ts
5. Segment reporting (continued)
The following tables present income and certain asset and liability information regarding the Bank’s
operating segments for the years ended 31 December 2016 and 31 December 2015.
£’000 TCM CIB Other Total 2016
Operating income
Net interest income 4,263 12,205 (1,360) 15,108
Net fees and commission income - 2,402 - 2,402
Net trading income 1,130 - 738 1,868
Realised gain on disposal of investment securities 662 - 662
Net operating income from other segments - (26) 26 -
Other operating income - - 538 538
Total operating income 6,055 14,581 (58) 20,578
Operating expenses
Personnel expenses (458) (514) (5,011) (5,983)
Depreciation - - (71) (71)
Amortisation - - (135) (135)
Other operating expenses - (26) (4,417) (4,443)
Net impairment losses - (886) - (886)
Total operating expenses (458) (1,426) (9,634) (11,518)
Segment results 5,597 13,155 (9,692) 9,060
Income tax expense - - (476) (476)
Profit for the year 5,597 13,155 (10,168) 8,584
Other comprehensive income
Items that may qualify for reclassification 1,941 - 356 2,297
Total other comprehensive income 1,941 - 356 2,297
Assets and liabilities
Segment assets 241,750 244,340 41,628 527,718
Segment liabilities 251,657 184,424 20,080 456,161
Capital expenditure
Tangible assets - - 115 115
Intangible assets - - 1,160 1,160

Page 34
no
tes
to t
he
fin
anci
al s
tate
men
ts
5. Segment reporting (continued)
£’000 TCM CIB Other Total 2015
Operating income
Net interest income 3,253 10,694 (966) 12,981
Net fees and commission income - 2,681 (821) 1,860
Net trading income 955 - (16) 939
Realised gain on disposal of investment securities 126 - - 126
Net operating income from other segments - (583) 583 -
Other operating income - 84 174 258
Total operating income 4,334 12,876 (1,046) 16,164
Operating expenses
Personnel expenses (385) (495) (4,065) (4,945)
Depreciation - - (119) (119)
Amortisation - - (30) (30)
Other operating expenses - - (5,408) (5,408)
Impairment recoveries - 1,143 - 1,143
Total operating expenses (385) 648 (9,622) (9,359)
Segment results 3,949 13,524 (10,668) 6,805
Income tax expense - - 990 990
Profit for the year 3,949 13,524 (9,678) 7,795
Other comprehensive income
Items that may qualify for reclassification (266) - (88) (354)
Total other comprehensive income (266) - (88) (354)
Assets and liabilities
Segment assets 228,071 183,836 29,775 441,682
Segment liabilities 142,071 221,289 17,646 381,006
Capital expenditure
Tangible assets - - 72 72
Intangible assets - - 724 724

Page 35
no
tes
to t
he
fin
anci
al s
tate
men
ts
5. Segment reporting (continued)
The following graphs compare values between 2016 and 2015 (figures in thousand GBP).
• Operating income
• Net results
• Assets
• Operating expenses
• Other comprehensive income
• Liabilities
(2,000)
0
2,000
4,000
6,000
8,000
10,000
12,000
14,000
16,000
TCM CIB Other
2015 2016
(12,000)
(10,000)
(8,000)
(6,000)
(4,000)
(2,000)
0
2,000
TCM CIB Other
2015 2016
(15,000)
(10,000)
(5,000)
0
5,000
10,000
15,000
TCM CIB Other
2015 2016
(500)
0
500
1,000
1,500
2,000
2,500
TCM CIB Other
2015 2016
0
50,000
100,000
150,000
200,000
250,000
300,000
TCM CIB Other2015 2016
0
50,000
100,000
150,000
200,000
250,000
300,000
TCM CIB Other2015 2016

Page 36
no
tes
to t
he
fin
anci
al s
tate
men
ts 5. Segment reporting (continued)
Information about geographical areas
The bank operates in four geographical locations: UK, Africa, Europe and the rest of the world. The Bank's external net operating income is allocated based accounting figures and on the location of the transaction counterparty.
• External net operating income
• Total of assets
£’000 - 2016 United
Kingdom Africa Europe
Rest of the World
External net operating income / (expenses) 8,198 10,489 (511) 2,402
Total of assets 74,945 233,520 155,780 63,473
£’000 – 2015 United
Kingdom Africa Europe
Rest of the World
External net operating income 1,713 12,496 426 1,529
Total of assets 62,966 199,663 135,644 43,409
UnitedKingdom
Africa Europe Rest of theWorld
-2,000
-
2,000
4,000
6,000
8,000
10,000
12,000
2016
UnitedKingdom
Africa Europe Rest of theWorld
-
2,000
4,000
6,000
8,000
10,000
12,000
14,000
2015
UnitedKingdom
Africa Europe Rest of theWorld
0
50,000
100,000
150,000
200,000
250,000
2016
UnitedKingdom
Africa Europe Rest of theWorld
0
50,000
100,000
150,000
200,000
250,000
2015

Page 37
no
tes
to t
he
fin
anci
al s
tate
men
ts
£’000 2016 2015
Due from banks 1,337 1,437
Loans and advances to customers 12,531 9,437
Financial investments - available for sale 4,229 3,624
Financial investments – held to maturity 941 166
Interest and similar income 19,038 14,664
Due to banks (3,340) (1,194)
Subordinated debt (590) (489)
Interest and similar charges (3,930) (1,683)
Net interest income 15,108 12,981
6. Net interest income
£’000 2016 2015
Credit related fees and commissions 850 730
Corporate banking fees 3,039 2,440
Fee and commission income 3,889 3,170
Fees and commission expense (299) (439)
Other fees paid (1,188) (871)
Fees and commission expense (1,487) (1,310)
Net fee and commission income 2,402 1,860
7. Net fee and commission income
Included within various line items under interest income for the year ended 31st December 2016 is a total of £222k (2015: £nil) relating to impaired financial assets.

Page 38
no
tes
to t
he
fin
anci
al s
tate
men
ts
£’000 2016 2015
Foreign exchange 7,794 (1,405)
Foreign exchange - derivative foreign exchange (5,926) 2,343
Gain on disposal of available for sale securities 662 126
Net trading income 2,530 1,065
8. Net trading income
£’000 2016 2015
Rent received from subletting of premises 401 353
Other income / (expenses) 137 (95)
Other operating income 538 258
9. Other operating income
£’000 2016 2015
Wages and salaries (4,202) (3,689)
Social security costs (794) (720)
Pension costs - defined contribution plans (321) (282)
Other benefits (666) (254)
Personnel expenses (5,983) (4,945)
Directors' remuneration and disclosure of highest paid director are disclosed in note 30.
Number of employees 61 56
The average monthly number of employees (including Directors) during the year was:
Board 3 4
Corporate and Investment Banking 16 16
Treasury and Capital Markets 3 3
Operations and support 39 33
10. Personnel expenses
No income derived from other financial instruments are recognised at fair value through profit and loss.

Page 39
no
tes
to t
he
fin
anci
al s
tate
men
ts
£’000 2016 2015
Marketing expense (35) (106)
Operating leases expenses (premises) (1,166) (1,180)
Administrative (2,056) (2,975)
Professional fees (377) (562)
Statutory audit fees (130) (137)
Other expenses (679) (448)
Other operating expenses (4,443) (5,408)
Other fees paid to the auditors
Taxation services (30) (15)
Other services & advice - (41)
11. Other operating expenses
£’000 Note 2016 2015
Loans and advances to customers 16 (886) 1,143
Impairment losses (886) 1,143
12. Net impairment (losses) / recoveries

Page 40
no
tes
to t
he
fin
anci
al s
tate
men
ts
£’000 2016 2015
Current Income tax (1,027) (534)
Prior period current tax adjustments 3 -
Current tax (1,024) (534)
Relating to origination and reversal of temporary differences 957 (213)
Change in tax rate (19) (67)
Recognition of deferred tax assets (390) 1,804
Deferred tax 548 1,525
Taxation (476) 990
Reconciliation of the total tax charge
Profit before tax 9,060 6,805
Income tax calculated at a tax rate of 20.00% (2015: 20.25%) (1,812) (1,379)
Other Non-deductible items (1) (10)
Depreciation in excess of capital allowances - (30)
Capital allowances in excess of depreciation 318 -
Effect of change in tax rate (19) (427)
Adjustment in respect of prior years 3 -
Recognition of tax effect of previously unrecognised deferred tax 1,035 2,836
Income tax benefit reported in the statement of profit and loss (476) 990
The deferred tax asset is due to temporary differences on the following:
Tax losses available 5,819 6,224
Property and equipment 1,147 140
Financial investments – available for sale - 54
Total 6,966 6,418
13. Taxation
Deferred tax has been provided at the rates being in force when the temporary differences reverse, in accordance with the accounting policy. This has been calculated using the tax rate ranging from 20% to 17% (2015: 20%). As a result of the change in bank loss relief utilisation, the deferred tax asset is expected to be released over 10 years. The deferred tax asset (DTA) recognised as at 31 December 2016 has been recognised on the basis that the Directors believe it is probable that sufficient future taxable profits will be generated against which it can be utilised. In arriving at this conclusion the
Directors have estimated the future profit performance for the Bank which is subject to a number of variables. If forecast reduces by 10% the Directors would still deem recognition of the deferred tax assets as appropriate. The Directors are satisfied the calculation of the deferred tax asset will be utilised with future taxable profits. A sensitivity analysis has been applied to the initial scenario described previously. A +10% - 6% changes in the forecast income of the Bank would change the period over which the losses will be fully utilised by 0 -1 year.
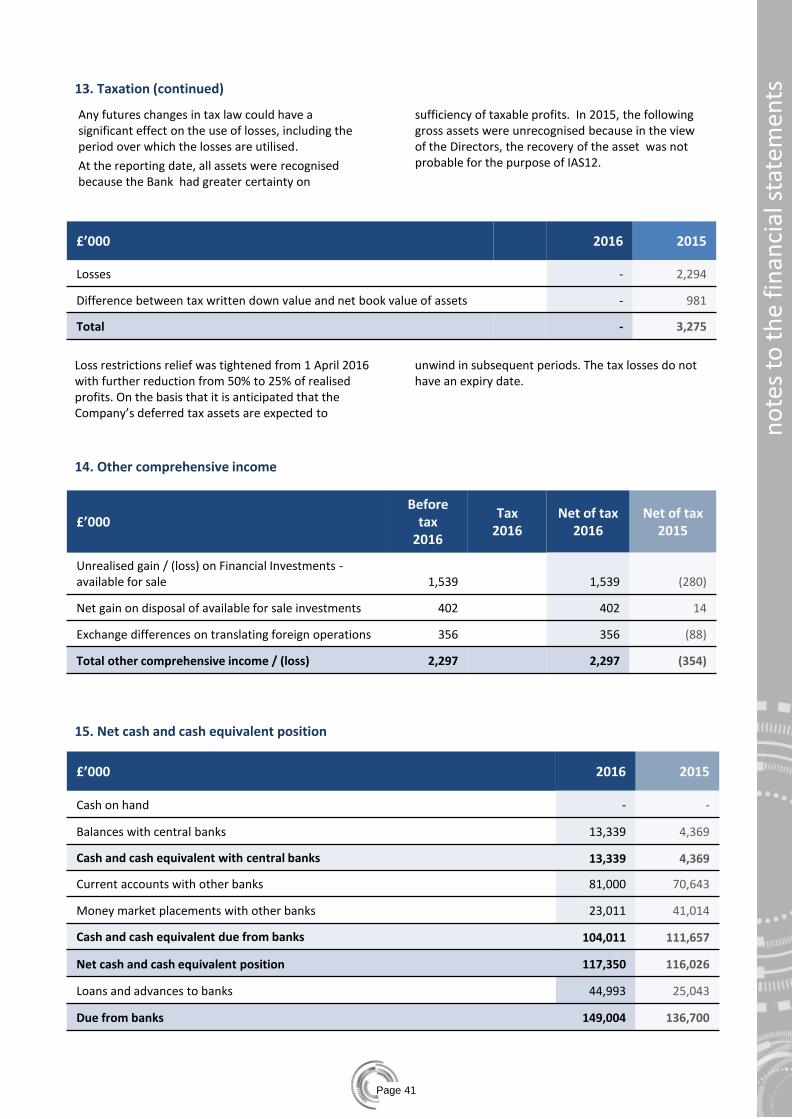
Page 41
no
tes
to t
he
fin
anci
al s
tate
men
ts
14. Other comprehensive income
£’000
Before tax
2016
Tax 2016
Net of tax 2016
Net of tax 2015
Unrealised gain / (loss) on Financial Investments - available for sale 1,539 1,539 (280)
Net gain on disposal of available for sale investments 402 402 14
Exchange differences on translating foreign operations 356 356 (88)
Total other comprehensive income / (loss) 2,297 2,297 (354)
£’000 2016 2015
Cash on hand - -
Balances with central banks 13,339 4,369
Cash and cash equivalent with central banks 13,339 4,369
Current accounts with other banks 81,000 70,643
Money market placements with other banks 23,011 41,014
Cash and cash equivalent due from banks 104,011 111,657
Net cash and cash equivalent position 117,350 116,026
Loans and advances to banks 44,993 25,043
Due from banks 149,004 136,700
15. Net cash and cash equivalent position
Any futures changes in tax law could have a significant effect on the use of losses, including the period over which the losses are utilised.
At the reporting date, all assets were recognised because the Bank had greater certainty on
sufficiency of taxable profits. In 2015, the following gross assets were unrecognised because in the view of the Directors, the recovery of the asset was not probable for the purpose of IAS12.
£’000 2016 2015
Losses - 2,294
Difference between tax written down value and net book value of assets - 981
Total - 3,275
13. Taxation (continued)
Loss restrictions relief was tightened from 1 April 2016 with further reduction from 50% to 25% of realised profits. On the basis that it is anticipated that the Company’s deferred tax assets are expected to
unwind in subsequent periods. The tax losses do not have an expiry date.
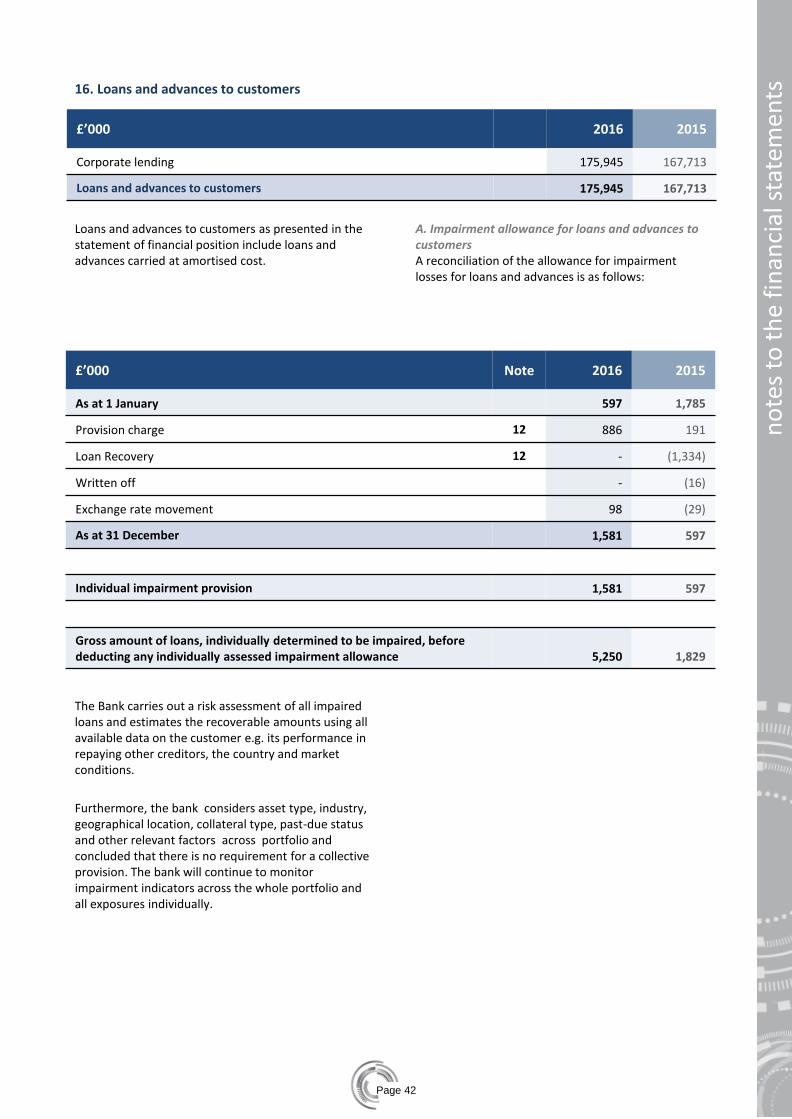
Page 42
no
tes
to t
he
fin
anci
al s
tate
men
ts
£’000 2016 2015
Corporate lending 175,945 167,713
Loans and advances to customers 175,945 167,713
16. Loans and advances to customers
Loans and advances to customers as presented in the statement of financial position include loans and advances carried at amortised cost.
A. Impairment allowance for loans and advances to customers A reconciliation of the allowance for impairment losses for loans and advances is as follows:
The Bank carries out a risk assessment of all impaired loans and estimates the recoverable amounts using all available data on the customer e.g. its performance in repaying other creditors, the country and market conditions.
Furthermore, the bank considers asset type, industry, geographical location, collateral type, past-due status and other relevant factors across portfolio and concluded that there is no requirement for a collective provision. The bank will continue to monitor impairment indicators across the whole portfolio and all exposures individually.
£’000 Note 2016 2015
As at 1 January 597 1,785
Provision charge 12 886 191
Loan Recovery 12 - (1,334)
Written off - (16)
Exchange rate movement 98 (29)
As at 31 December 1,581 597
Individual impairment provision 1,581 597
Gross amount of loans, individually determined to be impaired, before deducting any individually assessed impairment allowance 5,250 1,829

Page 43
no
tes
to t
he
fin
anci
al s
tate
men
ts
17. Financial investments - available for sale
£’000 2016 2015
Government debt securities 14,625 11,342
Other debt securities 129,638 91,036
Financial investments at available for sale 144,263 102,378
Financial instruments available for sale at cost 144,865 104,920
Available for sale cumulative valuation (602) (2,542)
less impairment provision - -
Available-for-sale financial assets carried at fair value 144,263 102,378
Maturity
less than three months - -
one year or less but over three months 53,178 17,063
between one year and five years 91,085 85,315
more than five years - -
Available-for-sale financial assets carried at fair value 144,263 102,378
18. Financial investments - held to maturity
£’000 2016 2015
Government debt securities 16,846 7,337
Financial investments held to maturity 16,846 7,337
Maturity
less than three months - -
one year or less but over three months - -
between one year and five years 16,846 -
more than five years - 7,337
Financial investments held to maturity 16,846 7,337

Page 44
no
tes
to t
he
fin
anci
al s
tate
men
ts
£’000 2016 2015
Cost as at 1 January 499 2,557
Additions 115 72
Disposals - (2,040)
Exchange adjustments 77 (90)
Cost as at 31 December 691 499
Depreciation as at 1 January (273) (1,570)
Charge for the year (71) (119)
Disposals - 1,379
Exchange adjustments (47) 37
Depreciation as at 31 December (391) (273)
Net book value 300 226
19. Property and equipment – computer hardware, furniture & equipment
£’000 2016 2015
Cost as at 1 January 724 -
Additions 1,160 724
Cost as at 31 December 1,884 724
Amortisation as at 1 January (30) -
Charge for the year (135) (30)
Amortisation as at 31 December (165) (30)
Net book value 1,719 694
20. Intangible assets – computer software

Page 45
21. Goodwill
A. Information about geographical areas
Goodwill acquired through business combinations has been allocated to two individual cash-generating units (CGUs) for impairment testing as follows:
• Corporate and Investment Banking; and
• Treasury and Capital Markets.
£’000 2016 2015
Corporate and Investment Banking 5,175 4,705
Treasury and Capital Markets 3,416 2,632
Net book value 8,591 7,337
Key assumptions used in value in use calculations The recoverable amounts of the above CGUs have been determined based on a value in use calculation, using cash flow projections in perpetuity based on business plans approved by senior management for 4 years with an assumption of steady 2% growth in future years after the 4 years period and then discounted at a rate of 11%. These assumptions are considered by management to be prudent. For example current average gross domestic product growth rates in the African market are about 4%. These business plans, which also form the basis of the assessment of the deferred tax recognition (see note 13), assume: • No significant impairments over a provision rate of
0.5% per annum of the loan book; • An ongoing cost reduction programme including
premises savings and eliminating resource duplication; and
• Adequate capital to cover asset growth. The calculation of value in use for both of the CGUs does not lead to any indicators of additional
impairment. The sensitivity to the key assumptions before a write down is required (assuming other factors remain constant), are as follows: • The discount rate would need to exceed 20%, or • Projected growth rates during the budget period
would need to exceed -2%. Interest margins: Interest margins are based on management assessments and are in line with average values achieved in 2016. These are maintained over the budget period for anticipated market conditions. Discount rates: Discount rates reflect management’s estimated return on the Bank’s capital employed (ROCE). Projected growth rates: Projected growth rates are based on the Bank’s ability to fully utilise its capital, together with its assessment of market conditions in Africa.
£’000 2016 2015
As at 1 January 12,191 12,645
Additions - -
Disposals - -
Exchange adjustments 1,254 (454)
As at 31 December 13,445 12,191
Impairment (4,854) (4,854)
Net book value 8,591 7,337
no
tes
to t
he
fin
anci
al s
tate
men
ts
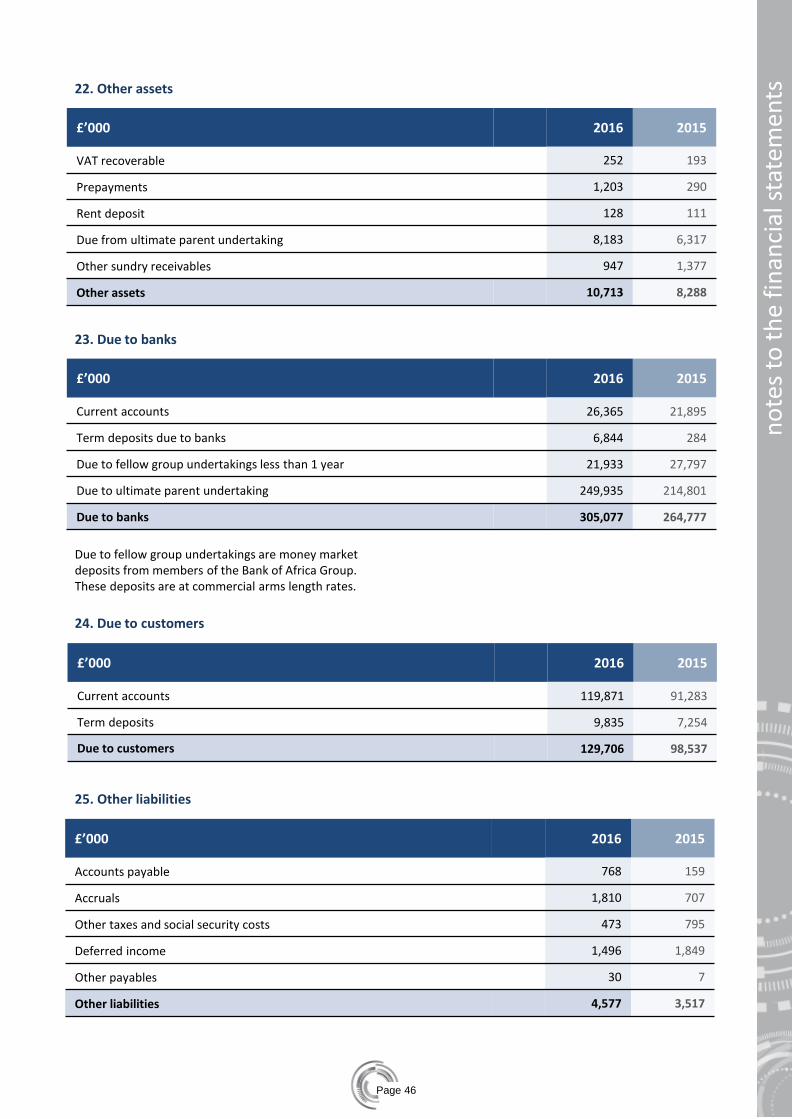
Page 46
no
tes
to t
he
fin
anci
al s
tate
men
ts
22. Other assets
£’000 2016 2015
Current accounts 26,365 21,895
Term deposits due to banks 6,844 284
Due to fellow group undertakings less than 1 year 21,933 27,797
Due to ultimate parent undertaking 249,935 214,801
Due to banks 305,077 264,777
23. Due to banks
£’000 2016 2015
Current accounts 119,871 91,283
Term deposits 9,835 7,254
Due to customers 129,706 98,537
24. Due to customers
£’000 2016 2015
Accounts payable 768 159
Accruals 1,810 707
Other taxes and social security costs 473 795
Deferred income 1,496 1,849
Other payables 30 7
Other liabilities 4,577 3,517
25. Other liabilities
£’000 2016 2015
VAT recoverable 252 193
Prepayments 1,203 290
Rent deposit 128 111
Due from ultimate parent undertaking 8,183 6,317
Other sundry receivables 947 1,377
Other assets 10,713 8,288
Due to fellow group undertakings are money market deposits from members of the Bank of Africa Group. These deposits are at commercial arms length rates.

Page 47
no
tes
to t
he
fin
anci
al s
tate
men
ts
£’000 2016 2015
Principal 15,140 13,001
Accrued Interest 363 315
Subordinated debt 15,503 13,316
26. Subordinated debt
£’000 Note 2016 2015
Share capital
Authorised 150,000,000 ordinary shares of £1 each
Issued, called up and fully paid 102,173,000 shares ordinary shares of £1 each 102,173 102,173
Share capital as at 31 December 102,173 102,173
All shares rank equally with one vote per share. There is no entitlement to fixed income
Reserves
Available for sale investment reserve (602) (2,543)
Foreign currency translation (90) (446)
Accumulated losses (29,924) (38,508)
Reserves as at 31 December (30,616) (41,497)
Share capital and reserves 71,557 60,676
27. Share capital and reserves
Subordinated debt represent subordinated loans of €17.700k 4% fixed rate notes granted by the parent company on 31st May 2010 with original redemption date of 2020. In 2015, the maturity of €17,700k subordinated debt was extended from 2020 to 2023.

Page 48
no
tes
to t
he
fin
anci
al s
tate
men
ts
28. Additional cash flow information
£’000 2016 2015*
Cash and balances with central banks 13,339 4,369
Current accounts with other banks 81,000 70,643
Money market placements with other banks 23,011 41,014
Cash and cash equivalent (note 15) 117,350 116,026
Net decrease / (increase) in:
Due from banks (19,950) (2,052)
Derivative Financial Instruments 190 (207)
Loans and advances to customers (8,232) (18,456)
Other assets (2,425) 2,185
Interest (11,400) (6,794)
Change in operating assets (41,817) (25,324)
Net (decrease) / increase in:
Due to banks 40,300 75,358
Derivative financial instruments 439 (3,408)
Due to customers 31,169 (2,882)
Other liabilities 3,225 550
Interest 205 (36)
Change in operating liabilities 75,338 69,582
Depreciation and amortisation 206 149
Impairment provisions 886 191
Gains on AFS (662) (126)
Net foreign exchange gain 540 563
Loss on disposal of property equipment - 809
Other items included in profit before tax 970 1,586
(*) 2015 figures amended for comparison purpose.

Page 49
no
tes
to t
he
fin
anci
al s
tate
men
ts
£’000 2016 2015
Financial guarantees 8,417 32,842
Letters of credit 47,758 67,409
Bills for collection 8,219 6,394
Contingent liabilities 64,394 106,645
Undrawn commitments to lend 16,448 36,076
Commitments 16,448 36,076
Contingent liabilities and commitments 80,842 142,721
29. Contingent liabilities and commitments
These are credit-related instruments which include guarantees and commitments to extend credit. The contractual amounts represent the amount at risk should the contract be fully drawn upon and the client defaults.
Since a significant portion of guarantees and commitments are expected to expire without being
drawn upon, the total of the contract amounts is not representative of future cash requirements.
These obligations are not recognised on the balance sheet but they contain credit risk and are therefore part of the overall risk of the Bank.
The total outstanding commitments and contingent liabilities are as follows:
Operating lease commitments Bank as lessee The Bank was committed to making the following cumulative payments under non-cancellable operating leases in the year. Operating leases are for the Bank’s offices in London and Paris. The lease is to be shared with other group companies, the Bank’s committed share is to pay £625,833 per annum. Future non-cancellable operating lease payments as at 31 December are as follows:
£’000 2016 2015
Within one year 1,051 714
After one year but not more than five years 1,996 1,420
After five years but not more than ten years - -
Lease commitments expiring 3,047 2,134

Page 50
no
tes
to t
he
fin
anci
al s
tate
men
ts
£’000 2016 2015
Within one year 393 328
Lease commitments receivable 393 328
29. Contingent liabilities and commitments (continued)
Bank as lessor
The Bank subleased a portion of its Paris premises. Future minimum rentals receivable under the non-cancellable operating leases as at 31 December are as follows:
30. Compensation and transactions with key management personnel of the Bank
The non-executive Directors do not receive pension entitlements from the Bank.
Key management personnel include senior management of the Bank.
One director was a member of the defined contribution scheme in 2015. The non–executive Directors do not receive pension entitlements from the Bank.
The Bank did not enter into transactions, arrangements and agreements involving Directors, senior management and their business associates, or close family members.
£’000 2016 2015
Short-term employee benefits 1,232 1,103
Post-employment pension (defined contribution) 33 12
Compensation of key management personnel (including Directors) 1,265 1,115
Short-term employee benefits 542 549
Compensation of Directors 542 549
Aggregate emoluments and benefits 348 309
Highest paid Director 348 309
31. Related party transactions
The Bank is a wholly owned subsidiary of BMCE International (Holdings) plc. The ultimate parent undertaking and ultimate parent company of the Bank is Banque Marocaine du Commerce Exterieur S.A. (BMCE).
During the year there have been transactions between the Bank, its parent company, the ultimate
parent company and other related parties. The Bank receives and provides a range of services from the parent and related parties, including loans and guarantees and various administrative services.

Page 51
no
tes
to t
he
fin
anci
al s
tate
men
ts
£’000 - 2016 BMCE BOA ITIS ES Total
Interest charged 3,569 166 - - 3,735
Interest received 591 223 - - 814
Fees and commission paid 13 - - - 13
Fees and commission received 137 143 - - 280
Net trading income/(expense) 430 280 2 712
Other operating expenses paid 2 1 1,461 - 1,464
Amounts owed to 253,936 19,098 900 - 273,934
Amounts owed by 35,058 4,061 5,590 - 44,709
Financial guarantees and commitments given 19,797 4,811 24,608
Financial guarantees received 21,331 2,820 24,151
£’000 - 2015 BMCE BOA ITIS ES Total
Interest charged 2,107 163 - - 2,270
Interest received 346 65 - - 411
Fees and commission paid 66 - - - 66
Fees and commission received 164 167 - - 331
Net trading income/(expense) - - - - -
Other operating expenses paid - - 1,322 - 1,322
Amounts owed to 221,912 17,785 - 2,914 242,611
Amounts owed by 18,575 1,484 3,638 - 23,697
Financial guarantees and commitments given 14,928 6,615 - - 21,543
Financial guarantees received 29,162 2,230 - - 31,392
BMCE = Banque Marocaine du Commerce Exterieur S.A BOA = Bank of Africa Group (*) (*) Company owned and controlled directly by Banque Marocaine du Commerce Exterieur S.A
IT IS = IT Information Services (*) ES = Euroservices SA (*)
31. Related party transactions (continued)
The outstanding balances at the year end arose from the ordinary course of business and are unsecured. The interest, fees and commissions paid to or received from related parties are at normal commercial rates.
In addition to entities within the scope of BMCE Group, key management personnel are also considered as related parties. Compensations are disclosed in note 30.

Page 52
no
tes
to t
he
fin
anci
al s
tate
men
ts
32. Risk management
A. Introduction
Effective risk management is an ongoing fundamental strategy for the Bank. Whilst it is in general a key capability for a successful financial services provider, risk management also plays a significant role in the Bank’s current stage of development and is critical to the Bank’s target of reaching profitability. The key components of the Bank’s risk management infrastructure are:
• Governance; and
• Risk management processes.
The main risks facing the Bank are:
• Credit risk;
• Liquidity risk;
• Market risk; and
• Operational risk.
B. Governance
The board of Directors is responsible for the overall risk management approach and for approving the risk strategies. It is supported by a number of committees as follows:
• Risk Management Department (RMD) and Risk Committee:
‒ The RMD is organised along traditional risk functions: Market/Liquidity, Credit, and Operational risks. The RMD is responsible for implementing, measuring and maintaining risk related procedures to ensure that an independent control process is present.
‒ The Risk Committee assists the Board in monitoring the adequacy and effectiveness of the Bank’s risk management policies and processes. The Credit Risk Committee approves all credit applications.
• Treasury Asset and Liability Committee (TALCO) - TALCO is responsible for assisting the board and senior management in the oversight of risk policies, strategies and processes. The role of TALCO is to assist the Bank in fulfilling its responsibilities relating to the oversight of the Bank’s market risk management policies, strategies and processes that have the potential to impact significantly on the Bank’s earnings performance and capital. TALCO’s responsibilities include management and review of:
‒ the Bank’s exposure to market risk and its hedging strategy;
‒ the Bank’s liquidity;
‒ the usage of capital including ensuring external regulatory requirements are met;
‒ risk management processes;
‒ other categories of risk linked to market risk (country risk, counterparty risk);
‒ regulatory developments and their impact on the prices of marketable assets;
‒ the valuation of market assets and the measurement of market risk; and
‒ market risk limits.
• Audit Committee:
The Audit Committee consists of independent non-executive Directors (including the Chairman of the Audit Committee). The Audit Committee meets quarterly, or as frequently as is required to carry out properly its functions. The Audit Committee’s responsibility is one of oversight and review. It does not provide expert advice nor exercise any executive role. The Audit Committee’s role is to assist the Board in monitoring:
‒ the integrity of the financial statements of the Bank;
‒ the adequacy and effectiveness of the systems of internal controls of the Bank;
‒ the qualifications and independence of the Bank's external auditors and the performance of the Bank's internal and external auditors; and
‒ any other relevant issue.
C. Measuring and reporting systems
The monitoring and controlling of risk is primarily performed against limits established by the Bank. These limits are established using an approved ‘Credit Policies and Procedures Manual’, ‘Market Risk Policies and Procedures Manual’ and ‘Operational Risk Policies and Procedures Manual’. Additionally, a qualitative and quantitative approach within this framework is used.
The Bank’s policy is to generate report on a daily basis from information compiled from all business systems, then analysed to identify control risks appropriately and promptly. These reports include (but are not limited to) exposure reports (counterparty exposure, country exposure, sector exposure), excess reports and concentration risks across all counterparties, countries and industries.

Page 53
£’000 - 2016 CIB TCM Total
Europe 44,551 87,192 131,743
United Kingdom 42,280 26,573 68,853
Africa 111,418 133,803 245,221
Others 45,326 19,000 64,326
Total 243,575 266,568 510,143
32. Risk management (continued)
D. Mitigation
As part of its overall risk management strategy the Bank may use derivatives and other financial instruments to manage exposures to interest rates, foreign currencies, equity price risks, credit risks and to pre-hedge those expected from future transactions.
33. Credit risk
Credit risk is one of the major risk areas for the Bank and is defined as the risk of loss from default by debtors (including bond issuers) or trading counterparties.
All such risks taken by the Bank must have been approved at the appropriate levels, and must adhere to the policies and procedures contained within the Credit Risk Policy Manual. Monitoring credit risks on a day-to-day basis, and making sure that exposures are within approved limits, is key responsibility of the Risk Management Department.
The Bank has an established credit review process to provide a periodic assessment of the creditworthiness of counterparties. An internal credit risk classification system is used to assess and allocate a credit risk grade notwithstanding the external rating assigned.
A. Risk concentrations of the maximum exposure to credit risk
Risk concentrations arise when a number of counterparties are engaged in similar business activities or activities in the same geographic region or have similar economic features that would cause their ability to meet contractual obligations to be similarly affected by changes in economic, political or other conditions.
Concentrations indicate the relative sensitivity of the Bank’s performance to developments affecting a particular industry or geographical location.
In order to avoid excessive concentrations of risk the Bank’s policies and procedures include specific guidelines regarding the importance of portfolio diversification. Identified concentrations of credit risks
are controlled and managed accordingly. Selective hedging may be used within the Bank to manage risk concentrations at both the relationship and industry levels.
The Bank has country limits and sector limits set in place and monitored accordingly in order that the Bank’s portfolio is maintained at a level that is appropriately diversified.
Concentrations of risks are managed by client/counterparty, by geographical region and by industry sector.
The maximum gross credit exposure to one counterparty, other than to related parties disclosed in note 31, by risk concentration as of 31 December 2016 was £29,039k (2015: £48,166k).
B. Geographical analysis
The Bank's concentration of maximum exposure to credit risk, before taking into account any collateral held or other credit enhancements can be analysed by the following geographical regions:
no
tes
to t
he
fin
anci
al s
tate
men
ts

Page 54
no
tes
to t
he
fin
anci
al s
tate
men
ts
33. Credit risk (continued)
£’000 - 2015 CIB TCM Total
Europe 6,291 68,221 74,512
United Kingdom 52,452 58,053 110,505
Africa 97,231 101,352 198,583
Others 43,408 - 43,408
Total 199,382 227,625 427,007
The general creditworthiness of a corporate customer tends to be the most relevant indicator or credit quality of a loan extended to it. However, collateral provides additional security and the Bank generally requests that corporate borrowers provide it. The Bank may take collateral in the form of floating charges over all corporate assets and other lines, credit insurance and guarantees. Because the Bank’s focus on corporate credit worthiness, the Bank does not routinely update the valuation of the collateral held against all loans to corporate customers. Valuation of collateral is updated when the credit risk of a loan deteriorates significantly and the loan is monitored more closely. For impaired loans, the Bank obtains an appraisal of collateral because the current value of the collateral is an input to the impairment measurement.
C. Maximum exposure to credit risk without taking account of any collateral and other credit enhancements
The following table shows the maximum exposure to credit risk for the components of the statement of financial position, including derivatives.
The maximum exposure is shown gross, before the effect of mitigation through the use of collateral agreements:
£’000 Note 2016 2015
Cash and balances with central banks 15 13,339 4,369
Due from banks 15 149,004 136,700
Derivative financial instruments 38 32 222
Loans and advances to customers 16 175,945 167,713
Financial investment - available for sale 17 144,263 102,378
Financial investment - held to maturity 18 16,846 7,337
Other assets 22 10,714 8,288
Total 510,143 427,007
Contingent liabilities 29 66,419 106,645
Commitments 29 16,448 36,076
Total 82,867 142,721
Contingent liabilities and commitments 593,009 569,728

Page 55
no
tes
to t
he
fin
anci
al s
tate
men
ts
£’000
2016 Gross
maximum exposure
2016 Net
maximum exposure
2015 Gross
maximum exposure
2015 Net
maximum exposure
Agriculture 1,172 1,172 3,905 3,905
Banking and finance 350,125 289,194 349,604 290,137
Commodities extraction and production 802 802 - -
Construction and heavy goods 8,234 8,234 13,880 5,673
Consumables wholesaling 20,239 6,285 14,907 6,766
Energy 12,305 1,367 26,254 8,855
Governments 172,056 137,998 128,592 82,741
Individuals 360 297 330 269
Commodities extraction and production 5,362 5,362 3,366 3,366
Recreational 477 477 77 77
Technology, and telecommunications 3,830 3,822 3,726 3,726
Transport and shipping 18,047 6,298 25,087 20,654
Total 593,009 461,308 569,728 426,169
33. Credit risk (continued) An industry sector analysis of the Bank's financial assets, before and after taking into account collateral held or other credit enhancements, is as follows:

Page 56
no
tes
to t
he
fin
anci
al s
tate
men
ts
33. Credit risk (continued)
D. Carrying amount per class of financial assets whose terms have been renegotiated
The below table shows the carrying amount of renegotiated financial assets, net of credit mitigation by class.
£’000 2016 2015
Corporate lending 12,011 6,900
Total 12,011 6,900
E. Credit quality per class of financial assets
The credit quality of financial assets is managed by the Bank using internal credit ratings. Credit Risk Grades (CRG) generally apply to clients, but can also be applied to specific transactions where considered appropriate. All facilities are considered to have the CRG of the client unless specifically stated otherwise. The latter will occur only where the transactions are considered to have a credit risk different to the legal entity concerned, an example being where some facilities or transactions are guaranteed by a stronger entity, or where the source of repayment is from a
stronger entity in a ring-fenced structured finance transaction.
The following table shows the credit quality by class of asset for loan-related balance sheet lines, based on the Bank's credit rating system, using the industry standard credit rating agency definition of investment grade, e.g. Moody’s Investors Service Baa3 or better, Fitch Ratings BBB- or better:
£’000 - 2016 Investment
grade Non investment
grade Impaired Total
Due from banks 94,543 54,461 - 149,004
Derivative financial instruments - 32 - 32
Loans and advances to customers 47 170,647 5,250 175,944
Financial instruments – available for sale 102,965 41,298 - 144,263
Financial instruments – held to maturity 8,153 8,693 - 16,846
Total 205,708 275,131 5,250 486,089
£’000 - 2015 Investment
grade Non investment
grade Impaired Total
Due to banks 104,397 32,303 - 136,700
Derivative financial instruments 32 190 - 222
Loans and advances to customers - 165,884 1,829 167,713
Financial instruments – available for sale 52,114 50,264 - 102,378
Financial instruments – held to maturity 7,337 - - 7,337
Total 163,880 248,641 1,829 414,350

Page 57
no
tes
to t
he
fin
anci
al s
tate
men
ts
33. Credit risk (continued)
The table below sets out a reconciliation of changes in the carrying amount of impaired loans and advances to customers:
E. Credit quality per class of financial assets Financial investments - available for sale and held to maturity can be split as follows:
£’000 2016 2015
Rated AAA 57,393 28,167
Rated BBB+ to BBB- 8,153 -
Rated BB+ and Below 23,318 18,679
Government Bonds and Treasury Bills 88,864 46,846
Rated A- 12,475 10,188
Rated BBB+ to BBB- 20,638 13,759
Rated BB+ and Below 39,132 38,922
Financial Institution Bonds 72,245 62,869
Total 161,109 109,715
£’000 2016 2015
As at January 1,829 8,135
Impaired in year 16,132 437
New provisions charge in the year (886) (191)
Released through interest income - -
Written off - -
Exchange movement 186 348
Reclassified to performing (12,011) (6,900)
As at 31 December 5,250 1,829

Page 58
no
tes
to t
he
fin
anci
al s
tate
men
ts
£’000 2016
Carrying amount
2015 Carrying amount
Balances with central banks 13,399 4,369
Cash and balances with other banks 81,000 74,120
Unencumbered debt securities issued by sovereigns 57,393 28,094
Total 151,792 106,583
34. Liquidity risk
Liquidity risk is the risk that the Bank may encounter difficulty in meeting obligations associated with financial liabilities when they fall due under normal and stressed conditions.
The Bank has obtained funding, with appropriate maturities, from its ultimate parent in order to meet its liquidity needs.
In stressed situations, the Bank will utilise funding arrangements under market repurchase agreements and deposits from the parent Company. This funding will be provided on an arms-length basis. The liquidity position is assessed and managed under a variety of scenarios. The most important of these is to maintain limits on the ratio of net liquid assets to customer liabilities, set to reflect market conditions.
Net liquid assets consist of cash, short term Bank deposits and high quality liquid assets securities available for immediate sale, less deposits from Banks and other borrowings. The Bank focuses on net liquid assets due to mature within the next eight days and also those due to mature within the next month. However the Bank also monitors all assets and liabilities over their contractual maturities.
The ultimate parent Company Banque Marocaine du Commerce Exterieur S.A has committed to provide intergroup funding deposits to a maximum of £250 million, or equivalent in foreign currency, at an arms length interest rate to be agreed between the two parties until 31 December 2017.
A. Liquidity reserves
The table below shows the liquidity reserves:

Page 59
no
tes
to t
he
fin
anci
al s
tate
men
ts
34. Liquidity risk (continued)
The table below summarises the maturity profile of the Bank’s assets and liabilities at 31 December 2016 based on contractual discounted repayment obligations.
£’000 - 2016 Less
than 1 month
1 to 3 months
Over 3 to 12
months
1 to 5 years
Over 5 years
Total
Assets
Balances with central banks 13,339 - - - - 13,339
Due from banks 101,481 10,795 27,439 9,289 - 149,004
Derivative financial instrument 26 - 6 - - 32
Loans and advances to customers 9,806 24,695 29,969 82,926 28,549 175,945
Financial Investments AFS 323 21 49,477 94,442 - 144,263
Financial Investments HTM - - 166 16,680 - 16,846
Property and equipment - - - - 300 300
Goodwill and other intangible assets - - - - 10,310 10,310
Deferred tax assets - - - 3,474 3,492 6,966
Other assets 10,713 - - - - 10,713
Total Assets 135,688 35,511 107,057 206,811 42,651 527,718
Liabilities
Due to banks 69,068 8,772 227,237 - - 305,077
Derivative financial instrument 178 1,120 - - - 1,298
Due to customers 114,454 4,469 10,783 - - 129,706
Subordinated debt - 363 - - 15,140 15,503
Other liabilities 4,577 - - - - 4,577
Total Liabilities 188,277 14,724 238,020 - 15,140 456,161

Page 60
no
tes
to t
he
fin
anci
al s
tate
men
ts
34. Liquidity risk (continued)
The table below summarises the maturity profile of the Bank’s assets and liabilities at 31 December 2015 based on contractual discounted repayment financial obligations.
£’000 - 2015 Less
than 1 month
1 to 3 months
Over 3 to 12
months
1 to 5 years
Over 5 years
Total
Assets
Balances with central banks 4,369 - - - - 4,369
Due from banks 113,046 1,061 17,872 4,721 - 136,700
Derivative financial instruments 31
191 - - 222
Loans and advances to customers 31,312 10,502 29,754 80,790 15,355 167,713
Financial Investments AFS - 849 23,580 77,949 - 102,378
Financial Investments HTM - 79 - - 7,258 7,337
Property and equipment - - - - 226 226
Goodwill and other intangible assets - - - - 8,031 8,031
Deferred tax assets - - - 5,598 820 6,418
Other assets 8,288 - - - - 8,288
Total Assets 157,015 12,522 71,397 169,058 31,690 441,682
Liabilities
Due to banks 72,901 - 191,876 - - 264,777
Derivative financial instruments 30 829 - - 859
Due to customers 90,375 1,397 6,765 - - 98,537
Subordinated debt - 315 - - 13,001 13,316
Other liabilities 3,517 - - - - 3,517
Total Liabilities 166,793 1,742 199,470 - 13,001 381,006

Page 61
no
tes
to t
he
fin
anci
al s
tate
men
ts
34. Liquidity risk (continued)
The table below summarises the split of the statement of the financial position between current and non-current assets and liabilities:
£’000
2016 Less than
1 year
2016 More than
1 year
2015 Less than
1 year
2015 More than
1 year
Assets
Cash and balances with central banks 13,339 - 4,369 -
Due from banks 139,715 9,289 131,979 4,721
Derivative financial instruments 32 - 222 -
Loans and advances to customers 64,470 111,475 71,568 96,145
Financial investments - available for sale 49,821 94,442 24,429 77,949
Financial investments - held to maturity 166 16,680 79 7,258
Property and equipment - 300 - 226
Goodwill and other intangible assets - 10,310 - 8,031
Deferred tax assets - 6,966 820 5,598
Other assets 10,713 - 8,288 -
Total assets 278,256 249,462 241,754 199,928
Liabilities
Due to banks 305,077 - 264,777 -
Derivative financial instruments 1,298 - 859 -
Due to customers 129,706 - 98,537 -
Other liabilities 4,577 - 3,517 -
Subordinated debt 363 15,140 315 13,001
Total liabilities 441,021 15,140 368,005 13,001
The above analysis shows the Bank has treated all demand customer deposits as repayable immediately, however long term business relationships means that this is not the case in practice. The Bank has adequate arrangements to meet its liquidity requirements.
The majority of the inter bank funding is comprised of a series of term deposits from the ultimate parent Company with staggered maturities.

Page 62
no
tes
to t
he
fin
anci
al s
tate
men
ts
35. Market risk
Market risk is defined as the risk of losses on financial instruments arising from changes in market factors. The Bank is currently exposed to changes in risk interest rate risk , foreign exchange rate risk and price risk.
Market risk may be propagated by other forms of financial risk such as credit and market liquidity risks, prices potentially moving adversely for a number of reasons, including credit downgrading of securities held, general negative economic factors, and reduced liquidity. The key specific types of market risk relevant to the Bank are:
• Interest rate risk
• Foreign exchange risk
• Price risk on available for sale assets
The Bank’s control framework has been designed using a risk-based approach i.e. to address the business risks which have been identified as being the most relevant to the Bank as a result of the type of business undertaken and according to the way its operations have been organised.
The other specific market type risks are managed and have the following potential financial impacts as follows:
A. Interest rate risk
• Banking book: Interest rate risk is the risk to earnings or capital arising from movement of interest rates. It arises from differences between the timing of rate changes and the timing of cash flows (re-pricing risk); from changing rate relationships among yield curves that affect Bank activities (basis risk); from changing rate relationships across the spectrum of maturities (yield curve risk); and, from interest-rate-related options embedded in Bank products (option risk). The evaluation of interest rate risk must consider the impact of complex, illiquid, hedging strategies or products, and also the potential impact on fee income that is sensitive to changes in interest rates.
• Trading book: The current low level of the trading book means there is no significant interest rate risk at this time.
The total sensitivity of all assets and liabilities held has been calculated as follows:
£’000 - Gain / (Loss) in profit or loss 2016 2015
Parallel shift in interest rates -2% (10,100) (4,393)
Parallel shift in interest rates +2% 11,420 4,831

Page 63
no
tes
to t
he
fin
anci
al s
tate
men
ts
35. Market risk (continued)
B. Foreign exchange risk
Foreign exchange risk is the risk that the value of a financial instrument denominated in foreign currency will fluctuate in domestic currency terms due to changes in exchange rates.
The bank policy’s is to monitor market exposures by the risk team on a daily basis.
£’000 - 2015 USD EUR Other
Currencies
Net foreign currency exposures 71 14,633 1,161
Impact of 5% increase in foreign currency : GBP rate (4) (732) (60)
Impact of 5% decrease in foreign currency : GBP rate 4 732 60
£’000 - 2016 USD EUR Other
Currencies
Net foreign currency exposures 4,606 (650) 883
Impact of 5% increase in foreign currency : GBP rate (230) 33 (44)
Impact of 5% decrease in foreign currency : GBP rate 230 (33) 44
C. Price risk on available for sale assets.
The Bank holds available for sale securities, which in accordance with International Financial Reporting Standards are marked to market through other reserves. The unrealised gains and losses on these bonds are monitored by the Treasury and Capital Markets traders and reported to the TALCO committee which makes decisions on whether or not to dispose of these assets. The policy is to hold assets with a maximum residual maturity of 7 years and only in markets where the Bank has experience in order to minimise risk. A 1% price reduction would result in a loss of approximately £1,433k. Similarly a 1% price rise would result in a gain of approximately £1,433k.
36. Operational risk
Operational risk is the risk of loss arising from systems failure, human error, fraud or external events. When controls fail to perform, operational risks can cause damage to reputation, have legal or regulatory implications, or lead to financial loss. The Bank cannot expect to eliminate all operational risks but it endeavors to manage these risks through its control framework and by monitoring and responding to potential risks. Controls include effective segregation of duties, access, authorisation and reconciliation procedures, staff education and assessment processes.
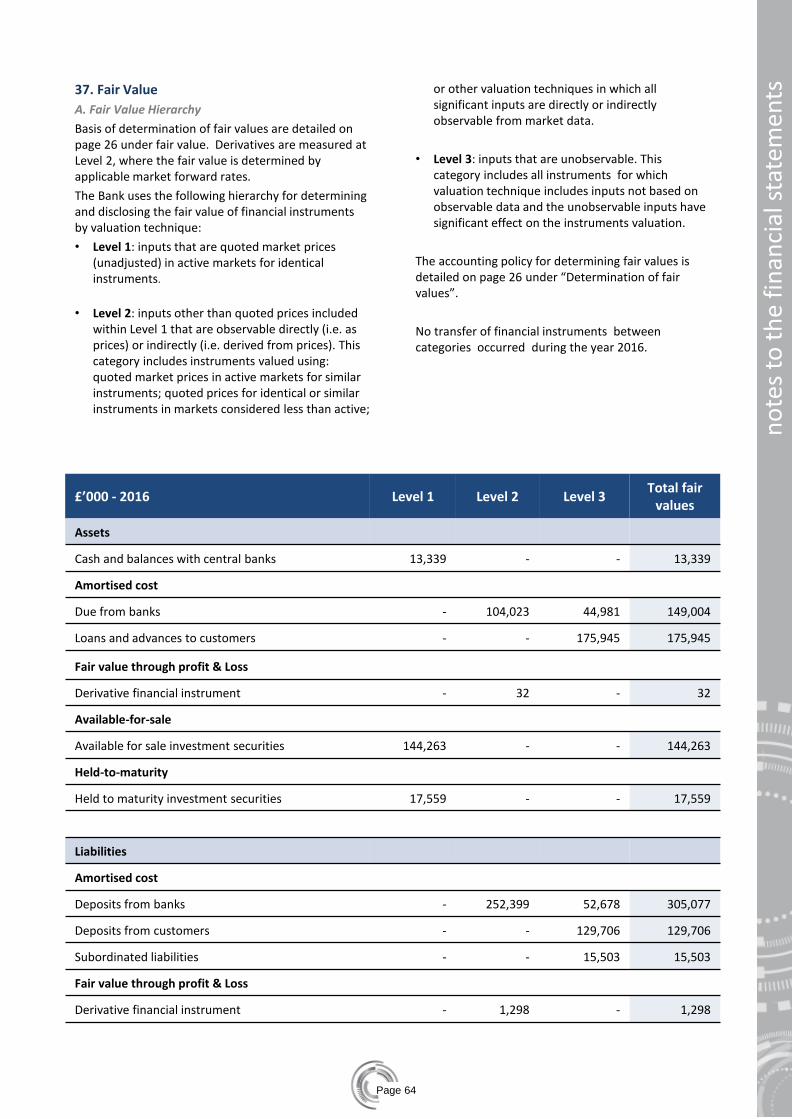
Page 64
no
tes
to t
he
fin
anci
al s
tate
men
ts
£’000 - 2016 Level 1 Level 2 Level 3 Total fair
values
Assets
Cash and balances with central banks 13,339 - - 13,339
Amortised cost
Due from banks - 104,023 44,981 149,004
Loans and advances to customers - - 175,945 175,945
Fair value through profit & Loss
Derivative financial instrument - 32 - 32
Available-for-sale
Available for sale investment securities 144,263 - - 144,263
Held-to-maturity
Held to maturity investment securities 17,559 - - 17,559
Liabilities
Amortised cost
Deposits from banks - 252,399 52,678 305,077
Deposits from customers - - 129,706 129,706
Subordinated liabilities - - 15,503 15,503
Fair value through profit & Loss
Derivative financial instrument - 1,298 - 1,298
37. Fair Value
A. Fair Value Hierarchy
Basis of determination of fair values are detailed on page 26 under fair value. Derivatives are measured at Level 2, where the fair value is determined by applicable market forward rates.
The Bank uses the following hierarchy for determining and disclosing the fair value of financial instruments by valuation technique:
• Level 1: inputs that are quoted market prices (unadjusted) in active markets for identical instruments.
• Level 2: inputs other than quoted prices included within Level 1 that are observable directly (i.e. as prices) or indirectly (i.e. derived from prices). This category includes instruments valued using: quoted market prices in active markets for similar instruments; quoted prices for identical or similar instruments in markets considered less than active;
or other valuation techniques in which all significant inputs are directly or indirectly observable from market data.
• Level 3: inputs that are unobservable. This category includes all instruments for which valuation technique includes inputs not based on observable data and the unobservable inputs have significant effect on the instruments valuation.
The accounting policy for determining fair values is detailed on page 26 under “Determination of fair values”.
No transfer of financial instruments between categories occurred during the year 2016.

Page 65
£’000 - 2015 Level 1 Level 2 Level 3 Total fair
values
Assets
Cash and balances with central banks 4,369 - - 4,369
Amortised cost
Loans and advances to banks - 111,308 25,392 136,700
Loans and advances to customers - - 167,713 167,713
Fair value through profit & Loss
Derivative financial instrument - 222 - 222
Available-for-sale
Available for sale investment securities 102,378 - - 102,378
Held to maturity investment securities 7,337 - - 7,337
Liabilities
Amortised cost
Deposits from banks - 169,836 94,941 264,777
Deposits from customers - - 98,537 98,537
Subordinated liabilities - - 13,316 13,316
Fair value through profit & Loss
Derivative financial instrument - 859 - 859
no
tes
to t
he
fin
anci
al s
tate
men
ts
37. Fair Value (continued)
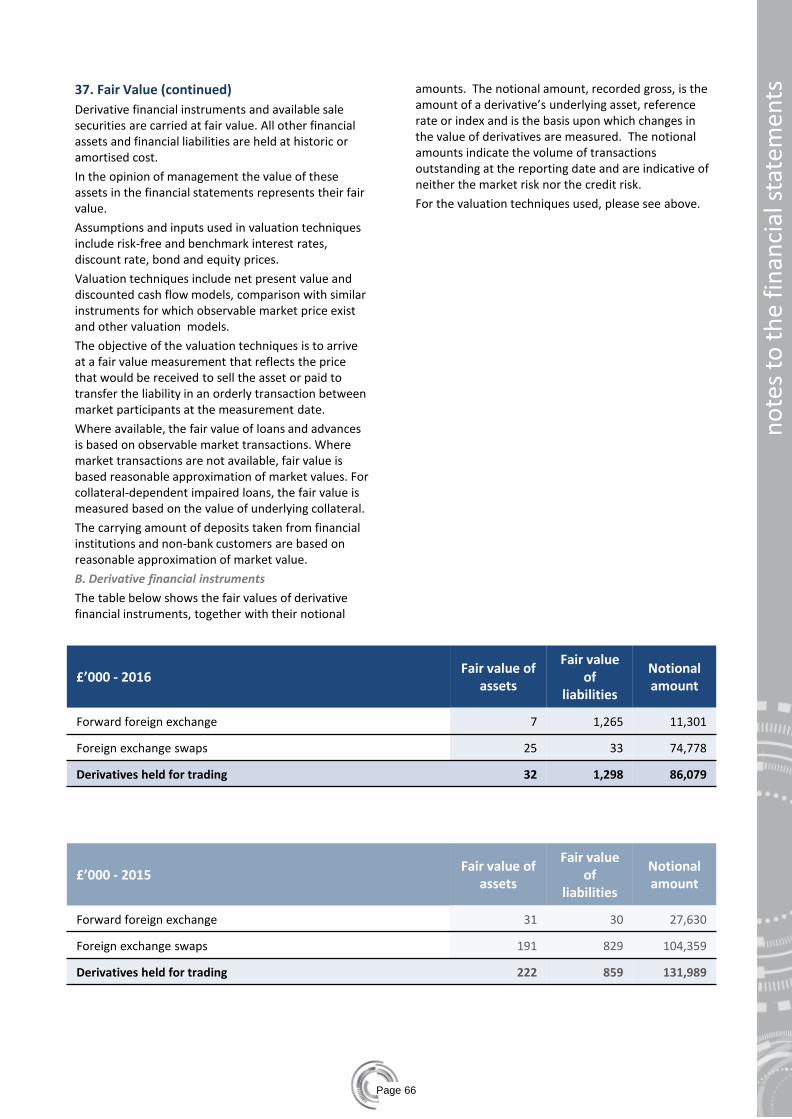
Page 66
no
tes
to t
he
fin
anci
al s
tate
men
ts
£’000 - 2016 Fair value of
assets
Fair value of
liabilities
Notional amount
Forward foreign exchange 7 1,265 11,301
Foreign exchange swaps 25 33 74,778
Derivatives held for trading 32 1,298 86,079
£’000 - 2015 Fair value of
assets
Fair value of
liabilities
Notional amount
Forward foreign exchange 31 30 27,630
Foreign exchange swaps 191 829 104,359
Derivatives held for trading 222 859 131,989
37. Fair Value (continued)
Derivative financial instruments and available sale securities are carried at fair value. All other financial assets and financial liabilities are held at historic or amortised cost.
In the opinion of management the value of these assets in the financial statements represents their fair value.
Assumptions and inputs used in valuation techniques include risk-free and benchmark interest rates, discount rate, bond and equity prices.
Valuation techniques include net present value and discounted cash flow models, comparison with similar instruments for which observable market price exist and other valuation models.
The objective of the valuation techniques is to arrive at a fair value measurement that reflects the price that would be received to sell the asset or paid to transfer the liability in an orderly transaction between market participants at the measurement date.
Where available, the fair value of loans and advances is based on observable market transactions. Where market transactions are not available, fair value is based reasonable approximation of market values. For collateral-dependent impaired loans, the fair value is measured based on the value of underlying collateral.
The carrying amount of deposits taken from financial institutions and non-bank customers are based on reasonable approximation of market value.
B. Derivative financial instruments
The table below shows the fair values of derivative financial instruments, together with their notional
amounts. The notional amount, recorded gross, is the amount of a derivative’s underlying asset, reference rate or index and is the basis upon which changes in the value of derivatives are measured. The notional amounts indicate the volume of transactions outstanding at the reporting date and are indicative of neither the market risk nor the credit risk.
For the valuation techniques used, please see above.
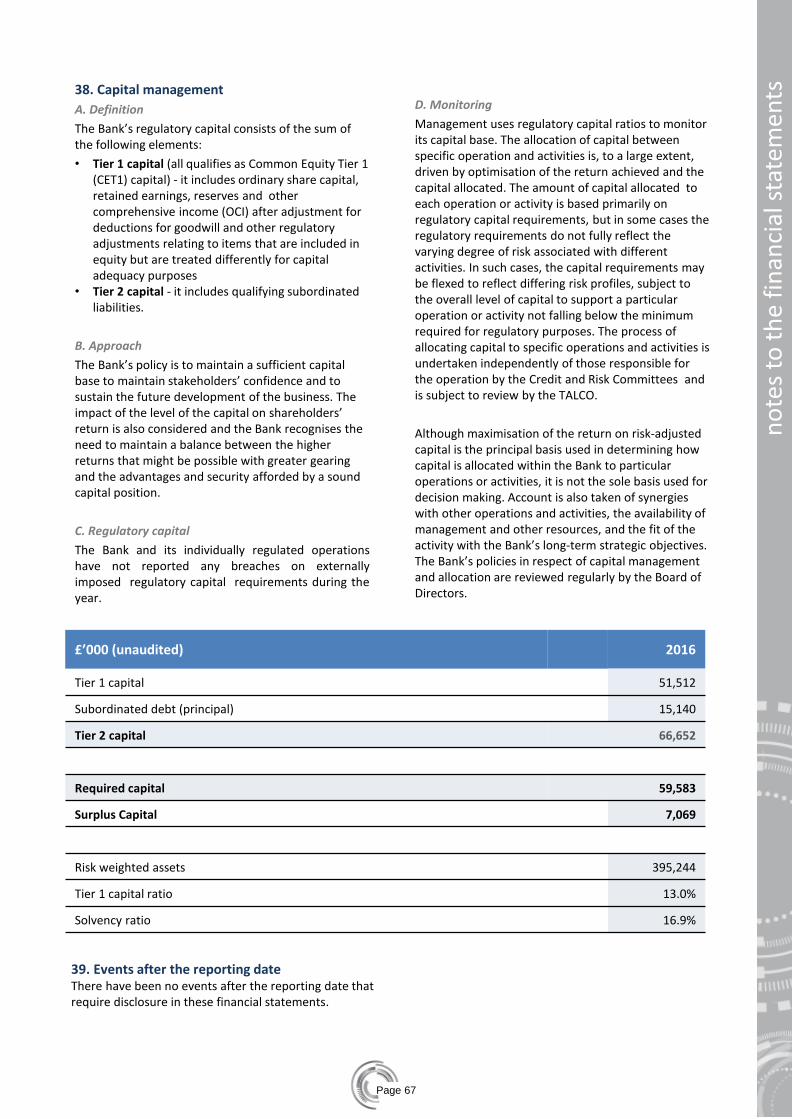
Page 67
no
tes
to t
he
fin
anci
al s
tate
men
ts
38. Capital management
A. Definition
The Bank’s regulatory capital consists of the sum of the following elements:
• Tier 1 capital (all qualifies as Common Equity Tier 1 (CET1) capital) - it includes ordinary share capital, retained earnings, reserves and other comprehensive income (OCI) after adjustment for deductions for goodwill and other regulatory adjustments relating to items that are included in equity but are treated differently for capital adequacy purposes
• Tier 2 capital - it includes qualifying subordinated liabilities.
B. Approach
The Bank’s policy is to maintain a sufficient capital base to maintain stakeholders’ confidence and to sustain the future development of the business. The impact of the level of the capital on shareholders’ return is also considered and the Bank recognises the need to maintain a balance between the higher returns that might be possible with greater gearing and the advantages and security afforded by a sound capital position.
C. Regulatory capital
The Bank and its individually regulated operations have not reported any breaches on externally imposed regulatory capital requirements during the year.
D. Monitoring
Management uses regulatory capital ratios to monitor its capital base. The allocation of capital between specific operation and activities is, to a large extent, driven by optimisation of the return achieved and the capital allocated. The amount of capital allocated to each operation or activity is based primarily on regulatory capital requirements, but in some cases the regulatory requirements do not fully reflect the varying degree of risk associated with different activities. In such cases, the capital requirements may be flexed to reflect differing risk profiles, subject to the overall level of capital to support a particular operation or activity not falling below the minimum required for regulatory purposes. The process of allocating capital to specific operations and activities is undertaken independently of those responsible for the operation by the Credit and Risk Committees and is subject to review by the TALCO.
Although maximisation of the return on risk-adjusted capital is the principal basis used in determining how capital is allocated within the Bank to particular operations or activities, it is not the sole basis used for decision making. Account is also taken of synergies with other operations and activities, the availability of management and other resources, and the fit of the activity with the Bank’s long-term strategic objectives. The Bank’s policies in respect of capital management and allocation are reviewed regularly by the Board of Directors.
39. Events after the reporting date There have been no events after the reporting date that require disclosure in these financial statements.
£’000 (unaudited) 2016
Tier 1 capital 51,512
Subordinated debt (principal) 15,140
Tier 2 capital 66,652
Required capital 59,583
Surplus Capital 7,069
Risk weighted assets 395,244
Tier 1 capital ratio 13.0%
Solvency ratio 16.9%

Page 68
BMCE Bank International plc
26 Upper Brook Street,
Mayfair - London W1K 7QE
United Kingdom ●
Tel. +44 (0) 207 429 5500
Fax. +44 (0) 207 248 8595
BMCE Bank International plc is registered in England and Wales under registration number 5321714
Authorised by the Prudential Regulation Authority and regulated by the Financial Conduct Authority and Prudential Regulation Authority
Contact us
Tel. +44 (0) 207 429 5500
Website BMCE Bank International plc
www.bmce-intl.co.uk
Website BMCE Bank of Africa
www.bmcebank.ma
Pillar 3 disclosures Further information regarding the Bank’s approach to risk management and its capital adequacy is contained in the unaudited Pillar 3 disclosures made under the
current regulatory capital requirements. These disclosures are published on the Bank’s website shortly after the approval of these financial statements at http://www.bmce-intl.co.uk/finance.