Embed Size (px)
Citation preview

ANNUAL REPORT AND FINANCIAL STATEMENTS 2019
Annual R
eport 2019

01Annual Report and Financial Statements 2019
OVERVIEW02 Highlights04 Introducing Science Group
STRATEGIC REPORT06 Chairman’s Statement12 Finance Director’s Report14 Key Performance Indicators14 Principal Opportunities and Risks16 Corporate Responsibility
REPORT OF THE DIRECTORS19 Report of the Directors22 Corporate Governance Report23 Board Committees24 Report of the Remuneration Committee26 Report of the Audit Committee28 Report of the Nomination Committee28 Directors’ Responsibilities28 Approval
29 Independent Auditor’s Report
FINANCIAL STATEMENTS37 Consolidated Income Statement38 Consolidated Statement of
Comprehensive Income39 Consolidated Statement of
Changes in Shareholders’ Equity41 Company Statement of
Changes in Shareholders’ Equity42 Consolidated and Company
Balance Sheet44 Consolidated and Company
Statement of Cash Flows46 Notes to the Financial Statements

02
OVERVIEW I HIGHLIGHTS
A S I AShenzhen, ChinaHong Kong
E U R O P EParis, FranceHildesheim, GermanyOviedo, Spain
U KCambridge (Headquarters)LondonEpsomKnaresborough
N O R T H A M E R I C ABoston, USAWashington DC, USASacramento, USA
We have a track record of delivering increased shareholder returns.Science Group is an international, science-led services and product development organisation, listed on the AIM market of the London Stock Exchange, with a freehold property asset base. We aim to deliver shareholder returns through the profitable development of our business based on financial and operational discipline, augmented by incremental and strategic acquisitions.

03
OPERATIONAL HIGHLIGHTS
AcquisitionThe acquisition of Frontier Smart Technologies was completed in October 2019 and brings additional scale and breadth to the Group. Frontier is the market leader in DAB/DAB+ radio chips and modules with engineering capabilities in the UK and manufacturing operations in China.
Product DevelopmentThe Product Development business provides science-led R&D services to medical and commercial (consumer, food & beverage and industrial) sectors. The Commercial business recorded a strong year of growth and the Medical business, despite a tough start to the year with a number of large projects completing in 2018, recovered in the second half of the year.
AdvisoryThe Advisory business provides science and technology-focused consulting services to blue-chip organisations in the consumer, industrial and food & beverage sectors. The business delivered a good performance in 2019 with strong growth in consumer and food & beverage market sectors which benefited from synergies with other parts of the Group.
RegulatoryComprising the TSG businesses in Europe and North America and the Leatherhead Food Research regulatory services, the Regulatory business specialises in providing science and regulatory advice to chemicals, agritech and food & beverage companies, with the latter sector delivering good growth in 2019.
OV
ER
VIE
WR
EP
OR
T O
F TH
E D
IRE
CT
OR
SS
TR
AT
EG
IC R
EP
OR
TFIN
AN
CIA
L STA
TE
ME
NT
S

04
1986
Formation of Sagentia(then Scientific Generics); Part of Cambridge Cluster
2010 2015
New Chairman invests and joins the board
Acquisition of Oakland Innovation
2013
Acquisition of OTM Consulting
2001
IPO and listing on the AIM market of the London Stock Exchange
OVERVIEW I INTRODUCING SCIENCE GROUP
Since 2010, Science Group has generated significant value for shareholders.
The Board of Directors has a diverse range of skills and experience which are used in the objective management of the Group in capital and resource allocation. The Group has an ambition to accelerate growth through acquisition and over the past 9 years, this strategy has been executed without shareholder dilution through the Group’s focus on cash generation from operations.

05
Defined by ScienceInspired by technologyDelivering innovation
Consulting Regulatory Applied Science & Product Development
2015 2019
Acquisition of Frontier Smart Technologies
2015
Acquisition of Leatherhead Food Research (founded 1919)
2015
Name change to Science Group plc
2017
Acquisition of TSG Consulting in Europe and USA
MEDICAL
AGRITECH
FOOD & BEVERAGE
CHEMICALS
CONSUMER INDUSTRIAL & ENERGY
OV
ER
VIE
WR
EP
OR
T O
F TH
E D
IRE
CT
OR
SS
TR
AT
EG
IC R
EP
OR
TFIN
AN
CIA
L STA
TE
ME
NT
S

06 Annual Report and Financial Statements 2019
Chairman’s Statement
Science Group plc (the ‘Company’) together with its subsidiaries (‘Science Group’ or the ‘Group’) is an international, science & technology services and product development organisation, supported by a strong balance sheet including significant freehold property assets. In 2019, the Group delivered a consistent operating performance from its organic business activities and completed a major acquisition followed by an accelerated restructuring and integration programme. As a result, the progress of Science Group has continued despite the background of macroeconomic and political uncertainty during 2019.
The strategy of enhancing the organic development of the Group through acquisitions has created a financially and operationally resilient organisation. The acquisition of Frontier Smart Technologies Group Limited (‘Frontier’) was again funded primarily from the Group’s existing cash resources, minimising shareholder dilution. This strategy has delivered a substantial increase in scale, profit and the asset base of the Group, with offices in the UK, Europe, North America and Asia, serving a range of vertical markets including medical, consumer, food & beverage and industrial sectors.
STRATEGIC REPORT
07Annual Report and Financial Statements 2019
Chairman’s Statement (continued)
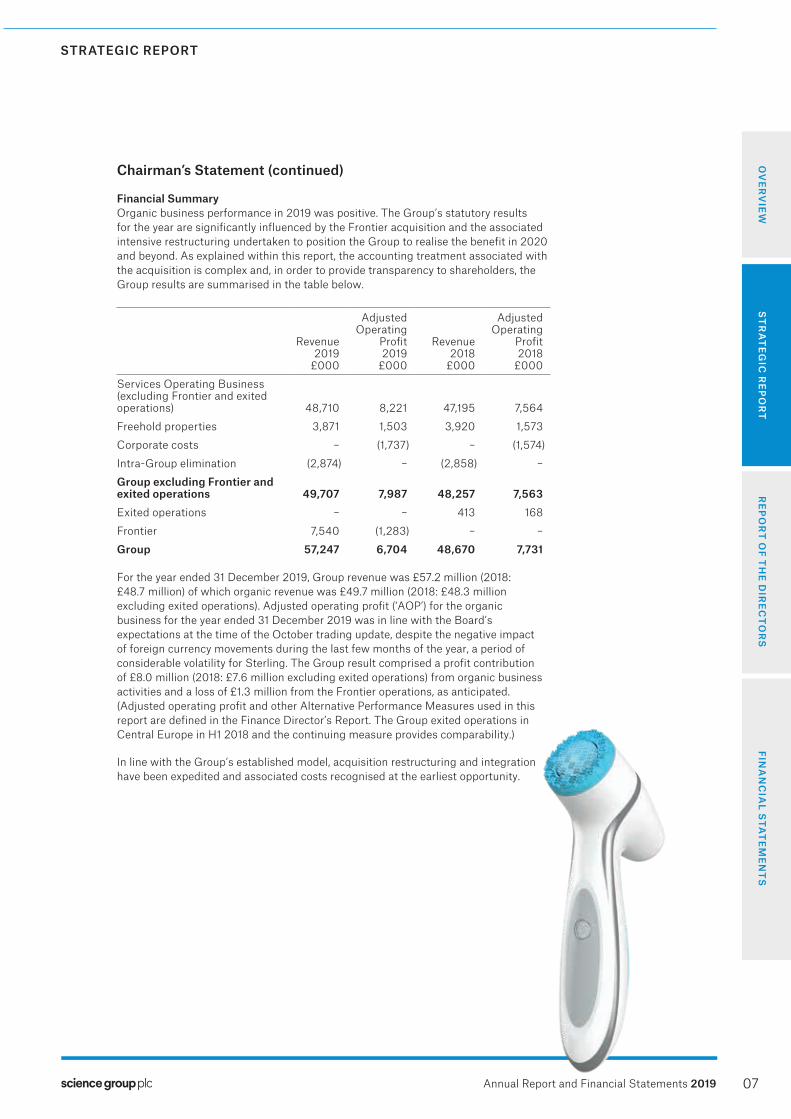
Financial SummaryOrganic business performance in 2019 was positive. The Group’s statutory results for the year are significantly influenced by the Frontier acquisition and the associated intensive restructuring undertaken to position the Group to realise the benefit in 2020 and beyond. As explained within this report, the accounting treatment associated with the acquisition is complex and, in order to provide transparency to shareholders, the Group results are summarised in the table below.
Revenue 2019
£000
Adjusted Operating
Profit 2019
£000
Revenue2018
£000
Adjusted Operating
Profit 2018
£000
Services Operating Business (excluding Frontier and exited operations) 48,710 8,221 47,195 7,564
Freehold properties 3,871 1,503 3,920 1,573
Corporate costs – (1,737) – (1,574)
Intra-Group elimination (2,874) – (2,858) –
Group excluding Frontier and exited operations 49,707 7,987 48,257 7,563Exited operations – – 413 168
Frontier 7,540 (1,283) – –
Group 57,247 6,704 48,670 7,731
For the year ended 31 December 2019, Group revenue was £57.2 million (2018: £48.7 million) of which organic revenue was £49.7 million (2018: £48.3 million excluding exited operations). Adjusted operating profit (‘AOP’) for the organic business for the year ended 31 December 2019 was in line with the Board’s expectations at the time of the October trading update, despite the negative impact of foreign currency movements during the last few months of the year, a period of considerable volatility for Sterling. The Group result comprised a profit contribution of £8.0 million (2018: £7.6 million excluding exited operations) from organic business activities and a loss of £1.3 million from the Frontier operations, as anticipated. (Adjusted operating profit and other Alternative Performance Measures used in this report are defined in the Finance Director’s Report. The Group exited operations in Central Europe in H1 2018 and the continuing measure provides comparability.)
In line with the Group’s established model, acquisition restructuring and integration have been expedited and associated costs recognised at the earliest opportunity.
OV
ER
VIE
WR
EP
OR
T O
F TH
E D
IRE
CT
OR
SS
TR
AT
EG
IC R
EP
OR
TFIN
AN
CIA
L STA
TE
ME
NT
S
STRATEGIC REPORT

08 Annual Report and Financial Statements 2019
Chairman’s Statement (continued)
Costs related to the Frontier acquisition including professional fees; share revaluation; property lease provisions; and the integration/restructuring process totalled £4.1 million. Amortisation of acquisition related intangibles and share based payment charge totalled £3.5 million (2018: £2.8 million) and as a result, in line with the Board’s expectations, the Group reported an operating loss of £0.2 million for the year (2018: profit of £5.3 million).
Balance SheetThe Group maintains a strong balance sheet, even after the Frontier acquisition, with significant cash resources, low debt and two substantial freehold properties hosting the Group’s main UK laboratories and offices (see below).
Reflecting the deployment of cash to acquire Frontier, at 31 December 2019, gross cash was £13.9 million (2018: £21.5 million) and net debt was £2.3 million (2018: net funds of £8.8 million). The Group’s bank debt at 31 December 2019 was £16.2 million (2018: £12.7 million). The Group’s bank debt is tied to interest rate swaps to produce a net fixed rate (effectively 3.6%) to 2026 and is secured on the Group’s freehold property assets. Subject to net debt not exceeding £10 million, the bank debt is not subject to operating covenants.
During the year, the Company sold some treasury shares in association with the Frontier acquisition. As a result, at 31 December 2019, shares in issue (excluding treasury shares held of 0.4 million) were 41.7 million (2018: 40.0 million). Apart from the treasury shares, the acquisition of Frontier was undertaken using the Group’s existing resources. This is consistent with the Board’s prior practice, which has delivered substantial growth in revenue and profit over the past 9 years without shareholder dilution. (Issued share capital, excluding treasury shares, at 31 December 2010 was 41.7 million, the same as at 31 December 2019.)
DividendIn recent years, the Group has progressively increased the dividend paid to shareholders ahead of the rate of inflation. Following the cash deployed in the Frontier acquisition, the Board has decided to recommend that this year the dividend is held at 4.6 pence per share. Subject to shareholder approval at the Annual General Meeting (‘AGM’), the dividend will be payable on 12 June 2020 to shareholders on the register at the close of business on 22 May 2020.
Services Operating Business OverviewFor the year ended 31 December 2019, revenue from the Group’s services operating business (which excludes Frontier and property income) increased to £48.7 million (2018: £47.2 million, excluding exited operations). Adjusted operating profit generated from the services operating business was £8.2 million (2018: £7.6 million), in line with the trading update in October, despite the foreign exchange impact within the fourth quarter related to Brexit uncertainty. This profitability measure includes property rental costs charged to the services operating business at market rates on an arms-length
basis. As a result, while there are operational and liability mitigation benefits from the Group’s freehold property, the financial performance of the services operating business is not enhanced by these assets.
Product DevelopmentThe Group provides product development consulting services to the medical, consumer, food & beverage and industrial markets helping clients develop innovative products and technologies. Science Group services are differentiated by their combination of deep scientific understanding, engineering excellence and sector domain knowledge.
Revenues for the Product Development business increased to £23.2 million (2018: £22.0 million). The Commercial (consumer, food & beverage and industrial sectors) business delivered very strong results compared to the prior year. The Medical business, characterised by large projects with a greater customer concentration, was impacted in H1 2019 as a result of some large projects completing at the end of 2018, but recovered well in the second half of the year. The largest Product Development client accounted for £3.1 million of revenue in 2019.
The acquisition of Frontier enhances the Product Development business’ Internet of Things (‘IoT’) proposition, particularly in the Commercial sectors. Prior to the Frontier acquisition, IoT has been a growth area as companies seek to evolve their business models in line with this digital market trend. However, one of the less understood but critical aspects of deploying IoT strategies is the requirement for ongoing support infrastructure to enable, for example, the updating of firmware; system control; data analysis; and maintenance monitoring. The Nuvola infrastructure, originally established to support Frontier’s smart radio (‘SmartRadio’) and smart audio models which now has an installed base of several million field-deployed units, brings a new capability to the Group’s strategy.
AdvisoryThe Group’s Advisory business provides clients with a combination of sector understanding and science/technology expertise. These consulting services help clients innovate, typically looking at market developments and opportunities in the 3-10 year horizon. The client base is mainly large, blue-chip organisations, but project-size is typically smaller than product development projects. The largest Advisory client accounted for £1.2 million of revenue in 2019.
The Advisory business had a good performance in 2019 with revenue increasing to £8.2 million (2018: £7.6 million). The Consumer and Food & Beverage sectors performed strongly, benefitting from the Group’s wider capabilities in Product Development and Regulatory services. The Industrial (including Energy) sector performed satisfactorily.
STRATEGIC REPORT

09Annual Report and Financial Statements 2019
Chairman’s Statement (continued)
RegulatoryThe Regulatory businesses provide science-based regulatory consulting services to clients in the food & beverage, agritech, consumer and chemicals market sectors. The Group delivers services to clients predominantly in Europe and North America, but provides international coverage across wider geographical territories, particularly in food & beverage where services cover over 100 countries, a key differentiating factor in this global market.
The revenues from the Group’s Regulatory businesses slightly declined to £16.8 million (2018: £17.3 million from continuing operations). Performance was strong in food & beverage, reflecting the Group’s market leadership position and scalable services model. In the US Regulatory business, the market was impacted significantly in the first part of the year by the federal government shutdown, recovering in the second half with growth in the federal and state renewals business which provides repeat revenue from the established client base. In Europe, the prior year benefited from a regulatory deadline relating to the REACH programme and the revenue in 2019 therefore declined slightly. The largest Regulatory client accounted for £0.5 million of revenue in the year.
Frontier AcquisitionScience Group completed the acquisition of Frontier in October. Due to the progressive increase of the Science Group shareholding between May and October, the accounting treatment of the 2019 results is complex. In brief, prior to 11 July 2019, the shareholding was deemed to be an investment. Thereafter, Frontier was treated as an associate until 23 August 2019, at which point Science Group obtained control and the results were consolidated (with the proportion relating to the other Frontier shareholders being separately attributed). On 11 October 2019, completion of the statutory merger resulted in Science Group obtaining 100% ownership of Frontier.
The accounting treatment is further complicated by the variation in price paid per share during the course of the acquisition. On 23 August, the Group’s weighted average cost per Frontier share for shares acquired prior to that date, through on-market purchases and the formal offer (‘Offer’), was 30.6 pence, at which time Science Group owned 19.4 million shares in Frontier. The price per share for the subsequent statutory merger was 25 pence and as a result a paper accounting loss of 5.6 pence per share was incurred on the Group’s holding, equivalent to £1.1 million, although the Board’s action produced a cash saving to Science Group of approximately £2.7 million compared to the original Offer price of 35 pence per Frontier share. This unusual circumstance, which was significantly beneficial to Science Group, was only possible due to Frontier not being subject to the UK Code on Takeovers and Mergers and the Frontier Board rejecting the original Science Group Offer.
At an adjusted operating level, the underlying loss reported by Frontier was £0.8 million. In addition, acquisition accounting treatment of work-in-progress and finished goods in
accordance with IFRS 3, Business Combinations, results in an adjustment of £0.5 million reported as an operating loss. Professional fees; share revaluation; property lease provisions; and the costs arising from integration/restructuring activities totalled £4.1 million.
In terms of the balance sheet on 23 August, when consolidation commenced, goodwill of £2.8 million ($3.5 million) and acquisition related intangible assets of £8.8 million ($10.7 million) were recognised. Subsequently, due to the fluctuation in exchange rates and amortisation of acquisition related intangible assets, at 31 December 2019 these balances were £2.6 million and £7.6 million respectively. Frontier also has significant unrecognised tax losses, in the order of £24 million.
Frontier Integration and StrategySince completion in October, a very intensive restructuring and integration programme has been executed by the new Frontier management team. Excellent progress has been made including:
• The Romanian operations have been closed and the legal entity is anticipated to be terminated in 2020;
• The Frontier London office has been closed and staff relocated to the Science Group London office;
• The Cambridge (Sawston) office has been closed and staff relocated to Science Group’s freehold facility in Harston, Cambridge, with onerous lease costs being recognised in 2019;
• In Hong Kong the office space has been reduced by approximately half with the associated onerous costs being recognised in 2019;
• A substantial reduction in the cost base has resulted in headcount reducing from 110 in October 2019 to 67 in February 2020; and
• A reduction in the number of module variants, including end-of-life programmes for unprofitable product lines.
The market for Frontier products is relatively stable with upticks in demand associated with country transitions to digital broadcasting. Frontier holds a majority share in its core digital radio (DAB/DAB+) market and demand for Frontier products is therefore fundamentally linked to the scale and dynamics of the market. Frontier has historically been over-optimistic in its forecasting and failed to manage distribution/retail channel inventory, a particular issue in late 2018 which resulted in incentives to customers towards the end of the year having a material impact on demand in 2019. This not only resulted in forecast downgrades in Frontier but such short-term incentives to customers exacerbate price/margin pressure and revenue volatility. The Frontier strategy in future will be to allow revenue to move in line with market developments to produce a more sustainable, and profitable, operating model.
OV
ER
VIE
WR
EP
OR
T O
F TH
E D
IRE
CT
OR
SS
TR
AT
EG
IC R
EP
OR
TFIN
AN
CIA
L STA
TE
ME
NT
S
STRATEGIC REPORT

10 Annual Report and Financial Statements 2019
Chairman’s Statement (continued)
The substantial reduction in the cost base resulting from the accelerated integration/restructuring programme, should enable Frontier performance to recover in 2020. However, the impact of the coronavirus (COVID-19) outbreak is uncertain, a global challenge particularly affecting production facilities in China where Frontier and Frontier customers manufacture their products. The Frontier manufacturing facility was temporarily closed but has now been partially reopened following approval from the local authority. The situation remains under close review.
Frontier revenue and material costs are transacted in US dollars, as is common practice in consumer electronics manufactured in China since most materials are priced in that currency. As a consequence, the Frontier business is exposed to exchange rate fluctuations between Sterling and US dollars.
Frontier Product StrategyThe Frontier business comprises:
DAB Radio: Frontier is the market leader in design and manufacture of chips and modules which are used in DAB radios. The skills involved in designing, developing and manufacturing these products include embedded software engineering, RF and digital hardware development and high-volume/low cost manufacturing. This product category contributes the majority of Frontier revenue.
The market of approximately 5 million chips/modules is concentrated in geographies such as Germany and the UK which have been major adopters of the DAB digital broadcast technology. The underlying, broadly flat market volume is enhanced when major geographies accelerate their national digital strategies or implement digital switchover.
SmartRadio: Frontier also designs and manufactures modules which contain internet radio technology in addition to DAB chips. The resulting products feature in an emerging category increasingly referred to as ‘SmartRadio’. These products enable consumers to listen to broadcast radio through DAB and/or a wide range of global internet radio stations in addition to music streaming services such as Spotify. The category aims to combine the simplicity of radio together with the scope of the internet, without the privacy concerns sometimes associated with the smart speaker category.
In terms of market volume, SmartRadio currently accounts for around 15% of Frontier shipments. Frontier SmartRadios are connected to the Group’s cloud platform (‘Nuvola’) which enables certain internet functionality and delivers firmware updates when required.
Smart Audio: In recent years, Frontier invested heavily in developing modules that enable voice-activated smart speakers and other audio devices. This product-line absorbed very substantial funds resulting in the lack of profitability of Frontier. While the product category contributes some valuable technology and capability in voice activation of the major ecosystems and remains part of the product portfolio, as a
stand-alone product category the importance has now been de-emphasised. A provision against excess inventory was taken in 2019.
IoT: As part of Frontier’s smart radio and smart audio strategy, Frontier developed the cloud architecture, Nuvola, which enables certain functionality and firmware updates of internet-connected products in the field. This architecture has been technically well-conceived and currently supports an installed base of several million devices, of which around 1.5 million were actively connecting to Nuvola in January 2020. This architecture will continue to support Frontier products and, as explained above, will potentially provide an enabler for the Group’s wider Product Development and IoT strategies.
Freehold PropertiesThe last formal valuation of the Group’s freehold properties, Harston Mill, near Cambridge, and Great Burgh, near Epsom, was undertaken in March 2018. This report indicated that the aggregate ‘vacant possession’ valuation was estimated at £22.6 million and, based on market rents and property yields at that time, the aggregate sale & leaseback valuation was estimated at £33.9 million. The properties are held on the balance sheet at an aggregate value of £21.4 million (2018: £21.6 million) on the historical cost-based valuation model.
Following the 2018 strategic review, the freehold properties are managed outside of the operating business activities and the operations are charged rent and service charges on an arms-length basis. For the year ended 31 December 2019, the property business generated a total revenue of £3.9 million. This comprised £1.0 million (2018: £1.1 million) from third party tenants and £2.9 million (2018: £2.9 million) from intra-Group rental charges. On a stand-alone basis, the Group’s freehold property delivered a £1.5 million (2018: £1.6 million) adjusted operating profit, although at Group level, the intra-Group trading is eliminated on consolidation.
The vacant space in the mill building on the Harston Mill site has been used to accommodate Frontier. During the year, one larger tenant went into insolvency and currently there is 6,000 square feet of lettable space at Harston Mill. Additional tenant turnover is anticipated in the year ahead and marketing of potential free space has been initiated.
The Board previously concluded that the Harston Mill property should be moved out of Sagentia into a separate company and this was due to be actioned early in 2020, with a corresponding tax cash outflow of approximately £2 million. The preparatory work has been completed. However, following the Frontier acquisition and the deployment of cash resources into expanding the Group’s business operations, the Board has decided to defer the Harston Mill transfer and to review later in the year. There are no material operating consequences of this deferral.
External FactorsThere are several external factors which may influence the Group in the year ahead.
STRATEGIC REPORT

11Annual Report and Financial Statements 2019
Chairman’s Statement (continued)
Brexit is the highest profile political change but it remains unclear what the net effect on the Group’s services operations will be, since some capabilities may be in greater demand while R&D tax credit arrangements in EU countries may in some cases make UK consultancy services less attractive. With regard to the Frontier product business, supply is provided directly from China/Hong Kong and it is not anticipated that Brexit will have any material effect on this division. In addition to Brexit, the US Presidential election could influence Science Group’s services operations later in the year since a high proportion of this revenue is derived from North America. The Board monitors developments and awaits greater certainty before reviewing the Group’s strategy, if appropriate.
The Covid-19 virus has to date only had a minor effect and this has been in relation to the Frontier manufacturing in China. However, while the timing of the outbreak around the Lunar New Year was unfortunate, this time of year was planned to be a quieter business period due to the holiday. As a result, to date there has been only limited financial impact and the Frontier manufacturing operations have now partially reopened in accordance with local procedures. In summary, at present it is considered that any material effect on Science Group is likely to derive from the indirect consequences on the global economy (R&D investment, business travel, etc). The Board are closely monitoring the situation.
However, in regard to factors beyond the Board’s control, the greatest financial impact is likely to derive from movements in currency exchange rates with the Group benefitting from a strong US dollar and weaker Sterling. Currency rates may be directly or indirectly related to the above and/or other external factors.
CorporateThe major corporate activity during 2019 was the Frontier acquisition. Not only was this the largest acquisition in the Group’s history, but it was also a complex bid for an AIM-listed, Cayman-domiciled entity, which was actively resisted by the Frontier Board. The transaction included market purchases; a formal offer; an equity investment; and finally a cross-border statutory merger, subject to English and Cayman law. The UK Code on Takeovers and Mergers did not apply.
With Frontier having operations in Cambridge, London, Romania, Hong Kong and China, the integration has been intense particularly since the operational restructuring has been effectively completed in just a few months. Finalising the corporate administrative procedures and implementing the new strategy is ongoing.
Corporate costs for the Group for the year increased to £1.7 million (2018: £1.6 million).
SummaryThe financial performance of the Group’s organic operations in 2019 was in line with expectations. The Board anticipate continued progress in the year ahead and the new year has started satisfactorily.
Despite only completing the acquisition in October, the restructuring and integration of Frontier has made very good progress, resulting in a substantial reduction in the cost base and a clear future strategy for this business. While the impact of Covid-19 cannot be fully evaluated, the Board is confident that the operational, financial and commercial transformation that has been undertaken in the last few months will render the business more resilient to external factors.
The Group retains a strong balance sheet with significant cash resources; low net debt (without any operating covenants at the current level); and substantial freehold property assets. This foundation, together with the Group’s portfolio of complementary business operations, diversified across geography and industry sectors, provides stability and opportunity in an unpredictable world.
Martyn RatcliffeChairman
OV
ER
VIE
WR
EP
OR
T O
F TH
E D
IRE
CT
OR
SS
TR
AT
EG
IC R
EP
OR
TFIN
AN
CIA
L STA
TE
ME
NT
S
STRATEGIC REPORT
Annual Report and Financial Statements 201912
STRATEGIC REPORT
Finance Director’s Report
Overview of resultsIn the year ended 31 December 2019, the Group generated revenue of £57.2 million (2018: £48.7 million) benefitting from the inclusion of 4 months trading of Frontier following the acquisition during 2019. Revenue from the services and product operating businesses, that is revenue derived from consultancy services, materials recharged on these projects and product revenue, increased to £56.2 million (2018: £47.6 million). Revenue generated by freehold properties, comprising property and associated services income derived from space let to third parties in the Harston Mill facility, was £1.0 million (2018: £1.1 million).
Adjusted operating profit for the Group of £6.7 million (2018: £7.7 million) includes an adjusted operating loss of £1.3 million for Frontier within which an acquisition accounting loss of £0.5 million arose due to the revaluation of acquired inventory. The Group statutory operating loss of £0.2 million (2018: profit of £5.3 million) includes the costs resulting from the restructuring of Frontier and the one-off costs and accounting adjustments arising from the acquisition as set out in the Chairman’s Statement. The statutory loss before tax was £1.6 million (2018: profit before tax of £4.9 million) and statutory loss after tax was £1.8 million (2018: profit after tax of £4.3 million).
(Adjusted operating profit is an alternative profit measure that is calculated as operating profit excluding amortisation of acquisition related intangible assets, impairment of investments, acquisition integration costs, share based payment charges and other specified items that meet the criteria to be adjusted. Refer to the notes to the financial statements for further information on this and other alternative performance measures.)
FrontierThe Frontier transaction started in early May 2019 when the initial on-market purchases of shares were made. On 11 July 2019, the Group ownership reached 35.6% and the Group commenced equity accounting for the investment. The Group continued to acquire shares on the market and made an offer for Frontier at 35 pence per share resulting in ownership of 47.5% on 19 July 2019. On 23 August 2019, through an issue of 4 million shares by Frontier, Science Group increased its ownership to 52.2% gaining control of Frontier and the consolidation of results commenced. Additional shares were acquired on the market taking the ownership to 72.3% on 6 September 2019 with the remaining Frontier shares being acquired on 11 October 2019 by way of a statutory merger. The statutory merger was effected by SG Bidco Limited (a 100% owned subsidiary of Science Group plc) merging with Frontier Smart Technologies Group Limited, the parent company of the Frontier Group, through which Science Group obtained full ownership of the Frontier business. Refer to Note 16 for further information on the acquisition process and accounting of Frontier.
Included within the Frontier adjusted operating loss for the post acquisition period is a fair value adjustment related to the acquisition accounting of inventory that increased the Frontier loss by £0.5 million. All assets and liabilities are recorded at fair
value at the date of acquisition and the valuation of inventory is adjusted to take into account the work done up until this date. Therefore, work in progress and manufactured finished goods held are not valued at cost and instead the fair value is measured by taking into account the stage of development in the production cycle of the item, with the fair value being the estimated selling price less certain costs and a margin thereon. This methodology, as required under IFRS 3, Business Combinations, has resulted in an accounting adjustment to the value of acquired inventory of £0.7 million and has reduced the adjusted operating profit in 2019 by £0.5 million with the balance reducing adjusted operating profit in 2020.
Adjusting itemsThe acquisition and restructuring activities have resulted in significant one-off costs including: professional fees and integration costs of £2.5 million; a provision for onerous costs relating to property leases (including an impairment of the leased right of use asset) of £1.1 million; and a loss on remeasurement of the equity investment in Frontier of £0.5 million. The capitalised acquisition related intangible assets in respect of Frontier has resulted in the associated amortisation increasing to £2.3 million (2018: £2.0 million) and the share based payment charge has increased to £1.2 million (2018: £0.8 million) due to the full year effect of the share options granted under the Enhanced Executive Incentive scheme and the increase in PSP share options granted resulting from the growth of the Group.
Foreign exchangeA significant proportion of the Group’s revenue is denominated in US Dollars and Euros and changes in exchange rates can have a significant influence on the Group’s financial performance. In 2019, £28.7 million of the Group operating business revenue was denominated in US Dollars (2018: £16.6 million), including all of Frontier revenue, and £3.6 million of the Group operating business revenue was denominated in Euros (2018: £5.7 million). The Group continues to monitor the volatility of exchange rates and to date has decided not to utilise foreign exchange hedging instruments.
IFRS 16 LeasesThe Group adopted IFRS 16 Leases from 1 January 2019 using the modified retrospective approach, under which the cumulative effect of initial application is recognised in retained earnings at 1 January 2019. This applies to property leases held by the Group companies. The effect was to recognise a Right of Use asset and a Lease liability of £2.8 million at 1 January 2019. As a result, in the Consolidated Income Statement for the year ended 31 December 2019, adjusted operating profit increased by a net of £12,000 and interest cost increased by £95,000.
TaxationThe tax charge for the year was £0.2 million (2018: £0.6 million). The underlying tax charge on the profits generated by the organic operating business has been partially offset against the tax income arising on losses generated by
13
OV
ER
VIE
WR
EP
OR
T O
F TH
E D
IRE
CT
OR
SS
TR
AT
EG
IC R
EP
OR
TFIN
AN
CIA
L STA
TE
ME
NT
S
Annual Report and Financial Statements 2019
STRATEGIC REPORT
Finance Director’s Report (continued)
Frontier from when it was 100% owned in the Group and a Research and Development tax credit of £0.4 million (2018: £0.4 million). A significant proportion of the one-off costs resulting from the acquisition and restructuring activities are not anticipated to be tax deductible.
At 31 December 2019, Science Group had £34.7 million (2018: £10.8 million) of tax losses of which £0.2 million (2018: £0.4 million) relate to trading losses which have been recognised as a deferred tax asset and are anticipated to be used to offset future trading profits. Tax losses of £24.0 million (2018: £nil) relate to the acquired Frontier companies of which £22.4 million (2018: £nil) are held by the trading company of Frontier (Frontier Smart Technologies Limited) and would be able to be offset against future profits generated by this company but due to the uncertainty in the timing of utilisation of these losses, they have not been recognised as a deferred tax asset. The remaining tax losses of £10.5 million (2018: £10.4 million) have not been recognised as a deferred tax asset due to the low probability that these losses will be able to be utilised in operating activities.
Statutory basic earnings per share (‘EPS’) was a loss of 4.5 pence (2018: profit of 10.7 pence) due to the Frontier one-off costs relating to the acquisition and integration.
Cash flowCash flow from operating activities excluding Client Registration Funds (‘CRF’) was £5.4 million (2018: £5.0 million). Reported cash from operating activities in accordance with IFRS was £5.4 million (2018: £5.6 million). The difference in these two metrics relates to the fact that TSG, particularly in the USA, processes regulatory registration payments on behalf of clients. The alternative performance measures, adjusting for CRF, more accurately reflect the Group’s cash position and cash flow.
The cash outflow in acquiring the shares of Frontier was £12.8 million which represented an average price per share of 27.3 pence. Frontier held cash at the end of August 2019 of £2.8 million and had a revolving credit facility with Clydesdale of £5.0 million which was repaid by Science Group following the statutory merger. During the post-acquisition period, the working capital of Frontier was normalised by paying overdue balances owed to suppliers to address the extended payment terms necessitated by Frontier’s financial position. Partially offsetting this was the reduction in trade receivables and inventory arising from Frontier’s seasonality which experiences peak shipments in the summer months.
Financing and cashThe Group’s term loan with Lloyds Bank plc (‘Lloyds’), secured on the Group’s freehold properties, is a 10 year fixed term loan expiring in 2026. It was increased during the year to £17.5 million on similar terms to those previously in place. Phased interest rate swaps hedge the loan resulting in a 10 year fixed effective interest rate of 3.6%, comprising a margin over 3 month LIBOR, the cost of the loan arrangement fee and the cost of the swap instruments. The term loan has no operating covenants as long as the Group net bank debt is less than £10 million. If this threshold is crossed, two conditions
apply: (i) a financial covenant, measured half-yearly on a 12 month rolling basis, such that annual EBITDA must exceed 1.25 times annual debt servicing (capital and interest) and (ii) a security covenant whereby the loan to value (‘LTV’) ratio of the securitised properties must remain below 75%. If either of these conditions are breached, a remedy period of 6 months is provided, during which time the EBITDA or LTV condition can be remedied or the net bank debt can be reduced to less than £10 million. The Group has adopted hedge accounting for the interest rate swap related to the bank loan under IFRS 9, Financial Instruments, and the loss on change in fair value of the interest rate swaps was £408,000 (2018: gain of £66,000) which was recognised directly within equity.
The Group cash position (excluding CRF) at 31 December 2019 was £13.9 million (2018: £21.5 million) and net debt was £2.3 million (2018: net funds of £8.8 million) following the cash outflows for the consideration of Frontier, restructuring costs and the realignment of the Frontier working capital position. CRF of £1.5 million (2018: £1.5 million) were held at the year end. Working capital management during the year continued to be a focus with debtor days of 32 days at 31 December 2019 (2018: 37 days) while combined debtor and WIP days was similar to prior year at negative 7 days (2018: negative 9 days). (WIP is defined as the net of accrued income and payments received on account). Following the acquisition of Frontier, the Group holds inventory which, at 31 December 2019, was £2.1 million (2018: £nil).
Share capitalAt 31 December 2019, the Company had 41,700,440 ordinary shares in issue (2018: 40,040,227) excluding 361,595 shares in treasury (2018: 2,021,808). Of the ordinary shares in issue, 104,400 (2018: nil) shares are held by the EBT and hence the voting rights in the Company are 41,596,040. In this report, all references to measures relative to the number of shares in issue exclude shares held in treasury unless explicitly stated to the contrary.
Employee Benefit TrustPrior to acquisition, Frontier Smart Technologies Employee Benefit Trust (‘EBT’) held 2.0 million Frontier shares. On completion of the statutory merger, the EBT received £0.5 million in settlement of the shares of which £0.3 million was paid to SG Bidco Limited to settle an outstanding loan. 104,400 shares in Science Group plc were acquired by the EBT (by issuing shares held in treasury) which will be used to satisfy employee share options issued to the Joint Managing Directors of the Frontier business. The voting rights and right to dividends in respect of the ordinary shares held by the EBT are waived.
Rebecca ArcherFinance Director
Annual Report and Financial Statements 201914
STRATEGIC REPORT
Key Performance Indicators
The key performance indicators (‘KPIs’) are operating profit, cash flow and the alternative performance measures as disclosed in Note 1 in the Notes to the Financial Statements. Profitability of the business is managed primarily via the review of revenue and headcount. (Secondary measures of consultant utilisation and daily fee rates are used internally but are not disclosed due to their commercial sensitivity.) Working capital is reviewed via measures of trade receivables, trade payables, WIP and inventory. Performance against KPIs is reported in the Financial Report.
Principal Opportunities and Risks
The Directors consider that the principal opportunities and risks facing the Group are as set out below. The Board has carried out a robust assessment of the emerging and principal risks, including those that would threaten the sustainability of its business model, its future performance, solvency or liquidity. In addition the Board regularly reviews existing and emerging risks across the Group on a monthly basis. The Board considers this period to be appropriate for the business as it allows the Board to remain informed of developments that may affect the delivery of its strategy and to identify and implement any mitigating actions. It also supports the Board’s review and revision of forecasting, undertaken on a quarterly basis, to minimise the impact of any emerging risks on the Group. The Board has a reasonable expectation that the Group will be able to continue in operation and meet its liabilities as they fall due over this period. A summary of the key measures taken to mitigate those risks are also set out below.
Technology advancesThe on-going development of new and existing technologies provides opportunities for Science Group to provide market-leading services to its clients. The Group’s personnel must stay at the forefront of technical advances and understanding of technical specialisms in order to exploit these opportunities and sustain the Group’s growth.
The Group seeks to do this by the regular identification and review by management of new technical areas for investment; providing a budget for investment by managers in new ideas; encouraging employees to keep up to date on technological developments by both formal and informal training and self-learning in relevant areas of technical expertise; and recruiting employees with new technical skills where gaps in expertise are identified.
Market for outsourced servicesScience Group is dependent on the global market for outsourced science-based services. This provides both opportunities and risks, depending on the performance of and confidence in the Group’s target geographies and markets. An economic downturn or instability may cause clients to delay or cancel projects and/or related services, or to use internal resources to achieve their business goals. Conversely, a reduction in internal resources by clients may result in greater levels of outsourcing for business critical projects.
The Group seeks to capitalise on these opportunities and mitigate these risks by diversifying exposure across
geographical markets; increasing the number of market sectors in which the Group operates; diversifying the type of customers with whom the Group operates (ranging from well-funded start-up companies to large multi-national corporates); increasing the range of service offerings that the Group provides; and marketing activities to inform current and prospective clients regarding the benefits of outsourced research and development services and Science Group’s proven ability to fulfil those objectives.
Market for radio productsThe Frontier part of Science Group has a high market share of the DAB radio market and is therefore subject to the market demand and the competitive environment. These factors are correspondingly affected by the economic climate and alternative methods of receiving radio stations.
Frontier supplies branded products through intermediate factories which are mainly based in China and Frontier’s reputation may be damaged if quality were to decline. These factories may also be impacted by local and global developments, which in 2020 have included the Covid-19 outbreak. Import tariff changes may also impact the cost of radio production and thereby the selling price to the end consumer, which may affect demand and/or the margins of the business. Furthermore, the business undertakes trade with its main customers in US Dollars and volatility in foreign exchange rates may result in significant changes to the cost of the products and the margins made by Frontier.
The Group seeks to mitigate these risks by actively monitoring market developments and adjusting material purchases accordingly. The Group also has employees based in Shenzhen and Hong Kong to manage relationships with customers and manufacturing locations.
Dependence on key personnelScience Group’s business relies on recruiting and retaining highly qualified technical experts on whom the business depends to deliver its science-based services. Failure to recruit and retain key staff could threaten the business’ ability to deliver projects to its clients or to win new work.
The Group’s expansion also places greater demands on the Group’s management and infrastructure, across a wider range of geographical locations and markets. Failure to recruit and retain key management and functional staff could increase the risks associated with operational and financial controls; sales and marketing; information technology and other functional support areas.
The risks associated with recruitment and retention of key personnel can be compounded by upward pressure on salaries and remuneration packages due to skill shortages or economic inflation.
The Group seeks to mitigate this risk by encouraging staff retention through both competitive remuneration packages and a stimulating work environment. In addition to base salary, remuneration can include profit share/annual bonus, pension, health benefits, life assurance and share option schemes. The

15
OV
ER
VIE
WR
EP
OR
T O
F TH
E D
IRE
CT
OR
SS
TR
AT
EG
IC R
EP
OR
TFIN
AN
CIA
L STA
TE
ME
NT
S
Annual Report and Financial Statements 2019
STRATEGIC REPORT
remuneration components are reviewed regularly. Efforts are made to foster a vibrant, dynamic and supportive environment for employees, which offers a diversity of technically challenging work for large and small companies across a range of industries and specialist market, science & technology areas. The Group also provides career development paths and training support.
Reputational riskFailure to deliver project deliverables to an agreed budget, timetable and quality may result in reputational damage to Science Group that may adversely affect future sales.
The Group seeks to mitigate this risk by having in place effective Quality Assurance procedures; review meetings being held with clients on a regular basis; formal questionnaires being sent to clients at the close of projects to ascertain their views and to suggest improvements and actions that the Group may take; and various accreditations held by certain parts of the Group including ISO 9001 and ISO 13485.
BrexitThe uncertainties and potential effects of Brexit during and following the transition period provide both risks and opportunities for Science Group.
There is uncertainty regarding the short, medium and long-term impact Brexit will have on markets, financial circumstances of customers and/or the future trading relationships between the UK and other countries both in Europe and in other parts of the world. The Group seeks to mitigate this risk by actively managing customer relationships including credit limits which, if appropriate, may require the payment in advance of all or part of the estimated costs which could have an impact on revenue.
The Group has a continental Europe presence which may be able to be further leveraged to provide services from within the EU. Furthermore, uncertainty around the legislative and regulatory landscape following Brexit provides opportunities for growth of the Group’s regulatory services.
Economic conditions or other factors affecting the financial circumstances of customersThe profitability of the Group could be adversely affected by the general economic conditions in the United Kingdom, Continental Europe, United States, Asia and/or other key markets by virtue of the impact of a deterioration in the economic climate and/or financial failure of customers or potential customers of the Group. It may also involve customers defaulting on the payment of invoices issued by the Group or delaying payment of invoices which may have a significant impact on the income and the business of the Group.
The Group seeks to mitigate this risk by actively managing customer relationships including credit limits which, if appropriate, may require payment in advance; regular reviews of debtors and overdue payments; and proactive credit control procedures.
Project over-run or failure to meet technical milestonesProjects may over-run and/or may fail to meet technical milestones because the nature of the work which Science Group undertakes is technically challenging. Project over-runs can lead to loss of margin on projects and overall profitability for the consultancy business. Poor performance may also result in damage to Science Group’s reputation.
The Group seeks to mitigate this risk by contracting the majority of projects on a time and materials basis; operating a formal bid review process; incorporating risk premiums into agreements if appropriate; conducting regular project reviews to assess whether the revenue recognised on work in progress is a fair representation of actual costs incurred and estimated costs to completion; conducting regular, formal project board review meetings for large projects; and meetings with clients to review progress on projects.
Currency exchange ratesA significant proportion of the Group’s revenues are invoiced in currencies other than Pounds Sterling, including but not limited to the US Dollar and Euro, whilst the majority of the Group’s employee-based costs are incurred in Pounds Sterling. Materials related to Frontier products are typically priced in US Dollars. As a result, variations in currency exchange rates may have a material impact, both positive and negative, on Group revenue and profit performance.
The Group seeks to mitigate this risk by transferring all foreign currency holdings into Pounds Sterling on a regular basis. The Group regularly considers the merits of currency hedging but to date has determined that it would not be appropriate.
Investment in acquisitionsThe Group has grown through the acquisition of companies with compatible service and technology offerings. The Board considers further acquisitions to be a core part of the Group’s strategy and the Group is continually monitoring opportunities for strategic acquisition opportunities. Acquisitions provide potential for growth and diversification, whilst increased scale provides efficiencies of back office and central services across the Group.
However, acquisitions can increase the risk profile of the Group; unknown liabilities may be identified post-acquisition; the revenue of the acquired business may decline; key staff may leave; and other unforeseeable problems may arise. The Group seeks to mitigate such risks by establishing an integration team at the time of the acquisition who are rapidly deployed to instil the Group’s financial and operational controls into the acquired company as fast as practicable. While this team comprises experienced managers from within the Group, in every acquisition, unforeseen challenges arise and an evolving iterative integration process is required.
Additional considerationsIn addition to the principal risks and uncertainties above, the Group faces other risks that include but are not limited to:
• increased competition;
• failure to retain, or loss of, customer contracts;
Principal Opportunities and Risks (continued)

Annual Report and Financial Statements 201916
STRATEGIC REPORT
• customer concentration;
• technology leadership;
• product or other professional liability claims or other warranty and indemnity claims in respect of contractual obligations;
• infringement of third party intellectual property rights;
• failure of licensees to successfully exploit licensed technology;
• counterparty risk;
• risk of adverse valuation of freehold properties;
• changes in legislation or regulations relating to trading, taxation or accounting practice.
Viability statement
In accordance with the UK Corporate Governance Code July 2018, the Board has determined that a one-year period from the date of signing these Financial Statements constitutes an appropriate period over which to provide its viability statement.
The Board considers annually a one-year detailed financial plan, forecasting sales and costs at a departmental level. Given the dynamic environment and inherent uncertainties in technology businesses, the Board believes that the one-year period is appropriate. Performance against the annual plan is reviewed on a monthly basis by the Board and forecasts are updated quarterly.
The Board has considered sensitivity analyses reflecting downside scenarios of some of the principal risks detailed above including the following:
Principal risk: Market for outsourced services – a downside may include the failure to sell services or the delay or cancellation of projects as a result of a global economic downturn affecting customers’ ability or desire to purchase outsourced services.
Principal risk: Market for radio products – a downside may include the suspension of manufacturing capability in China as a result of the Covid-19 outbreak.
Principal risk: Dependence on key personnel – a downside may include the loss of all key personnel.
In each scenario or combination of scenarios above, the Group is able to rely on its cash reserves, reduce capital expenditure and take other cash management measures to mitigate the impacts and still have residual capacity to absorb further unanticipated events.
The Board has also considered the effect of the bank loan covenants for this assessment period and noted that there is no expectation for the operating covenants to be applicable, as the prerequisite for this (net debt level exceeding £10 million) is not forecast to materialise in the assessment period.
Based on the results of these analyses, the Directors have a reasonable expectation that the Company will be able to continue in operation and meet its liabilities as they fall due over the one-year period of their assessment.
Corporate Responsibility
Science Group takes its responsibilities as a corporate citizen seriously in the territories in which the Group operates. The Board’s primary goal is to create shareholder value but in a responsible way which serves all stakeholders. Furthermore, Science Group seeks to continually enhance and extend its science and technology contribution to society through the work the Group undertakes with its clients and in areas where the Group decides to invest and explore directly.
GovernanceThe Board considers sound governance as a critical component of Science Group’s success and the delivery of its strategy. Science Group has an effective and engaged Board, with a strong non-executive presence from diverse backgrounds, and well-functioning governance committees. Through the Group’s compensation policies and variable components of employee remuneration, the Remuneration Committee of the Board seeks to ensure that Science Group’s values are reinforced in employee behaviour and that effective risk management is promoted.
More information on Science Group’s corporate governance can be found on page 22.
Section 172 statementThe Companies (Miscellaneous Reporting) Regulations 2018 require qualifying companies to publish a statement explaining how the directors have had regard to the matters set out in section 172(1)(a) to (f) of the Companies Act 2006 in performing their duties under section 172.
In accordance with section 172, the Directors confirm that they have acted in the way that they consider, in good faith, would be most likely to promote the success of the Company for the benefit of its shareholders as a whole. The paragraphs below summarise how the Directors have had regard to the matters set out in section 172(1)(a) to (f) of the Act.
The likely long term consequences of decisions - The acquisition of Frontier was a significant addition to the Group and, upon completion, involved an intensive restructuring and integration programme. More information on the integration can be found in the Chairman’s Statement of this report but included a review of Frontier employees’ remuneration packages and alignment with the wider Group, relocation of UK employees to current Science Group locations and transitioning to Group policies and processes where appropriate. These actions reflected the Directors’ consideration of the medium and long term consequences of the acquisition.
The interests of the Company’s employees - Science Group’s employees are fundamental to the specialist services that the Group provides. The Directors have regard to the interests of employees through the Group’s remuneration strategy;
Principal Opportunities and Risks (continued)
17
OV
ER
VIE
WR
EP
OR
T O
F TH
E D
IRE
CT
OR
SS
TR
AT
EG
IC R
EP
OR
TFIN
AN
CIA
L STA
TE
ME
NT
S
Annual Report and Financial Statements 2019
STRATEGIC REPORT
review of employee performance and associated training and development needs; and promotion of an inclusive and diverse culture within the Group. More information can be found in Report of the Remuneration Committee on page 24 and the sections below titled Statement on engagement with employees, Training and development, and Diversity and inclusion.
Need to foster business relationships - The Directors recognise the importance of fostering business relationships with key stakeholders such as customers and suppliers. Customer relationships are proactively maintained and strengthened including through key account management and the Group’s Quality Assurance procedures. Where appropriate the Group maintains key and critical supplier lists which are regularly reviewed and, for example, the Frontier business regularly liaises with and visits critical third party suppliers in its supply chain.
The need to act fairly between shareholders - The Directors are committed to treating all shareholders equally. As part of its decision making process, the Board considers the interests of shareholders as a whole. All shareholders are provided with equivalent information through RNS announcements, circulars and the Science Group website. All shareholders are invited to attend the Annual General Meeting and have the opportunity to ask questions of the Directors. For more information see the section entitled Relations with shareholders on page 22.
Statement on engagement with employeesEmployees have been provided with information on matters of concern to them through the Group’s intranet; revised policies and updates from the human resources team; and formal and informal meetings and other communications with line managers and senior managers. Employees have been consulted on specific issues likely to affect their interests through individual meetings with the human resources team; and discussion with line managers and senior managers.
The involvement of employees in the Group’s performance has been encouraged through the award of share option grants under the Group’s share option scheme, payments made under the Group’s bonus and profit share schemes, and other discretionary incentives.
The Directors have sought to ensure employees have a common awareness of the financial and economic factors affecting the Group’s performance by Group-wide presentations following the issue of the Group’s Annual and Interim Results.
For information on how the Directors have had regard to employees’ interests, see the Section 172 statement on page 16.
Employee training and developmentScience Group’s employees are the business’ primary asset and the Board are committed to investing in their career development and rewarding exceptional performance. The Group makes a focused effort to offer bespoke training and mentorship to allow each individual to thrive within their environment and realise their personal potential. Formal
training and career development is offered to staff of all levels through internal and external programmes that cover technical, business and managerial advancement opportunity. Beyond formal training, employees also hold informal lunchtime sessions on a regular basis to enable knowledge and skills transfer amongst teams.
Employee performance is aligned to the Group’s objectives through an annual performance review process and ongoing project management, line management and mentorship feedback. Employees are kept up to date with information about the Group’s activities through regular briefings and other media.
The Group also invests in and rewards its workforce through the operation of its bonus and profit share schemes for qualifying employees; and its share option scheme which is at the discretion of the Remuneration Committee and other discretionary incentives.
The Board regularly monitors the Group’s culture and practices, including the review of recruitment, retention and turnover data, health & safety reports and reports from senior managers within the Group.
Diversity and inclusionScience Group’s employment policies are non-discriminatory on the grounds of age, gender, nationality, ethnic or racial origin, disability, religion or belief, pregnancy and maternity, sexual orientation or marital or civil partnership status. Science Group gives due consideration to all applications and provides training and the opportunity for career development wherever possible. The Board does not support discrimination of any form, positive or negative, and all appointments are based on merit.
Corporate Responsibility (continued)
Annual Report and Financial Statements 201918
STRATEGIC REPORT
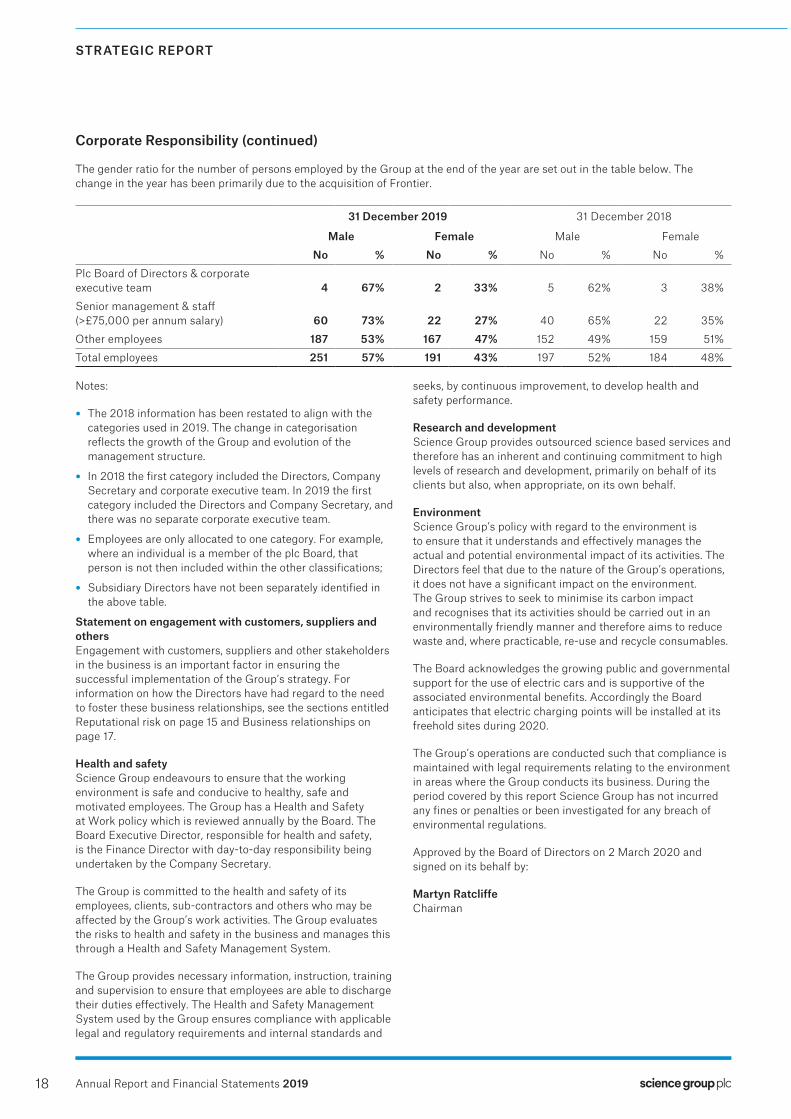
The gender ratio for the number of persons employed by the Group at the end of the year are set out in the table below. The change in the year has been primarily due to the acquisition of Frontier.
31 December 2019 31 December 2018
Male Female Male Female
No % No % No % No %
Plc Board of Directors & corporate executive team 4 67% 2 33% 5 62% 3 38%
Senior management & staff (>£75,000 per annum salary) 60 73% 22 27% 40 65% 22 35%
Other employees 187 53% 167 47% 152 49% 159 51%
Total employees 251 57% 191 43% 197 52% 184 48%
Notes:
• The 2018 information has been restated to align with the categories used in 2019. The change in categorisation reflects the growth of the Group and evolution of the management structure.
• In 2018 the first category included the Directors, Company Secretary and corporate executive team. In 2019 the first category included the Directors and Company Secretary, and there was no separate corporate executive team.
• Employees are only allocated to one category. For example, where an individual is a member of the plc Board, that person is not then included within the other classifications;
• Subsidiary Directors have not been separately identified in the above table.
Statement on engagement with customers, suppliers and othersEngagement with customers, suppliers and other stakeholders in the business is an important factor in ensuring the successful implementation of the Group’s strategy. For information on how the Directors have had regard to the need to foster these business relationships, see the sections entitled Reputational risk on page 15 and Business relationships on page 17.
Health and safetyScience Group endeavours to ensure that the working environment is safe and conducive to healthy, safe and motivated employees. The Group has a Health and Safety at Work policy which is reviewed annually by the Board. The Board Executive Director, responsible for health and safety, is the Finance Director with day-to-day responsibility being undertaken by the Company Secretary.
The Group is committed to the health and safety of its employees, clients, sub-contractors and others who may be affected by the Group’s work activities. The Group evaluates the risks to health and safety in the business and manages this through a Health and Safety Management System.
The Group provides necessary information, instruction, training and supervision to ensure that employees are able to discharge their duties effectively. The Health and Safety Management System used by the Group ensures compliance with applicable legal and regulatory requirements and internal standards and
seeks, by continuous improvement, to develop health and safety performance.
Research and developmentScience Group provides outsourced science based services and therefore has an inherent and continuing commitment to high levels of research and development, primarily on behalf of its clients but also, when appropriate, on its own behalf.
EnvironmentScience Group’s policy with regard to the environment is to ensure that it understands and effectively manages the actual and potential environmental impact of its activities. The Directors feel that due to the nature of the Group’s operations, it does not have a significant impact on the environment. The Group strives to seek to minimise its carbon impact and recognises that its activities should be carried out in an environmentally friendly manner and therefore aims to reduce waste and, where practicable, re-use and recycle consumables.
The Board acknowledges the growing public and governmental support for the use of electric cars and is supportive of the associated environmental benefits. Accordingly the Board anticipates that electric charging points will be installed at its freehold sites during 2020.
The Group’s operations are conducted such that compliance is maintained with legal requirements relating to the environment in areas where the Group conducts its business. During the period covered by this report Science Group has not incurred any fines or penalties or been investigated for any breach of environmental regulations.
Approved by the Board of Directors on 2 March 2020 and signed on its behalf by:
Martyn RatcliffeChairman
Corporate Responsibility (continued)
19
OV
ER
VIE
WR
EP
OR
T O
F TH
E D
IRE
CT
OR
SS
TR
AT
EG
IC R
EP
OR
TFIN
AN
CIA
L STA
TE
ME
NT
S
REPORT OF THE DIRECTORS
Annual Report and Financial Statements 2019
The Directors present their annual report on the business of Science Group plc together with Consolidated Financial Statements and Independent Auditor’s Report for the year ended 31 December 2019.
Accompanying the Report of the Directors is the Strategic Report.
Review of the business and its future developmentA review of the business and its future development is set out in the Strategic Report, incorporating the Chairman’s Statement and Financial Report.
Cautionary statementThe review of the business and its future development in the Strategic Report has been prepared solely to provide additional information to shareholders to assess the Group’s strategies and the potential for these strategies to succeed. It should not be relied on by any other party for any other purpose. The review contains forward looking statements which are made by the Directors in good faith based on information available to them up to the time of the approval of these reports and should be treated with caution due to inherent uncertainties associated with such statements.
Results and dividendsThe results of the Group are set out in detail on page 37.
Subject to shareholder approval at the next Annual General Meeting, the Directors propose to pay a dividend of 4.6 pence per share for the year ended 31 December 2019 (2018: 4.6 pence per share).
Capital structureDetails of the Company’s issued share capital, together with details of the movements therein are set out in Note 23 to the Financial Statements. The Company has one class of ordinary shares which carry no right to fixed income.
Financial instruments and risk managementDisclosures regarding financial instruments are provided within the Strategic Report and Note 3 to the Financial Statements.
DirectorsThe Directors and associated biographies are listed on page 21. Rebecca Archer took maternity leave for the first half of the year and returned to a full-time role in Q3 2019.
David Courtley was re-appointed as a Director at the Annual General Meeting for a tenth year to provide continuity and stability to the Board. Mr Courtley will retire after the Board Meeting in April 2020 and the Board will seek to appoint a new Non-Executive Director.
Daniel Edwards was appointed by the Board during the year, and as such will offer himself for re-election at the next Annual General Meeting. Rebecca Archer will retire by rotation and offer herself for re-election at the next Annual General Meeting.
Directors’ interests in shares and contractsDirectors’ interests in the shares of Science Group plc at 31 December 2019 and 31 December 2018, and any changes subsequent to 31 December 2019, are disclosed in Note 9. None of the Directors had an interest in any contract of significance to which Science Group was a party during the financial year.
Annual General MeetingThe Annual General Meeting (‘AGM’) will be held on 19 May 2020 at 17 Waterloo Place, London, SW1Y 4AR. The notice of the Annual General Meeting contains the full text of resolutions to be proposed.
Purchase of own sharesAt the AGM on 24 April 2019, shareholders approved a resolution for the Company to buy back up to 10% of its own shares. This resolution remains valid until the conclusion of the next Annual General Meeting in 2020 or 30 June 2020 if earlier. As at the date of this report, the Company has bought back 51,913 shares pursuant to this authority. For further information refer to Note 23.
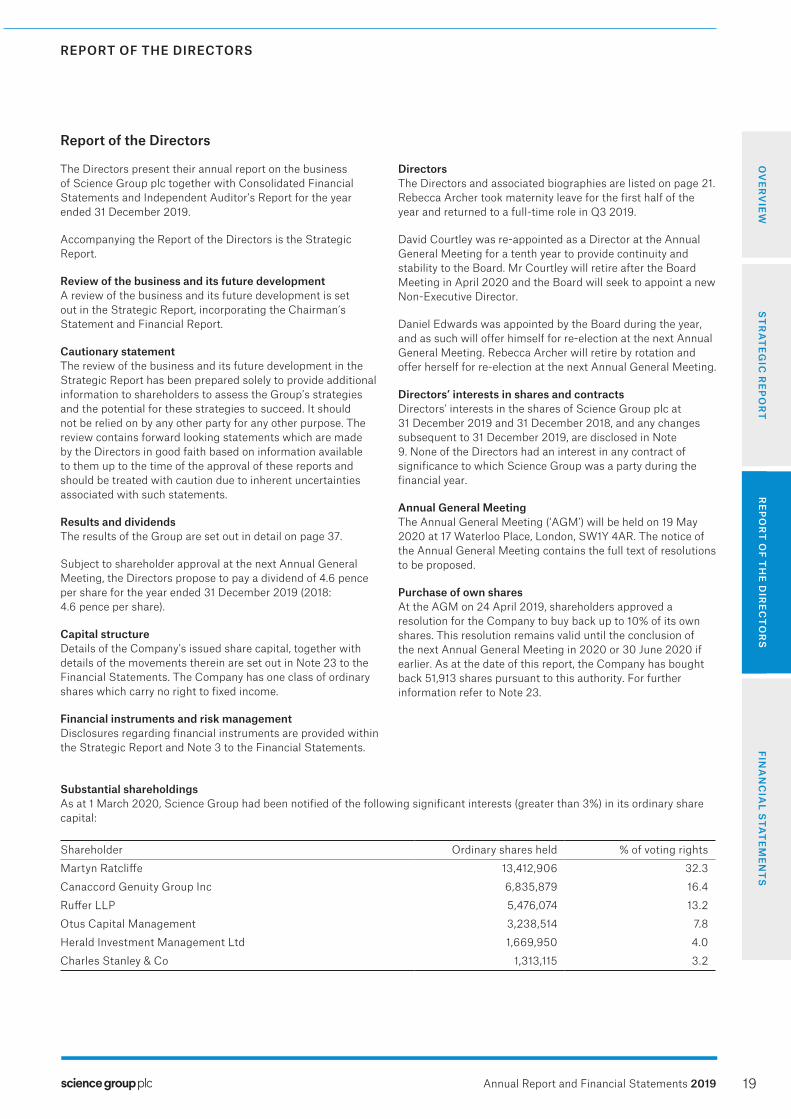
Substantial shareholdingsAs at 1 March 2020, Science Group had been notified of the following significant interests (greater than 3%) in its ordinary share capital:
Shareholder Ordinary shares held % of voting rights
Martyn Ratcliffe 13,412,906 32.3
Canaccord Genuity Group Inc 6,835,879 16.4
Ruffer LLP 5,476,074 13.2
Otus Capital Management 3,238,514 7.8
Herald Investment Management Ltd 1,669,950 4.0
Charles Stanley & Co 1,313,115 3.2
Report of the Directors

20
REPORT OF THE DIRECTORS
Annual Report and Financial Statements 2019
EmployeesThe average number of persons, including Directors, employed by the Group and their remuneration is set out in Note 8 to the Financial Statements.
DonationsThe Company operates a scheme whereby it will, on a discretionary basis, match charitable donations raised by employees up to a specified limit. Charitable donations related to this programme were similar to the prior year. As a result, total charitable contributions made in 2019 were £1,500 (2018: £305). No political donations were made during the period (2018: £nil).
Post balance sheet eventsPost balance sheet events are disclosed in Note 31 to the Financial Statements.
AuditorKPMG LLP were re-appointed as auditor during the year.
The KPMG audit fees for the 2019 year end audit were £176,000 (excluding Frontier). The fees for 2017 on a like for like basis were £101,000. The Board considers this fee level to be too high for a business of the Group’s size and that the increase from 2017 is both material and disproportionate. Consequently the Board will be tendering for new auditors and KPMG has indicated that they will decline to participate. As a result, KPMG has indicated its intention to resign as auditors of the Group but will remain in post until the appointment of new auditors following the tender process.
Disclosure of information to auditorsThe Directors who held office at the date of approval of this Directors’ report confirm that, so far as they are each aware, there is no relevant audit information of which the Company’s auditor is unaware and each Director has taken all the steps that they ought to have taken as a Director to make themselves aware of any relevant audit information and to establish that the Company’s auditor is aware of that information.
DirectorsThe Directors of the Company who served during the year were:
Director Role at 31 December 2018
Date of(re-) appointment
Board Committee
Martyn Ratcliffe Chairman 19/04/2018 N
Rebecca Archer Finance Director 18/05/2017
Daniel Edwards Group Managing Director 24/04/2019
David Courtley+ Non–Executive 24/04/2019 A N R
Michael Lacey-Solymar+ Non–Executive 24/04/2019 A N R
Board Committee abbreviations are as follows: A = Audit Committee; R = Remuneration Committee; N = Nomination Committee+ Independent Director
Report of the Directors (continued)

21
OV
ER
VIE
WR
EP
OR
T O
F TH
E D
IRE
CT
OR
SS
TR
AT
EG
IC R
EP
OR
TFIN
AN
CIA
L STA
TE
ME
NT
S
REPORT OF THE DIRECTORS
Annual Report and Financial Statements 2019
Directors’ BiographiesBelow are the biographies of the Directors:
Martyn Ratcliffe – ChairmanMartyn Ratcliffe was appointed Chairman on 15 April 2010 following his investment in Sagentia Group, now Science Group. He was Chairman of Microgen plc from 1998 to 2016 and Chairman of RM plc from 2011 to 2013. He was previously Senior Vice President of Dell Computer Corporation, responsible for EMEA. He has a degree in Physics from the University of Bath and an MBA from City University, London.
Rebecca Archer – Finance Director*Rebecca Archer was appointed to the Board on 27 January 2014. Mrs Archer is a Chartered Accountant and has a degree in Physics from the University of Oxford. She qualified at Deloitte where she spent six years including three years in New Zealand and joined Science Group from RM plc where she was Business Finance Partner for the Managed Services Business.
Daniel Edwards – Group Managing DirectorDaniel Edwards was appointed to the Board on 24 April 2019. Mr Edwards joined the Company in 2004 and has held a number of roles within the Group including four years in the USA before being appointed Managing Director in 2012. He has an Engineering degree from the University of Cambridge and an MBA from Harvard Business School. He started his career at Rolls-Royce plc.
Michael Lacey-Solymar – Senior Independent DirectorMichael was appointed a Non-Executive Director on 11 October 2012. Michael has over 25 years corporate finance experience at UBS and Investec. He is currently chairman of Cambridge Medical Technologies Limited and a partner at Opus Corporate Finance LLP. He has a degree in Modern Languages from the University of Oxford.
David Courtley – Non-Executive DirectorDavid Courtley was appointed a Non-Executive Director on 15 April 2010. He is also Chief Executive of Mozaic Services and Non-Executive Director of Parity plc. He was previously Chief Executive of Phoenix IT Group plc, Chief Executive of Fujitsu Services Europe and MD of EDS UK. He has a degree in Mathematics from Imperial College, London. After 10 years as a Non-Executive Director, Mr Courtley will be retiring from the Board in April 2020. The Board express their gratitude and appreciation for the significant contribution he has made.
Sarah Cole – Company SecretarySarah Cole joined the Company on 10 January 2011 and was appointed Company Secretary on 22 March 2013. Ms Cole has a degree in Jurisprudence from the University of Oxford and qualified as a Solicitor in 2003.
* Retire by rotation at the next AGM
Report of the Directors (continued)

22
REPORT OF THE DIRECTORS
Annual Report and Financial Statements 2019
The Company is registered in England and Wales and listed on the Alternative Investment Market of the London Stock Exchange (‘AIM’).
Adoption of recognised corporate governance codeThe Board has adopted the Financial Reporting Council’s UK Corporate Governance Code July 2018. The Company’s statement of compliance and associated disclosures are available on the investor pages of the Company’s website.
Board of DirectorsBiographical details of the Directors are included on page 21.
At 31 December 2019, the Board comprised an Executive Chairman (part-time), Group Managing Director, Finance Director, and two independent Non-Executive Directors. All Directors bring a wide range of skills and international experience to the Board. The Non-Executive Directors hold meetings without the Chairman, Group Managing Director and Finance Director present if appropriate.
The Chairman is primarily responsible for the working of the Board of Science Group plc and the Group corporate strategy.
High-level strategic decisions are discussed and taken by the full Board. Investment decisions (above a de minimis level) are taken by the full Board. Operational decisions are taken by the Executive Board members, Divisional Managing Directors and other Senior Managers within the framework approved in the annual financial plan and within a framework of Board-approved authorisation levels.
The Board met 24 times during 2019 (2018: 13). The significant increase in meetings over 2018 was primarily due to the Frontier acquisition. The Board regulations define a framework of high-level authorities that maps the structure of delegation below Board level, as well as specifying issues which remain within the Board’s preserve. The Board typically meets ten times a year to consider a formal schedule of matters including the operating performance of the business and to review Science Group’s financial plan and business model.
Non-Executive Directors are appointed for a three year term after which their appointment may be extended by mutual agreement after due consideration by the Nomination Committee of the Board. In accordance with the Company’s Articles of Association, the longest serving Director (from their last appointment) must retire at each Annual General Meeting and each Director must retire in any three year period, so that over a three year period all Directors will have retired from the Board and been subject to shareholder re-election.
All Directors have access to the advice and services of the Company Secretary and other independent professional advisers as required. Non-Executive Directors have access to key members of staff and are entitled to attend management meetings in order to familiarise themselves with all aspects of Science Group.
It is the responsibility of the Chairman and the Company Secretary to ensure that Board members receive sufficient and timely information regarding corporate and business issues to enable them to discharge their duties.
Relations with shareholdersThe Directors seek to establish and maintain a mutual understanding of objectives between Science Group and its major shareholders by meeting to discuss long-term issues and receive feedback, communicating regularly throughout the year and issuing trading or business updates as appropriate. The Board also seeks to use the Annual General Meeting to communicate with its shareholders.
Remuneration strategyScience Group operates in a competitive market. If Science Group is to compete successfully, it is essential that it attracts, develops and retains high quality staff. Remuneration policy has an important part to play in achieving this objective. Science Group aims to offer its staff a remuneration package which is both competitive in the relevant employment market and which reflects individual performance and contribution. For 2019, in addition to base salary, benefits have included pension contributions, healthcare and life assurance benefits, a Group bonus/profit share scheme and, where appropriate, share options.
Corporate Governance Report
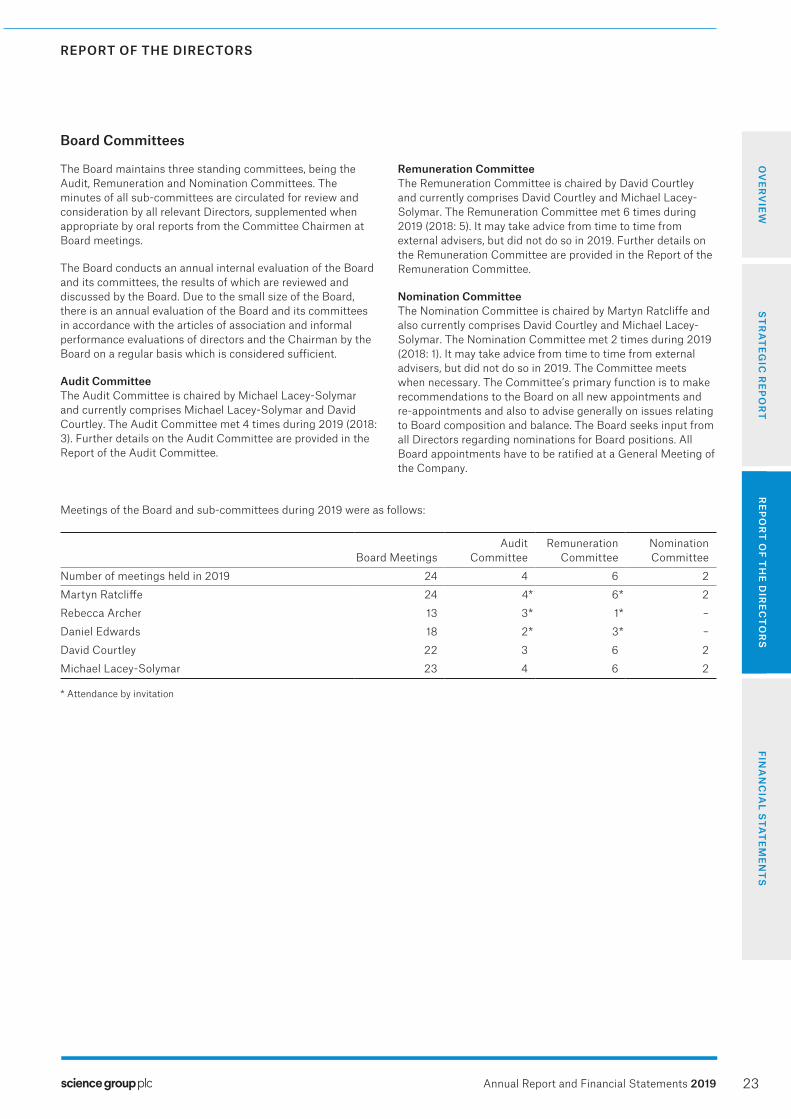
23
OV
ER
VIE
WR
EP
OR
T O
F TH
E D
IRE
CT
OR
SS
TR
AT
EG
IC R
EP
OR
TFIN
AN
CIA
L STA
TE
ME
NT
S
REPORT OF THE DIRECTORS
Annual Report and Financial Statements 2019
The Board maintains three standing committees, being the Audit, Remuneration and Nomination Committees. The minutes of all sub-committees are circulated for review and consideration by all relevant Directors, supplemented when appropriate by oral reports from the Committee Chairmen at Board meetings.
The Board conducts an annual internal evaluation of the Board and its committees, the results of which are reviewed and discussed by the Board. Due to the small size of the Board, there is an annual evaluation of the Board and its committees in accordance with the articles of association and informal performance evaluations of directors and the Chairman by the Board on a regular basis which is considered sufficient.
Audit CommitteeThe Audit Committee is chaired by Michael Lacey-Solymar and currently comprises Michael Lacey-Solymar and David Courtley. The Audit Committee met 4 times during 2019 (2018: 3). Further details on the Audit Committee are provided in the Report of the Audit Committee.
Remuneration CommitteeThe Remuneration Committee is chaired by David Courtley and currently comprises David Courtley and Michael Lacey-Solymar. The Remuneration Committee met 6 times during 2019 (2018: 5). It may take advice from time to time from external advisers, but did not do so in 2019. Further details on the Remuneration Committee are provided in the Report of the Remuneration Committee.
Nomination CommitteeThe Nomination Committee is chaired by Martyn Ratcliffe and also currently comprises David Courtley and Michael Lacey-Solymar. The Nomination Committee met 2 times during 2019 (2018: 1). It may take advice from time to time from external advisers, but did not do so in 2019. The Committee meets when necessary. The Committee’s primary function is to make recommendations to the Board on all new appointments and re-appointments and also to advise generally on issues relating to Board composition and balance. The Board seeks input from all Directors regarding nominations for Board positions. All Board appointments have to be ratified at a General Meeting of the Company.
Meetings of the Board and sub-committees during 2019 were as follows:
Board Meetings
Audit Committee
Remuneration Committee
NominationCommittee
Number of meetings held in 2019 24 4 6 2
Martyn Ratcliffe 24 4* 6* 2
Rebecca Archer 13 3* 1* –
Daniel Edwards 18 2* 3* –
David Courtley 22 3 6 2
Michael Lacey-Solymar 23 4 6 2 * Attendance by invitation
Board Committees
24
REPORT OF THE DIRECTORS
Annual Report and Financial Statements 2019
Remuneration CommitteeThe Remuneration Committee, which is chaired by David Courtley, currently comprises David Courtley and Michael Lacey-Solymar.
The Remuneration Committee monitors the remuneration policies of Science Group to ensure that they are consistent with Science Group’s business objectives. Its terms of reference include the recommendation and execution of policy on Director and executive management remuneration and for reporting decisions made to the Board. The Committee determines the individual remuneration package of the Chairman and Executive Directors, and also reviews remuneration packages for all senior employees of Science Group. This responsibility includes pension rights and any other compensation payments including bonus/profit share payments and share option awards.
The Remuneration Committee recognises that incentivisation of staff is a key issue for Science Group, which depends on the skill of its people for its success. The Remuneration Committee seeks to incentivise employees by linking individual remuneration to individual performance and contribution, and to Science Group results. During the year, the Remuneration Committee approved grants of share options and confirmed Group profit related bonus and profit share schemes for the Company for 2019.
The aim of the Board and the Remuneration Committee is to maintain a policy that:
• establishes a remuneration structure that will attract, retain and motivate executives, senior managers and other staff of appropriate calibre;
• rewards executives and senior managers according to both individual and Group performance;
• establishes an appropriate balance between fixed and variable elements of total remuneration, with the performance-related element forming a potentially significant proportion of the total remuneration package;
• aligns the interests of executives and senior managers with those of shareholders through the use of performance-related rewards and share options in Science Group.
From time to time the Committee may obtain market data and information as appropriate when making its comparisons and decisions and is sensitive to the wider perspective, including pay and employment conditions elsewhere in Science Group, especially when undertaking salary/remuneration reviews.
The remuneration policies operated as intended during the year.
Employee remuneration can include the following elements:
• basic salary – normally reviewed annually and set to reflect market conditions, personal performance and benchmarks in comparable companies;
• annual performance-related bonus/profit share – executives, managers and eligible employees receive annual bonuses/profit shares related to company performance. (The Chairman does not participate in the Group performance-related bonus scheme.) The bonus scheme includes a claw back mechanism in certain circumstances;
• commission – some employees in sales roles participate in commission schemes based on revenue received from relevant sales. These employees are not eligible for the Group bonus/profit share schemes.
• benefits – benefits include medical insurance, life assurance and pension contributions. The Chairman does not receive these benefits;
• share options – share option grants are reviewed regularly and granted on a discretionary basis by the Remuneration Committee.
Full details of each Director’s remuneration package and their interests in shares and share options can be found in Note 9 to the Financial Statements. There are no elements of remuneration, other than basic earnings, which are treated as being pensionable.
Share option plansThe Company adopted an approved and unapproved Share Option scheme in 2008, the terms of which were reviewed and amended in 2010 and 2013 and adopted by shareholders. Further in 2013, the Company adopted an unapproved Performance Share Plan (‘PSP’), the terms of which were amended in 2014 and 2018 and adopted by shareholders. Options granted under the former schemes were issued at market price whilst options granted under the PSP scheme are issued at the nominal share price. No options have been granted under the former schemes since the adoption of the PSP scheme. The Remuneration Committee approves any options granted.
Directors are entitled to participate in Science Group’s share option schemes. Independent Non-Executive Directors do not participate in Science Group’s share option schemes. It is the policy of Science Group to grant share options to Executive Directors and key employees as a means of encouraging ownership and providing incentives for performance. The only share options granted to the Chairman, which occurred in 2010, were specifically approved by shareholders.
Report of the Remuneration Committee

25
OV
ER
VIE
WR
EP
OR
T O
F TH
E D
IRE
CT
OR
SS
TR
AT
EG
IC R
EP
OR
TFIN
AN
CIA
L STA
TE
ME
NT
S
REPORT OF THE DIRECTORS
Annual Report and Financial Statements 2019
The Frontier Smart Technologies Employee Benefit Trust (‘EBT’) holds 104,400 shares in the Company which will be used to satisfy employee share options issued to the Joint Managing Directors of the Frontier business following acquisition. For more information about the EBT see the Finance Director’s Report.
Director contracts and remunerationThe Executive Directors have employment contracts that contain notice periods of six months. Non-Executive Directors’ service contracts may be terminated on three months’ notice. There are no additional financial provisions for termination.
The Chairman and Non-Executive Directors receive a fixed salary. The Chairman does not participate in the Group bonus scheme but, if appropriate, the Remuneration Committee may award a discretionary bonus. Remuneration of the Executive Directors (excluding the Chairman) follows a simple structure of base salary, bonus and long term incentives using share options, including under the Enhanced Executive Incentive (‘EEI’) addendum to the PSP plan that was approved by shareholders at the 2018 AGM.
The market price of the shares at 31 December 2019 was 249.0 pence (2018: 210.0 pence). The highest and lowest price during the year was 185.5 pence and 249.0 pence respectively.
Report of the Remuneration Committee (continued)
26
REPORT OF THE DIRECTORS
Annual Report and Financial Statements 2019
Audit CommitteeThe Audit Committee is chaired by Michael Lacey-Solymar and currently comprises Michael Lacey-Solymar and David Courtley.
The Audit Committee has written terms of reference and provides a mechanism through which the Board can: maintain the integrity of the financial statements of Science Group (including financial reporting policies) and any formal announcements relating to Science Group’s financial performance; review Science Group’s internal financial controls and Science Group’s internal control and risk management systems; and make recommendations to the Board in relation to the appointment of the external auditor, their remuneration both for audit and non-audit work, the nature, scope and results of the audit and the cost effectiveness and the independence and objectivity of the auditors. A recommendation regarding the auditors is put to shareholders for their approval in general meetings.
Provision is made by the Audit Committee to meet the auditors at least twice a year, including at least one meeting without any executives present.
Financial reporting and significant financial mattersIn carrying out its duties, the Audit Committee is required to assess whether suitable accounting policies have been adopted and to challenge the robustness of significant management judgements reflected in the financial results. This is performed through discussions at Audit Committee meetings where the Finance Director explains any changes to accounting policies and describes any significant management judgements made. In addition, the Audit Committee reviews the year end report to the Audit Committee from the external auditors which details its work performed and findings from the annual audit.
During the year, the Audit Committee considered the following key financial matters in relation to the Group’s financial statements and disclosures, with input from the external auditor:
Going concern - the going concern assertion has a significant impact on the basis of preparation of the financial statements. The Committee reviewed the business plan P&L presented by management for the financial year ending 31 December 2020 and considered the key assumptions made by management. The Committee challenged management on the assumptions in the Plan and consequently considered them appropriate. The Committee received the business plan cash flow which covered the period to March 2021 and considered the associated assumptions, which were concluded to be appropriate.
The Finance Director performed a sensitivity analysis to assess the amount of headroom available in the event of a downside event occurring. The analysis considered the likelihood of the net debt of the Group increasing above £10 million from which point covenants would apply. The conclusion was that, under the downside scenario, the net debt would remain below £10 million and hence covenants would not apply and that the Group would continue to have sufficient cash resources in order to meet its liabilities as they fall due.
Acquisition accounting – all acquisitions are approved by the Board to ensure the acquisition is in line with the Group strategy and the potential risks are explained, quantified where possible and understood.
The Frontier acquisition occurred over several months and completed with a statutory merger and as a result, was an unusually complex acquisition for the Group. A number of key judgements and assumptions were made relating to the acquisition accounting and additional review processes were performed in order to manage the risk of misstatement due to the material nature of these judgements and assumptions.
The dates on which the Group obtained significant influence and then control were critical in the accounting for the step acquisition of Frontier. All factors relevant at the date of these events were considered, including the ownership percentage of the Frontier shares acquired by the Group, the financing structure of Frontier and the ability for the Science Group Board to be able to participate in the financial and operating policy decisions of Frontier. Further, the purchase price allocation was calculated based on externally available market price information at these dates. The conclusions were reviewed by the Audit Committee to ensure they were appropriate.
The Finance Director obtained external advice on the identification and measurement of the value of goodwill and acquisition related intangible assets of Frontier. This was based on cash flows extracted from the Group’s financial plan which has been approved by the Board. The Finance Director communicated the key assumptions within the acquisition accounting model and the Audit Committee concurred with management’s conclusion that the carrying value of these assets was fully supported.
The Finance Director performed a review of the accounting policies of the acquired companies and whether they are compliant with Group accounting policies. Any differences were recognised in the opening balance sheet to ensure consistency. Further, additional consideration was given to ensure completeness of the recognition of identified assets and liabilities on the acquisition balance sheet.
Carrying value of goodwill and acquisition related intangible assets – the value of the goodwill and acquisition related intangible assets is supported by a value in use model prepared by management. This is based on cash flows extracted from the Group’s financial plan which has been approved by the Board. The Finance Director communicated the key assumptions within the value in use model and the Audit Committee concurred with management’s conclusion that the carrying value of these assets was fully supported.
Risk of fraud within revenue recognition - Revenue is the most material balance in the Consolidated Income Statement and accordingly, there is a rebuttable presumption that there is a fraud risk surrounding revenue. There is presumed to be an incentive to manipulate revenue in a manner that inflates the group profit, particularly around the year end period.
Report of the Audit Committee
27
OV
ER
VIE
WR
EP
OR
T O
F TH
E D
IRE
CT
OR
SS
TR
AT
EG
IC R
EP
OR
TFIN
AN
CIA
L STA
TE
ME
NT
S
REPORT OF THE DIRECTORS
Annual Report and Financial Statements 2019
Project managers carefully monitor the revenue recognised against projects and are accountable for the progress of projects. The Finance Director reviews the revenue recognised and accrued income balances on a monthly basis and investigates any unusual amounts recognised against projects. Collectively these processes would identify any unwarranted revenue recognised. No instances of fraudulent revenue recognition have been noted from these monitoring procedures in the current year. The Audit Committee is satisfied with management’s response to the risk this incentive represents.
Recoverability of investments in subsidiaries of Science Group plc – the value of investments in subsidiaries is supported by a value in use model prepared by management. This was based on cash flows extracted from the Group’s financial plan which has been approved by the Board. The Finance Director communicated the key assumptions within the value in use model and the Audit Committee concurred with management’s conclusion that the carrying value of these assets was fully supported.
Internal controlsIn applying the principle that the Board should maintain a sound system of internal control to safeguard shareholders’ investments and Science Group’s assets, the Directors recognise that they have overall responsibility for ensuring that Science Group maintains systems to provide them with reasonable assurance regarding effective and efficient operations, internal control and compliance with laws and regulations and for reviewing the effectiveness of that system. However, there are inherent limitations in any system of control and accordingly even the most effective system can provide only reasonable and not absolute assurance against material mis-statement or loss. The system is designed to manage rather than eliminate the risk of failure to achieve the business objectives.
Science Group has established procedures necessary to implement the guidance on internal control issued by the FRC Guidance on Audit Committees 2014. This includes identification, categorisation and prioritisation of critical risks within the business and allocation of responsibility to its executives and senior managers.
The key features of the internal control system are described below:
Control environment – Science Group is committed to high standards of business conduct and seeks to maintain these standards across all of its operations. There is a whistleblowing policy in place for the reporting and resolution of suspected fraudulent activities. There is a continual review of payment processes, authorisation levels for expenditure, and awareness raising of the risks of fraudulent activities. Science Group has an appropriate organisational structure for planning, executing, controlling and monitoring business operations in order to achieve its objectives.
Risk identification – Corporate and operational managers are responsible for the identification and evaluation of key risks applicable to their areas of business. These risks are assessed on a continual basis and may be associated with a variety of internal and external sources, including infringement of IP, sales channels, investment risk, staff retention, disruption in information systems, natural catastrophe and regulatory requirements.
Information systems – Group businesses participate in operational/strategy reviews and annual plans. The Board actively monitors performance against plan. Forecasts and operational results are consolidated and presented to the Board on a regular basis. Through these mechanisms, performance is continually monitored, risks identified in a timely manner, their financial implications assessed, control procedures re-evaluated and corrective actions agreed and implemented.
Main control procedures – Science Group has implemented control procedures designed to ensure complete and accurate accounting for financial transactions and to limit the exposure to loss of assets and fraud. Measures taken include segregation of duties, as far as reasonably practicable.
Monitoring and corrective action – There are procedures in place for monitoring the system of internal financial controls.
This process, which operates in accordance with the FRC Guidance, was maintained throughout the financial year, and has remained in place up to the date of the approval of these financial statements. The Board, via the Audit Committee, has reviewed the systems and processes in place in meetings with the Finance Director and Science Group’s auditors during 2019. No internal audit function is operated outside of the systems and processes in place, as the Board considers that Science Group is currently too small for a separate function, although this remains under regular review. The Board considers the internal control system to be appropriate for the Group.
AuditorsDuring the year KPMG LLP were re-appointed as auditor for a fourth year. Their initial appointment in 2015 followed a full tender process undertaken with three audit firms. The Board will be retendering for audit services during 2020. For more information see the section entitled Auditor on page 20.
The Audit Committee considers the independence of the auditors as part of considering their annual re-appointment. During the year KPMG has provided services in relation to the annual audit of the Group and also provided taxation advice in relation to the freehold property and certain Brexit implications. Audit Committee approval was provided for the provision of non-audit services by KPMG in order to safeguard auditor independence.
Report of the Audit Committee (continued)

28
REPORT OF THE DIRECTORS
Annual Report and Financial Statements 2019
Report of the Nomination Committee
The Nomination Committee is chaired by Martyn Ratcliffe and also currently comprises David Courtley and Michael Lacey-Solymar.
The Nomination Committee reviews the composition of the Board and its effectiveness on an annual basis in order to ensure that the Board comprises the requisite skills and experience and reviews how the Board works together as a unit. The Nomination Committee does not believe that it is appropriate to set any specific targets with regards to diversity, including gender. The Committee believes that the search for Board candidates should be conducted, and appointments made, on merit, against objective criteria but with due regard for the benefits of diversity on the Board. During 2020, the Committee will be seeking to appoint a new Non-Executive Director since Mr Courtley will be retiring after ten years’ service to the Company.
Directors’ Responsibilities
The Directors are responsible for preparing the Annual Report and the Group and parent Company financial statements in accordance with applicable law and regulations. The Directors consider that the Annual Report and financial statements, taken as a whole, are fair, balanced and understandable, and provide the information necessary for shareholders to assess the Group’s position, performance, business model and strategy.
Company law requires the directors to prepare Group and parent Company financial statements for each financial year. As required by the AIM Rules of the London Stock Exchange they are required to prepare the Group financial statements in accordance with International Financial Reporting Standards as adopted by the EU (IFRSs as adopted by the EU) and applicable law and have elected to prepare the parent Company financial statements on the same basis.
Under company law the directors must not approve the financial statements unless they are satisfied that they give a true and fair view of the state of affairs of the Group and parent Company and of their profit or loss for that period. In preparing each of the Group and parent Company financial statements, the directors are required to:
• select suitable accounting policies and then apply them consistently;
• make judgements and estimates that are reasonable, relevant and reliable;
• state whether they have been prepared in accordance with IFRSs as adopted by the EU;
• assess the Group and parent Company’s ability to continue as a going concern, disclosing, as applicable, matters related to going concern; and
• use the going concern basis of accounting unless they either intend to liquidate the Group or the parent Company or to cease operations, or have no realistic alternative but to do so. The directors confirm that they consider it appropriate to adopt the going concern basis of accounting in preparing the Annual Report and financial statements.
The Directors are responsible for keeping adequate accounting records that are sufficient to show and explain the parent Company’s transactions and disclose with reasonable accuracy at any time the financial position of the parent Company and enable them to ensure that its financial statements comply with the Companies Act 2006. They are responsible for such internal control as they determine is necessary to enable the preparation of financial statements that are free from material misstatement, whether due to fraud or error, and have general responsibility for taking such steps as are reasonably open to them to safeguard the assets of the Group and to prevent and detect fraud and other irregularities.
Under applicable law and regulations, the Directors are also responsible for preparing a Strategic Report and a Directors’ Report that complies with that law and those regulations.
The Directors are responsible for the maintenance and integrity of the corporate and financial information included on the company’s website. Legislation in the UK governing the preparation and dissemination of financial statements may differ from legislation in other jurisdictions.
Approval
The Report of the Directors was approved by the Board on 2 March 2020 and signed on its behalf:
By order of the Board
Sarah Cole Harston Mill Company Secretary Harston
Cambridge CB22 7GG

29
INDEPENDENT AUDITOR’S REPORT
Annual Report and Financial Statements 2019
Independent Auditor’s Report to the Members of Science Group plc
1 Our opinion is unmodified
We have audited the financial statements of Science Group plc (“the Company”) for the year ended 31 December 2019 which comprise the Consolidated Income Statement, Consolidated Statement of Comprehensive Income, Consolidated Statement of Changes in Shareholders’ Equity, Company Statement of Changes in Shareholders’ Equity, Consolidated and Company Balance Sheets and Consolidated and Company Statement of Cash Flows and the related notes, including the accounting policies in Note 2.
In our opinion:
• the financial statements give a true and fair view of the state of the Group’s and of the parent Company’s affairs as at 31 December 2019 and of the Group’s loss for the year then ended;
• the Group financial statements have been properly prepared in accordance with International Financial Reporting Standards as adopted by the European Union (IFRSs as adopted by the EU);
• the parent Company financial statements have been properly prepared in accordance with IFRSs as adopted by the EU and as applied in accordance with the provisions of the Companies Act 2006; and
• the financial statements have been prepared in accordance with the requirements of the Companies Act 2006.
Basis for opinionWe conducted our audit in accordance with International Standards on Auditing (UK) (“ISAs (UK)”) and applicable law. Our responsibilities are described below. We have fulfilled our ethical responsibilities under, and are independent of the Group in accordance with, UK ethical requirements including the FRC Ethical Standard as applied to listed entities. We believe that the audit evidence we have obtained is a sufficient and appropriate basis for our opinion.
2 Key audit matters: including our assessment of risks of material misstatement
Key audit matters are those matters that, in our professional judgment, were of most significance in the audit of the financial statements and include the most significant assessed risks of material misstatement (whether or not due to fraud) identified by us, including those which had the greatest effect on: the overall audit strategy; the allocation of resources in the audit; and directing the efforts of the engagement team. These matters were addressed in the context of our audit of the financial statements as a whole, and in forming our opinion thereon, and we do not provide a separate opinion on these matters.
The risk Our responseThe impact of uncertainties due to the UK exiting the European Union on our auditRefer to page 15 (principal risks)
All audits assess and challenge the reasonableness of estimates, in particular as described in the step acquisition of Frontier Smart Technologies Group Limited, recognition and measurement of the identifiable assets acquired and the liabilities assumed, valuation of Group goodwill and intangible assets and recoverability of parent Company’s investments in subsidiaries below, and related disclosures and the appropriateness of the going concern basis of preparation of the financial statements. All of these depend on assessments of the future economic environment and the Group’s future prospects and performance.In addition, we are required to consider the other information presented in the Annual Report including the principal risks disclosure and the viability statement and to consider the directors’ statement that the annual report and financial statements taken as a whole is fair, balanced and understandable and provides the information necessary for shareholders to assess the Group’s position and performance, business model and strategy.Brexit is one of the most significant economic events for the UK and its effects are subject to unprecedented levels of uncertainty of consequences, with the full range of possible effects unknown.
We developed a standardised firm–wide approach to the consideration of the uncertainties arising from Brexit in planning and performing our audits. Our procedures included:Our Brexit knowledge: We considered the directors’ assessment of Brexit–related sources of risk for the group’s business and financial resources compared with our own understanding of the risks. We considered the directors’ plans to take action to mitigate the risks.Sensitivity analysis: When addressing the key audit matters affected and other areas that depend on forecasts, we compared the directors’ analysis to our assessment of the full range of reasonably possible scenarios resulting from Brexit uncertainty and, where forecast cash flows are required to be discounted, considered adjustments to discount rates for the level of remaining uncertainty.Assessing transparency: As well as assessing individual disclosures as part of our procedures on key audit matters affected we considered all of the Brexit related disclosures together, including those in the strategic report, comparing the overall picture against our understanding of the risks.

30
INDEPENDENT AUDITOR’S REPORT
Annual Report and Financial Statements 2019
The risk Our responseStep acquisition of Frontier Smart Technologies Group Limited(Total identifiable net assets acquired £5,780k)Refer page 15 (principal risks), page 26 (Audit Committee report), page 49 (accounting policy) and page 86 (financial disclosures).
Accounting treatment and subjective estimateAs set out on page 86, the Group acquired Frontier Smart Technologies Group Limited “Frontier” in the year. The acquisition occurred in stages (i.e. as a step acquisition) resulting in significant judgement around the dates at which the Group first obtained significant influence and then subsequently control.Furthermore, accounting for the transaction involves estimating the fair value at acquisition date of the assets and liabilities, including the identification and valuation, where appropriate, of acquired intangible assets. Significant judgement is involved in relation to the assumptions used in this valuation process.The effect of these matters is that, as part of our risk assessment, we determined that the measurement of identifiable assets acquired and liabilities assumed has a high degree of estimation uncertainty, with a potential range of reasonable outcomes greater than our materiality for the financial statements as a whole, and possibly many times that amount.
Our procedures included;Accounting analysis: Critically evaluating and challenging management’s determination of the acquisition date and accounting for the holding in Frontier acquired entity prior to obtaining control, with the assistance of accounting specialists.Assessing valuer’s credentials: Assessing the competence, capability and independence of the expert engaged by the Group in identifying and valuing the acquired intangible assets.Our sector experience: Use of our own Corporate Finance Specialists to assist us in assessing the intangible asset valuations, in particular challenging the valuation method, inputs and key assumptions applied such as discount rate.Our sector experience: With the assistance of our accounting specialists, critically evaluating and testing the Directors’ determination of fair value of the remaining assets acquired and liabilities assumed including share based payment awards, inventory and contingent liabilities. This was done through our review of the work of component auditors on the acquisition date assets and liabilities, and obtaining corroborative audit evidence through inspection of supporting information.Assessing transparency: Assessing whether the Group’s disclosures regarding the acquisition adequately disclose the judgements and estimates involved in arriving at the fair values and considering whether the disclosure requirements of IFRS 3 Business Combinations are satisfied.
Independent Auditor’s Report to the Members of Science Group plc (continued)
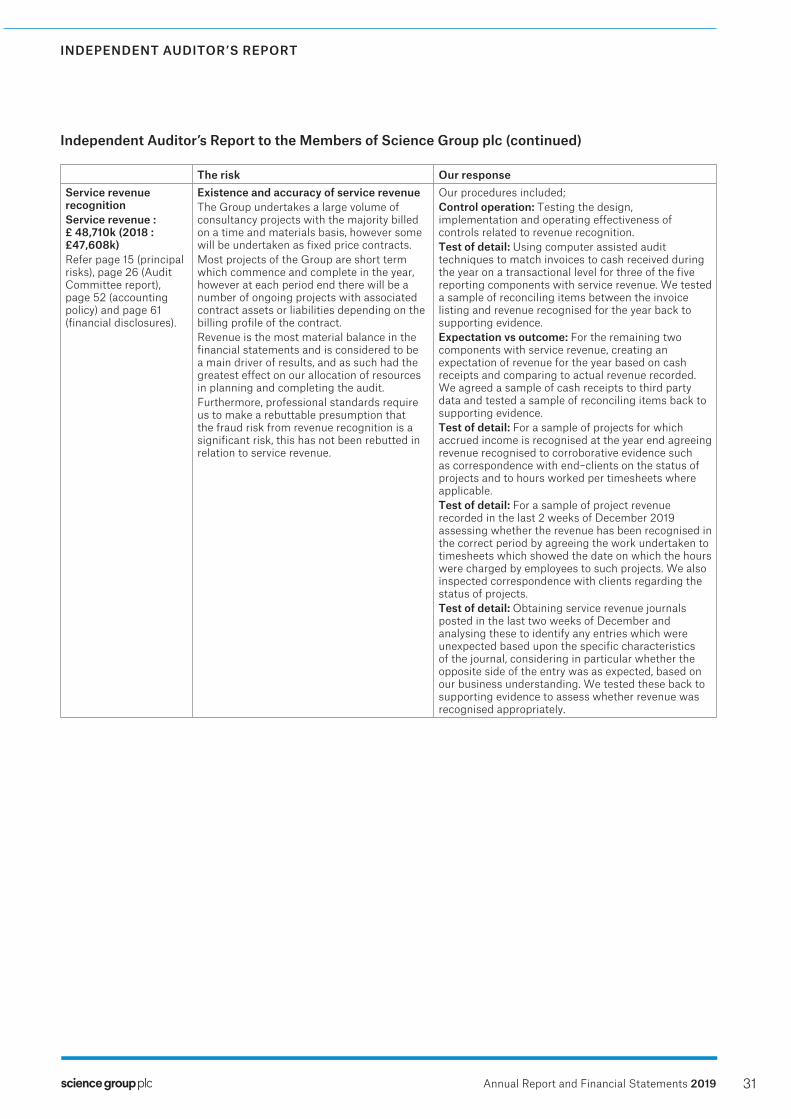
31
INDEPENDENT AUDITOR’S REPORT
Annual Report and Financial Statements 2019
The risk Our responseService revenue recognitionService revenue : £ 48,710k (2018 : £47,608k)Refer page 15 (principal risks), page 26 (Audit Committee report), page 52 (accounting policy) and page 61 (financial disclosures).
Existence and accuracy of service revenueThe Group undertakes a large volume of consultancy projects with the majority billed on a time and materials basis, however some will be undertaken as fixed price contracts.Most projects of the Group are short term which commence and complete in the year, however at each period end there will be a number of ongoing projects with associated contract assets or liabilities depending on the billing profile of the contract.Revenue is the most material balance in the financial statements and is considered to be a main driver of results, and as such had the greatest effect on our allocation of resources in planning and completing the audit.Furthermore, professional standards require us to make a rebuttable presumption that the fraud risk from revenue recognition is a significant risk, this has not been rebutted in relation to service revenue.
Our procedures included;Control operation: Testing the design, implementation and operating effectiveness of controls related to revenue recognition.Test of detail: Using computer assisted audit techniques to match invoices to cash received during the year on a transactional level for three of the five reporting components with service revenue. We tested a sample of reconciling items between the invoice listing and revenue recognised for the year back to supporting evidence.Expectation vs outcome: For the remaining two components with service revenue, creating an expectation of revenue for the year based on cash receipts and comparing to actual revenue recorded. We agreed a sample of cash receipts to third party data and tested a sample of reconciling items back to supporting evidence.Test of detail: For a sample of projects for which accrued income is recognised at the year end agreeing revenue recognised to corroborative evidence such as correspondence with end–clients on the status of projects and to hours worked per timesheets where applicable.Test of detail: For a sample of project revenue recorded in the last 2 weeks of December 2019 assessing whether the revenue has been recognised in the correct period by agreeing the work undertaken to timesheets which showed the date on which the hours were charged by employees to such projects. We also inspected correspondence with clients regarding the status of projects.Test of detail: Obtaining service revenue journals posted in the last two weeks of December and analysing these to identify any entries which were unexpected based upon the specific characteristics of the journal, considering in particular whether the opposite side of the entry was as expected, based on our business understanding. We tested these back to supporting evidence to assess whether revenue was recognised appropriately.
Independent Auditor’s Report to the Members of Science Group plc (continued)
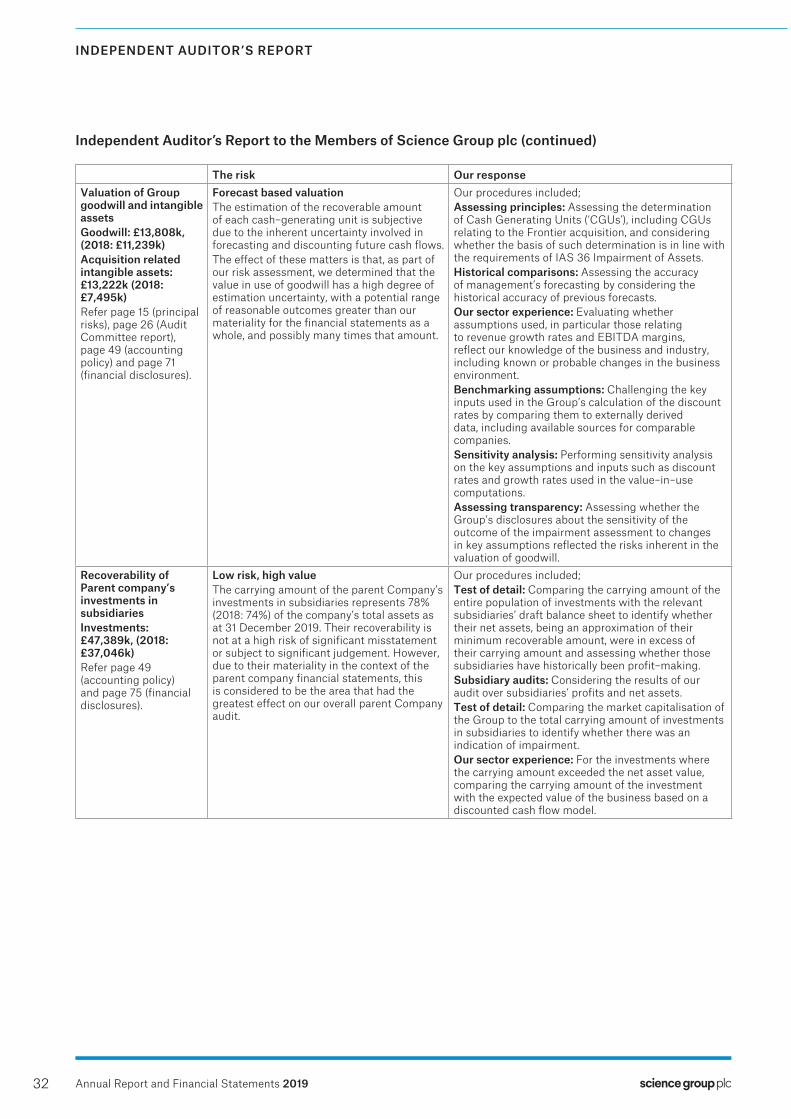
32
INDEPENDENT AUDITOR’S REPORT
Annual Report and Financial Statements 2019
The risk Our responseValuation of Group goodwill and intangible assetsGoodwill: £13,808k, (2018: £11,239k)Acquisition related intangible assets: £13,222k (2018: £7,495k)Refer page 15 (principal risks), page 26 (Audit Committee report), page 49 (accounting policy) and page 71 (financial disclosures).
Forecast based valuationThe estimation of the recoverable amount of each cash–generating unit is subjective due to the inherent uncertainty involved in forecasting and discounting future cash flows.The effect of these matters is that, as part of our risk assessment, we determined that the value in use of goodwill has a high degree of estimation uncertainty, with a potential range of reasonable outcomes greater than our materiality for the financial statements as a whole, and possibly many times that amount.
Our procedures included;Assessing principles: Assessing the determination of Cash Generating Units (‘CGUs’) , including CGUs relating to the Frontier acquisition, and considering whether the basis of such determination is in line with the requirements of IAS 36 Impairment of Assets.Historical comparisons: Assessing the accuracy of management’s forecasting by considering the historical accuracy of previous forecasts.Our sector experience: Evaluating whether assumptions used, in particular those relating to revenue growth rates and EBITDA margins, reflect our knowledge of the business and industry, including known or probable changes in the business environment.Benchmarking assumptions: Challenging the key inputs used in the Group’s calculation of the discount rates by comparing them to externally derived data, including available sources for comparable companies.Sensitivity analysis: Performing sensitivity analysis on the key assumptions and inputs such as discount rates and growth rates used in the value–in–use computations.Assessing transparency: Assessing whether the Group’s disclosures about the sensitivity of the outcome of the impairment assessment to changes in key assumptions reflected the risks inherent in the valuation of goodwill.
Recoverability of Parent company’s investments in subsidiariesInvestments: £47,389k, (2018: £37,046k)Refer page 49 (accounting policy) and page 75 (financial disclosures).
Low risk, high valueThe carrying amount of the parent Company’s investments in subsidiaries represents 78% (2018: 74%) of the company’s total assets as at 31 December 2019. Their recoverability is not at a high risk of significant misstatement or subject to significant judgement. However, due to their materiality in the context of the parent company financial statements, this is considered to be the area that had the greatest effect on our overall parent Company audit.
Our procedures included;Test of detail: Comparing the carrying amount of the entire population of investments with the relevant subsidiaries’ draft balance sheet to identify whether their net assets, being an approximation of their minimum recoverable amount, were in excess of their carrying amount and assessing whether those subsidiaries have historically been profit–making.Subsidiary audits: Considering the results of our audit over subsidiaries’ profits and net assets.Test of detail: Comparing the market capitalisation of the Group to the total carrying amount of investments in subsidiaries to identify whether there was an indication of impairment.Our sector experience: For the investments where the carrying amount exceeded the net asset value, comparing the carrying amount of the investment with the expected value of the business based on a discounted cash flow model.
Independent Auditor’s Report to the Members of Science Group plc (continued)

33
INDEPENDENT AUDITOR’S REPORT
Annual Report and Financial Statements 2019
3 Our application of materiality and an overview of the scope of our auditMateriality for the Group financial statements as a whole was set at £211,000 (2018 £183,000), determined with reference to a benchmark of profit before tax normalised to exclude one-off costs and adjustments such as costs related to the acquisition, share of loss of equity accounted investee and reversal of provision of legal claim, of which it represents 6.5% (2018: 5%).
Materiality for the parent Company financial statements as a whole was set at £105,000 (2018: £145,000), which was determined with reference to a benchmark of company total assets, but has been capped at 50% of Group materiality.
We agreed to report to the Audit Committee any corrected or uncorrected identified misstatements exceeding £10,500 (2018: £9,000), in addition to other identified misstatements that warranted reporting on qualitative grounds.
Of the Group’s 25 components, we subjected 8 components to full scope audits for Group purposes.
The components within the scope of our work accounted for the following percentages of the Group’s results
Number ofcomponents Group revenue
Profits and losses that
make up Group loss
before taxGroup total
assets
2019 8 93% 96% 92%
2018 9 92% 89% 98%
The remaining 7% of total Group revenue, 4% of profits and losses that make up Group loss before tax and 8% of total Group assets is represented by 17 of reporting components, none of which individually represented more than 4% of any of total Group revenue, profits and losses that make up Group loss before tax or total Group assets. For these residual components, we performed analysis at an aggregated Group level to re-examine our assessment that there were no significant risks of material misstatement within these.
The Group team instructed the component auditor as to the significant areas to be covered, including the relevant risks detailed above and the information to be reported back. The Group team approved the component materialities, which ranged from £16,000 to £116,000, having regard to the mix of size and risk profile of the Group across the components. The work on 1 of the 8 components above was performed by another component auditor and the rest, including the audit of the parent Company, was performed by the Group team. The Group team performed procedures on the items excluded from normalised Group profit before tax.
The Group team visited and held a number of telephone conference meetings with the 1 component auditor to assess the audit risks and strategy. At these meetings and visits, the findings reported to the Group team were discussed in more detail, and any further work required by the Group team was then performed by the component auditor.
4 We have nothing to report on going concernThe Directors have prepared the financial statements on the going concern basis as they do not intend to liquidate the Company or the Group or to cease their operations, and as they have concluded that the Company’s and the Group’s financial position means that this is realistic. They have also concluded that there are no material uncertainties that could have cast significant doubt over their ability to continue as a going concern for at least a year from the date of approval of the financial statements (“the going concern period”).
Our responsibility is to conclude on the appropriateness of the Directors’ conclusions and, had there been a material uncertainty related to going concern, to make reference to that in this audit report. However, as we cannot predict all future events or conditions and as subsequent events may result in outcomes that are inconsistent with judgements that were reasonable at the time they were made, the absence of reference to a material uncertainty in this auditor’s report is not a guarantee that the Group or the Company will continue in operation.
In our evaluation of the Directors’ conclusions, we considered the inherent risks to the Group’s and Company’s business model and analysed how those risks might affect the Group’s and Company’s financial resources or ability to continue operations over the going concern period. The risk that we considered most likely to adversely affect the Group’s and Company’s available financial resources over this period was the impact of coronavirus to Chinese operations.
As these were risks that could potentially cast significant doubt on the Group’s and the Company’s ability to continue as a going concern, we considered sensitivities over the level of available financial resources indicated by the Group’s financial forecasts taking account of reasonably possible (but not unrealistic) adverse effects that could arise from these risks individually and collectively and evaluated the achievability of the actions the Directors consider they would take to improve the position should the risks materialise. We also considered less predictable but realistic second order impacts, such as the erosion of customer or supplier confidence and the impact of Brexit on the Group’s UK workforce, which could result in a rapid reduction of available financial resources.
Independent Auditor’s Report to the Members of Science Group plc (continued)
34
INDEPENDENT AUDITOR’S REPORT
Annual Report and Financial Statements 2019
Based on this work, we are required to report to you if we have anything material to add or draw attention to in relation to the directors’ statement in Note 2 to the financial statements on the use of the going concern basis of accounting with no material uncertainties that may cast significant doubt over the Group and Company’s use of that basis for a period of at least twelve months from the date of approval of the financial statements.
We have nothing to report in these respects, and we did not identify going concern as a key audit matter.
5 We have nothing to report on the other information in the Annual ReportThe directors are responsible for the other information presented in the Annual Report together with the financial statements. Our opinion on the financial statements does not cover the other information and, accordingly, we do not express an audit opinion or, except as explicitly stated below, any form of assurance conclusion thereon.Our responsibility is to read the other information and, in doing so, consider whether, based on our financial statements audit work, the information therein is materially misstated or inconsistent with the financial statements or our audit knowledge. Based solely on that work we have not identified material misstatements in the other information.
Strategic report and directors’ reportBased solely on our work on the other information:
• we have not identified material misstatements in the strategic report and the directors’ report;
• in our opinion the information given in those reports for the financial year is consistent with the financial statements; and
• in our opinion those reports have been prepared in accordance with the Companies Act 2006.
Disclosures of emerging and principal risks and longer-term viabilityBased on the knowledge we acquired during our financial statements audit, we have nothing material to add or draw attention to in relation to:
• the directors’ confirmation within Viability Statement, as set out on page 16, that they have carried out a robust assessment of the emerging and principal risks facing the Group, including those that would threaten its business model, future performance, solvency and liquidity;
• the Principal Risks disclosures describing these risks and explaining how they are being managed and mitigated; and
• the directors’ explanation in the Viability Statement of how they have assessed the prospects of the Group, over what period they have done so and why they considered that period to be appropriate, and their statement as to whether they have a reasonable expectation that the Group will be able to continue in operation and meet its liabilities as they fall due over the period of their assessment, including any related disclosures drawing attention to any necessary qualifications or assumptions.
Our work is limited to assessing these matters in the context of only the knowledge acquired during our financial statements audit. As we cannot predict all future events or conditions and as subsequent events may result in outcomes that are inconsistent with judgments that were reasonable at the time they were made, the absence of anything to report on these statements is not a guarantee as to the Group’s and Company’s longer-term viability.
Corporate governance disclosuresWe are required to report to you if:
• we have identified material inconsistencies between the knowledge we acquired during our financial statements audit and the directors’ statement that they consider that the annual report and financial statements taken as a whole is fair, balanced and understandable and provides the information necessary for shareholders to assess the Group’s position and performance, business model and strategy; or
• the section of the annual report describing the work of the Audit Committee does not appropriately address matters communicated by us to the Audit Committee.
6 We have nothing to report on the other matters on which we are required to report by exceptionUnder the Companies Act 2006, we are required to report to you if, in our opinion:
• adequate accounting records have not been kept by the parent Company, or returns adequate for our audit have not been received from branches not visited by us; or
• the parent Company financial statements are not in agreement with the accounting records and returns; or
• certain disclosures of directors’ remuneration specified by law are not made; or
• we have not received all the information and explanations we require for our audit.
We have nothing to report in these respects.
Independent Auditor’s Report to the Members of Science Group plc (continued)
35
INDEPENDENT AUDITOR’S REPORT
Annual Report and Financial Statements 2019
7 Respective responsibilitiesDirectors’ responsibilitiesAs explained more fully in their statement set out on page 28, the directors are responsible for: the preparation of the financial statements including being satisfied that they give a true and fair view; such internal control as they determine is necessary to enable the preparation of financial statements that are free from material misstatement, whether due to fraud or error; assessing the Group and parent Company’s ability to continue as a going concern, disclosing, as applicable, matters related to going concern; and using the going concern basis of accounting unless they either intend to liquidate the Group or the parent Company or to cease operations, or have no realistic alternative but to do so.
Auditor’s responsibilitiesOur objectives are to obtain reasonable assurance about whether the financial statements as a whole are free from material misstatement, whether due to fraud or error, and to issue our opinion in an auditor’s report. Reasonable assurance is a high level of assurance, but does not guarantee that an audit conducted in accordance with ISAs (UK) will always detect a material misstatement when it exists. Misstatements can arise from fraud or error and are considered material if, individually or in aggregate, they could reasonably be expected to influence the economic decisions of users taken on the basis of the financial statements.
A fuller description of our responsibilities is provided on the FRC’s website at www.frc.org.uk/auditorsresponsibilities.
8 The purpose of our audit work and to whom we owe our responsibilitiesThis report is made solely to the Company’s members, as a body, in accordance with Chapter 3 of Part 16 of the Companies Act 2006. Our audit work has been undertaken so that we might state to the Company’s members those matters we are required to state to them in an auditor’s report and for no other purpose. To the fullest extent permitted by law, we do not accept or assume responsibility to anyone other than the Company and the Company’s members, as a body, for our audit work, for this report, or for the opinions we have formed.
Jeremy Hall (Senior Statutory Auditor)for and on behalf of KPMG LLP, Statutory AuditorChartered Accountants15, Canada Square, London, E14 5GL
2 March 2020
Independent Auditor’s Report to the Members of Science Group plc (continued)

FinancialStatementsand Notes to theFinancial Statements
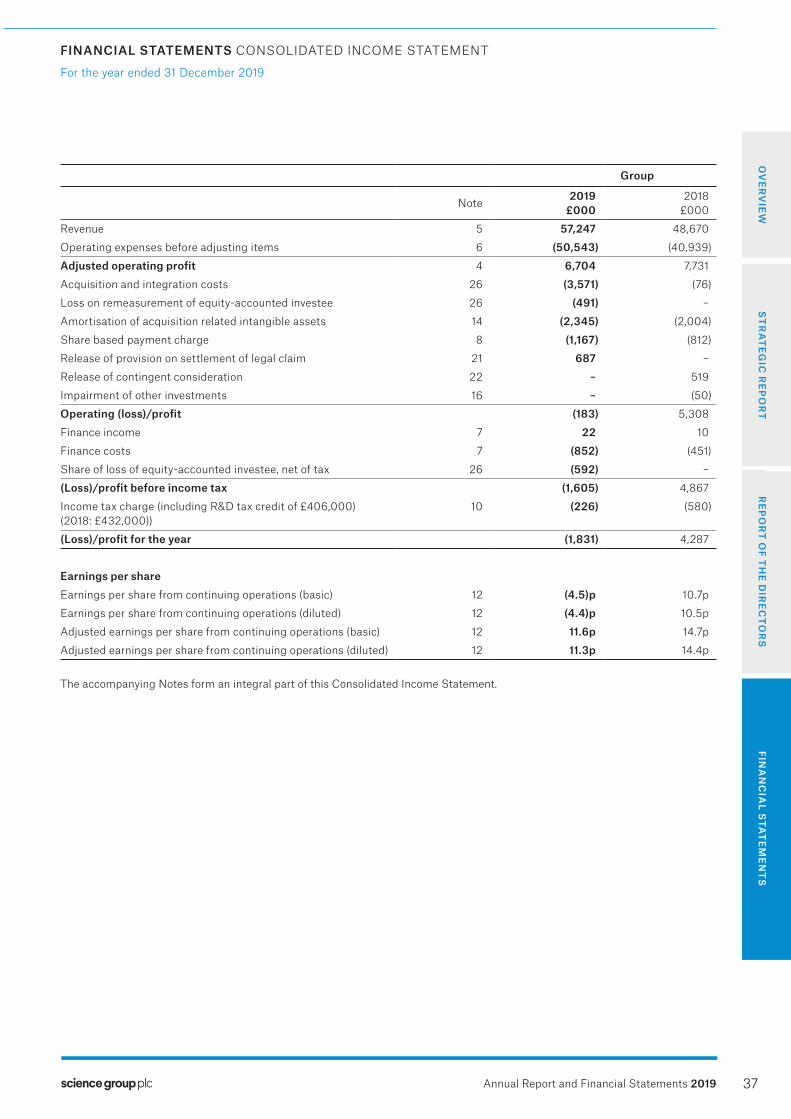
37
FINANCIAL STATEMENTS CONSOLIDATED INCOME STATEMENT FINANCIAL STATEMENTS CONSOLIDATED INCOME STATEMENT
OV
ER
VIE
WR
EP
OR
T O
F TH
E D
IRE
CT
OR
SS
TR
AT
EG
IC R
EP
OR
TFIN
AN
CIA
L STA
TE
ME
NT
S
For the year ended 31 December 2019
Annual Report and Financial Statements 2019
Group
Note 2019 £000
2018 £000
Revenue 5 57,247 48,670
Operating expenses before adjusting items 6 (50,543) (40,939)
Adjusted operating profit 4 6,704 7,731
Acquisition and integration costs 26 (3,571) (76)
Loss on remeasurement of equity-accounted investee 26 (491) –
Amortisation of acquisition related intangible assets 14 (2,345) (2,004)
Share based payment charge 8 (1,167) (812)
Release of provision on settlement of legal claim 21 687 –
Release of contingent consideration 22 – 519
Impairment of other investments 16 – (50)
Operating (loss)/profit (183) 5,308
Finance income 7 22 10
Finance costs 7 (852) (451)
Share of loss of equity-accounted investee, net of tax 26 (592) –
(Loss)/profit before income tax (1,605) 4,867
Income tax charge (including R&D tax credit of £406,000) (2018: £432,000))
10 (226) (580)
(Loss)/profit for the year (1,831) 4,287
Earnings per share Earnings per share from continuing operations (basic) 12 (4.5) p 10.7p
Earnings per share from continuing operations (diluted) 12 (4.4) p 10.5p
Adjusted earnings per share from continuing operations (basic) 12 11.6p 14.7p
Adjusted earnings per share from continuing operations (diluted) 12 11.3p 14.4p
The accompanying Notes form an integral part of this Consolidated Income Statement.

38
FINANCIAL STATEMENTS CONSOLIDATED STATEMENT OF COMPREHENSIVE INCOME
For the year ended 31 December 2019
Annual Report and Financial Statements 2019
Group
2019 £000
2018 £000
(Loss)/profit for the year attributable to:Equity holders of the parent (1,669) 4,287
Non-controlling interests (162) –
(Loss)/profit for the year (1,831) 4,287
Other comprehensive incomeItems that will or may be reclassified to profit or loss:Exchange differences on translating foreign operations (939) (50)
Fair value (loss)/gain on interest rate swap (408) 66
Deferred tax on interest rate swap 77 (13)
Other comprehensive (expense)/income for the year (1,270) 3
Total comprehensive income for the period attributable to:Equity holders of the parent (2,939) 4,290
Non-controlling interests (162) –
Total comprehensive (expense)/income for the year (3,101) 4,290
The accompanying Notes form an integral part of this Consolidated Statement of Comprehensive Income.

39
FINANCIAL STATEMENTS CONSOLIDATED STATEMENT OF COMPREHENSIVE INCOME FINANCIAL STATEMENTS CONSOLIDATED STATEMENT OF CHANGES IN SHAREHOLDERS’ EQUITY
OV
ER
VIE
WR
EP
OR
T O
F TH
E D
IRE
CT
OR
SS
TR
AT
EG
IC R
EP
OR
TFIN
AN
CIA
L STA
TE
ME
NT
S
For the year ended 31 December 2019
Annual Report and Financial Statements 2019
Attributable to owners of the Company
Group Issued capital
£000
Share premium
£000
Treasury stock
£000
Merger reserve
£000
Translation reserve
£000
Share based
payment reserve
£000
Retained earnings
£000
Total – Share-
holders’ funds£000
Non-controlling
interests
£000
Total equity
£000
Balance at 1 January 2018 421 8,230 (3,569) 10,343 310 2,663 19,341 37,739 – 37,739
Contributions and distributions
Purchase of own shares – – (190) – – – – (190) – (190)
Issue of shares out of treasury stock – – 995 – – – (880) 115 – 115
Dividends paid – – – – – – (1,760) (1,760) – (1,760)
Share based payment charge (Note 23) – – – – – 812 – 812 – 812
Deferred tax on share based payment transactions – – – – – – (48) (48) – (48)
Transactions with owners – – 805 – – 812 (2,688) (1,071) – (1,071)
Profit for the year – – – – – – 4,287 4,287 – 4,287
Other comprehensive income:
Fair value gain on interest rate swap – – – – – – 66 66 – 66
Exchange differences on translating foreign operations – – – – (50) – – (50) – (50)
Deferred tax on interest rate swap – – – – – – (13) (13) – (13)
Total comprehensive income for the year – – – – (50) – 4,340 4,290 – 4,290
Balance at 31 December 2018 421 8,230 (2,764) 10,343 260 3,475 20,993 40,958 – 40,958
The accompanying Notes form an integral part of this Consolidated Statement of Changes in Shareholders’ Equity.

40
FINANCIAL STATEMENTS CONSOLIDATED STATEMENT OF CHANGES IN SHAREHOLDERS’ EQUITY
For the year ended 31 December 2019
Annual Report and Financial Statements 2019
Attributable to owners of the Company
Group Issued capital
£000
Share premium
£000
Treasury stock
£000
Merger reserve
£000
Translation reserve
£000
Share based
payment reserve
£000
Retained earnings
£000
Total – Share-
holders’ funds£000
Non-controlling
interests
£000
Total equity
£000
Balance at 1 January 2019 421 8,230 (2,764) 10,343 260 3,475 20,993 40,958 – 40,958
Contributions and distributions
Purchase of own shares – – (203) – – – – (203) – (203)
Issue of shares out of treasury stock – – 2,307 – – – 109 2,416 – 2,416
Dividends paid – – – – – – (1,840) (1,840) – (1,840)
Share based payment charge (Note 23) – – – – – 1,167 – 1,167 – 1,167
Deferred tax on share based payment transactions – – – – – – (25) (25) – (25)
Total contributions and distributions – – 2,104 – – 1,167 (1,756) 1,515 – 1,515
Changes in ownership interests
Acquisition of subsidiary with NCI – – – – – – – – 2,763 2,763
Acquisition of NCI without change in control – – – – – – (3,265) (3,265) (2,601) (5,866)
Total changes in ownership interests – – – – – – (3,265) (3,265) 162 (3,103)
Total transactions with owners – – 2,104 – – 1,167 (5,021) (1,750) 162 (1,588)
Loss for the year (1,669) (1,669) (162) (1,831)
Other comprehensive income:
Fair value loss on interest rate swap – – – – – – (408) (408) – (408)
Exchange differences on translating foreign operations – – – – (939) – – (939) – (939)
Deferred tax on interest rate swap – – – – – – 77 77 – 77
Total comprehensive income for the year – – – – (939) – (2,000) (2,939) (162) (3,101)
Balance at 31 December 2019 421 8,230 (660) 10,343 (679) 4,642 13,972 36,269 – 36,269
The accompanying Notes form an integral part of this Consolidated Statement of Changes in Shareholders’ Equity.

41
FINANCIAL STATEMENTS CONSOLIDATED STATEMENT OF CHANGES IN SHAREHOLDERS’ EQUITY FINANCIAL STATEMENTS COMPANY STATEMENT OF CHANGES IN SHAREHOLDERS’ EQUITY
OV
ER
VIE
WR
EP
OR
T O
F TH
E D
IRE
CT
OR
SS
TR
AT
EG
IC R
EP
OR
TFIN
AN
CIA
L STA
TE
ME
NT
S
For the year ended 31 December 2019
Annual Report and Financial Statements 2019
Company Issued capital
£000
Share premium
£000
Treasury stock
£000
Merger reserve
£000
Share based
payment reserve
£000
Retained earnings
£000
Total Share-
holders’ funds£000
Balance at 1 January 2018 421 8,230 (3,569) 10,343 2,663 22,374 40,462Contributions and distributionsPurchase of own shares – – (190) – – – (190) Issue of shares out of treasury stock – – 995 – – (880) 115Dividends paid – – – – – (1,760) (1,760) Share based payment charge (Note 23) – – – – 812 – 812Deferred tax on share based payment transactions – – – – – 13 13Transactions with owners – – 805 – 812 (2,627) (1,010) Profit and total comprehensive income for the year – – – – – 7,425 7,425Balance at 31 December 2018 421 8,230 (2,764) 10,343 3,475 27,172 46,877Balance at 1 January 2019 421 8,230 (2,764) 10,343 3,475 27,172 46,877Contributions and distributionsPurchase of own shares – – (203) – – – (203) Issue of shares out of treasury stock – – 2,307 – – 109 2,416Dividends paid – – – – – (1,840) (1,840) Share based payment charge (Note 23) – – – – 1,167 – 1,167Deferred tax on share based payment transactions – – – – – (2) (2) Transactions with owners – – 2,104 – 1,167 (1,733) 1,538Profit and total comprehensive income for the year – – – – – 6,587 6,587Balance at 31 December 2019 421 8,230 (660) 10,343 4,642 32,026 55,002
The accompanying Notes form an integral part of this Company Statement of Changes in Shareholders’ Equity.

42
FINANCIAL STATEMENTS CONSOLIDATED AND COMPANY BALANCE SHEET
As at 31 December 2019
Annual Report and Financial Statements 2019
Company Group
Note 2019 £000
2018 £000
2019 £000
2018£000
AssetsNon-current assetsAcquisition related intangible assets 14 – – 13,222 7,495
Goodwill 14 – – 13,808 11,239
Property, plant and equipment 15 165 – 25,870 23,353
Investments 16 47,389 37,046 – –
Derivative financial assets 3 – – – 293
Deferred tax assets 11 25 27 47 16
47,579 37,073 52,947 42,396
Current assetsInventories 17 – – 2,060 –
Trade and other receivables 18 10,483 5,741 10,239 9,717
Current tax asset – – 482 245
Cash and cash equivalents – Client registration funds 19 – – 1,517 1,487
Cash and cash equivalents – Group cash 19 2,744 7,465 13,912 21,520
13,227 13,206 28,210 32,969
Total assets 60,806 50,279 81,157 75,365
LiabilitiesCurrent liabilitiesTrade and other payables 20 5,804 3,402 20,581 17,376
Current tax liabilities – – 226 374
Provisions 21 – – 172 1,038
Borrowings 24 – – 1,200 1,000
Lease liabilities 25 – – 1,212 –
5,804 3,402 23,391 19,788
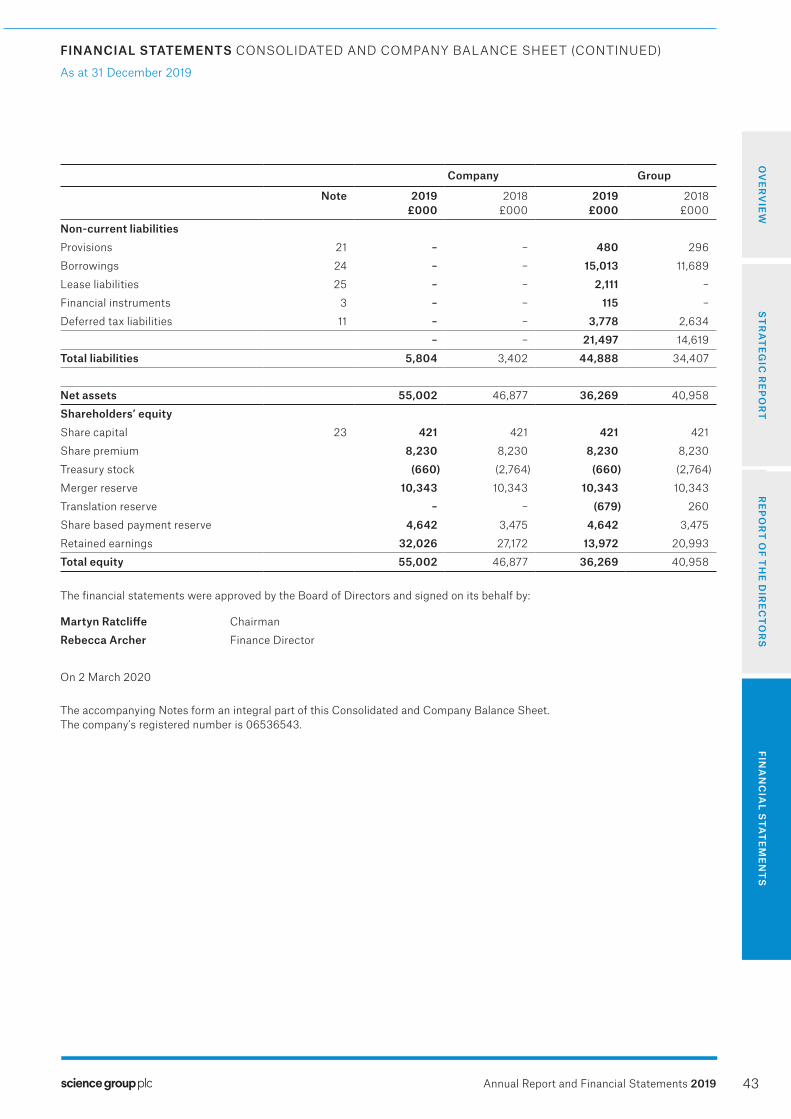
43
FINANCIAL STATEMENTS CONSOLIDATED AND COMPANY BALANCE SHEET FINANCIAL STATEMENTS CONSOLIDATED AND COMPANY BALANCE SHEET (CONTINUED)
OV
ER
VIE
WR
EP
OR
T O
F TH
E D
IRE
CT
OR
SS
TR
AT
EG
IC R
EP
OR
TFIN
AN
CIA
L STA
TE
ME
NT
S
As at 31 December 2019
Annual Report and Financial Statements 2019
Company Group
Note 2019 £000
2018 £000
2019 £000
2018£000
Non-current liabilitiesProvisions 21 – – 480 296
Borrowings 24 – – 15,013 11,689
Lease liabilities 25 – – 2,111 –
Financial instruments 3 – – 115 –
Deferred tax liabilities 11 – – 3,778 2,634
– – 21,497 14,619
Total liabilities 5,804 3,402 44,888 34,407
Net assets 55,002 46,877 36,269 40,958
Shareholders’ equityShare capital 23 421 421 421 421
Share premium 8,230 8,230 8,230 8,230
Treasury stock (660) (2,764) (660) (2,764)
Merger reserve 10,343 10,343 10,343 10,343
Translation reserve – – (679) 260
Share based payment reserve 4,642 3,475 4,642 3,475
Retained earnings 32,026 27,172 13,972 20,993
Total equity 55,002 46,877 36,269 40,958
The financial statements were approved by the Board of Directors and signed on its behalf by:
Martyn Ratcliffe Chairman
Rebecca Archer Finance Director
On 2 March 2020
The accompanying Notes form an integral part of this Consolidated and Company Balance Sheet. The company’s registered number is 06536543.
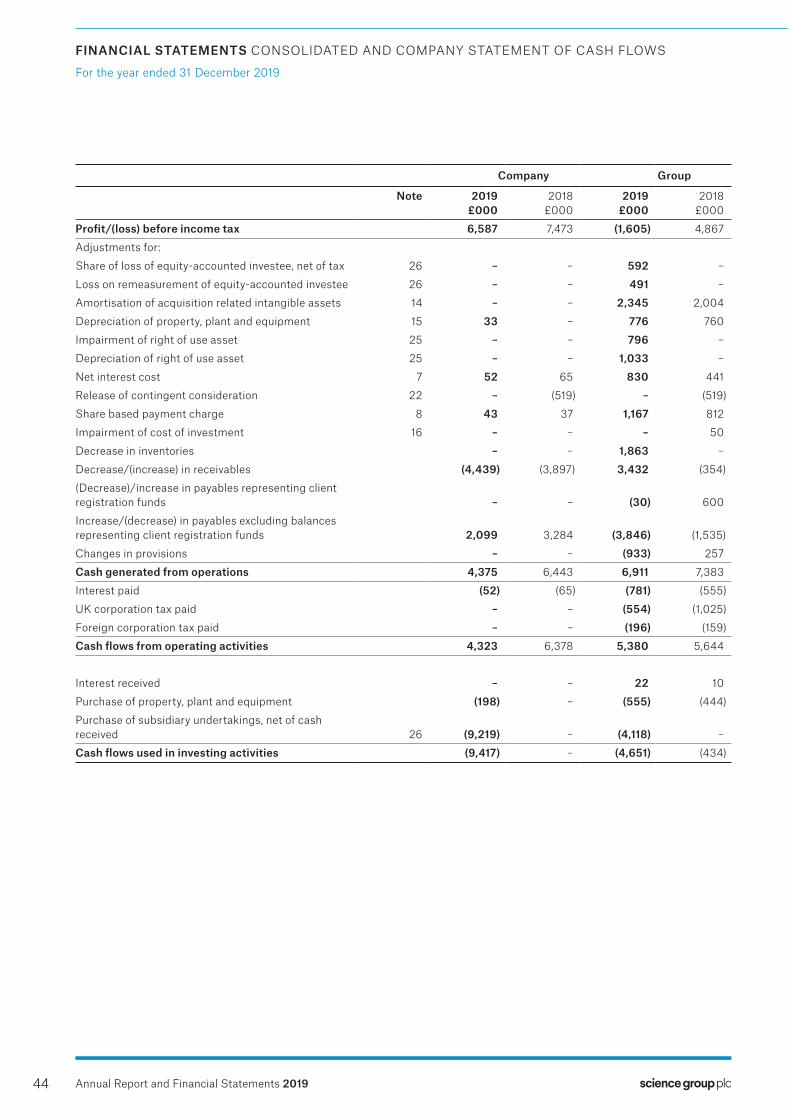
44
FINANCIAL STATEMENTS CONSOLIDATED AND COMPANY STATEMENT OF CASH FLOWS
For the year ended 31 December 2019
Annual Report and Financial Statements 2019
Company Group
Note 2019 £000
2018 £000
2019 £000
2018 £000
Profit/(loss) before income tax 6,587 7,473 (1,605) 4,867
Adjustments for:
Share of loss of equity-accounted investee, net of tax 26 – – 592 –
Loss on remeasurement of equity-accounted investee 26 – – 491 –
Amortisation of acquisition related intangible assets 14 – – 2,345 2,004
Depreciation of property, plant and equipment 15 33 – 776 760
Impairment of right of use asset 25 – – 796 –
Depreciation of right of use asset 25 – – 1,033 –
Net interest cost 7 52 65 830 441
Release of contingent consideration 22 – (519) – (519)
Share based payment charge 8 43 37 1,167 812
Impairment of cost of investment 16 – – – 50
Decrease in inventories – – 1,863 –
Decrease/(increase) in receivables (4,439) (3,897) 3,432 (354)
(Decrease)/increase in payables representing client registration funds – – (30) 600
Increase/(decrease) in payables excluding balances representing client registration funds 2,099 3,284 (3,846) (1,535)
Changes in provisions – – (933) 257
Cash generated from operations 4,375 6,443 6,911 7,383
Interest paid (52) (65) (781) (555)
UK corporation tax paid – – (554) (1,025)
Foreign corporation tax paid – – (196) (159)
Cash flows from operating activities 4,323 6,378 5,380 5,644
Interest received – – 22 10
Purchase of property, plant and equipment (198) – (555) (444)
Purchase of subsidiary undertakings, net of cash received 26 (9,219) – (4,118) –
Cash flows used in investing activities (9,417) – (4,651) (434)

45
FINANCIAL STATEMENTS CONSOLIDATED AND COMPANY STATEMENT OF CASH FLOWS FINANCIAL STATEMENTS CONSOLIDATED AND COMPANY STATEMENT OF CASH FLOWS (CONTINUED)
OV
ER
VIE
WR
EP
OR
T O
F TH
E D
IRE
CT
OR
SS
TR
AT
EG
IC R
EP
OR
TFIN
AN
CIA
L STA
TE
ME
NT
S
For the year ended 31 December 2019
Annual Report and Financial Statements 2019
Company Group
Note 2019 £000
2018 £000
2019 £000
2018 £000
Issue of shares out of treasury 2,416 115 2,416 115
Repurchase of own shares (203) (190) (203) (190)
Dividends paid 13 (1,840) (1,760) (1,840) (1,760)
Acquisition of NCI 26 – – (5,869) –
Proceeds of bank loan received 24 – – 4,750 –
Repayment of term loan 24 – – (1,200) (1,250)
Repayment of revolving credit facility 24 – – (5,000) –
Payment of lease liabilities 25 – – (998) –
Cash flows generated by/(used in) financing activities 373 (1,835) (7,944) (3,085)
(Decrease)/increase in cash and cash equivalents in the year (4,721) 4,543 (7,215) 2,125
Cash and cash equivalents at the beginning of the year 7,465 2,922 23,007 20,780
Exchange (loss)/gains on cash – – (363) 102
Cash and cash equivalents at the end of the year 19 2,744 7,465 15,429 23,007
Cash and cash equivalents is analysed as follows:
Group
2019£000
2018£000
Cash and cash equivalents – Client registration funds (Note 19) 1,517 1,487
Cash and cash equivalents – Group cash 13,912 21,520
15,429 23,007
The accompanying Notes form an integral part of this Consolidated and Company Statement of Cash Flows.
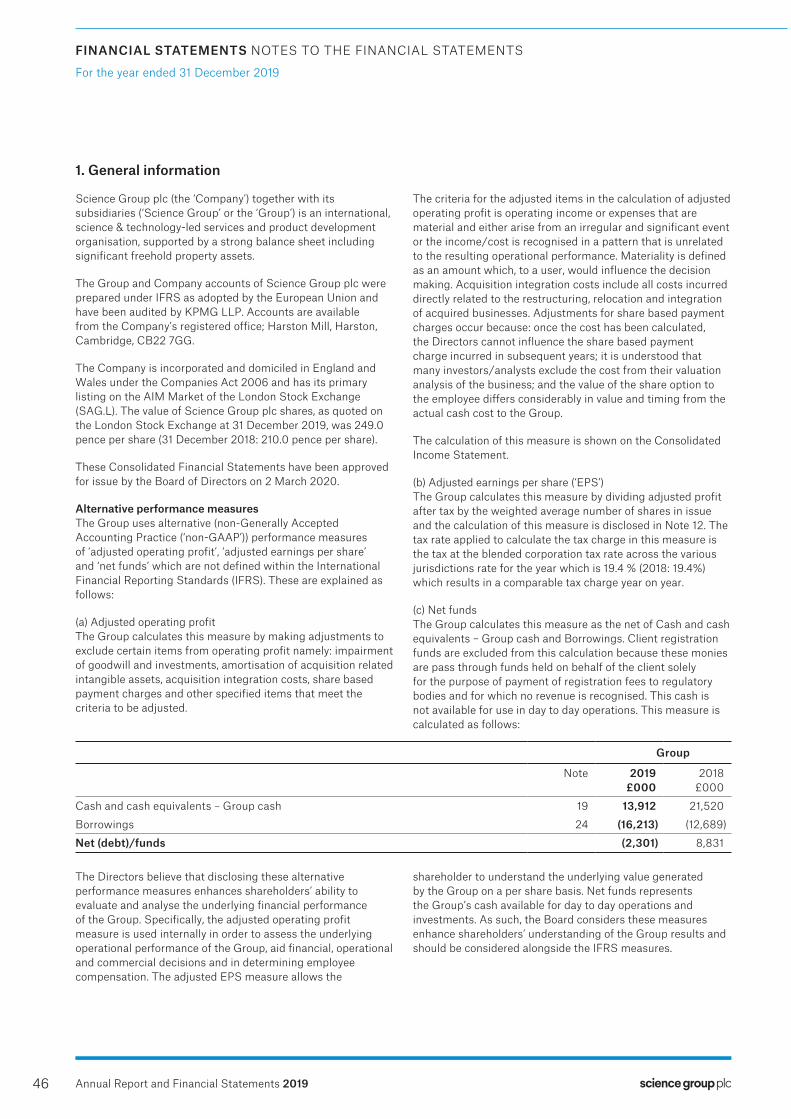
46
FINANCIAL STATEMENTS NOTES TO THE FINANCIAL STATEMENTS
For the year ended 31 December 2019
Annual Report and Financial Statements 2019
1. General information
Science Group plc (the ‘Company’) together with its subsidiaries (‘Science Group’ or the ‘Group’) is an international, science & technology-led services and product development organisation, supported by a strong balance sheet including significant freehold property assets.
The Group and Company accounts of Science Group plc were prepared under IFRS as adopted by the European Union and have been audited by KPMG LLP. Accounts are available from the Company’s registered office; Harston Mill, Harston, Cambridge, CB22 7GG.
The Company is incorporated and domiciled in England and Wales under the Companies Act 2006 and has its primary listing on the AIM Market of the London Stock Exchange (SAG.L). The value of Science Group plc shares, as quoted on the London Stock Exchange at 31 December 2019, was 249.0 pence per share (31 December 2018: 210.0 pence per share).
These Consolidated Financial Statements have been approved for issue by the Board of Directors on 2 March 2020.
Alternative performance measuresThe Group uses alternative (non-Generally Accepted Accounting Practice (‘non-GAAP’)) performance measures of ‘adjusted operating profit’, ‘adjusted earnings per share’ and ‘net funds’ which are not defined within the International Financial Reporting Standards (IFRS). These are explained as follows:
(a) Adjusted operating profitThe Group calculates this measure by making adjustments to exclude certain items from operating profit namely: impairment of goodwill and investments, amortisation of acquisition related intangible assets, acquisition integration costs, share based payment charges and other specified items that meet the criteria to be adjusted.
The criteria for the adjusted items in the calculation of adjusted operating profit is operating income or expenses that are material and either arise from an irregular and significant event or the income/cost is recognised in a pattern that is unrelated to the resulting operational performance. Materiality is defined as an amount which, to a user, would influence the decision making. Acquisition integration costs include all costs incurred directly related to the restructuring, relocation and integration of acquired businesses. Adjustments for share based payment charges occur because: once the cost has been calculated, the Directors cannot influence the share based payment charge incurred in subsequent years; it is understood that many investors/analysts exclude the cost from their valuation analysis of the business; and the value of the share option to the employee differs considerably in value and timing from the actual cash cost to the Group.
The calculation of this measure is shown on the Consolidated Income Statement.
(b) Adjusted earnings per share (‘EPS’)The Group calculates this measure by dividing adjusted profit after tax by the weighted average number of shares in issue and the calculation of this measure is disclosed in Note 12. The tax rate applied to calculate the tax charge in this measure is the tax at the blended corporation tax rate across the various jurisdictions rate for the year which is 19.4 % (2018: 19.4%) which results in a comparable tax charge year on year.
(c) Net fundsThe Group calculates this measure as the net of Cash and cash equivalents – Group cash and Borrowings. Client registration funds are excluded from this calculation because these monies are pass through funds held on behalf of the client solely for the purpose of payment of registration fees to regulatory bodies and for which no revenue is recognised. This cash is not available for use in day to day operations. This measure is calculated as follows:
Group
Note 2019£000
2018£000
Cash and cash equivalents – Group cash 19 13,912 21,520
Borrowings 24 (16,213) (12,689)
Net (debt)/funds (2,301) 8,831
The Directors believe that disclosing these alternative performance measures enhances shareholders’ ability to evaluate and analyse the underlying financial performance of the Group. Specifically, the adjusted operating profit measure is used internally in order to assess the underlying operational performance of the Group, aid financial, operational and commercial decisions and in determining employee compensation. The adjusted EPS measure allows the
shareholder to understand the underlying value generated by the Group on a per share basis. Net funds represents the Group’s cash available for day to day operations and investments. As such, the Board considers these measures enhance shareholders’ understanding of the Group results and should be considered alongside the IFRS measures.
47
FINANCIAL STATEMENTS NOTES TO THE FINANCIAL STATEMENTS FINANCIAL STATEMENTS NOTES TO THE FINANCIAL STATEMENTS
OV
ER
VIE
WR
EP
OR
T O
F TH
E D
IRE
CT
OR
SS
TR
AT
EG
IC R
EP
OR
TFIN
AN
CIA
L STA
TE
ME
NT
S
For the year ended 31 December 2019
Annual Report and Financial Statements 2019
2. Summary of significant accounting policies
The principal accounting policies applied in the preparation of these consolidated financial statements are set out below. These policies have been consistently applied to all of the years presented, unless otherwise stated.
2.1 Basis of preparationThe consolidated and Company financial statements of Science Group have been prepared under the historical cost convention, as modified by the revaluation of certain financial instruments at fair value. The financial statements are in accordance with IFRS as adopted by the EU.
Of the new standards and interpretations effective for the year ended 31 December 2019, there was no impact on the presentation of the financial statements of Science Group other than from IFRS 16. This is the first set of financial statements in which IFRS 16 has been applied. The related changes to accounting policies are described in Note 2.2. The accounting policies have been applied consistently throughout the Group for the purposes of preparation of these consolidated financial statements.
No income statement is presented for the Company as provided by Section 408 of the Companies Act 2006. The Company’s profit for the financial period after tax, determined in accordance with the Act, was £6,587,000 (2018: £7,425,000).
Going concern – the Directors have considered the current cash balance of £13.9m (excluding client registration funds) and assessed forecast future cash flows for the next 12 months. There are no events or conditions which cast significant doubt on the ability of the Group to continue as a going concern. The term loan has no operating covenants while the Group net bank debt is less than £10 million. On the basis of the forecast future cash flows, the Directors do not expect the Group net bank debt to exceed £10 million at any time during the forecast period. The Directors are satisfied that the Group has adequate cash and financing resources to continue in operational existence for the foreseeable future, being a period of at least a year following the approval of the accounts and therefore continue to adopt the going concern basis of accounting in preparing the annual financial statements.
2.2 Changes in accounting policiesThe Group has adopted IFRS16 Leases from 1 January 2019. A number of other new standards are effective from 1 January 2019 but they are not considered to have a material effect on the Group’s financial statements.
IFRS 16 introduced a single on-balance sheet accounting model for lessees. As a result, the Group as a lessee, has recognised right-of-use assets representing its rights to use the underlying assets and lease liabilities representing its obligation to make lease payments. Lessor accounting remains similar to previous accounting policies.
The Group has applied IFRS 16 using the modified retrospective approach, under which the cumulative effect of initial application is recognised in retained earnings at 1 January 2019. Accordingly, the comparative information presented for 2018 has not been restated – i.e. it is presented, as previously reported, under IAS 17 and related interpretations. The new accounting policy is set out in Note 2.21 Leases.
i. TransitionPreviously, the Group classified property leases as operating leases under IAS 17. The leases run for periods between 2 and 10 years, based on the non-cancellable period.
At transition, for leases classified as operating leases under IAS 17, lease liabilities were measured at the present value of the remaining lease payments, discounted at the Group’s incremental borrowing rate as at 1 January 2019. Right-of-use assets are measured at an amount equal to the lease liability, adjusted by the amount of any prepaid or accrued lease payments.
The Group has chosen the practical expedient not to reassess whether contracts at the date of initial application did, or did not, contain a lease.
The Group has elected not to recognise right-of-use assets and lease liabilities for leases of low-value assets and short-term leases, including IT equipment.
The Group used the following practical expedients when applying IFRS 16 to leases previously classified as operating leases under IAS 17.
– Applied a single discount rate to the property leases on the basis that they are leases with reasonably similar characteristics.
– Applied the exemption not to recognise right-of-use assets and liabilities for leases for which the lease term ends within 12 months of date of initial application.
– Excluded initial direct costs from measuring the right-of-use asset at the date of initial application.
ii. As a lessorThe Group lets out space to third party tenants on property leases, of which, the majority are subject to mutual notice periods of up to 6 months. These leases are classified as operating leases.
The accounting policies applicable to the Group as a lessor are not different from those under IAS 17. The Group is not required to make any adjustments on transition to IFRS 16 for leases in which it acts as a lessor.
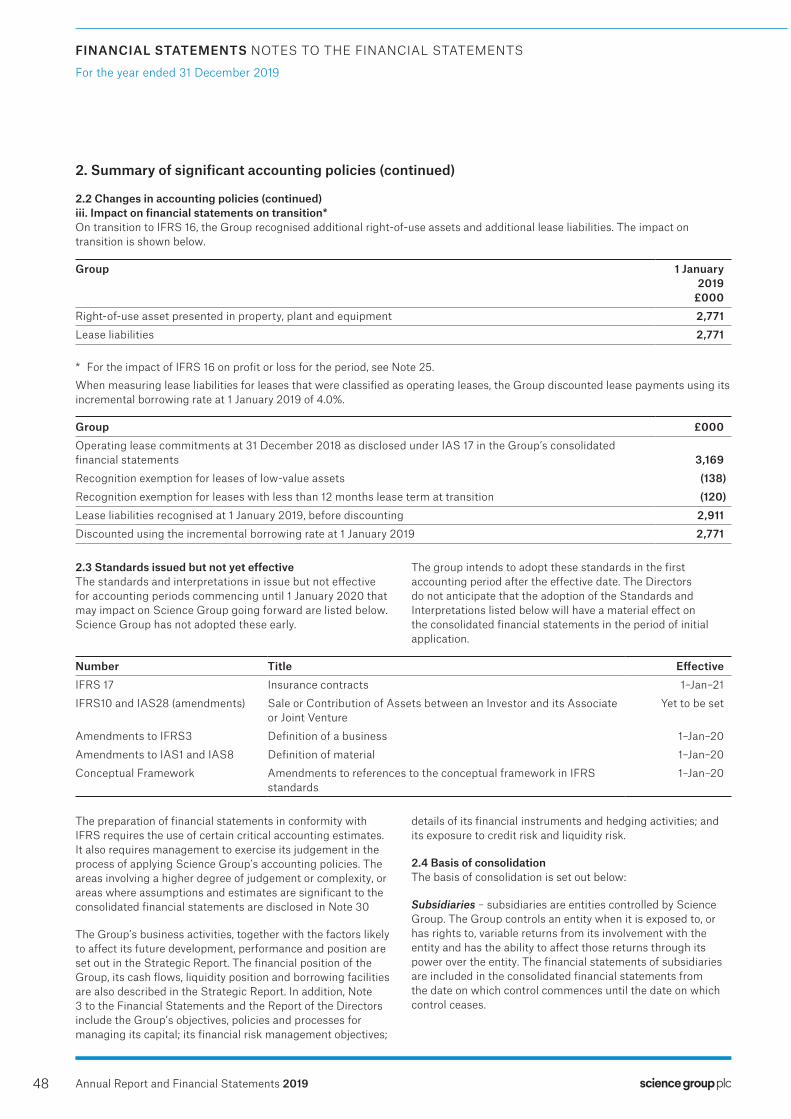
48
FINANCIAL STATEMENTS NOTES TO THE FINANCIAL STATEMENTS
For the year ended 31 December 2019
Annual Report and Financial Statements 2019
2. Summary of significant accounting policies (continued)
2.2 Changes in accounting policies (continued)iii. Impact on financial statements on transition*On transition to IFRS 16, the Group recognised additional right-of-use assets and additional lease liabilities. The impact on transition is shown below.
Group 1 January 2019
£000Right-of-use asset presented in property, plant and equipment 2,771Lease liabilities 2,771
* For the impact of IFRS 16 on profit or loss for the period, see Note 25.When measuring lease liabilities for leases that were classified as operating leases, the Group discounted lease payments using its incremental borrowing rate at 1 January 2019 of 4.0%.
Group £000Operating lease commitments at 31 December 2018 as disclosed under IAS 17 in the Group’s consolidated financial statements 3,169Recognition exemption for leases of low-value assets (138) Recognition exemption for leases with less than 12 months lease term at transition (120) Lease liabilities recognised at 1 January 2019, before discounting 2,911Discounted using the incremental borrowing rate at 1 January 2019 2,771
2.3 Standards issued but not yet effectiveThe standards and interpretations in issue but not effective for accounting periods commencing until 1 January 2020 that may impact on Science Group going forward are listed below. Science Group has not adopted these early.
The group intends to adopt these standards in the first accounting period after the effective date. The Directors do not anticipate that the adoption of the Standards and Interpretations listed below will have a material effect on the consolidated financial statements in the period of initial application.
Number Title EffectiveIFRS 17 Insurance contracts 1–Jan–21
IFRS10 and IAS28 (amendments) Sale or Contribution of Assets between an Investor and its Associate or Joint Venture
Yet to be set
Amendments to IFRS3 Definition of a business 1–Jan–20
Amendments to IAS1 and IAS8 Definition of material 1–Jan–20
Conceptual Framework Amendments to references to the conceptual framework in IFRS standards
1–Jan–20
The preparation of financial statements in conformity with IFRS requires the use of certain critical accounting estimates. It also requires management to exercise its judgement in the process of applying Science Group’s accounting policies. The areas involving a higher degree of judgement or complexity, or areas where assumptions and estimates are significant to the consolidated financial statements are disclosed in Note 30
The Group’s business activities, together with the factors likely to affect its future development, performance and position are set out in the Strategic Report. The financial position of the Group, its cash flows, liquidity position and borrowing facilities are also described in the Strategic Report. In addition, Note 3 to the Financial Statements and the Report of the Directors include the Group’s objectives, policies and processes for managing its capital; its financial risk management objectives;
details of its financial instruments and hedging activities; and its exposure to credit risk and liquidity risk.
2.4 Basis of consolidationThe basis of consolidation is set out below:
Subsidiaries – subsidiaries are entities controlled by Science Group. The Group controls an entity when it is exposed to, or has rights to, variable returns from its involvement with the entity and has the ability to affect those returns through its power over the entity. The financial statements of subsidiaries are included in the consolidated financial statements from the date on which control commences until the date on which control ceases.
49
FINANCIAL STATEMENTS NOTES TO THE FINANCIAL STATEMENTS FINANCIAL STATEMENTS NOTES TO THE FINANCIAL STATEMENTS
OV
ER
VIE
WR
EP
OR
T O
F TH
E D
IRE
CT
OR
SS
TR
AT
EG
IC R
EP
OR
TFIN
AN
CIA
L STA
TE
ME
NT
S
For the year ended 31 December 2019
Annual Report and Financial Statements 2019
2. Summary of significant accounting policies (continued)
2.4 Basis of consolidation (continued) Investment in subsidiaries – in the Company accounts, investments in subsidiaries are stated at cost less any provision for impairment where appropriate.
Business combinations – the acquisition of subsidiaries is accounted for using the acquisition method. The cost of the acquisition is measured at the aggregate of the fair values, at the date of exchange, of assets given and liabilities incurred or assumed in exchange for control. The acquired Company’s identifiable assets, liabilities and contingent liabilities that meet the conditions for recognition under IFRS 3 Business Combinations are recognised at their fair value at the acquisition date. Acquisition expenses are expensed as incurred.
Non-controlling interests – NCI are measured initially at their proportionate share of the acquiree’s identifiable net assets at the date of acquisition. Changes in the Group’s interest in a subsidiary that do not result in a loss of control are accounted for as equity transactions.
Interests in equity-accounted investees – Associates are those entities in which the Group has significant influence, but not control or joint control, over the financial and operating policies. Interests in associates are accounted for using the equity method. They are initially recognised at cost, which includes transaction costs. Subsequent to initial recognition, the consolidated financial statements include the Group’s share of the profit or loss and OCI of equity accounted investees, until the date on which significant influence ceases.
Other investments – investments made in entities over which Science Group is deemed to have no significant influence are stated at cost less any provision for impairment where appropriate. Significant influence is the power to participate in the financial and operating policy decisions of the investee but is not control or joint control over those policies.
2.5 Segment reportingUnder IFRS 8, the accounting policy for identifying segments is based on the internal management reporting information that is regularly reviewed by the chief operating decision makers (CODMs).
Following the Corporate Review in 2018, from 1 January 2019 the Group financial reporting was changed to show the performance of the operating business separately from the value generated by the Group’s significant freehold property assets and the Corporate costs. As a result, the Group results are presented across 4 reporting segments: Services Operating Business, Product Operating Business, Freehold Properties and Corporate. This provides greater transparency and facilitates shareholder analysis of the component parts of the Group and the prior period financial information has been restated to be in line with this new basis.
2.6 Intangible assetsAll intangible assets, except goodwill, are stated at cost less accumulated amortisation and any accumulated impairment losses.
Goodwill – goodwill represents the amount by which the fair value of the cost of a business combination exceeds the fair value of net assets acquired. Goodwill is not amortised and is stated at cost less any accumulated impairment losses.
The recoverable amount of goodwill is tested for impairment annually or when events or changes in circumstance indicate that it might be impaired. Impairment charges are deducted from the carrying value and recognised immediately in profit or loss. For the purpose of impairment testing, goodwill is allocated to each of the Group’s cash generating units expected to benefit from the synergies of the combination. If the recoverable amount of the cash generating unit is less than the carrying amount of the unit, the impairment loss is allocated first to reduce the carrying amount of any goodwill allocated to the unit and then to the other assets of the unit pro-rata on the basis of the carrying amount of each asset in the unit. An impairment loss recognised for goodwill is not reversed in a subsequent period.
Acquisition related intangible assets – net assets acquired as part of a business combination includes an assessment of the fair value of separately identifiable acquisition related intangible assets, in addition to other assets, liabilities and contingent liabilities purchased. These are amortised over their useful lives which are individually assessed. The estimated useful economic life for acquired technology, customer contracts and relationships is between 6 and 12 years. The assets are assessed on an annual basis for impairment and amortised over its remaining economic useful life.
2.7 Research and development expenditureExpenditure on research activities is recognised in profit or loss as incurred.
Development expenditure is capitalised only if the expenditure can be measured reliably, the product or process is technically and commercially feasible, future economic benefits are probable and the Group intends to and has sufficient resources to complete development and to use or sell the asset. Otherwise, it is recognised in profit or loss as incurred. Subsequent to initial recognition, development expenditure is measured at cost less accumulated amortisation and any accumulated impairment losses.

50
FINANCIAL STATEMENTS NOTES TO THE FINANCIAL STATEMENTS
For the year ended 31 December 2019
Annual Report and Financial Statements 2019
2. Summary of significant accounting policies (continued)
2.8 Property, plant and equipmentLand and buildings as shown in the Notes to the Financial Statements comprise offices and laboratories at Harston Mill, Harston, Cambridge, UK and at Great Burgh, Epsom, UK. Land and buildings are shown at historical cost less accumulated depreciation. Historical cost includes expenditure that is directly attributable to the acquisition of the items.
Subsequent costs are included in the asset’s carrying amount or recognised as a separate asset, as appropriate, only when it is probable that the future economic benefit associated with the item will flow to Science Group and the cost of the item can be measured reliably. All other repairs and maintenance are charged to the income statement during the financial period in which they are incurred.
Land is not depreciated. Depreciation on all other property, plant and equipment is calculated using the straight-line method to allocate their cost less their residual values over their estimated useful lives, as follows:
Buildings 25 yearsFurniture and fittings 3-5 yearsEquipment 3 years
The assets’ residual values and useful lives are reviewed, and adjusted if appropriate, at each balance sheet date. An asset’s carrying amount is written down immediately to its recoverable amount, when an indicator of impairment is identified.
Gains and losses on disposals are determined by comparing proceeds with carrying amount. These are included in the income statement.
2.9 Cash and cash equivalentsCash and cash equivalents comprise cash at bank and in hand and on demand deposits, together with short term, liquid investments that are readily convertible to a known amount of cash and that are subject to a minimal risk of changes in value. Cash that is held on behalf of the client that is solely for the purpose of payment of product registration fees to regulatory bodies is separately identified.
2.10 InventoriesInventories are stated at the lower of cost and net realisable value. Costs includes all cost incurred in bringing each product to its present location and condition, which comprises the cost of direct materials and third-party charges. Net realisable value is the estimated selling price in the ordinary course of business less any applicable selling expenses.
2.11 Trade and other receivablesTrade and other receivables are recognised initially at fair value and subsequently measured at amortised cost using the effective interest method, less provision for impairment.
A provision for impairment of trade receivables is established when there is objective evidence that Science Group will not be able to collect all the amounts due according to the original terms of receivables. The amount of the provision is the
difference between the asset’s carrying amount and the present value of estimated future cash flows, discounted at the effective interest rate. The amount of the provision is recognised in the income statement.
2.12 Trade and other payablesTrade and other payables are initially recognised at fair value and subsequently measured at amortised cost using the effective interest method.
2.13 ProvisionsA provision is recognised if, as a result of a past event, the Group has a present legal or constructive obligation that can be estimated reliably, and it is probable that an outflow of economic benefits will be required to settle the obligation.
Provisions are determined by discounting the expected future cash flows at a pre-tax rate that reflects current market assessments of the time value of money and the risks specific to the liability. The unwinding of the discount is recognised as a finance cost.
2.14 BorrowingsBorrowings are recognised initially at fair value, net of transaction costs incurred. Borrowings are subsequently stated at amortised cost; any difference between the proceeds (net of transaction costs) and the redemption value is recognised in the income statement over the period of the borrowings using the effective interest method.
Borrowings are classified as current liabilities unless the Group has an unconditional right to defer settlement of the liability for at least 12 months after the balance sheet date.
2.15 Financial instruments(a) Classification – from 1 January 2018, the Group classifies its financial assets in the following measurement categories:
(i) those to be measured subsequently at fair value (either through other comprehensive income, or through profit or loss), and
(ii) those to be measured at amortised cost.
The classification depends on the Group’s business model for managing the financial assets and the contractual terms of the cash flows.
For assets measured at fair value, gains and losses will either be recorded in profit or loss or other comprehensive income. For investments in debt instruments, this will depend on the business model in which the investment is held. For investments in equity instruments that are not held for trading, this will depend on whether the group has made an irrevocable election at the time of initial recognition to account for the equity investment at fair value through other comprehensive income.
51
FINANCIAL STATEMENTS NOTES TO THE FINANCIAL STATEMENTS FINANCIAL STATEMENTS NOTES TO THE FINANCIAL STATEMENTS
OV
ER
VIE
WR
EP
OR
T O
F TH
E D
IRE
CT
OR
SS
TR
AT
EG
IC R
EP
OR
TFIN
AN
CIA
L STA
TE
ME
NT
S
For the year ended 31 December 2019
Annual Report and Financial Statements 2019
2. Summary of significant accounting policies (continued)
2.15 Financial instruments (continued) (b) Measurement – at initial recognition, the Group measures a financial asset at its fair value plus, in the case of a financial asset not at fair value through profit or loss, transaction costs that are directly attributable to the acquisition of the financial asset. Transaction costs of financial assets carried at fair value through profit or loss are expensed in profit or loss.
Debt instrumentsSubsequent measurement of debt instruments depends on the Group’s business model for managing the asset and the cash flow characteristics of the asset. There are three measurement categories into which the Group classifies its debt instruments:
(i) Amortised cost: Assets that are held for collection of contractual cash flows where those cash flows represent solely payments of principal and interest are measured at amortised cost. A gain or loss on a debt investment that is subsequently measured at amortised cost and is not part of a hedging relationship is recognised in profit or loss when the asset is derecognised or impaired.
(ii) Fair value through other comprehensive income (FVOCI): Assets that are held for collection of contractual cash flows and for selling the financial assets, where the assets’ cash flows represent solely payments of principal and interest, are measured at FVOCI. Movements in the carrying amount are taken through OCI, except for the recognition of impairment gains or losses and interest revenue which are recognised in profit or loss. When the financial asset is derecognised, the cumulative gain or loss previously recognised in OCI is reclassified from equity to profit or loss and recognised in other gains/(losses). Interest income from these financial assets is included in finance income using the effective interest rate method.
(iii) Fair value through profit or loss: Assets that do not meet the criteria for amortised cost or FVOCI are measured at fair value through profit or loss. A gain or loss on a debt investment that is subsequently measured at fair value through profit or loss and is not part of a hedging relationship is recognised in profit or loss and presented net in the statement of profit or loss within other gains/(losses) in the period in which it arises.
Equity instrumentsThe Group subsequently measures all equity investments at fair value. Where the Group’s management has elected to present fair value gains and losses on equity investments in other comprehensive income, there is no subsequent reclassification of fair value gains and losses to profit or loss following the derecognition of the investment. Dividends from such investments continue to be recognised in profit or loss as other income when the Group’s right to receive payments is established.
Changes in the fair value of financial assets at fair value through profit or loss are recognised in other gain/(losses) in the statement of profit or loss as applicable. Impairment losses
(and reversal of impairment losses) on equity investments measured at FVOCI are not reported separately from other changes in fair value
(c) Impairment – the Group assesses on a forward-looking basis the expected credit losses associated with its debt instruments carried at amortised cost and FVOCI. The impairment methodology applied depends on whether there has been a significant increase in credit risk. For trade receivables, the Group applies the simplified approach permitted by IFRS 9, which requires expected lifetime losses to be recognised from initial recognition of the receivables.
The Group recognises loss allowances for expected credit losses (ECLs) on financial assets measured at amortised cost, debt investments measured at FVOCI and contract assets (as defined in IFRS 15).
The Company measures loss allowances at an amount equal to lifetime ECL, except for other debt securities and bank balances for which credit risk (i.e. the risk of default occurring over the expected life of the financial instrument) has not increased significantly since initial recognition, which are measured as 12-month ECL.
Loss allowances for trade receivables and contract assets are always measured at an amount equal to lifetime ECL.
When determining whether the credit risk of a financial asset has increased significantly since initial recognition and when estimating ECL, the Company considers reasonable and supportable information that is relevant and available without undue cost or effort. This includes both quantitative and qualitative information and analysis, based on the Company’s historical experience and informed credit assessment and including forward-looking information.
Measurement of ECLsECLs are a probability-weighted estimate of credit losses. Credit losses are measured as the present value of all cash shortfalls (i.e. the difference between the cash flows due to the entity in accordance with the contract and the cash flows that the company expects to receive). ECLs are discounted at the effective interest rate of the financial asset.
Credit-impaired financial assetsAt each reporting date, the Company assesses whether financial assets carried at amortised cost and debt securities at FVOCI are credit impaired. A financial asset is ‘credit-impaired’ when one or more events that have a detrimental impact on the estimated future cash flows of the financial asset have occurred.
Write-offsThe gross carrying amount of a financial asset is written off (either partially or in full) to the extent that there is no realistic prospect of recovery.

52
FINANCIAL STATEMENTS NOTES TO THE FINANCIAL STATEMENTS
For the year ended 31 December 2019
Annual Report and Financial Statements 2019
2. Summary of significant accounting policies (continued)
2.16 Share capitalOrdinary shares are classified as equity. Incremental costs directly attributable to the issue of new shares or options are shown in equity as a deduction, net of tax, from the proceeds.
Where the Company purchases the Company’s equity share capital into treasury (treasury shares), the consideration paid, including any directly attributable incremental costs (net of income taxes) is deducted from equity attributable to the Company’s equity holders until the shares are cancelled, reissued or disposed of. Where such shares are subsequently sold or reissued, any consideration received, net of any directly attributable incremental transaction costs, and the related income tax effects are included in equity attributable to the Company’s equity holders. Where such shares are subsequently cancelled, the movement is recognised directly in equity with no gain or loss recognised in profit or loss.
2.17 Revenue recognitionThe Services Operating Business segment provides consultancy services to clients across the medical, food & beverage and industrial markets. The Product Operating Business segment sells digital radios to the consumer electronics market.
i) Services revenueRevenue from providing services is recognised in the accounting period in which the services are rendered. The majority of projects are priced on a time and materials basis and the revenue for these projects is recognised based on the actual labour hours spent at the contractual fee rates.
Performance obligations are linked to the reports supplied to the client, where work is billed in an agreed fee rate context, so that clients are able to specifically review work performed.
For the few fixed-price project contracts, revenue is recognised based on the proportion of deliverables provided to the client with an adjustment if the project is forecast to overrun.
Revenue is measured and recognised using the contractual fee rates of the project. Estimates of revenues or extent of progress toward completion are revised if circumstances change. Any resulting increases or decreases in estimated revenues are reflected in profit or loss in the period in which the circumstances that give rise to the revision become known by management.
In the case of both time and materials and fixed-price contracts, the customer pays for the value of services provided based on an invoicing and payment schedule. If the services rendered by the Group at the reporting date exceed the payments received to date, a contract asset is recognised (within trade receivables if the sales invoice has been raised or amounts recoverable on contracts if the services rendered have not been invoiced). If the payments exceed the services rendered, a contract liability is recognised.
In the majority of cases, customers are invoiced on a monthly basis however this varies when appropriate to take into account credit limits, payment terms and operational efficiencies. Consideration is payable when invoiced based on contractual payment terms.
The Group earns revenue from design services on either a fixed cost or time and materials basis. These projects tend to be short term in nature and the revenue is recognised to match the effort expended.
ii) Subscription incomeSubscription income for membership services provided over an annual contractual period is recognised in the income statement on a straight-line basis over the period of the contract.
iii) Product revenueRevenue, excluding sales tax and relevant sales incentives, in respect of the sale of goods is recognised at the point that goods are despatched to customers.
The Group recognises contract liabilities for consideration received in respect of unsatisfied performance obligations and reports these amounts as other liabilities in the statement of financial position. Similarly, if the Group satisfies a performance obligation before it receives the consideration, the Group recognises either a contract asset or receivable in its statement of financial position.
Any sales incentives are recognised as the corresponding sale occurs as a charge against revenue to reflect the overall transaction price of the revenue recorded.
iv) Property rental incomeThe Freehold properties segment includes all third-party revenue generated from a property owned by the Group and this is recognised in the related period on a straight-line basis over the lease term. Lease contractual notice periods are typically shorter than 12 months.
2.18 Foreign currency(a) Functional and presentation currency – items included in the financial statements of each of Science Group’s entities are measured using the currency of the primary economic environment in which the entity operates (‘the functional currency’). The Consolidated Financial Statements are presented in Pound Sterling, which is the Company’s functional and presentation currency.
(b) Transactions and balances – foreign currency transactions are translated into the functional currency using the exchange rates prevailing at the dates of the transactions. Foreign exchange gains and losses resulting from the settlement of such transactions and from the translation at year end exchange rates of monetary assets and liabilities denominated in foreign currencies are recognised in the income statement.

53
FINANCIAL STATEMENTS NOTES TO THE FINANCIAL STATEMENTS FINANCIAL STATEMENTS NOTES TO THE FINANCIAL STATEMENTS
OV
ER
VIE
WR
EP
OR
T O
F TH
E D
IRE
CT
OR
SS
TR
AT
EG
IC R
EP
OR
TFIN
AN
CIA
L STA
TE
ME
NT
S
For the year ended 31 December 2019
Annual Report and Financial Statements 2019
2. Summary of significant accounting policies (continued)
2.18 Foreign currency (continued)(b) Transactions and balances – in respect of translation differences on non-monetary items, items held at cost are translated at the exchange rate at the date of transaction.
(c) Group companies – the results and financial position of all Science Group entities (none of which has the currency of a hyperinflationary economy) that have a functional currency different from the presentation currency are translated into the presentation currency as follows:
(i) assets and liabilities for each balance sheet presented are translated at the closing rate at the date of that balance sheet;
(ii) income and expenses for each income statement are translated at average exchange rates (unless this average is not a reasonable approximation of the cumulative effect of the rates prevailing on the transaction dates, in which case income and expenses are translated at the dates of the transactions);
(iii) all resulting exchange differences are recognised as a separate component of equity; and
(iv) on disposal of a foreign subsidiary the accumulated translation differences recognised in equity are reclassified to profit and loss and recognised as part of the gain or loss on disposal.
2.19 Employee benefits(a) Pension obligations – Group companies operate various pension schemes. The schemes in TSG Iberia, TSG Germany and TSG France are based on government schemes and funded through social security payments. The other schemes are generally funded through payments to insurance companies based on a percentage of salary earned, currently ranging between 5% and 8%. These are defined contribution plans. A defined contribution plan is a pension plan under which the Group pays fixed contributions into publicly or privately administered pension insurance plans. The Group has no legal or constructive obligations to pay further contributions if the fund does not hold sufficient assets to pay all employees the benefits relating to employee service in the current and prior periods.
The contributions are recognised as an employee benefit expense when they are due. Prepaid contributions are recognised as an asset to the extent that a cash refund or a reduction in future payments is available.
Sagentia Inc. and TSG Inc. provide 401(k) pension benefits to employees. The Group has no further payment obligations once the contributions have been paid.
(b) Share based compensation – Science Group operates an equity-settled, share based compensation plan. The fair value of the employee services received in exchange for the grant of the options is recognised as an expense. The total amount to be expensed over the vesting period is determined by reference
to the fair value of the options granted, as calculated by using an appropriate valuation method. The Black-Scholes model excludes the impact of any non-market vesting conditions (for example profitability and sales growth targets). The Monte Carlo and Binomial Option Pricing models build in any market performance conditions. Non-market vesting conditions are included in assumptions about the number of options that are expected to become exercisable. At each balance sheet date, the entity revises its estimates of the number of options that are expected to become exercisable. It recognises the impact of the revision of original estimates, if any, in the income statement, and a corresponding adjustment to equity over the remaining vesting period.
The proceeds received net of any directly attributable transaction costs are credited to share capital (nominal value) and share premium when the options are exercised.
The share based compensation charge in the Company accounts is based only on those option holders employed directly by the Company.
(c) Termination benefits – termination benefits are payable when employment is terminated before the normal retirement date, or whenever an employee accepts voluntary redundancy in exchange for these benefits. Science Group recognises termination benefits when it is demonstrably committed to either: terminating the employment of current employees according to a detailed formal plan without possibility of withdrawal; or providing termination benefits as a result of an offer made to encourage voluntary redundancy. Benefits falling due more than 12 months after balance sheet date are discounted to present value.
(d) Profit-sharing and bonus plans – Science Group recognises a liability and an expense for bonuses and/or profit-sharing, based on the incentive plans approved by the Remuneration Committee. Science Group recognises a liability where contractually obliged or where there is a past practice that has created a constructive obligation.
(e) Sales commission – Science Group operates a sales commission scheme for relevant sales staff. A liability and expense is recognised based on sales made by employees who are eligible for the scheme, and is calculated using the commission scheme rules. Sales commission is typically paid quarterly.
2.20 TaxationThe tax expense for the period comprises current and deferred tax. Tax is recognised in the income statement, except to the extent that it relates to items recognised in other comprehensive income, or directly in equity. In this case, the tax is also recognised in other comprehensive income or directly in equity, respectively.
Income tax is provided at amounts expected to be paid (or recovered) using the tax rates and laws of the relevant countries that have been enacted or substantively enacted by the balance sheet date.
54
FINANCIAL STATEMENTS NOTES TO THE FINANCIAL STATEMENTS
For the year ended 31 December 2019
Annual Report and Financial Statements 2019
2. Summary of significant accounting policies (continued)
2.20 Taxation (continued)Deferred income tax is provided, using the liability method, on temporary differences arising between the tax bases of assets and liabilities and their carrying amounts in the consolidated financial statements. However, if the deferred income tax arises from goodwill, the initial recognition of an asset or liability in a transaction other than a business combination that at the time of the transaction affects neither accounting nor taxable profit nor loss, it is not accounted for. Deferred income tax is determined using tax rates (and laws) that have been enacted or substantively enacted by the balance sheet date and are expected to apply when the related deferred income tax asset is realised or the deferred income tax liability is settled.
Deferred income tax assets are recognised to the extent that it is probable that future taxable profit will be available against which the temporary differences can be utilised.
Deferred income tax is provided on temporary differences arising on investments in subsidiaries, except where the timing of the reversal of the temporary difference is controlled by Science Group and it is probable that the temporary difference will not reverse in the foreseeable future.
2.21 LeasesThe Group has applied IFRS 16 using the modified retrospective approach and therefore the comparative information has not been restated and continues to be reported under IAS 17 and IFRIC 4. The details of accounting policies under IAS 17 and IFRIC 4 are disclosed separately.
Policy applicable from 1 January 2019At inception of a contract, the Group assesses whether a contract is, or contains, a lease. A contract is, or contains, a lease if the contract conveys the right to control the use of an identified asset for a period of time in exchange for consideration. To assess whether a contract conveys the right to control the use of an identified asset, the Group uses the definition of a lease in IFRS 16.
This policy is applied to contracts entered into, on or after 1 January 2019.
i. As a lesseeAt commencement or on modification of a contract that contains a lease component, the Group allocates the consideration in the contract to each lease component on the basis of its relative stand-alone prices. However, for the leases of property the Group has elected not to separate non-lease components and account for the lease and non-lease components as a single lease component.
The Group recognises a right-of-use asset and a lease liability at the lease commencement date. The right-of-use asset is initially measured at cost, which comprises the initial amount of the lease liability adjusted for any lease payments made at or before the commencement date, plus any initial direct costs incurred and an estimate of costs to dismantle and remove the
underlying asset or to restore the underlying asset or the site on which it is located, less any lease incentives received.
The right-of-use asset is subsequently depreciated using the straight-line method from the commencement date to the end of the lease term, unless the lease transfers ownership of the underlying asset to the Group by the end of the lease term or the cost of the right-of-use asset reflects that the Group will exercise a purchase option. In that case the right-of-use asset will be depreciated over the useful life of the underlying asset, which is determined on the same basis as those of property and equipment. In addition, the right-of-use asset is periodically reduced by impairment losses, if any, and adjusted for certain remeasurements of the lease liability.
The lease liability is initially measured at the present value of the lease payments that are not paid at the commencement date, discounted using the interest rate implicit in the lease or, if that rate cannot be readily determined, the Group’s incremental borrowing rate. Generally, the Group uses its incremental borrowing rate as the discount rate.
The Group determines its incremental borrowing rate by obtaining interest rates from various external financing sources and makes certain adjustments to reflect the terms of the lease and type of the asset leased.
Lease payments included in the measurement of the lease liability comprise the following:
– fixed payments, including in-substance fixed payments;
– variable lease payments that depend on an index or a rate, initially measured using the index or rate as at the commencement date;
– amounts expected to be payable under a residual value guarantee; and
– the exercise price under a purchase option that the Group is reasonably certain to exercise,
lease payments in an optional renewal period if the Group is reasonably certain to exercise an extension option, and penalties for early termination of a lease unless the Group is reasonably certain not to terminate early.
The lease liability is measured at amortised cost using the effective interest method. It is remeasured when there is a change in future lease payments arising from a change in an index or rate, if there is a change in the Group’s estimate of the amount expected to be payable under a residual value guarantee, if the Group changes its assessment of whether it will exercise a purchase, extension or termination option or if there is a revised in-substance fixed lease payment.

55
FINANCIAL STATEMENTS NOTES TO THE FINANCIAL STATEMENTS FINANCIAL STATEMENTS NOTES TO THE FINANCIAL STATEMENTS
OV
ER
VIE
WR
EP
OR
T O
F TH
E D
IRE
CT
OR
SS
TR
AT
EG
IC R
EP
OR
TFIN
AN
CIA
L STA
TE
ME
NT
S
For the year ended 31 December 2019
Annual Report and Financial Statements 2019
2. Summary of significant accounting policies (continued)
2.21 Leases (continued)i. As a lessee (continued)When the lease liability is remeasured in this way, a corresponding adjustment is made to the carrying amount of the right-of-use asset or is recorded in profit or loss if the carrying amount of the right-of-use asset has been reduced to zero.
The Group presents right-of-use assets that do not meet the definition of investment property in ‘property, plant and equipment’ and lease liabilities in ‘loans and borrowings’ in the statement of financial position.
Short-term leases and leases of low-value assetsThe Group has elected not to recognise right-of-use assets and lease liabilities for leases of low-value assets and short-term leases, including IT equipment. The Group recognises the lease payments associated with these leases as an expense on a straight-line basis over the lease term.
ii. As a lessorAt inception or on modification of a contract that contains a lease component, the Group allocates the consideration in the contract to each lease component on the basis of their relative standalone prices.
When the Group acts as a lessor, it determines at lease inception whether each lease is a finance lease or an operating lease. To classify each lease, the Group makes an overall assessment of whether the lease transfers substantially all of the risks and rewards incidental to ownership of the underlying asset. If this is the case, then the lease is a finance lease; if not, then it is an operating lease. As part of this assessment, the Group considers certain indicators such as whether the lease is for the major part of the economic life of the asset.
When the Group is an intermediate lessor, it accounts for its interests in the head lease and the sub-lease separately. It assesses the lease classification of a sub-lease with reference to the right-of-use asset arising from the head lease, not with reference to the underlying asset. If a head lease is a short-term lease to which the Group applies the exemption described above, then it classifies the sub-lease as an operating lease.
If an arrangement contains lease and non-lease components, then the Group applies IFRS 15 to allocate the consideration in the contract.
The Group applies the derecognition and impairment requirements in IFRS 9 to the net investment in the lease (see Note 45(R)(i)). The Group further regularly reviews estimated unguaranteed residual values used in calculating the gross investment in the lease.
The Group recognises lease payments received under operating leases as income on a straight-line basis over the lease term as part of ‘other revenue’.
Generally, the accounting policies applicable to the Group as a lessor in the comparative period were not different from IFRS 16 except for the classification of the sub-lease entered into during current reporting period that resulted in a finance lease classification.
Policy applicable before 1 January 2019In accordance with IAS 17, the economic ownership of a leased asset is transferred to the lessee if the lessee bears substantially all the risks and rewards related to the ownership of the leased asset. The related asset is recognised at the time of inception of the lease at the fair value of the leased asset or, if lower, the present value of the minimum lease payments plus incidental payments, if any, to be borne by the lessee. A corresponding amount is recognised as a finance leasing liability. Leases of land and buildings are split into land and buildings elements according to the relative fair values of the leasehold interests at the date the asset is initially recognised.
The interest element of leasing payments represents a constant proportion of the capital balance outstanding and is charged to the income statement over the period of the lease.
All other leases are treated as operating leases and are charged on a straight-line basis over the lease term, even if payments are not made on such a basis. Income from property leases is recognised in the related period on a straight-line basis over the lease term. The majority of property leases are subject to mutual notice periods of up to 6 months.
2.22 Dividends paidDividends are recognised as a liability in the period in which the shareholders’ right to receive payment has been established.
2.23 Dividend incomeDividend income is recognised when the Company’s right to receive payment is established.

56
FINANCIAL STATEMENTS NOTES TO THE FINANCIAL STATEMENTS
For the year ended 31 December 2019
Annual Report and Financial Statements 2019
3. Financial risk management
3.1 Financial risk factorsScience Group’s activities expose it to a variety of financial risks: market risk (including currency risk and fair value interest risk), credit risk, liquidity risk and cash flow interest rate risk. Science Group’s overall financial risk management programme focuses on the unpredictability of financial markets and seeks to minimise potential adverse effects on Science Group’s financial performance. Science Group uses derivative financial instruments to hedge certain risk exposures.
(a) Foreign currency sensitivityScience Group operates internationally and is exposed to foreign exchange risk arising from various currency exposures, primarily with respect to the US Dollar and Euro. Foreign exchange risk arises from commercial transactions, recognised assets and liabilities.
To manage the Group’s foreign exchange risk arising from commercial transactions, recognised assets and liabilities, entities in Science Group may use forward contracts and other instruments. Foreign exchange risk arises when commercial transactions and recognised assets and liabilities are denominated in a currency that is not the entity’s functional currency. The Group finance function is responsible for managing the net position in each foreign currency primarily by selling monies held in currency into GBP on a regular basis. At present, forward exchange contracts are not used.
Science Group has certain investments in foreign operations, whose net assets are exposed to foreign currency translation risk. Foreign currency denominated financial assets and liabilities, translated into GBP at the closing rate, are as follows:
2019£000
US$ Euro Other Total
Financial assets 13,515 1,176 674 15,365
Financial liabilities (5,115) (165) (41) (5,321)
Exposure 8,400 1,011 633 10,044
2018£000
US$ Euro Other Total
Financial assets 7,184 1,289 38 8,511
Financial liabilities (2,283) (379) (17) (2,679)
Exposure 4,901 910 21 5,832
All foreign currency denominated financial assets and liabilities are classified as current.
The following table illustrates the sensitivity of the net movement on reserves and equity in regards to Science Group’s financial assets and financial liabilities and the US Dollar/GBP exchange rate and Euro/GBP exchange rate. It assumes a +/- 10% change of the GBP/US Dollar exchange rate as at 31 December 2019 (2018: 10.0%). A +/- 10% change is considered for the GBP/Euro exchange rate (2018: 10.0%).
If the GBP had strengthened against the US Dollar and Euro by 10% (2018: 10.0%) respectively then this would have had the following impact:
2019£000
US$ Euro Other Total
Income statement (331) (94) – (425)
Equity (570) (47) (32) (649)
2018£000
US$ Euro Other Total
Income statement (194) (84) – (278)
Equity 93 (169) (27) (103)
For a 10.0% weakening of GBP against the relevant currency, there would be a comparable but opposite impact on the income statement and equity.

57
FINANCIAL STATEMENTS NOTES TO THE FINANCIAL STATEMENTS FINANCIAL STATEMENTS NOTES TO THE FINANCIAL STATEMENTS
OV
ER
VIE
WR
EP
OR
T O
F TH
E D
IRE
CT
OR
SS
TR
AT
EG
IC R
EP
OR
TFIN
AN
CIA
L STA
TE
ME
NT
S
For the year ended 31 December 2019
Annual Report and Financial Statements 2019
3. Financial risk management (continued)
3.1 Financial risk factors (continued)(a) Foreign currency sensitivity (continued)The Company held no financial assets or liabilities in foreign currencies at the start or end of the year.
The actual currency rate movement against the US Dollar and Euro at year end compared to the previous year end was +4.0% (2018: -5.8%) and +6.1% (2018: -1.0%) respectively. Exposures to foreign exchange rates vary during the year depending on the volume and value of overseas transactions.
(b) Interest rate sensitivityScience Group manages its longer-term cash flow interest rate risk by using floating-to-fixed interest rate swaps. Such interest rate swaps have the economic effect of converting borrowings from floating rates to fixed rates. Generally, Science Group raises long term borrowings at floating rates and swaps them into fixed rates that are lower than those available if Science Group borrowed at fixed rates directly. Under the interest rate swaps, Science Group agrees with other parties to exchange, at specified intervals (typically quarterly), the difference between fixed contract rates and floating rate interest amounts calculated by reference to the agreed notional principal amounts.
Science Group’s bank borrowings and its interest rate profile are as follows:
Group 2019£000
2018£000
Pound Sterling – bank loan 16,300 12,750
Weighted average interest ratePound Sterling – fixed rate bank loan 3.64% 3.47%
Pound Sterling – floating rate bank loan LIBOR+2.6% LIBOR+2.6%
For benchmark rates of interest, Science Group refers to LIBOR. The bank loan is secured via a fixed charge over certain assets of Science Group and is repayable as disclosed in Note 24. Terms and conditions of the interest rate swap are as disclosed in Note 24.
In February 2019, the Group increased the bank loan to £17.5 million. The equivalent fixed rate on the extended sum is 4.0%.
(c) Credit risk analysisScience Group has policies in place to ensure that sales are made to clients with an appropriate credit history. Derivative counterparties and cash transactions are limited to high-credit-quality financial institutions although counterparty risk is not negligible. Science Group has policies that limit the amount of credit exposure to any financial institution.
Science Group’s exposure to credit risk is limited to the carrying amount of financial assets recognised at the balance sheet date, as summarised below:
Company Group
2019£000
2018 £000
2019£000
2018 £000
Cash and cash equivalents – Group cash 2,744 7,465 13,912 21,520
Cash and cash equivalents – Client registration funds – – 1,517 1,487
Trade and other receivables 10,107 5,726 8,950 8,864
12,851 13,191 24,379 31,871
Science Group monitors defaults of customers and other counterparties, identified either individually or by group and incorporates this information into its credit risk controls. Where available at reasonable cost, external credit ratings and/or reports on customers and other counterparties are obtained and used. Science Group’s policy is to deal only with creditworthy counterparties or to require settlement in advance, although there can be no certainty that counterparty creditworthiness will be maintained. Cash balances are held with more than one creditworthy institution.
Management reviews the credit status of the financial institutions with whom it holds its deposits.
Science Group’s management considers that all the above financial assets that are not impaired for each of the reporting dates under review are of good credit quality, including those that are past due.
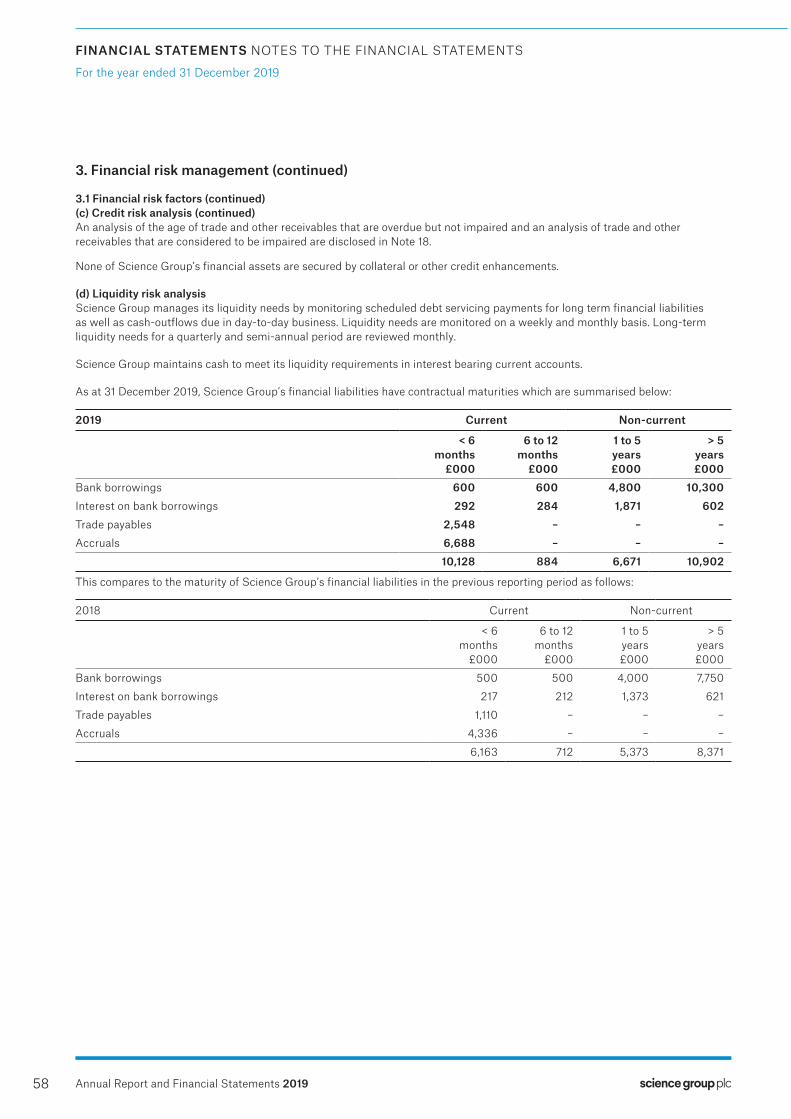
58
FINANCIAL STATEMENTS NOTES TO THE FINANCIAL STATEMENTS
For the year ended 31 December 2019
Annual Report and Financial Statements 2019
3. Financial risk management (continued)
3.1 Financial risk factors (continued)(c) Credit risk analysis (continued)An analysis of the age of trade and other receivables that are overdue but not impaired and an analysis of trade and other receivables that are considered to be impaired are disclosed in Note 18.
None of Science Group’s financial assets are secured by collateral or other credit enhancements.
(d) Liquidity risk analysisScience Group manages its liquidity needs by monitoring scheduled debt servicing payments for long term financial liabilities as well as cash-outflows due in day-to-day business. Liquidity needs are monitored on a weekly and monthly basis. Long-term liquidity needs for a quarterly and semi-annual period are reviewed monthly.
Science Group maintains cash to meet its liquidity requirements in interest bearing current accounts.
As at 31 December 2019, Science Group’s financial liabilities have contractual maturities which are summarised below:
2019 Current Non-current
< 6months
£000
6 to 12months
£000
1 to 5years£000
> 5years£000
Bank borrowings 600 600 4,800 10,300Interest on bank borrowings 292 284 1,871 602Trade payables 2,548 – – –Accruals 6,688 – – –
10,128 884 6,671 10,902
This compares to the maturity of Science Group’s financial liabilities in the previous reporting period as follows:
2018 Current Non-current
< 6months
£000
6 to 12months
£000
1 to 5years£000
> 5years£000
Bank borrowings 500 500 4,000 7,750
Interest on bank borrowings 217 212 1,373 621
Trade payables 1,110 – – –
Accruals 4,336 – – –
6,163 712 5,373 8,371
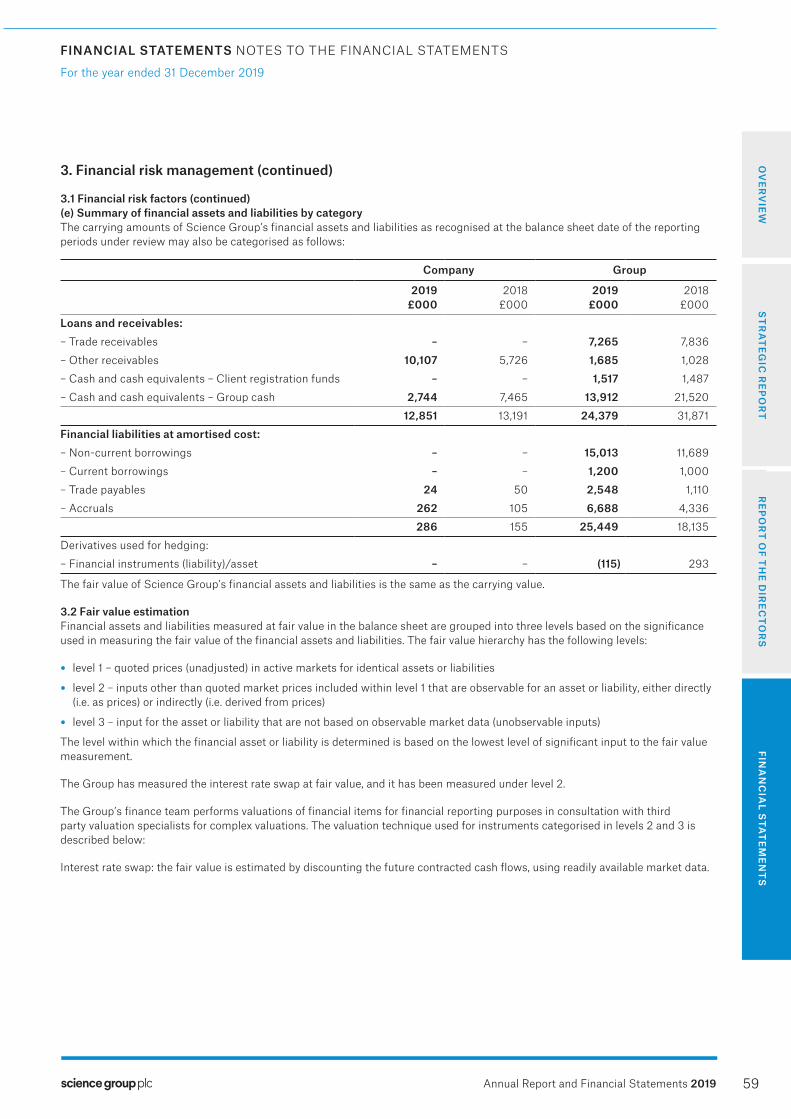
59
FINANCIAL STATEMENTS NOTES TO THE FINANCIAL STATEMENTS FINANCIAL STATEMENTS NOTES TO THE FINANCIAL STATEMENTS
OV
ER
VIE
WR
EP
OR
T O
F TH
E D
IRE
CT
OR
SS
TR
AT
EG
IC R
EP
OR
TFIN
AN
CIA
L STA
TE
ME
NT
S
For the year ended 31 December 2019
Annual Report and Financial Statements 2019
3. Financial risk management (continued)
3.1 Financial risk factors (continued)(e) Summary of financial assets and liabilities by categoryThe carrying amounts of Science Group’s financial assets and liabilities as recognised at the balance sheet date of the reporting periods under review may also be categorised as follows:
Company Group
2019£000
2018£000
2019£000
2018£000
Loans and receivables: – Trade receivables – – 7,265 7,836
– Other receivables 10,107 5,726 1,685 1,028
– Cash and cash equivalents – Client registration funds – – 1,517 1,487
– Cash and cash equivalents – Group cash 2,744 7,465 13,912 21,520
12,851 13,191 24,379 31,871
Financial liabilities at amortised cost:– Non-current borrowings – – 15,013 11,689
– Current borrowings – – 1,200 1,000
– Trade payables 24 50 2,548 1,110
– Accruals 262 105 6,688 4,336
286 155 25,449 18,135
Derivatives used for hedging:
– Financial instruments (liability)/asset – – (115) 293
The fair value of Science Group’s financial assets and liabilities is the same as the carrying value.
3.2 Fair value estimationFinancial assets and liabilities measured at fair value in the balance sheet are grouped into three levels based on the significance used in measuring the fair value of the financial assets and liabilities. The fair value hierarchy has the following levels:
• level 1 – quoted prices (unadjusted) in active markets for identical assets or liabilities
• level 2 – inputs other than quoted market prices included within level 1 that are observable for an asset or liability, either directly (i.e. as prices) or indirectly (i.e. derived from prices)
• level 3 – input for the asset or liability that are not based on observable market data (unobservable inputs)
The level within which the financial asset or liability is determined is based on the lowest level of significant input to the fair value measurement.
The Group has measured the interest rate swap at fair value, and it has been measured under level 2.
The Group’s finance team performs valuations of financial items for financial reporting purposes in consultation with third party valuation specialists for complex valuations. The valuation technique used for instruments categorised in levels 2 and 3 is described below:
Interest rate swap: the fair value is estimated by discounting the future contracted cash flows, using readily available market data.
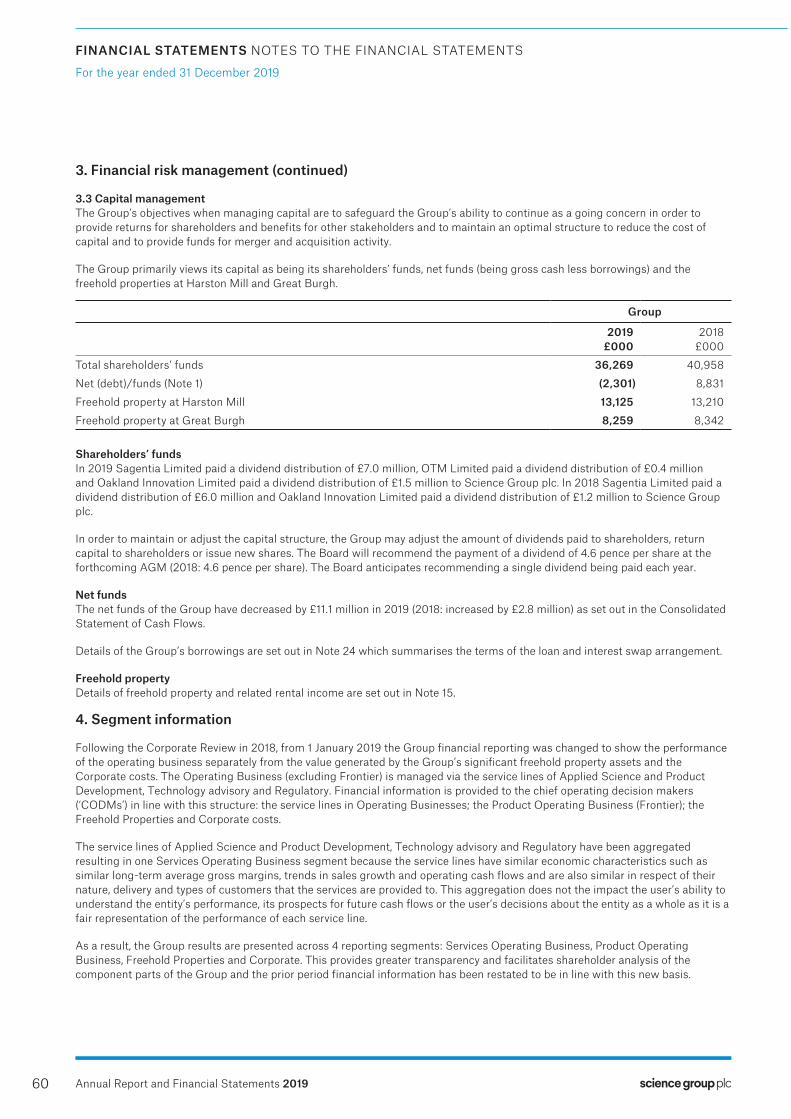
60
FINANCIAL STATEMENTS NOTES TO THE FINANCIAL STATEMENTS
For the year ended 31 December 2019
Annual Report and Financial Statements 2019
3. Financial risk management (continued)
3.3 Capital managementThe Group’s objectives when managing capital are to safeguard the Group’s ability to continue as a going concern in order to provide returns for shareholders and benefits for other stakeholders and to maintain an optimal structure to reduce the cost of capital and to provide funds for merger and acquisition activity.
The Group primarily views its capital as being its shareholders’ funds, net funds (being gross cash less borrowings) and the freehold properties at Harston Mill and Great Burgh.
Group
2019£000
2018£000
Total shareholders’ funds 36,269 40,958
Net (debt)/funds (Note 1) (2,301) 8,831
Freehold property at Harston Mill 13,125 13,210
Freehold property at Great Burgh 8,259 8,342
Shareholders’ fundsIn 2019 Sagentia Limited paid a dividend distribution of £7.0 million, OTM Limited paid a dividend distribution of £0.4 million and Oakland Innovation Limited paid a dividend distribution of £1.5 million to Science Group plc. In 2018 Sagentia Limited paid a dividend distribution of £6.0 million and Oakland Innovation Limited paid a dividend distribution of £1.2 million to Science Group plc.
In order to maintain or adjust the capital structure, the Group may adjust the amount of dividends paid to shareholders, return capital to shareholders or issue new shares. The Board will recommend the payment of a dividend of 4.6 pence per share at the forthcoming AGM (2018: 4.6 pence per share). The Board anticipates recommending a single dividend being paid each year.
Net fundsThe net funds of the Group have decreased by £11.1 million in 2019 (2018: increased by £2.8 million) as set out in the Consolidated Statement of Cash Flows.
Details of the Group’s borrowings are set out in Note 24 which summarises the terms of the loan and interest swap arrangement.
Freehold propertyDetails of freehold property and related rental income are set out in Note 15.
4. Segment information
Following the Corporate Review in 2018, from 1 January 2019 the Group financial reporting was changed to show the performance of the operating business separately from the value generated by the Group’s significant freehold property assets and the Corporate costs. The Operating Business (excluding Frontier) is managed via the service lines of Applied Science and Product Development, Technology advisory and Regulatory. Financial information is provided to the chief operating decision makers (‘CODMs’) in line with this structure: the service lines in Operating Businesses; the Product Operating Business (Frontier); the Freehold Properties and Corporate costs.
The service lines of Applied Science and Product Development, Technology advisory and Regulatory have been aggregated resulting in one Services Operating Business segment because the service lines have similar economic characteristics such as similar long-term average gross margins, trends in sales growth and operating cash flows and are also similar in respect of their nature, delivery and types of customers that the services are provided to. This aggregation does not the impact the user’s ability to understand the entity’s performance, its prospects for future cash flows or the user’s decisions about the entity as a whole as it is a fair representation of the performance of each service line.
As a result, the Group results are presented across 4 reporting segments: Services Operating Business, Product Operating Business, Freehold Properties and Corporate. This provides greater transparency and facilitates shareholder analysis of the component parts of the Group and the prior period financial information has been restated to be in line with this new basis.

61
FINANCIAL STATEMENTS NOTES TO THE FINANCIAL STATEMENTS FINANCIAL STATEMENTS NOTES TO THE FINANCIAL STATEMENTS
OV
ER
VIE
WR
EP
OR
T O
F TH
E D
IRE
CT
OR
SS
TR
AT
EG
IC R
EP
OR
TFIN
AN
CIA
L STA
TE
ME
NT
S
For the year ended 31 December 2019
Annual Report and Financial Statements 2019
4. Segment information (continued)
Services Operating Business revenue includes all consultancy fees and other revenue includes recharged materials, expenses and licence revenue generated directly from the Services Operating Business activities. Product Operating Business revenue includes sales of chips and modules which are incorporated into digital radios. The Freehold Properties segment includes the results for the two freehold properties owned by the Group. Income is derived from third party tenants from the Harston Mill site and from the Services and Product Operating Businesses which have been charged fees equivalent to market-based rents for their utilised property space and associated costs. Corporate costs include PLC/Group costs.
The segmental analysis is reviewed to operating profit. Other resources are shared across the Group.
The Group closed the Central/Eastern Europe offices during 2018 and the results generated by these offices are separately reported under exited operations in 2018 on a pro forma basis.
Services Operating Business 2019Total
£000
2018Continuing
£000
2018Exited£000
2018Total
£000
Services revenue 46,885 46,085 413 46,498
Other 1,825 1,110 – 1,110
Revenue 48,710 47,195 413 47,608
Adjusted operating profit 8,221 7,564 168 7,732Gain on settlement of legal claim 687 – – –
Amortisation of acquisition related intangible assets (2,006) (2,004) – (2,004)
Acquisition integration costs – (76) – (76)
Release of contingent consideration – 519 – 519
Impairment of other investments – (50) – (50)
Share based payment charge (1,008) (695) – (695)
Operating profit 5,894 5,258 168 5,426
Product Operating Business 2019£000
2018£000
Product revenue 7,540 –
Revenue 7,540 –
Adjusted operating loss (1,283) –Amortisation of acquisition related intangible assets (339) –
Professional fees and charges in relation to the acquisition (1,672) –
Acquisition integration costs (794) –
Provisions relating to onerous leases and impairment of right of use assets (1,105) –
Loss on remeasurement of equity-accounted investee (491) –
Share based payment charge (12) –
Operating loss (5,696) –

62
FINANCIAL STATEMENTS NOTES TO THE FINANCIAL STATEMENTS
For the year ended 31 December 2019
Annual Report and Financial Statements 2019
4. Segment information (continued)
Freehold Properties 2019£000
2018£000
Inter-company property income 2,874 2,858
Third party property income 997 1,062
Revenue 3,871 3,920
Adjusted operating profit 1,503 1,573Share based payment charge (14) (12)
Operating profit 1,489 1,561
Corporate 2019£000
2018£000
Adjusted operating loss (1,737) (1,574) Share based payment charge (133) (105)
Operating loss (1,870) (1,679)
Group 2019 Organic
£000
2019 Acquired
£000
2019Total
£000
2018 Continuing
£000
2018Exited£000
2018Total
£000
Services revenue 46,885 – 46,885 46,085 413 46,498
Products revenue – 7,540 7,540 – – –
Third party property income 997 – 997 1,062 – 1,062
Other 1,825 – 1,825 1,110 – 1,110
Revenue 49,707 7,540 57,247 48,257 413 48,670
Adjusted operating profit/(loss) 7,987 (1,283) 6,704 7,563 168 7,731Gain on settlement of legal claim 687 – 687 – – –
Amortisation of acquisition related intangible assets (2,006) (339) (2,345) (2,004) – (2,004)
Professional fees and charges in relation to the acquisition – (1,672) (1,672) – – –
Acquisition integration costs – (794) (794) (76) – (76)
Provisions relating to onerous leases and impairment of right of use assets – (1,105) (1,105) – – –
Release of contingent consideration – – – 519 – 519
Impairment of other investments – – – (50) – (50)
Loss on remeasurement of equity-accounted investee – (491) (491) – – –
Share based payment charge (1,155) (12) (1,167) (812) – (812)
Operating profit/(loss) 5,513 (5,696) (183) 5,140 168 5,308Finance charges (net) (665) (165) (830) (441) – (441)
Share of loss of equity-accounted investment, net of tax – (592) (592) – – –
Profit/(loss) before income tax 4,848 (6,453) (1,605) 4,699 168 4,867Income tax (charge)/credit (505) 279 (226) (580) – (580)
Profit/(loss) for the period 4,343 (6,174) (1,831) 4,119 168 4,287

63
FINANCIAL STATEMENTS NOTES TO THE FINANCIAL STATEMENTS FINANCIAL STATEMENTS NOTES TO THE FINANCIAL STATEMENTS
OV
ER
VIE
WR
EP
OR
T O
F TH
E D
IRE
CT
OR
SS
TR
AT
EG
IC R
EP
OR
TFIN
AN
CIA
L STA
TE
ME
NT
S
For the year ended 31 December 2019
Annual Report and Financial Statements 2019
4. Segment information (continued)
In the Freehold Properties segment, income includes £2.9 million (2018: £2.9 million) generated from intra group recharges. The corresponding cost is included within the Services Operating Business segment and is eliminated on consolidation.
Geographical segmentsRevenue and non-current assets (excluding deferred tax assets) by geographical area are as follows:
2019 2018
Revenue
£000
Non-current assets£000
Revenue
£000
Non-current assets£000
United Kingdom 12,263 52,459 8,948 42,262
Other European countries 12,345 54 18,197 33
North America 23,642 56 19,080 85
Other 8,997 331 2,445 –
Total 57,247 52,900 48,670 42,380
For the purpose of the analysis of revenue, geographical markets are defined as the country or area in which the client is based. Non-current assets are allocated based on their physical location.
During 2019, no single customer accounted for more than 10% of the Group’s revenue (2018: £nil).
Operating profit for the Services Operating Business included a depreciation charge of £1.1 million (2018: £0.3 million), the Product Operating Business included a depreciation charge of £0.2 million (2018: £nil) and the Freehold Properties included a depreciation charge of £0.5 million (2018 £0.5 million).
5. Revenue
5.1 Revenue StreamsThe Group’s operations and main revenue streams are those described in Note 4. The Group’s revenue is derived from contracts with customers.
5.2 Disaggregation of revenueIn the following table, revenue is disaggregated by geographical market and by the currency in which the contract is denominated Property revenue is generated in the UK and denominated in GBP.
For the purpose of the analysis of revenue, geographical markets are defined as the country or area in which the client is based.
Primary geographic markets 2019£000
2018£000
United Kingdom 12,263 8,948
Other European Countries 12,345 18,197
North America 23,642 19,080
Other 8,997 2,445
57,247 48,670
Currency 2019£000
2018£000
US Dollar 28,684 16,599
Euro 3,578 5,674
Sterling 24,822 26,249
Other 163 148
57,247 48,670

64
FINANCIAL STATEMENTS NOTES TO THE FINANCIAL STATEMENTS
For the year ended 31 December 2019
Annual Report and Financial Statements 2019
5. Revenue (continued)
5.3 Contract balancesThe following table provides information about receivables, contract assets and contract liabilities from contracts with customers.
2019£000
2018£000
Receivables that are included in ‘Trade and other receivables’ 7,265 7,836
Contract assets that are included in ‘Trade and other receivables’ 1,541 1,017
Contract liabilities which are included in ‘Trade and other payables’ (10,341) (10,752)
The contract assets primarily relate to the Group’s rights to consideration for work performed but not billed at the reporting date on Services Operating Business revenue streams. The contract assets are transferred to receivables when the rights to receive cash become unconditional. This usually occurs when the Group issues an invoice to the customer.
The contract liabilities primarily relate to the advance consideration received from customers. £1,517,000 (2018: £1,487,000) relates to pass through fees which represent advance payments for registration fees to be paid to regulatory bodies. The remainder represents revenue to be recognised over time as the work is performed.
Significant changes in the contract assets and the contract liabilities balances during the period are as follows:
Contract Assets
£000
Contract Liabilities
£000Revenue recognised that was included in the contract liability at the beginning of the period – 10,752Increase due to invoices raised to clients, excluding amounts recognised as revenue in the period – (10,341) Transfers from contract assets recognised at the beginning of the period to receivables (1,017) –Increases as a result of changes in the measure of progress 1,541 –
524 411
The Group applies the practical expedient in paragraph 121 of IFRS 15 and does not disclose information about remaining performance obligations that have original expected durations of one year or less.
6. Operating expenses
Expenses by nature Group
Year ended 31 December Note 2019£000
2018 £000
Employee remuneration and benefit expenses 8 32,275 28,320
Operating third party expenses 2,619 2,367
Occupancy costs 3,404 3,811
Equipment and consumables 2,619 1,744
Cost of inventories 3,931 –
Selling and marketing expenses 2,639 2,360
Depreciation of property, plant and equipment 15 776 760
Depreciation of right-of-use asset 15,25 1,033 –
Impairment of right-of-use asset 15,25 796 –
Release of contingent consideration – (519)
Foreign currency losses/(gains) 488 (87)
Amortisation of intangible assets 2,345 2,004
Other 1,325 2,602
54,250 43,362
Less expenses below adjusted operating profit (3,707) (2,423)
50,543 40,939
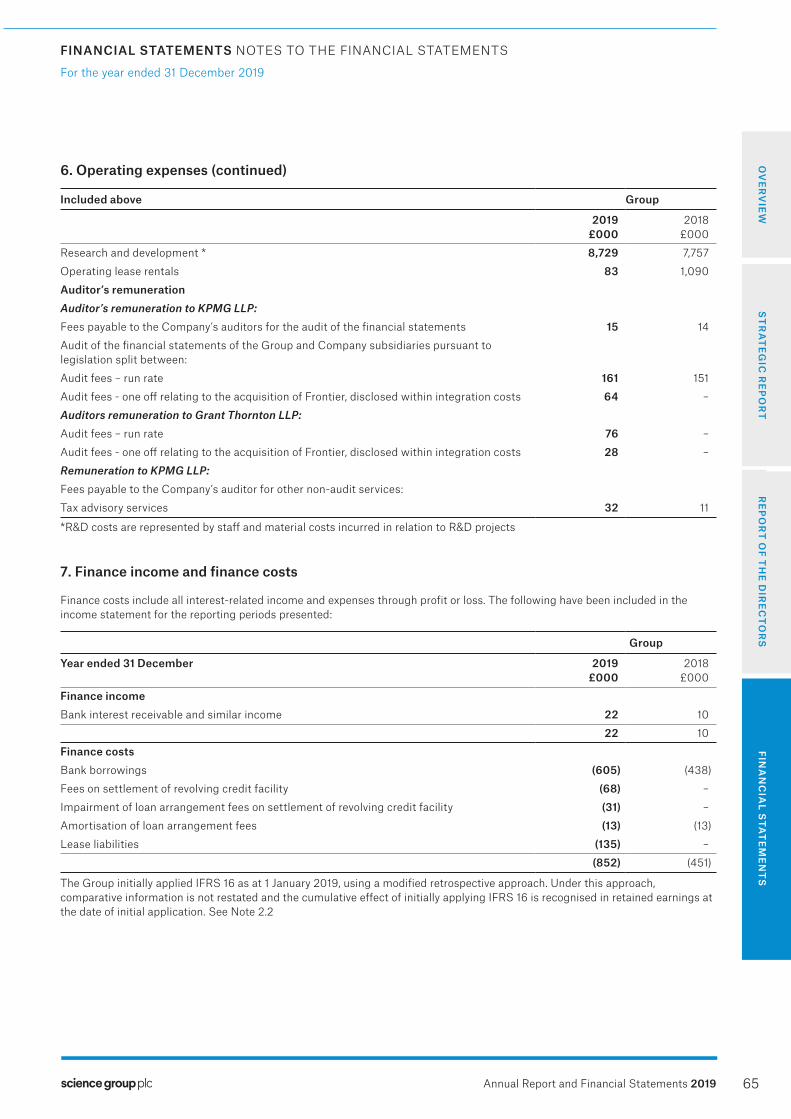
65
FINANCIAL STATEMENTS NOTES TO THE FINANCIAL STATEMENTS FINANCIAL STATEMENTS NOTES TO THE FINANCIAL STATEMENTS
OV
ER
VIE
WR
EP
OR
T O
F TH
E D
IRE
CT
OR
SS
TR
AT
EG
IC R
EP
OR
TFIN
AN
CIA
L STA
TE
ME
NT
S
For the year ended 31 December 2019
Annual Report and Financial Statements 2019
6. Operating expenses (continued)
Included above Group
2019£000
2018£000
Research and development * 8,729 7,757
Operating lease rentals 83 1,090
Auditor’s remunerationAuditor’s remuneration to KPMG LLP:Fees payable to the Company’s auditors for the audit of the financial statements 15 14
Audit of the financial statements of the Group and Company subsidiaries pursuant to legislation split between:
Audit fees – run rate 161 151
Audit fees - one off relating to the acquisition of Frontier, disclosed within integration costs 64 –
Auditors remuneration to Grant Thornton LLP:Audit fees – run rate 76 –
Audit fees - one off relating to the acquisition of Frontier, disclosed within integration costs 28 –
Remuneration to KPMG LLP:Fees payable to the Company’s auditor for other non-audit services:
Tax advisory services 32 11
*R&D costs are represented by staff and material costs incurred in relation to R&D projects
7. Finance income and finance costs
Finance costs include all interest-related income and expenses through profit or loss. The following have been included in the income statement for the reporting periods presented:
Group
Year ended 31 December 2019£000
2018£000
Finance incomeBank interest receivable and similar income 22 10
22 10
Finance costsBank borrowings (605) (438)
Fees on settlement of revolving credit facility (68) –
Impairment of loan arrangement fees on settlement of revolving credit facility (31) –
Amortisation of loan arrangement fees (13) (13)
Lease liabilities (135) –
(852) (451)
The Group initially applied IFRS 16 as at 1 January 2019, using a modified retrospective approach. Under this approach, comparative information is not restated and the cumulative effect of initially applying IFRS 16 is recognised in retained earnings at the date of initial application. See Note 2.2

66
FINANCIAL STATEMENTS NOTES TO THE FINANCIAL STATEMENTS
For the year ended 31 December 2019
Annual Report and Financial Statements 2019
8. Employee benefit expenses
Employment costs are shown below:
Group
Year ended 31 December 2019£000
2018£000
Wages and salaries (including bonuses and healthcare costs) 25,379 23,041
Social security costs 3,706 3,231
Redundancy costs 566 –
Pension costs 1,457 1,236
Share based payments (Note 23) 1,167 812
32,275 28,320
The average monthly number of persons employed (including Executive and Non-Executive Directors and fixed term contractors) by Science Group was as follows:
Group
Year ended 31 December 2019Number
2018Number
Technology consultants 305 289
Marketing, support, administration and other staff 104 92
409 381
9. Directors’ remuneration, interests and transactions
Directors’ emoluments and benefits include:
Year ended 31 December 2019Name of Director
Salary/ fee
£000
Bonus
£000
Pension contribution
£000
TaxableBenefits
£000
Total
£000Courtley 40 – – – 40Archer 148 42 12 – 202Lacey-Solymar 40 – – – 40Ratcliffe 385 – – – 385Edwards 141 56 10 – 207Aggregate emoluments 754 98 22 – 874
Year ended 31 December 2018Name of Director
Salary/ fee
£000
Bonus
£000
Pension contribution
£000
TaxableBenefits
£000
Total
£000
Courtley 40 – – – 40
Archer 170 43 12 – 225
Lacey-Solymar 40 – – – 40
Ratcliffe 385 – – – 385
Aggregate emoluments 635 43 12 – 690
Directors’ emoluments and benefits are stated for the Directors of Science Group plc only. Mr Edwards was appointed as Director on 28 April 2019 and his emoluments are included in the table above from this date. In addition to the above, a share based payment charge of £101,000 was recognised in the income statement relating to share options held by Directors (2018: £37,000). The share based payment charge includes a charge relating to Mr Edwards from 28 April 2019.

67
FINANCIAL STATEMENTS NOTES TO THE FINANCIAL STATEMENTS FINANCIAL STATEMENTS NOTES TO THE FINANCIAL STATEMENTS
OV
ER
VIE
WR
EP
OR
T O
F TH
E D
IRE
CT
OR
SS
TR
AT
EG
IC R
EP
OR
TFIN
AN
CIA
L STA
TE
ME
NT
S
For the year ended 31 December 2019
Annual Report and Financial Statements 2019
9. Directors’ remuneration, interests and transactions (continued)
The amounts shown were recognised as an expense during the year and relate to the Directors of the Company. Bonuses, pension and medical benefits are not paid to Non-Executive Directors. Mr Ratcliffe does not participate in the Group bonus scheme or receive pension or medical benefits.
Total social security costs related to Directors during the year was £112,371 (2018: £89,176).
Directors’ interests in the shares of Science Group at 31 December 2019 and 31 December 2018, and any changes subsequent to 31 December 2019, are as follows:
Mr Edward’s shares have been disclosed from the date he was appointed Director.
Science Group plc Ordinary shares of £0.01 Options Shares
Year ended 31 December 2019 2018 2019 2018 2019 2018
Average exercise price (pence)
Number Number Number Number
Archer 1.0 1.0 150,000 175,000 65,000 60,000
Ratcliffe – – – – 13,412,906 13,412,906
Courtley – – – – 375,000 375,000
Edwards 1.0 1.0 450,000 – 74,000 –
600,000 175,000 13,926,906 13,847,906
See Note 23 for further details on option plans.
10. Income tax
The tax charge comprises:
Year ended 31 December Note 2019£000
2018 £000
Current taxation (1,280) (1,377)
Current taxation – adjustment in respect of prior years 311 196
Deferred taxation 11 579 218
Deferred taxation – adjustment in respect of prior years (242) (49)
R&D tax credit 406 432
(226) (580)
The adjustment in prior years is due to estimation differences related to the tax charge.

68
FINANCIAL STATEMENTS NOTES TO THE FINANCIAL STATEMENTS
For the year ended 31 December 2019
Annual Report and Financial Statements 2019
10. Income tax (continued)
The corporation tax on Science Group’s profit before tax differs from the theoretical amount that would arise using the blended corporation tax rate across the various jurisdictions applicable to profits of the consolidated companies of 19.4% (2018: 19.4%) as follows:
2019 £000
2018 £000
(Loss)/profit before tax (1,605) 4,867
Tax calculated at domestic tax rates applicable to profits/(losses) in the respective countries 311 (946)
Expenses not deductible for tax purposes (1,022) (179)
Adjustment in respect of prior years – current tax 311 196
Adjustment in respect of prior years – deferred tax (242) (49)
Movement in deferred tax due to change in tax rate 27 (239)
Share scheme movements 100 293
Current year losses for which no deferred tax asset was recognised (180) (73)
Mandatory earnings and profits one-time tax – (78)
Prior year losses used in the current year which were not previously recognised 63 63
R&D tax credit 406 432
Tax (charge) (226) (580)
In 2017, the United States Federal Government released the Tax Cuts and Jobs Act. The impact of this bill resulted in the recognition of a corporation tax liability of £120,000 as at 31 December 2017 based on the estimated undistributed profits of all foreign subsidiaries of Technology Sciences Group Inc. During the prior year, the final liability in respect of these earnings and profits one-time tax was calculated and an additional charge of £78,000 was recognised in the year ended 31 December 2018.
The Group claims Research and Development tax credits under both the R&D expenditure credit scheme and the Small or Medium-sized Scheme. In the current year, the Group recognised a tax credit of £0.4 million (2018: £0.4 million). The Group performed a reasonable estimate of all amounts involved to determine the R&D tax credits to be recognised in the period to which it relates.

69
FINANCIAL STATEMENTS NOTES TO THE FINANCIAL STATEMENTS FINANCIAL STATEMENTS NOTES TO THE FINANCIAL STATEMENTS
OV
ER
VIE
WR
EP
OR
T O
F TH
E D
IRE
CT
OR
SS
TR
AT
EG
IC R
EP
OR
TFIN
AN
CIA
L STA
TE
ME
NT
S
For the year ended 31 December 2019
Annual Report and Financial Statements 2019
11. Deferred tax
The movement in deferred tax assets and liabilities during the year by each type of temporary difference is as follows:
Accelerated capital
allowances
£000
Tax losses
£000
Share based payment
£000
Acquisition related
intangible assets£000
Other temporary
differences
£000
Total
£000At 1 January 2018 (1,734) 104 477 (2,001) 428 (2,726)
Charged to the income statement (138) (39) (28) 456 (33) 218
Charge to the income statement (prior year adjustment) – (49) – – – (49)
Charged to equity – – (48) – (13) (61)
At 31 December 2018 (1,872) 16 401 (1,545) 382 (2,618) Charged to the income statement 33 47 130 469 (100) 579
Deferred taxation relating to acquisitions – – – (1,498) (130) (1,628)
Charge to the income statement(prior year adjustment) (54) (16) – – (172) (242)
Charged to Equity – – (25) – 77 52
Effect of movements in exchange rates – – – 121 5 126
At 31 December 2019 (1,893) 47 506 (2,453) 62 (3,731)
Group
2019£000
2018 £000
Deferred tax assets 47 16
Deferred tax liabilities (3,778) (2,634)
Net deferred tax liability (3,731) (2,618)
Deferred tax assets are recognised for tax loss carry-forwards to the extent that the realisation of the related tax benefit through the future taxable profits is probable. Deferred tax liabilities are recognised against accelerated capital allowances. The Group has available tax losses of approximately £34.7 million (2018: £10.8 million) and of these losses, £34.5 million are not recognised as a deferred tax asset and they do not expire. The available tax losses at 31 December 2019 include estimated tax losses of £24.0 million relating to Frontier. These tax losses are subject to approval by the UK tax authorities and none have been recognised as a deferred tax asset.
Company Share based payment
£000
Total
£000At 1 January 2018 62 62
Charged to the income statement (48) (48)
Charged to equity 13 13
At 31 December 2018 27 27Charged to equity (2) (2)
At 31 December 2019 25 25
The Company has available tax losses of approximately £2.3 million (2018: £2.3 million) and these losses do not expire.
Factors affecting future tax chargesA reduction in the UK corporation tax rate 20% to 19% (effective from 1 April 2017) and to 18% (effective 1 April 2020) were substantively enacted on 26 October 2015, and an additional reduction to 17% (effective 1 April 2020) was substantively enacted on 6 September 2016. This will reduce the company’s future current tax charge accordingly. The US federal rate had a reduction from 35% to 21%, effective from 1 January 2018. Deferred tax assets / (liabilities) were calculated at the substantively enacted corporation tax rates in the respective jurisdictions.

70
FINANCIAL STATEMENTS NOTES TO THE FINANCIAL STATEMENTS
For the year ended 31 December 2019
Annual Report and Financial Statements 2019
12. Earnings per share
The calculation of earnings per share is based on the following result and weighted average number of shares:
2019 2018
Profit after tax
£000
Weighted average
number of shares
Pence per share
Profit after tax
£000
Weighted average
number of shares
Pence per share
Basic earnings per ordinary share (1,831) 40,767,070 (4.5) 4,287 39,889,693 10.7
Effect of dilutive potential ordinary shares: share options – 1,257,907 0.1 – 1,021,609 (0.2)
Diluted earnings per ordinary share (1,831) 42,024,977 (4.4) 4,287 40,911,302 10.5
Only the share options granted, as disclosed in Note 23, are dilutive.
The calculation of adjusted earnings per share is as follows:
2019 2018
Adjusted* profit after
tax£000
Weighted average
number of shares
Pence per share
Adjusted* profit after
tax£000
Weighted average
number of shares
Pence per share
Adjusted basic earnings per ordinary share 4,735 40,767,070 11.6 5,876 39,889,693 14.7
Effect of dilutive potential ordinary shares: share options – 1,257,907 (0.3) – 1,021,609 (0.3)
Adjusted diluted earnings per ordinary share 4,735 42,024,977 11.3 5,876 40,911,302 14.4
*Calculation of adjusted profit after tax:
Group 2019£000
2018£000
Adjusted operating profit 6,704 7,731
Finance income 22 10
Finance costs (852) (451)
Adjusted profit before tax 5,874 7,290
Tax charge at the blended corporation tax rate across the various jurisdictions 19.4% (2018: 19.4%) (1,139) (1,414)
Adjusted profit after tax 4,735 5,876
The tax charge is calculated using the blended corporation tax rate across the various jurisdictions in which the Group companies are incorporated.
13. Dividends
The proposed final dividend for 2018 of 4.6 pence per share was approved by shareholders and the Board on 24 April 2019. An amount of £1.8 million was recognised as a distribution to equity holders in the year ended 31 December 2019.
The Board has proposed a final dividend for 2019 of 4.6 pence per share. The dividend is subject to approval by shareholders at the next Annual General Meeting and the expected cost of £1.9 million has not been included as a liability as at 31 December 2019.
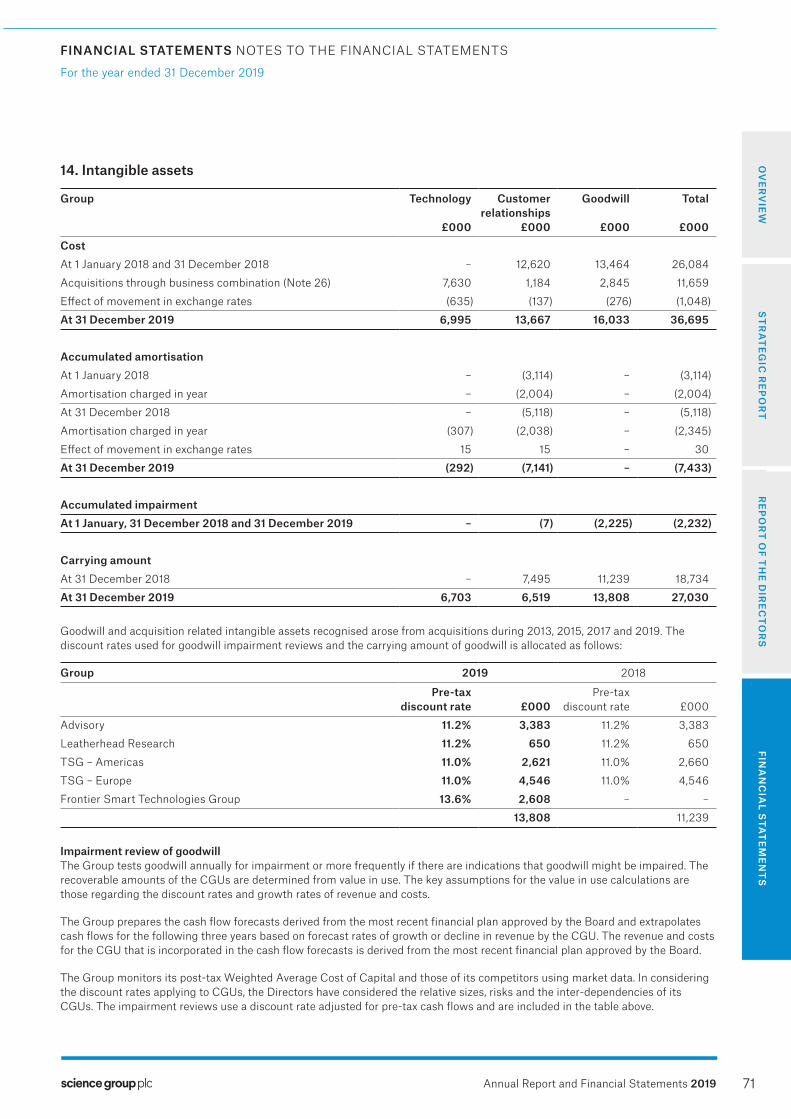
71
FINANCIAL STATEMENTS NOTES TO THE FINANCIAL STATEMENTS FINANCIAL STATEMENTS NOTES TO THE FINANCIAL STATEMENTS
OV
ER
VIE
WR
EP
OR
T O
F TH
E D
IRE
CT
OR
SS
TR
AT
EG
IC R
EP
OR
TFIN
AN
CIA
L STA
TE
ME
NT
S
For the year ended 31 December 2019
Annual Report and Financial Statements 2019
14. Intangible assets
Group Technology
£000
Customer relationships
£000
Goodwill
£000
Total
£000CostAt 1 January 2018 and 31 December 2018 – 12,620 13,464 26,084
Acquisitions through business combination (Note 26) 7,630 1,184 2,845 11,659
Effect of movement in exchange rates (635) (137) (276) (1,048)
At 31 December 2019 6,995 13,667 16,033 36,695
Accumulated amortisationAt 1 January 2018 – (3,114) – (3,114)
Amortisation charged in year – (2,004) – (2,004)
At 31 December 2018 – (5,118) – (5,118)
Amortisation charged in year (307) (2,038) – (2,345)
Effect of movement in exchange rates 15 15 – 30
At 31 December 2019 (292) (7,141) – (7,433)
Accumulated impairmentAt 1 January, 31 December 2018 and 31 December 2019 – (7) (2,225) (2,232)
Carrying amountAt 31 December 2018 – 7,495 11,239 18,734
At 31 December 2019 6,703 6,519 13,808 27,030
Goodwill and acquisition related intangible assets recognised arose from acquisitions during 2013, 2015, 2017 and 2019. The discount rates used for goodwill impairment reviews and the carrying amount of goodwill is allocated as follows:
Group 2019 2018
Pre-tax discount rate £000
Pre-tax discount rate
£000
Advisory 11.2% 3,383 11.2% 3,383
Leatherhead Research 11.2% 650 11.2% 650
TSG – Americas 11.0% 2,621 11.0% 2,660
TSG – Europe 11.0% 4,546 11.0% 4,546
Frontier Smart Technologies Group 13.6% 2,608 – –
13,808 11,239
Impairment review of goodwillThe Group tests goodwill annually for impairment or more frequently if there are indications that goodwill might be impaired. The recoverable amounts of the CGUs are determined from value in use. The key assumptions for the value in use calculations are those regarding the discount rates and growth rates of revenue and costs.
The Group prepares the cash flow forecasts derived from the most recent financial plan approved by the Board and extrapolates cash flows for the following three years based on forecast rates of growth or decline in revenue by the CGU. The revenue and costs for the CGU that is incorporated in the cash flow forecasts is derived from the most recent financial plan approved by the Board.
The Group monitors its post-tax Weighted Average Cost of Capital and those of its competitors using market data. In considering the discount rates applying to CGUs, the Directors have considered the relative sizes, risks and the inter-dependencies of its CGUs. The impairment reviews use a discount rate adjusted for pre-tax cash flows and are included in the table above.
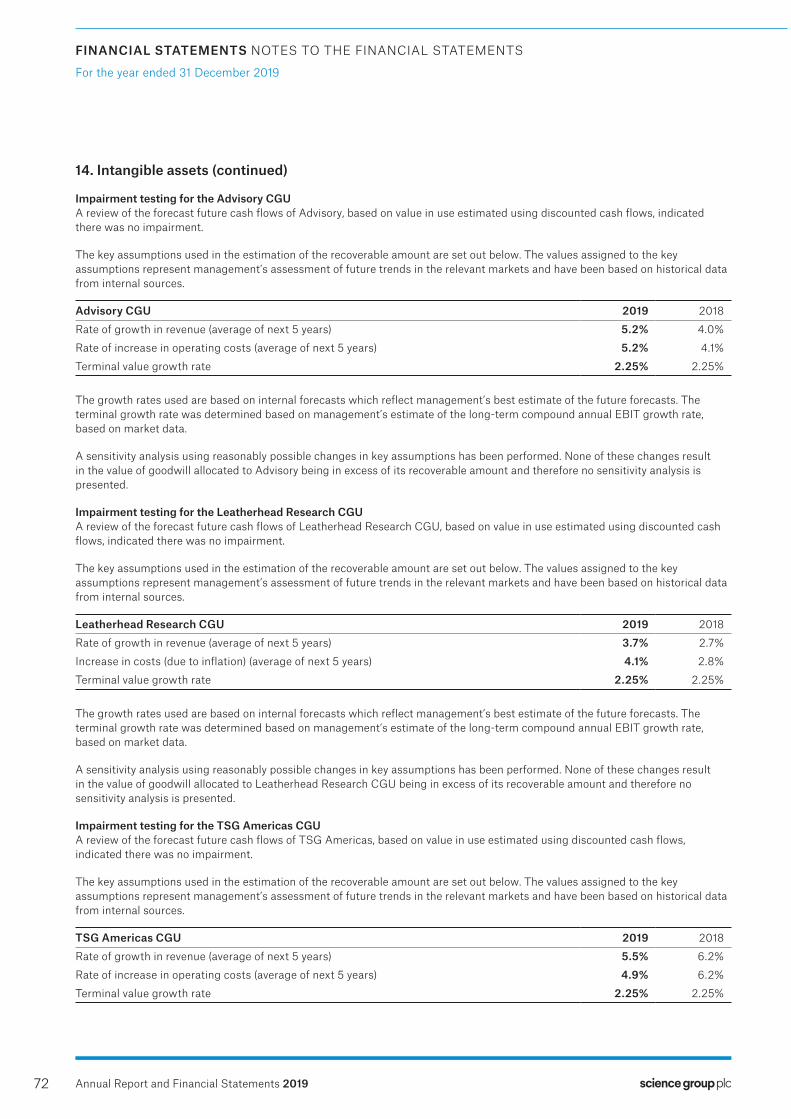
72
FINANCIAL STATEMENTS NOTES TO THE FINANCIAL STATEMENTS
For the year ended 31 December 2019
Annual Report and Financial Statements 2019
14. Intangible assets (continued)
Impairment testing for the Advisory CGUA review of the forecast future cash flows of Advisory, based on value in use estimated using discounted cash flows, indicated there was no impairment.
The key assumptions used in the estimation of the recoverable amount are set out below. The values assigned to the key assumptions represent management’s assessment of future trends in the relevant markets and have been based on historical data from internal sources.
Advisory CGU 2019 2018
Rate of growth in revenue (average of next 5 years) 5.2% 4.0%
Rate of increase in operating costs (average of next 5 years) 5.2% 4.1%
Terminal value growth rate 2.25% 2.25%
The growth rates used are based on internal forecasts which reflect management’s best estimate of the future forecasts. The terminal growth rate was determined based on management’s estimate of the long-term compound annual EBIT growth rate, based on market data.
A sensitivity analysis using reasonably possible changes in key assumptions has been performed. None of these changes result in the value of goodwill allocated to Advisory being in excess of its recoverable amount and therefore no sensitivity analysis is presented.
Impairment testing for the Leatherhead Research CGUA review of the forecast future cash flows of Leatherhead Research CGU, based on value in use estimated using discounted cash flows, indicated there was no impairment.
The key assumptions used in the estimation of the recoverable amount are set out below. The values assigned to the key assumptions represent management’s assessment of future trends in the relevant markets and have been based on historical data from internal sources.
Leatherhead Research CGU 2019 2018
Rate of growth in revenue (average of next 5 years) 3.7% 2.7%
Increase in costs (due to inflation) (average of next 5 years) 4.1% 2.8%
Terminal value growth rate 2.25% 2.25%
The growth rates used are based on internal forecasts which reflect management’s best estimate of the future forecasts. The terminal growth rate was determined based on management’s estimate of the long-term compound annual EBIT growth rate, based on market data.
A sensitivity analysis using reasonably possible changes in key assumptions has been performed. None of these changes result in the value of goodwill allocated to Leatherhead Research CGU being in excess of its recoverable amount and therefore no sensitivity analysis is presented.
Impairment testing for the TSG Americas CGUA review of the forecast future cash flows of TSG Americas, based on value in use estimated using discounted cash flows, indicated there was no impairment.
The key assumptions used in the estimation of the recoverable amount are set out below. The values assigned to the key assumptions represent management’s assessment of future trends in the relevant markets and have been based on historical data from internal sources.
TSG Americas CGU 2019 2018
Rate of growth in revenue (average of next 5 years) 5.5% 6.2%
Rate of increase in operating costs (average of next 5 years) 4.9% 6.2%
Terminal value growth rate 2.25% 2.25%

73
FINANCIAL STATEMENTS NOTES TO THE FINANCIAL STATEMENTS FINANCIAL STATEMENTS NOTES TO THE FINANCIAL STATEMENTS
OV
ER
VIE
WR
EP
OR
T O
F TH
E D
IRE
CT
OR
SS
TR
AT
EG
IC R
EP
OR
TFIN
AN
CIA
L STA
TE
ME
NT
S
For the year ended 31 December 2019
Annual Report and Financial Statements 2019
14. Intangible assets (continued)
Impairment testing for the TSG Americas CGU (continued)The growth rates used are based on internal forecasts which reflect management’s best estimate of the future forecasts. The terminal growth rate was determined based on management’s estimate of the long-term compound annual EBIT growth rate, based on market data.
A sensitivity analysis using reasonably possible changes in key assumptions has been performed. None of these changes result in the value of goodwill allocated to TSG Americas being in excess of its recoverable amount and therefore no sensitivity analysis is presented.
Impairment testing for the TSG Europe CGUA review of the forecast future cash flows of TSG Europe, based on value in use estimated using discounted cash flows, indicated there was no impairment.
The key assumptions used in the estimation of the recoverable amount are set out below. The values assigned to the key assumptions represent management’s assessment of future trends in the relevant markets and have been based on historical data from internal sources.
TSG Europe CGU 2019 2018
Rate of growth in revenue (average of next 5 years) 5.5% 5.0%
Rate of increase in operating costs (average of next 5 years) 5.2% 4.9%
Terminal value growth rate 2.25% 2.25%
The growth rates used are based on internal forecasts which reflect management’s best estimate of the future forecasts. The terminal growth rate was determined based on management’s estimate of the long-term compound annual EBIT growth rate, based on market data.
A sensitivity analysis using reasonably possible changes in key assumptions has been performed. None of these changes result in the value of goodwill allocated to TSG Europe being in excess of its recoverable amount and therefore no sensitivity analysis is presented.
Impairment testing for the Frontier Smart Technologies Group CGUA review of the forecast future cash flows of Frontier Smart Technologies Group (‘Frontier’), based on value in use estimated using discounted cash flows, indicated there was no impairment.
The key assumptions used in the estimation of the recoverable amount are set out below. The values assigned to the key assumptions represent management’s assessment of future trends in the relevant markets and have been based on historical data from internal sources.
Frontier Smart Technologies Group CGU 2019 2018
Rate of growth in revenue (average of next 5 years) 3.2% –
Rate of increase in operating costs (average of next 5 years) 2.9% –
Terminal value growth rate 2.25% –
The growth rates used are based on internal forecasts which reflect management’s best estimate of the future forecasts. The terminal growth rate was determined based on management’s estimate of the long-term compound annual EBIT growth rate, based on market data.
A sensitivity analysis using reasonably possible changes in key assumptions has been performed. None of these changes result in the value of goodwill allocated to Frontier being in excess of its recoverable amount and therefore no sensitivity analysis is presented.

74
FINANCIAL STATEMENTS NOTES TO THE FINANCIAL STATEMENTS
For the year ended 31 December 2019
Annual Report and Financial Statements 2019
15. Property, plant and equipment
Group
Cost
Freehold land and
buildings£000
Land & buildings
right-of- use£000
Furniture and
fittings £000
Equipment
£000
Total
£000At 1 January 2018 25,200 – 3,162 1,447 29,809
Exchange differences on cost – – 2 4 6
Reclassification – – (14) 14 –
Additions – – 90 230 320
At 1 January 2019 25,200 – 3,240 1,695 30,135
Recognition of right-of-use asset on initial application of IFRS 16 – 2,771 – – 2,771
Adjusted balance at 1 January 2019 25,200 2,771 3,240 1,695 32,906
Exchange differences on cost – (199) (17) (13) (229)
Acquired in business combination (Note 26) – 1,337 125 134 1,596
Additions – 368 350 205 923
At 31 December 2019 25,200 4,277 3,698 2,021 35,196
Accumulated depreciationAt 1 January 2018 3,481 – 1,585 956 6,022
Reclassification – – (4) 4 –
Depreciation charge 167 – 336 257 760
Exchange differences on depreciation – – (4) 4 –
At 1 January 2019 3,648 –– 1,913 1,221 6,782
Depreciation charge 168 1,033 362 246 1,809
Impairment loss – 796 – – 796
Exchange differences on depreciation – (46) (6) (9) (61)
At 31 December 2019 3,816 1,783 2,269 1,458 9,326Carrying amountAt 31 December 2018 21,552 – 1,327 474 23,353
At 31 December 2019 21,384 2,494 1,429 563 25,870
The Epsom property is held at cost less accumulated depreciation. Included within land and buildings for the Group is freehold land to the value of £500,000 (2018: £500,000) which has not been depreciated. During the year ended 31 December 2016, the property was brought into use from which point depreciation commenced. This property was acquired solely for the use of Science Group. This property was last formally valued at £8.1 million during March 2018 by BNP Paribas Real Estate, subject to the assumption of full vacant possession.
The Harston property is held at cost less accumulated depreciation. Included within land and buildings for the Group is freehold land to the value of £1,360,000 (2018: £1,360,000) which has not been depreciated. Cumulative interest capitalised up to 31 December 2003 was £340,000. No further interest has been capitalised. The Harston property was last formally valued during March 2018 by BNP Paribas Real Estate. Under the assumptions used, including tenant covenant strength and market rents, the indicative valuation range for the building was between £16.7 million based on occupational tenancies where the head lease is merged into the freehold interest, and £22.5 million under a sale and leaseback scenario.
The Epsom and Harston buildings are depreciated using the straight-line method to allocate their cost less their residual values over their estimated useful lives of 25 years. The residual values of the properties are based on estimates of the amounts the Group would receive currently for the properties if they were already of an age and in the condition expected at the end of their useful lives. The residual values are reviewed annually to ensure that they do not exceed the estimated market values of the properties.

75
FINANCIAL STATEMENTS NOTES TO THE FINANCIAL STATEMENTS FINANCIAL STATEMENTS NOTES TO THE FINANCIAL STATEMENTS
OV
ER
VIE
WR
EP
OR
T O
F TH
E D
IRE
CT
OR
SS
TR
AT
EG
IC R
EP
OR
TFIN
AN
CIA
L STA
TE
ME
NT
S
For the year ended 31 December 2019
Annual Report and Financial Statements 2019
15. Property, plant and equipment (continued)
The Harston property generated third party rental and services income of £980,000 (2018: £1,046,000). Of this income, £595,000 (2018: £659,000) was rental income and £385,000 (2018: £387,000) was services income. Services income includes, but is not limited to, utilities, cleaning and general maintenance.
The total space on the Harston site available for business use is 97,000 sq. ft. Of this space, the average total space let to third parties during 2019 was 29,100 sq. ft. (2018: 29,400 sq. ft.). The leases to tenants are typically for a 36-month term and normally have a termination notice period of 3 to 6 months. An average of 45,700 sq. ft. (2018: 45,700 sq. ft.) was used by the Group during the year for its business activities including office space and laboratory space and 20,000 sq. ft. are common areas. The remaining space of 2,200 sq. ft. (2018: 1,900 sq. ft.) was vacant during the year.
Given the continuing rental values and occupancy rates the Directors do not believe that the combined carrying value of the Harston and Epsom properties of £21,384,000 (2018: £21,552,000) is significantly different to its fair value.
The term loan with Lloyds Bank plc is secured on the Harston and Epsom properties which have a net book value at 31 December 2019 of £21.4 million (2018: 21.6 million) (see Note 24).
Science Group plc had fixed assets with a net book value of £165,000 at 31 December 2019 (£nil at 31 December 2018).
16. Investments
a) Investments in subsidiariesScience Group held investments in the following subsidiaries at 31 December 2019.
Subsidiaries of Science Group plc Registered office
Country of incorporation
Principal activity Shares held %
Consulting operationsSagentia Limited* (1) England Consultancy Ordinary 100
Sagentia Technology Advisory Limited* (1) England Holding company Ordinary 100
OTM Consulting Ltd* (1) England Consultancy Ordinary 100
Quadro Epsom Limited* (1) England Property Ordinary 100
Manage5Nines Limited (1) England IT Consultancy Ordinary 100
Sagentia Inc. (2) USA Consultancy Ordinary 100
OTM Consulting Inc. (3) USA Consultancy Ordinary 100
Oakland Innovation Ltd* (1) England Consultancy Ordinary 100
Leatherhead Research Limited* (1) England Consultancy Ordinary 100
Technology Sciences Group Limited** (1) England Consultancy Ordinary 61
Technology Sciences Group Consulting Limited (1) England Consultancy Ordinary 100
Technology Sciences Group Canada (TSG) Inc. (7) Canada Consultancy Ordinary 100
TSGE Forum Limited (1) England Consultancy Ordinary 100
TSGE Iberia SL (5) Spain Consultancy Ordinary 100
TSGE d.o.o (8) Slovenia Consultancy Ordinary 100
TSGE Deutschland GmbH (6) Germany Consultancy Ordinary 100
Technology Sciences Group Inc.* (2) USA Consultancy Ordinary 100
Technology Science Group France * (4) France Consultancy Ordinary 100
SG Bidco Ltd * (1) England Holding Company Ordinary 100
Frontier Smart Technologies Limited (1) England Production Ordinary 100
Frontier Microsystems Ltd (UK) (1) England Production Ordinary 100
Frontier Silicon (HK) Ltd (Hong Kong) (9) Hong Kong Production Ordinary 100
Frontier Silicon Srl (Romania) (10) Romania Production Ordinary 100
Frontier Silicon Limited (1) England Production Ordinary 100

76
FINANCIAL STATEMENTS NOTES TO THE FINANCIAL STATEMENTS
For the year ended 31 December 2019
Annual Report and Financial Statements 2019
16. Investments (continued)
* Direct subsidiaries of Science Group plc as at 31 December 2019** Science Group plc owns 61% of Technology Sciences Group Ltd, with Technology Sciences Group Inc. holding the remaining 39%. Science Group plc owns 100% of Technology Sciences Group Inc. hence the Group effectively owns 100% of Technology Sciences Group Limited.
(1) Harston Mill, Royston Road, Harston, Cambridge, England, CB22 7GG(2) 919 North Market Street, Suite 950, Wilmington, Delaware, 19801(3) 815 Brazos St. STE 500 Austin, Texas, 78701(4) 1-2 place des saisons, La Défense Tour First, 92400 Courbevoie, Paris(5) Avenida De Galicia, 22-1, Isquierda, Dr Oviedo, 33005, Spain(6) Richthofenstraße 29, 31137 Hildesheim, Germany(7) 50 O’Connor, Suite 300, Ottawa ON, K1P 6L2, Canada(8) Ljubljanska cesta 110, 1230 Domžale, Slovenia(9) Unit 2218, Grand Central Plaza Tower 2, 138 Sha Tin Rural Committee Road, Sha Tin, New Territories, Hong Kong(10) Str. MARTIN LUTHER Nr. 2, Județ Timiş, 300054 Municipiul Timişoara, RomaniaAll subsidiaries for which accounts are provided have year ends of 31 December.
b) Other investments
Group Total£000
CostAt 1 January 2018, 31 December 2018 and 31 December 2019 100
ImpairmentAt 1 January 2018 50
Impairment loss 50
At 31 December 2018 and 31 December 2019 100
Carrying amountAt 31 December 2018 –
At 31 December 2019 –
At 31 December 2018, a subsidiary of Science Group plc holds 30% of the ordinary share capital of Creactive (ID) Design Limited, a Cambridge-based industrial design consultancy, at a net book value of £nil. The annual impairment test on investments resulted in an impairment of £50,000 being recognised on this investment.
The Directors do not consider that any of its investments are associates and to avoid a statement of excessive length, details of investments that are not significant have been omitted.
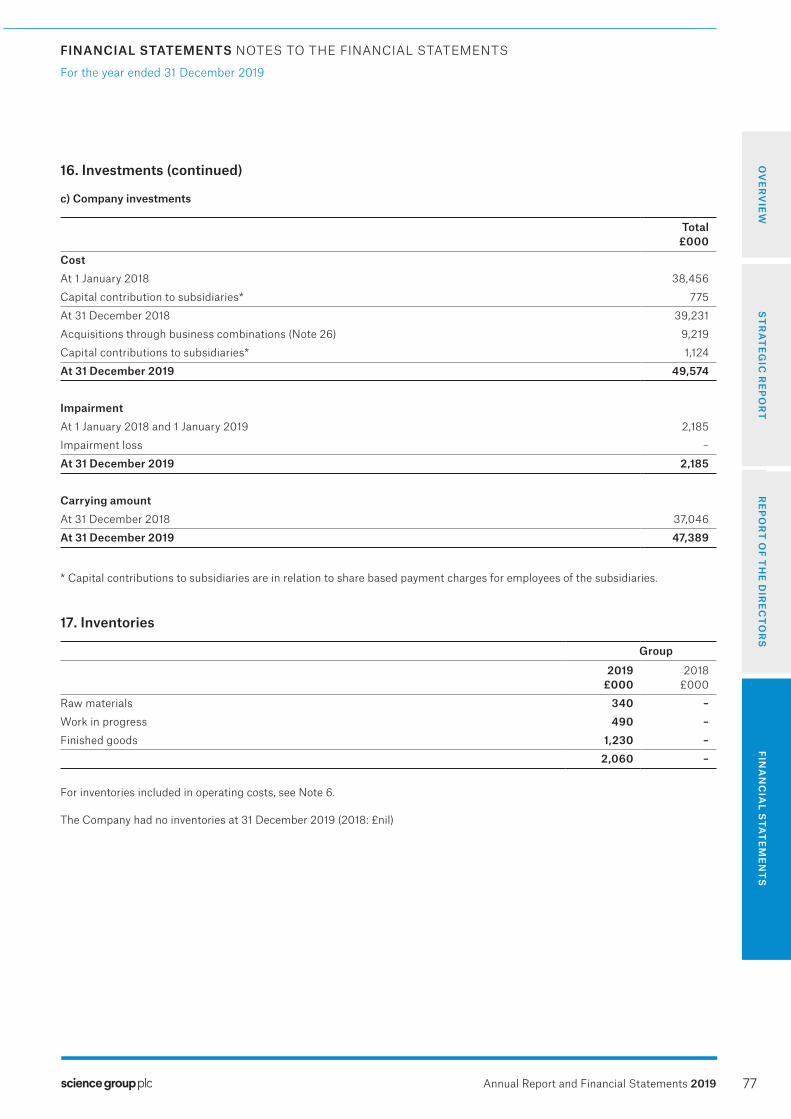
77
FINANCIAL STATEMENTS NOTES TO THE FINANCIAL STATEMENTS FINANCIAL STATEMENTS NOTES TO THE FINANCIAL STATEMENTS
OV
ER
VIE
WR
EP
OR
T O
F TH
E D
IRE
CT
OR
SS
TR
AT
EG
IC R
EP
OR
TFIN
AN
CIA
L STA
TE
ME
NT
S
For the year ended 31 December 2019
Annual Report and Financial Statements 2019
16. Investments (continued)
c) Company investments
Total £000
CostAt 1 January 2018 38,456
Capital contribution to subsidiaries* 775
At 31 December 2018 39,231
Acquisitions through business combinations (Note 26) 9,219
Capital contributions to subsidiaries* 1,124
At 31 December 2019 49,574
ImpairmentAt 1 January 2018 and 1 January 2019 2,185
Impairment loss –
At 31 December 2019 2,185
Carrying amountAt 31 December 2018 37,046
At 31 December 2019 47,389
* Capital contributions to subsidiaries are in relation to share based payment charges for employees of the subsidiaries.
17. Inventories
Group
2019£000
2018£000
Raw materials 340 –Work in progress 490 –Finished goods 1,230 –
2,060 –
For inventories included in operating costs, see Note 6.
The Company had no inventories at 31 December 2019 (2018: £nil)
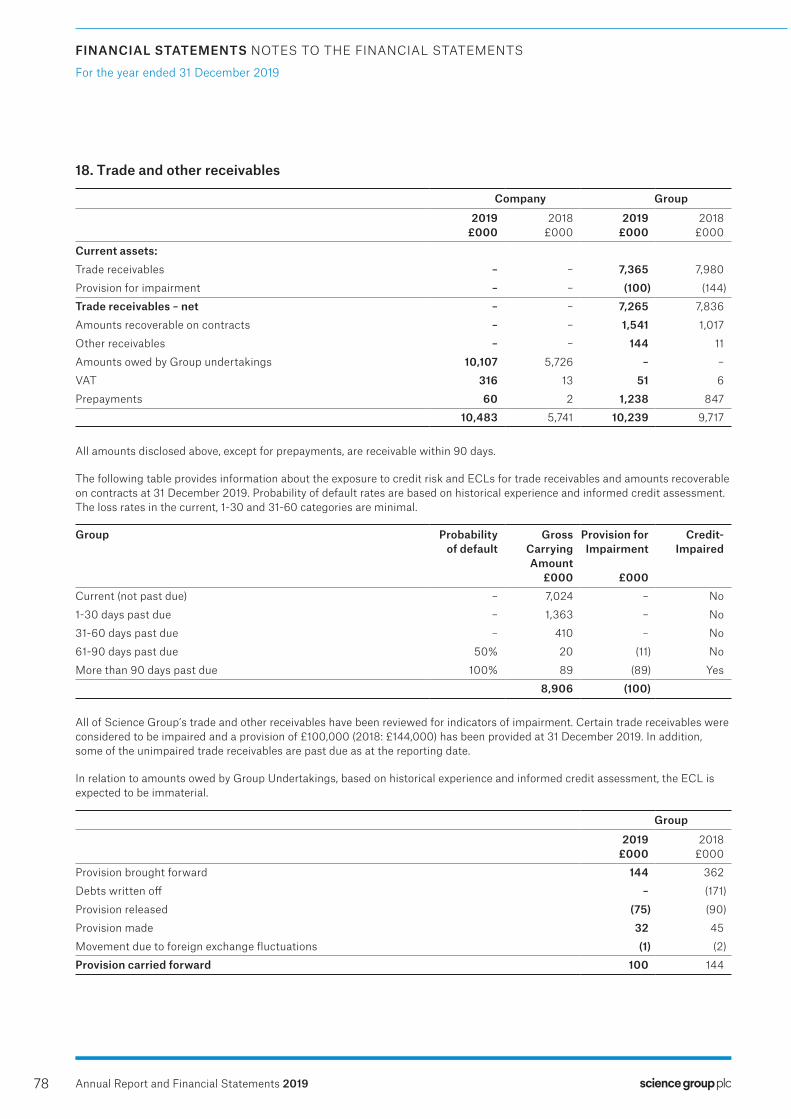
78
FINANCIAL STATEMENTS NOTES TO THE FINANCIAL STATEMENTS
For the year ended 31 December 2019
Annual Report and Financial Statements 2019
18. Trade and other receivables
Company Group
2019£000
2018£000
2019£000
2018£000
Current assets:Trade receivables – – 7,365 7,980
Provision for impairment – – (100) (144)
Trade receivables – net – – 7,265 7,836
Amounts recoverable on contracts – – 1,541 1,017
Other receivables – – 144 11
Amounts owed by Group undertakings 10,107 5,726 – –
VAT 316 13 51 6
Prepayments 60 2 1,238 847
10,483 5,741 10,239 9,717
All amounts disclosed above, except for prepayments, are receivable within 90 days.
The following table provides information about the exposure to credit risk and ECLs for trade receivables and amounts recoverable on contracts at 31 December 2019. Probability of default rates are based on historical experience and informed credit assessment. The loss rates in the current, 1-30 and 31-60 categories are minimal.
Group Probability of default
Gross Carrying Amount
£000
Provision for Impairment
£000
Credit- Impaired
Current (not past due) – 7,024 – No
1-30 days past due – 1,363 – No
31-60 days past due – 410 – No
61-90 days past due 50% 20 (11) No
More than 90 days past due 100% 89 (89) Yes
8,906 (100)
All of Science Group’s trade and other receivables have been reviewed for indicators of impairment. Certain trade receivables were considered to be impaired and a provision of £100,000 (2018: £144,000) has been provided at 31 December 2019. In addition, some of the unimpaired trade receivables are past due as at the reporting date.
In relation to amounts owed by Group Undertakings, based on historical experience and informed credit assessment, the ECL is expected to be immaterial.
Group
2019£000
2018£000
Provision brought forward 144 362
Debts written off – (171)
Provision released (75) (90)
Provision made 32 45
Movement due to foreign exchange fluctuations (1) (2)
Provision carried forward 100 144

79
FINANCIAL STATEMENTS NOTES TO THE FINANCIAL STATEMENTS FINANCIAL STATEMENTS NOTES TO THE FINANCIAL STATEMENTS
OV
ER
VIE
WR
EP
OR
T O
F TH
E D
IRE
CT
OR
SS
TR
AT
EG
IC R
EP
OR
TFIN
AN
CIA
L STA
TE
ME
NT
S
For the year ended 31 December 2019
Annual Report and Financial Statements 2019
19. Cash and cash equivalents
Company Group
2019£000
2018£000
2019£000
2018£000
Short term bank deposits – Group cash 37 37 39 37
Cash at bank and in hand – Group cash 2,707 7,428 13,873 21,483
Cash and cash equivalents – Group cash 2,744 7,465 13,912 21,520
Cash and cash equivalents – Client registration funds – – 1,517 1,487
2,744 7,465 15,429 23,007
The Group receives cash from clients which are pass through funds solely for the purpose of payment of registration fees to regulatory bodies. This cash is separated in the day to day operations of the business, is separately identified for reporting purposes and is unrestricted.
20. Trade and other payables
Company Group
2019£000
2018£000
2019£000
2018£000
Current liabilitiesContract liabilities – – 10,341 10,752
Trade payables 24 50 2,548 1,110
Other taxation and social security 30 35 884 786
Amounts owed to Group undertakings 5,488 3,212 – –
VAT – – 120 392
Accruals 262 105 6,688 4,336
5,804 3,402 20,581 17,376
21. Provisions
Group Onerous lease£000
Dilapidations
£000
Restructuring
£000
Legal
£000
Total
£000At 1 January 2018 495 199 – 597 1,291
Provisions made during the year – 170 199 391 760
Provisions used during the year (190) – (57) – (247)
Provisions reversed during the year (95) (108) – (300) (503)
Loss/(gain) on foreign exchange fluctuations 15 1 – 17 33
At 31 December 2018 225 262 142 705 1,334
Assumed in business combination – 300 – – 300
Provisions made during the year – 31 – – 31
Provisions used during the year (126) – (52) (5) (183)
Provisions reversed during the year (94) – – (687) (781)
Loss/(gain) on foreign exchange fluctuations (5) (31) – (13) (49)
At 31 December 2019 – 562 90 – 652

80
FINANCIAL STATEMENTS NOTES TO THE FINANCIAL STATEMENTS
For the year ended 31 December 2019
Annual Report and Financial Statements 2019
21. Provisions (continued)
Group
2019£000
2018£000
Current liabilities 172 1,038
Non-current liabilities 480 296
652 1,334
Provisions for onerous leases and dilapidation provisions have been recognised at the present value of the expected obligation. These discounts will unwind to their undiscounted value over the remaining lives of the leases via a finance charge within the income statement.
The average remaining life of the leases at 31 December 2019 is 2 years (2018: 1 year).
The restructuring provision relates to the costs associated with the closure of the Central/Eastern Europe offices and is anticipated to be utilised during the next 18 months.
Legal provisions represent the best estimate of the future economic outflow of settling potential litigation claims and associated costs such as legal fees. During the period ended 31 December 2019, a claim was settled by insurers with a cash outflow of £5,000 being required hence the remaining unutilised provision of £687,000 was released to the Consolidated Income Statement and is separately disclosed as an adjusting item.
22. Contingent consideration
During the prior year, contingent consideration of £0.5 million was released to the Consolidated Income Statement. This related to the consideration for the acquisition of TSG in 2017. Certain agreed conditions on the vendor ceased to be met in the year ended 31 December 2018 hence the contingent consideration was no longer payable and was released accordingly.
23. Called-up share capital
2019£000
2018£000
Allotted, called-up and fully paidOrdinary shares of £0.01 each 421 421
Number Number
Allotted, called-up and fully paidOrdinary shares of £0.01 each 42,062,035 42,062,035
The allotted, called-up and fully paid share capital of the Company as at 31 December 2019 was 42,062,035 shares (2018: 42,062,035) and the total number of ordinary shares in issue (excluding treasury shares) was 41,700,440 (2018: 40,040,227). Of the ordinary shares in issue, 104,400 (2018: nil) shares are held by the Frontier Smart Technologies Employee Benefit Trust (‘EBT’) and hence the voting rights in the Company are 41,596,040.
Prior to acquisition of Frontier, the EBT held 2.0 million Frontier shares. On completion of the statutory merger (Note 26), the EBT received £0.5 million in settlement of the shares of which £0.3 million was paid to SG Bidco Limited to settle an outstanding loan. 104,400 shares in Science Group plc were acquired by the EBT (by issuing shares held in treasury) which will be used to satisfy employee share options issued to the Joint Managing Directors of the Frontier business.

81
FINANCIAL STATEMENTS NOTES TO THE FINANCIAL STATEMENTS FINANCIAL STATEMENTS NOTES TO THE FINANCIAL STATEMENTS
OV
ER
VIE
WR
EP
OR
T O
F TH
E D
IRE
CT
OR
SS
TR
AT
EG
IC R
EP
OR
TFIN
AN
CIA
L STA
TE
ME
NT
S
For the year ended 31 December 2019
Annual Report and Financial Statements 2019
23. Called-up share capital (continued)
A reconciliation of treasury shares held by the Company is as follows:
Company
Reconciliation of treasury shares 2019Number
2018Number
At beginning of year 2,021,808 2,694,907
Purchase of own shares 97,913 89,800
Sale of own shares (1,187,401) –
Settlement of share options (570,725) (762,899)
At end of year 361,595 2,021,808
It is the intention of the Company to hold the treasury shares for the purpose of settling employee share schemes and for settling liquidated sums of cash consideration in any future business acquisitions, and in limited circumstances to satisfy shareholder demand which market liquidity is unable to meet. No dividend or other distribution may be made to the Company in respect of the treasury shares.
The total charge relating to employee share based payment plans, all of which related to equity-settled share based payment transactions, was £1,167,000 (2018: £812,000)
Reconciliation of outstanding options 2019 2018
Number Weighted average exercise
price (pence)
Number Weighted average exercise
price (pence)
At beginning of year 3,194,000 1.7 1,877,732 7.0
Granted during the year – PSP 754,400 1.0 1,100,000 1.0
Granted during the year – EEI – – 1,200,000 1.0
Exercised during the year (570,725) 4.0 (762,899) 15.1
Lapsed during the year (435,000) 1.0 (220,833) 1.0
At end of year 2,942,675 1.1 3,194,000 1.7
During the year ended 31 December 2019, share options were issued under the Performance Share Plan (‘PSP’).
The options outstanding at 31 December 2019 had a weighted average contractual life of 8.8 years (2018: 8.9 years).
Included within the total outstanding options at 31 December 2019 are 83,275 options which are exercisable (2018: 294,000). The weighted average exercise price of exercisable options at the end of the year was 6.0 pence (2018: 1.7 pence).
Options exercised during the year had a weighted average share price at the date of exercise of 195 pence (2018: 217 pence).
Exercise of an option is subject to continued employment, and normally lapses within three months of leaving employment.
The fair values of options granted under the PSP in 2019 were determined using a variation of the Binomial Option Pricing model that takes into account factors specific to the share incentive plans including performance conditions. The performance condition attached to options granted in the year is such that 100% of the options vest dependent on the Company achieving earnings per share targets. The performance condition, which is a market condition, has been incorporated into the measurement by means of actuarial modelling. For options granted in the year, a risk-free rate of 0.25% and 0.50% and a dividend yield factor of 2.4% and 2.0% has been used for the options issued in October and November 2019 respectively. The share price on the date the options were granted was 192.0 pence and 226.0 pence in October and November 2019 respectively. The other principal assumptions used in the valuation are set out in the table below. The underlying expected volatility was determined by reference to historical data of the Company’s shares over the vesting period.
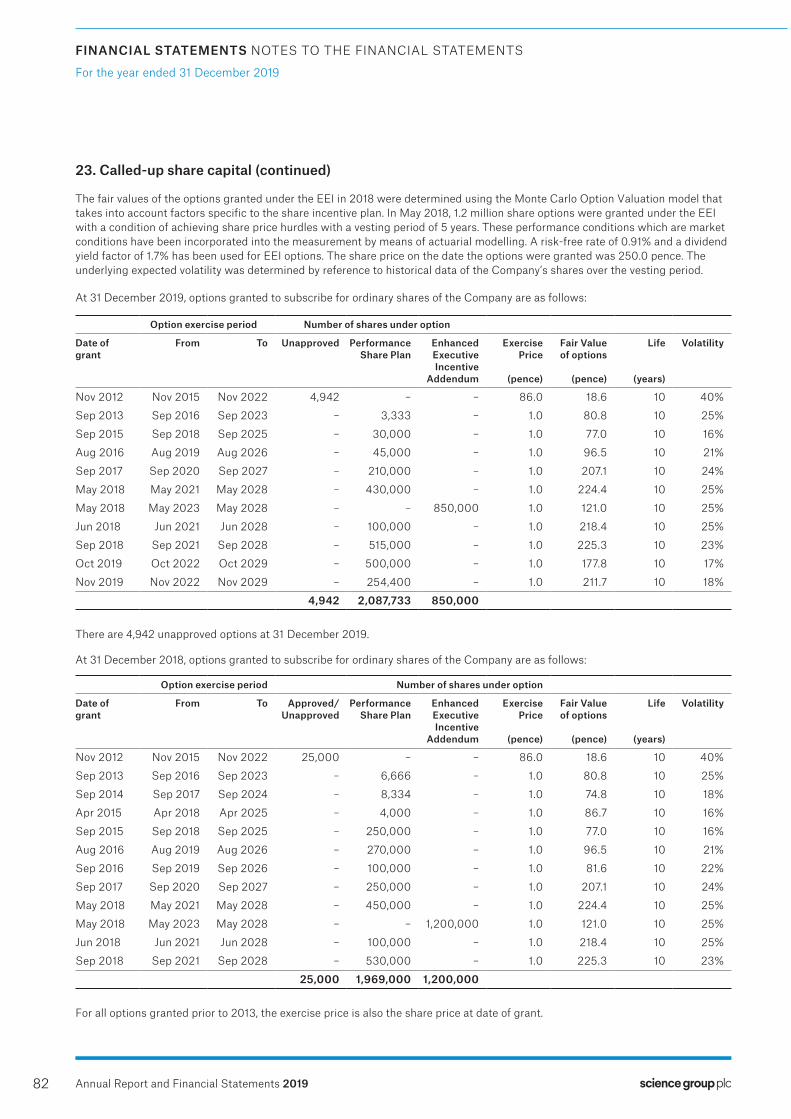
82
FINANCIAL STATEMENTS NOTES TO THE FINANCIAL STATEMENTS
For the year ended 31 December 2019
Annual Report and Financial Statements 2019
23. Called-up share capital (continued)
The fair values of the options granted under the EEI in 2018 were determined using the Monte Carlo Option Valuation model that takes into account factors specific to the share incentive plan. In May 2018, 1.2 million share options were granted under the EEI with a condition of achieving share price hurdles with a vesting period of 5 years. These performance conditions which are market conditions have been incorporated into the measurement by means of actuarial modelling. A risk-free rate of 0.91% and a dividend yield factor of 1.7% has been used for EEI options. The share price on the date the options were granted was 250.0 pence. The underlying expected volatility was determined by reference to historical data of the Company’s shares over the vesting period.
At 31 December 2019, options granted to subscribe for ordinary shares of the Company are as follows:
Option exercise period Number of shares under option
Date of grant
From To Unapproved Performance Share Plan
Enhanced Executive Incentive
Addendum
ExercisePrice
(pence)
Fair Value of options
(pence)
Life
(years)
Volatility
Nov 2012 Nov 2015 Nov 2022 4,942 – – 86.0 18.6 10 40%
Sep 2013 Sep 2016 Sep 2023 – 3,333 – 1.0 80.8 10 25%
Sep 2015 Sep 2018 Sep 2025 – 30,000 – 1.0 77.0 10 16%
Aug 2016 Aug 2019 Aug 2026 – 45,000 – 1.0 96.5 10 21%
Sep 2017 Sep 2020 Sep 2027 – 210,000 – 1.0 207.1 10 24%
May 2018 May 2021 May 2028 – 430,000 – 1.0 224.4 10 25%
May 2018 May 2023 May 2028 – – 850,000 1.0 121.0 10 25%
Jun 2018 Jun 2021 Jun 2028 – 100,000 – 1.0 218.4 10 25%
Sep 2018 Sep 2021 Sep 2028 – 515,000 – 1.0 225.3 10 23%
Oct 2019 Oct 2022 Oct 2029 – 500,000 – 1.0 177.8 10 17%
Nov 2019 Nov 2022 Nov 2029 – 254,400 – 1.0 211.7 10 18%
4,942 2,087,733 850,000
There are 4,942 unapproved options at 31 December 2019.
At 31 December 2018, options granted to subscribe for ordinary shares of the Company are as follows:
Option exercise period Number of shares under option
Date of grant
From To Approved/Unapproved
Performance Share Plan
Enhanced Executive Incentive
Addendum
ExercisePrice
(pence)
Fair Value of options
(pence)
Life
(years)
Volatility
Nov 2012 Nov 2015 Nov 2022 25,000 – – 86.0 18.6 10 40%
Sep 2013 Sep 2016 Sep 2023 – 6,666 – 1.0 80.8 10 25%
Sep 2014 Sep 2017 Sep 2024 – 8,334 – 1.0 74.8 10 18%
Apr 2015 Apr 2018 Apr 2025 – 4,000 – 1.0 86.7 10 16%
Sep 2015 Sep 2018 Sep 2025 – 250,000 – 1.0 77.0 10 16%
Aug 2016 Aug 2019 Aug 2026 – 270,000 – 1.0 96.5 10 21%
Sep 2016 Sep 2019 Sep 2026 – 100,000 – 1.0 81.6 10 22%
Sep 2017 Sep 2020 Sep 2027 – 250,000 – 1.0 207.1 10 24%
May 2018 May 2021 May 2028 – 450,000 – 1.0 224.4 10 25%
May 2018 May 2023 May 2028 – – 1,200,000 1.0 121.0 10 25%
Jun 2018 Jun 2021 Jun 2028 – 100,000 – 1.0 218.4 10 25%
Sep 2018 Sep 2021 Sep 2028 – 530,000 – 1.0 225.3 10 23%
25,000 1,969,000 1,200,000
For all options granted prior to 2013, the exercise price is also the share price at date of grant.
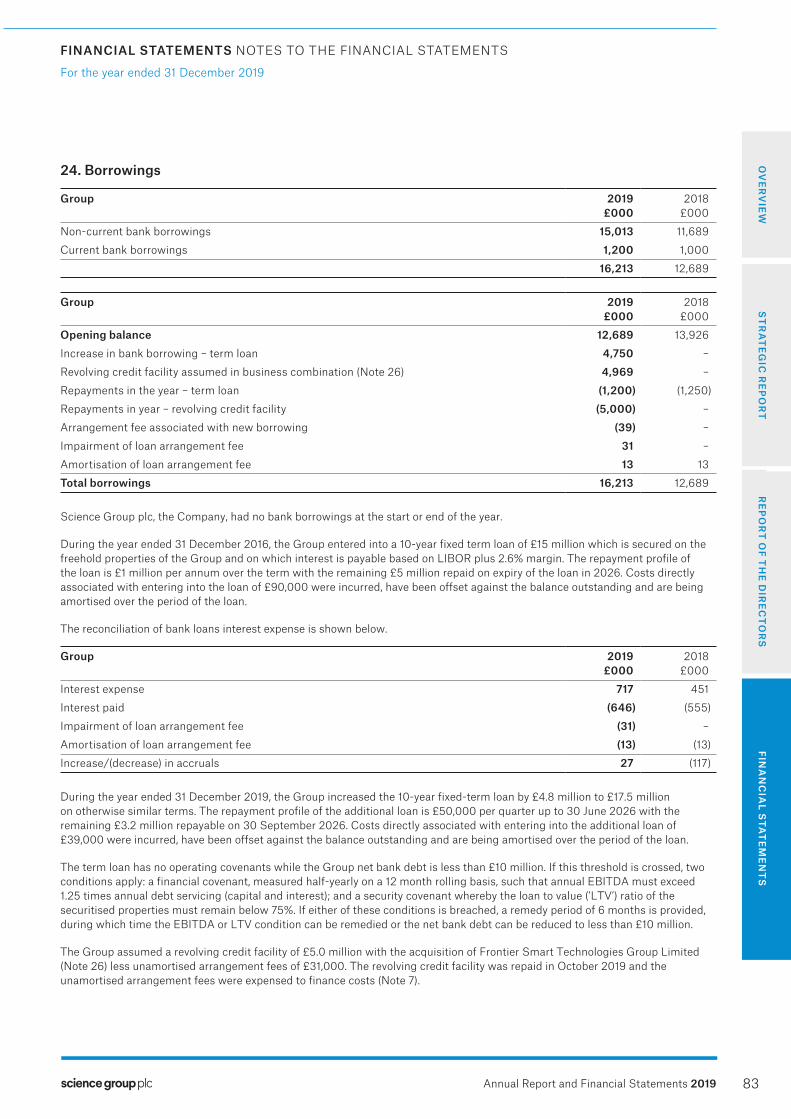
83
FINANCIAL STATEMENTS NOTES TO THE FINANCIAL STATEMENTS FINANCIAL STATEMENTS NOTES TO THE FINANCIAL STATEMENTS
OV
ER
VIE
WR
EP
OR
T O
F TH
E D
IRE
CT
OR
SS
TR
AT
EG
IC R
EP
OR
TFIN
AN
CIA
L STA
TE
ME
NT
S
For the year ended 31 December 2019
Annual Report and Financial Statements 2019
24. Borrowings
Group 2019£000
2018£000
Non-current bank borrowings 15,013 11,689
Current bank borrowings 1,200 1,000
16,213 12,689
Group 2019£000
2018£000
Opening balance 12,689 13,926
Increase in bank borrowing – term loan 4,750 –
Revolving credit facility assumed in business combination (Note 26) 4,969 –
Repayments in the year – term loan (1,200) (1,250)
Repayments in year – revolving credit facility (5,000) –
Arrangement fee associated with new borrowing (39) –
Impairment of loan arrangement fee 31 –
Amortisation of loan arrangement fee 13 13
Total borrowings 16,213 12,689
Science Group plc, the Company, had no bank borrowings at the start or end of the year.
During the year ended 31 December 2016, the Group entered into a 10-year fixed term loan of £15 million which is secured on the freehold properties of the Group and on which interest is payable based on LIBOR plus 2.6% margin. The repayment profile of the loan is £1 million per annum over the term with the remaining £5 million repaid on expiry of the loan in 2026. Costs directly associated with entering into the loan of £90,000 were incurred, have been offset against the balance outstanding and are being amortised over the period of the loan.
The reconciliation of bank loans interest expense is shown below.
Group 2019£000
2018£000
Interest expense 717 451
Interest paid (646) (555)
Impairment of loan arrangement fee (31) –
Amortisation of loan arrangement fee (13) (13)
Increase/(decrease) in accruals 27 (117)
During the year ended 31 December 2019, the Group increased the 10-year fixed-term loan by £4.8 million to £17.5 million on otherwise similar terms. The repayment profile of the additional loan is £50,000 per quarter up to 30 June 2026 with the remaining £3.2 million repayable on 30 September 2026. Costs directly associated with entering into the additional loan of £39,000 were incurred, have been offset against the balance outstanding and are being amortised over the period of the loan.
The term loan has no operating covenants while the Group net bank debt is less than £10 million. If this threshold is crossed, two conditions apply: a financial covenant, measured half-yearly on a 12 month rolling basis, such that annual EBITDA must exceed 1.25 times annual debt servicing (capital and interest); and a security covenant whereby the loan to value (’LTV’) ratio of the securitised properties must remain below 75%. If either of these conditions is breached, a remedy period of 6 months is provided, during which time the EBITDA or LTV condition can be remedied or the net bank debt can be reduced to less than £10 million.
The Group assumed a revolving credit facility of £5.0 million with the acquisition of Frontier Smart Technologies Group Limited (Note 26) less unamortised arrangement fees of £31,000. The revolving credit facility was repaid in October 2019 and the unamortised arrangement fees were expensed to finance costs (Note 7).
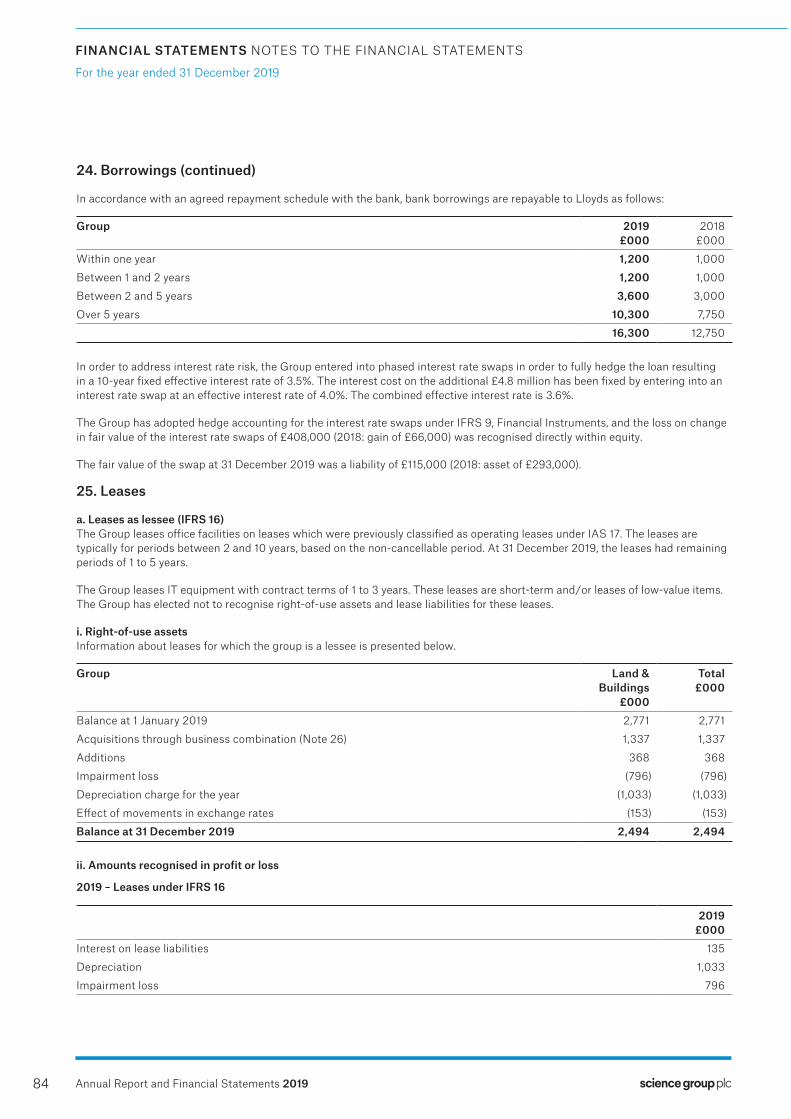
84
FINANCIAL STATEMENTS NOTES TO THE FINANCIAL STATEMENTS
For the year ended 31 December 2019
Annual Report and Financial Statements 2019
24. Borrowings (continued)
In accordance with an agreed repayment schedule with the bank, bank borrowings are repayable to Lloyds as follows:
Group 2019 £000
2018£000
Within one year 1,200 1,000
Between 1 and 2 years 1,200 1,000
Between 2 and 5 years 3,600 3,000
Over 5 years 10,300 7,750
16,300 12,750
In order to address interest rate risk, the Group entered into phased interest rate swaps in order to fully hedge the loan resulting in a 10-year fixed effective interest rate of 3.5%. The interest cost on the additional £4.8 million has been fixed by entering into an interest rate swap at an effective interest rate of 4.0%. The combined effective interest rate is 3.6%.
The Group has adopted hedge accounting for the interest rate swaps under IFRS 9, Financial Instruments, and the loss on change in fair value of the interest rate swaps of £408,000 (2018: gain of £66,000) was recognised directly within equity.
The fair value of the swap at 31 December 2019 was a liability of £115,000 (2018: asset of £293,000).
25. Leases
a. Leases as lessee (IFRS 16)The Group leases office facilities on leases which were previously classified as operating leases under IAS 17. The leases are typically for periods between 2 and 10 years, based on the non-cancellable period. At 31 December 2019, the leases had remaining periods of 1 to 5 years.
The Group leases IT equipment with contract terms of 1 to 3 years. These leases are short-term and/or leases of low-value items. The Group has elected not to recognise right-of-use assets and lease liabilities for these leases.
i. Right-of-use assetsInformation about leases for which the group is a lessee is presented below.
Group Land & Buildings
£000
Total£000
Balance at 1 January 2019 2,771 2,771
Acquisitions through business combination (Note 26) 1,337 1,337
Additions 368 368
Impairment loss (796) (796)
Depreciation charge for the year (1,033) (1,033)
Effect of movements in exchange rates (153) (153)
Balance at 31 December 2019 2,494 2,494
ii. Amounts recognised in profit or loss
2019 – Leases under IFRS 16
2019£000
Interest on lease liabilities 135
Depreciation 1,033
Impairment loss 796

85
FINANCIAL STATEMENTS NOTES TO THE FINANCIAL STATEMENTS FINANCIAL STATEMENTS NOTES TO THE FINANCIAL STATEMENTS
OV
ER
VIE
WR
EP
OR
T O
F TH
E D
IRE
CT
OR
SS
TR
AT
EG
IC R
EP
OR
TFIN
AN
CIA
L STA
TE
ME
NT
S
For the year ended 31 December 2019
Annual Report and Financial Statements 2019
25. Leases (continued)
a. Leases as lessee (IFRS 16) (continued)ii. Amounts recognised in profit or loss (continued)An impairment loss of £796,000 has been recognised in relation to the closure of the Frontier London and Cambridge (Sawston) offices and the reduction in physical office space in the Frontier Hong Kong office. This is included in the provisions relating to onerous leases and impairments of right-of-use assets in Note 26.
2018 Operating leases under IAS 17
2018£000
Lease expense 1,090
iii. Amounts recognised in statement of cash flows
2019£000
Total cash outflow for leases 1,133
iv. Lease LiabilitiesInformation about leases for which the group is a lessee is presented below.
Group 2019£000
Balance at 1 January 2,771Assumed in business combination (Note 26) 1,357Additions 368Repayments in year (998) Reduction due to foreign exchange fluctuations (175) Balance 31 December 2019 3,323
Lease liabilities are payable as follows
Group 2019£000
Within one year 1,212Between 1 and 5 years 2,111
3,323
b. Leases as lessorThe Group leases out some of the Harston site to third parties on leases which normally have a termination notice period of 3 to 6 months and typically for a 36-month term.
The leases are classified as operating leases from a lessor perspective because they do not transfer substantially all the risk and rewards to the ownership of the assets. Note 15 sets out information about the Harston leases.
Refer to Note 15 for rental income recognised by the Group during 2019.
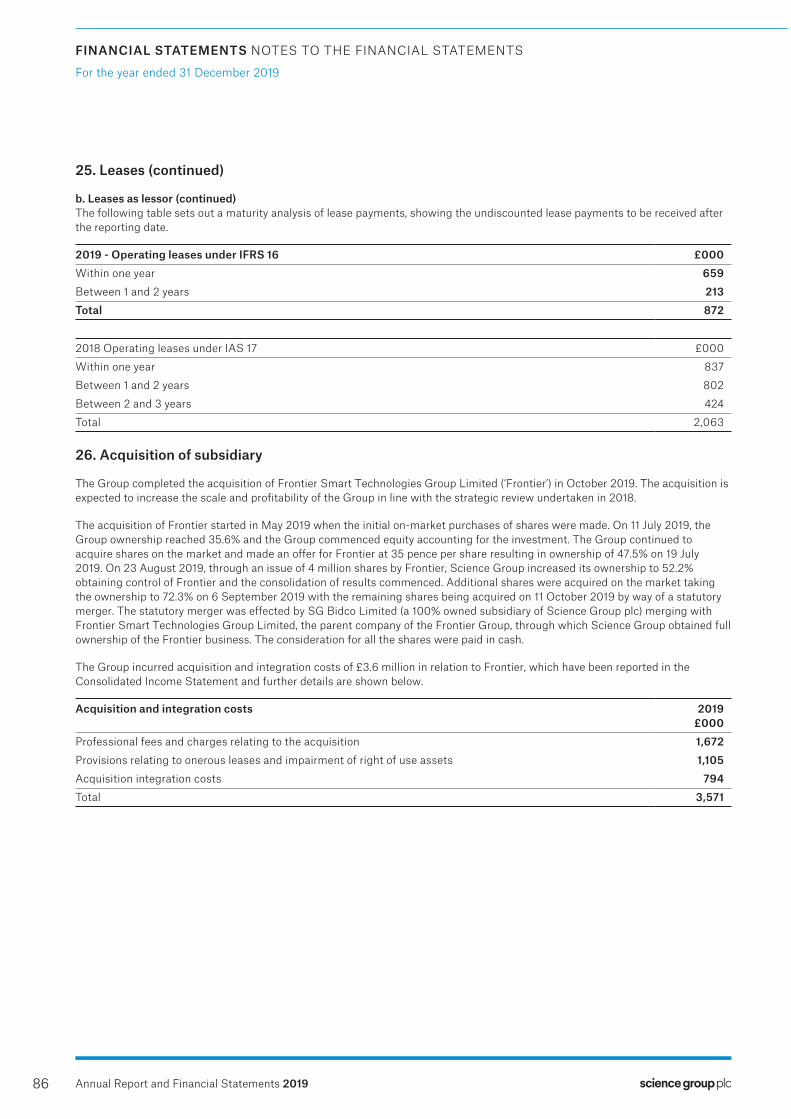
86
FINANCIAL STATEMENTS NOTES TO THE FINANCIAL STATEMENTS
For the year ended 31 December 2019
Annual Report and Financial Statements 2019
25. Leases (continued)
b. Leases as lessor (continued)The following table sets out a maturity analysis of lease payments, showing the undiscounted lease payments to be received after the reporting date.
2019 - Operating leases under IFRS 16 £000Within one year 659Between 1 and 2 years 213Total 872
2018 Operating leases under IAS 17 £000
Within one year 837
Between 1 and 2 years 802
Between 2 and 3 years 424
Total 2,063
26. Acquisition of subsidiary
The Group completed the acquisition of Frontier Smart Technologies Group Limited (‘Frontier’) in October 2019. The acquisition is expected to increase the scale and profitability of the Group in line with the strategic review undertaken in 2018.
The acquisition of Frontier started in May 2019 when the initial on-market purchases of shares were made. On 11 July 2019, the Group ownership reached 35.6% and the Group commenced equity accounting for the investment. The Group continued to acquire shares on the market and made an offer for Frontier at 35 pence per share resulting in ownership of 47.5% on 19 July 2019. On 23 August 2019, through an issue of 4 million shares by Frontier, Science Group increased its ownership to 52.2% obtaining control of Frontier and the consolidation of results commenced. Additional shares were acquired on the market taking the ownership to 72.3% on 6 September 2019 with the remaining shares being acquired on 11 October 2019 by way of a statutory merger. The statutory merger was effected by SG Bidco Limited (a 100% owned subsidiary of Science Group plc) merging with Frontier Smart Technologies Group Limited, the parent company of the Frontier Group, through which Science Group obtained full ownership of the Frontier business. The consideration for all the shares were paid in cash.
The Group incurred acquisition and integration costs of £3.6 million in relation to Frontier, which have been reported in the Consolidated Income Statement and further details are shown below.
Acquisition and integration costs 2019£000
Professional fees and charges relating to the acquisition 1,672Provisions relating to onerous leases and impairment of right of use assets 1,105Acquisition integration costs 794Total 3,571

87
FINANCIAL STATEMENTS NOTES TO THE FINANCIAL STATEMENTS FINANCIAL STATEMENTS NOTES TO THE FINANCIAL STATEMENTS
OV
ER
VIE
WR
EP
OR
T O
F TH
E D
IRE
CT
OR
SS
TR
AT
EG
IC R
EP
OR
TFIN
AN
CIA
L STA
TE
ME
NT
S
For the year ended 31 December 2019
Annual Report and Financial Statements 2019
26. Acquisition of subsidiary (continued)
The Income Statement of Frontier for the period from 23 August 2019 to 31 December 2019 that was consolidated into the Group is shown below:
£000Revenue 7,540
Operating expenses before adjusting items (8,823)
Adjusted operating loss (1,283)
Acquisition integration costs (794)
Provisions relating to onerous leases and impairment of right-of-use assets (1,105)
Share based payment charge (12)
Operating loss (3,194)
Finance costs (165)
Loss before income tax (3,359)
If the acquisition of Frontier had been completed on the first day of the financial year, Group revenue would have been £14.4 million higher and Group profit attributable to equity holders of the parent would have been £3.6 million lower.
(a) Accounting treatmentDetails of the acquisition and the accounting treatment of the investment in Frontier over the period 9 May 2019 to 11 October 2019 are summarised below:
Period Ownership Accounting Treatment Consideration Paid
£000On 9 May 2019 Acquired 3.1% of voting shares Fair value through profit or loss 144
10 May 2019 to10 July 2019
Holding of voting shares increased to 29.7%
Fair value through profit or loss 3,229
11 July 2019 Acquired 5.9% of voting sharesHolding increased to 35.6%
Equity accounted from 11 July 2019 (Note 1) 858
12 July 2019 to22 August 2019
Holding of voting shares increased to 47.5%
Equity accounted 1,711
23 August 2019 Frontier issued 4 million shares which were acquired by Science GroupHolding increased to 52.2%
Control obtained, consolidation commenced (Note 2) Remeasure pre–existing equity interest at acquisition date fair valueGoodwill calculated based on consideration, net assets and non controlling interest (‘NCI’) at 23 August 2019
1,000
24 August 2019 to10 October 2019
Holding of voting shares increased to 72.3%
Consolidated subsidiary with non–controlling interestChange in Group’s interest in Frontier accounted for as an equity transaction
2,277
11 October 2019 Completion of Statutory Merger resulting in remaining shares being acquired and holding increased to 100%
Remaining shares acquired accounted for as an equity transaction
3,592
Total consideration 12,811

88
FINANCIAL STATEMENTS NOTES TO THE FINANCIAL STATEMENTS
For the year ended 31 December 2019
Annual Report and Financial Statements 2019
26. Acquisition of subsidiary (continued)
(a) Accounting treatment (continued)Note 1The Group commenced equity accounting for the investment as an associate on 11 July 2019 when the shareholding of voting shares increased to 35.6%. Prior to this date, Science Group had no representation on the Board of Directors of Frontier. Further, the Group was unable participate in policy-making decisions due to 4 other significant shareholders whose combined holding totalled more than the voting shares held by Science Group. As a result, the Group was not able to exercise significant influence over Frontier.
On 11 July 2019, the Group increased its ownership of voting shares to 35.6% at which point the Group’s shareholding exceeded that of the other significant shareholders and hence was able to participate in the policy-making processes. As a result, the Group was able to exercise significant influence and equity accounting commenced on this date.
Note 2On 23 August 2019, the Group increased its holding of voting shares to 52.2%, obtained control of Frontier and commenced consolidation of the results.
On 23 August 2019, the equity accounted interest in Frontier was remeasured to fair value based on the market price per share of 25p. The Group had acquired 19.4 million shares up until this date and paid an average price of 30.6 pence per share hence the loss on remeasurement was £1.1 million.
In the period from 11 July 2019 to 22 August 2019, Frontier was equity accounted as an associate and the Group recorded its share of loss of the equity accounted investment of £0.6 million. The loss on remeasurement of £1.1 million has therefore been recorded in the Consolidated Income Statement as follows:
2019£000
Share of loss of equity accounted investment (from 11 July 2019 to 22 August 2019) 592Loss on remeasurement of equity-accounted investment (at 23 August 2019) 488Transaction costs associated with acquisition 3
1,083
Frontier was accounted for as a subsidiary with a non-controlling interest (NCI) from 23 August 2019. During the period from 23 August 2019 to 11 October 2019, the remaining NCI was acquired by the Group and Frontier became a 100% owned subsidiary on 11 October 2019. The change in the Group’s interest in Frontier has not resulted in loss of control and has been accounted for as an equity transaction.
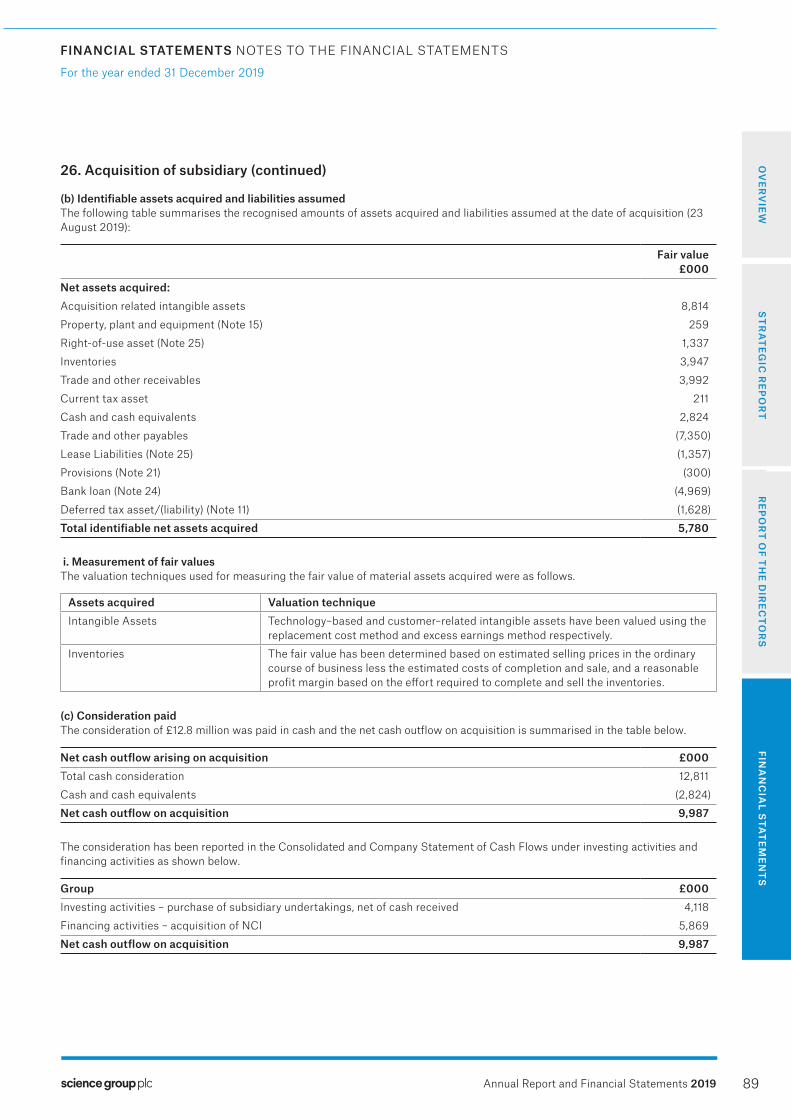
89
FINANCIAL STATEMENTS NOTES TO THE FINANCIAL STATEMENTS FINANCIAL STATEMENTS NOTES TO THE FINANCIAL STATEMENTS
OV
ER
VIE
WR
EP
OR
T O
F TH
E D
IRE
CT
OR
SS
TR
AT
EG
IC R
EP
OR
TFIN
AN
CIA
L STA
TE
ME
NT
S
For the year ended 31 December 2019
Annual Report and Financial Statements 2019
26. Acquisition of subsidiary (continued)
(b) Identifiable assets acquired and liabilities assumedThe following table summarises the recognised amounts of assets acquired and liabilities assumed at the date of acquisition (23 August 2019):
Fair value£000
Net assets acquired:Acquisition related intangible assets 8,814
Property, plant and equipment (Note 15) 259
Right-of-use asset (Note 25) 1,337
Inventories 3,947
Trade and other receivables 3,992
Current tax asset 211
Cash and cash equivalents 2,824
Trade and other payables (7,350)
Lease Liabilities (Note 25) (1,357)
Provisions (Note 21) (300)
Bank loan (Note 24) (4,969)
Deferred tax asset/(liability) (Note 11) (1,628)
Total identifiable net assets acquired 5,780
i. Measurement of fair valuesThe valuation techniques used for measuring the fair value of material assets acquired were as follows.
Assets acquired Valuation techniqueIntangible Assets Technology–based and customer–related intangible assets have been valued using the
replacement cost method and excess earnings method respectively.
Inventories The fair value has been determined based on estimated selling prices in the ordinary course of business less the estimated costs of completion and sale, and a reasonable profit margin based on the effort required to complete and sell the inventories.
(c) Consideration paidThe consideration of £12.8 million was paid in cash and the net cash outflow on acquisition is summarised in the table below.
Net cash outflow arising on acquisition £000Total cash consideration 12,811
Cash and cash equivalents (2,824)
Net cash outflow on acquisition 9,987
The consideration has been reported in the Consolidated and Company Statement of Cash Flows under investing activities and financing activities as shown below.
Group £000Investing activities – purchase of subsidiary undertakings, net of cash received 4,118
Financing activities – acquisition of NCI 5,869
Net cash outflow on acquisition 9,987
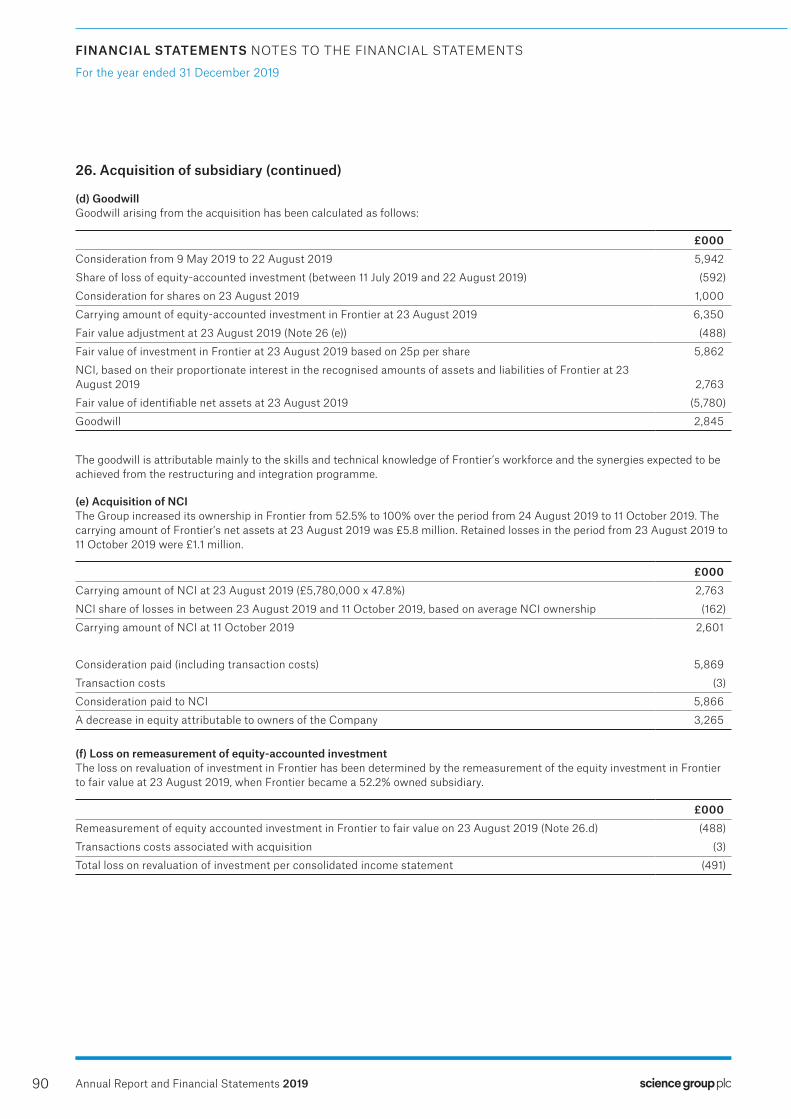
90
FINANCIAL STATEMENTS NOTES TO THE FINANCIAL STATEMENTS
For the year ended 31 December 2019
Annual Report and Financial Statements 2019
26. Acquisition of subsidiary (continued)
(d) GoodwillGoodwill arising from the acquisition has been calculated as follows:
£000Consideration from 9 May 2019 to 22 August 2019 5,942
Share of loss of equity-accounted investment (between 11 July 2019 and 22 August 2019) (592)
Consideration for shares on 23 August 2019 1,000
Carrying amount of equity-accounted investment in Frontier at 23 August 2019 6,350
Fair value adjustment at 23 August 2019 (Note 26 (e)) (488)
Fair value of investment in Frontier at 23 August 2019 based on 25p per share 5,862
NCI, based on their proportionate interest in the recognised amounts of assets and liabilities of Frontier at 23 August 2019 2,763
Fair value of identifiable net assets at 23 August 2019 (5,780)
Goodwill 2,845
The goodwill is attributable mainly to the skills and technical knowledge of Frontier’s workforce and the synergies expected to be achieved from the restructuring and integration programme.
(e) Acquisition of NCIThe Group increased its ownership in Frontier from 52.5% to 100% over the period from 24 August 2019 to 11 October 2019. The carrying amount of Frontier’s net assets at 23 August 2019 was £5.8 million. Retained losses in the period from 23 August 2019 to 11 October 2019 were £1.1 million.
£000Carrying amount of NCI at 23 August 2019 (£5,780,000 x 47.8%) 2,763
NCI share of losses in between 23 August 2019 and 11 October 2019, based on average NCI ownership (162)
Carrying amount of NCI at 11 October 2019 2,601
Consideration paid (including transaction costs) 5,869
Transaction costs (3)
Consideration paid to NCI 5,866
A decrease in equity attributable to owners of the Company 3,265
(f) Loss on remeasurement of equity-accounted investmentThe loss on revaluation of investment in Frontier has been determined by the remeasurement of the equity investment in Frontier to fair value at 23 August 2019, when Frontier became a 52.2% owned subsidiary.
£000Remeasurement of equity accounted investment in Frontier to fair value on 23 August 2019 (Note 26.d) (488)
Transactions costs associated with acquisition (3)
Total loss on revaluation of investment per consolidated income statement (491)

91
FINANCIAL STATEMENTS NOTES TO THE FINANCIAL STATEMENTS FINANCIAL STATEMENTS NOTES TO THE FINANCIAL STATEMENTS
OV
ER
VIE
WR
EP
OR
T O
F TH
E D
IRE
CT
OR
SS
TR
AT
EG
IC R
EP
OR
TFIN
AN
CIA
L STA
TE
ME
NT
S
For the year ended 31 December 2019
Annual Report and Financial Statements 2019
27. Commitments
a) Operating lease commitmentsThe minimum annual rentals under non-cancellable operating leases are as follows:
Group 2019£000
2018£000
Plant and equipment lease commitment– Within 1 year 40 74
– In the second and fifth years inclusive 26 64
66 138
Property lease rental (see Note below regarding 31 December 2019)– Within 1 year – 814
– In the second and fifth years inclusive – 2,217
– 3,031
Total operating lease commitments 66 3,169
Operating lease commitments represent rentals payable by the Group for certain of its property, plant and equipment to the next lease break clause or to the end of the lease, whichever is sooner.
Property rental commitments at 31 December 2019 are reported under IFRS 16 in Note 25.
b) Other financial commitmentsAt 31 December 2019 the Group and the Company had other financial commitments of £nil (2018: £nil).
28. Contingent liabilities
At 31 December 2019, there were £nil contingent liabilities (2018: £nil).

92
FINANCIAL STATEMENTS NOTES TO THE FINANCIAL STATEMENTS
For the year ended 31 December 2019
Annual Report and Financial Statements 2019
29. Related party transactions
The Group provides support and consultancy services to its subsidiaries and made loans, all of which eliminate on consolidation, and are therefore not disclosed.
The Company held intercompany balances, and charged management fees as follows:
Company 2019Loans due
(to)/from
2019Sale of
goods and services
2018Loans due
(to)/from
2018Sale of
goods and services
Sagentia Limited (1,061) 706 5,612 166
Sagentia Technology Advisory Limited 10 – 10 –
Oakland Innovation Limited – – – 64
Leatherhead Research Limited – – – 94
Technology Sciences Group Limited (52) – (52) –
Technology Sciences Group Consulting Limited (4,170) – (2,961) 77
TSGE Forum (11) – (11) –
TSG Iberia (1) – (1) –
TSG Inc. 133 – 104 45
TSG Canada (193) – (187) –
SG Bidco Ltd 3,592 – – –
Frontier Smart Technologies Limited 6,372 – – –
4,619 706 2,514 446
Sagentia Limited holds 30% of the ordinary share capital of Creactive (ID) Design Limited (“Creactive”). During the year, Creactive did not provide any consultancy services to Sagentia Limited (a subsidiary of Science Group plc) (2018: £120,000). Creactive had a licensing agreement in place with Sagentia Limited to occupy office space. During the year ended 31 December 2019, £3,000 was charged to Creactive in relation to this agreement (2018: £17,700).
Science Group plc also entered into a transaction with Cambridge Medical Technologies Limited (‘CMT’) (previously known as Clinitech Limited). One of the Directors of Science Group plc, Michael Lacey-Solymar, is also a Director of CMT and Director and Shareholder of CMT’s ultimate parent company. Sagentia Limited (a subsidiary of Science Group plc) entered into an agreement with CMT on 26 September 2014 to lease office space to CMT. During the year ended 31 December 2019, £11,300 (2018: £11,700) was charged to CMT in relation to this agreement.
The remuneration of the key management personnel of the Group, recognised in the income statement, is set out below in aggregate. Key management personnel include all members of the plc Board and the Operating Board of Science Group.
Aggregate remuneration
Year ended 31 December 2019£000
2018£000
Short-term employee benefits 1,591 1,754
Pension costs 42 49
Share based payment transactions 233 237
1,866 2,040

93
FINANCIAL STATEMENTS NOTES TO THE FINANCIAL STATEMENTS FINANCIAL STATEMENTS NOTES TO THE FINANCIAL STATEMENTS
OV
ER
VIE
WR
EP
OR
T O
F TH
E D
IRE
CT
OR
SS
TR
AT
EG
IC R
EP
OR
TFIN
AN
CIA
L STA
TE
ME
NT
S
For the year ended 31 December 2019
Annual Report and Financial Statements 2019
30. Critical accounting estimates and judgements
Estimates and judgements are continually evaluated and are based on historical experience and other factors, including expectations of future events that are believed to be reasonable under the circumstances. Science Group makes estimates and assumptions concerning the future. The resulting accounting estimates will, by definition, seldom equal the related actual results. The estimates and assumptions that have a significant risk of causing a material adjustment to the carrying amounts of assets and liabilities within the next financial year are discussed below.
(a) Critical accounting estimateProperty residual valuesResidual values have been estimated for the Epsom and Harston properties based on estimates of the amounts the Group would receive currently for the properties if they were already of an age and in the condition expected at the end of their useful lives.
Impairment testingThe recoverable amounts of cash generating units and individual assets have been determined based on the higher of the value-in-use calculations and fair value less costs to sell. These calculations require the use of estimates and assumptions. It is possible that the cash flow assumption may change which may then impact our estimations and may then require a material adjustment to the carrying value of intangible and tangible assets.
Science Group reviews and tests the carrying value of assets when events or changes in circumstance suggest that the carrying amount may not be recoverable. Assets are grouped at the lowest level for which identifiable cash flows are largely independent of cash flows of other assets and liabilities. If there are indications that impairment may have occurred, estimates are prepared of expected future cash flows for each group of assets.
Fair valuesThe fair values of the identifiable assets acquired and liabilities assumed were determined as part of the purchase price allocation of the acquisition. The management determined the fair values with the assistance of external independent valuation experts. Further information about the techniques and assumptions made in measuring fair values is included in Note 26 (b).
(b) Significant accounting judgementAccounting for freehold property at Harston MillScience Group owns and maintains the freehold property at Harston Mill for use in the supply of its Business Services and for administrative purposes.
Whilst there is remaining space on site not required to fulfil these activities, Science Group lets out space to third party tenants. The revenues and costs attributable to this activity are disclosed as third-party property income activities within the business segment disclosures. It is not accounted for as an investment property, the reasons being:
(i) the third-party leases include the use of common areas and because of this the areas that are leased to third parties could not be sold separately;
(ii) the leases normally have notice periods of no more than six months giving Science Group the flexibility to start using the areas if required, i.e. the leased areas are not held for capital appreciation or a return of investment through rental income.
Date of acquisition of FrontierThe acquisition of Frontier was an acquisition which commenced with an initial holding of 3.1% on 9 May 2019 through to 100% acquired on 11 October 2019. The acquisition was progressive and occurred over 6 months and judgement has been exercised in order to determine the following key dates:
(i) the date at which Frontier became an associate of the Group was determined by reference to the ability to exercise significant influence over Frontier, as set out in Note 26 (a) Note 1; and
(ii) the date at which the Group obtained control over Frontier, was determined by reference to the holding of voting shares exceeding 50%, as set out in Note 26 (a) Note 2.
31. Post balance sheet events
There are no post balance sheet events to disclose.

Annual Report and Financial Statements 2019
NOTES
94

95Annual Report and Financial Statements 2019
Websitewww.sciencegroup.com
Registered officeHarston Mill Harston Cambridge CB22 7GG
Company number06536543
NOTES