Embed Size (px)
Citation preview

23158.04 - Proof 2 - 14/03/2014
ANNUAL REPORT AND ACCOUNTS
JANUARY 2014

23158.04 - Proof 2 - 14/03/2014
NEXT IS A UK BASED MULTI-CHANNEL RETAILER OFFERING EXCITING, BEAUTIFULLY DESIGNED, EXCELLENT QUALITY CLOTHING, FOOTWEAR, ACCESSORIES AND HOME PRODUCTS.
NEXT distributes through three main channels: NEXT Retail, a chain of more than 500 stores in the UK and Eire; NEXT Directory, our home shopping division with almost 4 million active customers in the UK and overseas; and NEXT International Retail, with almost 200 mainly franchised stores.
Consolidated accounts72 Consolidated Income
Statement
73 Consolidated Statement of Comprehensive Income
74 Consolidated Balance Sheet
75 Consolidated Statement of Changes in Equity
76 Consolidated Cash Flow Statement
77 Group Accounting Policies
81 Notes to the Consolidated Financial Statements
Parent Company accounts108 Independent Auditor’s
Report on the Parent109 Parent Company
Balance Sheet110 Parent Company
Statement of Changes in Equity
111 Notes to the Parent Company Financial Statements
Additional information112 Half Year and Sector
Analysis112 Five Year History113 Notice of Meeting120 Other Information
Business reports 1 Highlights 2 Strategic Report: 2 Chairman’s Statement 3 Chief Executive’s Review18 Business Model19 Key Performance
Indicators20 Risks & Uncertainties22 Employees23 Social, Community &
Human Rights24 Environmental Matters26 Directors’ Report
including Annual General Meeting & other matters
Governance31 Directors’ Responsibilities
Statement32 Directors and Officers
33 Corporate Governance38 Remuneration Report70 Independent Auditor’s
Report on the Group
This document contains Forward Looking Statements — see the important information on page 121.

23158.04 - Proof 2 - 14/03/2014
HIGHLIGHTS:•Sales up 5.4% to over £3.7bn and
underlying profit growth of 11.8% to £695m.
•Strong net cash generation of £271m before share buybacks of £296m.
•EPS and ordinary dividend both up 23%; dividend remains covered 2.8 times.
•Special dividends announced for 2014, 50p paid in February and 50p payable in May.
•Strategy remains focused on products, profitability and returning cash to shareholders.
RevenueUnderlying continuing business
+5.4%
Jan 14 £3,740m
Jan 13 £3,548m
Jan 12 £3,441m
Jan 11 £3,298m
Jan 10 £3,261m
Profit before taxUnderlying continuing business
+11.8%
Jan 14 £695m
Jan 13 £622m
Jan 12 £570m
Jan 11 £543m
Jan 10 £499m
Earnings per shareUnderlying +23.0%Jan 14 366.1p
Jan 13 297.7p
Jan 12 255.4p
Jan 11 221.9p
Jan 10 188.5p
Dividends per shareExcluding special dividends
+22.9%
Jan 14 129p
Jan 13 105p
Jan 12 90p
Jan 11 78p
Jan 10 66p
Ad
diti
on
al i
nfo
rma
tion
Pare
nt C
om
pa
ny a
cc
ou
nts
Go
vern
an
ce
Co
nso
lida
ted
ac
co
un
tsBu
sin
ess
rep
ort
s
ANNUAL REPORT AND ACCOUNTS JANUARY 2014
1

23158.04 - Proof 2 - 14/03/2014
STRATEGIC REPORT
CHAIRMAN’S STATEMENT The year to January 2014 was a great year for NEXT. Underlying earnings per share grew by 23% to 366p and we propose to increase our full year ordinary dividends by 23% to 129p in total. This is the fifth consecutive year that our earnings per share and ordinary dividend have grown by over 15%. In addition, in February we paid a special dividend of 50p a share and have announced a further special dividend of 50p to be paid in May.
Sales for NEXT Directory, our online and catalogue business, grew by 12.4% narrowing the gap with NEXT Retail, which grew by 1.7%. The two businesses are complementary and support each other in an effective and efficient way. Operating margins in both businesses increased during the year. The Group’s underlying profit before tax rose 11.8% to £695m.
Cash flow was again strong and we continued our share buybacks, purchasing 6.2 million shares at an average price of £47.40 and reducing our shares in issue by 3.8%. During the year we returned £461m to shareholders through share buybacks and dividends.
Our share price again performed well, rising by 55% to £62.80. As a result of the increase, we stopped buying back our own shares at the end of October and have instead started to return surplus cash to shareholders through special dividends. We will reconsider buybacks when to do so would give an effective 8% return on the cash invested.
During the year there have been a number of changes to the Board. Andrew Varley, who had been a director for 23 years, retired from the Board in May 2013. Andrew has been with NEXT for 29 years, serving in various senior roles. On behalf of the Board I would like to thank him for all he has done for NEXT, particularly as our Group Property Director.
Christine Cross, who has made a much valued and active contribution to the Group as a Non-Executive Director, has served for 9 years and will step down from the Board at the AGM in May. We are currently searching for a new non-executive and will make an announcement in due course. Jonathan Dawson, our Senior Independent Director who has also served 9 years, has agreed to stay on the Board for one further year.
I am delighted to welcome onto the Board Michael Law, our Group Operations Director, and Jane Shields, our Group Sales and Marketing Director. Both joined the Board last July.
The strength of our Group is built on the hard work and productivity of our management team and all the people who work for NEXT. I would like to thank them all for their contribution during the year and especially for the excellent performance through the busy Christmas period.
That performance gives us a solid platform for 2014. Our strategy remains the same, focused on our products, our profitability and returning cash to our shareholders. Notwithstanding the continued pressure on the UK consumer, we anticipate another year of growth for NEXT.
John Barton Chairman
ANNUAL REPORT AND ACCOUNTS JANUARY 2014
2

23158.04 - Proof 2 - 14/03/2014
CHIEF EXECUTIVE’S REVIEWOVERVIEWNEXT has had another good year, achieving 5.4% growth in sales and 11.8% growth in underlying profit before tax. Strong cash generation enabled us to buy back 3.8% of shares outstanding without increasing financial leverage which, along with a lower tax rate, resulted in earnings per share (EPS) growing much faster than profits.
In the year to January 2014, underlying post-tax EPS grew by 23%. Our full year dividend is being increased in line with EPS, to 129p in total. We have announced two special dividends, each of 50p per share. The first was paid on 3 February and the second is payable on 1 May.
REVENUE excluding VAT
January 2014
£m
January 2013
£m
NEXT Retail 2,227.6 2,190.9 +1.7%
NEXT Directory 1,341.0 1,192.6 +12.4%
NEXT BRAND 3,568.6 3,383.5 + 5.5%
Other 171.4 164.3 + 4.3%
Total 3,740.0 3,547.8 + 5.4%
PROFIT and EPS Underlying excluding 2013 exceptionals
January 2014
£m
January 2013
£m
NEXT Retail 347.7 331.1 + 5.0%
NEXT Directory 358.5 302.1 +18.7%
Other 16.6 17.0
Operating profit 722.8 650.2 +11.2%
Net interest (27.6) (28.6)
Profit before tax 695.2 621.6 +11.8%
Taxation (142.0) (148.5)
Profit after tax 553.2 473.1 +16.9%
EPS 366.1p 297.7p +23.0%
Ordinary dividends per share 129.0p 105.0p +22.9%
Ad
diti
on
al i
nfo
rma
tion
Pare
nt C
om
pa
ny a
cc
ou
nts
Go
vern
an
ce
Co
nso
lida
ted
ac
co
un
tsBu
sin
ess
rep
ort
s
ANNUAL REPORT AND ACCOUNTS JANUARY 2014
3

23158.04 - Proof 2 - 14/03/2014
STRATEGIC REPORT
NEXT PLC ECONOMICS2014 PROFIT DRIVERSThe table below sets out the main drivers of the Group’s Profit and Loss account for the year. This shows how the sales from (1) new Retail space and (2) Online increased profit. Our existing stores (3) made the same profit as last year. It also shows how (4) cost inflation has been more than offset by (5) cost savings.
Profit Year Ending Jan 2013 £622mProfit from sales increases/decreases(1) Profit from new space + £12m(2) Profit from additional online sales growth + £48m(3) Cost/Profit of existing stores –
+ £60m + 9.7%Cost increases and savings (4) Inflation in cost base – £59m(5) Cost savings + £72m
+ £13m + 2.1%Profit Year Ending Jan 2014 £695m +11.8%
2012/13
£622m2013/14
£695m
Directory
+£48m
Space
+£12m
Cost Savings
+£72m
Cost Increases
-£59m
550 560 570 580 590 600 610 620 630 640 650 660 670 680 690 700 710
STRAIGHTFORWARD OBJECTIVESNEXT’s Operating ObjectivesThe Company has five operational objectives, as set out in the table below. These aims remain broadly unchanged from those given in this report last year. The only significant change is the addition of improving customer service as a goal for the year ahead.
Develop the NEXT Brand
Develop, improve and expand our product ranges, with particular emphasis on improving design across all our ranges.
Invest in online growth
Invest in growth from our online business, through improving UK delivery services, developing new overseas markets and expanding our online product offer.
Invest in profitable new space
Open profitable new retail space, maintaining the Company’s strict payback and profitability hurdles of 15% net store profit (before central overheads) and payback on net capital invested in 24 months.
Improve service Improve the quality of our service to customers provided by staff, both in stores and in our call centres.
Control costs Control costs through constantly developing more efficient ways of operating. This must be done without detracting from the quality of our products and services.
ANNUAL REPORT AND ACCOUNTS JANUARY 2014
4
23158.04 - Proof 2 - 14/03/2014
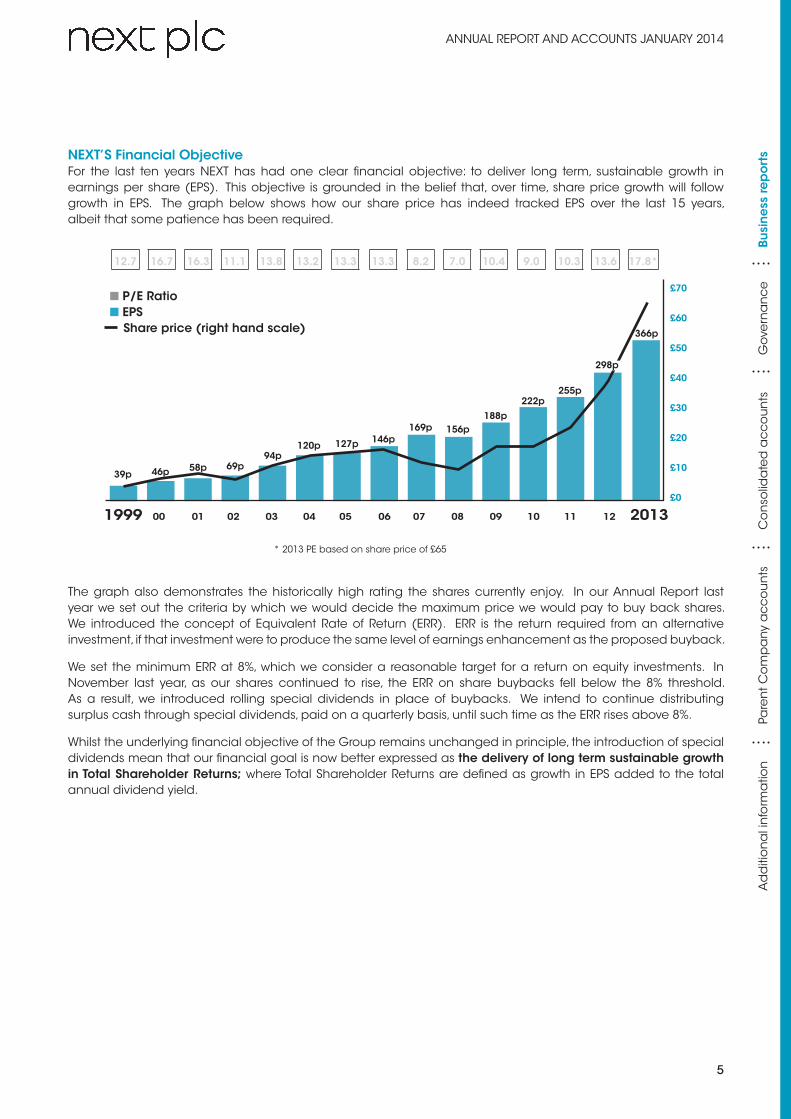
NEXT’S Financial ObjectiveFor the last ten years NEXT has had one clear financial objective: to deliver long term, sustainable growth in earnings per share (EPS). This objective is grounded in the belief that, over time, share price growth will follow growth in EPS. The graph below shows how our share price has indeed tracked EPS over the last 15 years, albeit that some patience has been required.
1999 00 01 02 03 04 05 06 07 08 09 10 11 12 2013
■ P/E Ratio■ EPS Share price (right hand scale)
* 2013 PE based on share price of £65
255p
£70
£60
£50
£40
£30
£20
£10
£0
39p 46p 58p 69p94p
120p 127p 146p169p 156p
188p
222p
298p
366p
12.7 16.7 16.3 11.1 13.8 13.2 13.3 13.3 8.2 7.0 10.4 9.0 10.3 13.6 17.8*
The graph also demonstrates the historically high rating the shares currently enjoy. In our Annual Report last year we set out the criteria by which we would decide the maximum price we would pay to buy back shares. We introduced the concept of Equivalent Rate of Return (ERR). ERR is the return required from an alternative investment, if that investment were to produce the same level of earnings enhancement as the proposed buyback.
We set the minimum ERR at 8%, which we consider a reasonable target for a return on equity investments. In November last year, as our shares continued to rise, the ERR on share buybacks fell below the 8% threshold. As a result, we introduced rolling special dividends in place of buybacks. We intend to continue distributing surplus cash through special dividends, paid on a quarterly basis, until such time as the ERR rises above 8%.
Whilst the underlying financial objective of the Group remains unchanged in principle, the introduction of special dividends mean that our financial goal is now better expressed as the delivery of long term sustainable growth in Total Shareholder Returns; where Total Shareholder Returns are defined as growth in EPS added to the total annual dividend yield.
Ad
diti
on
al i
nfo
rma
tion
Pare
nt C
om
pa
ny a
cc
ou
nts
Go
vern
an
ce
Co
nso
lida
ted
ac
co
un
tsBu
sin
ess
rep
ort
s
ANNUAL REPORT AND ACCOUNTS JANUARY 2014
5

23158.04 - Proof 2 - 14/03/2014
STRATEGIC REPORT
PRODUCT AND THE NEXT BRANDUnlike many high street retailers, NEXT designs and directly sources the vast majority of its products. We can do more to leverage our design resources and sourcing base to produce better quality fabrics, print designs, trim detailing and make up. In particular we will continue to push our design teams to adopt new trends in depth and with conviction. This approach of taking greater fashion risks may sound counter-intuitive but, in today’s fast moving fashion environment, to fall back on “safe” historical ranges would merely guarantee failure. On the whole, our experience is that where we have been braver in buying into new trends, we have been successful.
We have also adjusted our buying cycle to reflect the continuing trend for consumers to buy closer to the point at which they need the clothing. Our aim is to increase the availability of cold weather clothing in January, February and March and warm weather clothing in August and September. Going forward we will move away from a two season buying cycle to a four season cycle and our customers will see a bigger change from spring into summer (in April) and autumn into winter (in October).
Over the last 6 years we have made significant progress in developing our Home business. Trading space has more than doubled to 1.7 million square feet and Home sales now account for 18% of our total turnover. Over the next few years we intend to grow Home further by adding retail space and improving our online functionality.
RETAIL
RETAIL SALESTotal Retail sales were 1.7% ahead of last year, of which new space contributed 3.1%.
Full price sales grew by 2.9%. Markdown sales were 11% down as a result of stock for Sale being 15% lower than last year. This unusually low level of markdown came as a result of a last minute sales surge immediately before the summer and winter Sales. In the year ahead we expect markdown levels to return to more normal levels.
RETAIL SPACE EXPANSIONSpace added in the yearTrading space increased by 280,000 square feet over the year, taking us to 7 million, as shown below.
Store Numbers
Sq. Ft.(000’s)
January 2013 540 6,728
New stores +11 +192
Closures –10 – 67
Re-sites (8) and extensions (13) – +155
January 2014 541 7,008 + 4%
ANNUAL REPORT AND ACCOUNTS JANUARY 2014
6

23158.04 - Proof 2 - 14/03/2014
Portfolio Shape and ProfitabilityWhilst our space increased by 4%, the number of stores barely changed. Much of our new space has come from extending and re-locating in existing trading locations. Stores in new locations have been offset by the closure of smaller less profitable shops. As a result of this active management of our less profitable stores, our Mainline portfolio remains highly profitable despite continuing negative like for like sales in many locations. More than 90% of our sales come from stores which deliver more than 15% profit contribution on sales.
Mainline store profitability Percentage of turnover
>20%>15%>10%>5%>0%
76%91%96%98%
99.5%
Rental inflation remains very low, with most stores experiencing little or no increase at rent review. In the vast majority of cases, when stores reach the end of their lease, we have been able to reduce rents.
Returns on Capital and ProfitabilityProfitability of stores opened in the last 12 months is forecast to average 22% and payback on the net capital invested is expected to be 19 months. Both figures are within Company investment hurdles of 15% store profitability and 24 months capital payback.
New spaceSales vs
targetForecast
profitabilityForecast payback
Fashion + 4.4% 22% 19 months
Large Home format + 3.5% 21% 22 months
Total + 4.3% 22% 19 months
Retail Space – Pipeline We continue to look for opportunities to profitably increase UK selling space. For the coming year we expect to add 360,000 square feet (net of closures). We expect 113,000 of this to come from three large Home format out-of-town stores. For two of these shops (Maidstone, Kent and Hedge End, near Southampton) they are being built from the ground up to our own design, enabling us to ensure that the architecture of the building reflects the aspirations of our Brand.
RETAIL SERVICEIf our customers were to be asked to rate NEXT’s service we believe many would say it was generally good but not consistently exceptional. We think that we have an opportunity to improve both the consistency and quality of our retail customer service. During the last six months we have changed our recruitment processes, appraisal systems, training materials, man-hour planning systems and monthly bonus scheme with a view to focussing our store teams on providing better service. Initial results have been encouraging but there is a way to go.
In addition, we aim to improve the levels of staff experience in the business by increasing the average weekly contract worked by our staff. This change will take time and will be achieved through natural staff turnover. So that as and when staff leave the business some of their hours will be re-allocated to existing team members who want the extra work. A
dd
itio
na
l in
form
atio
nPa
ren
t Co
mp
any
ac
co
un
tsG
ove
rna
nc
eC
on
solid
ate
d a
cc
ou
nts
Busi
ne
ss re
po
rts
ANNUAL REPORT AND ACCOUNTS JANUARY 2014
7

23158.04 - Proof 2 - 14/03/2014
STRATEGIC REPORT
RETAIL PROFIT ANALYSIS Full year operating margin improved by 0.5% to 15.6%. The table below sets out significant margin movements by major heads of costs.
Net operating margin last year 15.1%Bought-in gross margin
In line with last year. 0.0%
Lower markdown Retail stock for Sale was down 15% with markdown sales down only 11%. Margin improved as a result of (1) higher participation of full price sales during the year and (2) improved clearance rates of Sale stock.
+ 0.8%
Reduction in freight, fabric and stock loss
Lower freight costs, improved fabric utilisation and reduced stock loss all served to increase margin.
+ 0.5%
Reduction in store payroll
In-store efficiency initiatives covered the cost of the annual pay review. + 0.1%
Increase in store occupancy
Rents and rates increased as a percentage of sales due to (1) negative like for like sales, (2) business rates and some rent inflation and (3) additional repair and store equipment write off costs.
- 0.7%
Central overheads Increased cost mainly due to staff incentives. - 0.2%
Net operating margin this year 15.6%
DIRECTORY
SALES ANALYSISDirectory sales were 12.4% ahead of last year. The table below shows the contribution to growth made by our UK and overseas online businesses.
Contribution to sales growth
UK 8.5%International 3.9%Total sales growth 12.4%
NEW CUSTOMERSDirectory active customer numbers increased year on year by 10.8% to 3.7 million, with growth coming from UK credit, UK cash and Overseas customers.
Average customers (‘000s)Jan
2014Jan
2013 Change
Contribution to customer
growth
UK cash customers 633 493 UK credit customers 2,798 2,697Total UK customers 3,431 3,190 + 241 7.2%Overseas customers 268 148 + 120 3.6%Total active customers 3,699 3,338 + 361 10.8%
ANNUAL REPORT AND ACCOUNTS JANUARY 2014
8

23158.04 - Proof 2 - 14/03/2014
DIRECTORY DEVELOPMENT – UKService ImprovementsIn October of this year we introduced free, next-day delivery to stores for customers who ordered before 10pm. This service is now available in 341 stores, which account for 74% of our retail turnover. As a result the percentage of orders made from home and delivered to store has risen from 30% to around 45%. In the year ahead we intend to extend this service to stores accounting for 99% of our retail turnover.
Going forward we will increase focus on improving the reliability of our Directory services. We fail to deliver around 2% of our parcels at the promised time, but know that there is an opportunity to improve this reliability. However, whatever improvements we make, there will always be a small number of errors. How our staff handle these rare events is central to developing our reputation. A Company’s ability to rectify mistakes is, for many customers, the litmus test of great service. We can do much to respond better to these occasions through improved recruitment, staff training and systems.
Directory Product Offer Our retail stores receive injections of new lines roughly every six weeks, with the year being divided into nine Retail phases. Directory has been reliant on the publication of four big catalogues and has missed out on some of the newest Retail stock. In future we will be adding stock to our website to coincide with our Retail phases, this stock will be supported by a number of “New-In” brochures.
For some years now NEXT has sold non-competing non-NEXT brands through the NEXT Directory. This year we are further expanding the branded offer in the Directory itself and, more importantly, trialling a standalone publication devoted exclusively to third party brands. This publication, which is currently called LABEL, has been distributed to 400,000 customers.
DIRECTORY DEVELOPMENT – INTERNATIONALWe continue to make good progress developing our internet business overseas. International online sales grew by 86% and contributed 3.9% to Directory growth. However, with a turnover of just over £100m, it is still relatively small and it would be a mistake to over-emphasise its importance. All overseas sales are currently serviced from our UK warehouses through third party distribution networks.
Sales InitiativesGrowth has been driven through a combination of improved pricing, site translations, the acceptance of new domestic currencies and the development of new territories. Of these factors, permanent price reductions have been by far the most important. The table below sets out the international growth drivers for last year and those planned for the year ahead. In addition to the initiatives listed in the table, we will be investigating ways to improve our delivery service in key territories.
Growth Driver Completed January 2014 Planned by January 2015
Lower Prices Prices lowered in 28 territories representing 52% of turnover
Prices to be lowered in 5 countries representing only 2.3% of turnover
Translations Traditional Chinese script (Taiwan) New languages including French, Spanish, Polish, Arabic, Simplified Chinese script and Hebrew
Domestic Currencies Five countries converted to domestic currency
11 countries converting to domestic currencies
New Territories China, Egypt, Brazil, Oman, Saudi Arabia, Belarus, Libya, Malta, Cyprus, Lebanon and Azerbaijan
New Tender Types Qiwi (Russian e-wallet) Paypal, Klarna (Germany)
Ad
diti
on
al i
nfo
rma
tion
Pare
nt C
om
pa
ny a
cc
ou
nts
Go
vern
an
ce
Co
nso
lida
ted
ac
co
un
tsBu
sin
ess
rep
ort
s
ANNUAL REPORT AND ACCOUNTS JANUARY 2014
9

23158.04 - Proof 2 - 14/03/2014
STRATEGIC REPORT
Online Overseas Profitability and the Year AheadNet margins on our overseas business fell from 19% to 18%, reflecting keener prices and some marketing initiatives. We expect net margins in the year ahead to remain at 18%.
Going forward we expect growth rates to ease a little, as the price adjustments made in 2013 begin to annualise. We are currently forecasting for International online sales to grow by 50% to £150m. The table below sets out the last two years sales, profits and net margins alongside our budget for the current year.
£mJanuary
2013January
2014January 2015 (e)
Sales £54m £101m £150mNet Profit £10m £18m £27mNet Margin 19% 18% 18%
DIRECTORY PROFIT ANALYSISFull year operating margin improved by 1.4% to 26.7%. The table below sets out significant margin movements by major heads of costs.
Net operating margin last year 25.3%Bought-in gross margin Bought-in gross margin improved due to a planned reduction in
sales of lower margin electrical products.+ 0.2%
Lower markdown Directory stock for Sale was down 9% whereas markdown sales were level. Margin improved as a result of (1) higher participation of full price sales during the year and (2) improved clearance rates of Sale stock.
+1.8%
Freight, fabric and stock loss Lower freight costs, improved fabric utilisation and reduced stock loss. + 0.2%
Service charge & bad debt Service charge income increased, but at a lesser rate than total sales due to the increased participation of International and UK cash sales.
– 0.4%
Increase in warehouse and distribution costs
International sales increased distribution costs, reducing margin by -0.7%. Using our store network for more UK parcel collections and returns improved margin by + 0.2%.
– 0.5%
Catalogue production costs Catalogue production costs increased, but at a lesser rate than sales. + 0.2%
Central overheads Reduced margin mainly due to increased staff incentives. – 0.1%
Net operating margin this year 26.7%
ANNUAL REPORT AND ACCOUNTS JANUARY 2014
10

23158.04 - Proof 2 - 14/03/2014
COST INFLATION AND COST CONTROLThis year we have more than offset cost increases with cost savings. The tables below outline the main contributors to cost increases and cost savings over the last year. Cost control remains at the heart of the business and we remain determined that cost savings must come through innovation and efficiency rather than any compromise to our product quality or services.
Cost Increases £m
Cost of living awards, other wage related inflation and staff incentives 28Rent, rates & other occupancy costs 13Costs of Directory delivery service improvements 9Warehouse capacity 5Systems investments and other 4Total Cost Increases 59
Cost Savings £m
Lower markdown 18Freight, fabric and stock loss 15Directory operating efficiencies 15Retail manpower efficiencies and other cost savings 13Non-stock purchasing improvements (e.g. paper) 7Other 4Total Cost Savings 72
In the year ahead we expect cost increases of around £44m. Anticipated wage increases account for £27m of this rise, the majority of which comes from our annual cost of living award. We expect these cost increases to be more than offset by cost savings.
Head Office, Warehouse and Systems Projects 2014/15The rapid growth of our Online and Home businesses means that we have an unusual number of big systems and warehousing projects starting in the current year. These projects will give some operational benefits but are mainly required to facilitate continued growth or replace obsolete systems. Most systems development costs are revenue costs and written off in the year they are incurred. Hardware and other infrastructure are depreciated over the life of the asset.
The table below sets out the largest projects and their estimated capital and revenue costs.
ProjectLife Years
Revenue Costs (e)
Capital Costs (e)
Store till, back office and payment systems upgrade 1 £3m £8mMainframe upgrade and modernisation 2 £3m –International website re-write and convergence with UK 2 £1m –Systems office refurbishment and data centres 1 – £5mHome warehouse expansion (including £8m for land) 2 – £11mTotal £7m £24mTotal likely to be incurred in year ending January 2015 £5m £20m
Ad
diti
on
al i
nfo
rma
tion
Pare
nt C
om
pa
ny a
cc
ou
nts
Go
vern
an
ce
Co
nso
lida
ted
ac
co
un
tsBu
sin
ess
rep
ort
s
ANNUAL REPORT AND ACCOUNTS JANUARY 2014
11

23158.04 - Proof 2 - 14/03/2014
STRATEGIC REPORT
OTHER GROUP BUSINESSESNEXT SOURCINGNEXT Sourcing (NS) had a good year, increasing sales and achieving a profit of £34m. NS competes for business against the many other suppliers to NEXT Retail and NEXT Directory, it continued to provide more than 40% of NEXT Brand stock. Each of its in-country offices operates in a very competitive environment, both against external suppliers and other NS offices.
£m 2014 2013
Sales 571.2 507.1 +13%
Operating profit 34.1 30.8 +11%
Operating margin 6.0% 6.1%
We are forecasting NEXT Sourcing profits of £36m in the year ahead.
INTERNATIONAL RETAIL AND FRANCHISE STORESOur franchise business, with partners operating 173 stores in 35 countries, continued to grow both sales and profits. The number of directly owned stores has been reduced to 16 and they broke even for the first time. Our 11 stores in Central Europe made a small profit, offset by a small loss in China. We do not aim to expand our directly owned international stores. Revenue and profit are set out below.
£m 2014 2013
Franchise income 71.0 61.5
Owned store sales 14.6 16.2
Total revenue 85.6 77.7 +10%
Operating profit 12.1 8.4 + 44%
We are budgeting for International Retail to make a profit of £14m in the year ahead.
LIPSYFull year sales of £63m and operating profit of £5m, before amortisation and profit share of £2m, was the best performance in our five years of ownership. Lipsy’s retail sales were £20m, taken from 49 stores trading 57,000 square feet, and sales to wholesale customers were £22m. Online sales, through Lipsy’s own site and the NEXT Directory were £21m. We expect further sales and profit growth from Lipsy in the years ahead.
ANNUAL REPORT AND ACCOUNTS JANUARY 2014
12
23158.04 - Proof 2 - 14/03/2014
CENTRAL COSTS AND OTHER ACTIVITIESThe table below sets out other Group and non-trading activities.
£m 2014 2013
Property management 1.8 3.5Central costs (33.3) (35.3)Pension variation 2.6 3.6Unrealised foreign exchange (5.9) 3.4Associates 2.5 0.6Total (32.3) (24.2)
UNREALISED FOREIGN EXCHANGE IAS 39The £6m loss for the year compares with a £3m gain in the prior year. At this time it is not possible to predict the year ahead, so group profit guidance assumes no IAS 39 gain or loss.
INTEREST AND TAXATIONThe interest charge was £28m, £1m less than last year. For the coming year we expect net debt to again range between £500m and £750m. This will result in an interest charge of £30m due to the higher level of bond debt and low interest rates available on cash deposits.
Our tax rate reduced as expected to 20.4%, due to the reduction in headline UK corporation tax rates and agreement of prior year items with HMRC. We expect our effective rate will be no higher than 21% in each of the next two years.
BALANCE SHEET AND ORDINARY DIVIDENDSThe balance sheet remains strong, with year end net debt of £517m and forecast peak borrowing requirements being very securely financed by our bonds and committed bank facilities of £1,088m. During the last six months we repaid the 2013 bond, issued a new 12 year bond and extended our bank facility, all as set out below.
£m
2016 bonds 2132021 bonds 3252026 bonds 250Total bonds nominal value 7882019 committed bank facility 300Total debt facilities available 1,088
FINAL DIVIDENDWe have proposed raising our final dividend to 93p, taking the total dividend for the year to 129p. The increase of 23% is in line with growth in underlying EPS. Dividend cover remains at 2.8 times.
Ad
diti
on
al i
nfo
rma
tion
Pare
nt C
om
pa
ny a
cc
ou
nts
Go
vern
an
ce
Co
nso
lida
ted
ac
co
un
tsBu
sin
ess
rep
ort
s
ANNUAL REPORT AND ACCOUNTS JANUARY 2014
13

23158.04 - Proof 2 - 14/03/2014
STRATEGIC REPORT
CASH GENERATION, SHARE BUYBACKS AND SPECIAL DIVIDENDS
CASH GENERATIONOver the last year we generated £326m of surplus cash after capex, interest, dividends and tax, of which £26m was used to maintain our ESOT. The balancing £300m was returned to shareholders through share buybacks and permanently increasing the level of cover in our ESOT (which enhances EPS by as much as a buyback).
We expect to generate around the same amount of free cash in the year ahead and are again budgeting to return £300m of cash to shareholders during the year. We paid a £75m special dividend in February and have committed to a further £75m special dividend which will be paid in May. Assuming the share price remains at its current level and our profit expectations remain unchanged, it is our intention to carry on paying quarterly special dividends for the remainder of the current year.
SHARE BUYBACK PRICE LIMIT GOING FORWARDIn the Chief Executive’s Review last year we set out the criteria by which we would decide the maximum price the Company would pay to buy back shares. We introduced the concept of Equivalent Rate of Return (ERR). ERR is the return required from an alternative investment, if that investment were to produce the same level of earnings enhancement as the proposed buyback. We set the minimum ERR at 8%, which we consider a reasonable target for a return on equity investments.
Over the course of the year we have discussed this concept with our shareholders. Most agree that the 8% limit is reasonable but many have commented that it would be more logical to use the Company’s guidance for forward profits as a basis for calculating the 8% ERR, rather than historic profits. We agree with this point and, going forward, will set our price limit on the basis of the mid-point of our forward guidance.
For year ending January 2015 the mid-point of our guidance is for profit before tax to be £750m (see below). On this basis a buyback of £300m at £62.45 would give an ERR of 8% and this figure now represents our upper limit for share buybacks. For clarity, in order for us to revert back to a buyback programme we would need to be convinced that any share price move below our target was likely to be sustained and that our profit expectations had not changed.
ANNUAL REPORT AND ACCOUNTS JANUARY 2014
14

23158.04 - Proof 2 - 14/03/2014
OUTLOOK FOR 2014
THE CONSUMER ECONOMYThe consumer economy has steadily improved over the course of the last year. This modest improvement looks set to continue. However, conditions are likely to remain far from buoyant and there are real risks to the sustainability of the current recovery.
Employment Remains StrongThe most positive aspect of the economy remains employment, which continues to rise to record highs.
30.0m
29.5m
29.0m
28.5m
Jan 10 Jan 11 Jan 12 Jan 13 Jan 14
Three month rolling average
Source: ONS, 19 Feb 2014
Total UK Employment Dec 2013
30.15m
Credit Constraints RecedeConsumer credit has been steadily flowing back into the market. The graph below shows the reversal of credit flows back into the market during 2013, with positive flows of around £7bn during the year (which equates to around 1% of UK earnings). Mortgage approvals are also growing strongly and housing transactions are following suit, this change has been reflected in strong growth in our Home division over the last six months.
1.5bn
1.0bn
0.5bn
0.0bn
-0.5bn
-1.0bn
Jan 10 Jul 10 Jan 11 Jul 11 Jan 12 Jul 12 Jan 13 Jul 13 Jan 14
UK Credit FlowSource: Bank of England, 3 March 2014
Ad
diti
on
al i
nfo
rma
tion
Pare
nt C
om
pa
ny a
cc
ou
nts
Go
vern
an
ce
Co
nso
lida
ted
ac
co
un
tsBu
sin
ess
rep
ort
s
ANNUAL REPORT AND ACCOUNTS JANUARY 2014
15

23158.04 - Proof 2 - 14/03/2014
STRATEGIC REPORT
Real Earnings Pressure Easing but Still NegativeThroughout 2013, growth in earnings began to close the gap with inflation. Encouragingly, in January there was little or no decline in real earnings. If this trend continues, and real earnings move into growth, it will be good news for the UK consumer environment. It would be the first time we have seen growth in real earnings for over five years.
Jan 10
UK Real Earnings - CPI and Earnings Growth
6.0%
5.0%
4.0%
3.0%
2.0%
1.0%
0.0%
Jul 10 Jan 11 Jul 11 Jan 12 Jul 12 Jan 13 Jul 13 Jan 14
■ CPI■ Average Earnings
Nonetheless, it is worth noting that last year’s increase in spending appears to have been driven through increased credit (see above). If anything has been learnt from the last ten years it is that credit cannot continue to grow faster than wages forever. Until we see significant increase in the supply side of the economy (profitable investment and improved productivity), we cannot bank on a return to sustained growth. Consequently we remain cautious in our budgeting for the year ahead.
OUTLOOK FOR NEXT BRAND SALES 2014We are budgeting for total NEXT Brand sales growth of between 4% and 8% in the year ahead, this compares to the 1% to 4% estimate we gave at this time last year. It reflects the underlying improvement in the economy and the fact that we are opening 1% more new space than last year.
Some might argue that our sales range is conservative when compared to the 5.5% growth we achieved last year. However, last year’s total was significantly enhanced by the exceptional last quarter. In the year ahead we expect the fourth quarter to provide tough comparatives and it will be hard to beat. Accordingly we are budgeting very cautiously for the final quarter. The chart below illustrates the anomalous performance in Q4.
Q1 2013
2013/14 Full Year Growth 5.5%
2013 Q1 - Q3 Growth 3.0%
NEXT Brand Quarterly Sales Growth 2013/1412%
11%
10%
9%
8%
7%
6%
5%
4%
3%
2%
1%
0%
Q2 2013 Q3 2013 Q4 2013 2014/15 ( e)
Low 4%
Top EndGuidance 8%
2.5% 4.3% 11.5%2.2%
ANNUAL REPORT AND ACCOUNTS JANUARY 2014
16

23158.04 - Proof 2 - 14/03/2014
GUIDANCE – GROUP PROFITS AND EPS FOR THE YEAR AHEADThe table below sets out our guidance for the full year. For the purposes of this guidance we have assumed that surplus cash of £300m is returned as special dividends, in reality this will depend on the prevailing share price as explained above.
Guidance Estimates Lower end
of guidanceUpper end
of guidance
Total Brand sales % growth + 4% + 8%Profit before tax £730m £770mProfit before tax % growth + 5% +11%Ordinary Dividend Yield (assuming £65 share price) + 2% + 2%Special Dividend Yield (assuming £65 share price) + 3% + 3%Total Shareholder Returns +10% +16%
INTERIM MANAGEMENT STATEMENTOur next statement will cover the first thirteen weeks of the year, to 26 April 2014, and is provisionally scheduled for Wednesday 30 April 2014.
Lord Wolfson of Aspley Guise Chief Executive 20 March 2014
Ad
diti
on
al i
nfo
rma
tion
Pare
nt C
om
pa
ny a
cc
ou
nts
Go
vern
an
ce
Co
nso
lida
ted
ac
co
un
tsBu
sin
ess
rep
ort
s
ANNUAL REPORT AND ACCOUNTS JANUARY 2014
17

23158.04 - Proof 2 - 14/03/2014
STRATEGIC REPORT
BUSINESS MODELNEXT is a UK based multi-channel retailer offering exciting, beautifully designed, excellent quality clothing, footwear, accessories and home products. NEXT is one of the largest clothing and home products retailers in the UK by sales, and a member of the FTSE-100 index. The Group is primarily comprised of:
❚ NEXT Retail, a chain of more than 500 stores in the UK and Eire.The majority of our stores sell clothing, footwear, accessories and home products; we also operate over 50 large Home Standalone and department style stores. The predominantly leased store portfolio is actively managed, with openings and closures based on store profitability and cash payback. Around 60% of group sales are from NEXT Retail.
❚ NEXT Directory, an online and catalogue shopping business with almost 4 million active customers and international websites serving approximately 70 countries.By embracing the internet, providing exceptional customer service and developing overseas opportunities, over the last ten years NEXT Directory’s sales have grown by more than 150% and now represent over one third of group sales.
There are strong synergies between NEXT Retail and NEXT Directory: through efficient stock management and customer service opportunities (such as handling Directory collections and returns in-store) the Group has been able to successfully develop both parts of the business.
❚ NEXT International Retail, with almost 200 mainly franchised stores around the world.NEXT’s franchise partners operate over 170 stores in 35 countries; there are also a small number of stores which NEXT operates directly. International Retail accounts for around 2% of Group sales.
❚ NEXT Sourcing, which designs, sources and buys NEXT branded products.Last year, over 40% of the Group’s products were procured or produced by NEXT Sourcing. Further information on the Group’s supply chain and NEXT’s commitment to ethical trading can be found on page 23.
❚ Lipsy, which designs and sells Lipsy branded younger women’s fashion products.Lipsy trades from around 50 stores, online, and through wholesale and franchise channels. Lipsy contributes around 2% of Group sales.
Further detail on the performance and development of the Group’s businesses can be found in the Chief Executive’s Review on pages 3 to 17, which forms part of this Strategic Report along with Key Performance Indicators (page 19), Risks & Uncertainties (page 20), Employees (page 22), Social, Community and Human Rights (page 23) and Environmental Matters (page 24).
Business strategies and objectivesThe primary financial objective of the Group is to deliver long term returns to shareholders through a combination of sustainable growth in earnings per share (“EPS”) and payment of cash dividends. Underlying EPS increased by 23% from last year. Over the last ten years EPS has increased by almost 300%, and the share price has increased by almost 400%. This long term value has been created through the consistent pursuit of the following strategies:
❚ Improving and developing NEXT product ranges, success in which is measured by sales performance.
❚ Profitably increasing retail selling space. New store appraisals must meet demanding financial criteria before the investment is made, and success is measured by achieved profit contribution and return on capital against appraised targets.
❚ Increasing the number of profitable NEXT Directory customers and their spend, both in the UK and through international online sales.
❚ Managing gross and net margins through efficient product sourcing, stock management and cost control.
❚ Maintaining the Group’s financial strength through an efficient balance sheet and secure financing structure.
❚ Generating and returning surplus cash to shareholders by way of share buybacks or, more recently, special dividends. Further information on the criteria we use to determine the method by which surplus cash is returned can be found in the Chief Executive’s Review.
ANNUAL REPORT AND ACCOUNTS JANUARY 2014
18

23158.04 - Proof 2 - 14/03/2014
KEY PERFORMANCE INDICATORSKPI’s of earnings per share, group cash flows and divisional revenues and profits are detailed in the Chief Executive’s Review and elsewhere in this Annual Report. Details of other key performance indicators used in the management of the business are provided below:
NEXT Retail selling space 2014 2013Annual
change
Store numbers 541 540 +1Square feet 000’s 7,008 6,728 + 4.2%Selling space is defined as the trading floor area of a store which excludes stockroom and administration areas.
2014 2013
NEXT Retail stores and sales No. storesLFL
Sales % No. storesLFL
Sales %
Total like for like 535 –1.8% 530 – 3.8%Underlying 498 –1.4% 473 – 3.2%NEXT defines like for like stores as those that have traded for at least one full year and have not benefited from significant capital expenditure. Sales from these stores for the current year are then compared with the same period in the previous year to calculate like for like sales figures. Underlying like for like sales applies the same calculation but excludes stores impacted by new store openings.
NEXT Retail operating margin movement 2014 2013
Net operating margin last year 15.1% 14.8%Increase in achieved gross margin +1.3% + 0.6%Decrease/increase in store payroll + 0.1% – 0.1%Increase in store occupancy – 0.7% – 0.4%Increase/decrease in other costs – 0.2% + 0.2%Net operating margin this year 15.6% 15.1%Gross margin is the difference between the cost of stock and the initial selling price; achieved gross margin is after markdown and stock related costs. Net operating margin is profit after deducting markdowns and all direct and indirect trading costs. All are expressed as a percentage of achieved VAT exclusive sales.
NEXT Directory customers 2014 2013Annual
change
Average active customers – credit 2,798,000 2,697,000 + 3.7%Average active customers – cash 901,000 641,000 + 40.6%Average active customers – total 3,699,000 3,338,000 +10.8%Average sales per customer £363 £357 +1.7%Active customers are defined as those who have placed an order or made a payment in the last 20 weeks, calculated as a weighted average of each week’s figure. Credit customers are those who order using a Directory credit account, whereas cash customers are those who pay when ordering. Average sales per customer are calculated as VAT exclusive sales, including service charge, divided by the average number of active customers.
NEXT Directory operating margin movement 2014 2013
Net operating margin last year 25.3% 24.1%Increase in achieved gross margin + 2.2% + 0.8%Decrease in bad debt + 0.1% + 0.3%Decrease/increase in service charge income – 0.5% + 0.2%Increase in other costs – 0.4% – 0.1%Net operating margin this year 26.7% 25.3%
Share buybacks 2014 2013
Number of shares purchased (‘000) 6,202 7,510% of opening share capital 3.8% 4.5%Total cost £295.8m £241.3mAverage cost per share £47.70 £32.13Total cost of shares purchased includes stamp duty and associated costs. The average price before costs was £47.40 (2013: £31.92).
Ad
diti
on
al i
nfo
rma
tion
Pare
nt C
om
pa
ny a
cc
ou
nts
Go
vern
an
ce
Co
nso
lida
ted
ac
co
un
tsBu
sin
ess
rep
ort
s
ANNUAL REPORT AND ACCOUNTS JANUARY 2014
19

23158.04 - Proof 2 - 14/03/2014
STRATEGIC REPORT
RISKS & UNCERTAINTIESThe Board has a policy of continuous identification and review of key business risks and oversees the development of processes to ensure that these risks are managed appropriately. Executive directors and operational management are delegated with the task of implementing these processes and reporting to the Board on their outcomes. The key risks identified by the Board are summarised below:
❚ Business strategy development & implementation
If the Board adopts the wrong business strategy or does not implement its strategies effectively, the business may suffer. The Board needs to understand and properly manage strategic risk in order to deliver long term growth for the benefit of NEXT’s stakeholders. The Board reviews business strategy on a regular basis to determine how sales and profit budgets can be achieved or bettered and business operations made more efficient. This process involves the setting of annual budgets and longer term financial objectives to identify ways in which to increase shareholder value. Critical to these processes are the consideration of wider economic and industry specific trends that affect the Group’s businesses, the competitive position of its product offer and the financial structure of the Group.
❚ Liquidity & credit risk
The Group has adequate medium and long term financing in place to support its business operations. The Board continues to assess its exposure to counterparty risk in the light of the prevailing economic climate both in the UK and globally and its treasury policy is amended as necessary to manage counterparties with which deposits, investments and other transactions may be made.
NEXT is exposed to credit risk in respect of its Directory and other business customers. Rigorous procedures are in place with regard to the Group’s credit customers and these are regularly reviewed and updated as required. Key suppliers whose services are essential to the successful running of the business also face credit risk. These include the production of the Directory, provision of IT systems and certain systems and suppliers to the Group’s warehouse and distribution network. The Group’s risk assessment procedures for key suppliers identify alternatives and develop contingency plans in the event any of these suppliers fail.
❚ Management team
The success of NEXT relies on the continued service of its senior management and technical personnel and on its ability to continue to attract, motivate and retain highly qualified employees. The retail sector is very competitive and NEXT staff are frequently targeted by other companies. The Remuneration Committee identifies senior personnel, reviews remuneration at least annually and formulates packages to retain and motivate these employees. In addition, the Board considers the development of senior managers to ensure adequate career development opportunities for key personnel, with orderly succession and promotion to important management positions.
❚ Product design & selection
The success of NEXT depends on providing exciting, beautifully designed, excellent quality clothing and homeware. Success also depends upon its ability to anticipate and respond to changing consumer preferences and trends. Many of NEXT’s products represent discretionary purchases and demand for these products can decline in periods of weaker consumer confidence. As a consequence, NEXT may be faced with surplus stocks that cannot be sold at full price and have to be disposed of at a loss. Executive directors and senior management continually review the design and selection of NEXT’s product ranges. This ensures, so far as possible, that there is a well-balanced product mix that is good value for money, and available in sufficient quantities and at the right time to meet customer demand.
❚ Key suppliers & supply chain management
NEXT relies on its supplier base to deliver products on time and to the quality standards it specifies. It continually seeks ways to develop its supplier base so as to reduce over-reliance on individual suppliers of product and services, and to improve the competitiveness of its product offer. If input costs rise, for example raw materials or labour costs, NEXT will work with existing suppliers to mitigate the inflationary impact. New sources of supply will be developed in conjunction with NEXT Sourcing, external agents and direct suppliers.
Non-compliance by suppliers with the NEXT Code of Practice may increase reputational risk. NEXT carries out regular inspections of its suppliers’ operations to ensure compliance with the standards set out in this code, covering production methods, employee working conditions, quality control and inspection processes. Further
ANNUAL REPORT AND ACCOUNTS JANUARY 2014
20

23158.04 - Proof 2 - 14/03/2014
details can be found on page 23. NEXT also monitors and reviews the financial, political and geographical aspects of its supplier base to identify any factors that may affect the continuity or quality of supply of its products.
❚ Retail store network
Growth of NEXT Retail is dependent upon developing the trading space within its store network and customers spending more. NEXT will continue to invest in new stores where its financial criteria are met and refurbish its existing portfolio when appropriate. New store appraisals estimate the effects of sales deflection from existing stores, although the performance of new stores and sales deflection may differ from estimates.
Successful development of new stores is dependent upon a number of factors including the identification of suitable properties, obtaining planning permissions and the negotiation of acceptable lease terms. Notwithstanding there have been a number of retail failures in recent years, prime sites will generally remain in demand, and increased competition can result in higher future rents.
❚ Directory customer base
Growth of the NEXT Directory depends upon the recruitment and retention of customers and increasing the average spend per customer. NEXT will continue to recruit new credit customers where they satisfy its credit score requirements. However, there can be no assurance that new customers will result in higher sales per customer or lower incidence of bad debts, compared with the existing customer base.
In addition, NEXT requires its internet website to attract new customers and encourage existing customers to continue ordering from the Directory. Management continually review the configuration, content and functionality of the website to ensure it provides a positive customer shopping experience. Service levels and response times are monitored to ensure that the website is both resilient and secure at all times.
❚ Warehousing & distribution
NEXT regularly reviews the warehousing and distribution operations that support the business. Risks include business interruption due to physical damage, access restrictions, breakdowns, capacity shortages, inefficient processes and delivery service failures. Planning processes are in place to ensure there is sufficient warehouse handling capacity for expected future business volumes over the short and longer terms. In addition, service levels, warehouse handling and delivery costs are monitored continuously to ensure goods are delivered to Retail stores, Directory customers and third party clients in a timely and cost-efficient manner.
❚ IT systems, business continuity & cyber risk
NEXT is dependent upon the continued availability and integrity of its IT systems, which must record and process a substantial volume of data and conduct inventory management accurately and quickly. The Group expects that its systems will require continuous enhancement and investment to prevent obsolescence and maintain responsiveness. The threat of unauthorised or malicious attack is an on-going risk, the nature of which is constantly evolving. Systems penetration testing, business continuity plans and back up facilities are in place and are tested regularly to ensure that business interruptions are minimised and data is protected from corruption or unauthorised access or use.
❚ Call centre capacity & service levels
NEXT is dependent on the efficient operation of its own and third party call centres to receive and respond to customer orders and enquiries. Insufficient manpower, supplier failures and interruption in the availability of telephony systems to meet customer service requirements are the principal risks. The Group continuously monitors call centre operations that support the business to ensure that there is sufficient capacity to handle call volumes. Capacity forecasting is used to manage peak demands and growth in business volumes, and customer satisfaction is measured on a regular basis. Business continuity plans minimise the risk of business interruption.
❚ Treasury & financial risk management
The main financial risks are the availability of funds to meet business needs, default by counterparties to financial transactions (see Liquidity & credit risk), and fluctuations in interest and foreign exchange rates. In addition, business expansion and share buybacks may necessitate the raising of additional finance, which can in turn increase interest costs and give rise to fluctuations in profit. Higher debt could also increase the proportion of cash flow required to service debt and potentially increase exposure to interest rate fluctuations. NEXT operates a centralised treasury function which is responsible for managing its liquidity, interest and foreign currency risks. The
Ad
diti
on
al i
nfo
rma
tion
Pare
nt C
om
pa
ny a
cc
ou
nts
Go
vern
an
ce
Co
nso
lida
ted
ac
co
un
tsBu
sin
ess
rep
ort
s
ANNUAL REPORT AND ACCOUNTS JANUARY 2014
21

23158.04 - Proof 2 - 14/03/2014
STRATEGIC REPORT
Group’s treasury policy allows the use of derivative instruments provided they are not entered into for speculative purposes. Further details of the Group’s treasury operations are given in Note 27 to the financial statements.
In addition, NEXT has to fund its defined benefit pension scheme and ensure that sufficient contributions are made to meet outstanding liabilities as they fall due. If NEXT fails to provide sufficient and timely funding, action may be taken by the pension scheme trustees, or the Pensions Regulator, which could result in an acceleration and/or an increase in overall contributions towards any deficit. Management meets regularly with the trustees to assess fund performance, as well as to agree future contribution levels and any necessary changes to members’ future benefits.
EMPLOYEESNEXT’s employees are key to achieving business objectives. NEXT has established policies for recruitment, training and development of personnel and is committed to achieving excellence in the areas of health, safety, welfare and protection of employees and their working environment.
Equal opportunities and diversityNEXT is an equal opportunities employer and will continue to ensure it offers career opportunities without discrimination. Full consideration is given to applications for employment from disabled persons, having regard to their particular aptitudes and abilities. The Group has continued the employment wherever possible of any person who becomes disabled during their employment. Opportunities for training, career development and promotion do not operate to the detriment of disabled employees. The following table shows the gender mix of the Group’s employees at the end of the financial year:
2014 2013Males Females Males Females
Directors of NEXT plc 8 3 8 2Subsidiary directors and other senior managers 29 13 27 17Total employees 15,929 34,138 16,856 36,369
Training and developmentNEXT aims to realise the potential of its employees by supporting their career progression and promotion wherever possible. It makes significant investment in the training and development of staff and in training and education programmes which contribute to the promotion prospects of employees.
Employee communicationNEXT has a policy of providing employees with financial and other information about the business and ensures that the suggestions and views of employees are taken into account. NEXT has an employee forum made up of elected representatives from throughout the business who attend meetings at least twice a year with directors and senior managers. This forum enables and encourages open discussion on key business issues, policies and the working environment.
Employee share ownershipApproximately 9,800 employees held options over 7.4 million shares in NEXT at January 2014, being 4.8% of the total shares in issue. Its employee share ownership trust (“ESOT”) purchases shares for issue to employees when their options are exercised. At the year end the ESOT held 6.2 million shares, the voting rights of which are exercisable by the Trustee.
Pension provisionNEXT offers valuable pension benefits to participating employees, details of which are set out in the Remuneration Report and in Note 21 to the financial statements. At January 2014, there were 1,169 (2013: 1,242) active members in the Defined Benefit Section of the Next Group Pension Plan and 2,775 (2013: 2,375) UK employees with Defined Contribution arrangements.
ANNUAL REPORT AND ACCOUNTS JANUARY 2014
22

23158.04 - Proof 2 - 14/03/2014
SOCIAL, COMMUNITY AND HUMAN RIGHTSNEXT is committed to the principles of responsible business. This means addressing key business related social, ethical and environmental matters in a way that aims to bring value to all of its stakeholders, including customers and shareholders. Continuous improvement lies at the heart of NEXT’s approach and is achieved by acting in an ethical manner, developing positive relationships with suppliers, recruiting and retaining successful and responsible employees, taking responsibility for our impact on the environment and through contributions to charities and community organisations.
NEXT has a Corporate Responsibility (“CR”) forum of 15 senior managers and directors representing key areas of the business to develop and implement strategy. The forum identifies potential issues and opportunities and evaluates the success of NEXT’s response. The CR Manager holds regular updates with the executive director responsible for CR.
A third party provides independent assurance on the Group’s CR report which is published on the Company’s website each year. Commitment to CR matters is recognised externally by its membership of the FTSE4Good Index Series.
SuppliersIn common with other retailers, NEXT’s product supply chain is both diverse and dynamic. Last year, NEXT used over 500 third party suppliers with products manufactured across some 40 countries. The challenge of trading ethically and acting responsibly towards the workers within our own and our suppliers’ factories is a key priority. NEXT is a member of the Ethical Trading Initiative and operates its Code of Practice (“COP”), an established set of ethical trading standards, as an integral part of its operations. The NEXT COP has ten key principles that stipulate the minimum standards with which suppliers are required to comply in relation to workers’ rights and conditions of work including working hours, minimum age of employment, health, safety, welfare and environmental issues. NEXT seeks to ensure all products bearing the NEXT brand are produced in a clean and safe environment and in accordance with all relevant laws.
NEXT is committed to its supplier audit and management programme and has a COP audit team of 45 staff (2013: 44) which carried out more than 1,500 factory audits last year. The COP team works directly with suppliers to identify and address causes of non-compliance. Each audited factory is measured against the COP’s six tier rating system and the supplier is made aware of its rating and what is required to improve via a corrective action plan. This direct approach allows NEXT to build knowledge and understanding in local communities and monitor suppliers through its auditing process.
Human RightsNEXT is committed to upholding all basic human rights and welcomes the implementation of the United Nations’ Guiding Principles of Business and Human Rights. Our supplier COP reflects relevant international labour conventions. Where NEXT employees are based in countries with recognised concerns over human and labour rights, as determined by the FTSE4Good Index, all employees are specifically required to uphold the Declaration of Human Rights and the ILO Core Conventions and receive annual training to ensure their understanding of those principles.
CustomersNEXT is committed to offering stylish, excellent quality products to its customers, which are well made, functional, safe and are sourced in a responsible manner. NEXT works closely with buyers, designers and suppliers to ensure NEXT products comply with all relevant legislation and its own internal standards where these are higher. The expertise of independent safety specialists for clothing, footwear, accessories, beauty and home products is used where required.
NEXT endeavours to provide a high quality service to its customers, whether they are shopping through its stores, catalogues or website. These different ways of shopping must be easily accessible for all customers and be responsive to their needs.
NEXT Customer Services interacts with Retail and Directory customers to resolve enquiries and issues. Findings are recorded and the information is used by other areas of the business to review how a product or service can be improved.
Ad
diti
on
al i
nfo
rma
tion
Pare
nt C
om
pa
ny a
cc
ou
nts
Go
vern
an
ce
Co
nso
lida
ted
ac
co
un
tsBu
sin
ess
rep
ort
s
ANNUAL REPORT AND ACCOUNTS JANUARY 2014
23

23158.04 - Proof 2 - 14/03/2014
STRATEGIC REPORT
Health and safetyNEXT recognises the importance of health and safety and its management is designed to contribute to business performance. Policies and procedures are reviewed and audited regularly to make safety management more robust and current.
The Group’s objective is to manage all aspects of its business in a safe manner and take practical measures to ensure that its activities and products do not harm the public, customers, employees or contractors. Procedures exist to enable two way communication and consultation about health, safety and welfare issues in order to achieve a high level of safety awareness.
CommunityNEXT supports a wide range of charities and organisations, and provided the following financial support during the year:
2014£000
2013£000
Registered charities 945 911Individual requests, local and national groups and organisations 115 110Commercial support 120 83
This support was supplemented by the following additional activities:
2014£000
2013£000
NEXT charity events 34 182Gifts in kind – product donations 1,613 2,187Charity linked sales 363 357Employee fundraising 37 22
No donations were made for political purposes (2013: nil).
ENVIRONMENTAL MATTERSNEXT recognises that it has a responsibility to manage the impact of its business on the environment both now and in the future. For several years we have measured and reported against environmental targets for NEXT in the UK and Eire. The targets are measured from 2007 and look forward to 2015.
Key areas of focus are:
❚ Energy use and emissions from stores, warehouses, distribution centres and offices Target: Electricity consumption – 35% reduction in kg CO2e/m2 Progress: 4% reduction compared with last year, and 33% electricity reduction achieved to date
❚ Fuel emissions from the transportation of products Target: Retail Distribution – 10% reduction in litres of fuel used/m2 Progress: Target achieved in 2012 with 16% reduction
❚ Waste created in stores, warehouses, distribution centres and offices Target: To send less than 5% of operational waste to landfill Progress: 93% of operational waste diverted from landfill achieved to date
ANNUAL REPORT AND ACCOUNTS JANUARY 2014
24

23158.04 - Proof 2 - 14/03/2014
Greenhouse gas emissionsIn our Corporate Responsibility Report last year we provided detailed information on NEXT’s global emissions footprint. In accordance with the new disclosure requirements for listed companies under the Companies Act, the table below shows the Group’s greenhouse gas emissions during the financial year:
2014Tonnes of CO2
equivalent
2013Tonnes of CO2
equivalent
Combustion of fuel & operation of facilities (Scope 1) 38,576 38,506Electricity, heat, steam and cooling purchased for own use (Scope 2) 117,950 122,794Total Scope 1 and Scope 2 emissions 156,526 161,300
Intensity metric: tonnes of CO2e per £m of turnover 41.9 45.3
MethodologyThe methodology used to calculate our emissions is in compliance with the ‘Environmental Reporting Guidelines: Including mandatory greenhouse gas emissions reporting guidance’ and the UK Government’s GHG Conversion Factors for Company Reporting (June 2013) issued by the Department for Environment, Food and Rural Affairs (DEFRA). We report our emissions data using an operational control approach to define our organisational boundary which meets the definitional requirements of the Regulations in respect of those emissions for which we are responsible, following the guidelines and principles of the WBCSD/WRI Greenhouse Gas Protocol.
NEXT remains committed to reducing its carbon footprint by reducing energy consumption throughout its operations, minimising and recycling waste, cutting transport emissions and reducing the packaging in our products.
On behalf of the Board
David Keens Director 20 March 2014
Ad
diti
on
al i
nfo
rma
tion
Pare
nt C
om
pa
ny a
cc
ou
nts
Go
vern
an
ce
Co
nso
lida
ted
ac
co
un
tsBu
sin
ess
rep
ort
s
ANNUAL REPORT AND ACCOUNTS JANUARY 2014
25

23158.04 - Proof 2 - 14/03/2014
DIRECTORS’ REPORT
Disclosures required under the 2013 amendment to the Large and Medium-sized Companies and Groups (Accounts and Reports) Regulations 2008 in respect of employee matters (including the employment, training and advancement of disabled persons), political donations and greenhouse gas emissions are given in the Strategic Report.
ANNUAL GENERAL MEETING & OTHER MATTERSNotice of the Annual General Meeting (“AGM”) is on pages 113 to 119 and includes the following business:
DividendsThe Directors recommend that a final dividend of 93p per share be paid on 1 August 2014 to shareholders on the register of members at close of business on 11 July 2014. This resolution relates only to the final dividend. As described in the Chief Executive’s Review on page 14 the directors may in future decide to pay special dividends as long as NEXT’s share price remains consistently above the Board’s buyback price limit. This arrangement will ensure the Company continues to return surplus cash to shareholders, whilst maintaining the flexibility to return to buying back shares if and when the share price returns to levels commensurate with the required Equivalent Rate of Return. Any such special dividends will be declared by the directors as interim dividends. The announcement of any dividend will clearly indicate whether it is an interim or final dividend and whether it is a special dividend or not.
The Trustee of the NEXT Employee Share Ownership Trust (“ESOT”) has waived dividends paid in the year on the shares held by it, see Note 26.
Directors Michael Law (Group Operations Director) and Jane Shields (Group Sales and Marketing Director) were appointed executive directors on 1 July 2013. Jane joined NEXT Retail in 1985 as a Sales Assistant in one of our London stores. Jane worked her way through Store Management to be appointed Sales Director in 2000, responsible for all store operations and training. In 2006 Jane took additional responsibility for Retail Marketing and in 2010 was appointed Group Sales and Marketing Director, adding Directory and online marketing to her portfolio. Michael Law joined the Group in 1995 as Call Centre Manager for the NEXT Directory. Michael was appointed Call Centre Director in 2003. In 2006 Michael took responsibility for Group IT and in 2010 was appointed Group Operations Director, adding Warehousing and Logistics to his portfolio. Michael is now responsible for all Systems, Warehousing, Logistics and Call Centres within the Group.
Jonathan Dawson and Christine Cross are the longest serving non-executive directors, having both been first elected at the 2005 AGM; the ninth anniversary of their first election is therefore May 2014. In order to manage their succession, Christine Cross will not stand for re-election at the 2014 AGM, and a replacement will be announced in due course. It is intended that Jonathan Dawson will stand down in 2015, and a replacement non-executive will be appointed.
The UK Corporate Governance Code recommends that all directors of FTSE companies stand for election every year, and all members of the Board other than Christine Cross will do so at this year’s AGM. Directors’ biographies are set out on page 32.
Each of the directors standing for election has undergone a performance evaluation and has demonstrated that they remain committed to the role and continue to be an effective and valuable member of the Board. The Board is satisfied that each non-executive director offering themselves for re-election, including Jonathan Dawson, are independent in both character and judgement, and their knowledge and other business interests continue to enable them to contribute significantly to the work and balance of the Board.
The interests of the directors who held office at 25 January 2014 and their families are shown in the Remuneration Report on page 60.
ANNUAL REPORT AND ACCOUNTS JANUARY 2014
26

23158.04 - Proof 2 - 14/03/2014
AuditorErnst & Young LLP have expressed their willingness to continue in office and their reappointment will be proposed at the AGM.
Disclosure of information to the auditorIn accordance with the provisions of Section 418 of the Companies Act 2006 (the “2006 Act”), each of the persons who is a director at the date of approval of this report confirms that:
❚ so far as the director is aware, there is no relevant audit information of which the Company’s auditor is unaware; and
❚ each director has taken all the steps that they ought to have taken as a director to make themselves aware of any relevant audit information and to establish that the Company’s auditor is aware of that information.
Authority to allot sharesUnder the 2006 Act, the directors may only allot shares or grant rights to subscribe for, or convert any security into, shares if authorised to do so by shareholders in general meeting. The authority conferred on the directors at last year’s AGM under section 551 of the 2006 Act expires on the date of the forthcoming AGM and ordinary resolution 16 seeks a new authority to allow the directors to allot ordinary shares up to a maximum nominal amount of £5,100,000, representing approximately one third of the Company’s existing issued share capital as at 19 March 2014. In accordance with institutional guidelines, resolution 16 will also allow directors to allot further ordinary shares, in connection with a pre-emptive offer by way of a rights issue, up to a total maximum nominal amount of £10,200,000, representing approximately two thirds of the Company’s existing issued share capital as at that date. As at 19 March 2014 (being the latest practicable date prior to publication of this document) the Company’s issued share capital amounted to £15,503,232, comprising 155,032,317 ordinary shares of 10 pence each, none of which are held in treasury. The directors have no present intention of exercising this authority which will expire at the conclusion of the AGM in 2015 or, if earlier, 1 August 2015.
Authority to disapply pre-emption rightsSpecial resolution 17 will, if passed, renew the directors’ authority pursuant to sections 570 to 573 of the 2006 Act to allot equity securities for cash without first offering them to existing shareholders in proportion to their holdings. This resolution limits the aggregate nominal value of ordinary shares which may be issued by the directors on a non pre-emptive basis to £775,000, being less than 5% of the issued ordinary share capital as at 19 March 2014. This authority also allows the directors, within the same aggregate limit, to sell for cash, shares that may be held by the Company in treasury. The directors do not have any present intention of exercising this authority which will expire at the AGM in 2015 or, if earlier, 1 August 2015. In accordance with the Pre-Emption Group’s Statement of Principles, the directors do not intend to issue more than 7.5% of the issued share capital of the Company for cash under this or previous authorities in any rolling three year period without prior consultation with shareholders.
On-market purchase of own sharesNEXT has been returning capital to its shareholders by share repurchases as well as dividends since March 2000 as part of its strategy for delivering sustainable long term growth in earnings per share. Over this period, and up to 19 March 2014, NEXT has returned over £3.1bn to shareholders by way of share buybacks and almost £1.6bn in dividends, of which £74m comprised special dividends. This buyback activity has enhanced earnings per share, given shareholders the opportunity for capital returns (as well as dividends) and has been transparent to the financial markets. Share buybacks have not been made at the expense of investment in the business. Over the last five years, NEXT has invested over £550m in capital expenditure to support and grow the business.
Special resolution 18 will renew the authority for the Company to make market purchases (as defined in Section 693 of the 2006 Act) of its ordinary shares of 10p each provided that:
(a) the aggregate number of ordinary shares authorised to be purchased shall be the lesser of 23,239,000 ordinary shares of 10p each (being less than 15% of the issued share capital at 19 March 2014) and no more than 14.99% of the issued ordinary share capital outstanding at the date of the AGM, such limits to be reduced by the number of any shares to be purchased pursuant to ordinary resolution 19: Off-market purchases of own shares, see below;
Ad
diti
on
al i
nfo
rma
tion
Pare
nt C
om
pa
ny a
cc
ou
nts
Go
vern
an
ce
Co
nso
lida
ted
ac
co
un
tsBu
sin
ess
rep
ort
s
ANNUAL REPORT AND ACCOUNTS JANUARY 2014
27

23158.04 - Proof 2 - 14/03/2014
DIRECTORS’ REPORT
(b) the payment per ordinary share is not less than 10p and not more than 105% of the average of the middle market price according to the Daily Official List of the London Stock Exchange for the five business days immediately preceding the date of purchase or, if higher, the amount stipulated by Article 5(1) of the Buy-back and Stabilisation Regulation 2003; and
(c) the renewed authority will expire at the AGM in 2015 or, if earlier, 1 August 2015.
The directors intend that this authority to purchase the Company’s shares will only be exercised if doing so will result in an increase in earnings per share and, being in the interests of shareholders generally, it is considered to promote the success of the Company. The directors will also give careful consideration to financial gearing levels of the Company and its general financial position. The purchase price would be paid out of distributable profits. It is the directors’ present intention to cancel any shares purchased under this authority.
The repurchase of ordinary shares would give rise to a stamp duty liability of the Company at the rate of 0.5% of the consideration paid.
The total number of employee share options to subscribe for shares outstanding at 19 March 2014 was 7,242,592. This represents 4.7% of the issued share capital at that date. If the Company were to buy back the maximum number of shares permitted pursuant to both the existing authority granted at the 2013 AGM (which will expire at the 2014 AGM) and the authority sought by this resolution, then the total number of options to subscribe for shares outstanding at 19 March 2014 would represent 6.4% of the reduced issued share capital.
Off-market purchases of own sharesThe directors consider that share buybacks are an important means of returning value to shareholders and maximising sustainable long term growth in EPS. Contingent contracts for off-market share purchases are an integral part of the Company’s buyback strategy and offer a number of additional benefits compared to on-market share purchases:
❚ Contingent contracts allow the Company to purchase shares at a discount to the market price prevailing at the date each contract is entered into. Pursuant to the authority granted at the 2013 AGM, and up to 19 March 2014, the Company bought back 50,000 shares for cancellation under such contracts at a discount of 5.0%.
❚ Low share liquidity can often prevent the Company from purchasing sufficient numbers of shares on a single day without risk of affecting the prevailing market price. Contingent contracts enable the Company to purchase shares over time without risk of distorting the prevailing share price, and also spread the cash outflow.
❚ Contingent contracts entered into prior to any close period allow the Company to take delivery of shares during these periods.
❚ Competitive tendering involving up to five banks is used which minimises the risk of hidden purchase costs. The pricing mechanism ensures the Company retains the benefit of declared and forecast dividends.
❚ In future, the Company would also have the option to set a suspension price in individual contracts whereby they would automatically terminate if the Company’s share price was to fall.
As with any share buyback decision, the directors would use this authority only after careful consideration, taking into account market conditions prevailing at the time, other investment opportunities and the overall financial position of the Company. The directors will only purchase shares using such contracts if, based on the contract discounted price (rather than any future price), it is earnings enhancing and promotes the success of the Company for the benefit of its shareholders generally. It is the directors’ present intention to cancel any shares purchased under this authority.
Ordinary resolution 19 will give the Company authority to enter into contingent purchase contracts with any of Goldman Sachs International, UBS AG, Deutsche Bank AG, HSBC Bank plc and Barclays Bank plc under which shares may be purchased off-market at a discount to the market price prevailing at the date each contract is entered into. The maximum which the Company would be permitted to purchase pursuant to this authority would be the lower of 4,000,000 shares or a total cost of £200 million.
ANNUAL REPORT AND ACCOUNTS JANUARY 2014
28

23158.04 - Proof 2 - 14/03/2014
The principal features of the contracts are set out in Appendix 1 to the Notice of the AGM. Copies of the agreements the Company proposes to enter into with any of the banks (the “Programme Agreements”) will be available for inspection at the registered office of the Company, and at the offices of Pinsent Masons, 30 Crown Place, Earl Street, London EC2A 4ES during normal working hours from the date of the Notice of the AGM up to the date of the AGM and at the Meeting itself.
Notice of General MeetingsThe notice period required by the 2006 Act for general meetings of the Company is 21 days unless shareholders approve a shorter notice period, which cannot however be less than 14 clear days. However, the Company’s AGM must always be held on at least 21 clear days’ notice. At the AGM of the Company held in 2013, shareholders authorised the calling of general meetings other than an AGM on not less than 14 clear days’ notice and it is proposed that this authority be renewed. The authority granted by special resolution 20, if passed, will be effective until the Company’s AGM in 2015. In order to be able to call a general meeting on less than 21 clear days’ notice, the Company will make electronic voting available to all shareholders for that meeting. The flexibility offered by this resolution will not be used as a matter of routine for such meetings, but only where the directors consider it appropriate, taking account of the business to be considered at the meeting and the interests of the Company and its shareholders as a whole.
RecommendationYour Board are of the opinion that all resolutions which are to be proposed at the 2014 AGM will promote the success of the Company and are in the best interests of its shareholders as a whole and, accordingly, unanimously recommend that you vote in favour of the resolutions.
Share capital and major shareholdersDetails of the Company’s share capital are shown in Note 23 to the financial statements.
The Company was authorised by its shareholders at the 2013 AGM to purchase its own shares. During the year the Company purchased and cancelled 6,201,920 ordinary shares with a nominal value of £620,192 (of which 50,000 were purchased off-market), at a cost of £295.8m, representing 3.8% of its issued share capital at the start of the year.
On 25 January 2014 the Company had 155,032,317 shares in issue, which remained the same as at 19 March 2014.
The following information has been received from holders of notifiable interests in the Company’s issued share capital:
Notifications received up to 25 January 2014No. of voting rights
% of voting rights* Nature of holding
FMR LLC (Fidelity) 23,068,634 14.14 Indirect interestBlackRock, Inc. 15,449,829 9.97 Indirect interestSchroders plc 8,817,239 4.79 Indirect interestNEXT plc Employee Share Option Trust 6,190,747 3.99 Direct interest
* at date of notification.
No other notifications were received after 25 January up to 19 March 2014.
Ad
diti
on
al i
nfo
rma
tion
Pare
nt C
om
pa
ny a
cc
ou
nts
Go
vern
an
ce
Co
nso
lida
ted
ac
co
un
tsBu
sin
ess
rep
ort
s
ANNUAL REPORT AND ACCOUNTS JANUARY 2014
29

23158.04 - Proof 2 - 14/03/2014
ADDITIONAL INFORMATIONShareholder and voting rightsAll members who hold ordinary shares are entitled to attend and vote at the AGM. On a show of hands at a general meeting every member present in person and every duly appointed proxy shall have one vote and on a poll, every member present in person or by proxy shall have one vote for every ordinary share held or represented. It is intended that voting at the 2014 AGM will be on a poll. The Notice of Meeting on pages 113 to 119 specifies deadlines for exercising voting rights.
The Company is not aware of any agreements between shareholders that may result in restrictions on the transfer of securities and voting rights. There are no restrictions on the transfer of ordinary shares in the Company other than certain restrictions imposed by laws and regulations (such as insider trading laws and market requirements relating to close periods) and requirements of the Listing Rules whereby directors and certain employees of the Company require Board approval to deal in the Company’s securities.
The Company’s articles of association may only be amended by a special resolution at a general meeting. Directors are elected or re-elected by ordinary resolution at a general meeting; the Board may appoint a director but anyone so appointed must be elected by ordinary resolution at the next general meeting. Under the articles of association, directors retire and may offer themselves for re-election at a general meeting at least every three years. However, in line with the provisions of the UK Corporate Governance Code, all directors will stand for election at the 2014 AGM other than Christine Cross who is retiring from the Board.
Change of controlThe Company is not party to any significant agreements which take effect, alter or terminate solely upon a change of control of the Company following a takeover bid. However, in the event of a change of control, the Company’s medium term borrowing facilities may be subject to early repayment if a majority of the lending banks give written notice to the Company within 30 days of the change of control. In addition, should a change of control cause a downgrading in the credit rating of the Company’s corporate bonds to sub-investment grade which is not rectified within 120 days after the change in control, holders of the bonds have the option to call for redemption of the bonds by the Company at their nominal value together with accrued interest.
The Company’s share option plans, and its long term incentive and share matching plans, contain provisions regarding a change of control. Outstanding options and awards may vest on a change of control, subject to the satisfaction of any relevant performance conditions.
Directors’ service contracts are terminable by the Company on giving one year’s notice. There are no agreements between the Company and its directors or employees providing for additional compensation for loss of office or employment (whether through resignation, redundancy or otherwise) that occurs because of a takeover bid.
Corporate governanceThe corporate governance statement as required by the UK Financial Conduct Authority’s Disclosure and Transparency Rules (DTR 7.2.6) comprises the Additional Information section of the Directors’ Report and the Corporate Governance statement included in this Annual Report.
By order of the Board
David Keens Director 20 March 2014
DIRECTORS’ REPORT
ANNUAL REPORT AND ACCOUNTS JANUARY 2014
30

23158.04 - Proof 2 - 14/03/2014
Ad
diti
on
al i
nfo
rma
tion
Pare
nt C
om
pa
ny a
cc
ou
nts
Co
nso
lida
ted
ac
co
un
tsG
ove
rna
nc
eBu
sin
ess
rep
ort
sDIRECTORS’ RESPONSIBILITIESThe directors are responsible for preparing the Strategic Report, Directors’ Report and the financial statements in accordance with applicable law and regulations.
As a listed company within the European Union, the directors are required to prepare the Group Financial Statements in accordance with International Financial Reporting Standards (“IFRSs”) as adopted by the EU. The directors have elected to prepare the parent company financial statements in accordance with Companies Act 2006 and UK Accounting Standard FRS 101 “Reduced Disclosure Framework”.
Under company law the directors must not approve the financial statements unless they are satisfied that they give a true and fair view of the state of affairs of the Group and the Company and of the profit or loss of the Group for that period. In preparing the Group financial statements, the directors are required to:
❚ select suitable accounting policies and then apply them consistently;
❚ make judgments and estimates that are reasonable and prudent;
❚ present information, including accounting policies, in a manner that provides relevant, reliable, comparable and understandable information;
❚ in respect of the Group financial statements, to provide additional disclosures when compliance with the specific requirements of IFRS is insufficient to enable users to understand the impact of particular transactions, other events and conditions on the Group’s financial position and performance; and
❚ to state that the Group has complied with IFRS, subject to any material departures disclosed and explained in the financial statements.
❚ in respect of the parent company financial statements, to state whether applicable UK accounting standards have been followed, subject to any material departures disclosed and explained in the financial statements; and
❚ prepare the financial statements on a going concern basis, unless they consider that to be inappropriate.
The directors confirm that the financial statements comply with the above requirements.
The directors are responsible for keeping adequate accounting records that are sufficient to show and explain the Company’s transactions and disclose with reasonable accuracy at any time the financial position of the Company and the Group and enable them to ensure that the financial statements comply with the Companies Act 2006 and, as regards the Group financial statements, Article 4 of the IAS Regulation. They are also responsible for safeguarding the assets of the Group and hence for taking reasonable steps for the prevention and detection of fraud and other irregularities.
Responsibilities Statement We confirm that to the best of our knowledge:
a) the Group financial statements, which have been prepared in accordance with IFRSs as adopted by the EU, give a true and fair view of the assets, liabilities, financial position and results of the Group; and
b) the Strategic Report contained in this annual report includes a fair review of the development and performance of the business and the position of the Company and the Group, together with a description of the principal risks and uncertainties that they face; and
c) the annual report and accounts, taken as a whole, is fair, balanced and understandable and provides the information necessary for shareholders to assess the Company’s performance, business model and strategy.
On behalf of the Board
Lord Wolfson of Aspley Guise Chief Executive 20 March 2014
David Keens Group Finance Director
DIRECTORS’ RESPONSIBILITIES STATEMENT
ANNUAL REPORT AND ACCOUNTS JANUARY 2014
31

23158.04 - Proof 2 - 14/03/2014
DIRECTORS AND OFFICERS
CHAIRMAN OF THE BOARDJohn BartonAged 69. Became a member of the Board in 2002 and was appointed Deputy Chairman in 2004 and Chairman in 2006. He is also Chairman of Catlin Group Limited and easyJet plc and a non-executive director of SSP. John previously served as Chief Executive of JIB Group plc, Chairman of Cable and Wireless Worldwide plc, Jardine Lloyd Thompson Group plc, Wellington Underwriting plc and Brit Insurance Holdings plc and as a non-executive director of WH Smith plc and Hammerson plc.
EXECUTIVE DIRECTORSLord Wolfson of Aspley Guise, Chief Executive Aged 46. Joined the Group in 1991. Appointed Retail Sales Director in 1993, became responsible for NEXT Directory in 1995 and was appointed to the Board in 1997 with additional responsibilities for systems. Appointed Managing Director of the NEXT Brand in 1999 and Chief Executive in 2001.
Christos Angelides, Group Product DirectorAged 50. Joined the Group in 1986 and has a wealth of experience in the Product area, starting at NEXT as a Trainee Menswear Buyer and became General Manager of NEXT’s sourcing office in Hong Kong in 1989, Menswear Product Director in 1994 and Womenswear Product Director in 1998. He was appointed to the Board in 2000 and has overall responsibility for all aspects of the design, buying, quality and merchandising of NEXT products.
David Keens, Group Finance DirectorAged 60. Joined NEXT in 1986 as Group Treasurer and was appointed to the Board in 1991. Previous experience includes seven years in the accountancy profession and nine years in the UK and overseas operations of multinational manufacturers of consumer goods, with roles including Group Treasurer and Finance Director. Professional qualifications include the Association of Chartered Certified Accountants and the Association of Corporate Treasurers.
Michael Law, Group Operations Director Aged 52. Joined the Group in 1995 as Call Centre Manager for the NEXT Directory. Michael was appointed Call Centre Director in 2003 and in 2006 took responsibility for Group IT. In 2010 he was appointed Group Operations Director, adding Warehousing and Logistics to his portfolio. Michael is now responsible for all Systems, Warehousing, Logistics and Call Centres within the Group and was appointed to the Board in 2013.
Jane Shields, Group Sales and Marketing DirectorAged 50. Joined NEXT Retail in 1985 as a Sales Assistant in one of our London stores. Jane worked her way through Store Management to be appointed Sales Director in 2000, responsible for all store operations and training. In 2006 Jane took additional responsibility for Retail Marketing and in 2010 was appointed Group Sales and Marketing Director, adding Directory and online marketing to her portfolio. She was appointed to the Board in 2013.
COMPANY SECRETARY Seonna Anderson
INDEPENDENT NON-EXECUTIVE DIRECTORSJonathan Dawson, Senior Independent Non-executive DirectorAged 62. Became a member of the Board in 2004. He is also a non-executive director of Jardine Lloyd Thompson Group plc and National Grid plc and a partner in Penfida Partners LLP. Previous experience includes non-executive directorships of National Australia Group Europe Ltd, Standard Life Investments (Holdings) Limited and Galliford Try plc, eight years in the Ministry of Defence and over twenty years in investment banking with Lazard.
Steve BarberAged 62. Became a member of the Board in 2007. Previous experience includes almost thirty years in the accountancy profession, principally with Price Waterhouse where he was a senior partner. Formerly Finance Director of Mirror Group and Chief Operating Officer of Whitehead Mann. Founder of The Objectivity Partnership, a member of the Audit Quality Forum and Chairman of Design Objectives.
Christine CrossAged 62. Became a member of the Board in 2005. She is also a non-executive director of Sonae Group Ltd (Portugal), Woolworths Limited (Australia), Brambles Limited (Australia) and Kathmandu Limited (New Zealand). Christine is also a retail advisor to Apax Partners and Warburg Pincus. Previous experience includes Chief Retail Advisor to PricewaterhouseCoopers, fourteen years as a director at Tesco plc and fifteen years lecturing and course director roles at Edinburgh and Bath Universities.
Francis SalwayAged 56. Joined the Board in June 2010. He is also Chairman of Town & Country Housing Group and a non-executive director of Cadogan Group Limited. Formerly Chief Executive of Land Securities Group plc and past president of the British Property Federation.
Caroline GoodallAged 58. Became a member of the Board in January 2013. Caroline has thirty years’ experience in the legal profession, with twenty years as a corporate finance partner at Herbert Smith, including five years as head of the Global Corporate Division. She is currently a non-executive director of SVG Capital plc and a non-executive on the Partnership Board of Grant Thornton UK LLP, as well as a trustee and member of the Council of the National Trust.
BOARD COMMITTEESAudit CommitteeSteve Barber (Committee Chairman) Caroline Goodall
Christine Cross Francis Salway
Jonathan Dawson
Remuneration CommitteeJonathan Dawson (Committee Chairman) Christine Cross
Steve Barber Caroline Goodall
John Barton Francis Salway
Nomination Committee John Barton (Committee Chairman) Jonathan Dawson
Steve Barber Caroline Goodall
Christine Cross Francis Salway
ANNUAL REPORT AND ACCOUNTS JANUARY 2014
32

23158.04 - Proof 2 - 14/03/2014
Ad
diti
on
al i
nfo
rma
tion
Pare
nt C
om
pa
ny a
cc
ou
nts
Co
nso
lida
ted
ac
co
un
tsG
ove
rna
nc
eBu
sin
ess
rep
ort
sChairman’s introductionEffective corporate governance is essential to the success of our business.
As Chairman, my role is to manage the Board, ensuring it operates effectively and contains the right balance of skills and experience to successfully execute the strategy. The Board is collectively responsible for the long term success of the Company and for setting and executing the strategy.
Over many years, NEXT has successfully grown its business and created significant shareholder value against the backdrop of a challenging and changing external environment. This is the ultimate measure of our success and reflects our strong corporate governance structure and the stable, effective management team we have in place. We remain committed to the robust approach to governance which has served the business well.
Code complianceThe Group complied throughout the year under review with the provisions set out in the UK Corporate Governance Code and the UK FCA Disclosure and Transparency Rules. Disclosures required by DTR7.2.6 with regard to share capital are presented in the ‘Share capital and major shareholders’ and ‘Additional information’ sections of the Directors’ Report.
Board composition and successionThe Board includes five independent non-executive directors and the Chairman who bring considerable knowledge, judgement and experience to the Group. The Board has a good record of recruiting new non-executive directors at regular intervals to achieve appropriate rotation and continuity. The UK Corporate Governance Code states that Boards should pay particular attention to the independence of non-executives if they have served on the Board for more than nine years from the date of their first election. Jonathan Dawson and Christine Cross are the longest serving non-executive directors, having both been first elected at the AGM in 2005; the ninth anniversary of their first election is therefore May 2014. In order to manage their succession in an orderly way, it is intended that Christine Cross will not stand for re-election at the 2014 AGM, and an announcement on her replacement will be made in due course. It is also intended that Jonathan Dawson will stand down in 2015, again to be replaced by a new non-executive appointment at that time. Notwithstanding this, the Board considers that all of its non-executive directors remain independent in character and judgement, and their knowledge, experience and other business interests continue to enable them to contribute significantly to the work of the Board. Terms and conditions of appointment of non-executive directors are available for inspection at the Company’s registered office during normal business hours.
NEXT has a successful history of promoting internal candidates to most senior management and executive Board positions through career development, as demonstrated by the Board appointments in 2013 of Jane Shields and Michael Law. It is expected that most future appointees will come from within the Group.
The Company’s Articles of Association require directors to submit themselves for re-election by shareholders at least once every three years, however the Board has determined that all directors will stand for election at each AGM in accordance with the UK Corporate Governance Code.
Board responsibilitiesThe Board is responsible for major policy decisions whilst delegating more detailed matters to its committees and officers including the Chief Executive. The Board is responsible for the Group’s system of internal control and for monitoring implementation of its policies by the Chief Executive. The system of internal control is designed to manage, rather than eliminate, the risk of failure to achieve business objectives and can only provide reasonable and not absolute assurance against material misstatement or loss.
The Board holds regular meetings where it approves major decisions, including significant items of capital expenditure, investments, treasury and dividend policy. Board papers including reports from the Chief Executive and other executive directors are circulated in advance of each Board meeting. The Board is responsible for approving semi-annual group budgets. Performance against budget is reported to the Board monthly and any substantial variances are explained. Forecasts for each half year are revised and reviewed monthly. Certain other important matters are subject to weekly or monthly reporting to the Board or Board Committee, including sales, treasury operations and capital expenditure. There is a regular flow of written and verbal information between all directors irrespective of the timing of meetings.
CORPORATE GOVERNANCE
ANNUAL REPORT AND ACCOUNTS JANUARY 2014
33

23158.04 - Proof 2 - 14/03/2014
CORPORATE GOVERNANCE
All new directors receive a personalised induction programme, tailored to their experience, background and understanding of the Group’s operations. Individual training needs are reviewed regularly and training is provided where a need is identified or requested. All directors receive frequent updates on a variety of issues relevant to the group’s business, including regulatory and governance issues.
Meetings of the non-executive directors without the executive directors being present are held at least annually, both with and without the Chairman. The Company Secretary attends all Board meetings and is responsible for advising the Board on corporate governance matters and facilitating the flow of information within the Board.
The Board has appointed committees to carry out certain of its duties, three of which are detailed below. Each of these is chaired by a different director and has written terms of reference which are available for inspection on the Company’s website (www.nextplc.co.uk) or on request.
Attendance at meetingsThe Board held nine formal meetings during the year and these were fully attended with the exception that Christine Cross, Jane Shields and Jonathan Dawson each missed one meeting. The Audit Committee held four meetings which were fully attended with the exception of one meeting which Jonathan Dawson did not attend. The Remuneration Committee held six meetings which were fully attended with the exception that Jonathan Dawson and Christine Cross each missed one meeting. The Nomination Committee held two meetings which were fully attended with the exception of one meeting which Christine Cross did not attend.
Audit Committee and external auditThe Committee consists of the five independent non-executive directors including the senior non-executive director and at least one member (Steve Barber, the Committee Chairman) with recent and relevant financial experience.
The Committee holds regular, structured meetings and consults with external auditors and senior management, including internal audit, where appropriate. The Committee frequently requests that executive directors and senior managers attend meetings in order to reinforce a strong culture of risk management. The Chairman and Group Finance Director have attended all of this year’s meetings.
The Committee’s review of the interim and full year financial statements focused on the following areas of significance:
a) Directory receivables and related provisions for doubtful debts. These, at £682m, represent the largest asset class on the Group’s balance sheet. The Committee reviewed the basis and level of provisions with management and the external auditor and was satisfied that the judgments taken were reasonable, consistent and appropriate.
b) Pension scheme funding, accounting and actuarial reports. Prepared in accordance with International Accounting Standards, the Group’s balance sheet shows a net surplus of £70m, comprised of £668m assets and £597m liabilities. The assumptions underlying the calculations are highly sensitive to small changes, particularly in respect of discount rates (see Note 21 to the accounts), and are not intended to reflect the full cost of a fully funded pension buyout.
c) Foreign currency hedging. Forward contracts and options are used to manage the Sterling cost of future product purchases; this enables selling prices and gross margins to be set. The systems and processes in relation to the valuation and accounting treatment of such contracts are regularly reviewed.
d) Judgmental accounting areas. There is a requirement for industry specific and general accounting estimates, including those in respect of stock valuation, product returns rates, onerous leases, gift card redemptions, taxation and share schemes. The Committee satisfied itself as to the reasonableness and consistency of these estimates through discussions with management and the external auditor.
These items were also addressed at the planning stage of the external audit and there were no significant differences between management and external auditor conclusions.
The Committee received reports and presentations from senior management on significant activities of the Group, including NEXT Sourcing, Directory International, Franchise, Legal, Treasury, Pensions, Corporate Responsibility and Code of Practice (ethical and responsible sourcing). The Group’s internal control functions in areas such as Finance, IT, Cyber Security and Product are regularly reviewed by the Committee. Frequent briefings are received on Health and Safety, Risk Management, Business Continuity, Whistleblowing and Corporate Governance generally.
ANNUAL REPORT AND ACCOUNTS JANUARY 2014
34

23158.04 - Proof 2 - 14/03/2014
Ad
diti
on
al i
nfo
rma
tion
Pare
nt C
om
pa
ny a
cc
ou
nts
Co
nso
lida
ted
ac
co
un
tsG
ove
rna
nc
eBu
sin
ess
rep
ort
sThe Committee had discussions with the external auditor (EY) on audit planning, fees, accounting policies, audit findings and internal control. EY also reported to the Committee on the extraction of financial information and changes in financial position in respect of the £250m 2026 bond issued during the year. Meetings were held with the auditor without management present and the independence of the auditor has been assessed. The effectiveness of the audit is assessed through the review of audit plans, reports and conclusions, and discussions with management. During the year, the Audit Quality Review team of the Financial Reporting Council (FRC) reviewed EY’s January 2013 audit of the Group. The FRC has given us a copy of their confidential report which has been reviewed and discussed by the Committee and separately with the external auditor, and the Committee is satisfied that the matters raised do not give it concerns over the quality, objectivity or independence of the audit and have been appropriately addressed by EY in this year’s audit.
The Committee is aware of the International Accounting Standards Board (IASB) proposal for bringing all leases on to the balance sheet. The Chairman of the Committee and Group Finance Director have had meetings with representatives of accounting standard setters, and other interested parties, to express the Group’s opposition to the current proposals. Implementation of the IASB proposal would fundamentally change the Group’s balance sheet by bringing on some £1.8bn (undiscounted) of theoretical “right to use” assets, together with broadly matching lease liabilities. The proposals would have no impact on the Group’s cash flows and minimal impact on reported profits; but would add volatility to the balance sheet as the Group actively manages the 500+ properties from which it trades or leases, as well as adding compliance costs.
The Audit Committee is responsible for recommending the appointment, re-appointment and removal of the external auditor. Consideration is given each year to an audit tender process, however, a tender was not considered necessary during the current year. EY, or its predecessor firms, have been the Group’s auditor for over 20 years. There has been regular partner rotation, most recently in 2012. The Committee is satisfied that EY continues to possess the skills and experience required to fulfill its duties effectively and efficiently. The appointment of the external auditor will continue to be reviewed annually and a tendering process will be undertaken to coincide with the rotation of the current audit partner in 2017, or earlier if the Committee considers it appropriate.
EY have reported to the Committee that, in their professional judgement, they are independent within the meaning of regulatory and professional requirements and the objectivity of the audit engagement partner and audit staff is not impaired. The Audit Committee has reviewed this statement and concurs with its conclusion.
In order to ensure the continued independence and objectivity of the Group’s external auditor, the Board has strict policies regarding the provision of non-audit services by the external auditor. The Audit Committee’s approval is required in advance for any non-audit services to be provided where the fees exceed £100,000 for an individual assignment or £150,000 in aggregate for the year. The Committee reviews audit and non-audit fees twice a year. Proposed assignments of non-audit services with anticipated fees in excess of £50,000 are generally subject to competitive tender and decisions on the award of work are made on the basis of competence, cost-effectiveness and legislation. A tender process may not be undertaken where existing knowledge of the Group enables the auditor to provide the relevant services more cost-effectively than other parties, for example in connection with bond issues or overseas taxation compliance services. The Group’s external auditor is prohibited from providing any services that would conflict with their statutory responsibilities. During the year, EY’s audit fee amounted to £0.5m and EY’s non-audit fees were £0.1m in total.
The Committee has reviewed its Terms of Reference and composition, and believes that both are appropriate.
Remuneration CommitteeThe Committee consists of the Chairman and five independent non-executive directors. The Committee, which is chaired by the senior non-executive director, determines the remuneration of the executive directors in accordance with the Remuneration Policy and reviews the remuneration of senior management. The Remuneration Report on page 68 summarises the activities of the Committee.
Nomination CommitteeThe Committee consists of the Chairman and five independent non-executive directors, including the senior non-executive director. The Committee meets whenever necessary to consider succession planning for directors and other senior executives, to ensure that requisite skills and expertise are available to the Board to address future challenges and opportunities.
External consultants may be used to assist in identifying suitable external Board candidates, based on a written specification for each appointment. The Chairman is responsible for providing a shortlist of candidates for consideration by the Committee which then makes its recommendation for final approval by the Board.
ANNUAL REPORT AND ACCOUNTS JANUARY 2014
35

23158.04 - Proof 2 - 14/03/2014
CORPORATE GOVERNANCE
Appointments to the Board, as with other positions within the Group, are made on merit according to the balance of skills and experience offered by prospective candidates. Whilst acknowledging the benefits of diversity, individual appointments are made irrespective of personal characteristics such as race, religion or gender. The number of directors, senior managers and employees by gender is given in the Strategic Report.
ChairmanThere is a clear division of responsibilities between the offices of Chairman and Chief Executive, which is set out in writing and agreed by the Board. The Chairman manages the Board to ensure; that the Group has appropriate objectives and an effective strategy, that there is a high calibre Chief Executive with a team of executive directors able to implement the strategy, that there are procedures in place to inform the Board of performance against objectives, and that the Group is operating in accordance with a high standard of corporate governance.
The current Chairman became a member of the Board in 2002 and was an independent non-executive director of the Company prior to his appointment as Chairman on 17 May 2006. His other significant commitments are noted on page 32, and the Board considers that these are not a constraint on his agreed time commitment to the Company.
Chief ExecutiveThe Board sets objectives and annual targets for the Chief Executive to achieve. The Board is responsible for general policy on how these objectives are achieved and delegates the implementation of that policy to the Chief Executive. The Chief Executive is required to report at each Board meeting all material matters affecting the Group and its performance.
Management delegationThe Chief Executive has delegated authority for the day to day management of the business to operational management drawn from executive directors and other senior management who have responsibility for the respective areas. The most important management meetings are the weekly NEXT Brand trading and capital expenditure meetings which consider the performance and development of the NEXT Brand through its different distribution channels. These meetings cover risk management of all business areas in respect of the NEXT Brand including product, sales, property, warehousing, systems and personnel. Key performance indicators are monitored daily and weekly.
Directors’ conflicts of interestIn accordance with the Company’s Articles of Association, the Board has a formal system in place for directors to declare situational conflicts to be considered for authorisation by those directors who have no interest in the matter being considered. In deciding whether to authorise a situational conflict, the non-conflicted directors consider the situation in conjunction with their general duties under the Companies Act 2006. They may impose limits or conditions when giving an authorisation or subsequently if considered appropriate. Any situational conflicts considered by the Board, and any authorisations given, are recorded in the Board minutes and in a register of conflicts which is reviewed annually by the Board.
Performance evaluationThe senior independent non-executive director appraises the performance of the Chairman through discussions with all the directors individually and, together with the Chairman, appraises the performance of the Chief Executive. The performance of the executive directors is monitored throughout the year by the Chief Executive and the Chairman. The Chairman also monitors the performance of the non-executive directors.
An externally facilitated review was carried out in 2013 by PricewaterhouseCoopers; this concluded that there were no significant weaknesses or risks that required attention. The Board intends to conduct an externally facilitated review every three years in line with the UK Corporate Governance Code.
Risk managementThe Board is responsible for the Group’s risk management process and has delegated responsibility for its implementation to the Chief Executive and senior management best qualified in each area of the business. The Board sets guidance on the general level of risk which is acceptable and has a considered approach to evaluating risk and reward.
The Board confirms that it has carried out a review of the effectiveness of the Group’s system of internal control including financial, operational, compliance and risk management. This includes identifying and evaluating key risks, determining control strategies and considering how they may impact on the achievement of the business
ANNUAL REPORT AND ACCOUNTS JANUARY 2014
36

23158.04 - Proof 2 - 14/03/2014
Ad
diti
on
al i
nfo
rma
tion
Pare
nt C
om
pa
ny a
cc
ou
nts
Co
nso
lida
ted
ac
co
un
tsG
ove
rna
nc
eBu
sin
ess
rep
ort
sobjectives. The risk management process has been in place for the year under review and up to the date of approval of the Annual Report.
Risk management and internal control is a continuous process and has been considered by the Board on a regular basis during the year. The Board promotes the development of a strong control culture within the business. During the year the Board addressed the business risks which had been identified as key, taking into account any changes in circumstances over the period. The Audit Committee has reviewed the level of internal audit resource available within the Group and believes that it is adequate for the size, structure and business risks of the Group and is supplemented with appropriate external resources where needed.
The Board considers that the Group’s management structure and continuous monitoring of key performance indicators provide the ability to identify promptly any material areas of concern. Business continuity plans, procedures manuals and codes of conduct are maintained in respect of specific major risk areas and business processes. Through these measures the management of business risk is an integral part of Group policy and the Board will continue to develop risk management and internal controls where necessary.
The use of a Group accounting manual and prescribed reporting requirements for finance teams throughout the Group ensures that the Group’s accounting policies are clearly established and consistently applied. Information is appropriately reviewed and reconciled as part of the reporting process and the use of a standard reporting package by all entities in the Group ensures that information is presented consistently to facilitate the production of the consolidated financial statements.
Personal use of company assetsThe Board carried out a review during the year and confirmed that there has been no improper personal use of company assets by directors. Policies are in place to ensure approval procedures are applied to expense claims and that these are in accordance with service agreements. The Remuneration Committee has reviewed the level of benefits in kind provided to executive directors.
Relations with shareholdersThe Board’s primary role is to promote the success of the Company and the interests of shareholders. The Board is accountable to shareholders for the performance and activities of the Group.
The Board communicates with its shareholders in respect of the Group’s business activities through its Annual Report, yearly and half yearly announcements, interim management statements and other regular trading statements. Full year, interim and other public announcements are presented in a consistent format with a particular focus on making the presentations as meaningful, understandable and comparable as possible. This information is also made publicly available via the Company’s website.
All shareholders have an opportunity to ask questions or represent their views to the Board at the Annual General Meeting. The Company’s largest shareholders are invited to the annual and interim results presentations, at which executive and non-executive directors are present. Non-executive directors attend other meetings with shareholders if requested. Shareholder views are also communicated to the Board through the inclusion in Board reports of shareholder feedback and statements made by representative associations. Whilst the Board recognises that it is primarily accountable to the Company’s shareholders, the views of other providers of capital are also considered.
The Board takes care not to disseminate information of a share price sensitive nature which is not available to the market as a whole.
Going concernThe Group’s business activities, together with the factors likely to affect its future development, performance and position are set out in the Strategic Report. The Strategic Report also describes the Group’s financial position, cash flows and borrowing facilities, further information on which is detailed in the financial statements. Information on the Group’s financial management objectives, and how derivative instruments are used to hedge its capital, credit and liquidity risks is provided in Note 27 of the financial statements.
The Directors report that, having reviewed current performance and forecasts, they have a reasonable expectation that the Group has adequate resources to continue its operations for the foreseeable future. For this reason, they have continued to adopt the going concern basis in preparing the financial statements.
ANNUAL REPORT AND ACCOUNTS JANUARY 2014
37

23158.04 - Proof 2 - 14/03/2014
REMUNERATION REPORT
This report sets out the remuneration of NEXT’s directors for the year to January 2014 and is in three parts: (1) Remuneration Committee Chairman’s statement, (2) directors’ remuneration policy, and (3) annual report on remuneration, each prepared in accordance with Schedule 8 to the Large and Medium-sized Companies and Groups (Accounts and Reports) (Amendment) Regulations 2013 (“the new regulations”), UK Listing Rules and UK Corporate Governance Code.
Separate resolutions to approve the directors’ remuneration policy and to approve the directors’ remuneration report (excluding the directors’ remuneration policy) will be proposed at the 2014 AGM.
PART 1: REMUNERATION COMMITTEE CHAIRMAN’S STATEMENT This year’s Remuneration Report for NEXT is the first prepared in accordance with the new regulations. Whilst its format has changed to reflect the greater complexity of the regulations, the approach of the Remuneration Committee has remained consistent with previous years.
We seek to avoid significant increases in base salaries and associated costs and prefer to offer annual and longer term incentives which reward strong business and financial performance, measured against challenging benchmarks and reflecting the experience of shareholders. During the year NEXT has achieved record pre-tax profits of £695m and EPS of 366.1p, representing annual growth of 11.8% and 23% respectively; over the past 3 years EPS have grown by a compound annual average of 18.2%. We consider that this consistently strong EPS performance fully justifies the bonuses and long term incentives earned by the executive directors and other senior executives during the year. This performance has also been aligned with shareholders as dividends have grown by a compound annual average of 18% and the share price has risen 215% from £19.94 to £62.80 over the past 3 financial years.
The Committee has addressed the following areas over the past year:
Annual bonus and base salariesAt the start of the year, the Committee set targets for EPS growth, details of which are shown on page 43. This year’s strong growth in EPS resulted in a maximum pay-out under the annual bonus for executive directors. Base salaries for executive directors were increased by 2% in February 2014 (having increased by 2.5% in 2012 and 2.0% in 2013), in line with wider company cost of living awards and our general approach of restraint.
Long Term Incentive Plan (“LTIP”) Since 2008 NEXT has granted smaller awards twice a year, rather than annually, and accordingly this year the Committee approved two further grants. In addition, two awards matured. Over the performance periods for these awards, i.e. between August 2010 to January 2014, NEXT’s share price rose from £21.50 to £62.80 and its market capitalisation grew from £4.0 billion to £9.7 billion. £492m was paid in dividends and a further £894m was returned to shareholders through share buybacks. The LTIP for the three year performance period to July 2013 vested 100% when NEXT’s TSR ranked fourth out of 21 companies in the comparator group and 100% of the LTIP for the three year performance period to January 2014 has also vested as NEXT’s TSR ranked third in the comparator group.
The estimated total value of these two LTIPs is substantial (see the Single Total Figure of Remuneration table on page 56). However, as there was no change in the basis of grant, this is largely due to the 192% rise in share price over the performance periods. In 2011 we decided that the maximum value of LTIPs vesting for any participant in any one year, irrespective of the underlying strength of performance or share price growth, would be capped at £2.5m. The cap will be applied again this year and as a result Lord Wolfson’s and Christos Angelides’ LTIP payments are expected to be reduced by an estimated £1,097k and £762k respectively (based on the calculation method prescribed by the new regulations).
In recognition of wider investor concern over the complexity of some annual and long term incentive plans, the Committee decided that executive directors should only participate in the LTIP and will not be granted any further awards under the NEXT Share Matching Plan. Instead, the maximum value of LTIP awards granted to executive directors each year will now be 200% of base salary (previously 200% for Lord Wolfson and 150% for other executive directors), thereby consolidating the maximum value of awards that may otherwise be received if executive directors continued to participate in both plans. The combined level of awards for each executive director falls in consequence.
ANNUAL REPORT AND ACCOUNTS JANUARY 2014
38

23158.04 - Proof 2 - 14/03/2014
Ad
diti
on
al i
nfo
rma
tion
Pare
nt C
om
pa
ny a
cc
ou
nts
Co
nso
lida
ted
ac
co
un
tsG
ove
rna
nc
eBu
sin
ess
rep
ort
sTo further align the interests of executive directors with shareholders, the Committee determined that any LTIP awards granted to executive directors after January 2014 will be subject to the condition that any vesting on maturity will only be settled in shares and that, after payment of tax and NIC, the net shares received should ordinarily be retained for a period of two further years. Executive directors will retain dividend and voting rights during this holding period.
In light of the changes noted above, the Committee reviewed the cap on the maximum value of LTIPs vesting for any participant in any one year and decided it is appropriate to remove the cap for LTIP awards granted to executive directors after January 2014. The £2.5m cap will remain in force for LTIPs with performance periods ending in the financial years to January 2015 and 2016.
Share Matching Plan (“SMP”)Although the Committee decided that executive directors should no longer participate in the SMP, the Committee considers that the SMP still continues to meet its objectives for other members of the senior management team and intends to invite senior executives below Board level to participate in 2014. We closely monitor the level of pay-outs under the SMP and over the past 2 years we have made a number of changes to the original SMP which have reduced the amounts that can be invested as well as the maximum level of matching award.
The 2011 SMP will vest in full in April 2014, subject to the continued employment of participants. Lord Wolfson has waived his potential entitlement under the 2011 SMP (as he also did last year with his 2010 SMP) on the understanding that all NEXT employees who have been employed since April 2011 will share an equivalent amount by way of a special bonus in May 2014, pro rata to their annual salary. The estimated value of the amount waived by Lord Wolfson (based on the average NEXT share price over the last 2013/14 financial quarter of £56.47) is £3.8m.
EPS and performance measurementThe Committee reviews each year the basis and performance measures used for the annual bonus, LTIP and SMP. The performance measures for both the annual bonus and the SMP have hitherto been based solely on growth in EPS – pre-tax EPS for the annual bonus and fully diluted post-tax EPS for the SMP.
The principal reasons for using the EPS measure have been set out in previous Remuneration Reports. They are:
❚ it is consistent and transparent to participants and shareholders;
❚ NEXT is predominantly a single business selling products through a number of channels under the NEXT brand. No significant earnings are derived from uncorrelated businesses and therefore a group metric such as EPS is logical and consistent with strategy;
❚ EPS continues to be the core financial measure by which the Board assesses overall performance; and
❚ the use of EPS is complemented by the application of TSR and consideration of the general economic underpin condition for the LTIP.
As explained in previous years, we consider it right that the impact of share buybacks on EPS should be included in performance measurement as, for more than a decade, share buybacks have been one of NEXT’s primary strategies in generating value for shareholders. Share buybacks are regularly considered by the Board and are subject to prior approval as to timing, price and volume. Shares are only bought after the Board is fully satisfied that the ability to invest in the business and to continue to grow the regular dividend would not be impaired. Following the Board’s decision to set a minimum required return from any share buybacks (as described in detail in the Chief Executive’s Review) and to make special dividend payments where the return cannot be met, the Committee felt that some changes were needed to the performance measure for the annual bonus. The Committee concluded that the basis of calculation for this purpose should incorporate an appropriate adjustment to reflect the benefit to shareholders from any special dividends paid in the period. This is in order to ensure that there is no unintentional reward or penalty for management arising from one means or another of returning value to shareholders. The Board will maintain the same robust discipline over the level of special dividends as it does with regard to share buybacks.
ANNUAL REPORT AND ACCOUNTS JANUARY 2014
39

23158.04 - Proof 2 - 14/03/2014
REMUNERATION REPORT
The policy voteAs referred to earlier, this report is split between a remuneration policy section and an annual report which sets out actual remuneration. Each section will be subject to a separate vote at the AGM. If approved, the policy section will become binding on the Board which means that payments outside the policy would be unauthorised. We believe that our policy, as set out in this report, strikes a balance between having the legal authority to make payments which we consider to be in shareholders’ interests, whilst limiting the Committee’s discretion appropriately. Our policy therefore focuses on our actual approach to pay but includes the required formal caps at higher levels than we envisage needing, so as to preserve some flexibility. The Committee believes that it has demonstrated an appropriately conservative approach to pay decisions over many years and I wish to reassure shareholders that we will continue to do so.
RecommendationEach year the Committee carefully reviews the level of performance-related remuneration earned by the executive directors. The Committee considers that the remuneration earned is a reflection of NEXT’s strong operating and financial performance over the past three years. Moreover, we believe that NEXT’s remuneration strategy, and the structures implementing that strategy, have contributed positively to maintaining the stable and highly motivated management team at NEXT who have continued to deliver consistently strong performances for shareholders.
We pay close attention to ensuring that there is an appropriate balance in the remuneration structure between annual and long term rewards, as well as between cash and share-based payments, to ensure that the way NEXT remunerates its senior executives drives the right behaviours and rewards the right outcomes. We believe that the present weighting towards rewarding sustainable long term performance is well aligned with shareholders’ interests. This is evident from the high proportion of directors’ performance-related pay in the year that derived from growth in EPS and share price.
I hope very much that shareholders will support the Committee’s continuing overall approach to remuneration and, on behalf of the Committee, I commend both the policy and our report to you.
Jonathan Dawson Chairman of the Remuneration Committee
ANNUAL REPORT AND ACCOUNTS JANUARY 2014
40

23158.04 - Proof 2 - 14/03/2014
Ad
diti
on
al i
nfo
rma
tion
Pare
nt C
om
pa
ny a
cc
ou
nts
Co
nso
lida
ted
ac
co
un
tsG
ove
rna
nc
eBu
sin
ess
rep
ort
sPART 2: REMUNERATION POLICYIt is the Company’s intention that the directors’ remuneration policy as set out in this part of the report should apply from the date of the Company’s 2014 Annual General Meeting, subject to its approval by shareholders at that meeting.
BackgroundThe Committee’s objective is to ensure that the remuneration paid to senior executives is appropriate in both amount and structure, is directly linked to the Company’s annual and long term performance and aligned with the interests of shareholders. We believe that stable and transparent remuneration structures are key elements in a fair system for rewarding personal and collective contribution across the business. There are bonus structures throughout the Company, including Head Office, stores, call centres and warehouses.
The focus is on ensuring that a competitive and appropriate base salary is paid to directors and senior managers, together with incentive arrangements that are:
❚ appropriate in both amount and structure;
❚ directly linked to the Company’s annual and long term performance;
❚ in alignment with the interests of shareholders and our long term strategy; and
❚ stable and transparent.
Pay and employment conditions elsewhere in the Group are considered to ensure that differences for directors are justified. Remuneration policy does not conflict with the Company’s approach to environmental, social and corporate governance matters and we believe the current arrangements do not encourage directors to take undue business risks.
The table below summarises the Company’s policies with regard to each of the elements of remuneration for existing directors and the approach to payments on external recruitment and termination.
ANNUAL REPORT AND ACCOUNTS JANUARY 2014
41

23158.04 - Proof 2 - 14/03/2014
ELEMENTPurpose and link to strategy Operation Maximum potential value Performance measures and targets
Changes for 2013 and 2014(this column is to provide information and is not formally part of the directors’ remuneration policy but is part of the annual report on remuneration)
SalaryTo provide a satisfactory base salary within a total package comprising salary and performance-related pay.
Performance-related components and certain benefits are calculated by reference to base salary. The level of salary broadly reflects the value of the individual, their role, skills and experience.
Reviewed annually, generally effective 1 February. The Committee focuses particularly on ensuring that an appropriate base salary is paid to directors and senior managers. The Committee considers salaries in the context of overall packages with reference to market data, individual experience and performance, and the level and structure of remuneration for other employees and the external environment. External benchmarking analysis is only occasionally undertaken and the Committee has not adopted a prescribed objective of setting salaries by reference to a particular percentile or benchmark.
There is no guaranteed annual increase. The Committee considers it important that base salary increases are kept under tight control given the multiplier effect of such increases on future costs. In recent years, increases in executive directors’ salaries have been in line with the wider company cost of living awards.
Under the new regulations the Company is required to specify a maximum potential value for each component of pay. Accordingly, for the period of this policy no salary paid to an executive director in any year will exceed the median base salary of FTSE 100 Chief Executives as confirmed by independent advisers. Currently this is circa £850,000 per annum.
Not applicable. Base salaries of the executive directors increased by 2% in February 2014, in line with the wider company cost of living awards.
Base salaries for the executive directors from February 2014 are:
£’000Lord Wolfson 743
Christos Angelides 539
David Keens 496
Michael Law 306
Jane Shields 306
Annual bonusTo incentivise delivery of stretching annual financial goals.
To provide focus on the Company’s key financial objectives.
To provide a retention element in the case of the Chief Executive as any annual bonus in excess of 100% of base salary is payable in shares, deferred for a period of two years and subject to forfeiture if he voluntarily resigns prior to the end of that period.
Performance measures and related performance targets are set at the commencement of each financial year by the Committee. Company policy is to set such measures by reference to pre-tax EPS but the Committee retains flexibility to use different performance measures during the period of this policy if it considers it appropriate to do so.
At the threshold level of performance, 20% of the maximum bonus may be earned. A straight sliding scale of payments operates for performance between the minimum and maximum levels. There is no in-line target level although, for the purposes of the scenario charts on pages 52 and 53, 50% of maximum bonus has been assumed because it is the mid-point.
At present Company policy is to provide a maximum bonus of 150% of salary for the Chief Executive and 100% of salary for other executive directors.
Although the Committee has no current plan to make any changes, for the period of this policy the Committee reserves flexibility to:
❚ increase maximum bonus levels for executive directors in any financial year to 200% of salary. This flexibility would be used only in exceptional circumstances and where the Committee considered any such increase to be in the best interests of shareholders and after appropriate consultation with key shareholders;
❚ lessen the current differentials in bonus maximums which exist between the Chief Executive and other executive directors; and
❚ introduce or extend an element of compulsory deferral of bonus outcomes if considered appropriate by the Committee.
While the Committee reserves flexibility to apply different performance measures, it currently uses stretching pre-tax EPS growth targets set annually, which take account of factors including the Company’s budgets and the wider background of the UK economy. Pre-tax EPS has been chosen as the basic metric to avoid executives benefitting from external factors such as reductions in the rate of corporation tax. There has to be growth in EPS before any bonus is payable to executive directors. By contrast the threshold for staff bonuses is set at a lower level than for directors. The Committee reserves flexibility to apply discretion in the interests of fairness to shareholders and executives by making adjustments it considers appropriate.
As noted in the Committee Chairman’s Statement on page 39, the basis of performance measurement is changing to incorporate an appropriate adjustment to EPS growth to reflect the benefit to shareholders from special dividends paid in any period.
For the year to January 2014, performance targets were set requiring pre-tax EPS of 408p before any bonus became payable, being growth of 4.3% on the prior year. Maximum bonus of 150% and 100% of salary for the Chief Executive and the other executive directors respectively was payable if pre-tax EPS exceeded 446p, being growth of 14%.
Actual pre-tax EPS achieved was 460p, growth of 17.6%. Accordingly, a bonus of 150% of salary for the Chief Executive and 100% for the other executive directors was earned.
Bonus performance targets for the year ahead have been set but are not disclosed in advance for reasons of commercial sensitivity. The targets and performance will be disclosed in next year’s Remuneration Report.
LTIPTo incentivise manage-ment to deliver superior total shareholder returns (“TSR”) over three year performance periods relative to a selected group of retail companies.
Retention of key employees over three-year performance periods.
A variable percentage of a pre-determined maximum number of shares can vest, depending on relative TSR performance against the comparator group the Committee selects at grant (current practice is to select a comparator group of retail companies (shown on page 64)).
The maximum number of shares that may be awarded to each director is a percentage of each director’s base salary at the date of each grant, divided by NEXT’s average share price over the three months prior to the start of the performance period.
LTIP awards are made twice a year to reduce the volatility inherent in the TSR performance measure and to enhance the portfolio effect for participants of more frequent, but smaller, grants.
The Company has the option to settle vested LTIP awards in cash.
The LTIP does not credit participants with additional value in respect of dividends paid over any vesting period (except that the Committee has discretion to award such credit for special dividends).
Since 2008, the maximum aggregate annual award allowed under the current plan rules has been over shares worth 200% of base salary (and up to 300% in exceptional circumstances). With effect from 2012, the maximum value of any LTIP awards that vest for a participant in a year has been capped at £2.5m.
Within this maximum, the Chief Executive and other executive directors receive grants equal to 100% and 75% of annual salary respectively every six months. The Committee reserves the right to vary these levels within the overall annual limits described above.
For 2014 onwards, the Committee has decided that the maximum possible aggregate value of awards granted to all executive directors will be 200% of annual salary (i.e. 100% every six months). The Committee reserves the right to vary these levels within the overall annual limits described above. In addition, awards granted to executive directors which vest must be taken in shares and the net shares (after payment of tax and NIC) must be held for a minimum period of two further years. The Committee reserves the right to lengthen (but not reduce) the performance period and to introduce a retention period or to further increase this holding period.
In light of the cessation of further grants under the SMP (see below), the Committee has reviewed the cap on the maximum value of LTIPs vesting for any participant in any one year and has decided it is appropriate to remove the cap for LTIP awards granted to executive directors after January 2014. The £2.5m cap will remain in force for vesting LTIPs with three year performance periods ending in financial years to January 2015 and January 2016.
Performance is measured over periods of three years, which commence in February and August, by measuring NEXT’s TSR against a group (currently 20 other UK listed retail companies) which are, in the view of the Committee, most comparable with NEXT in size or nature of their business. Comparison against such a group is more likely to reflect the Company’s relative performance against its peers, thereby resulting in grants being made on an appropriate basis.
Relative performance Percentage vestingBelow median 0%
Median 20%
Upper quintile 100%
If no entitlement has been earned at the end of a three year performance period then that award will lapse; there is no retesting.
Before any of the awards vest, the Committee must have regard to the performance of the Company in the light of underlying economic and other circumstances, including EPS performance of the Company and of other UK retailers over the period. Whilst not disclosed in advance, the factors taken into account for these purposes are disclosed in the relevant year’s Remuneration Report.
The Committee reserves flexibility to apply different performance measures and targets in respect of new grants for the period of this policy.
The grant that matured in July 2013 vested 100% as the TSR ranked fourth out of 21 in the comparator group. The Committee also assessed the performance of NEXT during the performance period and determined that the economic underpin performance condition had been satisfied.
The grant that matured in January 2014 also vested at 100% as the TSR ranked third out of 21 in the comparator group. The Committee also determined that the economic underpin performance condition had been satisfied.
For recent policy related changes please see commentary in the Maximum potential value column to the left.
REMUNERATION REPORT
ANNUAL REPORT AND ACCOUNTS JANUARY 2014
42

23158.04 - Proof 2 - 14/03/2014
Ad
diti
on
al i
nfo
rma
tion
Pare
nt C
om
pa
ny a
cc
ou
nts
Co
nso
lida
ted
ac
co
un
tsG
ove
rna
nc
eBu
sin
ess
rep
ort
s
ELEMENTPurpose and link to strategy Operation Maximum potential value Performance measures and targets
Changes for 2013 and 2014(this column is to provide information and is not formally part of the directors’ remuneration policy but is part of the annual report on remuneration)
SalaryTo provide a satisfactory base salary within a total package comprising salary and performance-related pay.
Performance-related components and certain benefits are calculated by reference to base salary. The level of salary broadly reflects the value of the individual, their role, skills and experience.
Reviewed annually, generally effective 1 February. The Committee focuses particularly on ensuring that an appropriate base salary is paid to directors and senior managers. The Committee considers salaries in the context of overall packages with reference to market data, individual experience and performance, and the level and structure of remuneration for other employees and the external environment. External benchmarking analysis is only occasionally undertaken and the Committee has not adopted a prescribed objective of setting salaries by reference to a particular percentile or benchmark.
There is no guaranteed annual increase. The Committee considers it important that base salary increases are kept under tight control given the multiplier effect of such increases on future costs. In recent years, increases in executive directors’ salaries have been in line with the wider company cost of living awards.
Under the new regulations the Company is required to specify a maximum potential value for each component of pay. Accordingly, for the period of this policy no salary paid to an executive director in any year will exceed the median base salary of FTSE 100 Chief Executives as confirmed by independent advisers. Currently this is circa £850,000 per annum.
Not applicable. Base salaries of the executive directors increased by 2% in February 2014, in line with the wider company cost of living awards.
Base salaries for the executive directors from February 2014 are:
£’000Lord Wolfson 743
Christos Angelides 539
David Keens 496
Michael Law 306
Jane Shields 306
Annual bonusTo incentivise delivery of stretching annual financial goals.
To provide focus on the Company’s key financial objectives.
To provide a retention element in the case of the Chief Executive as any annual bonus in excess of 100% of base salary is payable in shares, deferred for a period of two years and subject to forfeiture if he voluntarily resigns prior to the end of that period.
Performance measures and related performance targets are set at the commencement of each financial year by the Committee. Company policy is to set such measures by reference to pre-tax EPS but the Committee retains flexibility to use different performance measures during the period of this policy if it considers it appropriate to do so.
At the threshold level of performance, 20% of the maximum bonus may be earned. A straight sliding scale of payments operates for performance between the minimum and maximum levels. There is no in-line target level although, for the purposes of the scenario charts on pages 52 and 53, 50% of maximum bonus has been assumed because it is the mid-point.
At present Company policy is to provide a maximum bonus of 150% of salary for the Chief Executive and 100% of salary for other executive directors.
Although the Committee has no current plan to make any changes, for the period of this policy the Committee reserves flexibility to:
❚ increase maximum bonus levels for executive directors in any financial year to 200% of salary. This flexibility would be used only in exceptional circumstances and where the Committee considered any such increase to be in the best interests of shareholders and after appropriate consultation with key shareholders;
❚ lessen the current differentials in bonus maximums which exist between the Chief Executive and other executive directors; and
❚ introduce or extend an element of compulsory deferral of bonus outcomes if considered appropriate by the Committee.
While the Committee reserves flexibility to apply different performance measures, it currently uses stretching pre-tax EPS growth targets set annually, which take account of factors including the Company’s budgets and the wider background of the UK economy. Pre-tax EPS has been chosen as the basic metric to avoid executives benefitting from external factors such as reductions in the rate of corporation tax. There has to be growth in EPS before any bonus is payable to executive directors. By contrast the threshold for staff bonuses is set at a lower level than for directors. The Committee reserves flexibility to apply discretion in the interests of fairness to shareholders and executives by making adjustments it considers appropriate.
As noted in the Committee Chairman’s Statement on page 39, the basis of performance measurement is changing to incorporate an appropriate adjustment to EPS growth to reflect the benefit to shareholders from special dividends paid in any period.
For the year to January 2014, performance targets were set requiring pre-tax EPS of 408p before any bonus became payable, being growth of 4.3% on the prior year. Maximum bonus of 150% and 100% of salary for the Chief Executive and the other executive directors respectively was payable if pre-tax EPS exceeded 446p, being growth of 14%.
Actual pre-tax EPS achieved was 460p, growth of 17.6%. Accordingly, a bonus of 150% of salary for the Chief Executive and 100% for the other executive directors was earned.
Bonus performance targets for the year ahead have been set but are not disclosed in advance for reasons of commercial sensitivity. The targets and performance will be disclosed in next year’s Remuneration Report.
LTIPTo incentivise manage-ment to deliver superior total shareholder returns (“TSR”) over three year performance periods relative to a selected group of retail companies.
Retention of key employees over three-year performance periods.
A variable percentage of a pre-determined maximum number of shares can vest, depending on relative TSR performance against the comparator group the Committee selects at grant (current practice is to select a comparator group of retail companies (shown on page 64)).
The maximum number of shares that may be awarded to each director is a percentage of each director’s base salary at the date of each grant, divided by NEXT’s average share price over the three months prior to the start of the performance period.
LTIP awards are made twice a year to reduce the volatility inherent in the TSR performance measure and to enhance the portfolio effect for participants of more frequent, but smaller, grants.
The Company has the option to settle vested LTIP awards in cash.
The LTIP does not credit participants with additional value in respect of dividends paid over any vesting period (except that the Committee has discretion to award such credit for special dividends).
Since 2008, the maximum aggregate annual award allowed under the current plan rules has been over shares worth 200% of base salary (and up to 300% in exceptional circumstances). With effect from 2012, the maximum value of any LTIP awards that vest for a participant in a year has been capped at £2.5m.
Within this maximum, the Chief Executive and other executive directors receive grants equal to 100% and 75% of annual salary respectively every six months. The Committee reserves the right to vary these levels within the overall annual limits described above.
For 2014 onwards, the Committee has decided that the maximum possible aggregate value of awards granted to all executive directors will be 200% of annual salary (i.e. 100% every six months). The Committee reserves the right to vary these levels within the overall annual limits described above. In addition, awards granted to executive directors which vest must be taken in shares and the net shares (after payment of tax and NIC) must be held for a minimum period of two further years. The Committee reserves the right to lengthen (but not reduce) the performance period and to introduce a retention period or to further increase this holding period.
In light of the cessation of further grants under the SMP (see below), the Committee has reviewed the cap on the maximum value of LTIPs vesting for any participant in any one year and has decided it is appropriate to remove the cap for LTIP awards granted to executive directors after January 2014. The £2.5m cap will remain in force for vesting LTIPs with three year performance periods ending in financial years to January 2015 and January 2016.
Performance is measured over periods of three years, which commence in February and August, by measuring NEXT’s TSR against a group (currently 20 other UK listed retail companies) which are, in the view of the Committee, most comparable with NEXT in size or nature of their business. Comparison against such a group is more likely to reflect the Company’s relative performance against its peers, thereby resulting in grants being made on an appropriate basis.
Relative performance Percentage vestingBelow median 0%
Median 20%
Upper quintile 100%
If no entitlement has been earned at the end of a three year performance period then that award will lapse; there is no retesting.
Before any of the awards vest, the Committee must have regard to the performance of the Company in the light of underlying economic and other circumstances, including EPS performance of the Company and of other UK retailers over the period. Whilst not disclosed in advance, the factors taken into account for these purposes are disclosed in the relevant year’s Remuneration Report.
The Committee reserves flexibility to apply different performance measures and targets in respect of new grants for the period of this policy.
The grant that matured in July 2013 vested 100% as the TSR ranked fourth out of 21 in the comparator group. The Committee also assessed the performance of NEXT during the performance period and determined that the economic underpin performance condition had been satisfied.
The grant that matured in January 2014 also vested at 100% as the TSR ranked third out of 21 in the comparator group. The Committee also determined that the economic underpin performance condition had been satisfied.
For recent policy related changes please see commentary in the Maximum potential value column to the left.
ANNUAL REPORT AND ACCOUNTS JANUARY 2014
43

23158.04 - Proof 2 - 14/03/2014
REMUNERATION REPORT
ELEMENTPurpose and link to strategy Operation Maximum potential value Performance measures and targets
Changes for 2013 and 2014(this column is to provide information and is not formally part of the directors’ remuneration policy but is part of the annual report on remuneration)
SMPTo encourage greater ownership of NEXT shares by senior executives, excluding executive directors, and thereby further align their interests with shareholders.
Participants who invest a proportion of any annual cash bonus in NEXT shares can receive up to a maximum of two times the original number of shares they purchase with their bonus. Any matching is conditional upon achieving performance measures over the following three years.
The Committee’s policy is to set such performance measures by reference to fully diluted post-tax earnings per share but the Committee retains flexibility to use different measures during the period of this policy if it considers it appropriate to do so, including adjustments to reflect the benefit to shareholders from special dividends.
As noted in the Committee Chairman’s statement, executive directors will no longer be granted awards under the SMP after January 2014 and participation will be restricted to senior executives below Board level, although the Committee reserves flexibility to re-introduce executive director participation within the period of this policy if it considers it appropriate to do so.
The SMP does not credit participants with additional value in respect of dividends paid over any vesting period (except that the Committee has discretion to award such credit for special dividends).
The maximum matching ratio available under SMP is 3:1, matching the pre-tax equivalent of the amount invested in shares.
Within this maximum matching ratio, a match of up to 2:1 based on the actual number of investment shares has been offered in practice, although the Company retains flexibility within the period of this policy to offer a different matching ratio within the scope of the maximum ratio set out above.
Although the Company reserves flexibility to apply different performance measures, the Committee currently uses measures based on stretching fully diluted post-tax EPS targets.
The targets for awards in each year will be detailed in the report and accounts.
Participants (i.e. senior executives below Board level only) can invest all of their post-tax bonus in the SMP in 2014. In 2013 the Chief Executive was allowed to invest £200,000 and other executive directors £150,000. The matching award remains at a maximum of two times the number of shares purchased by the participants.
The minimum match of 0.5 of a share requires fully diluted EPS growth of 12% and the maximum match of two times requires growth of 30% over the three year performance period
PensionTo provide for retirement through Company sponsored schemes or a cash alternative for personal pension planning.
All executive directors are deferred members of the defined benefit (“DB”) section of the 2013 NEXT Group Pension Plan (“the Plan”).
In addition to being deferred members of the DB section of the Plan, Lord Wolfson and Christos Angelides are members of the unfunded, unapproved supplementary pension arrangement (“SPA”), described on page 59. Their future pensions will be calculated by reference to their October 2012 salaries, rather than final earnings, and future salary changes will have no effect.
Jane Shields and David Keens ceased to contribute to the Plan in 2011 and Michael Law in 2012. Their pensions are no longer linked to salary and will increase in line with statutory deferred revaluation only (i.e. in line with CPI).
Executive directors receive salary supplements of 15% in lieu of past changes to their pension arrangements, in line with other senior employee members of the DB benefit section of the Plan.
New employees of the Group can join the defined contribution (“DC”) section of the NEXT Plan or the statutory Auto-Enrolment plan, described on page 59.
Bonuses are not taken into account in assessing pensionable earnings in the Plan.
Under the DB section and the SPA, the maximum potential pension is only achieved on completion of at least 20 years pensionable service at age 65, when two thirds of the executive director’s annual pensionable salary at October 2012 could become payable. The lump sum payable on death is four times base salary.
No DC contributions, or equivalent salary supplement payments, will be made to an executive director in any year that will exceed the median level of contributions or payments made to FTSE 100 Chief Executives as at the time the rate is set, as confirmed by independent advisers to the Committee.
Not applicable. Not applicable.
ANNUAL REPORT AND ACCOUNTS JANUARY 2014
44

23158.04 - Proof 2 - 14/03/2014
Ad
diti
on
al i
nfo
rma
tion
Pare
nt C
om
pa
ny a
cc
ou
nts
Co
nso
lida
ted
ac
co
un
tsG
ove
rna
nc
eBu
sin
ess
rep
ort
s
ELEMENTPurpose and link to strategy Operation Maximum potential value Performance measures and targets
Changes for 2013 and 2014(this column is to provide information and is not formally part of the directors’ remuneration policy but is part of the annual report on remuneration)
SMPTo encourage greater ownership of NEXT shares by senior executives, excluding executive directors, and thereby further align their interests with shareholders.
Participants who invest a proportion of any annual cash bonus in NEXT shares can receive up to a maximum of two times the original number of shares they purchase with their bonus. Any matching is conditional upon achieving performance measures over the following three years.
The Committee’s policy is to set such performance measures by reference to fully diluted post-tax earnings per share but the Committee retains flexibility to use different measures during the period of this policy if it considers it appropriate to do so, including adjustments to reflect the benefit to shareholders from special dividends.
As noted in the Committee Chairman’s statement, executive directors will no longer be granted awards under the SMP after January 2014 and participation will be restricted to senior executives below Board level, although the Committee reserves flexibility to re-introduce executive director participation within the period of this policy if it considers it appropriate to do so.
The SMP does not credit participants with additional value in respect of dividends paid over any vesting period (except that the Committee has discretion to award such credit for special dividends).
The maximum matching ratio available under SMP is 3:1, matching the pre-tax equivalent of the amount invested in shares.
Within this maximum matching ratio, a match of up to 2:1 based on the actual number of investment shares has been offered in practice, although the Company retains flexibility within the period of this policy to offer a different matching ratio within the scope of the maximum ratio set out above.
Although the Company reserves flexibility to apply different performance measures, the Committee currently uses measures based on stretching fully diluted post-tax EPS targets.
The targets for awards in each year will be detailed in the report and accounts.
Participants (i.e. senior executives below Board level only) can invest all of their post-tax bonus in the SMP in 2014. In 2013 the Chief Executive was allowed to invest £200,000 and other executive directors £150,000. The matching award remains at a maximum of two times the number of shares purchased by the participants.
The minimum match of 0.5 of a share requires fully diluted EPS growth of 12% and the maximum match of two times requires growth of 30% over the three year performance period
PensionTo provide for retirement through Company sponsored schemes or a cash alternative for personal pension planning.
All executive directors are deferred members of the defined benefit (“DB”) section of the 2013 NEXT Group Pension Plan (“the Plan”).
In addition to being deferred members of the DB section of the Plan, Lord Wolfson and Christos Angelides are members of the unfunded, unapproved supplementary pension arrangement (“SPA”), described on page 59. Their future pensions will be calculated by reference to their October 2012 salaries, rather than final earnings, and future salary changes will have no effect.
Jane Shields and David Keens ceased to contribute to the Plan in 2011 and Michael Law in 2012. Their pensions are no longer linked to salary and will increase in line with statutory deferred revaluation only (i.e. in line with CPI).
Executive directors receive salary supplements of 15% in lieu of past changes to their pension arrangements, in line with other senior employee members of the DB benefit section of the Plan.
New employees of the Group can join the defined contribution (“DC”) section of the NEXT Plan or the statutory Auto-Enrolment plan, described on page 59.
Bonuses are not taken into account in assessing pensionable earnings in the Plan.
Under the DB section and the SPA, the maximum potential pension is only achieved on completion of at least 20 years pensionable service at age 65, when two thirds of the executive director’s annual pensionable salary at October 2012 could become payable. The lump sum payable on death is four times base salary.
No DC contributions, or equivalent salary supplement payments, will be made to an executive director in any year that will exceed the median level of contributions or payments made to FTSE 100 Chief Executives as at the time the rate is set, as confirmed by independent advisers to the Committee.
Not applicable. Not applicable.
ANNUAL REPORT AND ACCOUNTS JANUARY 2014
45

23158.04 - Proof 2 - 14/03/2014
REMUNERATION REPORT
ELEMENTPurpose and link to strategy Operation Maximum potential value Performance measures and targets
Changes for 2013 and 2014(this column is to provide information and is not formally part of the directors’ remuneration policy but is part of the annual report on remuneration)
Other benefitsTo provide market competitive non-cash benefits.
Executive directors receive benefits which may include the provision of a company car or cash alternative, private medical insurance, subscriptions to professional bodies and staff discount on Group merchandise. A driver is also made available to the executive directors for business purposes.
The Committee reserves discretion to introduce new benefits where it concludes that it is in the interests of NEXT to do so, having regard to the particular circumstances and to market practice and reserves flexibility to make relocation related payments.
Whilst not considered necessarily to be benefits, the Committee reserves the discretion to authorise attendance by directors and their family members (at the Company’s cost if required) at corporate events and to receive reasonable levels of hospitality in accordance with Company policies.
During the policy period, the value of benefits (other than relocation costs) paid to an executive director in any year will not exceed £100,000. In addition, the Committee reserves the right to pay up to £250,000 relocation costs in any year to an executive director if considered appropriate to secure the better performance by an executive director of their duties. During the policy period, the actual level of taxable benefits provided will be included in the Single Total Figure of Remuneration.
Not applicable. Not applicable.
Save As You Earn SchemeTo encourage all employees to make a long term investment in the Company’s shares.
Executive directors can participate in the Company’s Save As You Earn (Sharesave) scheme which is HMRC approved and open to all employees. Option grants are generally made annually, with the exercise price discounted by a maximum of 20% of the share price at the date an invitation is issued. Options are exercisable three or five years from the date of grant. Alternatively, participants may ask for their contributions to be returned.
Investment currently limited to a maximum amount of £250 per month but may increase in line with new limits set by HMRC.
Not applicable. Monthly savings limit may be increased to £500 in line with new limits set by HMRC.
ANNUAL REPORT AND ACCOUNTS JANUARY 2014
46

23158.04 - Proof 2 - 14/03/2014
Ad
diti
on
al i
nfo
rma
tion
Pare
nt C
om
pa
ny a
cc
ou
nts
Co
nso
lida
ted
ac
co
un
tsG
ove
rna
nc
eBu
sin
ess
rep
ort
s
ELEMENTPurpose and link to strategy Operation Maximum potential value Performance measures and targets
Changes for 2013 and 2014(this column is to provide information and is not formally part of the directors’ remuneration policy but is part of the annual report on remuneration)
Other benefitsTo provide market competitive non-cash benefits.
Executive directors receive benefits which may include the provision of a company car or cash alternative, private medical insurance, subscriptions to professional bodies and staff discount on Group merchandise. A driver is also made available to the executive directors for business purposes.
The Committee reserves discretion to introduce new benefits where it concludes that it is in the interests of NEXT to do so, having regard to the particular circumstances and to market practice and reserves flexibility to make relocation related payments.
Whilst not considered necessarily to be benefits, the Committee reserves the discretion to authorise attendance by directors and their family members (at the Company’s cost if required) at corporate events and to receive reasonable levels of hospitality in accordance with Company policies.
During the policy period, the value of benefits (other than relocation costs) paid to an executive director in any year will not exceed £100,000. In addition, the Committee reserves the right to pay up to £250,000 relocation costs in any year to an executive director if considered appropriate to secure the better performance by an executive director of their duties. During the policy period, the actual level of taxable benefits provided will be included in the Single Total Figure of Remuneration.
Not applicable. Not applicable.
Save As You Earn SchemeTo encourage all employees to make a long term investment in the Company’s shares.
Executive directors can participate in the Company’s Save As You Earn (Sharesave) scheme which is HMRC approved and open to all employees. Option grants are generally made annually, with the exercise price discounted by a maximum of 20% of the share price at the date an invitation is issued. Options are exercisable three or five years from the date of grant. Alternatively, participants may ask for their contributions to be returned.
Investment currently limited to a maximum amount of £250 per month but may increase in line with new limits set by HMRC.
Not applicable. Monthly savings limit may be increased to £500 in line with new limits set by HMRC.
ANNUAL REPORT AND ACCOUNTS JANUARY 2014
47

23158.04 - Proof 2 - 14/03/2014
REMUNERATION REPORT
ELEMENTPurpose and link to strategy Operation Maximum potential value Performance measures and targets
Changes for 2013 and 2014(this column is to provide information and is not formally part of the directors’ remuneration policy but is part of the annual report on remuneration)
Termination paymentsConsistent with market practice, to ensure NEXT can recruit and retain key executives, whilst protecting the Company from making payments for failure.
The Committee will consider the need for and quantum of any termination payments having regard to all of the relevant facts and circumstances at that time.
Future service contracts will take into account relevant published guidance.
Each of the executive directors has a rolling service contract which commenced on either 14 March 2013 or, for Michael Law and Jane Shields, on 1 July 2013. The contract is terminable by the Company on giving one year’s notice. The Company has reserved the right to make a payment in lieu of notice on termination of an executive director’s contract equal to their base salary and contractual benefits (excluding performance-related pay).
If notice of termination is given immediately following a change of control of the Company, the executive director may request immediate termination of his contract and payment of liquidated damages equal to the value of his base salary and contractual benefits.
In normal circumstances executives have no entitlement in respect of loss of performance bonuses and all share awards would lapse following resignation. However, under certain circumstances (e.g. ‘good leaver’ or change in control), and solely at the Committee’s discretion, annual bonus payments may be made and would ordinarily be calculated up to the date of termination only. In addition, awards made under the LTIP and SMP would in those circumstances generally be time pro-rated and remain subject to the application of the performance conditions at the normal measurement date. The Committee also has a standard discretion to vary the application of time pro-rating in such cases. “Good leaver” treatments are applied in exceptional cases only.
In the event of any termination payment being made to a director (including any performance-related pay elements), the Committee will take full account of that director’s duty to mitigate any loss and, where appropriate, may seek independent professional advice and consider the views of shareholders as expressed in published guidance prior to authorising such payment.
Consistent with market practice, in the event of removal from office of an executive director, the Company may pay a contribution towards the individual’s legal fees and fees for outplacement services as part of a negotiated settlement and such other amounts as the Committee considers to be necessary, having taken legal advice, in settlement of potential claims. Any such fees would be disclosed with all other termination arrangements. The Committee reserves the right, if necessary, to authorise additional payments in respect of such professional fees if not ascertained at the time of reporting such termination arrangements up to a maximum of £10,000.
A departing gift may be provided up to a value of £1,000 (plus related taxes) per director
Not applicable. No compensation payments on termination of employment were made during the year.
Claw-back/malusTo ensure the Company can recover any payments made or potentially due to executive directors under performance-related remuneration structures.
Claw-back provisions are in service contracts of all executive directors and will be enforced where appropriate to recover performance-related remuneration which has been overpaid due to: a material misstatement of the Company’s accounts; errors made in the calculation of an award; or a director’s misconduct. These provisions allow for the recovery of sums paid and/or withholding of sums to be paid.
Not applicable. Not applicable. No claw-back or malus adjustments made in period.
Chairman and non-executive director feesTo ensure fees paid to the Chairman and non-executive directors are competitive and comparable with other companies of equivalent size and complexity.
Remuneration of the non-executive directors is reviewed annually and determined by the Chairman and the executive directors. The Chairman’s fee is determined by the Committee (excluding the Chairman).
Additional fees are paid to non-executive directors who chair the Remuneration and Audit Committees, and act as the Senior Independent Director. The structure of fees may be amended within the overall limits.
External benchmarking is undertaken only occasionally and there is no prescribed policy regarding the benchmarks used or any objective of achieving a prescribed percentile level.
The total of fees paid to the Chairman and the non-executive directors in any year will not exceed the maximum level for such fees from time to time prescribed by the Company’s articles of association (currently £750,000 per annum).
Non-executive directors receive staff discount on Group merchandise but do not participate in any of the Group’s bonus, pension, share option or other incentive schemes.
The fees of the Chairman and non-executive directors were increased by 2% in February 2014, in line with the wider company cost of living awards. The Chairman will be paid an annual fee of £260,100 (2013/14: £255,000). The basic non-executive director fee is £53,550 (2013/14: £52,500), with a further £10,710 (2013/14: £10,500) paid to the Chairmen of the Audit and Remuneration Committees, and to the Senior Independent Director.
ANNUAL REPORT AND ACCOUNTS JANUARY 2014
48

23158.04 - Proof 2 - 14/03/2014
Ad
diti
on
al i
nfo
rma
tion
Pare
nt C
om
pa
ny a
cc
ou
nts
Co
nso
lida
ted
ac
co
un
tsG
ove
rna
nc
eBu
sin
ess
rep
ort
s
ELEMENTPurpose and link to strategy Operation Maximum potential value Performance measures and targets
Changes for 2013 and 2014(this column is to provide information and is not formally part of the directors’ remuneration policy but is part of the annual report on remuneration)
Termination paymentsConsistent with market practice, to ensure NEXT can recruit and retain key executives, whilst protecting the Company from making payments for failure.
The Committee will consider the need for and quantum of any termination payments having regard to all of the relevant facts and circumstances at that time.
Future service contracts will take into account relevant published guidance.
Each of the executive directors has a rolling service contract which commenced on either 14 March 2013 or, for Michael Law and Jane Shields, on 1 July 2013. The contract is terminable by the Company on giving one year’s notice. The Company has reserved the right to make a payment in lieu of notice on termination of an executive director’s contract equal to their base salary and contractual benefits (excluding performance-related pay).
If notice of termination is given immediately following a change of control of the Company, the executive director may request immediate termination of his contract and payment of liquidated damages equal to the value of his base salary and contractual benefits.
In normal circumstances executives have no entitlement in respect of loss of performance bonuses and all share awards would lapse following resignation. However, under certain circumstances (e.g. ‘good leaver’ or change in control), and solely at the Committee’s discretion, annual bonus payments may be made and would ordinarily be calculated up to the date of termination only. In addition, awards made under the LTIP and SMP would in those circumstances generally be time pro-rated and remain subject to the application of the performance conditions at the normal measurement date. The Committee also has a standard discretion to vary the application of time pro-rating in such cases. “Good leaver” treatments are applied in exceptional cases only.
In the event of any termination payment being made to a director (including any performance-related pay elements), the Committee will take full account of that director’s duty to mitigate any loss and, where appropriate, may seek independent professional advice and consider the views of shareholders as expressed in published guidance prior to authorising such payment.
Consistent with market practice, in the event of removal from office of an executive director, the Company may pay a contribution towards the individual’s legal fees and fees for outplacement services as part of a negotiated settlement and such other amounts as the Committee considers to be necessary, having taken legal advice, in settlement of potential claims. Any such fees would be disclosed with all other termination arrangements. The Committee reserves the right, if necessary, to authorise additional payments in respect of such professional fees if not ascertained at the time of reporting such termination arrangements up to a maximum of £10,000.
A departing gift may be provided up to a value of £1,000 (plus related taxes) per director
Not applicable. No compensation payments on termination of employment were made during the year.
Claw-back/malusTo ensure the Company can recover any payments made or potentially due to executive directors under performance-related remuneration structures.
Claw-back provisions are in service contracts of all executive directors and will be enforced where appropriate to recover performance-related remuneration which has been overpaid due to: a material misstatement of the Company’s accounts; errors made in the calculation of an award; or a director’s misconduct. These provisions allow for the recovery of sums paid and/or withholding of sums to be paid.
Not applicable. Not applicable. No claw-back or malus adjustments made in period.
Chairman and non-executive director feesTo ensure fees paid to the Chairman and non-executive directors are competitive and comparable with other companies of equivalent size and complexity.
Remuneration of the non-executive directors is reviewed annually and determined by the Chairman and the executive directors. The Chairman’s fee is determined by the Committee (excluding the Chairman).
Additional fees are paid to non-executive directors who chair the Remuneration and Audit Committees, and act as the Senior Independent Director. The structure of fees may be amended within the overall limits.
External benchmarking is undertaken only occasionally and there is no prescribed policy regarding the benchmarks used or any objective of achieving a prescribed percentile level.
The total of fees paid to the Chairman and the non-executive directors in any year will not exceed the maximum level for such fees from time to time prescribed by the Company’s articles of association (currently £750,000 per annum).
Non-executive directors receive staff discount on Group merchandise but do not participate in any of the Group’s bonus, pension, share option or other incentive schemes.
The fees of the Chairman and non-executive directors were increased by 2% in February 2014, in line with the wider company cost of living awards. The Chairman will be paid an annual fee of £260,100 (2013/14: £255,000). The basic non-executive director fee is £53,550 (2013/14: £52,500), with a further £10,710 (2013/14: £10,500) paid to the Chairmen of the Audit and Remuneration Committees, and to the Senior Independent Director.
ANNUAL REPORT AND ACCOUNTS JANUARY 2014
49

23158.04 - Proof 2 - 14/03/2014
REMUNERATION REPORT
The following principles will be applied on an internal appointment, or the recruitment of an external candidate, to the Board.
The policies as set out above would apply to the promotion of an existing group employee to the Board.
For such appointments, and unless agreed otherwise with the new director, the Company will honour the contractual entitlements and other incentives (e.g. options granted under the NEXT Management Share Option Plan) awarded prior to the board appointment.
For external recruits, the Committee will also aim to structure and agree a package which is in line with the same policies for existing executive directors as set out above. However, consistent with the new regulations, the Committee reserves the right not to apply the caps contained within the policy for fixed pay, either on joining or for any subsequent review within the life of this policy, although the Committee would not envisage exceeding these caps in practice. In addition, the Committee may offer cash or share-based incentives when considered to be necessary to secure a candidate and in the best interests of the Company and its shareholders. It may be necessary to make such awards on more bespoke terms which differ from NEXT’s existing annual and share-based pay structures. However, the Committee will not authorise the payment of more than it considers necessary and will abide by the caps for such elements within the general policy.
Additional awards may be made to compensate for forfeiture of incentive awards in the previous employer, and may not be subject to the caps applied to NEXT’s annual bonus plan or the LTIP. All such awards for external appointments, whether made under the annual bonus plan, LTIP or otherwise, will be limited to the commercial value of the amounts forfeited and will take account of the nature, time periods and performance requirements of those awards. In particular the Committee’s starting point will be that any forfeited awards which are subject to continued service or performance requirements are replaced by NEXT awards with broadly equivalent terms. However, the Committee may relax these requirements in exceptional circumstances and where the Committee considers it to be less expensive for shareholders, for example where service periods are materially complete and/or the replacement awards are materially discounted to reflect the conditions on forfeited awards. The Committee will only authorise guaranteed or non pro-rated awards under the annual bonus plan where the Committee considers it is necessary to secure a recruitment.
For external and internal appointments, the Committee may agree the Company will meet such relocation expenses it considers appropriate and/or make a contribution towards legal fees in agreeing employment terms.
The Company has not made an external appointment of an executive director for over 25 years and therefore no recruitment awards were made during the year. All such appointments during this time have been through internal promotions, so it is challenging to set out principles for an event that has not occurred in practice. Therefore the above principles, particularly for external appointments, represent guidelines considered reasonable by the Committee and the Committee will consider their application in practice, taking account when appropriate of evolving best practice.
ANNUAL REPORT AND ACCOUNTS JANUARY 2014
50

23158.04 - Proof 2 - 14/03/2014
Ad
diti
on
al i
nfo
rma
tion
Pare
nt C
om
pa
ny a
cc
ou
nts
Co
nso
lida
ted
ac
co
un
tsG
ove
rna
nc
eBu
sin
ess
rep
ort
sShare ownership guidelinesShare ownership guidelines do not form part of directors’ remuneration but the Committee has determined that these should be observed by executive directors.
The Chief Executive’s minimum shareholding is 1.5 times salary and for other executive directors 1 times salary. An executive director has up to five years from date of appointment to acquire the minimum shareholding and only shares owned beneficially are counted. All executive directors, including the new appointees, have met the minimum shareholding and Lord Wolfson, Christos Angelides and David Keens each hold numbers of NEXT shares with a value significantly in excess of the applicable guidelines.
Service contractsExecutive directorsThe Company’s policy on notice periods and in relation to termination payments is set out above. Apart from their service contracts, no director has had any material interest in any contract with the Company or its subsidiaries.
Non-executive directorsLetters of appointment for the Chairman and non-executive directors do not contain fixed term periods; however they are appointed in the expectation that they will serve for a minimum of six years, subject to satisfactory performance and re-election at Annual General Meetings.
Dates of appointment and notice periods for non-executive directors are set out below:
Date of appointment Notice period
ChairmanJohn Barton 17 May 2006 12 monthsNon-executive directorsSteve Barber 1 June 2007 1 monthChristine Cross 19 January 2005 1 monthJonathan Dawson 13 May 2004 1 monthCaroline Goodall 1 January 2013 1 monthFrancis Salway 1 June 2010 1 month
ANNUAL REPORT AND ACCOUNTS JANUARY 2014
51

23158.04 - Proof 2 - 14/03/2014
REMUNERATION REPORT
ILLUSTRATION OF APPLICATION OF REMUNERATION POLICYThe Committee’s objective is to ensure that the remuneration paid to senior executives is appropriate in both amount and structure, is directly linked to the Company’s annual and longer term performance and aligned with the interests of shareholders. Careful consideration is given to ensuring there is an appropriate balance in the remuneration structure between annual and long term rewards, as well as between cash and share-based payments. The charts below indicate the level of remuneration that could be received by each executive director in accordance with the directors’ remuneration policy in the first year to which the policy applies (i.e. year to January 2015) at different levels of performance.
LORD WOLFSON
0 500 1,000 1,500 2,000 2,500 3,000 3,500
Total £3,664k
Total £1,918k
Total £1,063k
Fixed Pay
Fixed pay
Mid-point/median
Maximum
Annual bonus
LTIP (multiple period)
41%
15%
30%
30%
29%
55%
100%
AMOUNT (£’000)
CHRISTOS ANGELIDES
0 500 1,000 1,500 2,000 2,500
Total £2,410k
Total £1,278k
Total £793kFixed pay
Mid-point/median
Maximum45%
17%21%
22%33%
62%
100%
Fixed Pay
Annual bonus
LTIP (multiple period)
AMOUNT (£’000)
DAVID KEENS
0 500 1,000 1,500 2,000
Total £2,080k
Total £1,039k
Total £592k
Fixed Pay
Fixed pay
Mid-point/median
Maximum
Annual bonus
LTIP (multiple period)
48%
19%24%
24%28%
57%
100%
AMOUNT (£’000)
ANNUAL REPORT AND ACCOUNTS JANUARY 2014
52

23158.04 - Proof 2 - 14/03/2014
Ad
diti
on
al i
nfo
rma
tion
Pare
nt C
om
pa
ny a
cc
ou
nts
Co
nso
lida
ted
ac
co
un
tsG
ove
rna
nc
eBu
sin
ess
rep
ort
s
MICHAEL LAW
0 200 400 600 800 1,000 1,200
Total £1,293k
Total £650k
Total £375k
Fixed Pay
Fixed pay
Mid-point/median
Maximum
Annual bonus
LTIP (multiple period)
47%
19%23%
24%29%
58%
100%
AMOUNT (£’000)
JANE SHIELDS
0 200 400 600 800 1,000 1,200
Total £1,299k
Total £656k
Total £381k
Fixed Pay
Fixed pay
Mid-point/median
Maximum
Annual bonus
LTIP (multiple period)
47%
19%23%
24%29%
58%
100%
AMOUNT (£’000)
In the above scenarios, the following assumptions have been made:
FIXED AND PERFORMANCE-RELATED PAY ASSUMPTIONS
Fixed ❚ Base salary for 2014 (see page 43);
❚ Benefits as at February 2014;
❚ Pension-related salary supplements calculated at 15% of base salary for 2014; and
❚ Pension amounts based on 2013/14 single total figure of remuneration pension values (for Lord Wolfson and Christos Angelides only.)
Mid-point/median
Includes the performance-related pay a director would receive in the scenario where:
❚ 50% of maximum annual bonus is earned (being the mid-point); and
❚ LTIP1 pay out is at median and therefore 20% of the maximum award would vest. LTIP values apply to both awards made in the year.
Maximum Includes the performance-related pay a director would receive in the scenario where performance equalled or exceeded maximum targets:
❚ 100% of the annual bonus; and
❚ 100% vesting of LTIP1.
1 The LTIP is a share-based award and the scenario charts use the face value of shares at the date of the award and do not make any assumptions for share price movement. The LTIP scheme does not allow for the benefit of dividend gross-up.
ANNUAL REPORT AND ACCOUNTS JANUARY 2014
53

23158.04 - Proof 2 - 14/03/2014
REMUNERATION REPORT
The table below illustrates when the various payments in the charts above would actually be made or released to executive directors.
SETTLEMENT OF REMUNERATION AWARDED DURING THE FINANCIAL YEAR TO JANUARY 2015
TO BE SETTLED DURING FINANCIAL YEAR ENDING
JAN 2015 JAN 2016JAN2017 JAN 2018
JAN2019 JAN 2020
Base salaryBenefits
Annual performance for the year to January 2015 is measured against targets and any annual cash bonus is paid. For the Chief Executive, any bonus in excess of 100% of base salary is deferred for two years and payable in shares dependent on continued employment.
LTIP awards vest and are payable in shares if TSR is at or above median for the comparator group and general economic underpin condition satisfied. Directors must retain these shares (after payment of tax and NIC) for a further two years.
Any bonus earned by the Chief Executive for the Jan 2015 year in excess of 100% of base salary, payable in shares, is released.
LTIP shares which vested in the year to January 2018 are released after two year retention.
ANNUAL REPORT AND ACCOUNTS JANUARY 2014
54

23158.04 - Proof 2 - 14/03/2014
Ad
diti
on
al i
nfo
rma
tion
Pare
nt C
om
pa
ny a
cc
ou
nts
Co
nso
lida
ted
ac
co
un
tsG
ove
rna
nc
eBu
sin
ess
rep
ort
sNEXT EMPLOYMENT CONDITIONS GENERALLY The remuneration policy operates for the executive directors and senior management of the Group. Pay structures and employment conditions for other Group employees are driven by market and role comparatives and are also considered by the Committee to ensure that any differences for directors are justified. Salary increases for the wider employee group are taken into consideration when determining increases for executive directors and senior management. For the last 3 years, the base salary increases for the executive directors have generally been in line with wider company awards.
In common with executive directors, all other employees are eligible to participate in annual bonus arrangements. The targets for these are linked to performance of the group, their operating function or personal performance.
These other employees are provided with a competitive package of benefits that includes the opportunity to participate in the Group’s pension arrangements and staff discount on Group merchandise. In addition, the NEXT Management Share Option Plan provides for options over shares, exercisable between three and ten years following their grant, to be allocated to Group employees. This plan is primarily aimed at middle management and senior store staff. Options are set at the prevailing market price at the time of grant, and are generally granted annually. In order to encourage wider employee share ownership, the Company also operates all-employee Save as You Earn share schemes in the UK and Ireland, in which all permanent employees (including executive directors) are eligible to participate.
The Company did not consult with employees when drawing up the directors’ remuneration policy. The Committee does not generally use any formal internal comparison metrics when setting directors’ remuneration, other than the consideration of employee pay as described above, but has sought advice from FIT Remuneration Consultants LLP from time to time on the appropriateness and competitiveness of remuneration structures in place within the Company. No formal benchmarking exercise was undertaken during the year.
CONSIDERATION OF SHAREHOLDER VIEWSThe Remuneration Committee has written to and consulted with major shareholders on a pro-active basis when any significant change in remuneration policy has been considered and has taken full account of their feedback. Shareholder views about remuneration are also communicated to the Committee on an on-going basis through inclusion in Board reports of shareholder feedback and statements made by representative associations. In addition, the Committee Chairman and the Chairman of the Board have from time to time engaged directly with shareholders and representative bodies on any particular matters they may have raised. Shareholders and representative bodies are able to contact the Committee Chairman directly if they have any concerns regarding remuneration.
ANNUAL REPORT AND ACCOUNTS JANUARY 2014
55

23158.04 - Proof 2 - 14/03/2014
56
REM
UN
ERA
TIO
N R
EPO
RT
PART
3: A
NN
UAL
REPO
RT O
N R
EMU
NER
ATI
ON
Sec
tion
s o
f th
e a
nn
ua
l re
po
rt o
n re
mu
ne
ratio
n w
hic
h h
ave
be
en
su
bje
ct t
o a
ud
it a
re n
ote
d a
cc
ord
ing
ly.
SIN
GLE
TO
TAL
FIG
URE
OF
REM
UN
ERA
TIO
N (
AU
DIT
ED)
Dire
cto
rs’ r
emun
era
tion
£’00
0
Fi
xed
pa
y
Pe
rform
an
ce
-rela
ted
pa
y
Sala
ry/f
ee
sBe
ne
fits1
Pen
sio
n2
Sala
ry
sup
ple
me
nt3
Sub
-tota
lA
nnu
al b
onu
s4LT
IP5
Sha
re M
atc
hin
g
Pla
n6
Sha
re-s
ave
Sub
-tota
lTo
tal
rem
un
era
tion
2013
/14
2012
/13
2013
/14
2012
/13
2013
/14
2012
/13
2013
/14
2012
/13
2013
/14
2012
/13
2013
/14
2012
/13
2013
/14
2012
/13
2013
/14
2012
/13
2013
/14
2012
/13
2013
/14
2012
/13
2013
/14
2012
/13
Ch
airm
an
Joh
n B
art
on
255
250
––
––
––
255
250
––
––
––
––
––
255
250
Exe
cu
tive
dire
cto
rs
Lord
Wo
lfso
n72
971
449
4516
028
010
927
1,04
71,
066
1,09
31,
064
2,50
02,
500
––
6–
3,59
93,
564
4,64
6*4,
630*
Ch
risto
s A
ng
elid
es
529
519
3333
140
220
7919
781
791
529
514
2,50
02,
500
2,74
92,
103
––
5,77
85,
117
6,55
95,
908
Da
vid
Ke
en
s48
747
721
19–
–73
7258
156
848
747
21,
801
1,45
02,
529
2,04
24
–4,
821
3,96
45,
402
4,53
2
Mic
ha
el L
aw
†17
5N
/A16
N/A
–N
/A26
N/A
217
N/A
239
N/A
783
N/A
449
N/A
–N
/A1,
471
N/A
1,68
8N
/A
Jan
e S
hie
lds†
175
N/A
17N
/A–
N/A
26N
/A21
8N
/A23
9N
/A78
3N
/A45
4N
/A5
N/A
1,48
1N
/A1,
699
N/A
An
dre
w V
arle
y†12
135
57
27–
–18
5314
643
5–
351
631
1,07
8–
1,46
8–
–63
12,
897
777
3,33
2
No
n-e
xec
utiv
e d
irec
tors
Stev
e B
arb
er
6360
––
––
––
6360
––
––
––
––
––
6360
Ch
ristin
e C
ross
5350
––
––
––
5350
––
––
––
––
––
5350
Jon
ath
an
Da
wso
n74
70–
––
––
–74
70–
––
––
––
––
–74
70
Ca
rolin
e G
oo
da
ll53
4–
––
––
–53
4–
––
––
––
––
–53
4
Fra
nc
is S
alw
ay
5350
––
––
––
5350
––
––
––
––
––
5350
2,76
72,
549
143
124
300
500
331
171
3,54
13,
344
2,58
72,
401
8,99
87,
528
6,18
15,
613
15–
17,7
8115
,542
21,3
2218
,886
* As
det
aile
d in
the
Rem
un
era
tion
Co
mm
ittee
Ch
airm
an
’s St
ate
men
t, Lo
rd W
olfs
on
wa
ived
his
en
title
men
t to
the
Ap
ril 2
011
SMP
aw
ard
wh
ich
wo
uld
ha
ve m
atu
red
in A
pril
201
4 a
t an
est
ima
ted
va
lue
of £
3.8m
. Lo
rd W
olfs
on
als
o w
aiv
ed h
is e
ntit
lem
ent t
o th
e Ju
ne
2010
SM
P a
wa
rd w
hic
h m
atu
red
in 2
013
an
d w
ou
ld h
ave
ha
d a
va
lue
at t
ha
t da
te o
f £3m
. H
ad
he
no
t do
ne
so, L
ord
Wo
lfso
n’s
tota
l rem
un
era
tion
wo
uld
h
ave
bee
n £
8,43
5,00
0 fo
r 201
3/14
an
d £
7,60
1,00
0 fo
r 201
2/13
.
† An
dre
w V
arle
y st
epp
ed d
own
fro
m th
e Bo
ard
on
31
Ma
y 20
13; s
inc
e th
en h
e h
as
co
ntin
ued
in h
is ro
le a
s G
rou
p P
rop
erty
Dire
cto
r an
d re
cei
ved
the
sam
e ra
te o
f sa
lary
. M
ich
ael
La
w a
nd
Ja
ne
Shie
lds
join
ed
the
Boa
rd o
n 1
Ju
ly 2
013.
Th
e va
lues
dis
clo
sed
for s
ala
ry, b
enef
its a
nd
sa
lary
su
pp
lem
ent f
or t
hes
e th
ree
Dire
cto
rs re
late
on
ly to
the
per
iod
of t
hei
r exe
cu
tive
dire
cto
rsh
ip.
LTIP
rem
un
era
tion
of £
631,
000
wa
s p
aid
to A
nd
rew
Va
rley
afte
r he
step
ped
dow
n fr
om
the
Boa
rd a
nd
rela
tes
to th
e th
ree
yea
r per
form
an
ce
per
iod
en
din
g J
uly
201
3. P
erfo
rma
nc
e-re
late
d re
mu
ner
atio
n fo
r Mic
ha
el L
aw
an
d J
an
e Sh
ield
s in
th
e a
bov
e ta
ble
incl
ud
es p
ay
rela
ting
to th
e p
erio
d b
efo
re th
ey b
eca
me
exec
utiv
e d
irec
tors
bu
t pa
id a
fter t
hei
r ap
po
intm
ent.
Tota
l em
olu
men
ts p
aid
to d
irec
tors
(sa
lary
/fee
s, b
enef
its, s
ala
ry s
up
ple
men
ts a
nd
an
nua
l bo
nus)
for t
he
yea
r to
Ja
nua
ry 2
014
wer
e £5
,828
,000
(20
13: £
5,24
5,00
0).
AN
NUA
L RE
PORT
AN
D A
CC
OU
NTS
JA
NUA
RY 2
014

23158.04 - Proof 2 - 14/03/2014
Ad
diti
on
al i
nfo
rma
tion
Pare
nt C
om
pa
ny a
cc
ou
nts
Co
nso
lida
ted
ac
co
un
tsG
ove
rna
nc
eBu
sin
ess
rep
ort
s
57
No
te 1
: Ben
efits
Ca
r/c
ash
allo
wa
nc
e
Fue
l
Me
dic
al i
nsu
ran
ce
& N
EXT
clo
thin
g
allo
wa
nc
eTo
tal
2014
£’00
020
13£’
000
2014
£’00
020
13£’
000
2014
£’00
020
13£’
000
2014
£’00
020
13£’
000
Lord
Wo
lfso
n40
367
72
249
45
Ch
risto
s A
ng
elid
es
2424
77
22
3333
Da
vid
Ke
en
s19
18–
–2
121
19
Mic
ha
el L
aw
13N
/A2
N/A
1N
/A16
N/A
Jan
e S
hie
lds
11N
/A4
N/A
2N
/A17
N/A
An
dre
w V
arle
y5
192
7–
17
27
No
te 2
: Pen
sio
n
Pen
sio
n v
alu
es a
re c
alc
ula
ted
usi
ng
the
met
ho
d re
qu
ired
by
the
new
reg
ula
tion
s, i.e
. th
e to
tal p
ensi
on
ac
cru
ed a
t Ja
nua
ry 2
014
less
the
tota
l pen
sio
n a
cc
rued
at t
he
end
of t
he
pre
vio
us
yea
r, a
dju
sted
for i
nfla
tion
an
d m
ulti
plie
d b
y a
fac
tor o
f 20.
It d
oes
no
t nec
essa
rily
rep
rese
nt t
he
eco
no
mic
va
lue
of t
he
pen
sio
n ri
gh
ts a
cc
rued
an
d th
is b
enef
it is
no
t im
med
iate
ly a
vaila
ble
to th
e d
irec
tor.
In s
um
ma
ry, t
he
pen
sio
n e
ntit
lem
ents
of t
he
dire
cto
rs a
re a
s fo
llow
s:
Ag
e a
t Ja
nua
ry
2014
Yea
rs o
f p
en
sio
na
ble
se
rvic
e
Ac
cru
ed
a
nnu
al
pe
nsi
on
£’
000
Ch
an
ge
in
ac
cru
ed
a
nnu
al
pe
nsi
on
£’
000
Ch
an
ge
in
ac
cru
ed
a
nnu
al
pe
nsi
on
(n
et
of
infla
tion
) £’
000
Tra
nsf
er
valu
e
of a
cc
rue
d
an
nua
l p
en
sio
n
Inc
rea
se/
(de
cre
ase
) in
tra
nsf
er
valu
e le
ss
dire
cto
r’s
co
ntr
ibu
tion
s £’
000
2014
£’00
020
13£’
000
Lord
Wo
lfso
n46
1932
416
84,
370
4,33
31
Ch
risto
s A
ng
elid
es
5021
286
147
4,80
54,
802
(23)
Da
vid
Ke
en
s60
2518
86
–4,
832
5,69
6(8
64)
Mic
ha
el L
aw
5225
122
3–
2,29
52,
3351
(40)
Jan
e S
hie
lds
5019
118
3–
2,00
32,
0131
(10)
1 M
icha
el L
aw
and
Ja
ne S
hiel
ds
wer
e p
rom
ote
d to
the
Bo
ard
on
1 Ju
ly 2
013.
As
they
wer
e a
lrea
dy
emp
loye
d b
y N
EXT
the
trans
fer v
alu
e d
iscl
ose
d a
bov
e is
ca
lcul
ate
d a
t the
yea
r sta
rt.
Yea
rs o
f p
en
sio
na
ble
se
rvic
e s
ho
wn
ab
ove
ma
y in
clu
de
bo
ug
ht-i
n s
erv
ice
fro
m t
he
tra
nsf
er
of
oth
er
pe
nsi
on
e
ntit
lem
en
ts in
to th
e P
lan
. D
irec
tors
’ pe
nsi
on
arra
ng
em
en
ts a
re s
ub
jec
t to
the
sa
me
ac
tua
rial r
ed
uc
tion
as
oth
er
em
plo
yee
s o
n te
rmin
atio
n o
r ea
rly re
tire
me
nt.
No
te 3
: Sa
lary
sup
ple
men
t in
lieu
of p
ensi
on
Sup
ple
me
nts
of
15%
of
ba
se s
ala
ry a
re p
aid
in
lie
u o
f p
en
sio
n p
rovi
sio
n a
fter
the
dire
cto
rs b
ec
am
e d
efe
rred
m
em
be
rs o
f th
e d
efin
ed
be
ne
fit s
ec
tion
of t
he
NEX
T G
rou
p P
en
sio
n P
lan
. D
avi
d K
ee
ns,
Jan
e S
hie
lds
an
d A
nd
rew
Va
rley
rec
eiv
ed
this
su
pp
lem
en
t fro
m 2
011,
Mic
ha
el L
aw
fro
m A
pril
201
2 a
nd
Lo
rd W
olfs
on
an
d C
hris
tos
An
ge
lide
s fro
m N
ove
mb
er 2
012.
No
te 4
: Ann
ual b
onu
sTh
e p
erfo
rma
nc
e ta
rge
ts fo
r th
e a
nn
ua
l bo
nu
s a
re s
et o
ut o
n p
ag
e 4
3. F
or
the
ye
ar
to J
an
ua
ry 2
014
ac
tua
l pre
-ta
x EP
S a
ch
ieve
d w
as
460.
0p, g
row
th o
f 17.
6%.
Ac
co
rdin
gly
, a b
on
us
of 1
50%
of s
ala
ry fo
r th
e C
hie
f Exe
cu
tive
an
d
100%
of s
ala
ry fo
r th
e o
the
r exe
cu
tive
dire
cto
rs w
as
ea
rne
d.
To p
rovi
de
a r
ete
ntio
n e
lem
en
t in
th
e c
ase
of
the
Ch
ief
Exe
cu
tive
, any
an
nu
al b
on
us
in e
xce
ss o
f 10
0% o
f b
ase
sa
lary
is p
aya
ble
in s
ha
res,
de
ferre
d fo
r a p
erio
d o
f tw
o y
ea
rs a
nd
su
bje
ct t
o fo
rfeitu
re if
he
vo
lun
taril
y re
sig
ns
prio
r to
the
en
d o
f th
at p
erio
d.
No
te 5
: LTI
PTh
e p
erfo
rma
nc
e ta
rget
s fo
r th
e LT
IP a
re s
et o
ut o
n p
ag
e 43
. In
Ap
ril 2
013,
the
Co
mm
ittee
revi
ewed
the
Co
mp
any
’s
fina
nc
ial
per
form
an
ce
for
the
thre
e ye
ar
per
form
an
ce
per
iod
to
Ja
nua
ry 2
013
in l
igh
t o
f u
nd
erly
ing
ec
on
om
ic
an
d o
ther
co
nd
itio
ns
(‘th
e ec
on
om
ic u
nd
erp
in’)
. D
urin
g t
his
per
iod
, th
e C
om
pa
ny’s
co
mp
ou
nd
an
nua
l gro
wth
in
un
der
lyin
g E
PS a
nd
pre
-tax
pro
fits
wa
s 16
.5%
an
d 7
.1%
res
pec
tivel
y, w
ell a
hea
d o
f RP
I (4
.1%
). D
ivid
end
s h
ad
a
lso
in
cre
ase
d i
n l
ine
with
EPS
an
d s
om
e £7
36m
wa
s re
turn
ed t
o s
ha
reh
old
ers
thro
ug
h s
ha
re b
uyb
ack
s. A
s th
e C
om
pa
ny’s
per
form
an
ce
als
o c
om
pa
red
fa
vou
rab
ly a
ga
inst
its
prin
cip
al
reta
il c
om
pet
itors
an
d F
TSE1
00
co
mp
an
ies,
the
Co
mm
ittee
co
nfir
med
tha
t th
e ec
on
om
ic u
nd
erp
in p
erfo
rma
nc
e c
on
diti
on
ha
d b
een
sa
tisfie
d.
As
a c
on
seq
uen
ce,
98%
of t
he
aw
ard
for t
his
per
iod
ves
ted
. Fo
r th
e th
ree
yea
r p
erfo
rma
nc
e p
erio
d to
Ju
ly 2
013,
TSR
ran
ked
fou
rth
in t
he
co
mp
ara
tor
gro
up
of 2
1 a
nd
100
% o
f th
e g
ran
t ma
de
in th
e se
co
nd
ha
lf o
f 201
0 ve
sted
. Th
e C
om
mitt
ee a
sses
sed
the
per
form
an
ce
of t
he
Co
mp
any
an
d
no
ted
th
at
EPS
co
mp
ou
nd
an
nua
l gro
wth
of 1
6.2%
an
d p
re-ta
x p
rofit
co
mp
ou
nd
an
nua
l gro
wth
of 6
.4%
ove
r th
e
thre
e ye
ar
per
iod
wer
e si
gn
ific
an
tly a
hea
d o
f RPI
(3.
7%).
In a
dd
itio
n, d
ivid
end
s h
ad
co
ntin
ued
to in
cre
ase
in li
ne
w
ith E
PS a
nd
£76
8m h
ad
bee
n re
turn
ed to
sh
are
ho
lder
s th
rou
gh
bu
yba
cks.
The
Co
mm
ittee
als
o a
sses
sed
ea
rnin
gs
gro
wth
ag
ain
st s
elec
ted
co
mp
ara
ble
ma
jor
UK
reta
ilers
an
d c
on
clu
ded
th
at
NEX
T h
ad
per
form
ed f
avo
ura
bly
. Ta
kin
g th
ese
fac
tors
into
ac
co
un
t, th
e C
om
mitt
ee d
eter
min
ed th
at t
he
eco
no
mic
un
der
pin
per
form
an
ce
co
nd
itio
n
for t
he
aw
ard
ha
d b
een
sa
tisfie
d.
The
aw
ard
s w
ere
ca
sh s
ettle
d fo
r all
exec
utiv
es.
For t
he
per
form
an
ce
per
iod
to J
anu
ary
201
4, TS
R ra
nke
d th
ird a
ga
inst
the
co
mp
ara
tor g
rou
p o
f 21
wh
ich
co
rresp
on
ds
to a
n e
xpec
ted
ves
ting
of 1
00%
of t
he
ma
xim
um
aw
ard
ma
de
in J
anu
ary
201
1.
In M
arc
h 2
014
the
Rem
un
era
tion
C
om
mitt
ee a
sses
sed
th
e p
erfo
rma
nc
e o
f th
e C
om
pa
ny o
n t
he
sam
e b
asi
s a
s d
esc
ribed
ab
ove
an
d n
ote
d t
ha
t EP
S c
om
po
un
d a
nnu
al g
row
th o
f 18.
2% a
nd
pre
-tax
pro
fit c
om
po
un
d g
row
th o
f 8%
ove
r th
e th
ree
yea
r per
iod
wer
e
sig
nifi
ca
ntly
ah
ead
of R
PI (
3.3%
). In
ad
diti
on
, div
iden
ds
ha
d c
on
tinu
ed to
inc
rea
se in
lin
e w
ith E
PS a
nd
£82
7m h
ad
b
een
retu
rned
to s
ha
reh
old
ers
thro
ug
h b
uyb
ack
s. Th
e C
om
mitt
ee a
lso
ass
esse
d e
arn
ing
s g
row
th a
ga
inst
sel
ecte
d
co
mp
ara
ble
ma
jor
UK
reta
ilers
an
d c
on
clu
ded
th
at
NEX
T h
ad
per
form
ed f
avo
ura
bly
. Ta
kin
g t
hes
e fa
cto
rs i
nto
a
cc
ou
nt,
the
Co
mm
ittee
det
erm
ined
tha
t th
e ec
on
om
ic u
nd
erp
in p
erfo
rma
nc
e c
on
diti
on
for t
he
aw
ard
ha
d b
een
sa
tisfie
d a
nd
it s
ho
uld
ves
t in
full.
LTIP
va
lues
for t
he J
anu
ary
201
4 si
ngle
fig
ure
tab
le c
om
pris
e th
e a
ctua
l va
lue
of a
wa
rds
tha
t ha
ve v
este
d a
nd b
een
p
aid
for t
he p
erfo
rma
nce
per
iod
end
ing
in J
uly
2013
, to
get
her w
ith th
e es
tima
ted
va
lue
of a
wa
rds
tha
t will
vest
for t
he
per
form
anc
e p
erio
d e
ndin
g in
Ja
nua
ry 2
014,
ba
sed
on
the
ave
rag
e N
EXT
sha
re p
rice
over
the
last
fina
ncia
l qua
rter o
f £5
6.47
. Fo
r Ja
nua
ry 2
013
thes
e a
re th
e a
ctua
l va
lues
of t
he LT
IP a
wa
rds
tha
t ves
ted
in re
spec
t of p
erfo
rma
nce
per
iod
s en
din
g in
tha
t fin
anc
ial y
ear.
The
ma
xim
um
va
lue
of L
TIP
aw
ard
s th
at v
est f
or
a p
art
icip
an
t in
a y
ear
is c
ap
ped
at £
2.5m
. Th
is c
ap
wa
s a
pp
lied
to
aw
ard
s th
at v
este
d in
the
yea
r to
Ja
nua
ry 2
013
for
Lord
Wo
lfso
n a
nd
Ch
risto
s A
ng
elid
es a
nd
pa
ymen
ts to
them
w
ere
red
uc
ed b
y £3
97k
an
d £
75k
resp
ectiv
ely.
Fo
r th
e a
wa
rds
vest
ing
in th
e ye
ar t
o J
anu
ary
201
4 th
e c
ap
will
ag
ain
b
e a
pp
lied
an
d p
aym
ents
to
Lo
rd W
olfs
on
an
d C
hris
tos
An
gel
ides
will
be
red
uc
ed b
y a
n e
stim
ate
d £
1,09
7k a
nd
£7
62k
resp
ectiv
ely.
No
te 6
: SM
PTh
e S
MP
wa
s in
trod
uc
ed
to e
nc
ou
rag
e o
wn
ers
hip
of N
EXT
sha
res
am
on
gst
exe
cu
tive
dire
cto
rs a
nd
oth
er
sen
ior
exe
cu
tive
s a
nd
to a
ct a
s a
furt
he
r re
ten
tion
inc
en
tive
. It
als
o c
on
tinu
es
to s
up
po
rt th
e C
om
mitt
ee
’s a
pp
roa
ch
of
en
surin
g c
lose
lon
g t
erm
alig
nm
en
t o
f m
an
ag
em
en
t’s in
tere
sts
with
sh
are
ho
lde
rs.
For
the
201
1 g
ran
t, w
hic
h is
d
ue
to v
est
in A
pril
201
4, s
om
e 2
5 se
nio
r ex
ec
utiv
es
we
re a
ble
to re
inve
st p
art
, or
all,
of t
he
ir a
nn
ua
l ca
sh b
on
us
in N
EXT
sha
res.
Th
e p
erfo
rma
nc
e ta
rge
ts fo
r th
e S
MP
are
se
t o
ut
on
pa
ge
68.
SM
P va
lue
s fo
r Ja
nu
ary
201
4 a
ssu
me
a m
axi
mu
m
vest
ing
in A
pril
201
4 a
nd
are
ba
sed
on
the
ave
rag
e N
EXT
sha
re p
rice
ove
r th
e la
st fi
na
nc
ial q
ua
rte
r of £
56.4
7. T
he
st
ron
g g
row
th in
EPS
me
an
s th
e m
axi
mu
m p
erfo
rma
nc
e ta
rge
t fo
r th
e S
MP
ha
s b
ee
n e
xce
ed
ed
an
d th
ere
fore
the
20
11 S
MP
will
ve
st in
full
in A
pril
201
4, s
ub
jec
t to
the
co
ntin
ue
d e
mp
loym
en
t of p
art
icip
an
ts.
Exe
cu
tive
dire
cto
rs w
ill n
o lo
ng
er b
e g
ran
ted
aw
ard
s u
nd
er t
he
SM
P a
fter J
an
ua
ry 2
014
an
d p
art
icip
atio
n w
ill b
e
rest
ricte
d to
se
nio
r exe
cu
tive
s b
elo
w B
oa
rd le
vel.
As
no
ted
be
low
the
Sin
gle
Fig
ure
of R
em
un
era
tion
tab
le, L
ord
Wo
lfso
n w
aiv
ed
his
en
title
me
nt t
o th
e A
pril
201
1 SM
P a
wa
rd a
nd
to th
e J
un
e 2
010
SMP
aw
ard
. In
resp
ec
t of t
he
SM
P a
wa
rd w
hic
h w
ill v
est
in A
pril
201
4, th
e e
stim
ate
d
tota
l 201
4 p
re-ta
x va
lue
for t
he
oth
er e
xec
utiv
e d
irec
tors
is £
6.2m
, of w
hic
h £
3.7m
(60
%)
de
rive
s fro
m th
e g
row
th in
N
EXT’
s sh
are
pric
e s
inc
e in
vest
me
nt i
n 2
011.
The
SM
P va
lue
s fo
r Ja
nu
ary
201
3 a
re a
ctu
al v
alu
es
at t
he
da
te o
f ve
stin
g.

23158.04 - Proof 2 - 14/03/2014
REMUNERATION REPORT
Executive directors’ external appointmentsNo current executive director holds any non-executive directorships outside the Group. Andrew Varley, who stepped down from the Board in 2013, is a non-executive director of LondonMetric Property plc and the Committee approved his retention of the director’s fee of £50,000 per annum for this appointment.
PENSION ENTITLEMENTS (AUDITED) In October 2013 all active members of the NEXT Group Pension Plan (the “NEXT Plan”), were transferred to the new 2013 NEXT Group Pension Plan (the “2013 Plan”) so that pensioners of the NEXT Plan could be issued with individual policies with Aviva. Most deferred pensioners and pensioners who had not previously been subject to a buy-in through Aviva were also transferred to the 2013 Plan. Benefits within the 2013 Plan mirror those in the NEXT Plan.
Executive directors are now members of the 2013 Plan which has been approved by HM Revenue & Customs and consists of defined benefit and defined contribution sections.
The trustee of both Plans is a limited company, NEXT Pension Trustees Limited (the “Trustee”). The Board of the Trustee includes members of the 2013 Plan, a pensioner member and a Chairman who is an independently appointed person with no other association with NEXT. Two of the directors are member nominated directors and cannot be removed by NEXT; the other directors, including the independent director, are appointed by and can be removed by NEXT. All directors of the Trustee receive a fee for their services, including those directors who are also employees of NEXT. No director of the Company is a director of the Trustee.
The Plans’ investments are kept separate from the business of the NEXT Group and the Trustee holds them in separate trusts. Responsibility for investment of the Plans’ funds has been delegated to professional investment managers.
The Group operates a salary sacrifice scheme whereby members from either section can elect to receive a reduced gross salary in exchange for enhanced employer pension contributions. The participation of members in the salary sacrifice scheme does not result in any overall increase in costs to the Group.
Defined contribution sectionEmployees of the Group can join the defined contribution section of the 2013 Plan. Members elect to pay either 3% or 5% of their pensionable earnings which is matched by the Company. For death prior to retirement, a lump sum of three times the member’s base salary at the previous April is payable along with the current value of the member’s fund.
ANNUAL REPORT AND ACCOUNTS JANUARY 2014
58

23158.04 - Proof 2 - 14/03/2014
Ad
diti
on
al i
nfo
rma
tion
Pare
nt C
om
pa
ny a
cc
ou
nts
Co
nso
lida
ted
ac
co
un
tsG
ove
rna
nc
eBu
sin
ess
rep
ort
sDefined benefit sectionThe defined benefit section was closed to new members in 2000. In 2012 the Group reviewed this section for remaining employee members and following a consultation process the future accrual of pension benefits has been based on pensionable salary frozen at October 2012, rather than final earnings. In addition, those employees can elect to receive up to a 15% salary supplement or additional contributions to the defined contribution section. The defined benefit section now provides members with a retirement benefit of one sixtieth or one eightieth (depending on the member’s chosen contribution rate) of pensionable earnings at October 2012 for each year of pensionable service.
Lord Wolfson, Christos Angelides and a small number of senior employees, on completion of at least 20 years’ pensionable service at age 65, receive a retirement benefit of two-thirds of pensionable earnings at October 2012, which accrues uniformly throughout their pensionable service. The deferred pensions for David Keens, Jane Shields and Michael Law are based on their pensionable earnings at the time they became deferred pensioners and accrued uniformly throughout their pensionable service.
The defined benefit section provides a lump sum death in service benefit and dependants’ pensions on death in service or following retirement. Pensions are only payable to deceased members’ children after death in service. In the case of ill-health retirement, only the accrued pension is payable. All benefits are subject to 2013 Plan limits. Increases to pensions in payment are at the discretion of the Trustee although pensionable service post-1997 is subject to limited price indexation. From 2006, sales and profit related bonuses were excluded from pensionable earnings and the normal retirement age under the Plan was increased from 60 to 65. There are no additional benefits which become receivable by a director in the event of early retirement.
Members contribute 3% or 5% of pensionable earnings, whilst the Company currently makes contributions at the rate of 17.5%. The last full triennial valuation of the NEXT Plan was carried out as at March 2013, and the first triennial valuation of the 2013 Plan was carried out as at October 2013. As calculated in accordance with International Financial Reporting Standards, the surplus in the 2013 Plan at January 2014 was £70.3m; further details are given in Note 21 to the financial statements.
Certain members (including Lord Wolfson and Christos Angelides) whose accrued or projected pension fund value exceeds their personal lifetime allowance are provided with benefits through an unfunded, unapproved arrangement. The relevant members contribute towards the additional cost of providing these benefits by a payment of 5% on all pensionable earnings. Since April 2011, where existing members have reached either the annual or lifetime pension contributions limits, the Company has offered those members the choice of leaving the defined benefit section and either joining the defined contribution section (with an enhanced Company contribution) or taking a salary supplement, in both cases equal to 10% or 15% of their salary (depending on their existing contributions and benefits).
Auto-EnrolmentFollowing the introduction of Auto-Enrolment (A-E) in 2012, most employees now have the option of joining the 2013 Plan, the statutory A-E plan or opting out of pension provision through the Company. Contributions to A-E commenced in February 2013.
ANNUAL REPORT AND ACCOUNTS JANUARY 2014
59

23158.04 - Proof 2 - 14/03/2014
REMUNERATION REPORT
DIRECTORS’ SHAREHOLDING AND SHARE INTERESTS (AUDITED)Directors’ interestsThe Company has a formal share ownership requirement for executive directors, as set out on page 51. All executive directors have met this requirement. Directors’ beneficial interests in shares at the beginning of the financial year and at the end of the year were as follows:
Ordinary sharesDeferred
bonus shares1 LTIP2 SMP2 Sharesave3
2014 2013 2014 2013 2014 2013 2014 2013 2014 2013
Lord Wolfson 1,514,128 1,520,505 9,844 18,922 149,221 180,829 9,2044 67,0984 364 1,826
Christos Angelides 105,073 77,171 – - 93,440 134,888 63,986 103,214 431 431
Steve Barber 5,000 5,000 – - – - – - – -
John Barton 14,000 16,000 – - – - – - – -
Christine Cross 5,598 5,598 – - – - – - – -
Jonathan Dawson 5,000 5,000 – - – - – - – -
Caroline Goodall nil nil – - – - – - – -
David Keens 201,950 165,535 – - 74,715 90,544 58,414 96,306 388 477
Michael Law 11,627 N/A – - 34,493 N/A 13,282 N/A 431 N/A
Francis Salway 7,790 9,258 – - – - – - – -
Jane Shields 37,065 N/A – - 34,493 N/A 13,318 N/A 494 N/A
Andrew Varley5 79,885 69,817 – - 55,531 67,303 40,020 72,224 431 431
1 Full details of deferred bonus are set out on pages 42 and 43.2 The LTIP and SMP amounts above are the maximum potential awards that may vest subject to performance conditions described on pages
42 to 45.3 Executive directors can participate in the Company’s Sharesave scheme (see details on page 46) and the amounts above are the options
which will become exercisable at maturity.4 As disclosed on page 39 Lord Wolfson has waived his potential entitlement under the 2011 SMP (67,098 options). 5 Andrew Varley stepped down from the Board in May 2013.
The Company’s 2013 5.25% corporate bonds were redeemed during the year so David Keens no longer has a beneficial bond holding (2013: £83,000 nominal value).
Save for the waiver of Lord Wolfson’s 2011 SMP entitlement, there have been no other changes to directors’ interests in the shares of the Company from the end of the financial year to 19 March 2014. Full details of directors’ interests in the shares and share options of the Company are contained in the Register of Directors’ Interests which is open to inspection.
ANNUAL REPORT AND ACCOUNTS JANUARY 2014
60

23158.04 - Proof 2 - 14/03/2014
Ad
diti
on
al i
nfo
rma
tion
Pare
nt C
om
pa
ny a
cc
ou
nts
Co
nso
lida
ted
ac
co
un
tsG
ove
rna
nc
eBu
sin
ess
rep
ort
sThe table below summarises those share awards made to executive directors that have not yet vested or, in the case of awards made under historic share option schemes, have not yet been exercised.
Awards during
financial year end January
Date of award
Market price at
award date
£
Option price
£
Maximum share
potential awarded
Options waived1
Shares vested in the year
Vesting date/
Exercisable dates2
Lord WolfsonDeferred bonus shares 2012 Apr 2011 20.24 N/A 17,020 17,0203 Apr 2013
2013 Apr 2012 29.33 N/A 1,902 Apr 20142014 Apr 2013 44.08 N/A 7,942 Apr 2015
LTIP 2011 Mar 2010 20.13 Nil 34,228 24,3474 Jan 20132011 Sept 2010 21.14 Nil 32,592 32,592 Jul 20132012 Mar 2011 20.70 Nil 33,6845 Jan 20142012 Sept 2011 23.02 Nil 30,289 Jul 20142013 Mar 2012 26.60 Nil 26,861 Jan 20152013 Sept 2012 30.83 Nil 23,175 Jul 20152014 Mar 2013 37.396 Nil 19,492 Jan 20162014 Sept 2013 46.366 Nil 15,720 Jul 2016
SMP 2012 Apr 2011 22.37 Nil 67,098 67,098 Apr 2014 – Apr 20212014 Apr 2013 43.81 Nil 9,204 Apr 2016 – Apr 2023
Sharesave 2009 Oct 2008 9.17 1,826 1,8268 Dec 2013 – Jun 2014
2014 Oct 2013 41.12 364 Dec 2018 – Jun 2019
Christos AngelidesLTIP 2011 Mar 2010 20.13 Nil 31,048 28,6924 Jan 2013
2011 Sept 2010 21.14 Nil 29,565 29,565 Jul 20132012 Mar 2011 20.70 Nil 30,5565 Jan 20142012 Sept 2011 23.02 Nil 16,486 Jul 20142013 Mar 2012 26.60 Nil 14,619 Jan 20152013 Sept 2012 30.83 Nil 12,614 Jul 20152014 Mar 2013 37.396 Nil 10,609 Jan 20162014 Sept 2013 46.366 Nil 8,556 Jul 2016
SMP 2011 Jun 2010 20.23 Nil 46,132 46,1327 Jun 20132012 Apr 2011 22.37 Nil 48,690 Apr 2014 – Apr 20212013 Apr 2012 30.32 Nil 8,392 Apr 2015 – Apr 20222014 Apr 2013 43.81 Nil 6,904 Apr 2016 – Apr 2023
Sharesave 2012 Oct 2011 20.84 431 Dec 2014 – Jun 2015
Notes to this table are on page 63.
ANNUAL REPORT AND ACCOUNTS JANUARY 2014
61

23158.04 - Proof 2 - 14/03/2014
REMUNERATION REPORT
Awards during
financial year end January
Date of award
Market price at
award date
£
Option price
£
Maximum share
potential awarded
Options waived1
Shares vested in the year
Vesting date/
Exercisable dates2
David KeensLTIP 2011 Mar 2010 20.13 Nil 17,139 16,796 Jan 2013
2011 Sept 2010 21.14 Nil 16,320 16,320 Jul 20132012 Mar 2011 20.70 Nil 16,8665 Jan 20142012 Sept 2011 23.02 Nil 15,166 Jul 20142013 Mar 2012 26.60 Nil 13,449 Jan 20152013 Sept 2012 30.83 Nil 11,604 Jul 20152014 Mar 2013 37.396 Nil 9,759 Jan 20162014 Sept 2013 46.366 Nil 7,871 Jul 2016
SMP 2011 Jun 2010 20.23 Nil 44,796 44,7967 Jun 20132012 Apr 2011 22.37 Nil 44,796 Apr 2014 – Apr 20212013 Apr 2012 30.32 Nil 6,714 Apr 2015 – Apr 20222014 Apr 2013 43.81 Nil 6,904 Apr 2016 – Apr 2023
Sharesave 2011 Oct 2010 17.82 319 3198 Dec 2013 – Jun 20142012 Oct 2011 20.84 158 Dec 2014 – Jun 20152014 Oct 2013 41.12 230 Dec 2018 – Jun 2019
Michael LawLTIP 2012 Mar 2011 20.70 Nil 7,3335 Jan 2014
2012 Sept 2011 23.02 Nil 6,594 Jul 20142013 Mar 2012 26.60 Nil 5,851 Jan 20152013 Sept 2012 30.83 Nil 5,048 Jul 20152014 Mar 2013 37.396 Nil 4,814 Jan 20162014 Sept 2013 46.366 Nil 4,853 Jul 2016
SMP 2012 Apr 2011 22.37 Nil 7,952 Apr 2014 – Apr 20212013 Apr 2012 30.32 Nil 2,862 Apr 2015 – Apr 20222014 Apr 2013 43.81 Nil 2,468 Apr 2016 – Apr 2023
Sharesave 2012 Oct 2011 20.84 431 Dec 2014 – Jun 2015
Jane ShieldsLTIP 2012 Mar 2011 20.70 Nil 7,3335 Jan 2014
2012 Sept 2011 23.02 Nil 6,594 Jul 20142013 Mar 2012 26.60 Nil 5,851 Jan 20152013 Sept 2012 30.83 Nil 5,048 Jul 20152014 Mar 2013 37.396 Nil 4,814 Jan 20162014 Sept 2013 46.366 Nil 4,853 Jul 2016
SMP 2012 Apr 2011 22.37 Nil 8,032 Apr 2014 – Apr 20212013 Apr 2012 30.32 Nil 2,820 Apr 2015 – Apr 20222014 Apr 2013 43.81 Nil 2,466 Apr 2016 – Apr 2023
Sharesave 2009 Oct 2008 9.17 1,497 1,4978 Dec 2013 – Jun 20142010 Oct 2009 14.34 195 Dec 2014 – Jun 20152014 Oct 2013 41.12 299 Dec 2018 – Jun 2019
ANNUAL REPORT AND ACCOUNTS JANUARY 2014
62

23158.04 - Proof 2 - 14/03/2014
Ad
diti
on
al i
nfo
rma
tion
Pare
nt C
om
pa
ny a
cc
ou
nts
Co
nso
lida
ted
ac
co
un
tsG
ove
rna
nc
eBu
sin
ess
rep
ort
sAwards during
financial year end January
Date of award
Market price at
award date
£
Option price
£
Maximum share
potential awarded
Options waived1
Shares vested in the year
Vesting date/
Exercisable dates2
Andrew Varley LTIP 2011 Mar 2010 20.13 Nil 12,742 12,487 Jan 2013
2011 Sept 2010 21.14 Nil 12,133 12,133 Jul 20132012 Mar 2011 20.70 Nil 12,5365 Jan 20142012 Sept 2011 23.02 Nil 11,273 Jul 20142013 Mar 2012 26.60 Nil 9,995 Jan 20152013 Sept 2012 30.83 Nil 8,624 Jul 20152014 Mar 2013 37.396 Nil 7,253 Jan 20162014 Sept 2013 46.366 Nil 5,850 Jul 2016
SMP 2011 Jun 2010 20.23 Nil 32,204 32,2047 Jun 20132012 Apr 2011 22.37 Nil 33,306 Apr 2014 – Apr 20212013 Apr 2012 30.32 Nil 6,714 Apr 2015 – Apr 2022
Sharesave 2012 Oct 2011 20.84 431 Dec 2014 – Jun 2015
1 As disclosed on page 39 Lord Wolfson has waived his potential entitlement under the 2011 SMP (options over 67,098 shares).2 For LTIP awards, the date in this column is the end of the three year performance period. Actual vesting will be the date on which the
Committee determines whether any Performance Condition has been satisfied.3 The market value of shares at the time the deferred bonus vested was £44.08.4 For LTIP awards made prior to February 2014 the maximum value of LTIP awards that vest for a particular year is capped at £2.5m. The cap was
applied to the awards that vested in the year to January 2013 for Lord Wolfson and Christos Angelides. The impact of this cap was to reduce the shares vested by 9,196 and 1,735 respectively.
5 See page 57 for details of the performance conditions and vesting levels applicable to the LTIP schemes vesting in the year.6 The LTIP price at award date is NEXT’s average share price over the three months prior to the start of the performance period.7 Christos Angelides, David Keens and Andrew Varley exercised their SMP options at the date of vesting when the market price for the shares was
£45.58.8 The market price for the shares at the date of Sharesave exercise was £54.00 for Lord Wolfson and Jane Shields and £54.95 for David Keens.9 Within the above table, all awards are subject to pre-vesting performance conditions except for Sharesave options and Deferred Bonus Shares.
ANNUAL REPORT AND ACCOUNTS JANUARY 2014
63

23158.04 - Proof 2 - 14/03/2014
REMUNERATION REPORT
The LTIP performance periods which mature after January 2014 are not yet complete and no entitlement has yet been earned. A charge of £26,845,000 for the year (2013: £23,368,000) has been made in the accounts in respect of these LTIP grants, of which approximately £10,962,000 (2013: £9,554,000) related to the executive directors.
For all LTIP participants, the total maximum shares receivable at January 2013 was 1,084,471 (January 2012: 1,364,175). During the year, grants over 385,956 shares vested (2013: 517,192), grants over 52,296 shares, including 10,931 shares subject to the maximum cap, lapsed (2013: 57,545 in total, including 23,344 capped shares) and further grants over 217,087 shares were issued (2013: 295,033). At January 2014 the total maximum shares receivable was 863,306 (excluding the impact of any cap on the total value which may apply) with an average remaining contractual life of 1.6 years (2013: 1.6 years).
The aggregate gains of directors arising from the exercise of options granted under the SMP and Sharesave scheme and LTIP awards that vested in the year totalled £14,150,000 (2013: £7,011,000).
SCHEME INTERESTS AWARDED DURING THE YEAR TO JANUARY 2014 (AUDITED) LTIP
Face value In respect of the LTIP awards granted during the year to January 2014, the maximum “face value” of awards (i.e. the maximum number of shares that would vest if all performance measures are met multiplied by the average share price used to determine the award) is summarised below:
Mar 2013 £’000
Sep 2013 £’000
Total £’000
Lord Wolfson 729 729 1,458Christos Angelides 397 397 794David Keens 365 365 730Michael Law1 180 225 405Jane Shields1 180 225 405Andrew Varley2 271 271 542
1 March 2013 award granted prior to promotion to Executive director and therefore at 60% of annual salary.2 LTIP award prior to Andrew Varley stepping down from the Board.
Vesting if minimum performance achieved
20% of the entitlement will be earned for relative TSR at median and full vesting requires relative TSR at upper quintile.
Performance period
March 2013 grant: period from February 2013 to January 2016.
September 2013 grant: period from August 2013 to July 2016.
Performance measures
The LTIP performance measures are detailed on page 43. The Companies in the TSR comparator group for the awards granted during the financial year are:
ASOSBurberryCarpetrightCarphone WarehouseDebenhams
Dixons RetailDunelmHalfordsHome Retail GroupJ Sainsbury
JD Sports1
Kesa1
Kingfisher Marks & SpencerMorrisonsMothercare
N BrownSupergroupTed BakerTescoW H Smith
1 JD Sports replaced Kesa in the comparator group for the three year performance period commencing July 2013.
ANNUAL REPORT AND ACCOUNTS JANUARY 2014
64

23158.04 - Proof 2 - 14/03/2014
Ad
diti
on
al i
nfo
rma
tion
Pare
nt C
om
pa
ny a
cc
ou
nts
Co
nso
lida
ted
ac
co
un
tsG
ove
rna
nc
eBu
sin
ess
rep
ort
sSMP
Face value In respect of the SMP awards granted during the financial year, the maximum potential “face value” of awards (i.e. the maximum number of shares that would vest if all performance measures are met multiplied by the average share price used to determine the number of shares awarded) is summarised below
£’000
Lord Wolfson 403Christos Angelides 302David Keens 302Michael Law1 108Jane Shields1 108
1 2013 award granted prior to promotion to Executive director and therefore a lower bonus was earned and capped. Further details of these awards are provided on page 62.
Vesting if minimum performance achieved
For each investment share 0.5 matched share will be earned at the end of a three year performance period for fully diluted EPS for the financial year ending January 2016 of 314.5p and 2 matched shares will be earned for EPS of 365.0p.
Performance period
February 2013 to January 2016.
Performance measures
The SMP performance measures are detailed on page 45.
Deferred bonusIn addition to the scheme interests detailed above, any annual bonus in excess of 100% of base salary payable to the Chief Executive is deferred for a period of two years and subject to forfeiture if he voluntarily resigns prior to the end of that period. The value of the deferred bonus (£364k) is included in the single total figure of remuneration table on page 56.
PAYMENTS TO PAST DIRECTORS (AUDITED) There were no payments to past directors during the financial year ending January 2014.
PAYMENTS FOR LOSS OF OFFICE (AUDITED) There were no payments made to any director in respect of loss of office.
PAY AND PERFORMANCEPerformance graph The graph below illustrates the performance of the Company when compared with the FTSE All Share and FTSE General Retailers index. These have been selected to illustrate the Company’s total shareholder return performance against a wide UK index and a sector specific index for the five year period ending January 2014.
2009 2010 2011 2012 2013 2014
660
580
500
420
340
260
180
100
20
NEXT FTSE General RetailersRe-based to 31 January 2009 = 100
FTSE All Share
NEXT plc Performance Chart 2009-2014 Total Shareholder Return
ANNUAL REPORT AND ACCOUNTS JANUARY 2014
65
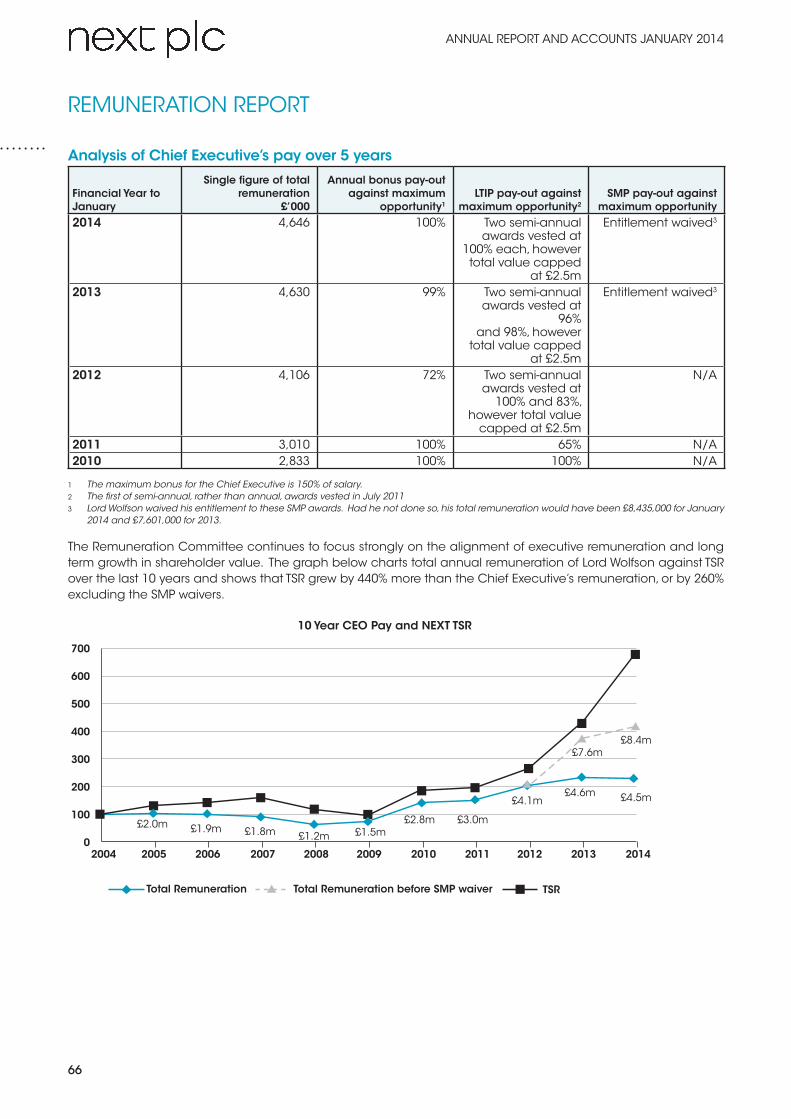
23158.04 - Proof 2 - 14/03/2014
REMUNERATION REPORT
Analysis of Chief Executive’s pay over 5 years
Financial Year to January
Single figure of total remuneration
£’000
Annual bonus pay-out against maximum
opportunity1LTIP pay-out against
maximum opportunity2SMP pay-out against
maximum opportunity2014 4,646 100% Two semi-annual
awards vested at 100% each, however total value capped
at £2.5m
Entitlement waived3
2013 4,630 99% Two semi-annual awards vested at
96% and 98%, however
total value capped at £2.5m
Entitlement waived3
2012 4,106 72% Two semi-annual awards vested at
100% and 83%, however total value
capped at £2.5m
N/A
2011 3,010 100% 65% N/A2010 2,833 100% 100% N/A
1 The maximum bonus for the Chief Executive is 150% of salary.2 The first of semi-annual, rather than annual, awards vested in July 20113 Lord Wolfson waived his entitlement to these SMP awards. Had he not done so, his total remuneration would have been £8,435,000 for January
2014 and £7,601,000 for 2013.
The Remuneration Committee continues to focus strongly on the alignment of executive remuneration and long term growth in shareholder value. The graph below charts total annual remuneration of Lord Wolfson against TSR over the last 10 years and shows that TSR grew by 440% more than the Chief Executive’s remuneration, or by 260% excluding the SMP waivers.
2004 2005 2006 2007 2008 2009 2010 2011 2012 2013 2014
700
600
500
400
300
200
100
0
Total Remuneration Total Remuneration before SMP waiver TSR
10 Year CEO Pay and NEXT TSR
£2.0m £1.9m £1.8m £1.2m £1.5m£2.8m £3.0m
£4.1m£4.6m
£7.6m£8.4m
£4.5m
ANNUAL REPORT AND ACCOUNTS JANUARY 2014
66

23158.04 - Proof 2 - 14/03/2014
Ad
diti
on
al i
nfo
rma
tion
Pare
nt C
om
pa
ny a
cc
ou
nts
Co
nso
lida
ted
ac
co
un
tsG
ove
rna
nc
eBu
sin
ess
rep
ort
sCHANGE IN REMUNERATION OF CHIEF EXECUTIVEThe table below shows the percentage changes in Lord Wolfson’s remuneration (i.e. salary, taxable benefits and annual bonus) between 2013/14 and 2012/13 compared with the percentage changes in the average of each of those components of pay for Group employees in the UK and Eire. This group has been selected as the most appropriate comparator and represents almost 90% of the Group’s workforce.
Salary increase %
Annual bonus
increase %
Taxable benefits
increase %
Lord Wolfson 2.0% 2.7% 8.9%UK/Eire Employees (average per FTE) 2.6% 18.7% 2.2%
RELATIVE IMPORTANCE OF SPEND ON PAYThe graph below illustrates for the years ended January 2014 and 2013 the relative and actual spend on total remuneration paid to all employees of the Group together with other significant distributions and payments (i.e. for share buybacks and dividends).
£147.7m
£241.3m
£295.8m
£510.1m£531.9m
£164.8m
All Employee Remuneration Compared with Other Disbursements
Total wages & salaries Buybacks Dividends
2014
2013
IMPLEMENTATION OF REMUNERATION POLICY IN THE FINANCIAL YEAR TO JANUARY 2015 The Committee will implement the policy set out on pages 41 to 55 subject to approval by shareholders of that policy at the 2014 AGM. The policy table sets out the performance targets for SMP and LTIP awards which will be made during the year to January 2015 and summarised below is that same information for all outstanding awards made under the LTIP and SMP schemes:
LTIPDetails of potential awards granted to executive directors for outstanding performance periods are as follows:
3 year performance periods commencing
Maximum potential award granted (% of base salary)
Lord WolfsonChristos Angelides &
David KeensJane Shields &
Michael Law
August 2011, February 2012, August 2012, and February 2013 100% 75% 60%August 2013 100% 75% 75%
The comparator group for the LTIP three year performance periods ending January 2015, July 2015, January 2016 and July 2016 is the same as the group detailed on page 64. For the three year performance period ending July 2014, HMV was included in place of Dunelm.
ANNUAL REPORT AND ACCOUNTS JANUARY 2014
67

23158.04 - Proof 2 - 14/03/2014
REMUNERATION REPORT
Share Matching PlanVesting of awards is dependent solely on achieving the fully diluted post-tax EPS targets detailed below.
Required fully diluted EPS (pence)Date of grant For 0.5:1 match For 1:1 match For 2:1 match
April 2011 (for this award the matching ratio is after grossing up for income tax and employees’ national insurance)
231.3 240.2 258.1
April 2012 (for this award no grossing up was applied prior to the matching award)
267.2 281.5 310.2
April 2013 (for this award no grossing up was applied prior to the matching award)
314.5 331.3 365.0
These targets require a minimum three year growth in EPS of 12% before any shares vest and a maximum award is only achieved if EPS growth reaches 25% (2011 award) and 30% (2012 and 2013 awards) over three years. The effective matching ratio will be calculated on a straight line basis for EPS falling between each of the threshold points. Details of the calculation of fully diluted EPS are provided in Note 9.
Dilution of share capital by employee share plansThe Company monitors and has complied with dilution limits in its various share scheme rules and has not issued a significant number of new or treasury shares in satisfaction of share schemes in the last 10 years. Share-based incentives are usually satisfied from shares purchased and held by the ESOT – see Note 26.
CONSIDERATION OF MATTERS RELATING TO DIRECTORS’ REMUNERATION
Remuneration CommitteeDuring the year the Committee comprised the following independent non-executive directors:
Jonathan Dawson (Committee Chairman) Steve Barber John Barton Christine Cross Francis Salway Caroline Goodall
The Committee met six times during the year under review. All meetings were fully attended except that Christine Cross and Jonathan Dawson were each unable to attend one meeting.
Role of Remuneration CommitteeThe Committee determines the remuneration of the Group’s Chairman and executive directors, and reviews that of senior executives. It is also responsible for determining the targets for performance-related pay schemes, approves any award of the Company’s shares under share option or incentive schemes to employees and oversees any major changes in employee benefit structures. The Committee members have no conflicts of interest arising from cross-directorships and no director is permitted to be involved in any decisions as to his or her own remuneration. The remuneration of non-executive directors is decided by the Chairman and executive directors of the Board. The Committee’s terms of reference are available on the Company’s website (www.nextplc.co.uk) or on request from the Company Secretary.
ANNUAL REPORT AND ACCOUNTS JANUARY 2014
68

23158.04 - Proof 2 - 14/03/2014
Ad
diti
on
al i
nfo
rma
tion
Pare
nt C
om
pa
ny a
cc
ou
nts
Co
nso
lida
ted
ac
co
un
tsG
ove
rna
nc
eBu
sin
ess
rep
ort
sAssistance to the CommitteeDuring the period the Committee received input from the Chief Executive and Group Finance Director. Aon Hewitt and FIT Remuneration Consultants LLP also provided independent external advice, mostly of a technical nature and related to share plans and the implementation of the new Directors’ Remuneration reporting regime. These advisers have no other connection with the Company and were appointed by the Committee based on their expertise in the relevant areas of interest. Based on the nature of the advice, the relatively small fees and no other connection existing with these advisers, the Committee was satisfied that the advice received was objective and independent. PricewaterhouseCoopers provided independent verification services of total shareholder returns for NEXT and the comparator group of companies under the long term incentive plan. Each of these firms is a member of the Remuneration Consultants Group, being the professional body for remuneration consultants and have confirmed to us that they adhere to its code of conduct.
During the year Aon Hewitt, FIT Remuneration Consultants LLP and PricewaterhouseCoopers, were paid less than £20k each and their fees were charged at an hourly rate.
VOTING AT GENERAL MEETINGA resolution to approve the directors’ remuneration report was passed at the Company’s 2013 AGM. Of the total votes cast (109m), 99.7% were voted for the resolution and 0.3% against; 1.8m votes were withheld which represented 1.1% of the total number of shares in issue at the date of the AGM.
Votes For%
For Votes Against%
AgainstTotal Votes
CastVotes
WithheldTo approve the directors’ remuneration report 108,929,272 99.7% 357,212 0.3% 109,286,484 1,837,922
On behalf of the Board
Jonathan Dawson Chairman of the Remuneration Committee
ANNUAL REPORT AND ACCOUNTS JANUARY 2014
69

23158.04 - Proof 2 - 14/03/2014
INDEPENDENT AUDITOR’S REPORT TO THE MEMBERS OF NEXT PLC
We have audited the Group financial statements of NEXT plc for the year ended 25 January 2014 which comprise the Consolidated Income Statement, the Consolidated Statement of Comprehensive Income, the Consolidated Balance Sheet, the Consolidated Statement of Changes in Equity, the Consolidated Cash Flow Statement and the related notes 1 to 32. The financial reporting framework that has been applied in their preparation is applicable law and International Financial Reporting Standards (IFRSs) as adopted by the European Union.
This report is made solely to the Company’s members, as a body, in accordance with Chapter 3 of Part 16 of the Companies Act 2006. Our audit work has been undertaken so that we might state to the Company’s members those matters we are required to state to them in an auditor’s report and for no other purpose. To the fullest extent permitted by law, we do not accept or assume responsibility to anyone other than the Company and the Company’s members as a body, for our audit work, for this report, or for the opinions we have formed.
Respective responsibilities of directors and auditor As explained more fully in the Directors’ Responsibilities Statement set out on page 31, the directors are responsible for the preparation of the Group financial statements and for being satisfied that they give a true and fair view. Our responsibility is to audit and express an opinion on the Group financial statements in accordance with applicable law and International Standards on Auditing (ISAs) (UK and Ireland). Those standards require us to comply with the Auditing Practices Board’s Ethical Standards for Auditors.
Scope of the audit of the financial statements An audit involves obtaining evidence about the amounts and disclosures in the financial statements sufficient to give reasonable assurance that the financial statements are free from material misstatement, whether caused by fraud or error. This includes an assessment of: whether the accounting policies are appropriate to the Group’s circumstances and have been consistently applied and adequately disclosed; the reasonableness of significant accounting estimates made by the directors; and the overall presentation of the financial statements. In addition, we read all the financial and non-financial information in the Annual Report and Accounts to identify material inconsistencies with the audited financial statements and to identify any information that is apparently materially incorrect based on, or materially inconsistent with, the knowledge acquired by us in the course of performing the audit. If we become aware of any apparent material misstatements or inconsistencies we consider the implications for our report.
Our assessment of risks of material misstatementWe consider that the following areas present the greatest risk of material misstatement in the financial statements and consequently have had the greatest impact on our audit strategy, the allocation of resources and, the efforts of the engagement team, including the more senior members of the team;
❚ The assessment of the directory debt provision;
❚ The assessment of inventory provisions;
❚ The assessment of underlying risk and valuation of, financial instruments; and
❚ The risk of misstatement arising from management override of internal controls with regard to estimates and other provisions relevant to the retail environment.
Our application of materialityWe apply the concept of materiality both in planning and performing our audit, and in evaluating the effect of misstatements on our audit and on the financial statements. For the purposes of determining whether the financial statements are free from material misstatement we define materiality as the magnitude of misstatement that makes it probable that the economic decisions of a reasonably knowledgeable person, relying on the financial statements, would be changed or influenced.
We also determine a lower level of performance materiality which we use to determine the extent of testing needed to reduce to an appropriately low level the probability that the aggregate of uncorrected and undetected misstatements exceeds materiality for the financial statements as a whole.
When establishing our overall audit strategy, we determined a magnitude of uncorrected misstatements that we judged would be material for the financial statements as a whole. We determined materiality for the Group to be £35 million, which is approximately 5% of pre-exceptional pre-tax profit.
On the basis of our risk assessments, together with our assessment of the Group’s overall control environment, our judgement is that performance materiality for the Group should be 50% of materiality, namely £17.5 million. Our approach is designed to have a reasonable probability of ensuring that the total of uncorrected and undetected audit differences does not exceed our materiality for the financial statements as a whole.
We agreed with the Audit Committee that we would report to the Committee all audit differences in excess of £1.7 million, as well as differences below that threshold that, in our view, warranted reporting on qualitative grounds.
An overview of the scope of our auditThe Retail and Directory business operations accounting for 95% of the Group’s revenue and 93% of total segment profit were subject to a full scope audit. The overseas Group purchasing division, Lipsy and Property Management contribute 5% of total segment profit and were subject to specific scope audits in areas where we assessed there was a risk of material misstatement. For the remaining components of the Group, we performed other procedures to confirm there were no significant risks of material misstatement in the Group financial statements.
ANNUAL REPORT AND ACCOUNTS JANUARY 2014
70

23158.04 - Proof 2 - 14/03/2014
Ad
diti
on
al i
nfo
rma
tion
Pare
nt C
om
pa
ny a
cc
ou
nts
Co
nso
lida
ted
ac
co
un
tsG
ove
rna
nc
eBu
sin
ess
rep
ort
sIn view of the nature of the main risk areas noted above, the Group audit team is supported by experts in auditing the financial instruments and their valuation.
The principal way in which we scoped our response to the risks noted above was as follows:
❚ We checked management’s categorisation of the debtor book based on payment in accordance with agreed terms. We challenged the reasonableness of the key assumptions in determining management’s provision for future default, being the Group’s assumed default rates (which represent the likelihood of eventual default for debt within each category), and expected recovery rates on such debts, in combination with evidence of historical default and recovery rates, current performance, and any observed changes in debtor profile in the current period. We checked the arithmetical accuracy of the provision based on management’s assumptions and compared the underlying debtor book categorisation to the financial accounting system and the mapping of external affordability data.
❚ The adequacy of the inventory provision depends on the level of stock on hand which is expected to be sold below cost plus attributable selling costs. We examined the Group’s historical trading patterns of stock sold at full price, stock marked down below full price in a sale period, and the element of inventory that is passed to clearance; along with the related margins achieved for each of these sales channels. We then challenged the reasonableness of the inventory provision taking into account a combination of the evidence of these historical trading patterns and any observed changes to the current year buying cycle.
❚ We determined the different types of financial instruments held by the Group and the level of risk inherent in each of the transaction types. We analysed the features of a selected sample of financial instruments by comparison to the originating contractual agreements. With our experts we challenged the reasonableness of the valuation of the selected sample where the Group’s valuation was outside a reasonable tolerance of our own expectations.
❚ We performed analytical procedures and journal entry testing in order to identify and test the risk of misstatement arising from management override of controls, which in addition to the risks disclosed above, focused on accruals and provisions of a judgemental nature capable of being manipulated by management. These comprised of accruals for sales returns, gift card exposure, share based payments and LTIP arrangements; along with provisions for dilapidations, onerous leases and vacant leasehold properties.
Opinion on financial statements In our opinion the Group financial statements:
❚ give a true and fair view of the state of the Group’s affairs as at 25 January 2014 and of its profit for the year then ended;
❚ have been properly prepared in accordance with IFRSs as adopted by the European Union; and
❚ have been prepared in accordance with the requirements of the Companies Act 2006 and Article 4 of the IAS Regulation.
Opinion on other matters prescribed by the Companies Act 2006 In our opinion:
❚ the information given in the Strategic Report and the Directors’ Report for the financial year for which the Group financial statements are prepared is consistent with the Group financial statements.
Matters on which we are required to report by exception We have nothing to report in respect of the following:
Under the ISAs (UK and Ireland), we are required to report to you if, in our opinion, information in the annual report is:
❚ materially inconsistent with the information in the audited financial statements; or
❚ apparently materially incorrect based on, or materially inconsistent with, our knowledge of the Group acquired in the course of performing our audit; or
❚ is otherwise misleading.
In particular, we are required to consider whether we have identified any inconsistencies between our knowledge acquired during the audit and the directors’ statement that they consider the annual report is fair, balanced and understandable and whether the annual report appropriately discloses those matters that we communicated to the audit committee which we consider should have been disclosed.
Under the Companies Act 2006 we are required to report to you if, in our opinion:
❚ certain disclosures of directors’ remuneration specified by law are not made; or
❚ we have not received all the information and explanations we require for our audit.
Under the Listing Rules we are required to review:
❚ the directors’ statement, set out on page 37, in relation to going concern; and
❚ the part of the Corporate Governance Statement relating to the Company’s compliance with the nine provisions of the UK Corporate Governance Code specified for our review.
Other matter We have reported separately on the parent company financial statements of NEXT plc for the year ended 25 January 2014 and on the information in the Directors’ Remuneration Report that is described as having been audited.
Nigel Meredith Senior Statutory Auditor for and on behalf of Ernst & Young LLP, Statutory Auditor Birmingham 20 March 2014
Notes: 1. The maintenance and integrity of the Next plc website is the responsibility of the
directors; the work carried out by the auditors does not involve consideration of these matters and, accordingly, the auditors accept no responsibility for any changes that may have occurred to the financial statements since they were initially presented on the website.
2. Legislation in the United Kingdom governing the preparation and dissemination of financial statements may differ from legislation in other jurisdictions
ANNUAL REPORT AND ACCOUNTS JANUARY 2014
71

23158.04 - Proof 2 - 14/03/2014
CONSOLIDATED INCOME STATEMENTFor the financial year ended 25 January
2014 2013
Notes
Underlying and total
£mUnderlying
£m
Exceptional items
(Note 6) £m
Total£m
Continuing operationsRevenue 1 , 2 3,740.0 3,547.8 15.0 3,562.8Cost of sales (2,499.9) (2,431.1) (5.9) (2,437.0)Gross profit 1,240.1 1,116.7 9.1 1,125.8Distribution costs (296.2) (269.5) – (269.5)Administrative expenses (217.7) (201.0) – (201.0)Other (losses)/gains 3 (5.9) 3.4 35.8 39.2Trading profit 720.3 649.6 44.9 694.5Share of results of associates 2.5 0.6 – 0.6Operating profit 3 722.8 650.2 44.9 695.1Finance income 5 0.7 0.4 – 0.4Finance costs 5 (28.3) (29.0) – (29.0)Profit before taxation 695.2 621.6 44.9 666.5Taxation 7 (142.0) (148.5) (9.4) (157.9)Profit for the year 553.2 473.1 35.5 508.6
Profit for the year attributable to:Equity holders of the parent company 553.2 473.2 35.5 508.7Non-controlling interest – (0.1) – (0.1)Profit for the year 553.2 473.1 35.5 508.6
2014 2013Underlying
and total Underlying Total
Basic earnings per share 9 366.1p 297.7p 320.1pDiluted earnings per share 9 355.6p 289.9p 311.7p
ANNUAL REPORT AND ACCOUNTS JANUARY 2014
72

23158.04 - Proof 2 - 14/03/2014
Ad
diti
on
al i
nfo
rma
tion
Pare
nt C
om
pa
ny a
cc
ou
nts
Go
vern
an
ce
Co
nso
lida
ted
ac
co
un
tsBu
sin
ess
rep
ort
s
CONSOLIDATED STATEMENT OF COMPREHENSIVE INCOMEFor the financial year ended 25 January
Notes2014
£m2013
£m
Profit for the year 553.2 508.6
Other comprehensive income and expenses:Items that will not be reclassified to profit or lossActuarial losses on defined benefit pension scheme 21 (12.6) (19.7)Tax relating to items which will not be reclassified 5.0 5.9Sub-total items that will not be reclassified (7.6) (13.8)
Items that may be reclassified to profit or lossExchange differences on translation of foreign operations 3.0 –(Losses)/gains on cash flow hedges (21.9) 1.6Transferred to income statement on cash flow hedges (14.9) (4.5)Transferred to the carrying amount of hedged items on cash flow hedges 8.5 (0.3)Tax relating to items that may be reclassified 5.3 1.0Sub-total items that may be reclassified (20.0) (2.2)
Other comprehensive expense for the year (27.6) (16.0)Total comprehensive income for the year 525.6 492.6
Attributable to:Equity holders of the parent company 525.6 492.7Non-controlling interest – (0.1)Total comprehensive income for the year 525.6 492.6
ANNUAL REPORT AND ACCOUNTS JANUARY 2014
73

23158.04 - Proof 2 - 14/03/2014
CONSOLIDATED BALANCE SHEETAs at 25 January
Notes2014
£m2013
£m
ASSETS AND LIABILITIESNon-current assetsProperty, plant & equipment 10 509.2 537.3Intangible assets 11 44.4 44.8Interests in associates and other investments 12 7.9 7.2Defined benefit pension surplus 21 70.3 65.6Other financial assets 15 17.7 30.9Deferred tax assets 7 27.0 –
676.5 685.8Current assetsInventories 13 385.6 331.8Customer and other receivables 14 808.0 718.1Other financial assets 15 1.2 21.6Cash and short term deposits 16 273.3 136.3
1,468.1 1,207.8Total assets 2,144.6 1,893.6
Current liabilitiesBank loans and overdrafts 17 (2.6) (5.4)Corporate bonds 20 – (87.6)Trade payables and other liabilities 18 (594.0) (537.2)Dividends payable 8 (74.4) –Other financial liabilities 19 (83.8) (87.5)Current tax liabilities (79.7) (98.3)
(834.5) (816.0)Non-current liabilitiesCorporate bonds 20 (800.8) (566.8)Provisions 22 (8.5) (11.2)Deferred tax liabilities 7 – (4.0)Other financial liabilities 19 (0.9) –Other liabilities 18 (213.7) (210.0)
(1,023.9) (792.0)Total liabilities (1,858.4) (1,608.0)
NET ASSETS 286.2 285.6
TOTAL EQUITY 286.2 285.6
Approved by the Board on 20 March 2014
Lord Wolfson of Aspley Guise Chief Executive 20 March 2014
David Keens Group Finance Director
ANNUAL REPORT AND ACCOUNTS JANUARY 2014
74

23158.04 - Proof 2 - 14/03/2014
Ad
diti
on
al i
nfo
rma
tion
Pare
nt C
om
pa
ny a
cc
ou
nts
Go
vern
an
ce
Co
nso
lida
ted
ac
co
un
tsBu
sin
ess
rep
ort
s
CONSOLIDATED STATEMENT OF CHANGES IN EQUITYFor the financial year ended 25 January
Share capital
£m
Share premiumaccount
£m
Capitalredemp-
tionreserve
£m
ESOT reserve
£m
Fair value
reserve£m
Foreign currency
trans-lation
£m
Other reserves
£m
Retained earnings
£m
Shareholders’
equity£m
Non-control-
linginterest
£m
Total equity
£m
At January 2012 16.9 0.8 13.0 (141.1) 11.5 2.0 (1,443.8) 1,763.4 222.7 – 222.7
Profit for the year – – – – – – – 508.7 508.7 (0.1) 508.6Other comprehensive expense for the year – – – – (3.2) – – (12.8) (16.0) – (16.0)Total comprehensive income for the year – – – – (3.2) – – 495.9 492.7 (0.1) 492.6
Shares issued – 0.1 – – – – – – 0.1 – 0.1Share buybacks & commitments (Note 23) (0.8) – 0.8 – – – – (220.0) (220.0) – (220.0)ESOT share purchases & commitments (Note 26) – – – (143.5) – – – – (143.5) – (143.5)Shares issued by ESOT – – – 69.0 – – – (24.7) 44.3 – 44.3Share option charge – – – – – – – 17.8 17.8 – 17.8Tax recognised directly in equity – – – – – – – 19.3 19.3 – 19.3Equity dividends – – – – – – – (147.7) (147.7) – (147.7)At January 2013 16.1 0.9 13.8 (215.6) 8.3 2.0 (1,443.8) 1,904.0 285.7 (0.1) 285.6
Profit for the year – – – – – – – 553.2 553.2 – 553.2Other comprehensive income/(expense) for the year – – – – (24.3) 3.0 – (6.3) (27.6) – (27.6)Total comprehensive income for the year – – – – (24.3) 3.0 – 546.9 525.6 – 525.6
Share buybacks & commitments (Note 23) (0.6) – 0.6 – – – – (311.9) (311.9) – (311.9)ESOT share purchases & commitments (Note 26) – – – (55.0) – – – – (55.0) – (55.0)Shares issued by ESOT – – – 74.0 – – – (35.6) 38.4 – 38.4Share option charge – – – – – – – 15.8 15.8 – 15.8Equity awards settled in cash – – – – – – – (2.4) (2.4) – (2.4)Tax recognised directly in equity – – – – – – – 29.0 29.0 – 29.0Equity dividends – – – – – – – (238.9) (238.9) – (238.9)At January 2014 15.5 0.9 14.4 (196.6) (16.0) 5.0 (1,443.8) 1,906.9 286.3 (0.1) 286.2
ANNUAL REPORT AND ACCOUNTS JANUARY 2014
75

23158.04 - Proof 2 - 14/03/2014
CONSOLIDATED CASH FLOW STATEMENTFor the financial year ended 25 January
2014£m
2013£m
Cash flows from operating activitiesOperating profit 722.8 695.1 Depreciation and amortisation 117.4 117.2 Impairment of property, plant & equipment 2.9 1.8 Loss on disposal of property, plant & equipment 13.0 2.5 Share option charge less amounts settled in cash 13.4 17.8 Share of undistributed profit of associates (0.7) (0.1) Exchange movement 9.3 (3.2) (Increase)/decrease in inventories (53.8) 40.1 Increase in customer and other receivables (90.9) (21.7) Increase in trade and other payables 50.7 7.4 Pension contributions less income statement charge (17.3) (50.2)Cash generated from operations 766.8 806.7 Corporation taxes paid (152.0) (147.7)Net cash from operating activities 614.8 659.0
Cash flows from investing activities Additions to property, plant & equipment (105.3) (81.6) Movement in capital accruals 2.4 (10.8) Payments to acquire property, plant & equipment (102.9) (92.4) Net proceeds from disposal of subsidiary – 1.5 Proceeds from sale of property, plant & equipment 0.4 5.3 Payment of deferred consideration (0.1) (0.1)Net cash from investing activities (102.6) (85.7)
Cash flows from financing activities Repurchase of own shares (295.8) (241.9) Purchase of shares by ESOT (97.5) (123.0) Proceeds from disposal of shares by ESOT 42.9 43.4 Bonds issued 250.0 – Bonds redeemed (85.5) – Interest paid (21.5) (23.8) Interest received 0.5 2.0 Payment of finance lease liabilities (0.1) (0.1) Dividends paid (164.8) (147.7)Net cash from financing activities (371.8) (491.1)
Net increase in cash and cash equivalents 140.4 82.2Opening cash and cash equivalents 130.9 48.8Effect of exchange rate fluctuations on cash held (0.6) (0.1)Closing cash and cash equivalents (Note 31) 270.7 130.9
ANNUAL REPORT AND ACCOUNTS JANUARY 2014
76

23158.04 - Proof 2 - 14/03/2014
Ad
diti
on
al i
nfo
rma
tion
Pare
nt C
om
pa
ny a
cc
ou
nts
Go
vern
an
ce
Co
nso
lida
ted
ac
co
un
tsBu
sin
ess
rep
ort
s
GROUP ACCOUNTING POLICIES
Basis of preparationThe financial statements of NEXT plc and its subsidiaries (“the Group”) have been prepared in accordance with International Financial Reporting Standards (“IFRS”) adopted for use in the European Union and in accordance with the Companies Act 2006. The financial statements have been prepared on the historical cost basis except for certain financial instruments, pension assets and liabilities and share-based payment liabilities which are measured at fair value. The financial statements are for the 52 weeks to 25 January 2014 (last year 52 weeks to 26 January 2013).
Except for the immaterial effect of the amendment to IAS 19 (described on page 80), there have been no changes to our group accounting policies this year or last year and the principal policies adopted are set out below.
Basis of consolidationThe consolidated financial statements incorporate the financial statements of NEXT plc (“the Company”) and its subsidiary undertakings. All intra-group transactions, balances, income and expenses are eliminated on consolidation.
The results of any subsidiaries acquired or disposed of during the period are included in the consolidated income statement from the effective date of acquisition or up to the effective date of disposal. The results and net assets of associated undertakings are incorporated into these financial statements using the equity method of accounting.
Foreign currenciesThe consolidated financial statements are presented in pounds Sterling, which is the Company’s functional and presentation currency. The Group includes foreign entities whose functional currencies are not Sterling. On consolidation, the assets and liabilities of those entities are translated at the exchange rates at the balance sheet date and income and expenses are translated at weighted average rates during the period. Translation differences are recognised in equity.
Transactions in currencies other than an entity’s functional currency are recorded at the exchange rate on the transaction date, whilst assets and liabilities are translated at exchange rates at the balance sheet date. Exchange differences are recognised in the income statement.
RevenueRevenue represents the fair value of amounts receivable for goods and services and is stated net of sales taxes and returns. Sales of goods are recognised on delivery. Directory service charge income is accrued on a time basis by reference to the principal outstanding and the effective interest rate. Revenue from the sale of gift cards is deferred until their redemption.
Underlying profit and exceptional itemsExceptional items are significant items of an unusual or non-recurring nature which are shown separately in the income statement to provide a clearer understanding of the underlying financial performance during the year. Further details are given in Note 6.
Property, plant & equipmentProperty, plant and equipment are stated at cost less accumulated depreciation and impairment.
Depreciation is charged so as to write down the cost of assets to their estimated residual values over their remaining useful lives on a straight line basis. Estimated useful lives and residual values are reviewed at least annually and are summarised as follows:
Freehold and long leasehold property 50 yearsPlant and fittings: Plant, machinery and building works 10 – 25 years Fixtures and fittings 6 – 15 years Vehicles, IT and other assets 2 – 6 years Leasehold improvements the period of the lease, or useful life if shorter
ANNUAL REPORT AND ACCOUNTS JANUARY 2014
77

23158.04 - Proof 2 - 14/03/2014
GoodwillGoodwill is initially measured at cost, being the excess of the acquisition cost over the Group’s interest in the assets and liabilities recognised. Goodwill is not amortised, but is reviewed for impairment annually or whenever there is an indication of impairment.
Other intangible assetsSeparately identifiable intangible assets obtained in a business acquisition are initially recognised at fair value, if this can be measured reliably and the asset arises from contractual or other legal rights. Other intangible assets are amortised on a straight line basis over their expected useful lives as follows:
Lipsy brand names and trademarks 10 yearsLipsy customer relationships 4 years
Other intangible assets are reviewed for impairment whenever events or changes in circumstances indicate their carrying value may not be recoverable.
InvestmentsInvestments in subsidiary companies and equity instruments that do not have a quoted market price in an active market and whose fair value cannot be reliably measured are stated at cost, subject to review for impairment.
ImpairmentThe carrying values of non-financial assets are reviewed at each balance sheet date to determine whether there is any indication of impairment. If any impairment loss arises, the asset value is adjusted to its estimated recoverable amount and the difference is recognised in the income statement.
Pension arrangementsThe Group offers pension benefits which include both defined benefit and defined contribution arrangements. Pension assets are held in separate trustee administered funds and the Group also provides other, unfunded, pension benefits to certain plan members.
The cost of providing benefits under the defined benefit and unfunded arrangements are determined using the projected unit credit method, with actuarial valuations being carried out at each balance sheet date. The net defined benefit pension asset or liability represents the fair value of the defined benefit plan assets less the present value of the defined benefit and unfunded liabilities. A net pension asset is only recognised to the extent that it is expected to be recoverable in the future.
Actuarial gains and losses are recognised in the statement of comprehensive income in full in the period in which they occur. Other income and expenses are recognised in the income statement. The accounting impact of an amendment to IAS 19 Employee Benefits is explained on page 80.
The cost of the defined contribution section is recognised in the income statement as incurred.
Inventories Inventories (stocks) are valued at the lower of standard cost or net realisable value. Net realisable value is based on estimated selling prices less further costs to be incurred to disposal.
Directory and other receivablesDirectory customer receivables represent outstanding customer balances less any allowance for impairment which is based on objective evidence and recent default experience by customer account category. Other trade receivables are stated at invoice value less any allowance for impairment.
Cash and cash equivalentsFor the purposes of the consolidated cash flow statement, cash and cash equivalents consist of cash and short term deposits, less bank overdrafts which are repayable on demand. Short term deposits are those with an original maturity of three months or less.
GROUP ACCOUNTING POLICIES
ANNUAL REPORT AND ACCOUNTS JANUARY 2014
78

23158.04 - Proof 2 - 14/03/2014
Ad
diti
on
al i
nfo
rma
tion
Pare
nt C
om
pa
ny a
cc
ou
nts
Go
vern
an
ce
Co
nso
lida
ted
ac
co
un
tsBu
sin
ess
rep
ort
sCorporate bonds and bank borrowingsCorporate bonds and bank borrowings are initially recognised at fair value and subsequently adjusted where hedge accounting applies (see interest rate derivatives below). Accrued interest is included within other creditors and accruals.
Share-based paymentsThe fair value of employee share options is calculated when they are granted using a Black-Scholes model. The resulting cost is charged in the income statement over the vesting period of the option, and is regularly reviewed and adjusted for the expected and actual number of options vesting.
For cash-settled share-based payments (including the long term incentive plan), the fair value of the liability is determined at each balance sheet date and the cost is recognised in the income statement over the vesting period.
TaxationTaxation, comprised of current and deferred tax, is charged or credited to the income statement unless it relates to items in other comprehensive income or directly in equity. In such cases, the related tax is also recognised in other comprehensive income or directly in equity.
Current tax liabilities are measured at the amount expected to be paid, based on tax rates and laws that are enacted or substantively enacted at the balance sheet date.
Deferred tax is accounted for using the balance sheet liability method and is calculated using rates of taxation enacted or substantively enacted at the balance sheet date which are expected to apply when the asset or liability is settled.
Deferred tax liabilities are generally recognised for all taxable temporary differences. Deferred tax assets are only recognised to the extent that it is probable that taxable profits will be available against which deductible temporary differences can be utilised. Deferred tax is not recognised in respect of investments in subsidiaries and associates where the reversal of any taxable temporary differences can be controlled and are unlikely to reverse in the foreseeable future.
Other financial assets and liabilities: derivative financial instruments and hedge accountingDerivative financial instruments (“derivatives”) are used to manage risks arising from changes in foreign currency exchange rates relating to the purchase of overseas sourced products and changes in interest rates relating to the Group’s debt. In accordance with its treasury policy, the Group does not enter into derivatives for speculative purposes. Foreign currency and interest rate derivatives are stated at their fair value, being the estimated amount that the Group would receive or pay to terminate them at the balance sheet date based on prevailing foreign currency and interest rates.
Foreign currency derivativesChanges in the fair value of foreign currency derivatives which are designated and effective as hedges of future cash flows are recognised in equity in the fair value reserve, and subsequently transferred to the carrying amount of the hedged item or the income statement. Realised gains or losses on cash flow hedges are therefore recognised in the income statement in the same period as the hedged item.
Hedge accounting is discontinued when the hedging instrument expires or is sold, terminated or exercised, or no longer qualifies for hedge accounting. At that time, any cumulative gain or loss on the hedging instrument previously recognised in equity is retained in equity until the hedged transaction occurs. If the hedged transaction is no longer expected to occur, the net cumulative gain or loss recognised in equity is then transferred to the income statement.
Changes in the fair value of foreign currency derivatives which are ineffective or do not meet the criteria for hedge accounting in IAS 39 are recognised in the income statement.
ANNUAL REPORT AND ACCOUNTS JANUARY 2014
79

23158.04 - Proof 2 - 14/03/2014
GROUP ACCOUNTING POLICIES
Interest rate derivativesThe Group uses interest rate derivatives to hedge part of the interest rate risk associated with the Company’s corporate bonds. The carrying values of the relevant bonds are adjusted only for changes in fair value attributable to the interest rate risk being hedged. The adjustment is recognised in the income statement and is offset by movements in the fair value of the derivatives.
Changes in the fair value of interest rate derivatives which are ineffective or do not meet the criteria for hedge accounting in IAS 39 are recognised in the income statement.
Share buybacksThe Group has regularly returned surplus cash to shareholders through share buybacks. Shares purchased for cancellation are deducted from retained earnings at the total consideration paid or payable. The Company also uses contingent share purchase contracts and irrevocable closed period buyback programmes. The obligation to purchase shares is recognised in full at the inception of the contract, even when that obligation is conditional on the share price. Any subsequent reduction in the obligation caused by the expiry or termination of a contract is credited back to equity at that time.
Shares held by ESOTThe NEXT Employee Share Ownership Trust (“ESOT”) provides for the issue of shares to Group employees, principally under share option schemes. Shares in the Company held by the ESOT are included in the balance sheet at cost as a deduction from equity. The ESOT may also use contingent share purchase contracts and irrevocable closed period share purchase programmes which are accounted for as described above.
ProvisionsA provision is recognised where the Group has a legal or constructive obligation as a result of a past event and it is probable that an outflow of economic benefits will be required to settle the obligation.
Leasing commitmentsRentals payable under operating leases are charged to income on a straight line basis over the period of the lease. Contingent rentals payable based on store revenues are accrued in line with the related sales.
Premiums payable, rent free periods and capital contributions receivable on entering an operating lease are released to income on a straight line basis over the lease term.
The Group does not have significant finance leases.
Significant areas of estimation and judgementThe preparation of the financial statements requires judgements, estimations and assumptions to be made that affect the reported values of assets, liabilities, revenues and expenses. The nature of estimation means that actual outcomes could differ from those estimates. Significant areas of estimation for the Group include the expected future cash flows applied in measuring impairment of Directory customer receivables (Note 14), estimated selling prices applied in determining the net realisable values of inventories (Note 13 and inventories policy above) and the actuarial assumptions applied in calculating the net retirement benefit obligation (Note 21). The Audit Committee section of the Corporate Governance Report (page 34) contains further information on the judgmental areas considered by the Committee during the year.
Changes to accounting standards An amendment to IAS 19 Employee Benefits was published in June 2011 and became effective during the current year. This affects the accounting for defined benefit pension schemes and has been applied this year.
If applied retrospectively, the effect of the amendment on last year would have been to increase pension costs in the income statement by £2.6 million and to increase actuarial gains in the statement of comprehensive income by an equivalent amount. There is no impact on the balance sheet. As the impact is not material, prior year figures have not been restated and remain as reported last year.
Various other new accounting standards and amendments were issued during the year, none of which have had or are expected to have any significant impact on the Group.
ANNUAL REPORT AND ACCOUNTS JANUARY 2014
80

23158.04 - Proof 2 - 14/03/2014
Ad
diti
on
al i
nfo
rma
tion
Pare
nt C
om
pa
ny a
cc
ou
nts
Go
vern
an
ce
Co
nso
lida
ted
ac
co
un
tsBu
sin
ess
rep
ort
s
NOTES TO THE CONSOLIDATED FINANCIAL STATEMENTS
1. Segmental analysisThe Group’s operating segments under IFRS 8 have been determined based on management accounts reviewed by the Board. The performance of operating segments is assessed on profits before interest and tax, excluding equity settled share option charges recognised under IFRS 2 Share-Based Payment and unrealised foreign exchange gains or losses on derivatives which do not qualify for hedge accounting. The activities, products and services of the operating segments are detailed in the Strategic Report on page 18. The Property Management segment holds properties and property leases which are sub-let to other segments and external parties.
External revenue Internal revenue Total revenue2014
£m2013
£m2014
£m2013
£m2014
£m2013
£m
NEXT Retail 2,227.6 2,190.9 9.8 6.0 2,237.4 2,196.9NEXT Directory 1,341.0 1,192.6 5.3 3.7 1,346.3 1,196.3NEXT International Retail 85.6 77.7 – – 85.6 77.7NEXT Sourcing 11.0 8.8 560.2 498.3 571.2 507.1
3,665.2 3,470.0 575.3 508.0 4,240.5 3,978.0Lipsy 62.9 58.1 1.9 0.5 64.8 58.6Property Management 4.8 20.3 192.9 192.0 197.7 212.3Total segment revenues 3,732.9 3,548.4 770.1 700.5 4,503.0 4,248.9Third party distribution 7.1 14.4 – – 7.1 14.4Eliminations – – (770.1) (700.5) (770.1) (700.5)Total 3,740.0 3,562.8 – – 3,740.0 3,562.8
2014 2013
Segment profit
Underlying & Total
£mUnderlying
£m
Exceptionalitems
(note 6)£m
Total£m
NEXT Retail 347.7 331.1 – 331.1NEXT Directory 358.5 302.1 – 302.1NEXT International Retail 12.1 8.4 – 8.4NEXT Sourcing 34.1 30.8 – 30.8
752.4 672.4 – 672.4Lipsy 2.7 2.0 – 2.0Property Management 1.8 3.5 9.1 12.6Total segment profit 756.9 677.9 9.1 687.0Central costs and other (14.9) (13.9) 35.8 21.9Share option charge (15.8) (17.8) – (17.8)Unrealised foreign exchange (5.9) 3.4 – 3.4Trading profit 720.3 649.6 44.9 694.5Share of results of associates 2.5 0.6 – 0.6Finance income 0.7 0.4 – 0.4Finance costs (28.3) (29.0) – (29.0)Profit before tax 695.2 621.6 44.9 666.5
Transactions between operating segments are made on an arm’s length basis in a manner similar to those with third parties. Segment revenue and segment profit include transactions between business segments which are eliminated on consolidation. The majority of NEXT Sourcing’s revenues and profits are derived from sales to NEXT Retail and NEXT Directory.
ANNUAL REPORT AND ACCOUNTS JANUARY 2014
81

23158.04 - Proof 2 - 14/03/2014
1. Segmental analysis (continued)
Property, plant & equipment Capital expenditure Depreciation
2014£m
2013£m
2014£m
2013£m
2014£m
2013£m
NEXT Retail 347.8 374.1 88.0 73.2 101.8 101.4NEXT Directory 80.7 84.5 8.4 6.7 11.8 10.9NEXT International Retail 0.9 1.1 0.4 – 0.4 0.5NEXT Sourcing 2.4 2.6 0.8 0.6 0.9 1.0Lipsy 4.7 6.8 0.9 0.8 1.9 2.3Property Management 72.5 68.0 6.6 0.2 0.1 0.2Other 0.2 0.2 0.2 0.1 0.1 0.1Total 509.2 537.3 105.3 81.6 117.0 116.4
Analyses of the Group’s external revenues (by customer location) and non-current assets (excluding investments, the defined benefit pension surplus, other financial assets and deferred tax assets) by geographical location are detailed below:
External revenue by geographical location2014
£m2013
£m
United Kingdom 3,447.0 3,319.3Rest of Europe 197.7 171.1Middle East 46.5 34.2Asia 19.6 13.9Rest of World 29.2 24.3
3,740.0 3,562.8
Non-current assets by geographical location2014
£m2013
£m
United Kingdom 514.1 537.9Rest of Europe 7.5 12.0Middle East 4.3 4.5Asia 27.6 27.6Rest of World 0.1 0.1
553.6 582.1
There were no discontinued operations in the current or previous year.
2. Revenue by type
2014£m
2013£m
Sale of goods 3,564.5 3,376.6Rendering of services 158.8 154.8Rental income 4.8 5.3Royalties 11.9 11.1Sale of property development stock (exceptional item, see Note 6) – 15.0Revenue 3,740.0 3,562.8
Rendering of services includes £151.8m (2013: £140.4m) of service charge on Directory customer receivables.
NOTES TO THE CONSOLIDATED FINANCIAL STATEMENTS
ANNUAL REPORT AND ACCOUNTS JANUARY 2014
82

23158.04 - Proof 2 - 14/03/2014
Ad
diti
on
al i
nfo
rma
tion
Pare
nt C
om
pa
ny a
cc
ou
nts
Go
vern
an
ce
Co
nso
lida
ted
ac
co
un
tsBu
sin
ess
rep
ort
s3. Operating profit Group operating profit is stated after charging/(crediting):
2014£m
2013£m
Depreciation on tangible assets: Owned 116.9 116.3 Leased 0.1 0.1
Loss on disposal of property, plant & equipment 13.0 2.5
Amortisation of intangible assets 0.4 0.8
Impairment charges: Tangible assets 2.9 1.8
Operating lease rentals: Minimum lease payments (net of amortisation of incentives) 198.5 195.5 Contingent rentals payable 7.1 6.8
Net foreign exchange losses/(gains) 6.8 (3.4)
Cost of inventories recognised as an expense 1,363.5 1,352.2Write down of inventories to net realisable value 80.7 75.1
1,444.2 1,427.3
Trade receivables: Impairment charge 29.0 28.3 Amounts recovered (4.6) (4.7)
2014£m
2013£m
Auditor’s remunerationAudit of the financial statements 193 181Audit of subsidiaries 279 267Total audit fees 472 448Other services: Tax compliance 6 7 Tax advisory services – 2 Corporate finance (2026 bond issue) 82 – Other assurance services 31 18
591 475
Gains and losses on cash flow hedges removed from equity and included in the income statement for the period comprise gains of £14.9m (2013: gains of £4.5m) included in cost of sales.
Cost of inventories recognised as an expense consists of those costs which are directly attributable to goods sold in the year, including packaging and inbound freight costs.
Other (losses)/gains reported in the income statement represent foreign exchange losses of £5.9m (2013: gains of £3.4m) in respect of derivative contracts which do not qualify for hedge accounting under IAS 39 and the prior year exceptional pension items explained in Note 6.
ANNUAL REPORT AND ACCOUNTS JANUARY 2014
83

23158.04 - Proof 2 - 14/03/2014
4. Staff costs and key management personnelTotal staff costs were as follows:
2014£m
2013£m
Wages and salaries 531.9 510.1Social security costs 36.0 32.7Other pension costs (including £35.8m net exceptional gains in the prior year) 16.0 (25.2)
583.9 517.6Share-based payments expense – equity settled 15.8 17.8Share-based payments expense – cash settled 26.8 23.4
626.5 558.8
Equity settled share-based payments comprise management options, sharesave options and potential awards under the Share Matching Plan, details of which are given in Note 25. Cash settled share-based payments relate to the Long Term Incentive Plan (“LTIP”), details of which are given in the Remuneration Report.
Total staff costs by business sector were made up as follows:
2014£m
2013£m
NEXT Retail and Directory 580.7 540.0NEXT International Retail 2.8 3.2NEXT Sourcing 26.4 23.6Other activities 16.6 27.8Exceptional pension credit (see Note 6) – (35.8)Total 626.5 558.8
Average employees Full-time equivalents2014
Number2013
Number2014
Number2013
Number
NEXT Retail and Directory 48,417 50,707 24,618 24,710NEXT International Retail 204 277 164 217NEXT Sourcing 3,573 3,148 3,573 3,148Other activities 339 375 213 226Total 52,533 54,507 28,568 28,301
Aggregate compensation for key management personnel (including employer’s National Insurance contributions), being the directors of NEXT plc, was as follows:
2014£m
2013£m
Short term employee benefits 6.6 6.0Post-employment benefits 0.3 0.3Share-based payments 14.2 13.2
21.1 19.5
Directors’ remuneration is detailed in the Remuneration Report.
NOTES TO THE CONSOLIDATED FINANCIAL STATEMENTS
ANNUAL REPORT AND ACCOUNTS JANUARY 2014
84

23158.04 - Proof 2 - 14/03/2014
Ad
diti
on
al i
nfo
rma
tion
Pare
nt C
om
pa
ny a
cc
ou
nts
Go
vern
an
ce
Co
nso
lida
ted
ac
co
un
tsBu
sin
ess
rep
ort
s5. Finance income and costs2014
£m2013
£m
Interest on bank deposits 0.7 0.3Other interest receivable – 0.1Total finance income 0.7 0.4
Interest on bonds and other borrowings 25.3 24.4Other fair value movements 3.0 4.6Total finance costs 28.3 29.0
Directory service charge is presented as a component of revenue.
6. Exceptional itemsFootnote
2014£m
2013£m
Pension credit (a) – 42.1Pension charge (b) – (6.3)Sale of property development stock (c) – 9.1
– 44.9Associated tax charge – (9.4)
– 35.5
There were no exceptional items during the current year. Last year’s exceptional items were as follows:
a) The Group reviewed the operation of the defined benefit section of its pension plan. From November 2012, the future accrual of benefits for remaining employee members is based on pensionable earnings at that time, rather than final earnings. This change gave rise to a one-off accounting gain of £42.1m last year.
b) A tranche of pensions in payment were subject to a buy-in arrangement in 2012. The contract also allows for the buy-in to be converted to a buy-out, and steps are being taken to proceed on this basis. Accordingly, the transaction was accounted for as a settlement, with the £6.3m accounting charge presented in the income statement as an exceptional item.
c) The Group sold its last remaining stock from its property development activities for £15.0m last year which had a book value of £5.9m. The £9.1m gain was presented as an exceptional item because of its size and non-recurring nature.
ANNUAL REPORT AND ACCOUNTS JANUARY 2014
85

23158.04 - Proof 2 - 14/03/2014
7. Taxation2014
£m2013
£m
Current tax:UK corporation tax on profits of the year 166.5 159.3Adjustments in respect of previous years (20.6) (8.1)
145.9 151.2Overseas tax:On profits of the year 4.1 2.8Adjustments in respect of previous years – (0.1)Total current tax 150.0 153.9
Deferred tax:Origination and reversal of temporary differences (9.3) (0.1)Adjustments in respect of previous years 1.3 4.1Tax expense reported in the consolidated income statement 142.0 157.9
Last year’s total tax charge includes £9.4m relating to exceptional items (see Note 6). Adjustments in respect of previous years relate to release of provisions for items subsequently agreed with HM Revenue & Customs and overseas tax authorities.
The tax rate for the current year varied from the standard rate of corporation tax in the UK due to the following factors:
2014%
2013%
UK corporation tax rate 23.2 24.3Non-deductible expenses 0.5 1.0Deferred tax not previously recognised: property development losses – (0.2)Overseas tax differentials (0.5) (0.7)Tax over-provided in previous years (2.8) (0.6)Deferred tax rate change – (0.1)Effective total tax rate on profit before taxation 20.4 23.7
The 2013 effective tax rate stated above is based on total profit including exceptional items.
NOTES TO THE CONSOLIDATED FINANCIAL STATEMENTS
ANNUAL REPORT AND ACCOUNTS JANUARY 2014
86

23158.04 - Proof 2 - 14/03/2014
Ad
diti
on
al i
nfo
rma
tion
Pare
nt C
om
pa
ny a
cc
ou
nts
Go
vern
an
ce
Co
nso
lida
ted
ac
co
un
tsBu
sin
ess
rep
ort
s7. Taxation (continued)In addition to the amount charged to the income statement, tax movements recognised in other comprehensive income and directly in equity were as follows:
2014£m
2013£m
Current tax:Pension benefit obligation (3.4) (2.7)Exchange differences on translation of foreign operations 0.6 –Deferred tax:Pension benefit obligation (1.6) (3.2)Fair value movements on derivative instruments (5.9) (1.0)Tax credit in other comprehensive income (10.3) (6.9)
2014£m
2013£m
Current tax:Share-based payments (13.4) (8.1)Deferred tax:Share-based payments (15.6) (11.2)Tax credit in the statement of changes in equity (29.0) (19.3)
Deferred tax asset/(liability)2014
£m2013
£m
Accelerated capital allowances (7.5) (17.5)Revaluation of derivatives to fair value 4.9 (2.3)Pension benefit obligations (14.1) (15.1)Share-based payments 41.1 28.0Other temporary differences 2.6 2.9
27.0 (4.0)
The deferred tax movement in the year is as follows:2014
£m2013
£mAt January 2013 (4.0) (15.4)Recognised in the income statement: Accelerated capital allowances 10.0 5.4 Revaluation of derivatives to fair value 1.3 (0.9) Pension benefit obligations (0.6) (9.5) Share-based payments (2.5) 1.0 Other temporary differences (0.3) –Recognised in other comprehensive income 7.5 4.2Recognised in the statement of changes in equity 15.6 11.2At January 2014 27.0 (4.0)
No recognition has been made of the following deferred tax assets:
Gross value 2014
£m
Unrecognised deferred tax
2014 £m
Gross value 2013
£m
Unrecognised deferred tax
2013 £m
Capital losses 74.3 14.9 83.0 19.1
The benefit of unrecognised capital losses will only accrue if taxable profits are realised on future disposals of the Group’s capital assets.
ANNUAL REPORT AND ACCOUNTS JANUARY 2014
87

23158.04 - Proof 2 - 14/03/2014
8. Dividends2014
£m2013
£m
Amounts recognised as distributions to equity holders in the year:Final dividend for the year to January 2013 of 74p (2012: 62.5p) per share 111.4 99.7Interim dividend for the year to January 2014 of 36p (2013: 31p) per share 53.4 48.0Dividends paid in the year 164.8 147.7
Special interim dividend of 50p per share paid 3 February 2014 74.4 –
Proposed final dividend for the year to January 2014 of 93p (2013: 74p) per share 139.2 111.4
The special interim dividend was announced on 3 January 2014 and shares in NEXT plc traded ex-dividend from 15 January. The liability of £74.4m is recorded in the January 2014 balance sheet on the basis that it could not realistically have been cancelled after the ex-dividend date. The special dividend was paid on 3 February 2014.
The proposed final dividend is subject to approval by shareholders at the Annual General Meeting and has not been included as a liability in these financial statements. The Trustee of the ESOT has waived dividends paid in the year on the shares held by the ESOT.
9. Earnings per share2014 2013
Basic earnings per shareTotal 366.1p 320.1pUnderlying 366.1p 297.7p
Basic earnings per share is based on the profit for the year attributable to the equity holders of the parent company and the weighted average number of shares ranking for dividend less the weighted average number of shares held by the ESOT during the period.
Underlying earnings per share is based on profit before the exceptional items described in Note 6.
2014 2013
Diluted earnings per shareTotal 355.6p 311.7pUnderlying 355.6p 289.9p
Diluted earnings per share is based on the weighted average number of shares used for the calculation of basic earnings per share as increased by the dilutive effect of potential ordinary shares. Dilutive shares arise from employee share option schemes where the exercise price is less than the average market price of the Company’s ordinary shares during the period. Their dilutive effect is calculated on the basis of the equivalent number of nil-cost options. Where the option price is above the average market price, the option is not dilutive and is excluded from the diluted EPS calculation. There were no such share options in the current year (2013: nil).
NOTES TO THE CONSOLIDATED FINANCIAL STATEMENTS
ANNUAL REPORT AND ACCOUNTS JANUARY 2014
88
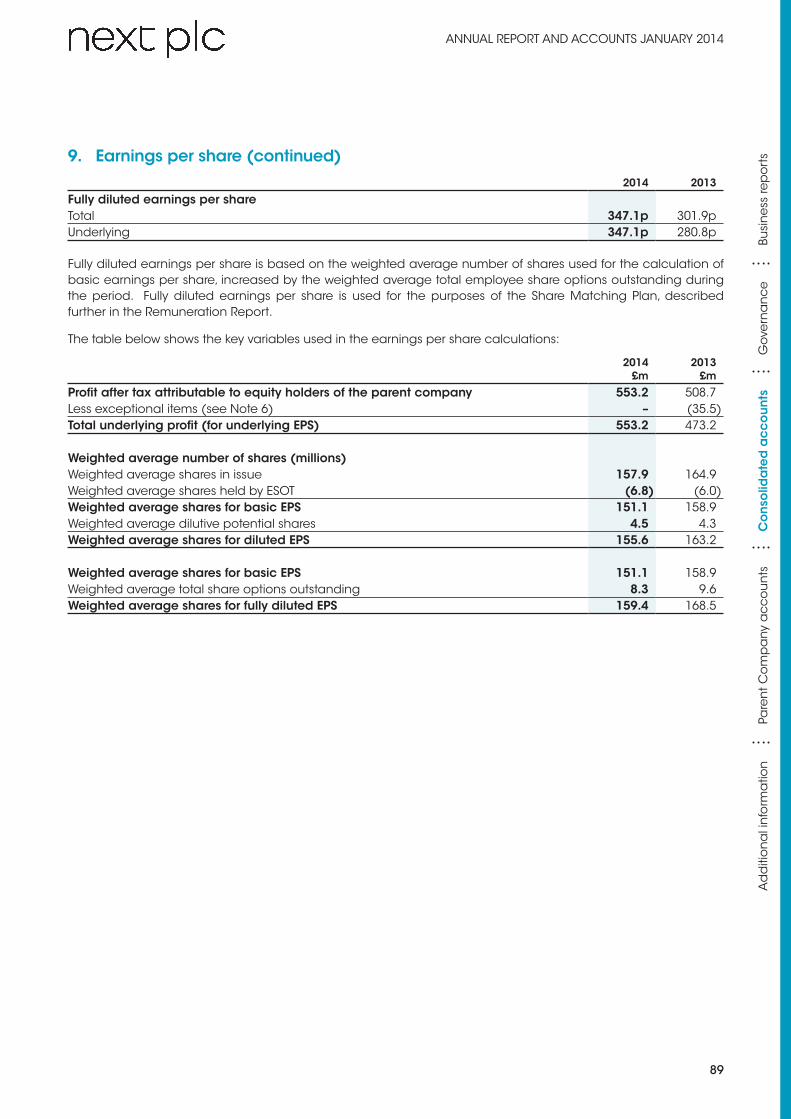
23158.04 - Proof 2 - 14/03/2014
Ad
diti
on
al i
nfo
rma
tion
Pare
nt C
om
pa
ny a
cc
ou
nts
Go
vern
an
ce
Co
nso
lida
ted
ac
co
un
tsBu
sin
ess
rep
ort
s9. Earnings per share (continued)2014 2013
Fully diluted earnings per shareTotal 347.1p 301.9pUnderlying 347.1p 280.8p
Fully diluted earnings per share is based on the weighted average number of shares used for the calculation of basic earnings per share, increased by the weighted average total employee share options outstanding during the period. Fully diluted earnings per share is used for the purposes of the Share Matching Plan, described further in the Remuneration Report.
The table below shows the key variables used in the earnings per share calculations:
2014£m
2013£m
Profit after tax attributable to equity holders of the parent company 553.2 508.7Less exceptional items (see Note 6) – (35.5)Total underlying profit (for underlying EPS) 553.2 473.2
Weighted average number of shares (millions)Weighted average shares in issue 157.9 164.9Weighted average shares held by ESOT (6.8) (6.0)Weighted average shares for basic EPS 151.1 158.9Weighted average dilutive potential shares 4.5 4.3Weighted average shares for diluted EPS 155.6 163.2
Weighted average shares for basic EPS 151.1 158.9Weighted average total share options outstanding 8.3 9.6Weighted average shares for fully diluted EPS 159.4 168.5
ANNUAL REPORT AND ACCOUNTS JANUARY 2014
89

23158.04 - Proof 2 - 14/03/2014
10. Property, plant & equipmentFreehold property
£m
Leasehold property
£m
Plant and fittings
£mTotal
£m
CostAt January 2012 73.5 8.3 1,402.0 1,483.8Exchange movement – – (1.3) (1.3)Additions 0.2 – 81.4 81.6Disposals (4.2) – (23.8) (28.0)At January 2013 69.5 8.3 1,458.3 1,536.1Exchange movement – – (0.9) (0.9)Additions 5.4 1.1 98.8 105.3Disposals – – (62.3) (62.3)At January 2014 74.9 9.4 1,493.9 1,578.2
DepreciationAt January 2012 8.2 1.4 892.3 901.9Exchange movement – – (1.1) (1.1)Provided during the year – – 116.4 116.4Impairment charge – – 1.8 1.8Disposals (0.2) – (20.0) (20.2)At January 2013 8.0 1.4 989.4 998.8Exchange movement – – (0.7) (0.7)Provided during the year – – 117.0 117.0Impairment charge 1.9 – 1.0 2.9Disposals – – (49.0) (49.0)At January 2014 9.9 1.4 1,057.7 1,069.0
Carrying amountAt January 2014 65.0 8.0 436.2 509.2At January 2013 61.5 6.9 468.9 537.3At January 2012 65.3 6.9 509.7 581.9
The carrying amount of plant and fittings above includes an amount of £0.3m (2013: £0.3m) in respect of assets held under finance lease contracts.
At 25 January 2014 the Group had entered into contractual commitments for the acquisition of property, plant and equipment amounting to £18.2m (2013: £15.4m).
NOTES TO THE CONSOLIDATED FINANCIAL STATEMENTS
ANNUAL REPORT AND ACCOUNTS JANUARY 2014
90

23158.04 - Proof 2 - 14/03/2014
Ad
diti
on
al i
nfo
rma
tion
Pare
nt C
om
pa
ny a
cc
ou
nts
Go
vern
an
ce
Co
nso
lida
ted
ac
co
un
tsBu
sin
ess
rep
ort
s11. Intangible assetsBrand
names & trademarks
£m
Customer relationships
£mGoodwill
£mTotal
£m
CostAt January 2012, January 2013 and January 2014 4.0 2.0 44.1 50.1
Amortisation and impairmentAt January 2012 1.3 1.6 1.6 4.5Provided during the year 0.4 0.4 – 0.8At January 2013 1.7 2.0 1.6 5.3Provided during the year 0.4 – – 0.4At January 2014 2.1 2.0 1.6 5.7
Carrying amountAt January 2014 1.9 – 42.5 44.4At January 2013 2.3 – 42.5 44.8At January 2012 2.7 0.4 42.5 45.6
Customer relationships relates to contractual and other arrangements with corporate customers of Lipsy that existed at the date of acquisition.
The carrying amount of goodwill is allocated to the following cash generating units:
2014£m
2013£m
NEXT Sourcing 30.5 30.5Lipsy 12.0 12.0
42.5 42.5
Goodwill is tested for impairment at the balance sheet date on the basis of value in use. As this exceeded carrying value for each of the cash generating units concerned, no impairment loss was recognised (2013: £nil).
NEXT SourcingThe key assumptions in the calculation are the future sourcing requirements of the Group and the ability of NEXT Sourcing to meet these requirements based on past experience. In assessing value in use, the most recent financial results and internal budgets for the next year were used and extrapolated for four further years with no subsequent growth assumed, and discounted at 10% (2013: 10%).
LipsyIn assessing the recoverable amount of goodwill and intangibles, the most recent financial results and internal budgets for next year were used and extrapolated for nine further years using a growth rate of 2% (2013: 2%) and discounted at 12% (2013: 15%). The reduction in the discount rate is to reflect the increasing maturity of Lipsy’s business, and has no bearing on the outcome. The key assumption is that Lipsy will continue to trade profitably through its different sales channels.
For both NEXT Sourcing and Lipsy, the calculated value in use significantly exceeded the carrying value of the goodwill and other intangible assets and no further sensitivity calculations were necessary to conclude that there was no impairment.
ANNUAL REPORT AND ACCOUNTS JANUARY 2014
91

23158.04 - Proof 2 - 14/03/2014
12. Interests in associates and other investments2014
£m2013
£m
Interests in associates 6.9 6.2Other investments 1.0 1.0
7.9 7.2
During the year the Group sold goods and services in the normal course of business to its associated undertakings as follows:
Sales Amounts receivable2014
£m 2013
£m2014
£m2013
£m
Choice Discount Stores Limited 5.6 5.6 0.5 0.4Cotton Traders Limited 5.9 6.9 0.5 0.4
11.5 12.5 1.0 0.8
13. Inventories2014
£m2013
£m
Merchandise stocks 385.6 331.8
14. Customer and other receivables2014
£m2013
£m
Directory customer receivables 806.4 726.6Less: allowance for doubtful debts (124.2) (125.4)
682.2 601.2Other trade receivables 21.6 21.2Less: allowance for doubtful debts (0.2) (0.2)
703.6 622.2Amounts due from associated undertakings 1.0 0.8Other debtors 9.4 8.3Prepayments 94.0 86.8
808.0 718.1
No interest is charged on Directory customer receivables if the statement balance is paid in full; otherwise balances bear interest at a variable annual percentage rate of 25.99% (2013: 25.99%).
Expected irrecoverable amounts on overdue balances are provided for based on past default experience. Receivables which are impaired, other than by age or default, are separately identified and provided for as necessary.
NOTES TO THE CONSOLIDATED FINANCIAL STATEMENTS
ANNUAL REPORT AND ACCOUNTS JANUARY 2014
92

23158.04 - Proof 2 - 14/03/2014
Ad
diti
on
al i
nfo
rma
tion
Pare
nt C
om
pa
ny a
cc
ou
nts
Go
vern
an
ce
Co
nso
lida
ted
ac
co
un
tsBu
sin
ess
rep
ort
s14. Customer and other receivables (continued)The credit quality of customer receivables that are neither past due nor impaired can be assessed by reference to the historical default rate for the preceding 365 days of approximately 1% (2013: 1%), although default rates over shorter periods may show significant variations.
Other debtors and prepayments do not include impaired assets. The maximum exposure to credit risk at the reporting date is the carrying value of each class of asset. The Group does not hold any collateral over these balances.
Ageing of customer and other trade receivables:
2014£m
2013£m
Not past due 687.2 609.70 – 30 days past due 46.4 40.030 – 60 days past due 10.4 9.260 – 90 days past due 3.8 3.590 – 120 days past due 2.8 2.2Over 120 days past due 55.6 63.9Otherwise impaired 21.8 19.3Total customer and other trade receivables 828.0 747.8
Movement in the allowance for doubtful debts:
2014£m
2013£m
Opening position 125.6 113.7Charged to the income statement 29.0 28.3Written off as uncollectible (25.6) (11.7)Recovered during the year (4.6) (4.7)Closing position 124.4 125.6
15. Other financial assets
2014 2013
Current £m
Non-current
£mCurrent
£m
Non-current
£m
Foreign exchange contracts 1.2 – 10.8 –Interest rate derivatives – 17.7 10.8 30.9
1.2 17.7 21.6 30.9
Foreign exchange contracts comprise forward contracts and options, the majority of which are used to hedge exchange risk arising from the Group’s overseas purchases (Note 27). These instruments are primarily for US Dollars and Euros. Interest rate derivatives relate to the corporate bonds (Note 20).
ANNUAL REPORT AND ACCOUNTS JANUARY 2014
93

23158.04 - Proof 2 - 14/03/2014
16. Cash and short term deposits2014
£m2013
£m
Cash at bank and in hand 70.0 42.1Short term deposits 203.3 94.2
273.3 136.3
Cash at bank earns interest at floating rates based on daily bank deposit rates. Short term deposits are made for varying periods of between one day and three months depending on the cash requirements of the Group and earn interest at market short term deposit rates.
17. Bank loans and overdrafts2014
£m2013
£m
Bank overdrafts and overnight borrowings 2.6 5.4Unsecured bank loans – –
2.6 5.4
Bank overdrafts are repayable on demand and bear interest at a margin over bank base rates. Overnight borrowings and unsecured bank loans bear interest at a margin above LIBOR. The Group has medium term bank facilities of £300m (2013: £300m) committed until May 2019. None of this facility was drawn down at January 2014 or January 2013.
18. Trade payables and other liabilities
2014 2013
Current £m
Non-current
£mCurrent
£m
Non-current
£m
Trade payables 194.8 – 189.2 –Other taxation and social security 75.1 – 64.0 –Deferred revenue from sale of gift cards 69.0 – 65.7 –Property lease incentives received 25.7 195.6 27.2 190.7Share-based payment liability 19.4 16.0 17.8 13.9Other creditors and accruals 209.9 1.9 173.2 5.1Finance leases 0.1 0.2 0.1 0.3
594.0 213.7 537.2 210.0
Trade payables do not bear interest and are generally settled on 30 day terms. Other creditors and accruals do not bear interest. Property lease incentives are classified as non-current to the extent that they will be credited to the income statement more than one year from the balance sheet date.
NOTES TO THE CONSOLIDATED FINANCIAL STATEMENTS
ANNUAL REPORT AND ACCOUNTS JANUARY 2014
94

23158.04 - Proof 2 - 14/03/2014
Ad
diti
on
al i
nfo
rma
tion
Pare
nt C
om
pa
ny a
cc
ou
nts
Go
vern
an
ce
Co
nso
lida
ted
ac
co
un
tsBu
sin
ess
rep
ort
s19. Other financial liabilities
2014 2013
Current £m
Non-current
£mCurrent
£m
Non-current
£m
Foreign exchange contracts 25.4 – 0.8 –Interest rate derivatives – 0.9 3.4 –Own equity share purchase contracts 58.4 – 83.3 –
83.8 0.9 87.5 –
Foreign exchange contracts comprise forward contracts and options, the majority of which are used to hedge exchange risk arising from the Group’s overseas purchases (Note 27). These instruments are primarily for US Dollars and Euros. Interest rate derivatives relate to the corporate bonds (Note 20).
Own equity share purchase contracts relate to liabilities of £58.4m (2013: £42.3m) arising under an irrevocable closed season buyback agreement for the purchase of the Company’s own shares (Note 23), and net liabilities of £nil (2013: £41.0m) arising under contingent purchase contracts for the Company’s own shares entered into by the ESOT (Note 26).
20. Corporate bonds
Balance sheet value Nominal value2014
£m2013
£m2014
£m2013
£m
Corporate bond 5.25% repaid 2013 – 87.6 – 85.5Corporate bond 5.875% repayable 2016 216.5 218.5 212.6 212.6Corporate bond 5.375% repayable 2021 336.9 348.3 325.0 325.0Corporate bond 4.375% repayable 2026 247.4 – 250.0 –
800.8 654.4 787.6 623.1
The 5.25% 2013 corporate bond was repaid in September 2013 and was therefore classified as a current liability at January 2013. The Group uses interest rate derivatives to manage the interest rate risk associated with its bonds, the profile of which is shown below:
2014 Nominal
value £m
2014 Effective interest
rate
2013 Nominal
value £m
2013 Effective interest
rate
2013 bondsFloating – N/A 85.5 6m LIBOR + 0.9%2016 bondsFixed 162.6 5.875% 162.6 5.875%Floating 50.0 6m LIBOR + 1.7% 50.0 6m LIBOR +1.7%
212.6 212.62021 bondsFixed 150.0 5.375% 150.0 5.375%Floating* 175.0 6m LIBOR + 1.9% 175.0 6m LIBOR + 1.9%
325.0 325.02026 bondsFloating 250.0 6m LIBOR +1.4% – N/ATotal 787.6 623.1
* £50m of which reverts to a fixed rate of 5.2% from October 2016.
The fair values of the corporate bonds are shown in Note 29.
ANNUAL REPORT AND ACCOUNTS JANUARY 2014
95

23158.04 - Proof 2 - 14/03/2014
21. Pension benefitsThe Group’s UK pension arrangements include defined benefit and defined contribution sections. The Group also provides unfunded retirement benefits to some plan members whose benefits would otherwise be restricted by the lifetime allowance. Pension assets are held in separate trustee administered funds which have equal pension rights with respect to members of either sex and comply with the Employment Equality Regulations (2006). Further information on the Group’s pension arrangements is given in the Remuneration Report on pages 58 and 59.
The defined benefit section was closed to new members in 2000 and over recent years the Group has taken steps to manage the on-going risks associated with it:
❚ In 2010, most pensions in payment were subject to a buy-in contract with an insurance company. This was followed up in 2012 by a further buy-in contract for pensions that had come into payment since 2010;
❚ From November 2012, the future accrual of benefits for remaining employee members is based on pensionable earnings frozen at that time, rather than final earnings. Those employees receive either additional contributions to the defined contribution section, or a salary supplement. This change resulted in an accounting gain last year of £42.1m which was included in the income statement as an exceptional item;
❚ To enable the conversion of the buy-in to buy-out, in 2013 a new Plan was established for existing employee members whose pensions are not insured through the buy-in contracts, and the associated assets and liabilities were transferred across. It is intended that the pensions and matching insurance contracts held by the original Plan will be converted to buy-out, and the original Plan can then be dissolved.
The following table summarises the principal risks associated with the Group’s defined benefit arrangements:
Investment Risk The present value of defined benefit liabilities is calculated using a discount rate set by reference to high quality corporate bond yields. To the extent that the return on plan assets is lower than the discount rate, the pension surplus may reduce and a deficit may emerge.
Interest Rate Risk A fall in bond yields would increase the value of the liabilities. This would be only partially offset by an increase in the value of bond investments held.
Inflation Risk An increase in inflation would increase the value of pension liabilities.Longevity Risk The present value of the defined benefit liabilities is calculated having regards to a best
estimate of the mortality of plan members. If members are expected to live longer, this will increase the liabilities.
The buy-in contracts represent approximately 24% of the total pension liabilities and provide a partial hedge to the risks described above.
The components of the net benefit expense recognised in the consolidated income statement are as follows:
2014 2013New 2013
Plan£m
OriginalPlan
£mUnfunded
£mTotal
£mFunded
£mUnfunded
£mTotal
£m
Current service cost 2.0 4.7 0.3 7.0 7.9 0.5 8.4Interest on benefit obligation 5.3 19.2 0.4 24.9 24.1 0.4 24.5Interest on plan assets (6.6) (21.8) – (28.4) (28.4) – (28.4)Administration costs 0.2 1.2 – 1.4 – – –Curtailment gain on pensionable pay freeze* – – – – (39.3) (2.8) (42.1)Settlement loss on buy-in/buy-out* – – – – 6.3 – 6.3Net benefit expense/(credit) 0.9 3.3 0.7 4.9 (29.4) (1.9) (31.3)
* Included as exceptional items in the prior year income statement (see Note 6).
Actual return on plan assets 23.7 26.1 – 49.8 68.3 – 68.3
The expected average duration of the original Plan is 13 years and the new 2013 Plan is 26 years.
NOTES TO THE CONSOLIDATED FINANCIAL STATEMENTS
ANNUAL REPORT AND ACCOUNTS JANUARY 2014
96

23158.04 - Proof 2 - 14/03/2014
Ad
diti
on
al i
nfo
rma
tion
Pare
nt C
om
pa
ny a
cc
ou
nts
Go
vern
an
ce
Co
nso
lida
ted
ac
co
un
tsBu
sin
ess
rep
ort
s21. Pension benefits (continued)Changes in the present value of defined benefit pension obligations are analysed as follows:
2014 2013New 2013
Plan£m
Original Plan
£mUnfunded
£mTotal
£mFunded
£mUnfunded
£mTotal
£m
Opening obligation – 534.7 8.5 543.2 495.6 9.4 505.0Current service cost 2.0 4.7 0.3 7.0 7.9 0.5 8.4Interest cost 5.3 19.2 0.4 24.9 24.1 0.4 24.5Curtailment gains – – – – (39.3) (2.8) (42.1)Employee contributions – 0.1 – 0.1 0.2 – 0.2Benefits paid (0.8) (11.1) – (11.9) (12.4) – (12.4)Transferred to new 2013 Plan 391.3 (391.3) – – – – –Actuarial losses — financial assumptions 25.9 0.4 0.7 27.0 56.3 1.0 57.3— experience 4.3 (1.8) – 2.5 (4.2) – (4.2)— demographic assumptions 3.5 1.0 – 4.5 6.5 – 6.5Closing pension benefit obligation 431.5 155.9 9.9 597.3 534.7 8.5 543.2
Changes in the fair value of defined benefit pension assets were as follows:
2014 2013New 2013
Plan£m
Original Plan
£mUnfunded
£mTotal
£mFunded
£mUnfunded
£mTotal
£m
Opening assets – 608.8 – 608.8 540.1 – 540.1Employer contributions 7.4 14.8 – 22.2 18.9 – 18.9Employee contributions – 0.1 – 0.1 0.2 – 0.2Benefits paid (0.8) (11.1) – (11.9) (12.4) – (12.4)Transferred to new 2013 Plan 482.5 (482.5) – – – – –Settlements (buy-in contract) – – – – (6.3) – (6.3)Interest income on assets 6.6 21.8 – 28.4 28.4 – 28.4Return on plan assets greater than discount rate 17.1 4.3 – 21.4 39.9 – 39.9Administrative costs (0.2) (1.2) – (1.4) – – –Closing pension benefit assets 512.6 155.0 – 667.6 608.8 – 608.8
The fair value of plan assets was as follows:
2014 2013New 2013
Plan£m
OriginalPlan
£mTotal £m %
Total £m %
Equities 340.3 – 340.3 51.0 296.8 48.7Bonds 106.9 – 106.9 16.0 100.7 16.5Gilts 35.0 – 35.0 5.2 35.6 5.8Property 23.4 – 23.4 3.5 21.1 3.5Insurance contracts – 142.9 142.9 21.4 146.9 24.1Other (cash deposits) 7.0 12.1 19.1 2.9 7.7 1.4
512.6 155.0 667.6 100.0 608.8 100.0
The fair values of the above equity and debt instruments are determined based on quoted prices in active markets.
ANNUAL REPORT AND ACCOUNTS JANUARY 2014
97

23158.04 - Proof 2 - 14/03/2014
21. Pension benefits (continued)The net defined benefit pension asset/(liability) is analysed as follows:
2014 2013New 2013
Plan£m
OriginalPlan
£mUnfunded
£mTotal
£mFunded
£mUnfunded
£mTotal
£m
Total assets 512.6 155.0 – 667.6 608.8 – 608.8Benefit obligation (431.5) (155.9) (9.9) (597.3) (534.7) (8.5) (543.2)Net pension asset/(liability) 81.1 (0.9) (9.9) 70.3 74.1 (8.5) 65.6
The most recent full actuarial valuation was undertaken as at March 2013. The IAS 19 valuation of the defined benefit obligation was undertaken by an independent qualified actuary as at January 2014 using the projected unit credit method. The principal actuarial assumptions used in the valuation were as follows:
2014 2013Original
PlanNew 2013
Plan PensionersNon-
pensioners
Discount rate 4.15% 4.40% 4.25% 4.75%Inflation – RPI 3.40% 3.35% 3.30% 3.45%Inflation – CPI 2.40% 2.35% 2.30% 2.45%
2014 2013
Pensioneraged 65
Non-pensioner
aged 45Pensioner
aged 65
Non-pensioner
aged 45Life expectancy at age 65 (years) Male 22.6 24.8 22.6 24.8 Female 25.0 27.3 25.0 27.3
The key sensitivities in the calculation are the discount rate and the inflation assumption. A decrease of 0.25% in the discount rates used would increase the gross liabilities by approximately £35m, which would be partly mitigated by an increase of approximately £4.8m on the insurance assets. An increase of 0.25% in the inflation assumption would increase the gross liabilities by £24m, offset by an increase of approximately £2.4m on the insurance assets.
Members of the defined benefit section contribute 3% or 5% of pensionable earnings whilst the employer contribution rate is 17.5%. Members of the defined contribution section contribute 3% or 5% of pensionable earnings which is matched by the employing company. Contribution rates are expected to remain the same for the year ahead.
Total employer contributions of £32.5m (2013: £24.3m) were made during the year, including special contributions of £15.0m (2013: £11.0m), £9.1m (2013: £5.4m) in respect of the defined contribution section and £1.2m in respect of Automatic Enrolment contributions which commenced in February 2013.
An amendment to IAS 19 Employee Benefits was published in June 2011 and became effective during the current year. This affects the accounting for defined benefit pension schemes and has been applied this year.
The main change is that instead of using an assumed return on pension assets, the income statement charge is calculated by applying the discount rate to the net pension surplus or liability. If applied retrospectively, the effect of the amendment on last year would have been to increase pension costs in the income statement by £2.6m and to increase actuarial gains in the statement of comprehensive income by an equivalent amount. There is no impact on the balance sheet. As the impact is not material, prior year figures have not been restated and remain as reported last year.
NOTES TO THE CONSOLIDATED FINANCIAL STATEMENTS
ANNUAL REPORT AND ACCOUNTS JANUARY 2014
98

23158.04 - Proof 2 - 14/03/2014
Ad
diti
on
al i
nfo
rma
tion
Pare
nt C
om
pa
ny a
cc
ou
nts
Go
vern
an
ce
Co
nso
lida
ted
ac
co
un
tsBu
sin
ess
rep
ort
s22. ProvisionsVacant
property costs
£m
At January 2013 11.2 Provisions made in the year 3.6 Utilisation of provisions (4.3) Release of provisions (2.4) Unwind of discount 0.4At January 2014 8.5
Provision is made for the committed cost of future rentals or estimated exit costs of properties no longer occupied by the Group, the average remaining lease term is three years (2013: four years).
23. Share capital2014
Shares ‘000
2013 Shares
‘0002014
£m2013
£m
Allotted, called up and fully paidOrdinary shares of 10p eachAt January 2013 161,234 168,740 16.1 16.9Shares issued – 4 – –Purchased for cancellation (6,202) (7,510) (0.6) (0.8)At January 2014 155,032 161,234 15.5 16.1
The table below shows the movements in equity from share purchases and commitments during the year:
2014 2013Shares
‘000 £mShares
‘000 £m
Shares purchased for cancellation in the year 6,202 295.8 7,510 241.3Less: Commitment at start of year (1,050) (42.3) (2,425) (63.6)Add: Commitment at end of year 1,000 58.4 1,050 42.3Amount shown in statement of changes in equity 311.9 220.0
All £42.3m of the commitment outstanding at January 2013 expired unfulfilled.
At 19 March 2014, all £58.4m of the January 2014 commitment was also unfulfilled and had expired, and will therefore be credited back to equity.
24. Other reservesOther reserves in the consolidated balance sheet comprise the reserve created on reduction of share capital through the Scheme of Arrangement under Section 425 of the Companies Act 1985 (£1,460.7m) less share premium account (£3.8m) and capital redemption reserve (£8.7m) at the time of the capital reconstruction in 2002 plus the accumulated amount of goodwill arising on acquisition after taking into account subsequent disposals (£0.7m) less the unrealised component of revaluations of properties arising under previous accounting standards (£5.1m) as at the date of transition to IFRS.
ANNUAL REPORT AND ACCOUNTS JANUARY 2014
99

23158.04 - Proof 2 - 14/03/2014
25. Equity settled share-based paymentsThe Group operates a number of share-based payment schemes. Details of the Long Term Incentive Plan (LTIP) and the Share Matching Plan (SMP) are set out in the Remuneration Report. Other share-based payment schemes in operation are:
Management share optionsThe NEXT Management Share Option Plan provides for options over shares, exercisable between three and ten years following their grant, to be allocated to Group employees at the discretion of the Remuneration Committee. This plan is primarily aimed at middle management and senior store staff. No options were granted to any directors or changes made to existing entitlements in the year under review. No employee is entitled to be granted options under the scheme and be included in NEXT’s LTIP or the SMP in the same year.
The total number of options which can be granted is subject to shareholder approved limits and there are no cash settlement alternatives. Options are set at the prevailing market price at the time of grant. The maximum total market value of shares (i.e. the acquisition price of shares) over which options may be granted to any person during any financial year of the Company is three times salary, excluding bonuses and benefits in kind. This limit may be increased to five times salary in circumstances considered by the Committee to be exceptional, for example on the grant of options following recruitment. Grants are generally made annually.
Sharesave optionsThe Company’s Save As You Earn (Sharesave) scheme is open to all employees. Invitations to participate are generally issued annually and the scheme is subject to HMRC rules which limited the maximum monthly savings for the schemes detailed below to £250. Options are granted at the prevailing market rate less a discount of 20% and are exercisable three, five or seven years from the date of grant.
Management and Sharesave optionsThe following table summarises the movements in management and sharesave options during the year:
2014 2013
No. of options
Weighted average exercise
price No. of options
Weighted average exercise
price
Outstanding at beginning of year 7,951,797 £21.52 9,219,193 £17.67Granted 1,611,943 £41.52 2,069,776 £29.10Exercised (2,265,840) £18.84 (2,933,737) £14.75Forfeited (284,258) £27.49 (403,435) £21.57Outstanding at end of year 7,013,642 £26.75 7,951,797 £21.52
Exercisable at end of year 1,188,164 £17.60 1,259,065 £15.98
Options were exercised on a regular basis throughout the year and the weighted average share price during this period was £48.29 (2013: £31.54). Options outstanding at January 2014 are exercisable at prices ranging between £9.17 and £41.70 (2013: £8.89 and £29.67) and have a weighted average remaining contractual life of 6.1 years (2013: 6.3 years), as analysed below:
2014 2013
No. of options
Weighted average
remaining contractuallife (years)
No. of options
Weighted average
remaining contractual life (years)
Exercise price range £9.17– £17.82 838,769 3.3 1,711,497 3.4£20.70 1,722,901 7.2 1,834,505 8.2£20.84 – £21.89 1,065,861 3.4 2,421,024 5.8£27.56 – £29.67 1,845,187 6.7 1,984,771 7.6£41.12 – £41.70 1,540,924 7.5 – –
7,013,642 6.1 7,951,797 6.3
NOTES TO THE CONSOLIDATED FINANCIAL STATEMENTS
ANNUAL REPORT AND ACCOUNTS JANUARY 2014
100

23158.04 - Proof 2 - 14/03/2014
Ad
diti
on
al i
nfo
rma
tion
Pare
nt C
om
pa
ny a
cc
ou
nts
Go
vern
an
ce
Co
nso
lida
ted
ac
co
un
tsBu
sin
ess
rep
ort
s25. Equity settled share-based payments (continued)
Share Matching PlanThe following table summarises the movements in nil cost share matching plan options during the year:
2014 No. of
options
2013 No. of
options
Outstanding at beginning of year 675,046 679,232Granted 53,490 61,004Exercised (290,650) –Forfeited (82,982) (65,190)Outstanding at end of year 354,904 675,046
The weighted average remaining contractual life of these options is 7.7 years (2013: 8.0 years). These options were exercised at different times in the year and the weighted average share price during this period was £48.12. No SMP options were exercised in the previous year. 12,338 options were exercisable at the end of the period (2013: nil).
Fair value calculationThe fair value of management, sharesave and share matching plan options granted is calculated at the date of grant using a Black-Scholes option pricing model. Expected volatility was determined by calculating the historical volatility of the Company’s share price over a period equivalent to the expected life of the option. The expected life applied in the model is based on historical analyses of exercise patterns, taking into account any early exercises. The following table lists the inputs to the model used for options granted in the years ended 25 January 2014 and 26 January 2013 based on information at the date of grant:
Management share options (granted in April) 2014 2013
Weighted average share price at date of grant £41.70 £29.67Weighted average exercise price £41.70 £29.67Volatility 24.7% 37.9%Expected life 4 years 4 yearsRisk free rate 0.45% 0.70%Dividend yield 2.24% 2.71%Weighted average fair value per option £6.38 £7.12
Sharesave plans (granted in October) 2014 2013
Weighted average share price at date of grant £51.40 £34.44Weighted average exercise price £41.12 £27.56Volatility 21.8% 25.4%Expected life 3.4 years 3.3 yearsRisk free rate 0.87% 0.46%Dividend yield 2.04% 2.61%Weighted average fair value per option £11.82 £8.04
Share Matching Plan (granted in April) 2014 2013
Weighted average share price at date of grant £43.81 £30.32Weighted average exercise price Nil NilVolatility 22.4% 26.0%Expected life 3 years 3 yearsRisk free rate 0.34% 0.63%Dividend yield 2.40% 2.97%Weighted average fair value per option £40.77 £27.74
ANNUAL REPORT AND ACCOUNTS JANUARY 2014
101

23158.04 - Proof 2 - 14/03/2014
26. Shares held by ESOTThe NEXT 2003 Employee Share Ownership Trust (“ESOT”) has an independent professional trustee resident in Jersey and provides for the issue of shares to Group employees, including share issues under share options, at the discretion of the Trustee. All management and sharesave options which were exercised during the year were satisfied by shares issued from the ESOT.
At 25 January 2014 the ESOT held 6,190,747 (2013: 6,531,837) ordinary shares of 10p each in the Company, the market value of which amounted to £388.8m (2013: £265.1m). Details of outstanding share options are shown in Note 25.
The consideration paid for the ordinary shares of 10p each in the Company held by the ESOT at 25 January 2014 and 26 January 2013 has been shown as an ESOT reserve and presented within equity for the Company and the Group. All other assets, liabilities, income and costs of the ESOT have been incorporated into the accounts of the Company and the Group.
The table below shows the movements in equity from ESOT share purchases and commitment movements during the year:
2014 2013Shares
‘000 £mShares
‘000 £m
Shares purchased by ESOT in the year 2,136 96.0 3,859 122.5Less: Commitment at start of year (1,062) (41.0) (825) (20.0)Add: Commitment at end of year – – 1,062 41.0Amount shown in Statement of Changes in Equity 55.0 143.5
Shares issued on employee option exercises 2,477 38.4 2,965 44.3
Proceeds of £42.9m (2013: £43.4m) were received on the exercise of management and SAYE options. The amount shown in the Statement of Changes in Equity of £38.4m (2013: £44.3m) is after the issue of nil-cost LTIP, SMP and Deferred Bonus shares. The weighted average cost of shares issued by the ESOT was £74.0m (2013: £69.0m).
Of the £41.0m commitment at January 2013, £6.3m was fulfilled in the current year and £34.8m was not fulfilled and expired.
At 19 March 2014, employee share options over 106,334 shares had been exercised subsequent to the balance sheet date and had been satisfied by ordinary shares issued by the ESOT.
27. Financial instruments: risk management and hedging activitiesNEXT operates a centralised treasury function which is responsible for managing the liquidity, interest and foreign currency risks associated with the Group’s activities. As part of its strategy for the management of these risks, the Group uses derivative financial instruments. In accordance with the Group’s treasury policy, derivative instruments are not entered into for speculative purposes. Treasury policy is reviewed and approved by the Board and specifies the parameters within which treasury operations must be conducted, including authorised counterparties, instrument types and transaction limits, and principles governing the management of liquidity, interest and foreign currency risks.
The Group’s principal financial instruments, other than derivatives, are cash and short term deposits, bank overdrafts and loans, and corporate bonds. The main purpose of these financial instruments is to raise finance for the Group’s operations. In addition, the Group has various other financial assets and liabilities such as trade receivables and trade payables arising directly from its operations.
NOTES TO THE CONSOLIDATED FINANCIAL STATEMENTS
ANNUAL REPORT AND ACCOUNTS JANUARY 2014
102

23158.04 - Proof 2 - 14/03/2014
Ad
diti
on
al i
nfo
rma
tion
Pare
nt C
om
pa
ny a
cc
ou
nts
Go
vern
an
ce
Co
nso
lida
ted
ac
co
un
tsBu
sin
ess
rep
ort
s27. Financial instruments: risk management and hedging activities (continued)
Liquidity riskThe Group manages its cash and borrowing requirements centrally to minimise net interest expense within risk parameters agreed by the Board, whilst ensuring that the Group has sufficient liquid resources to meet the operating needs of its businesses. The forecast cash and borrowings profile of the Group is monitored to ensure that adequate headroom remains under committed borrowing facilities.
The table below shows the maturity analysis of the undiscounted remaining contractual cash flows (including interest) of the Group’s financial liabilities:
2014
Less than 1 year
£m
1 to 2 years
£m
2 to 5 years
£m
Over 5 years
£mTotal
£m
Bank loans and overdrafts 2.6 – – – 2.6Trade and other payables 380.9 1.0 – – 381.9Finance lease liabilities 0.1 0.1 0.1 – 0.3Corporate bonds 40.9 40.9 310.3 714.9 1,107.0Other liabilities 58.4 – – – 58.4
482.9 42.0 310.4 714.9 1,550.2Derivatives: net settled (7.7) (2.6) (1.8) (3.0) (15.1)Derivatives: gross settled Cash inflows (819.7) (6.1) – – (825.8) Cash outflows 845.8 6.1 – – 851.9Total cash flows 501.3 39.4 308.6 711.9 1,561.2
2013
Less than 1 year
£m
1 to 2 years
£m
2 to 5 years
£m
Over 5 years
£mTotal
£m
Bank loans and overdrafts 5.4 – – – 5.4Trade and other payables 345.5 2.5 – – 348.0Finance lease liabilities 0.1 0.1 0.2 – 0.4Corporate bonds 120.0 30.0 290.0 394.9 834.9Other liabilities 83.3 – – – 83.3
554.3 32.6 290.2 394.9 1,272.0Derivatives: net settled (13.0) (4.5) (11.8) (11.3) (40.6)Derivatives: gross settled Cash inflows (787.9) (50.9) – – (838.8) Cash outflows 772.5 49.3 – – 821.8Total cash flows 525.9 26.5 278.4 383.6 1,214.4
At January 2014 the Group had borrowing facilities of £300m (2013: £300m) in respect of which all conditions precedent have been met and which are committed to December 2016 (2013: December 2016). None of this facility was drawn down at January 2014 (2013: £nil). Subsequent to the year end date, the facility was extended to May 2019.
Interest rate riskThe Group is exposed to fair value interest rate risk on its fixed rate corporate bonds and cash flow interest rate risk on floating rate bank loans and overdrafts. The forecast cash and borrowings profile of the Group is monitored regularly to assess the mix of fixed and variable rate debt, and the Group uses interest rate derivatives where appropriate to reduce its exposure to changes in interest rates and the economic environment.
Interest rates: fair value hedgesThe Group has interest rate swap agreements in place as fair value hedges of part of the interest rate risk associated with the Company’s corporate bonds. Under the terms of the swaps, which have the same key features as the bonds, the Group receives a fixed rate of interest equivalent to the relevant coupon rate, and pays a variable rate. Details of the effective rates payable are given in Note 20.
ANNUAL REPORT AND ACCOUNTS JANUARY 2014
103

23158.04 - Proof 2 - 14/03/2014
27. Financial instruments: risk management and hedging activities (continued)The fair values of the Group’s interest rate swaps, including accrued interest, are as follows:
2014£m
2013£m
Derivatives in designated fair value hedging relationships 16.8 34.0Other interest rate derivatives – 4.3Total interest rate derivatives 16.8 38.3
Other interest rate derivatives related to economic hedges of variable rate interest payments due under swaps relating to the 2013 corporate bond which were not able to be hedge accounted under IAS 39.
The fair values of derivatives have been calculated by discounting the expected future cash flows at prevailing interest rates and are based on market prices at the balance sheet date.
Foreign currency riskThe Group’s principal foreign currency exposures arise from the purchase of overseas sourced products. Group policy allows for these exposures to be hedged for up to 24 months ahead in order to fix the cost in Sterling. This hedging activity involves, inter alia, the use of spot, forward and option contracts.
The market value of outstanding foreign exchange contracts is reported regularly at Board level, and reviewed in conjunction with percentage cover taken by season and current market conditions in order to assess and manage the Group’s ongoing exposure.
The Group does not have a material exposure to currency movements in relation to translation of overseas investments and consequently does not hedge any such exposure. The Group’s net exposure to foreign currencies, taking hedging activities into account is illustrated by the sensitivity analysis in Note 30.
Foreign currency: cash flow hedgesThe fair values of foreign exchange derivatives are as follows:
2014£m
2013£m
Derivatives in designated hedging relationships (20.0) 8.3Other foreign exchange derivatives (4.2) 1.7Total foreign exchange derivatives (24.2) 10.0
The total notional amount of outstanding foreign exchange contracts at the balance sheet date is as follows:
2014£m
2013£m
US Dollar 752.8 770.3Euro 64.8 64.1Other 8.2 4.4
825.8 838.8
The Group also supplies its associated company, Cotton Traders, with US Dollars. The notional value of contracts outstanding at January 2014 was £36.6m (2013: £28.0m).
Credit riskInvestments of cash surpluses, borrowings and derivative instruments are made through banks and companies which must fulfil credit rating and investment criteria approved by the Board. Concentrations of risk are mitigated by the use of various counterparties at any one time. All customers who wish to trade on credit terms are subject to credit verification procedures. Receivable balances are monitored on an ongoing basis and provision is made for estimated irrecoverable amounts. The concentration of credit risk is limited due to the Directory customer base being large and diverse. The Group’s outstanding receivables balances are detailed in Note 14.
NOTES TO THE CONSOLIDATED FINANCIAL STATEMENTS
ANNUAL REPORT AND ACCOUNTS JANUARY 2014
104

23158.04 - Proof 2 - 14/03/2014
Ad
diti
on
al i
nfo
rma
tion
Pare
nt C
om
pa
ny a
cc
ou
nts
Go
vern
an
ce
Co
nso
lida
ted
ac
co
un
tsBu
sin
ess
rep
ort
s27. Financial instruments: risk management and hedging activities (continued)
Capital riskThe capital structure of the Group consists of debt, as analysed in Note 31, and equity attributable to the equity holders of the parent company, comprising issued capital, reserves and retained earnings as shown in the Consolidated Statement of Changes in Equity. The Group manages its capital with the objective that all entities within the Group continue as going concerns while maintaining an efficient structure to minimise the cost of capital. The Group is not restricted by any externally imposed capital requirements.
As part of its strategy for delivering sustainable long term growth in earnings per share, the Group has been returning capital to shareholders by way of share buybacks in addition to dividends (including, more recently, special dividends). Share buybacks are transacted through both on-market purchases and contingent contracts for off-market share purchases.
28. Financial instruments: categories2014
£m2013
£m
Financial assets Derivatives at fair value through profit and loss – held for trading 0.8 10.0 Derivatives in designated hedging relationships 18.1 42.5 Loans and receivables 712.4 630.8 Cash and short term deposits 273.3 136.3 Available for sale financial assets 1.0 1.0Financial liabilities Derivatives at fair value through profit and loss – held for trading (5.0) (4.0) Derivatives in designated hedging relationships (21.3) (0.2) Corporate bonds (800.8) (654.4) Amortised cost (442.9) (436.7) Finance lease obligations (0.3) (0.4)
All derivatives are categorised as Level 2 under the requirements of IFRS 13, as they are valued using techniques based significantly on observed market data.
29. Financial instruments: fair valuesThe fair values of each category of the Group’s financial instruments are the same as their carrying values in the Group’s balance sheet, other than as noted below:
2014 2013Carrying amount
£m
Fair value
£m
Carrying amount
£m
Fair value
£m
Corporate bondsIn hedging relationships 488.2 513.5 341.8 347.8Not in hedging relationships 312.6 353.0 312.6 358.8
800.8 866.5 654.4 706.6
The fair values of corporate bonds are their market values at the balance sheet date (IFRS 13 Level 1). Market values include accrued interest and changes in credit risk and interest rate risk, and are therefore different to the reported carrying amounts.
ANNUAL REPORT AND ACCOUNTS JANUARY 2014
105

23158.04 - Proof 2 - 14/03/2014
30. Financial instruments: sensitivity analysis
Foreign currency sensitivity analysisThe Group’s principal foreign currency exposures are to US Dollars and the Euro. The table below illustrates the hypothetical sensitivity of the Group’s reported profit and closing equity to a 10% increase and decrease in the US Dollar/Sterling and Euro/Sterling exchange rates at the year end date, assuming all other variables remain unchanged. The sensitivity rate of 10% represents the directors’ assessment of a reasonably possible change, based on historic volatility.
The analysis assumes that exchange rate fluctuations on currency derivatives that form part of an effective cash flow hedge relationship affect the fair value reserve in equity and the fair value of the hedging derivatives. For foreign exchange derivatives which are not designated hedges, movements in exchange rates impact the income statement.
Positive figures represent an increase in profit or equity.
Income statement Equity2014
£m2013
£m2014
£m2013
£m
Sterling strengthens by 10%US Dollar (3.8) (12.8) (43.4) (41.2)Euro 0.3 0.8 (3.6) (2.1)Sterling weakens by 10%US Dollar (0.8) (0.8) 44.7 36.5Euro (1.2) (1.0) 3.5 1.9
Year end exchange rates applied in the above analysis are US Dollar 1.65 (2013: 1.58) and Euro 1.21 (2013: 1.17). Strengthening and weakening of Sterling may not produce symmetrical results depending on the proportion and nature of foreign exchange derivatives which do not qualify for hedge accounting.
Interest rate sensitivity analysisThe table below illustrates the hypothetical sensitivity of the Group’s reported profit and closing equity to a 0.5% increase or decrease in interest rates, assuming all other variables were unchanged. The sensitivity rate of 0.5% represents the directors’ assessment of a reasonably possible change, based on historic volatility.
The analysis has been prepared using the following assumptions:
❚ For floating rate assets and liabilities, the amount of asset or liability outstanding at the balance sheet date is assumed to have been outstanding for the whole year.
❚ Fixed rate financial instruments that are carried at amortised cost are not subject to interest rate risk for the purpose of this analysis.
Positive figures represent an increase in profit or equity.
Income statement Equity2014
£m2013
£m2014
£m2013
£m
Interest rate increase of 0.5% (1.1) (1.0) (1.1) (1.0)Interest rate decrease of 0.5% 1.1 1.0 1.1 1.0
NOTES TO THE CONSOLIDATED FINANCIAL STATEMENTS
ANNUAL REPORT AND ACCOUNTS JANUARY 2014
106

23158.04 - Proof 2 - 14/03/2014
Ad
diti
on
al i
nfo
rma
tion
Pare
nt C
om
pa
ny a
cc
ou
nts
Go
vern
an
ce
Co
nso
lida
ted
ac
co
un
tsBu
sin
ess
rep
ort
s31. Analysis of net debtJanuary
2013 £m
Cash flow £m
Other non-cash changes
£m
January 2014
£m
Cash and short term deposits 136.3 273.3Overdrafts (5.4) (2.6)Cash and cash equivalents 130.9 140.4 (0.6) 270.7Corporate bonds (654.4) (164.5) 18.1 (800.8)Fair value hedges of corporate bonds 31.3 – (18.3) 13.0Finance leases (0.4) 0.1 – (0.3)Total net debt (492.6) (24.0) (0.8) (517.4)
32. Operating lease commitmentsFuture minimum rentals payable under non-cancellable operating leases where the Group is the lessee:
2014£m
2013£m
Within one year 227.0 216.8In two to five years 784.9 778.5Over five years 786.3 839.9
1,798.2 1,835.2
At January 2014, future rentals receivable under non-cancellable sub-leases where the Group is the lessor were £15.7m (2013: £23.4m).
The Group has entered into operating leases in respect of vehicles, equipment, warehouses, office equipment and retail stores. These non-cancellable leases have remaining terms of between 1 month and approximately 20 years. Contingent rentals are payable on certain retail store leases based on store revenues. The majority of the Group’s operating leases provide for their renewal by mutual agreement at the expiry of the lease term.
Additional information on the Group’s leasing commitments as at January 2014 is detailed in the table below:
Minimum lease
payments£m
Less sub-lease
income£m
Net total£m
Year to January 2013 (Actual) 208.4 (5.4) 203.0Year to January 2014 (Actual) 218.5 (4.8) 213.7
Year to January 2015 227.0 (4.7) 222.3Year to January 2016 218.6 (3.8) 214.8Year to January 2017 204.9 (2.1) 202.8Year to January 2018 188.9 (1.6) 187.3Year to January 2019 172.5 (1.5) 171.0Sub-total 5 years to January 2019 1,011.9 (13.7) 998.2
5 years from February 2019 to January 2024 536.3 (2.0) 534.310 years from February 2024 to January 2034 218.8 – 218.82034 and beyond 31.2 – 31.2Total future obligations 1,798.2 (15.7) 1,782.5
ANNUAL REPORT AND ACCOUNTS JANUARY 2014
107

23158.04 - Proof 2 - 14/03/2014
INDEPENDENT AUDITOR’S REPORT – PARENT COMPANY
Independent auditor’s report to the members of NEXT plcWe have audited the parent company financial statements of NEXT plc (“the Company”) for the year ended 25 January 2014 which comprise the Balance Sheet, the Statement of Changes in Equity and the related notes C1 to C5. The financial reporting framework that has been applied in their preparation is applicable law and United Kingdom Accounting Standards (United Kingdom Generally Accepted Accounting Practice), including Financial Reporting Standard 101 ‘Reduced Disclosure Framework’.
This report is made solely to the Company’s members, as a body, in accordance with Chapter 3 of Part 16 of the Companies Act 2006. Our audit work has been undertaken so that we might state to the Company’s members those matters we are required to state to them in an auditor’s report and for no other purpose. To the fullest extent permitted by law, we do not accept or assume responsibility to anyone other than the Company and the Company’s members as a body, for our audit work, for this report, or for the opinions we have formed.
Respective responsibilities of directors and auditorAs explained more fully in the Directors’ Responsibilities Statement set out on page 31, the directors are responsible for the preparation of the parent company financial statements and for being satisfied that they give a true and fair view. Our responsibility is to audit and express an opinion on the parent company financial statements in accordance with applicable law and International Standards on Auditing (UK and Ireland). Those standards require us to comply with the Auditing Practices Board’s Ethical Standards for Auditors.
Scope of the audit of the financial statementsAn audit involves obtaining evidence about the amounts and disclosures in the financial statements sufficient to give reasonable assurance that the financial statements are free from material misstatement, whether caused by fraud or error. This includes an assessment of: whether the accounting policies are appropriate to the parent company’s circumstances and have been consistently applied and adequately disclosed; the reasonableness of significant accounting estimates made by the directors; and the overall presentation of the financial statements. In addition, we read all the financial and non-financial information in the Annual Report and Accounts to identify material inconsistencies with the audited financial statements and to identify any information that is apparently materially incorrect based on, or materially inconsistent with, the knowledge acquired by us in the course of performing the audit.
If we become aware of any apparent material misstatements or inconsistencies we consider the implications for our report.
Opinion on financial statementsIn our opinion the parent company financial statements:
❚ give a true and fair view of the state of the Company’s affairs as at 25 January 2014;
❚ have been properly prepared in accordance with United Kingdom Generally Accepted Accounting Practice; and
❚ have been prepared in accordance with the requirements of the Companies Act 2006.
Opinion on other matters prescribed by the Companies Act 2006In our opinion:
❚ the part of the Directors’ Remuneration Report to be audited has been properly prepared in accordance with the Companies Act 2006; and
❚ the information given in the Strategic Report and the Directors’ Report for the financial year for which the financial statements are prepared is consistent with the parent company financial statements.
Matters on which we are required to report by exceptionWe have nothing to report in respect of the following matters where the Companies Act 2006 requires us to report to you if, in our opinion:
❚ adequate accounting records have not been kept by the parent company, or returns adequate for our audit have not been received from branches not visited by us; or
❚ the parent company financial statements and the part of the Directors’ Remuneration Report to be audited are not in agreement with the accounting records and returns; or
❚ certain disclosures of directors’ remuneration specified by law are not made; or
❚ we have not received all the information and explanations we require for our audit.
Other matterWe have reported separately on the group financial statements of NEXT plc for the year ended 25 January 2014.
Nigel Meredith (Senior statutory auditor) for and on behalf of Ernst & Young LLP, Statutory Auditor, Birmingham 20 March 2014Notes: 1. The maintenance and integrity of the Next plc website is the responsibility of the
directors; the work carried out by the auditors does not involve consideration of these matters and, accordingly, the auditors accept no responsibility for any changes that may have occurred to the financial statements since they were initially presented on the website.
2. Legislation in the United Kingdom governing the preparation and dissemination of financial statements may differ from legislation in other jurisdictions
ANNUAL REPORT AND ACCOUNTS JANUARY 2014
108

23158.04 - Proof 2 - 14/03/2014
Ad
diti
on
al i
nfo
rma
tion
Go
vern
an
ce
Co
nso
lida
ted
ac
co
un
tsPa
ren
t C
om
pa
ny a
cc
ou
nts
Busi
ne
ss re
po
rts
PARENT COMPANY BALANCE SHEETAs at 25 January
Notes2014
£m2013
£m
Fixed assetsInvestments C2 2,475.7 2,475.7Other financial assets C3 17.7 30.9
2,493.4 2,506.6
Current assetsDebtors 12.3 21.2Cash at bank and in hand 203.3 96.2
215.6 117.4Total assets 2,709.0 2,624.0
Creditors: amounts falling due within one year C4 (396.7) (472.0)
Net current liabilities (181.1) (354.6)
Total assets less current liabilities 2,312.3 2,152.0
Creditors: amounts falling due after more than one year C4 (801.7) (566.8)
Total liabilities (1,198.4) (1,038.8)
NET ASSETS 1,510.6 1,585.2
Capital and reservesCalled up share capital C5 15.5 16.1Share premium account 0.9 0.9Capital redemption reserve 14.4 13.8ESOT reserve C5 (196.6) (215.6)Other reserves C5 985.2 985.2Profit and loss account 691.2 784.8
TOTAL EQUITY 1,510.6 1,585.2
Approved by the Board on 20 March 2014
Lord Wolfson of Aspley Guise Chief Executive 20 March 2014
David Keens Group Finance Director
ANNUAL REPORT AND ACCOUNTS JANUARY 2014
109

23158.04 - Proof 2 - 14/03/2014
PARENT COMPANY STATEMENT OF CHANGES IN EQUITYFor the financial year ended 25 January
Share capital
£m
Share premium account
£m
Capital redemption
reserve £m
ESOTreserve
£m
Otherreserves
£m
Profit and loss account
£m
Totalequity
£m
At January 2012 16.9 0.8 13.0 (141.1) 985.2 680.7 1,555.5
Profit for the year – – – – – 478.7 478.7 Other comprehensive income for the year – – – – – – –Total comprehensive income for the year – – – – – 478.7 478.7
Shares issued – 0.1 – – – – 0.1Share buybacks and commitments (Note C5) (0.8) – 0.8 – – (220.0) (220.0)ESOT share purchases and commitments (Note C5) – – – (143.5) – – (143.5)Shares issued by ESOT – – – 69.0 – (24.7) 44.3Share option charge – – – – – 17.8 17.8Equity dividends – – – – – (147.7) (147.7)At January 2013 16.1 0.9 13.8 (215.6) 985.2 784.8 1,585.2
Profit for the year – – – – – 478.8 478.8Other comprehensive income for the year – – – – – – –Total comprehensive income for the year – – – – – 478.8 478.8
Share buybacks and commitments (Note C5) (0.6) – 0.6 – – (311.9) (311.9)ESOT share purchases and commitments (Note C5) – – – (55.0) – – (55.0)Shares issued by ESOT – – – 74.0 – (35.6) 38.4Share option charge – – – – – 15.8 15.8Equity awards settled in cash – – – – – (2.4) (2.4)Tax recognised directly in equity – – – – – 0.6 0.6Equity dividends – – – – – (238.9) (238.9)
At January 2014 15.5 0.9 14.4 (196.6) 985.2 691.2 1,510.6
ANNUAL REPORT AND ACCOUNTS JANUARY 2014
110

23158.04 - Proof 2 - 14/03/2014
Ad
diti
on
al i
nfo
rma
tion
Go
vern
an
ce
Co
nso
lida
ted
ac
co
un
tsPa
ren
t C
om
pa
ny a
cc
ou
nts
Busi
ne
ss re
po
rts
NOTES TO THE PARENT COMPANY FINANCIAL STATEMENTS
C1. Accounting policiesThe parent company financial statements of NEXT plc have been prepared in accordance with the Companies Act 2006 and Financial Reporting Standard 101 Reduced Disclosure Framework (“FRS 101”), which was first applied this year after notifying shareholders of the proposed change last year. FRS 101 enables the financial statements of the parent company to be prepared in accordance with EU-adopted IFRS but with certain disclosure exemptions. The main areas of reduced disclosure are in respect of equity settled share based payments, financial instruments, the cash flow statement, and related party transactions with Group companies. The Company’s reported profits and net assets were unaffected by the transition to FRS 101 and remain consistent with EU-adopted IFRS which was applied previously. The accounting policies adopted for the parent company, NEXT plc, are otherwise consistent with those used for the Group which are set out on pages 77 to 80. As permitted by Section 408 of the Companies Act 2006, the income statement of the Company is not presented as part of the financial statements. The profit after taxation dealt with in the accounts of the holding company was £478.8m (2013: profit of £478.7m).
C2. InvestmentsThe Company has taken advantage of Section 410(2) of the Companies Act 2006 to list only its principal subsidiary and associated undertakings at January 2014. All of these are wholly owned by the Company or its subsidiary undertakings, registered in England and Wales, and operate predominantly in the United Kingdom unless otherwise stated.
Subsidiary undertakingsNEXT Group Plc Intermediate holding companyNEXT Retail Limited¹ Retailing of fashion and home productsNEXT Directory² Home shopping, including international onlineNEXT Distribution Limited¹ Warehousing and distributionLipsy Limited¹ Fashion retailingNEXT Sourcing Limited¹ Overseas sourcing services (Hong Kong)NEXT Manufacturing (Pvt) Limited¹ Garment manufacture (Sri Lanka)
Associated undertakingsChoice Discount Stores Limited¹ Retailing (40%)Cotton Traders Holdings Limited¹ Home shopping and retailing (33%)
¹ Shareholdings held by subsidiary undertakings. ² The trade of the NEXT Directory is carried out by NEXT Retail Limited.
C3. Other financial assetsOther financial assets comprise interest rate derivatives as detailed in Note 15 of the consolidated financial statements, which are carried at their fair value.
C4. Current and non-current creditors2014 2013
Current £m
Non-current £m
Current £m
Non-current £m
Corporate bonds – 800.8 87.6 566.8Amounts due to subsidiary undertaking 252.3 – 286.1 –Dividends payable 74.4 – – –Derivative financial instruments 58.4 0.9 86.7 –Accruals and other creditors 11.6 – 11.6 –
396.7 801.7 472.0 566.8
Details of the terms of bank overdrafts and unsecured bank loans are given in Note 17. Further information on the Company’s corporate bonds is given in Note 20. Derivative financial instruments include interest rate swaps carried at fair value (Notes 15 and 19) and amounts payable under the Company’s closed season buyback arrangements and contingent purchase contracts (including those entered into by the ESOT) for the Company’s own shares (Note 19).
C5. Share capital, ESOT and other reservesDetails of the Company’s share capital and share buybacks are given in Note 23. ESOT transactions are detailed in Note 26. Other reserves in the Company balance sheet of £985.2m (2013: £985.2m) represent the difference between the market price and the nominal value of shares issued as part of the capital reconstruction on acquisition of NEXT Group plc which has been subject to Section 131 Companies Act 1985 merger relief.
ANNUAL REPORT AND ACCOUNTS JANUARY 2014
111

23158.04 - Proof 2 - 14/03/2014
Firsthalf £m
Secondhalf £m
Year toJan 2014
£m
Firsthalf £m
Secondhalf £m
Year toJan 2013
£m
RevenueNEXT Retail 1,000.6 1,227.0 2,227.6 1,009.9 1,181.0 2,190.9NEXT Directory 597.6 743.4 1,341.0 551.7 640.9 1,192.6NEXT International Retail 40.4 45.2 85.6 37.9 39.8 77.7NEXT Sourcing 5.3 5.7 11.0 3.0 5.8 8.8Lipsy 27.3 35.6 62.9 26.9 31.2 58.1Property Management 2.3 2.5 4.8 2.7 17.6 20.3Other activities 3.7 3.4 7.1 8.2 6.2 14.4Total 1,677.2 2,062.8 3,740.0 1,640.3 1,922.5 3,562.8
Profit before taxNEXT Retail 124.3 223.4 347.7 122.7 208.4 331.1NEXT Directory 156.1 202.4 358.5 137.7 164.4 302.1NEXT International Retail 5.1 7.0 12.1 3.4 5.0 8.4NEXT Sourcing 13.6 20.5 34.1 11.8 19.0 30.8Lipsy 0.8 1.9 2.7 0.5 1.5 2.0Property Management 1.1 0.7 1.8 3.6 (0.1) 3.5Other activities (16.1) (18.0) (34.1) (13.9) (13.8) (27.7)Operating profit - underlying 284.9 437.9 722.8 265.8 384.4 650.2Exceptional items - - - (6.3) 51.2 44.9Net finance costs (13.1) (14.5) (27.6) (14.5) (14.1) (28.6)Total 271.8 423.4 695.2 245.0 421.5 666.5
FIVE YEAR HISTORYYear to January
2014£m
2013£m
2012£m
2011£m
2010£m
Continuing operationsRevenue 3,740.0 3,562.8 3,441.1 3,297.7 3,260.9
Operating profit – underlying 722.8 650.2 598.7 566.8 523.8Net finance costs – underlying (27.6) (28.6) (28.4) (23.4) (24.5)Profit before taxation – underlying 695.2 621.6 570.3 543.4 499.3Exceptional items (pre-tax) – 44.9 47.2 – –Ventura profit before tax (discontinued) – – 2.9 8.0 6.0Taxation (142.0) (157.9) (145.6) (150.5) (141.3)Profit after taxation 553.2 508.6 474.8 400.9 364.0
Total equity 286.2 285.6 222.7 232.4 133.4
Shares purchased for cancellation 6.2m 7.5m 12.5m 10.0m 5.9m
Dividends per share– ordinary 129.0p 105.0p 90.0p 78.0p 66.0p– special* 50.0p – – – –
Basic earnings per share Underlying 366.1p 297.7p 255.4p 221.9p 188.5p Total 366.1p 320.1p 282.0p 221.9p 188.5p
* The first 50p special dividend was announced on 3 January 2014 and paid on 3 February 2014.
HALF YEAR AND SECTOR ANALYSIS
ANNUAL REPORT AND ACCOUNTS JANUARY 2014
112

23158.04 - Proof 2 - 14/03/2014
Pare
nt C
om
pa
ny a
cc
ou
nts
Go
vern
an
ce
Co
nso
lida
ted
ac
co
un
tsA
dd
itio
na
l in
form
atio
nBu
sin
ess
rep
ort
s
NOTICE OF MEETING
THIS DOCUMENT IS IMPORTANT AND REQUIRES YOUR IMMEDIATE ATTENTION. If you are in any doubt as to the action you should take, you are recommended to seek your own personal financial advice from your stockbroker, bank manager, solicitor, accountant or other financial advisor authorised under the Financial Services and Markets Act 2000.
If you have sold or otherwise transferred all your NEXT shares, please send this document, together with the accompanying Form of Proxy, as soon as possible to the purchaser or transferee, or to the stockbroker, bank or other agent through whom the sale or transfer was effected, for delivery to the purchaser or transferee.
Notice is given that the Annual General Meeting of NEXT plc will be held at the Leicester Marriott Hotel, Smith Way, Grove Park, Leicester LE19 1SW on Thursday 15 May 2014 at 9.30 a.m. at which the following resolutions will be proposed; resolutions 1 to 16 and 19 as Ordinary Resolutions and 17, 18 and 20 as Special Resolutions.
Further information on these resolutions can be found in the Directors’ Report on pages 26 to 30 and in the appendix to this Notice. Biographies of directors seeking election/re-election are shown on page 32 of the Annual Report.
1. To receive and adopt the accounts and reports of the directors and auditor for the year ended 25 January 2014.
2. To approve the directors’ remuneration policy, the full text of which is contained in the Remuneration Report for the year ended 25 January 2014 and set out on pages 41 to 55.
3. To approve the Remuneration Report (excluding the directors’ remuneration policy set out on pages 41 to 55) for the year ended 25 January 2014.
4. To declare a final dividend of 93p per share in respect of the year ended 25 January 2014.
5. To re-elect John Barton as a director.
6. To re-elect Christos Angelides as a director.
7. To re-elect Steve Barber as a director.
8. To re-elect Jonathan Dawson as a director.
9. To re-elect Caroline Goodall as a director.
10. To re-elect David Keens as a director.
11. To elect Michael Law as a director.
12. To re-elect Francis Salway as a director.
13. To elect Jane Shields as a director.
14. To re-elect Lord Wolfson as a director.
15. To re-appoint Ernst & Young LLP as auditor and authorise the directors to set their remuneration.
ANNUAL REPORT AND ACCOUNTS JANUARY 2014
113

23158.04 - Proof 2 - 14/03/2014
16. Directors’ authority to allot shares
That:
a) the directors be authorised to allot equity securities (as defined in section 560 of the Companies Act 2006 (the “2006 Act”)) in the Company:
(i) in accordance with article 7 of the Company’s articles of association (the “Articles”), up to a maximum nominal amount of £5,100,000; and
(ii) up to a maximum nominal amount of £10,200,000 (as reduced by any equity securities allotted under paragraph (a)(i) above) in connection with an offer by way of a rights issue (as defined in article 8 of the Articles);
b) in accordance with article 7 of the Articles this authority shall expire at the conclusion of the next annual general meeting of the Company after the passing of this resolution, or, if earlier, at the close of business on 1 August 2015; and
c) all previous unutilised authorities under section 551 of the 2006 Act shall cease to have effect (save to the extent that the same are exercisable pursuant to section 551(7) of the 2006 Act by reason of any offer or agreement made prior to the date of this resolution which would or might require shares to be allotted on or after that date).
17. Disapplication of pre-emption rights
That:
a) in accordance with article 8 of the Company’s articles of association (the “Articles”), the directors be given power to allot equity securities for cash;
b) the power under paragraph (a) above (other than in connection with a rights issue, as defined in article 8(b)(ii) of the Articles) shall be limited to the allotment of equity securities having a nominal amount not exceeding in aggregate £775,000;
c) in accordance with article 8 of the Articles this authority shall expire at the conclusion of the next annual general meeting of the Company after the passing of this resolution or, if earlier, at the close of business on 1 August 2015; and
d) all previous unutilised authorities under sections 570 and 573 of the 2006 Act shall cease to have effect.
18. On-market purchase of own shares
That in accordance with the 2006 Act, the Company be granted general and unconditional authority to make market purchases (as defined in Section 693 of the 2006 Act) of any of its own ordinary shares on such terms and in such manner as the directors may determine provided that:
a) the authority conferred by this resolution shall be limited to the lesser of 23,239,000 ordinary shares of 10p each and no more than 14.99% of the issued ordinary shares outstanding at the date of the Annual General Meeting, such limit to be reduced by the number of any shares purchased pursuant to the authority granted at resolution 19 below;
b) the minimum price which may be paid for ordinary shares (exclusive of expenses) is 10p per ordinary share;
c) the maximum price which may be paid for each ordinary share (exclusive of expenses) is an amount not more than the higher of 105% of the average of the middle market price of the ordinary shares of the Company according to the Daily Official List of the London Stock Exchange for the five business days immediately preceding the date of purchase and the amount stipulated by Article 5(1) of the Buy-back and Stabilisation Regulation 2003;
NOTICE OF MEETING
ANNUAL REPORT AND ACCOUNTS JANUARY 2014
114

23158.04 - Proof 2 - 14/03/2014
Pare
nt C
om
pa
ny a
cc
ou
nts
Go
vern
an
ce
Co
nso
lida
ted
ac
co
un
tsA
dd
itio
na
l in
form
atio
nBu
sin
ess
rep
ort
sd) the authority hereby conferred, unless renewed, shall expire on whichever is the earlier of the conclusion of the Annual General Meeting of the Company held in 2015 and 1 August 2015;
e) the Company may make a contract or contracts to purchase ordinary shares under the authority hereby conferred prior to the expiry of such authority which will or may be executed wholly or partly after the expiry of such authority and may make a purchase of ordinary shares in pursuance of any such contract; and
f) all existing authorities for the Company to make market purchases of its own ordinary shares are revoked, except in relation to the purchase of shares under a contract or contracts concluded before the date of this resolution and which has or have not yet been executed.
19. Off-market purchases of own shares
That, in accordance with section 694 of the 2006 Act, the proposed programme agreements to be entered into between the Company and any of Goldman Sachs International, UBS AG, Deutsche Bank AG, HSBC Bank plc and Barclays Bank plc (in the form produced to this meeting and initialled by the Chairman for the purpose of identification) (the “Programme Agreements”) be and are approved and the Company be and is authorised to enter into the Programme Agreements and all and any forward trades which may be effected or made from time to time under or pursuant to the Programme Agreements for the off-market purchase by the Company of its ordinary shares of 10 pence each, as more fully described in Appendix 1 on pages 116 to 117 (the authority conferred by this ordinary resolution to expire on whichever is the earlier of the conclusion of the next annual general meeting of the Company held in 2015 and 1 August 2015, unless such authority is renewed prior to that time (except in relation to the purchase of ordinary shares under any forward trade effected or made before the expiry of such authority and which might be completed wholly or partly after such expiry)), and provided that shares purchased pursuant to this authority will reduce the number of shares that the Company may purchase under the general authority granted under resolution 18 above.
20. Notice of general meetings
That, in accordance with the Company’s articles of association, a general meeting (other than an annual general meeting) may be called on not less than 14 clear days’ notice.
By order of the Board
Seonna Anderson Secretary Registered Office: Desford Road, Enderby, Leicester, LE19 4AT 11 April 2014
ANNUAL REPORT AND ACCOUNTS JANUARY 2014
115
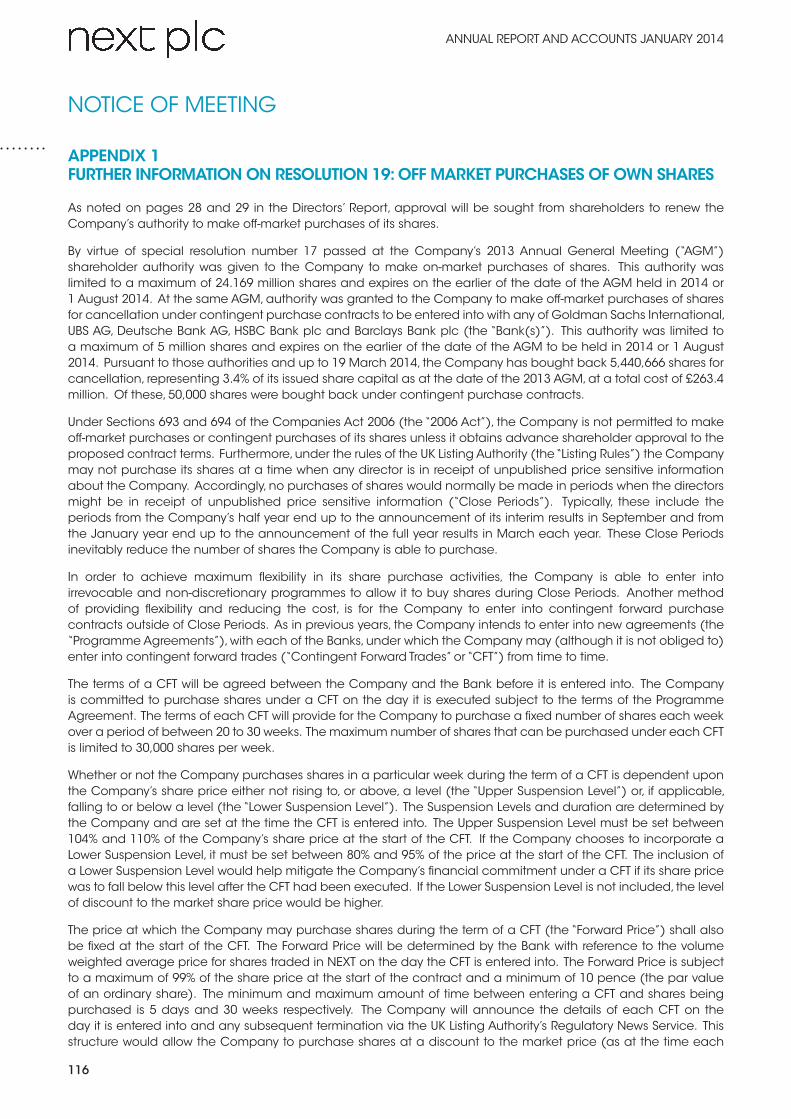
23158.04 - Proof 2 - 14/03/2014
NOTICE OF MEETING
APPENDIX 1FURTHER INFORMATION ON RESOLUTION 19: OFF MARKET PURCHASES OF OWN SHARES
As noted on pages 28 and 29 in the Directors’ Report, approval will be sought from shareholders to renew the Company’s authority to make off-market purchases of its shares.
By virtue of special resolution number 17 passed at the Company’s 2013 Annual General Meeting (“AGM”) shareholder authority was given to the Company to make on-market purchases of shares. This authority was limited to a maximum of 24.169 million shares and expires on the earlier of the date of the AGM held in 2014 or 1 August 2014. At the same AGM, authority was granted to the Company to make off-market purchases of shares for cancellation under contingent purchase contracts to be entered into with any of Goldman Sachs International, UBS AG, Deutsche Bank AG, HSBC Bank plc and Barclays Bank plc (the “Bank(s)”). This authority was limited to a maximum of 5 million shares and expires on the earlier of the date of the AGM to be held in 2014 or 1 August 2014. Pursuant to those authorities and up to 19 March 2014, the Company has bought back 5,440,666 shares for cancellation, representing 3.4% of its issued share capital as at the date of the 2013 AGM, at a total cost of £263.4 million. Of these, 50,000 shares were bought back under contingent purchase contracts.
Under Sections 693 and 694 of the Companies Act 2006 (the “2006 Act”), the Company is not permitted to make off-market purchases or contingent purchases of its shares unless it obtains advance shareholder approval to the proposed contract terms. Furthermore, under the rules of the UK Listing Authority (the “Listing Rules”) the Company may not purchase its shares at a time when any director is in receipt of unpublished price sensitive information about the Company. Accordingly, no purchases of shares would normally be made in periods when the directors might be in receipt of unpublished price sensitive information (“Close Periods”). Typically, these include the periods from the Company’s half year end up to the announcement of its interim results in September and from the January year end up to the announcement of the full year results in March each year. These Close Periods inevitably reduce the number of shares the Company is able to purchase.
In order to achieve maximum flexibility in its share purchase activities, the Company is able to enter into irrevocable and non-discretionary programmes to allow it to buy shares during Close Periods. Another method of providing flexibility and reducing the cost, is for the Company to enter into contingent forward purchase contracts outside of Close Periods. As in previous years, the Company intends to enter into new agreements (the “Programme Agreements”), with each of the Banks, under which the Company may (although it is not obliged to) enter into contingent forward trades (“Contingent Forward Trades” or “CFT”) from time to time.
The terms of a CFT will be agreed between the Company and the Bank before it is entered into. The Company is committed to purchase shares under a CFT on the day it is executed subject to the terms of the Programme Agreement. The terms of each CFT will provide for the Company to purchase a fixed number of shares each week over a period of between 20 to 30 weeks. The maximum number of shares that can be purchased under each CFT is limited to 30,000 shares per week.
Whether or not the Company purchases shares in a particular week during the term of a CFT is dependent upon the Company’s share price either not rising to, or above, a level (the “Upper Suspension Level”) or, if applicable, falling to or below a level (the “Lower Suspension Level”). The Suspension Levels and duration are determined by the Company and are set at the time the CFT is entered into. The Upper Suspension Level must be set between 104% and 110% of the Company’s share price at the start of the CFT. If the Company chooses to incorporate a Lower Suspension Level, it must be set between 80% and 95% of the price at the start of the CFT. The inclusion of a Lower Suspension Level would help mitigate the Company’s financial commitment under a CFT if its share price was to fall below this level after the CFT had been executed. If the Lower Suspension Level is not included, the level of discount to the market share price would be higher.
The price at which the Company may purchase shares during the term of a CFT (the “Forward Price”) shall also be fixed at the start of the CFT. The Forward Price will be determined by the Bank with reference to the volume weighted average price for shares traded in NEXT on the day the CFT is entered into. The Forward Price is subject to a maximum of 99% of the share price at the start of the contract and a minimum of 10 pence (the par value of an ordinary share). The minimum and maximum amount of time between entering a CFT and shares being purchased is 5 days and 30 weeks respectively. The Company will announce the details of each CFT on the day it is entered into and any subsequent termination via the UK Listing Authority’s Regulatory News Service. This structure would allow the Company to purchase shares at a discount to the market price (as at the time each
ANNUAL REPORT AND ACCOUNTS JANUARY 2014
116

23158.04 - Proof 2 - 14/03/2014
Pare
nt C
om
pa
ny a
cc
ou
nts
Go
vern
an
ce
Co
nso
lida
ted
ac
co
un
tsA
dd
itio
na
l in
form
atio
nBu
sin
ess
rep
ort
sCFT commences), for so long as the Suspension Levels are not reached, without breaching the Listing Rules. If any Suspension Level is reached, the CFT would terminate automatically at that time and no further shares would be purchased under that contract.
Under the provisions of sections 693 and 694 of the 2006 Act, the Programme Agreements and Contingent Forward Trades are contingent purchase contracts to purchase shares by the Company off-market. Accordingly resolution 19, which will be proposed as an ordinary resolution, seeks shareholder approval to the terms of the Programme Agreements to be entered into between the Company and each of the Banks. The Programme Agreements will have a duration of the shorter of the period to the date of the next AGM to be held in 2015 or 1 August 2015 and will incorporate the terms of an ISDA Master Agreement and Schedule. The Programme Agreements will be entered into and each CFT will be effected outside a Close Period but shares may be purchased during a Close Period by the Company.
Should shareholder approval be granted, any number of CFT may be effected with the Banks at any time, provided that:
❚ the total maximum number of shares which the Company is permitted to purchase pursuant to this authority would be 4.0 million, representing circa 2.6% of its issued share capital at 19 March 2014;
❚ the total cost of shares that the Company would be permitted to purchase pursuant to this authority may not exceed £200 million (including costs);
❚ the Forward Price may not exceed the higher of 105% of the average middle market closing price of the Company’s shares as derived from the Official List of the London Stock Exchange for the five days immediately preceding the day on which the CFT was effected and the amount stipulated by Article 5(1) of the Buy-back and Stabilisation Regulation 2003;
❚ the Forward Price will be no more than 99% of the share price at the time the Contingent Forward Trade was effected;
❚ the minimum price that can be paid for any share is £0.10; and
❚ only one Contingent Forward Trade will be entered into on any particular day.
Shares purchased under the Programme Agreements will reduce the number of shares that the Company may purchase under any authority granted at the AGM on 15 May 2014 for on-market purchases. No shares will be purchased under that authority on the same day that a CFT is entered into. The authority granted to the Company under this resolution will expire at the conclusion of the AGM of the Company held in 2015 or on 1 August 2015, whichever is the earlier, unless such authority is renewed prior to that time (except in relation to the purchase of shares under any CFT effected before the expiry of such authority and which might be completed wholly or partly after such expiry). The purchase of shares under the Programme Agreements will always be physically settled by delivery of shares to the Company (except in the case of certain events of default or termination events).
A copy of each of the Programme Agreements will be available at the AGM on 15 May 2014. Copies will also be available for inspection at the Company’s registered office at Desford Road, Enderby, Leicester LE19 4AT and at the offices of Pinsent Masons, 30 Crown Place, Earl Street, London EC2A 4ES during usual business hours until the date of the AGM and at the Meeting itself.
The total number of employee share options to subscribe for shares outstanding at 19 March 2014 was 7,242,592. This represents 4.7% of the issued share capital at that date. If the Company were to buy back the maximum number of shares permitted pursuant to both the existing authority for off-market purchases granted at the 2013 AGM (which will expire at the 2014 AGM) and the authority sought by this special resolution, then the total number of options to subscribe for shares outstanding at 19 March 2014 would represent 5.0% of the reduced issued share capital.
ANNUAL REPORT AND ACCOUNTS JANUARY 2014
117

23158.04 - Proof 2 - 14/03/2014
Attendance, Voting and QuestionsAll members who hold ordinary shares are entitled to attend and vote at the AGM. A member who is entitled to attend and vote may appoint one or more proxies to attend and vote instead of him, provided that each proxy is appointed to exercise the rights attached to a different share or shares held by him. A proxy need not also be a member. A proxy may vote on any other business which may properly come before the meeting. If you do not intend being present at the meeting please either sign and return a hard copy form of proxy so as to reach the Company’s registrars at least 48 hours before the meeting or follow the instructions for electronic proxy appointment through CREST or through www.sharevote.co.uk, where full instructions are provided. The return by a member of a fully completed form of proxy will not preclude any such member from attending in person and voting at the meeting.
A person to whom this notice is sent who is a person nominated under section 146 of the 2006 Act to enjoy information rights (a “Nominated Person”) may, under an agreement between them and the shareholder by whom they were nominated, have a right to be appointed (or to have someone else appointed) as a proxy for the AGM. If a Nominated Person has no such proxy appointment right or does not wish to exercise it, they may, under any such agreement, have a right to give instructions to the shareholder as to the exercise of voting rights.
The statements of the rights of members in relation to the appointment of proxies in the above paragraph and in the paragraphs headed “Electronic proxy appointment through CREST” and “Proxy card” below do not apply to a Nominated Person. The rights described in these paragraphs can only be exercised by registered members of the Company. Nominated persons are reminded that they should contact the registered holder of their shares (and not the Company) on matters relating to their investments in the Company.
Any corporation which is a member can appoint one or more corporate representatives who may exercise on its behalf all of its powers as a member provided that they do not do so in relation to the same shares.
In the case of joint holders, where more than one of the joint holders purports to appoint a proxy, only the appointment submitted by the most senior holder will be accepted, the senior holder being the first named of the joint holders to appear in the Company’s share register.
A member who appoints as their proxy someone other than the Chairman, is responsible for ensuring that the proxy attends the meeting and is aware of the voting intention of the member. If no voting instruction is given, the proxy has discretion on whether and how to vote.
If a member submits more than one valid proxy appointment, the appointment received last before the latest time for the receipt of proxies will take precedence.
The Company, pursuant to Regulation 41 of the Uncertificated Securities Regulations 2001 and its articles of association, specifies that only those shareholders registered in the register of members of the Company as at 6pm on 13 May 2014 shall be entitled to attend or vote at the aforesaid general meeting in respect of the number of shares registered in their name at that time. Changes to entries on the relevant register of securities after 6pm on 13 May 2014 (or 6pm on the day that is two days before any adjourned meeting) shall be disregarded in determining the rights of any person to attend or vote at the meeting.
All resolutions will be put to poll votes. This means that the votes of all shareholders, including those who cannot attend the meeting but who validly appoint a proxy, are counted. The procedures for the poll votes will be explained at the AGM.
In respect of resolution 19 on off-market share purchase contracts, the 2006 Act provides that this resolution will not be effective if any member of the Company holding shares to which it relates (i.e. those which may be purchased pursuant to the Programme Agreements) exercised the voting rights carried by any of those shares in voting on the resolution and the resolution would not have been passed if they had not done so. Therefore, NEXT intends to disregard any poll votes which are cast in favour of resolution 19 attaching to 4.0 million shares (being the total maximum number of shares which the Company is permitted to purchase pursuant to the Programme Agreements) from both the total number of votes cast in favour of this resolution and the total number of votes cast.
NOTICE OF MEETINGNOTICE OF MEETING
ANNUAL REPORT AND ACCOUNTS JANUARY 2014
118

23158.04 - Proof 2 - 14/03/2014
Pare
nt C
om
pa
ny a
cc
ou
nts
Go
vern
an
ce
Co
nso
lida
ted
ac
co
un
tsA
dd
itio
na
l in
form
atio
nBu
sin
ess
rep
ort
sAs at 19 March 2014 (being the latest practicable date prior to the publication of this Notice) the Company’s issued share capital consists of 155,032,317 ordinary shares. All of the ordinary shares carry one vote each and there are no shares held in treasury.
A member attending the meeting has the right to ask questions. The Company must ensure any such question relating to the business being dealt with at the meeting is answered but no such answer need be given if (a) to do so would interfere unduly with the preparation for the meeting or involve the disclosure of confidential information, (b) the answer has already been given on a website in the form of an answer to a question, or (c) it is undesirable in the interests of the Company or the good order of the meeting that the question be answered.
Electronic proxy appointment through CRESTCREST members who wish to appoint a proxy or proxies through the CREST electronic proxy appointment service may do so for the AGM to be held on 15 May 2014 and any adjournment(s) thereof by using the procedures described in the CREST Manual. CREST personal members or other CREST sponsored members, and those CREST members who have appointed a voting service provider(s), should refer to their CREST sponsor or voting service provider(s), who will be able to take the appropriate action on their behalf.
In order for a proxy appointment or instruction made using the CREST service to be valid, the appropriate CREST message (a “CREST Proxy Instruction”) must be properly authenticated in accordance with Euroclear UK & Ireland Limited’s specifications and must contain the information required for such instructions, as described in the CREST Manual. The message, regardless of whether it constitutes the appointment of a proxy or is an amendment to the instruction given to a previously appointed proxy must, in order to be valid, be transmitted so as to be received by the issuer’s agent (ID RA19) by the latest time(s) for receipt of proxy appointments specified in the notice of meeting. For this purpose, the time of receipt will be taken to be the time (as determined by the timestamp applied to the message by the CREST Applications Host) from which the issuer’s agent is able to retrieve the message by enquiry to CREST in the manner prescribed by CREST. After this time any change of instructions to proxies appointed through CREST should be communicated to the appointee through other means.
CREST members and, where applicable, their CREST sponsors or voting service providers should note that Euroclear UK & Ireland Limited does not make available special procedures in CREST for any particular messages. Normal system timings and limitations will therefore apply in relation to the input of CREST Proxy Instructions. It is the responsibility of the CREST member concerned to take (or, if the CREST member is a CREST personal member or sponsored member or has appointed a voting service provider(s), to procure that his CREST sponsor or voting service provider(s) take(s)) such action as shall be necessary to ensure that a message is transmitted by means of the CREST system by any particular time. In this connection, CREST members and, where applicable, their CREST sponsors or voting service provider(s) are referred, in particular, to those sections of the CREST Manual concerning practical limitations of the CREST system and timings. The CREST Manual is available at www.euroclear.com.
The Company may treat as invalid a CREST Proxy Instruction in the circumstances set out in Regulation 35(5)(a) of the Uncertificated Securities Regulations 2001.
Documents available for inspectionThe following documents will be available for inspection at the registered office of the Company during usual business hours and will be available for fifteen minutes prior to and for the duration of the AGM:
❚ Copies of the terms of appointment of the non-executive directors
❚ Copies of each of the Programme Agreements pursuant to resolution 19
Copies of each of the Programme Agreements pursuant to resolution 19 will be available for inspection at the offices of Pinsent Masons, 30 Crown Place, Earl Street, London EC2A 4ES during normal working hours until the close of the Annual General Meeting.
You may not use any electronic address provided in this notice of meeting to communicate with the Company for any purposes other than those expressly stated.
ANNUAL REPORT AND ACCOUNTS JANUARY 2014
119

23158.04 - Proof 2 - 14/03/2014
OTHER INFORMATION
Registered OfficeDesford Road, Enderby, Leicester, LE19 4AT Registered in England, no. 4412362
Company websiteA full copy of this Annual Report, together with those for prior years, and other information required by section 311A of the 2006 Act can be found on the NEXT plc website at www.nextplc.co.uk.
Under section 527 of the 2006 Act members meeting the threshold requirements set out in that section have the right to require the Company to publish on a website a statement setting out any matter relating to: (i) the audit of the Company’s accounts (including the auditor’s report and the conduct of the audit) that are to be laid before the Annual General Meeting; or (ii) any circumstance connected with an auditor of the Company ceasing to hold office since the previous meeting at which annual accounts and reports were laid in accordance with section 437 of the 2006 Act. The Company may not require the members requesting such website publication to pay its expenses in complying with sections 527 or 528 of the 2006 Act, and it must forward the statement to the Company’s auditor not later than the time when it makes the statement available on the website. The business which may be dealt with at the Annual General Meeting includes any statement that the Company has been required under section 527 of the 2006 Act to publish on its website.
Payment of dividendThe recommended final dividend, if approved, will be paid on 1 August 2014 to holders of ordinary shares registered at close of business on 11 July 2014. The ordinary shares will trade ex-dividend from 9 July 2014.
Annual General MeetingThe Annual General Meeting will be held at 9.30am on Thursday 15 May 2014 at the Leicester Marriott Hotel, Smith Way, Grove Park, Leicester LE19 1SW. The notice of the meeting on pages 113 to 119 sets out business to be transacted. Full access is available to the venue for those with special requirements.
Proxy cardCompleted proxy cards should be sent to our registrars, Equiniti, and must be received by 9.30am on 13 May 2014 (or 48 hours before any adjourned meeting). As an alternative to completing and returning this form of proxy, you may submit your proxy electronically by accessing the Registrar’s website www.sharevote.co.uk. You will be asked to enter your unique Voting ID, Task ID and Shareholder Reference Number as printed on your form of proxy. The use by members of the electronic proxy appointment service will be governed by the terms and conditions of use which appear on the website. Electronic proxies must be completed and lodged in accordance with the instructions on the website by no later than 48 hours before the Annual General Meeting. A member must inform the Registrar in writing of any termination of the authority of a proxy.
Share price data (Stock Exchange Code: NXT.L)
2014 2013
Share price at financial year end £62.80 £40.59
Market capitalisation £9,736m £6,544m
Share price movement during year:High mid-market quotation £63.65 £40.59Low mid-market quotation £40.58 £26.19
Registrars and transfer officeEquiniti, Aspect House, Spencer Road, Lancing, West Sussex, BN99 6DA
Telephone 0871 384 2164. Calls to this number are charged at 8p per minute plus network extras. Overseas Shareholder Helpline Number +44 (0)121 415 7047. Lines are open 8.30am to 5.30pm Monday to Friday.
ANNUAL REPORT AND ACCOUNTS JANUARY 2014
120

23158.04 - Proof 2 - 14/03/2014
Pare
nt C
om
pa
ny a
cc
ou
nts
Go
vern
an
ce
Co
nso
lida
ted
ac
co
un
tsA
dd
itio
na
l in
form
atio
nBu
sin
ess
rep
ort
sDiscount voucherThe Company offers a discount voucher to any first named, registered shareholder holding 500 or more ordinary shares as at 1 April each year. The voucher entitles the recipient or their immediate family to a 25% discount against most purchases at any one time of full price merchandise in NEXT Retail stores. It cannot be used in conjunction with any other discount voucher or offer, nor can it be used for the purchase of gift cards, Sale merchandise, electrical goods, non-NEXT branded goods or at any branch of NEXT Clearance or purchases from NEXT Directory. The voucher has no monetary purchase limit and expires on 31 October of the same year. Shareholders holding shares in nominee or PEP/ISA accounts are also eligible, but must request the voucher through their nominee or PEP/ISA account manager who should email [email protected].
Shareholder enquiriesThe Company’s share register is maintained by Equiniti. Please contact them if you have any enquiries about your NEXT plc shareholding including the following matters:
❚ change of name and address.
❚ loss of share certificate, dividend warrant or tax voucher.
❚ if you receive duplicate sets of company mailings as a result of an inconsistency in name or address and wish, if appropriate, to combine accounts.
The Shareview Portfolio service from our registrar, Equiniti, gives you more online information about your NEXT plc shares and other investments. For direct access to information held for you on the share register, including recent balance movements and a daily valuation of investments held in your portfolio, visit www.shareview.co.uk.
For shareholders with disabilities Equiniti provides the following:
❚ if requested future communications produced by them will be sent in the appropriate format.
❚ textphone number 0871 384 2255 for shareholders with hearing difficulties.
❚ hearing loop facilities in their buildings for use by visiting shareholders.
CRESTThe Company’s ordinary shares are available for electronic settlement.
Payments of dividends to mandated accountsShareholders who do not at present have their dividends paid directly into a bank or building society may wish to do so. A mandate form is attached to your dividend warrant and tax voucher or is available to download from the NEXT plc website on www.nextplc.co.uk or from Equiniti, telephone 0871 384 2164.
FORWARD LOOKING STATEMENTSThis Report and Accounts contains “forward looking statements” which are all matters that are not historical facts, including anticipated financial and operational performance, business prospects and similar matters. These forward looking statements are identifiable by words such as “aim”, “anticipate”, “believe”, “budget”, “estimate”, “expect”, “forecast”, “intend”, “plan”, “project” and similar expressions. These forward looking statements reflect NEXT’s current expectations concerning future events and actual results may differ materially from current expectations or historical results. Any such forward looking statements are subject to risks and uncertainties, including but not limited to those risks described in “Risks & Uncertainties” on pages 20 to 22; failure by NEXT to predict accurately customer fashion preferences; decline in the demand for merchandise offered by NEXT; competitive influences; changes in level of store traffic or consumer spending habits; effectiveness of NEXT’s brand awareness and marketing programmes; general economic conditions or a downturn in the retail industry; the inability of NEXT to successfully implement relocation or expansion of existing stores; insufficient consumer interest in NEXT Directory; acts of war or terrorism worldwide; work stoppages, slowdowns or strikes; and changes in financial or equity markets. These forward looking statements do not amount to any representation that they will be achieved as they involve risks and uncertainties and relate to events and depend upon circumstances which may or may not occur in the future and there can be no guarantee of future performance. Undue reliance should not be placed on forward looking statements which speak only as of the date of this document. NEXT does not undertake any obligation to update publicly or revise forward looking statements, whether as a result of new information, future events or otherwise, except to the extent legally required.
This report has been printed on recycled paper.
ANNUAL REPORT AND ACCOUNTS JANUARY 2014
121

23158.04 - Proof 2 - 14/03/2014
ANNUAL REPORT AND ACCOUNTS JANUARY 2014
122

23158.04 - Proof 2 - 14/03/2014

23158.04 - Proof 2 - 14/03/2014
www.next.co.uk
www.nextplc.co.uk