Embed Size (px)
Citation preview

Natural Environment Research CouncilAnnual Report and Accounts 2012-2013


HC 278 London: The Stationery Office £21.25
Presented to Parliament pursuant to Schedule 1 of the Science and Technology Act 1965
Ordered by the House of Commons to be printed on 16 July 2013
Natural Environment Research CouncilAnnual Report and Accounts 2012-2013

© Natural Environment Research Council (2013)
The text of this document (this excludes, where present, the Royal Arms and all departmental and agency logos) may be reproduced free of charge in any format or medium providing that it is reproduced accurately and not in a misleading context.
The material must be acknowledged as Natural Environment Research Council copyright and the document title specified. Where third party material has been identified, permission from the respective copyright holder must be sought.
Any enquiries regarding this publication should be sent to us at [email protected]
You can download this publication from our website at www.nerc.ac.uk
ISBN: 9780102982770
Printed in the UK for The Stationery Office Limited on behalf of the Controller of Her Majesty’s Stationery Office
ID 2555480 07/13
Printed on paper containing 75% recycled fibre content minimum.

The science of our changing world 04The year in review 06Delivering the strategy 11Management commentary 26Annual accounts 35
Contents
Some research reported here may not yet have been peer-reviewed or published. For a list of NERC Council members see page 40. For members of our other committees go to www.nerc.ac.uk.

NERC Annual Report & Accounts 2012-13
04
The science of our changing worldThe Natural Environment Research Council (NERC) is the largest funder of environmental science in the UK. We invest public money in cutting-edge research, training and knowledge transfer in the environmental sciences. Our scientists study and monitor the whole planet, from pole to pole, and from the deep Earth and oceans to the edge of space. We address and respond to critical issues such as environmental hazards, resource security and environmental change. Through collaboration with other science disciplines, with UK business and with policy-makers, we make sure our knowledge and skills support sustainable economic growth and public wellbeing – reducing risks to health, infrastructure, supply chains and our changing environment.
NERC strategic goalsTo deliver world-leading environmental research at the frontiers of knowledge: n Enabling society to respond urgently to global
climate change and the increasing pressures on natural resources.
n Contributing to UK leadership in predicting the regional and local impacts of environmental change over timescales from days to decades.
n Creating and supporting vibrant, integrated research communities.
With our researchers and stakeholders, we develop the priorities that provide a focus for the marine, polar, atmospheric, geological, terrestrial and freshwater science communities. This research is often multidisciplinary and in collaboration with national and international partners.
NERC runs a fleet of research ships and scientific aircraft. We have bases in some of the world’s most hostile environments and we invest in satellite technology to monitor environmental change on a global scale.
NERC is committed to developing UK and international capability across the environmental sciences. We fund centres and universities to carry out research and to train and support a world-class community of environmental scientists.

05
THE SCIENCE OF OUR CHANGING WORLD
The science of our changing worldNERC funds six major environmental research centres:
BAS – British Antarctic Survey
BGS – British Geological Survey
CEH – Centre for Ecology & Hydrology
NOC – National Oceanography Centre
NCAS – National Centre for Atmospheric Science
NCEO – National Centre for Earth Observation
Where their names appear in this report, they have been abbreviated.

NERC Annual Report & Accounts 2012-13
06
This year NERC has been putting the core principles of its emerging new strategic direction into practice.
Central to this is our commitment to working in partnership – with other science disciplines, with businesses and NGOs across sectors, and with policy-makers – not just to deliver applicable and accessible research but also to inform the future direction of our science strategy.
Meanwhile we continue to look at our internal process and structures – our research centres, our central administration and our budget allocations – to make sure that as much of our resource as possible is directed to front-line science.
And through internal reorganisation and better dialogue with stakeholders, we are capturing and demonstrating the diverse impacts of our work, many
The year in reviewrealised in partnership with other funders and other nations.
A natural business partnerNERC has intensified its engagement with industry, policy-makers and third-sector organisations, targeting key sectors where we can make the greatest contribution to the government’s strategy for economic growth. To do this as effectively as possible, we are working closely alongside our fellow research councils and other bodies such as the Technology Strategy Board.
As well as developing strategic partnerships with individual companies and organisations, we are developing multi-partner collaborations to drive innovation and knowledge transfer. We are working with organisations with a common interest in a particular sector, to identify the most pressing challenges in that area and support the science to meet them. One model for collaboration is the Business Club, which we are scoping in five priority areas of food security, risk, infrastructure, natural resources and big data. A club for sustainable agriculture has already been set up, with the Biotechnology and Biological Sciences Research Council, and is now targeting key challenges including water and nutrients.
NERC and its centres CEH and BGS are founder partners in the Environmental Science to Services Partnership which is now operational after a successful pilot phase. The partnership was created to more effectively translate the knowledge, expertise and data of the partners into products and services that meet

07
THE YEAR IN REVIEW
customers’ specific needs, whether commercial tools or improved public services. A range of products and services is already being developed, the first of which will be launched later in the year.
Accessing resources for industry and societyThe discovery of plate tectonics by environmental scientists in the 1950s was fundamental to the development of the fossil-fuel industry and post-war economic growth. Oil and gas still provide 70 per cent of the UK’s energy mix and NERC continues to contribute to its safe and efficient extraction. The Ocean Margins LINK programme developed a new way of analysing field data, which triggered significant investment and employment in Scotland as well as spin-out company, Geospatial Research Ltd. BP used the research outputs to locate up to 36 new wells in the Clair Ridge Project, and to get approval for the £4.5bn development of the field – the largest hydrocarbon resource in the UK continental shelf.
Now NERC is helping the UK secure a sustainable energy supply and meet its low-carbon targets by reducing the risk of exploiting unconventional fuel sources and renewables. The UK Energy Research Centre this year gave evidence on the impacts of shale gas on energy markets while BGS has quantified shale gas reserves and given evidence on its safe extraction, enabling the government to plan the medium-term national energy balance. Our environmental monitoring work underpins the sustainability of new technologies like tidal turbines so they can be licensed and begin operation quickly. This means the green economy can grow, generating jobs and growth while contributing to the UK’s carbon-reduction targets and energy security.
Impact on societyMuch of the work we fund will have profound long-term implications for society. For example, many of our scientists are contributing to the forthcoming fifth report of the United Nations Intergovernmental Panel on Climate Change, expected to be published in 2013 and 2014. This will provide a new synthesis of the science of our changing environment that will improve the ability of governments and businesses to plan for and cope with the consequences of climate change.
At last year’s Rio+20 summit, disaster risk reduction was identified as an area needing urgent attention. NERC research in forecasting and mitigating global geological hazards remains world-leading. The Increasing Resilience to Natural Hazards programme is providing £3m for volcanologists, social scientists and international development experts to work together to improve forecasting and mitigation of the threat from volcanic eruptions in Latin America and the Caribbean.
And, together with the Economic and Social Research Council, NERC is investing £4.6m on increasing resilience through multi-hazard

NERC Annual Report & Accounts 2012-13
08
assessment of earthquake-prone and volcanic regions, an initiative that has strong international stakeholder engagement. Further work is also continuing to improve our understanding of the Eyjafjallajökull volcanic eruption, for new ash and gas forecasting models in development with the Met Office.
Closer to home, NERC scientists are producing knowledge which will help protect UK biodiversity from emerging threats through the Living With Environmental Change (LWEC) Tree Health Initiative, which will involve ecological modellers, plant pathologists and forest ecologists, as well as forestry professionals, the nursery trade and government. By combining expertise from across the research councils, the initiative will fight threats like ash dieback and sudden oak death,
which could transform the UK countryside and cause huge damage to biodiversity.
The NERC-supported Valuing Nature Network helped set up the UK’s first ‘valuing nature’ auction, which is already reducing pollution in Cornwall. South West Water invested £360,000 in the innovative pilot, in which farmers bid for funding for farm improvements to reduce the pollution running off their land and into the River Fowey. This is an excellent example of the widespread benefits of such collaborative arrangements. The company’s investment is a fraction of the savings made on its own costs, the improvements that are financed directly benefit farmers, and the public gains a cleaner environment and potentially lower water bills too.
National capabilityWe continue to invest in the research infrastructure, training and organisational capabilities that will enable us to carry out cutting-edge environmental science for decades to come.
Scientists at NERC’s NCEO led a pioneering study that produced the most accurate estimate ever of how much ice has been lost from Greenland and Antarctica since 1992, by combining data from ten satellites. The researchers demonstrated that melting ice caps have contributed just over a centimetre to global sea levels, amounting to a fifth of all sea-level rise over the 20-year study period. This is the first time data from so many satellites has been combined in this way and the results, estimated to be two to three times more accurate than previous calculations, end decades of uncertainty around ice loss from the poles.
In 2013, BAS’s revolutionary new Halley VI base became fully operational

09
– the latest and most advanced in a long line of facilities on the Brunt Ice Shelf that has played a key role in vital polar discoveries since the 1950s. NERC’s new oceanographic research ship, the RRS Discovery, will be formally launched later this year. Also in 2013, BGS opened its new National Geological Repository, containing the largest archive of geological information in the UK.
Earlier this year, Science Minister David Willetts announced £600m of new capital investment in eight emerging technologies that will propel the UK’s future growth. NERC researchers will benefit in two of these areas. There will be £10m of new investment to strengthen the UK’s already world-leading expertise in marine robotics, and another £13m in big data – developing the computational capability to process and use the enormous quantities of environmental data that are accumulating at an ever-increasing rate.
Discovery scienceNERC is committed to discovery science, which often yields unexpected benefits far beyond the immediate questions it seeks to answer.
In February researchers from NOC found an extraordinary set of hydrothermal vents on the Caribbean seafloor – at almost five kilometres below the surface, the deepest ever discovered. This was not just a scientific breakthrough and a telling sign of the UK’s expertise in deep-sea robotics, it also caught the public’s imagination, receiving extensive coverage on BBC TV and across other media.
Another high-profile project, UK scientists’ effort in late 2012 to drill into the subglacial Lake Ellsworth, was an ambitious initiative to sample an environment that has been cut off
from the outside world under Antarctic ice for perhaps millions of years. Equipment failure unfortunately meant the project could not proceed as planned, but lessons will be learned and will inform future ambitious, large-scale research projects of this type.
NERC-supported scientists also contributed to research showing that a global temperature rise of just 1°C could increase the frequency of hurricanes on the magnitude of 2005’s Katrina between two and seven-fold by the end of the century. This is among the clearest and most compelling evidence yet of climate change’s dangerous implications for extreme weather events, and will help inform planning decisions aimed at mitigating these risks.
Meanwhile our scientists continue to improve and refine how that data is
THE YEAR IN REVIEW

NERC Annual Report & Accounts 2012-13
10
applied. This year’s Lloyd’s Science of Risk Prize in the Natural Hazards category was awarded to Paul Bates, Director of the Cabot Institute and Professor of Hydrology at the University of Bristol. His new approach to high-resolution flood modelling is both faster and cheaper to run than those previously used by the insurance industry. Models based on Professor Bates’s work are already being developed by specialist companies to enable the sector to estimate flood risk at the level of individual properties.
Investing in People and SkillsIn today’s knowledge-based society, economic success relies on the availability of a highly skilled workforce. In particular, the prosperity of the UK’s environmental science sector depends on a healthy supply of people with the right skills to tackle the diverse and dynamic changes we face. This year we updated the Most Wanted report and skills review which identifies the transferable and specialist skills the UK needs for a strong, vibrant economy. The training and funding NERC
provides helps make sure skills needs are met.
Previous NERC PhD students are now applying their knowledge and skills across disciplines to tackle key economic issues, as varied as consulting on safe nuclear-waste disposal, assessing natural hazard risk for reinsurance companies, and managing scarce water resources. Many now also work with universities to design and supervise PhDs that address real-life problems and skills needs.
Focus on efficiencyAnd we are fully aware of the need for efficiencies closer to home. We have achieved savings of more than more than £113m across the whole of RCUK in 2012-13 by implementing the recommendations of the Wakeham Review. We created a new directorate of Innovation and Communications to sharpen our focus on delivering and communicating the impact of our work. Work continues on harmonising our reporting and communication processes across our sister councils, for example with our adoption of the Research Outcomes System and harmonisation of the structures of our websites. This will enable the academic community to apply for funding and tell us about what they are doing with that funding, with as little time spent away from their research as possible.
Meanwhile the new Gateway to Research web platform will this year enable consistent public access – including for research-intensive businesses and policy-makers – to information about the outcomes of all publicly-funded science; one more important step towards maximising the impact of environmental science for society and the economy.
Duncan Wingham Chief Executive 26 June 2013Ed Wallis Chairman

11
Delivering the strategyNERC regularly monitors, evaluates and reports on progress against delivery of our strategy, to inform our decision-making and to demonstrate that we are effectively and efficiently investing public funds to make economic, political and social contributions both in the UK and internationally.
Our planning and performance documents can be found at www.nerc.ac.uk/about/perform/documents.asp
Summary of progress against NERC’s Delivery Plan and ScorecardOur Delivery Plan for the period 2011-15 identifies five actions to deliver our strategy, plus a number of financial targets and priorities. At the end of 2012-13 financial year we have made good progress in delivery. There has been some minor deviation from these priorities, which relate to: a delay in the publication of our new strategy (to inform NERC’s future direction); the decision not to fund two Knowledge Exchange (KE) programmes – in financial services, risk management and valuation; in resource management – to a delay in publishing the ‘Most Wanted II – Postgraduate and Professional Skills Needs in the Environment Sector’ report, due to the decision to concentrate on responsive training; and to slower than expected progress towards the 100 per cent Personal Deal target. However, all off-track objectives have mitigation plans in place to deliver desired outcomes. www.nerc.ac.uk/about/perform/documents.asp
Excellence of research outputsCitation impact is a key measure of the excellence and health of the research base. Independent studies recently commissioned by BIS (www.bis.gov.uk/assets/biscore/science/docs/i/11-p123-international-comparative-performance-uk-research-base-2011.pdf) and NERC (www.nerc.ac.uk/about/perform/documents/citations-study-2012.pdf) demonstrate that NERC remains a world leader. For example:
n UK environmental science is cited more often than that of any other major research country (1.4 times the world average and rising) and delivers value for money, as many other leading countries invest a larger proportion of their GDP in research.
n NERC-funded research performs significantly more strongly, ie, 40 per cent better citations impact than UK Environmental Science as a whole.
n NERC’s own research centres perform strongly, averaging around twice the world mean citation impact.
n NERC-funded scientists are often leaders and partners in international programmes. 53 per cent of NERC-funded scientific publications involve international collaborators.
Summary of evaluations and outputsEvaluation in NERC is a retrospective assessment of performance, used to manage progress in delivering our strategy, inform decision-making and identify evidence of achievements. Six evaluations took place in 2012-13. Completed evaluations are available at: www.nerc.ac.uk/about/perform/evaluation.asp
NERC led a mid-term evaluation of the LWEC partnership on behalf of the LWEC partners. An independent Evaluation Panel, chaired by Sir Brian Bender, reviewed LWEC’s progress to date and considered whether improvements were needed to ensure LWEC’s strategic goal will be delivered and the partners’ aspirations met. The report was published, together with the LWEC partners’ response, in January 2013 and is available at: www.lwec.org.uk/news/2013/january/lwec-evaluation-highlights-successes
As part of our rolling programme of Board self-assessment, NERC’s Council and Science and Innovation Strategy Board conducted self-assessment exercises to help ensure they continued to function effectively and meet their Terms of Reference.
DELIVERING THE STRATEGY

NERC Annual Report & Accounts 2012-13
12
NERC Annual Report & Accounts 2012-13
12
External fundingFunding from outside NERC meets the costs of commissioned and co-funded research carried out by NERC’s centres for government departments, other public bodies, industry, the European Commission, and international and overseas organisations. This is a significant funding stream for many of NERC’s centres and an important means of transferring knowledge to users.
StaffNERC embraces diversity and equality. We have introduced a wide range of measures to ensure individuals can contribute their skills, knowledge and experience to the organisation while maintaining a work/life balance.
We actively encourage parents to return to work by providing flexible working arrangements. We continue to monitor all recruitment exercises to ensure demographically fair representation, and all promotion rounds are scrutinised for fairness.
In addition we promote personal development, embracing initiatives such as sabbaticals, secondments, further education and a range of short courses. By investing in individuals, we continue to foster potential across the organisation and ensure that NERC has the necessary skills, knowledge and experience to meet future challenges
Information assurance and security The government’s Security Policy Framework requires departments to submit an annual report to Cabinet Office. NERC has put in place policies and procedures to minimise the risk of data loss, and reports annually on information security.
In 2012-13, NERC introduced revised information security related policies and procedures. Staff awareness of information security has been raised through the rollout of mandatory training and personal responsibility statements. Advanced attacker activity on the network was detected during the year. NERC is working with a company assured under the HMG Cyber Incident Response scheme to respond and put protective measures in place to reduce the risk of further attacks.
More information:David Hyett, [email protected]
Openness and transparency NERC is subject to the Freedom of Information Act 2000 and also the Environmental Information Regulations 2004, which provide broadly similar access rights to the Act but relate specifically to information about the environment. We work with the other research councils to ensure a consistent approach to open-access legislation on key business activities. During 2012 we answered 54 requests for information specifically under the legislation, compared to 37 the previous year. The requests covered a wide range of subjects, from business policy to research outputs. We answered all requests, some of which were complex and wide ranging, within the statutory time limit or within an agreed extension.
Much of our information is readily available without a specific Freedom of Information Act request. For details see our publication scheme at foi.nerc.ac.uk.
More information: David Hyett, [email protected]
Categories of requests made under the Freedom of Information Act/Environmental Information Regulations in 2012
Research policy and operation 10
Contracts 2
Business policy and operations 25
Research outputs 13
Funding applications 2
Personal information 2
13
DELIVERING THE STRATEGY
Health and safetyThis report covers the financial year from 1 April 2012 to 31 March 2013. In this period there were three reportable events affecting NERC staff under the Reporting of Injuries, Disease and Dangerous Occurrences Regulations 1995 (RIDDOR), compared to six in 2011-12. The total number of injuries and work-related ill-health reported to staff within NERC and its associated research institutes following our safety management system was 201 compared to 195 the previous year.
Much NERC work is done outside the UK; there were no occurrences outside the UK that would have been reportable had they occurred in the UK. There were no occurrences on ships reportable to the Marine Accident Investigation Branch (MAIB) under maritime law. In the previous three years there has been an average of six such occurrences a year.
The total number of 201 work-related accidents and ill health cases reported across NERC in 2012-2013 was a marginal increase from the previous year’s total of 195. This year’s total includes 32 reported cases of work-related ill
10
20
30
40
2011-12
2012-13
Oth
er
Wor
k-re
lated
illne
ss (o
ther
than
RSI
)
Expo
sed
to n
on-io
nising
radi
atio
n
Cont
act w
ith e
lectri
city
Phys
ically
ass
aulte
d
Inju
ry in
volvi
ng a
mov
ing v
ehicl
e (n
on-R
TA)
Trap
ped
by so
met
hing
colla
psing
Cont
act w
ith h
arm
ful b
iolo
gical
agen
t
Cont
act w
ith m
achin
ery
Invo
lved
in ro
ad tr
affic
acc
iden
t
Inju
red
by a
han
d to
ol
Inju
red
by a
n an
imal
Expo
sed
to h
arm
ful c
hem
ical a
gent
Fall f
rom
heig
ht
Expo
sed
to h
ot o
r col
d
Inju
red
whil
e lift
ing o
r han
dling
Slip,
trip
or fa
ll on
sam
e lev
el
Collid
ed w
ith so
met
hing
fixed
or s
tatio
nary
Hit
by a
mov
ing, f
lying
or f
alling
obj
ect
Repe
titive
stra
in inj
ury (
inclu
ding
from
DSE
)
Cut o
r sta
bbed
with
a sh
arp
objec
t
Expo
sed
to fi
re
health, almost exclusively musculoskeletal conditions from repetitive work.
A breakdown of work-related injuries and ill health by type for the financial year 2012-13 is presented above together with figures from the previous financial year for comparison. In 2012-2013 the top type of work-related injury or ill health was slips, trips and falls on same level at 39. The second most common type was repetitive strain injury (RSI) at 31, a number which continues to rise and is a cause for concern although it may reflect changing patterns of work with more, or more intensive, Display Screen Equipment use. Manual handling is the third most common type of injury or ill health at 26. RSI conditions and manual handling may together be considered as ergonomically related conditions and comprise some 29 per cent of all our reported work-related injuries and ill health.
In 2012-2013 we reported 1.15 incidents or near misses per reported accident compared with 1.14 per reported accident the previous year. It is hoped that the introduction of an electronic recording system will lead to further improvements in this ratio by making reporting easier and quicker.
Comparison of accidents

NERC Annual Report & Accounts 2012-13
14
Responsive mode grant applications and success rates
2011-12 2012-13
Number of applications 1,220 853
Number of awards 247 225
Total £k 49,308 61,634
% success rate 20.2 26.4
Success rates by gender
Men Women
Number of applications 1,076 246
Number of successful applications 344 70
% successful applicants 32 28
Success rates for fellowships by gender
Men Women
Number of applications 86 72
Number of successful applications 15 6
% successful applications 17 8
Staff, students and fellows
2010-11 2011-12 2012-13
Directly employed staff 2,623 2,509 2,365
Staff in research organisations 1 1,864 1,932 1,762
Fellows 88 98 96
PhD 2 1,068 1,065 1,043
1. Headcount of all academic and research staff named on research grants that were active at the end of the financial year.
2. PhD data is based on number of students directly funded by NERC. These do not include studentships funded through cross-council programmes where another research council administers the award. PhD data have been recast following improvements to reporting systems, which now capture students funded through a wider variety of NERC schemes. The figures for 12-13 are lower than previous years as not all students have yet been entered onto the system.
Grants, fellowships and studentshipsWe continue to monitor the success rates of grant and fellowship applications to ensure that we do not discriminate against any applicants. Trend data have shown that the proportion of women applying for research grants, and their subsequent success rate, remains relatively constant. However, the number of women in the system remains low.
Although there are yearly fluctuations, on average 50 per cent of studentships are awarded to females. The current PhD stock is 48 per cent female.
In recognition of NERC’s own role in promoting and leading cultural change in relation to equalities and diversity, we will be reviewing the overall effectiveness of our approaches to funding.
15
Sustainability Report – 2012-13
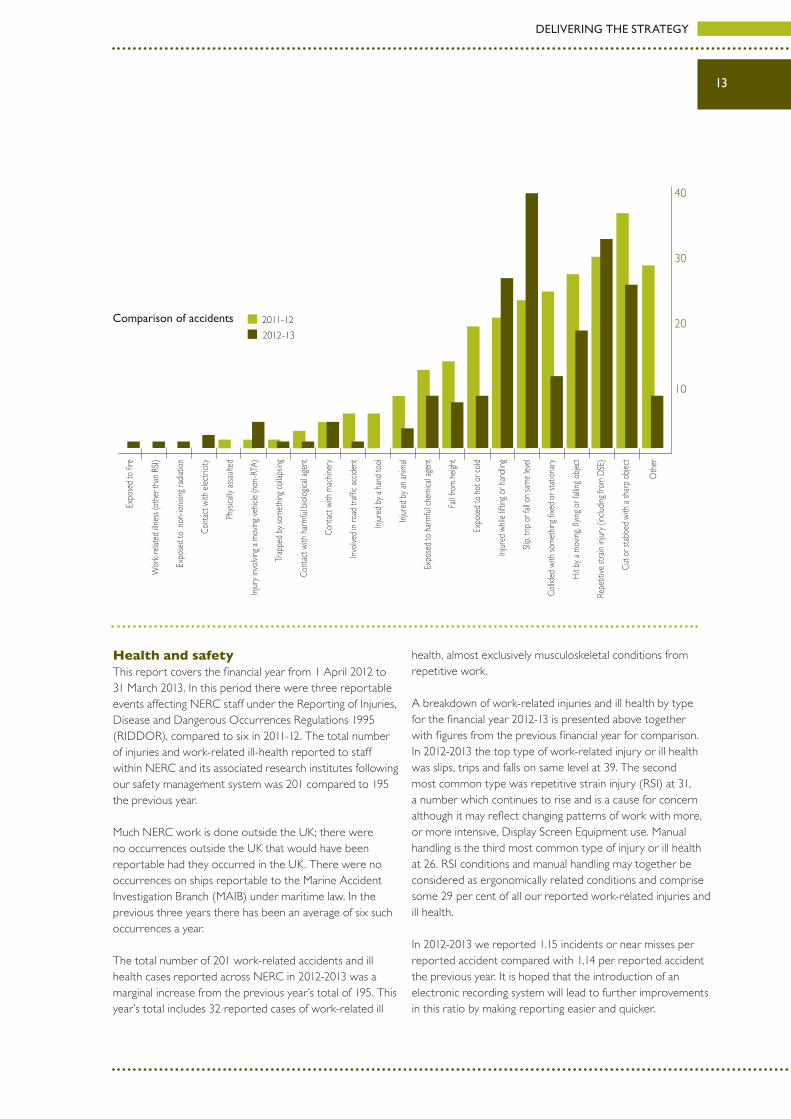
OverviewNERC continues to promote a sustainability agenda throughout its scientific operations, completing its fifth consecutive year of reporting energy data. In doing so, it has gained the Carbon Trust Standard, and is well placed to comply with the requirements of the Carbon Reduction Commitment Energy Efficiency Scheme and HM Treasury’s Public Sector Sustainability Reporting. NERC also considers biodiversity to be important and actively encourages its promotion throughout its estate in accordance with its own environmental policy.
Summary of activityNERC has undertaken a variety of sustainability projects across its estate during the reporting period, including PV installations, roll out of LED lighting, control of air conditioning usage and improved recycling. NERC has also made excellent progress towards greening ICT. A range
of server room improvements have been made across the Estate with BREEAM ‘Excellent’ achieved for the BGS Keyworth Server Room. Future plans will drive further energy efficiencies through improved housekeeping and further awareness campaigns.
NERC is committed to participating in the Carbon Reduction Commitment Energy Efficiency Scheme which began in 2010. Although NERC is committed to reducing its CRC emissions, early indications for 2012-13 show that NERC has not been as successful as the previous year. The data needs to be analysed to determine the reasons for this.
GovernanceAll NERC Research Centres have obtained ISO 14001 for Environmental Management and uses this system to record all sustainability data. The Carbon Reduction Commitment Energy Scheme audits the data provided to the Environment Agency and the Carbon Trust Standard audits the data provided every two years.
Greenhouse gas emissions 2011-12 2012-13
Non-financial indicators Total gross emissions 13.1 15.6(1,000 tCO2e) Total net emissions (less green tariff ) 10.8 12.7 Gross emissions Scope 1 (direct) (fleet vehicles) 0.2 Gross emissions Scope 2 & 3 (indirect) (utilities + all travel) 15.4
Related energy Electricity: non-renewable 18.4 18.1consumption (million kWh) Electricity: renewable 0.1 0.1 Gas 17.5 21.1 Total Energy Consumption 36.0 39.3
Financial indicators (£m) Expenditure on energy 2.1 2.2 Expenditure on official business travel (UK only) 2.2 1.8
PERFORMANCE COMMENTARY (INCLUDING MEASURES)Consumption of electricity has decreased slightly this year. Consumption of gas is considerably higher even allowing for the long, cold winter. The scale of the difference means that both the 2011-12 and 2012-13 data needs re-examination. Despite the apparent increase in gas consumption, the increase in expenditure on energy is minimal. The on-going target is to reduce the emissions from NERC operations which will be achieved by continual improvements in our reporting system and an investigation into those sites that appear to have a higher consumption. Significant savings have been made on official business travel within the UK.
CONTROLLABLE IMPACTS COMMENTARYThe main impacts from NERC in the UK result from the electricity, gas and other fuels that are used for the specialist estate and official business travel. NERC is continually working to reduce the direct impacts it has through energy efficiency strategies.
OVERVIEW OF INFLUENCED IMPACTS NERC continues to promote a sustainability agenda throughout its scientific operations and is committed to reducing the overall carbon footprint.
DELIVERING THE STRATEGY

NERC Annual Report & Accounts 2012-13
16
Waste 2011-12 2012-13
Non-financial indicators Total waste 598 493(tonnes) Hazardous waste Total 0 1 Non-hazardous waste Landfill 298 138 Reused/recycled 287 304 Incinerated without energy recovery 6 51
Financial indicators Total disposal cost 62.7 67.3(£k) Hazardous waste 0.7 2.7 Non-hazardous waste Landfill 25.2 23.0 Reused/recycled 18.1 31.0 Incinerated without energy recovery 3.3 6.6
PERFORMANCE COMMENTARY (INCLUDING MEASURES)The data indicates that NERC has made a significant reduction in the amount of overall waste generated. NERC has also increased the amount of recycled waste. However, this has had an impact on cost.
CONTROLLABLE IMPACTS COMMENTARYNERC continues to monitor this area both at site level and in terms of data reporting.
OVERVIEW OF INFLUENCED IMPACTS NERC has a number of environmental initiatives in place and continually undertakes a variety of sustainability projects across the Estate.
Finite resource consumption 2011-12 2012-13
Non-financial indicators Water consumption per FTE 16 18 (‘000m3) (non-office estate) Supplied 39.0 45.8 Total consumption 39.0 45.8
Financial indicators (£k) Water supply costs (non-office estate) 103.0 123.0
PERFORMANCE COMMENTARY (INCLUDING MEASURES)The figures indicate that water consumption has increased. The reasons for this are being investigated.
CONTROLLABLE IMPACTS COMMENTARYAs a consequence of the increased consumption, costs have increased in this category.
OVERVIEW OF INFLUENCED IMPACTS NERC will continue to monitor consumption and costs and include water in its environmental initiatives for the coming year.
Royalties and licence income by research centres (£k)
2010-11 2011-12 2012-13
British Antarctic Survey 5 5 88
British Geological Survey 1,941 1,722 1,776
Centre for Ecology & Hydrology 502 369 373
National Oceanography Centre 93 - -
Swindon Office - 16 10
Total 2,541 2,112 2,247

17
DELIVERING THE STRATEGY
Trends in annual capital investment (£m) 2010-11 2011-12 2012-13
Land, buildings and Antarctic stations (i) 14.7 13.5 -2.0
Plant and equipment (i) & (ii) 12.4 4.6 12.6
Transport equipment (ii) & (iii) 15.3 37.8 23.4
RCUK Shared Services Centre (iv) 1.3 - -
Net Book Value of fixed assets disposed (v) -15.2 -3.3 -9.8
Capital Grants (vi) 22.1 4.7 4.8
Total 50.6 57.3 29.0 Notes: (i) In 2012-13 £2.1m of Land and Building Assets in the Course of Construction were
capitalised as Plant and Equipment as this better reflected their useful life. As capitalisations are treated as negative additions this results in a negative overall investment figure.
(ii) Following migration to SSC, some Plant and Equipment assets were reclassified as Transport Equipment, the original investment in these assets has been left in Plant and Equipment.
(iii) 2012-13 figures include £21.6m for the RRS Discovery replacement vessel (2011-12 £36.7m).
(iv) 2010-11 figures include £11.1m for RCUK SSC Ltd shares purchased during the year (2008-09 £1.6m) less the £11.1m received from SSC for NERC’s share of the SSC asset.
(v) From 2007-08 all disposals of fixed assets classified as capital, these figures have been restated to reflect BIS budgetary treatment.
(vi) 2010-11 figures include £2m paid to RCUK SSC Ltd on behalf of BIS.
Trends in research council income from the private sector (£m)
2010-11 2011-12 2012-13
UK Private Sector 4.5 4.3 6.2
Overseas Private Sector 8.3 9.4 9.0
Total 12.8 13.7 15.2
Total at 2012-13 prices 13.5 14.1 15.2
Note: UK figures include Integrated Ocean Drilling Program income to BGS.
Value of earned income (contract research) by research centres (£k)
2010-11 2011-12 2012-13
British Antartic Survey 2,465 2,793 2,641
British Geological Survey 16,651 14,748 15,326
Centre for Ecology & Hydrology 9,882 8,610 10,756
National Oceanography Centre 6,286 6,948 5,179
Swindon Office 13,331 11,963 14,297
Total 48,615 45,062 48,199
Figures do not include other funding received from BIS.

NERC Annual Report & Accounts 2012-13
18
Research Programmes Aerosols & Clouds 1.073 Algal Bioenergy Network 0.045 Analytical Science & Technology PhD Studentships 0.185 Arctic Programme 3.907 BioDIVERSA 0.373 Biodiversity & Ecosystem Service Sustainability 2.302 Carbon Capture & Storage 0.506 Changing Water Cycle 2.748 Coastal Sediment Systems 0.808 Managing RP Investments 0.371 Earth System Modelling 0.060 Earth System Modelling Strategy Implementation 0.377 Ecology and Hydrology Funding Initiative 0.316 Ecosystem Services for Poverty Alleviation 0.957 Environment & Human Health 0.076 Environmental & Social Ecology of Human Infectious Diseases (ESEI) 0.596 Environmental Exposure & Health Initiative (EEHI) 0.789 Environmental Nanotechnology 0.680 Greenhouse Gas Emissions & Feedbacks 0.130 Human Modified Tropical Forests 0.001 Ice Sheet Stability 0.238 Increasing Resilience to Natural Hazards in Earthquake-prone & Volcanic Regions 0.354 Insect Pollinators Initiative 0.451 International Polar Year 0.048 Joint Weather & Climate Research Programme 0.333 Land Based Renewables 0.590 Long Term Co-evolution of Life & the Planet 1.218 Macronutrient Cycles 1.848 Marine Ecosystems 0.008 Marine Renewable Energy 1.159 Mathematics and Infomatics for ‘omics 0.102 Mineral Resources 0.130 Networks of Sensors 1.553 Next Generation Unmanned Aerial Vehicles 0.772 Next Generation Weather & Climate Prediction 0.767 Ocean Acidification 3.811 Ocean Shelf-Edge Exchange 1.364 Minor Initiatives 0.695 Probability, Uncertainty & Risk in the Environment 0.616 Quantifying and Understanding the Earth System Programme 0.018 Quantifying Uncertainty in Predictions of Climate Change & Climate Impacts 0.382 Radioactivity & the Environment 0.031 RAPIDWATCH 1.833
How we spent the science budget (£m)*
Resource Recovery from Waste 0.009 Shelf Sea Biogeochemistry -0.161 South Asian Monsoon 0.005 Storm Risk Mitigation through Improved Prediction & Impact Modelling 1.606 Strategic Ocean Funding Initiative 0.042 Sustainable Marine Bioresources 0.023 Taxonomy & Systematics 0.100 Technology Clusters 0.002 Technology Proof of Concept 0.256 Theme Leaders 1.323 UK Droughts 0.008 UK Energy Research Centre 0.264 UK Integrated Ocean Drilling Programme 0.039 UK Integrated Ocean Drilling Programme Phase II 1.195 Understanding & Predicting the Ocean Surface Boundary Layer 0.966 Urban Atmospheric Science 0.487 Valuation Biodiversity & Natural Resources 0.137 Virtual Observatory 0.167 Other Programmes Earth Observation Programmes 0.469 Living with Environmental Change 0.630 Knowledge Exchange 9.475 Research Centres Marine Biological Association 0.594 National Centre for Atmospheric Science 8.875 National Centre for Earth Observation 6.494 Plymouth Marine Laboratory 4.148 Scottish Association for Marine Science 2.022 Sea Mammal Research Unit 1.042 Sir Alister Hardy Foundation for Ocean Science 0.404 National Capability – Swindon Office Airborne Research & Survey Facility 1.088 Facility for Airborne Atmospheric Measurements 1.695 High Performance Computing 2.339 International Activities 1.945 IODP Subscription 3.602 Other National Capability Programmes 0.153 Services and Facilities 9.005 National Capability Capital 0.015 Responsive Mode Grants Antarctic Funding Initiative 2.100Consortium Grants 9.885

19
DELIVERING THE STRATEGY
Fellowships 8.343New Investigator 1.123Small Grants 2.235Standard Grants 50.717 Responsive Mode Training Studentships 20.071 British Antarctic Survey National Capability 34.201Knowledge Exchange 1.031Research Programmes 2.675Administration Costs 0.823Halley 6 0.651Core Capital 3.293 British Geological Survey National Capability 15.770Knowledge Exchange 2.681Research Programmes 1.428Administration Costs 0.887Core Capital 0.829 Centre for Ecology & Hydrology National Capability 13.364Knowledge Exchange 0.687Research Programmes 1.530Administration Costs 0.985Core Capital 0.770
CEH Transition and Integration 0.657 National Oceanography Centre National Capability 22.157Knowledge Exchange 0.271Research Programmes 2.327Administration Costs 0.935RRS Discovery Replacement Ship 21.643Core Capital 6.471Capital Income -0.208 Other Infrastructure Corporate Activities (including Swindon Office) 5.166Swindon Office Administration Costs 15.935Shared Services Centre Costs 7.180Corporate Administration Income -4.214Corporate Capital 0.236
Corporate Restructuring 7.845 Private Funding Initiative Scored Outside DEL -1.535Depreciation 28.672Amortisation 0.059Loss in joint venture 2.278Impairment 5.059Asset Disposals -9.776 Total NERC expenditure 382.321 Comprises: Resource ** 358.397Capital 23.924
Capital Expenditure in italics * This table shows how NERC has spent the BIS science
allocation. All figures are net of other income received.
** Resource figure differs from the net expenditure for the year by -£0.834m, which is broken down as follows:
£mOther funding received from BIS (recorded as f inancing) 0.120Capital Income -0.208AME change in provisions -1.046AME Impairment of IXO Investment 0.300
-0.834

NERC Annual Report & Accounts 2012-13
20
Grants awarded in 2012-13
Aberystwyth University 2 138 2 367 1 200 1 189 1 144 Bangor University 1 375 1 182 3 1194 1 299 1 287 Birkbeck College 1 20 Bournemouth University 1 72 1 69British Trust for Ornithology 3 211 Brunel University 1 173 1 75Cardiff University 5 946 1 57 1 144 1 71CEFAS 2 281 Cranfield University 3 1293 1 17 1 72 Durham University 7 2318 1 370 4 1131 1 236 1 359 Edinburgh Napier University 1 72 Heriot-Watt University 1 158 Imperial College London 1 70 6 1972 6 1366 1 281 1 518 1 709 Keele University 1 271 King’s College London 1 133 1 81 Lancaster University 2 680 8 2346 1 359 2 139London School of Hygiene and Tropical Medicine 1 57 Loughborough University 1 151 1 252 1 72 Manchester Metropolitan University 1 43 Marine Biological Association 1 57 2 339 Met Office 1 56 NERC British Antarctic Survey 2 133 11 4015 1 69 4 1745 1 248 1 431 NERC British Geological Survey 1 81 1 17 2 507 5 655 1 144 NERC Centre for Ecology & Hydrology 2 577 1 379 10 4981 1 431 National Museums of Scotland 1 313 National Oceanography Centre 1 9 8 2400 6 1625 1 17 1 431 Newcastle University 2 130 6 1599 5 377 1 287 2 170Northumbria University 1 58 1 33 Open University 3 1521 1 7 1 293 1 215 Overseas Development Institute 2 607 Plymouth Marine Laboratory 1 61 1 357 3 737 1 2 1 144 Queen Mary, University of London 1 52 2 620 3 1878 1 79 2 160Queen’s University of Belfast 2 69 1 264 RSPB 2 24 Rothamsted Research 2 106 1 240 Royal Holloway, Univ of London 1 12 2 296 1 236 Royal Veterinary College 1 420 SAHFOS 1 15 SRUC 1 176 STFC - Laboratories 1 55 Scottish Association for Marine Science 2 602 2 493 2 212 1 215 Scottish Universities Env Research Centre 1 72 Swansea University 2 525 1 41 1 144
RESEARCH GRANTS RESEARCH FELLOWS RESEARCH STUDENTSHIPS
Responsive Research Programmes Knowledge Exchange Responsive Research Programmes
Small Grants Standard Grants Consortium Grants Research Programmes Post-doc Fellow Advanced Fellow Doctoral Training Grants Doctoral Training Grants
Number Value £k Number Value £k Number Value £k Number Value £k Number Value £k Number Value £k Number Value £k Number Value £k Number Value £k

21
Aberystwyth University 2 138 2 367 1 200 1 189 1 144 Bangor University 1 375 1 182 3 1194 1 299 1 287 Birkbeck College 1 20 Bournemouth University 1 72 1 69British Trust for Ornithology 3 211 Brunel University 1 173 1 75Cardiff University 5 946 1 57 1 144 1 71CEFAS 2 281 Cranfield University 3 1293 1 17 1 72 Durham University 7 2318 1 370 4 1131 1 236 1 359 Edinburgh Napier University 1 72 Heriot-Watt University 1 158 Imperial College London 1 70 6 1972 6 1366 1 281 1 518 1 709 Keele University 1 271 King’s College London 1 133 1 81 Lancaster University 2 680 8 2346 1 359 2 139London School of Hygiene and Tropical Medicine 1 57 Loughborough University 1 151 1 252 1 72 Manchester Metropolitan University 1 43 Marine Biological Association 1 57 2 339 Met Office 1 56 NERC British Antarctic Survey 2 133 11 4015 1 69 4 1745 1 248 1 431 NERC British Geological Survey 1 81 1 17 2 507 5 655 1 144 NERC Centre for Ecology & Hydrology 2 577 1 379 10 4981 1 431 National Museums of Scotland 1 313 National Oceanography Centre 1 9 8 2400 6 1625 1 17 1 431 Newcastle University 2 130 6 1599 5 377 1 287 2 170Northumbria University 1 58 1 33 Open University 3 1521 1 7 1 293 1 215 Overseas Development Institute 2 607 Plymouth Marine Laboratory 1 61 1 357 3 737 1 2 1 144 Queen Mary, University of London 1 52 2 620 3 1878 1 79 2 160Queen’s University of Belfast 2 69 1 264 RSPB 2 24 Rothamsted Research 2 106 1 240 Royal Holloway, Univ of London 1 12 2 296 1 236 Royal Veterinary College 1 420 SAHFOS 1 15 SRUC 1 176 STFC - Laboratories 1 55 Scottish Association for Marine Science 2 602 2 493 2 212 1 215 Scottish Universities Env Research Centre 1 72 Swansea University 2 525 1 41 1 144
RESEARCH GRANTS RESEARCH FELLOWS RESEARCH STUDENTSHIPS
Responsive Research Programmes Knowledge Exchange Responsive Research Programmes
Small Grants Standard Grants Consortium Grants Research Programmes Post-doc Fellow Advanced Fellow Doctoral Training Grants Doctoral Training Grants
Number Value £k Number Value £k Number Value £k Number Value £k Number Value £k Number Value £k Number Value £k Number Value £k Number Value £k
DELIVERING THE STRATEGY

NERC Annual Report & Accounts 2012-13
22
Grants awarded in 2012-13 cont.
The Natural History Museum 2 294 The University of Manchester 2 144 11 3928 4 878 1 71 1 723 University College London 6 2306 5 1257 1 492 1 315 2 160University of Aberdeen 2 735 4 568 1 247 1 431 1 84University of Bath 2 251 1 72 University of Birmingham 1 73 4 1198 3 104 1 287 3 209University of Brighton 1 72 University of Bristol 18 3481 5 2722 2 32 3 800 1 1005 2 139University of Cambridge 14 3685 1 835 5 1276 2 540 1 646 University of Dundee 1 397 1 228 University of East Anglia 8 2703 1 121 5 2054 1 14 1 646 2 148University of Edinburgh 2 94 9 2379 1 272 5 2012 1 101 1 299 1 1005 1 68University of Essex 1 395 2 899 1 104 1 72 University of Exeter 1 80 7 2744 5 1888 2 17 1 228 1 574 1 68University of Glasgow 1 413 2 798 1 533 1 215 University of Gloucestershire 1 42 University of Greenwich 1 19 University of Hertfordshire 1 72 University of Hull 1 65 2 246 2 188 1 596 University of Kent 1 16 1 232 University of Leeds 14 3764 8 1418 3 297 1 586 2 1082 2 139University of Leicester 1 50 3 881 1 490 2 348 1 287 1 73University of Liverpool 1 34 4 1368 1 334 3 392 1 431 University of Nottingham 4 810 1 51 1 72 University of Oxford 2 71 14 4836 6 1125 1 299 1 1082 1 87University of Plymouth 2 99 2 525 3 76 1 215 University of Portsmouth 1 393 1 72 University of Reading 10 2134 4 1029 1 47 2 869 University of Salford 1 72 University of Sheffield 1 52 4 895 1 681 5 1536 2 136 1 723 2 146University of Southampton 2 129 9 3163 1 254 10 1914 1 430 1 503 University of St Andrews 2 107 5 1953 2 635 1 342 1 287 University of Stirling 1 50 1 632 1 62 University of Strathclyde 1 274 1 144 1 68University of Surrey 1 255 1 68University of Sussex 1 50 1 408 1 114 1 72 1 72University of Ulster 1 34 1 232 University of Warwick 1 51 2 733 1 215 University of York 1 78 6 982 6 1035 1 503 2 143University of the Highlands and Islands 1 15
Grand Total 39 2119 235 67210 22 7267 186 47504 26 1846 14 3802 7 3429 55 17961 32 2354
RESEARCH GRANTS RESEARCH FELLOWS RESEARCH STUDENTSHIPS
Responsive Research Programmes Knowledge Exchange Responsive Research Programmes
Small Grants Standard Grants Consortium Grants Research Programmes Post-doc Fellow Advanced Fellow Doctoral Training Grants Doctoral Training Grants
Number Value £k Number Value £k Number Value £k Number Value £k Number Value £k Number Value £k Number Value £k Number Value £k Number Value £k

23
The Natural History Museum 2 294 The University of Manchester 2 144 11 3928 4 878 1 71 1 723 University College London 6 2306 5 1257 1 492 1 315 2 160University of Aberdeen 2 735 4 568 1 247 1 431 1 84University of Bath 2 251 1 72 University of Birmingham 1 73 4 1198 3 104 1 287 3 209University of Brighton 1 72 University of Bristol 18 3481 5 2722 2 32 3 800 1 1005 2 139University of Cambridge 14 3685 1 835 5 1276 2 540 1 646 University of Dundee 1 397 1 228 University of East Anglia 8 2703 1 121 5 2054 1 14 1 646 2 148University of Edinburgh 2 94 9 2379 1 272 5 2012 1 101 1 299 1 1005 1 68University of Essex 1 395 2 899 1 104 1 72 University of Exeter 1 80 7 2744 5 1888 2 17 1 228 1 574 1 68University of Glasgow 1 413 2 798 1 533 1 215 University of Gloucestershire 1 42 University of Greenwich 1 19 University of Hertfordshire 1 72 University of Hull 1 65 2 246 2 188 1 596 University of Kent 1 16 1 232 University of Leeds 14 3764 8 1418 3 297 1 586 2 1082 2 139University of Leicester 1 50 3 881 1 490 2 348 1 287 1 73University of Liverpool 1 34 4 1368 1 334 3 392 1 431 University of Nottingham 4 810 1 51 1 72 University of Oxford 2 71 14 4836 6 1125 1 299 1 1082 1 87University of Plymouth 2 99 2 525 3 76 1 215 University of Portsmouth 1 393 1 72 University of Reading 10 2134 4 1029 1 47 2 869 University of Salford 1 72 University of Sheffield 1 52 4 895 1 681 5 1536 2 136 1 723 2 146University of Southampton 2 129 9 3163 1 254 10 1914 1 430 1 503 University of St Andrews 2 107 5 1953 2 635 1 342 1 287 University of Stirling 1 50 1 632 1 62 University of Strathclyde 1 274 1 144 1 68University of Surrey 1 255 1 68University of Sussex 1 50 1 408 1 114 1 72 1 72University of Ulster 1 34 1 232 University of Warwick 1 51 2 733 1 215 University of York 1 78 6 982 6 1035 1 503 2 143University of the Highlands and Islands 1 15
Grand Total 39 2119 235 67210 22 7267 186 47504 26 1846 14 3802 7 3429 55 17961 32 2354
RESEARCH GRANTS RESEARCH FELLOWS RESEARCH STUDENTSHIPS
Responsive Research Programmes Knowledge Exchange Responsive Research Programmes
Small Grants Standard Grants Consortium Grants Research Programmes Post-doc Fellow Advanced Fellow Doctoral Training Grants Doctoral Training Grants
Number Value £k Number Value £k Number Value £k Number Value £k Number Value £k Number Value £k Number Value £k Number Value £k Number Value £k
DELIVERING THE STRATEGY
All entries and totals show the amounts awarded rounded to the nearest £k. However manual addition of individual column entries may result in rounding differences compared to the totals.

NERC Annual Report & Accounts 2012-13
24
Science budget expenditure in research organisations
Aberystwyth University 535 50 58 35 678 African Collaborative Centre for Earth Sciences 28 28 Bangladesh Uni of Engineering and Technology 244 244 Bangor University 224 1,143 258 634 15 60 8 2,342 BC3 Basque Centre for Climate Change 33 33 Biotechnology & Biological Sciences Research Council 1,655 170 1,825 Birkbeck College 172 2 174 Bolivian Natura Foundation 28 28 Bournemouth University 96 10 10 116 Brunel University 35 22 10 68 BTO Services Ltd (British Trust For Ornithology) 62 62 Cardiff University 81 1,087 173 666 42 115 2,163 CEFAS 171 171 City University 5 5 Conservation International Foundation 83 83 Consorcio para el Desarrollo Sostenible 3 3 Cranfield University 29 403 69 502 Daphne Jackson Trust 122 122 Defra 200 200 Diamond Light Source Ltd 8 8 East China Normal University 4 4 Economic & Social Research Council 423 423 Edge Hill University College 43 43 Edinburgh Napier University 5 17 22 Engineering & Physical Sciences Research 493 36 1,500 2,029 Glasgow Caledonian University 1 1 Heriot-Watt University 19 414 433 HR Wallingford Ltd 90 90 Imperial College London 667 1,244 820 5,045 324 145 8,245 Indian Institute of Technology Roorkee 45 45 Inst for European Environmental Policy 3 3 Institute of Development Studies 290 290 Int Food Policy Research Inst 30 30 International Center for Tropical Agriculture 189 189 International Livestock Research Institute 134 134 International Union for Conservation of Nature 30 30 Isaac Newton Institute for Mathematical Sciences 45 45 Keele University 130 20 47 197 King’s College London 47 132 370 159 708 Kingston University 48 48 Lancaster University 450 286 684 59 99 48 1,626 Liverpool John Moores University 20 20 London School of Economics & Political Science 86 86 London School of Hygiene & Tropical Medicine 15 168 14 198 Loughborough University 323 13 267 24 19 647 Makerere University 31 31 Manchester Metropolitan University 4 35 2 41 Marine Biological Association 82 244 594 920 Medical Research Council 645 645 Met Office 2 952 954 National Museums of Scotland 56 56 Natural History Museum 702 45 746 North Wyke Research 67 304 371 Northumbria University 142 5 147 Overseas Development Institute 89 89 Oxford Brookes University 2 2 Plymouth Marine Laboratory 217 210 1,032 4,897 6,356 Queen Mary University of London 90 589 190 404 91 1,363 Queen’s University Belfast 116 118 61 295 Royal Botanic Garden Edinburgh 118 85 204 Royal Botanic Gardens Kew 367 367 Royal Holloway, University of London 140 436 175 198 86 1,036 Royal Veterinary College 72 18 90 Royal Society For The Protection Of Birds 6 6 Scottish Association for Marine Science 605 112 891 115 2,291 4,013 Science & Technology Facilities Council 40 73 3,628 3,742
Expenditure £k Responsive Awards Research Knowledge Research Total Programme Exchange# Programme Contracts Fellowships Grants Students Grants Students
25
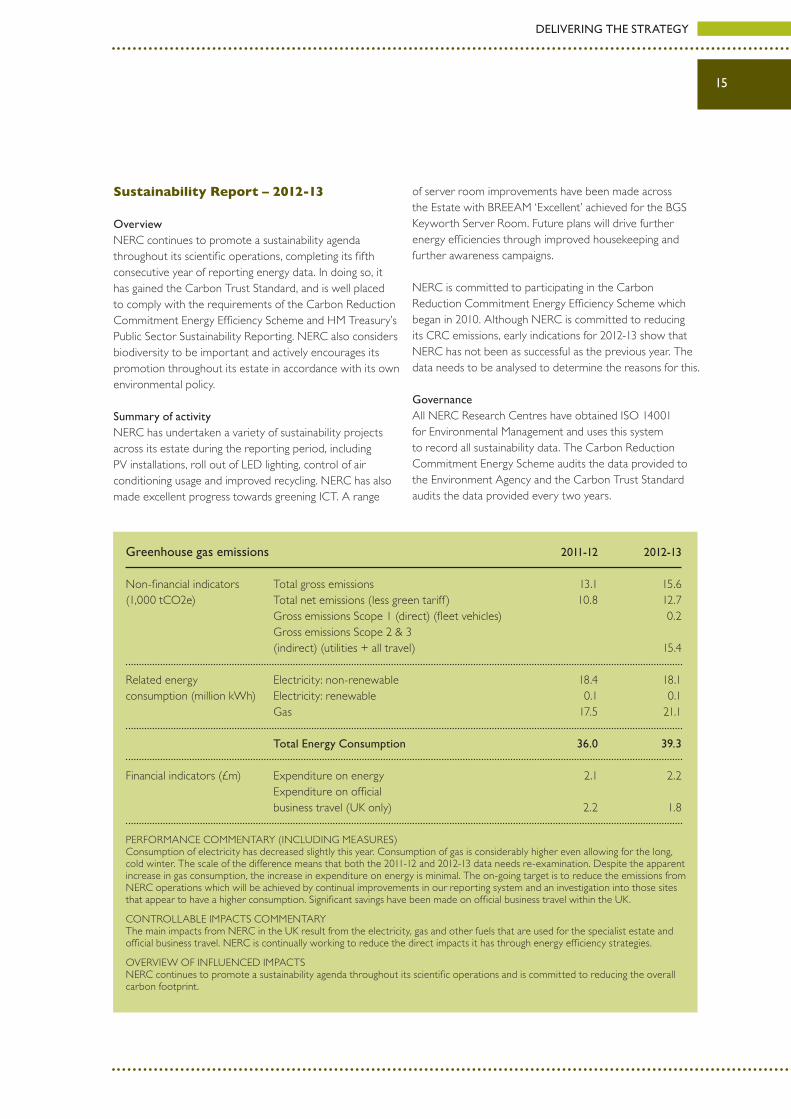
Expenditure £k Responsive Awards Research Knowledge Research Total Programme Exchange# Programme Contracts Fellowships Grants Students Grants Students
SEI Oxford Office Ltd 4 4 Sir Alister Hardy Foundation For Ocean Science 9 24 77 404 514 Scotland’s Rural College 2 2 St George’s University of London 165 165 Scottish Universities Environmental Research Centre 42 1,181 1,223 Scottish Universities Research and Reactor Centre 796 796 Swansea University 52 109 155 562 878 Technology Strategy Board 609 609 The Linnean Society 100 100 The Open University 260 283 195 119 21 11 889 The Royal Society 50 50 UK Astronomy Technology Centre 559 559 University College Dublin 0 University College London 249 2,375 575 1,179 4 94 369 4,845 University of Aberdeen 131 879 507 342 8 137 2,004 University of Abertay Dundee 4 4 University of Bath 42 257 64 152 20 536 University of Birmingham 112 782 337 1,088 14 151 358 2,843 University of Bradford 9 9 University of Brighton 106 10 117 University of Bristol 654 3,532 953 921 53 237 359 6,708 University of Cambridge 304 2,092 781 740 8 489 4 4,418 University of Cumbria 1 6 7 University of Dundee 43 20 192 19 407 681 University of Durham 205 1,667 353 223 66 233 2,747 University of East Anglia 359 2,040 884 950 26 244 273 4,775 University of Edinburgh 568 2,912 1,198 1,132 395 2,595 8,800 University of Essex 189 158 183 69 95 694 University of Exeter 238 2,996 378 1,471 5 210 5,298 University of Glasgow 138 592 233 200 25 140 25 1,352 University of Gloucestershire 42 42 University of Greenwich 19 19 University of Hertfordshire 31 207 238 University of Hull 360 36 80 19 494 University of Kent 38 26 2 46 112 University of Leeds 513 4,691 1,187 1,083 406 8,458 16,338 University of Leicester 82 775 207 239 181 74 326 1,884 University of Lincoln 48 46 42 136 University of Liverpool 301 2,286 523 216 19 82 568 3,995 University of Malawi 95 95 University of Manchester 384 2,669 859 1,174 126 69 5,282 University of Nairobi 26 26 University of Newcastle Upon Tyne 218 464 270 207 68 61 1,288 University of Northampton 0 University of Nottingham 359 86 6 129 580 University of Oxford 408 4,286 1,075 1,478 20 56 660 7,983 University of Plymouth 500 181 536 20 29 1,266 University of Portsmouth 190 10 59 19 35 313 University of Reading 372 922 1,014 2,671 239 5,972 11,189 University of Salford 9 9 University of Sheffield 394 1,718 667 654 143 496 4,072 University of Southampton 476 2,233 692 2,788 51 156 6,396 University of St Andrews 224 1,706 325 510 5 84 1,043 3,898 University of Stirling 275 109 41 81 507 University of Strathclyde 147 39 55 198 6 445 University of Surrey 38 9 47 University of Sussex 174 51 90 11 326 University of Ulster 326 37 363 University of Warwick 153 768 196 28 38 20 1,203 University of Westminster 12 12 University of York 746 358 610 39 54 404 2,212 Zoological Society of London 148 121 93 363
Total 8,461 58,134 17,459 37,266 700 5,286 41,371 168,677 # – includes both Grant and Student awards In addition to the table above, NERC Institutes have funded additional research awards and contracts totalling £1.983m.
DELIVERING THE STRATEGY
All entries and totals show the amounts awarded rounded to the nearest £k. However manual addition of individual row and column entries may result in rounding differences compared to the totals.

NERC Annual Report & Accounts 2012-13
26
Management commentaryStatutory basis of financial statementsNERC’s statutory financial statements have been prepared using accruals accounting in accordance with the UK Government’s Financial Reporting Manual (FReM) for 2012-13 and the accounts direction issued by the Secretary of State.
NERC successfully kept within agreed tolerances for the first two years of its four-year spending review settlement, and has an agreed financial plan to continue its existing operations until at least 2015. A triennial review is currently being undertaken for all Research Councils that will focus on continuing need, control and governance. The financial statements have been prepared on a going-concern basis.
NERC maintains a risk-management strategy that conforms to HM Treasury guidance. NERC’s approach to risk is described comprehensively in the Accounting Officer’s Governance Statement within the Annual Accounts and is supported by the positive and reasonable assurance provided by the Audit and Assurance Services Group.
Financial summaryNERC concludes the accounting period with a balanced financial position for both near cash and capital within 0.1% of budget; including non-cash this makes for an overall outturn variance of 1.45%. A comparison with the previous accounting period is shown in Table 1.
Reconciliation between NERC’s outturn and its annual accounts for 2012-13 is shown in Table 2.
Statutory disclosuresIn accordance with the Companies Act 2006, the following statutory disclosures are presented for the accounting period 2012-13:
PensionsNERC’s pension schemes are discussed in greater detail in Note 5d to the Annual Accounts.
Table 1. NERC outturn 2012-13 and 2011-12 comparison NERC outturn 2012-13 2011-12 £000 £000
Science budget 376,001 417,168
Other BIS funding 120 47
Earned income 59,720 56,087
Total funding 435,841 473,302
Expenditure 442,161 468,071
(Deficit) / surplus (6,320) 5,231
Variance (%) -1.45% 1.11%
Significant interestsPotentially relevant significant interests of NERC’s Council members where they are affiliated to other organisations are presented at Table 3 in the Remuneration Report to the main accounts. No issues regarding conflict with their managerial responsibilities have materialised. NERC’s Council Secretariat manages a Register of Interests: www.nerc.ac.uk/about/work/boards/councils/interests.asp
AuditorsNERC’s accounts are audited by the Comptroller and Auditor General who has been appointed under statute and is responsible to Parliament. The cost of the audit was £80,000. No remuneration was paid to the external auditors in respect of non-audit work in 2012-13. Internal audit was provided independently by the Audit and Assurance Services Group (AASG). AASG reports annually to the Audit and Risk Committee (ARAC). The cost of internal audits undertaken during 2012-13 was £147,901. No remuneration was paid to the internal auditors in respect

27
of non-audit work during 2012-13. The Accounting Officer has taken all reasonable steps to ensure that he is aware of any relevant audit information and to ensure that the Council’s auditors are aware of that information. As far as the Accounting Officer is aware, there is no relevant audit information of which the Council’s auditors are unaware.
Sickness absenceNERC’s sickness absence rate was 2.3% (2011-12 2.8%), equivalent to 6.4 days per full-time employee (2011-12 7.01 days).
Public Sector InformationNERC has complied with the cost allocation and charging requirements set out in HM Treasury and Public Sector
Information guidance, but is exempt from the requirements of The Re-use of Public Sector Information Regulations 2005.
Payment policyNERC observes the Confederation of British Industry Code of Practice regarding prompt payment, and in accordance with the Government direction, is committed to paying its suppliers within five days of the receipt of a valid invoice or earlier if suppliers terms dictate. During 2012-13, 83 per cent of payments were made within five working days (69 per cent 2011-12) and 93 per cent within 30 days (94 per cent 2011-12). In accordance with the guidance of the Statutory Instrument 1997/571, creditor days for the period are 12 days (2011-12: 39 days).
Table 2. NERC Outturn and Annual Accounts Reconciliation 2012-13 Resource Capital Total £000 £000 £000
Net expenditure 1 357,563 - 357,563
AME change in provisions 2 1,046 - 1,046
AME loss on investment 3 (300) - (300)
Other BIS funding 4 (120) - (120)
Capital grants (4,797) 4,797 -
Capital 5 - 33,908 33,908
Capital income 208 (208) -
Net Profit on NBV and revaluation reserve disposals 6 - (9,776) (9,776)
Outturn 353,600 28,721 382,321
Science budget 347,256 28,745 376,001
Reported surplus / (deficit) 7,8 (6,344) 24 (6,320)
Notes:1. Taken from the statement of net expenditure for the year ended 31 Mar 2013.2. Provision, utilisation, movements, unwinding of discount and change in discount factor score as AME and are outside the scope of
DEL; figures taken from note 8 Other operating costs (allowance for trade receivables) and note 14 Provisions.3. Taken from note 9(c) Jointly controlled entities and unconsolidated investments.4. Taken from note 3 Grant-in aid and other BIS Funding.5. Taken from note 9(a) Property, plant and equipment, note 9(b) Assets Under the Course of Construction and note 10 Intangible
Fixed Assets - Additions.6. In accordance with Financial Reporting Manual.7. Resource deficit of £6,344k comprises of £336k near-cash deficit and £6,008k non-cash deficit.8. Capital surplus of £24k comprises £397k capital grants deficit and £421k direct capital surplus.
MANAGEMENT COMMENTARY

NERC Annual Report & Accounts 2012-13
28
Delivery Plan Action: Increase focus on strategic research
Research Programme highlights 2012-13Research programmes provide strategically directed environmental research, training and related knowledge exchange, and encourage national and international collaboration. Research Programme highlights for 2012-13 include:
In collaboration with the Met Office and Environment Agency, NERC is investing £5.2m in a five-year research programme, Flooding from Intense Rainfall. The programme will improve forecasts of the length and intensity of rainfall from convective storms, and help us understand which areas are most vulnerable to the effects of intense rain. This will enhance flood-risk management through the development of both flood-risk estimation and real-time flood forecasts. www.nerc.ac.uk/research/programmes/flooding/
The £5m Network of Sensors programme aims to develop new technological approaches to creating sensor networks and communication systems, some of which may be in remote or hostile environments. It involves over 30 partners including major public and private sector stakeholders. The annual technology showcase, held in February 2013, stimulated interest from new potential participants from the energy, transport and telecoms sectors and government agencies. www.nerc.ac.uk/research/programmes/nos/
The ClearfLo (Clean Air For London) consortium, funded under the Urban Atmospheric Science programme, carried out two periods of intensive observation of air pollution in London in 2012: one in winter and one during the Olympics in late summer, taking advantage of the once-in-a-lifetime research opportunity offered by the changes to traffic flow during the Games. The project’s long-term measurements continued into 2013; the result is a two-year dataset on meteorology, atmospheric chemistry and particulate pollution around London giving unprecedented insight into how human activities and weather affect the capital’s air quality, with major implications for the health and wellbeing of its inhabitants.
RCUK programmesTo ensure the UK’s science research base is well placed to address tomorrow’s societal and economic challenges, it is vital that we work in partnership as part of RCUK, to foster cross-disciplinary research and nurture national capability. New approaches are needed to solve many of the big research challenges over the next 10-20 years. To achieve this, NERC either leads or has an interest in four cross-council research programmes: LWEC, Energy, Global Food Security and Global Uncertainties. All work in these areas is being done in partnership with other research councils and government bodies, with increasing input from the private sector. New flood models based on the LWEC Storm Risk Mitigation programme are being taken up by the private sector and the Environment Agency, for a more detailed understanding of exactly where in urban areas river flooding will strike. This should help the Environment Agency target flood-defence spending and avoid more costs from flood damage. It will also help the insurance market cope better with flood risks and manage extreme events more effectively.
Cross-council programmes have made a considerable impact on policy over the past year. The Energy programme delivered an independent report to the Department of Energy and Climate Change on shale gas and fracking, which underwent public consultation in April 2012. The report includes recommendations for a system to monitor seismic events induced by fracking, to warn when fracking operations should be suspended and remedial action taken. It also concludes that seismic hazard should be assessed before proceeding with future shale gas operations elsewhere in the UK. The UK Government will introduce a package of support for UK shale gas to promote investment in the industry at an early stage of its development.
Innovations in soil science will grow the solutions to global food security. The Royal Society of Chemistry, the University of Sheffield, NERC and the Environmental Sustainability Knowledge Transfer Network (ESKTN) issued a joint report entitled Securing Soils for Sustainable Agriculture – A science led strategy. It highlights the fundamental need
Developments during the year

29
for innovative research in soil science to tackle the growing threat of global food and fuel-crop shortages as the world’s population continues to increase. In his speech on science at the Royal Society in November, Chancellor George Osborne highlighted agricultural research as one of eight areas in which he sees the UK as a world leader. Further information is available at: www.rsc.org/ScienceAndTechnology/Policy/Documents/SustainableSoils.asp
InternationalIn the run-up to Rio+20, NERC and the São Paulo Research Foundation (FAPESP) announced a major investment to investigate how changes to tropical forests affect biodiversity, ecosystem services and the climate. A five-year research programme, Biodiversity and Ecosystem Processes in Human Modified Tropical Forests, will carry out studies in Sabah, Malaysia and Brazil to improve understanding and assess the potential of different policies and approaches to forest management to protect key ecosystem functions and biodiversity. The collaboration will also develop and test new technology for long-term observations of biogeochemical cycling that may be deployed as a legacy of the programme across a range of tropical environments.
As a partner in the Belmont Forum, NERC has invited proposals for major international research projects into coastal vulnerability and freshwater security. At least 10 consortia, involving partners from more than 11 countries, are expected to receive a share of a c€20m International Opportunities Fund, jointly funded by the Belmont Forum and members of the G8 Heads of Research Councils.
NERC and the Ministry of Earth Sciences of the Republic of India (MoES) have agreed a Memorandum of Understanding (MoU) between the UK and Indian environmental research communities. The MoU will encourage collaboration in areas such as meteorology, climate variability and change, oceanography, hydrology, natural hazards and biodiversity, and promote information sharing and identification of new opportunities for
collaborative activities such as networking, exchange of scientific and technical capability, and co-funding new research through joint calls.
The CEH and the James Hutton Institute have agreed new collaborations with the Chinese Academy of Sciences’ Research Centre for Eco-environmental Sciences (RCEES) and the China Agricultural University’s Centre for Resources, Environment and Food Security (CREFS). These collaborations are designed to tackle some of the global challenges of food, water and energy security, and provide knowledge and understanding to support economic growth hand in hand with environmental protection.
NERC’s new strategy In 2013 NERC will publish its new corporate strategy. NERC has engaged with the research community and businesses to establish new strategic priorities and develop key messages. The new strategy will drive NERC research and training in discovery science and three key areas that pose particular challenges for society: access to natural resources, resilience to environmental hazards, and managing environmental change. The strategy will articulate more clearly how NERC will translate its science so UK businesses, government and other users of science can generate economic growth and provide other benefits to society.
Delivery Plan Action: Increase economic impact and societal benefit
Working with business
Environmental hazardsBusinesses and government are taking a keen interest in the wide range of NERC research on natural hazards. NERC launched the research programme Probability, Uncertainty and Risk in the Environment (PURE) in November 2012,
MANAGEMENT COMMENTARY

NERC Annual Report & Accounts 2012-13
30
which aims to transform the way that the risks and uncertainties of a range of natural hazards are dealt with. PURE brings together major insurance and reinsurance firms and infrastructure companies – including Willis, Arup and the world’s largest reinsurer, AON Benfield – in two large consortia, led by the University of Bristol and University College London.
PURE will not only help the UK government to prepare for natural hazards and disaster situations, but will also help the insurance industries to meet the requirements and risk management standards of a new EU directive known as Solvency II.
SpaceThis year has also seen the establishment of the Satellite Applications Catapult, based in Harwell, Oxfordshire. NCEO has been directly involved in this development, working with companies including Astrium, Logica, Vega and the Technology Strategy Board and UK Space Agency, to make the UK the leading country for both Earth observation capability and downstream services. NCEO spends £6.49m per year on Earth observation and this new link with the Catapult will help ensure that research is fully exploited.
Sustainable agricultureIn sustainable agriculture, there is a significant opportunity for NERC and BBSRC science to address the challenges of sustainable food production in a changing environment. Marks & Spencer, Unilever and Heineken have all engaged directly with NERC by co-funding Knowledge Exchange fellows in order to understand the potential of environmental science to address their challenges and to build partnerships with the NERC-funded community.
Over the last year, we have worked closely with BBSRC to engage the business and academic community in scoping a multi-million pound innovation programme on sustainable agriculture. NERC spend on food security-related activities this year was just under £15m.
Marine renewable energyBy engaging with business and government in the offshore wind, wave and tidal energy sectors, NERC’s Marine Renewable Energy Knowledge Exchange Programme (KEP) has identified a range of opportunities for NERC science to deliver significant benefits to the deployment and operation of devices in the marine environment. These include helping to streamline the process by which new projects gain planning consent, reducing environmental risks, and developing and adapting monitoring technologies and tools which reduce pre- and post-development costs and create new jobs. The programme has informed regulatory decisions, supported the development of X-band radar and other real-time monitoring devices. The programme has facilitated the development of novel research and projects in collaboration with businesses, NGOs, regulators and their advisors, to support the development of large-scale arrays of wind, wave and tidal energy in UK coastal waters. NERC invested £491k in the Marine Renewable Energy KEP this year, as well as funding eight business internships in the sector.
WaterTo give businesses, government bodies and other potential users better access to relevant NERC research expertise, the Water Security Knowledge Exchange Programme launched the UK Water Research Directory, a comprehensive searchable listing that provides summaries of expertise and contact details of individuals active in water research (www.ukwaterresearch.net). A directory of water-related research facilities will be added to improve user-access to the wealth of equipment and facilities available within the UK research community. The programme has also brokered relationships between researchers and users, resulting in internships in water-related ecosystem services, development of sustainable drainage screening tools, and the reduction of water-use and contamination at airports.
Economic impacts, enabling growthTo provide stronger leadership and prominence for innovation and impact within NERC, we have recruited a Director of Innovation and Communications. Activities have been reorganised to achieve a better focus on delivering and demonstrating impact from NERC science.

31
The NERC Impact Report 2012 was published in January 2013. It illustrates how NERC’s world-leading science translates into knowledge, expertise and skills that stimulate economic growth and improve societal wellbeing. www.nerc.ac.uk/about/perform/documents/impactreport2012.pdf
Policy impactsGovernment, both central and local, has a leading role in driving UK economic growth by making major infrastructure decisions. NERC has worked closely with a range of government bodies to provide evidence and solutions for the development and implementation of policy.
NERC-funded science has been a key part of the evidence base for the recent Defra White Paper ‘Water for Life’, and underpinned the analysis of climate change in the supporting papers prepared by the Environment Agency. Better prediction of water availability incorporating climate change impacts is of fundamental importance to water managers across the UK for supply management and efficient infrastructure. This plans to avoid potential additional costs estimated to be £94-437m annually by 2050 on water supply demand as well as £400-690m annually by 2080 through the degradation of the ecosystem services provided by the environment.
NERC research within the Living with Environmental Change strategic partnership has given the UK the world’s first National Ecosystem Assessment (NEA) to value ecosystem services and natural capital. Supplementary guidance to HM Treasury’s Green Book now recommends using the UK NEA ecosystem services framework when
assessing environmental effects for cost-benefit analyses on major infrastructure investments.
In partnership with other Research Councils through the Rural Economy and Land Use (RELU) research programme, NERC has contributed to UK and EU policy discussions on the regulation of biopesticides. Scientists developed recommendations working alongside the Chemicals Regulation Directorate, as well as advising policy-makers, major UK supermarkets and companies developing biopesticides.
RELU researchers have also helped establish the best policies for sustainable catchment management for the water industry. It is estimated that a £10m investment in changing land management practices could potentially save the UK water industry £650m over 30 years in reduced purification costs.
The UK water market is estimated to be worth around £12-14bn per year. CEH is at the forefront of work to improve UK and European rivers and responsible for developing the RIVPACS (River Prediction and Classification System) software that provides a scientific classification system to measure whether a river has good ecological status. This not only protects rivers, but protects the use of rivers from irrational decisions based on the precautionary principle. CEH’s pioneering work on water quality indicators has been influential on methods and techniques adopted by a range of countries, including Australia, Canada, USA and across Europe.
Meanwhile our research into natural hazards informed, among other policy documents, the Government Office for
MANAGEMENT COMMENTARY
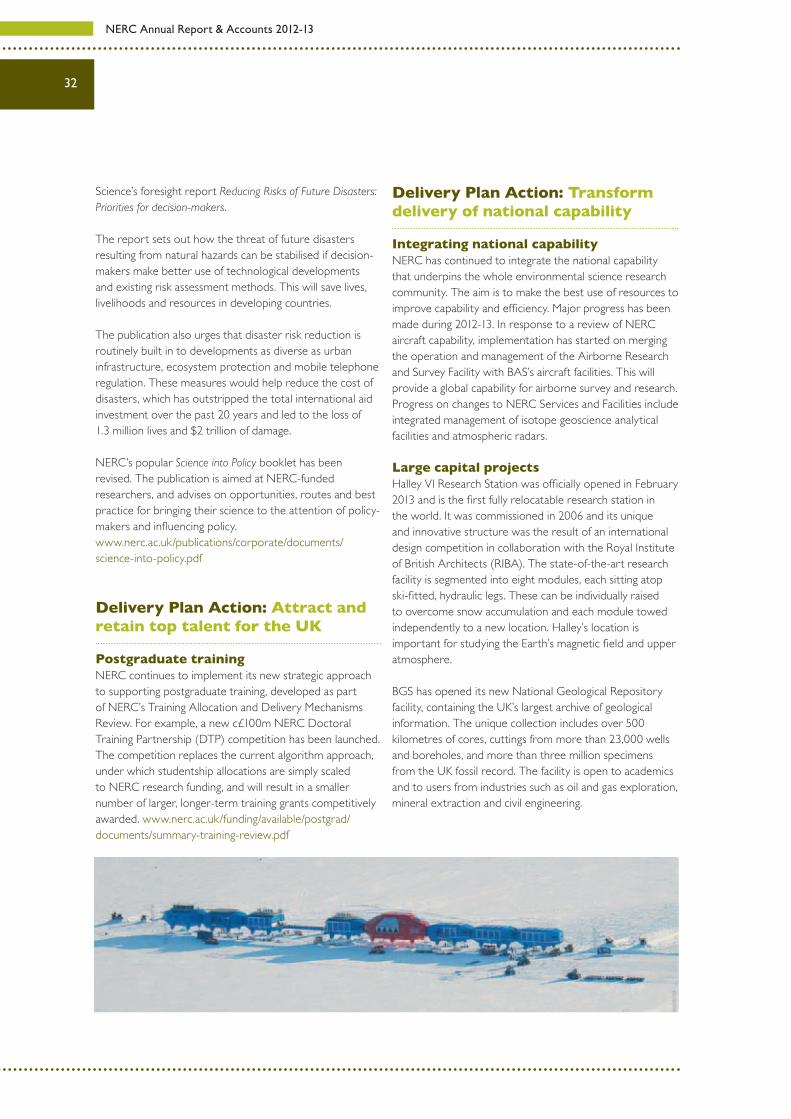
NERC Annual Report & Accounts 2012-13
32
Science’s foresight report Reducing Risks of Future Disasters: Priorities for decision-makers.
The report sets out how the threat of future disasters resulting from natural hazards can be stabilised if decision- makers make better use of technological developments and existing risk assessment methods. This will save lives, livelihoods and resources in developing countries.
The publication also urges that disaster risk reduction is routinely built in to developments as diverse as urban infrastructure, ecosystem protection and mobile telephone regulation. These measures would help reduce the cost of disasters, which has outstripped the total international aid investment over the past 20 years and led to the loss of 1.3 million lives and $2 trillion of damage.
NERC’s popular Science into Policy booklet has been revised. The publication is aimed at NERC-funded researchers, and advises on opportunities, routes and best practice for bringing their science to the attention of policy-makers and influencing policy. www.nerc.ac.uk/publications/corporate/documents/science-into-policy.pdf
Delivery Plan Action: Attract and retain top talent for the UK
Postgraduate training NERC continues to implement its new strategic approach to supporting postgraduate training, developed as part of NERC’s Training Allocation and Delivery Mechanisms Review. For example, a new c£100m NERC Doctoral Training Partnership (DTP) competition has been launched. The competition replaces the current algorithm approach, under which studentship allocations are simply scaled to NERC research funding, and will result in a smaller number of larger, longer-term training grants competitively awarded. www.nerc.ac.uk/funding/available/postgrad/documents/summary-training-review.pdf
Delivery Plan Action: Transform delivery of national capability
Integrating national capabilityNERC has continued to integrate the national capability that underpins the whole environmental science research community. The aim is to make the best use of resources to improve capability and efficiency. Major progress has been made during 2012-13. In response to a review of NERC aircraft capability, implementation has started on merging the operation and management of the Airborne Research and Survey Facility with BAS’s aircraft facilities. This will provide a global capability for airborne survey and research. Progress on changes to NERC Services and Facilities include integrated management of isotope geoscience analytical facilities and atmospheric radars.
Large capital projectsHalley VI Research Station was officially opened in February 2013 and is the first fully relocatable research station in the world. It was commissioned in 2006 and its unique and innovative structure was the result of an international design competition in collaboration with the Royal Institute of British Architects (RIBA). The state-of-the-art research facility is segmented into eight modules, each sitting atop ski-fitted, hydraulic legs. These can be individually raised to overcome snow accumulation and each module towed independently to a new location. Halley’s location is important for studying the Earth’s magnetic field and upper atmosphere.
BGS has opened its new National Geological Repository facility, containing the UK’s largest archive of geological information. The unique collection includes over 500 kilometres of cores, cuttings from more than 23,000 wells and boreholes, and more than three million specimens from the UK fossil record. The facility is open to academics and to users from industries such as oil and gas exploration, mineral extraction and civil engineering.

33
Delivery Plan Action: Shift resources into front-line science
NERC demand managementSince April 2012, grant proposals submitted to NERCs Responsive Mode have been monitored under our demand-management policy. Demand management has the potential to shift resources into front-line science by increasing the efficiency of the application and assessment process. The NERC demand-management system relies on working in partnership with research organisations, asking them to regulate their submissions and focus their effort on the proposals most likely to be competitive. Although other factors may also be involved, fewer proposals were submitted to NERC Responsive Mode this year and success rates for standard grant calls completed in 2012-13 rose to 27-29 per cent, compared to 16-23 per cent in 2011-12.
Planned changes to the Responsive Mode schemes on offer have been completed to streamline and focus the portfolio, consolidating the number of schemes from seven to four. The impact of the changes will be monitored for at least a year, and the application and assessment processes will continue to be adjusted as required.
Cross-council harmonisation activitiesIn January 2013 NERC adopted the Research Outcomes System (ROS) alongside ESRC, EPSRC, BBSRC and AHRC. Harmonising reporting systems across councils means universities can develop common standards to collect information once and share, making the whole process much more efficient. Information can now also be made public in a more accessible and consistent way through Gateway to Research, on behalf of all research councils. Gateway to Research will be fully functional by the end of 2013, following a positive appraisal of the trial system by Science Minister David Willetts. The new systems implement the Government’s and RCUK’s open-access policies.
NERC has introduced data-management plans for its grants to improve curation of datasets, which support open access to data and provide scientific assurance. NERC has led the research councils in an initiative, in collaboration with the British Library, to establish unique identifiers for datasets (see www.datacite.org) which means they can be cited in a similar way to publications. This creates a new way for UK science excellence to be acknowledged and measured, as well as a new criterion for career advancement, all of which helps maintain the long-term health of the UK research base.
Progress in implementing the Wakeham ReviewAs set out as part of the 2010 spending review settlement, the Research Councils have begun implementation of an efficiency programme to drive down the costs and overheads associated with research. The efficiency savings derived from this programme are being reinvested in research.
In the spring of 2011 RCUK published Efficiency 2011-15: Ensuring Excellence with Impact describing how the Research Councils would implement the recommendations in Sir William Wakeham’s report Financial Sustainability and Efficiency in Full Economic Costing of Research in UK Higher Education Institution. The efficiency savings are being applied to both research grants and fellowships awarded via competitive route to Research Organisations and also to Research Council institutes. The combined savings for 2012-13 were £113.7m, exceeding the planned target of £82.2m. RCUK is therefore on target to reach the planned savings of £428m over the four year Spending Review period.
Alongside these measures the Research Councils also introduced changes to the requests for equipment on grants, including asking applicants to demonstrate how the usage of the equipment will be maximised. RCUK is currently working with university partners to develop options to promote and assist equipment sharing, including exploring the issues around asset registers. There is good anecdotal evidence of significant progress by universities to promote sharing, and of very efficient usage of large pieces of experimental equipment.
MANAGEMENT COMMENTARY

NERC Annual Report & Accounts 2012-13
34
Strategic funding modelsNERC is reviewing its funding models for strategic science (currently ‘Research Programme’ and ‘National Capability’ budgets) to ensure that funding is demonstrably focused on delivering our strategic goals. Over the next year we will reform these to better support long-term science and to ensure that research programmes select the best ideas from across our community. It will also speed up the process from idea to grant, help researchers form external partnerships, leveraging NERC contributions with partnership funding.
Ownership and governance of NERC research centresNERC is reviewing the relationship with its wholly-owned research centres to enable greater clarity of NERC’s role and thereby make easier greater alignment with other Councils and the wider BIS family, and to improve the centres’ roles as science delivery partners and provide an opportunity for them to develop outside of public sector constraints.
The review will be managed via an external gateway process and is expected to take 18-24 months to complete.
Evaluation of NERC research centresAn evaluation of five of NERC’s research centres is under way, and reported to NERC Council in July 2013. The work will provide independent evidence of the research excellence and impact of the centres, using an evaluation process based on the Higher Education Funding Councils Research Excellence Framework methodology. The evaluation was conducted by two independent panels (dealing respectively with research excellence and impact).
RRS DiscoveryA new NERC research ship serving UK marine science is
nearing completion and will go into active service at the end of 2013. The vessel will replace the 50-year-old RRS Discovery, and will be operated by National Marine Facilities Sea Systems, based at NOC in Southampton. Discovery carries a crew of 24 and can accommodate 28 scientists and technicians.
The new vessel will play a key role in the scientific mission to understand the role of the oceans in the Earth system. The research it enables will deliver significant economic and societal benefits, particularly in areas such as climate change, mapping earthquakes and underwater landslides, and investigating little-understood features like hydrothermal vents.
Marine roboticsNERC, particularly through NOC, has long been a world leader in the use of autonomous technologies for ocean exploration. This area poses significant technical challenges but offers enormous scientific opportunity. Using a £10m investment from BIS over the next two years, we will engage with UK industry to develop this technology and reinforce UK expertise in marine robotics. The outcomes will potentially support the defence, space, oil and gas, environmental protection and emergency service sectors.
Big dataEnvironmental data are accumulating at ever-increasing rates and we need to make sure we have the right data analysis and management capabilities to make the most of it. NERC will use £13m capital investment from BIS to help develop the computational capability to run complex environmental models and capture real-time data from sensors embedded in the natural environment.
NERC is developing an Environmental Virtual Observatory which will use cloud technology to integrate environmental datasets. This will make it much easier for decision-makers to access and visualise NERC data and knowledge. For example, providing access to real-time modelling of national water stocks and demands for better management of water supplies and to help us increase our resilience to the effects of drought and infrastructure failures.
Professor Duncan Wingham Chief Executive and Accounting Officer26 June 2013
Forward Look

35
Accounts 2012-13
The maintenance and integrity of NERC’s website is the responsibility of the Accounting Officer; the work carried out by the auditors does not involve consideration of these matters and accordingly the auditors accept no responsibility for any changes that may have occurred to the financial statements since they were initially presented on the website.

NERC Annual Report & Accounts 2012-13
36
Remuneration report
Remuneration PolicyThe Remuneration Committee is responsible for agreeing the pay and allowances of senior managers, i.e. directors (except for the Chief Executive, see below). The Committee members are listed below:-
Mr E Wallis, Chairman NERCProf P Curran, Council MemberProf P Monks, Council Member Professor D Wingham, Chief Executive Mr J Bates, Director, People & Skills, who attends in an Advisory capacity.
The Remuneration Committee works in accordance with its policy on senior staff pay, which is designed to reward senior staff on the basis of individual skills, experience and performance set against the market median for their role. A market-related pay point is determined by survey evidence obtained from relevant comparator organisations in the public, higher education and voluntary sectors and is updated annually.
In accordance with NERC’s appraisal system, performance is assessed against pre-set objectives for individual roles with input in the assessment process from individual reviewees, reviewers and the Chief Executive. In addition an assessment will be made of whether the performance and overall development in experience for the reporting year shows an increased and sustained exceptional contribution to NERC.
Performance will be rated according to whether certain characteristics have been exhibited; these include inter alia: achievements that have helped develop NERC’s science/organisational impact, compliance with NERC Core Expectations, being integral to the delivery of NERC’s mission, adding value to the organisation and adding distinction to NERC’s science outputs. How well the individual exhibits these characteristics will determine the rating they receive.
These assessments will be used to determine both the pay increase and level of bonus that the member of senior staff will receive. In addition the survey evidence is factored into the pay increase assessment.
These arrangements were brought in to address the wide range of roles held by senior staff; to ensure that individual experience and performance were routinely included as factors in determining annual movement in base pay; and most critically to ensure a strong link between pay arrangements and the markets from which NERC recruits its senior staff. This was necessary as it had become apparent that the previous arrangements resulted in pay packages that fell short of the market and therefore inhibited NERC’s ability to recruit and retain senior staff.
From 1 April 2006 all pay movement for senior employees is performance related. Prior to that date only the non-consolidated element of senior pay was performance related.
It should be noted that no senior managers are on a service contract. No awards have been made to senior staff this year.
More information about the remuneration committee can be found at the following websitewww.nerc.ac.uk/about/work/boards/intro/#remuneration
Employment ContractsNERC staff are not civil servants but the organisation makes its appointments in accordance with the broad principles set out in the Civil Service Commissioners’ Recruitment Code, which requires appointments to be on merit on the basis of fair and open competition but also includes the circumstances when appointments may otherwise be made.
All senior officers covered by this report, apart from the Chief Executive, hold appointments that are open-ended. All staff may retire after age 50 and draw their pensions on an actuarially reduced basis. Staff appointed before October 2006 may draw full pensions from age 60. Staff who leave during a formal redundancy exercise will be eligible for compensation terms, as defined under the rules of the Research Council’s Superannuation Scheme. These payments are in line with those due under the Civil Service Compensation Scheme.
The notice period for all senior employees is three months.

37
ACCOUNTS 2012-13
Remuneration of the Chief ExecutiveProfessor Wingham started his tenure on 1 January 2012. His initial contract is for a period of four years. Both the appointment terms and remuneration package are determined by the Department for Business, Innovation & Skills (BIS) with the Senior Review Oversight Committee (SORC) making a decision based on input from the Permanent Secretary and NERC Chair.
Professor Wingham’s emoluments, including both taxable and non-taxable benefits, were £130,000 (2011-12: £32,500) entirely relating to his basic salary.
A charge of £33,800 (2011-12: £8,450) was also incurred in respect of employer’s pension contributions. This was assessed as 26% of basic salary (2011-12: 26%). The Cash Equivalent Transfer Value for Professor Wingham at 31 March 2013 was £50,818. The real increase in the cash equivalent transfer value for the period was £32,067. Professor Wingham is an ordinary member of the Research Councils’ Pension Scheme.
NERC Executive Board (NEB)The NERC Executive Board (NEB) is responsible for:l Overall corporate management l Directing the development and implementation of Council’s strategies, policies and decisionsl Effective financial managementl Developing and maintaining corporate information systemsl Ensuring that NERC is managed according to the required standards of accountability, regularity and propriety,
achieving high standards of efficiency, effectiveness, economy and health and safety
NEB works with other research councils, and other bodies, on scientific, operational and administrative matters where there is benefit in doing so.
NEB members are appointed by the Chief Executive.
Table 1: Membership of NEB as at 31st March 2013
Name Position Notes
Professor Duncan Wingham Chief Executive & Accounting Officer Appointed effective 1st January 2012.
Professor Mark Bailey Director, Centre for Ecology & Hydrology Acting Director 1st March 2011 - 30th July 2012, permanent thereafter.
Mr Jonathan Bates Director, People & Skills Interim Director 1st November 2011 - 7th October 2012, permanent thereafter.
Mr Paul Fox Director, Finance & Operations
Professor Ed Hill Director, National Oceanography Centre Also Interim Director, British Antarctic Survey (BAS) 20th February - 26th November 2012.
Professor John Ludden Director, British Geological Survey
Mr Colin McKinnon Director, Innovation & Communication Appointed effective 7th January 2013, this role replaced the position of Director, Strategy & Partnerships.
Professor Stephen Mobbs Director, National Centre for Atmospheric Professor of Atmospheric Dynamics, University of Leeds Science (NCAS)
Dr Phil Newton Director, Science Stood down 30th May 2013, Dr Pamela Kempton will fill the role on an interim basis until Professor Iain Gillespie takes up the post 1st September 2013.
Professor Patricia Nuttall Director, Special Projects Stood down as Director, Centre for Ecology & Hydrology (CEH) to take up the post of Director, National Capability Intergration effective 1st March 2011, this was intended to be a 2 year posting, however her standing down became permanent effective 31st July 2012 when she became Director, Special Projects. This role ended 31st March 2013, after which she left NERC to take up the role of Professor of Arbovirology at the University of Oxford.
Professor Alan O’Neill Director, National Centre for Earth Professor of Meteorology, University of Reading Observation (NCEO)
Professor Alan Rodger Interim Director, British Antarctic Survey Appointment effective 27th November 2012, he will stand down 30th September 2013 at which point the new Director, Professor Jane Francis, will take up the post.
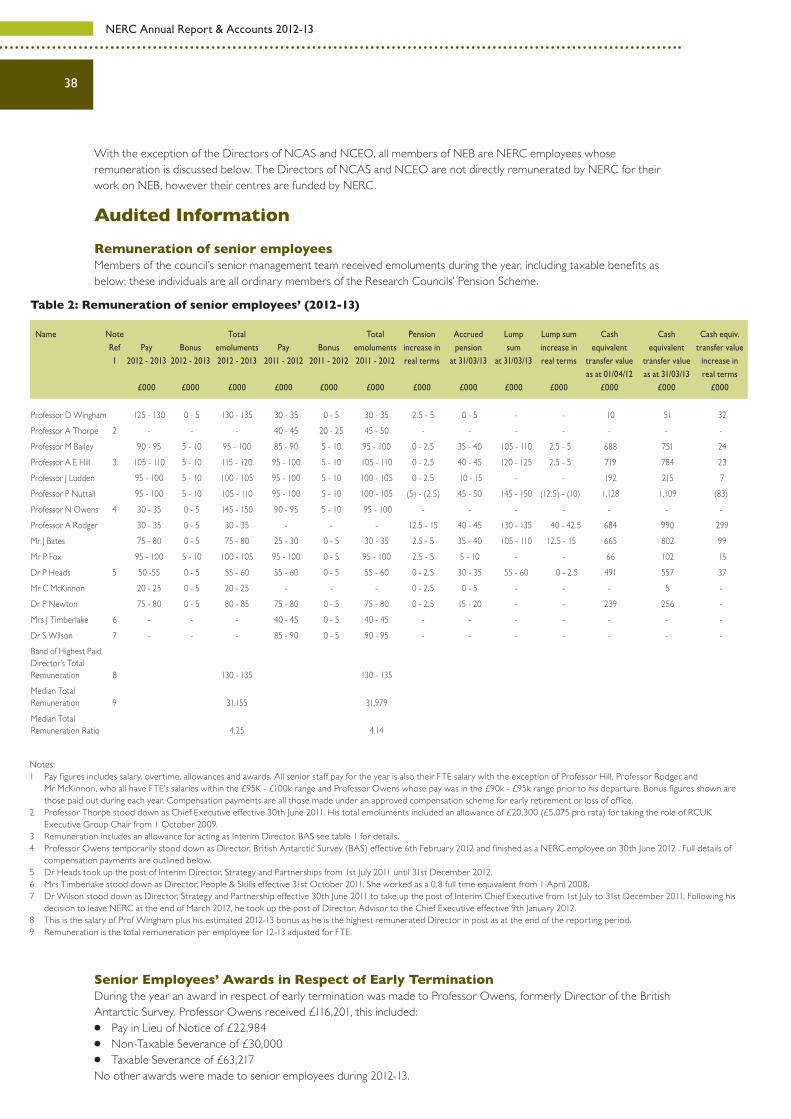
NERC Annual Report & Accounts 2012-13
38
Name Note Total Total Pension Accrued Lump Lump sum Cash Cash Cash equiv. Ref Pay Bonus emoluments Pay Bonus emoluments increase in pension sum increase in equivalent equivalent transfer value 1 2012 - 2013 2012 - 2013 2012 - 2013 2011 - 2012 2011 - 2012 2011 - 2012 real terms at 31/03/13 at 31/03/13 real terms transfer value transfer value increase in as at 01/04/12 as at 31/03/13 real terms £000 £000 £000 £000 £000 £000 £000 £000 £000 £000 £000 £000 £000
Professor D Wingham 125 - 130 0 - 5 130 - 135 30 - 35 0 - 5 30 - 35 2.5 - 5 0 - 5 - - 10 51 32 Professor A Thorpe 2 - - - 40 - 45 20 - 25 45 - 50 - - - - - - - Professor M Bailey 90 - 95 5 - 10 95 - 100 85 - 90 5 - 10 95 - 100 0 - 2.5 35 - 40 105 - 110 2.5 - 5 688 751 24 Professor A E Hill 3 105 - 110 5 - 10 115 - 120 95 - 100 5 - 10 105 - 110 0 - 2.5 40 - 45 120 - 125 2.5 - 5 719 784 23 Professor J Ludden 95 - 100 5 - 10 100 - 105 95 - 100 5 - 10 100 - 105 0 - 2.5 10 - 15 - - 192 215 7 Professor P Nuttall 95 - 100 5 - 10 105 - 110 95 - 100 5 - 10 100 - 105 (5) - (2.5) 45 - 50 145 - 150 (12.5) - (10) 1,128 1,109 (83)Professor N Owens 4 30 - 35 0 - 5 145 - 150 90 - 95 5 - 10 95 - 100 - - - - - - - Professor A Rodger 30 - 35 0 - 5 30 - 35 - - - 12.5 - 15 40 - 45 130 - 135 40 - 42.5 684 990 299 Mr J Bates 75 - 80 0 - 5 75 - 80 25 - 30 0 - 5 30 - 35 2.5 - 5 35 - 40 105 - 110 12.5 - 15 665 802 99 Mr P Fox 95 - 100 5 - 10 100 - 105 95 - 100 0 - 5 95 - 100 2.5 - 5 5 - 10 - - 66 102 15 Dr P Heads 5 50 -55 0 - 5 55 - 60 55 - 60 0 - 5 55 - 60 0 - 2.5 30 - 35 55 - 60 0 - 2.5 491 557 37 Mr C McKinnon 20 - 25 0 - 5 20 - 25 - - - 0 - 2.5 0 - 5 - - - 5 - Dr P Newton 75 - 80 0 - 5 80 - 85 75 - 80 0 - 5 75 - 80 0 - 2.5 15 - 20 - - 239 256 - Mrs J Timberlake 6 - - - 40 - 45 0 - 5 40 - 45 - - - - - - - Dr S Wilson 7 - - - 85 - 90 0 - 5 90 - 95 - - - - - - - Band of Highest Paid Director’s Total Remuneration 8 130 - 135 130 - 135 Median Total Remuneration 9 31,155 31,979 Median Total Remuneration Ratio 4.25 4.14
Table 2: Remuneration of senior employees’ (2012-13)
With the exception of the Directors of NCAS and NCEO, all members of NEB are NERC employees whose remuneration is discussed below. The Directors of NCAS and NCEO are not directly remunerated by NERC for their work on NEB, however their centres are funded by NERC.
Audited Information
Remuneration of senior employees Members of the council’s senior management team received emoluments during the year, including taxable benefits as below; these individuals are all ordinary members of the Research Councils’ Pension Scheme.
Notes: 1 Pay figures includes salary, overtime, allowances and awards. All senior staff pay for the year is also their FTE salary with the exception of Professor Hill, Professor Rodger and Mr McKinnon, who all have FTE’s salaries within the £95K - £100k range and Professor Owens whose pay was in the £90k - £95k range prior to his departure. Bonus figures shown are
those paid out during each year. Compensation payments are all those made under an approved compensation scheme for early retirement or loss of office. 2 Professor Thorpe stood down as Chief Executive effective 30th June 2011. His total emoluments included an allowance of £20,300 (£5,075 pro rata) for taking the role of RCUK
Executive Group Chair from 1 October 2009. 3 Remuneration includes an allowance for acting as Interim Director, BAS see table 1 for details. 4 Professor Owens temporarily stood down as Director, British Antarctic Survey (BAS) effective 6th February 2012 and finished as a NERC employee on 30th June 2012 . Full details of
compensation payments are outlined below. 5 Dr Heads took up the post of Interim Director, Strategy and Partnerships from 1st July 2011 until 31st December 2012. 6 Mrs Timberlake stood down as Director, People & Skills effective 31st October 2011. She worked as a 0.8 full time equivalent from 1 April 2008. 7 Dr Wilson stood down as Director, Strategy and Partnership effective 30th June 2011 to take up the post of Interim Chief Executive from 1st July to 31st December 2011. Following his
decision to leave NERC at the end of March 2012, he took up the post of Director, Advisor to the Chief Executive effective 9th January 2012. 8 This is the salary of Prof Wingham plus his estimated 2012-13 bonus as he is the highest remunerated Director in post as at the end of the reporting period. 9 Remuneration is the total remuneration per employee for 12-13 adjusted for FTE.
Senior Employees’ Awards in Respect of Early TerminationDuring the year an award in respect of early termination was made to Professor Owens, formerly Director of the British Antarctic Survey. Professor Owens received £116,201, this included: l Pay in Lieu of Notice of £22,984l Non-Taxable Severance of £30,000l Taxable Severance of £63,217No other awards were made to senior employees during 2012-13.

39
ACCOUNTS 2012-13
Total Emoluments Total emoluments include gross salaries and performance related bonuses. From 1 April 2004 basic pay rates for senior staff incorporate all existing allowances including supervisory and responsibility allowances and any contribution awards.
Pension benefitsAll senior employees are ordinary members of the Research Councils’ Pension Scheme (RCPS) which is a defined benefit scheme funded from annual Grant-in-aid on a pay-as-you-go basis.
Further details about the RCPS can be found in Note 5(d) of the Annual Accounts.
Cash Equivalent Transfer Value (CETV) A Cash Equivalent Transfer Value (CETV) is the actuarially assessed capitalised value of the pension scheme benefits accrued by a member at a particular point in time. The benefits valued are the member’s accrued benefits and any contingent spouse’s or partner’s pension payable from the scheme. A CETV is a payment made by a pension scheme when the member leaves a scheme and chooses to transfer the benefits accrued in the former scheme. The pension figures shown relate to the benefits that the individual has accrued as a consequence of their total membership of the pension scheme, not just their service in a senior capacity to which disclosure applies. The CETV figures include the value of any pension benefit in another scheme which the individual has transferred to the Research Councils’ pension arrangement and for which the RCPS has received a transfer payment commensurate with the additional pension liabilities being taken on. They also include any additional pension benefit accrued to the member as a result of their purchasing additional years and additional pension at their own cost.
Real increase in the value of the CETVThe real increase in the value of the CETV reflects the increase effectively funded by the employer. It takes account of the increase in accrued pension due to inflation, contributions paid by the employee (including the value of any benefits transferred from another pension scheme) and uses common market valuation factors for the start and end of the period.
Remuneration of Council MembersMembers of Council receive an Honorarium of £6,850 per annum to cover all work for the Council including membership of Council’s Boards; Professor Curran receives an additional £2,260 for being Chair of the NERC Council Audit Committee. The Chairman of Council, Mr Wallis, receives a salary of £16,430 per annum. These rates are effective from 1 October 2009 and are formulated by the Department for Business, Innovation and Skills.
Council members are normally employed on fixed term contracts not exceeding 4 years.
Honoraria are not payable to members who are:l Civil Servantsl Employees of NERCl Full time employees of organisations whose funds are derived from Votes of Parliament (eg Government
Departments, UK Atomic Energy Authority, British Broadcasting Corporation and other Research Councils)
Members of Council may not receive fees in addition to honoraria. University academic staff and retired Civil Servants are eligible to receive honoraria or fees.

NERC Annual Report & Accounts 2012-13
40
Name Affiliation Period of Appointment Total Emoluments £’000 Notes
2012-13 2011-12
Mr E Wallis Chairman 01 Jan 2007 - 01 Jan 2014 15 - 20 15 - 20
Professor D Wingham Chief Executive and Deputy Chairman 01 Jan 2012 - 31 Dec 2015 0 0 1
Professor P Curran Vice Chancellor and Professor of Physical Geography, City University London and Chair of NERC Council Audit Committee 08 Aug 2006 - 31 July 2014 5 - 10 5 - 10
Professor I Boyd Chief Scientific Advisor to DEFRA 01 Feb 2013 - 31 Jan 2017 0 0 1
Mr R Douglas Managing Director, Willis analytics for Willis Re 01 Aug 2008 - 31 July 2015 5 - 10 5 - 10
Professor C Godfray Professor of Zoology, University of Oxford 01 Aug 2008 - 31 July 2015 5 - 10 5 - 10
Professor L Heathwaite Professor of Land & Water Science and Co-Director of the Centre for Sustainable Water Management in the Lancaster Environment Centre, Lancaster University. Part-time Chief Scientific Advisor for Rural & Environment for the Scottish Government. 17 Dec 2012 - 16 Dec 2016 0 0 1
Professor M Lockwood Professor of Space Environment Physics in the Department of Meteorology, University of Reading. 01 Mar 2007 - 31 July 2013 5 - 10 5 - 10
Professor G Mace Professor of Biodiversity & Ecosystems at University College London 01 Aug 2011 - 31 July 2015 5 - 10 0 - 5
Professor T Meagher Professor and Chair of Plant Biology at the University of St Andrews 01 Aug 2007 - 31 Dec 2013 5 - 10 5 - 10
Professor P Monks Professor of Atmospheric Chemistry, University of Leicester 01 Aug 2011 - 31 July 2015 5 - 10 0 - 5
Professor J Slingo Chief Scientist, Met Office 01 May 2009 - 30 April 2017 0 0 1
Professor A Watson Professor at the School of Environmental Sciences, University of East Anglia 01 Aug 2008 - 31 July 2015 5 - 10 5 - 10
Professor R Watson Chief Scientific Advisor to DEFRA 01 Dec 2007 - 31 July 2012 0 0 1
Lord Willis of Knaresborough Member of the House of Lords Science & Technology Committee 01 Aug 2011 - 31 July 2015 5 - 10 0 - 5
Ms R Willis Independent consultant in environmental policy and practice 01 Aug 2011 - 31 July 2015 5 - 10 0 - 5
Professor M Wilson Professor at the Institute of Geophysics, School of Earth and Environment, Pro-Dean for Research in the Faculty of Environment, University of Leeds 01 Mar 2007 - 31 July 2013 5 - 10 5 - 10
Notes 1 Honoraria are not payable to members who are civil servants, employees of NERC or full time employees of organisations whose
funds are derived from Votes of Parliament. 2 Graeme Reid attends Council as a BIS observer and is not remunerated for his services.
Table 3: Membership of the NERC Council (2012-13)2
Professor Duncan WinghamChief Executive and Accounting Officer26 June 2013

41
ACCOUNTS 2012-13
Statement of Account for the Financial Year 2012-13
STATEMENT OF CHIEF EXECUTIVE’S RESPONSIBILITIES WITH RESPECT TO THE FINANCIAL STATEMENTS
Under Paragraph 3 of Schedule 1 to the Science and Technology Act 1965, the Secretary of State for the Department for Business, Innovation and Skills has directed the Council to prepare for each financial year a statement of accounts in the form and on the basis set out in the Accounts Direction. The accounts are prepared on an accruals basis and must give a true and fair view of the state of affairs of the Natural Environment Research Council and of its comprehensive net expenditure and cash flows for the financial year.
In preparing the accounts the Chief Executive as the Accounting Officer is required to comply with the requirements of the Government Financial Reporting Manual and in particular to:
l observe the Accounts Direction issued by the Department for Business, Innovation and Skills, including the relevant accounting and disclosure requirements, and apply suitable accounting policies on a consistent basis;
l make judgements and estimates on a reasonable basis;l state whether applicable accounting standards as set out in the Government Financial Reporting Manual (www.hm-treasury.gov.uk/frem_index.htm) have been followed, and disclose and explain any material departures in
the financial statements; and l prepare the financial statements on the going concern basis.
The Department for Business, Innovation and Skills has appointed the Chief Executive as Accounting Officer of the Natural Environment Research Council. The responsibilities of an Accounting Officer, including responsibility for the propriety and regularity of the public finances for which the Accounting Officer is answerable, for keeping of proper records and for safeguarding the Natural Environment Research Council’s assets, are set out in the Non-Departmental Public Bodies’ Accounting Officers’ Memorandum, issued by HM Treasury and published in ‘Managing Public Money’ (The Stationery Office). GOVERNANCE STATEMENT
Scope of ResponsibilityAs Accounting Officer, I have responsibility for maintaining a sound system of internal control that supports the achievement of NERC’s policies, aims and objectives, as approved by Council, whilst safeguarding the public funds and NERC assets for which I am personally responsible. This is in accordance with the responsibilities assigned to me in ‘Managing Public Money’.
The purpose of the Governance StatementThe Governance statement, for which I take personal responsibility, gives a clear understanding of the dynamics of NERC and its control structure. It records the stewardship of NERC, and provides a sense of NERC’s performance during the year and how successfully it has coped with the challenge it faces. The statement explains how NERC has complied with the principles of Good Governance and reviews the effectiveness of these arrangements.
Governance StructureThe NERC Council is the senior decision making body and includes members from NERC’s academic and user communities. Membership is reviewed annually, appointments are advertised nationally and members are ultimately appointed by the Secretary of State for Business Innovation and Skills. Details of Council membership can be found at:www.nerc.ac.uk/about/work/boards/council/members.asp
The role of NERC Council is to decide on all issues of major importance, principally issues of corporate strategy, key strategic objectives and targets, major decisions involving the use of resources and personnel issues, including key appointments. Responsibility for carrying out key strategy and responsibilities associated with the day to day management of NERC is delegated to the Chief Executive.

NERC Annual Report & Accounts 2012-13
42
The powers, roles, responsibilities and membership of Council are defined in its Royal Charter. The nature of its relationship with its sponsor department, the Department for Business Innovation and Skills (BIS), is defined in the Management Statement and Financial Memorandum agreed with DIUS (a predecessor department of BIS) in 2005. These documents are available on the NERC website at: www.nerc.ac.uk/about/work/boards/intro/
Council has established three bodies to support it in discharging its responsibilities:i. the Audit & Risk Assurance Committee (ARAC);ii. the Science & Innovation Strategy Board (SISB); andiii. the NERC Investment Committee (NIC).
The responsibilities of the Chief Executive, who is also the Accounting Officer of the Council, are also set out in the Management Statement and Financial Memorandum. I may delegate the administration of these responsibilities to Council’s employees but may not assign any of the responsibilities absolutely to any other person. I have established the NERC Executive Board (NEB) to support me in discharging these responsibilities.
Council & audit & risk assurance committee: attendance & highlights report for 2012-13
Council met five times during 2012-13. The membership/attendance record is as follows:Council membership and attendance* record:
Name Position held Appointment from/to Attendance record
Mr Ed Wallis Chairman 01.01.07 – 01.01.14 5/5
Prof Duncan Wingham CE NERC 01.01.12 – 31.12.15 5/5
Prof Paul Curran Member 01.08.06 – 31.07.14 4/5
Mr Rowan Douglas Member 01.08.08 – 31.07.15 2/4
Prof Charles Godfray Member 01.08.08 – 31.07.15 5/5
Prof Mike Lockwood Member 01.03.07 - 31.07.13 4/5
Prof Georgina Mace Member 01.08.11 – 31.07.15 5/5
Prof Thomas Meagher Member 01.08.07 – 31.07.13 5/5
Prof Paul Monks Member 01.08.11 – 31.07.15 4/5
Prof Julia Slingo Member 01.05.09 – 30.04.17 5/5
Prof Andrew Watson Member 01.08.08 – 31.07.15 5/5
Prof Robert Watson Member 01.12.07 – 31.07.12 2/2
Prof Marjorie Wilson Member 01.03.07 – 31.07.13 3/5
Lord Willis of Knaresborough Member 01.08.11 – 31.07.15 3/5
Ms Rebecca Willis Member 01.08.11 – 31.07.15 5/5
Prof Louise Heathwaite Member 17.12.12 – 16.12.16 1/2
Prof Ian Boyd Member 01.02.13 – 31.01.17 0/1
*The quorum of Council is six members (as stated in the NERC Royal Charter)

43
ACCOUNTS 2012-13
The main topics of discussion during 2012, in addition to the standing items, were as follows:l The new NERC Strategy The current NERC strategy Next generation science for planet Earth was developed during 2005 and 2007. Some of
the political, economic, social, environmental and science drivers have evolved significantly since 2005-07, so work has begun on the development of a new NERC strategy.
l Demonstrating the impact of NERC science Developing and implementing plans to strengthen NERC’s approach to innovation and impact. NERC strengths in
contributing to investment decisions (e.g. when to replace the Thames barrier), policy development (e.g. DEFRA national ecosystem assessment and environment white paper) and cost avoidance (e.g. human and economic costs of flooding) are recognised. Nevertheless, Council resolved that NERC must act urgently to address a relative weakness in business impact.
l Living With Environmental Change (LWEC) Programme Council discussed the findings of the mid-term evaluation of the Living With Environmental Change (LWEC)
programme and agreed a programme of reforms as a result of this review.l Evaluation of NERC Research Centres Council discussed and agreed a programme of evaluation of the science excellence and impact of NERC Research
Centres via a process of expert review.l British Antarctic Survey/National Oceanography Centre Merger In June 2012 NERC carried out a public consultation on a potential merger of BAS and NOC, creating a new Centre
encompassing polar and marine science. Council considered the responses to this public consultation as well as feedback from Parliament, Government, the polar affairs community, scientists, and NERC staff and agreed that it would not proceed with the proposal of merger. Additionally, the Minister of State for Universities and Science, David Willetts, announced that looking to the future, without pre-empting the timing and size of the next spending review settlement, he considered that NERC should have discrete funding line for Antarctic infrastructure and logistics from within the ring-fenced science budget to ensure a visible UK commitment to maintaining Antarctic science and presence.
ARAC is a sub-Committee of Council and reports throughout the year on its activity to Council through access to its minutes and orally by the Chairman of ARAC who is a member of Council. The Committee met five times during the course of 2012 with full meetings in April, June and October 2012 and February 2013 and at its annual members’ meeting in December 2012. The membership/attendance record is as follows:
Audit and Risk Assurance Committee membership and attendance record:
Name Position held Appointment from/to Attendance record
Prof Paul Curran Chairman 01.08.11 – 31.07.14 5/5
Mr Rowan Douglas Member 01.08.11 – 30.04.12 1/1
Mr David Hyde Member 01.06.05 – 31.08.13 5/5
Prof Paul Monks Member 01.10.12 – 31.12.15 2/2
Mr Bryan Thompson Member 01.09.09 – 31.08.14 5/5
As part of its normal business, ARAC considered and commented on the AASG audit plan for the year, received copies of AASG reports, was provided with status updates on audit recommendations and reviewed aspects of NERC’s internal control systems in line with its terms of reference.
The key items of discussion this year have been:l Change of Audit Committee name, role and terms of reference. ARAC changed its name from the Audit Committee to the Audit and Risk Assurance Committee as of 21st February
2013 (Council approved this change). The driver for this change was to ensure that the emphasis given by ARAC to risk issues through engagement with risk owners was reflected both within the Committee’s title and within revised terms of reference. The changes took account of the HM Treasury and The Cabinet Office Corporate Governance in Central Government Departments: Code of Good Practice which requires the Research Councils to ensure that their corporate governance protocols mirror the Code wherever practicable.
Associated with this change, revised Terms of reference were approved by Council on 21st February 2013.
NERC Annual Report & Accounts 2012-13
44
l The NERC Annual Report and Statutory Accounts 2012-13 ARAC carried out a full review of the NERC financial statements to ensure they reflected best practice and was
informed in this task by the National Audit Office reporting on its audit and matters arising. ARAC sought and obtained assurance about the revised audit timetable in order to ensure that the accounts were presented before Parliament in good time.
l The NERC Risk Register ARAC agreed that additional time would be allowed in future agendas for the Chief Executive to discuss with ARAC
current NERC risks and that ARAC would offer advice and opinion on those risks. ARAC also agreed that members of the NERC executive would be invited to future ARAC meetings to discuss risks within their particular area of responsibility. Professor Ed Hill, who was the Executive Director NOC and Interim Director BAS, attended the October 2012 meeting to discuss risks related to capital reduction, the loss of major platforms and the consultation on the proposed BAS/NOC merger.
l UKSBS Ltd (formerly RCUK SSC Ltd) Stabilisation Programme ARAC discussed RCUK shared assurance and its potential to impact on NERC assurance. ARAC Chair and the Chair
of SSC Audit Committee exchanged correspondence about these concerns and ARAC sought assurance that when the Stabilisation Board had reached its conclusions, NERC would be provided with the plan to manage any outstanding issues. ARAC received this assurance and was able to monitor the implementation of the AASG recommendations for stabilisation.
ARAC is an advisory body with no executive powers. However, it is authorised by Council to investigate any activity within its terms of reference, which include the review of NERC’s internal and external financial statements/reports and to review NERC’s internal control systems in matters such as risk, health & safety and security.
Remuneration CommitteeUnder the remit of Council’s Remuneration Committee, the Senior Staff Salaries Review Committee (SSSRC) determines base pay movement and annual performance bonuses for NERC’s staff at Band 1 and 2 levels. This category of staff includes all Directors and NEB level appointments.
The Committee is chaired by Chairman of Council and includes two Council members and the Chief Executive with the Director of People and Skills as an adviser. It met once during 2012-13 in the margins of the December Council meeting. The membership/attendance record is as follows:
Name Position held Appointment from/to Attendance record
Mr Ed Wallis Chairman 01.01.07 – 01.01.14 1/1
Prof Duncan Wingham CE NERC 01.01.12 – 31.12.15 1/1
Prof Paul Curran Member 01.01.12 – 31.07.14 1/1
Prof Paul Monks Member 01.01.12 – 31.08.15 1/1
Mr Jonathan Bates Director, People & Skills N/A 1/1
Corporate Governance CodeThe structure and operations of Council and ARAC were benchmarked against the Corporate Governance Code during 2012-13. It can therefore be confirmed that they comply with its requirements.
Risk and Internal Control FrameworkThe purpose of the system of internal controlThe system of internal control is designed to manage risk to a reasonable level rather than to eliminate all risk of failure to achieve policies, aims and objectives; it can therefore only provide reasonable and not absolute assurance of effectiveness. The system of internal control is based on an on-going process designed to identify and prioritise the risks to the achievement of organisational policies, aims and objectives, to evaluate the likelihood of those risks being realised and the impact should they be realised, and to manage them efficiently, effectively and economically. The system of internal control has been in place in NERC for the year ended 31 March 2013 and up to the date of approval of the annual report and accounts, and accords with Treasury guidance.

45
ACCOUNTS 2012-13
Capacity to handle riskOverall responsibility for risk management in NERC lies with the Chief Executive, who as the NERC Accounting Officer signs this annual Governance Statement as part of the audited Annual Accounts. Currently I delegate the task of implementing and maintaining the risk management policy and strategy to the Director Finance and Operations, who fulfils the role of Director Responsible for Risk. The Director Responsible for Risk’s responsibilities include overseeing the activities of the Risk Management Network and reporting on risk management to NEB. NERC Directors have a responsibility to ensure the effective application of NERC’s risk management strategy and policy. These arrangements ensure risk management is an integral part of NERC’s management style and is tied to core activities reflected in the NERC Strategic Management Tool and BIS scorecard.
NEB is the owner of the NERC Risk Management Strategy and is responsible for reporting issues relating to risks and their management to Council, and for receiving assurance from NERC staff that risks are managed appropriately and passing this assurance to Council.
In executing these responsibilities the role of NEB can be characterised as follows:l Monitor: i) overseeing the process ii) noting business critical risks iii) noting mitigation strategies iv) reviewing audit output v) annual review of risk and the risk management systems in place;l Decide: i) setting and communicating the NERC level risk appetitel Direct: i) setting delegated authority levels ii) solving risk management dilemmas (when asked to do so)
As a minimum, the top risks’ listing is reviewed quarterly. NEB will review specific, high risk, matters at each meeting together with issues relating to any risks that are referred upwards by Research Centre Directors and others via the agreed escalation procedures.
NEB encourages sound properly managed risk taking and recognises that effective risk management, rather than risk avoidance, is an essential ingredient for successful business operations.
NEB Directors appoint ‘owners’ for all risk threats as they emerge. These risk owners are most likely to be middle / senior managers within NERC Swindon Office and the Research Centres. Risk owners have responsibility for the practical day to day management of risks and are responsible for ensuring that appropriate management plans are prepared and that risk response actions are carried out effectively. Responsibility for managing key business risks is retained at a senior level.
Risks are managed by trained and experienced people. All staff in NERC participate in an annual appraisal, where individual training needs and personal development requirements are identified and assessed. The Risk Management Network, supported by the Risk and Assurance Manager, will be responsible for identifying specific risk management training needs and making proposals to management at appropriate levels about how such training should be provided. The Network will periodically review the delivery and take-up of such training and include a commentary in the annual report to NEB.
The NERC Risk Management Network, which currently meets at least once each year, helps promote best practice in risk management across NERC by sharing lessons learnt and monitoring compliance with (and continued relevance of) the NERC Risk Management Strategy and Policy (which are available to all staff via the NERC extranet).
The risk and control frameworkThe purpose of the NERC Risk Management Strategy is to describe at a high level how NERC will implement its Risk Management Policy, setting out the necessary organisation, roles and responsibilities, along with the framework and underlying principles of the control system.
NERC Directors have a responsibility to ensure the effective application of NERC’s risk management strategy and policy. Directors must satisfy themselves that the following issues have been adequately addressed within their areas of responsibility:l the requirements of corporate governance – these include developing more focused and open ways of managing risk and
ensuring that all NEB decisions on managing risk are implemented.l the need to identify appropriate ‘risk owners’ at a sufficiently senior level for all identified risks.

NERC Annual Report & Accounts 2012-13
46
l the adequacy of reporting arrangements that ensure the timely escalation of major risk issues internally within their area of responsibility; and, where appropriate externally to NEB. And that these arrangements are in line with delegated authority levels and the provisions of Research Centre Management Statements (where these apply).
l the need to ensure a shared understanding of risk management principles, thereby ensuring a consistent approach to the treatment of risks at all levels.
l deciding the overall risk tolerance level, or ‘risk appetite’ for areas that they have a responsibility for (mindful of the NERC level risk appetite determined by NEB).
NERC has a web-based database to host the NERC risk register. The system is known as STAR (System for Targets and Risks). STAR is the cornerstone of NERC risk management and provides a single system for recording Business Risks, Business Critical Projects and activities reflected in the NERC Strategic Management Tool and BIS scorecard. In addition to attaching scores to risks and identifying mitigation tactics, STAR also records information concerning quarterly progress against plan by way of a ‘traffic light system’. Reports from STAR are considered by Council (NERC Top Risks), NEB (NERC Top Risks /NERC Strategic Management Tool and BIS scorecard activities progress report) and the NERC Audit Committee (NERC Top Risks / Business Critical Projects status report). STAR also provides the quarterly report to BIS that details progress towards completing activities that feature in the BIS scorecard.
Review of EffectivenessAs Accounting Officer, I have responsibility for conducting an annual review of the effectiveness of the system of the organisation’s governance, risk management and internal control. This review is informed by the work of executive managers within the organisation who have responsibility for the development and maintenance of the governance structures and internal control framework; and comments made by internal/external auditors in their management letter and reports. The Governance Statement represents the end product of the review of the effectiveness of the governance framework, risk management and internal control.
The system of internal control can provide only reasonable and not absolute assurance that NERC’s internal control framework is operating as intended. My review of the effectiveness of the internal control framework is informed by this year’s Director’s Annual Statements on Internal Control (DASICs), the work of the Audit and Assurance Service Group (AASG), comments made by the National Audit Office (NAO) in their management letter and other reports, and the advice of the Director Responsible for Risk Management concerning the progress made on risk management and related matters.
DASIC Exercise (Directors’ Stewardship Statements)NERC Directors are required to provide a Directors Annual Statement on Internal Control, (DASIC) concerning the effectiveness of internal control within their area of responsibility. The 2012 DASIC exercise did not identify any significant internal control weaknesses.
In response to a request from the Department of Business Innovation and Skills, relevant Directors have confirmed via their DASIC stewardship statement that:l Board members and senior officials with significant financial responsibility are on the organisation’s payroll;l assurances are sought regarding the tax and NICs obligations of any off-payroll staff;l all staff are aware of the need to comply with austerity measures.
Advice from Audit and Assurance Service GroupIn December 2011, the RCUK Efficiency and Reform Group approved a proposal to merge the separate business operations of Research Councils Internal Audit Service and RCUK Assurance into a single administrative business function. Following the implementation, a merged assurance group came into being on the 2nd April 2012, under the re-branded title of Audit and Assurance Services Group (AASG).
The Director of the Audit and Assurance Service Group (AASG), NERC’s internal auditor, provides an annual internal audit opinion on the overall adequacy and effectiveness of NERC’s framework of governance, risk management and control. This opinion is informed by the internal audit work undertaken during the year. The Director has provided NERC with an overall opinion of ‘Substantial Assurance’, reflecting a basically sound system of internal control, but where there are a few weaknesses that may put achievement of some system objectives at risk.
The work of the AASG provides assurance in three areas: NERC core activities; cross-Council activities which NERC is involved in; processes shared by NERC with the UK Shared Business Services (UKSBS Ltd);

47
ACCOUNTS 2012-13
i) NERC Core and Cross Council Activities - of the 15 assurances provided through the audit programme, 80% reflect substantial assurance, with improvement plans being put in place for:
l Training and Development to ensure that learning and development planning is embedded into strategic planning process through Centre Activity & Resource Plans;
l A clearer Goods Received Not Invoiced policy and process is promulgated and applied.
ii) NERC/UKSBS Ltd Shared Assurance – of the end-to-end processes audited, 86% (12) received Substantial Assurance in 2012-13 compared to 36% in 2011-12. However not all material improvements have been made to the system of internal control to ensure system objectives are achieved. Some 14% (2) of the E2E processes received Limited Assurance: GPC and IExpenses; and Order to Cash. Across the client base non-compliance with the iExpenses process is high (21% of claims processed contain policy violations) and there are quality shortfalls in the master data that supports the Order to Cash process. AASG identified 5 key issues where they believed NERC’s exposure was potentially high. These were investigated by NERC and where necessary control measures were improved.
Within the Controls and Security Framework, 3 key areas continue to receive Limited Assurance: Network Security; Master Services Data and E2E process Governance. Improvements in these areas through delivery of action plans are relatively recent, outstanding or extend into 2013-14. There are 5 high priority issues that remain open and require improvement to the control and risk management framework:
l Documentation to support, review and update Oracle database security configurations is requiredl Network maintenance and access controls need strengtheningl The control framework for the creation and maintenance of master data needs strengtheningl The management assurance framework needs to be established and reliablel An appropriate IT Governance and IT Security Strategy is required
In April 2013 UKSBS Ltd (formerly SSC) informed me that it had been the subject of a number of instances of attempted fraud which had been identified and avoided, and were now subject to an investigation. Follow up work by AASG concluded that the control framework for Master Data Maintenance had some identified risk exposures which were being addressed to reduce vulnerability. As such, the issues highlighted by these fraud attempts relate directly to the findings of recent internal audit reports on the controls and security framework operating within UKSBS Ltd which identified specific control weaknesses. In addition, these weaknesses had been identified by internal audit reports in earlier years and measures to address them had been recommended previously by AASG. I consider the level of risk of financial loss to which the NERC has been exposed to be low. However, I am concerned that the limited assurance provided by internal audit work with regard to some elements of the controls and security framework within UKSBS Ltd represents an area of risk for the NERC which I am not able to directly manage.
UKSBS Ltd has provided me with assurance that it is dealing with the matter appropriately, with regards to both the fraud attempts and necessary improvements to control frameworks, and that it is not aware of any fraud or suspected fraud affecting UKSBS Ltd or NERC. In the coming year the ARAC will review the outcomes of internal audit work by the AASG to check that improved control frameworks have been implemented and assess the evidence that they are adequate and effective.
NAO Management letter The management letter from NAO concerning the audit of the 2012-13 accounts has not raised any material issues that will have implications for internal control.
Activity of AASG’s Assurance Unit AASG is hosted by BBSRC and acts on behalf of all the Research Councils by reviewing the regularity of expenditure on Research Council grants at all eligible Research Organisations. The programme typically involves around 15-20 visits per annum to the research intensive organisations, supplemented by 15 desk based reviews for the less research intensive bodies. Assurance activities focus on the control environment and its effectiveness in ensuring compliance with the Research Councils’ terms and conditions which accompany grant funding, with a further strand of work focusing on the scrutiny of the costing methodology used in research organisations, which for universities is the Transparent Approach to Costing (TRAC). The programme is an important element of the risk management framework for NERC with an annual report produced for me, as the Accounting Officer, which reports on activities undertaken in the year as well as proposed activities for the following year.
NERC Annual Report & Accounts 2012-13
48
For 2012-13, seventeen visits were undertaken along with fifteen desk based reviews. Whenever specific issues are identified with universities, an action plan is agreed to ensure appropriate improvements are introduced. The work undertaken in 2012-13 and related findings provided me with a satisfactory level of assurance.
Client Assurance Service Group (CSG)The RCUK Shared Services Centre (SSC now UKSBS Ltd) project ended on 31 March 2011. Since that date, the body responsible for co-ordinating the Councils’ collective engagement with the SSC as clients has been the CSG. This role has been fulfilled alongside a range of assurance mechanisms established by BIS as part of the SSC stabilisation process and move toward on boarding new clients into the SSC. For example from January 2012, a joint SSC/CSG assurance reporting framework was established to report to the BIS Assurance Board, set up to monitor the stability for the services provided by the SSC.
The CSG has taken responsibility for, inter alia, the negotiation of annual service charges and development funding; the development of business improvement activities in each of the main functional areas covered by SSC service delivery; and oversight of an end to end audit assurance programme. Formal approval of funding is however made by the Efficiency and Reform Group, advised by CSG.
Overall AssuranceThe current level of assurance is green/amber. During the year our emphasis has been placed on seeing SSC through to stabilisation. As part of this process BIS have taken an active role in establishing robust structures with cross Council representation to oversee progress and input from AASG. The purpose of this framework was to ensure that the control structures surrounding the end-to-end shared business processes are suitably designed and established (control design), and operating as intended (control effectiveness and fit for purpose).
During 2011-12 AASG carried out nineteen business process audits across all functional areas. During 2012-13 AASG revisited these audits and actively reviewed all outstanding ‘High’ priority recommendations seeking evidence of both implementation and effectiveness. All recommendations were signed off as completed and evidence provided however their effectiveness continues to be monitored as part of the on-going review process.
In addition a revised suite of performance indicators have been put in place (Critical Performance Indicators – CPIs). Latest analysis indicates that the overall direction of travel for each of the areas is positive.
Stabilisation was formally signed off with a few caveats, however issues remain around the Controls and Security Framework, highlighted by AASG. NERC will continue to monitor and stress the importance of making sure that UKSBS Ltd performance, not just maintains these standards, but continues to improve, particularly as new clients come on board.
Managing the Risk of Financial LossThe Managing the Risk of Financial Loss (MRoFL) initiative was introduced by BIS/HMT during 2011-12 and applies to all transaction processing systems that result in payments or receipts. It represents an annual review of six core financial systems:l Procurement l Payrolll Expensesl Fundingl Grantsl Taxation receipts (relates to commercial income in the Research Councils context)
The first year’s findings and recommendations were consolidated into a report that was sent to BIS in December 2011. The NERC Audit Committee subsequently monitored progress towards implementing the improvement actions contained therein. All the actions to address internal control weaknesses identified during the first year’s work have now been completed. The cross Research Council Group that co-ordinated the first year’s work has continued, and the second pass of this exercise is underway and will report later in 2013.
Austerity measures All staff have recently been reminded of these requirements with the issue of a communication from the Director of Finance and Operations before Christmas. This also reminded staff that all expenditure was now published on an open website. Purchases over £5k are approved by line managers and budget holders and all purchases below 5k are subject to dipstick testing.

49
ACCOUNTS 2012-13
Fraud InvestigationsThere were a number of investigations into non-compliance during 2012. These investigations did not identify any systemic weaknesses, but have resulted in improvements to GPC cardholder awareness across the organisation concerning how GPC should be used. A number of overpayments related to misunderstanding/non-compliance have been recovered.
During April 2013 UKSBS Ltd informed me that it had been the subject of a number of instances of attempted fraud, which had been identified and avoided and were now subject to an investigation. RCUK SSC has provided me with assurance that it is dealing with the matter appropriately, with regards to both the fraud attempts and necessary improvements to control frameworks, and that it is not aware of any fraud or suspected fraud affecting UKSBS Ltd or NERC.
Fraud hot-line/whistle blowing: A concern raised by a member of staff was reported, fully investigated but found to have no substance.
Counter-fraud activity:NERC counter-fraud systems continue to work efficiently and effectively. The Audit & Risk Assurance Committee are provided with updates at each meeting.
The Research Councils (via the RCUK Risk and Assurance Group) have made arrangements for the RCUK SSC to host a common counter-fraud awareness raising e-learning package in response to BIS/Cabinet Office initiatives. The package and intended approach has been approved by BIS.
Losses and write-offs Significant losses for the year consisted of settlements and legal costs of three legal cases against NERC totalling £174k and the demolition costs of an unused building at Bidston of £177k. BIS approval has been sought and received for each of these significant losses. None of the losses appears to be related to an internal control weakness.
Project Management and Gateway ReviewsNo Gateway Reviews were undertaken during 2012-13:
Information AssuranceDuring 2012-13, the NERC Information Assurance Group IAG) continued to formally meet and coordinate NERC Information and Technology risks. Revised information security related policies were signed off and introduced. Rollout of Personal Responsibility Statements for all staff has commenced. No incidents of personal data loss have occurred. There is an increased threat level to network security and this will be reviewed during the coming year. Advanced attacker activity on the network was detected during the year. NERC worked with a company assured under the HMG Cyber Incident Response scheme to respond and put protective measures in place to reduce the risk of further attacks.
Risk ManagementIt is my judgement that NERC fully satisfies the ‘six elements of risk management that organisations must have in place’ as set out in Annex 2 of DAO(GEN)09/03. I am satisfied with the performance of our risk management system (including the activity of the risk Management Network), and this view is supported by the ‘substantial assurance’ provided by AASG in their last audit of this system in 2010.
Disclosure of internal control problemsMy review has identified the following internal control weaknesses affecting NERC that are discussed earlier and are summarised as follows:
The need to:l improve embedding of learning and development planning into NERC’s strategic planning processl improve the Goods Received Not Invoiced process and policy l improve consistent appliance of new GPC policy across all users and tighten control of usage through policy
implementationl improve adequacy of local Inventory Registers to ensure that low value but attractive items are properly recordedl improve compliance with iExpenses policy and reduce the level of policy violationsl improve the quality of the master data that supports the Order to Cash processl Improve the Controls and Security Framework in place with UKSBS Ltd that underpins the E2E process

NERC Annual Report & Accounts 2012-13
50
ConclusionI have been advised on the implications of the result of my review of the effectiveness of the system of internal control by NEB, the Audit Committee and the Director Responsible for Risk. Plans to address all weaknesses identified and measures to ensure continuous improvement of the system of internal control are in place.
I have considered the evidence provided with regards to the production of the Annual Governance Statement. The conclusion of the review is that the Organisation’s overall governance and internal control structures are satisfactory.
Professor Duncan WinghamChief Executive and Accounting Officer26 June 2013
THE CERTIFICATE AND REPORT OF THE COMPTROLLER AND AUDITOR GENERAL TO THE HOUSES OF PARLIAMENT
I certify that I have audited the financial statements of the Natural Environment Research Council for the year ended 31 March 2013 under the Science and Technology Act 1965. The financial statements comprise: the Statement of Comprehensive Net Expenditure, the Statement of Financial Position, the Statement of Cash Flows, the Statement of Changes in Taxpayers’ Equity and the related notes. These financial statements have been prepared under the accounting policies set out within them. I have also audited the information in the Remuneration Report that is described in that report as having been audited.
Respective responsibilities of the Council, Accounting Officer and auditorAs explained more fully in the Statement of Chief Executive’s Responsibilities With Respect To The Financial Statements, the Accounting Officer is responsible for the preparation of the financial statements and for being satisfied that they give a true and fair view. My responsibility is to audit, certify and report on the financial statements in accordance with the Science and Technology Act 1965. I conducted my audit in accordance with International Standards on Auditing (UK and Ireland). Those standards require me and my staff to comply with the Auditing Practices Board’s Ethical Standards for Auditors.
Scope of the audit of the financial statementsAn audit involves obtaining evidence about the amounts and disclosures in the financial statements sufficient to give reasonable assurance that the financial statements are free from material misstatement, whether caused by fraud or error. This includes an assessment of: whether the accounting policies are appropriate to the Natural Environment Research Council’s circumstances and have been consistently applied and adequately disclosed; the reasonableness of significant accounting estimates made by the Natural Environment Research Council; and the overall presentation of the financial statements. In addition I read all the financial and non-financial information in the Annual Report and Accounts to identify material inconsistencies with the audited financial statements. If I become aware of any apparent material misstatements or inconsistencies I consider the implications for my certificate and report.
I am required to obtain evidence sufficient to give reasonable assurance that the expenditure and income recorded in the financial statements have been applied to the purposes intended by Parliament and the financial transactions recorded in the financial statements conform to the authorities which govern them.
Opinion on regularityIn my opinion, in all material respects the expenditure and income recorded in the financial statements have been applied to the purposes intended by Parliament and the financial transactions recorded in the financial statements conform to the authorities which govern them.
Opinion on financial statementsIn my opinion: l the financial statements give a true and fair view of the state of the Natural Environment Research Council’s affairs as
at 31 March 2013 and of its comprehensive net expenditure for the year then ended; andl the financial statements have been properly prepared in accordance with the Science and Technology Act 1965 and
Secretary of State directions issued thereunder.

51
ACCOUNTS 2012-13
Opinion on other matters In my opinion:l the part of the Remuneration Report to be audited has been properly prepared in accordance with Secretary of State
directions made under by the Science and Technology Act 1965; andl the information given in the Delivering the Strategy and Management Commentary sections for the financial year for
which the financial statements are prepared is consistent with the financial statements.
Matters on which I report by exceptionI have nothing to report in respect of the following matters which I report to you if, in my opinion:l adequate accounting records have not been kept or returns adequate for my audit have not been received from
branches not visited by my staff; orl the financial statements and the part of the Remuneration Report to be audited are not in agreement with the
accounting records or returns; orl I have not received all of the information and explanations I require for my audit; orl the Governance Statement does not reflect compliance with HM Treasury’s guidance.
ReportI have no observations to make on these financial statements.
Amyas C E MorseComptroller and Auditor GeneralNational Audit Office157-197 Buckingham Palace RoadVictoriaLondonSW1W 9SPDate: 1 July 2013

NERC Annual Report & Accounts 2012-13
52
STATEMENT OF COMPREHENSIVE NET EXPENDITURE FOR THE PERIOD ENDED 31 MARCH 2013
2013 2012 £000 £000 Notes
Expenditure
Staff costs 5(b) 105,828 109,426Staff early retirements 6 8,255 5,163Grants and training 7 170,660 169,808Other operating costs 8 92,773 99,181Depreciation 9(a) 28,672 26,496Amortisation 10 59 128Losses and impairments of joint ventures and investments 9(c) 2,278 1,736Impairment of property, plant and equipment 9(a),11 5,359 2,189
Total expenditure 413,884 414,127
Income 4 (59,720) (56,087) Net expenditure 354,164 358,040
Finance lease interest 799 922Interest receivable (12) (6)
Net expenditure after interest 354,951 358,956 CEH restructuring 14 191 51Unwinding of discount 14 355 250Change in discount rate 14 552 9Loss on disposal of fixed assets 1,514 25
Total net expenditure for the year 357,563 359,291 Other comprehensive expenditure Net gain on revaluation of property, plant and equipment (1,580) (20,705)Net gain on revaluation of intangible assets (4) (132)Net loss on revaluation of investment property - -Net loss on revaluation of assets held for sale - - TOTAL COMPREHENSIVE ExPENDITURE FOR THE YEAR ENDED 31 MARCH 2013 355,979 338,454 All activities are continuing. The notes on pages 56 to 80 form part of these accounts.

53
ACCOUNTS 2012-13
STATEMENT OF FINANCIAL POSITION AS AT 31 MARCH 2013
31 March 31 March 31 March 2013 2012 2011 Restated(i) Restated(i)
Notes £000 £000 £000 £000 £000 £000
Non-current assets Property, plant and equipment 9(a)(b) 401,183 401,613 355,433 Intangible assets 10 117 172 174 Non-current receivables 12(b) 90 122 167 Jointly Controlled Entities and Unconsolidated Investments 9(c) 125 10,258 12,019 Total non-current assets 401,515 412,165 367,793
Current assets Assets classified as held for sale 11 70 69 224 Trade and other receivables 12(a) 24,608 24,088 39,570 Cash and cash equivalents 15 21,962 14,372 12,361
Total current assets 46,640 38,529 52,155
Total assets 448,155 450,694 419,948Current liabilities
Trade and other payables 13(a) (68,346) (66,028) (77,969) Provisions 14 (3,609) (4,805) (2,924)
Total current liabilities (71,955) (70,833) (80,893)
Non-current assets plus current
assets less current liabilities 376,200 379,861 339,055
Non-current liabilities
Provisions 14 (6,487) (6,418) (7,490) Trade and other payables 13(b) (7,097) (8,764) (10,299)
Total non-current liabilities (13,584) (15,182) (17,789)
Assets less liabilities 362,616 364,679 321,266 Taxpayers’ Equity Revaluation reserve 94,445 100,746 86,863Income and expenditure reserve 268,171 263,933 234,403
TOTAL GOVERNMENT FUNDS 362,616 364,679 321,266
Note: (i) Restated to exclude bank balances held on behalf of 3rd parties and the related liabilities.The notes on pages 56 to 80 form part of these accounts. Professor Duncan WinghamChief Executive and Accounting Officer26 June 2013

NERC Annual Report & Accounts 2012-13
54
Notes 2013 2012 Restated(i)
£000 £000 £000 £000
Cash flows from operating activities
Net expenditure after interest (354,951) (358,956)Depreciation charge 9(a) 28,672 26,496Amortisation charge 10 59 128Loss on joint venture 9(c) 2,278 1,736Impairment charged to net expenditure account 9(a) 5,359 2,189(Decrease) / increase in provisions 14 (2,225) 500(Increase) / decrease in trade and other receivables 12 (488) 15,528Increase / (decrease) in trade and other payables 13 2,187 (12,064)
Net cash outflow from operating activities (319,109) (324,443)
Cash flows from investing activities Payments to acquire property, plant and equipment 9(a),(b) (33,908) (55,936)Payments to acquire intangible assets 10 - (2)Receipts from disposal of property, plant and equipment, intangible assets and investments 8,226 1,938 Net cash outflow from investing activities (25,682) (54,000)
Cash flows from financing activities Grant-in-aid and other BIS funding 3 353,916 381,866Capital element of finance lease payments 17 (1,535) (1,412)
Net cash inflow from financing activities 352,381 380,454
Net increase / (decrease) in cash and cash 7,590 2,011equivalents in the period
Cash and cash equivalents at the beginning of the period 14,372 12,361
Cash and cash equivalents at the end of the period 21,962 14,372
Note: (i) Restated to exclude bank balances held on behalf of 3rd parties and the related liabilities.The notes on pages 56 to 80 form part of these accounts.
STATEMENT OF CASH FLOWS FOR THE PERIOD ENDED 31 MARCH 2013

55
ACCOUNTS 2012-13
STATEMENT OF CHANGES IN TAXPAYERS’ EQUITY FOR THE PERIOD ENDED 31 MARCH 2013
Notes Accumulated income & Revaluation Total expenditure reserve reserve government funds £000 £000 £000
At 1 April 2012 234,403 86,863 321,266
Changes in taxpayers’ equity for 2011-12 Grant-in-aid and other BIS funding 3 381,866 - 381,866Revaluation in year - 20,838 20,838Net expenditure for the year (359,291) - (359,291)Release to net expenditure 6,955 (6,955) - Balance at 31 March 2012 263,933 100,746 364,679
Changes in taxpayers’ equity for 2012-13 Grant-in-aid and other BIS funding 3 353,916 - 353,916Revaluation in year - 1,584 1,584Net expenditure for the year (357,563) - (357,563)Release to net expenditure 7,885 (7,885) - Balance at 31 March 2013 268,171 94,445 362,616

NERC Annual Report & Accounts 2012-13
56
NOTES TO THE ACCOUNTS
1. Statement of accounting policies
a. Basis of accounting(i) The accounts have been prepared under the historical cost convention, modified to account for the revaluation
of property, plant and equipment, intangible assets and inventories in accordance with the Government Financial Reporting Manual (FReM) for 2012-13. The accounting policies contained in the FReM apply International Financial Reporting Standards (IFRS) as adapted or interpreted for the public sector context. The accounts, which give a true and fair view, have been prepared in accordance with The Science and Technology Act 1965 and with directions made by the Secretary of State. Where the FReM permits a choice of accounting policy, the accounting policy which is judged to be most appropriate to the particular circumstances of the Natural Environment Research Council for the purpose of giving a true and fair view has been selected.
(ii) The accounts meet the accounting and disclosure requirements of the Companies Act 1985 and accounting standards issued or adopted by the Accounting Standards Board in as far as these requirements are appropriate in accordance with the FReM.
(iii) The accounts of all NERC owned research centres have been incorporated into these accounts.(iv) These financial statements are presented in pounds sterling, NERC’s functional currency, and all amounts have been
rounded to the nearest thousand pound (£’000).
Adoption of standards and changes in policyAll International Reporting Standards, Interpretations and Amendments to published standards, effective at 31 March 2013, have been adopted in these financial statements, taking into account the specific interpretations and adaptations included in the FReM.
Effective for future financial yearsThe IASB and IFRIC issued certain standards and interpretations with an effective date after these financial statements. Where these changes are relevant to NERC’s circumstances they are listed below and will be adopted at the effective date. They have not been adopted early and their adoption is not expected to have a material impact on NERC’s reported income or net assets in the period of adoption.
IAS 19 Employee Benefits has been amended to make significant changes to the recognition and measurement of defined benefit pension expense and termination benefits and to the disclosures for all employee benefits. The revised standard has been adopted by the EU and is effective for annual periods beginning on or after 1 January 2013. Under the current interpretation of IAS 19 in the FReM, the new changes in the amended standard are effectively already followed. IAS 27 Separate Financial Statements requires that when an entity prepares separate financial statements, investments in subsidiaries, associates, and jointly controlled entities are accounted for either at cost or in accordance with IFRS 9 Financial Instruments. The Standard also deals with the recognition of dividends, certain group reorganisations and includes a number of disclosure requirements. Adoption is still uncertain as the amendment has not been endorsed by the EU, but is expected to be effective for periods beginning on or after 1 January 2014.
IAS 28 Investments in Associates and Joint Ventures defines “significant influence” and provides guidance on how the equity method of accounting is to be applied, including exemptions from applying the equity method in some cases. It also prescribes how investments in associates and joint ventures should be tested for impairment. Adoption is still uncertain as the amendment is still subject to EU endorsement, but it is expected to be effective for periods beginning on or after 1 January 2014.
IFRS 7 Financial Instruments: Disclosures, has been amended with respect to netting arrangements and is due to come into effect in 2013-14. Detailed disclosures are required for financial assets transferred to another entity but not derecognised in their entirety and financial assets derecognised in their entirety but in which the reporting entity has an involvement. NERC does not expect there to be any transactions requiring disclosure but will assess further as appropriate for the 2013-14 financial statements. IFRS 9 Financial instruments, will replace IAS 39 Financial Instruments: Recognition and Measurement in its entirety. IFRS 9 is expected to improve and simplify the reporting of financial instruments. The new standard will be effective for accounting periods beginning on or after 1 January 2013 subject to EU endorsement. Earlier application is permitted. The standard is part of a wider project to replace IAS 39 and it is not clear what the impact of the introduction of this standard will have on NERC. NERC will undertake an assessment of the impact of IFRS 9 once the full requirements are known.

57
ACCOUNTS 2012-13
IFRS 10 Consolidated Financial Statements and IFRS 11 Joint Arrangements cover the definition of, and the accounting treatment required for, subsidiaries and jointly controlled operations. Both standards are currently subject to EU endorsement and are expected to be effective for periods beginning on or after 1 January 2014.
IFRS 12 Disclosure of Interests in Other Entities requires disclosure of arrangements where the reporting entity owns a majority of shares but does not consolidate and arrangements where the reporting entity owns more than 20% of shares but does not equity account, and vice versa. This standard should not give rise to any accounting changes, but will result in additional disclosure.
IFRS 13 Fair Value Measurement sets out an IFRS framework for measuring fair value and is effective for periods beginning on or after 1 January 2013. The standard will increase the disclosures required for non-financial items held at fair value, such as property, plant and equipment. NERC will undertake an assessment of the impact of the new IFRS 13 disclosures for the 2013-14 financial statements.
b. Going ConcernThese accounts have been prepared on the basis of a Going Concern. Any deficit shown on the income and expenditure reserve will be extinguished over time, having regard to the resource and capital budgets to which NERC can be expected to have access.
In April 2011, Cabinet Office announced that all non-departmental public bodies (NDPB’s) would have to undergo a substantive review at least once every three years. These Triennial Reviews have two purposes:
l To provide a robust challenge of the continuing need for individual NDPB’s for both their function and form; andl Where it is agreed that a particular body should remain as an NDPB, to review the control and governance
arrangements in place to ensure that the public body is complying with recognised principles of good corporate governance.
All Research Councils are being reviewed together over the period January to August 2013.
c. AssetsProperty, plant and equipmentExpenditure on property, plant and equipment includes the purchase of land and buildings, construction and services projects, and equipment valued at £10,000 or above (2011-12: £10,000).
Property, plant and equipment are stated at the lower of depreciated historical cost or valuation. Costs of acquisition, comprising only those costs that are directly attributable to bringing the asset into working condition for its intended use, are capitalised. Land, buildings, ice stations in Antarctica, ships and aircraft are independently and professionally revalued every five years. These assets are subject to annual indexation when a full revaluation is not completed.
All UK land and buildings were valued in 2012-13 by Rafe Staples BSc (Hons), MRICS (member of The Royal Institution of Chartered Surveyors) acting as an external valuer on the basis of Existing Use Value in accordance with the RICS Valuation Professional Standards. These valuations excluded the scientific apparatus.
The British Antarctic Survey (BAS) Antarctic Research Stations were valued in 2011-12 via a desk-based valuation by Rafe Staples BSc (Hons), and Kirstie Wheeler BSc (Econ), MRICS acting as an external valuer, on the basis of Existing Use Value calculated by reference to Depreciated Replacement Costs. The Estimated Replacement Costs were calculated by BAS and adjusted by BAS and Powis Hughes in accordance with the RICS Valuation Standards.
The four research ships, RRS Discovery, RRS James Clark Ross, RRS Ernest Shackleton and RRS James Cook, were revalued in 2008-09 by E.A. Gibson Shipbrokers Ltd. All aircraft were also revalued in 2008-09 by the International Bureau of Aviation Group Limited.
All other plant & equipment and transport are revalued using relevant indices.
Any surplus or deficit on revaluation is taken to a revaluation reserve, except that any permanent diminution in value is charged to the statement of comprehensive net expenditure in the year in which it is recognised. Where subsequent evidence suggests a partial or complete reversal of the diminution in value, this is also reflected in the statement of comprehensive net expenditure in the year in which it is recognised as per IAS 36.
Increased depreciation charges arising from the revaluation are matched by annual transfers from the revaluation reserve to the income and expenditure reserve. On the disposal of a revalued asset, that element of the revaluation reserve

NERC Annual Report & Accounts 2012-13
58
which becomes realised as a result is transferred directly to the income and expenditure reserve.
Freehold land is not depreciated. All other tangible fixed assets are depreciated in order to write off the value of the asset less its estimated residual value over their estimated useful economic lives using modified reducing balance depreciation methodology. These lie within the following ranges:
Leasehold land - over the terms of the leaseFreehold buildings - up to 50 years or valuer’s estimates of economic lifeLong leasehold buildings - up to 50 years (or the length of the lease if less)Short leasehold buildings - over the length of the leaseAntarctic ice stations - up to 35 years or valuer’s estimates of remaining useful lifePlant and machinery - 10 to 15 yearsShips and aircraft - minimum of 20 years for ships, 15 years for aircraftScientific, office and major computing equipment - 5 to 10 yearsMotor vehicles - 3 to 7 yearsAssets under construction - not depreciated until brought into use
Property, plant and equipment are depreciated from date when they are available for use. The residual values of assets are reviewed on an annual basis.
Component accountingProperty, plant and equipment may have parts with different useful lives. In accordance with the provisions of IAS 16 each part of an item of property, plant and equipment with a cost that is significant in relation to the total cost of the item is depreciated separately.
d. InvestmentsIf material and with controlling interest, NERC would consolidate its investments into its financial statements in accordance with IAS 27 Consolidated and Separate Financial Statements. Where immaterial or without controlling interest, the investment will not be consolidated, but where possible its fair value will be reported in accordance with IAS 39 Financial Instruments: Recognition and Measurement. Where an investment is classified as an interest in a jointly controlled entity, it has been accounted for using the equity method in accordance with IAS 31 Interests in Joint Ventures and is carried at cost less any provision for impairment. The profit or loss for the year is credited or charged to the statement of comprehensive net expenditure in the year that it arises. e. Intangible assetsIntangible assets comprise purchased or developed computer software and websites and are stated at the lower of historical cost less accumulated amortisation or valuation. Intangibles are given definite useful lives and are amortised over a period not exceeding ten years on a straight line basis over the useful life of the asset from the date of use based on nil residual value.
f. Investment property In accordance with IAS 40, any property (land or building) held by the Council mainly to earn rental income and/or for capital appreciation is recognised as an investment property in the statement of financial position. Investment properties are measured at fair values which reflect market conditions existing at the balance sheet date.
g. Impairment The carrying amounts of the Council’s property, plant and equipment, intangible assets and financial assets are reviewed at each statement of financial position date to determine whether there is any indication of impairment: property, plant and equipment, intangible assets and financial assets are considered to be impaired if objective evidence indicates that one or more events have had a negative effect on the estimated future cash flows of the assets. If any such indication exists, the assets’ recoverable amounts are estimated.
An impairment loss is recognised whenever the carrying amount of an asset or its cash-generating unit exceeds its recoverable amount. To the extent the asset has not previously been revalued, impairment losses are recognised in the statement of comprehensive net expenditure.

59
ACCOUNTS 2012-13
h. Assets held for saleWhere a non-current asset, whose value will be recovered principally through sale rather than through continuing use, is available for its immediate sale in its present condition and its sale is highly probable, it is classified as ‘held for sale’ and presented separately on the face of the statement of financial position. A sale is highly probable where: there is evidence of management commitment; there is an active programme to locate a buyer and complete the plan; the asset is actively marketed for sale at a reasonable price; and the sale will normally be completed within 12 months from the date of classification.
Assets held for sale are stated at the lower of net book value (carrying amount) and fair value less costs to sell. These assets are not depreciated. Depreciation ceases at the date an item of property, plant and equipment is classified as an asset held for sale.
i. Employee benefits Under IAS 19 ‘Employee Benefits’ an entity is required to recognised short term employee benefits when an employee has rendered service in exchange for those benefits. Included in the financial statements is an accrual for the outstanding employee holiday entitlement at 31 March 2013 on an undiscounted basis.
j. Ownership of equipment purchased with NERC research grantsEquipment purchased by an Institution with research grant funds supplied by NERC, belong to the Institution and are not included in NERC’s property, plant and equipment. Through the Conditions of Grant applied to funded Institutions, NERC reserves the right to determine the disposal of such equipment and how any disposal proceeds are to be utilised.
k. Government grants receivable and other incomeGrant-in-aid for revenue and general capital purposes is credited to the income and expenditure reserve. Other operating income is shown net of trade discounts, value added tax and other taxes.
l. Research and developmentAs an organisation wholly engaged in research, NERC does not classify research and development expenditure separately in the accounts. It is reported under operating costs in the statement of comprehensive net expenditure.
Intellectual property rights arising from the Council’s research and development have not been included in these accounts as their market value cannot be readily estimated. The anticipated annual income generated from such rights is not material in value and is credited to the statement of comprehensive net expenditure on receipt.
m. Research and training grantsThe majority of research grants and fellowships are paid by the Council on an instalment basis in arrears in accordance with an agreed payment profile. The majority of studentship payments are paid on a quarterly instalment basis in advance directly to the research institute.
Payments made in advance or in arrears are accounted for on an accruals basis in the financial statements. Future commitments at the balance sheet date are disclosed in Note 16 of the financial statements.
n. InsuranceIn line with government policy, NERC carries its own risks in respect of employment of staff and assets, except where there exists a statutory requirement to insure or where commercial insurance represents better value for money.
o. Foreign currenciesForeign currency balances representing cash or amounts to be received or paid in cash (‘monetary items’) are expressed in pound sterling at the rate(s) of exchange ruling at the statement of financial position date. Non-monetary items that are measured at fair value in a foreign currency are translated using the spot exchange rate at the date the value is determined. Non-monetary items that are measured at historical cost are translated using the spot exchange rate at the time of the transaction. Transactions in foreign currencies are recorded at the rate ruling at the time of the transaction. All exchange differences are taken to the statement of comprehensive net expenditure. p. Value Added TaxAs NERC is partially exempt for VAT purposes, irrecoverable VAT is charged to the relevant expenditure category or included in the capitalised purchase cost of property, plant and equipment. Where output tax is charged or input tax is recoverable the amounts are stated net of VAT. NERC has charitable status for VAT purposes.

NERC Annual Report & Accounts 2012-13
60
q. Pension and early retirement costsPayments are made to the Research Councils’ Pension Scheme in respect of superannuation benefits for Council staff. In addition the council also paid contributions to a number of other multi-employer pensions schemes for specific groups of employees; these include inter alia the Merchant Navy Officers’ and Ratings’ Pensions Funds and Plans. The costs of early retirements are charged to NERC’s accounts in the year in which the binding decision is taken to release staff and liabilities recognised. Payments by the Council of early retirement lump sums are recoverable from the Research Councils’ Pension Scheme when recipients achieve normal retirement age. Recoverable amounts are recognised as receivables in these accounts and offset against annual staff restructuring costs.
r. Cash and cash equivalentsCash and cash equivalents comprise cash balances and deposits which are repayable on demand.
s. Derivatives and other financial instruments Due to the non-trading nature of its activities and the way in which NERC is financed, NERC is not exposed to the degree of financial risk faced by non-public sector entities. Moreover, financial instruments play a much more limited role in creating or changing risk that would be typical of the listed companies to which IAS 32, 39 and IFRS7 mainly apply. NERC has very limited powers to borrow or invest surplus funds and financial assets and liabilities are generated by day to day operational activities and are not held to change the risks facing NERC in undertaking its activities.
Foreign currency riskThe Council’s exposure to foreign currency risk is not currently significant.
Trade receivablesTrade receivables are not interest bearing and are carried at original invoice amount less allowance for impairment. Provision for impairment is established when there is objective evidence that the Council will not be able to collect all amounts due according to the original terms of the receivable. The amount of provision is the difference between the carrying amount and recoverable amount and is recognised in the statement of comprehensive net expenditure.
Trade and other payablesTrade and other payables are recognised in the period in which related money, goods or services are received or when a legally enforceable claim against NERC is established or when the corresponding assets or expenses are recognised.
t. ProvisionsProvisions are recognised when it is probable that NERC will be required to settle a present obligation and a reliable estimate can be made of that obligation. The obligation is normally the amount that NERC would rationally pay to settle the obligation at the statement of financial position date or to transfer it to a third party at that time.
This may require estimating the future cash flows in current-year prices (i.e. at the price level prevailing in the year covered by the accounts) and, where the time value of money is material, discounting them at the standard public sector real rate set by HM Treasury, currently +2.35% for pension provisions and for all other provisions: short-term -1.80%, medium-term -1.00% and long-term 2.20%.
u. Decommissioning costsDecommissioning costs are recognised as soon as the obligation exists. For Antarctic stations and other assets in the course of construction the percentage completion method will be used to determine the current obligation. A specific provision is established to cover the current value of the expected future costs of decommissioning the asset.
v. Finance leaseNERC has the use of a ship for which substantially all risks and rewards of the asset are transferred to the Council. The asset is capitalised and is subject to the same revaluation policy as other property, plant and equipment and is depreciated over the shorter of its estimated useful economic life or the lease period, with the outstanding lease obligations (net of interest) shown in payables. Finance charges are charged to the statement of comprehensive net expenditure over the period of the agreement in accordance with the interest rate within the contract.
w. Operating leasesOperating lease rentals are charged to the statement of comprehensive net expenditure on a straight line basis over the period of the lease.

61
ACCOUNTS 2012-13
x. Key judgements and decisionsThe preparation of Financial Statements requires management to make key judgements and estimates. These affect the reported amounts of assets and liabilities, the disclosure of contingent assets and liabilities at the date of the Financial Statements and the reported amounts of revenues and expenses during the reporting period.
On an on-going basis, management evaluates its judgements and estimates, including those relating to property, plant and equipment and provisions.
Management bases its judgements and estimates on historical experience and on various other factors that are believed to be reasonable under the circumstances, the results of which form the basis for making judgements about the carrying value of assets and liabilities that are not readily available from other sources. Actual results may differ from these estimates under different assumptions and conditions. Specific policies for judgemental areas such as decommissioning costs and provisions are shown above.
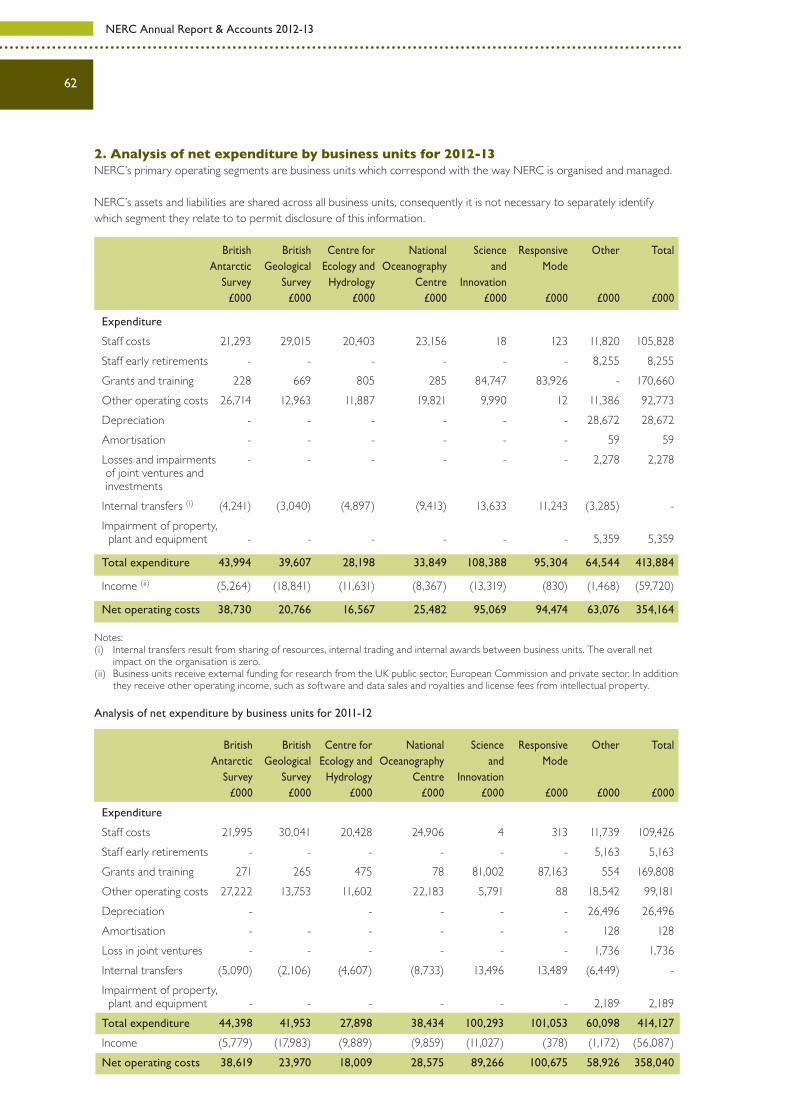
NERC Annual Report & Accounts 2012-13
62
2. Analysis of net expenditure by business units for 2012-13 NERC’s primary operating segments are business units which correspond with the way NERC is organised and managed. NERC’s assets and liabilities are shared across all business units, consequently it is not necessary to separately identify which segment they relate to to permit disclosure of this information. British British Centre for National Science Responsive Other Total Antarctic Geological Ecology and Oceanography and Mode Survey Survey Hydrology Centre Innovation £000 £000 £000 £000 £000 £000 £000 £000
Expenditure
Staff costs 21,293 29,015 20,403 23,156 18 123 11,820 105,828Staff early retirements - - - - - - 8,255 8,255Grants and training 228 669 805 285 84,747 83,926 - 170,660Other operating costs 26,714 12,963 11,887 19,821 9,990 12 11,386 92,773Depreciation - - - - - - 28,672 28,672Amortisation - - - - - - 59 59Losses and impairments - - - - - - 2,278 2,278of joint ventures andinvestments
Internal transfers (i) (4,241) (3,040) (4,897) (9,413) 13,633 11,243 (3,285) -Impairment of property, plant and equipment - - - - - - 5,359 5,359
Total expenditure 43,994 39,607 28,198 33,849 108,388 95,304 64,544 413,884
Income (ii) (5,264) (18,841) (11,631) (8,367) (13,319) (830) (1,468) (59,720)
Net operating costs 38,730 20,766 16,567 25,482 95,069 94,474 63,076 354,164 Notes: (i) Internal transfers result from sharing of resources, internal trading and internal awards between business units. The overall net
impact on the organisation is zero. (ii) Business units receive external funding for research from the UK public sector, European Commission and private sector. In addition
they receive other operating income, such as software and data sales and royalties and license fees from intellectual property.
Analysis of net expenditure by business units for 2011-12
British British Centre for National Science Responsive Other Total Antarctic Geological Ecology and Oceanography and Mode Survey Survey Hydrology Centre Innovation £000 £000 £000 £000 £000 £000 £000 £000
Expenditure
Staff costs 21,995 30,041 20,428 24,906 4 313 11,739 109,426Staff early retirements - - - - - - 5,163 5,163Grants and training 271 265 475 78 81,002 87,163 554 169,808Other operating costs 27,222 13,753 11,602 22,183 5,791 88 18,542 99,181Depreciation - - - - - 26,496 26,496Amortisation - - - - - - 128 128Loss in joint ventures - - - - - - 1,736 1,736Internal transfers (5,090) (2,106) (4,607) (8,733) 13,496 13,489 (6,449) -Impairment of property, plant and equipment - - - - - - 2,189 2,189Total expenditure 44,398 41,953 27,898 38,434 100,293 101,053 60,098 414,127
Income (5,779) (17,983) (9,889) (9,859) (11,027) (378) (1,172) (56,087)Net operating costs 38,619 23,970 18,009 28,575 89,266 100,675 58,926 358,040

63
ACCOUNTS 2012-13
2013 2012 £000 £000 Grant-in-aid received 353,796 381,819 Other BIS Funding (i) 120 47 353,916 381,866Note: (i) This relates to other non-GIA funding received from BIS for specific services e.g. the secondment of staff from NERC to BIS.
Under the FReM, NDPB’s regard grants and grant-in-aid received as contributions from controlling parties giving rise to a financial interest in the body. As a result, grants and grant-in-aid received is credited to the income and expenditure reserve rather than being recognised as income in the statement of comprehensive net expenditure. The table below shows a summary of the grants and grant-in-aid, which have been transferred to the income and expenditure reserve during 2012-13.
3. Grant-in-aid and other BIS funding
4.Income
2013 2012 £000 £000 (a) Income from government departments Department for Environment Food and Rural Affairs 6,460 6,121 Ministry of Defence 341 300 Department for Energy and Climate Change 1,934 726 Department for International Development 3,006 3,178 Environment Agency 957 855 Department of Enterprise, Trade and Investment Northern Ireland 1,267 1,307 Foreign and Commonwealth Office 648 119 Department for Communities and Local Government 119 179
Total income from government departments 14,732 12,785
(b) Income from other bodies European Community (i) 4,869 7,920 Other Research Councils 7,351 5,561 Other Public Sector 5,559 5,128 Private Sector 15,688 13,668
Total income from other bodies 33,467 32,277
Other operating income Software and Data Sales 374 283 Sale of Products & Publications 272 697 Property and Equipment Rentals 1,761 1,835 Lecture fees, seminars and training courses 54 23 Royalties and licence fees 2,247 2,112 Other Income (ii) 6,813 6,075
Total other operating income 11,521 11,025
Total income 59,720 56,087
Notes: (i) Income from the European Community consists of cash receipts of £4,835,954 and accruals of £33,046. (ii) This includes £370,000 (2011-12 £411,316) of income relating to the establishment of a Dutch Research Facility at Rothera, £255,074
(2011-12 £164,843) of non-grant related income from Research Council and Collaborative bodies and £2,926,532. (2011-12 £1,996,709) of monies from the University of Southampton paid to the National Oceanography Centre concerning their
joint occupation of the Waterfront Campus.

NERC Annual Report & Accounts 2012-13
64
5. Salaries and wages
(a) Staff numbers The average number of FTE’s (Full Time Equivalent) of staff employed during the year was:
2013 2012 No. No. Permanent Staff 2,136 2,178 Temporary and Contract Staff 194 216 Staff on inward secondment/loan 2 2 Agency 20 11
2,352 2,407
The total number of staff reported in the Annual Report is based on head count as at 31 March 2013, whereas the above figures are average FTE’s for the year.
b) Staff costs
2013 2012 £000 £000
Salaries and wages 80,047 83,579 Social Security Costs 6,783 7,014 Other pension costs (note 5d) (i) 18,998 18,833
105,828 109,426
Note: (i) 2011-12 Pension costs include a credit of £717,816 relating to the removal of the pension element from the brought forward Annual Leave Accrual, as these amounts are not pensionable.
Temporary staff costs total £336,056 (2011-12: £365,929) and are also included in the figures above.
Agency costs of £1,116,418 (2011-12: £762,531) have been included in operating costs.
The total amount capitalised for staff costs in 2012-13 is £677,009 (2011-12: £384,083). This relates to an estimated 15.9 full time equivalents for those staff employed by NERC that are adding value to assets such as those engaged in project managing or building of assets.
(c) Remuneration to Council and Committee Members/Peer Review College The following are included in staff costs, note 5(b) and other operating costs, note 8.
Committee members may receive £170 per day (2011-12: £170). Committee Chairs may receive £230 per day (2011-12: £230). The Chair of the Science & Innovation Strategy Board receives £9,110 per annum (2011-12: £9,110). Non-Executive Directors receive £3,760 per annum (2011-12 £3,760).All emoluments are non-pensionable.
2013 2012 £000 £000 Council Members’ fees 97 96 Committee Members/Peer Review 123 345 Other emoluments 40 44
260 485

65
ACCOUNTS 2012-13
Council Members are normally employed on fixed term contracts not exceeding 4 years.
Peer Review College Chairs receive honoraria of £1,000 per annum (2011-12: £1,000). Peer Review College members previously received honoraria of £500 per annum, however from July 2012, those who are eligible for payment (not already Government employed), and elect to be remunerated, are paid £200 per meeting.
Peer Review College Chair and Member appointments are open-ended but reviewed annually; the College year runs from 1 July to 30 June.
Number of Council, Committee and Board Members as at 31 March
2013 2012 Restated(i)
No. No. Council Members * 16 15Committee Members ^ 41 27Peer Review College Members ~ 672 450
729 492 * Includes Chief Executive and Chairman ^ Members of Audit Committee, Science and Innovation Strategy Board, Training Advisory Group (formed May 2012) and Individual
Merit Promotion Panel. Members of council or multiple committees are only counted once. ~ Not all members will attend meetings during the year, college expanded in July 2012. (i) Members numbers restated to include non-remunerated members.
Council* / Committee and Peer Review College Members’ emoluments fell into the following bands:
2013 2012 No. No. £0 to £5,000 417 395£5,001 to £10,000 12 12£10,001 to £15,000 0 -£15,001 to £20,000 1 1
430 408 * Neither the Chief Executive nor the members of Council who are also Civil Servants receive any remuneration for their work on NERC Council and are therefore excluded from this table. The Chief Executive’s emoluments are disclosed separately in the remuneration report.
(d) Superannuation
Pension scheme payments
2013 2012 £000 £000 Payments in respect of the Research Councils’ Pension Scheme (RCPS) 18,812 18,652 Payments to pension schemes other than the RCPS: Merchant Navy Officers’ Pension Fund 31 32 Merchant Navy Officers’ Pension Plan - - Merchant Navy Ratings’ Pension Fund 2 2 Merchant Navy Ratings’ Pension Plan 2 3 Partnership Pensions 151 144
18,998 18,833

NERC Annual Report & Accounts 2012-13
66
Most employees of NERC are members of the Research Councils’ Pension Scheme (RCPS) which is a defined benefit scheme funded from annual grant-in-aid on a pay-as-you-go basis. The RCPS is in all respects ‘by-analogy’ with the Principal Civil Service Pension Scheme, except that the employer’s contribution is determined separately. The scheme provides retirement and related benefits based on final or average emoluments. Redundancy and injury benefits are administered and funded by the Council. The scheme is administered by the Research Councils’ Joint Superannuation Service with the associated grant-in-aid managed by BBSRC.
Employees may be in one of four defined benefit scheme arrangements; either a ‘final salary’ scheme (classic, classic plus or premium); or a career average scheme (nuvos). Pensions payable are increased annually in line with changes in the Consumer Prices Index (CPI). The employer contribution rate is agreed by the RCPS Board of Management on the recommendation of the Government Actuary’s Department (GAD) and is set at 26.0% of pensionable pay. Employee contribution rates vary between 1.5% and 5.9% depending on scheme and annual pensionable earnings (see table below). NERC paid costs in the year of £18,811,664.41 (2011-12: £18,652,187.37). As at 31st March 2013 there were 2,198 NERC members of these schemes.
In order that the defined benefit obligations recognised in the financial statements do not differ materially from those that would be determined at the reporting date by a formal actuarial valuation, the FReM requires that “the period between formal actuarial valuations shall be four years, with approximate assessments in intervening years.
The last formal actuarial valuation undertaken for the RCPS as at 31 March 2006 was completed in 2008-09. Consequently, a formal actuarial valuation as at 31 March 2010 was initiated but was not expected to be completed at 31 March 2011.
Subsequently however, formal actuarial valuations for unfunded public service pension schemes have been suspended by HM Treasury on value for money grounds while consideration is given to recent changes to public service pensions and while future scheme terms are developed as part of the reforms to public service pension provision. The primary purpose of the formal actuarial valuations is to set employer and employee contribution rates, and these are currently being determined under the new scheme design.
From 1 April 2013 employee contribution rates have been increased, the new rates are outlined below, along with those for the current year:
Annual pensionable earnings Classic Scheme contribution % Classic Plus, Premium & NUVOS (full-time equivalent basis) Scheme contribution %
1 April 2012 1 April 2013 1 April 2012 1 April 2013
Up to £15,000 1.50 1.50 3.50 3.50£15,001 - £21,000 2.10 2.70 4.10 4.70£21,001 - £30,000 2.70 3.88 4.70 5.88£30,001 - £50,000 3.10 4.67 5.10 6.67£50,001 - £60,000 3.50 5.46 5.50 7.46Over £60,000 3.90 6.25 5.90 8.25
As an alternative to the RCPS a Partnership Pension Account was made available to new recruits from 1 October 2002. It is based on the portable Stakeholder Pension introduced by the Government in 2001. This is a defined contribution scheme. The employers pay the RCPS 0.8 percent of pensionable pay to cover death in service and ill health benefits. The employers pay an age related contribution to the employee’s private pension provider. As at 31st March 2013 there were 42 NERC members of these schemes.
The accrued pension quoted is the pension the member is entitled to receive when they reach pension age or immediately on ceasing to be an active member of the scheme if they are already at or over pensionable age. Pensionable age is 60 for members of the classic, classic plus and premium scheme arrangements and 65 for members of Nuvos.
For further details about the Research Councils Pension Scheme pension arrangements can be found at the website http://jsspensions.nerc.ac.uk/.
The Council also paid contributions during the year to a number of other multi-employer pension schemes for specific groups of employees, as at 31st March 2013 there were 10 NERC members of these schemes; details of these schemes are shown on the next page:-

67
ACCOUNTS 2012-13
Scheme Rate of contribution Year of last variation Merchant Navy Officers’ Pension Fund^ 11.9% 2009Merchant Navy Officers’ Pension Plan 5.1% n/aMerchant Navy Ratings’ Pension Fund* 2.0% 2012Merchant Navy Ratings’ Pension Plan 5.1% n/a
^ The Merchant Navy Officers’ Pension Fund (New Section) was subject to an actuarial valuation as at 31 March 2009 and showed a deficit overall. In 2009-10 NERC made a one off payment of £2,817,513 in full settlement of our share of the deficit. The NERC element of the scheme is now fully funded and no liability in respect of the 31 March 2009 valuation is outstanding at 31 March 2013.
* The Merchant Navy Ratings’ Pension Fund closed on 31 May 2001. On closure of the fund members transferred to the RCPS or the new Merchant Navy Ratings’ Pension plan which is a money purchase scheme.
An actuarial valuation was undertaken on 31 March 2012; however the trustees do not intend to take immediate action on this report due to the on-going consultation process between the Trustee and the current employers concerning the details of the proposed Schedule of Contributions and Recovery Plan. The Trustee’s current intention is to suspend collection of deficit contributions until the Court judgement on the proposed new deficit contribution regime is received in 2014. This decision is subject to the support of the Pensions Regulator.
NERC held a provision for our share of the deficit amounting to £2,449,582 in 2008-09 and made a one off payment in 2009-10 in full settlement of £2,724,138. At 31 March 2013 the NERC element of the scheme in respect of the 31 March 2008 valuation was fully funded and no current liabilities existed.
6. Staff restructuring / early retirements (i)
Resource costs packages agreed 2013 2012 £000 £000 Redundancy compensation payments 4,704 2,660Early retirement lump sums 1,047 918
Resource costs packages agreed (ii) 5,751 3,578Increase early retirement liability 2,504 1,585
Total costs 8,255 5,163
Exit package cost band Band Number of Number of Total number of compulsory other exit packages redundancies departures by cost band
<£10k 1 - 32 32£10k-£25k 2 - 40 40£25k-50k 3 - 51 51£50k-£100k 4 - 41 41£100k-£150k 5 - 16 16£150k-£200k 6 - - - >£200k 7 - - -
Total packages agreed - 180 180 £000 £000 £000
Total resource costs packages agreed (iii) - 7,214 7,214
Notes: (i) All payments were within contracted entitlement. (ii) Resource costs packages agreed net of release of provisions as per Note 14. (iii) Full costs of all exit packages agreed during the year, including those costs that are covered by the release of provisions as per Note
14. These costs will therefore differ from the totals shown in note (ii).
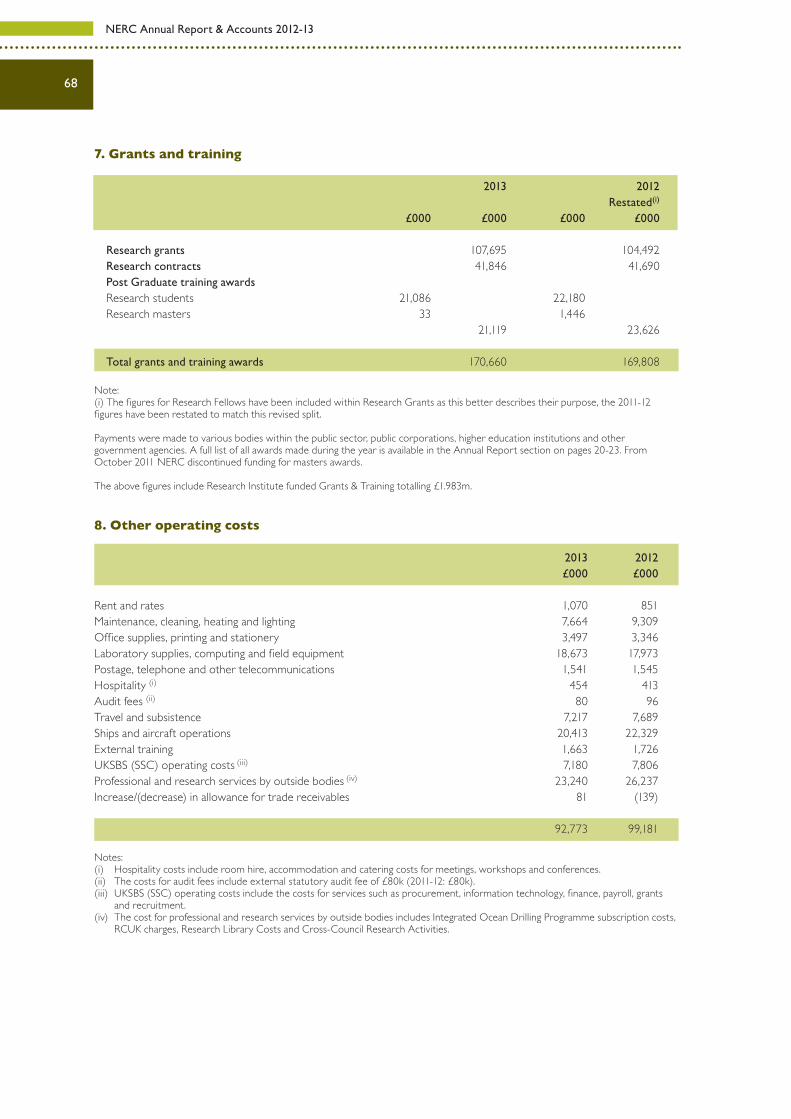
NERC Annual Report & Accounts 2012-13
68
7. Grants and training 2013 2012 Restated(i) £000 £000 £000 £000
Research grants 107,695 104,492 Research contracts 41,846 41,690 Post Graduate training awards Research students 21,086 22,180 Research masters 33 1,446 21,119 23,626 Total grants and training awards 170,660 169,808
Note: (i) The figures for Research Fellows have been included within Research Grants as this better describes their purpose, the 2011-12 figures have been restated to match this revised split. Payments were made to various bodies within the public sector, public corporations, higher education institutions and other government agencies. A full list of all awards made during the year is available in the Annual Report section on pages 20-23. From October 2011 NERC discontinued funding for masters awards.
The above figures include Research Institute funded Grants & Training totalling £1.983m.
8. Other operating costs 2013 2012 £000 £000
Rent and rates 1,070 851 Maintenance, cleaning, heating and lighting 7,664 9,309 Office supplies, printing and stationery 3,497 3,346 Laboratory supplies, computing and field equipment 18,673 17,973 Postage, telephone and other telecommunications 1,541 1,545 Hospitality (i) 454 413 Audit fees (ii) 80 96 Travel and subsistence 7,217 7,689 Ships and aircraft operations 20,413 22,329 External training 1,663 1,726 UKSBS (SSC) operating costs (iii) 7,180 7,806 Professional and research services by outside bodies (iv) 23,240 26,237 Increase/(decrease) in allowance for trade receivables 81 (139) 92,773 99,181 Notes: (i) Hospitality costs include room hire, accommodation and catering costs for meetings, workshops and conferences.(ii) The costs for audit fees include external statutory audit fee of £80k (2011-12: £80k). (iii) UKSBS (SSC) operating costs include the costs for services such as procurement, information technology, finance, payroll, grants
and recruitment. (iv) The cost for professional and research services by outside bodies includes Integrated Ocean Drilling Programme subscription costs,
RCUK charges, Research Library Costs and Cross-Council Research Activities.

69
ACCOUNTS 2012-13
9(a). Property, plant and equipment
Cost or Land, buildings and Plant and Transport Totalvaluation Antarctic stations equipment (i) & (v) (iv) (ii), (iii) & (v) £000 £000 £000 £000 At 1 April 2012 284,259 63,826 238,807 586,892Additions 46,352 17,185 2,536 66,073Revaluation (4,354) 5,316 1,372 2,334Revaluation Adjustment (vi) (1,250) - - (1,250)Disposals (vii), (viii) & (ix) (90) (13,459) (52,438) (65,987)Impairment (x) (11,025) - - (11,025)
At 31 March 2013 313,892 72,868 190,277 577,037
Depreciation At 1 April 2012 105,817 32,891 153,167 291,875Charge for the year 8,907 11,564 8,201 28,672Revaluation (977) 1,163 388 574Revaluation Adjustment (vi) (1,104) - - (1,104)Disposals (vii), (viii) & (ix) (52) (13,178) (50,836) (64,066)Impairment (x) (5,666) - - (5,666)
At 31 March 2013 106,925 32,440 110,920 250,285 Net Book Value At 31 March 2013 206,967 40,428 79,357 326,752
At 1 April 2012 178,442 30,935 85,640 295,017
Notes: (i) Cost / Valuation includes £19,197,265 in respect of Freehold Land which is not depreciated (2011-12: £18,631,548). (ii) Including specialised Antarctic Vehicles. (iii) The NBV of the leased ship is £16,393,899 (2011-12: £18,509,906). The annual depreciation charge on this asset held under the
finance lease was £2,549,158 (2011-12: £2,447,926). (iv) Includes assets previously offset by the donated and government grant assets reserves and which are now offset by the revaluation
reserve (per IAS 20). There is no restriction on the use of these assets. (v) There has been no effect on the depreciation charge as a result of the application of component depreciation (IAS 16). Assets
have historically been split between land and buildings and sites; ships have also been accounted for based on the component accounting rules. It has been decided not to apply component depreciation for the aircraft based on the advice given by our professional valuers, IBA Group. Furthermore, Polaris House is solely occupied as a standard office building with no requirement for any part or element to be replaced at any set intervals or for any major regular inspections. There are therefore no component parts in Polaris House based on the principles of IAS 16. Day to day servicing is deemed repair and maintenance.
(vi) During the year a classification error was discovered whereby a land asset that had been mistaken recorded as leasehold was corrected to show as freehold. This has required the unwinding of depreciation to date along with the reversal of adjustments made to the revalued cost and accumulated depreciation in 2010-11. These adjustments to depreciating assets were part of the migration of NERC assets to the new Oracle system and must be reversed to ensure the asset cost is shown correctly in NERC’s accounts.
(vii) During the year exercises to clear Zero Net book Value assets from the Fixed Asset Register resulted in the removal of 288 assets to inventory and 17 to scrap, which amounted for £10,831k of the disposals of both cost and depreciation. This included 283 assets under the plant & equipment category (£10,403k disposed) and 22 assets under the transport category (£428k disposed).
(viii) During the year an exercise to validate the existence and usage of assets with a remaining useful life of less than 1 year resulted in the scrapping of 9 assets within the plant & equipment category, which amounted for £131,073 of the disposals of cost and £117,891 of depreciation.
(ix) Disposals of Transport include £51,936,810 of cost and £50,365,217 of depreciation relating to the disposal of the old RRS Discovery research vessel.
(x) The net impairment costs of £5,359,491 as shown in the statement of comprehensive net expenditure consist of impairment costs of £6,824,703 less the reversal of previous impairment losses amounting to £1,465,212. These costs are included in the expenditure for the year in the statement of changes in taxpayer equity. The impairments relate to the revaluation of land and building properties to below their depreciated historic cost, the impairment reversals reflect the revaluation of land & building properties above their depreciated historic cost where those properties had been impaired as a result of previous revaluations. The net impairment costs are as follows:
- Complete reversal of 2009-10 impairment of Capel Dewi (-£26,245) & Eskdalemuir (-£198,501) properties to their professionally revalued amounts due to subsequent increased professional revaluation in 2012-13.
-Partial reversal of 2009-10 impairment of Wallingford (-£1,240,466) property to its professionally revalued amounts due to subsequent increased professional revaluation in 2012-13.
-Keyworth (£4,013,504), Bush (£343,658), Lancaster (£2,289,410) and Liverpool Kempston St (£178,131) properties being impaired to their professionally revalued amounts.
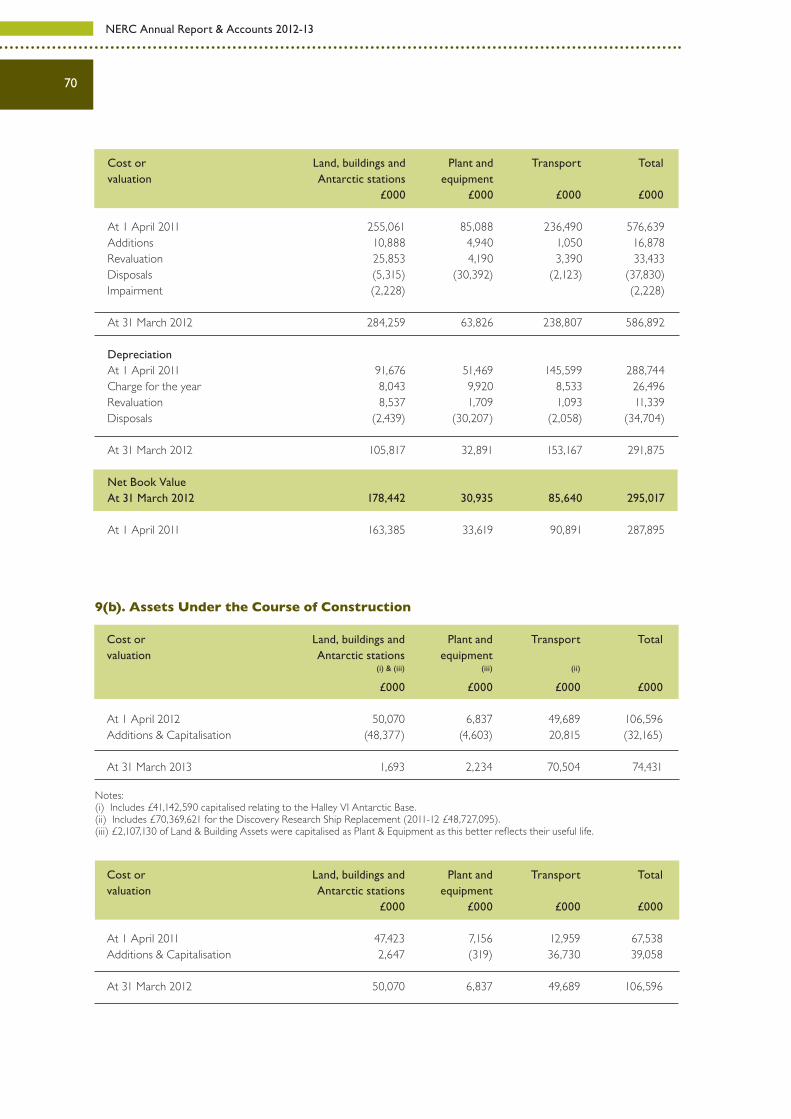
NERC Annual Report & Accounts 2012-13
70
9(b). Assets Under the Course of Construction
Cost or Land, buildings and Plant and Transport Totalvaluation Antarctic stations equipment (i) & (iii) (iii) (ii) £000 £000 £000 £000 At 1 April 2012 50,070 6,837 49,689 106,596Additions & Capitalisation (48,377) (4,603) 20,815 (32,165)
At 31 March 2013 1,693 2,234 70,504 74,431
Notes: (i) Includes £41,142,590 capitalised relating to the Halley VI Antarctic Base. (ii) Includes £70,369,621 for the Discovery Research Ship Replacement (2011-12 £48,727,095). (iii) £2,107,130 of Land & Building Assets were capitalised as Plant & Equipment as this better reflects their useful life.
Cost or Land, buildings and Plant and Transport Totalvaluation Antarctic stations equipment £000 £000 £000 £000 At 1 April 2011 47,423 7,156 12,959 67,538Additions & Capitalisation 2,647 (319) 36,730 39,058
At 31 March 2012 50,070 6,837 49,689 106,596
Cost or Land, buildings and Plant and Transport Totalvaluation Antarctic stations equipment £000 £000 £000 £000
At 1 April 2011 255,061 85,088 236,490 576,639Additions 10,888 4,940 1,050 16,878Revaluation 25,853 4,190 3,390 33,433Disposals (5,315) (30,392) (2,123) (37,830)Impairment (2,228) (2,228)
At 31 March 2012 284,259 63,826 238,807 586,892 Depreciation At 1 April 2011 91,676 51,469 145,599 288,744Charge for the year 8,043 9,920 8,533 26,496Revaluation 8,537 1,709 1,093 11,339Disposals (2,439) (30,207) (2,058) (34,704)
At 31 March 2012 105,817 32,891 153,167 291,875 Net Book Value At 31 March 2012 178,442 30,935 85,640 295,017 At 1 April 2011 163,385 33,619 90,891 287,895

71
ACCOUNTS 2012-13
9(c). Jointly Controlled Entities and Unconsolidated Investments ‘NGD’ share UKSBS Ltd ‘B’ shares IxO IGS Total Cost or valuation (previously ‘A’ share RCUK Shared Therapeutics Ltd Ltd RCUK SSC) Services Centre Shares Shares £ £ £ £ £
At 1 April 2011 1 11,568,763 300,000 150,000 12,018,764Losses - (1,736,000) - - (1,736,000)Shares sold - - - (25,031) (25,031) At 31 March 2012 1 9,832,763 300,000 124,969 10,257,733 Impairment - - (300,000) - (300,000)Losses - (1,977,856) - - (1,977,856)Shares sold - (7,854,907) - - (7,854,907) At 31 March 2013 1 - - 124,969 124,970
RCUK Shared Services Centre Investment RCUK SSC UK Ltd was accounted for as a joint venture until the change in governance and ownership of the company on 6 March 2013. Under the new arrangement the company’s name was changed to UK Shared Business Services Limited (UK SBS Ltd). BIS hold a Government Department (‘GD’) share carrying 51% of the votes, UK SBS Ltd holds 1 share carrying 5% of the votes, and all other stakeholders including NERC each own one Non-Government Department (‘NGD’) share, with the combined voting value of all the ‘NGD’ shares being 44%.
NERC have exchanged their ‘A’ share, which carried the voting rights, for a new ‘NGD’ share and have sold their ‘B’ shares, conveying ownership rights, to BIS at their value as at 6 March 2013 (£7,854,907). This value represents NERC’s opening joint venture value (£9,832,763) less NERC’s share of the company’s losses and other impairments incurred during the year until 6 March 2013 (£1,977,856). The amount received from BIS is shown on the Statement of Cash Flows under investing activities. NERC’s share of the company losses and other impairments has been charged to the Statement of Comprehensive Net Expenditure.
This leaves NERC with one ‘NGD’ share and means that NERC no longer have joint ownership of the company. Therefore the company has been reclassified as an unconsolidated investment with an initial cost of £1 being the nominal value of the ‘NGD’ share.
Other investmentsNERC has shareholdings in two unlisted undertakings: IXO Therapeutics Ltd, in which NERC holds a controlling interest of 67.78% (2011-12: 67.78%), and IGS Ltd, in which NERC holds a non-controlling interest of 22.64% (2011-12: 49.99%). NERC has not consolidated the controlling investment in IXO Therapeutics Ltd as it is immaterial to NERC and holds the investment at fair value (currently nil) in accordance with IAS 39.

NERC Annual Report & Accounts 2012-13
72
Venture
UK Shared Business Services Limited (UKSBS Ltd)
IXO Therapeutics Ltd
International Geosciences (IGS) Ltd
Wallingford Hydrosolutions Ltd
Microbial Solutions Ltd
Spectrum (General Partner) Ltd
Oxford Expression Technologies Ltd
Gordons 1 Ltd
Market Sector
Shared Services
Biotechnology research to develop immunotherapeutics .
International geoscience and geothematic surveys.
Consultancy and environmental software systems.
Wastewater treatment technology.
Advisory board to Rainbow Seed Fund which provides early stage funding for commercialisation of technology and services.
Products and services to pharmaceutical and biotechnology industries.
Environmental analytical tools and services.
Equity
4.89%
67.80%
22.64%
24.90%
29.08%
18.75%
13.50%
0.05%
Remarks See above.
NERC regards IXO Therapeutics as a subsidiary and exerts control over its operations. However, the operations are not sufficiently financially material for their accounts to be consolidated into NERC’s. NERC’s initial investment of £300,000 has now been fully impaired due to IXO being in the process of dissolution. During 11-12, NERC disposed of 751 of its shares in IGS Ltd. NERC no longer regards IGS Ltd as a subsidiary and does not exert control over its operations. During 12-13 an additional 5,438 shares were issued. Its investment of £124,969 is recognised as fair value for this entity.
93,385 N shares were issued during 12-13, of which 40,000 were issued to NERC in exchange for NERC intellectual property and 33,135 in exchange for £331.35 in cash. This cash was paid to Microbial Solutions by other shareholders to whom NERC sold an equal number of their Ordinary shares. Dormant
Unconsolidated Investments NERC holds shares in the following unlisted ventures whose accounts, by virtue of NERC’s non-controlling interest or the relative financial immateriality of these entities, are not consolidated into NERC’s financial statements.

73
ACCOUNTS 2012-13
10. Intangible Fixed Assets Software Licenses Website Costs Total Cost or Valuation £000 £000 £000 At 1 April 2012 358 - 358Additions - - -Revaluation 7 - 7Disposals (70) - (70)
At 31 March 2013 295 - 295 Amortisation At 1 April 2012 186 - 186Amortisation for the year 59 - 59Revaluation 3 - 3Disposals (70) - (70)
At 31 March 2013 178 - 178 Net Book Value At 31 March 2013 117 - 117
At 1 April 2012 172 - 172 The intangible assets were revalued on an annual basis using the HM Treasury GDP deflator figures.
Software Licenses Website Costs Total Cost or Valuation £000 £000 £000
At 1 April 2011 7,571 211 7,782Additions 2 - 2Revaluation 357 - 357Disposals (7,572) (211) (7,783)
At 31 March 2012 358 - 358 Amortisation At 1 April 2011 7,397 211 7,608Amortisation for the year 128 - 128Revaluation 225 - 225Disposals (7,564) (211) (7,775)
At 31 March 2012 186 - 186 Net Book Value At 31 March 2012 172 - 172 At 1 April 2011 174 - 174

NERC Annual Report & Accounts 2012-13
74
11. Assets held for sale
Net cost or valuation £000At 1 April 2012 69
Adjustment 1
Net Book Value at 31 March 2013 70 Net cost or valuation At 1 April 2011 224
Disposals (155)
Net Book Value at 31 March 2012 69 Net Book Value at 1 April 2011 224
Note: The assets held for sale comprise: - Buildings and land owned at the Bidston site. These assets were re-classified from the property, plant and equipment category to held for sale at 31 March 2008. During
2011-12 part of the site’s Land & Buildings were sold; the remaining buildings have been razed and the site cleared. Management is committed to sale of the remainder of this property. The remaining site consists of 3 plots of land, which have been impaired down to their fair value: £25k for Brae Head Cottage plot and £45k for the Proudman plots. The fair value for the Proudman plots have been calculated as a reasonable proportion of the maximum value of the plots following a successful grant of a planning permission (estimated at 30% possibility resulting in plots becoming worth £150k).
12. Receivables 2013 2012 £000 £000 £000 £000
(a) Current assets: trade and other receivables Trade receivables 8,274 6,390 Intra Government Central Government bodies 2,632 5,407 Local Authorities 87 42
2,719 5,449 Other receivables 1,439 625 Prepayments (i) 4,967 5,334 Accrued income 7,635 6,635 Provision for trade receivables (426) (345)
24,608 24,088
(b) Non-current receivables: trade and other receivables Other receivables 90 122 Total receivables 24,698 24,210 Note: (i) Prepayments are due to contracted obligations, such as: IST subscriptions, license & maintenance costs, research grants, international subscriptions and Integrated Ocean Drilling Programme subscription costs.

75
ACCOUNTS 2012-13
13. Payables 2013 2012 2011 Restated(i) Restated(i)
£000 £000 £000 £000 £000 £000
(a) Current liabilities: trade and other payables Trade payables 2,932 10,679 12,664 Intra Government Central Government bodies 615 3,223 2,589
615 3,223 2,589 Taxation & Social Security 2,149 10 2,287 VAT payable 524 718 854 Other payables 219 1,084 1,609 Accruals & deferred income 60,240 48,779 56,554 Obligation under finance leases 1,667 1,535 1,412 68,346 66,028 77,969(b) Non-current liabilities: trade and other payables Obligation under finance leases 7,097 8,764 10,299 Total payables 75,443 74,792 88,268
14. NERC Provisions for liabilities and charges (i) Antarctic Early Other CEH Total Treaty costs (ii) retirements liabilities (iii) restructuring (iv) £000 £000 £000 £000 £000 Provision at 31 March 2011 5,513 1,177 913 2,811 10,414 Changes in provisions for 2011-12: Change in discount rate - 3 - 6 9 Write back of provisions not required - - (52) (16) (68)Amounts provided in year 368 1,585 - 67 2,020 Unwinding of discount 121 34 20 75 250 Provision utilised in year - (589) (170) (643) (1,402) Provision at 31 March 2012 6,002 2,210 711 2,300 11,223 Changes in provisions for 2012-13: Change in discount rate 443 17 8 84 552 Write back of provisions not required (268) - (300) (41) (609)Amounts provided in year - 2,504 95 232 2,831 Unwinding of discount 218 62 16 59 355 Provision utilised in year (1,573) (1,750) (279) (654) (4,256) Provision at 31 March 2013 4,822 3,043 251 1,980 10,096 Notes: (i) The discount rate used is 2.35% for pension provisions (2011-12: 2.8%). For all other provisions the discount rate is -1.8% for 0-5
years, -1% for 6-10 years and 2.2% for over 10 years (2011-12: all 2.2%). (ii) Antarctic Treaty costs represent the Council’s liability to remove any items from the Antarctic no longer used. (iii) Other liabilities include claims made against NERC and commitments to onerous operating lease payments. These have been
estimated on the likelihood of the leases being assigned during the remainder of their term. (iv) CEH restructuring costs include NERC’s liability for CEH staff restructuring and staff removal costs.
Note: (i) Restated to exclude monies held on behalf of 3rd parties.

NERC Annual Report & Accounts 2012-13
76
Analysis of expected timing of discounted cashflows Antarctic Early Other CEH Total Treaty cost retirements liabilities restructuring £000 £000 £000 £000 £000 Provision due within one year - 2,742 251 616 3,609Between one and five years 1,025 235 - 1,241 2,501Between five and ten years 1,013 66 - 123 1,202Thereafter 2,784 - - - 2,784 Provision at 31 March 2013 4,822 3,043 251 1,980 10,096
Provision due within one year 1,823 1,658 701 623 4,805Between one and five years 871 428 10 1,532 2,841Between five and ten years 588 124 - 118 830Thereafter 2,720 - - 27 2,747 Provision at 31 March 2012 6,002 2,210 711 2,300 11,223
15. Cash and cash equivalents 2013 2012 2011 Restated(i) Restated(i) £000 £000 £000 £000 £000 £000 The following balances were held at 31 March: Government Banking Service National Westminster clearing accounts (2,279) (2,215) - Citibank 22,231 6,829 104 19,952 4,614 104Commercial bank accounts Lloyds TSB 1,587 8,827 11,543National Bank of Abu Dhabi 328 494 598 Other local commercial accounts 95 437 116
2,010 9,758 12,257 Balance at year end 21,962 14,372 12,361 Notes: (i) Restated to exclude bank balances held on behalf of 3rd parties. (ii) In addition to the above NERC holds the following monies on behalf of 3rd parties: £3,750,305 (2011-12: £5,169,375, 2010-11:
£4,334,460) held on behalf of EU Programme Collaborators and £4,810,288 (2011-12: nil, 2010-11: nil) held on behalf of the Integrated Ocean Drilling Programme Collaborators.

77
ACCOUNTS 2012-13
16. Forward commitments on approved research grants, research contracts and studentships Research Postgraduate Fellowships Contracts Total Grants Training 2013 £000 £000 £000 £000 £000 2013-2014 123,970 15,373 8,554 30,022 177,9192014-2015 75,551 11,610 4,669 6,376 98,2062015-2016 41,566 5,851 2,179 3,844 53,4402016-2017 9,582 231 976 2,983 13,7722017-2018 1,164 - 464 - 1,6282018-2019 167 - 30 - 197
252,000 33,065 16,872 43,225 345,162
17. Amounts payable under finance lease obligations Payments Interest Net payments £000 £000 £000
As at 31 March 2013 Within one year 2,334 667 1,667Between one and five years 6,630 1,541 5,089Thereafter 2,128 120 2,008
11,092 2,328 8,764 As at 31 March 2012 Within one year 2,334 799 1,535Between one and five years 7,368 1,978 5,390Thereafter 3,724 350 3,374
13,426 3,127 10,299
18. Related party transactions
The Natural Environment Research Council (NERC) is a Non-Departmental Public Body (NDPB) sponsored by the Department for Business, Innovation and Skills (BIS).
BIS is regarded as a related party. During the year, NERC has had various material transactions with BIS and with other entities for which BIS is regarded as the parent Department, viz: Engineering and Physical Sciences Research Council, Biotechnology and Biological Sciences Research Council, Science and Technology Facilities Council, Medical Research Council, Economic and Social Research Council, the Arts and Humanities Research Council, the Technology Strategy Board, the Higher Education Funding Council for England and the UK Space Agency.
NERC has had various material transactions with other Government departments and other central Government bodies. NERC has also entered into various material transactions with the UK Shared Business Services Ltd (formerly named the RCUK Shared Services Centre Ltd).
During the year, NERC entered into the following material transactions with Council members in respect of payments under awards or contracts funded by NERC.
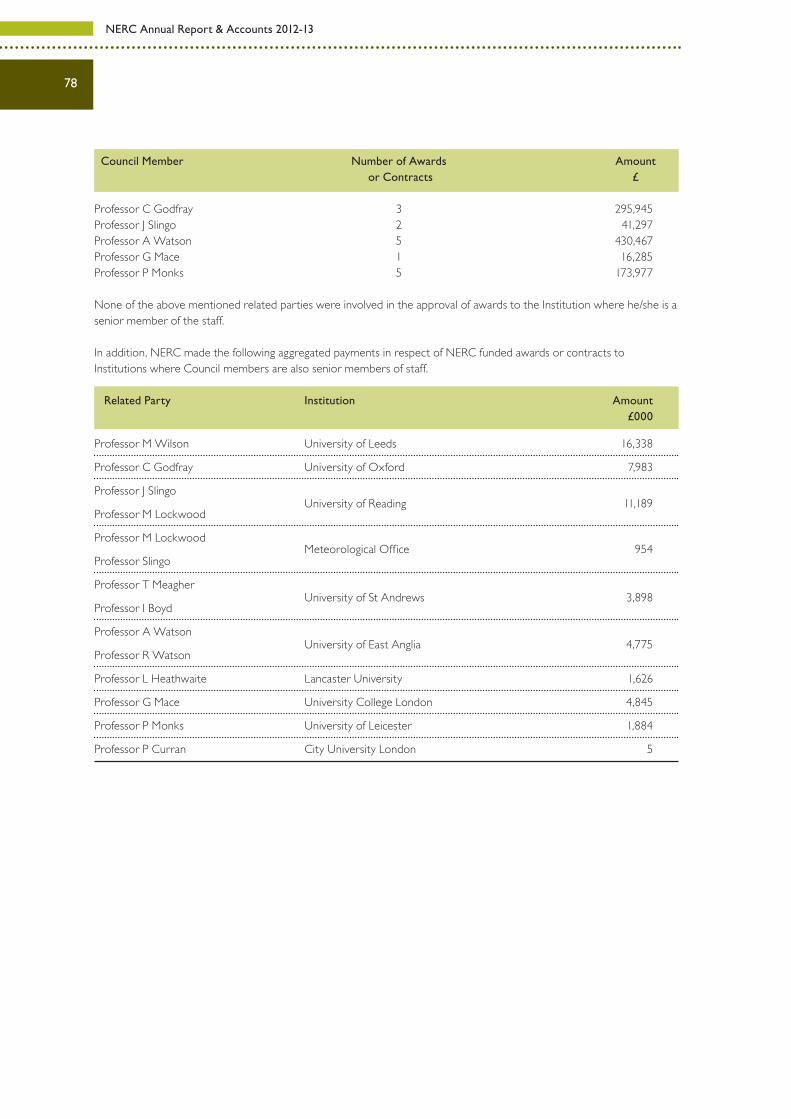
NERC Annual Report & Accounts 2012-13
78
Council Member Number of Awards Amount or Contracts £
Professor C Godfray 3 295,945Professor J Slingo 2 41,297Professor A Watson 5 430,467Professor G Mace 1 16,285Professor P Monks 5 173,977
None of the above mentioned related parties were involved in the approval of awards to the Institution where he/she is a senior member of the staff.
In addition, NERC made the following aggregated payments in respect of NERC funded awards or contracts to Institutions where Council members are also senior members of staff.
Related Party Institution Amount £000
Professor M Wilson University of Leeds 16,338
Professor C Godfray University of Oxford 7,983
Professor J Slingo
Professor M Lockwood University of Reading 11,189
Professor M Lockwood
Professor Slingo Meteorological Office 954
Professor T Meagher
Professor I Boyd University of St Andrews 3,898
Professor A Watson
Professor R Watson University of East Anglia 4,775
Professor L Heathwaite Lancaster University 1,626
Professor G Mace University College London 4,845
Professor P Monks University of Leicester 1,884
Professor P Curran City University London 5
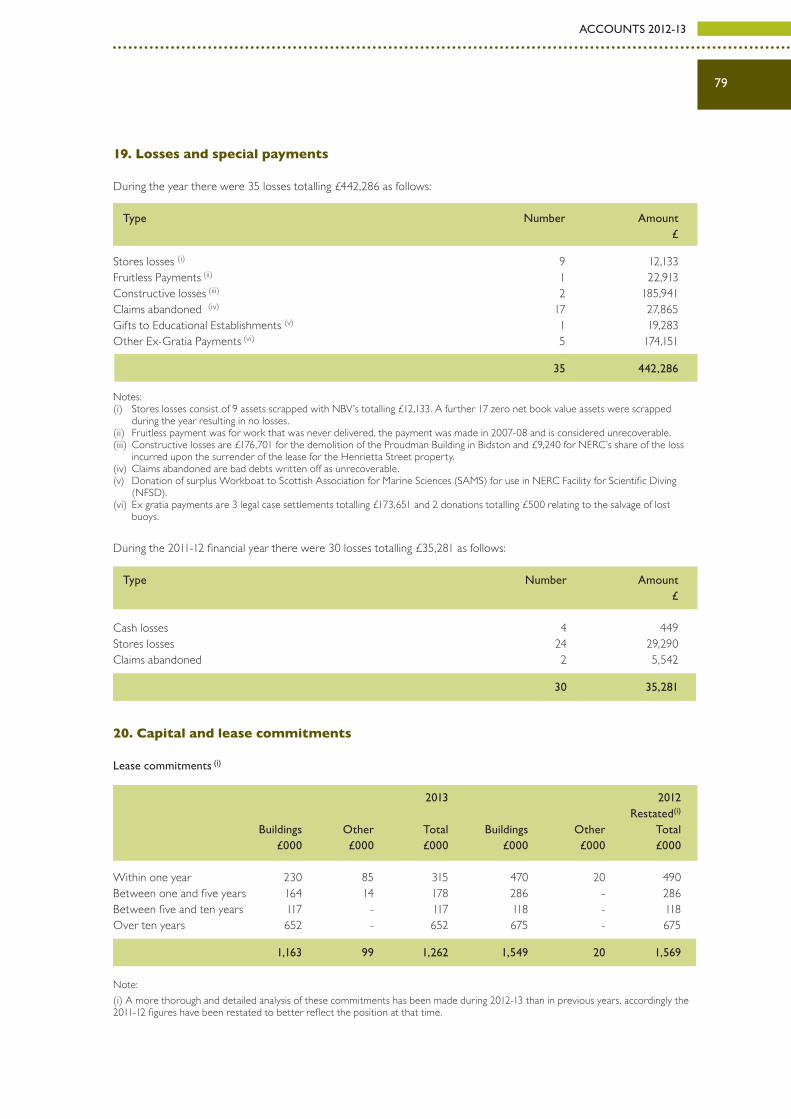
79
ACCOUNTS 2012-13
19. Losses and special payments During the year there were 35 losses totalling £442,286 as follows: Type Number Amount £
Stores losses (i) 9 12,133Fruitless Payments (ii) 1 22,913Constructive losses (iii) 2 185,941Claims abandoned (iv) 17 27,865Gifts to Educational Establishments (v) 1 19,283Other Ex-Gratia Payments (vi) 5 174,151
35 442,286 Notes: (i) Stores losses consist of 9 assets scrapped with NBV’s totalling £12,133. A further 17 zero net book value assets were scrapped
during the year resulting in no losses. (ii) Fruitless payment was for work that was never delivered, the payment was made in 2007-08 and is considered unrecoverable.(iii) Constructive losses are £176,701 for the demolition of the Proudman Building in Bidston and £9,240 for NERC’s share of the loss
incurred upon the surrender of the lease for the Henrietta Street property. (iv) Claims abandoned are bad debts written off as unrecoverable. (v) Donation of surplus Workboat to Scottish Association for Marine Sciences (SAMS) for use in NERC Facility for Scientific Diving
(NFSD). (vi) Ex gratia payments are 3 legal case settlements totalling £173,651 and 2 donations totalling £500 relating to the salvage of lost
buoys. During the 2011-12 financial year there were 30 losses totalling £35,281 as follows: Type Number Amount £
Cash losses 4 449Stores losses 24 29,290Claims abandoned 2 5,542
30 35,281
20. Capital and lease commitments
Lease commitments (i) 2013 2012 Restated(i)
Buildings Other Total Buildings Other Total £000 £000 £000 £000 £000 £000 Within one year 230 85 315 470 20 490Between one and five years 164 14 178 286 - 286Between five and ten years 117 - 117 118 - 118Over ten years 652 - 652 675 - 675
1,163 99 1,262 1,549 20 1,569 Note: (i) A more thorough and detailed analysis of these commitments has been made during 2012-13 than in previous years, accordingly the 2011-12 figures have been restated to better reflect the position at that time.

NERC Annual Report & Accounts 2012-13
80
Capital commitments As at the date of these accounts, NERC is committed to a sum of £6.30m in respect of capital contracts. This includes £4.25m for the building of the RRS Discovery replacement ship due to be completed in 2014-15 and £0.73m for the Seabed Rockdrill Winch due to be completed in 2013-14. Bonds and guarantees The Council has a number of bonds and guarantees that are lodged with Lloyds Bank and relate to overseas contracts, amounting to £823,950 at 31 March 2013 (2011-12: £872,006).
21. Contingent liabilitiesThe value of contingent liabilities at 31 March 2013 of legal claims made against NERC where based on legal advice sought it is not deemed probable that these will lead to future outflows of resources, is estimated at £12k (2011-12 £Nil).
22. Events after the reporting periodIn accordance with the requirements of IAS 10 ‘Events After the Reporting Period’, post Statement of Financial Position events are considered up to the date on which the Accounts are authorised for issue. This is interpreted as the same date as the date of the Certificate and Report of the Comptroller and Auditor General. There are no post Statement of Financial Position events between the balance sheet date and this date.
23. Derivatives and other financial instruments IFRS 7 Financial Instruments – Disclosures, IFRS 32 Financial Instruments – Presentation and IFRS 39 Financial Instruments – Recognition and Measurement require disclosure of the role which financial instruments have had during the period in creating or changing the risks an entity faces in undertaking its activities. Due to the largely non-trading nature of its activities and the way it is financed, the Council is not exposed to the degree of financial risk faced by non-public sector entities. Moreover, financial instruments play a much more limited role in creating or changing risk than would be typical of the listed companies to which IFRS 7, 32 and 39 mainly apply. The Council has limited powers to borrow or invest funds and except for the finance lease contract (details of which are given in notes 1(v), 9(a) and (17), financial assets and liabilities are generated by day-to-day operational activities and are not held to change the risks facing the Council in undertaking its activities.
Liquidity riskThe Council’s net revenue resource requirements are financed by grant-in-aid from its sponsor department, the Department for Business, Innovation and Skills. The capital expenditure, with the exception of the ship financed under the finance lease referred to above, is also financed through grant-in-aid. The Council is therefore not exposed to significant liquidity risks.
Interest rate riskThe Council is not exposed to significant interest rate risk.
Foreign currency riskThe Council’s exposure to foreign currency risk is not currently significant.


82
Natural Environment Research CouncilPolaris House, North Star Avenue, Swindon, SN2 1EU, Wiltshire, UK.
Tel: 01793 411500 Fax: 01793 411501 www.nerc.ac.uk 9 780102 982770
ISBN 978-0-10-298277-0
Published by TSO (The Stationery Office) and available from:
Onlinewww.tsoshop.co.uk
Mail, telephone, fax and emailTSOPO Box 29, Norwich NR3 1GNTelephone orders/general enquiries: 0870 600 5522Order through the Parliamentary Hotline Lo-Call 0845 7 023474Fax orders: 0870 600 5533Email: [email protected]: 0870 240 3701
The Houses of Parliament Shop12 Bridge Street, Parliament Square,London SW1A 2JXTelephone orders/general enquiries: 020 7219 3890Fax orders: 020 7219 3866Email: [email protected]: www.shop.parliament.uk
TSO@Blackwell and other accredited agents