Embed Size (px)
Citation preview

Address: Str. Dervish Rozhaja No. 12, 10000 Prishtina, Kosovo Tel: 038 247 615 ext. 101, Fax: 038 247 620, E-mail: [email protected], web: www.ero-ks.org
ANNUAL REPORT 2019
Prishtina, March 2020

ANNUAL REPORT 2019
2
TABLE OF CONTENTS
1 EXECUTIVE SUMMARY ............................................................................................ 6
2 ENERGY REGULATORY OFFICE ................................................................................ 9
2.1 The Board of the Regulator........................................................................................ 9
2.2 Organizational Structure and Human Resources .................................................... 10
2.3 Funding of the Regulator ......................................................................................... 14
3 ACTIVITIES OF THE ENERGY REGULATORY OFFICE ................................................ 15
3.1 Licensing of energy activities ................................................................................... 15
3.2 Renewable Energy Sources (RES)............................................................................. 18
3.3 Authorization - construction of new capacities ....................................................... 22
3.4 Self-consumption generators .................................................................................. 28
3.5 Harmonization of Power Purchase Agreements by the RES ................................... 29
3.6 Monitoring of energy enterprises ............................................................................ 30
3.7 Court Disputes ......................................................................................................... 36
3.8 Electricity and Thermal Energy Annual Balance ...................................................... 36
3.9 Activities of the Regulator in the Area of Price Regulation ..................................... 37
3.10 Activities of the Regulator in the Area of Customer Protection .............................. 46
3.11 TSO (KOSTT) Certification Process ........................................................................... 51
4 COOPERATION WITH OTHER PARTIES AND TRANSPARENCY ................................ 52
4.1 Reporting and cooperation with the Assembly of Kosovo ...................................... 53
4.2 Cooperation with International Organizations ........................................................ 55
4.3 Procurement activities ............................................................................................. 64
5 FINANCIAL REPORT OF ERO .................................................................................. 65
5.1 Revenues .................................................................................................................. 65
5.2 Budget ...................................................................................................................... 65
5.3 Budget Expenditures ................................................................................................ 66
6 ELECTRICITY SECTOR ............................................................................................. 70
6.1 Characteristics of the electricity sector ................................................................... 70
6.2 Primary Energy Sources ........................................................................................... 74
6.3 Electricity Generation .............................................................................................. 75
6.4 Transmission System................................................................................................ 80
6.5 Electricity distribution system ................................................................................. 90
6.6 Electricity Supply ...................................................................................................... 99
6.7 Electricity Import and Export ................................................................................. 104

ANNUAL REPORT 2019
3
6.8 Quality Standards of electricity supply and services .. Error! Bookmark not defined.
7 THERMAL ENERGY SECTOR ................................................................................. 121
7.2 Main Developments in Thermal Energy Sector ..................................................... 122
7.3 Performance of District Heating Companies ......................................................... 125
7.4 Overall production, supply and losses of thermal energy ..................................... 129
7.5 Billing, collection and heating surface ................................................................... 129
8 NATURAL GAS SECTOR ........................................................................................ 132
8.1 Perspective of the development of natural gas sector in Kosovo ......................... 132
9 CONCLUSION ....................................................................................................... 135
9.1 Challenges/Recommendations of the Regulator ................................................... 135

ANNUAL REPORT 2019
4
List of abbreviations
CPA Central Procurement Agency
EU European Union
RES Renewable Energy Sources
CCP Customer Care Programme
CEER Council of European Energy Regulators
TENGD Thermal Energy and Natural Gas Department LLD Legal and Licensing Department
CPD Customer Protection Department
TPD Tariffs and Pricing Department EMD Energy Market Department
EBRD European Bank for Reconstruction and Development
EC European Commission
ECRB Energy Community Regulatory Board
SEE South East Europe
EMS Serbia Transmission System Operation ENS Energy Not Supplied
ENTSO-E European Network of Transmission System Operators for Electricity
ERC Energy and Water Regulatory Commission of the Republic of Northern Macedonia
ERE Albanian Energy Regulator Authority
ERRA Energy Regulators Regional Association
USS Universal Service Supplier
GWG Gas Working Group PHLG Permanent High Level Group
GWh Gig watt hour HC Hydropower Plant
MAR Maximum Allowed Revenue
IAP Ion-Adriatic-Pipeline
ITC Inter TSO Compensation
EnC Energy Community
KEDS Kosovo Electricity Distribution and Services
SEEEC South East Europe Energy Community
KEK Kosovo Electricity Corporation
KESCO Kosovo Electricity Supply Company
KESH Albanian Energy Corporation
KfW German Development Bank
CM Council of Ministers
km Kilometer
KOSTT Transmission, System and Market Operators
KPSC Kentucky Public Service Commission
kV Kilovolt
kW Kilowatt
OL Overhead line
MPA Ministry of Public Administration

ANNUAL REPORT 2019
5
PPA Power Purchase Agreement
MESP Ministry of Environment and Spatial Planning
MVA Megavoltamper
MW Megawatt
MWh Megawatt hour
MWTH Thermal Megawatt
MED Ministry of Economic Development
NARUC National Association of Regulatory Utility Commissioners
AU Administration unit
DH District Heating
SS Substation
DSO Distribution System Operator
TSO Transmission System Operator
MO Market Operator
PECI Projects of Energy Community Interest
EP Regulatory Period
RAB Regulated Asset Base
RoR Rate of Return
SAIDI System Average Interruption Duration Index SAIFI System Average Interruption Frequency Index
SCADA Supervisory Control and Data Acquisition
SKE Energy Community Secretariat
TAP Trans-Adriatic-Pipeline
PP Power Plant
TF Task Force
TKE Energy Community Treaty
MV Medium Voltage
TR Transformer
LV Low Voltage
VAT Value Added Tax
AI Administrative Instruction
USAID United States Agency for International Development
WACC Weighted Average Cost of Capital
WBIF Western Balkans Investment Framework
CA Cadastral Area
ERO Energy Regulatory Office (ERO)

ANNUAL REPORT 2019
6
1 EXECUTIVE SUMMARY
Pursuant to the obligations contained in the Law No. 05/L-084 on the Energy Regulator, the Energy
Regulatory Office (hereinafter ERO) presents the Annual Report 2019 for review by the Assembly of
the Republic of Kosovo. The Annual Report contains information on activities undertaken and results
achieved in relation to the scope of ERO, as well as analysis regarding the energy enterprise activities,
according to licensee data, and present an overview of the energy market development in Kosovo.
An integral part of this report is also ERO's financial report for 2019.
The Regulator drafted secondary legislation for the energy sector, based on the requirements arising
from the primary laws and the obligations deriving from the Energy Community, where Kosovo is a
participant in the Energy Community Treaty. The drafting and review of the secondary legislation by
the Regulator is done by applying public consultations where third parties can provide their stands.
Further, a brief summary of the Regulator's activities and developments in the energy sector is
presented, starting with the obligations, responsibilities, organizational structure and funding of the
Regulator.
An important activity of the Regulator is the licensing of energy enterprises for generation,
supply/trade, transmission and distribution of energy. The Regulator’s Board has issued
licenses for energy generation to the companies; Hydroenergy, Kelkos Energy, Kosovo Energy
Corporation (KEK for the TPP Kosova A - license extension) and in the process of review is the
application of Contour Global Kosova.
The license for the company Enerco LLC has been issued for the supply of electricity.
The Regulator, through various forms of support, including the Support Scheme and priority
in dispatching, pays special attention to the development of Renewable Energy Sources (RES)
projects. The projects for the development of RES are realized through the authorizations
issued by the Regulator, where during 2019 the Regulator has issued 22 preliminary
authorizations, 2 final authorizations, has modified 4 final authorizations and 3 applications
are in the process of review. In the process of construction are 4 projects with wind turbines,
some projects of small hydropower plants and a project of biomass.
Also, during 2019, 20 decisions have been issued for the construction of self-consumption
generators.
During 2019, the Regulator has continued to monitor licensed energy companies, including
the energy market.
Monitoring reports are published on the ERO website.
The Regulator has reviewed the applications of licensed entities for allowed revenues and
tariffs in the electricity sector, for the transmission, distribution, bulk purchases of electricity
and the supply of electricity to customers with universal service, as well as the review of the
tariff application for thermal energy.
In February 2019, the Reguator’s Board certified the Transmission System Operator, thus
concluding the certification process which was considered successful by the Energy
Community Secretariat.

ANNUAL REPORT 2019
7
In the framework of customer protection, the Regulator during 2019 has received 75 new
complaints from customers, while it has resolved 263 complaints, including those from
previous years.
In the framework of its cooperation activities and relations with other institutions, the
Regulator has made reports to the Assembly of Kosovo, and has had meetings with
parliamentary committees and concluded an agreement with the Kosovo Chamber of
Commerce.
During 2019, cooperation agreements were signed with international partners such as the
Energy and Water Regulatory Commission (ERC) of the Republic of Northern Macedonia and
the Energy Regulatory Entity (ERE) of the Republic of Albania.
As part of the cooperation with NARUC, issues for vulnerable customers and cyber security
were discussed.
In carrying out and performing the duties and responsibilities defined by law, the Regulator
has participated in international activities organized by the Energy Community Secretariat as
a participant in working groups for electricity, gas, customers and retail markets, as well as
for REMIT and cyber security.
The Regulator is funded from its own revenues, in accordance with the Law on Energy
Regulator, and during 2019 has realized revenues in the amount of € 1,329,192.29, while it
has spent € 699,215.18 and the unspent portion in the amount of € 629,977.11 has been
poured into the Budget of the Republic of Kosovo.
The second part of the report contains the activities of the licensees in the energy sector where
electricity, thermal energy and natural gas are analysed separately.
In the electricity sector the report contains data on the electricity market, production,
transmission, distribution, demand, losses, supply, imports, exports and wholesale and retail
electricity prices.
Electricity production in 2019 was 5,718 GWh, of which 5,404 GWh are from thermal power
plants, while from HP and other RES are 314 GWh, and there is an increase of 7.7% compared
to production in 2018.
The total demand for electricity in the system in 2019 was 6,001 GWh, which represents an
increase of 5.8% compared to the demand in 2018.
Losses in the transmission network are at an acceptable level of 1.25% to the energy
introduced into the transmission.
Losses in the distribution network are quite high. Technical losses are 12.84%, while
unauthorized energy consumption (hereinafter referred to as commercial losses) accounts
for 13.04% of the distribution demand, of which unencumbered energy in the four northern
municipalities of Kosovo is 5.53% (294 GWh). The supply of customers in 2019 includes the
supply of customers with the right to universal service and unregulated customers. The share
of household customers in total consumption is about 57%, while with 43% other customers
participate.

ANNUAL REPORT 2019
8
For the category of household customers, the average price of energy is € 5.68 cents / kWh,
while for non-household customers the average price of energy is € 7.33 cents / kWh.
The following table reflects the main data realized in 2019 compared to the balance sheet of
2019 and the realization in 2018, which shows that to balance the system-supply to demand
there is a need for imports and exports.
As for the thermal energy sector, the situation remains largely unchanged. The cogeneration
project in DH Termokos has given good results by raising the quality of heating for customers
connected to the network, while the cogeneration project in DH Gjakova is in the process of
realization.
Thermal energy production in 2019 in DH Termokos was 235 GWhTh, while in DH Gjakova9.1 GWhTh;
Thermal energy consumption in 2019 in DH Termokos was 210 GWhTh, while in DH Gjakova6.9GWhTh;
Thermal energy losses in 2019, in DH Termokos were 8.44% (only for the primary distribution network), while in DH Gjakova20%.
In Kosovo, there is no functional infrastructure and natural gas market, but energy laws and
energy strategy envisage the development of natural gas infrastructure, through connection
with gas infrastructure projects in the region of Southeast Europe, through the gas pipeline
project. TAP ("Trans-Adriatic-Pipeline" - Pipeline Beyond the Adriatic) and the Northern
Macedonia-Kosovo Gas Interconnection Project - Kosovo.
Load Realisation Billing Collection
MWh MWh € €
Regulated customers (distribution) 5,321,999 3,944,315 278,206,817 276,721,423
Unregulated customers (transmission) 573,713 573,713 27,801,482 27,801,482
Total 5,895,713 4,518,028 306,008,300 304,522,905
2019
Transmission Distribution
Realisation 2019 GWh 5,718 6,001 928 905 105 1,378
Balance 2019 GWh 5,696 5,627 693 650 110 1,341
Ratio Realis./Balance % 100.38 106.65 133.98 139.23 95.90 102.71
Realisation 2018 GWh 5,311 5,686 1,242 880 118 1,464
Ratio 2019/2018 % 107.66 105.54 74.76 102.84 89.40 94.10
Unit Demand Import Export
Losses
Generation

ANNUAL REPORT 2019
9
2 ENERGY REGULATORY OFFICE
Energy Regulatory Office (ERO) is an independent agency and separated in legal and functional
terms from any other natural or legal person. ERO’s duties and functions are defined in the Law 05/L-
084 on Energy Regulator, which includes: the efficient, transparent and non-discriminatory creation
and functioning of the energy market; determining the terms and conditions as well as granting of
licenses for carrying out activities in the field of energy; determining the terms and conditions and
the granting of authorizations for construction of new capacities; market monitoring and the
care to improve energy supply security; setting tariffs for energy activities in a reasonable manner
and based on tariff methodology; monitoring and preventing the creation of dominant position and
uncompetitive practices by energy enterprises, as well as resolving complaints and disputes in the
energy sector.
ERO is responsible for designing and implementing the regulatory framework for the energy sector
in Kosovo, in order to achieve compliance with the obligations of SEEEC Treaty and alignment with
the “acquis communautaire” on energy, ensure non-discriminatory access to all energy network
users at prices reflecting true economic costs.
2.1 The Board of the Regulator
The Board of the Regulator consists of 5 members including the chairman, who are appointed as full-
time employees by the Assembly of Kosovo with a term of five (5) years. The Board of the Regulator
is a
decision-making body for all matters under the Regulator’s jurisdiction and competence. The Board
takes decisions by majority vote and has the quorum needed to take a decision if at least three
Board members are present, but there should be three (3) votes in favour in order to become a final
decision. The Board states its stances regarding the issues it handles through decisions that are
taken at open sessions announced in advance on ERO’s official website.
From May 2017, the ERO Board operates with acting chairpersons but has the necessary quorum for
decision-making.
On December 31, 2019, the Board of the Energy Regulatory Office consisted of the following
members:
Arsim Janova, Acting chairman;
Besim Sejfijaj, member;
Selman Hoti, member; and
Izet Rushiti, member.
For decision-making purposes, in accordance with the authority granted under the legislation in
force, the ERO Board has held regular meetings where it discussed about the
functioning of the energy system in Kosovo, and adequate decisions were taken and documents
needed for the sector were approved.

ANNUAL REPORT 2019
10
The ERO’s Board until December 2019 has held a total of eleven (11) public meetings, in which 134
decisions related to:
Market monitoring and energy sector activities;
Liberalization of the energy market;
Price adjustment;
Licensing of energy activities in Kosovo;
Authorization for construction of new generation capacities from renewable
sources;
Customer protection;
Approval of rules, methodologies and other energy sector documents, and
Other issues within its responsibilities.
Most of the approved and reviewed documents were initially subject to public discussion, as
foreseen by law, to include all parties involved in the decision-making processes and are published
in ERO’s official website.
The Board, for all activities, was supported by: Managing Director, Administration Unit and 5
departments as follows:
Legal and Licensing Department (LLD)
Energy Market Department (EMD)
Tariffs and Pricing Department (TPD)
Customer Protection Department (CPD)
Thermal Energy and Natural Gas Department (TENGS)
In terms of professional qualifications, the Board of ERO has targeted the employees' specialization
in the relevant profiles within their responsibilities, through various training courses organized inside
and outside the country.
2.2 Organizational Structure and Human Resources
The Regulator is organized in accordance with the Law on Energy Regulator (Chapter II of the Law)
and the Regulator’s Operations Manual. The Board of the Regulator, according to the responsibilities
defined by law, performs the following activities:
approves the regulatory and operational policies of the Regulator;
organizes and supervises the work of the Regulator;
oversees the implementation of the Budget and Financial Management of the Regulator and
approves its financial reports and statements;
organizes recruitment procedures and supervises the work of the staff employed by the
Regulator;
approves compensation levels and other employment conditions for employees of the
Regulator;
drafts and approves bylaws that are necessary for implementation of the Law on Energy
Regulator.

ANNUAL REPORT 2019
11
The organizational structure of the Regulator is determined by the Board of the Regulator based on
the responsibilities and duties provided in the Law on Energy Regulator no. 05/L-084. The basic
structure consists of the Managing Director, the Assistance Officer of the Board, the Public Relations
Officer, five departments and the Administration Unit (AU) which were established in accordance
with the operational duties of the Regulator.
2.2.1 Managing Director
The managing director coordinates the activities between the Board and the professional and
administrative staff; is responsible for implementing all decisions of the Regulator’s Board, actively
informs and advises the Board on developments in the energy sector, supports the Regulator’s Board
to ensure that all activities of the Regulator are carried out in accordance with the laws, regulations
and policies of the Regulator, as well as oversees the work of the Regulator’s departments. The
Managing Director reports and responds directly to the Board and exercises the duties under the
direction and guidance of the Board, in accordance with the Regulator's Manual of Operations.
2.2.2 Departments of the Regulator
Departments are headed by department heads, who organize, control, and plan, collaborate,
evaluate his/her staff and are responsible for the activities and fulfilment of all tasks assigned to the
work of the departments. The head of the department is responsible for delegating the day-to-day
affairs of the department staff.
The role of department staff members is to perform tasks, whenever necessary according to legal
requirements, and through department heads are proposed to the Board. In some cases, staff
members may be authorized by the Board to perform special duties.
Staff members should work closely with the head of the department and other professional staff. The
staff member should also have the opportunity to attend the trainings available from the Regulator,
to improve their skills and professional knowledge.
Legal and Licensing Department (LLD)
Legal and Licensing Department is responsible for drafting secondary legislation, reviewing
licensing applications by energy enterprises, reviewing applications on granting authorizations
for construction of new capacities. This department also supervises and monitors licensees’
activities
Energy Market Department (EMD)
Energy Market Department is responsible for market structure, monitoring the performance of
market participants, evaluation and analysis of data in the energy sector. The Department also
monitors competition and behaviour of market participants in an objective, transparent and
non-discriminatory manner.
Tariffs and Pricing Department (TPD)
Tariffs and Pricing Department is responsible for evaluation of tariff applications of licensed
enterprises, monitors the execution of operational and capital expenses through tariff reviews,
undertakes all the measures to ensure that the tariffs are cost-reflective, reasonable, non-

ANNUAL REPORT 2019
12
discriminatory, based on objective criteria and established in a transparent manner, taking into
consideration customer protection.
Customer Protection Department (CPD)
Customer Protection Department is responsible for reviewing and resolving complaints and
disputes between customers and energy enterprises, system operators and energy enterprises
as well as between two energy enterprises. In the course of exercising its duties and
responsibilities, this Department cooperates with all institutions and organizations which
legitimately represent customers.
Thermal Energy and Natural Gas Department (TENGD)
Thermal Energy and Natural Gas Department is responsible for reviewing and implementing
strategies, performance standards and other operational practices that are related to these
sectors. This Department carries out the monitoring of licensed enterprises through collection,
analysis and evaluation of relevant data and information and also contributes to the
development of reporting systems of district heating enterprises, focusing in technical-
technological elements and integration of incentives and targets for efficiency. It also cooperates
with other departments of ERO by providing support and technical expertise on issues related
to thermal energy and natural gas.
Administration Unit (AU)
Administration Unit supports the functioning of ERO, administration of finances, organizes the
efficient recruitment of ERO staff, coordinates trainings of the ERO staff, supply and maintenance
of office equipment and assists in arranging the office by making it comfortable for work for all
the ERO staff.
Fig. 2.1 Organizational Scheme of ERO
Brief description of organizational structure with job positions in 2019 is shown in the table below.
Board of Energy
Regulatory Office
Managing Director
Energy Market Department
Prices and Tariffs Department
Legal and
Licensing Department
Customer
Protection Department
Thermal Energy and Natural Gas
Department
General Administration
Unit
Board Assistance
Officer
Public Relation Officer

ANNUAL REPORT 2019
13
Tab. 2.1 Organizational structure
The Regulator’s staff is a team of experts with proven performance in the areas of responsibilities
they cover.
This composition of engineering, economics, law and other experiences strengthens the
confidence of an institution having clear strategies towards success in developing the energy
sector in Kosovo.
Job Positions Planned Positions Employed Vacancies
ERO Board 5 4 1
Managing Director 1 1 0
Public Relations Officer 1 1 0
Board Assistance Officer 1 1 0
Administration Unit
Head of Administration Unit
Chief Financial Officer
Procurement Manager
Administration Officer
Data Manager Officer
Database Development Expert
English Translator
Receptionist
Driver/Maintenance
Legal and Licensing Department (LLD)
Head of Legal and Licensing Department
Legal Affairs and Monitoring Expert
License Monitoring Analyst
Tariffs and Pricing Department (TPD)
Head of Tariffs and Pricing Department
Expert for Regulatory Affairs and Tariffs
Tariffs and Prices Analyst
Tariff Structure Analyst
Energy Market Department (EMD)
Head of Energy Market Department
Power Supply and Market Structure Analyst
Power Systems Analyst
Market Monitoring Analyst
Thermal Energy and Natural Gas Department (TENGD)
Head of Thermal Energy and Natural Gas Department
Thermal Energy Analyst
Customer Protection Department (CPD)
Head of Customer Protection Department
Customer Protection Officer
Standards Performance Analyst 1
Total 33 31 2
9 9 0
3 3 0
4 4 0
4 4 0
2 2 0
3 20

ANNUAL REPORT 2019
14
2.3 Funding of the Regulator
The Regulator is funded from dedicated revenues collected from taxes of licensees pursuant to Article 24 of the Law on Energy Regulator.
The Regulator collects taxes for:
- Initial and annual licensing tax;
- Applications for issuance and modification of licenses;
- Issuance of Certificates of Origin;
- Reviewing of applications for authorization for construction of new capacities.
In accordance with the Law on Energy Regulator, all the above-mentioned taxes are dedicated
revenues of the Regulator.
If it is deemed that the Regulator's dedicated revenues are insufficient to cover the total costs
required for the effective performance of the obligations, the Regulator may request an additional
budget allocation to cover the shortfall. Also in accordance with this Law, if the collected taxes exceed
the provisions of the Regulator, they are deposited in the state budget.
ANNUAL REPORT 2019
15
3 ACTIVITIES OF THE ENERGY REGULATORY OFFICE
3.1 Licensing of energy activities
It is now known that no energy activity can be carried out in Kosovo without a license issued by the
Energy Regulatory Office. All types of activities for which enterprises must be licensed are described
in the legislation in force, more specifically in Article 28 of the Law on Energy Regulator. According to
this Article (paragraph 2) and also according to Article 3 (paragraph 1) of the Rule for Licensing of
Energy Activities in Kosovo (ERO Rule / No. 07/2017, dated 31.03.2017),Regulator has licensed the
following activities: electricity production; thermal energy production; co-production of electricity
and thermal energy; transmission of electricity, including operation of transmission system;
distribution of electricity, including operation of distribution system; distribution of thermal energy;
supply of electricity and thermal energy, including transit, import or export of electricity; wholesale
supply (trading) of electricity supply; and operation of the electricity market
In addition to the aforementioned licenses, applicable laws allow for some energy activities without
having to apply to the Regulator for a license, as these activities do not have a stringent
impact on Kosovo’s energy system. Activities that do not require a permit are as follows:
production of electricity at the energy location, with a capacity not exceeding 5 MW;
production of thermal energy from DHs for own consumption, or with a capacity not
exceeding 1 MW;
production of electricity for own consumption, where the production facility or electricity
customers are not connected to the transmission or distribution system.
Since its establishment until now, the Regulator has licensed about seventy (70) enterprises for
various energy activities; where about forty (40) still have active licenses.
During this year, the focus of the companies that have applied for licensing has been on licensing the
production of electricity, mainly from renewable energy sources (water), electricity supply and
extension of the license.
Unlike other years, for the first time this year no enterprise has applied to the Regulator for licensing
of the activity of wholesale supply (trade) of electricity.
3.1.1 Licensing of electricity generation activity
According to Article 29 of the Law on Energy Regulator, power generation for generators with a
capacity greater than 5 MW cannot be done without a license issued by the Regulator.
As a result, the Regulator continuously accepts applications for licensing of electricity generation
activity (from lignite, wind, water, solar, etc.), which is worth mentioning that during this year, unlike
other years, the Regulator has issued four (4) (temporary) licenses for electricity generation from
hydropower plants, where the process of construction of these hydropower plants has also been led
by the Regulator through the rule on authorization procedure for construction of new capacities. Also
during this year an applicant has applied to the Regulator for electricity production from lignite (coal)
and an applicant for extension of the license.

ANNUAL REPORT 2019
16
Enterprises that have been provided with a (temporary) license for electricity production, the license
has been extended and those who are in the process of licensing the activity of electricity production,
can be found in the table below.
Tab. 3.1 The licensed companies have had their licenses extended and are in the process of licensing their electricity generation activity
Hydropower (Hidroregjioni) L.L.C. – has applied to the Regulator for electricity generation license
from Lepenci 3 Hydropower Plant, on 20 December 2018, for installed capacity of 9.98 MW.
The Regulator’s Board on 5 June 2019, with decision V_1140_2019, has issued a temporary license to
the company in question, obliging the company to bring the Integrated Environmental Permit to the
Regulator within twelve (12) months from the date of issuing the decision.
Kelkos Energy L.L.C – this enterprise has applied to the regulator for licensing the activity of electricity
production, for three (3) production units from:
- Deçan hydropower plant with a capacity of 8.06 MW
- Belaje hydropower plant with a capacity of 9.8 MW and
- Lumbardhi II hydropower plant with a capacity of 6.2 MW
For the first two units it applied on 24 February 2016, while for the last unit it applied on 21 December
2018. In the absence of complete documentation, no decision was made to license this enterprise
until 2019. Thus, the Board of the Regulator during this year, more specifically on 14 October 2019,
by decision V_1182_2019, V_1183_2019, and V_1184_2019 has issued to the enterprise in question
a temporary license for all three hydropower plants, obliging the enterprise to bring the Integrated
Environmental Permit to the Regulator within twelve (12) months, within the deadline set in the
decision, from the date of issuance of the decision.
The commissioning of these hydropower plants (Lepenci 3, Deçani, Belaje and Lumbardhi II),
increases the production capacity in Kosovo from renewable resources (over 5MW) in total of
34.04MW.
No. Name of the CompanyDescription of licensed
activityLicense number
Address, headquarters of the
licensee License validity
1"Hidroenergji" L.L.C. (HPP
Lepenci 3)
Electricity generation
(from water)ZRRE/Li_63/18
Str. Dëshmorët e Kombit, P.N.
Ferizaj, Republic of Kosovo
05.06.2019 -
04.06.2020
Temporary license
2"KelKos Energy” SH.P.K (HPP
Deçani)
Electricity generation
(from water)ZRRE/Li_49/16
Str. Demë Ali Pozhari, No. 41,
51000 Deçan, Republic of
Kosovo
14.10.2019 -
13.10.2020
Temporary license
3"KelKos Energy” SH.P.K (HPP
Belaje)
Electricity generation
(from water)ZRRE/Li_50/16
Str. Demë Ali Pozhari, No. 41,
51000 Deçan, Republic of
Kosovo
14.10.2019 -
13.10.2020
Temporary license
4"KelKos Energy” SH.P.K (HPP
Lumbardhi II)
Electricity generation
(from water)ZRRE/Li_64/18
Str. Demë Ali Pozhari, No. 41,
51000 Deçan, Republic of
Kosovo
14.10.2019 -
13.10.2020
Temporary license
5Kosovo Energy Corporation
JSC (PP Kosova A)
Electricity generation
(from lignite)ZRRE/Li_05/17_A
Str. “Nëna Terezë” No 36,
10000 Prishtina, Republic of
Kosovo
04.10.2019-
04.10.2020-License
renewal
6"ContourGlobal Kosovo"
L.L.C.
Electricity generation
(from lignite)ZRRE/Li_66/19
Str. Anton Çeta, 5A, 10000 -
Prishtina, Republic of Kosovo
in the process of
l icensing

ANNUAL REPORT 2019
17
Kosovo Energy Corporation JSC The Generation Division, Kosova A Thermal Power Plant - this year,
as well as other years, KEK has applied for extension of the license for production of electricity from
lignite (coal) until 04.10.2022, while the same has been extended the license from the Board of
Regulator for the period from 04.10.2019 to 04.10.2020.
With regard to the extension of the license, the duration of each license may be extended for a period
of time not exceeding the relevant time period of the current license, meaning that the licensee
manages to meet all the conditions and obligations of the license and has submitted a written request
for extension of the current license.
Contour Global Kosovo L.L.C. – In addition to the application for energy production from renewable
energy sources, the Regulator on 20.06.2019 has received an application with several supporting
documents for energy production from lignite (coal) with an installed capacity of 500MW. The
application is in the process of being reviewed and will be evaluated in accordance with applicable
legislation.
3.1.2 Licensing of electricity supply activity
Unlike previous years, when the interest for licensing of this activity was much higher, during this
year we have only one enterprise (Enerco LLC) which has applied on 5 March 2019 and on 16 April
2019 is licensed to supply electricity, despite this, has not yet provided any supply of electricity to
customers.
Neither this nor seven (7) previously licensed enterprises (HEP Energy KS L.L.C., GSA ENERGJI L.L.C.,
FUTURE ENERGY TRADING AND EXCHANGE DYNAMICS L.L.C., JAHA COMPANY L.L.C.,) SharrCem L.L.C,
and the Kosovo Energy Corporation JSC) except KESCO have not entered the market to supply
customers with electricity. Therefore, the entire supply of customers in the country with electricity,
even during 2019, has been done by KESC, the same as in previous years.
Tab. 3.2 Enterprises that are licensed for electricity supply activity during 2019.
The duration of the supply license is determined depending on the financial situation of the applicant
with a maximum duration of twenty-five (25) years, while in terms of the enterprise Enerco L.L.C the
Board of the Regulator has issued a license for a period of five (5) years in accordance with Article 32
of the Law on Energy Regulators.
The Regulator decides on each license application, within sixty (60) calendar days, upon submission
of the completed application.
It is important to note that during this year there was no application for licensing the activity of
wholesale supply (trade) of electricity, so the trade of electricity was carried out by some enterprises
that are licensed by the Energy Regulator and other enterprises, licensed to any of the contracting
parties of the Energy Community. According to the Law on Electricity, licenses issued for the trade of
electricity in other Contracting Parties of the Energy Community must be recognized in Kosovo. Such
No. Name of the CompanyDescription of licensed
activityLicense number
Address, headquarters of the
licensee License validity
1 Enerco LLC. Electricity supply ZRRE/Li_65/19
Bregu i diellit, Hyzri Talla
11/4, Prishtina, Republic of
Kosovo
16.04.2019-
15.04.2024 license
issuance

ANNUAL REPORT 2019
18
licensed suppliers will be entitled to trade electricity without the need for an additional license.
Traders and suppliers registered with another Party of the Energy Community have the right to
participate in the electricity market, in accordance with the principle of reciprocity and in accordance
with applicable market rules, balancing rules and fiscal rules.
3.2 Renewable Energy Sources (RES)
The applicable Law No. 05/L-081 on Energy has established the RES policy, which aims to promote
the economic and sustainable exploitation of the local potentials of RES, in order to meet the needs
for energy, increase the security of supply and environmental protection, which is an integral part
of the Energy Strategy of the Republic of Kosovo.
For the purpose of implementing RES policies, the respective Ministry, according to the legislation in
force, has determined with a special sub-legal act the energy targets of RES in accordance with
requirements of relevant directive of the European Union.
Law No. 05/L-084 on the Energy Regulator has established that the construction of new generation
capacities (RES), new systems for transmission and distribution of natural gas, including
interconnectors, and direct electricity lines and direct pipelines for transmission of natural gas shall
be undertaken in line with authorization procedures as described in this law, and shall be carried
out by the Regulator, in line with objective, transparent and non-discriminatory criteria.
In order to fulfill the legal obligations to achieve the mandatory target for RES by 2020, the Ministry
of Economic Development has issued Administrative Instruction no. 01/2013 and no. 05/2017 with
which it has determined the annual and long-term energy targets by the RES.
The Administrative Instruction has determined that the mandatory RES target by 2020 is 25% of the
gross final energy consumption as set out in Article 4 of the Decision No. D/2012/04/MC –EnC of
the Ministerial Council of the Energy Community.
It is worth mentioning that Kosovo is a signatory party to the Treaty establishing the Energy
Community, which was signed on 25 October 2005, ratified and entered into force on 1 July 2006 and
began to be implemented on 1 July 2007. Based on this, Kosovo has taken legal obligations to fulfill
all obligations related to the energy sector where it is foreseen the mandatory obligation to achieve
the targets of RES by 2020.
Annex I of this Administrative Instruction 05/2017 has defined electricity capacity from renewable
energy sources (MW), where the level of the targets set for renewable energy sources and admitted
to the Support Scheme is as in the following table:
Tab. 3.3 Targets for RES capacities
Primary Energy Source 2016 2017 2018 2019 2020
Photovoltaic 6 7 8 9 30
Wind 1 61 115 129 150
Small HPPs 40 57 181 187 240
Biomass 6 8 10 12 20
Capacity of Electricity from RES

ANNUAL REPORT 2019
19
3.2.1 Existing Support Scheme for Renewable Energy Sources
The Energy Regulatory Office (ERO), as an independent institution that regulates the energy sector in
Kosovo, implements the authorization procedure for development o RESf projects, issues licenses
and conditions for the operation of these projects, and drafts Support Schemes to help their financing
and realization.
The Rule on Support Scheme sets out the current principles of electricity support or subsidy
generated by renewable energy sources which would otherwise not be able to compete in the
wholesale market.
To be qualified for the Support Scheme, a RES generating facility must generate electricity from one
of the primary renewable energy sources, must be located within the territory of Kosovo and must
be equipped with new and unused generation facilities.
During the review of their application for admission, ERO refers to the mandatory specific target of
2020 technology set by the Ministry of Economic Development.
The Rule on Support Scheme for renewable energy generators also determines the maximum size of
a single acceptable project for a scheme such as:
3 MW for PV,
14 MW for biomass,
35 MW for the wind and
10 MW for hydro
Currently, the feed-in tariff is the only Support Scheme that uses financial incentives to achieve RES
targets. The criteria for obtaining this support exclude other types of financial incentives that will be
used simultaneously for the same project. There are currently no incentives for tax deductions or
import costs for renewable energy sources for electricity generation.
Kosovo, similar to most countries in the Southeast European Region (SEE), created its own support
scheme based on the feed-in tariff. However, due to financial constraints and the lack of quick
response to falling prices of RES technology, the efficiency of current support schemes has been called
into question. There is a need to consider a return to market-based support schemes, mainly
incentive premiums and competitive bidding/tender procedures (auctions), in order to increase cost-
effectiveness and limit competitive distortions. This trend has been accelerated by EU rules on state
aid that guides a gradual introduction of competitive bidding processes and provide for a gradual
replacement of the feed-in tariff with incentive premiums, which will also be a mandatory approach
for members of the Energy Community.
When considering a suitable support scheme for RES, four basic principles must be followed in
determining the most suitable support scheme for RES: effectiveness, efficiency, practice and
external effects of a support scheme.
Considering the certain benefits and disadvantages in different forms of RES support, incentive
premiums and auctions are the most approved RES support mechanisms based on market and price.
RES support mechanisms that are not considered pricing-based mechanisms are also important to
consider by policymakers, but are usually considered as something that complements pricing-based
ANNUAL REPORT 2019
20
mechanisms. Therefore, in order to achieve the planned goals for RES, a combination of supportive
but complementary financial and non-financial mechanisms (i.e., policy instruments) must be
gradually implemented to support the development and deployment of RES.
In order to set the right policy of the RES sector for Kosovo, the current phase of market liberalization
must be taken into account. There are well-known limiting factors in countries with similar market
conditions as in Kosovo; however, the general guidelines to follow when defining a support scheme
are;
Restrictions on Financial Support - Responsible decision makers should limit financial support to what is needed to ensure the competitiveness of RES generation in the market;
Flexibility - RES support scheme should be able to react to declining technology costs;
Integrity and transparency - decision makers should avoid any unannounced or retroactive changes;
Although auctions should provide greater efficiency and effectiveness in the RES sector, the following
risks could potentially occur;
Risk of unsuccessful tendering process. Every tender process takes a lot of time and costs
significantly to organize and participate in such a process.
The risk of failure to complete the project by the winning manufacturer can affect the
effectiveness and failure to achieve mandatory targets.
The aforementioned risks can be mitigated by selecting the right elements of the auction design. One
of the most important elements for mitigating the risk where incentive premiums, auctions and
competitive bids are presented are the price restrictions at the highest and lowest, which are
restrictions that do not allow either the premium or the price for electricity generated by the RES go
above or below predefined values.
Auctions are generally not organized for small power plants due to the high cost of preparing
documentation for bidding. For these manufacturers, an administrative approach to determining the
feed-in tariff or incentive premium is recommended. Similarly, auctions are not quite suitable for
markets without developed competition or where markets are dominated by a single entity.
In order to proceed with a new support scheme for RES based on competitive criteria, Kosovo
authorities need to analyse all relevant aspects in order to determine an appropriate way to move
forward in a gradual transformation towards market support mechanisms. To select the appropriate
support mechanism and its elements, the authorities must review and eventually adjust the legal and
regulatory framework. It is important to note that the introduction of the new mechanism should not
have any impact on all current PPA contracts signed under the current support scheme.
Key facts that characterize the RES Support Scheme:
• Generators from RES sign the Power Purchase Agreement valid for 10-12 years, depending on the technology.
• Support through Promotional Fees is provided for a reliable and stress-regulated regulatory framework to support the additional cost of production by RES.
• RES generators have the right of priority in dispatch for all electricity generation along the entire validity of the PPA and are compensated for the delivered electricity.

ANNUAL REPORT 2019
21
• Generators from the RES accepted in the Support Scheme are responsible for only 25% of their unbalanced costs.
3.2.2 Promotion of electricity production by RES
Kosovo is one of the countries that has so far supported the entire financial support mechanism for
renewable sources at the Energy Regulatory Office, which has created mechanisms of the RES
Support Scheme based on the targets set by the Government of Kosovo for fulfilling the legal
obligations it has received in relation to the European Commission. Thus, Kosovo had the obligatory
target that by 2020, to achieve that 25% of domestic consumption is from RES. As a result, the
Regulator has handled this obligation very carefully, creating appropriate and predictable
mechanisms for the time and economic and social circumstances of Kosovo. The mechanisms created
by the Regulator to support RES have proved to be quite effective, largely covering the targets in
various technologies with investment applications, and from time to time has adapted to these
mechanisms legal changes and conditions for doing business in Kosovo and region.
We can say that the energy sector, including renewable energy, remains one of the most attractive
links for investment in Kosovo, thanks to the above mechanisms. As a result, the level of investment
in RES has increased significantly in recent years, where only in 2019 it is estimated that about 35
million euros have been invested in generating capacity with 24.9 MW from water technology and
3.4 MW capacity installed with solar panels.
For the period 2013-2019, these production capacities have been invested by RES according to the
technologies presented in the following table, which have been put into operation by the end of 2019.
Tab. 3.4 Installed capacities of RES according to technology
Feed-in tariffs are a mechanism for encouraging investment in electricity generation from renewable
sources, which are applied in developing countries, as well as in developed countries (EU, US and
beyond.). Being an indispensable need to promote investment in RES, Kosovo has also adopted the
Feed in Tariff as the main support mechanism.
The following table shows the feed-in tariffs for electricity production by RES, according to
technologies.
RES technology MW
Wind Turbines 33.75
Photovoltaic 10
Hydro Power Plant 50.02
Biomass 0
Total 93.77
RES installed capacities 2013-2019

ANNUAL REPORT 2019
22
Tab. 3.5 Feed-in tariffs of RES according to technology
Implementation of the Support Scheme of the Feed-in Tariff is made possible through the RES Fund
managed by the Market Operator. The financial value of the fund foreseen for 2019 has been around
13.74 million Euros. According to the investment trend in RES, the RES fund is expected to increase
in the coming years.
Since the targets of RES under international obligations and the Administrative Instruction of the
Government of Kosovo for promotion of RES are limited, then the Regulator has taken care to create
a regulatory framework for all potential investors to invest in RES technology outside the Support
Scheme. This framework guarantees you priority in energy dispatching and market prices, to all
generators outside the support scheme.
The Regulator has also developed a Support Scheme for RES self-consumption generators. The main
purpose of this scheme is to encourage customers to invest in micro-generators through which they
would cover part of their consumption.
3.3 Authorization - construction of new capacities
ERO, during this year has continued with the implementation of the authorization procedure, the
review of applications for the issuance of authorization for construction of new generation capacities
based on Renewable Energy Sources (RES), for companies that have applied for authorization.
In the framework of fulfilling the obligations set forth in the legislation in force, ERO has issued Final
Authorizations for Construction of Generating Capacities, whereby each applicant in order to
obtain the authorization was subject to regularity analysis and correctness of legal, administrative,
technical, financial and environmental documentation, as well as obtaining relevant permits for
water use in case of hydropower plant, land use rights, technical solutions of the connection and
environmental consent, issued by relevant institutions in accordance with the activity that entities
have requested for obtaining a Final Authorization for allowing construction of new generating
capacity from RES.
During 2019, ERO has received 17 applications from various legal entities for obtaining authorization
for construction of new generating capacities from RES. 2 requests for conversion of Preliminary
Authorization to Final Authorization from wind energy sources and biomass have been received and
reviewed. During this year there have been requests for Modification of Final Authorization.
3.3.1 Issuance of preliminary authorization
ERO during this year has reviewed and evaluated the applications received by legal entities and that
they have proven their suitability for construction of new facilities, but have not yet met the
RES €/MWh
Wind 85.00
Photovoltaic 136.40
Small Hydro Power Plants 67.47
Biomass 71.30
Feed-in tariffs applicable to RES

ANNUAL REPORT 2019
23
requirements arising from the legislation in force, has issued Preliminary Authorizations for
completing applications and for obtaining Final Authorization for construction of new generating
capacities.
The following table shows the number of Preliminary Authorizations issued by ERO Board according
to various sources during 2019.
Tab. 3.6 Preliminary authorizations of RES
ERO has issued Preliminary Authorizations for 22 projects from solar/photovoltaic panels with an
installed capacity of about 66 MW, which have been considered by decision as "pending" applications
to be admitted to the Support Scheme.
Regarding the applicants who have met the requirements and criteria set for the issuance of
Preliminary Authorization, during this year the ERO Board has issued twenty-two (22) preliminary
authorizations ("pending"). The following are the companies to which the Preliminary Authorization
has been issued (see Table 3.7 below);
RES preliminary authorizations No. of decisions issued
Solar energy 22
Total 22

ANNUAL REPORT 2019
24
Tab. 3.7 Companies that have been issued a Decision for Preliminary Authorization
Compared to 2018, where ERO had issued seven (13) Preliminary Authorizations, during 2019,
twenty-two (22) decisions have been issued for Preliminary Authorizations with a total installed
capacity of 66 MW, which have been outside the limits of RES, and are considered "pending
applications", according to the legal provisions of Rule no. 10/2017 on the Support Scheme for RES
generators.
3.3.2 Applications under review by ERO
ERO, during this year has received applications for obtaining authorization for construction of new
generation capacities, which are in the phase of completion of applications. The following is a list of
applications that are being reviewed.
Tab. 3.8 Companies that are in the process of reviewing the decision for preliminary authorization
No. Legal entity Facility LocationInstalled
capacity
Date of issuance of the
Preliminary
Authorization
1 KPOWER L.L.C. Solar KSOL project -Sverrk- Peja 33 MW 28-Jan-19
2 EDK L.L.C. Solar SUNPOWER 1 project – Sverrk Peja 3 MW 28-Jan-19
3 EDK L.L.C. Solar SUNPOWER 2 project – Sverrk Peja 3 MW 28-Jan-19
4 JAHA EXRA BETON L.L.C. Solar DUKASONNE 1 project - Sverrk Peja 3 MW 28-Jan-19
5 JAHA EXRA BETON L.L.C. Solar DUKASONNE 2 project - Sverrk Peja 3 MW 28-Jan-19
6 PERLAT L.L.C. Solar ALPHA POWER project - Sverrk Peja 3 MW 28-Jan-19
7 EDK L.L.C. Solar SUNPOWER 3 project – Sverrk Peja 3 MW 28-Jan-19
8 N.T.SH. ELING Solar SOLAR project - Llabjan Peja 3 MW 28-Jan-19
9 D-ENERGY L.L.C. Solar D-ENERGY 1 project, Peja 3 MW 5-Jun-19
10 D-ENERGY L.L.C. Solar D-ENERGY 2 project, Peja 3 MW 5-Jun-19
11 D-ENERGY L.L.C. Solar D-ENERGY 1 project, Peja 3 MW 5-Jun-19
12 BP SOLAR L.L.C. Solar SOLAR 1 project, Peja 3 MW 5-Jun-19
13 BP SOLAR L.L.C. Solar SOLAR 1 project, Peja 3 MW 5-Jun-19
14 BP SOLAR L.L.C. Solar SOLAR 1 project, Peja 3 MW 5-Jun-19
15 ALPHA SOLAR L.L.C. Solar ALPHA SOLAR 1 project, Peja 3 MW 5-Jun-19
16 ALPHA SOLAR L.L.C. Solar ALPHA SOLAR 2 project, Peja 3 MW 5-Jun-19
17 ALPHA SOLAR L.L.C. Solar ALPHA SOLAR 3 project, Peja 3 MW 5-Jun-19
18 SUN ENERGY L.L.C. Solar SUN ENERGY 1 project, Sverrk Peja 3 MW 5-Jun-19
19 SUN ENERGY L.L.C. Solar SUN ENERGY 2 project, Sverrk Peja 3 MW 5-Jun-19
20 SUN ENERGY L.L.C. Solar SUN ENERGY 3 project, Sverrk Peja 3 MW 5-Jun-19
21 SUN ENERGY L.L.C. Solar SUN ENERGY 4 project, Sverrk Peja 3 MW 5-Jun-19
22 SUN ENERGY L.L.C. Solar SUN ENERGY 5 project, Sverrk Peja 3 MW 5-Jun-19
No. Legal entity Facility LocationInstalled
capacityApplication date
1 ECODRI L.L.C. Hydro Power Plant HPP ECODRI-me digë), Prizren 9.56 MW 18-Jul -19
2 SHARR PLANINA VODE L.L.C. Hydro Power Plant HPP SHARR PLLANINA 1, Dragash 1.65 MW 29-Jul -19
3 SHARR PLANINA VODE L.L.C. Hydro Power Plant HPP SHARR PLLANINA 2, Dragash 2.2 MW 29-Jul -19

ANNUAL REPORT 2019
25
ERO has evaluated the applications for issuing authorizations for construction of new generating
capacities, respecting all legal procedures and criteria for meeting the targets of RES, defined by the
instructions in force, and upon completion, will issue preliminary authorizations for the
aforementioned applicants.
3.3.3 Termination of preliminary authorization (final)
ERO during 2019 has reviewed the applications for issuance of the Final Authorization, together with
the completed documentation for conversion of the decision on the notice for preliminary
authorization to the final Authorization for construction.
The following table shows the number of Final Authorizations issued by the ERO Board according to
various sources during 2019.
Tab. 3.8 Final authorizations of RES
For construction of new generating capacities by Wind Turbines one Final Authorization was issued
and one other Final Authorization has been issued for construction of generating capacities by
Biomass with a total installed capacity of 12.2 MW, of which:
- 1 authorization from Wind Turbines with a capacity of 11 MW
- 1 authorization from Biomass with a capacity of 1.2 MW
The following table presents the legal entities to which the Final Authorization for Construction of
New Generating Capacities has been issued (see the table below).
Tab. 3.9 Companies that have been issued the final authorization for construction
The above-mentioned projects are expected to be realized within the period of deadlines determined
according to the dynamic plan of realization of the projects in accordance with the conditions of the
Authorization.
3.3.4 Final Authorization Modification
ERO during this year has accepted the request for Modification of Final Authorization for the
construction of new generating capacities by RES. Such requests after completion with the relevant
evidence issued by the relevant Institutions in the Republic of Kosovo have been evaluated and
RES final authorizations No. of decisions issued
Wind turbines 1
Biomass 1
Total 2
No. Legal entity Facility LocationInstalled
capacity
Date of issuance of the
Final Authorization
1NP NGROHTORJA E QYTETIT
SH.A. GJAKOVABiomass Rezina, Gjakova 1.2 MW 27-Nov-19
2BOND – COM ENERGY POINT
L.L.C.Wind turbines Wind Park – BUDAKOVA, Suhareka 11 MW 26-Dec-19
ANNUAL REPORT 2019
26
reviewed by the ERO Board, in accordance with the legal provisions of the Rule on authorization
procedure.
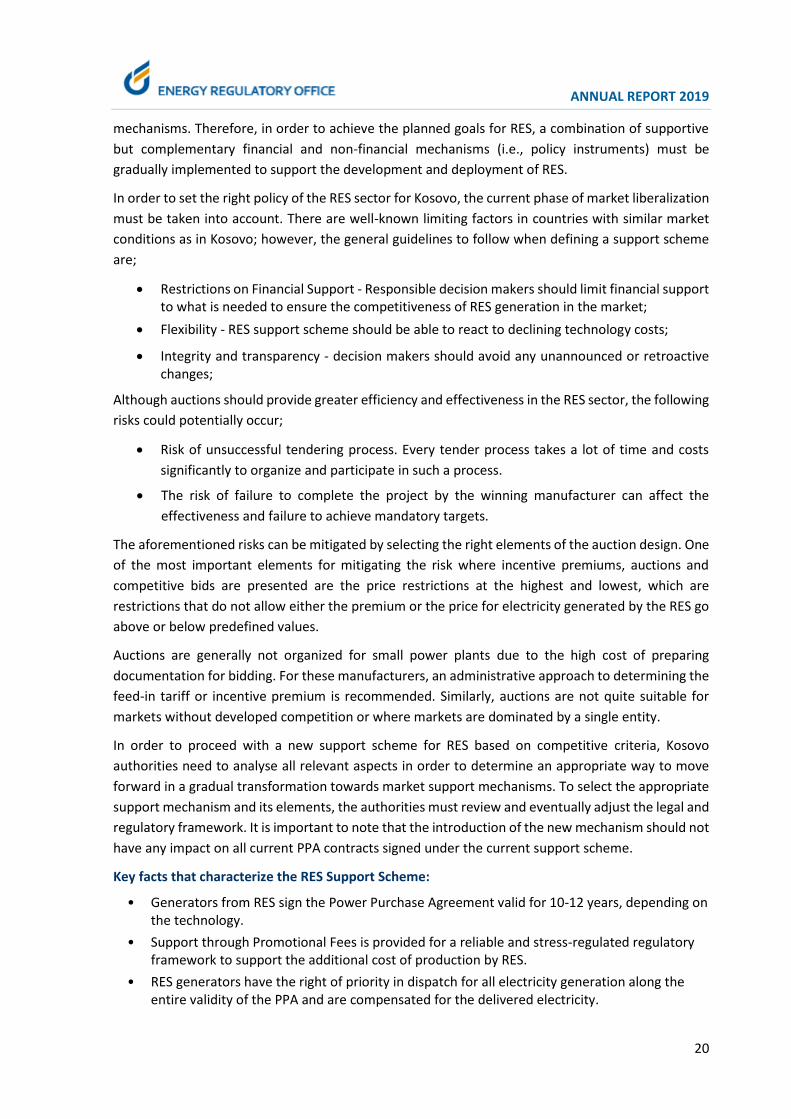
The following table presents the legal entities that have been allowed to modify the Final
Authorization for the installed capacities for the production of electricity by the RES.
Tab. 3.10 Companies whose final authorization has been modified
Modification of the final authorization of KelKos Energy LLC, has been requested for HP Lumbardhi II
Hydropower Plant for the installed capacity of 5.5 MW, authorized by Decision V-568-2013 of 24
October 2013, and modified by Decision V-1122-2019 of 28 March 2019 with an installed capacity of
6.2 MW, municipality of Deçan, meeting environmental and water requirement. While the
Modification of Final Authorization according to Decisions V-980-2018, V_981_2018 and V_982_2018
dated 13 June 2018 issued to the company SOWI KOSOVO L.L.C. from the initial installed capacity of
34.5 MW to the installed capacity of 34.47 MW and the reduction of the number of turbines from ten
(10) to nine (9) turbines is allowed with Decisions V-1164-2019, V_1165_2019 and V_1166_2019
dated 10 July 2019 in compliance with Construction Permits issued by MESP. These Modifications are
allowed in accordance with the criteria and legal requirements of the legislation in force.
3.3.5 Projects under construction according to Final Authorization
Projects which are being built according to the dynamic implementation plan and according to the
deadlines set by Regulation no. 11/2017 on the Authorization Procedure, there are four (4) projects
from the Wind Turbines where 103.4 MW with a total of twenty-seven (27) turbines, in the Wind Park
in Bajgora of the Municipality of Mitrovica, and the project Wind Park Budakova with a capacity of 11
MW with a total of three (3) turbines are being built in Budakova, Suhareka. Also, in the process of
construction are some small projects from hydropower plants where according to the dynamics of
works are expected to be realized in the coming years, as well as the first project from Biomass with
a capacity of 1.2 MW of electricity and 15 MW of thermal energy which will be implemented by NP
District Heating - Gjakova, a project funded by the European Commission.
3.3.6 Operation of generators by RES
During this year, after the finalization of the projects according to the Authorization by the ERO Board, and after the technical acceptance, seven (7) projects have entered into commercial operation, with a total installed capacity of 28.3 MW.
The following table shows the projects that have entered into commercial operation for the production of electricity from RES.
No. Legal entity Facility LocationInstalled
capacity
Date of Modification of
the Final Authorization
1 KelKos Energy SH.P.K Hydro Power Plant HPP Lumbardhi II . 6.2 MW 28-Mar-19
2 SOWI KOSOVO L.L.C. Wind turbines WIND PARK SELAC 1 34.47 MW 10-Jul -19
3 SOWI KOSOVO L.L.C. Wind turbines WIND PARK SELAC 2 34.47 MW 10-Jul -19
4 SOWI KOSOVO L.L.C. Wind turbines WIND PARK SELAC 3 34.47 MW 10-Jul -19

ANNUAL REPORT 2019
27
Tab. 3.11 Companies that have entered the operation
Fig. 3.1 View from the building of HP Lepenci 3, Kaçanik
Fig. 3.2 View from Solar Park / photovoltaic, Novosele, Kamenica
Hydraulic projects and solar/photovoltaic panels are in commercial operation, Power Purchase
Agreements for the production of electricity from RES have been finalized, agreements have been
signed for a period of ten (10) years for energy production from hydropower plants and twelve (12)
years for energy production from solar/photovoltaic panels with KOSTT/OT.
No. Legal entity Facility LocationInstalled
capacity
Date of entry into
operation
1 N.T. SH. ELING Solar Llabjan, Peja 0.4 MW 23-Mar-19
2 EUROKOS JH L.L.C. Hydro Power Plant HPP Brodi 3- Dragash 4.7 MW 8-May-19
3 N.T.N. RENELUAL TAHIRI L.L.C. Hydro Power Plant HPP Orqusha 4 MW 4-Jun-19
4 HIDROENERGJI L.L.C. Hydro Power Plant HPP Lepenci 3- Kaçanik 9.98 MW 19-Jun-19
5 SOLAR GREEN ENERGY L.L.C. Solar Novosel lë, Kamencia, 3 MW 18-Sep-19
6 KELKOS ENERGY L.L.C. Hydro Power Plant HPP Lumbardhi II - Deçan 6.2 MW 31-Dec-19

ANNUAL REPORT 2019
28
3.4 Self-consumption generators
ERO, during this year has also addressed the requests/applications for generators for obtaining the
status of customer producer for self-consumption, which after meeting the legal requirements in
accordance with the Authorization Rule and Support Scheme, are allowed to continue with the
construction of self-consumption generating capacities.
The following table shows the number of decisions issued by the ERO Board, for self-consumption
generators during 2019.
Tab. 3.12 Authorizations for self-consumption
The following table presents the legal entities that have been issued the decision for authorization
for the construction of generators for self-consumption.
Decisions for Self-consumption No. of decisions issued
Solar 20
Total 20

ANNUAL REPORT 2019
29
Tab. 3.13 Companies that have been issued a decision to construct self-consumption generators
The above-mentioned projects are expected to be realized within the defined period according to the
dynamic plan of realization of the projects in accordance with the technical conditions of connection.
ERO has also received other requests from natural and legal persons, which are in different stages of
completion and according to the procedures in force, after completion will be allowed in the
construction of new generating capacities by generators for self-consumption.
3.5 Harmonization of Power Purchase Agreements for RES
ERO, during 2019 at the request of the European Bank for Reconstruction and Development (EBRD)
and other international financial institutions, has reviewed the Power Purchase Agreement for
generators of RES, where after analysing, evaluating and consulting with all interested parties and
institutions of the country, has approved this Agreement, which in November 2019 was signed
No. Legal entity Facility LocationInstalled
capacity
Date of issuance of
the Decision
1 IADK Solar Sfaraçak I Ultë, Vushtrri 10 kW 20-Jan-19
2 Phys ica l Person Solar Gjakova 4.88 kW 20-Jan-19
3 Phys ica l Person Solar Prishtina 5 kW 16-Apr-19
4 Phys ica l Person Solar Cecel i/Vushtrri 5 kW 5-Jun-19
5NTSH TIK –TAC
–SERVICE&SUPPLY Solar Shkugza/Gjakova 4.8 kW 5-Jun-19
6 Phys ica l Person Solar Leshan/Peja 5 kW 5-Jun-19
7 DYZI BERRY FRUITS L.L.C. Solar Dyz/Podujeva 25 kW 05 June 219
8 BESIANA – G L.L.C. Solar Izvor/Novobërda 5 kW 5-Jun-19
9 BESIANA – G L.L.C. Solar Prelez/Feriza j 69 kW 10-Jul -19
10 Phys ica l Person Solar Orl lat/Drenas 3 kW 28-Aug-19
11 Phys ica l Person Solar Zl latar/Prishtina 5 kW 28-Aug-19
12 N.T.P. AMG Solar Bal loc/Podujeva 30 kW 14-Oct-19
13 DONI FRUITS L.L.C. Solar Z. Indis tria le/Shtime 49.92 kW 14-Oct-19
14 OBRICO L.L.C. Solar Graqanica 30 kW 14-Oct-19
15 Phys ica l Person Solar Prishtina 9.9 kW 14-Oct-19
16 BALLKAN PETROL L.L.C. Solar Gërl ic/Feriza j 100 kW 27-Nov-19
17 AGROPRODUKT L.L.C. Solar Sine/Is tog 64 kW 27-Nov-19
18 Phys ica l Person Solar Dujak/Gjakova 5 kW 27-Nov-19
19 Phys ica l Person Solar Pagarush/Mal ishevë 2 kW 27-Nov-19
20 DRENA L.L.C. Solar Skenderaj 75 kW 26-Dec-19
ANNUAL REPORT 2019
30
between EBRD/SOW/KOSTT for financing and implementation of the construction project of three
(3) generators from RES/wind, with an installed capacity of 105MW, which project is considered one
of the largest in the Balkans and is funded by the EBRD.
ERO, during 2019, has drafted and approved the Power Purchase Agreement for self-consumption
generators. This completes the entire regulatory/legal framework for handling these self-
consumption generators or otherwise known as prosumers, and thus meets the last criteria of the
Rule on Support Scheme for RES, and the handling of energy produced by self-consumption
generators.
3.6 Monitoring of energy enterprises
One of the main competencies of the Energy Regulator regarding the supervision/monitoring of
energy enterprises are provided by the Law on Energy Regulator, especially with Chapter XII, the Law
on Electricity and secondary legislation.
Thus, the Regulator, as in other years, this year as well, has continued to monitor companies licensed
for energy activities, ensuring whether enterprises are operating in accordance with the terms of the
license, enforcement of rules, individual acts and other decisions issued by the regulator or other
legislation in force. Monitoring is done by requesting reports and data from the licensees, holding
meetings, as well as visiting (monitoring) the licensed, with or without prior notice.
Even during 2019, the Regulator has monitored licensed energy enterprises, especially those over 5
MW, but also monitored enterprises that are in the process of construction through the authorization
procedure for building new capacity.
Detailed reports on the monitoring of energy enterprises are published on the Regulator's website.
3.6.1 Electricity market monitoring
Despite the liberalization of the electricity market, for the smooth running and functioning and
avoidance of irregularities and discrimination of the participants in the energy sector, it is necessary
to constantly monitor the energy market. The regulator is responsible for monitoring the operation
of energy markets.
The regulator continuously monitors the energy market in general through daily, monthly reports,
etc., according to legal requirements. This monitoring includes the production, demand and losses of
electricity according to different categories, as well as imports and exports of electricity. Internal
quartile reports are prepared for the findings of these monitoring, while at the end of the year all
these are summarized in the annual ERO report, which is published on the ERO website.
3.6.2 Monitoring the construction of new generating capacities
The Regulator, during this year, has monitored the legal entities that are equipped with Final
Authorization for the construction of generating capacities, which are in different stages of
construction.
ERO has monitored the works that are being carried out by the company HIDROENERGJI LLC, for the
project HP Lepenci 3 Authorized by Decision V-755-2016, for the construction of new generating

ANNUAL REPORT 2019
31
capacities by the Hydropower Plant, with an installed capacity of 9.98 MW, CZ Kaçanik, Municipality
of Kaçanik. HPP Lepenci 3 project has been completed and is in commercial operation.
HPP Vica Hydropower Plant, according to the dynamics of the works carried out in the field, is
expected to be finalized in early 2019, while the projects HPP Shtërpca and HPP Sharri are in different
stages of construction.
ERO has monitored the works that are being carried out by the company HIDROENERGJI LLC, for the
project HPP Lepenci 1 Authorized by Decision V-754-2016, for the construction of new generating
capacities by the Hydropower Plant, with an installed capacity of 9.98 MW, CZ Uji i Tharët,
Municipality of Hani i Elezit. This project has been delayed due to the construction of the R6 Highway
Pristina - Hani i Elezit.
ERO has monitored the works that are being carried out by the company EUROKOS JH LLC, for the
project HPP Brodi 3 Authorized by Decision V-870-2016, for construction of new generating capacities
from the Hydropower Plant, with an installed capacity of 4.7 MW, CZ Kukalane, Municipality of
Dragash. The HPP Brodi 3 project has been completed and is in commercial operation.
ERO has monitored the works that are being carried out by the company N.T.N. RENELUAL TAHIRI
L.L.C., for the HPP Orqusha project, Authorized by Decision V-891-2017, for the construction of new
generating capacities by the Hydropower Plant, with an installed capacity of 4 MW, CZ Orqusha,
Dragash/Dragash Municipality. This project has been finalized and has entered into commercial
operation.
ERO has monitored the works that are being carried out by Matkos Group LLC, for HPP Vica, HPP
Shterpca and HPP Sharri projects, Authorized by Decisions V-640-2014, V-759-2016 and V-760-2016,
for construction of new generating capacities from Hydropower Plants, with a total installed capacity
of three (3) projects of 16 MW, CZ Shterpce, Municipality of Shterpce. These projects are in different
stages of realization.
ERO has monitored the works that are being carried out by the company SOLAR GREEN ENERGY LLC,
for the project Authorized by Decision V-838-2016, for the construction of new generating capacities
from solar/photovoltaic panels, with an installed capacity of 3 MW, CZ Novosele, and Municipality of
Kamenica. This project has been finalized and has entered into commercial operation.
ERO has also monitored the works in the implementation of projects by the company SOWI KOSOVO
L.L.C. for Wind Park project SELAC1, SELAC 2 and SELAC 3, authorized by Decisions V-980-2018,
V_981_2018 and V_982_2018 dated 13 June 2018, where according to the dynamic plan it is expected
to install twenty-seven (27) turbines for the production of electricity from the wind.
Also, ERO has monitored other projects that are being implemented according to the decisions on
the Final Authorizations, which are in different stages of construction according to the legal deadlines
given with the respective decisions. Their monitoring has been carried out continuously depending
on the requirements that have emerged during their implementation.
ERO will continue to monitor the construction of new generating capacities from Renewable Energy
Sources, respecting all legal procedures and criteria set by applicable law.

ANNUAL REPORT 2019
32
3.6.3 Monitoring according to the Reporting Manual in the Energy Sector
According to this manual, licensed energy companies have sent to the Regulator immediate,
quarterly, or annual reports, depending on the requirements described in this handbook or other
requirements of the Regulator. For some articles of the license, of particular importance, i.e. violation
of the license conditions that may have a serious impact on government policies, customers or the
cost of compensation, the licensee must immediately notify the Regulator. In the event that such
notification is not made in time, the Regulator has the right to impose administrative measures or
fines in accordance with the Rules of Administrative Measures and Fines.
Taking into account the reports sent during 2019, the regulator has not imposed any administrative
measures or fines for licensees.
In the following, some of the monitoring carried out by the Regulator for energy enterprises during
2019 are presented in brief.
3.6.4 On-site monitoring of the Distribution System Operator Compliance Program
(KEDS) for 2018
This program has been in force since 2015 (V_750_2015), which is approved by the Board of the
Regulator. Every year, the KEDS Compliance Officer has reported to the Regulator regarding the
fulfillment of the obligations set out in this program. So far, there has been no need to impose
measures or fines on the licensee in connection with the implementation of this program. However,
for its better functioning, the Regulator during the monitoring of this program during 2019, has
requested from KEDS that this program be modified and approximated with the current legislation,
hence, KEDS has sent this modified program, which is expected to be approved by the Board of the
Regulator during 2020.
3.6.5 Monitoring of capital investments in KOSTT and KEDS for 2018
The safety of electricity supply and its quality depend on the level of operating and capital costs. For
this purpose, ERO during the regulatory periods allows a certain level of capital investments based on
planned projects. To see how such projects have been implemented, ERO, within its responsibilities
and competencies, made the necessary monitoring. In this context, through the decision
VB_114_2018 of the ERO board, the working group for monitoring the capital investments of the
licensees KOSTT and KEDS was established.
To carry out this process, the monitoring group through written communications and field visits has
focused on monitoring the procedural, technical and financial aspect. The methodology used for the
realization of this monitoring has been done by selecting projects according to coincidence which are
of different natures. For this purpose, the working group has requested from the licensees the files
of the respective projects.
After reviewing and analysing the selected projects, the monitoring group has issued results which by
nature are measurable (quantitative) and qualitative. In general, we can say that after analyzing the
files and field visits, the licensee KOSTT performed the procedural and technical process in
accordance with the general technical and procedural requirements and provided evidence for the

ANNUAL REPORT 2019
33
selected projects, while the licensee KEDS explained technical and procedural process but did not
provide sufficient evidence.
In accordance with the findings of the monitoring report, the ERO Board made the notification of
non-compliance by notifying the parties of non-compliance with the regulatory framework and issued
remarks on improvement.
Details from the capital investment monitoring report for KOSTT and KEDS for 2018 can be found in
the report published on the ERO website on the following link:
http://ero-ks.org/2019/Raportet/Monitorimi%20i%20investimeve%20kapitale%20KOSTT%20dhe%20KEDS_Qershor%202019.pdf
3.6.6 Monitoring the provision of customer service by KEDS and KESCO
The Regulator in accordance with the legal provisions given in the Law on Energy Regulator during
2019 has monitored the complaints and other issues related to the field of customer protection for
the Supplier - KESCO and the Distribution System Operator - KEDS. The activities undertaken by the
Regulator during the monitoring of the licensees KESCO and KEDS regarding customer complaints and
other areas in customer protection are:
1. Providing data in the field of providing services to customers by the Supplier - KESCO and the
Distribution System Operator - KEDS;
2. Visits of the working group of the Regulator in three districts: Pristina, Ferizaj and Mitrovica;
3. Providing data (samples) from the scene in the aforementioned districts;
4. Analysis of all data provided by KESCO and KEDS;
5. Statements derived from data provided by KESCO and KEDS.
The Working Group of the Regulator, based on the data and information received by KESCO and KEDS,
has prepared the Final Report on the provision of customer service by KEDS and KESCO for the period
January - December 2018, which describes in detail all the processes related to the provided KEDS
and KESCO services.
In the Customer Services Report by KEDS and KESCO for the period January - December 2018, these
areas were monitored:
New connections and Electricity Consents;
Replacement of electric meters;
Implementation of disconnections and reconnections;
Implementation of the procedure for identification and prevention of unauthorized use of
electricity;
Customer reading;
Customer complaints.
In the Final Report on the provision of customer service by KEDS and KESCO, in addition to the analysis
of data and processes obtained by both licensees, also presented the findings for each area of
monitoring, and presented concrete recommendations for the licensees KEDS and KESCO related to
improving customer service delivery.

ANNUAL REPORT 2019
34
ERO recommendations for KESCO and KEDS are as follows;
a) New Connections and Electricity Consents
Points 7 and 8 given in the Electricity Consent by KEDS, which relate to the operation,
maintenance, billing of customers, as well as the delivery of energy facilities, must be
unifying for all applicants and be in accordance with the legal provisions of the primary and
secondary legislation.
KEDS must compensate all customers who have been charged with Electricity Consent for
the payment of the metering group or even the placement of the metering group by the
customer himself, because according to Article 54 of the Law on Electricity: “Measuring
devices for measuring electricity are property of the Transmission System Operator and the
Distribution System Operator, as defined in the Energy Law”.
b) Replacement of electric meters
Customer requests related to the review of meters, i.e. the accuracy of meter
measurement, must be respected by KEDS and they must be made in accordance with the
Metering Code;
No response related to customer complaints regarding the suspicion of measuring the
electricity consumption of the electricity meter should be issued by KESCO without
reviewing the accuracy of that electricity meter first.
c) Customer disconnections and reconnections
KEDS should not disconnect customers in any case, for the disputed values as defined in
Article 17 of the Regulation for disconnection and reconnection of customers in the energy
sector
KEDS must submit each official record to the customer at the residential facility.
d) Unauthorized use of electricity
KESCO / KEDS instructs that in the case of new connections, the initiation of unauthorized
use of electricity should be determined based on the customer's request and efforts should
be made to provide information on the duration of the calculation of unauthorized use.
KEDS is instructed to continue to advance the training of authorized workers for the
inspection of metering points for the method of completion, as well as the content of
inspection/control minutes in order to present as accurately and clearly the factual
situation and measures undertaken during the inspection, otherwise such minutes may be
considered invalid.
e) Customer complaints
KESCO and KEDS must comply with Article 6, paragraph 4, of the Regulation on Resolution
of Complaints and Disputes in the Energy Sector, and send for review and approval to ERO
their internal procedure for handling customer complaints harmonized according to the
above-given Regulation.

ANNUAL REPORT 2019
35
KESCO should improve responses to customer complaints, which responses should be
designed in accordance with Article 10 of the Rule on Resolution of Complaints and
Disputes in the Energy Sector; to respect the legal deadlines in accordance with Article 9,
paragraph 3; as well as to comply with the provision of Article 12, paragraph 4 of the above-
mentioned rule, which concerns the provision of documents for the customer.
KEDS for customer complaints regarding electricity consents and complaints for network
access / connection, to issue a written response to customers / applicants for connection
in accordance with Article 10 of the Rule on Resolution of Complaints and Disputes in
Energy Sector.
The Board of the Regulator in the session dated on 28.08.2019 has reviewed the Report on the
provision of services for customers by KEDS and KESCO for the period January - December 2018,
together with the recommendations presented in the report, and has decided to notify the operators
of the monitoring findings and to proceed with the procedures provided in the Monitoring Program.
3.6.7 Non-compliance notice (Board findings and decisions regarding enterprise
monitoring)
The Board of the Regulator in its meeting held on 28.08 2019, based on the proven findings and
recommendations presented in the monitoring reports of the working groups of the Regulator, as
well as in accordance with the provisions of the Law on Energy Regulator, has decided to oblige the
licensees KEDS and KESCO to inform the Board within 30 days from the date of receipt of this notice
regarding the actions that will be taken to improve the irregularities in the monitoring reports, and
the actions that will be taken for non-repetition of ascertained irregularities.
Based on the notification of non-compliance of the Regulator, the licensees KEDS and KESCO on
07.10.2019 responded to the Regulator regarding the notification of non-compliance, respectively
the licensee for each point of notification has provided the necessary clarifications.
The Board of the Regulator in the session held on 27.11.2019 has issued a decision where it has
obliged KEDS to immediately stop performing activities that cause violation of the conditions and
obligations provided by Article 11 of the DSO License, and has obliged KEDS that within 30 (thirty)
days from the date of receipt or publication of the Decision, to compensate all customers who have
been charged with the Energy Consent for the payment of the measuring group.
3.6.8 Monitoring of thermal energy enterprises
As monitoring is one of the regular activities undertaken continuously by ERO, in 2019 the realizations
and performance in the 2018/2019 season of the enterprises DH Termokos and DH Gjakova were
monitored. Monitoring of realizations has included:
- Energy balance: production and supply of thermal energy as well as network losses;
- Realization of revenues (billing and collection) and operating costs;
- Realization of capital costs - specifically of new allowed investments;
- New connections and customer supply contracts;
- Unauthorized use and disconnections; and

ANNUAL REPORT 2019
36
- Customer complaints and requests and their addressing by the respective enterprises;
From the analysis of data and information collected during the monitoring, the monitoring reports of
the realizations in the 2018/2019 season for DH Termokos and DH Gjakova were drafted, which were
reviewed by the ERO Board in the session of 28 August 2019. These reports have described the
assessments and findings for the implementation of each monitoring component and relevant
recommendations were also provided.
3.7 Court Disputes
During the reporting year, several ERO Decisions were challenged in the Basic Courts, Department for
Administrative Affairs, and which are expected to be reviewed and decided during 2020 by the
competent Courts. ERO's challenged decisions are mainly related to customer complaints, while one
of the challenged decisions is related to the setting of the feed-in tariff for electricity that will be
produced by photovoltaic/solar panels.
In the next Annual ERO Report, the course of these disputes will be reported in detail.
3.8 Electricity and Thermal Energy Annual Balance
According to the Law on Energy (No. 05 / L-081), ERO is responsible for approving energy balances,
which include annual and long-term (10-year) balance sheets of electricity, thermal energy, and
natural gas. In this sense, the legal responsibility of ERO lies in defining the Methodology, rules and
procedures for the preparation and approval of energy balances. Also, according to the law, the
obligations of the system operators for the preparation of these balances are determined. Annual
balance sheets must be approved by ERO separately and then summarized as a total for electricity,
thermal energy and natural gas and published on the website.
Based on the legal requirements and the Rule and methodology for drafting energy balances, in the
session of 26 December 2019, it approved the following Annual Balances:
Annual Balance of Electricity 2020;
Annual Balances of Thermal Energy of DH Termokos and DH Gjakova 2020;
Since Kosovo does not have an organized natural gas system, the relevant balances for natural gas
have not been prepared.
These documents were drafted in accordance with Law no. 05 / L-081 on Energy (Article 8), and the
Methodology on Preparation of Electricity Balances and contain:
a) annual and long-term production planning of electricity and thermal energy;
b) forecast of import and export of electricity;
c) consumption and losses in electricity / thermal transmission and distribution networks.
The purpose of these documents is to inform all interested parties about the forecast of energy
demand for 2020. The documents are published on the ERO website www.ero-ks.org.

ANNUAL REPORT 2019
37
3.9 Activities of the Regulator in the Area of Price Regulation
3.9.1 Tariff review
The Energy Regulatory Office (ERO) based on the Law on Energy Regulator and Rule on Maximum
Allowed Revenues (MAR), within the given competencies is the only authority responsible for setting
tariffs for regulated activities and those that have the obligation of public service in the energy sector.
In this context, one of the main tasks of ERO during 2019 has been the review of licensed applications
for allowed revenues and tariffs in the electricity sector, including transmission, distribution,
wholesale energy purchase and power supply activities for customers with universal services,
respectively tariffs for regulated customers. ERO has assessed the allowed revenues and tariffs
through the analysis of technical, economic and financial indicators presented in the applications of
the licensees.
ERO during 2018 has conducted the periodic review for the period 1 April 2018 to 31 March 2023,
where the Maximum Allowed Revenues (MAR) of the licensees has been determined: Transmission
System Operator-Market Operator (TSO / MO-KOSTT), Distribution System Operator (DSO-KEDS) and
one-year period for the Universal Service Supplier (USS-KESCO). Based on the revenues set during the
periodic review, ERO has carried out regular revenue adjustments, in March 2019, while in April 2019
it has determined the fees for regulated electricity services.
Review of applications for revenues and fees regulated in the electricity sector has included:
wholesale energy purchasing activities by local generators, electricity imports, electricity
transmission activity, electricity distribution activity and the universal service supplier (USS) activity.
In this tariff review, ERO has analysed the data for 2018, which it has adapted to those of the relevant
tariff year 2019.
This whole review process has gone through public consultation (meetings and publication of
documents) as follows:
The Regulator in December 2018 has initiated the tariff review for 2019;
Consultation Paper on Maximum Allowed Revenues, Periodic Review for DSO, published in
March 2019;
Consultation Paper on Maximum Allowed Revenues of the Universal Service Supplier
(KESCO), published in March 2019;
Final Report on Maximum Allowed Revenues TSO/MO - Responses to Comments, published
in April 2019;
Final Report on Maximum Allowed Revenues DSO - Responses to Comments, published in
April 2019;
Final Report on Maximum Allowed Revenues of the Universal Service Supplier - Responses to
Comments, published in April 2019.

ANNUAL REPORT 2019
38
3.9.2 Energy purchases in the wholesale market
Production prices for Public Generators (KEK JSC) are deregulated from 1 April 2017, but this energy
will be offered in the wholesale energy market, with priority for the Universal Service Supplier. After
determining the necessary quantities for the supply in order to cover the customer requirements of
the Universal Service Supplier, the calculation of other costs for the purchase of energy in the
wholesale market is done. In accordance with the Rule on USS Revenues, the Universal Service
Supplier is obliged to provide electricity in a transparent, competitive and efficient manner. The
Universal Service Supplier must demonstrate that the projected electricity prices are reasonable, in
line with the historical and projected prices in the wholesale market.
Kosovo, as a signatory to the Energy Community Treaty, has committed to implementing the third EU
energy package and is implementing them. ERO based on the Guideline on Market Liberalization and
Market Design is developing the competitive market. By opening up the market, it is possible to
increase competition in the wholesale and retail market. This enables customers to benefit from more
competitive prices.
In determining the revenues of USS, the electricity balance is taken into account, which should reflect
only the costs of electricity supply for customers who enjoy the right to supply in terms of universal
service. The energy produced by KEK will be offered in the wholesale market, which must be done in
accordance with the "Energy Trade Procedure". Respecting this procedure and Market Rules, the
Transmission System Operator and the Distribution System Operator make the purchase of energy to
cover losses and provide ancillary services. Contracts for these services must be made in accordance
with market principles.
Load forecasting (Energy Balance) - available energy includes: purchases of energy generated by KEK,
purchases of energy produced by hydropower plants, production of energy from solar panels,
production of energy from wind turbines, purchases from imports, purchases of electricity losses for
the transmission system, distribution and sales to regulated tariff customers.
These energy and financial data allowed for 2019 are presented in the following table:
Tab. 3.14 Allowed purchases of electricity for USS
From the data presented in the table above, it can be seen that the average price for purchasing
energy in the wholesale market for USS is € 30.8/MWh.
Electricity purchasing costs - 2019 GWh €/MWh mil€
Quantities supplied by KEK 3,293.0 29.5 97.14
Ujmani and other OST-level generators 296.0 37.3 11.03
OST-level generators 142.6 37.8 5.39
Import 41.3 60.0 2.48
Total supplied quantities 3,772.0 30.8 116.05
Retail margin [3.00 %] 3.81
119.53Total Electricity purchasing costs

ANNUAL REPORT 2019
39
3.9.3 Revenues and electricity tariffs for regulated customers
In accordance with the general principles set out in the legislation and the Rule on USS Revenues,
KESCO has prepared the application with proposals for revenues and tariffs for review by ERO.
ERO after evaluating the applications of the licensees, has made the necessary analyzes and has
prepared the Evaluation Report for the maximum allowed revenues for USS. This report has been in
public consultation for the purpose of obtaining comments from stakeholders. Following the
acceptance of the comments and their review, ERO has prepared the final report on the maximum
allowed revenues for USS.
After determining the maximum allowed revenues, the licensee has submitted the proposals for
tariffs, where ERO has analysed the proposal and decided that the regulated tariffs remain the same.
Justifiable costs which have been used to determine regulated tariffs include: energy purchase costs,
transferable costs (transmission and distribution network costs), supplier costs (retail costs) and
adjusted costs. Details of these costs are presented in the following table.
Tab. 3.15 Justifiable costs which are used to determine the regulated fees
ERO sets the regulated tariffs for customers who enjoy the right to supply in terms of universal
service. The criteria for which customers enjoy this right are set out in the Law on Electricity,
according to which: “The right to universal service is enjoyed by all household customers and non-
household customers who have an annual turnover of no more than ten (10) million Euros, or not
more than fifty (50) employees”.
In 2019, the customers who have been billed with regulated tariffs are the customers connected to
the voltage levels 35kV, 10kV and 0.4kV, while the customers connected to the voltage level 220kV
and those at 110kV have been supplied at unregulated prices (market prices)
It should be noted that all customers are entitled the supply at market prices, i.e. the possibility to
choose a supplier. So far ERO has licensed a total of 8 suppliers from which customers can purchase
their energy at unregulated prices, but it is worth noting that only KESCO is active.
MAR for Universal Service Supplier - 2019 mil€
Operating expenses 6.06
Depreciation 0.11
Transferable costs
TSO costs 30.34
DSO costs 101.50
RES fund 12.06
Working Capital (WCLCt) 1.68
Costs for purchasing energy 119.53
License fee 0.01
Adjustments 2018 -32.42
Bad debt (BDTA) 9.95
Final MAR 248.82

ANNUAL REPORT 2019
40
The structure of retail electricity tariffs for customers with universal services (regulated tariffs) is
designed to cover the set revenues in the amount of 248.82 million euro’s.
The following table shows the structure of retail tariffs, after the application of these tariffs it is
expected that the supplier will bill the allowed level of maximum allowed revenues. This tariff
structure is being applied from April 1, 2019.
Tab. 3.16 Tariff Structure of Retail Customers for 2019
3.9.4 Revenues and tariffs for the use of the transmission system
During 2019, ERO has carried out the process of adjusting revenues through the application of
efficiency factor and indexing costs for inflation for operating expenses, repairs & maintenance, cost
of purchasing losses, return and depreciation costs resulting from planned investments according to
development plan and other reasonable costs for operating the transmission and distribution system.
Customer Fixed Tariff €/customer/month 11.19
Engaged Power €/kW/month 5.85
€c/kWh High Tariff 4.92
€c/kWh Low Tariff 3.16
Reactive Energy (Q) €c/kVArh 0.67
Customer Fixed Tariff €/customer/month 4.62
Engaged Power €/kW 5.04
€c/kWh High Tariff 5.73
€c/kWh Low Tariff 3.69
Reactive Energy (Q) €c/kVArh 0.67
Customer Fixed Tariff €/customer/month 2.57
Engaged Power €/kW 2.97
€c/kWh High Tariff 6.69
€c/kWh Low Tariff 4.96
Reactive Energy (Q) €c/kVArh 0.67
Customer Fixed Tariff €/customer/month 2.97
Active Energy (P), of which €c/kWh Single Tariff 8.83
€c/kWh High Tariff 10.71
€c/kWh Low Tariff 5.30
Customer Fixed Tariff €/customer/month 1.74
€c/kWh High Tariff 6.75
€c/kWh Low Tariff 2.89
Customer Fixed Tariff €/customer/month 1.74
Active Energy (P), of which €c/kWh 5.32
Estimated consumption
Customer Fixed Tariff €/customer/month 1.74
Active Energy (P), of which €c/kWh Average Tariff 6.75
Customer Fixed Tariff €/customer/month 3.21
Active Energy (P), of which €c/kWh Single Tariff 9.24
High Tariff (day) is applied from 07:00-22:00 during the period from 1 October until 31 March
High Tariff (day) is applied fron 08:00-23:00 during the period 1 April until 30 September
The customer is charged with reactive energy above the allowed one which corresponds with cos( Φ)<0.95
60.4kV 1 rate meter
(household)
70.4kV (household-
unmetered)
8 Public Lighting
4 0.4kV Category II
Active Energy (P), of which
50.4kV 2-rate meter
(household) Active Energy (P), of which
2 10kVActive Energy (P), of which
3
0.4 kV Category I
(reactive power
customers )Active Energy (P), of which
Customer Tariff Unit Time of the day Approved 2018
1 35kVActive Energy (P), of which
Voltage Level of
Supply
Tariff
Group
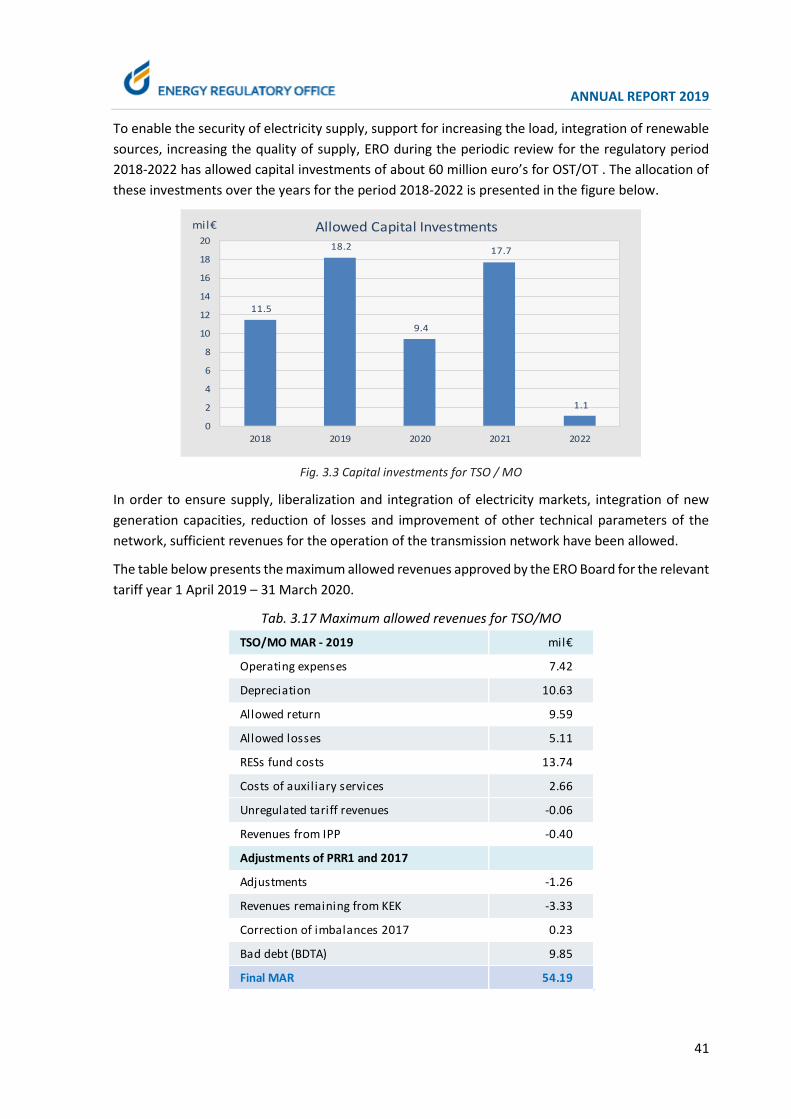
ANNUAL REPORT 2019
41
To enable the security of electricity supply, support for increasing the load, integration of renewable
sources, increasing the quality of supply, ERO during the periodic review for the regulatory period
2018-2022 has allowed capital investments of about 60 million euro’s for OST/OT . The allocation of
these investments over the years for the period 2018-2022 is presented in the figure below.
Fig. 3.3 Capital investments for TSO / MO
In order to ensure supply, liberalization and integration of electricity markets, integration of new
generation capacities, reduction of losses and improvement of other technical parameters of the
network, sufficient revenues for the operation of the transmission network have been allowed.
The table below presents the maximum allowed revenues approved by the ERO Board for the relevant
tariff year 1 April 2019 – 31 March 2020.
Tab. 3.17 Maximum allowed revenues for TSO/MO
11.5
18.2
9.4
17.7
1.1
0
2
4
6
8
10
12
14
16
18
20
2018 2019 2020 2021 2022
mil€ Allowed Capital Investments
TSO/MO MAR - 2019 mil€
Operating expenses 7.42
Depreciation 10.63
Allowed return 9.59
Allowed losses 5.11
RESs fund costs 13.74
Costs of auxiliary services 2.66
Unregulated tariff revenues -0.06
Revenues from IPP -0.40
Adjustments of PRR1 and 2017
Adjustments -1.26
Revenues remaining from KEK -3.33
Correction of imbalances 2017 0.23
Bad debt (BDTA) 9.85
Final MAR 54.19
ANNUAL REPORT 2019
42
The maximum allowed revenues for KOSTT will be collected through the tariffs approved by ERO
based on the Methodology of determining the tariffs of the transmission system, system operation,
and market operation. So, KOSTT has two licenses issued by ERO such as: Transmission System
Operator which manages and operates with high voltage power transmission system and Market
Operator which is responsible for the organization and administration of trade (sale-purchase) of
electricity and conducting transactions between producers, suppliers and other customers.
The following table presents the structure of tariffs for the use of the transmission system operator
and market operator that is applied from 1 April 2019.
Tab. 3.18 TSO/MO tariff structure for 2019
3.9.5 Revenues and tariffs for the use of distribution system
The process of regular annual adjustments similar to TSO/MO is also applied to DSO. Thus, ERO
through a transparent process and consulting with all stakeholders has determined the maximum
allowed revenues for DSO for 2019.
To enable the security of electricity supply, support for increasing the load, integration of renewable
sources, expansion and strengthening of the network, increasing the quality of supply, ERO during
the periodic review for the regulatory period 2018-2022 has allowed capital investments of about
131 million euro for DSO.
The allocation of these investments over the years for the period 2018-2022 is presented in the figure
below:
TariffTariff group Tariff element Unit
Generation connected to transmissionSystem Operator Tariff €/MWh 1.241
Market Operator Tariff €/MWh 0.036
Generation connected to distributionSystem Operator Tariff €/MWh 0.550
Market Operator Tariff €/MWh 0.036
Distribution operatorSystem Operator Tariff €/MWh 1.286
Market Operator Tariff €/MWh 0.038
Supply
TOUS Tariff 400/220 kV €/kW/year 11.600
TOUS Tariff 110 kV €/kW/year 23.885
System Operator Tariff €/MWh 1.286
Market Operator Tariff €/MWh 0.038
RES Fund Tariff €/MWh 3.198

ANNUAL REPORT 2019
43
Fig. 3.4 Capital investments for DSO
DSO revenues for the period 1 April 2019 – 31 March 2020 which have been approved are presented
in the following table;
Tab. 3.19 Maximum allowed revenues for DSO for the period 1 April 2019- 31 March 2020
The maximum allowed revenues for DSO will be collected through the tariffs approved by ERO based
on the Methodology of determining the Distribution System Tariffs.
The following table shows the structure of tariffs for the use of the Distribution System for 2019.
Tab. 3.20 The structure of tariffs for DSO for 2019
28.5
33.7
28.8
20.5 19.9
0
5
10
15
20
25
30
35
40
2018 2019 2020 2021 2022
mil€ Allowed Capital Investments
DSO MAR - 2019 mil€
Operating expenses 26.30
Depreciation 14.65
Allowed return 13.59
Obligations for OS and OT 1.23
Allowed losses 41.89
Unregulated revenues -3.50
Adjustments of PRR1 and 2017
Adjustments -1.50
Correction for loss price of 2017 -2.48
Correction for imbalances of 2017 1.74
Revenue Correction Factor KREV 9.58
Final MAR 101.50
Voltage level Unit Tariff
35 kV €c/kWh 1.71
10 kV €c/kWh 2.01
0.4 kV €c/kWh 2.77
Tariffs for customers connected to DSO

ANNUAL REPORT 2019
44
3.9.6 Thermal energy tariffs
In accordance with the primary legislation - Articles 47 and 48 of the Law on Energy Regulator, the
Energy Regulatory Office (ERO) is responsible for determining the methodology of tariffs and
approving tariffs in the regulated energy sector.
Within its legal competencies and obligations, the Energy Regulatory Office has issued the Thermal
Energy Pricing Rule. The rule defines the procedures for submission, review of the tariff application
and approval of fees, as well as Methodology for calculating the maximum allowed revenues and
tariffs.
Schematically, Tariff Methodology is shown as follows:
Fig. 3.5 Scheme of calculation of allowed revenues
From the schematic presentation it is noticed that the costs that the enterprise has to cover consist
of operating costs, the depreciation that presents the possibility for the enterprise to replace its
assets, the cost of network losses and return to the Regulated Assets Base (RAB).
The process of setting tariffs and approving them has been done in two steps:
1. Determining Maximum Allowed Revenues, based on: information and data provided in the tariff
application; ii) information submitted during the regulatory reporting of realizations in the last
season 2018/2019; and iii) the coordination between actual and projected realizations, which is
based on the difference between the planned revenues and those of the previous heating season.
2. Calculation of tariffs based on Maximum Allowed Revenues and tariff structure.
For the determination of the allowed Revenues of DH Termokos JSC, for the 2019/2020 season, in
accordance with the Thermal Energy Pricing Rule, ERO has undertaken the following:
1) Estimation and determination of allowed operating costs;
2) Evaluation and determination of depreciation;

ANNUAL REPORT 2019
45
3) Determining the Allowed Return on RAB (Return on Investment), which includes:
a) RAB determination - assessment and approval of company assets, verification and approval
of planned investments and working capital; and
b) calculation of Allowed Rate of Return (RoR)/WACC;
4) Assessing and determining the allowed cost for network losses.
ERO has engaged the expertise available to make a more realistic assessment of the information
provided by Termokos. A comprehensive analysis and evaluation of the presented information has
been made, which has been followed by the comparison of the respective data from the previous
seasons, in order to determine the exact (forecast) of the allowed revenues for the 2019/2020 season.
In the framework of the tariff review for DH Termokos, ERO has drafted Regulatory Reports for
determining the maximum allowed revenues and for determining the thermal energy tariffs for the
2019/2020 season.
Following the review of the relevant tariff review documents, in the session of 14 October 2019, the
ERO Board approved the Maximum Allowed Revenues (MAR) for DH Termokos for the 2019/2020
season, in the amount of 6,472,902 euro’s. Tariffs reflected by the MAR of DH Termokos for the
heating season 2019-2020, have been reduced to an average value of 3.85% - Tariffs according to
measured consumption have been reduced by 6.8%; while tariffs according to the heated area (per
m2) have been reduced by 2.37%.
Decisions issued:
- V_1187_2019 -for the approval of Maximum Allowed Revenues (MAR) for DH Termokos that
will be collected from the thermal energy (heating) tariffs for final customers for the
2019/2020 season;
- V_1188_2019 -for the approval of thermal energy tariffs for the final customers of DH
Termokos for the heating season 2019/2020;
Regarding DH Gjakova, ERO has also undertaken a comprehensive assessment of the financial and
energy performance of DH Gjakova, which has included the realizations of past seasons. Based on
this assessment, these conclusions are drawn:
The current financial situation and the high price of fuel - fuel oil, condition a limited supply of
fuel and consequently limited production and supply limited of thermal energy; It should be
noted that the purchase/supply of fuel oil is entirely dependent on subsidies from the Kosovo
Budget, i.e. from the expected allocations of the 2020 budget, which has not yet been approved.
Other operating and maintenance costs also reflect limited financial resources to the extent that
they enable a basic operation and limited thermal energy supply.
In this regard, the supply of thermal energy is limited for a period of three months (the coldest
months of the season, December - February) and also the halved number of customers, i.e. the
heating area of customers.
Also, the difficult financial situation makes it impossible for any self-financing of new investments
in the district heating system of DH Gjakova, which would affect the reduction of losses in the
network and heating production plants, which are currently estimated to be quite large. In this

ANNUAL REPORT 2019
46
regard, it should be noted that, in terms of development projects, the whole activity is focused
on the project for construction of the new heater and the EU-funded biomass cogeneration unit.
The above given descriptions of the main components for tariff review argue that it is currently very
difficult to make any realistic and accurate enough planning (forecasting) to undertake a proper tariff
review, which would result in the correct determination of the allowed revenues and tariffs for the
2019/2020 season. Consequently, the ERO Board in its session of 27 November 2019, after reviewing
the request of DH Gjakova and the evaluation of the relevant professional staff of ERO, has decided
that the tariffs of thermal energy of DH Gjakova for the season 2019/2020 to remain the same as last
year until the next tariff review.
- V_1193_2019 - for the approval of thermal energy tariffs, for the final customers of DH
Gjakova JSC. for the 2018/2019 heating season.
The structure and levels of thermal energy tariffs for DH Termokos and DH Gjakova are presented as
follows:
Tab. 3.21 The structure of thermal energy tariffs for 2019
3.10 Activities of the Regulator in the Area of Customer Protection
The Regulator in accordance with the Law on the Energy Regulator is responsible for resolving
complaints and disputes between customers and licensees, between two licensees, and in relation to
the third party's access to the transmission system, or distribution of electricity, thermal energy or
natural gas, as well as transmission, cross-border flows of electricity and natural gas.
According to the provisions of the Rule on Resolution of Complaints and Disputes in Energy Sector,
all customers have the right to file complaints related to the services provided by the system supplier
or operator, and these complaints must first be addressed to suppliers, as the first instance body,
which reviews the complaint and issues a response within the legal deadline. After receiving the
answer, the customer can address the Regulator for further review of his complaint.
Tariff components with measurements Unit
Thermal capacity monthly tariff (fixed
component) [€/kW/muaj]
Thermal energy supply/consumption
tariff (variable component)[€/MWh]
Tariff components without
measurementsUnit
Residential
customers
Commercial
and
institutional
customers
Residential
customers
Commercial
and
institutional
customers
Thermal capacity monthly tariff (fixed
component) [€/m2 per month] 0.11 0.14 0.09 0.12
Thermal energy supply/consumption
tariff (variable component)[€/m2 per month] 0.65 0.81 0.88 1.27
Total tarifs for customers without
measurements[€/m2 per month] 0.76 0.95 0.97 1.39
0.78 0.91
36.25 58.76
Thermal energy tariffs - 2019/2020 season
DH Termokos DH Gjakova

ANNUAL REPORT 2019
47
During 2019, the Regulator has registered 75 official complaints of customers who have exercised
their right against the answers issued by the Supplier, and has reviewed 128 complaints with the
Supplier and Distribution System Operator. During 2019, the number of complaints registered at the
Regulator is about 41.33% lower than the number of complaints registered during 2018. In addition
to the registered and resolved complaints of the customers, the Regulator has also provided support
in providing information, explanations, verbal consultations, e-mail, as well as by telephone to all
energy customers.
The number of complaints received by customer categories is presented in the table below.
Tab. 3.22 Customer complaints by categories, 2019
The following figure shows the number of customer complaints by their nature.
Fig. 3.6 Number of customer complaints by their nature
Below is the explanation of the nature of customer complaints registered for 2019:
- Contesting electricity bills relates to customer complaints in cases of incorrect or irregular
readings, which in this case are considered to have given an inaccurate reflection of the real
state of electricity consumption.
- Contesting additional charges, relates to customer complaints regarding additional invoices
from regular invoicing. These complaints are the result of incorrect recording of electricity
consumption, as a result of a defect in any measuring system.
Customer complaints by category Number Percentage [%]
Residential customer 58 77.33
Commercial customer 15 20.00
Industrial customer 2 2.67
Total 75 100.00
Dispute of electricity bil ls, 52
Dispute of additional charges, 11
Dispute of electricity debt, 4
Dispute of bil ls for thermal heating, 4
Other, 4
Consumer complaints by nature

ANNUAL REPORT 2019
48
- Contesting electricity debt, relates to customer complaints related to problems regarding
the incorrect definition of the electricity debt not collected by the supplier in cases of sale
and purchase of property, and to properties that have been usurped.
- Contesting thermal energy bills relates to customer complaints regarding thermal energy
bills made at DH "Termokos", which are related to the quality of heating and the billed area.
During 2019, the Regulator has resolved 263 customer complaints, including complaints that have
been returned for review to the supplier and the distribution system operator. Of the total number
of resolved complaints, 192 of them were decided in favour of customers or expressed in percentage
as 73.00%, partially approved are 12 or 4.56%, while 59 customer complaints or 22.43% were rejected
as ungrounded. All complaints reviewed by the operators, which have been processed by the
Regulator, have been reviewed once again by the Regulator in order to certify the full resolution of
complaints according to customer requirements, and customers have been notified. In all reviewed
cases the customers agreed with the solutions offered.
Fig. 3.7 Resolved Complaints, 2019
The number of customer complaints registered and resolved by the Regulator over the years is shown
in the figure below.
Approved73.00%
Rejected22.43%
Partly approved4.56%
Complaints resolved in 2019

ANNUAL REPORT 2019
49
Fig. 3.8 Registered and Resolved Customer Complaints 2011-2019
3.10.1 Disputes between two licensees
Pursuant to Article 17, paragraph 1, sub-paragraph 1.2 of the Law on the Energy Regulator, as well as
the legal provisions of Article 4, paragraph 1, under paragraph 1.2 of the Rule on Resolution of
Complaints and Disputes in the Energy Sector, the Regulator in addition to the competencies in
reviewing customer complaints against an energy enterprise, has the competence for resolution of
disputes between two licensees.
Towards the end of 2018, the Transmission System and Market Operator - KOSTT JSC has initiated a
dispute at the Regulator against the Kosovo Energy Corporation JSC regarding the objection of the
invoice no OST-P-03-2-2018. The dispute raised by KOSTT JSC against KEK JSC regarding the objection
of the invoice no. OST-P-03-2-2018 relates to the issue of energy compensation supplied in March
2018 by KEK according to the program compensation to the Transmission System Operators (TSO) of
Europe.
The dispute raised by KOSTT JSC against KEK JSC could not be resolved by the Regulator during 2018
because it came at the end of 2018, so it remained to be reviewed and completed at the beginning
of 2019. Regarding this, the Regulator on 21.02.2019 after reviewing all case files sent by both
licensees KOSTT JSC and KEK JSC, responded to both licensees with an official letter stating that, since
both energy companies do not have a written agreement on enabling the return of the compensation
program to the TSOs of Europe through the excesses of KEK, which request was approved by the
Prime Minister of the Republic of Kosovo, such a dispute cannot be handled by the Regulator, as it is
beyond its control and competence, therefore the resolution of this dispute should be requested by
both licensees from the shareholders of both enterprises and not by the Regulator.
3.10.2 Decisions of the ERO Board in the area of customer protection
Based on the Rule on Resolution of Complaints and Disputes in the Energy Sector, customers
and licensees are entitled to submit complaints against decisions of CPD, as the first instance, to the
ERO Board as a second instance.
139
71
353
234 235
281
233
106
75
205182
251
220
172 180 186
223
263
0
40
80
120
160
200
240
280
320
360
400
2011 2012 2013 2014 2015 2016 2019
Customer complaints by years
Registered Resolved

ANNUAL REPORT 2019
50
During 2019, customers have filed 6 complaints at the ERO Board against the decisions of the CPD.
Of the 6 registered complaints, the ERO Board reviewed all of these complaints and rejected them as
ungrounded.
During 2019, KESCO supplier has submitted 24 complaints to the ERO Board against the decisions of
the CPD. Of the 24 registered complaints, the Board reviewed all of these complaints and rejected
them as ungrounded.
Also during 2019, the ERO Board has reviewed 4 recommendations issued by the CPD for complaints
of commercial and industrial customers, in which case the Board has approved all these
recommendations.
3.10.3 Other activities related to customer protection
In addition to the registered complaints, the Regulator’s staff during this reporting year has also
carried out 1,687 meetings and 1,021 telephone conversations with parties including electronic
communications, who have addressed the office for various contractual issues between the customer
and the energy enterprise. The Regulator’s staff during the communication with customers has
informed and instructed them about the rules, procedures and their rights and obligations regarding
electricity supply.
During 2019, the Regulator also received 15 customer complaints by mail. Despite the fact that it was
necessary to address the licensees or the courts regarding these complaints, the customers insisted
on addressing the Regulator in resolving them. The nature of these complaints was mainly for
unauthorized use of electricity, as well as damage compensation. The regulator in all these cases
responded in writing to the customers by instructing them about further procedures regarding their
complaints.
The Regulator, during 2019 same as in the previous years, had close cooperation with the Department
of Customer Protection within the Ministry of Trade and Industry. During this reporting year, it has
received some customer complaints from this institution. These complaints were received and
reviewed by the Regulator in accordance with the legal provisions.
During 2019, a number of Regulator’s decisions were appealed by dissatisfied parties to the Basic
Court in Pristina - Department for Administrative Matters to assess the legality of administrative
decisions. During 2019, the Regulator based on the decisions of the Basic Court in Pristina has
prepared 22 responses to the claim against the claimants KEK, KEDS, KESCO and customers regarding
the decisions of the Regulator’s Board. Also, during this reporting year the Regulator has been
engaged in 28 court hearings in the Basic Court in Pristina as a respondent party. It is worth
mentioning that during the previous years as well as the reporting year, the number of court
proceedings that the Regulator has followed has increased significantly and is demanding high
engagement.
It is important to note that, so far, no decision of ERO related to customer complaints in
administrative procedure has been returned for review due to legality non-compliance by the
administrative body; all these charges against decisions of ERO were rejected as ungrounded and
the challenged decisions were upheld.

ANNUAL REPORT 2019
51
3.11 TSO (KOSTT) Certification Process
As outcome of the requests issued by Directive 2009/72 and Regulation 714/2009 transposed into
Kosovo Energy Legislation in relation to the property dissolution of the Transmission System
Operator, ERO has drafted and approved the Rule on Certification of Transmission System Operator
(April 2017). In accordance with this Rule, ERO on 03.05.2018 has received an Application on
Certificate of Ownership of KOSTT.
The entire evaluation process of KOSTT application by ERO has been conducted in cooperation and
coordination with the Energy Community Secretariat. This process was concluded on 15.02.2019 with
ERO Decision No. V_1107_2019 by which it Certified the Transmission System Operator as the sole
operator in the territory of the Republic of Kosovo, by which has been confirmed that the criteria of
property dissolution and decision-making independence from the activity of production and supply
of electricity have been met, in accordance with the laws of the Republic of Kosovo and Energy
Community. This process has been considered successful by the Energy Community Secretariat.
According to the requirements of legislation as stated above, ERO on 14.10.2019, with Decision No.
1186_2019 has approved the Compliance Officer of the Transmission System Operator, while on
27.11.2019 ERO has approved the Compliance Programme of the Transmission System Operator.

ANNUAL REPORT 2019
52
4 COOPERATION WITH OTHER PARTIES AND TRANSPARENCY
ERO has shown full transparency in exercising its function by holding Board meetings open to the
public and publishing all decisions. Through press releases, announcements, preparation of the
bulletin and other publications on the website and in Facebook, the entire public has been informed
in time about all activities and events of ERO. During this period, 20 press releases, 11
announcements, 2 bulletins were published and 7 public discussions were announced.
During fulfilment of obligations of ERO, in the drafting and approval of the secondary legislation as
well as other regulatory reviews, in order to involve and inform all interested Parties, it publishes and
conducts various public consultations. During 2019, ERO has conducted 7 public discussions.
On 6 February 2019, ERO has announced in public the draft document for Establishment of
Public Service Obligation on Security of Supply. This document describes the criteria for measuring
the security of electricity supply, the Process for assessing the establishment of a public service
obligation and the Supply Security Tax on suppliers.
During the process of Regular Annual Adjustments for Maximum Allowed Revenues (MAR)
for the tariff year 2019 for the Transmission System and Market Operator (TSO/MO, KOSTT), the
Distribution System Operator (DSO, KEDS) and the Universal Service Supplier (USS), ERO has prepared
consultation papers with initial proposals for the updated MARs’:
- USS Consultation Paper 2019
- KOSTT Consultation Paper 2019
- DSO Consultation Paper 2019
In order to consult with all interested parties, the above-mentioned papers were announced
for public consultation on 22 February 2019. In addition to this, all other documents related to this
process were published on the official website of ERO.
On 26 April 2019, ERO has announced in public discussion the draft Rule on Electricity Service
Quality Standards. The purpose of rendering the Rule on Electricity Service Quality Standards is
to determine indicators of the quality of electricity service for customers, regarding the provided
services, the uninterrupted supply of electricity and the quality of voltage.
ERO, on 2 May 2019, has announced in public discussion the Consultation Paper on “Support
Mechanism for RES targets (20 MW Solar Photovoltaic)”. The review of these mechanisms has
derived as a result of the revision of an Administrative Instruction 05/2017, on the targets of RES
by the Government of the Republic of Kosovo through the Ministry of Economic Development.
In June 2019, ERO has announced for public discussion the Ten (10) Year Development
Plan of the District Heating Enterprise DH “Termokos” JSC. The Development Plan
presents the measures that will be taken to guarantee the suitability of the system and
to provide the best possible supply of thermal energy district heating), including plans for
rehabilitation projects and expansion of infrastructure of the district heating system in
the Municipality of Prishtina, during the next ten (10) years.
On September 20, the Regulatory Report on Tariff Review for the 2019/2020 season of
DH Termokos was published for public discussion.

ANNUAL REPORT 2019
53
ERO has also announced in public discussion the Development Plan 2020-2029 of the
Distribution Operator.
4.1 Reporting and cooperation with the Assembly of Kosovo
Meetings with the Assembly Committee on Economic Development, Infrastructure, Trade, Industry
and Regional Development
ERO according to the foreseen legal deadlines has presented the Annual Report 2018 in front of the
Assembly Commission for Economic Development, Infrastructure, Trade, Industry and Regional
Development, in the meeting held on 18 June 2019. The report was approved by the Committee, but
due to the political developments it has not been reviewed in the plenary session.
On 20 April 2019, ERO upon a request of the Committee for Economic Development has discussed
with the Chamber of Commerce, the American Chamber of Commerce and the Manufacturers' Club,
about demands and difficulties that businesses and manufacturers may encounter with the opening
of the market. Chamber representatives may have previously asked ERO to postpone the opening of
the electricity service market in order to create more supply for genuine liberalization.
Informative meeting with the Assembly Committee for Agriculture, Forestry, Rural Development,
Environment and Spatial Planning
On 16 July 2019, at ERO, representatives of the Board and experts of the Energy Regulator held an
informative meeting with members of the Assembly Committee on Agriculture, Forestry, Rural
Development, Environment and Spatial Planning. The purpose of this meeting was to inform the
members of Assembly with the process of Authorization for construction of new capacities from
Renewable Energy Sources (RES), specifically in relation to the several projects, for the construction
of hydropower plants, for which members of the Assembly Commission have raised questions and
asked for more detailed explanations.
Fig. 4.1 – Working meeting with the Assembly Committee for Agriculture, Forestry, Rural Development,
Environment and Spatial Planning 2019, Prishtina
Members of the Assembly have requested clarifications regarding the process and procedure of
issuing the authorizations, expressing their concerns in relation to the ambiguities and reactions of
the citizens related to some of these projects.

ANNUAL REPORT 2019
54
ERO representatives have presented to the Members of the Assembly the process led by ERO, a
process based on the Energy Laws and the Authorization Rule.
Agreement with the Kosovo Chamber of Commerce
In order to increase cooperation and provide support to economic development in the country, on
29 January 2019, ERO has signed a cooperation agreement with Kosovo Chamber of Commerce (KCC).
Through the mentioned memorandum, ERO and KCC have agreed that within the function of general
economic and social development to assist, promote, support and raise the level of mutual
cooperation between them.
ERO and KCA have also agreed to exchange information about their activities and of member
businesses. According to the memorandum, the exchange of information will be based on the
authorized requests of both Parties and in full compliance with applicable laws.
Fig. 4.2 – Signing of the agreement with KCA 2019, Prishtina
ERO through this memorandum has emphasized once again that it will have as a priority the
involvement of all Parties, in the processes of reviewing the development plans of the Transmission
and Distribution network, as well during other regulatory processes that are of general interest.

ANNUAL REPORT 2019
55
4.2 Cooperation with International Organizations
Cooperation and new agreements with Regional Regulators and other Parties
Cooperation Agreement with ERC
On 19 November 2019, ERO has signed a cooperation agreement with the Energy and Water
Regulatory Commission (ERC) of the Republic of Northern Macedonia. The signing of this Agreement
expresses the common interest of both institutions to cooperate in fulfilling their obligations to
maintain the energy sectors of both countries. Through the signing of this agreement, the two
regulatory authorities agreed to exchange information on the applied practices, while fulfilling
obligations that are in common with public interest of both countries. Exchange of experiences will
be applied in the field of regulatory policies in the energy sector, experience in monitoring licensed
activities, methodologies applied in determining tariffs for energy activities, construction of the new
generators of RES, manners to support projects by RES, as well as other applied practices that will
help to increase the professional capacities of both institutions.
Fig. 4.3 – Signing of the Agreement with ERC 2019, Prishtina
Cooperation agreement with ERE
ERO on 13 December 2019 has signed a Cooperation Agreement with the Energy Regulatory Entity
(ERE) of the Republic of Albania. This is the second agreement, after the one signed in 2013, that
Regulators of both countries are signing in order to strengthen the cooperation and adapt to the new
circumstances created in the energy sector. With this agreement, the two regulators have highlighted
the opportunities to focus their joint efforts on the development of a sustainable regulatory structure
in the electricity and gas sectors at the regional and bilateral levels.

ANNUAL REPORT 2019
56
Fig. 4.4 – Signing of the Agreement with ERE 2019, Prishtina
Partnership activities with NARUC
Addressing the issue of vulnerable customers
The subject of protection of vulnerable customers in the energy sector, which was addressed in the
Workshop held in August 2019, has been part of the Partnership Activity that ERO has with the
National Association of Regulatory Utility Commissioners (NARUC). The partnership between ERO and
NARUC has been supported since 2008 by the United States Agency for International Development
(USAID). Considering that the Regulator has an important role in addressing customer protection in
the energy sector as part of the partnership with NARUC, ERO is committed to better understanding
of the extent to which vulnerable customers will be affected by the abolition of inter-subsidy, the
methods by which these customers will be classified, and the policy options available in Kosovo to
address this issue. As part of this activity, on 20 August was held a workshop with other Parties
involved, in order to address this issue at a wider inter-institutional level.
Fig. 4.5-Workshop for vulnerable - August 2019, Prishtina
In addition to this, the staff of ERO during 2019 has participated in three other groups that NARUC
has organized in order to support the energy sector in the region countries.
Cyber Security
ERO has also been part of NARUC's Cyber Security policy development program. To this end, three
ERO representatives participated in two workshops organized by NARUC and USAID during 2019. The
first workshop was held in Warsaw from 10 to 12 April 2019, where the subject was "Effective Cyber

ANNUAL REPORT 2019
57
Security Regulation". Whilst, the Second Workshop was held in Skopje on 28-29 October on
"Guidelines for Cyber Security Fees".
The purpose of these roundtables was to familiarize regulators with guidelines for setting tariffs to
improve the situation in the power system in relation to cyber security. Participants were also
instructed on the approach that regulators should follow in order to advance their preparations for
aspects of cyber security.
The purpose of participation in international activities is considered by ERO as one of the key
elements that serves institutional strengthening, increase of knowledge and experience of its staff.
The main activities and the active participation in international organizations, international
conferences, roundtables or multilateral and bilateral meetings are presented below.
4.2.1 Participation in the Energy Community Regulatory Board (ECRB)
The Energy Community (EC) is an international organization established by the international treaty in
October 2005 in Athens, attended by the European Union countries, the South East European
region and the Black Sea. EC activities during 2018 were focused towards achieving a common goal:
"acquis communautaire" implementation, develop the harmonized regulatory framework at
regional level and liberalize and integrate markets in the electricity and natural gas sectors.
EC Contracting Parties are: Albania, Bosnia and Herzegovina, Kosovo, Northern Macedonia,
Montenegro, Serbia, Moldova, Ukraine and Georgia. European Union member states are participants,
whereas Norway, Turkey and Armenia have the observer status.
Fig. 4.6 Member states of the Energy Community of South East Europe
Energy Community Treaty (ECT) is a key strategic component of the European Union (EU) for
Southeast Europe and an effective pre-accession tool, which is aimed at expanding benefits from
the Regional Energy Market before the regional countries become EU members.

ANNUAL REPORT 2019
58
The main institutions of the EC are: Ministerial Council (MC), Permanent High-Level Group (PHLG),
Energy Community Regulatory Board (ECRB), the EC Secretariat with the seat in Vienna and four
advisory forums: on electricity, natural gas, social issues and oil.
ECRB – “Energy Community Regulatory Board” is an institution established under Article 58 of the
ECT SEE, comprised of regulatory authorities of the contracting parties, participants and observers.
ECRB plays the role of a coordinating body of the regulatory authorities for harmonization of the
regulatory framework, exchange of knowledge and development of best practices on
implementation of the treaty.
Based on the provisions of the EC Treaty, ECRB has the responsibility to:
advise to the Ministerial Council and PHLG on statutory, technical and regulatory issues;
Issue recommendations to parties, in line with the provisions of the Treaty, on any cross
border disputes, etc.;
Undertake measures against parties, if authorized by the MC;
Facilitate cooperation and coordination among regulatory authorities;
Give recommendations and draft reports about the functioning of energy markets; and
Seeks fulfilment of the parties’ obligations under ECT.
With the purpose of fulfilling its responsibilities, ECRB is organized in working groups that perform
activities in their respective fields. ECRB is chaired by the President, annually elected by the
representatives of national regulators, and the deputy who is delegated by the European
Commission.
Fig. 4.7 Registered and Resolved Customer Complaints
4.2.2 Activities of the Regulator within ECRB
Under its obligations to the EC, ERO has appointed its members to the ECRB and to each working
group, and actively participates in the activities of the Board and of the relevant working groups.
Activities of the respective groups are presented below:
ECRB board
Customers and Retail market
Electricity Natural gas
ACER Representative International co-
operation
Crosscutting

ANNUAL REPORT 2019
59
4.2.2.1 Electricity Working Group
During 2017, this working group has held regular meetings and activities within its scope; for more
efficient work, this group has also established its subgroups (Task Forces –TF), description and
activities of which are presented below:
o TF1 – Electricity Wholesale Market Opening
In order to support the effective opening of electricity regional markets in Energy Community,
this subgroup is focused on regulatory support activities, integration of the "day-ahead"
market and “intraday” markets in the South East Europe. Also, activities are focused on
providing coordinated inputs for the adaptation of EU Regulations: 1223/2015 on Capacity
Allocation and Congestion Management and 1719/2016 on previous Capacity Allocation.
A number of documents were compiled within this Task Force, such as: i) The Report on
Trading Activities on the “day-ahead” and “intraday” markets; and ii) Report on the status of
‘intraday’ markets in the Contracting Parties;
o TF2 –Integrated Market Balancing
Implementation of balancing mechanisms based on the market and interconnection of
national balancing markets into regional market shall promote transparent formation of
balancing prices, shall encourage competition in purchasing of balancing services and have
positive impact on the stability of transmission network. This process has received an
additional boost from the WB 6 Initiative.
In this respect, TF-2 subgroup activities have resulted in drafting of Reports for: i) Balancing
Market Development Plans; ii) Analysis of Price Formation of Imbalances in Contracting
Parties; and iii) Coordinated Regulatory Input for Cross-Border Balancing.
o TF3 – Electricity Wholesale Market Monitoring
Market Monitoring is a key component of regulatory responsibilities, which is also defined in
"acquis communautaire", a full disclosure of market performance and development
prospects, enables the promotion of competition, customer protection, energy efficiency,
investment and safety of supply.
In this context, activities are focused on drafting of documents such as: i) Monitoring Report
on the Development of Electricity Wholesale Market in the Contracting Parties; ii) Guideline
on SEE Market Monitoring.
o TF4 – Monitoring transmission rates based on R838 / 2010
Within this task force are assessed annual loads of the transmission system on electricity
generators (G-charges) that are applied to the Contracting Parties, as well as the relevant
recommendations for harmonization at the level of the Energy Community.
4.2.2.2 Gas Working Group (GWG)
This working group focuses its activities on issues of regulating the natural gas sector, harmonizing
the regulatory framework at regional level and other issues related to the development of natural
gas infrastructure in the SEE region. For efficiency purposes and in favour of handling of specific
issues, specific subgroups are created ("Task Force"-TF).

ANNUAL REPORT 2019
60
o TF1 – Natural Gas Wholesale Market Monitoring
Market monitoring is a fundamental component of regulatory responsibilities, because
complete reporting on market performance and development prospects promotes
competition, customer protection, energy efficiency, investment and safety of supply.
Within this sub-group, the activities are mainly focused on: i) Monitoring Reports on
Developments of Gas Wholesale Market in Contracting Parties; and ii) Monitoring Report of
Compliance with Transparency Requirements in Contracting Parties as well as Monitoring
Report on ACER Gas Markets.
o TF2 – Transparency
Transparency Monitoring has included two components: Assessing Compliance with
Transparency Requirements of the Energy Community “acquis communautaire”, and joint
venture with “MedReg” to compare transparency achievements. The work within this task
force has been concretized with the drafting of 2 reports: i) Report on the compliance of the
Contracting Parties with the requirements for transparency of the ‘acquis communautaire’ of
the Energy Community; and ii) ECRB-MedReg Joint Transparency Report.
o TF3 – Implementation of Network Codes
Upon adoption by the Energy Community of the Network Codes under the Third Package,
implementation of these codes by the Contracting Parties is one of the primary tasks in the
Energy Community Agenda. In this regard, Regulatory Authorities shall identify and select the
best model for implementing network codes.
Activities within this task force are focused on monitoring on congestion of intersection
points, considering the trading of capacities in the secondary markets and the use of
‘intermittent’ capacity.
o TF4 – Coordination of transmission and distribution systems
Coordination between transmission and gas distribution system operators has become
increasingly important in the process of opening of the market and developing network
codes, including the interaction between these two systems. The activities are focused on
coordinating the development and maintenance of transmission and distribution networks,
gas quality at the transmission and distribution level, as well, as on the models applied for
balancing. In this regard, an Analytical Report on the common issues of transmission and
distribution network codes has been compiled.
4.2.2.3 Customer and Retail Market Working Group
Within the ECRB, there is a customer working group with its own sub-groups, which deals with
customer-related activities, tariffs and retail prices, contractual relations between suppliers and
customers, and the quality of energy supply and regulation of the voltage quality.
o TF1 – Retail Market Monitoring
Market monitoring is a fundamental component of regulatory responsibilities; complete
reporting on market performance and development prospects allows regulators to create an
ANNUAL REPORT 2019
61
effective framework that balances market participants' needs and promotes competition,
customer protection, energy efficiency, investment and safety of supply.
In this regard, the activities of this sub-group include: i) drafting a Monitoring Report on the
functioning of retail electricity markets and natural gas in the EC; ii) issuing inputs for the
ACEER-CEER Report on monitoring the development of retail markets.
o TF2 – Customer protection
Customer protection is considered as one of the main tasks of the Regulatory Authorities,
and consequently this responsibility is conveyed to regional / international organizations such
as ECRB, CEER and MEDREG. It is estimated that cooperation of these 3 regional bodies is
important in the exchange of best and most efficient experiences in the field of customer
protection. Among the main activities of this task force was holding of the three-party ECRB-
CEER-MEDREG Workshop where numerous aspects of customer protection were reviewed.
o TF3 – Quality of Supply
Achieving a satisfactory degree of quality of continuous supply remains a basic activity of
regulatory Authorities, as well as monitoring the quality of electricity and gas supply.
Activities of this task force have resulted in the drafting of the joint ECRB-CEER Comparative
Report on the quality of electricity and gas supply, in which are presented the respective data
on the quality of supply in the ‘Contracting Parties’ and the relevant analyses.
o TF4 – Self-consumption producers (‘Prosumers’)
Following the latest technological developments, especially RES (photovoltaic solar)
technologies, customer interest in installing these technologies for generation and self-
consumption has been increased. In this context it is necessary to develop a specific,
transparent and comprehensive framework for the treatment of self-consumption energy
producers.
As part of the relevant activities, this task force has undertaken a research which has
included: Assessment of capacity levels for qualification as self-consumption producers; legal
procedures for admission to the self-consumption producer scheme; identifying potential
barriers; and has made recommendations on improvement in accessing the self-consumption
producers.
o TF5 – Losses in electricity networks
Since losses directly affect tariffs, then the reduction of network losses is always in the focus
of regulatory activities in order to increase the efficiency of system operation. In this regard,
the task force has drafted a report on energy losses in the network, which provides
comparisons with the level of losses in the EU and the contracting parties of the EC, and has
identified practices for calculating network losses.
4.2.2.4 Working Group on REMIT and Cyber Security
Within this group, 4 task forces have functioned:
o TF1 – Procedural aspects:
ANNUAL REPORT 2019
62
It has addressed issues on the drafting of procedural acts for reporting and the format of reporting, as well handling confidential information.
o TF2 – Registration and the demand for information technology:
The registration format of market participants of the Contracting Parties has been established, as well a register at the level of ECRB.
o TF3 – Implementation of REMIT Regulation no. 1227/2011:
It has assessed aspects of correct implementation of this regulation and professional capacity building in order to address issues on implementation of REMIT Regulation.
o TF4 – Cyber Security:
Considering digitalization in the energy sector, this task force has addressed various aspects of cyber security and made relevant recommendations to increase cyber security in the EC Contracting Parties.
4.2.3 Participation of ERO in meetings organized by international institutions
Given that the regulation in energy sector is a field that is developing dynamically then these
developments need to be followed continuously. The Regulator pays special attention to participation
in meetings, workshops and trainings. In addition to the contribution made to these meetings and
workshops, this has an impact on increasing the knowledge of the Regulator’s staff, as well as gaining
experience from regional and international regulation practices that are required for professional
development.
During 2019, a series of regional meetings, workshops and trainings have been held that have
contributed to further enhance the knowledge of Regulator’s employees on regulating the energy
sector in line with EU standards.
Below are presented the meetings, working groups and trainings held during 2019:
29 January 2019 - 42nd Meeting of the Working Group on Customers and the Retail Market
within the ECRB, Energy Community Secretariat; Vienna, Austria;
26 February 2019 - 46th meeting of the ECRB Electricity Energy Group, organized by the
Energy Community Secretariat; Vienna, Austria;
14 February 2019 - Workshop "Implementation of electricity network codes in the Energy
Community", organized by the Energy Community Secretariat; Vienna, Austria;
4-5 April 2019 - 29th EAPM Congress (European Association for Human Management),
organized by EAPM and Slovenian Association of Human Resources; Bled, Slovenia;
4-5 April 2019 - Workshop "Analysis of the cost benefit of Gas infrastructure projects"; in
Budapest, Hungary;
27 - 28 May 2019 - 47th Meeting of the ECRB Electricity Energy Group (EWG), organized by
the Energy Community Secretariat; Athens, Greece;
28 and 29 May 2019 - Athens 24th Electricity Energy Forum organized by the European
Commission; Athens, Greece;

ANNUAL REPORT 2019
63
24 - 25 June 2019 – 43rd Meeting of the Working Group on Customers and the Retail Market
within ECRB, as well the second joint roundtable organized between CEER-MEDREG-ECRB,
organized by the Council of European Energy Regulators; Brussels, Belgium;
25 June 2019 – 2nd CEER-ECRB-MEDREG trilateral Workshop organized by the Council of
European Energy Regulators; Brussels, Belgium;
20 September 2019 - The 7th Vienna Forum on European Energy Laws, organized by the
Energy Community Secretariat, the Law Sector of the European Union School of Florence
Regulation, the Robert Schuman Centre for Advanced Studies (RSCAS), the European
University Institute (EUI) of Florence, Italy; Vienna, Austria;
23-24 September 2019 – 18th Conference on Energy Investment and Regulation Training, in
Riga, Latvia;
03-04 October 2019 – Conference "100 years of conference interpretation", "Reflection on
the past and perspectives of the future", organized by International Labour Organization - ILO
(International Labour Organization); Geneva, Switzerland;
17 October 2019 – Training on gas and electricity distribution tariffs, organized by the Energy
Community Secretariat; Vienna, Austria;
16-17 October 2019 – Training - Gender Equality and Diversity in the National Energy
Regulatory Authorities; organized by the Council of European Energy Regulators; Brussels,
Belgium;
23 October 2019 - 48th meeting of the ECRB Electricity Energy Group, organized by the Energy
Community Secretariat; Sarajevo, Bosnia and Herzegovina;
24 October 2019 - Second meeting of the working group for REMIT, organized by the Energy
Community Secretariat; Sarajevo, Bosnia and Herzegovina;
25-28 October 2019 – Training “Identifying risk management in the tendering process,
managing the procurement process”; Istanbul, Turkey;
28-29 October 2019 – Technical Workshop - Guidelines for Cyber Security Fees; organized by
NARUC and USAID; Skopje, Northern Macedonia;
05 and 06 November 2019 -48th meeting of the ECRB Electricity Group - 3rd ACER Workshop
- ECRB on Regulation (EU) 2015/1222 (CACM), organized by the Energy Community
Secretariat; Vienna, Austria;
14 November 2019 - Regulatory training school: Integration of RES, organized by the Energy
Community Secretariat; Vienna, Austria;
15-18 November 2019 – Training Role of internal control in budget organizations and public
enterprises, in the management of public finances, Istanbul - Turkey;
5-6 December 2019 Meeting of the Working Group on Customers and Retail Markets within
ERRA, organized by the Association of Energy Regulators; Budapest, Hungary;
11 December 2019 – Seventh meeting of the working group for the Security of Supply: under
the group of energy electricity; organized by the Energy Community Secretariat in
cooperation with the European Commission; Vienna, Austria;

ANNUAL REPORT 2019
64
4.3 Procurement activities
ERO has been facing numerous problems as a result of Central Procurement Agency (CPA) failure to
perform the procurement procedures. Due to the amendment of the Law on Public Procurement, the
office’s operation has been hampered by the lengthy procedures pursued by CPA while carrying out
procurement activities. This has led the office to remain without services and supplies required for
its normal functioning.

ANNUAL REPORT 2019
65
5 FINANCIAL REPORT FOR ERO
ERO is funded from its own revenues, in accordance with the Law on Energy Regulator, Chapter 4,
respectively from taxes collected by enterprises and licensed operators in the energy sector.
5.1 Revenues
All revenues collected by the Energy Regulatory Office are deposited in accordance with Article 64 of
the Law on Public Financial Management and Accountability, in the official bank account established
by the Director General of the Treasury.
In 2019, the Energy Regulatory Office has realized revenues in the amount of € 1,329,192.29. Given
that the total amount of the budget spent by ERO in 2019 is 699,215.18 €, unspent revenues in the
amount of 629,977.11 €, in accordance with Article 23 of the Law on Energy Regulator, have been
transferred to the Budget of the Republic of Kosovo.
Tab. 5.1 Revenues
5.2 Budget
With the Law on the Budget of the Republic of Kosovo No. 06/L-133 for 2019, the Assembly of
Kosovo approved the ERO budget in the amount of 836,789€,, which is entirely allocated as a
government grant, although according to the Law on the Energy Regulator, ERO is funded from its
own source revenues and only in cases where such revenues are insufficient, ERO may use budget
allocations in the form of government grants. According to economic categories, the budget of ERO
is as follows:
Tab. 5.2 Budget at the beginning of the year
With the decision of the Government of the Republic of Kosovo (Decision No. 03/115), ERO's budget
has been reduced by € 108,671.25 namely € 47,060.25 in the economic category "wages and salaries"
and € 5,611.00 in the economic category “communal expenses” and € 42,000.00 in the economic
category “capital expenditures”. Expressed in percentage, ERO budget is reduced by 12.98%.
It is important to note that the budget of ERO is shortened by the Government of the Republic of
Kosovo at the end of 2019, due to not spending it. The reason for not spending the budget in the
category "wages and salaries" is the failure to fill the position of Chairman of the Board and four staff
Description Amount
Own Source Revenues 2019 1,329,192.29 €
Expenditures 2019 (699,215.18) €
Revenues transferred to the Budget of the Republic of Kosovo 629,977.11 €
Description Budget
Wages and salaries 523,457.00 €
Goods and Services 219,332.00 €
Utilities 22,000.00 €
Capital expenditures 72,000.00 €
Total 836,789.00 €

ANNUAL REPORT 2019
66
positions throughout 2019, while not spending the budget in the categories "goods and services" and
"capital expenditures" occurred due to non-implementation of procurement procedures by the
Central Procurement Agency (CPA).
Tab. 5.3 Final Budget
5.3 Budget Expenditures
To finance the activities carried out in 2019, ERO has spent 699,215.18€.
According to the economic classification, ERO expenditures are as follows:
Tab. 5.4 Expenditures by economic categories
Budget execution in proportion to the remaining budget after cuts is 96.03%.
The degree of realization of the budget according to economic categories, expressed in percentage,
is presented in Table 5.5.
Tab. 5.5 Budget execution, expressed in percentage
Description Budget
Wages and salaries 476,396.75 €
Goods and Services 205,332.00 €
Utilities 16,389.00 €
Capital expenditures 30,000.00 €
Total 728,117.75 €
Description Amount
Wages and salaries 476,396.75 €
Goods and Services 184,955.44 €
Utilities 15,089.99 €
Capital expenditures 22,773.00 €
Total 699,215.18 €
Description Budget Expenditures Difference Execution in %
Wages and salaries 476,396.75 € 476,396.75 € - € 100.00%
Goods and Services 205,332.00 € 184,955.44 € 20,376.56 € 90.08%
Utilities 16,389.00 € 15,089.99 € 1,299.01 € 92.07%
Capital expenditures 30,000.00 € 22,773.00 € 7,227.00 € 75.91%
Total 728,117.75 € 699,215.18 € 28,902.57 € 96.03%

ANNUAL REPORT 2019
67
Fig. 5.1 Budget and Expenditures for 2019
The following tables display expenditures by economic codes.
Tab. 5.6 Wages and Salaries
In this category, a total of € 476,396.75 is spent and the all amount was spent on regular salaries of
ERO staff. With the exception of allowances (per diems) for official trips abroad, which are paid by
goods and services category, ERO does not pay other allowances.
100.00%
90.08% 92.07%
75.91%
0%
10%
20%
30%
40%
50%
60%
70%
80%
90%
100%
€-
€100
€200
€300
€400
€500
€600
Wages and salaries Goods and Services Utilities Capital expenditures
Tho
usa
nd
s
Budget/expenditures for 2018
Budget Expenditures Execution in %
Euro*1000
Wages and Salaries Amount
Net wages 396,181.18 €
Personal Income Tax 34,844.59 €
Employer's pension contribution 22,685.49 €
Employee's pension contribution 22,685.49 €
Total 476,396.75 €

ANNUAL REPORT 2019
68
Tab. 5.7 Goods and services
As it can be seen from Table 5.7, the amount of funds spent on this category of expenditures is €
184,955.44.
Budget expenditures based on activities are as follows:
Goods and services Amount
Other expenditures for official travels within the country 280.00 €
Expenditures for official travels abroad 13,351.33 €
Allowances for official travels abroad 18,883.95 €
Accommodation for official travels abroad 9,375.37 €
Other expenditures for official travels abroad 3,368.12 €
Internet Expenditures 906.88 €
Expenditures for Mobile Telephony 5,143.32 €
Postal expenditures 219.40 €
Education and training services 10,745.00 €
Different intellectual and advisory services 4,273.97 €
Printing services 1,021.50 €
Other contracting services - €
Membership expenditures 6,560.00 €
Furniture 2,940.00 €
Computer 3,989.70 €
Hardware for IT 1,605.20 €
Other equipment - €
Office supplies 2,837.42 €
Beverage supply 3,111.90 €
Accommodation - €
Generator fuels 94.20 €
Vehicle fuel 6,358.35 €
Vehicle registration 420.00 €
Vehicle insurance 771.24 €
Municipal tax for vehicle registration 40.00 €
Security of premises 6,745.20 €
Vehicle maintenance and repair 1,574.20 €
Building maintenance 3,984.31 €
Maintenance of information technology 2,701.00 €
Maintenance of furniture and equipment - €
Building rent 49,140.00 €
Equipment rent 646.44 €
Machinery rent 11,951.04 €
Advertisements and vacancies - €
Official dinners 7,056.40 €
Rental tax payment 4,860.00 €
Total 184,955.44 €

ANNUAL REPORT 2019
69
Tab. 5.8 Expenditures by activities
Tab. 5.9 Municipal expenses
Tab. 5.10 Capital expenditures
In this category of expenditures, ERO for 2019 has planned a budget of 72,000.00 €, for the realization
of two projects, of which only one has been realized, while the second project in the foreseen value
of 42,000.00 €, has not been realized due to non-fulfilment of procurement procedures by the Central
Procurement Agency, despite the fact that the initiation of procedures by ERO was done in early 2019.
Expenditures by activities Amount
Travel expenditures 45,258.77 €
Telecommunication Services 6,050.20 €
Expenditures for services 22,819.87 €
Purchase of furniture and equipment 8,534.90 €
Other purchases - goods and services 5,949.32 €
Derivatives and fuels 6,452.55 €
Registration and insurance services 7,976.44 €
Maintenance 8,259.51 €
Rent 66,597.48 €
Marketing expenditures - €
Representation expenditures 7,056.40 €
Total 184,955.44 €
Utilities Amount
Electricity 13,754.21 €
Water 449.48 €
Telephone expenditures 886.30 €
Total 15,089.99 €
Capital expenditures Amount
Information technology equipment 22,773.00 €
Total 22,773.00 €

ANNUAL REPORT 2019
70
6 ELECTRICITY SECTOR
6.1 Characteristics of the electricity sector
The energy system in the Republic of Kosovo is composed of electricity generation, electricity
transmission, electricity distribution, unregulated customers, as well customers with the right to
universal service. Major suppliers and traders are also participants in the electricity market.
Generation is mainly based on lignite power plants (TPP A and TPP B), HC Ujmani which are owned
by the Government of the Republic of Kosovo, whereas other HPPs and other RES are privately
owned.
KOSTT is the only operator of the transmission and market and is 100% owned by the Assembly of
Kosovo. It operates with two separate licenses, a license for operation of the transmission system
and a license for market operation. Market Operator is responsible for organizing and developing
electricity market, while the Transmission System Operator is responsible for transmitting electricity,
operating and maintaining the transmission system, and balancing the system.
KEDS is the only distribution operator but is privately owned. This operator is responsible for the
operation and maintenance of the distribution system and the management of generators connected
to the distribution system.
KESCO is a supplier that has a license for supply of Public Service Obligation, set forth by the Regulator
to supply customers who are entitled to the universal service. In addition, the Regulator has assigned
obligation of Last Resort Supplier.
Other suppliers –so far, there are 7 licensed suppliers who are privately owned but have not begun
to operate commercially yet.
Kosovo's power system is mainly designed to produce basic electricity, which, as mentioned above,
is based on lignite as raw material, but not for maximum load coverage and balancing of the system
which remains a major challenge to all participants in the sector.
Kosovo has installed generation capacities of 1,431 MW, including generation capacities from RES,
however the operational capacity is considered 1,099 MW, of which lignite thermal power plants
(TPP) account for about 87.36%, while the rest consists of HPP Ujmani with 2.91%, wind power plants
“Kitka” (Air energy) with 2.95% and other RES (hydro power plants, solar panels and wind power
plants) with 6.78%.
These capacities, in most of the period would be sufficient to cover demand as well as to export, but
due to power plant aging and insufficient flexibility to accommodate demand at different times,
especially at peak times, then imports, and sometimes exports, are required to balance the system.
The introduction of generators from RES increases the generation capacity, but in most cases they
are unpredictable and are in dispatch priority mode, therefore they do not have an impact on
improving the balancing of the power system, and sometimes even increase the imbalances.
The figure below shows the generation, import, export and demand of electricity over the last ten
years.

ANNUAL REPORT 2019
71
Fig. 6.1 Generation, Import and Electricity Demand 2009 - 2019
6.1.1 Electricity Market
Electricity sector in Kosovo is inextricably linked to the regional market and beyond.
As part of activities for the liberalization of the electricity market is the creation of day-ahead and
intraday market stock exchange, as well as market coupling. During 2019, members of working group,
such are representatives of the two countries, Kosovo – Albania have held several joint meetings
regarding an action plan for carrying out these activities in order to prepare the necessary documents
for the formation of the Stock Exchange and market coupling between two countries.
The electricity market in Kosovo includes bilateral electricity trading and trading to balance the
electricity system. Based on the legislation in force, electricity generators are obliged to offer their
capacity in a transparent, non-discriminatory and market-based manner to all customers in wholesale
and retail markets, including those with public service obligations. All customers in the market are
entitled to change their supplier.
As mentioned above, due to the low flexibility of the system to meet the demand and the high
demand at peak times, there is a need for imports or exports of electricity. From the overall electricity
demand at the country level 6,001 GWh (including transmission and distribution losses), most of it is
covered by domestic (generators), whereas the rest is covered by electricity imports.
The table below presents system balancing, which shows that during 2019, Kosovo was a net
importer.
-2,000
-1,000
0
1,000
2,000
3,000
4,000
5,000
6,000
7,000
8,000
2009 2010 2011 2012 2013 2014 2015 2016 2017 2018 2019
Electricity generation, import, export, and demand 2009-2019
PP A PP B HPP and RES Import Export Demand
GWh

ANNUAL REPORT 2019
72
Tab. 6.1 Balancing of the power system
The share of transit in the transmission system network in previous periods has been much higher
(even over 50%), but there is a downward trend, especially upon the increase in local demand. In
2019, the share of transit in transmission system network is about 20.2%.
With respect to the operation of the transmission network, it should also be emphasized the KOSTT's
inability to allocate transmission capacities due to the non-recognition of KOSTT as a control
block/area. Capacity allocation would generate revenues for KOSTT that could be used for
maintenance and repair of transmission capacities as well as for the construction of new transmission
capacities where there is network congestion. The capacity allocation for Kosovo lines continues to
be carried out by the Transmission System Operator of Serbia (EMS), who also collects financial
revenues from this allocation.
The implementation of the signed electricity agreement between Kosovo and Serbia has not been
implemented yet, although it has been foreseen since November 2015, which would regulate the
functioning of KOSTT as a regulatory area / block, capacity allocation, etc.
Regarding the security of supply of electricity customers is required regular operation of the
transmission network, distribution and generation network, including import and export of
electricity.
Figure 6.2 shows the flow of electricity from generation, transmission up to the distribution to
customers, as well as electricity flows towards regional networks and from regional networks
including transit.
Power system Balancing 2019 GWh
1 Production from generators connected in transmission network 5,650
2 Production from generators connected in distribution network 68
3 Import 928
4 Total energy available 6,646
5 Export 905
6 Net import/Export -24
7 Deviations of the system (exits from the system) -260
8 Transit 1,696
9 National demand 6,001
10 Losses in transmission 105
11 Consumption of customers connected in transmission network 464
12 LLOMAG Consumption 110
13 Distribution system load 5,322
14 Distribution losses 1,378
15 Nett Consumption in distribution network 3,944

ANNUAL REPORT 2019
73
Fig. 6.2 Electricity flows in the system in 2019
6.1.2 Generation Adequacy and Security of Supply
Local generation is not sufficient to cover the maximum load on Kosovo's power system, but it is
worth to emphasize that electricity generation along with imports meet the national electricity
demand.
The overall generation capacity of generators in Kosovo is 1,099 MW, while the maximum load during
this year was 1,253 MW, therefore the ratio of the generation adequacy towards the maximum load
is 87.7 %.
The table below shows maximum and minimum monthly loads during 2019.
Tab. 6.2 Maximum and Minimum Loads in 2019
It is worth emphasizing that the maximum loads occur during the winter season due to consumption
of electricity for heating.
Adequacy of the transmission system contains sufficient reserves to enable the flow of electricity to
meet the local demand, including the coverage of the maximum load (peak), as well as to enable
transit through interconnection lines.
DSO (KEDS) - 5,322 GWh losses + north
1,083 GWh +294 GWh
TSO(KOSTT) – 5934 GWh
(105 GWh losses)
Import Export
2,078 GWh
3,325 GWh
Intercon. flow offtake
Intercon. flow intake
68 GWh
Electricity flows in the Kosovo power system in 2019
Customers in distribution network
Customers connected
in transmission
Distribution generators
Public gen.KEK (A+B)
3,944 GWh
928 GWh 905 GWh
5,255 GWh
464 GWh
Internal consumption KEK
110 GWh
Deviation to ES-260 GWh
2,481 GWh
2,197 GWh
Other gen. Ujm. + Lumb.
246 GWh
Customers in the north of the country
294 GWh
Jan Feb Mar Apr May Jun Jul Aug Sep Oct Nov Dec
MWh/h MWh/h MWh/h MWh/h MWh/h MWh/h MWh/h MWh/h MWh/h MWh/h MWh/h MWh/h
Maximum 1,178 1,105 1,003 887 915 810 759 805 776 927 939 1,253
Minimum 618 535 458 364 327 289 332 349 313 348 417 545
Load 2019

ANNUAL REPORT 2019
74
The table below shows the maximum and minimum loads (Pmax and Pmin) of the Kosovo power system
over the years, their time of occurrence, generation, and the respective import and export of
electricity.
Tab. 6.3 Maximal and Minimal Power System Loads
* Deviation of the system towards the interconnection system
In order to cover the losses, during 2019, electricity continued to be purchased by the Transmission
System Operator and Distribution System Operator in the competitive electricity market. The energy
required to cover the losses in the transmission and distribution network is provided proportionally
by the remaining energy from KEK after the allocation of energy for the universal service. If the energy
received from KEK is not sufficient to cover the losses, then the rest of the required energy is provided
by import.
6.2 Primary Energy Sources
Kosovo has large reserves of lignite as a primary source of energy, which enables a long-term
production of electricity, but remains an environmental issue due to greenhouse gas emissions and
other pollutants. Also, our country has the potential of RES such as: water energy, wind energy, solar
energy, biomass, etc.
6.2.1 Lignite Production and Consumption
Lignite production in 2019 was 8.06 mil. ton, while consumption 8.38 mil. ton, these quantities are
larger compared to 2018.
Lignite production and consumption by months, for 2019 is presented in Table 6.4.
Tab. 6.4 Lignite production and consumption in 2019
The following figure shows the production and consumption of lignite during 2009 - 2019.
Production Import Export Deviation* Production Import Export Deviation*
[MW] Data Ora [MW] [MW] [MW] [MW] [MW] Data Ora [MW] [MW] [MW] [MW]
2015 1,129 31.12 20:00 825 308 0 -4 272 30.08 04:00 250 0 50 -72
2016 1,160 31.12 18:00 797 321 0 42 246 12.06 06:00 711 0 310 155
2017 1,161 11.01 20:00 660 415 0 86 286 3.06 06:00 733 50 440 57
2018 1,203 31.12 18:00 787 271 0 145 265 27.06 06:00 577 5 430 -113
2019 1,253 31.12 18:00 861 348 16 60 289 7.06 06:00 435 15 140 21
Maximum load Minimum load
YearPmax Pmin
Lignite production/consumption Total Jan Feb Mar Apr May Jun Jul Aug Sep Oct Nov Dec
Lignite production (t*1000) 8,063 664 798 807 788 525 421 505 580 758 759 855 603
Lignite consumption (t*1000) 8,382 861 755 859 604 541 491 603 635 654 809 780 790
Lignite consumption in the market (t*1000)266 19 23 20 17 23 23 21 24 27 27 23 19

ANNUAL REPORT 2019
75
Fig. 6.3 Production and consumption of lignite in the years 2009 - 2019
6.3 Electricity Generation
6.3.1 Electricity Generation Capacities
Electricity generation capacities in Kosovo are mainly from power plants which account for 90.02% of
the installed capacity or 87.36% of the operating capacity, and the rest are hydropower plants and
renewable energy sources (hydropower plants, wind farms and photovoltaic panels).
The capacity of the generating units is presented in the following table according to the type of
primary source, installation and operational capacity, minimum and maximum production limits and
the year of operation.
7,872
7,9588,212
8,0288,219
7,204
8,241
8,801
7,5757,170
8,063
7,993 8,269 8,287 8,219
8,904
7,118
8,1438,520
7,645 7,476
8,382
0
1,000
2,000
3,000
4,000
5,000
6,000
7,000
8,000
9,000
10,000
2009 2010 2011 2012 2013 2014 2015 2016 2017 2018 2019
Lignite production and consumption 2009 - 2019
Lignite production Lignite consumption by PPs
t*1000

ANNUAL REPORT 2019
76
Tab. 6.5 Generation capacities in Kosovo’s electricity system
In recent years there has been an increase in the installed generation capacity of RES, which continues
to operate as private investment.
6.3.2 Electricity Generation
Overall electricity production in 2019 was 5,718 GWh, whilst in 2018 it was 5,311 GWh, which means
that there is an increase of 7.7%. Whereas, compared to the electricity balance for 2019, the
Installed Net Min/max
PP Kosova A1 65 Not functional 1962
PP Kosova A2 125 Not functional 1964
PP Kosova A3 200 144 100-130 1970
PP Kosova A4 200 144 100-130 1974
PP Kosova A5 210 144 100-135 1975
PP Kosova A 610 432
PP Kosova B1 339 264 180-260 1983
PP Kosova B2 339 264 180-260 1984
PP Kosova B 678 528
HPP Ujmani 35.00 32.00 1983
HPP Lumbardhi 8.08 8.00 (1957) 2006
HPP Dikanci 4.02 3.34 (1957) 2013
HPP Radavci 1.00 0.90 (1934) 2010
HPP Burimi 0.95 0.85 (1948) 2011
Total HPP (outside the support scheme) 49.05 45.09
EGU Belaja 8.06 8.06 2016
EGU Deçani 9.81 9.81 2016
HPP Hydroline-Albaniku III 4.27 4.27 2016
HPP Brod II 4.80 4.80 2015
HPP Restelica 1&2 2.28 2.28 2016
HPP Brodi III 4.70 4.70 2016
HPP Brezovica 2.10 2.10 2017
HPP Orqusha 4.00 4.00 2019
HPP Lepenci 3 10.00 10.00 2019
Wind Power 1.35 1.35 2010
Air Energy-Kitka 32.40 32.40 2018
PV LedLight Technology 0.10 0.10 2015
PV ONIX SPA 0.50 0.50 2016
PV Birra Peja 3.00 3.00 2018
PV Frigo Food Kosova 3.00 3.00 2018
PV Eling 0.40 0.40 2019
PV SGE 3.00 3.00 2019
Total RES (in the support scheme) 93.77 93.77
Total 1,430.82 1,098.86
Manufacturing unitsUnit Capacity (MW) Entry into
operation

ANNUAL REPORT 2019
77
production is about 100.4%. Production including own expenditures by units and months during 2019
is presented in Table 6.6.
Tab. 6.6 Electricity flows in the system in 2019
It should be emphasized that 11.82% of the electricity from the gross production of power plants is
consumed by the power plants themselves as own costs. Part of this consumption (for both
generators TPP Kosova A and TPP Kosova B) is realized directly from the plants, while the rest is
exported into the transmission system and then consumed by the power plants.
The figure below presents the participation of generators in the overall electricity generation in 2019.
Fig. 6.4 Production of generating units in 2019
The production of RES connected to the transmission network in 2019 was 246.1 GWh and is higher
by 0.4% compared to 2018 year. While the production of RES connected to the distribution network
Generation
MWhTotal Jan Feb Mar Apr May Jun Jul Aug Sep Oct Nov Dec
PP A3 gross 480,607 53,486 99,208 92,632 0 0 0 0 0 38,339 53,890 62,209 80,844
PP A4 gross 902,513 48,481 2,178 106,821 76,224 69,197 102,018 109,452 104,914 84,429 89,860 95,680 13,258
PP A5 gross 983,352 103,544 85,548 20,014 108,590 108,656 58,449 111,611 89,490 106,738 55,234 25,310 110,166
PP A Own consump. 288,186 26,756 24,590 26,144 22,456 21,909 18,890 25,449 23,252 27,887 23,585 22,061 25,207
PP A threshold 2,078,286 178,755 162,344 193,323 162,358 155,944 141,578 195,615 171,152 201,620 175,398 161,138 179,061
PP B1 gross 2,197,730 213,445 193,807 213,132 146,196 217,275 194,766 199,422 211,817 41,276 207,255 191,527 167,811
PP B2 gross 1,478,370 207,993 168,232 193,618 100,464 0 0 0 31,673 208,940 175,010 196,105 196,335
PP B Own consump. 350,632 39,080 39,930 37,739 24,010 19,735 18,523 18,687 22,587 22,757 36,042 36,515 35,029
PP B threshold 3,325,468 382,358 322,109 369,011 222,650 197,540 176,243 180,736 220,903 227,459 346,223 351,117 329,118
HPP+RES Transmission246,088 15,657 18,842 21,596 25,954 29,632 23,395 17,842 18,277 17,989 9,821 25,448 21,633
RES Distribution 67,965 1,540 3,430 5,774 8,759 12,388 12,259 5,613 3,184 2,150 2,087 4,153 6,629
Total 5,717,806 578,309 506,725 589,704 419,722 395,503 353,476 399,806 413,516 449,218 533,530 541,856 536,442
Balance 2019 5,696,334 564,230 515,533 603,493 406,245 338,507 369,308 372,847 381,574 550,125 533,300 503,277 557,895
Report tot./bil 100.4% 102.5% 98.3% 97.7% 103.3% 116.8% 95.7% 107.2% 108.4% 81.7% 100.0% 107.7% 96.2%
0
100
200
300
400
500
600
700
Jan Feb Mar Apr May Jun Jul Aug Sep Oct Nov Dec
GWh Share of the power plants in total generation2019
PP A threshold PP B threshold HPP+RES Transmission RES Distribution

ANNUAL REPORT 2019
78
was 67.9 GWh in 2019, and is higher compared to 2018 by 16.8%, since two photovoltaic generators
and three hydro-generators with a total capacity of 22.08 MW have been put into operation.
The following tables present electricity generation from RES connected to the transmission network,
respectively to the distribution network.
Tab. 6.7 Generation from RES connected to the transmission network in 2019
Tab. 6.8 Generation from RES connected to the distribution network in 2019
Operation of generating units
The operation of generating units of TPP Kosova A and TPP Kosova B, during 2019 has been close to
the forecasts in the energy balance. The largest share in the total production is from TPP Kosova A
and TPP Kosovo B, which have also realized a generation close to the forecasts in the energy balance,
and have had high availability at work by completing the hours in operation, approximately according
to the forecast in the balance sheet.
RES in transmissionInstalled
capacityGeneration
Share in
generation*
MW MWh %
HPP Ujmani 35.00 82,891 33.68
HPP Kaskada Lumbardh 25.95 72,661 29.53
Air Energy/Kitka 32.40 90,535 36.79
Total RES 93.35 246,088 100%
* The share of generating units in the production of RES in transmission
Installation
capacityGeneration
Share in
generation*
MW MWh %
Hydroline 4.27 8,150 11.99
Dikanci 4.02 8,413 12.38
Radavci 1.00 3,464 5.10
Burimi 0.95 1,197 1.76
Eurokos-JH 4.80 23,292 34.27
HPP Brezovica 2.10 3,673 5.40
HPP Orqusha 4.00 4,047 5.95
HPP Lepenci 3 9.99 5,135 7.55
Me ere 1.35 113 0.17
Solar-C 0.10 118 0.17
Solar-Feti 0.10 92 0.13
Solar Onix 0.50 685 1.01
Solar Birra Peja 3.00 4,130 6.08
Solar Frigo Food 3.00 4,128 6.07
Centrali solar"Eling" 0.40 537 0.79
Centrali Solar Green Energy 3.00 790 1.16
Total RES 42.58 67,965 100%
* The share of generating units in the production of RES in distribution
RES in distribution

ANNUAL REPORT 2019
79
Compared to last year, the number of declines from the operation of lignite generating units has been
smaller. The table below shows all types of discontinuations and the availability of power plants for
2019, where it is noted that the generating units TPP Kosova A3 and TPP Kosova A4 have never
interrupted from the system.
Tab. 6.9 Interruptions of Generating Units 2019
The operation hours of the generating units of TPP Kosova A and TPP Kosova B in graphical form are
shown in the figure below and were lower than planned, especially for Unit B1 which worked only
87.4% of the year, whereas Unit B2 worked around 60.2% of the year.
Pic. 6.5 Operation of Generation Units in 2019
The figure below presents the production of generating units for the period 2009 – 2019.
A3 A4 A5 B1 B2
Planned interruptions 3 3 3 2 1
Unplanned interruptions 4 5 1 8 7
Failures 0 0 2 2 7
Total interruptions 7 8 6 12 15
Working hours 3,271 6,262 6,802 7,652 5,275
2019PP Kosova A PP Kosova B
3,271
6,262
6,802
7,652
5,275
0
1,000
2,000
3,000
4,000
5,000
6,000
7,000
8,000
9,000
A3 A4 A5 B1 B2
Operation of generating units 2019time

ANNUAL REPORT 2019
80
Fig. 6.6 Electricity generation 2009 – 2019
6.4 Transmission System
Kosovo transmission system is operated by KOSTT, who is responsible for the safety and reliability
of energy system operation. The transmission network has sufficient capacity to withstand the power
flows in the system.
The transmission network of the Kosovo power system is well connected to the regional and
European system through interconnection lines with:
Albania, Macedonia, Montenegro and Serbia – line 400 kV;
Albania and Serbia – line 220 kV; and
Serbia – with two lines 110 kV.
Interconnection line 400 kV SS Kosova B - SS Kashar (Tirana) was finalized in 2016 including successful
testing phase, but due to political reasons has not started the regular operation yet.
The agreement signed for secondary regulating frequency/power between KOSTT and OST in Albania
also remains unimplemented since KOSTT has not yet begun to operate as a regulatory area/block
within ENTSO-E.
Transmission network of Kosovo energy system is well-connected to the regional system and meets
the domestic transmission needs and criterion N-1, except the line Prizren 2 – Rahovec, which
remains with radial supply.
The transformation capacities and transmission network lines by voltage level are shown in the
following tables:
1,1971,424
1,6851,922
1,840 1,907
1,432
1,8042,033
1,827 1,967 2,078
3,254 3,252 3,1953,140
3,378
3,812
3,310
3,5573,568
3,2943,041 3,325
76 122158 105 96
143 102 142 235 179 303 314
4,527
4,7985,037 5,167
5,314
5,862
4,844
5,5035,835
5,300 5,3115,718
0
1,000
2,000
3,000
4,000
5,000
6,000
7,000
2008 2009 2010 2011 2012 2013 2014 2015 2016 2017 2018 2019
GWh Production by generators for years 2008 - 2019
PP Kosova A PP Kosova B HPP and RES Total production
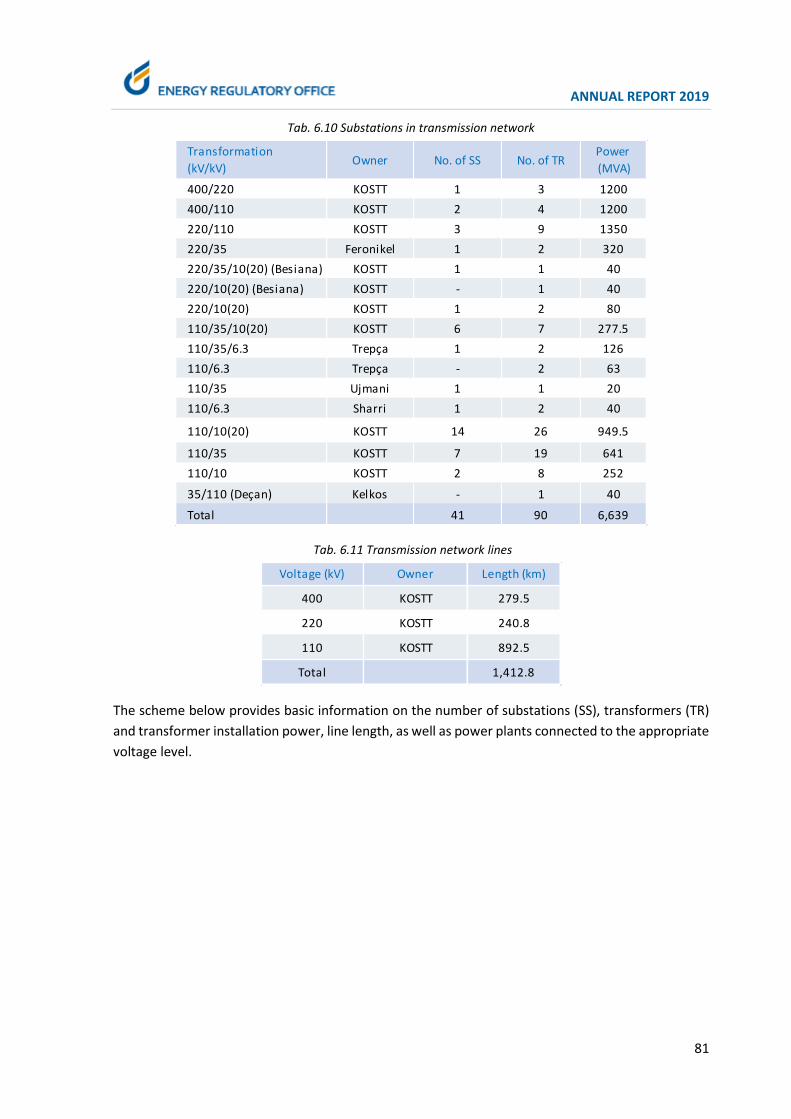
ANNUAL REPORT 2019
81
Tab. 6.10 Substations in transmission network
Tab. 6.11 Transmission network lines
The scheme below provides basic information on the number of substations (SS), transformers (TR)
and transformer installation power, line length, as well as power plants connected to the appropriate
voltage level.
Transformation
(kV/kV)Owner No. of SS No. of TR
Power
(MVA)
400/220 KOSTT 1 3 1200
400/110 KOSTT 2 4 1200
220/110 KOSTT 3 9 1350
220/35 Feronikel 1 2 320
220/35/10(20) (Besiana) KOSTT 1 1 40
220/10(20) (Besiana) KOSTT - 1 40
220/10(20) KOSTT 1 2 80
110/35/10(20) KOSTT 6 7 277.5
110/35/6.3 Trepça 1 2 126
110/6.3 Trepça - 2 63
110/35 Ujmani 1 1 20
110/6.3 Sharri 1 2 40
110/10(20) KOSTT 14 26 949.5
110/35 KOSTT 7 19 641
110/10 KOSTT 2 8 252
35/110 (Deçan) Kelkos - 1 40
Total 41 90 6,639
Voltage (kV) Owner Length (km)
400 KOSTT 279.5
220 KOSTT 240.8
110 KOSTT 892.5
Total 1,412.8

ANNUAL REPORT 2019
82
Fig. 6.7 Basic data of transmission network
6.4.1 Electricity flows in transmission systems
The transmission network has considerable electricity flows to cover customer demand from
domestic generation and import but also for possible exports of electricity surpluses, and also for
electricity transited towards other countries.
Electricity transit through the Kosovo network in 2019 was about 28.3% compared to the demand,
and this energy charges the network by increasing losses, depreciation of the network, and the need
to maintain the transmission network. Compensation for transit network loading is done through the
ITC Mechanism.
The following figure shows the energy flows through all interconnection lines in both directions (input,
output).
~
220 kV – 6 SS
110 kV – 32 SS
Medium voltage (35kV, 10kV and 6.3kV)
400 kV – 3 SS 279.5km
TR 3x400MVA TR 4x300MVA
TR 9x150MVA
240.8km
6 TR
480 MVA
68 TR
2,409 MVA
892.5km
4 interconnection
lines
2 interconnection
lines
2 interconnection
lines
~ ~
~
Customer
Customer

ANNUAL REPORT 2019
83
Fig. 6.8 Energy Flows through Interconnection Lines
6.4.2 Investments in transmission system
During 2019, investments were made in the transmission network to support load and generation.
Below are the main projects divided into:
Projects completed in 2019 which have one-year valid warranty period
In Q3 of 2016 year, contracts were signed for projects, financed by EBRD / KOSTT and which were
completed during 2019. These projects are in the one-year guarantee period.
Construction of new GIS sub-stations with two 2x40MVA transformers and transmission lines
/cables:
110/10(20) kV – SS Prishtina 6 ( Dardania) and two fields 110 kV HIS in NS Prishtina 4
220/10(20) kV – SS Drenasi 2
Rahoveci
13
Theranda
Deçani
Peja 2
Peja 1
Burimi
PEJA 3Skenderaj
Gjakova1
2
Klina Feronikeli
DRENAS 1
Podujeva
Vushtrri
21
Trepça
VallaqiHC Ujmani
TC BPalaj
PRISHTINA
1
23
4
5
A
KOS B
PRIZREN
FERIZAJ 2
Bibaj
Sharr
Viti
Gjilan 5
Berivojce
Lipjan
Sistemi Transmetues i Republikës së Kosovës 2019
Linja 400 kV
Linja 220 kV
Linja 110 kV
HC
TC
NS 400/220 kV
NS 400/110 kV
NS 220/110 kV
NS 220/35/10 kVNS 110/35/10 kV
NS 110/35 kV
NS 110/10 kV
Legjenda
AL
ME
RS
NM
Tirana 2Fierza
Shkupi 5
Bujanovc
Nish 2
Krushevc
Ribarevina
N.Pazar
HC Kelkos
KS Drenasi 2
D
Ilirida
7
PE Kitka
2

ANNUAL REPORT 2019
84
110/10(20) kV – NS Mitrovica 2 (Ilirida)
Projects that are ongoing and should be completed in 2020
The continuity of works is until Q2 2020 for projects:
Line 110 kV Single OH line SS Rahoveci – SS Theranda (80% completed),
Double Line 110 kV and cable line from the point of intersection of the line TPP Kosova A –
SS Lipjan, up to SS Fushe Kosovo, (15%)
** Due to delays in obtaining construction permits, there are delays in the implementation of contract-based
projects.
Projects which had started in 2018/2019 and are ongoing, but should be completed in 2022:
Construction of connection to the city network of water and sewerage in SS Prizren 1, SS
Prizren 3, SS Lipjani, SS Viti, SS Ferizaji 1 (in continuation for other NS);
Renovation of Command Buildings in: SS Deçani, SS Lipjani, SS Burim, SS Viti, NS Prishtina 3,
SS Prizreni 3, SS Gjakova 2, SS Besiana, SS Vitia, SS Gjakova 1 (in continuation for other NS);
Supply with spare parts for tightening and hanging lines, OPGW, joint-box and other
accompanying equipment;
Supply with spare parts for sub-stations;
Execution of uninterrupted supply of secure operating infrastructure system of the real-time
transmission of SO;
Supply with digital wall monitor of QND and dismantling the existing monitor in QND;
Supply with hardware;
Supply with equipment for adoption of SCS functions;
Purchase of Software DLP and of Database Audit Software.
These projects are funded by KOSTT.
6.4.3 Maximum Load and Electricity Demand in Power System
In order to analyze the functioning of the power system, the value of maximum load (peak) is also
important, and this usually takes as a sample five (5) maximum loads realized in different hours and
different days of the year. The following table shows the maximum load (peak) values for 2019.
Tab. 6.12 Energy Flows through Interconnection Lines 2019
Maximum load Pmax
(MW)Date Time
1,253 12/31/2019 18:00
1,193 12/29/2019 18:00
1,178 1/8/2019 18:00
1,177 1/4/2019 18:00
1,138 1/14/2019 18:00

ANNUAL REPORT 2019
85
The maximum load in the Kosovo power system was recorded at 31 December 2019 at 18:00 in the
amount of 1,253 MW, which is higher than the maximum load in 2018 year (1,203 MW).
The demand varies in daily and seasonal periods, and due to this change, balancing the system is
hampered. To see this impact, especially in the case of Kosovo power system, it is important to
analyse the daily consumption chart for each hour of the day for the entire annual period.
The below chart shows the demand and generation, which shows that the generation is higher than
the demand during night hours, whereas during the day, especially at evening hours, demand has a
significant increase and is higher than generation. So, within the same day, in the daylight hours (high
tariff) generation does not cover the demand and electricity needs to be imported, while at night (low
tariff) there is surplus of energy that should be exported.
Fig. 6.9 Daily diagram as annual average for hours per 2019
The difference between the average of maximum and minimum daily consumption, during the
months of 2019 is shown in the chart below.
643
553
502474 462 473
527
628
727787 797 785
762 749 739 741 765788 798 810 802 792 783
737
-200
-100
0
100
200
300
400
500
600
700
800
900
1000
1 2 3 4 5 6 7 8 9 10 11 12 13 14 15 16 17 18 19 20 21 22 23 24
Production Consumption Exchange
Production, consumption and exchange in 2019 - average per hourMWh/h

ANNUAL REPORT 2019
86
Fig. 6.10 Monthly average demand and maximum / minimum daily loads 2019
The difference between production and total demand can be seen in the following diagrams both on
daily and seasonal basis. The diagrams show the characteristic months January - winter season and
July - summer season. As well, from the diagrams is seen that every day there are imports and exports
of electricity with the regional system, depending on local production and consumption.
Consumption fluctuations are on a daily basis, while there are also differences between demand in
the winter-summer season, the average maximum above 1000 MWh / h in January, and between
600-700 MWh / h in July.
Fig. 6.11 Realization of hours of finding, consumption and exchange, January 2019
0
80
160
240
320
400
480
560
640
720
800
0
120
240
360
480
600
720
840
960
1080
1200
1 2 3 4 5 6 7 8 9 10 11 12
Maximum/minimum and monthly demand-2019
Demand Max Min
MWh/h GWh
-400
-300
-200
-100
0
100
200
300
400
500
600
700
800
900
1000
1100
1200
1 97 193 289 385 481 577 673
Generation Consumption Exchange
744
MWh Generation, consumption and exchange january -2019

ANNUAL REPORT 2019
87
Fig. 6.12 Real-time production, consumption and exchange, July 2019
Shortages due to lack of electricity
Despite the efforts to eliminate supply outages due to power shortages, electricity reductions have
been made over the years. At the end of 2018, ERO Board issued a decision to ban reductions for lack
of energy, except in cases when the facilities are endangered, therefore in 2019 there were no
reductions for lack of electricity.
The table below shows the monthly electricity outages over the years.
Fig. 6.13 Consumption reductions over the years 2009 - 2019
6.4.4 Electricity Demand and Transmission System Losses
The total electricity demand in 2019 was 6,001 GWh and represents a considerable decrease of 5.8 % compared to 2018, which was 5,671 GWh, while compared to the forecast of electricity balance for 2019, the electricity demand is 1.19 % lower.
-400
-300
-200
-100
0
100
200
300
400
500
600
700
800
900
1000
1100
1200
1 97 193 289 385 481 577 673
Generation Consumption Exchange
744
MWh Generation, consumption and exchange july -2019
431
205
333
154
53
8767
21 23 160
0
50
100
150
200
250
300
350
400
450
500
2009 2010 2011 2012 2013 2014 2015 2016 2017 2018 2019
GWh Electricity reductions over the years 2009-2019

ANNUAL REPORT 2019
88
Table 6.13 shows the total demand and transmission losses realized in 2019 and compared to
electricity balance 2019.
Tab. 6.13 Overall demand and losses in the transmission system in 2019
The electricity demand has been steadily rising until 2011, whereas starting from 2011 the demand
is stabilized, with small fluctuations from year to year, and in the last year an increase is noticed that
can be seen in the following figure.
Fig. 6.14 Overall demand in the power system 2009-2019
The total electricity demand is divided into the consumption of customers connected to the
transmission network, consumption in the distribution system (including losses), own-consumption
Gross demand
Real ization
Gross demand
Balance
Real is ./Balance
Ratio
MWh MWh % MWh % MWh %
January 696,427 669,672 104.00 13,753 1.97 12,675 1.89
February 556,085 594,769 93.50 9,791 1.76 11,127 1.87
March 549,544 550,690 99.79 10,450 1.90 13,036 2.37
Apri l 479,939 478,081 100.39 8,473 1.77 8,068 1.69
May 464,029 424,842 109.22 6,910 1.49 7,146 1.68
June 388,948 403,144 96.48 6,225 1.60 7,276 1.80
July 416,678 430,868 96.71 6,337 1.52 7,935 1.84
August 429,125 444,789 96.48 6,688 1.56 8,388 1.89
September 389,873 416,327 93.65 6,239 1.60 11,101 2.67
October 456,911 478,523 95.48 8,103 1.77 10,682 2.23
November 504,932 548,713 92.02 9,175 1.82 11,017 2.01
December 668,711 632,886 105.66 13,345 2.00 12,242 1.93
Total 6,001,202 6,073,305 98.81 105,489 1.76 120,692 1.99
2019
Losses in transmiss ion
real isation
Losses in Transmis ion
Balance
4,9445,275
5,506 5,584 5,467 5,520 5,3995,570
5,3425,686 5,671
6,001
0
700
1400
2100
2800
3500
4200
4900
5600
6300
7000
2008 2009 2010 2011 2012 2013 2014 2015 2016 2017 2018 2019
Electricity demand in power system 2008-2019GWh

ANNUAL REPORT 2019
89
for generation plant needs, and transmission losses, as shown in the table below divided by categories
for 2019.
Tab. 6.14 The demand by categories and energy losses
*Electricity received in distribution from transmission + generation in distribution
The value of electricity for own expenses in 2019, received from the transmission network is 108 GWh
for generators of TPP Kosova A and 27 GWh for TPP Kosova B, or a total of 135 GWh.
Electricity demand varies according to the consumption period, but also according to customer
categories and this is shown in the following table, including the losses in the transmission and
distribution network (technical and commercial losses).
Tab. 6.15 Share of different categories in the overall demand 2019
Table 6.16 shows the change of demand by months. In some categories this change is quite high, such
as household consumption and commercial losses that are higher in the winter season, which is
mainly due to the consumption of electricity for heating.
Losses in the transmission system, which a considerable period (2011-2019) are at an acceptable level
owing to investments made by KOSTT. Losses in the Kosovo transmission network are approximately
the same as the losses in transmission networks in the region and Europe. Figure 6.15 shows the
share of losses in the transmission network towards the overall demand of the Kosovo power system.
Total
MWh
Gross consumption in distribution* 5,321,999
Ferronikeli 371,177
Trepça + Sharrcemi 92,933
KEK internal consumption 109,604
Losses in transmission 105,489
Total demand 6,001,202
KEK own consumption from transmission 135,411
Electricity demand 2018
2019/GWh Total Jan Feb Mar Apr May Jun Jul Aug Sep Oct Nov Dec
Household consumption 2,515 289.4 223.2 230.2 199.7 198.1 173.2 177.8 189.3 164.8 188.6 206.0 275.2
Commercial consumption 1,020 101.2 89.0 84.9 75.2 74.9 74.6 85.7 90.6 77.1 78.5 84.9 103.1
Industrial consumption 873 72.2 50.8 77.1 74.4 76.1 69.8 77.9 78.4 69.1 80.8 74.9 72.2
Commercial losses 694 105.0 101.1 72.7 60.7 54.2 23.4 24.2 19.5 27.6 44.2 63.4 98.0
Technical losses 684 103.6 71.8 63.4 52.2 46.4 35.2 37.2 37.2 36.0 46.7 56.7 97.1
Losses in transmission 105 13.8 9.8 10.4 8.5 6.9 6.2 6.3 6.7 6.2 8.1 9.2 13.3
KEK internal consumption 110 11.3 10.3 10.9 9.3 7.5 6.5 7.5 7.5 9.1 10.0 9.9 9.8
Total 6,001 696.4 556.1 549.5 479.9 464.0 388.9 416.7 429.1 389.9 456.9 504.9 668.7

ANNUAL REPORT 2019
90
Fig. 6.15 Share of losses in transmission network 2009-2019
The figure shows the share of losses calculated towards the domestic demand. The level of
transmission losses is affected by all the energy entered into the transmission system. Therefore, in
order to calculate the share of losses towards the transmission network load, other sources, such as
transit, as well as energy for generators own costs, should be included in addition to domestic
demand. The share of transmission losses calculated in this form is 1.25%.
According to government decision of 2012 to transfer part of the assets of the distribution system to
the transmission system, the metering point between the two networks is on the secondary side of
the transformers (35 kV or 10 kV). In SS Vallaq, KOSTT failed to place the interval meters on the
secondary side, therefore in the balancing mechanism for calculating transmission losses the values
from the interval meters located on the primary side of the transformers were obtained. According
to the measurements for imbalance (based on interval meters) the losses in the transmission network
are 105.5 GWh, while from the monthly readings on the secondary side of the transformers in SS
Vallaq the losses in the transmission network are 108.8 GWh. In the same way the energy consumed
in the north is 294.3 GWh, while according to the monthly measurements on the secondary side of
the transformers in SS Vallaq this value is 290.5 GWh.
6.5 Electricity distribution system
Distribution network consists of voltage lines of 35 kV, 10(20) kV, 6 kV and 0.4 kV and the respective
sub-stations of 35/x kV, 10(20)/0.4 kV dhe 6/0.4 kV.
Basic data of substations and lines, including capacity, transformation and length of lines of
distribution system have been presented in the tables below.
3.31%
2.38%2.06%
1.99%2.00% 2.02% 1.98%
2.25%2.07% 1.96%
1.76%
0.00%
1.00%
2.00%
3.00%
4.00%
5.00%
6.00%
7.00%
2009 2010 2011 2012 2013 2014 2015 2016 2017 2018 2019
Hu
nd
red
sLosses in transmission network against consumption

ANNUAL REPORT 2019
91
Tab. 6.16 Substations and transformers by level of voltage in DSO
Tab. 6.17 Lines in DSO
The scheme below provides basic information on the number of substations (SS), transformers (TR)
and transformer power (VA), line length, and power plants connected to the appropriate voltage
level.
Transformation
(kV/kV)Owner No. of SS No. of TR
Installed
Capacity (MVA)
35/10 KEDS 44 94 662
35/10 Private 10 14 63
35/20 KEDS 1 1 4
35/6 kV Private 5 8 43
35/0.4kV Private 17 23 22
10(20)/0.4 KEDS 2,487 2,579 1,324
10(20)/0.4 Private 2,394 2,404 1,147
10/20 KEDS 3 3 8
10/0.4 KEDS 2,865 2,865 868
10/0.4 Private 1,247 1,253 606
6(3)/0.4 KEDS 66 66 13
6/0.4 Private 1 1 1
Total 9,141 9,312 4,762
Voltage
(kV)Owner
Overhead lines
(km)
Cable network
(km)
Total
(km)
35 kV KEDS 482 131 613
10(20) kV KEDS 1,471 474 1,946
10 kV KEDS 4,165 904 5,069
6 kV KEDS 42 8 50
3 kV KEDS 4 1 5
0.4 kV KEDS 17,187 2,445 19,632
Total 23,351 3,963 27,314

ANNUAL REPORT 2019
92
Fig. 6.16 The Basic Data of Transmission Network
6.5.1 Investments in the Distribution System
Investments in the Distribution Network increase the functioning of the distribution system in order
to achieve a reliable supply of electricity, to increase the capacity of the existing network. Investments
include projects in the medium and low voltage network as well as in projects in the digitalization and
modernization of the network such as SCADA, smart PLC meters, etc.
Implementation of 2019 investments includes projects that are planned for 2019 and as a
continuation of previous years. Projects are selected by analysing the need for investment in critical
~
SS 35 kV 141 TR 615 km
SS 10(20) kV 9,369 TR 7,516 km
SS 6.3 kV 79 TR 55 km
Low voltage (0.4kV) 20,333 km
735 MVA
43 MVA
22 MVA
4,019 MVA
23 MVA
~
Customer
Customer
Customer
Customer
40 MVA 1,042MVA 103 MVA 360 MVA 1,085 MVA

ANNUAL REPORT 2019
93
areas and by evaluating them through the priority criteria to achieve the main investment targets,
such as:
• Reduction of technical and non-technical losses,
• Reliable and quality power supply,
• Increasing existing network capacity and modernizing the network.
The projects were selected by analysing the following technical criteria:
• Losses,
• Network load,
• Voltage drops,
• No. of interruptions,
• Energy demand,
• Consumption increase,
• Network obsolescence,
• Number of customers.
Medium voltage projects in 2019 have been implemented mainly in the areas of Ferizaj, Fushe Kosove
and Dragash to solve the problems of rapid growth of consumption, overloading of the network and
improvement of technical parameters.
Reinforcement projects in the low voltage network have been implemented in Podujeva, Drenas,
Pristina, Decan, Gjakova and Mitrovica.
The 2019 investment projects are presented in two parts, as "Projects within the scope of past years
completed in 2019" and "Investment projects planned for 2019".
Projects within the scope of past years completed in 2019
Investments in 10 kV exits
The project: Hogoshti (Planned year: 2018)
The 10 kV exit Hogosht is supplied by SS Berivojca and is the longest exit in Kosovo. In this case,
the exit was divided into two other exits and 1968 customers benefited from this investment.
The project was completed in 2019.
The project: Zahaqi - Kastrati (Planned year: 2018)
Many businesses are supplied at Zahaqi exits. By this investment, the load from the Kastrati exit
is discharged, as one of its branches will be supplied by Zahaqi. Fusha e Pejes exit is also
connected to Zahaq. 1913 customers benefited from this investment, which was completed in
2019.
The project: Fushë Kosova 2 - Apollonia (Planned year: 2018)
Investments in Fushe Kosovo 2 and Apollonia exits discharge the Apollonia exit , whose load is
increasing. 971 customers benefited from this investment, which project was completed in 2019.
The project: Plemetin - Fidanishte (Planned year: 2018)
Investments in Plemetin and Fidanishte exits discharge Plemetin, Lum i Madh, Shkabaj and Palaj
exits and customers from the exits of Plemetin, Lum i Madh, Shkabaj and Palaj are benefitting
with a total number of 2476 customers. The project was completed in 2019.
Conversion of exits at 20 kV level

ANNUAL REPORT 2019
94
Since 2017, the DSO (Distribution System Operator) has started converting 10 kV exits to 20 kV
voltage level. The projects that continued during 2019 are presented as follows.
The project: Breznica (Planned year: 2017)
Investments in this exit started in 2018, while the increasing voltage transformer and energizing
at the voltage level of 20 kV was made in 2019. 576 customers benefit from this project.
The project: Drenica (Planned year: 2017)
Drenica exit has been selected as a pilot project for conversion to the 20kV voltage level, and
about 2611 customers benefit from this investment. The entire investment was completed in
2018, but the energy exit of the 20 kV voltage level was finalized in 2019.
The project: Runik (Planned year: 2018)
Investments in Runiku exit in Skenderaj are done in the transformation from the 10kV level to
20kV one. The implementation and energizing of the project continued in 2019 and it will be
completed in 2020. 1772 customers will benefit from this project.
Low voltage network reinforcement projects
A number of low voltage reinforcement projects have been carried over from previous years to 2019.
Due to some obstacles from 2015 to 2018, 92 projects have been transferred to 2019.
Investment projects planned in 2019
Investments in the medium voltage network (MV)
The project: New 35 kV line from SS-Zhur 35/10 kV to SS-Dragash 35/10 kV (Planned year: 2019)
As part of the emergency projects, a 35 kV line has been built from SS-Zhur 35/10 kV to SS-
Dragash 35/10 kV. The implementation of the project started in March 2019 and was completed
in August 2019.
The project: Investment in 35 kV and 20 kV network in Fushe Kosovo (Planned year: 2019)
Also, within the emergency projects, new 35 kV lines and two new 35/20 kV substations have
been built in the city centre. 10 kV exits are planned to be converted to 20 kV voltage level, using
a ring topology between the substations. 15,134 customers will benefit from this project. The 35
kV and 20 kV projects are expected to be completed in the first quarter of 2020.
The project: Investment in 35kV and 10 kV network in Ferizaj (Planned year: 2019)
The new 35 kV lines are planned between HV/MV and MV/MV substations, in the framework of
emergency investments, thus creating a ring topology in the 35 kV network. The total number of
customers who will benefit from the investment is 23,283. The 35 kV and 10 kV projects are
expected to be completed in the first quarter of 2020.
Investments in low voltage network
The low voltage investments in the 2019 Investment Plan have been realized in the regions of
Podujeva, Drenas, Prishtina, Deçan, Gjakova and Mitrovica. The total number of projects in the LV
network is 114.
Investments made in low voltage projects include:
• New transformers in areas in need of investment,

ANNUAL REPORT 2019
95
• Replacing existing transformers with new ones to increase capacity,
• Rehabilitation of low voltage network,
• Reinforcement of the medium voltage network within the scope of LV projects, in accordance
with the future MV outage plans,
• Placement of MMOs, which means placing meters outside to columns or landmarks,
• Connecting customers to outside-the-house meters.
In conclusion, for all investments of 2019, including investments carried and planned in 2019, in the MV and LV network, the following materials are spent:
• Transformers - 102 pieces,
• Pillars - 9,240 pieces,
• Meter boxes - 9,232 pieces,
• Distribution panel - 128 pieces,
• Stands - 21 pieces,
• Chambers - 191 pieces,
• Cable - 1,326,656 m,
• Conductors - 309,999 m,
• Cable heads - 2.570 pieces.
Maintenance and rehabilitation of MV and LV network
Maintenance and rehabilitation of MV and LV was one of the main operations implemented during 2019, as presented below:
• Replacement of MV and LV pillars,
• Cleaning the route of the MV and LV network as a preventive measure in creating working
conditions for the lines without being affected by external factors such as tree branches, etc.
• Replacement of conductors and their tightening, replacement of insulators, overvoltage
dischargers, consoles and any other elements that may become a source of breakdown,
• Displacement of 10 kV and 0.4 kV lines in order to maintain and adjust the breakdowns as
easily as possible,
• Reinforcement of basements of transformer pillars, metal construction pillars,
• Adjustment of transformers, their metal construction,
• Replacement of damaged transformers.
During 2019, a total of 204 lines 0.4, 10 (20) and 35 kV with a length of 319 were cleared of vegetation. 69 km.
Implementation of PLC Projects
To reduce commercial and technical losses during 2019, 73 PLC projects have been implemented in seven districts, where 5,028 customers have been affected.
Implementation of projects related to voltage drops on 0.4 kV level.
During 2019, a total of 168 projects were implemented that have voltage drops at 10 (20) and 0.4 kV levels and that have affected 4,886 customers. Numerous materials have been used, such as conductors, cables, connectors, hubs, switches, poles, and 74 transformers.
• Cable connectors – 1,555 pieces,
• Trunk bases - 5,471 pieces,
• Cable heads - 602 pieces,
• Cable - 166,868 m,

ANNUAL REPORT 2019
96
• Distribution panels - 7 pieces,
• Conductors - 17,409 kg,
• Chambers - 41 pieces,
• Dividers - 39 pieces,
• Insulators - 5,408 pieces,
• Shells - 5,085 pieces,
• LV switches - 73 pieces,
• LV panels - 106 pieces,
• Meter boxes - 1,244 pieces,
• Pillars - 2,231 pieces,
• Overvoltage dischargers - 461 pieces,
• Transformers - 74 pieces.
Investments at the metering point
The DSO has invested in the installation of new meters, replacing the mechanical meters by digital meters, with the ability to read remotely. During 2019, the following meters have been invested:
• 2,922 meters with direct measurement with GSM GPRS communication,
• 18,078 meters with direct measurement with PLC,
• 196 meters with semi-indirect and indirect measurements, of which 148 are new meters and
48 replaced meters,
• 10,039 mechanical meters that have been replaced by digital ones,
• 25,972 meters dedicated to new connections.
Investments in SCADA
The SCADA project is planned to be implemented in three phases. The first and second phases of the project have already been completed, while the third phase is expected to be completed by the end of 2020, as shown below:
• Monitoring and control of 21 SS is carried out during the first stage of the SCADA project;
• Monitoring and control of 19 SS is carried out during the second stage of the SCADA project;
• SCADA Main Control Centre and servers have been completed in 2018;
• The integration of DMS/OMS/Call Centre/GIS/CIS is ongoing;
• The third phase of the SCADA project will begin soon and is scheduled to be completed by
the end of 2020.
6.5.2 Consumption and distribution losses
DSO is organized into seven districts: Pristine, Mitrovica, Peja, Gjakova, Prizren, Ferizaj and Gjilan.
Data on consumption, technical and commercial losses as well as other data are calculated by
districts and months of the year.
The highest consumption was realized in Pristina district with 32% of the total consumption in
distribution, while the lowest consumption is in the district of Gjilan with 8.4 % of the total
consumption.

ANNUAL REPORT 2019
97
Energy flows in Distribution, by districts, including electricity losses, are presented in Table 6.18. Data
on the Mitrovica district also include consumption in the north, which is considered in the category
of commercial losses.
Tab. 6.18 Consumption and Distribution losses by districts in 2019
Table 6.19 presents the demand (load), billed energy as well as technical and commercial losses by
months.
Tab. 6.19 Consumption and Distribution Losses in 2019
The technical losses, according to the data sent by the DSO, amount to 12.84 %, The old age of the
network has a high impact on these losses, as well as the length of the lines, the quality and type of
conductors and transformers, the loading of the equipment as well as their maintenance
Commercial losses are quite high, accounting for 7.51 % of total demand in distribution, however
the unbilled energy in the northern part of Kosovo must be added as well, which represents 5.53 %
(294 GWh) of the total demand in distribution. Therefore, non-technical losses are 13.04 %.
The total losses in the distribution system are metered and represent the difference between the
energy entering the distribution system and the billed energy. Since technical and commercial
Load in
dis tricts
Bi l led
electrici ty
MWh MWh MWh % MWh % MWh %
Prishtina 1,688,271 1,319,059 212,889 12.61 156,323 9.26 369,211 21.87
Mitrovica 774,088 334,388 72,307 9.34 367,393 47.46 439,700 56.80
Peja 579,057 430,467 80,834 13.96 67,757 11.70 148,591 25.66
Gjakova 469,995 364,637 79,406 16.89 25,953 5.52 105,358 22.42
Prizreni 670,820 541,162 91,756 13.68 37,903 5.65 129,658 19.33
Feriza ji 692,440 567,867 95,266 13.76 29,307 4.23 124,573 17.99
Gji lani 447,328 386,736 51,052 11.41 9,541 2.13 60,592 13.55
Total 5,321,999 3,944,315 683,508 12.84 694,177 13.04 1,377,684 25.89
DistrictsTechnical losses Commercia l losses Total losses
Charge Billed energy
MWh MWh MWh % MWh % MWh %
January 633,129 424,555 103,560 16.36 105,014 16.59 208,574 32.94
February 515,867 342,900 71,823 13.92 101,144 19.61 172,967 33.53
March 485,515 349,400 63,438 13.07 72,677 14.97 136,115 28.04
Apri l 420,106 307,209 52,167 12.42 60,729 14.46 112,896 26.87
May 406,102 305,499 46,374 11.42 54,229 13.35 100,604 24.77
June 337,905 279,250 35,216 10.42 23,438 6.94 58,654 17.36
July 359,745 298,249 37,250 10.35 24,246 6.74 61,495 17.09
August 371,582 314,905 37,176 10.00 19,501 5.25 56,677 15.25
September 338,372 274,750 35,986 10.64 27,637 8.17 63,623 18.80
October 392,928 302,010 46,739 11.90 44,179 11.24 90,918 23.14
November 446,781 326,684 56,675 12.69 63,421 14.20 120,097 26.88
December 613,968 418,903 97,103 15.82 97,962 15.96 195,065 31.77
Total rea l ised 5,321,999 3,944,315 683,508 12.84 694,177 13.04 1,377,684 25.89
Total ba lance 5,158,260 3,740,590 537,204 10.41 880,466 17.07 1,417,670 27.48
Commercial lossesMonth
Technical losses Total losses

ANNUAL REPORT 2019
98
losses cannot be measured separately, the allocation of these losses is carried out by calculating the
technical losses through the respective software, while commercial losses are further calculated as
the difference between total and technical losses.
Electricity demand in distribution in 2019 was realized in an amount of 5,322 GWh, whereas in 2018
it was 5,120 GWh, which represents an increase of approximately 3.94 %
Consumption in the distribution system is constantly increasing, as is the overall demand, and this
increase is shown in Figure 6.17, which presents the data from 2009 to 2019.
Fig. 6.17 Electricity Demand in Distribution System 2009-2019
Despite investments realized so far in the distribution network, electricity losses remain high and
represent a concerning problem for the electricity sector. Losses also have a negative impact on
customer supply and financial sustainability of supply and distribution operators as well as the
entire energy sector.
The reduction of commercial losses also has a positive impact on the reduction of consumption,
thus reducing the network load and technical losses.
The cost of electricity losses up to the level determined by the Regulator is covered by the
customer’s tariff. The Distribution System Operator makes continuous efforts to reduce distribution
losses, however despite the reduction of losses over the years, the DSO has failed to meet the targets
set by the Regulator, which means that the cost of the part which exceeds these targets is
borne by the DSO itself.
Below is a chart showing the technical, commercial and total losses from 2009 to 2019, showing the
trend of loss reduction as well as fluctuations in the level of technical and commercial losses.
4,133
4,4284,559
4,682 4,768 4,7944,555
4,6774,807
4,997 5,120
5,322
0
600
1,200
1,800
2,400
3,000
3,600
4,200
4,800
5,400
6,000
2008 2009 2010 2011 2012 2013 2014 2015 2016 2017 2018 2019
GWh Electricity demand in distribution network 2008-2019

ANNUAL REPORT 2019
99
Fig. 6.18 Technical and commercial losses in distribution for the period 2009-2019
Overall, electricity losses in DSO have decreased from 27.9% in 2018 to 25.9% in distribution demand.
6.6 Electricity Supply
The electricity supply is related to the sale of electricity to final customers and includes the supply of
customers with the right to universal service and unregulated customers.
Electricity supply during 2019 is provided by the supplier bearing the universal service obligation,
who has supplied customers at regulated process and customers with deregulated prices, for
which a special account has been kept.
Participation of household consumption in the overall billed distribution consumption is still
dominant - about 57.06 %, followed by commercial consumption by 22.48%, followed by industrial
consumption by 19.81%, and finally by public lighting consumption by 0.65%. Gross demand
increased by 5.83%, consumption of household customers increased by about 5.97%, consumption
of commercial customers also increased by 7.7% and consumption in industry increased by 24.01%
compared to last year.
In the figure below is presented in percentage share of consumption categories compared with total
consumption (shown with and without losses).
17.1% 18.1% 17.2% 16.8% 16.3% 16.0% 15.6% 15.4%13.0% 12.3% 13.2% 12.8%
25.8% 24.8% 24.0%
21.4% 20.4% 19.5%17.9%
16.4% 16.7% 17.0%14.7%
13.0%
42.8% 42.8%41.2%
38.1%36.7%
35.5%33.5%
31.8%29.7% 29.3%
27.9%25.9%
0%
6%
12%
18%
24%
30%
36%
42%
48%
54%
60%
2008 2009 2010 2011 2012 2013 2014 2015 2016 2017 2018 2019
Losses in the distribution network 2008-2019
Technical losses Commercial losses Total losses in DSO

ANNUAL REPORT 2019
100
Fig. 6.19 Participation of customer categories - with and without losses 2019
6.6.1 Billing and collection
The energy billed in the distribution system in 2019 was 3,944 GWh and represents about 74.1% to
the load of the distribution system, which compared to 2018 is higher by 2.03 percentage points.
Table 6.20 presents the billing, energy collection and gross collection of distribution as well as the
ratio between billing and energy collection by months for 2019, which shows that in a few months
this ratio is higher than the value of 100%, which means that in these months the electricity billed for
the previous months has been collected.
Tab. 6.20 Billing and collection by months in distribution for 2019
The electricity billed and collected (gross) in distribution as well as the ratio between billing and gross
collection from 2009 to 2019 is presented in the following figure.
Family41.91%
Industrial14.55%
Commercial16.51%
Public lightning
0.48%
KEDS losses22.96%
KOSTT losses1.76%
KEK internal consumption
1.83%
Share of consumption and losses in %
Family57.06%
Industrial19.81%
Commercial22.48%
Public lightning
0.65%
Billed electricity by category
Load Realisation Bill ingCollection for
energy
Gross
collectionColl./Bill.
MWh MWh € € € %
January 633,129 424,555 28,430,862 24,437,335 25,192,853 86.0%
February 515,867 342,900 23,600,410 23,703,165 24,406,514 100.4%
March 485,515 349,400 24,266,194 23,947,375 24,797,457 98.7%
April 420,106 307,209 21,699,458 22,330,858 23,035,833 102.9%
May 406,102 305,499 21,564,261 26,613,326 27,462,796 123.4%
June 337,905 279,250 20,146,707 19,065,438 19,768,969 94.6%
July 359,745 298,249 21,681,433 20,712,256 21,534,596 95.5%
August 371,582 314,905 22,881,862 22,465,745 23,329,739 98.2%
September 338,372 274,750 20,204,952 20,695,328 21,503,833 102.4%
October 392,928 302,010 21,643,358 20,359,614 21,161,936 94.1%
November 446,781 326,684 23,194,877 20,368,900 21,179,043 87.8%
December 613,968 418,903 28,892,444 22,214,341 23,347,856 76.9%
Total 5,321,999 3,944,315 278,206,817 266,913,681 276,721,423 95.94%
Distribution 2019

ANNUAL REPORT 2019
101
Fig. 6.20. Distribution billing and collection over the years 2009-2019
The level of collection only for energy in distribution was 95.94%, while the gross collection towards
distribution billing for 2019 was 99.47%, while when counting the customers connected to the
transmission network in which the collection is 100%, then the overall collection reaches 99.51%.
Consumption categorized by voltage level and customer groups that use electricity, for 2019 is given
in Table 6.21.
Tab. 6.20 Electricity billed according to tariff categories 2019
The electricity billed in the transmission system and in the distribution system in 2019 was 4,518
GWh, which in monetary terms (including VAT) is 306.0 mil €, while the gross collection is 304.5 mil€.
16
5
17
8
17
5
18
8 20
8
22
2
22
6 24
7
24
7 27
0
26
4 27
8
11
9
14
2 15
2 16
9 18
5 19
2
21
4 23
3
23
9
26
8 26
1 27
7
71.87
79.70
86.8789.68 88.77
86.67
94.94 94.4196.85
99.0198.85 99.47
0
20
40
60
80
100
120
0
50
100
150
200
250
300
2008 2009 2010 2011 2012 2013 2014 2015 2016 2017 2018 2019
Bill ing and collection in distribution 2009 - 2019
Billing Collection Coll./Bill.
€*[mil] %
Categories
(MWh)Total Jan Feb Mar Apr May Jun Jul Aug Sep Oct Nov Dec
220 kV 371,177 34,029 12,911 34,482 34,090 35,554 31,857 35,538 35,318 27,986 35,001 30,701 23,709
110 kV (Trepça) 20,592 1,758 1,724 2,002 1,747 1,735 1,675 1,495 1,540 1,550 1,789 1,584 1,993
110 kV (Sharrcem) 72,341 2,504 5,443 6,240 6,187 6,221 4,758 6,042 6,455 6,661 9,131 6,824 5,875
35 kV 47,011 3,555 3,345 3,995 3,905 3,826 3,885 4,204 4,136 3,851 4,088 4,006 4,215
10 kV 362,320 30,350 27,339 30,401 28,423 28,725 27,601 30,573 30,919 29,008 30,828 31,795 36,359
Household 2,515,348 289,413 223,193 230,154 199,655 198,094 173,171 177,799 189,279 164,782 188,590 206,032 275,186
0.4 kV I 392,798 36,798 33,729 31,019 29,357 29,661 29,858 34,771 35,226 30,237 32,296 32,613 37,234
0.4 kV II 598,291 61,774 53,003 51,586 43,745 43,227 43,028 49,017 53,291 44,647 43,515 49,195 62,264
Public lightning 28,546 2,665 2,291 2,246 2,125 1,965 1,708 1,886 2,055 2,224 2,691 3,044 3,645
Total billed 4,408,424 462,847 362,978 392,124 349,233 349,009 317,541 341,324 358,218 310,947 347,930 365,793 450,480
KEK consumption 109,604 11,253 10,349 10,855 9,335 7,506 6,529 7,521 7,542 9,064 9,960 9,867 9,821
KEDS losses 1,377,684 208,574 172,967 136,115 112,896 100,604 58,654 61,495 56,677 63,623 90,918 120,097 195,065
KOSTT losses 105,489 13,753 9,791 10,450 8,473 6,910 6,225 6,337 6,688 6,239 8,103 9,175 13,345
Total 6,001,202 696,427 556,085 549,544 479,939 464,029 388,948 416,678 429,125 389,873 456,911 504,932 668,711

ANNUAL REPORT 2019
102
The following table provides billing and collection, as well as the relationship between collection
and billing.
Tab. 6.21 Billing and collection in the 2019
Below is a table with the data on the number of customers by category, billing and average consumption for
metering points by category.
Tab. 6.22 Number of customers and billing by categories for the 2019
The average price of electricity
Depending on the category of customers, the level of voltage at which customers are connected and
the use of electricity at different tariffs according to the time in which the energy is used, the average
selling price of electricity also changes. The average selling price (excluding VAT) is shown in Figure
6:21. The average selling price also varies according to districts depending on the concentration of
commercial / industrial activities that use electricity in certain periods.
For the category of household customers, the average energy price is 5.68 € cent/kWh which is
slightly higher than in 2018, while for non-household customers the average energy price is 7.33 €
cent/kWh which is slightly lower than the average price in 2018.
Load Realisation BillingGross
collectionColl./Bill.
MWh MWh € € %
Regulated customers 5,321,999 3,944,315 278,206,817 276,721,423 99.47%
Unregulated customers 573,713 573,713 27,801,482 27,801,482 100.00%
Total 5,895,713 4,518,028 306,008,300 304,522,905 99.51%
2019
Metering point
(MP)Total billed
Consumption
per MPShare
PCS MWh MWh %
220 kV (Ferronikeli) 1 371,177 371,177 8.42%
110 kV (Trepça + Sharrcemi) 2 92,933 46,467 2.11%
35 kV 35 47,011 1,343 1.07%
10 kV 390 362,320 929 8.22%
Households 517,486 2,515,348 4.86 57.06%
0.4 kV I 2,543 392,798 154 8.91%
0.4 kV II 82,912 598,291 7.22 13.57%
Public l ighting 2,307 28,546 12.37 0.65%
Total 605,676 4,408,424 420,095 100.00%
Consumption by categories 2019

ANNUAL REPORT 2019
103
Fig. 6.21 Average price of electricity sales 2019 (excluding VAT)
The figure below shows the average electricity prices for household and non-household customers
for the last ten years, prices which do not include VAT.
Fig. 6.22 Average price of electricity sales (excluding VAT) over the years
The average price without VAT for household customers is presented in the figure below for the first
six months of 2019 for some countries, issued by Eurostat, as data for the second half is still missing.
Eurostat data are categorized by consumption, and the figure shows the consumption value of 2500-
5000 kWh, which most closely corresponds to the average consumption of a Kosovar family.
5.68
8.55
5.92
9.53
6.39
2.00
3.00
4.00
5.00
6.00
7.00
8.00
9.00
10.00
11.00
12.00
Household Commercial Industrial Public lighting
€ce
nt/
kWh
The average selling price of electricityVAT excluded
4.77 4.72 4.94 5.15 5.245.64 5.71
6.045.65 5.68
5.726.20
6.99 7.21 7.357.64
7.92 7.94 7.95
7.33
0.00
1.00
2.00
3.00
4.00
5.00
6.00
7.00
8.00
9.00
10.00
2010 2011 2012 2013 2014 2015 2016 2017 2018 2019
Household and Non-Household average price 2010-2019
Household Non-Household
€ce
nt/
kWh

ANNUAL REPORT 2019
104
* EUROSTAT data source
Fig. 6.23 Average prices for household customers for the first 6 months of 2019 (excluding VAT)
6.7 Electricity Import and Export
The electricity demand in Kosovo's power system is covered by domestic generation and imports
realized through cross-border lines.
The country's total electricity demand was covered by import at the level of 15.47 %, which
represents a decrease of about 0.9 percentage points from the previous year being about 14.55 %.
Through interconnection lines from the regional system in the electricity system of Kosovo, 2,481,130
MWh have entered, while 2,197,154 MWh have been released, where 283,977 MWh represents the
difference between entry and exit, while this is divided into net imports and deviations to the regional
system.
The table below shows the electricity flows to neighbouring interconnection lines.
Tab. 6.23 Electricity flows on interconnection lines for 2019
11.39 11.25
10.28
8.828.34 8.31
7.29
6.64
5.41 5.37
0.00
2.00
4.00
6.00
8.00
10.00
12.00
Average prices for household customers 2019€c/kWh
Band DC : 2 500 kWh < Consumption < 5 000 kWh
Received Delivered Received Delivered Received Delivered Received Delivered
Albania 279,079 195,874 279,079 195,874
Macedonia 84,457 1,400,701 84,457 1,400,701
Montenegro 600,799 362,143 600,799 362,143
Serbia 1,390,934 59,663 108,958 61,211 16,902 117,563 1,516,795 238,436
Total 2,076,191 1,822,506 388,038 257,085 16,902 117,563 2,481,130 2,197,154
Balance -253,685 -130,952 100,661 -283,977
Flow in interconnection
lines in MWh
400 kV 220 kV 110 kV Total

ANNUAL REPORT 2019
105
The import realized for 2019 was 928,492 MWh, with which the energy deficiencies were met,
especially at peak times in the winter season when the demand was unaffordable for the domestic
generation
This amount includes the electricity imported for regulated and unregulated customers, the losses
in the transmission network and losses in the distribution network, which is provided through
commercial contracts and through the exchange of energy for energy between KEK and KESH.
The total electricity imports for 2019 was about 13 percentage points lower than in 2018, which was
825,182 MWh.
Electricity imported with commercial contracts during 2019 was 894,062 MWh in the amount of €
50,132,368, with an average price of € 56.07 / MWh. Although in HUPX the average price of 2019
compared to the average price of 2018 was lower by only 0.64 € / MWh, in our country compared to
last year, this year the average import price is lower by 10.27 € / MWh.
The data on imports and exports of electricity are presented in the table below.
Tab. 6.24 Import and export of electricity for 2019
Given the consumption curve during the daylight hours, and the inefficiency of the generating units
to convey the consumption, it is seen that in many cases there is energy inefficiency and surpluses,
sometimes within the same day. So in a few hours of the same day there are imports and exports of
electricity, also due to the fact that the opening of the market has influenced customers to choose
the source of energy supply, without being limited to local sources of production.
Electricity surpluses occur mainly in the night hours (at the time of low tariff). In these periods,
surpluses appear in the region as well, resulting in higher bids, and this implies that export prices
are significantly lower than import price.
Electricity exported with commercial contracts during 2019 was 804,903 MWh with an average
price of 39.69 €/MWh. In addition to contracted export, there was an amount of energy exchanged
(energy for energy) between KEK and KESH. The amount of energy exported as an exchange is
Import/Export
MWh
Import
contracted
Import as
exchangeTotal Import
Export
contracted
Export as
exchangeTotal Export
Net
Imp/Exp
January 110,407 0 110,407 27,995 0 27,995 -82,412
February 49,284 18,360 67,644 38,069 4,414 42,483 -25,161
March 47,474 0 47,474 108,020 13,547 121,567 74,093
April 82,430 0 82,430 47,640 5,293 52,933 -29,497
May 94,176 5,650 99,826 29,155 2,892 32,047 -67,779
June 68,856 0 68,856 44,891 4,731 49,622 -19,234
July 56,903 4,960 61,863 56,942 8,243 65,185 3,322
August 86,865 0 86,865 69,001 10,029 79,030 -7,835
September 42,451 0 42,451 100,093 14,358 114,451 72,000
October 51,050 5,460 56,510 127,829 35,381 163,210 106,700
November 63,263 0 63,263 109,922 241 110,163 46,900
December 140,903 0 140,903 45,346 957 46,303 -94,600
Total 894,062 34,430 928,492 804,903 100,086 904,989 -23,503

ANNUAL REPORT 2019
106
100,086 MWh. The total export of electricity for 2019 was 904,989 MWh, which is about 34
percentage point higher than in the year 2018, which was 676,815 MWh
As seen from the data presented above, in 2019 Kosovo was a net importer of electricity in the
amount of 23,503 MWh, presented by months in the figure below.
Fig. 6.24 Import and export of electricity in 2019
The price of import and export of electricity during the years 2000 - 2019 has increased and
decreased. Below is a figure showing import and export prices from 2000 to 2019.
Fig. 6.25 Average price of imports and exports over the years
-82
-25
74
-29
-68
-19
3
-8
72
107
47
-95
-24
-200
-150
-100
-50
0
50
100
150
200
Jan Feb Mar Apr May Jun Jul Aug Sep Oct Nov Dec Total
Net Import/Export for 2019GWh export
import
30.4329.6032.67
44.5339.64
47.87
54.87
83.66
112.52
75.77
57.91
69.66
79.46
62.14
52.3151.7645.80
59.06
66.34
56.07
29.60
40.7038.4536.59
20.17
26.44
45.05
31.1628.25
32.8633.3129.73
37.3935.8839.69
0
10
20
30
40
50
60
70
80
90
100
110
120
130
2000 2001 2002 2003 2004 2005 2006 2007 2008 2009 2010 2011 2012 2013 2014 2015 2016 2017 2018 2019
Import and export price over the years
Import Price (€/MWh) Export Price (€/MWh)
€/MWh

ANNUAL REPORT 2019
107
6.8 Electricity Service and Supply Quality Standards
The ERO Board in accordance with the legal provisions of the Law on Energy Regulator No.05 / L-084
and the Law on Electricity No. 05 / L - 085, on 05.06.2019 has approved the Rule on Electricity Service
Quality Standards. The purpose of this Rule is to determine the indicators of the quality of electricity
service for customers regarding the services provided, the uninterrupted supply of electricity and the
quality of voltage.
Electricity supply services which are included in the rule are:
service quality;
uninterrupted supply; and
voltage quality.
The Rule on Electricity Service Quality Standards presents the individual and general indicators
(indicators) of the quality of the electricity service, the indicators of the uninterrupted supply, as well
as the indicators of the quality of the voltage.
It should be noted that the quality standards of electricity supply and service are an important
element of the regulation of the energy sector. These standards are defined so that the supply and
quality of electricity service, and quality of voltage customers continuously improve the energy
company.
Even during this reporting year, the quality standards of electricity supply and service have been
monitored according to the following areas:
o Continuity of supply;
o Voltage quality; and
o Commercial Quality.
6.8.1 Continuity of supply
Continuity of supply is related to the availability of electricity, respectively displays the
number and duration of outages per customer within a year.
Continuity of electricity supply in 2019 is monitored by ERO for both system operators:
Transmission System and Market Operator (TSMO) and Distribution System Operator
(DSO).
Continuity of supply is measured by indexes:
o SAIDI - System average interruption duration index;
o SAIFI - System average interruption frequency index; and
o ENS – Energy Not-Supplied.
6.8.1.1 Measuring indexes reported by OST
Measuring indexes reported by KOSTT for the standards of quality of electricity supply and
service for 2019 are shown below.
o SAIDI - for planned interruptions in the transmission system has been 1.89 hours;

ANNUAL REPORT 2019
108
o SAIDI for unplanned interruptions in the transmission system has been 0.37 hours;
o SAIFI - for planned interruptions in the transmission system has been 0.52;
o SAIFI - for unplanned interruptions in the transmission system has been 0.41;
o ENS - for planned interruptions in the transmission system has been 1.556 GWh; and
o ENS - for unplanned interruptions in the transmission system has been 0.402 GWh.
Fig. 6.26 Measuring indicators SAIDI, SAIFI and ENS by KOSTT for 2019
The figure below shows the measuring indexes, reported by KOSTT for the standards of
quality of electricity supply and service during 2015 – 2019.
0.41, 44%
0.52, 56%
SAIFI
Unplanned Planned
0.37, 16%
1.89, 84%
SAIDI (hour)
Unplanned Planned
0.402, 21%
1.556, 79%
ENS (GWh)
Unplanned Planned
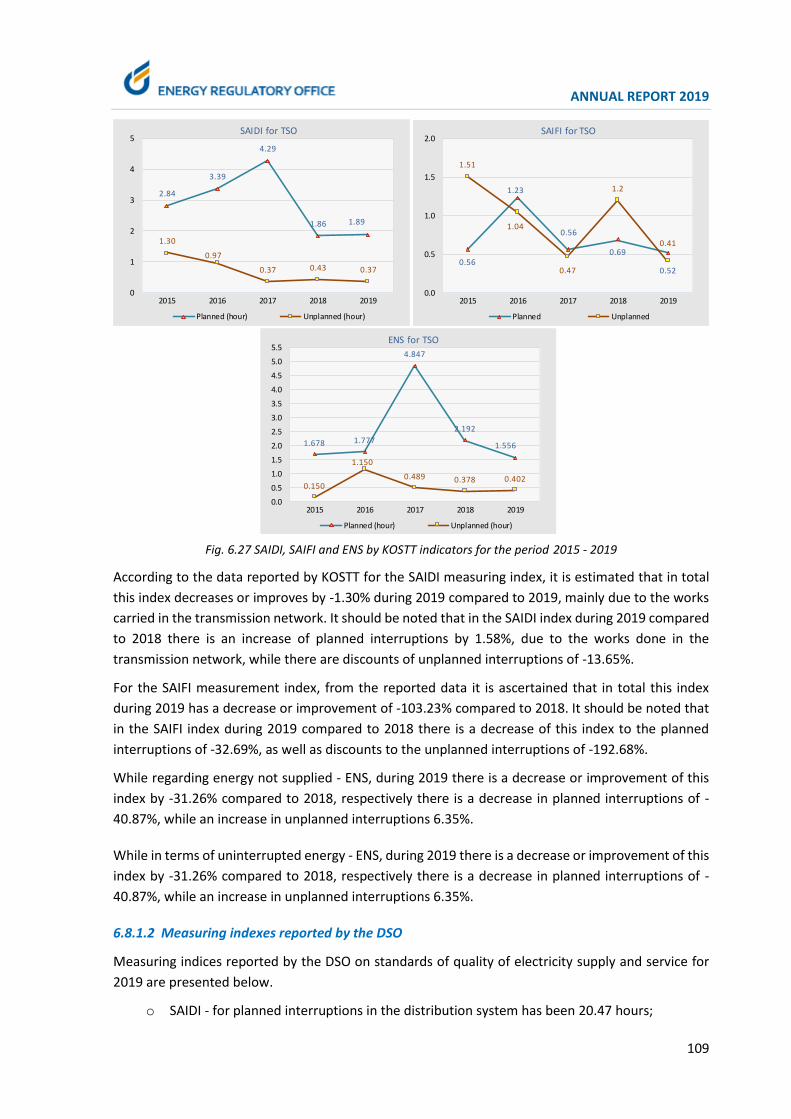
ANNUAL REPORT 2019
109
Fig. 6.27 SAIDI, SAIFI and ENS by KOSTT indicators for the period 2015 - 2019
According to the data reported by KOSTT for the SAIDI measuring index, it is estimated that in total
this index decreases or improves by -1.30% during 2019 compared to 2019, mainly due to the works
carried in the transmission network. It should be noted that in the SAIDI index during 2019 compared
to 2018 there is an increase of planned interruptions by 1.58%, due to the works done in the
transmission network, while there are discounts of unplanned interruptions of -13.65%.
For the SAIFI measurement index, from the reported data it is ascertained that in total this index
during 2019 has a decrease or improvement of -103.23% compared to 2018. It should be noted that
in the SAIFI index during 2019 compared to 2018 there is a decrease of this index to the planned
interruptions of -32.69%, as well as discounts to the unplanned interruptions of -192.68%.
While regarding energy not supplied - ENS, during 2019 there is a decrease or improvement of this
index by -31.26% compared to 2018, respectively there is a decrease in planned interruptions of -
40.87%, while an increase in unplanned interruptions 6.35%.
While in terms of uninterrupted energy - ENS, during 2019 there is a decrease or improvement of this
index by -31.26% compared to 2018, respectively there is a decrease in planned interruptions of -
40.87%, while an increase in unplanned interruptions 6.35%.
6.8.1.2 Measuring indexes reported by the DSO
Measuring indices reported by the DSO on standards of quality of electricity supply and service for
2019 are presented below.
o SAIDI - for planned interruptions in the distribution system has been 20.47 hours;
2.84
3.39
4.29
1.86 1.89
1.30
0.97
0.37 0.43 0.37
0
1
2
3
4
5
2015 2016 2017 2018 2019
SAIDI for TSO
Planned (hour) Unplanned (hour)
0.56
1.23
0.56
0.69
0.52
1.51
1.04
0.47
1.2
0.41
0.0
0.5
1.0
1.5
2.0
2015 2016 2017 2018 2019
SAIFI for TSO
Planned Unplanned
1.678 1.777
4.847
2.192
1.556
0.150
1.150
0.489 0.378 0.402
0.0
0.5
1.0
1.5
2.0
2.5
3.0
3.5
4.0
4.5
5.0
5.5
2015 2016 2017 2018 2019
ENS for TSO
Planned (hour) Unplanned (hour)

ANNUAL REPORT 2019
110
o SAIDI - for unplanned interruptions in the distribution system has been 48.35 hours;
o SAIFI - for planned interruptions in the distribution system has been 6.76;
o SAIFI - for unplanned interruptions in the distribution system has been 47.26;
o ENS - for unplanned interruptions in the distribution system has been 10.74 GWh; and
o ENS - for planned interruptions in the distribution system has been 33.51 GWh.
Fig. 6.28 Measuring indicators SAIDI, SAIFI and ENS by KOSTT for2019
In the following figures we have shown measuring indices reported by the DSO on standards of
quality of electricity supply and service during 2011 – 2019.
20.47
6.76 10.74
48.35
47.2633.51
0
10
20
30
40
50
60
70
80
SAIDI (hour) SAIFI ENS (GWh)
Planned Unplanned
SAIDI, SAIFI and ENS index for DSO

ANNUAL REPORT 2019
111
Fig. 6.29 Indicators SAIDI, SAIFI and ENS from the DSO for the period 2011-2019
From the above data it is noticed that the measuring indices SAIDI, SAIFI in 2019 have generally had
a significant improvement compared to 2018, as a result of investments made in the distribution
network.
According to the data reported for the SAIDI measurement index during 2019, it is noticed that there
is a significant improvement of this index compared to 2018, which means that in 2019 there are
discounts of -60.07% compared to 2018. It should be noted that during the more detailed analysis of
the index - SAIDI, it is noted that in 2019 there is a decrease for planned outages of -119.49%
compared to 2018, as well as a decrease for unplanned outages by -34.91% in 2019 compared to
2018.
An analysis of the measuring index SAIFI, shows that during 2019 there is an improvement of this
index compared to 2018, which means that in 2019 there is decrease in frequency of electricity
outages per customer - SAIFI for- 24.31% compared to 2019. During the more detailed analysis of the
index - SAIFI, it is observed that in 2019 there is a decrease in the frequency of planned outages for
customers (SAIFI) by -92.90% compared to 2019, as well as a decrease in frequency of unplanned
outages per customer by -14.49% compared to 2018.
During 2019, the energy not supplied (ENS) in general has improved compared to 2018, which
according to the data shows that in 2019 there is a decrease of -12.52% compared to 2018. In 2019
there is a decrease in uninterrupted energy for planned interruptions for -65.08% compared to 2018,
while increased non-supplied energy for unplanned interruptions by 4.52%, compared to 2018.
6.10 4.92 4.97 4.58
20.68
82.34
50.80
44.93
20.47
98.81109.61
85.5580.31 81.74
49.32 50.18
65.23
48.35
0
20
40
60
80
100
120
2011 2012 2013 2014 2015 2016 2017 2018 2019
SAIDI for DSO
Planned (hour) Unplanned (hour)
1.6 2.59 2.68 2.42
11.42
44.24
33.6113.04
6.76
49.74
56.91
43.27
29.57
50.7
27.3226.45
54.11
47.26
0
10
20
30
40
50
60
70
2011 2012 2013 2014 2015 2016 2017 2018 2019
SAIFI for DSO
Planned Unplanned
155.2
68.51
51.58
35.9947.07
72.23
66.48
49.7944.25
0
20
40
60
80
100
120
140
160
180
2011 2012 2013 2014 2015 2016 2017 2018 2019
ENS for DSO
ENS (GWh)

ANNUAL REPORT 2019
112
6.8.2 Quality of voltage
The voltage quality is related to the technical aspects of the electricity system and compares to the nominal voltage, which during this period was mainly monitored through registration of customer complaints regarding the quality of voltage.
During 2019, the number of complaints submitted by customers in DSO regarding the quality of
voltage was 278 complaints, of which 156 or 56.12% were resolved, 72 or 25.90% in the review
process, while 50 complaints or 17.99% remain unresolved.
Fig. 6.30 Customer complaints about voltage quality in the 2019
Below is the figure with the data of the status of resolved customer complaints for voltage quality in
DSO for 2019.
Fig. 6.31 Status of customer complaints resolved for the 2019
The figure above shows that the DSO from the 156 resolved customer complaints on voltage quality,
128 complaints were approved in favour of the customer or 82.05%, while 50 rejected, or in
percentage 17.95%.
156 , 56.12%
50 , 17.99%
72 , 25.90%
No. of complaints for voltage quality for 2019
Resolved Not resolved In process
128,82.05%
28, 17.95%
Complaints resolved in 2019
Approved Rejected

ANNUAL REPORT 2019
113
Below in the picture are presented the customers complaints about voltage quality according to the
years, where it is seen that until 2017 there was a continuous increase of customer complaints about
voltage quality, while in 2018 and 2019 it is noticed that we have a decrease in complaints of
customers for voltage quality. In 2019 compared to 2018 there is a decrease of 184.89%
Fig. 6.32 Complaints about voltage quality by years
The voltage quality standards are defined in the Rule on General Conditions of Energy Supply, in the
Distribution Code and Metering Code of Distribution.
6.8.3 Commercial quality
Commercial quality determines the efficiency and accuracy of resolving customers’ complaints and
requests. Commercial quality regulation takes into account the mutual relationship between the
customers and the supplier.
In order to analyse the commercial quality, the data obtained by the licensees have been presented
in two categories which directly affect the customers’ issues. These categories are as follows:
o New connections, and;
o Energetic consents; and
o Costumers’ complaints
6.8.3.1 New connection
In commercial quality standards, among other things, are also incorporated new connections,
through which is recorded how quickly the energy enterprise takes measures for execution of new
connection.
During 2019 in KESCO were registered a total of 27,664 regular requests for new connections for tariff
groups 4, 5, 6, 7 and 8, while 25,830 or 93.37% requests for new connections were approved, while
the rest of the requests are in registration process. It should be noted that the demand for new
connections carried over from the previous year was 1,774.
288 304349
1175
792
278
0
200
400
600
800
1000
1200
1400
2014 2015 2016 2017 2018 2019
Complaint for voltage quality

ANNUAL REPORT 2019
114
From KESCO data, it can be seen that from the total number of requests for new connections, the
most requests were from household customers (tariff group 5, 6 and 7) 19,539 or 70.63%, followed
by requests for new connections of the commercial tariff group 0.4 kV Category II - tariff group 4
which were 3,726 or 13.47%, while the demand for the tariff group 8 - Public lighting were 195 or
0.70%. It should also be noted that out of the total number of requests for new connections, 4,204
requests or 15.20% were of undefined categories, and this is because the applicants for new
connections in their requests did not specify the category of the customer and these requests. are
registered in this category.
From the total number of registrations of applicants as customers in the billing program "CCP",
household customers are 21,976 or 85.08%, followed by tariff group 4 (0.4 kV Category II -
commercial) with 3,608 registrations or 13.97%, as well as the tariff group 8 (public lighting) with 246
registrations or 0.95%.
Fig. 6.33 New connections by districts for 2019
From the above diagram it is noticed that for 2019 from the total number of requests for new
connections, most requests are registered in the district of Prishtina of 8,955 or 32.37%, followed by
the district of Ferizaj of 5,089 or 18.40%, while the lowest number of requests for new connections
has been registered in Peja district with 2,414 or 8.73%. Also, it should be noted that in terms of
registration of claims in the billing program by the total number, most registrations were in the district
of Prishtina with 8,037 or 31.11%, followed by the district of Ferizaj with 4,569 or 17.69%, while the
lowest number was registered in Gjakova district with 1,946 or 7.53%.
8,955
3,342
2,414
5,089
2,644 3,076
2,144
8,037
3,353
2,791
4,569
2,383 2,751
1,946
-
1,200
2,400
3,600
4,800
6,000
7,200
8,400
9,600
10,800
12,000
Prishtina Prizreni Peja Ferizaji Gjilani Mitrovica Gjakova
New connections by districts January - December 2019
Regular requests Registration in CCP
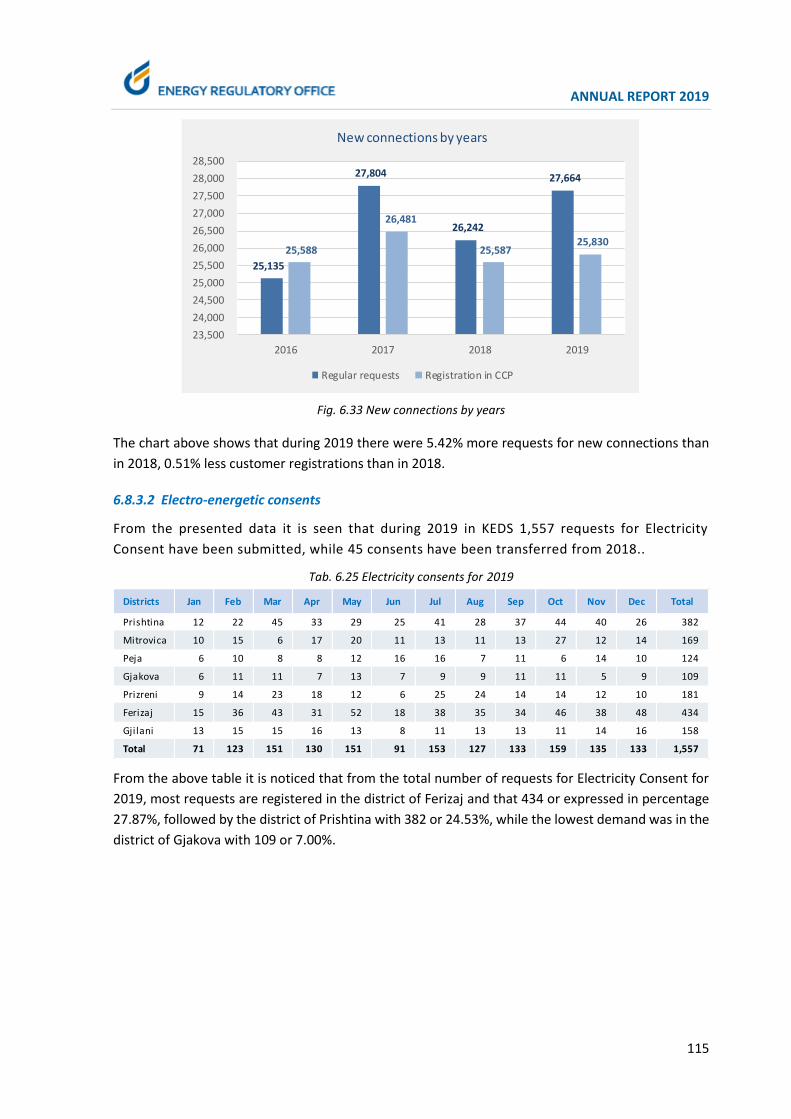
ANNUAL REPORT 2019
115
Fig. 6.33 New connections by years
The chart above shows that during 2019 there were 5.42% more requests for new connections than
in 2018, 0.51% less customer registrations than in 2018.
6.8.3.2 Electro-energetic consents
From the presented data it is seen that during 2019 in KEDS 1,557 requests for Electricity
Consent have been submitted, while 45 consents have been transferred from 2018..
Tab. 6.25 Electricity consents for 2019
From the above table it is noticed that from the total number of requests for Electricity Consent for
2019, most requests are registered in the district of Ferizaj and that 434 or expressed in percentage
27.87%, followed by the district of Prishtina with 382 or 24.53%, while the lowest demand was in the
district of Gjakova with 109 or 7.00%.
25,135
27,804
26,242
27,664
25,588
26,481
25,587 25,830
23,500
24,000
24,500
25,000
25,500
26,000
26,500
27,000
27,500
28,000
28,500
2016 2017 2018 2019
New connections by years
Regular requests Registration in CCP
Districts Jan Feb Mar Apr May Jun Jul Aug Sep Oct Nov Dec Total
Prishtina 12 22 45 33 29 25 41 28 37 44 40 26 382
Mitrovica 10 15 6 17 20 11 13 11 13 27 12 14 169
Peja 6 10 8 8 12 16 16 7 11 6 14 10 124
Gjakova 6 11 11 7 13 7 9 9 11 11 5 9 109
Prizreni 9 14 23 18 12 6 25 24 14 14 12 10 181
Ferizaj 15 36 43 31 52 18 38 35 34 46 38 48 434
Gjilani 13 15 15 16 13 8 11 13 13 11 14 16 158
Total 71 123 151 130 151 91 153 127 133 159 135 133 1,557
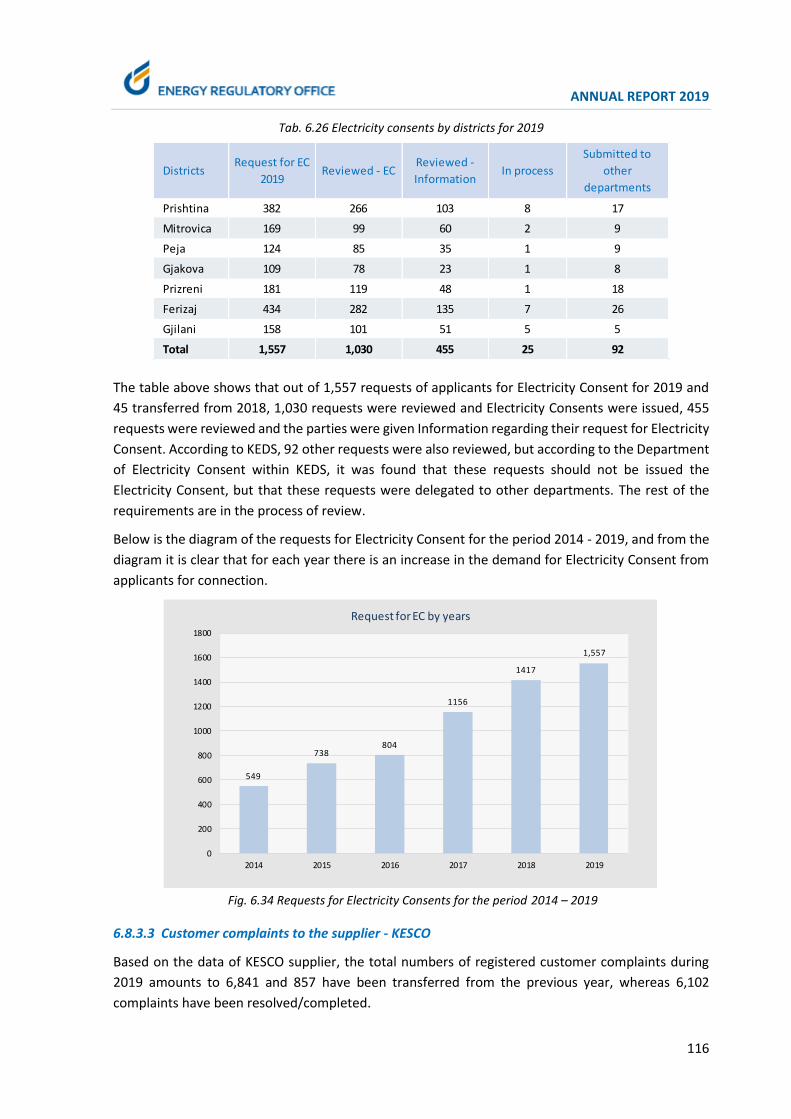
ANNUAL REPORT 2019
116
Tab. 6.26 Electricity consents by districts for 2019
The table above shows that out of 1,557 requests of applicants for Electricity Consent for 2019 and
45 transferred from 2018, 1,030 requests were reviewed and Electricity Consents were issued, 455
requests were reviewed and the parties were given Information regarding their request for Electricity
Consent. According to KEDS, 92 other requests were also reviewed, but according to the Department
of Electricity Consent within KEDS, it was found that these requests should not be issued the
Electricity Consent, but that these requests were delegated to other departments. The rest of the
requirements are in the process of review.
Below is the diagram of the requests for Electricity Consent for the period 2014 - 2019, and from the
diagram it is clear that for each year there is an increase in the demand for Electricity Consent from
applicants for connection.
Fig. 6.34 Requests for Electricity Consents for the period 2014 – 2019
6.8.3.3 Customer complaints to the supplier - KESCO
Based on the data of KESCO supplier, the total numbers of registered customer complaints during
2019 amounts to 6,841 and 857 have been transferred from the previous year, whereas 6,102
complaints have been resolved/completed.
DistrictsRequest for EC
2019Reviewed - EC
Reviewed -
InformationIn process
Submitted to
other
departments
Prishtina 382 266 103 8 17
Mitrovica 169 99 60 2 9
Peja 124 85 35 1 9
Gjakova 109 78 23 1 8
Prizreni 181 119 48 1 18
Ferizaj 434 282 135 7 26
Gjilani 158 101 51 5 5
Total 1,557 1,030 455 25 92
549
738804
1156
1417
1,557
0
200
400
600
800
1000
1200
1400
1600
1800
2014 2015 2016 2017 2018 2019
Request for EC by years

ANNUAL REPORT 2019
117
Find below the chart of registered and resolved customer complaints registered and resolved, by
districts.
Fig. 6.35 Complaints and number of customers by districts, 2019
The figure above shows that the highest percentage of customer complaints registered with KESCO
during 2019 is in the district of Prishtina with 57.93 %, followed by the district of Ferizaj with 12.50 %,
whereas the lowest percentage is in the district of Gjakova with 4.25 %. It should be stated that the
highest number of complaints in the district of Prishtina mainly result from the fact that the district
of Prishtina has the highest number of customers in Kosovo. Also the figure above shows that the
highest percentage of customer complaints resolved by the KESCO’s Customer Department compared
to the total number of complaints resolved at the national level it is in the district of Pristina with
56.36%, followed by Ferizaj district with 13.65%, while the lowest is in the Prizren district with 4.38%.
Below is the report of customer complaints submitted to KESCO with the number of invoices/
customers by months.
85
5
29
1
33
2 51
2
59
6
3,9
63
29
2
83
3
29
3
33
3
44
7
49
0
34
39
26
7
85,987
57,387
67,171 58,491
71,010
179,308
86,340
-
20,000
40,000
60,000
80,000
100,000
120,000
140,000
160,000
180,000
0
1,000
2,000
3,000
4,000
5,000
6,000
DFE DGJ DGL DMI DPE DPR DPZ
Complaints by districts 2019
Registered Completed Number of customers 2019

ANNUAL REPORT 2019
118
Tab. 6.27 Complaints report and number of customers by months for 2019
From the data reported by the supplier KESCO, it is seen that the number of complaints registered
during 2019 is 6,841, which represents 1.13% of the total number of customers, respectively 0.10%
of the total number of annual invoices.
The data show that the highest percentage of resolved complaints compared to registered complaints
for the period January - December 2019 was realized in the district of Gjakova (report of completed
complaints/registered complaints) with 100.69%, followed by the district of Gjilan with 100.30%,
while the lowest in the district of Peja with 82.21%.It is worth noting that in some districts there is a
percentage higher than 100%, and this is due to the fact that in addition to the registered complaints
of that period, the districts have managed to review some complaints transferred from last year.
The figure below shows the number of registered and resolved complaints according to the nature of
complaints for 2019.
Fig. 6.36 Customer complaints by nature for 2019
Find below descriptions of complaints’ nature:
Month ComplaintNumber of invoices /
customers
Complaint/customer
ratio
January 819 582,425 0.14%
February 747 583,930 0.13%
March 568 585,590 0.10%
April 496 587,633 0.08%
May 609 589,963 0.10%
June 484 591,850 0.08%
July 535 594,265 0.09%
August 485 596,751 0.08%
September 480 598,301 0.08%
October 580 601,159 0.10%
November 514 602,847 0.09%
December 524 605,694 0.09%
Total 6,841 7,120,408 0.10%
528
32
301 300239
1367
222
1713
122
12
895
1110
540
14
289324
86
1365
192
1091
99
12
1138
952
0
200
400
600
800
1,000
1,200
1,400
1,600
1,800
B1 B2 B3 B4 B5 B6 B7 B8 B9 B10 B11 B12
Complaints by nature 2019
Registered Completed

ANNUAL REPORT 2019
119
B1 - Unregistered payment
B2 - Error in initial balance
B3 – Invoice is not taken
B4 – Over the limit
B5 – Change of the lump sum
B6 – Incorrect reading
B7 – Irregular reading
B8 - Incorrect calculator
B9 – Request for debt settlement
B10 - Disconnection without notice
B11 - Others
B12 – Unauthorized use of electricity (Recovery of losses)
From the data reported by KESCO for 2019, it is noted that from the total number of customer
complaints, the most complaints were related to the incorrect metering, precisely 1,713 or expressed
in percentage 25.04%, followed by complaints regarding incorrect readings with 1,367 or expressed
as a percentage 19.98%, while the lowest number of complaints was related to the disconnection
without notice with 12 complaints or 0.18%.
According to KESCO data, in 2019 the complaints of registered customers which were related to
reading errors in the metering point (incorrect reading and irregular reading) were 1,589 or expressed
in percentage 23.23% of the total number of submitted customer complaints, in 2018 the number of
complaints that were related to errors in reading the metering point were 1500, in 2017 there were
3,955, in 2016 there were 4,504, and in 2015 there were 5,312. From this it is clear that the number
of customer complaints regarding errors in reading the metering point is declining, and this is due to
the new way of reading the measuring point by means of the hand device ("Hand Held Unit") which
has significantly improved the reading of the measuring points and has reduced the possibility of
errors when reading the metering point, because the reading and billing is done at the same time
Below is the figure with the data of the complaints resolved by KESCO for 2019, or more precisely the
status of the resolved complaints.
2694 3408
Status of complaints resolved in 2019
Approved Rejected

ANNUAL REPORT 2019
120
Fig. 6.37 Status of resolved customer complaints for 2019
The figure above shows that KESCO from 6.102 resolved customer complaints, of which 2,694
complaints were approved in favour of the customer or 44.15%, while 3.408 rejected, or in
percentage 55.85%.
The total number of customer complaints registered in 2019 is 6,841, in 2018 it is 8,040, in 2017 it is
11,350, in 2016 it is 11,180, in 2015 it was 12,926, while in 2014 it was 17,655 as presented in the
following figure.
Fig. 6.38 Customer complaints to KESCO by years
17,655
12,926
11,180 11,350
8,040
6,841
10,896 11,896
10,974 11,359
8,158
6,102
0
2,000
4,000
6,000
8,000
10,000
12,000
14,000
16,000
18,000
20,000
2014 2015 2016 2017 2018 2019
Registered Resolved
Complaints at KESCO by years

ANNUAL REPORT 2019
121
7 THERMAL ENERGY SECTOR
Thermal energy sector in Kosovo consists of four systems: DH Termokos – Prishtina, DH Gjakova –
Gjakove, DH Termomit – Mitrovica, and DH in Zvecan. This sector has a fairly limited extent locally,
fulfilling 3 - 5% of total heating demand in Kosovo.
Thermal energy sector in Kosovo consists of 4 district heating systems, with an installed capacity
considered to be around 332 MWTH. District Heating of Termomit and Zveçan, due to notorious
circumstances, have not responded to requirements for licensing/regulation and monitoring of ERO,
thus making impossible to ensure relevant updated data; to this end, find below detailed data on
DH Termokos and DH Gjakova
7.1.1 Thermal energy generation plants
Thermal energy generation plants of DH Termokos consist of main district heating with a total
installed capacity of 120 MWTH, and auxiliary district heating in the University Clinical Centre with a
capacity of 14 MWTH. Upon the connection of the thermal energy extraction station in B1 and B2
units of TPP Kosova B, the installed capacity of cogeneration of 140 MWTH was added to this
capacity. It should be mentioned that boilers with heating fuel in DH Termokos have not been
decommissioned, but they will serve as reserve capacities to be activated in cases of possible failure
in TPP Kosova B units.
District heating of the city of Gjakova consists of two boilers with heavy oil, with a total installed
capacity of 38.6 MWTH – one with generating capacity of 20 MWTH and the other with capacity of
18.6 MWTH.
7.1.2 Thermal energy distribution systems
Thermal energy distribution systems in Kosovo consist of primary distribution network which
extends until the point of supply in substations, and secondary network, which extends from supply
point in substations, to the final users.
Primary distribution network of DH Termokos has a length of around 41 km respectively pipeline
length of 82 km. An integral part of the distribution network is also the pump and heat exchangers
station located at Bregu i Diellit and 465 active substations which are dividing points between the
primary and secondary network. In addition to the existing distribution network, the network for
transporting thermal energy between TPP Kosova B – DH Termokos has been constructed in 2014,
in a length of around 10.5 km.
Primary distribution network of DH Gjakova has a length of around 15.5 km respectively pipeline
route in length 31 km. This network consists of around 180 active substations, which are dividing
points between the primary and secondary network.
A summary of the technical characteristics of district heating systems of DH Termokos and DH
Gjakova is shown in the following table.

ANNUAL REPORT 2019
122
Tab. 7.1 Technical data of District Heating systems
7.2 Main Developments in Thermal Energy Sector
7.2.1 Developments in DH Termokos
The qualitative and stable supply of thermal energy over the recent years has increased interest for
a wider inclusion of potential customers from the city of Prishtina into the DH Termokos system.
In order to meet the growing demand for connection to the DH Termokos system, during 2019 a
number of development projects have been updated, mainly in the distribution network, which are
in different stages of development.
In May 2019 began the implementation of the European Commission IPA 2015 Project: Rehabilitation
of the network of substations and network expansion and new substations. Within this project,
execution of construction and installation works will include the following main components:
Rehabilitation of the distribution network (replacement of old pipelines with new pre-insulated
pipes) - 3.28 km of respectively 6.5 km of pipeline; rehabilitation includes the regions: Center: 1
km track, Dardani: 0.79 km track, Kodra e Diellit: 1.18 km track, Ulpiana 0.24 km track and Kalabria
a very short segment of only 0.07 km.
Rehabilitation of 100 thermal substations - Dardania: 26, Center: 9, Ulpiana: 21, Kodra e Diellit:
8, UCCK: 5 and various Institutions: 31 thermal substations. The rehabilitation also includes the
installation of 100 regulating valves (control) of the differential pressure.
expansion of the network in total 3.96 km of route respectively 7.92 km of new pipeline - Center:
0.66 km of route, Kodra e Diellit: 0.048 km of route, 0.574 km of route, Dardania: 0.617 km of
route, Calabria: 1,028 km of route and Mati: 1,035 km of route
51 New thermal substations - Center: 9, Ulpiana: 4, Calabria: 31, Mati: 5 and 1 Thermal substation
of the Kosovo Customs Directorate.
Length of network
(track) [km]
No. of
substations
2 x 58 = 116 2 x 49.3 = 98.6 Rrjeti i shpërnd.
2 x 7 = 14 2 x 6.3 = 12.6 41.0 475
1 x 4 = 4 3.6 Transp.network (aktive-465)[Cogeneration] 2 x 70 =
140 2 x 68.7 = 137.4 10.5
Sub-total 274.0 252.2 51.5 475
1 x 20 = 20 1 x 14.8 = 14.8 Distrib. Network 302
1 x 18.6 = 18.60 1x13.02 = 13.02 15.5 (active-180)
Sub-total 38.6 27.8 15.5 302
Total 312.6 280.0 67.0777
(Aktive - 645)
Company (city) Installed capacity [MW]Operational
capacity [MW]
Thermal energy network
TERMOKOS
(Prishtina)
DH GJAKOVA
(Gjakove)

ANNUAL REPORT 2019
123
Fig. 7.1 Views from the works on the rehabilitation of the network and substations
With the finalization of this project will be achieved to reduce the thermal energy losses and improve
the quality of heating in some parts of which are more problematic, as well as network expansion will
increase the number of customers who receive thermal energy supply (central heating), respectively,
it is possible to increase the heating area of the spaces covered by the District Heating supply service
from Termokos.
In the wake of efforts to address the expansion of the District Heating system but also environmental
issues, the project for obtaining thermal energy from solar panels has been initiated. Specifically, in
November 2019, was presented the Pre-Feasibility Study funded in cooperation between the German
Development Bank (KfW) and the European Bank for Reconstruction and Development (EBRD).
This project includes solar collector plants (solar panels) in an area of about 73,000 m2 and a hot
water tank with a volume of about 540,000 m3 and is planned to have a maximum heat capacity of
29MW. This will enable the provision of heating (i.e. the possibility of expanding the system) for the
neighbourhoods Arbëria and Tophane, which are currently not included in the system of DH
Termokos. In addition to providing adequate and quality heating for thousands of new customers in
these two neighbourhoods, it would be effective to eliminate the use of coal and firewood for
individual heating of homes and buildings, which would significantly contribute to the improvement
of air quality in Prishtina.
In March 2018, the financial agreement was signed between the German Government and the
Government of Kosovo for financial support within the Program for the energy sector VIII and IX - the
project for rehabilitation and expansion of the network of DH Termokos. This project led by the
German Development Bank (kFW) is in the preparatory phase and contains 2 main components:
- Rehabilitation and expansion of DH Termokos distribution network;
- Modernization of existing substations and construction of new substations, as well as
construction of reservoirs for heat storage.
This project, which is the initial preparatory phase, is expected to be worth approximately €14 million,
funds pledged as donations from Germany, Luxembourg, Sweden, funds to be allocated and managed
through KfW, and a small amount from the Municipality of Prishtina.
In December 2019, the company was selected for the implementation of the project: "Measurement
of central heating". Specifically, within the MCC-US 'Reliable Energy Spectrum' Program ("Millennium

ANNUAL REPORT 2019
124
Challenge Corporation"), the installation component of thermal energy meters for DH Termokos
customers has been included, with the aim to switch to consumption based billing, in which case
efficient use of thermal energy is achieved. This project, estimated at $ 10.9 million, as a donation
from MCC - USA, contains:
- Installation of individual thermal energy meters, respectively heat allocators;
- Installation of thermostatic valves and circulating pumps;
- Development of software for billing and reading of thermal energy consumption;
- Assistance in improving billing services based on measured consumption.
The implementation of this project, which is expected to begin in 2020, will enable the measurement
of consumption and the implementation of billing based on the recorded measurement of
consumption, which will save thermal energy that will release the capacity to expand the customer
base, respectively will enable the connection to the heating system of a significant number of
customers who currently use electricity for heating their space.
Regarding the development projects, it should be noted that in the session of date July 10, 2019, ERO
Board has approved the Ten (10) year Development Plan of DH Termokos. The Development Plan
presents the effective measures that will be taken to guarantee the suitability of the system and to
provide the best possible supply of thermal energy (central heating), including plans for rehabilitation
projects and expansion of the infrastructure of the District Heating system in the municipality. of
Prishtina, during the next ten (10) years.
7.2.2 Developments in DH Gjakova – Fuel Change and Cogeneration Project
Regarding DH Gjakova, initially it must be emphasized that despite the financial difficulties in
supplying of sufficient quantities of heavy fuel oil, owing to subsidies from Kosovo budget, DH
Gjakova managed, since 25 November 2018, to start generation and supply of customers with
thermal energy.
With regards to the project for the new district heating with biomass of the DH Gjakova, it is worth
mentioning that during 2019 the tender procedures for the execution and supervision of construction
and installation works have been completed and the drafting of the detailed project of the new heater
has been drafted. While in December 2019, the realization of the Project for construction of the new
heater and the cogeneration unit with biomass fuel has started. This project in the amount of € 13.5
million is financially supported by the European Commission – Office in Kosovo through IPA-2015
funds
- 2 units generating only thermal energy: with capacity 2 X 5.5 MWTH
- 1 unit of cogeneration (co-production) of electricity and thermal with thermal capacity: 4
MWTH; and Electrical Capacity: 1.2 MWEL
- Total thermal capacity: 15MWTH and Electric capacity 1.2 MWEL
The project, among others, includes the installation of appropriate equipment for the new heater and
connection to the network of distribution of thermal energy and electricity.
This project will enable operational and financial sustainability of DH Gjakova, where specifically the
main impact is the replacement of fuel - heavy fuel oil (which due to the high cost is largely subsidized

ANNUAL REPORT 2019
125
by the Kosovo Budget) with biomass. In addition to providing quality heating to customers with
district heating, this project also has a positive impact on increasing energy efficiency and protecting
the environment.
On 27 November 2019, ERO Board has issued the final authorization for construction of energy
generation capacities, which includes the inclusion in the support scheme (feed-in tariff) of
generating capacity of electricity of 1.2 MWEL as part of the cogeneration unit.
7.3 Performance of District Heating Companies
In the 2018/2019 season, DH Termokos has continued with the positive trend of production and
sustainable supply of thermal energy, offering uninterrupted supply 24 h, which is mainly a result of
sufficient production from cogeneration plants in TPP Kosovo B, but also realization of network
rehabilitation projects and thermal substations.
Regarding DH Gjakova, it should be mentioned that, owing to subsidies from the Government of
Kosovo, it has managed to start production and supply of thermal energy in the 2018/2019 season.
However, due to financial constraints, DH Gjakova has been forced to shorten the heating season to
about 3.5 months (second half of November 2018 - February 2019). Also during this period, it has
provided a reduced daily supply and has significantly reduced the heating surface, ie the number of
customers that were provided the supply, focusing on more regular paying customers and parts of
the network where there is less loss of thermal energy
7.3.1 Production, Supply and Losses in DH Termokos
- Thermal energy production
DH Termokos bases the production of thermal energy on cogeneration plants in TPP Kosova B; in
fact, in 2018/2019 season, the entire thermal energy production was from cogeneration plants in
TPP Kosovo B, so the activation of boilers with heating oil in DH Termokos was unnecessary.
The amount of thermal energy extracted from cogeneration in the 2018/2019 season was 235,079
MWhTH, which is 11,341 MWhTH or 5.07% greater than the amount of thermal energy last season
(223,738 MWhTH). While the amount of thermal energy received at the heat exchange station in DH
Termokos was 229,661 MWhTH, which also represents an increase of 9,907 MWhTH or 4.41%
compared to last season (219,954 MWhTH).
Summarized data of thermal energy production from cogeneration is presented in the following
table:

ANNUAL REPORT 2019
126
Tab. 7.2 Production of thermal energy from cogeneration
- Thermal energy supply
DH Termokos, in 2018/2019 season has marked a significant improvement in quantity and quality of
the thermal energy supply, which is mainly due to continuous improvements in the thermal energy
production, as well as the maintenance and repairs of the network.
Customers’ supply with thermal energy (central heating), in this season was considered to be
209,533 MWhTH, which represents an increase of 9,671 MWHTH or around 4.84 % compared to the
previous 2017/2018 (199,862 MWhTh) season. Such supply is quite satisfactory and fulfilled the
plans and objectives for a sufficient and qualitative supply
- System losses
The thermal power system of DH Termokos has its own specifics in terms of losses in the system, due
to the integration of thermal energy from cogeneration. Therefore, system losses include two
components: losses in transmission network from TPP Kosova B- DH Termokos and losses in primary
distribution network
Losses in the transportation network of thermal energy TPP Kosova B- DH Termokos in a length of
10.5 km are determined from the measurements carried out in the heat exchange station (thermal
energy production station) in TPP Kosova B and in heat exchange station in DH Termokos. Based on
the measurements carried out for the period October 2018 – April 2019, the quantitative losses in
this period amount to 5,418 MWhTH namely 2.3%. Details on losses in the thermal energy
transmission network are given in the following table
Month UnitExtracted the. en. (measured in
TPP Kosova B)/Gross Production
Received the. en. (measured in
DH Termokos)/Net production
October 2018 MWhTH 13,703 13,589
November 2018 MWhTH 29,583 28,988
December 2018 MWhTH 44,912 43,698
January 2019 MWhTH 48,391 47,647
February 2019 MWhTH 40,778 39,899
March 2019 MWhTH 36,744 35,289
April 2019 MWhTH 20,968 20,551
Total MWhTH 235,079 229,661
Thermal energy from cogeneration – DH Termokos, 2018/2019 season

ANNUAL REPORT 2019
127
Tab. 7.3 Losses of thermal energy in transmission network TPP Kosova B – DH Termokos 2018/2019 season
Losses in primary network of thermal energy distribution are normally determined by the metering
of thermal energy at the entrance of distribution network and from thermal energy supply in
customers substations. But, due to the lack of total measurement of supplied thermal energy
quantity (in substations), several approximations for the calculation of supply were done, first using
parameters such as, specific demand for heating capacity (W/m2) and full load hours, namely
specific consumption (kWh/m2). The estimated consumption value is 209,533 MWhTh. By
subtracting this consumption value from thermal energy brought into the distribution network
(228,841 MWhTh) it results that quantitative losses in distribution network for 2018/2019 season are
19,308 MWhTh, which in percentage represents 8.44%; This level of losses of 8.4% represents a
decrease of 0.4% compared to last season (8.8%).
Table below present summarized data on total production, supply and losses in system – thermal
energy transport network and distribution network:
Tab. 7.4 Energy performance in DH Termokos – 2018/2019 season
7.3.2 Production, supply and losses in DH Gjakova
- Thermal energy production
DH Gjakova bases thermal energy production on heating boilers with heavy oil. As stated above,
during 2018/2019 season thermal energy production was quite reduced – gross production has
been 9,112 MWhTH while net production of thermal energy was 8,637 MWhTH. For the production
Oct Nov Dec Jan Feb Mar Apr Total
Extracted Thermal Energy - measured
in TPP Kosova B [MWh]13,703 29,583 44,912 48,391 40,778 36,744 20,968 235,079
Received Thermal Energy – measured
in DH Termokos [MWh} 13,589 28,988 43,698 47,647 39,899 35,289 20,551 229,661
Losses in energy quantity [MWh] 114 595 1,214 744 879 1,455 417 5,418
Losses in [%] 0.83% 2.01% 2.70% 1.28% 1.46% 1.30% 1.30% 2.30%
Description Njësia Vlera
Gross production in heating plants [MWhth] 0
Gross production in cogeneration plants [MWhth] 235,079
Quantitative loss in transport network (TPP Kosova B - DH Termokos) [MWhth] 5,418
Losses in percentage in transport network [%] 2.30
Own consumption [MWhth] 820
Thermal energy net production [MWhth] 228,841
Quantitative losses in distribution network [MWhth] 19,308
Losses in percentage in distribution network [%] 8.44
Customer supply with thermal energy [MWhth] 209,533
DH Termokos - Heating season 2018/2019
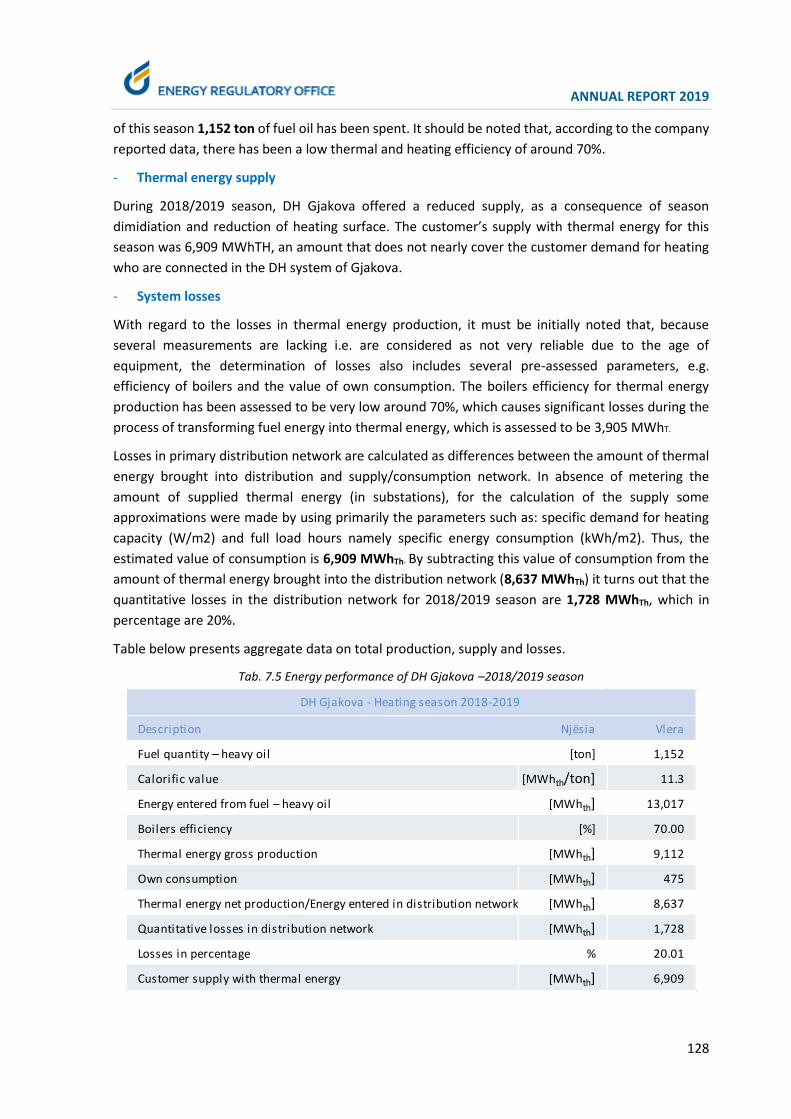
ANNUAL REPORT 2019
128
of this season 1,152 ton of fuel oil has been spent. It should be noted that, according to the company
reported data, there has been a low thermal and heating efficiency of around 70%.
- Thermal energy supply
During 2018/2019 season, DH Gjakova offered a reduced supply, as a consequence of season
dimidiation and reduction of heating surface. The customer’s supply with thermal energy for this
season was 6,909 MWhTH, an amount that does not nearly cover the customer demand for heating
who are connected in the DH system of Gjakova.
- System losses
With regard to the losses in thermal energy production, it must be initially noted that, because
several measurements are lacking i.e. are considered as not very reliable due to the age of
equipment, the determination of losses also includes several pre-assessed parameters, e.g.
efficiency of boilers and the value of own consumption. The boilers efficiency for thermal energy
production has been assessed to be very low around 70%, which causes significant losses during the
process of transforming fuel energy into thermal energy, which is assessed to be 3,905 MWhT.
Losses in primary distribution network are calculated as differences between the amount of thermal
energy brought into distribution and supply/consumption network. In absence of metering the
amount of supplied thermal energy (in substations), for the calculation of the supply some
approximations were made by using primarily the parameters such as: specific demand for heating
capacity (W/m2) and full load hours namely specific energy consumption (kWh/m2). Thus, the
estimated value of consumption is 6,909 MWhTh. By subtracting this value of consumption from the
amount of thermal energy brought into the distribution network (8,637 MWhTh) it turns out that the
quantitative losses in the distribution network for 2018/2019 season are 1,728 MWhTh, which in
percentage are 20%.
Table below presents aggregate data on total production, supply and losses.
Tab. 7.5 Energy performance of DH Gjakova –2018/2019 season
Description Njësia Vlera
Fuel quantity – heavy oil [ton] 1,152
Calorific value [MWhth/ton] 11.3
Energy entered from fuel – heavy oil [MWhth] 13,017
Boilers efficiency [%] 70.00
Thermal energy gross production [MWhth] 9,112
Own consumption [MWhth] 475
Thermal energy net production/Energy entered in distribution network [MWhth] 8,637
Quantitative losses in distribution network [MWhth] 1,728
Losses in percentage % 20.01
Customer supply with thermal energy [MWhth] 6,909
DH Gjakova - Heating season 2018-2019

ANNUAL REPORT 2019
129
7.4 Overall production, supply and losses of thermal energy
The following table presents the summarized data on production, supply and losses in the system
for the entire sector of thermal energy.
Tab. 7.6 Energy performance of thermal energy sector –2018/2019 season
7.5 Billing, collection and heating surface
7.5.1 Billing and collection
With regard to the billing, initially should be noted that during the 2018/2019 season as well, the
billing of thermal energy customers was mainly based on heating surface (per square meter while a
smaller number of customers are billed based on measured consumption. Specifically, in DH
Termokos the number of customers billed by measurement has reached 105 customers, mainly
commercial and institutional; while DH Gjakova in the absence of functional meters almost
completely bills according to the heating surface.
DH Termokos in the 2018/2019 season recorded a billing growth compared to the previous season
2017/2018, which is mainly due to the continuous improvement of supply. In fact, the billing in the
2018/2019 season was € 6,288,796, which represents an increase of € 247,136 or 4% compared to
the 2017/2018 season (€ 6,041,660). However, even in this season is not reached planned billing level
mainly due to: i) deductions in billing due to days without heat and because of the poor quality of
supply (in some neighbourhoods of Pristina); and ii) discounts on the heating surface after field
verification.
From the total billing realized in the 2018/2019 season of € 6,288,796, metered billing was €
2,457,164 and unmetered billing was € 3,831,632; the ratio of measured and unmeasured billing as
well as the respective values are presented in the diagram below.
Description Unit DH Termokos DH Gjakova Total
Thermal energy gross production [MWhth] 235,079 9,112 244,191
Quantitative losses in transport network [MWhth] 5,418 0 5,418
Losses in percentage in transport network [%] 2.30 0.00 2.30
Own consumption [MWhth] 820 475 1,295
Thermal energy net production [MWhth] 228,841 8,637 237,478
Quantitative losses in distribution network [MWhth] 19,308 1,728 21,036
Losses in percentage in distribution network [%] 8.44 20.01 8.86
Customers supply with thermal energy [MWhth] 209,533 6,909 216,442
Thermal Energy Sector - 2018/2019 season

ANNUAL REPORT 2019
130
Fig. 7.2 Participation of invoicing values with and without measurement in total billing
As a result of the increased billing but also the improvement in collection, the amount collected has
increased compared to last season - in the 2018/2019 season the amount collected was € 4,456,254
while the amount collected in the 2017/2018 season was € 3,812,371, representing an increase of €
643,833 or 16.9%. Also, if we refer to the percentage of collection, in this season there is an increase
of the percentage of collection compared to last season - in the 2018/19 season the collection
percentage was 70.86% while in the 2017/18 season the collection percentage was 63.59%, which
represents an increase of 7.27%.
As noted above, DH Gjakova during the 2018/2019 season has provided a reduced supply, as a result
of halving the heating season and reducing the heating surface. Consequently, billing this season has
been quite small - € 312,323, while the collection as a monetary amount has reached the value of €
250,301, which represents a collection rate of 80.14%.
Details regarding billing and collection are shown in the table and graph below.
Tab. 7.7 Billing and collection - season 2018/2019
2,457,164
3,831,632
Total billing (with and without measurement)-DH
Termokos-18/19 [€]
Billing with measurement Billing without measurement
Heating season 2018/2019 Heating
surface [m2]
Participation in
percentage
Bill ing
[€]Collection [€]
Collection Rate
[%]
Household 738,413 57.05% 2,979,629 2,266,135 76.05%
Commercial and institutional 555,835 42.95% 3,309,167 2,190,119 66.18%
Total 1,294,248 100.00% 6,288,796 4,456,254 70.86%
Household 34,559 45.34% 114,390 97,314 85.07%
Commercial and institutional 41,670 54.66% 197,933 152,987 77.29%
Total 76,229 100.00% 312,323 250,301 80.14%
NQ "Termokos" Prishtina
NQ "Gjakova" Gjakove

ANNUAL REPORT 2019
131
Fig. 7.3 Invoicing and collection at DH Termokos and DH Gjakova - season 2018/2019
7.5.2 Heating surface
DH Termokos, in 2018/2019 season, had total costumer heating surface of 1,294,248 m2, which
represents an increase of 23,468 m2 or around 1.85% compared to the heating surface in 2017/2018
season (1,270,780 m2).
While DH Gjakova, due to the above mentioned reasons, in 2018/2019 season significantly reduced
the heating surface in just 76,229 m2.
Graphs presented below show the heating surface for DH Termokos and Gjakova, divided by the
customers groups.
Fig. 7.4 Heating surface by groups of customers in 2018/2019 season
6,288,796 €
4,456,254 €
Billing
Collection
DH Termokos 2018/2019
Collection level 70.86%
312,323 €
250,301 €
Billing
Collection
DH Gjakova 2018/2019
Collection level 80.14%
738,413 57% 555,835
43%
DH Termokos - Heating surface [m2]
Household Commercial and institutional
34,55945%
41,67055%
DH Gjakova - Heating surface [m2]
Household Commercial and institutional

ANNUAL REPORT 2019
132
8 NATURAL GAS SECTOR
8.1 Perspective of the development of natural gas sector in Kosovo
In order to create the perspective for development of natural gas sector and fulfil obligations that
Kosovo has as a full member in Energy Community Treaty, in June 2016 has adopted the Law No.
05/L-082 on Natural Gas within the energy laws package
This law transposes the third package of European legislation relevant to natural gas, mainly:
- - Directive no. 2009/73 / EC on the Common Rules for the Internal Market of Natural Gas; and
- - Regulation no. 715/2009 / EC on Access Conditions in Natural Gas Transmission Networks.
Law on natural gas lays the foundations of legal and regulatory framework for the transmission,
distribution, storage and supply with natural gas and the operation of gas transmission and
distribution systems. Consequently, this law determines the organization and functioning of the
natural gas sector and access to networks and gas market.
Kosovo Energy Strategy 2017-2026 in Objective ‘4’ has included the development of natural gas
infrastructure, through the connection with gas infrastructure projects in the region of Southeast
Europe, especially with the TAP pipeline project (“Trans-Adriatic-Pipeline”) and gas ring of Energy
Community. In this regard, it should be emphasized that a gasification project, namely the
development of gas infrastructure is ranked in the priority infrastructure projects – area of energy,
approved by the National Council for Investment and the Government of Kosovo
The TAP pipeline project is considered to have a positive impact on the development of gas
infrastructure in the Energy Community, namely Southeast Europe region, by providing
opportunities to connect the planned regional projects as Ionian – Adriatic Pipeline and ALKOGAP,
where both these projects supplement the so-called ‘Gas Ring of Energy Community.
TAP is currently in the construction phase, and in 2020 the TAP gas pipeline is planned to start the
operation and the first gas flows through this pipeline. TAP’s initial capacity is planned to be 10 billion
cubic meters (bcm) per year, with the possibility of increasing up to 20 bcm per year. TAP will allow
interconnections along pipeline to supply with gas other regional projects. Thus, state agreements
with “host countries” (Greece, Albania and Italy) have pre-defined connection sites and quantities,
namely gas capacities.
In this context of regional developments in the gas sector, Kosovo has undertaken a number of
activities related to current regional gas pipeline projects.
In addition to the Albania-Kosovo Pipeline Project (ALKOGAP), for which the Pre-Feasibility Study for
the ALKOGAP project was prepared in 2018, during 2019 other initiatives have been undertaken for
other projects of local or regional character.

ANNUAL REPORT 2019
133
Master Plan for the development of the natural gas sector in Kosovo
Based on the recommendations from the Pre-Feasibility Study for the ALKOGAP project, in early 2019
Kosovo applied to the WBIF platform ('Western Balkans Investment Framework') for technical
assistance in drafting the Master Plan of Gas. At June 2019 meeting of the WBIF Steering Committee,
the draft proposal for the Master Plan of Gas in Kosovo was approved and it was decided to financially
support the drafting of this master plan, where the leading financial institution is the European Bank
for Reconstruction and Development (EBRD); it is planned to start drafting the Master Plan in 2020.
Gas interconnection North Macedonia - Kosovo
In February 2019, the Ministry of Economic Development of Kosovo and the Ministry of Economy of
North Macedonia signed a Memorandum of Understanding to intensify bilateral relations in the
energy sector; among other things, this memorandum defines the priority areas for cooperation in
the electricity sector, natural gas, renewable energy sources, and energy efficiency, as well as in the
future preparation of joint projects of infrastructural importance in electricity and natural gas.
Following this cooperation, Kosovo and North Macedonia have jointly submitted a draft
project/application for the interconnection gas line between the two countries to the WBIF platform.
The Steering Committee of the WBIF at its June 2019 meeting approved the financial support for
technical assistance in drafting the Feasibility Study and Environmental and Social Impact Assessment
for this project; the leading financial institution is the European Bank for Reconstruction and
Development (EBRD).
Progress in the development and implementation of these above-mentioned projects is considered
important and a necessary precondition for the creation and development of natural gas markets in
Kosovo, Albania and North Macedonia. The following are the sketches of these projects:
Fig. 8.1 Kosovo regional das infrastructure projects and options for Kosovo connection (including ALKOGAP and
North Macedonia-Kosovo gas interconnection)

ANNUAL REPORT 2019
134
Fig. 8.2 North Macedonia-Kosovo gas interconnection line project
During the first part of 2019, ERO has continued to participate in the regional project "Southeast
Europe Natural Gas Transmission and Distribution Grid Codes Project" - Southeast Europe Project for
gas transmission and distribution codes”. This project is implemented by NARUC, USA - National
Agency for Regulatory Utility Commissioners with the financial support of the United States Agency
for International Development (USAID). In the framework of the implementation of the project with
the assistance of NARUC consultants, the 'cost-benefit' model of the analysis for the evaluation of gas
infrastructure projects has been prepared.
ERO, this year has continued its regular participation in the work of the Gas Working Group of the
Energy Community Regulatory Board (ECRB) and the Gas Forum, as well as in other regional events
organized within the Energy Community.

ANNUAL REPORT 2019
135
9 CONCLUSION
9.1 Challenges/Recommendations of the Regulator
ERO, as an independent agency was established by the Assembly of the Republic of Kosovo through
the Law on Energy Regulator no. 05/L-084, which defines its duties and functions. The legal
provisions of the above-mentioned law, emphasize that the activity of ERO is funded by own source
revenues, in accordance with the Law on Energy Regulator, Chapter 4, respectively from the taxes
collected by enterprises and licensed operators in the energy sector. It should also be mentioned
that Articles 21 and 22 of the Law on Energy Regulator clearly state ERO's right to use dedicated
revenues. Therefore, the above provisions prove beyond doubt that ERO has the authority and the
right to determine its own budget according to specific needs.
The Republic of Kosovo is a Contracting Party to the Energy Community, and as a contracting party
it is committed to adopt, but also to apply the Energy Community rules. This includes the Third
Energy Package, which envisages strict decision making and financial independence of the energy
regulator.
Chapter IX of the Internal Market Directive (Directive 2009/72/EC of the European Parliament and
of the Council), namely Article 35.5, requires, inter alia, that Member States ensure that the
regulatory authority has a separate allocation from the budget and autonomy in implementation of
its budget, ie. provide sufficient financial resources for operating and personnel expenses to fulfill
legal duties and obligations.
The Law on Energy Regulator No. 05/L-084 is in full compliance with the 3rd package of EU Energy
Legislation; the transposition of these provisions was an obligation from the Energy Community
Treaty.
It is worth emphasizing that the European Commission has consistently reacted to the Progress Reports for Kosovo, clearly pointing out the necessity for ERO's budget independence: "ERO's independence continues to be undermined by government intervention and interventions in the ERO budget process”.
ERO considers its staff as one of the resources of particular importance and is constantly engaged in
supporting them in order to provide the required knowledge, skills and expertise to fulfil their
duties and responsibilities at the highest standards. So far, ERO staff is now trained at the highest
level possible to fulfil all its duties and competencies. ERO is of the opinion that salaries of staff
members should be compatible with the level of salaries of the regulated industry in order to avoid
"brain drain" towards the industry and enable ERO to attract and retain human resources qualified
and sufficient to carry out its responsibilities. Therefore the involvement of ERO in Law on Salaries in
Public Sector strongly risks the departure of qualified ERO staff who can find better-paid and more
secure positions outside ERO.
ERO has consistently reacted during the drafting process of the Law on Salaries and addressed
letters to the Ministry of Public Administration, Parliamentary Committee on Public Administration,
expressing its concerns and disagreements. Despite the clear arguments, the Regulator’s objections
were not considered. It is worth pointing out that the Energy Community Secretariat on 19 July
2018 has also reacted on the involvement of the Energy Regulator in the Law on the Organization

ANNUAL REPORT 2019
136
and Functioning of the State Administration and the Independent Agencies and the Law on Salaries
in the Public Sector, clearly pointing out that these laws will seriously undermine the independence
of the Regulator. The Energy Community Secretariat therefore considers that the inclusion of the
Energy Regulator in these laws is a step backwards and is in contradiction with Kosovo's
commitments under the Energy Community Treaty, as well as with the Energy Community Policy
Guidelines, PG 02 / 2015, on the Independence of National Regulatory Authorities.
ERO requires from the legislative bodies to be treated as an independent constitutional agency that
responds to the Assembly of the Republic of Kosovo, and has autonomy in determining its budget,
including staff salaries.

ANNUAL REPORT 2019
137
ERO addresses
Energy Regulatory Office Street: Dervish Rozhaja no. 12 Prishtina 10000, Kosovo Tel: +383 (0) 38 247 615 Fax: +383 (0) 38 247 620 Email: [email protected]
Web: www.ero-ks.org
Energy Regulatory Office Board:
Tel: +383 (0) 38 247 615 ext. 101
Secretary:
Tel: + 383 (0) 38 247 615 ext. 104
Department for Customer Protection:
Tel. + 383 (0) 38 247 615 ext 116 and 125
Email: [email protected]