Embed Size (px)
Citation preview


Outlander PHEV
Forward-looking Statements
Mitsubishi Motors Corporation’s current plans, strategies, beliefs,
performance outlook and other statements in this annual report
that are not historical facts are forward-looking statements. These
forward-looking statements are based on management’s beliefs
and assumptions drawn from current expectations, estimates,
forecasts and projections. These expectations, estimates, forecasts
and projections are subject to a number of risks, uncertainties and
assumptions that may cause actual results to differ materially from
those indicated in any forward-looking statement. Mitsubishi Motors
Corporation, therefore, cautions readers not to place undue reliance
on forward-looking statements. Furthermore, any forward-looking
statements are subject to change as a result of new information,
future events or other developments.
¢ To Our Stakeholders . . . . . . . . . . . . . . . . . . . . . . . . . . . . . . 2
¢ Message from the CEO . . . . . . . . . . . . . . . . . . . . . . . . . . . 4
¢ Message from the CFO . . . . . . . . . . . . . . . . . . . . . . . . . . . 6
¢ Feature 1: Drive for Growth (Mid-Term Plan) . . . . . . . 8
¢ Feature 2: Focus on Core Markets . . . . . . . . . . . . . . . . . 10
¢ Feature 3: Formulation of a New Vision
and Mission . . . . . . . . . . . . . . . . . . . . . . . . . . . 12
¢ Feature 4: New Brand Strategy and Tagline,
“Drive Your Ambition” . . . . . . . . . . . . . . . . . . 13
¢ Management . . . . . . . . . . . . . . . . . . . . . . . . . . . . . . . . . . . . . 14
¢ Corporate Governance . . . . . . . . . . . . . . . . . . . . . . . . . . . . 17
¢ Overview of Operations by Region . . . . . . . . . . . . . . . . . 20
¢ Financial Section . . . . . . . . . . . . . . . . . . . . . . . . . . . . . . . . . 23
¢ Consolidated Subsidiaries and Affiliates . . . . . . . . . . . 34
¢ Principal Production Facilities . . . . . . . . . . . . . . . . . . . . . 36
¢ Investor Information . . . . . . . . . . . . . . . . . . . . . . . . . . . . . 37
Contents

Annual Report 2018 1

To Our Stakeholders
After a promising yet challenging year in 2016, in
2017 Mitsubishi exceeded its forecasts and demon-
strated its potential for a strong and quick recovery.
As announced, we launched our mid-term plan “Drive
for Growth” and efforts were made companywide
to achieve its main objectives. We sought to rebuild
customer trust, bring business performance back on
a V-shaped recovery and initiate sustainable growth.
Throughout the year, the Alliance has been an enabler
and an accelerator of these efforts.
In 2017, Renault, Nissan and Mitsubishi sold more
than 10.6 million vehicles and became the number one
automotive group for passenger cars and light com-
mercial vehicles. In 2018 we expect to exceed 11 million
vehicles, and forecast total annual sales of 14 million
units by 2022, which shall generate combined rev-
enues of ¥31.8 trillion. Size is a necessary but not suffi-
cient condition for success. Within the Alliance, we turn
our scale into a strong competitive advantage through
a patient and thoughtful strategy of convergence.
In March 2018, we accelerated convergence in such
functions as purchasing, engineering, manufactur-
ing and the supply chain. While ensuring each member
company remained autonomous, these convergence
moves benefited Mitsubishi in multiple ways. In pur-
chasing, first. Last year, Renault, Nissan and Mitsubishi
spent a total of 160,000 Oku-Yen in common purchas-
ing. Mitsubishi benefited by benchmarking Nissan and
looking at the Alliance best practices, and also from
common purchasing of raw materials like steel, plastic
and oil, which helped reduce our costs. In Manufacturing,
in the course of this fiscal year our Mitsubishi plant in
Indonesia will start producing Nissan vehicles based on
Mitsubishi XPANDER – and will soon benefit from more
joint plant utilization. Finally, in engineering, Mitsubishi
and Nissan joined efforts in developing next-generation
minicars. This cooperation helped reduce R&D costs and
investments. Mitsubishi also proved its contribution to
the Alliance by sharing its best practices in engineering,
bought-out parts and logistics in the ASEAN region. Its
PHEV technology will be also utilized as Alliance’s com-
mon technology in the future.
On top of accelerating convergence in Alliance
functions, we also extended our convergence to new
functions such as light commercial vehicles, business
development, after-sales service, quality and total
customer satisfaction.
All in all, in fiscal 2017, synergies of the Alliance
accounted for 28% of Mitsubishi’s operating
profit. This direct, positive impact of synergies on
Mitsubishi’s growth and profit will continue as all
three alliance member companies strive to achieve
the Alliance 2022 strategic plan.
Alliance 2022 calls for more than 9 million vehicles
to be produced using common platforms by 2022, and
for two-thirds of engines to be shared across Renault,
Nissan and Mitsubishi. Alliance members will benefit
from next-generation technologies and shared innova-
tion. Given the Alliance mindset to develop once and
share, each yen we spend in research and development
is amplified through the alliance. Mitsubishi plans to
spend ¥122.0 billion on R&D in fiscal 2018, while having
access to a wide array of technologies, as the Alliance
plans to invest a cumulative ¥6.6 trillion by 2022.
We look to the future of Mitsubishi with confidence.
The Alliance will continue to turbocharge its growth
and profit as well as Nissan Motor’s and Groupe
Renault’s. We’ve already made solid progress, yet there
is still much work to be done – and each member
company is responsible for its own performance.
Together we’ll deliver more and in a better way:
more and better products and services, more and better
technologies, more and better business opportunities.
We’ll also be more efficient by eliminating duplication,
pooling our capacities and resources, avoiding costs
and creating incremental revenue opportunities. These
win-win-win solutions will significantly contribute to
Mitsubishi’s growth and profit in the years to come.
I am confident that through the impact of the Alliance
and the efforts of all the men and women at Mitsubishi,
we will deliver the Drive for Growth objectives.
August 2018
We will make the most of the Alliance to turbo-
charge our growth and profit in a sustainable way
MITSUBISHI MOTORS CORPORATION2

Carlos Ghosn
Chairman of the Board
Annual Report 2018 3Annual Report 2018 3

Message from the CEO
While continuing to work to rebuild trust,
we will press ahead with establishing
a foundation for sustainable growth.
In fiscal 2017, the first year of the Drive for Growth mid-
term plan, we were able to make a good start, achiev-
ing targets that were even revised upward during the
fiscal year. I also find it very encouraging that our new
products, the XPANDER and Eclipse Cross, have been
launched successfully.
At the same time, the world situation is changing sub-
stantially on a daily basis, engendering various risks. More
than ever before, companies are compelled to pay atten-
tion to these risks and are being called on to respond flexibly.
We are doing our best to do so, while steadily achieving
a recovery in our operating performance, undertaking
reforms to rebuild trust and establishing the foundation
for profitable and sustainable growth.
Osamu Masuko
Member of the Board
Representative Director
CEO
MITSUBISHI MOTORS CORPORATION4

In October 2017, we formulated Drive for Growth, our
three-year mid-term plan through fiscal 2019.
(Please see pages 8–9 for details.)
This mid-term plan sets three key priorities to
address as we work to establish the foundation for
profitable and sustainable growth.
Our first priority is rebuilding trust that was tarnished
following the incident of fuel economy misrepresenta-
tion. We recognize that it will take time to restore the
trust of customers and society at large, but we are
making compliance our top priority and leveraging IT
in our unremitting efforts to dramatically reform and
enhance our internal control and governance structures.
Our second priority is putting the Company’s perfor-
mance on track to a V-shaped recovery. To date, our
sales volume has been around 1 million vehicles. We
aim to increase this level to 1.3 million vehicles by fis-
cal 2019. We are targeting sales of ¥2.5 trillion by that
date, representing a 30% increase from fiscal 2016. At
the same time, we will manage costs thoroughly to
boost the operating margin to 6% or more, in line with
our historic peak. To simultaneously raise volume and
enhance profitability, over the plan’s three-year period
we will invest more than ¥600 billion in development
and facilities to introduce new models and set business
foundations in place. Despite this aggressive invest-
ment, we will work to ensure positive free cash flow
each year and maintain a sound financial structure.
Our third priority is successful new model launch-
es. Centering on the SUV segment, which we expect
to continue growing, we will leverage our strength in
4WD vehicles and pickup trucks to further enhance
our product lineup. During the period of the mid-term
plan, we plan to introduce 11 new models. These
include the XPANDER and the Eclipse Cross, for which
we began production and sales in fiscal 2017. In addi-
tion to the ASEAN region, which is an area of strength,
we will focus on sales in other main markets, includ-
ing Japan, Oceania, the United States and China. By
succeeding in these new model launches, we aim to
enhance our brand and achieve growth in scale.
Automobiles and the business climate of the indus-
try are undergoing significant transformations. More
stringent environmental regulations imposed by each
country cannot be met by simply increasing IC engine
efficiency or reducing vehicle weight. Carmakers
around the world are thus investing resources in
electrified vehicles one after another, resulting in full-
scale competition. In addition, markets are expecting
autonomous driving technologies and sophisticated
safety features such as emergency brakes as standard
equipment. Along with increasing connectivity, devel-
opment of vehicle intelligence is gaining momentum.
With the management environment changing at
unimaginable speed, Mitsubishi Motors recognizes that
in order to continue existing and growing, the Company
must respond to these changes and take the initia-
tive in transforming itself. To this end, we aim to take
full advantage of the Alliance’s strengths. At the same
time, we will further hone our own SUV and electrifica-
tion technologies and contribute toward the Alliance.
In addition, through the concentrated investment of
management resources in regions and technologies in
which we excel, we aim to build a foundation that will
enable us to remain competitive amid the major chang-
es in the operating environment that are underway.
Mitsubishi Motors will continue working to trans-
form itself in order to deliver new value and remain a
company that society truly needs.
August 2018
Annual Report 2018 5

Message from the CFO
0
40
80
120
160
2018(Target)
201720162015201420132012
Capital Expenditures
(Billions of yen)
(FY)
51.4
72.2 68.0 69.058.1
99.9
135.0
We are responding to the expectations
of a wide range of stakeholders by
ensuring a balance between growth
and profits.
Performance in the Year Ended March 31, 2018
In fiscal 2017, we kicked off the three-year mid-term
business plan, Drive for Growth, to build a foundation
for profitable and sustainable growth. During the year,
we focused on the three main goals of the plan, name-
ly: “rebuilding trust that was tarnished following the
incident of fuel economy misrepresentation,” “putting
the Company’s performance on track to a V-shaped
recovery” and “launching new models successfully.”
Our sales volume for the year amounted to 1,101
thousand units, up 175 thousand units year on year.
Due to this increase, net sales expanded ¥285.8 billion,
to ¥2,192.4 billion. Operating profit grew ¥93.1 billion
year on year, to ¥98.2 billion, due to higher unit sales
and cost-lowering efforts, plus a decrease in costs
on quality measures in the market. Profit attributable
to owners of the parent moved back into the black,
improving ¥306.1 billion, to ¥107.6 billion.
Outlook for the Year Ending March 31, 2019
In fiscal 2018, we aim to increase sales volume by 149
thousand units year on year, to 1,250 thousand units,
by introducing new models and expanding sales in the
ASEAN region and China. As a result, we anticipate a
¥207.6 billion rise in net sales, to ¥2.4 trillion. We ex-
pect operating profit to increase ¥11.8 billion, to ¥110.0
billion. We forecast that sales-related factors will
deliver a ¥41.0 billion positive impact, and cost reduc-
tions and other measures will account for ¥26.0 bil-
lion, with the overall figure taking into account higher
R&D and other expenses, as well as the impact of yen
appreciation. We forecast ¥110.0 billion in profit attrib-
utable to owners of the parent, up ¥2.4 billion year on
year. For fiscal 2018, we plan to pay dividends of ¥20
per share, up ¥3 from the fiscal 2017 figure, taking a
balance with investment in growth into consideration.
Koji Ikeya
Executive Vice President CFO
Operating Performance and Forecast
(Billions of yen, thousands of units)
FY2017 (Actual) FY2018 (Forecast)
Sales volume (retail) 1,101 1,250
Net sales 2,192.4 2,400.0
Operating profit 98.2 110.0
Net income attributable to owners of the parent
107.6 110.0
MITSUBISHI MOTORS CORPORATION6

0
40
80
120
160
2018(Target)
201720162015201420132012
R&D Expenses
(Billions of yen)
(FY)
59.9 67.574.6 78.7
89.0102.5
122.0
0
150
300
450
600
201720162015201420132012
Cash and Deposits/Interest-Bearing DebtCash and depositsInterest-bearing debt(Billions of yen)
(FY)
364.4409.5
222.4
450.1 440.3 453.4
556.8
144.5
27.1 15.6 26.6
571.9
Initiatives in Fiscal 2018
In fiscal 2017, we launched new models according to
plan, and performance outpaced our forecasts, put-
ting us firmly on a V-shaped recovery path. Fiscal
2018, the second year of our mid-term business plan,
will be an important year to ensure that Mitsubishi
Motors remains firmly on this path.
To establish the foundations for profitable and
sustainable growth, in fiscal 2018 we will continue
to invest proactively. At the same time, we will
work toward our goals of expanding scale and in-
creasing profitability.
First, while increasing sales we will invest proac-
tively in future growth—an area where we fell short in
the past. We also plan to maintain healthy cash flow
and return profit to shareholders, after making the
necessary investments.
Regarding capital investment, we will continue to
step up investment in new products, manufacturing
and IT.
In R&D, we will reinforce the development of new
models for future launches. We will continue to aug-
ment development resources to hone our SUV and
electrification technologies.
Meanwhile, we will support purchases by custom-
ers in Japan by providing a wide range of attractive
financial services and enhance after-sales services.
To this end, in April 2018 we converted MMC Diamond
Finance Corporation, a sales financing company, into a
wholly owned subsidiary. In this manner, we will work
to strengthen our domestic sales structure by pro-
moting sales measures along with financial services.
Annual Report 2018 7

We will renew our product lineup, grow in core markets,
optimize costs and invest aggressively to solidify
our foundation for sustainable growth.
Feature 1: Drive for Growth (Mid-Term Plan)
Based on “Drive for Growth,” Mitsubishi Motors’ three-
year mid-term plan that concludes in fiscal 2019, the
Company will build a foundation for profitable and
sustainable growth by moving forward with efficiency
improvements, renewing product lineups and achiev-
ing growth in core markets.
“Drive for Growth” sets four key performance indi-
cators (KPIs) to be achieved by fiscal 2019: sales vol-
ume (retail) of 1.3 million units, amounting to a 40%
increase from fiscal 2016; net sales of ¥2.5 trillion,
up 30% from fiscal 2016; an operating profit margin
of 6% or more; and positive free cash flow during all
three years of the plan.
Our strategic actions for achieving these aims are
product renewal, a focus on core markets and cost
optimization. Using these strategic actions, we will
further strengthen our lineups in SUVs, four-wheel-
drive vehicles and pickup trucks, and introduce 11
models, including the new XPANDER and the new
Eclipse Cross. By renewing the product lineup in this
way, we aim to simultaneously increase sales in the
ASEAN region, Oceania, the United States, China and
Japan. At the same time, we will continue to enact
thorough cost management and build an efficient and
disciplined operating structure.
Furthermore, we will solidify our foundation for
sustainable growth through capital investment and
aggressive investment in new-vehicle development.
In fiscal 2019, the final year of Drive for Growth,
we anticipate capital investment of ¥137.0 billion,
amounting to 5.5% of net sales. We also anticipate
R&D expenditure for the year of ¥133.0 billion.
Four Key Performance Indicators (KPIs)
0
300
600
900
1,200
1,500
2019Target
20172016
Sales volume (retail)
(Thousands of units)
(FY)
926
1,101
1,300
0
500
1,000
1,500
2,000
2,500
2019Target
20172016
Net sales
(Billions of yen)
(FY)
2,500.0
1,906.6
2,192.4
0
2
4
6
8
10
2019Target
20172016
Operating profit
(%)
(FY)
6.0 or higher6.0 or higher
0.3
4.5
-150
-50
0
50
100
2019Target
20172016
Free cash flow
(Billions of yen)
(FY)
-118.9
22.5
Positive freecash flow
Positive freecash flow
MITSUBISHI MOTORS CORPORATION8

Substantial Increases in Capital Investment and R&D Expenditure
Product RenewalRevenue Growth through
Focus on Core MarketsCost Optimization
During the period of the Drive for
Growth plan, Mitsubishi Motors will
introduce 11 models. Of these, six will
be new models or full model changes of
existing models. We will introduce these
models at a rate of two per year. We
expect our five main models of SUVs,
four-wheel-drive vehicles and plug-
in hybrid vehicles—Mitsubishi Motors’
strengths—to account for 70% of our
global sales volume. Furthermore, amid
the shift to low-emission gas vehicles,
from 2020 we plan to offer electric
power-trains for core models, including
minicar EVs.
The ASEAN region is the largest and
highly profitable market for Mitsubishi
Motors. One key factor is growth in
sales of the new XPANDER, which is
being manufactured at a new plant in
Indonesia that commenced operations
in 2017. We aim to increase sales vol-
ume in the ASEAN region from 206,000
units to 310,000 units by fiscal 2019. In
Japan, we will introduce a new minicar.
In the United States, we will step up
sales activities in the aim of boosting
annual sales volume by 30%, to 130,000
units, by fiscal 2019. In China, we will
double our dealer network in the aim
of more than doubling sales volume, to
220,000 units by fiscal 2019.
In addition to thoroughly managing
costs, Mitsubishi Motors will substan-
tially increase R&D expenditure. That
being said, we intend to reduce total
manufacturing costs—including devel-
opment, manufacturing and logistics
expenditures—by 1.3% per year. While
managing these costs, as an alliance
member Mitsubishi Motors will benefit
from more than ¥100.0 billion in syn-
ergies during the period of the plan,
including synergies arising from joint
purchasing and R&D cost avoidance.
We will accelerate our aggressive investment in
growth, building a foundation to support future
expansion. Specifically, by the final year of the plan
(fiscal 2019), we will increase capital investment to
¥137.0 billion (5.5% of new sales) and R&D expendi-
ture to ¥133.0 billion (5.3% of net sales). As a result of
Eclipse Cross XPANDER
Infrastructure Development
Strategic Actions
this aggressive investment, we expect to spend more
than ¥600.0 billion on capital and R&D investments
over the three-year period. As a result, we will put in
place the development and production structures to
support growth in scale.
Annual Report 2018 9
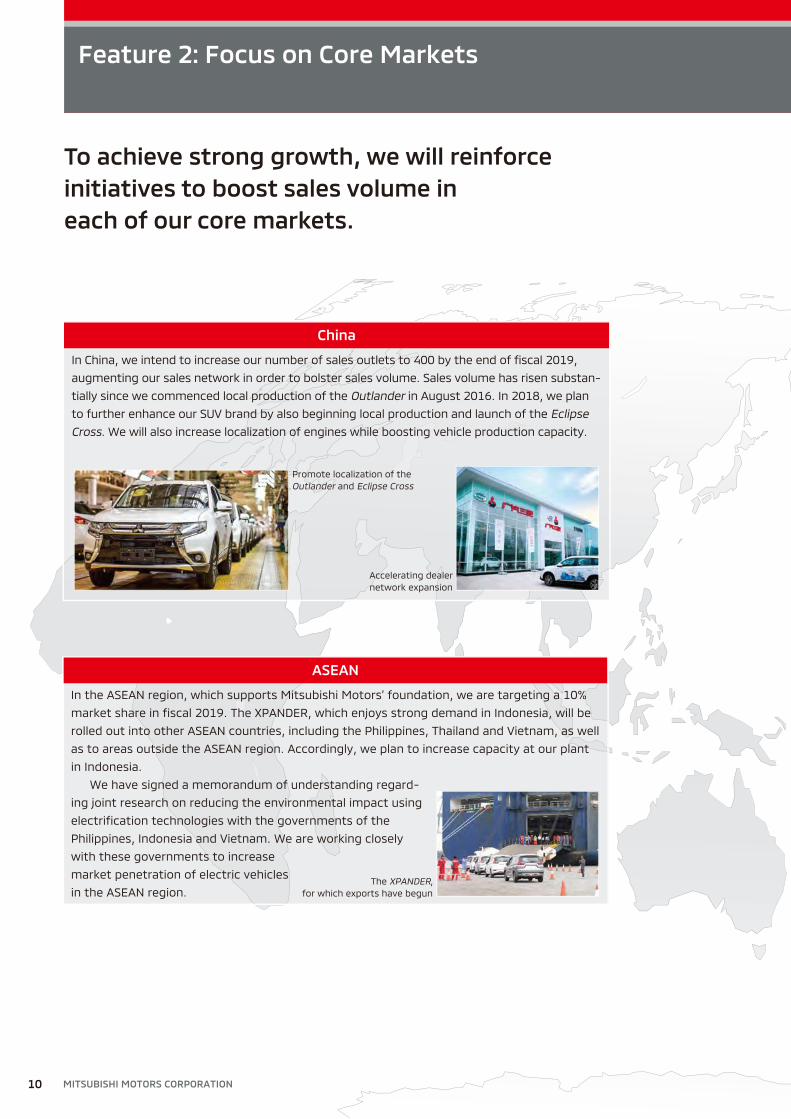
To achieve strong growth, we will reinforce
initiatives to boost sales volume in
each of our core markets.
Feature 2: Focus on Core Markets
MITSUBISHI MOTORS CORPORATION10
Promote localization of the
Outlander and Eclipse Cross
Accelerating dealer
network expansion
China
In China, we intend to increase our number of sales outlets to 400 by the end of fiscal 2019,
augmenting our sales network in order to bolster sales volume. Sales volume has risen substan-
tially since we commenced local production of the Outlander in August 2016. In 2018, we plan
to further enhance our SUV brand by also beginning local production and launch of the Eclipse
Cross. We will also increase localization of engines while boosting vehicle production capacity.
ASEAN
In the ASEAN region, which supports Mitsubishi Motors’ foundation, we are targeting a 10%
market share in fiscal 2019. The XPANDER, which enjoys strong demand in Indonesia, will be
rolled out into other ASEAN countries, including the Philippines, Thailand and Vietnam, as well
as to areas outside the ASEAN region. Accordingly, we plan to increase capacity at our plant
in Indonesia.
We have signed a memorandum of understanding regard-
ing joint research on reducing the environmental impact using
electrification technologies with the governments of the
Philippines, Indonesia and Vietnam. We are working closely
with these governments to increase
market penetration of electric vehicles
in the ASEAN region.The XPANDER,
for which exports have begun

Annual Report 2018 11
Launching the new 2019 model year
Outlander PHEV
“Night Showroom”
United States
In the United States, we intend to boost sales volume by 30% by fiscal 2019. To this end,
we introduced the Eclipse Cross and the Outlander PHEV in the second half of fiscal 2017. In
2017, Mitsubishi Motors enjoyed the largest growth among the mass brands. In fiscal 2018,
we will focus on building a stronger sales network and on further expanding sales.
Japan
In Japan, to increase sales volume we launched the Eclipse Cross in March 2018 and plan to
introduce the new DELICA D:5 and a new minicar. The “Night Showroom,” a sales initiative
that provides a showroom experience involving the Eclipse Cross, was well received. We plan
to expand the program to include the Outlander PHEV and other models and adopt more dig-
ital marketing tools that enable customers who are unable to visit our outlets to learn more
about our products’ appeal.
Oceania
Oceania is another area of strength for Mitsubishi Motors that ranks alongside the ASEAN
region. We enjoy a stable market share of around 7% in Australia and New Zealand. In fiscal
2017, our market share reached a record high in each of the two countries. We are further
expanding our lineup, including through the 2017 launch of the Eclipse Cross.
Starting the sales of
the Eclipse Cross
Accelerating the deployment of
Dendo Drive Stations
Starting the sales of
the Eclipse Cross
Keeping the positive sales of
the Triton

Feature 3: Formulation of a New Vision and Mission
In the aim of being a company that society considers neces-
sary, we have formulated a new corporate vision and mission
to serve as common guiding principles for the people of the
Mitsubishi Motors Group as we look toward the future.
Mitsubishi Motors established its corporate philoso-
phy in 2005. Since then, both the Company and the
external environment have undergone significant
changes. Against this backdrop, our ambition is to
rebuild trust and be a company that society needs. At
the same time, we believe that all the people working
for Mitsubishi Motors should be aligned under a com-
mon vision and work together as they look toward the
future. To this end, we have developed the new corpo-
rate vision and mission to serve as guiding principles.
The vision and mission define the Company’s most
important philosophy: the values that we intend to
deliver to customers and society and the society that
we intend to create. We also formulated the MMC
Way, which are the standards of behavior that will
turn the vision and mission into reality. In addition, in
April 2018 we created the Global Code of Conduct. All
corporate officers and employees must respect this
code, which replaced the former corporate ethical
guidelines. We are enhancing our efforts to cultivate
understanding of all members of the team, enabling
them to share the same approach and be aligned
toward a common goal.
MITSUBISHI MOTORS CORPORATION12

Feature 4: New Brand Strategy and Tagline, “Drive Your Ambition”
We have unveiled a new brand strategy and tagline,
“Drive Your Ambition.” The new tagline describes
the direction of the Company and is a clear statement of
our commitment to vehicle manufacturing.
The newly formulated brand tagline, “Drive Your
Ambition,” is the first Mitsubishi Motors has formu-
lated in 10 years.
“Drive Your Ambition” describes the direction of
the Company.
Motorized society is entering a new period of reform
that will make society safer, more secure and more
convenient than ever before. To welcome this new era,
Mitsubishi Motors will hone the technologies it has accu-
mulated to date and provide new value to take the lead
in a new era and usher in a bountiful motorized society.
The new value we provide will introduce alto-
gether new experiences to our customers. We aim
to continue facilitating a greater scope of activity for
our customers and enable them to take on a host of
new challenges.
“Drive your Ambition” also embodies a commit-
ment from us. Our major ambition will generate prod-
ucts and services that are original and have a sense of
presence, enabling us to grow along with customers
around the world.
Communication Mark
As a global tagline, Drive your Ambition functions
as the center or kernel of the Mitsubishi Motors
brand. Starting in October 2017, it has been dis-
played in association with the Mitsubishi Motors
corporate mark in advertisement and promotional
communications.
Annual Report 2018 13

Members of the Board
Shunichi MiyanagaMembers of the Board(Outside Director)
Apr. 1972 Joined Mitsubishi Heavy Industries, Ltd.Jun. 2008 Member of the Board, Executive Vice President,
Mitsubishi Heavy Industries, Ltd.Apr. 2011 Member of the Board, Senior Executive Vice President,
Mitsubishi Heavy Industries, Ltd.Apr. 2013 Member of the Board, President,
Mitsubishi Heavy Industries, Ltd.Apr. 2014 Member of the Board, President, CEO,
Mitsubishi Heavy Industries, Ltd. (to the present)Jun. 2014 Member of the Board, MMC (to the present)
Ken KobayashiMembers of the Board(Outside Director)
Jul. 1971 Joined Mitsubishi CorporationApr. 2003 Senior Vice President, General Manager of Singapore Branch,
Mitsubishi CorporationJun. 2004 Senior Vice President, Division COO of Plant Project Div.,
Mitsubishi CorporationApr. 2006 Senior Vice President, Division COO of Ship, Aerospace &
Transportation Systems Div., Mitsubishi CorporationApr. 2007 Executive Vice President, Group CEO of Industrial Finance,
Logistics & Development Group, Mitsubishi CorporationJun. 2007 Member of the Board, Executive Vice President,
Group CEO of Industrial Finance, Logistics & Development Group, Mitsubishi Corporation
Jun. 2008 Executive Vice President, Group CEO of Industrial Finance, Logistics & Development Group, Mitsubishi Corporation
Apr. 2010 Senior Executive Vice President, Executive Assistant to President, Mitsubishi Corporation
Jun. 2010 Member of the Board, President & CEO, Mitsubishi CorporationApr. 2016 Chairman of the Board, Mitsubishi Corporation (to the present)Jun. 2016 Member of the Board, MMC (to the present)
Carlos GhosnChairman of the BoardRepresentative Director
Oct. 1996 Joined RenaultDec. 1996 Executive Vice President, RenaultJun. 1999 Director and COO, Nissan Motor Co., Ltd.Jun. 2000 President and COO, Nissan Motor Co., Ltd.Jun. 2001 President and CEO, Nissan Motor Co., Ltd.Jun. 2003 Co-Chairman, President and CEO, Nissan Motor Co., Ltd.Apr. 2005 Board of Director, CEO, Renault
Chairman and President, Renault-Nissan B.V. (to the present)Jun. 2008 Chairman of the Board, President and CEO, Nissan Motor
Co.,Ltd.May 2009 Chairman of the Board and CEO, Renault (to the present)Dec. 2016 Chairman of the Board, MMC (to the present)Apr. 2017 Chairman of the Board, Nissan Motor Co., Ltd. (to the
present)
Osamu MasukoMember of the BoardRepresentative DirectorCEO
Apr. 1972 Joined Mitsubishi CorporationApr. 2003 Senior Vice President, Division COO of Motor Vehicle Business
Div., Mitsubishi CorporationJun. 2004 Managing Director, in charge of Overseas Operations Group
Headquarters, MMCJan. 2005 President, Chief Business Ethics Officer, MMCOct. 2007 President, MMCJun. 2014 Chairman of the Board and CEO, MMCJun. 2016 Chairman of the Board, President and CEO, MMCDec. 2016 President and CEO, MMCJun. 2017 Member of the Board and CEO, MMC (to the present)
Management (As of June 22, 2018)
MITSUBISHI MOTORS CORPORATION14

Members of the Board
Setsuko EgamiMembers of the Board(Outside Director)
Apr. 1983 Editor in Chief of Travaille published by Recruit Co., Ltd. (present: Recruit Holdings Co., Ltd.)
Dec. 2001 Director, Frontier Service Development Laboratory, East Japan Railway Company
Apr. 2006 Visiting Professor, The Okuma School of Public Management, Waseda University
Nov. 2006 Member of Government Tax CommissionJun. 2007 Outside Corporate Auditor, Taisho Pharmaceutical Co., Ltd.Apr. 2009 Professor, Graduate School of Humanities,
Musashi University (to the present) Professor, Faculty of Sociology, Musashi University (to the present)
Jun. 2011 Outside Audit & Supervisory Board Member, Yusen Logistics Co., Ltd. (to the present)
Apr. 2012 Dean, Faculty of Sociology, Musashi UniversityJun. 2015 Outside Director, Mitsubishi Estate Co., Ltd. (to the present)Jun. 2018 Member of the Board, MMC (to the present)
Hitoshi KawaguchiMembers of the Board(Outside Director)
Apr. 1976 Joined Nissan Motor Co., Ltd.Apr. 2005 Senior Vice President in charge of Human Resources,
Diversity Development Office, Nissan Motor Co., Ltd.Apr. 2009 Senior Vice President in charge of External and
Government Affairs, Intellectual Asset Management, Nissan Motor Co., Ltd.
Apr. 2016 Senior Vice President, CSO (Chief Sustainability Officer) in charge of Global External and Government Affairs, Japan Communication, Corporate Service Management Department, CSR Department, Nissan Motor Co., Ltd. (to the present)
Dec. 2016 Member of the Board, MMC (to the present)
Main KohdaMembers of the Board(Outside Director)
Sep. 1995 Started independently as Novelist (to the present)Jan. 2003 Member of Financial System Council, Ministry of Finance JapanApr. 2004 Visiting Professor, Faculty of Economics, Shiga UniversityMar. 2005 Member of the Council for Transport Policy, Ministry of Land,
Infrastructure, Transport and TourismNov. 2006 Member of Government Tax CommissionJun. 2010 Member of the Board of Governors,
Japan Broadcasting CorporationJun. 2012 Outside Director, Japan Tobacco Inc. (to the present)June 2013 Outside Director and member of the Compensation
Committee, LIXIL Group Corporation (to the present)Jun. 2016 Outside Director and member of the Audit Committee,
Japan Exchange Group (to the present)Jun. 2018 Member of the Board, MMC (to the present)
Hiroshi KarubeMembers of the Board(Outside Director)
Apr. 1980 Joined Nissan Motor Co., Ltd.Apr. 2010 Corporate Vice President, in charge of Global Controller,
Budget and Accounting Dept., Global Asset Management Dept., Nissan Motor Co., Ltd.
Dec. 2016 Member of the Board, MMC (to the present)Apr. 2018 Senior Vice President, in charge of Global Controller (MC &
Global Function), Accounting, Global Asset Management, Nissan Motor Co., Ltd.
May 2018 Chief Financial Officer (CFO), in charge of Finance, Control, IR, M&A Support, Nissan Motor Co., Ltd. (to the present)
Annual Report 2018 15

Management
Kozo ShirajiAudit & Supervisory Board Member(Full-Time)
Osamu MasukoCEO
Noboru TsujiSenior Vice President(Corporate Strategy)
Masao OmichiCorporate Vice PresidentChief External and Government Relations Officer,Chief Environmental Strategy Officer
Yoshikazu NakamuraAudit & Supervisory Board Member(Full-Time)
Trevor MannCOO
Yukihiro HattoriSenior Vice President(Procurement)
Vincent CobeeCorporate Vice President(Product Strategy/PD)Division General Manager,Product Strategy Div.And Division General Manager,PD Office
Hiroshi NodaCorporate Vice PresidentDivision General Manager,Controlling & Accounting Div.
Koji YamadaCorporate Vice PresidentDivision General Manager,TSC Div.
Katsunori NagayasuAudit & Supervisory Board Member(Outside Audit & Supervisory Board Member)
Mitsuhiko YamashitaExecutive Vice President(Engineering)
Guillaume CartierSenior Vice President(Global Marketing & Sales)Division General Manager,Global Marketing & Sales Div.
Naoya FujimotoCorporate Vice PresidentDivision General Manager,Product Development Div.
Koichi KitamuraCorporate Vice PresidentDivision General Manager,Business Administration Div.And Assistant Division General Manager,Controlling & Accounting Div.
Masao KurumaCorporate Vice PresidentCIODivision General Manager,Global IT Div.
Satoru NakayamaCorporate Vice PresidentGeneral Manager, CFO Office
Yaeko TakeokaAudit & Supervisory Board Member(Outside Audit & Supervisory Board Member)
Koji IkeyaExecutive Vice President(Finance, Controlling & Accounting)CFO
Hitoshi InadaCorporate Vice President(Corporate Governance)
Tsunehiro KunimotoCorporate Vice PresidentDivision General Manager,Design Div.
Tetsuya HashimotoCorporate Vice PresidentDivision General Manager,Human Resources Div.
Jun MiuraCorporate Vice PresidentDivision General Manager,Development Management Div.
Yoshitsugu ObaAudit & Supervisory Board Member(Outside Audit & Supervisory Board Member)
Takeshi AndoExecutive Vice President(Production)
Yoichi YokozawaCorporate Vice PresidentDivision General Manager,Strategy Management Div.
Yoichiro YatabeCorporate Vice PresidentDivision General Manager,ASEAN Div.
Yosuke WakabayashiCorporate Vice PresidentDivision General Manager,Corporate Affairs Div.
Kazuaki IwamotoCorporate Vice President(Global Risk Control)
Kiyoshi FukasawaCorporate Vice PresidentDivision General Manager,Domestic Sales Div.
Takahide TsujitaniCorporate Vice President(Alliance Procurement)
Audit & Supervisory Board Members
Executive Officers
MITSUBISHI MOTORS CORPORATION16

Corporate Governance
General Meeting of ShareholdersGeneral Meeting of Shareholders
Corporate Governance Framework (As of April 1, 2018)
Accounting audit
Accounting AuditorAccounting AuditorReport
Audit/Report
Audit
Cooperation
EC (Executive Committee)EC (Executive Committee)
PDM (Product Meeting)PDM (Product Meeting)
CEOCEO
COOCOO
Audit & SupervisoryBoard Member/
Audit & Supervisory Board
Audit & SupervisoryBoard Member/
Audit & Supervisory Board
Board of DirectorsBoard of Directors
Report
InstructionReport
Audit divisionAudit division
Subsidiaries and associatesSubsidiaries and associates
DepartmentsDepartments
Report and submit(Operating Units)Appoint, dismiss
Delegate authoritySupervise
Quality auditInternal audit
Quality auditInternal audit
CFOCFO
Internal Control CommitteeInternal Control Committee
Structure of meetingsrelated to internal control
Structure of meetingsrelated to internal control
J-SOX Promotion CommitteeJ-SOX Promotion Committee
Basic Policy and Framework for
Corporate Governance
Considering compliance to be of topmost importance,
MMC aims to meet the expectations of sharehold-
ers, customers and all other stakeholders and achieve
sustainable growth and increases in corporate value
by making the ongoing reinforcement and improve-
ment of governance as a management priority.
System of Corporate Governance
To increase the flexibility of business execution, clarify
management responsibilities and appropriately over-
see business execution, the Company has introduced a
structure of various committees including the Execu-
tive Committee and an executive officer system, in
addition to statutory organizations, with the intention
of improving and strengthening corporate governance.
The Board of Directors makes decisions on im-
portant management issues and oversees business
execution, and consists of eight directors, six of whom
oversee business execution as Non-Executive Direc-
tors with considerable experience and a high level of
insight. To increase the speed of decision-making, the
Company has also established and operates a struc-
ture of various committees that deliberate or report
on important management issues.
In addition, in order to separate management over-
sight and business execution functions to promptly
and flexibly respond to changes in the business envi-
ronment, the Company has introduced an executive
officer system to expedite management decision-
making by delegating authority and other measures.
Moreover, to conduct appropriate audits of busi-
ness execution, the Company has established an Audit
& Supervisory Board consisting of five members.
Three of the Audit & Supervisory Board members are
outside members, thus enabling the Company to es-
tablish a highly independent auditing system.
Audit & Supervisory Board members’ Audits
and Internal Audits
The Audit & Supervisory Board members carry out
audits of the status of business execution of the MMC
Group by attending important MMC meetings, such as
Board of Directors meetings, to receive reports on the
status of business activities from the Board members,
executive officers and other corporate officers, re-
viewing key internal documents, and receiving reports
from the internal audit department, accounting audi-
tors and subsidiaries and associates.
Annual Report 2018 17
Corporate Governance
Risk Management
Development of Risk Management Framework
MMC has put in place and works to improve its risk
management system for the entire Group through
three types of risk management activities: priority risk
management, departmental risk management and af-
filiated company risk management.
For priority risk management, we select risks that
the entire MMC Group faces directly, that have a high
potential impact and a high degree of urgency. For
each risk, we assign “risk owners,” who are at the ex-
ecutive officer level or above, to reduce these risks as
quickly as possible.
In departmental risk management, we have ap-
pointed risk management officers to each division
or plant. These officers work to reduce risks through
repeated application of the PDCA cycle which involves
identifying and evaluating each risk, devising and
implementing countermeasures, and monitoring.
Affiliated company risk management includes ini-
tiatives for addressing various types of risks encoun-
tered by MMC’s affiliated companies. The Company
regularly confirms the status of activities, such as the
reinforcement of compliance systems, and we pro-
pose and direct improvements, as necessary.
These risk management activities are regularly
reported to the Board of Directors as key internal con-
trol measures.
In addition, to prepare for unforeseen contingen-
cies MMC has developed emergency contact systems
that enable the rapid communication of information
to management and other key personnel, as well as a
swift and accurate response. In particular, to create a
crisis management system to respond when serious
incidents occur, we have formulated an emergency
response manual. This manual outlines the establish-
ment of an emergency response organization and
clarifies the chain of command, enabling us to put
appropriate response systems in place.
MMC’s basic policy in times of disaster—such as
earthquakes or other natural disasters or an outbreak
of an infectious disease—is to ensure the safety of
customers, as well as employees and their families,
and assist local communities. We are preparing disas-
ter countermeasures and business continuity plans
(BCPs) to this end.
We regularly conduct drills in communicating among
various manufacturing facilities and Group companies
on the basis of a simulated emergency situation.
As preparations against the possibility that em-
ployees will be unable to return to their homes for
In accordance with auditing policies established
by the Audit & Supervisory Board, important audit-
ing items for each fiscal year, allocation of duties
and other matters, the Audit & Supervisory Board
members conduct interviews of the top executives of
each internal division and hold visiting audits at each
factory and subsidiaries and associates in Japan and
overseas, and, based on the results, hold discussions
at Audit & Supervisory Board meetings. In addition,
Audit & Supervisory Board members regularly report
to the Board of Directors and exchange opinions with
the CEO and COO.
In addition, MMC has established the Internal Au-
dit Dept. and the Quality Audit Dept. as Internal Audit
departments within the Audit Div., an independent
organization that reports directly to the CEO.
The Internal Audit Dept. conducts planned internal
audits to determine whether operational manage-
ment of MMC and subsidiaries and associates in Japan
and overseas is being conducted with transparency
using appropriate processes. The Quality Audit Dept.
audits the appropriateness of quality-related activities
by MMC and subsidiaries and associates in Japan and
overseas. Audit results are reported directly to the CEO.
The Audit & Supervisory Board members regularly
exchange information and works to strengthen coop-
eration with the Audit Div. and the Accounting Auditors.
Internal Control System
Development of Internal Control System
Based on the “Basic Policy on the Establishment of
Internal Control Systems” as passed by the Board
of Directors, the Company strives to improve and
strengthen its monitoring of the status of operations
and its internal control systems in the Internal Control
Committee, with the CEO as chairman and the Global
Risk Control Officer as vice chairman. In addition, in
fiscal 2017 we formulated a new vision and mission
that encompasses the entire Group, including subsid-
iaries, to establish basic concepts based on which all
Group members act and ensure sustainable growth.
We also established the MMC Way, outlining the stan-
dards of behavior for every employee to follow to
make the vision and mission a reality. Underlying these
standards, we formulated the Global Code of Conduct
that every corporate officer and employee must re-
spect. As we continue working to respond to changes
in the internal and external environment, we will strive
for ongoing improvements and enhancements in
complying with laws and regulations and ensuring the
appropriateness and efficiency of business execution,
and endeavor to further bolster governance.
MITSUBISHI MOTORS CORPORATION18

a three-day period, the MMC headquarter is work-
ing with local municipal authorities to ensure means
through which they can communicate with their fami-
lies and cache emergency supplies.
We have formulated action plans that assume
a large-scale earthquake or a major outbreak of an
infectious disease. We work to improve these BCPs
through regular drills with individual regions.
Compliance
Basic Approach
In their corporate activities, companies come into
contact with a host of laws and public systems involv-
ing the environment, labor and consumer protection
that they must comply with.
Mitsubishi Motors recognizes that failure to com-
ply appropriately with these laws and systems could
hinder its business sustainability and have a major
impact on society and the global environment.
To fulfill its corporate social responsibility, the Com-
pany must respect laws and regulations, international
rules and Company rules and pay utmost respect to
changing social norms. For these reasons, we have for-
mulated the new Global Code of Conduct, which out-
lines the rules that all corporate officers and employees
must respect. We are also focusing on enhancing the
compliance system including key affiliated companies
in Japan and overseas, and employee education.
We have drafted measures to prevent recurrence
of the improper conduct in fuel economy testing
that was discovered in April 2016, and are continuing
our response.
Promotion System
Taking a global perspective on internal control, we
have in place systems to prevent compliance infrac-
tions, including information security incidents. Compli-
ance officers under the supervision of the Global Risk
Control Officer are appointed at each division, and the
general manager of each department serves as the
code leader. We also have a framework in place by
which compliance officers are appointed at principal
affiliated companies in Japan and overseas.
We also have a procedure by which any seri-
ous compliance concerns are ultimately reported to
the Board of Directors through the code leaders and
compliance officers. To instill among all employees the
awareness that compliance is a top priority, compli-
ance officers instruct responsible departments, as ap-
propriate, on handling issues, taking corrective action
and undertaking measures to prevent recurrence.
¢ Establishment of Internal and External Consultation
Offices (Helplines)
Mitsubishi Motors has established internal and external
consultation offices to prevent and promptly detect fraud
or other improper conduct as well for use in self-correction.
The internal employee consultation office offers counseling
to employees of Mitsubishi Motors and affiliated compa-
nies in Japan, and the external consultation office works
with outside attorneys. In addition to a Business Partner
Helpline, in fiscal 2018 we established a new Mitsubishi
Motors Global Whistleblowing Office for use by employees
of Mitsubishi Motors and key affiliated companies in Japan
and overseas.
¢ Education and Training
Every fiscal year we formulate compliance-related educa-
tion and training programs and provide them for each job
rank. Each division also draws up and conducts its own
measures under the direction of the compliance officer.
¢ Anti-Corruption
The Company has formulated the Global Code of Conduct,
which states that we shall “comply with all applicable laws
and regulations” and “maintain impartial and fair relation-
ships with public servants as well as business partners” In
addition, we have created and operate a framework to pre-
vent corrupt practices.
¢ Information Security
We have in place the Information Security Policy and inter-
nal rules, which we share with key affiliated companies in
Japan and overseas. In addition, we have established an
information security committee, and monitor information
security activities in an effort to reduce security risks.
¢ Protection of Personal Information
Based on its Privacy Policy, Mitsubishi Motors has in place
a management framework to establish internal rules
regarding protection of personal information. In addition,
we conduct ongoing employee education via e-learning.
Furthermore, we have established a team tasked with
responding to personal information protection laws in
countries around the world.
¢ Security Export Controls
From the perspective of maintaining international peace
and security, the Company manages exports stringently
to ensure against the proliferation of weapons of mass
destruction and prevent the excessive accumulation of
conventional weapons. We have formulated Security
Export Control Regulations and set up the Security Export
Control Committee under the CEO having ultimate author-
ity and responsibility for overall security export control.
With this control framework, we work to ensure the legal-
ity of our export transactions.
Annual Report 2018 19

Performance in the year ended March 31, 2018
In the year ended March 31, 2018, our sales volume (retail) in the Japanese mar-
ket rose 18,000 units year on year, or 23%, to 98,000 units, due to a recovery in
minicars and favorable sales from the startup of the Eclipse Cross.
In line with the increase in sales volume, sales rose ¥52.1 billion year on year,
to ¥349.4 billion. The operating loss improved ¥21.7 billion from the previous fis-
cal year to ¥14.1 billion.
Outlook for the year ending March 31, 2019
In the year ending March 31, 2019, we expect to introduce new model and see
an increase in sales of the Eclipse Cross, which was launched in March 2018. As
a result, we anticipate sales volume of 105,000 units, up 7,000 units, or 7%, from
the year ended March 31, 2018. We also forecast sales of ¥400.0 billion, up ¥50.6
billion from the year ended March 31, 2018.
Japan
Delica D:5 ACTIVE GEAR
Eclipse Cross
Net Sales
(Billions of yen)
FY2016 FY2017 FY2018 (Forecast)
Japan 297.3 349.4 400.0
North America 310.0 352.5 390.0
Europe 433.5 454.8 460.0
Asia 433.5 591.6 645.0
Other Regions 432.3 444.1 505.0
Total 1,906.6 2,192.4 2,400.0
Operating Profit (Loss)
(Billions of yen)
FY2016 FY2017
Japan (35.8) (14.1)
North America (15.5) 1.0
Europe (21.6) 10.9
Asia 51.2 64.1
Other Regions 26.8 36.3
Total 5.1 98.2
Overview of Operations by Region
Sales Volume (Retail)
(Thousands of units)
FY2016 FY2017 FY2018 (Forecast)
Japan 80 98 105
North America 144 155 184
Europe 179 193 210
Asia 315 432 504
Other Regions 208 223 247
Total 926 1,101 1,250
Notes:
1 From the year ended March 31, 2018, Puerto Rico has been reclas-
sified from Other Regions to North America. Figures for the year
ended March 31, 2017 have been retroactively adjusted to account
for this change.
2 From the year ending March 31, 2019, certain countries in Asia and
Europe have been reclassified to Other Regions.
MITSUBISHI MOTORS CORPORATION20

Performance in the year ended March 31, 2018
In the North American market, sales volume in the year ended March 31, 2018
rose 11,000 units, or 8%, to 155,000 units due to favorable sales of the Outlander
and Outlander Sport.
Due to higher sales volume, sales grew ¥42.5 billion, to ¥352.5 billion. At the
operating level, performance improved ¥16.5 billion year on year, to operating
profit of ¥1.0 billion.
Outlook for the year ending March 31, 2019
We expect sales volume to rise 29,000 units, or 19%, from the year ended March
31, 2018, to 184,000 units, centering on higher sales of the Outlander PHEV
and the Eclipse Cross, which we launched in the second half of the year ended
March 31, 2018. Accordingly, we forecast sales of ¥390.0 billion, up ¥37.5 billion
from the year ended March 31, 2018.
Outlander PHEV
Eclipse Cross
North America
Performance in the year ended March 31, 2018
In the European market, sales volume in the year ended March 31, 2018, came
to 193,000 units, up 14,000 units, or 8%. This rise was attributable to favorable
sales of the Outlander and Pajero Sport in Russia and robust sales in Germany
and the United Kingdom.
Due to the rise in sales volume, sales grew ¥21.3 billion year on year, to
¥454.8 billion, and performance at the operating level improved ¥32.5 billion,
from an operating loss of ¥21.6 billion to operating profit of ¥10.9 billion.
Outlook for the year ending March 31, 2019
Due to strong sales in Europe, centered on the Eclipse Cross and the Outlander
PHEV, we anticipate sales volume of 210,000 units and sales of ¥460.0 billion.
Outlander
Eclipse Cross
Europe
Annual Report 2018 21

Performance in the year ended March 31, 2018
Sales volume in Asia was up 117,000 units, or 37%, to 432,000 units. This signifi-
cant increase stemmed from favorable sales of the XPANDER, launched in In-
donesia in September 2017, and pick-up trucks in Thailand. Sales also remained
strong for the Outlander, which we began producing locally in China in 2016.
In the ASEAN region, sales grew ¥156.9 billion year on year, pushing up sales
for Asia as a whole by ¥158.1 billion, to ¥591.6 billion, and leading to operating
profit of ¥64.1 billion, up ¥12.9 billion.
Outlook for the year ending March 31, 2019
In Asia, we plan to roll out sales of the XPANDER, which is popular in Indonesia,
to the Philippines, Thailand and Vietnam. In China, we will sell the Eclipse Cross,
which is produced locally, and augment our sales network. For the region as a
whole, we forecast sales volume of 504,000 vehicles and sales of ¥645.0 billion.
Note: From the year ending March 31, 2019, certain countries in Asia and Europe have been reclassi-
fied to Other Regions.
Asia
XPANDER
Outlander
Overview of Operations by Region
Performance in the year ended March 31, 2018
In the year ended March 31, 2018, sales volume in other regions rose by 15,000
vehicles, or 7% year on year, to 223,000 units, buoyed by higher sales in Australia.
Aided by the rise in sales volume, sales grew ¥11.8 billion year on year, to
¥444.1 billion, and operating profit expanded ¥9.5 billion, to ¥36.3 billion.
Outlook for the year ending March 31, 2019
In the year ending March 31, 2019, we expect sales volume of 247,000 units and
sales of ¥505.0 billion, due to higher sales of the Eclipse Cross and a new global
core model.
Note: From the year ending March 31, 2019, certain countries in Asia and Europe have been reclassi-
fied to Other Regions.
Other Regions (Australia, New Zealand, Latin America, Middle East and Africa)
Triton/L200
Pajero Sport
MITSUBISHI MOTORS CORPORATION22

Annual Report 2018 23
Contents
Consolidated Financial Summary . . . . . . . . . . . . . . . . . . . . . . . . . . . 24
Operational Review . . . . . . . . . . . . . . . . . . . . . . . . . . . . . . . . . . . . . . . . . . . . 25
Consolidated Balance Sheet . . . . . . . . . . . . . . . . . . . . . . . . . . . . . . . . . 28
Consolidated Statement of Income . . . . . . . . . . . . . . . . . . . . . . . . 30
Consolidated Statement of Comprehensive Income . . . 31
Consolidated Statement of Changes in Net Assets . . . . . 32
Consolidated Statement of Cash Flows . . . . . . . . . . . . . . . . . . . 33
Financial Section

Financial Section
20172015 20162013 20142012
Net Sales(Billions of yen)
(FY)
1,815.12,093.4
1,906.62,192.42,180.7 2,267.8
20172015 20162013 20142012
Cash and Deposits/Interest-Bearing Debt(Billions of yen)
(FY)
26.6
571.9
409.5364.4
450.1
222.4
453.4
27.1
440.3
144.5
15.6
556.8
Interest-bearing debtCash and deposits
20172015 20162013 20142012
Operating Profit(Billions of yen)
(FY)
67.4
123.4135.9 138.4
5.1
98.2
20172015 20162013 20142012
Equity Ratio(%)
(FY)
23.4
35.041.6
46.8 46.5 47.2
Consolidated Financial Summary
FY2012 FY2013 FY2014 FY2015 FY2016 FY2017
For the year: (In billions of yen)Net sales 1,815.1 2,093.4 2,180.7 2,267.8 1,906.6 2,192.4Operating profit 67.4 123.4 135.9 138.4 5.1 98.2Profit (loss) before income taxes 69.4 117.2 129.5 108.8 (158.7) 103.0Profit (loss) attributable to owners of the parent 38.0 104.7 118.2 72.6 (198.5) 107.6
Sales volume (retail) (Thousands of units) 987 1,047 1,090 1,048 926 1,101
R&D expenses 59.9 67.5 74.6 78.7 89.0 102.5Capital expenditures 51.4 72.2 68.0 69.0 58.1 99.9Depreciation 50.3 52.7 53.3 53.6 46.2 52.0
Return on equity (ROE) (%) 12.7 23.8 19.7 10.9 (29.2) 14.6
Per share data: (In yen)Earnings per share 66.05 156.60 120.16 73.80 (164.11) 72.23Diluted earnings per share 37.09 104.29 — — — 72.20Dividends per share — 25.00 16.00 16.00 10.00 17.00
At year-end: (In billions of yen)Total assets 1,452.8 1,543.9 1,582.8 1,433.7 1,484.4 1,655.3Net assets 351.2 550.0 670.8 685.3 703.5 796.6
Cash and deposits 409.5 450.1 440.3 453.4 556.8 571.9Interest-bearing debt 364.4 222.4 144.5 27.1 15.6 26.6
Equity ratio (%) 23.4 35.0 41.6 46.8 46.5 47.2Number of shares outstanding (Thousands) 6,080,900 983,661 983,661 983,661 1,490,282 1,490,282
1. For fiscal 2014 and earlier, profit attributable to owners of the parent refers to net income.2. On August 1, 2013, the Company conducted a 1-for-10 reverse share split on its common stock. Indicated figures for basic net income per share and
diluted net income per share are calculated as if this reverse share split had occurred at the beginning of fiscal 2012.3. Diluted net income per share is not indicated for fiscal 2014, 2015 and 2016 because no dilutive shares existed.
MITSUBISHI MOTORS CORPORATION24

Results of Operations
Global sales volume for Fiscal Year 2017 increased 19% year on year to 1,101,000 units. ASEAN sales increased by 33% to 275,000 units, driven by orders for pick-up trucks in Thailand and the strong performance of the new XPANDER MPV, launched in Indonesia in September 2017. In China, sales rose 55% year on year to 136,000 units due to demand for the Outlander localized in 2016. Sales in Japan increased 23% year on year to 98,000 units. The growth was driven by encouraging demand for Kei car models including the “eK Wagon” and “eK Space,” as well as for the Delica D:5 and other “Active Gear” series. We have also seen strong sales of the new Eclipse Cross compact SUV. Initial Sales of the Eclipse Cross, launched last year in Europe, are being followed by sales in other important markets including Oceania, North America, and Japan in March.
Net Sales and Income
Net sales rose ¥285.8 billion year on year, to ¥2,192.4 billion. Operating profit expanded ¥93.1 billion, to ¥98.2 billion, due to the impact of higher unit sales, cost reductions and lower expenses for market quality measures. Ordinary profit increased ¥101.2 billion to ¥110.1 billion. Profit attributable to owners of the par-ent came to ¥107.6 billion, up ¥306.1 billion from the ¥198.5 billion loss posted in the preceding fiscal year, affected by the fuel economy testing issue.
Overview of Financial Position
Total assets as of March 31, 2018, were ¥1,655.3 billion, up ¥170.9 billion year on year. Of this amount, cash and deposits rose ¥15.1 billion, to ¥571.9 billion. Total liabili-ties amounted to ¥858.7 billion, up ¥77.8 billion, which included a ¥11.0 billion rise in interest-bearing debt, to ¥26.6 billion. Meanwhile, net assets at the end of the period were ¥796.6 billion, up ¥93.1 billion.
Overview of Cash Flow
In the year ended March 31, 2018, net cash provided by operating activities amounted to ¥119.6 billion. (In the previous year, these activities used ¥45.8 billion in cash.) Net cash used in investing activities was ¥97.1 billion (net cash of ¥73.1 billion used in the preced-ing term), and net cash used in financing activities amounted to ¥23.2 billion (net cash of ¥210.4 billion provided in the previous year). As a result, cash and cash equivalents on March 31, 2018, stood at ¥559.0 billion, compared with ¥555.9 billion one year earlier.
Overview of Cash Flow(FY) 2013 2014 2015 2016 2017
Shareholders’ equity ratio (%)*1 35.0 41.6 46.8 46.5 47.2
Shareholders’ equity ratio (fair value basis)*2 68.8 67.4 57.8 67.2 68.5
Cash flows/Interest-bearing debt ratio*3 1.1 0.8 0.1 (0.3) 0.2
Interest coverage ratio*4 22.3 41.0 120.2 (38.7) 34.1
*1 The shareholders’ equity ratio is shareholders’ equity divided by total assets.
*2 The shareholders’ equity ratio (fair value basis) is market capitalization divided by total assets.
*3 The cash flows/interest-bearing debt ratio is interest-bearing debt divided by cash flow.
*4 The interest coverage ratio is cash flow divided by interest paid.
Notes:1. Each indicator is calculated from consolidated financial figures.2. Market capitalization is calculated based on the number of
issued shares excluding treasury stock.3. Cash flow refers to operating cash flow.4. Interest-bearing debt includes all liabilities recorded on the
balance sheet for which interest is paid.
Cash Flows(Billions of yen)
20172015 20162013 20142012(FY)
119.6
-97.1
-23.2-45.8
-73.1
210.4172.2
-114.3
-8.3
210.4
-81.4 -82.1
177.0
-71.3
-131.5
197.7
17.2
-122.9
Cash flows from operating activitiesCash flows from investing activitiesCash flows from financing activities
Operational Review
Annual Report 2018 25

Financial Section
Risks that may seriously impact the operating results and/
or financial position, and the like of the MMC Group are out-
lined below.
Impact of the economic and social situation in Japan
and overseas
Overseas sales accounted for around 80% of the MMC
Group’s consolidated net sales for the previous fiscal year.
Changes in the economic and social situation in Japan or in
the regions and countries the MMC Group trades with, and
in particular the countries of the ASEAN region and other
emerging nations that will be central to the MMC Group’s
regional strategy, may seriously impact the MMC Group’s
operating results and/or financial position. In addition, con-
ducting business operations in overseas markets exposes
the MMC Group to latent risks including, but not limited to,
changes in laws and taxes, changes in the political and eco-
nomic situation, deficiencies in infrastructure, difficulties
in acquiring skilled personnel, acts of terrorism and other
emergencies and the outbreak of epidemics. In the event
risks such as these start to manifest themselves, they may
seriously impact the operating results and/or financial posi-
tion of the MMC Group.
Impact of intensifying competition in the automotive industry
Overcapacity in the auto industry and other factors are seeing
an intensification of competition on a global basis. Increasing
price competition makes sales incentives and effective pub-
licity campaigns indispensable in promoting sales and retain-
ing market share. Such increases in price competition and
marketing incentives may seriously impact the operating
results and/or financial position of the MMC Group.
Amid intensifying competition in the automotive indus-
try and shorter new product development cycles, MMC may
become unable to supply new products appropriately and in
a timely manner that respond to customers’ needs in terms
of price, quality, safety and other factors, or the market may
not be sufficiently receptive to MMC’s strategic products.
Such conditions may seriously impact the operating results
and/or financial position of the MMC Group. In addition, the
MMC Group may render ineffective its measures to main-
tain or enhance competitiveness, and as a result, product
demand could fall. Such conditions may seriously impact the
operating results and/or financial position of the MMC Group.
Impact of natural and other disasters
The MMC Group maintains production and other facilities in
Japan and many other parts of the world. The occurrence
of a major natural or other disaster, including earthquakes,
typhoons, floods, fires and epidemics, in these areas may
result in the suspension or other serious interruption in the
operations of the MMC Group or of its suppliers. The MMC
Group has prepared and maintains plans to keep operations
going and disaster measures in areas and under situations
where such risks are high and where they would have a seri-
ous impact on the MMC Group’s operations. A disaster occur-
ring on a scale larger than anticipated, however, may seri-
Business-related risks
ously impact the operating results and/or financial position
of the MMC Group.
Impact of laws and regulations, etc.
The MMC Group is subject to various laws and regulations
governing protection of the global environment, product
safety and other matters in the countries where it operates.
In the event that the MMC Group fails to conform to or is
unable to comply with such laws and regulations and such
failure leads to sanctions against it, or that large costs may
be incurred for the purpose of conforming to or complying
with any revision to or tightening of existing regulations, this
may seriously impact the operating results and/or financial
position of the MMC Group.
Other than the above laws and regulations, the MMC
Group’s business activities are also subject to a wide range
of laws and regulations in Japan and overseas. For example,
the business activities are under restrictions by consumer
protection regulations, approvals and licenses for businesses
and investments, labor regulations, environmental protec-
tion regulations, foreign exchange regulations, import-
export trade regulations including those for security purpos-
es, various tax laws, anti-monopoly laws, anti-bribery laws
and the like. In some cases, the MMC Group’s businesses
may be conducted based on a legislative foundation that has
not been developed sufficiently, or the burden of expenses
may increase for responding to the lack of a comprehensive
system of laws and regulations, application and interpreta-
tion of inconsistent laws and regulations, unilateral changes
made by supervisory authorities in regulatory measures, and
others. In addition, any unexpected change may be made in
rates of taxes imposed on products or services supplied by
these businesses, technical requirements for environmen-
tal restrictions, income taxes and tariffs, foreign exchange
restrictions on invested capital and dividend repatriation,
and other laws and regulations.
In order to deal with these regulatory risks, the MMC
Group has taken preventive measures with regard to com-
pliance with laws and regulations, etc. Moreover, the MMC
Group has also improved a structure to respond promptly
when it detects any compliance-related matter to prevent
an effect on its social credibility and reputation. However,
the possibility that a law violation may be committed in the
future is not zero. If there is a fact of law violation, or the
content, promptness and others of its response are insuf-
ficient, the fact or insufficiency may have a negative impact
on the MMC Group’s social credibility and reputation, and
furthermore, on its operating results and financial position.
Impact of changes in manufacturing cost
The MMC Group sources parts and raw materials, etc. from a
large number of suppliers to manufacture its products. Any
rise in the manufacturing cost of MMC’s products due to
changes in demand and other market conditions may seri-
ously impact the operating results and/or financial position
of the MMC Group.
MITSUBISHI MOTORS CORPORATION26

Impact of foreign exchange rate fluctuations
Overseas sales accounted for around 80 percent of the
MMC Group’s consolidated net sales for the previous fiscal
year. MMC closely monitors the market trend of Thai baht
for foreign currency denominated payables and US dollars
and Euros for foreign currency denominated receivables to
take necessary measures in a timely manner, but significant
fluctuations in the foreign currency rates may still seriously
impact the operating results and/or financial position of the
MMC Group.
Impact of failure to achieve mid-term business plan targets
mainly due to differences between the premises on which
the plan was drawn up and real-world conditions
The MMC Group has drawn up a mid-term business plan set-
ting out operational strategy for the medium term. However,
in the event that differences arise between the premises
on which the plan was drawn up and real-world conditions
or should any of the risks described in this section become
prominent, the operating results and/or financial position of
the MMC Group may be seriously impacted.
Impact of product quality and safety
The MMC Group endeavors to improve the quality and assure
the safety of the MMC Group’s products. However, in the
event that MMC has to issue a recall or implement counter-
measures, etc. on a large scale due to product defects or
failures, or in the event that MMC is pursued in a large-scale
product liability action, the large costs incurred and the
damage to reputation of the MMC’s products and conse-
quent drop in demand, etc. for its products may seriously
impact the operating results and/or financial position of the
MMC Group.
Impact of lawsuits, etc.
Any lawsuit brought against the MMC Group by customers,
trading partners or other third parties in the course of the
MMC Group conducting its business operations may seri-
ously impact the operating results and/or financial position
of the MMC Group.
In addition, in the event that decisions, etc. in legal
actions, etc. currently under dispute go against the MMC
Group’s claims or predictions, these may seriously impact the
operating results and/or financial position of the MMC Group.
In February 20, 2010, MASRIA Co., Ltd. (hereafter
“Plaintiff”), a former MMC distributor in Egypt, filed a law-
suit against MMC for dissolution of a distributor agreement
between MMC and the Plaintiff including a 900 million USD
claim for damages. The judgments in both the courts of first
and second instance found in favor of MMC on October 26,
2010, and July 3, 2012, respectively, based on the reasoning
that the case was not within the Egyptian court’s legal juris-
diction. The case is now before the final appellate court after
the Plaintiff appealed on July 21, 2012 against the judgment
of the court of second instance.
It is clearly spelled out in the distributor agreement men-
tioned above that the case does not fall within the Egyptian
court’s jurisdiction. Furthermore, MMC’s notice to terminate
the distributor agreement with the Plaintiff followed due
legal process and the terms of the agreement, thus making
the Plaintiff’s claim irrational. For these reasons, at present
MMC does not consider this legal case will result in any seri-
ous impact on the operating results and/or financial position
of the MMC Group.
Impact of dependence on particular suppliers
The MMC Group sources raw materials and parts, etc. from
a large number of suppliers. The necessity to procure mate-
rials and parts characterized by higher quality or more
advanced technologies at more competitive prices may bring
about a situation in which orders are concentrated upon a
specific supplier. There may also be only a limited number
of suppliers able to supply parts, etc. for which a specific
technology is required. Consequently, the operating results
and/or financial position of the MMC Group may be seriously
impacted in the event that some unforeseen situation arises
and interrupts deliveries from such suppliers or in the event
that it is not possible to procure materials and parts at com-
petitive prices in a timely manner.
Impact of credit risks of customers, trading partners
and others
The MMC Group is exposed to credit risks in its dealings with
customers, dealers and other trading partners including les-
sees in its automobile financing business. In the event that
losses stemming from such credit risks exceed the MMC
Group’s estimates, the operating results and/or financial
position of the MMC Group may be seriously impacted.
Impact of infringement of intellectual property rights
In order to distinguish its products from those of other auto
manufacturers the MMC Group endeavors to protect its own
technologies, know-how and other intellectual property
as well as to prevent the infringement of third-party intel-
lectual property rights. However, in the event that a third
party unlawfully uses the MMC Group’s intellectual property
to manufacture and sell imitations of its products, or in the
event that limitations in the legal system in certain countries
in relation to the protection of the MMC Group’s intellectual
property rights result in a fall in sales or in legal costs, or in
the event that an unforeseen infringement of a third-party
intellectual property right requires a halt in manufacturing
or sales or the payment of compensation, or causes damage
to reputation of the MMC’s products and a consequent drop
in demand, the operating results and/or financial position of
the MMC Group may be seriously impacted.
Impact of IT and information security
The information technology and the networks and systems
that the MMC Group uses in its management and its prod-
ucts, etc. are exposed to the possibility of attacks by hackers
or computer viruses, to illegal or inappropriate use and to
infrastructure breakdowns, and the like. In such an event,
the operating results and/or financial position of the MMC
Group may be seriously impacted. The MMC Group possesses
confidential information relating to matters both within and
outside the Group and including personal information. In the
event such information is improperly leaked to the outside,
the social credibility and the operating results and/or finan-
cial position of the MMC Group may be seriously impacted.
Annual Report 2018 27

(Millions of yen)
As of March 31,
2017
As of March 31,
2018
Assets
Current assets
Cash and deposits 556,836 571,911
Notes and accounts receivable - trade 164,761 176,020
Merchandise and finished goods 118,195 143,332
Work in process 19,695 21,901
Raw materials and supplies 26,139 38,551
Short-term loans receivable 1,766 806
Deferred tax assets 8,626 19,426
Other 76,590 95,542
Allowance for doubtful accounts (1,209) (1,229)
Total current assets 971,401 1,066,264
Non-current assets
Property, plant and equipment
Buildings and structures, net 77,002 89,314
Machinery, equipment and vehicles, net 100,516 113,266
Tools, furniture and fixtures, net 22,349 46,237
Land 89,925 94,565
Construction in progress 19,210 33,698
Total property, plant and equipment 309,004 377,082
Intangible assets 22,939 29,022
Investments and other assets
Investment securities 94,959 97,699
Long-term loans receivable 21,615 6,218
Net defined benefit asset 2,913 4,198
Deferred tax assets 7,311 10,558
Other 60,120 70,178
Allowance for doubtful accounts (5,853) (5,921)
Total investments and other assets 181,068 182,931
Total non-current assets 513,011 589,035
Total assets 1,484,413 1,655,299
Consolidated Balance Sheet
Financial Section
MITSUBISHI MOTORS CORPORATION28

(Millions of yen)
As of March 31,
2017
As of March 31,
2018
Liabilities
Current liabilities
Notes and accounts payable - trade 378,561 426,312
Electronically recorded obligations - operating 21,393 22,897
Short-term loans payable 15,069 10,589
Current portion of long-term loans payable 299 15,893
Lease obligations 989 504
Accounts payable - other and accrued expenses 124,573 165,963
Income taxes payable 26,485 11,272
Deferred tax liabilities 51 17
Provision for product warranties 45,512 46,733
Provision for loss on fuel consumption test 28,136 15,478
Other 32,494 29,896
Total current liabilities 673,566 745,559
Non-current liabilities
Long-term loans payable 240 90
Lease obligations 1,018 639
Deferred tax liabilities 24,583 31,642
Net defined benefit liability 41,593 42,596
Other 39,946 38,209
Total non-current liabilities 107,383 113,177
Total liabilities 780,949 858,737
Net assets
Shareholders’ equity
Capital stock 284,382 284,382
Capital surplus 203,938 203,938
Retained earnings 277,281 363,382
Treasury shares (220) (220)
Total shareholders’ equity 765,381 851,482
Accumulated other comprehensive income
Valuation difference on available-for-sale securities 7,480 7,158
Deferred gains or losses on hedges 627 526
Foreign currency translation adjustment (62,739) (59,966)
Remeasurements of defined benefit plans (20,295) (18,232)
Total accumulated other comprehensive income (74,926) (70,514)
Share acquisition rights — 106
Non-controlling interests 13,008 15,487
Total net assets 703,463 796,562
Total liabilities and net assets 1,484,413 1,655,299
Annual Report 2018 29

(Millions of yen)
For the fiscal year ended
March 31, 2017
For the fiscal year ended
March 31, 2018
Net sales 1,906,632 2,192,389
Cost of sales 1,581,273 1,730,278
Gross profit 325,359 462,111
Selling, general and administrative expenses
Advertising and promotion expenses 83,014 110,047
Freightage expenses 45,817 42,316
Provision of allowance for doubtful accounts (330) 33
Directors’ compensations, salaries and allowances 66,097 71,758
Retirement benefit expenses 3,783 3,509
Depreciation 10,320 12,506
Research and development expenses 57,679 56,066
Other 53,858 67,671
Total selling, general and administrative expenses 320,240 363,909
Operating profit (loss) 5,118 98,201
Non-operating income
Interest income 3,530 3,464
Dividend income 1,607 2,090
Share of profit of entities accounted for using equity method 10,969 20,579
Other 502 949
Total non-operating income 16,609 27,084
Non-operating expenses
Interest expenses 1,208 3,499
Foreign exchange losses 6,829 8,370
Litigation expenses 1,205 1,564
Other 3,540 1,723
Total non-operating expenses 12,783 15,158
Ordinary profit (loss) 8,944 110,127
Extraordinary income
Gain on sales of non-current assets 952 306
Gain on sales of investment securities 1,863 328
Gain on dissolution of employee’s pension fund — 1,434
Compensation income for expropriation 1,481 —
Gain on sales of investments in capital of subsidiaries and associates 809 —
Other 432 217
Total extraordinary income 5,538 2,287
Extraordinary losses
Loss on retirement of non-current assets 2,073 2,418
Loss on sales of non-current assets 277 139
Impairment loss 1,165 2,636
Loss on fuel consumption test 165,455 2,262
Compensation for production transfer — 984
Loss on closing of plants 640 —
Other 3,608 924
Total extraordinary losses 173,221 9,365
Profit (loss) before income taxes (158,738) 103,049
Income taxes - current 20,986 11,675
Income taxes for prior periods 12,281 (8,616)
Income taxes - deferred 4,782 (6,261)
Total income taxes 38,051 (3,203)
Profit (loss) (196,789) 106,253
Profit (loss) attributable to non-controlling interests 1,735 (1,366)
Profit (loss) attributable to owners of the parent (198,524) 107,619
Consolidated Statement of Income
Financial Section
MITSUBISHI MOTORS CORPORATION30

(Millions of yen)
For the fiscal year ended
March 31, 2017
For the fiscal year ended
March 31, 2018
Profit (loss) (196,789) 106,253
Other comprehensive income
Valuation difference on available-for-sale securities 3,052 (311)
Deferred gains or losses on hedges (32) 330
Foreign currency translation adjustment 71 1,332
Remeasurements of defined benefit plans, net of tax (6,180) 2,174
Share of other comprehensive income of entities accounted for using equity method
(4,862) 933
Total other comprehensive income (7,951) 4,460
Comprehensive income (204,740) 110,713
Comprehensive income attributable to
Comprehensive income attributable to owners of the parent (205,269) 113,022
Comprehensive income attributable to non-controlling interests 528 (2,309)
Consolidated Statement of Comprehensive Income
Annual Report 2018 31

(Millions of yen)
For the fiscal year endedMarch 31, 2017
Shareholders’ equity
Capital stock Capital surplus Retained earnings Treasury sharesTotal shareholders’
equity
Balance at beginning of current period 165,701 85,257 488,590 (220) 739,328
Changes of items during period
Issuance of new shares 118,680 118,680 237,361
Dividends of surplus (12,784) (12,784)
Profit (loss) attributable to owners of the parent
(198,524) (198,524)
Purchase of treasury shares (0) (0)
Change of scope of consolidation
Change of scope of equity method —
Net changes of items other than shareholders’ equity
Total changes of items during period 118,680 118,680 (211,309) (0) 26,052
Balance at end of current period 284,382 203,938 277,281 (220) 765,381
Accumulated other comprehensive income
Share acquisition
rights
Non-controlling interests
Total net assets
Valuation difference on
available-for-sale
securities
Deferred gains or
losses on hedges
Foreign currency
translation adjustment
Remeasurements of defined benefit
plans
Total accu-mulated
other com-preAhensive
income
Balance at beginning of current period 4,429 542 (59,109) (14,043) (68,181) — 14,189 685,337
Changes of items during period
Issuance of new shares 237,361
Dividends of surplus (12,784)
Profit (loss) attributable to owners of the parent
(198,524)
Purchase of treasury shares (0)
Change of scope of consolidation
Change of scope of equity method —
Net changes of items other than shareholders’ equity
3,051 85 (3,629) (6,251) (6,744) — (1,181) (7,926)
Total changes of items during period 3,051 85 (3,629) (6,251) (6,744) — (1,181) 18,126
Balance at end of current period 7,480 627 (62,739) (20,295) (74,926) — 13,008 703,463
For the fiscal year endedMarch 31, 2018
Shareholders’ equity
Capital stock Capital surplus Retained earnings Treasury sharesTotal shareholders’
equity
Balance at beginning of current period 284,382 203,938 277,281 (220) 765,381
Changes of items during period
Issuance of new shares —
Dividends of surplus (17,880) (17,880)
Profit (loss) attributable to owners of the parent
107,619 107,619
Purchase of treasury shares (0) (0)
Change of scope of consolidation (3,457) (3,457)
Change of scope of equity method (180) (180)
Net changes of items other than shareholders’ equity
Total changes of items during period — — 86,101 (0) 86,101
Balance at end of current period 284,382 203,938 363,382 (220) 851,482
Accumulated other comprehensive income
Share acquisition
rights
Non-controlling interests
Total net assets
Valuation difference on
available-for-sale
securities
Deferred gains or
losses on hedges
Foreign currency
translation adjustment
Remeasurements of defined benefit
plans
Total accu-mulated
other com-prehensive
income
Balance at beginning of current period 7,480 627 (62,739) (20,295) (74,926) — 13,008 703,463
Changes of items during period
Issuance of new shares —
Dividends of surplus (17,880)
Profit (loss) attributable to owners of the parent
107,619
Purchase of treasury shares (0)
Change of scope of consolidation (3,457)
Change of scope of equity method (180)
Net changes of items other than shareholders’ equity
(322) (101) 2,773 2,062 4,411 106 2,479 6,997
Total changes of items during period (322) (101) 2,773 2,062 4,411 106 2,479 93,098
Balance at end of current period 7,158 526 (59,966) (18,232) (70,514) 106 15,487 796,562
Financial Section
Consolidated Statement of Changes in Net Assets
MITSUBISHI MOTORS CORPORATION32

(Millions of yen)
For the fiscal year ended
March 31, 2017
For the fiscal year ended
March 31, 2018
Cash flows from operating activities
Profit (loss) before income taxes (158,738) 103,049
Depreciation 46,815 52,551
Impairment loss 1,165 2,636
Loss on fuel consumption test 165,455 2,262
Loss on closing of plants 640 —
Increase (decrease) in allowance for doubtful accounts (373) (16)
Increase (decrease) in net defined benefit liability 1,598 2,115
Interest and dividend income (5,138) (5,555)
Interest expenses 1,208 3,499
Foreign exchange losses (gains) 31 5,430
Share of loss (profit) of entities accounted for using equity method (10,969) (20,579)
Loss (gain) on sales and retirement of non-current assets 1,399 2,251
Decrease (increase) in notes and accounts receivable-trade 7,973 (11,730)
Decrease (increase) in inventories 24,869 (37,504)
Increase (decrease) in notes and accounts payable-trade 12,289 47,485
Other, net 5,446 (384)
Subtotal 93,675 145,510
Interest and dividend income received 9,845 10,982
Interest expenses paid (1,183) (3,507)
Payments related to fuel consumption test (130,689) (13,221)
Payments for closing of plants (2,903) —
Income taxes paid (14,573) (20,140)
Net cash provided by (used in) operating activities (45,829) 119,624
Cash flows from investing activities
Decrease (increase) in time deposits (0) (11,997)
Purchase of property, plant and equipment (56,474) (72,251)
Proceeds from sales of property, plant and equipment 4,238 2,989
Purchase of intangible assets (11,530) (11,497)
Proceeds from sales of investment securities 2,459 682
Decrease (increase) in short-term loans receivable 673 155
Payments of long-term loans receivable (14,814) (1,517)
Collection of long-term loans receivable 1,137 744
Other, net 1,189 (4,401)
Net cash provided by (used in) investing activities (73,119) (97,093)
Cash flows from financing activities
Increase (decrease) in short-term loans payable 3,178 (4,510)
Proceeds from long-term loans payable 835 2,375
Repayments of long-term loans payable (14,485) (301)
Proceeds from issuance of common shares 236,317 —
Cash dividends paid (12,755) (17,938)
Dividends paid to non-controlling interests (1,649) (2,085)
Other, net (1,062) (700)
Net cash provided by (used in) financing activities 210,377 (23,161)
Effect of exchange rate change on cash and cash equivalents 2,037 (3,167)
Net increase (decrease) in cash and cash equivalents 93,465 (3,797)
Cash and cash equivalents at beginning of period 462,440 555,906
Increase (decrease) in cash and cash equivalents resulting from change of scope of consolidation
— 6,927
Cash and cash equivalents at end of period 555,906 559,036
Consolidated Statement of Cash Flows
Annual Report 2018 33

Consolidated Subsidiaries and Affiliates As of March 31, 2018
Company Name Location
Consolidated subsidiaries
Hokkaido Mitsubishi Motor Sales Co., Ltd. Japan
Higashi Nihon Mitsubishi Motor Sales Co., Ltd. Japan
Kanto Mitsubishi Motor Sales Co., Ltd. Japan
Chubu Mitsubishi Motor Sales Co., Ltd. Japan
Nishi Nihon Mitsubishi Motor Sales Co., Ltd. Japan
Pajero Manufacturing Co., Ltd. Japan
Mitsubishi Automotive Logistics Technology Co., Ltd. Japan
Mitsubishi Automotive Engineering Co., Ltd. Japan
Suiryo Plastics Co., Ltd. Japan
Mitsubishi Motors North America, Inc. (MMNA)*2 U.S.A.
Mitsubishi Motors R&D of America, Inc. (MRDA) U.S.A.
Mitsubishi Motor Sales of Canada, Inc. (MMSCAN) Canada
Mitsubishi Motor Sales of Caribbean, Inc. (MMSC) Puerto Rico
Mitsubishi Motors Europe B.V. (MME) Netherlands
Mitsubishi Motor R&D Europe GmbH (MRDE) Germany
Mitsubishi Motor Sales Netherlands B.V. Netherlands
Mitsubishi Motors Australia, Ltd. (MMAL)*2 Australia
Mitsubishi Motors New Zealand Ltd. (MMNZ) New Zealand
Mitsubishi Motors (Thailand) Co., Ltd. (MMTh)*2 Thailand
MMTh Engine Co., Ltd. Thailand
Mitsubishi Motors Philippines Corp. (MMPC) Philippines
Asian Transmission Corp. (ATC ) Philippines
Mitsubishi Motors Middle East and Africa FZE U.A.E.
P.T. Mitsubishi Motors Krama Yudha Indonesia Indonesia
Note: MMC has 10 other subsidiaries outside Japan in addition to
the above.
Equity-method affiliates
Tokachi Mitsubishi Motor Sales Co., Ltd. Japan
Ibaraki Mitsubishi Motor Sales Co., Ltd. Japan
Nagano Mitsubishi Motor Sales Co., Ltd. Japan
Mie Mitsubishi Motor Sales Co., Ltd. Japan
Kagawa Mitsubishi Motor Sales Co., Ltd. Japan
Miyazaki Mitsubishi Motor Sales Co., Ltd. Japan
Higashi Kanto MMC Parts Sales Co., Ltd. Japan
NMKV Co., Ltd Japan
MMC Diamond Finance Corp. Japan
MMD Automobile GmbH Germany
Mitsubishi Motors Vietnam Co., Ltd. Vietnam
GAC Mitsubishi Motors Co., Ltd. (GMMC) China
P.T. Mitsubishi Motors Krama Yudha Sales Indonesia Indonesia
Note: MMC has 8 other affiliates outside Japan in addition to
the above.
Other associated company
Company Incorporated in
Nissan Motor Co., Ltd.*3 Japan
Mitsubishi Corporation*3 Japan
* 1 Figures in parentheses represent indirect shares.
* 2 Specified subsidiaries. (Mitsubishi Motors North America, Inc. (MMNA), Mitsubishi Motors Australia, Ltd. (MMAL), Mitsubishi Motors (Thailand) Co., Ltd. (MMTh))
* 3 A company submitting an annual securities report.
MITSUBISHI MOTORS CORPORATION34

Capital Stock (In millions) Business Lines MMC Share of Voting Rights (%)*1
JPY 100 Automobile sales 100.0
JPY 100 Automobile sales 100.0
JPY 100 Automobile sales 100.0
JPY 100 Automobile sales 100.0
JPY 100 Automobile sales 100.0
JPY 610 Automobile manufacture 100.0
JPY 436 Automobile transport, maintenance and sales of parts 83.2
JPY 350 Automobile development 100.0
JPY 100 Manufacture of automobile parts 100.0
USD 398.8 Automobile sales 100.0
USD 2.0 Investigation, testing and research related to automobiles 100.0 (100.0)
CAD 2.0 Automobile sales 100.0 (100.0)
USD 47.5 Automobile sales 100.0
EUR 107.2 Automobile parts sales 100.0
EUR 0.8 Investigation, testing and research related to automobiles 100.0
EUR 6.8 Automobile sales 100.0
AUD 1,789.9 Automobile sales 100.0
NZD 48.0 Automobile sales 100.0
THB 7,000.0 Automobile assembly, sales 100.0
THB 20.0 Manufacturing of automobile engines and press parts 100.0 (100.0)
PHP 1,640.0 Automobile assembly, sales 51.0
PHP 770.0 Manufacturing of automobile transmissions 100.0 (10.0)
UAD 10.0 Automobile parts sales 100.0
IDR 2,200,000 Automobile assembly 51.0
JPY 60 Automobile sales 35.0
JPY 30 Automobile sales 40.0
JPY 40 Automobile sales 49.86
JPY 58 Automobile sales 24.8
JPY 50 Automobile sales 23.0
JPY 60 Automobile sales 38.8
JPY 100 Automobile parts sales 33.0 (10.0)
JPY 10 Automobile planning and development 50.0
JPY 3,000 Auto sales financing, leasing, rentals 47.0
EUR 30.0 Automobile sales 24.99
VND 410,812 Automobile assembly, sales 41.2
CNY 1,947.0 Automobile assembly, sales 30.0
IDR 1,300,000 Automobile sales 30.0
Capitalization (In millions) Business Lines Share of Voting Rights in MMC (%)*1
JPY 605,814 Automobile assembly, sales and related business 34.0
JPY 204,447 Wholesale trade 20.0 (10.76)
Annual Report 2018 35

Principal Production Facilities
1 2 34 5
98
13
166 7
1512
10
11
14
Country/Region Name Major Products
Japan 1. Okazaki Plant Eclipse Cross, Outlander, Outlander PHEV
2. Mizushima Plant ASX (RVR, Outlander Sport), i-MiEV, eK Wagon, ek Space, MINICAB-MiEV
3. Pajero Manufacturing Co., Ltd. Pajero (Montero), Delica D:5, Outlander
4. Kyoto Plant–Kyoto Engines
5. Kyoto Plant–Shiga Engines
Thailand 6. Mitsubishi Motors (Thailand) Co., Ltd. (MMTh) Triton (L200, Strada), Pajero Sport (Montero Sport), Mirage (Space Star), Attrage (Mirage G4)
7. MMTh Engine Co., Ltd. (MEC) Engines
Philippines 8. Mitsubishi Motors Philippines Corporation (MMPC) Mirage, Mirage G4, L300
9. Asian Transmission Corporation (ATC) Transmissions
Indonesia 10. P.T. Mitsubishi Motors Krama Yudha Indonesia (MMKI)
XPANDER, Pajero Sport, L300
Russia 11. PCMA Rus Outlander, Pajero Sport
China 12. GAC Mitsubishi Motors Co., Ltd. (GMMC) Outlander, ASX
13. Shenyang Aerospace Mitsubishi Motors Engine Manufacturing, Co., Ltd. (SAME)
Engines
14. Harbin Dongan Automotive Engine Manufacturing, Co., Ltd. (DAE)
Engines, transmissions
Taiwan 15. China Motor Corporation (CMC) Colt Plus, Grand Lancer, Outlander, Delica
Vietnam 16. Mitsubishi Motors Vietnam Co., Ltd. (MMV) Outlander
MITSUBISHI MOTORS CORPORATION36
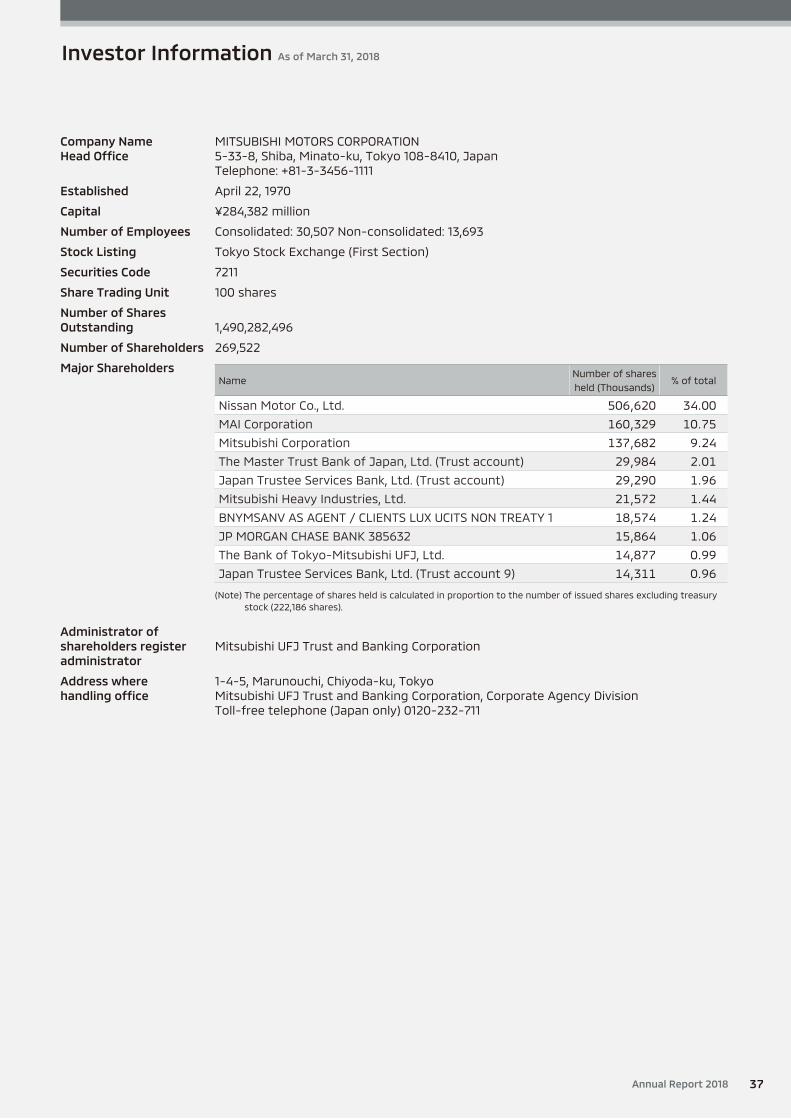
Company Name MITSUBISHI MOTORS CORPORATIONHead Office 5-33-8, Shiba, Minato-ku, Tokyo 108-8410, Japan Telephone: +81-3-3456-1111
Established April 22, 1970
Capital ¥284,382 million
Number of Employees Consolidated: 30,507 Non-consolidated: 13,693
Stock Listing Tokyo Stock Exchange (First Section)
Securities Code 7211
Share Trading Unit 100 shares
Number of Shares Outstanding 1,490,282,496
Number of Shareholders 269,522
Major Shareholders
Administrator of shareholders register Mitsubishi UFJ Trust and Banking Corporationadministrator
Address where 1-4-5, Marunouchi, Chiyoda-ku, Tokyohandling office Mitsubishi UFJ Trust and Banking Corporation, Corporate Agency Division Toll-free telephone (Japan only) 0120-232-711
Investor Information As of March 31, 2018
NameNumber of shares
held (Thousands)% of total
Nissan Motor Co., Ltd. 506,620 34.00
MAI Corporation 160,329 10.75
Mitsubishi Corporation 137,682 9.24
The Master Trust Bank of Japan, Ltd. (Trust account) 29,984 2.01
Japan Trustee Services Bank, Ltd. (Trust account) 29,290 1.96
Mitsubishi Heavy Industries, Ltd. 21,572 1.44
BNYMSANV AS AGENT / CLIENTS LUX UCITS NON TREATY 1 18,574 1.24
JP MORGAN CHASE BANK 385632 15,864 1.06
The Bank of Tokyo-Mitsubishi UFJ, Ltd. 14,877 0.99
Japan Trustee Services Bank, Ltd. (Trust account 9) 14,311 0.96
(Note) The percentage of shares held is calculated in proportion to the number of issued shares excluding treasury
stock (222,186 shares).
Annual Report 2018 37

5-33-8, Shiba, Minato-ku, Tokyo 108-8410, Japan
IR Office
http://www.mitsubishi-motors.com/en/ Printed in Japan