Embed Size (px)
Citation preview

EO
LU
S V
IND
AB
AN
NU
AL
RE
PO
RT
20
17
/20
18
ANNUAL REPORT
2017/2018
Eolus Vind is a leading Nordic wind power developer. Eolus creates value at every level of project develop-ment, establishment and operation of renewable energy facilities. We offer attractive and competitive investment opportunities in the Nordic region, Baltic countries and the US to both local and international investors.
Since the company’s inception in 1990, Eolus has been involved in the construction of more than 540 wind turbines with a capacity of nearly 930 MW. The Eolus Group currently has customer contracts for asset management services with an installed capacity of more than 400 MW. Eolus Vind AB has approximately 8,200 shareholders. Eolus’s Class B share is traded on Nasdaq Stockholm, Small Cap.
Eolus Vind ABBox 95, SE-281 21 Hässleholm, Sweden
Street address:Tredje Avenyen 3
Tel: +46 (0)10-199 88 00 E-mail: [email protected]

2 ANNUAL REPORT EOLUS VIND AB 2017/2018
THE PAST YEAR
SIGNIFICANT EVENTS DURING THE FISCAL YEAR
JENÅSEN HANDED OVER TO CUSTOMERIn August 2018, Eolus handed over the Jenåsen wind farm to Munich Re. This wind farm is Eolus’s largest establishment to date, with a total capacity of 79 MW divided between 23 Vestas wind turbines of model V126-3.45 MW. All electricity generated by the Jenåsen wind farm is covered by a ten-year Power Purchase Agreement (PPA) with Google, and the farm was completed in summer 2018. Eolus provides asset management services for the wind farm, which is located in the Municipality of Sundsvall.
232 MW OF WIND POWER TO AQUILA CAPITALIn December 2017, Eolus signed an agreement with Aquila Capital regarding the divestment of Kråktorpet and Nylandsbergen wind farms, comprising 61 wind turbines and a total installed capacity of 232 MW. Kråktorpet will comprise 43 Vestas V136-3.8 MW wind turbines, and Nylandsbergen will comprise 18 Vestas V136-3.8 MW wind turbines. Both wind farms are scheduled for handover to Aquila Capital in the second half of 2019. Eolus will provide asset management services for both of the farms.
KGAL RE-SELECTED EOLUSIn December 2017, Eolus signed an agreement with the German fund manager KGAL regarding divestment of the Sötterfällan and Anneberg wind farms. The total transaction comprised 47 MW, divided between 13 Vestas V136-3.6 MW wind turbines, of which ten will be constructed in Sötterfällan and three in Anneberg. This is KGAL’s second transaction with Eolus in a short time, and the wind farms are scheduled for handover in December 2018 and the summer of 2019, respectively. Eolus will provide asset manage-ment services for both of the farms.
STIGAFJELLET TO BE THE FIRST PROJECT IN NORWAYIn July 2018, Eolus signed an agreement with ewz regarding divestment of the Stigafjellet wind farm in Norway with an installed capacity of 30 MW. The wind farm is scheduled for deployment in the second half of 2020 and ewz will contribute financing during the construction phase. Eolus will provide asset management servic-es for the wind farm, which is located in Bjerkreim, south of Stavanger, and this will be the first wind farm completed by Eolus in Norway.
POWER PURCHASE AGREEMENT FOR ØYFJELLETIn March 2018, Eolus signed a 15-year Power Purchase Agree-ment with Alcoa for the Norwegian Øyfjellet project. This is Eolus’ largest permitted project to date, with capacity of up to 330 MW and estimated generation of about 1.2 TWh per year. Alcoa will
purchase all electricity generated by the new wind farm with deployment planned for 2021, with the
aim of supplying its production facility in Mosjøen with local electricity.
Deployment in 2021 will qualify the wind farm for certifi-cates under the joint
Swedish-Norwegian Electricity Certificate System.
As part of the arrangement, Eolus has signed a power guarantee with the Norwegian Export Credit Guarantee Agency (GIEK). The guaranteed amountis EUR 256 M.

ANNUAL REPORT EOLUS VIND AB 2017/2018 3
84During the fiscal year, Eolus deployed 25 wind turbines
with a total capacity of 84 MW.
Eolus signed its largest-ever Power Purchase Agreement
during the year, regarding 330 MW from Øyfjellet
with Alcoa.
330
THE PAST YEAR
CONTENTS
Significant events during the fiscal year .......................................2
Five-year summary ...............................3
Message from the CEO ........................4
Eolus in brief .........................................6
Market ..................................................8
Customer groups ...............................11
Project development ...........................12
Asset management.............................20
Electricity generation ...........................21
Customer case ...................................22
Sustainability ......................................24
Financial summary ..............................27
Key figures for the Group ....................27
Share and ownership structure ...........28
Management ......................................30
Directors’ Report ................................32
Corporate Governance Report ...........37
Consolidated statement of income .....40
Consolidated statement of other comprehensive income ..........41
Consolidated statement of financial position .............................42
Consolidated statement of changes in equity ............................44
Consolidated cash flow statement ...........................45
Parent Company income statement ....46
Parent Company statement of other comprehensive income ..........47
Parent Company balance sheet ..........48
Parent Company statement of changes in equity ...........50
Parent Company cash flow statement ...........................51
Notes .................................................52
Signatures ..........................................80
Auditor’s Report ..................................81
Board of Directors ..............................84
Glossary .............................................86
Annual General Meeting, financial calendar, definitions of alternative performance measures .......................87
During the fiscal year, the equivalent of 31 wind turbines
were handed over to customers, with a total
capacity of 93 MW.
93
FIVE-YEAR SUMMARY
SEK M 2017/2018 2016/2017 2015/2016 2014/2015 2013/2014
Net sales 1,366.0 1,065.7 693.4 1,502.1 465.8
Operating profit 202.4 40.2 -15.9 90.0 41.5
Profit/loss before tax 198.9 34.2 -29.1 75.2 13.1
Net profit/loss for the year 194.3 24.5 -23.9 80.0 9.9
Earnings/loss per share, before and after dilution, SEK 7.81 1.02 -0.92 3.25 0.44
No. of turbines constructed and deployed 25 25 14 33 27
Turbines constructed and deployed, MW 83.8 72.2 37.7 68.6 53.0
Managed turbines, MW 415 351 293 303 125
Electricity generation, GWh 30.2 58.6 123.6 242.3 172.1
EOLUS’S CUMULATIVE INSTALLED CAPACITY
MW
2012/2013 2013/2014 2014/2015 2015/2016 2016/2017 2017/20180
200
400
600
800
1,000
Installed capacity during the fiscal year + Total installed capacity

4 ANNUAL REPORT EOLUS VIND AB 2017/2018
MESSAGE FROM THE CEO
COMPETENCE, FLEXIBILITY AND AN EAGERNESS TO
IMPROVE HAVE LIFTED EOLUS TO RECORD-BREAKING HEIGHTS
I am delighted to confirm that Eolus’s earn-ings for the 2017/2018 fiscal year are the company’s highest-ever. The largest single reason for these excellent results is the handover of the Jenåsen wind farm to our customer Munich Re. The farm was handed over on schedule in August 2018 and the construction costs were lower than budget-ed. The establishment is Eolus’s largest to date and we will obviously be using the les-sons learned from this project in both future and larger ongoing establishments. The success is the result of genuine project development skills, a proactive divestment process and a high-quality, cost-conscious establishment. I feel privileged to be leading an organization that can deliver such pro-jects at a time when the need for renewable electricity generation is becoming increas-ingly obvious!
High awareness – now it’s time for actionIn its latest report, the UN Intergovernmental Panel on Climate Change (IPCC) analyses the impact of limiting the temperature in-crease to 1.5°C above pre-industrial levels. According to the report,the temperature has already risen 1.0°C and to meet the target, global greenhouse gas emissions must be halved by 2030. Moreover, the longer it takes to introduce effective initiatives, the greater the adverse effects on people and the economy. Awareness among politicians, investors and consumers is high. Now it’s time to move fast and take action! Eolus is ready to do its part, and more. The Nordic countries have ideal conditions to lead the transition to an economically, environmental-ly and socially sustainable energy supply.
With a high-quality project portfolio, a strong financial position and dedicated employees, Eolus has a fantastic opportunity to be a driving force in the ongoing energy revolution.”
”

ANNUAL REPORT EOLUS VIND AB 2017/2018 5
MESSAGE FROM THE CEO
Crucial to credibility The expansion of renewable electricity gener-ation in the Nordic region is now moving for-ward at a rapid rate. Sweden’s objective to extend the Electricity Certificate System until 2030 in combination with expansion in Nor-way could actually be achieved with existing facilities by 2021. In times of rapid change, it is vital that politicians and authorities moni-tor developments closely. The design of the stop mechanism in the Electricity Certificate System that the Swedish Energy Agency is expected to announce in December 2018 is crucial to Sweden’s credibility among inves-tors in renewable electricity generation. The discontinuation of the system must be bal-anced in order to create confidence among investors, consumers and other market players. The wind power industry is ready to deliver and expansion will continue even when the Electricity Certificate System’s targets have been achieved.
High-priority projects soon realizedWith the handover of the Jenåsen wind farm, we have now delivered the first of our eight most prioritized projects, comprising a joint transaction volume of some SEK 9 billion. Five farms have been divested and are sched-uled for construction in 2019 and 2020. These include Kråktorpet and Nylandsbergen with a total capacity of 232 MW, which were di-vested to Aquila Capital. The transaction was completed in December 2017 and is Eolus’s largest single transaction to date. In two sepa-rate transactions, KGAL acquired Sötterfällan with 36 MW and after the end of the fiscal year, Bäckhammar with 130 MW. In July, we concluded an agreement with ewz (energy supplier for the City of Zurich in Switzerland) for the establishment and delivery of Stigafjel-let. The project includes seven turbines with
a total capacity of 30 MW and will be the first wind farm completed by Eolus in Norway. After these divestments, there are only two more projects to divest from the original portfolio of high-priority projects – Øyfjellet in Norway and Wind Wall in the US. Final- stage project development is now underway for both projects and divestment processes have commenced. A Power Purchase Agree-ment has been signed with Alcoa for Øyfjellet. More projects will be added to the list of high-priority projects as ongoing projects are realized.
Example of a tailored solutionAs part of the Jenåsen transaction, Eolus acquired the rights to 96% of all future elec-tricity certificates for electricity generated by the farm. The purchase consideration was SEK 96 M and paid as a lump sum. Over the next 15 years, the farm is expected to receive almost four million electricity certificates. To date, we have hedged sales of approximately 391,000 certificates totaling SEK 64.7 M for delivery and payment in 2019 and 2020. The arrangement whereby Eolus acquire the rights to the electricity certificate is one example of Eolus’s ability to tailor solutions to suit the needs of our customers.
Stored solar power changes the gameIn September 2018, we announced the acquisition of a solar PV and battery storage project in southwestern US – our first project in these technologies following the broadening
of Eolus’s business model. The project is in the early stages of development, but if permits are granted, it will combine up to 500 MW of solar PV capacity with 250 MW of battery storage. Our analyses shows that such a facil-ity could generate electricity at a lower cost per megawatt-hour than an equivalent wind power facility in the same area. Solar PV and wind power are complementary technologies that, to various degrees in various markets, will play a key role in the transition to a sustainable energy supply.
EOLUS IS EXPANDINGAs indicated by the high rate of development in all of our markets and the advancement of our own project portfolio, Eolus has entered a period of expansion. At the time of writing, the order backlog of projects to be estab-lished by 2020 is SEK 4.2 billion. To secure financing for our future expansion, we signed a 4-year credit agreement with Swedbank in September. The agreement comprises credit facilities of just over SEK 1 billion. With a high-quality project portfolio, a strong financial position and dedicated employees, Eolus has a fantastic opportunity to be a driving force in the ongoing energy revolution.
PER WITALISSON
Chief Executive Officer
The Jenåsen wind farm

6 ANNUAL REPORT EOLUS VIND AB 2017/2018
EOLUS IN BRIEF
COMPETITIVE INVESTMENTS IN
RENEWABLE ENERGY
BUSINESS CONCEPTEolus aims to create value at all levels of project development, establishment and operation of facilities for renewable energy and energy storage, and to offer attractive and competitive investment objects to both local and international investors.
EXTENSIVE EXPERIENCESince the company’s inception in 1990, Eolus has developed, constructed and divested turnkey wind power facilities to investors. Eolus therefore has extensive experience and expertise in the construction of wind power facilities and a broad network of landowners, authorities, investors, sub-contractors and wind turbine manufacturers. A diverse and strong customer base is one of the main rea-sons for the company’s success and strong market position. Eolus has established a total capacity of 929 MW, which is about 13% of the wind power constructed in Sweden.
BUSINESS MODELEolus’s mission is to develop and construct wind power facilities in favorable wind loca-tions. Projects are mainly realized through the divestment of turnkey facilities. The business model also allows parts of the project portfolio to be realized through sales of project rights for permitted projects and projects under development. In connection with the 2017 Annual General Meeting, the Articles of Asso-ciation were amended to also include activi-ties related to other forms of renewable ener-gy, and to energy storage. The company currently conducts operations in the Nordic region, Baltic countries and the US. Eolus
offers a full range of asset management ser-vices to investors, enabling carefree owner-ship of wind power facilities constructed by either Eolus or other operators. Eolus still generates electricity from its own wind power facilities but the holdings have been reduced and the remaining facilities are also for sale. The company has three operating seg-ments: project development, asset manage-ment and electricity generation. Project devel-opment is by far the dominating segment. The asset management segment is steadily growing, while the electricity generation seg-ment has declined in line with the strategy to reduce Eolus’s own wind power holding. Eolus’s strengths are the localization, planning, construction and divestment of turnkey wind power facilities in a range of sizes, as well as asset management.
THE EOLUS GROUPThe Group comprises the Parent Company, Eolus Vind AB (publ) and such wholly owned subsidiaries as Ekovind AB, Svenska Vind-bolaget AB, Eolus Elnät AB, Eolus Wind Power Management AB, SIA Eolus, Eolus Vind Norge Holding A/S, Eolus North America Inc, Eolus Oy and the sub-subsidiary OÜ Baltic Wind Energy. In addition to the above companies, the Group also includes partly owned Blekinge Offshore AB and several other companies that have been formed to manage the devel-opment of specific wind power projects. Eolus owns 56% of Blekinge Offshore. The remain-ing shares are owned by Vingkraft and Vindin. In December 2016, the Swedish Government decided not to grant a permit for the project
under the Environmental Code. Although the activities of Blekinge Offshore have been reduced, the company will continue to monitor future business opportunities for the project. At August 31, 2018, Eolus’s Swedish project portfolio contained sites for 735 on-shore wind turbines with a potential capacity of approximately 2,950 MW in the pre-study, project development, granted permits and establishment phases. Most projects in the foreign portfolio are in the pre-study or project development phase, except for Eolus’s largest permitted project to date, Øyfjellet, in Norway, and Stigafjellet which is currently in the estab-lishment phase. In terms of volume, the larg-est foreign portfolio is in the US and Eolus’s first solar and battery storage project was added to this portfolio after the balance- sheet date. For more information about the foreign business operations, refer to page 18.
OBJECTIVESVisionEolus’s vision is to be the most profitable renewable energy developer and an attractive business partner in the transition to a sustain-able society.
Eolus’s overall objectives for the next three years are: • that our stakeholders (customers, employ-
ees, suppliers and shareholders) perceive us as an attractive and leading renewable energy player in all of the markets in which we operate.
• average return of at least 10% on equity after tax.
EOLUS IS A LEADING NORDIC WIND POWER DEVELOPER. Eolus aims to create value at all levels of project development, establishment and operation of facilities for
renewable energy and energy storage, and to offer attractive and competitive investment objects to both local and international investors in the Nordic region, Baltic countries
and the US. Since the company’s inception in 1990, Eolus has been involved in the construction of 541 wind turbines across Sweden and Estonia. Eolus divests
most of its projects to customers as turnkey facilities. Eolus also offers a sophisticated concept for wind power asset management services.

ANNUAL REPORT EOLUS VIND AB 2017/2018 7
EOLUS IN BRIEF
• to broaden the technological platform of our operations by participating in the establishment of at least one solar farm or energy storage facility.
• to initiate the development of new wind power projects in Nordic and Baltic coun-tries to secure a long-term and commercial-ly viable portfolio for establishment from 2022 and onwards.
STRATEGY Eolus’s core business is to construct turnkey wind power facilities in favorable wind loca-tions and transfer them to customers. The company is also active in solar power and energy storage. The strategy for the company’s project development is to focus on projects that are most likely to be realized, regardless of mar-ket, and to develop them with the highest possible quality at the lowest possible cost. This increases opportunities for offering end-investors facilities that provide the lowest-possible cost per megawatt-hour over the useful life of the facility. A careful selection process based on access to wind or solar, opportunities for grid connection, and constructability in terms of roads and foundations is paramount, combined with a commercial focus in the early stages.
This ensures that projects with the greatest potential receive sufficient priority. To assess wind resources, Eolus conducts wind meas-urements for all large projects. Eolus normally secures user rights through leasehold agreements, rather than owning the land on which turbines are installed.
Eolus’s strategy is to offer landowners a commercial lease that is normally paid as an annual lease equivalent to a certain percentage of the value of the electricity generated by the facility. In some projects, neighboring landowners are also offered lease revenue.
We take responsibility for the transition to a sustainable society. We act responsibly in our contact with authorities, local residents, customers and share-holders.
We strive for dialog and engagement with stakeholders affected by
our wind power projects and offer opportunities
for investment in re- newable energy.
EOLUS’S CORE VALUES By acting in a
consistent manner in regard to respon- sibility, participation and results, we will inspire the trust of
shareholders, customers, banks, authorities, land owners and the public.
Our income statement is positive and our balance sheet shows financial strength. With our wind power facilities, we also aim to offer our customers a profitable investment and favorable terms for the landowners affected.
The Iglasjön wind farm
R
ESP
O
NSIBILITY COMM
ITME
NT
RESULTS CONFID
ENC
E

8 ANNUAL REPORT EOLUS VIND AB 2017/2018
MARKET
RAPID GROWTH FOR WIND AND SOLAR
The future looks to belong to renewable ener-gy sources. The global energy market is un-dergoing nothing short of a revolution, driven by wind and solar energy combined with a better economy for energy storage technolo-gies. While the power generation mix can vary from market to market, the trend is clear – the share of renewable electricity generation is growing steadily. According to Bloomberg NEF’s New Energy Outlook 2018, the world is poised to see a transition from fossil fuels accounting for 2/3 of the global electricity gen-eration mix in 2017, to renewables accounting for 2/3 by 2050. The pathway to achieve this, according to the same report, is via wind and solar technologies jointly accounting for more than 70% of investments in new power generation. Wind and solar technologies are predicted to account for 50% of the world’s electricity generation by 2050. In this transi-tion, coal will shrink and be the biggest loser.
OPPORTUNITIES FOR INNOVATORSThe establishment costs for both wind and solar will continue to fall sharply, according to Bloomberg. The cost of establishing solar power is expected to drop by 71% by 2050, and the cost of onshore wind power by 58% during the same period. The falling costs will reduce the need for subsidies in the market and technologies will be able to stand on their own feet moving forward. This trend is chal-lenging existing business models and present-ing new business opportunities for anyone who wishes to embrace change, rather than stick-ing to past truths and old business models.
Modern wind power technology is relatively new compared with hydro or nuclear power. The technological advancements of recent years include longer rotor blades, higher tow-ers and higher generating capacity, resulting in more efficient turbines that can generate more energy from the wind. Rapid technologi-cal advancements combined with more efficient construction methods, for example, have reduced the investment cost per mega-watt-hour by approximately 75% since the advent of wind power in the 1980s.
THREE COUNTRIES DOMINATEAccording to statistics from the Global Wind Energy Council (GWEC), global installed wind power capacity in 2017 totaled 54,642 MW. Cumulative installed capacity reached 539,581 MW. In 2017, China, the US and Germany remained the countries with the highest share of cumulative installed capacity. China accounted for 37% of the installed capacity, while the US and Germany account-ed for approximately 13%, respectively. These three countries jointly account for most of the wind power installed globally – about 62% of all wind energy has been established in one of them.
LOW GENERATION COSTSOnshore wind power is one of the cheapest methods for adding new generation capacity, according to the Swedish Energy Agency’s report, Generation costs for wind power, published in September 2016. The cost of establishing new wind power is already
cheaper now than the cost of establishing new nuclear power. Offshore wind power holds major potential in both the Nordic region and globally, and plays a key role in the shift toward more renewable electricity generation. Once high, the cost of establish-ing offshore wind power is now falling rapidly and some of the winning bids in auctions conducted recently in Europe have not required subsidies. Eolus will continue to follow these developments closely and monitor future opportunities for the Blekinge Offshore project with up to 2,500 MW in capacity, for which the Swedish Government prioritized the Swedish Armed Forces’ interests and denied a permit in 2016.
WIND POWER IN THE NORDIC REGION The development of wind power in Sweden has been fantastic. In 2006, wind power accounted for approximately 1 TWh, or less than 0.5%, of the country’s electricity genera-tion. In 2017, Swedish wind power account-ed for 17.3 TWh, or 11%. Wind power is now well-established as the country’s third-highest source of electricity after hydropower and nuclear power. According to Swedish Wind Energy’s forecast from the third quarter of 2018, the estimated generation capacity of facilities in operation at the end of 2018 is 19.8 TWh annually. The same forecast shows that wind-power generation could amount to 30 TWh annually by 2021, given the current rate of expansion. Swedish Wind Energy’s assessment shows that Swedish wind power could generate
Source: Wind Europe, Wind in power 2017 European statistics
PROPORTION OF INSTALLED CAPACITY IN 2017, PER EU COUNTRY
Total 54,642 MW
Germany 42.0%
UK 27.2%
France 10.8%
Finland 3.4%Belgium 3,0%
Ireland 2.7%Denmark 2.2%
Greece 1.8%Italy 1.6% Others 5.1%
Source: GWEC
PROPORTION OF INSTALLED CAPACITY IN 2017, GLOBALLY
Total 54,642 MW
China 37%
US 13%
Germany 13%
UK 8%India 8%
Brazil 4%France 3%
Turkey 1%Mexico 1%Belgium 1%
Others 11%
Source: GWEC
2013 2014 2015 2016 2017
MW
0
100,000
200,000
300,000
400,000
500,000
600,000539,581
486,790
432,680
369,862
318,697
2012 2013 2014 2015 2016
MW
050 000
100 000150 000200 000250 000300 000350 000400 000450 000500 000 486 790
432 680
369 862
318 697282 850
TOTAL GLOBAL CUMULATIVE INSTALLED WIND POWER CAPACITY, 2013-2017

ANNUAL REPORT EOLUS VIND AB 2017/2018 9
MARKET
70 TWh by 2040 and, combined with hydropower, become the leading source of power generation.
GREEN BATTERY POTENTIALAt the end of 2017, with an installed capaci-ty of 6,691 MW, Sweden was ranked 12th in the world in terms of wind power penetra-tion. In Europe, Sweden is ranked seventh after Germany, Spain, the UK, France, Italy and Turkey. According to the Swedish Energy Agency’s report Generation costs for wind power in Sweden, Sweden has the lowest generation costs for wind power of any country in Europe. In Norway, expansion began later but is now gathering momentum. In 2017, wind power accounted for 2.85 TWh, or 1.9%, of Norway’s electricity generation according to statistics from the Norwegian Water Resources and Energy Directorate (NVE).
When planned or ongoing establishments are completed, generation is expected to reach 12 TWh. In recent years, more electricity has been generated than consumed in the Swedish market, enabling Sweden to be-come a net exporter of electricity. Norway and Sweden combined have major potential to become Europe’s green battery, with large-scale carbon-free electricity generation to replace the dirty fossil-fuel energy used by other countries. Further opportunities to export electricity are positive for Sweden and Norway, making expansion of the trans-mission capacity even more important, not only within these countries but also to other
ABOUT ELECTRICITY CERTIFICATESThe Swedish-Norwegian support system for renewable electricity generation is the called the Electricity Certificate System. This is a technology-neutral support scheme for gener-ation from wind power, some hydropower, some biofuels, solar energy, geothermal ener-gy, tide and wave energy and peat in com-bined heat and power plants (CHPs). Electrici-ty generators in the Electricity Certificate System are awarded certificates in relation to their facility’s generation over 15 years, where one megawatt-hour of electricity generated carries the right to one certificate. The Electric-ity Certificate System is not linked to the countries’ national budgets and is financed by a surcharge on electricity prices for private consumers and for commercial and service companies. Other countries have opted for a fixed price per megawatt-hour generated, linked to the respective country’s national budget. Demand for electricity certificates is regulated by a quota obligation, which deter-mines the number of electricity certificates that an electricity consumer needs to purchase in relation to their annual electricity consumption. By changing the quota obligation, the parlia-ment of each country can control the price of electricity certificates. There is no quota obli-gation or electricity certificate cost for electrici-ty-intensive industry in Sweden. This enables industry to benefit from low electricity prices due to the expansion of renewable energy.
Continued high expansion rateSweden introduced the Electricity Certificate System in 2003 and Norway became affiliated in 2012. Within the framework of the energy agreement reached by five parliamentary par-ties in 2016, Sweden decided to extend the Electricity Certificate System by adding 18 TWh of new electricity certificates until 2030. In Norway, facilities established after 2021 will not be included in the System. Considering that wind power is one of the cheapest meth-ods for adding new generation capacity, the vast majority of investing decisions have been related to wind power. In April 2017, the Swedish and Norwegian governments reached an agreement on how the Swedish extension of the Electricity Certifi-cate System would be designed in relation to the existing joint Swedish-Norwegian certifi-cate system. The agreement created clear incentives for further expansion and the pace of development under the System has ex-ceeded all expectations. The investments that are needed to meet the objectives of the Electricity Certificate System will probably have been implemented by 2020. The market will therefore meet the objective long before 2030 which, in turn, will create a need for policy decisions and mechanisms to maintain the legitimacy of the System. For more infor-mation about electricity certificates, visit: www.energimyndigheten.seor www.nve.no.
Wind and solar combined will account for more
than 70% of investments in new power
generation.
70
Source: Swedish Energy Agency
NET GENERATION OF ELECTRICITY IN SWEDEN, 2013-2017
TWh 2013 2014 2015 2016 2017
Hydropower 60.8 64.2 73.9 61.2 63.9
Nuclear power 63.6 62.2 54.3 60.5 63.0
Wind power 9.9 11.5 16.6 15.4 17.3
Cogeneration 8.6 6.9 7.1 7.8 7.9
Cogeneration in industry 6.0 5.9 5.9 5.9 6.1
Condensation power 0.6 0.5 0.4 0.6 1.0
Total net generation 149.5 151.2 158.3 151.5 159.1
TRENDS IN THE SWEDISH WIND POWER MARKET:
• Fewer but larger establishments
• Foreign investors account for a major share of the expansion
• Power Purchase Agreements (PPA) are becoming more common
• Sharp decline in establishment costs
• Major need for professional asset management for facilities, including long-term service agreements

10 ANNUAL REPORT EOLUS VIND AB 2017/2018
MARKET
countries, in addition to the transmission opportunities that already exist or are under construction to Germany and the UK, for example. The future potential to store electrici-ty will present major opportunities for Sweden and Norway to increase their share of intermit-tent energy sources, such as wind and solar. In 2018, the price of electricity and elec-tricity certificates rose considerably compared with recent years, making the market even more attractive to investors. According to Bixia’s long-term forecast (published in No-vember 2018), electricity consumption in the Nordic region is expected to increase by 25 TWh by 2030, despite energy efficiencies and increased solar PV microgeneration, in particular. The increase is due a growing popu-lation, more electric vehicles and the establish-ment of more data centers. Compared with its long-term forecast from November 2017, Bixia has revised upward its growth forecast for electricity consumption by 4 TWh. In its base-line scenario, Bixia predicts a price of SEK 440 per MWh by 2025, and SEK 460 per MWh by 2030. The increase is linked to rising fuel pric-es, but simultaneously dampened by the ex-pansive development of renewable generation.
NEW BUSINESS OPPORTUNITIES Since 2017, Eolus’s Articles of Association have included other types of renewable energy in addition to wind power, as well as energy storage. This is a natural change in order to be part of a trend in which solar power, for example, is be-coming an increasingly larger and more important share of the global energy mix. By 2050, wind and solar will account for most of the world’s new power generation capacity, according to Bloomberg NEF’s New Energy Outlook 2018. The rapidly falling costs of renewable generation from wind and solar present exciting combi-nation solutions, as well as market offers with independent sources of energy.
BETTER BATTERIESThe rising share of intermittent energy sources in the energy mix is also creating a growing need to identify smart solutions for storing energy. New market conditions are presenting opportunities for a range of storage solutions. In general, both large-scale industrial batteries and small-scale flexible battery solutions are expected to offer major opportunities for storage. Just like wind and solar, battery costs are falling fast and helping to change market conditions. In September 2018, Eolus acquired an early-stage solar and battery storage project in southwestern US. The project comprises up to 500 MW of solar capacity and 250 MW of battery storage.
BY ITS OWN POWEREolus’s objective is to continue pushing down costs per megawatt-hour. The aim is to reach a position where no extra support is needed to make the establishment of new facilities profitable for investors in the markets where Eolus is currently active and may enter into in the future. Value-chain efficiencies through-out the lifespan of a wind power project are essential for meeting return on investment requirements. By significantly reducing the costs of wind power establishment, projects can be profitable for end-investors in a range of markets.
POWER PURCHASE AGREEMENTS – GROWING TREND IN THE NORDIC REGIONA growing trend in the Swedish and European electricity markets is Power Purchase Agreements (PPA). So called Corporate PPAs are contracts between an electricity genera-tor and an electricity purchaser to buy electricity directly from specific facilities, usually from wind power or photovoltaic (PV) facilities. The contractual terms can vary from five years and upwards, with fixed predetermined prices for all electricity generated by the facility. Long-term contracts with predetermined prices provide security for electricity purchasers and clarity in relation to costs during the contractual term. The also provide security for both the owner of the facility and the builder by defining the revenue terms.
Highly significant agreementThis type of contract is common in the US, and becoming increasingly common in Europe, particularly for facilities owned by institutional investors who do not have electricity generation as their core business. Power Purchase Agreements (PPA) have played a pivotal role in the rapid expansion of wind power in the Nordic market and will continue to do so in the future financing of facilities for renewable electricity generation. In the Nordic market, such companies as Google, Norsk Hydro, Vattenfall and Alcoa have actively sought PPAs with wind power facilities. In March 2018, Eolus signed a 330 MW-PPA with Alcoa for Øyfjellet. Eolus has signed two PPAs with Google for 59 and 79 MW, respectively, the latter relating to Jenåsen which was completed in 2018. With PPAs signed all over the world, Google is now the world’s largest corporate buyer of renewable electricity.
A social shift, with lower greenhouse gas emis-sions, such as CO2, is vital. The latest report from the UN Intergovernmental Panel on Climate Change (IPCC) warns that we have 12 years to significantly reduce carbon emissions to keep global warning to a maximum of 1.5°C. Beyond that, even half a degree could significantly worsen the risks of drought, floods, extreme heat and poverty. A transitioning energy market is playing a key role in meeting this challenge, which the IPCC claims is possible to achieve both economi-cally and time-wise. After the Paris Agreement and subsequent ratification of the long-term goal
to keep the average global temperature well below 2°C, a strong global willingness to transi-tion not only the energy sector but also other sectors of society became apparent. This force is far stronger than the objectives and actions of national governments. Federal states, regions and cities from all over the world must unite with companies and organizations that want to contribute to these efforts. In a cross-party energy agreement in 2016, Sweden adopted a target of 100% renewable electricity generation by 2040.
HIGH TIME FOR A COLLABORATIVE EFFORT

ANNUAL REPORT EOLUS VIND AB 2017/2018 11
CUSTOMER GROUPS
Since its inception in 1990, Eolus has built trust and credibility with customers, landown-ers, shareholders, creditors and employees. Creating and maintaining a high level of trust is a prerequisite for attracting both capital and the expertise required for continued growth and new business. With a flexible business model and strong balance sheet, Eolus has adapted to market fluctuations and the pre-vailing market conditions to effectively meet investor demands. The customer base is broad and diverse, ranging from global inves-tors in the form of insurance companies, pension funds, infrastructure funds and energy companies, to small businesses and private individuals. Due to the trend toward fewer but larger wind farms, it is only natural that the vast majority of sales are generated by major investors.
INSTITUTIONAL INVESTORSInstitutional investors, including various types of funds, insurance companies and reinsur-ance companies, now account for most in-vestments in the Nordic wind power market. Ownership of public infrastructure, such as wind power, is driven by long-term invest-ments with relatively stable returns and cash flows. This, in turn, generates security in companies’ commitments to their customers in reinsurance and pension investment seg-ments. Anyone who invests in renewable electricity generation is also supporting the transition to fossil-free electricity generation, which reduces CO2 emissions and, in the long term, reduces risk in other climate-related investments and insurance commitments. In recent years, major global players such as Aquila Capital, Munich Re, Allianz, Black Rock, Mirova, KGAL and HG Capital have invested heavily in Swedish wind power.
MAJOR CONSUMERSMajor consumers are companies and organi-zations that consume large amounts of elec-tricity but do not have energy generation as their core business. This customer group is growing – partly because electricity from wind power provides secure, low and stable electricity costs over time, but also because of a sustainability perspective. More and more companies want to be recognized for their role in the transition to a fossil-free future.
Investments can take the form of direct in-vestments, or long-term PPAs, which are common in the US. A PPA is a contract whereby a party agrees to purchase the power generated by a specific facility for a certain period of time and can thereby contribute to expanded capacity without owning any facilities. This type of agreement has become increasingly common in the Nordic region in recent years and Eolus, for example, has entered into two PPAs with Google and one with Alcoa.
ENERGY COMPANIESOnshore wind power is one of the most cost- efficient methods for adding new generation capacity and is therefore attractive to compa-nies with energy generation as their business mission. In addition to adding cost-efficient generation capacity, by investing in wind power, energy companies are able to offer customers green electricity from their own facilities. Over the years, Eolus has divested both turnkey facilities and operational turbines to both Swedish and international energy companies.
PUBLIC-SECTOR INVESTORSPublic-sector investors are mainly municipali-ties, county councils/regions and municipal companies. Ownership of electricity genera-tion facilities creates predictability and control over costs for electricity consumption in their own operations. Investments in wind power contribute to sustainable development and thus meet the environmental and energy objectives that many public-sector players have set for their operations.
WIND TURBINE COOPERATIVESEolus has been selling shares in wind turbines to customers for more than 25 years, thus enabling thousands of private individuals and companies to become wind power shareholders. This cooperative model has also been a success factor for Eolus over the years. Due to new market conditions and a greater focus on large establishments, fewer shared-ownership projects will be es-tablished. During the fiscal year, the Vilseber-ga wind farm, comprising two Vestas V100-2.2 MW wind turbines, was divested by selling shares to investors.
CLEAR CUSTOMER BENEFITSWith more than 25 years of experience and involvement in the construction of 541 wind turbines as of August 31, 2018, Eolus has built up expertise across the entire value chain and a financial position that makes the com-pany a strong and stable partner. Eolus’s pro-ject portfolio in Sweden, and in other markets in which the company operates, presents major opportunities to offer facilities tailored to the specific needs of individual investors at the lowest possible cost per megawatt-hour. Eolus’s complete asset management concept offers professional management that maximiz-es revenue for both large and small investors. As one of the largest players in the industry, Eolus can push investment and operating expenses down, which benefits investors in all customer groups.
BENEFITS FOR EVERYONE.WIND POWER AS AN INVESTMENT
The Fröreda wind farm

PROJECT DEVELOPMENT
12 ANNUAL REPORT EOLUS VIND AB 2017/2018
The company’s project development rests on several pillars. The aim is to advance projects that meet investors’ needs for sustainable in-vestments in a simple and profitable manner. The process must also be based on clear public benefit with the ability to create, in co-existence with other interests, the condi-tions for generating green electricity with the lowest carbon footprint as possible over the entire life cycle. This should be carried out as profitably as possible for the company, which requires a clear focus on the projects with the greatest chance of being realized.
PROJECT DEVELOPMENT PHASESThe project phases are: pre-study, project development, construction and divestment of the facilities. After final commissioning, the construction phase is completed by either customer handover, or by transfer to Eolus’s own electricity generation operations if a customer contract has not been signed. The divestment phase is obviously varied, depending on the size and frequency of the transactions. If a contract has not been signed when all, or some, of a wind farm becomes operational, revenue and expenses from operations are recognized in the Electric-ity Generation operating segment until the en-tire facility has been divested. Eolus has an extensive project portfolio, with projects in various phases. This provides good oppor-tunities for meeting a range of investor requirements and demands.
REVENUE AND EXPENSESRevenue in this operating segment comprises proceeds from the divestment of facilities, shares in project companies or project rights. Due to the construction rate of the facilities, and the dates of their divestment, sales and earnings vary between quarters and fiscal
years. Over the past four fiscal years, project development operations have accounted for 92-98% of Eolus’s overall revenue. Wind power facilities are divested by transferring entire operational wind farms, individual wind turbines or shares in wind turbines. Eolus also offers construction-ready project rights. The most costly item when establishing a wind power facility is the actual wind turbine. Eolus mainly purchases turbines in EUR, which entails an element of risk. This is managed with currency futures to hedge the cash flow in foreign currency, by raising loans in EUR or by divestment to customers in EUR. Overall, the actual wind turbine ac-counts for 65-75% of the costs for a turnkey facility. Others costs include project develop-ment, foundations, road construction and grid connection. The project development operations are mainly financed with advance payments from customers, construction loans or equity. At present, Eolus conducts project development operations in Sweden, Norway, Finland, the US and Baltic countries.
COMMUNICATION AND INTERACTIONEolus’s work affects and impacts many people. Those living close to a wind farm are obviously affected, but also people in general and other stakeholders such as authorities and future green electricity cus-tomers. Open dialog about both positive and perceived negative effects is therefore impor-tant, as well as providing continuous updates about the ongoing process, and answering any questions that may arise in connection with both the construction and the subse-quent operation. Interaction with the local community is therefore a crucial part of a project.
THE IMPACT OF LARGER FARMSAs market conditions change due to techno-logical advancements, electricity prices and investors, Eolus will establish fewer but larger facilities in the future, with larger wind tur-bines. Despite signing agreements for the largest wind turbines in the company’s history during the fiscal year, Eolus signed contracts for even larger turbines after the end of the fiscal year – nine Vestas V150-4.2 MW wind turbines for the Bäckhammar wind farm. With fewer but larger established wind farms, the fluctuations between individu-al quarters and fiscal years in relation to the number of constructed wind turbines, and sales and earnings, could be considerable.
LARGER, BUT FEWER:NEW FOCUS
From the company’s inception in 1990 until the balance sheet date on August 31, 2018, Eolus has been involved in the construction of 541 wind turbines with a total capacity of approximately 929 MW. During the 2017/2018 fiscal year, 25 wind turbines (25), with a total capacity of 83.8 (72.2) MW, were con-structed and completed. At the end of the fiscal year, 74 wind turbines were under construction, compared with 25 on the corresponding date of the preceding year.
CONSTRUCTED DURING THE 2017/2018 FISCAL YEAR
Name Municipality Capacity in MW
Vilseberga Vadstena 4.4
Jenåsen Sundsvall 79.4
Total 83.8
PROJECT DEVELOPMENT – KEY FIGURES
SEK M
Full-yearSep 1, 2017
-Aug 31, 2018
Full-yearSep 1, 2016
-Aug 31, 2017
Net sales 1,336.5 1,027.4
Other operating income 14.5 2.9
Operating profit 201.4 44.5

ANNUAL REPORT EOLUS VIND AB 2017/2018 13
PROJECT DEVELOPMENT
The Fröreda wind farm
Eolus has been involved in the construction of
541 wind turbines since 1990.
541
GroupAug 31, 2018
Group Aug 31, 2017
No. of turbines
Total capacity,
MW
No. of turbines
Total capacity,
MW
Pre-study 201 767 290 915
Project development 298 1,139 368 1,164
Projects with relevant permits 162 586 251 780
Under construction 74 279 25 84
Total 735 2,771 934 2,944
GroupAug 31, 2018
Group Aug 31, 2017
Country
No. of turbines
Total capacity,
MW
No. of turbines
Total capacity,
MW
Norway 100 400 110 400
Latvia 117 468 115 420
Estonia 42 168 42 150
Finland 14 56 14 50
US 99-292 258-740 99-292 258-740
EOLUS’S SWEDISH PROJECT PORTFOLIO EOLUS’S OTHER PROJECT PORTFOLIOS

14 ANNUAL REPORT EOLUS VIND AB 2017/2018
PROJECT DEVELOPMENT
As establishments have become fewer but larger, the need for a clear focus on the pro-jects that best meet market demands for new generation facilities has increased. Eolus’s strategic direction is focused on the development, establishment and divestment of a number of high-priority projects that are considered to have the best chances of being realized at the lowest cost per megawatt-hour. The compilation of high-priority projects and how they are being developed is addressed under a separate heading in Eolus’s interim reports and presented on the company’s
website. The website is updated quarterly following the publication of each quarterly report, or due to other significant project events announced in a press release. The following projects currently have highest priority. The Jenåsen project was completed and handed over during the 2017/2018 fiscal year and is no longer in-cluded in the compilation of high-priority projects. The remaining high-priority projects have an estimated transaction volume of about SEK 8 billion and customer contracts were signed for most of them during or after
the 2017/2018 fiscal year. For the Øyfjellet wind farm, a Power Purchase Agreement has been signed with Alcoa and a divestment process is ongoing. The rapid advancement of Eolus’s projects is an indication of how attractive these projects are for investors. As existing high-priority projects are com-pleted, new projects are added to the compi-lation. However, the compilation does not rule out the establishment of other projects from Eolus’s high-quality project portfolio that meet investors’ demands and requirements.
EOLUS’S HIGH-PRIORITY PROJECTS
HIGH-PRIORITY PROJECTS
Project Location No. of turbines
Capacity, MW
Estimated generation,
GWh
Planned deployment
Comments
Nylandsbergen Sundsvall, Sweden, SE2 18 68 230-250 2019 The farm was divested to Aquila Capital, which is expected to take possession of the facility in the second half of 2019. Turbine supply agreement signed with Vestas. Grid connec-tion agreement signed with E.ON. Under construction.
Kråktorpet Sundsvall, Sweden, SE2 43 163 550-590 2019 The farm was divested to Aquila Capital, which is expected to take possession of the facility in the second half of 2019. Turbine supply agreement signed with Vestas. Grid connec-tion agreement signed with E.ON. Under construction.
Wind Wall Tehachapi, California, US 11-12 38-40 135-145 2020 Repowering project. Full-value Production Tax Credit granted for the project.
Stigafjellet Bjerkreim, Norway, NO2 7 30 110-130 2020 The farm was divested to ewz, which is expected to take possession of the facility in the second half of 2020. Grid capacity reserved. Turbine supply agreement signed with Siemens Gamesa.
Sötterfällan Jönköping, Sweden, SE3 10 36 125-135 2019 The farm was sold to KGAL, which is expect-ed to take possession of the facility in summer 2019. Turbine supply agreement signed with Vestas.
Bäckhammar Kristinehamn/ Degerfors, Sweden, SE3
31 130 400 2020 The farm was sold to KGAL, which is expect-ed to take possession of the facility in summer 2020. Turbine supply agreement signed with Vestas.
Øyfjellet Vefsn, Norway, NO4 80-100 330-400 1,200-1,500 2021 Fully concessioned. Grid capacity reserved. 15-year Power Purchase Agreement with Alcoa. Divestment process initiated.
PROJECT DEVELOPMENT
ANNUAL REPORT EOLUS VIND AB 2017/2018 15
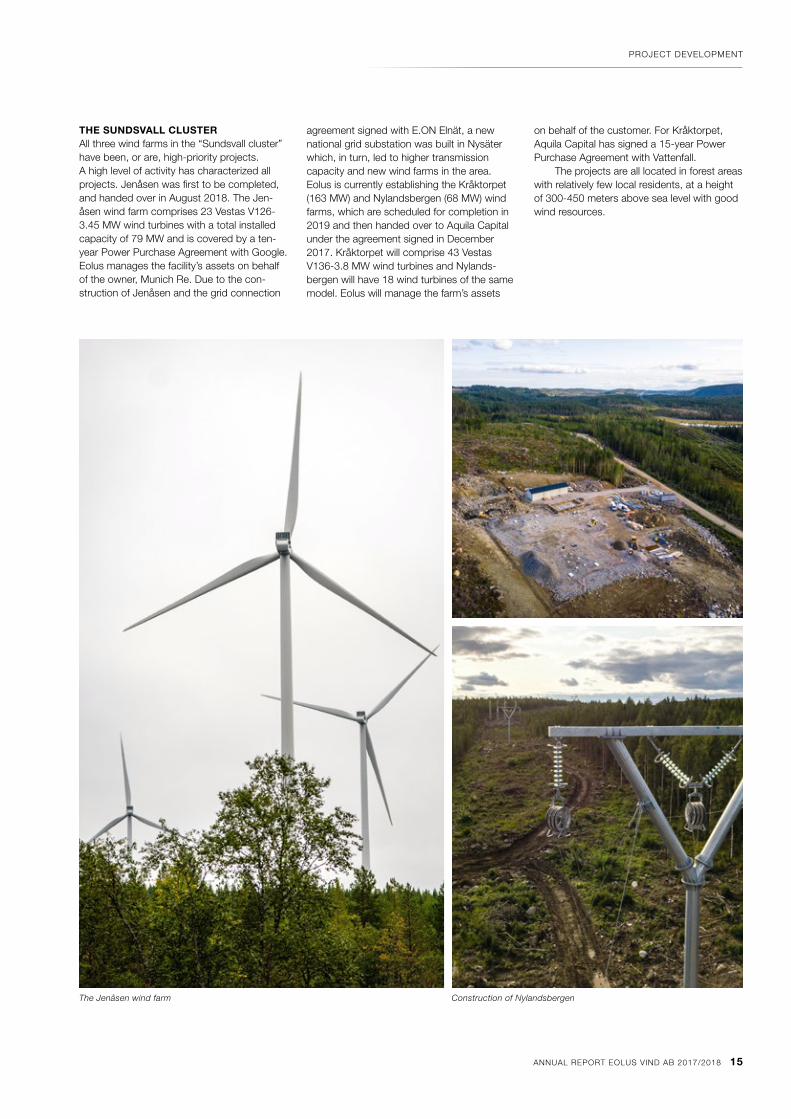
THE SUNDSVALL CLUSTERAll three wind farms in the “Sundsvall cluster” have been, or are, high-priority projects. A high level of activity has characterized all projects. Jenåsen was first to be completed, and handed over in August 2018. The Jen- åsen wind farm comprises 23 Vestas V126-3.45 MW wind turbines with a total installed capacity of 79 MW and is covered by a ten-year Power Purchase Agreement with Google. Eolus manages the facility’s assets on behalf of the owner, Munich Re. Due to the con-struction of Jenåsen and the grid connection
agreement signed with E.ON Elnät, a new national grid substation was built in Nysäter which, in turn, led to higher transmission capacity and new wind farms in the area. Eolus is currently establishing the Kråktorpet (163 MW) and Nylandsbergen (68 MW) wind farms, which are scheduled for completion in 2019 and then handed over to Aquila Capital under the agreement signed in December 2017. Kråktorpet will comprise 43 Vestas V136-3.8 MW wind turbines and Nylands-bergen will have 18 wind turbines of the same model. Eolus will manage the farm’s assets
on behalf of the customer. For Kråktorpet, Aquila Capital has signed a 15-year Power Purchase Agreement with Vattenfall. The projects are all located in forest areas with relatively few local residents, at a height of 300-450 meters above sea level with good wind resources.
The Jenåsen wind farm Construction of Nylandsbergen

16 ANNUAL REPORT EOLUS VIND AB 2017/2018
PROJECT DEVELOPMENT
THE NORWEGIAN ØYFJELLET AND STIGAFJELLET PROJECTSEolus has been active in Norway since 2012. In Norway, like Sweden, Eolus is able to de-velop projects independently, acquire ongoing projects, acquire permitted projects and divest project rights at any time throughout the value chain. Projects in the Norwegian market are often characterized by challenging terrain and complex infrastructure, but also high average wind speeds, which leads to high productivity in established facilities. During the fiscal year, the high-priority Norwegian projects, Øyfjellet and Stigafjellet, developed favorably. In March 2018, Eolus signed a 15-year Power Purchase Agreement
with Alcoa for the Norwegian Øyfjellet project. The project is Eolus’s largest permitted project to date. The original concession was for 330 MW but in October 2018, the Norwe-gian Water Resources and Energy Directorate (NVE) raised the concession to 400 MW. Alcoa will purchase all electricity generated by the new wind farm with deployment planned for 2021, with the aim of supplying its production facility in Mosjøen with local electricity. Deployment in 2021 will qualify the wind farm for certificates under the joint Swedish-Norwegian Electricity Certificate System. As part of the arrangement, Eolus has signed a power guarantee with the Norwegian Export Credit Guarantee Agency
(GIEK). The guaranteed amount is EUR 256 M. The divestment process and procure-ment of turbines has commenced. In July 2018, Eolus signed an agreement with ewz regarding divestment of the Stiga-fjellet wind farm (30 MW). The wind farm is scheduled for deployment in the second half of 2020 and ewz will contribute financing during the construction phase. The wind farm will comprise seven Siemens SWT-DD-130 4.3 MW wind turbines. Eolus will provide asset management services for the wind farm, which is located in Bjerkreim, south of Stavanger, and this is the first wind farm completed by Eolus in Norway.
Öyfjellet

ANNUAL REPORT EOLUS VIND AB 2017/2018 17
PROJECT DEVELOPMENT
WIND WALLIn December 2016, Eolus acquired 60% of the Wind Wall project in Tehachapi, California, in the US. This is a repowering project, in which old turbines are being replaced by new modern turbines. The farm comprises some 400 old wind turbines with an installed capaci-ty of approximately 36 MW. Together with its US partners, Eolus intends to realize a project of 38-40 MW by constructing new wind tur-bines. By replacing the old wind turbines on site, electricity generation will increase to about 135-145 GWh annually, or three times the existing volume. By ordering the required amount of wind power components, Eolus has received a full-value Production Tax Credit (PTC) for the project.
SÖTTERFÄLLANIn December 2017, Eolus signed an agree-ment with the German fund manager, KGAL, regarding divestment of the Sötterfällan wind farm (36 MW). Sötterfällan lies close to the Gunillaberg wind farm, which Eolus also constructed on behalf of KGAL. The wind farm will comprise 10 Vestas V136-3.6 MW wind turbines and is scheduled for customer handover in summer 2019. Eolus will provide asset management services to maximize the facility’s output.
BÄCKHAMMARIn October 2018, Eolus signed a new agree-ment with the German fund manager KGAL. This time regarding divestment of the Bäck-hammar wind farm with a capacity of 130 MW. Bäckhammar will comprise 22 Vestas V136-4.2 MW and nine Vestas V150-4.2 MW wind turbines. The Vestas V150 wind turbines are the largest turbine contract ever signed by Eolus in relation to rotor diameter. Bäck-hammar is scheduled for customer handover in August 2020 and after deployment, Eolus will provide asset management services for the facility. KGAL’s co-investor is Kempen Private Markets Fund.
Bäckhammar. The photo has been modified.
Sötterfällan. The photo has been modified.
Wind Wall, California, US.

18 ANNUAL REPORT EOLUS VIND AB 2017/2018
PROJECT DEVELOPMENT
EOLUS AROUND THE WORLD
In addition to Sweden, Eolus is also develop-ing projects in Norway, the US, Estonia, Latvia and Finland. These markets are diverse in terms of their current level of wind power de-velopment and facilities under establishement. The countries also have varying conditions in terms of their geography, infrastructure, grid capacity and support systems for renewable electricity generation. In addition to Sweden, the most attractive markets for Eolus are cur-rently Norway and the US, where Eolus has projects that are included in the compilation of high-priority projects. For more information about high-priority projects, see page 14.
NORWAYNorway joined the Swedish-Norwegian Elec-tricity Certificate System on January 1, 2012. Eolus has been active in Norway since 2012 and the first agreement to divest a wind farm in this market was signed in the 2017/2018 fiscal year. The Stigafjellet project, with an in-stalled capacity of 30 MW, was divested to ewz. This is the second wind farm completed by Eolus in a non-Swedish market. The wind farm is scheduled for customer handover in the second half of 2020. During the year, Eolus’s largest-ever per-mitted project (regardless of market), Øyfjellet outside Mosjøen in the Municipality of Vefsn in Norway, moved closer to realization when a 15-year Power Purchase Agreement was signed with Alcoa to supply their production facility in Mosjøen with local renewable elec-tricity. In autumn 2018, the Norwegian Water Resources and Energy Directorate (NVE) an-nounced that the wind farm’s concession of 330 MW had been increased to a maximum capacity of 400 MW. The divestment process has commenced and is running parallel to the procurement of turbines. The aim is that the project will be realized within the framework of the Swedish-Norwegian Electricity Certifi-cate System. In Norway, as in other markets, Eolus can acquire ongoing projects and develop new projects independently. The Norwegian project portfolio comprises a potential capaci-ty of 430 MW, of which the largest project is Øyfjellet. According to statistics from NVE, Nor-way’s installed wind power capacity was approximately 1,425 MW in October 2018.
At that same time, additional capacity of ap-proximately 2,170 MW was under construc-tion. The rapid expansion in Norway is also characterized by the aspiration to be eligible for electricity certificates. Facilities in Norway must be completed by 2021 to be included in the Electricity Certificate System. Another driving force is being able to export renewable electricity to the UK, for example, where transmission capacity already exists and is also being planned. Projects in the Norwegian market are often characterized by challenging terrain and complex infrastructure, but also high average wind speeds.
USEolus established operations in the US during the 2015/2016 fiscal year. The operations are run by the subsidiary Eolus North America Inc, with a geographic focus on Western US. Eolus’s portfolio comprises wind, solar and battery storage projects. Along the Western Nevada-California border, Eolus has two projects under development: Crescent Peak with a potential installed capacity of 200- 600 MW, and Comstock with 20-100 MW. The plan is to develop the projects and then divest them construction-ready, with or with-out a PPA. In California, Eolus is a majority shareholder in the Wind Wall repowering pro-ject in California, with up to 40 MW in installed capacity. A full-value Production Tax Credit (PTC) has been granted for the project. Eolus has selected Wind Wall as a high-priority pro-ject for for the coming years. In September 2018, Eolus acquired its first-ever PV and battery storage project. The project, located in western US, is in an early stage of develop-ment and comprises 500 MW solar PV and 250 MW battery storage. There is a federal incentive scheme in the US to promote the development of wind power. A PTC is granted for the first ten years, with a gradual step down in the value of the credit over the ten-year period depending on when construction commenced. The tax credit applies for facilities whose construction commences before the end of 2019. Facilities commenced in 2015 and 2016 qualify for the full value of the credit. The value of the credit steps down in 2017, 2018 and 2019. In addition to the federal PTC incentive, a number of US states have offensive targets
for the development of renewable energy. This indicates the major potential of the US market, which really should be seen as sever-al markets because of its geography, and the regulatory diversity in regard to permitting, grid connection and electricity trading. The five states with the most wind power installed to date are Texas, Oklahoma, Iowa, California and Kansas. According to statistics from the AWEA, Texas has the largest installed capacity by far, with 22,637 MW, which is 15,000 MW more than Oklahoma.
FINLAND AND THE BALTIC COUNTRIESOf the other markets in which Eolus is active, the country with the most wind power in-stalled is Finland. At the end of 2017, Fin-land’s installed capacity was 2,071 MW, of which 535 MW was added in 2017, according to statistics from WindEurope. The relatively high rate of expansion in recent years is due to a generous support system in the form of feed-in tariffs, combined with technical advances enabling larger and more powerful turbines. Projects with new investment deci-sions are not covered by the feed-in tariff system, which was capped at 2,000 MW. The feed-in tariff system has now been replaced by an auction-based scheme. Eolus’s project portfolio in Finland comprises 56 MW. In Estonia and Latvia, no new wind power was added in 2017. In Estonia, severe restrictions have been placed on the con-struction of large wind turbines because the Armed Forces claim that interference with their radar activities is the reason for lack of investment. According to WindEurope’s statistics, Estonia’s total installed capacity is 310 MW. 1.6 MW of this capacity is divided between two wind turbines constructed and owned by Eolus on the island of Saaremaa, where Eolus also owns land. Eolus’s project portfolio in Estonia amounts to 168 MW. Latvia has excellent wind conditions in both the western and central regions of the country, presenting major potential. At pres-ent, Eolus is one of the few active project developers in Latvia and, at the end of the fiscal year, had an estimated capacity of approximately 468 MW in its project port- folio. At the end of 2017, the country’s total installed wind power capacity was 66 MW, according to statistics from WindEurope.

ANNUAL REPORT EOLUS VIND AB 2017/2018 19
The Gunillaberg wind farm

0.8
0.2
15.2
13.2
ELECTRICITY PRICE AREA 1
Luleå
ELECTRICITY PRICE AREA 3
Stockholm
24.4
13.8
44.9
25.5
27.1ELECTRICITY
PRICE AREA 4Malmö
1.5
1.5
44.8
4.2
• MW, managed capacity.
• MW managed capacity, signed but not yet deployed.
1.2 Estonia
231.8
46.8
130.0
8.8
20.0
26.0
25.4
26.4
90.4
30.0 Norway
20 ANNUAL REPORT EOLUS VIND AB 2017/2018
At November 11, 2018, Eolus had signed asset management
agreements for 854 MW. These have either been
deployed, or are scheduled for deployment in 2019 and 2020.
854
ASSET MANAGEMENT
RELIABLE PARTNER WITH OVERALL RESPONSIBILITY
At the end of the fiscal year, Eolus had asset management assignments on both its own behalf and that of customers of 415 MW, plus signed agreements for an additional 309 MW. After the end of the fiscal year, contracts for an additional 130 MW were signed. Investors that have chosen Eolus’s asset management concept include ewz, Munich Re, Aquila Capital, KGAL, Tolvmanstegen Drift AB, Mirova/European Investment Bank and a range of public-sector investors.
During the fiscal year, Eolus increased the in-stalled capacity of its managed wind power assets from 351.0 MW to 415.4 MW, corre-sponding to approximately 18%. 408.1 MW of these wind power assets is managed on be-half of external customers. At the end of the fiscal year, asset management agreements had also been signed with external customers for Kråktorpet (163 MW), Nylandsbergen (68 MW), Sötterfällan (36 MW), Anneberg (11 MW) and Stigafjellet (30 MW), which are scheduled for deployment during 2019 and 2020. When these farms are deployed, the estimated annual generation of Eolus’s managed assets will be more than 2.1 TWh, compared with just over 1.2 TWh at the end of the fiscal year. Eolus offers wind power owners a complete package of asset management services to maxi-mize the revenue generated by their facilities over time. The goal of our technical and financial services is to ensure that the owner receives professional management of all aspects related to the operation of a facility, including surveil-lance, control, monitoring, administration and contact with the owner’s contracted service company/turbine manufacturer. As the responsi-ble operator, Eolus works closely with turbine manufacturers including Vestas, Siemens Game-sa and Enercon. In partnership with them, Eolus ensures that the facility’s availability is high and downtime is minimized. This operating segment provides recurring, stable and long-term revenue streams.
EXPERTISE CENTEREolus’s driving force is that we want our custom-ers to see the company as a partner that will do anything to maximize generation and minimize operating expenses over the life of their facility. Eolus also takes care of all other practical and administrative aspects. Over the years, Eolus has built up extensive expertise in wind farm operation. The company
has refined, packaged and offers this experience and knowledge to customers. This has also meant that Eolus’s asset management department has evolved into a center for expertise, and can offer knowl- edge on a consultative basis, both externally to turbine customers and manufacturers, and internally within the organization during the project development and construction stages.
MAJOR FUTURE POTENTIALEolus sees growing market demand, from international investors as well as other players in this segment. Investors whose core operations are neither wind power nor energy generation represent the strongest and clearest growth potential. Parties without any business operations in the relevant geographic market also hold potential. Not only does wind power hold a firm position in a total energy mix, it is also one of the fastest-growing sources of energy. This has also led a more professional approach to, and view of, asset management for wind power facilities, regardless of their size.
TOTAL SOLUTIONEolus’s Asset Management department can pro - vide technical operation and all administration of a facility, such as responsibility for electrical operations, occupational health and safety, accounting and financial statements, and insurance policies. The company also serves as the point of contact for the facility’s own suppliers, regulators and insurance companies. Eolus’s operating engineers check and monitor the facility via the company’s operations center, follow up planned and unplanned service, make regular visits to the site, conduct annual in-spections of the facility and ensure compliance with regulatory conditions and requirements. Customers can purchase either a total solution or some of the services offered by Eolus and this offer is not limited to the Swedish market.
ASSET MANAGEMENT – KEY FIGURES
SEK M
Full-yearSep 1, 2017
– Aug 31, 2018
Full-yearSep 1, 2016
– Aug 31, 2017
Net sales 16.3 14.3
Other operating income 6.8 10.0
Operating profit 2.5 1.5
Managed turbines, MW 415 351
Signed agreement, not yet deployed farms, MW 309 83
ELECTRICITY PRICE AREA 2
Sundsvall

ANNUAL REPORT EOLUS VIND AB 2017/2018 21
The Electricity Generation operating seg-ment comprises generation and sales of renewable electricity from facilities owned by Eolus. Our holding of operational wind turbines is recognized as either wind tur-bine inventories or non-current assets. Sales of electricity generation, with the associated electricity and guarantee of origin certificates, are conducted on either an ongoing basis at the prevailing spot price, or by hedging, which can vary in terms of time. Guarantee of origin certifi-cates are assigned in relation to generation and traded like electricity certificates. Eolus’s objective has been to gradual-ly reduce its own wind turbine holding in order to free up capital for investments in project development and the divestment of turnkey facilities to customers. This ob-jective has been achieved and during the fiscal year, Eolus divested 9.6 MW of wind power from its own holding in addition to the newly established facilities divested to customers. The holding was subsequently
halved during 2017/2018. The MW holding has fallen by approximately 85% over the past three years. These divestment meant that the carrying amount of Eolus’s own facilities was only about SEK 32 M at the end of the fiscal year. Due to Eolus’s strategy of being a player that develops, constructs and manages facilities rather than owning them, the significance of this operating segment will be marginal for Eolus’s earnings. The remaining facilities will be either divested or run until the end of their useful lives. In the operational phase, a wind pow-er owner’s costs usually comprise leasing fees to the landowner, service and mainte-nance, insurance, property tax and admin-istration costs. Operating expenses, excluding capital costs, are normally within the range of SEK 90-120 per MWh. Over the past four fiscal years, elec-tricity generation’s share of the Group’s overall revenue has fallen and during the fiscal year accounted for about 1%.
ELECTRICITY GENERATION
CONTINUED REDUCTION OF OWN WIND POWER HOLDING
At the end of the fiscal year, Eolus owned opera-tional wind power facilities with a total installed capacity of 8.2 (17.8) MW, and estimated annual generation of 17.2 (40.2) GWh. All turbines are recognized as non-current assets. Average revenue for the electricity generated during the fiscal year was SEK 470 (423) per MWh.
Eolus reduced its wind power holding
by 54% during the fiscal year.
54
The Långmarken wind farm
ELECTRICITY GENERATION – KEY FIGURES
SEK M
Full-yearSep 1, 2017
– Aug 31, 2018
Full-yearSep 1, 2016
– Aug 31, 2017
Net sales 14.2 24.8
Other operating income 1.2 4.5
Operating profit, before impairment losses 0.8 2.7
Operating loss, after impairment losses -1.4 -5.8
Electricity generation, MWh 30,233 58,564
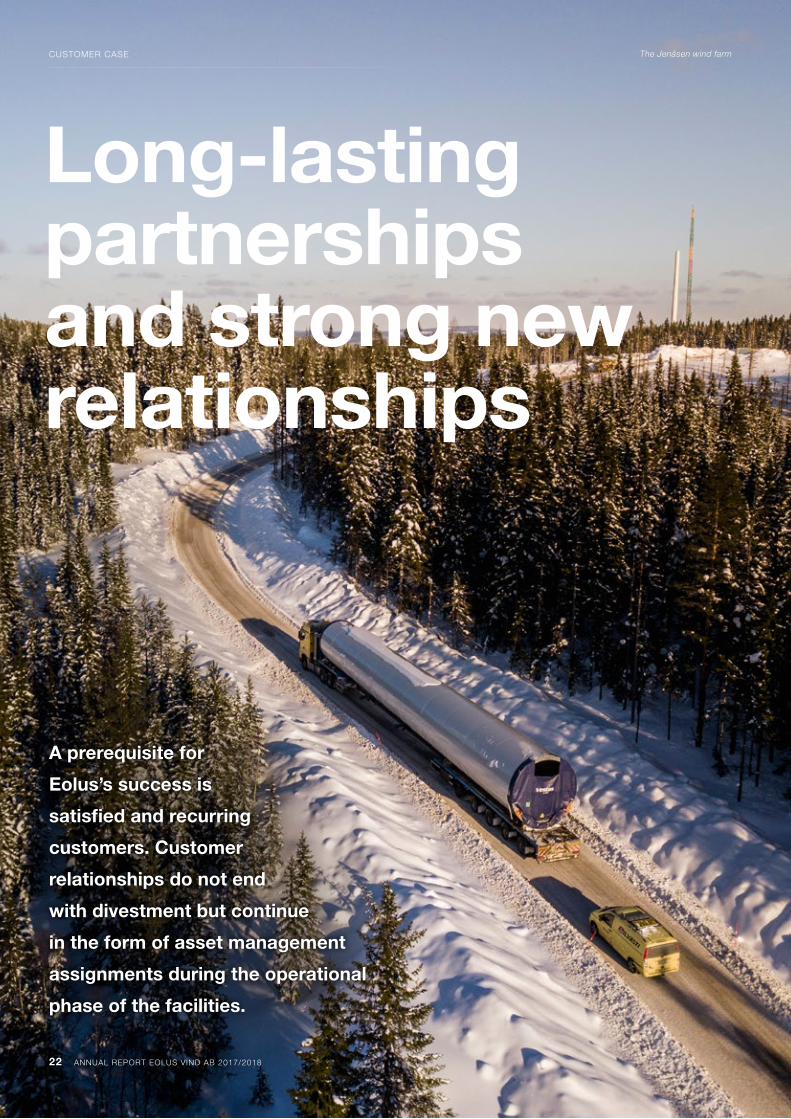
Long-lasting partnerships and strong new relationships
A prerequisite for
Eolus’s success is
satisfied and recurring
customers. Customer
relationships do not end
with divestment but continue
in the form of asset management
assignments during the operational
phase of the facilities.
The Jenåsen wind farm
22 ANNUAL REPORT EOLUS VIND AB 2017/2018
CUSTOMER CASE

ANNUAL REPORT EOLUS VIND AB 2017/2018 23
CUSTOMER CASE
Over the past fiscal year, Eolus has signed large-scale wind farm divest-ment contracts with Aquila Capital,
ewz and KGAL. Both KGAL and ewz are recurring customers, while Aquila Capital was ewz’s co-investor when Eolus completed the first Power Purchase Agreement for 59 MW with Google in 2014.
Attractive marketThe high level of investment in recent years is proof that the Nordic market is attractive to investors. A clear trend in this market is that large institutional investors account for a very high share of total investments. And the majority are foreign investors. This is also true for Eolus. “The rapid development of wind power in the Nordic region would not have been possible without foreign capital, but I would obviously have preferred that Swedish institu-tional investors were equally as offensive as their foreign counterparts,” says Eolus’s CEO Per Witalisson.
Award-winning partnersOne currently offensive player in the Nordic market is Aquila Capital. In October 2018, Aquila Capital was awarded the Swedish Re-newable Energy Award. This prize is awarded annually by Swedish Wind Energy Association to recognize role models in the business sec-tor (outside the energy industry) with an un-derstanding of the need to use renewable en-ergy, and the role of the business sector in this transition. Previous prizewinners include Google, Tesla and Wallenstam. Aquila Capital received the award in 2018 for its numerous investments in Swedish wind power, including 232 MW in Kråktorpet and Nylandsbergen that the company purchased from Eolus, in a transaction known as ‘Zlatan’ (after football icon Zlatan Ibrahimovic) because of its size and strength. “Wind energy investments in the Nordics region are getting more and more attractive and with the acquisition of the Zlatan portfolio we are further strengthening our position
in the Nordic power market. This market shows a rather good dynamic driven by the increasing investment activities of institutional investors,” says Aquila’s CEO and co-founder Roman Rosslenbroich. He continues, “Aquila Capital is well positioned to take advantage of this development – not at least thanks to our field-tested network to leading market participants like Eolus, whom we want to thank for the again very good and constructive cooperation”. Eolus’s most-recent large-scale transac-tion was completed in October, after the end of the fiscal year, when KGAL chose to trans-act with Eolus for the third time. This time for the Bäckhammar wind farm with an installed capacity of 130 MW. KGAL has now invested in in a total of five wind farms developed by Eolus. “We are delighted to have acquired another wind farm from our long-standing partner Eolus, equipped with state of the art turbines from Vestas. The investment strengthens our footprint in the Scandinavian renewable market and leverages the co- investment structure we have implemented,” says Michael Ebner, CEO, KGAL Investment Management.
Premiere in NorwayDuring the fiscal year, Eolus divested its first wind farm in Norway. Swiss energy company ewz became the historic customer that invest-ed in the wind farm with an installed capacity of 30 MW. “After the success of our first investment in Sweden we are now happy to again work with Eolus on their first project in Norway. Building strong relations and repeated busi-ness are key to an ever consolidating market,” says Hans Gunnervall, Head of Transactions at ewz. Eolus secured its first business arrange-ment with a major foreign player in 2012 when MEAG, on behalf of Munich Re, invested in operational wind farms that Eolus had con-structed. MEAG’s most recent acquisition is the Jenåsen wind farm, whose 79 MW of installed capacity is covered by a Power Purchase Agreement with Google. Holger Kerzel from MEAG commented on the transaction as follows: “We are pleased to announce a further project acquisition in Sweden. The investment makes an attractive and lasting contribution to the risk diversification of our portfolio and helps to cover Munich Re’s long-term liabilities deriving from its insurance business. The Jenåsen wind farm was handed over in August 2018.
Delighted with the confidence All customers that entered into transactions with Eolus during the year have also engaged Eolus to manage the facilities they acquired. “Eolus is obviously delighted that cus-tomers have chosen to come back to us and make new investments, while also entrusting us with management of the facilities we have divested,” says Per Witalisson.
“Customers are choosing to come back to us and make new investments, while also entrusting us with
management of the facilities we have divested.”

24 ANNUAL REPORT EOLUS VIND AB 2017/2018
SUSTAINABILITY
The transition to a sustainable society is one of today’s most important issues. The compa-ny’s operations touch all parts of the sustaina-bility concept: ecological, economic and social sustainability. Eolus therefore has a corporate social responsibility – in addition to generating a profit for our shareholders, offer-ing cost-efficient solutions to our customers and providing meaningful, stimulating work for our employees. This responsible approach is not contradictory. On the contrary – it is a competitive advantage and a prerequisite for our future success. Eolus considers the company and its operations an important part of the infrastruc-ture development that is benefiting society. Generating electricity from wind power helps to make our society more sustainable. Wind power is a natural part of Sweden’s energy supply and will play an increasingly greater role in the transition to a sustainable energy system, with a political target of 100% renew-able electricity generation by 2040. Wind is an infinite resource, and an energy source that is completely free. A wind turbine is envi-ronmentally friendly and generates minimal greenhouse gas emissions throughout its lifespan. It can generate electricity for 20- 25 years. When a turbine reaches the end of its useful life, it can be dismantled and recycled, or sometimes renovated and re- installed on a new site. The land on which wind power has been established can be restored and used either for new purposes, or for new electricity generation by construct-ing new wind turbines.
A VALUE-CREATING PARTNEREolus has been a leading Nordic player in the transition to renewable energy since 1990. The company has driven the development of greater efficiency, and has extensive knowl-edge of where and how wind farms should be built to optimize electricity generation while also accounting for other community interests. Eolus aims to be a respected company that creates value for its stakeholders. The company’s employees are expected to act properly, fairly and honestly. The same stand-ards are imposed on consultants, suppliers and other business partners. Impartiality shall prevail in all business relationships.
Eolus aims for a high degree of transparency when communicating with shareholders and society in general. Our vision is to be the most profitable wind power developer and an attractive business partner in the transition to a sustainable society.
SUSTAINABILITY REPORTThis is the first year that Eolus has prepared a Sustainability Report. The report is present-ed in a separate document, and is available on Eolus’s website www.eolusvind.com The company has conducted an analysis to determine the material sustainability aspects for Eolus and where the company has the greatest impact. The sustainability aspects that the company considers high-priority and that it intends to focus on are: • The supply chain• An attractive workplace• Anti-corruption
SUSTAINABILITY TARGETSWe intend to focus on the following targets in the coming fiscal year:
The supply chainTarget: In 2018/2019, create a Code of Conduct for the companies that are contracted for the establishment of facilities constructed by Eolus.
An attractive workplaceTarget: In 2018/2019, management will assess the need for a separate HR position and should a need exist, propose the duties involved in such a position. A report will be presented in connection with the next Sustainability Report.
Anti-corruptionTarget: In 2018/2019, the company will prepare anti-corruption guidelines and define a target of zero corruption-incidents per year.
UN SUSTAINABLE DEVELOPMENT GOALSOur work with sustainable development is based on the 2030 Agenda for Sustainable Development and its 17 Sustainable Develop-ment Goals (SDGs) set by the United Nations General Assembly in 2015. The SGDs affect all sectors of society, and the business sector has a key role to play in their achievement. Eolus’s mission embraces several SDGs, such as combating climate change, ensuring access to sustainable energy for all, and promoting decent working conditions and sustainable economic growth.
SUSTAINABLE PRIORITIES AND TARGETS
UN SUSTAINABLE DEVELOPMENT GOALS

ANNUAL REPORT EOLUS VIND AB 2017/2018 25
SUSTAINABILITY
OUR IMPORTANT EMPLOYEESEolus is a knowledge-intensive company with a small-scale organization. This means that the experience, knowledge, creativity and commitment of our employees is important for the company, and for the development of Eolus’s market offering. Reaching this goal requires a corporate culture where every em-ployee can achieve a balance between work, life and personal development. Our corporate culture also helps us to recruit and retain the best employees. Eolus has high ambitions for reducing the risk of occupational injuries and illness.
The aim is to reduce illness rates, ensure a faster return to work and to continuously improve procedures for promoting a positive health and safety culture. Eolus is not bound by any collective bargaining agreements. Instead, the company has negotiated a pen-sion and health insurance plan, and an em-ployer-sponsored wellness program. During the year, the average number of employees in the Group was 35 (33). The number of women employees was 10 (10), correspond-ing to 29% (30).
The Jenåsen wind farm

26 ANNUAL REPORT EOLUS VIND AB 2017/2018
The Stångby wind farm

ANNUAL REPORT EOLUS VIND AB 2017/2018 27
FINANCIAL SUMMARY AND THE GROUP’S KEY FIGURES
FINANCIAL SUMMARY
Amounts in KSEK 2017/2018 2016/2017 2015/2016 2014/2015 2013/2014
Income statement
Net sales 1,365,977 1,065,668 693,446 1,502,137 465,839
Operating profit 202,411 40,233 -15,949 90,040 41,477
Profit/loss after financial items 198,879 34,224 -29,057 75,243 13,143
Net profit/loss for the year 194,313 24,504 -23,918 79,994 9,930
Balance sheet
Non-current assets 177,271 147,959 291,795 351,787 426,375
Current assets 1,717,730 752,805 977,821 907,568 1,503,439
Assets 1,895,002 900,764 1,269,616 1,259,355 1,929,814
Equity, Eolus’s shareholders 814,013 657,791 671,025 731,313 936,662
Equity, non-controlling interests 1,912 1,719 140 51 47
Non-current liabilities 124,145 74,617 136,434 248,607 298,224
Current liabilities 954,932 166,637 462,017 279,384 694,881
Equity, provisions and liabilities 1,895,002 900,764 1,269,616 1,259,355 1,929,814
Cash flow statement
Cash flow from operating activities 241,724 90,971 134,190 714,911 -487,767
Cash flow from investing activities -952 -9,718 -10,395 44,167 10,254
Cash flow from financing activities 296,832 -101,037 -143,754 -604,049 200,284
Cash flow for the year 537,604 -19,784 -19,959 155,029 -277,229
Cash and cash equivalents at beginning of year 201,509 221,549 241,522 86,499 363,612
Exchange rate differences in cash and cash equivalents 712 -256 -13 -6 116
Cash and cash equivalents at year-end 739,825 201,509 221,549 241,522 86,499
KEY FIGURES FOR THE GROUP***
2017/2018 2016/2017 2015/2016 2014/2015 2013/2014
No. of turbines taken into operation 25 25 14 33 27
Turbines taken into operation, MW 83.8 72.2 37.7 68.6 53.0
Managed turbines, MW 415 351 293 303 125
Electricity generation, GWh 30.2 58.6 123.6 242.3 172.1
Average number of employees, full-time positions 35 33 33 33 37
Operating margin, % 14.8 3.8 neg. 6.0 8.9
Profit margin, % 14.6 3.2 neg. 5.0 2.8
Return on capital employed, % 21.9 5.8 neg. 7.8 2.1
Return on equity after tax, % 26.4 3.7 neg. 9.7 1.2
Equity/assets ratio, % 43.0 73.0 52.9 58.1 48.5
Earnings/loss per share, SEK 7.81 1.02 -0.92 3.25 0.44
Equity per share, SEK 32.68 26.41 26.94 29.36 37.61
Dividend per share, SEK 1.50 1.50 1.50 11.50 1.50
No. of shares at year-end, 000s 24,907 24,907 24,907 24,907 24,907
Average number of shares during the year, 000s 24,907 24,907 24,907 24,907 24,907
* Proposed dividend ** Extra dividend of SEK 10 paid on July 3, 2015.*** Refer to page 87 for a definition of key figures.
* **

28 ANNUAL REPORT EOLUS VIND AB 2017/2018
SHARE AND OWNERSHIP STRUCTURE
EOLUS’S SHARE AND OWNERSHIP STRUCTURE
Eolus Vind has two share classes, Class A and Class B. The company’s Class B share has been traded on Nasdaq Stockholm Small Cap since February 2, 2015, under the ticker EOLU B. Prior to that, the company’s Class B share has been traded on Nasdaq OMX First North since May 28, 2009, and on Nasdaq First North Premier since May 5, 2014.
SHARE PRICE PERFORMANCEDuring the fiscal year, the share price fluctuat-ed from the lowest price of SEK 21.40 on September 1 and 8, 2017 and the highest price of SEK 39.15 on July 18, 2018. At the end of the fiscal year, on August 31, 2018, the closing price was SEK 38.40. Eolus’s share price rose approximately 77.8% during the fiscal year, compared with the Nasdaq Stockholm Small Cap’s index, which rose about 14.8% during the same period. A total of 7,602,355 Class B shares were traded. The turnover rate decreased about 17.2% com-pared with the preceding 12-month period.
OWNERSHIP STRUCTUREAt August 31, 2018, the company had 8,177 shareholders, up 1,378 during the fiscal year. The ten largest shareholders accounted for 33.9% (33.1) of the capital, and 51.4% (50.9)of the voting rights. The largest shareholders were mainly Domneåns Kraftaktiebolag and Hans-Göran Stennert. At the end of the 2017/2018 fiscal year, Eolus Vind AB did not hold any treasury shares.
SHARE CAPITALAt August 31, 2018, the nominal amount of share capital in Eolus Vind AB was SEK 24,907,000 and the total number of shares was 24,907,000 (24,907,000), divided be-tween 1,285,625 Class A shares carrying one (1) voting right per share, and 23,621,375 Class B shares, carrying one-tenth (1/10) of a voting right per share. All shares outstanding are fully paid and entitle the holder to an equal share of the company’s assets and earnings. Each share has a quotient value of SEK 1.00. Shareholders are entitled to dividend pay-ments in amounts determined by the Annual General Meeting. There are no restrictions on the transfer of shares, or on the voting rights of each shareholder at Annual General Meet-ings, due to provisions in the Articles of Asso-ciation. Eolus has implemented 11 new share issues since the company was founded in 1990. The purpose of all new share issues has been to facilitate faster expansion than the company’s earnings growth has enabled. The share capital trend for the 1990-2018 period is presented in the table on page 29.
DIVIDENDSEolus’s long-term dividend policy entails that dividends over a long period of time will be determined by earnings and correspond to 20-50% of the company’s profit after tax. However, dividends will be adapted to the company’s investment requirements and financial position. Eolus may incur net debt
over time in order to continue developing the company. For a company such as Eolus, in which the development and divestment of wind turbines are an essential part of the busi-ness, maintaining a strong financial position is imperative. The Board will therefore consider the company’s long-term financing require-ments on each occasion. In view of Eolus’s strong financial position, the Board of Direc-tors proposes that a dividend of SEK 1.50 (1.50) per share be adopted by the Annual General Meeting. This corresponds to a trans-fer of SEK 37.4 M (37.4), corresponding to a direct yield of 3.9%.
FINANCIAL INFORMATIONEolus’s Investor Relations (IR) communication is characterized by open, relevant and accu-rate information to shareholders, investors and analysts with the aim of raising aware-ness of the Group’s operations and share. Eolus communicates information in the form of interim reports, annual reports and relevant press releases and provides detailed informa-tion about the company in the IR section of the company’s website, www.eolusvind.com Shareholders and other stakeholders may subscribe to press releases, the customer magazine New Winds and financial state-ments via the company’s website. Presenta-tions and interviews with the CEO of Eolus are also available on the website.
2017-09-01 2018-08-31
SEK
15
20
25
30
35
40
SHARE PRICE PERFORMANCE
Dividend, SEK Direct yield, %
Eolus B Nasdaq Stockholm Small Cap
DIVIDEND PER SHARE, AND DIRECT YIELD
2012 2013 2014 2015 2016 2013/2014
2014/2015
2015/2016
2016/2017
2017/2018
MW
050000
100000150000200000250000300000350000400000450000500000 486 790
432 680
369 862
318 697282 850
0123456789
10
0123456789
10
SEK %
25
30
35
40
012345678910
KEY FIGURES PER SHARE
2017/2018
2016/2017
Earnings per share, before and after dilution, SEK 7.81 1.02
Ordinary dividend, SEK 1.50 1.50
Direct yield, %2 3.9 6.9
Share price at year-end, SEK 38.4 21.6
Market capitalization, SEK M 956 538
No. of shares outstanding, 000s 24,907 24,907
Average number of shares during the year, 000s 24,907 24,907
1 Based on the Board of Director’s dividend proposal.2 Dividend divided by the closing price for each
fiscal year.
1
* The 2017/2018 dividend is based on the Board’s proposal to the Annual General Meeting.** During the 2014/2015 fiscal year, and extra dividend of SEK 10 was paid in the form of a share split with a redemption procedure. Direct yield including extra dividend was 46.9%.
*
**

ANNUAL REPORT EOLUS VIND AB 2017/2018 29
SHARE AND OWNERSHIP STRUCTURE
SHAREHOLDERS AT AUG 31, 2018
ShareholderNo. of
Class A sharesNo. of
Class B sharesTotal no. of
shares% of
capital% of
votes
Domneåns Kraftaktiebolag 357,900 2,012,869 2,370,769 9.5% 15.3%
Hans-Göran Stennert, directly and through endowment insurance 380,100 518,984 899,084 3.6% 11.8%
Åke Johansson 194,720 567,200 761,920 3.1% 6.9%
Hans Johansson and Borgunda bygghandel, through companies 169,520 58,506 228,026 0.9% 4.8%
Försäkringsaktiebolaget Avanza Pension 0 1,491,679 1,491,679 6.0% 4.1%
Johan Markensten 0 808,080 808,080 3.2% 2.2%
Nordnet Pensionsförsäkring AB 500 659,675 660,175 2.7% 1.8%
Ingvar Svantesson 43,750 200,175 243,925 1.0% 1.7%
M A C O Business Development AB 0 490,471 490,471 2.0% 1.3%
Swedbank Försäkring AB 0 487,967 487,967 2.0% 1.3%
Other shareholders 139,135 16,325,769 16,464,904 66.1% 48.6%
Total 1,285,625 23,621,375 24,907,000 100.0% 100.0%
IntervalsNo. of
shares% of
capitalNo. of
shareholders% of
shareholders
1-500 746,463 3.0% 5,765 70.5%
501-1,000 682,990 2.7% 823 10.1%
1,001-5,000 2,579,742 10.4% 1,103 13.5%
5,001-10,000 1,616,639 6.5% 218 2.7%
10,001-15,000 798,243 3.2% 64 0.8%
15,001-20,000 942,966 3.8% 53 0.6%
20,001- 17,539,957 70.4% 151 1.8%
Total 24,907,000 100.0% 8,177 100.0%
SHARE CAPITAL TREND
Year EventTotal share
capital, SEKChange in share
capital, SEKNo. of
Class A sharesNo. of
Class B sharesChange in
Class A sharesChange in
Class B sharesQuotient
value, SEK
1990 Company foundation 1,200,000 1,200,000 5,000 7,000 5,000 7,000 100.00
1991 New share issue 3,000,000 1,800,000 5,000 25,000 - 18,000 100.00
1996 New share issue 5,000,000 2,000,000 5,000 45,000 - 27,000 100.00
2001 New share issue 6,000,000 1,000,000 6,000 54,000 1,000 9,000 100.00
2003 New share issue 8,000,000 2,000,000 6,000 74,000 - 20,000 100.00
2005 New share issue 10,000,000 2,000,000 7,500 92,500 1,500 18,500 100.00
2006 New share issue 12,000,000 2,000,000 9,000 111,000 1,500 18,500 100.00
2007 Non-cash issue 14,100,200 2,100,200 9,000 132,002 - 21,002 100.00
2007 New share issue 16,114,400 2,014,200 10,285 150,859 1,285 18,857 100.00
2007 New share issue 18,114,400 2,000,000 10,285 170,859 - 20,000 100.00
2008 Split 100:1 18,114,400 - 1,028,500 17,085,900 1,018,215 16,915,041 1.00
2009 New share issue 22,643,000 4,528,600 1,285,625 21,357,375 257,125 4,271,475 1.00
2011 Non-cash issue 24,907,000 2,264,000 1,285,625 23,621,375 - 2,264,000 1.00
2015 Split 2:1 24,907,000 - 2,571,250 47,242,750 1,285,625 23,621,375 0.50
2015 Stock dividend 49,814,000 24,907,000 - - - - 1.00
2015 Redemption 24,907,000 -24,907,000 1,285,625 23,621,375 -1,285,625 -23,621,375 1.00
24,907,000 1,285,625 23,621,375 1.00
Source: Euroclear and Eolus

30 ANNUAL REPORT EOLUS VIND AB 2017/2018
During the 2017/2018 fiscal year, Eolus’s had four senior executives: Per Witalisson, Marcus Landelin, Catharina Persson and Karl Olsson. Since the opening of the new fiscal year on September 1, Richard Larsson has also been a member of Eolus’s Group Management. Information regarding when these executives assumed their positions, their dates of birth, experience, sharehold-ings in Eolus at November 15, 2018 and their ongoing assignments is presented be-low. Assignments within the Group and the assignments of deputy Board members are not specified. Company shareholdings include own shares, both direct and indirect, and those of related parties.
PER WITALISSON CEO
KARL OLSSON GENERAL COUNSEL
CATHARINA PERSSON CFO
MARCUS LANDELIN DEPUTY CEO AND CHIEF OPERATING OFFICER
RICHARD LARSSON HEAD OF PROJECT DELIVERY
Born: 1971. Employed since 2006 and CEO since August 2012. Master of Busi-ness Administration. Previously an auditor at Ernst & Young from 1996-2006, where he was an authorized public accountant from 2003-2006.Other assignments:Chairman of the Board of Rockneby Vind AB and Långmarken Wind AB. Board member of Isgrannatorp Drift AB and Triventus AB.Shareholding in Eolus: 12,700 Class A shares and 51,196 Class B shares
Born: 1963. Employed since 2011. Bache-lor of Laws degree. Previously employed as a lawyer at Setterwalls and Linklaters law firms, and General Counsel in Vattenfall AB’s Group staff unit. He has also been an employee and member of the management team of Awapatent AB and, prior to joining Eolus, ran his own business Terrier Law AB.Other assignments:Board member and CEO of Terrier Law AB. Board member of Skogskovall AB and Rockneby Vind AB. Agent for service of process for Snickare-gatan Holding AB.Shareholding in Eolus: 5,719 Class B shares
Born: 1975. Employed since 2013.Master of Business Administration and previously CFO at ACAP Invest AB (publ).Other assignments: Chairman of the Board of Wind Farms Götaland Svealand AB, Wind Farms Västra Götaland AB, Windfarm Iglasjön AB, Wind Farm Jenasen AB. Board member of SD Förvaltning i Malmö ABShareholding in Eolus: 3,102 Class B shares
Born: 1978. Employed since 2015. Bachelor of Laws degree and Master of Business Administration. Most recently worked at E.ON, where he was Head of Origination and Project Development for onshore wind power in Northern Europe, as well as working with offshore wind power. He also worked with export and trade issues at the Swedish Trade Council in Eastern Europe and ran his own trading and construction businesses. Other assignments: None.Shareholding in Eolus: None
Born: 1979. Employed since 2011. Master of Electrical Engineering. Came to Eolus through the acquisition of Svenska Vind-bolaget, where he was responsible for onshore wind power project development, mainly in Sweden. Has has also worked in several consultant companies where he undertook technical assignments in the field of engineering for the power industry.Other assignments: None.Shareholding in Eolus: 2,000 Class B shares
GROUP MANAGEMENT
EOLUS’S GROUP MANAGEMENT

ANNUAL REPORT EOLUS VIND AB 2017/2018 31 ANNUAL REPORT EOLUS VIND AB 2017/2018 31
The Fröreda wind farm

32 ANNUAL REPORT EOLUS VIND AB 2017/2018
DIRECTORS’ REPORT
DIRECTORS’ REPORT
INFORMATION ABOUT BUSINESS OPERATIONSEolus aims to create value at all levels of project development, establishment and operation of facilities for renewable energy and energy storage, and to offer attractive and competitive investment objects to both local and interna-tional investors in the Nordic region, Baltic countries and the US. Eolus’s main operations are to realize projects primarily through sales of turnkey operational facilities to a broad customer base of investors. The business model also includes parts of the project portfolio to be realized through sales of project rights, meaning permitted projects, and projects under development. Eolus also uses its own wind power facilities to generate electricity. New wind turbines may be constructed, and existing turbines divested to customers that want to invest in facilities that are already opera-tional, in order to continuously develop and renew the wind power portfolio for electricity generation. Eolus offers a full range of asset management services to wind power owners for carefree ownership. The Group consists of the Parent Company, Eolus Vind AB (publ), the subsidiaries Eolus Wind Power Management AB, Ekovind AB, Svenska Vindbolaget AB, Blekinge Offshore AB, Eolus Elnät AB, SIA Eolus, Eolus Vind Norge Holding AS, Eolus Oy, Eolus North America Inc and the sub- subsidiary OÜ Baltic Wind Energy. In addition to the companies above, several other companies formed to manage the development of specific wind power projects are also included.
Project developmentSince its inception in 1990, Eolus has evolved into a leading wind power developer throughout Sweden and the Nordic region. By the end of the fiscal year, Eolus had participated in the construction of 541 wind turbines with a combined capacity of 929 MW. Projects are mainly realized by estab-lishing wind turbines that are divested as turnkey facilities to investors. Proj-ects can also be realized by selling project rights. Profit recognition after construction takes place after final commissioning. Sales and earnings may vary considerably between individual quarters and fiscal years, depending on the rate of wind farm construction, and when the farms are divested. The project development operations are mainly financed by equity, advance payments from customers and construction loans. At present, Eolus conducts project development operations in Sweden, Norway, Finland, the Baltic countries and the US. Sales from the development, establishment and divestment of turnkey wind power facilities amounted to SEK 1,336.5 M (1,027.4). During the fiscal year, 25 (25) wind turbines with a combined capacity of 83.8 MW (72.2) were installed and completed, all of which were handed over to customers. Other operating income amounted to SEK 14.5 M (2.9) and primarily com-prised exchange rate gains and capital gains for other non-current assets.
Asset managementOver the years, Eolus has developed extensive expertise in virtually all areas related to the establishment and operation of wind turbines. Eolus offers full asset management services to wind power owners to provide carefree own-ership that maximizes revenue and minimizes production loss. Eolus sees increasing demand for these services both from major institutional investors
that own large wind farms, and from local operators with smaller facilities. These operations provide Eolus with stable, recurring and long-term revenue streams. Sales from wind power asset management services amounted to SEK 16.3 M (14.3), of which external customers accounted for SEK 15.7 M (13.9). At the end of the fiscal year, Eolus’s customer contracts relating to asset management assignments for its own holdings and on behalf of cus-tomers totaled 415 MW (351), of which external customers accounted for 408 MW (336). In addition to these assignments, the company has signed asset management agreements for the following wind farms that have not yet been deployed: Kråktorpet (163 MW), Nylandsbergen (68 MW), Sötter-fällan (36 MW), Anneberg (11 MW) and Stigafjellet (30 MW). Anneberg, Sötterfällan and Nylandsbergen will be deployed and handed over to cus-tomers in 2018/2019. Kråktorpet will be deployed and handed over to the customer in 2019/2020 and Stigafjellet will be deployed and handed over to the customer in the second half of 2020.
Electricity generationThe Group uses its own wind power facilities to generate electricity, which are recognized as either a non-current asset or inventories. Revenue is derived from sales of electricity, and from sales of the electricity certificates allocated to renewable electricity producers. New wind turbines may be constructed and existing turbines divested in order to continuously develop and renew the electricity generation asset portfolio. Sales from the Group’s electricity generation amounted to SEK 14.2 M (24.8). This decline was attributable to lower electricity generation – due to the strategy to reduce the number of owned turbines – but was offset by higher average revenue. In comparable facilities, generation was lower than in the year-earlier period due to lower wind energy content. At the end of the fiscal year, the Group owned a combined installed capacity of 8.2 MW with estimated generation of 17.2 GWh per year, recognized as non-current assets. Average revenue for the electricity generated during the fiscal year was SEK 470 (423) per MWh. THE GROUP’S NET SALES AND EARNINGSNet sales amounted to SEK 1,366.0 M (1,065.7), up SEK 300.3 M compared with the preceding year. Operating profit amounted to SEK 202.4 M (40.2), up SEK 162.2 M. The higher sales and earnings were due to the sale of project rights for the Kråktorpet wind farm and the handover of the Jenåsen wind farm. During the year, 25 wind turbines with a capacity of 83.8 MW were constructed, all of which were handed over to customers. In the pre-ceding year, 25 wind turbines with a capacity of 72.7 MW were constructed, of which 24.6 were handed over to customers. Changes in the fair value of currency derivatives had a negative impact of SEK 0.4 M on operating profit, compared with a negative impact of SEK 4.6 M in the preceding year. Loss from financial items amounted to SEK 3.5 M, compared with a loss of SEK 6.0 M in the preceding year. Changes in the fair value of interest rate deriva-tives had a positive impact of SEK 2.8 M on operating profit, compared with a positive impact of SEK 8.3 M in the preceding year. In total, changes in the fair value of financial currency and interest rate derivatives had a positive
The Board of Directors and CEO of Eolus Vind AB (publ), Corp. Reg. No. 556389-3956, hereby submit the Annual Report and consolidated financial statements for the September 1, 2017-August 31, 2018 fiscal year. All amounts are in thousands of Swedish kronor (KSEK), unless otherwise specified. Figures in parentheses pertain to the preceding fiscal year.

ANNUAL REPORT EOLUS VIND AB 2017/2018 33
DIRECTORS’ REPORT
impact of SEK 2.4 M before tax, compared with a positive amount of SEK 3.7 M in the preceding year. The effective tax rate varies considerably between periods, depending on the structure of wind turbine divestments.
FINANCIAL POSITIONTotal assets are significantly affected by the size of ongoing wind power projects, the phase they are in, and the use of credit facilities. For projects to be divested as turnkey facilities to customers, the company aims to secure customer financing in pace with the projects completion. The Group’s equity/assets ratio was 43.1% at end of the fiscal year, compared with 73.2% at the end of the preceding fiscal year.
CASH FLOW AND CASH AND CASH EQUIVALENTSCash flow from operating activities amounted to SEK 241.7 M, compared with SEK 91.0 M in the preceding year. The higher cash flow was due to a decline in ongoing projects after the handover of the Jenåsen wind farm and an increase in advance payments from customers for ongoing establishments. Cash flow from investing activities was a negative SEK 1.0 M, compared with a negative SEK 9.7 M in the preceding year. Cash flow from financing activities was SEK 296.8 M, compared with a negative SEK 101.0 M in the preceding year. The change was mainly attributable to loans raised. At the end of the fiscal year, cash and cash equivalents amounted to SEK 739.8 M (201.5), an increase of SEK 538.3 M. In addition to cash and cash equivalents, there was an unutilized overdraft facility of SEK 75 M. There was a framework credit agreement totaling SEK 255 M at the end of the fiscal year that had been utilized. Both the overdraft facility and framework credit agreement were ununtilized at this point in time last year. At the end of the fiscal year, net cash amounted to SEK 371.1 M (167.6), up SEK 203.5 M.
WIND TURBINE INVENTORIES, WIND TURBINES UNDER CONSTRUCTION AND PROJECTS UNDER DEVELOPMENTAt the end of the fiscal year, wind turbine inventories, wind turbines under construction and projects under development amounted to SEK 574.7 M (344.8), up SEK 229.9 M. The difference is due to the number of ongoing establishments and their current phase. At the end of the fiscal year, there were 74 wind turbines under con-struction, compared with 25 on the corresponding date in the preceding year. Wind turbines recognized as non-current assets or inventories, respec-tively, are attributable to the Electricity Generation operating segment and generate electricity that the company sells. New wind turbines may be established and existing turbines divested in order to continuously develop and renew the electricity generation asset portfolio. There were no wind turbines in inventories at the end of the fiscal year. During the fiscal year, five wind turbines were reclassified from non-current assets to inventories in preparation for sale.
LIABILITIESAt the end of the fiscal year, net cash amounted to SEK 371.1 M, compared with SEK 167.6 M on the corresponding date in the preceding year. Inter-est-bearing liabilities to credit institutions amounted to SEK 368.7 M (33.9) at the end of the fiscal year. Liabilities are affected by the size of ongoing wind power projects and the phase they are in.
SIGNIFICANT EVENTS DURING THE FISCAL YEARIn December, Eolus signed an agreement to divest 47 MW of wind power to KGAL for a preliminary purchase consideration of EUR 57.7 M. The Söt-terfällan wind farm (36.0 MW) is scheduled to be handed over as a turnkey facility in summer 2019 and the Anneberg wind farm (11.0 MW) is scheduled to be handed over as a turnkey facility in December 2018. These farms will be recognized in profit or loss on completion and handover to the customer.
EARNINGS AND FINANCIAL POSITION
Amounts in KSEK2017/2018
IFRS2016/2017
IFRS2015/2016
IFRS2014/2015
IFRS2013/2014
IFRS
Overview Group
Net sales 1,365,977 1,065,668 693,446 1,502,137 465,839
Operating profit/loss 202,411 40,233 -15,949 90,040 41,600
Profit/loss after financial items 198,879 34,224 -29,057 75,243 13,143
Return on capital employed, % 22 6 neg. 8 2
Return on equity after tax, % 26 4 neg. 10 1
Total assets 1,895,002 900,764 1,269,616 1,259,355 1,929,814
Equity/assets ratio, % 43 73 53 58 48
Average number of employees 35 33 33 33 37
Amounts in KSEK2017/2018
RFR22016/2017
RFR22015/2016
RFR22014/2015
RFR22013/2014
RFR2
Overview Parent Company
Net sales 1,115,620 910,062 611,873 1,348,830 423,808
Profit/loss after financial items 288,869 82,560 26,663 160,261 41,450
Total assets 2,039,782 890,371 1,176,727 1,088,855 1,602,132
Equity/assets ratio, % 44 74 47 50 45
Average number of employees 25 32 31 31 34
DEFINITIONS OF KEY FINANCIAL FIGURES
Return on equity after tax Rolling 12-month earnings relative to average equity.Equity/assets ratio Equity expressed as a percentage of total assets.Return on capital employed Profit after financial items plus interest expense expressed as a percentage of average capital employed.Capital employed Total assets minus non-interest-bearing liabilities.

34 ANNUAL REPORT EOLUS VIND AB 2017/2018
DIRECTORS’ REPORT
Eolus will manage the farms’ assets on behalf of the customer. In December, Eolus signed an agreement to divest 232 MW of wind power to Aquila Capi-tal for a preliminary purchase consideration of EUR 264 M. The transaction includes the sale of all shares in each project company that owns the rights to the wind farms. Eolus will construct both wind farms and Aquila will pro-vide financing during construction for the Kråk torpet wind farm comprising 43 wind turbines with a capacity of 163.4 MW. The preliminary purchase consideration for the Kråktorpet wind farm amounts to EUR 182 M. Revenue from the sale of project rights for the Kråktorpet wind farm was recognized during the fiscal year. For the Nylandsbergen wind farm, comprising 18 wind turbines with a capacity of 68.4 MW, the purchase consideration will be fully paid on completion and handover. The preliminary purchase consideration for the Nylandsbergen wind farm amounts to EUR 82 M. Both wind farms will be deployed in the second half of 2019. Eolus will manage the farms’ assets on behalf of the customer. In December, Eolus signed an agreement with Vestas for the delivery of 74 wind turbines of the V136 model comprising 279 MW for the Kråk- torpet, Nylandsbergen, Sötterfällan and Anneberg wind farms. All four farms also have a full-service agreement with Vestas signed for 15–20 years from startup. In January, Eolus signed an agreement with Veidekke regarding turnkey contracts for the construction of the Kråktorpet and Nylandsbergen wind farms and an agreement with E.ON Elnät for grid connections for the farms. In March, Eolus signed a Power Purchase Agreement (PPA) with Alcoa Norway ANS entailing that Alcoa will purchase all electricity generated in the Øyfjellet wind farm in Norway when it is deployed in 2021. Annual generation is expected to amount to 1.2 TWh. As part of the deal, Eolus has signed a power guarantee with the Norwegian Export Credit Guarantee Agency (GIEK). The guaranteed amount is EUR 256 M. In December, Eolus signed an agreement to divest the Stigafjellet wind farm (30 MW) in Norway to ewz for a preliminary purchase consideration of EUR 40.7 M. The transaction includes the sale of all shares in the project company that owns the rights to the wind farms. Eolus will construct the wind farm and ewz will provide financing during construction. The wind farm is scheduled for deployment in the second half of 2020. In August, the Jenåsen wind farm (79 MW) in the Municipality of Sunds-vall was completed and handed over to Munich Re. The wind farm is subject to a PPA with Google and comprises 23 wind turbines of the Vestas V126-3.45 MW. Eolus will provide asset management services for the wind farm. It was announced in August that Richard Larsson, Head of Project Delivery, would join Eolus Group Management on September 1, 2018.
ENVIRONMENTAL IMPACTThrough its wind power holdings, the Parent Company and the Ekovind sub-sidiary conduct activities that are licensable or subject to notification require-ments under the Swedish Environmental Code. The company and the Group hold the relevant environmental permits. When the duty to notify applies, notification is a prerequisite for granting a building permit under the Environ-mental Code. Wind power is a clean and renewable source of energy with very little environmental impact throughout the turbine’s lifespan. During operation, the environmental impact mainly consists of noise and shadow casting.
EMPLOYEESDuring the year, the average number of employees in the Group was 35 (33). The number of women employees was 10 (10), corresponding to 28% (30). For information regarding distribution of the number of employees and salaries paid, other remuneration, social security expenses pertaining to the Board and the CEO, as well as remuneration of senior executives, refer to Notes 5 and 6.
SIGNIFICANT RISKS AND UNCERTAINTIESSignificant risksA number of risk factors considered significant for the future development of Eolus are outlined below. The following risks are not ranked in order of priority and do not claim to be comprehensive.
Dependence on regulations, legislation and policy measuresThe establishment of wind power facilities is covered by a series of regula-tions. For environmental permits to be granted, the relevant municipality must actively recommend that the permit be granted. In practice, municipali-ties thus holds a right of veto. Both building permits and environmental permits may be appealed, which can lead to delays or make projects impos-sible to implement. Under the Planning and Building Act, municipalities in Sweden exercise a planning monopoly. The implementation of projects is therefore dependent on the willingness of each individual municipality to contribute to a sustainable energy supply. Political will can swing rapidly due to changing public opinion, the distribution of seats in building and planning committees, and so forth. Sweden and Norway have technology-neutral electricity certificate systems, which favor the development of renewable electricity generation. In 2008, the EU adopted the Renewable Energy Directive, through which Sweden has agreed that at least 49% of its energy consumption will be derived from renewable energy sources by 2020. Through its energy and climate agreement, the former Swedish Government raised ambitions by an additional percentage point. In October 2014, EU member states decided that the share of renewable energy should amount to at least 27% of the energy mix by 2030. Sweden introduced the Electricity Certificate System in 2003 and Norway became affiliated in 2012, and had the target of increasing renewable electricity generation by 28.4 TWh between 2012 and 2020. Within the framework of the energy agreement reached by five parliamentary parties in 2016, Sweden decided to extend the Electricity Certificate System by adding 18 TWh of new electricity certificates until 2030. In Norway, facilities estab-lished after 2021 will not be included in the System. Considering that wind power is one of the cheapest methods for adding new generation capacity, the vast majority of investing decisions have been related to wind power. In April 2017, the Swedish and Norwegian Governments reached an agreement on how the Swedish extension of the Electricity Certificate System would be designed in relation to the existing joint Swedish- Norwegian certificate system. The agreement created clear incentives for further expansion and the pace of development under the System has exceeded all expectations. The investments that are needed to meet the objectives of the Electricity Certificate System will probably have been implemented by 2020. The market will therefore be able to meet the objec-tive long before 2030 which, in turn, will create a need for policy decisions and mechanisms to maintain the legitimacy of the System. Although conditions for the wind power industry have become clearer in recent years, there is no guarantee that future Swedish parliaments will not make other decisions, entailing weaker terms for wind power in Sweden, which could affect Eolus’s operations and financial position. The division of Sweden into four electricity price areas means that the price of electricity generated varies, depending on the supply and demand situation in the relevant area.
Dependence on agreementsEolus has not concluded any operational or financial agreements with terms considered uncommon for the industry. When establishing wind power facili-ties, the company’s activities include signing agreements with manufacturers for the supply of wind turbines. Advance payments to wind turbine manufac-turers can add up to considerable amounts. Since the size of the company’s wind power projects has increased in recent years, while the number of manufacturers in the market is limited and delivery times are relatively long, the inability of a particular manufacturer to fulfill agreements could have a significantly adverse effect on the company’s financial position.
Dependence on strategic partnersEolus installs wind power facilities from world-class manufacturers using the highest possible technical and overall economic efficiency. The wind power industry is undergoing rapid growth and the number of manufacturers that want to establish a market presence has increased in recent years. This competition among manufacturers has led to better terms and reduced dependence on individual suppliers. Although new manufacturers are be-coming established in the markets where Eolus operates, it may take time for them to establish construction and service organizations.

ANNUAL REPORT EOLUS VIND AB 2017/2018 35
DIRECTORS’ REPORT
Dependence on key individuals and employeesEolus is a knowledge-based company with a small organization, where dependence on the knowledge, experience and creativity of individual employees is high. The loss of key individuals could have significantly adverse effects on the company in the short term.
Earning capacityThe capital cost per MWh generated in a wind turbine varies greatly, depend-ing on the wind conditions at the actual location. Establishing wind power facilities on appropriate sites and accurate generation assessments are thus crucial to the company’s earning capacity. The wind conditions at each indi-vidual facility can vary from year to year. Generation can vary up to +/- 15%, compared with a normal wind year. The market price of electricity varies over time. The price trend for electricity certificates is dependent on how rapidly renewable electricity generation is developed in proportion to the quota obligation that applies for consumers when purchasing electricity certificates. Through a partnership with Axpo Sverige AB, a leading player on the Nord Pool Spot power market, Eolus acquires risk management support for sales of electricity. The partnership aims to secure future generation revenues, achieve long-term profitability, minimize the risk that market volatility will have a negative impact on Eolus’s earnings, generate positive results from price hedging and address the need for load balancing in a cost-efficient manner. In its finance and risk policy, Eolus hedges a predetermined portion of the generation volume, which reduces the volume and profile risk. The main costs for wind turbine management are interest expense, depreciation, leases, service and maintenance costs and insurance expenses. Rising market interest rates have a negative impact on earnings. Investment deci-sions are usually based on an economic life of 25 years. If the actual life falls short of the estimated life, this would have a negative impact on profitability. With such a long time horizon, there is an additional risk that the future costs of service and maintenance may differ from the cost basis of the investment decision.
CompetitionSince development of the wind power industry has accelerated sharply in recent years, the number of market players has risen. Under current condi-tions, this has increased the supply of projects and turnkey facilities to the market. In the project development phase, Eolus competes with smaller players, major utilities companies and international wind power developers. In regard to sales of electricity, wind power-based electricity competes with all other types of electricity generation since all electricity is sold on a single market. The Electricity Certificate System is technology-neutral, which favors the generation of renewable electricity using the most cost-efficient technolo-gy. In terms of its offering of asset management services, Eolus competes with both major wind power developers offering complete managements services and owners who choose to carry out these services themselves.
FINANCIAL RISKSCapital requirements and financing abilityEolus has a large, high-quality project portfolio. The planning of project development operations includes monitoring building permits and other per-mits to ensure they do not expire before the wind turbines are constructed. In July 2016, Eolus secured financing for the next two fiscal years through the signing of three credit agreements with Handelsbanken. All agreements have a 29-month term. The agreements comprise an overdraft facility of SEK 75 M, a framework credit agreement of SEK 255 M for project financing and a construction loan of SEK 600 M. The construction loan was signed to finance the establishment of the Jenåsen wind farm. The loan was termi-nated when the farm was handed over to the customer. The overdraft facility of SEK 75 M was unutilized on the balance sheet date, while the framework credit agreement totaling SEK 255 M was fully utilized. All credit facilities were ununtilized at this point in time last year. The Board has adopted a finance and risk policy containing guidelines for the equity/assets ratio, maturity structure of loans and the management of liquidity preparedness to reduce refinancing risk.
Exchange rate changesA major portion of Eolus’s wind turbine payments and sales of wind farms are made in EUR. Exchange rate fluctuations against the SEK can thus affect the profitability of wind turbine construction. This is offset by currency futures or sales and borrowing in EUR. The Board has stated in the finance and risk policy that at least 75%, and a maximum of 125%, of the estimated net flow over a 12-month period is to be hedged. On the balance sheet date, the company’s outstanding currency futures for selling contracts amounted to EUR 10.0 M (0.0) and for purchasing contracts to EUR 0.0 M (4.0). These had a negative market value of SEK 0.8 M (0.5).
Interest rate riskThe electricity generation operations are partly financed by bank loans. Changes in market interest rates may therefore affect future earnings and profitability. The Board has stated in the finance and risk policy that the average fixed-interest term in the electricity generation operations is not to be less than 2.5 years. At the end of the 2017/2018 fiscal year, more than 100% of the Group’s liabilities to credit institutions attributable to electricity generation operations were covered by interest rate hedging instruments. The Board of Directors approved this deviation from the policy. On the balance sheet date, these instruments had a negative market value of SEK 11.8 M (14.6).
SIGNIFICANT EVENTS AFTER THE END OF THE FISCAL YEARIn September, Eolus’s wholly owned subsidiary Eolus North America, Inc acquired a solar and battery storage project in the western US with a capacity of 500 MW and 250 MW, respectively. The project is in an early stage of development and is on the waiting list for a grid connection to deliver electricity to California. In September, Eolus signed an agreement with Siemens Gamesa for the delivery of seven wind turbines of the SWT-DD-130 model with a capacity of 4.3 MW each to the Norwegian Stigafjellet project, located in Bjerkreim south of Stavanger. This wind farm will be deployed in the second half of 2020 and is subject to a sale agreement with ewz. In September, Eolus signed a credit agreement with Swedbank com-prising liquidity and construction loans totaling SEK 1,050 M. The four-year agreement ensures financing for Eolus’s expansion in this forthcoming period in terms of both financing ongoing and future establishments for which Eolus provides the financing during the construction phase, and ensuring high liquidity for the operating activities. In October, Eolus signed an agreement to divest the Bäckhammar wind farm (130 MW) in Sweden to KGAL for a preliminary purchase consideration of EUR 131 M. At the same time, Eolus placed an order for wind turbines from Vestas. Bäckhammar will comprise 22 Vestas V136-4.2 MW and 9 Vestas V150-4.2 MW. Eolus will construct the wind farms and KGAL will provide financing during construction. Bäckhammar is scheduled to be completed in August 2020 and Eolus was commissioned to deliver asset management services for the facility.
OUTLOOKA social shift, with lower greenhouse gas emissions, such as CO2, is vital. The latest report from the UN Intergovernmental Panel on Climate Change (IPCC) warns that we have 12 years to significantly reduce carbon emissions to keep global warming to a maximum of 1.5°C. Beyond that, even half a degree could significantly worsen the risks of drought, floods, extreme heat and poverty. A transitioning energy market is playing a key role in meeting this challenge, which the IPCC claims is possible to achieve both economi-cally and time-wise. The energy market is undergoing a process of rapid and major change. The cost of renewable electricity generation is falling every year and new business models are emerging to challenge existing structures in the energy market. Although the pricing scenario is largely driven by global prices for fossil-based energy generation, investments in renewable generation meth-ods account for a majority of the new investments at the global level. From a Swedish perspective, wind power has undergone tremendous growth. In 2006, wind power accounted for approximately 1 TWh, or less than 0.5%, of Swedish electricity generation. In 2017, Swedish wind power accounted

36 ANNUAL REPORT EOLUS VIND AB 2017/2018
DIRECTORS’ REPORT
for 17.6 TWh, or 11%, of Swedish electricity generation. Wind power is now well-established as the country’s third-highest source of electricity generation after hydropower and nuclear power. The Swedish Energy Agreement from 2016 is based on the objective of transitioning to 100%-renewable electricity generation in Sweden. The agree-ment contains a new development target of 18 TWh for the Electricity Certifi-cate System between 2021 and 2030. With the current cost base for the establishment of new renewable electricity generation, a large proportion of these investments will be made in wind power. After the rules were clari-fied in 2017, a decision was made to invest in the generation of more than 2,000 MW compared with a total capacity expansion of 180 MW in 2017. The investments that are needed to meet the objectives of the Electricity Certificate System will probably have been implemented by 2020. The market will therefore be able to meet the objective long before 2030. In recent years, more electricity has been generated than consumed in the Swedish market, enabling Sweden to become a net exporter of elec-tricity. The Nordic region has an excellent opportunity to become a driving force for sustainability in Europe thanks to its extensive carbon-free electricity generation, which could replace the dirty fossil-based power used in other countries. A continued ability to export electricity is positive for Sweden, which is why it is so important to continue expanding the transmission capacity – not only within Sweden but also to other countries. The fact that the energy agreement addresses the need to expand the transmission capacity in order to enable exports is thus positive. The future potential to store electricity will present major opportunities for Sweden to increase their share of intermittent electricity sources, such as wind and solar power. Eolus is now active in a number of markets beside Sweden. At present, the most attractive markets for Eolus’s operations – in addition to Sweden – are the Norwegian and US markets. In addition to high-priority projects in the Swedish market, Eolus has now identified high-priority projects in these markets in the project portfolio for the coming years. These include the large onshore Øyfjellet projects (330 MW) for which Eolus has signed a PPA with Alcoa. After the end of the reporting period, Eolus’s US subsidiary Eolus North America, Inc acquired a solar and battery storage project in the western US with a capacity of 500 MW and 250 MW, respectively. This is Eolus’s first acquisition in these sectors and shows the potential in the renewables industry. Onshore wind power is one of the cheapest methods for adding new generation capacity. The cost associated with establishing new wind power is already lower than the cost of establishing new nuclear power, and Eolus aims to continue pushing down the price per MWh generated. Efficiency enhancements throughout the value chain of a wind power project’s lifespan are crucial in order to meet investors’ yield requirements. By significantly reducing the costs of wind power establishment, the realization of projects with profitability for end-investors can also continue in times with low overall price levels for electricity and electricity certificates. For the Swedish market, 2018 entailed considerably higher prices for electricity and electricity certifi-cates compared with recent years, making the market even more attractive to investors. Eolus’s extensive experience in the construction of wind power facilities, combined with a full range of asset management services, will safeguard the company’s continued ability to offer attractive investment objects to various types of investors, but primarily to customer groups that invest in major generation facilities. With fewer but larger established wind farms in Eolus’s prioritized markets, quarterly fluctuations will be greater. This applies to both the number of wind turbines constructions, sales and earnings.
SHAREHOLDERSOn August 31, 2018, Eolus had 8,177 shareholders according to the register maintained by Euroclear Sweden AB. Shareholders with a direct and indirect shareholding who represent more than 10% of the votes are Domneåns Kraftaktiebolag and Hans-Göran Stennert. The largest shareholders of Eolus shares are presented on page 29. The number of shares held by individuals with an insider position are presented on Eolus’s website: www.eolusvind.com.
SHARESOn August 31, 2018, the share capital in Eolus Vind AB amounted to SEK 24,907,000, distributed between 1,285,625 Class A shares and 23,621,375 Class B shares. Class A shares carry one voting right, while Class B shares correspond to one-tenth (1/10) of a voting right. All shares carry equal rights to the company’s assets, profit and dividends.
CORPORATE GOVERNANCEFor information about the company’s governance during the year, refer to the Corporate Governance Report on pages 37-39.
SUSTAINABLE PERFORMANCEEolus proactively assumes responsibility for people and the environment throughout its operations. In accordance with Chapter 6, Section 11 of the Annual Accounts Act, Eolus Vind AB must prepare a Sustainability Report that is separate from the Annual Report. This Sustainability Report is available on www.eolusvind.com. The Sustainability Report was submitted to the auditor at the same time as the Annual Report. A summary of the Sustainability Report is provided on pages 24-25 of this Annual Report.
DIVIDEND POLICYThe Board has adopted a dividend policy entailing that dividends issued by Eolus in the long term will be determined by the company’s earnings and correspond to 20-50% of the company’s profit. However, dividends will be adapted to the company’s investment requirements and financial position. For the 2016/20167 fiscal year, the Annual General Meeting on January 27, 2018 resolved to pay dividends corresponding to SEK 1.50 (1.50) per share. Payment of the dividends took place on February 2, 2018.
PROPOSED DISTRIBUTION OF PROFITThe Board of Directors proposes a dividend of SEK 1.50 (1.50) per share for the 2017/2018 fiscal year in line with the company’s dividend policy. The proposed record date for the dividends is Tuesday, January 29, 2019. Payment of the dividends is expected to take place on Friday, February 1, 2019. The Board of Directors deems that the proposal is consistent with the prudence rule in Chapter 17, Section 3 of the Swedish Companies Act, as follows:
The following profits are at the disposal of the Annual General Meeting (amounts in SEK):
Share premium reserve 168,662,573
Retained earnings 293,772,840
Net profit for the year 286,345,382
Total 748,780,795
The Board of Directors proposes that the profits be appropriated as follows:
dividend to the shareholders 37,360,500
to be carried forward 711,420,295
Total 748,780,795
Statement:The proposed dividend is considered justifiable in view of the earnings trend after the end of the fiscal year. The proposed distribution of profit is also considered justifiable in view of the requirements concerning equity, consolidation requirements, liquidity and financial position in general for both the Parent Company and the Group.
DEFINITIONS OF KEY FINANCIAL FIGURESReturn on equity after tax Rolling 12-month earnings relative to average equity.Equity/assets ratio Equity expressed as a percentage of total assets. Return on capital employed Profit after financial items plus interest expense expressed as a percentage of average capital employed.Capital employed Total assets minus non-interest-bearing liabilities.

ANNUAL REPORT EOLUS VIND AB 2017/2018 37
CORPORATE GOVERNANCE REPORT
CORPORATE GOVERNANCE REPORTCORPORATE GOVERNANCE REPORT FOR EOLUS VIND AB (PUBL)Eolus Vind AB is a Swedish public limited liability company that has been listed on Nasdaq Stockholm since February 2, 2015. Eolus is governed through General Meetings, the Board of Directors, the CEO and Group management in accordance with the Swedish Companies Act, the Articles of Association and the rules of procedure for the Board of Directors and CEO. Representatives from the Eolus Group’s management are also members of its subsidiaries’ boards. With Nasdaq Stockholm, Eolus has committed to apply the Swedish Corporate Governance Code (the “Code”), which is to be applied by all Swedish limited liability companies whose shares are traded on a regulated market in Sweden. ARTICLES OF ASSOCIATIONThe current Articles of Association were adopted at the Annual General Meeting on January 28, 2017. It states that the Board’s registered office is to be in Hässleholm, Sweden, that the Board’s members are to be elected every year by the Annual General Meeting for a period up to the next Annual General Meeting, and that one Class A share entitles the holder to one vote while one Class B share entitles the holder to one-tenth of a vote. The complete Articles of Association are available on Eolus’s website, www.eolusvind.com.
GENERAL MEETINGSThe shareholders exercise their decision-making rights regarding central issues at the General Meeting. The Meeting resolves on adoption of the income statement and balance sheet, appropriation of the company’s profit or loss, discharge of liability for Board members and CEO, election of the Board of Directors and auditors, and remuneration of the Board of Directors and auditors. Notice convening the Annual General Meeting for Eolus must be issued not earlier than six weeks and not later than four weeks prior to the Meeting. The notice is to be advertised in Post- och Inrikes Tidningar and on Eolus’s website. The fact that notification has been issued is to be an-nounced in the Swedish daily Dagens Industri. Shareholders who wish to participate in the Annual General Meeting are to notify the company by no later than the date stipulated in the notice.
2018 Annual General MeetingEolus’s 2018 Annual General Meeting was held in Hässleholm, Sweden, on Saturday, January 27. Some 92 shareholders, representing 34% of the votes, attended the meeting, personally or through proxy. General Counsel Karl Olsson was elected Chairman of the Meeting. In attendance at the Annual General Meeting were the Board members, CEO, Deputy CEO, CFO and the company’s auditor. The minutes of the Meeting are available in Swedish on Eolus’s website, www.eolusvind.com. All resolutions were made in accor-dance with the proposals from the Nomination Committee and the Board of Directors.
A few of the resolutions made by the Meeting include:• Dividend of SEK 1.50 per share for the 2016/2017 fiscal year.• The Board of Directors is to comprise six members, with no deputy
members.• Re-election of Board members Hans-Göran Stennert, Fredrik Daveby,
Sigrun Hjelmquist. Hans Johansson, Hans Linnarson and Bodil Rosvall Jönsson.
• Re-election of Hans-Göran Stennert as Board Chairman.• Re-election of PricewaterhouseCoopers AB as the company’s auditors
with Eva Carlsvi as Auditor in Charge.• Fees to the Board Chairman, Board members and auditor. • Rules for the appointment and work of the Nomination Committee.
Annual General Meeting 2019The next Annual General Meeting of Eolus’s shareholders will be held at Hässleholms Kulturhus on Saturday, January 26, 2019 at 3:00 p.m. More details about the Annual General Meeting, registration, etc. are available on page 87.
NOMINATION COMMITTEEThe Nomination Committee nominates the people who are proposed for election to Eolus’s Board of Directors at the Annual General Meeting. It also presents proposals for auditors’ fees, Board fees to the Chairman and other Board members, and remuneration for committee work. All the proposals are presented at the Annual General Meeting, in the notice and on the website ahead of the Annual General Meeting. The Nomination Committee comprises the Board Chairman and repre-sentatives for Eolus’s three largest shareholders in terms of the number of votes on May 31. Hans-Göran Stennert, Board Chairman, presented the composition of the Nomination Committee on July 11, 2017.
The Nomination Committee comprises the following members:Name Represents Holding on May 31, 2018Hans-Göran Stennert In his capacity as Chairman of the BoardIngvar Svantesson Domneåns Kraftaktiebolag 15.3%Hans Gydell (Chairman) Hans-Göran Stennert 11.8%Hans Johansson Åke Johansson 6.9%
The Nomination Committee held its first meeting on August 28, 2018. The Nomination Committee has held two minuted meetings ahead of the 2019 Annual General Meeting. The work of the Nomination Committee begins with the members reviewing the evaluation of the Board carried out during the year. The Nomination Committee agreed unanimously that the current composition is satisfactory. The number of Board members is considered appropriate and the expertise possessed by the Board is both complemen-tary and relevant. The composition of the Board is also considered satisfac-tory in terms of equality.
THE BOARD OF DIRECTORS AND ITS WORKEolus’s Board of Directors decides on the company’s business orientation, strategy, business plan, resources and capital structure, organization, acquisitions, major investments and divestments, annual reports and interim reports, as well as other comprehensive matters of a strategic nature. The Board also appoints the CEO who is in charge of the day-to-day management in accordance with the Board’s instructions.
Board membersBoard members are elected every year by the Annual General Meeting for the period up until the next Annual General Meeting. According to the Articles of Association, the Board is to comprise no fewer than four and no more than ten regular members and no more than six deputy members. The Board comprised six members as of the Annual General Meeting on January 27, 2018. For a presentation of the Board Chairman and Board members, see pages 84-85. Eolus’s CEO is not a member of the Board but participates as a rule at the Board meetings as a rapporteur, as do the Deputy CEO, CFO and General Counsel.
The work of the BoardAt the first regular Board meeting following the Annual General Meeting, Eolus’s Board adopts written instructions that describe the Board’s rules of procedure. The adopted rules of procedure stipulate the division of duties among the Board’s members and how often the Board will convene. Further-more, the rules of procedure regulate the Board’s duties, quorum, instruc-tions for the CEO, the division of responsibilities between the Board and the CEO, and more. The Board has also internally established a Remuneration Committee comprising three members of the Board and an Audit Committee comprising the entire Board.

38 ANNUAL REPORT EOLUS VIND AB 2017/2018
CORPORATE GOVERNANCE REPORT
The Board convenes according to a one-year plan proposed in advance and more meetings are arranged as needed. The Board held 12 minuted Board meetings during the 2017/2018 fiscal year. Items on the agenda for 2017/2018 included:• Annual accounts including the auditors’ report, the proposed distribution
of profit and the year-end report.• Annual report and preparations ahead of the Annual General Meeting.• Follow-up with the Auditor in Charge regarding the year’s audit.• Interim reports.• Rules of procedure for the Board and CEO.• Annual review of policies.• Budget.• Strategic issues and risks.• Ongoing forecasts.• Outline plans (prioritized projects for the next three years).• Liquidity planning with respect to future prioritized projects.• Economic climate and conditions.
In addition to the Board meetings, the Board Chairman and the CEO have an ongoing dialog regarding the management of the company. The CEO, Per Witalisson, is in charge of implementation of the business plan, the day-to-day management of the company’s affairs and the daily operations of the company. Before Board meetings, the Board receives written information in the form of a CEO report that contains a follow-up of the company’s sales, operational results, liquidity forecasts, interest rate and currency hedging, details concerning order backlog, the number of wind turbines under con-struction as well as comments concerning the various market trends. Prior to the Board meetings, the Board will also have access to the balance sheets and cash flow statements. The Board Chairman presents to the Board the results of the annual evaluation of the Board’s work. The evaluation includes the composition of the Board, the individual Board members and the Board’s work and procedures. The Code contains rules concerning the Board members’ independence and stipulates that the majority of the Board members are to be independent in relation to the company and company management. At least two of the Board members who are independent in relation to the company and com-pany management must also be independent in relation to all shareholders who control ten percent or more of the shares or the votes in Eolus Vind AB. No more than one person from company management may be a member of the Board.
BOARD ATTENDANCE IN 2017/2018
Function Inde-pendent1
Boardmeeting
Remu- neration
Committee
Hans-Göran Stennert Chairman 2) 12 of 12 2 of 2
Fredrik Daveby Board member X 12 of 12 2 of 2
Sigrun Hjelmquist Board member X 12 of 12 2 of 2
Hans Johansson Board member X 11 of 12
Hans Linnarson Board member X 12 of 12
Bodil Rosvall Jönsson Board member X 12 of 12
1) According to the definition in the Swedish Corporate Governance Code. 2) Not independent (in relation to Eolus’s major shareholders).
REMUNERATION COMMITTEEThe Remuneration Committee comprises Hans-Göran Stennert, Sigrun Hjelmquist and Fredrik Daveby. Hans-Göran Stennert is the Committee’s Chairman. The duties of the Remuneration Committee include:• preparing and on behalf of the Board make decisions on matters regarding
the remuneration policy, remuneration and other terms of employment for senior management including submitting proposals to the Annual General Meeting on behalf of the Board on the guidelines for remuneration of senior executives that the Annual General Meeting is to resolve on,
• monitoring and evaluating any ongoing and during-the-year adopted programs for variable remuneration to company management,
• monitoring and evaluating the application of the guidelines for remunera-tion of senior executives decided by the Annual General Meeting as well as relevant remuneration structures and levels in the company,
• ensuring that the company’s auditor submits a written statement to the Board no later than three weeks before the Annual General Meeting regarding whether the guidelines for remuneration of senior executives valid since the previous Annual General Meeting have been followed, and
• carrying out the other duties that are assigned to the Remuneration Committee in the Swedish Corporate Governance Code and other applicable rules and regulations for the company.
The Remuneration Committee held two minuted meetings during 2017/2018 at which all members were in attendance.
AUDIT COMMITTEEThe company has decided that the Board in its entirety will carry out the committee’s duties.
The duties that the Board will carry out in this function include:• monitoring the company’s financial statements, • monitoring the effectiveness of the company’s internal control and risk
management in relation to financial reporting and providing recommenda-tions and proposals to ensure the reliability of financial reporting,
• annually evaluating the need for an internal audit function that is the responsibility of the Board,
• remaining informed about the audit of the annual report and consolidated accounts, and assessing how the audit contributed to the reliability of financial reporting,
• regularly meeting the company’s auditor for updates concerning the scope and methodology of the audit and to discuss the approach to the company’s risks,
• determining guidelines for non-auditing services that the company may request from the company’s auditor,
• reviewing and monitoring the auditor’s impartiality and independence,• assisting the Nomination Committee in preparing proposals for the General
Meeting’s decisions regarding auditors and fees for the audit assignment, • executing the other duties of the Audit Committee required by law, the
Swedish Corporate Governance Code, and other relevant rules and regulations for the company.
CHIEF EXECUTIVE OFFICER (CEO)The CEO of Eolus is Per Witalisson (born 1971), Master of Business Admin-istration. The Board has adopted instructions for the work and role of the CEO. The CEO is responsible for the day-to-day management of the Group’s business in accordance with the Board’s guidelines. For a presentation of the CEO, refer to page 30. For remuneration of the CEO, refer to Note 6.
GROUP MANAGEMENTPer Witalisson leads the work of Group management and makes decisions in consultation with other members of management. Group management consists of four people, in addition to the CEO, Deputy CEO, CFO and Gen-eral Counsel. During the 2017/2018 fiscal year, management convened on 17 occasions in Hässleholm or Malmö in Sweden. The year’s meetings were dominated by continuous reconciliation of the rolling business plan, strategy issues and action plans. Standing items on the agenda are minutes from the previous meeting, reports from the operational team, finances, project devel-opment, establishment, sales and marketing, operation, foreign operations, personnel, occupational health and safety and legal issues.
AUDITAt the Annual General Meeting on January 27, 2018, Pricewaterhouse- Coopers AB (PwC) was re-elected with Eva Carlsvi as Auditor in Charge. The auditors review the annual accounts and the annual report as well as the company’s ongoing operations and routines in order to express an opinion on the accounts and the administration of the Board of Directors and the CEO. The annual accounts and the annual report are audited in October and November. An examination is then made of whether the Annual General Meeting’s guidelines for the remuneration of senior executives have been

ANNUAL REPORT EOLUS VIND AB 2017/2018 39
CORPORATE GOVERNANCE REPORT
followed. Eolus’s second-quarter report is reviewed in April and an interim review is performed in May. In addition to Eolus, Eva Carlsvi is also Auditor in Charge for Bygghemma Group First AB (publ), BE Group AB (publ), E.ON Nordic Aktiebolag and KappAhl AB (publ). Eva Carlsvi is an authorized public accountant and member of FAR. In 2017/2018, fees paid to PwC for non-audit assignments totaled SEK 1.0 M (0.6).
REMUNERATION
Remuneration of the BoardFees and other remuneration of the Board, including the Chairman of Eolus’s Board, are determined by the Annual General Meeting. The Annual General Meeting on January 27, 2018, resolved on total annual fees of KSEK 1,100, of which KSEK 350 was to be paid to Board Chairman and KSEK 150 to each of the other Board members. For more information about remuneration of the Board, refer to Note 6.
Remuneration of senior executivesRemuneration of the CEO and other members of Group Management (currently the Deputy CEO, CFO and General Counsel) is paid in accordance with the guidelines for remuneration of senior executives. The guidelines were adopted by the Annual General Meeting on January 27, 2018, for the period up until the next Annual General Meeting. According to the guidelines, senior executives shall be offered market- based and competitive remuneration. The level of remuneration for individual executives is to be based on such factors as position, expertise, experience and performance. Remuneration includes fixed salary and pension benefits, and may also include variable salary and other non-monetary benefits. The company shall be able to offer all senior executives maximum variable remu-neration of one monthly salary per year. Variable salary shall be based on the achievement of one or more quan-titative and/or qualitative targets. The targets shall be formulated with the objective of promoting the company’s long-term value creation. Furthermore, the company shall also be able to offer senior executives a share ownership program under which the company, three years after payment of variable remuneration, will reimburse the cost of acquiring half as many shares as the executive acquired for their variable remuneration and continues to hold. For more information about remuneration of senior executives, refer to Note 6.
Remuneration of auditorsFees for the audit assignment are paid against invoice and amounted to SEK 0.5 M for the 2017/2018 fiscal year. For the 2017/2018 fiscal year, fees paid to PwC for non-audit assignments totaled SEK 1.0 M. For more infor-mation about the remuneration of auditors, refer to Note 7.
THE BOARD’S DESCRIPTION OF INTERNAL CONTROL OVER FINANCIAL REPORTING FOR THE 2017/2018 FISCAL YEARThe Board’s responsibility for internal control is governed by the Swedish Companies Act and Swedish Corporate Governance Code. This includes monitoring Eolus’s financial reporting and the effectiveness of the company’s internal control and risk assessment. Internal control over financial reporting aims to provide reasonable assurance of the reliability of the external financial reporting in the form of annual reports and interim reports published by Eolus every year, and that financial reporting is prepared in accordance with the law, applicable ac-counting standards and other requirements for listed companies. Internal control is also aimed at ensuring high-quality financial reporting to company management and the Board so that decisions can be made on correct grounds. To describe internal control over financial reporting, Eolus proceeds from the five components of internal control defined in the COSO Internal Control-Integrated Framework – Control Environment, Risk Assessment, Control Activities, Information and Communication, and Monitoring Activities. The description below therefore relates to Eolus’s internal control system in relation to the 2013 edition of the COSO Framework.
Control environmentThe Board’s rules of procedure and the Board’s instructions for the duties of the CEO and the Board’s Committees clearly define the division of respon-sibility and powers in order to ensure effective management of risks in the business operations. In its role as Audit Committee, the Board of Eolus re-views the instructions and procedures used in the financial reporting process as well as accounting policies and any amendments of these. The CEO reports to the Board of Directors, according to established procedures, on the operations and financial performance prior to every Board meeting. Internal control instruments for financial reporting mainly comprise the finance and risk policy, information and insider policy and the Group’s accounting manual, which defines the accounting and reporting rules.
Risk assessment Significant risks for the operations are analyzed by the Board of Directors as part of financial reporting. These are described in the Company’s guide-lines for risk management and internal control. The risk areas are document-ed on the basis of probability and their probable impact. Based on this, control processes are designed to ensure high-quality financial reporting.
Control structuresThe organizational structure, and the division of responsibility and rules of authorization, are clearly described and communicated through instructions. The operations are organized into segments that are monitored. The compa-ny performs an annual self-assessment of internal controls in management, core and support processes. The results of these self-assessments form the basis for ongoing improvement initiatives within risk management and internal control.
Information and communicationAn accounting manual with guidelines and instructions for financial reporting has been produced. The accounting manual is continuously updated and issued to the relevant employees at Eolus. Prior to all quarterly financial statements and the annual accounts, specific written instructions are also provided to ensure accurate information in the external reporting. External communication is governed by Eolus’s information and insider policy and communication plan, which address responsibilities, procedures and rules. The policy is continuously evaluated to ensure that information to the stock market maintains high quality and is in accordance with the stock exchange’s rules. Financial information such as quarterly reports, annual reports and significant events are published through press releases, and on Eolus’s website. Meetings with financial analysts are arranged regularly in conjunction with the publication of quarterly reports.
MonitoringGroup management continuously analyzes the financial performance of the Group’s segments. At all levels of the organization, continuous monitor-ing is generally performed through comparisons against budget, forecasts and plans, as well as evaluation of key figures. Prior to Board meetings, the Board receives financial reporting on Eolus’s performance. In addition to formal reporting, there are informal information channels to the CEO and the Board for significant information from employees. The Board continuously evaluates the information provided by the CEO. This involves ensuring that measures are taken in regard to any shortcomings and proposed measures that have arisen during the internal control and external audit. The Board and the auditor engage in regular dialog. All members of the Board and the auditor receive a copy of interim reports before they are published. The Board and the auditor meet at least once per year, without the presence of management.
INTERNAL AUDIT OPINIONTo date, the Board has not found any reason to establish an internal audit function, as the above functions are deemed to fulfil this duty. However, the Board annually evaluates the need for such a function.

40 ANNUAL REPORT EOLUS VIND AB 2017/2018
CONSOLIDATED STATEMENT OF INCOME
CONSOLIDATED STATEMENT OF INCOME
KSEK Note 2017/2018 2016/2017
Net sales 3 1,365,977 1,065,668
Other operating income 8 22,533 17,379
Total operating income 1,388,511 1,083,047
Change in inventories of wind turbines, wind turbines under construction and projects under development 171,724 -183,858
Cost of goods and project development -1,248,858 -739,026
Other external expenses 7, 14 -51,542 -54,382
Employee benefits expenses 5, 6 -32,702 -30,650
Depreciation and impairment of property, plant and equipment 13 -14,765 -23,423
Profit/loss from participations in associated companies 18 -4,589 -2,570
Other operating expenses 8 -5,367 -8,904
Total operating expenses -1,186,100 -1,042,814
Operating profit 202,411 40,233
Interest income 9 2,727 2,187
Interest expense 9 -6,586 -7,464
Other financial items 9 327 -732
Loss from financial items -3,532 -6,009
Profit before tax 198,879 34,224
Tax 11 -4,566 -9,720
Net profit for the year 194,313 24,504
Attributable to Parent Company shareholders 194,460 25,317
Attributable to non-controlling interests -147 -813
Total 194,313 24,504
Earnings per share, before and after dilution 22 7.81 1.02

ANNUAL REPORT EOLUS VIND AB 2017/2018 41
CONSOLIDATED STATEMENT OF OTHER COMPREHENSIVE INCOME
CONSOLIDATED STATEMENT OF OTHER COMPREHENSIVE INCOME
KSEK Note 2017/2018 2016/2017
Net profit for the year 194,313 24,504
Other comprehensive income
Other comprehensive income not to be reclassified to profit or loss in subsequent periods - -
Other comprehensive income to be reclassified to profit or loss in subsequent periods - -
Exchange differences on translation of foreign operations -538 172
Total other comprehensive income -538 172
Comprehensive income for the year 193,775 24,677
Attributable to Parent Company shareholders 193,582 25,729
Attributable to non-controlling interests 193 -1,053
Total 193,775 24,677

42 ANNUAL REPORT EOLUS VIND AB 2017/2018
CONSOLIDATED STATEMENT OF FINANCIAL POSITION
KSEK Note Aug 31, 2018 Aug 31, 2017
ASSETS
Non-current assets
Intangible assets 12 96,162 -
Property, plant and equipment 13 52,024 111,443
Participation in associated companies 18 37 3,763
Deferred tax assets 11 3,095 2,236
Other financial assets 25 25,953 30,517
Total non-current assets 177,271 147,959
Current assets
Wind turbine inventories, wind turbines under construction and projects under development 19 574,666 344,840
Advance payments to suppliers 307,225 128,435
Accounts receivable 20, 25 53,018 25,686
Other current receivables 20, 25 37,023 44,493
Prepaid expenses and accrued income 21, 25 5,973 7,840
Cash and cash equivalents 25 739,825 201,509
Total current assets 1,717,730 752,805
TOTAL ASSETS 1,895,002 900,764
CONSOLIDATED STATEMENT OF FINANCIAL POSITION

ANNUAL REPORT EOLUS VIND AB 2017/2018 43
CONSOLIDATED STATEMENT OF FINANCIAL POSITION
KSEK Note Aug 31, 2018 Aug 31, 2017
EQUITY AND LIABILITIES
Equity
Share capital 22 24,907 24,907
Additional paid-in capital 190,843 190,843
Reserves -496 369
Retained earnings 598,759 441,673
Equity attributable to Eolus’s shareholders 814,013 657,791
Non-controlling interests 1,912 1,719
Total equity 815,924 659,510
Non-current liabilities
Non-current interest-bearing liabilities to credit institutions 23, 25, 27 81,780 12,740
Non-current provisions 24 2,107 3,789
Deferred tax liabilities 11 39,994 57,291
Other non-current liabilities 23, 27 264 797
Total non-current liabilities 124,145 74,617
Current liabilities
Current interest-bearing liabilities to credit institutions 23, 25, 27 286,960 21,169
Accounts payable 25 140,806 28,276
Derivative instruments 25 12,647 15,097
Current tax liabilities 35,099 15,598
Accrued expenses and deferred income 21, 25 61,606 32,483
Advance payments from customers 318,782 51,300
Other current liabilities 25 99,031 2,714
Total current liabilities 954,932 166,637
TOTAL EQUITY AND LIABILITIES 1,895,002 900,764

44 ANNUAL REPORT EOLUS VIND AB 2017/2018
CONSOLIDATED STATEMENT OF CHANGES IN EQUITY
KSEK Note 22
Share capital
Additional paid-in capital
Reserves Retained earnings
Total, Eolus’s share-
holders
Non- controlling
interests
Total equity
At September 1, 2017 24,907 190,843 369 441,673 657,791 1,719 659,510
Net profit for the year 194,460 194,460 -147 194,313
Other comprehensive income -864 -14 -878 340 -538
Total comprehensive income -864 194,446 193,582 193 193,775
Transactions with shareholders
Dividends -37,361 -37,361 -37,361
At August 31, 2018 24,907 190,843 -496 598,759 814,013 1,912 815,924
KSEK Note 22
Share capital
Additional paid-in capital
Reserves Retained earnings
Total, Eolus’s share-
holders
Non- controlling
interests
Total equity
At September 1, 2016 24,907 190,843 -42 455,315 671,026 140 671,166
Net profit for the year 25,317 25,317 -813 24,504
Other comprehensive income 412 412 -240 172
Total comprehensive income 412 25,317 25,729 -1,053 24,677
Transactions with shareholders
Acquisition of shares from non-controlling interests 10 10 -10 -
Non-controlling interests arising on acquisition of subsidiaries - 2,641 2,641
Change in shares of equity in associated companies -1,610 -1,610 - -1,610
Dividends -37,361 -37,361 -37,361
At August 31, 2017 24,907 190,843 369 441,673 657,791 1,719 659,510
CONSOLIDATED STATEMENT OF CHANGES IN EQUITY

ANNUAL REPORT EOLUS VIND AB 2017/2018 45
CONSOLIDATED CASH FLOW STATEMENT
KSEK Note 2017/2018 2016/2017
Operating activities
Operating profit/loss 202,411 40,233
Non-cash items 26 15,399 23,715
217,810 63,948
Interest received 2,667 730
Interest paid -7,174 -8,632
Income tax paid -3,424 -1,175
Net cash flow from operating activities before changes in working capital 209,879 54,871
Adjustments of working capital
Increase/decrease in wind turbine inventories, wind turbines under construction, projects under development and advance payments to suppliers -347,147 335,260
Increase in operating receivables -11,975 -22,429
Decrease/increase in operating liabilities 390,967 -276,732
Cash flow from operating activities 241,724 90,971
Cash flow from investing activities
Acquisition of participations in subsidiaries/asset acquisitions - -4,009
Acquisition of property, plant and equipment 13 -1,388 -6,698
Sale of property, plant and equipment 13 437 606
Sale of financial assets - 383
Cash flow from investing activities -952 -9,718
Cash flow from financing activities
Borrowings 23, 27 360,000 -
Repayment of loans 23, 27 -25,807 -47,865
Redemption derivative instruments - -15,810
Dividends -37,361 -37,361
Cash flow from financing activities 296,832 -101,036
Cash flow for the year 537,604 -19,784
Cash and cash equivalents at beginning of year 201,509 221,549
Exchange rate differences in cash and cash equivalents 712 -256
Cash and cash equivalents at year-end 739,825 201,509
CONSOLIDATED CASH FLOW STATEMENT

46 ANNUAL REPORT EOLUS VIND AB 2017/2018
PARENT COMPANY INCOME STATEMENT
KSEK Note 2017/2018 2016/2017
Net sales 4 1,115,620 910,062
Change in wind turbine inventories, wind turbines under construction and projects under development 209,495 -155,556
Other operating income 8 20,420 16,974
Total operating income 1,345,535 771,480
Cost of goods and project development -1,194,017 -624,097
Other external expenses 7, 14 -31,378 -33,439
Employee benefits expenses 5, 6 -25,429 -30,112
Depreciation and impairment of property, plant and equipment 13 -5,524 -4,673
Other operating expenses 8 -12,033 -10,294
Total operating expenses -1,268,381 -702,615
Operating profit 77,154 68,865
Profit from participations in Group companies 16 209,898 21,109
Interest income 9 582 470
Interest expense 9 -2,232 -1,586
Other financial items 9 3,467 -6,298
Loss from financial items 211,715 13,695
Profit after financial items 288,869 82,560
Appropriations 10 20,484 89,547
Profit before tax 309,353 172,107
Tax on profit for the year 11 -23,008 -34,396
Net profit for the year 286,345 137,711
PARENT COMPANY INCOME STATEMENT

ANNUAL REPORT EOLUS VIND AB 2017/2018 47
PARENT COMPANY STATEMENT OF OTHER COMPREHENSIVE INCOME
KSEK Note 2017/2018 2016/2017
Net profit for the year 286,345 137,711
Other comprehensive income
Other comprehensive income not to be reclassified to profit or loss in subsequent periods - -
Other comprehensive income to be reclassified to profit or loss in subsequent periods - -
Total other comprehensive income - -
Comprehensive income for the year 286,345 137,711
PARENT COMPANY STATEMENT OF OTHER COMPREHENSIVE INCOME

48 ANNUAL REPORT EOLUS VIND AB 2017/2018
PARENT COMPANY BALANCE SHEET
KSEK Note Aug 31, 2018 Aug 31, 2017
ASSETS
Intangible assets 12 96,162 -
Property, plant and equipment
Land and buildings 13 221 221
Wind turbines 13 5,458 35,477
Equipment 13 6,285 3,027
Constructions in progress 13 - 4,799
11,964 43,524
Financial assets
Participations in Group companies 16 64,529 137,698
Participations in associated companies 18 - 3,725
Other securities held as non-current assets 15 722 1,242
Deferred tax assets 11 71 238
Other non-current receivables 5,000 5,000
70,322 147,903
Total non-current assets 178,448 191,427
Inventories, etc.
Wind turbine inventories - 9,325
Wind turbines under construction and projects under development 392,045 173,705
Advance payments to suppliers 304,490 125,804
696,535 308,834
Current receivables
Accounts receivable 51,505 23,760
Receivables from Group companies 388,519 161,712
Current tax assets - -
Other current receivables 13,299 18,723
Prepaid expenses and accrued income 2,145 4,530
455,468 208,725
Cash and cash equivalents 709,331 181,385
Total current assets 1,861,334 698,944
TOTAL ASSETS 2,039,782 890,371
PARENT COMPANY BALANCE SHEET

ANNUAL REPORT EOLUS VIND AB 2017/2018 49
PARENT COMPANY BALANCE SHEET
KSEK Note Aug 31, 2018 Aug 31, 2017
EQUITY AND LIABILITIES
Restricted equity 22
Share capital 24,907 24,907
Statutory reserve 22,259 22,259
47,166 47,166
Non-restricted equity
Share premium reserve 168,663 168,663
Retained earnings 293,773 193,423
Net profit for the year 286,345 137,711
748,781 499,797
Total equity 795,947 546,963
Untaxed reserves 10 140,457 142,951
Provisions 24 511 1,449
Non-current liabilities to credit institutions 23 75,000 -
Current liabilities
Liabilities to credit institutions 23 285,000 -
Advance payments from customers 203,782 51,300
Accounts payable 137,872 26,159
Liabilities to Group companies 208,960 64,210
Current tax liabilities 34,954 23,693
Other liabilities 97,862 2,454
Accrued expenses and deferred income 21 59,437 31,192
Total current liabilities 1,027,867 199,008
TOTAL EQUITY AND LIABILITIES 2,039,782 890,371

50 ANNUAL REPORT EOLUS VIND AB 2017/2018
PARENT COMPANY STATEMENT OF CHANGES IN EQUITY
KSEK Note 22Share capital Additional
paid-in capitalReserves Retained
earningsTotal equity
At September 1, 2017 24,907 22,259 168,663 331,134 546,963
Net profit for the year 286,345 286,345
Total comprehensive income 286,345 286,345
Transactions with shareholders
Dividends -37,361 -37,361
At August 31, 2018 24,907 22,259 168,663 580,118 795,947
KSEK Note 22Share capital Statutory
reserveShare premium
reserveRetained earnings
Total equity
At September 1, 2016 24,907 22,259 168,663 230,784 446,613
Net profit for the year 137,711 137,711
Total comprehensive income 137,711 137,711
Transactions with shareholders
Dividends -37,361 -37,361
At August 31, 2017 24,907 22,259 168,663 331,134 546,963
PARENT COMPANY STATEMENT OF CHANGES IN EQUITY

ANNUAL REPORT EOLUS VIND AB 2017/2018 51
PARENT COMPANY CASH FLOW STATEMENT
KSEK Note 2017/2018 2016/2017
Operating activities
Operating profit/loss 77,154 68,865
Non-cash items 26 9,234 9,860
86,388 78,725
Interest received 582 485
Interest paid -2,800 -3,292
Income tax paid -11,580 14,736
Net cash flow from operating activities before changes in working capital 72,590 90,654
Adjustments of working capital
Increase/decrease in wind turbine inventories, wind turbines under construction, projects under development and advance payments to suppliers -386,079 230,507
Increase in operating receivables -246,743 -81,668
Increase/decrease in operating liabilities 644,702 -276,104
Cash flow from operating activities 84,470 -36,611
Cash flow from investing activities
Shareholders’ contributions 16 - 545
Acquisition of participations in subsidiaries 250 -150
Divestment of participations in subsidiaries - 110
Acquisition of property, plant and equipment 13 -1,054 -6,034
Sale of property, plant and equipment 13 23,101 26,162
Cash flow from investing activities 22,297 20,633
Cash flow from financing activities
Borrowings 23 360,000 -
Group contributions received/paid 98,540 23,255
Dividends -37,361 -37,362
Cash flow from financing activities 421,179 -14,106
Cash flow for the year 527,946 -30,084
Cash and cash equivalents at beginning of year 181,385 211,469
Cash and cash equivalents at year-end 709,331 181,385
PARENT COMPANY CASH FLOW STATEMENT

52 ANNUAL REPORT EOLUS VIND AB 2017/2018
The Parent Company, Eolus Vind AB, Corporate Registration Number 556389-3956, is a limited liability company registered and headquartered in Sweden. The Group’s main operations comprise the development, divest-ment and establishment of wind turbines and performance of operating ser-vices on behalf of wind farm owners. The address of the head office is Tredje Avenyen 3, Hässleholm, Sweden, under the postal address Box 95, SE-281 21 Hässleholm, Sweden. The company is listed on Nasdaq Stockholm. The Board of Directors approved these consolidated financial state-ments and the financial statements for the Parent Company on November 28, 2018 and they will be presented for adoption at the Annual General Meeting on January 26, 2019. The most important accounting policies applied to the preparation of these consolidated financial statements are stated below. These policies were applied consistently for all years presented, unless otherwise stated.
REGULATIONS APPLIED TO THE CONSOLIDATED FINANCIAL STATEMENTSThe consolidated financial statements were prepared in accordance with International Financial Reporting Standards (IFRS) issued by the International Accounting Standards Board (IASB) as adopted by the EU. Furthermore, the Swedish Annual Accounts Act and recommendation RFR 1 Supplementary Accounting Rules for Groups were applied.
BASIS FOR THE PREPARATION OF THE CONSOLIDATED FINANCIAL STATEMENTSThe consolidated financial statements are based on historical cost, unless otherwise stated. The Group’s presentation currency is SEK, which is the Parent Company’s functional currency. All figures are presented in thousands of SEK (KSEK), unless otherwise stated.
INTRODUCTION OF NEW ACCOUNTING POLICIESThe Group has decided to comment only on standards and interpretations that are deemed to be, or may in the future be, relevant to the Group and its operations. The standards, interpretations and amendments that are to be applied on or after the 2018/2019 fiscal year are currently being evaluated. Other than that which is stated below, the initial assessment is that they will not have any significant impact on the consolidated financial statements.
IFRS 9 FINANCIAL INSTRUMENTS IFRS 9 is mandatory for fiscal years beginning on or after January 1, 2018. This standard addresses the recognition, measurement and impairment of financial assets and liabilities and introduces new rules on hedge accounting. IFRS 9 replaces the parts of IAS 39 that address the recognition and mea-surement of financial instruments and introduces a new impairment model. In accordance with the standard’s transition rules, Eolus will not restate com-parative figures for the 2017/2018 fiscal year. The new recognition and mea-surement rules will not have a material impact on Eolus’s financial position on the transition date since the regulations will not entail any change to the recognition or measurement of the financial instruments. IFRS 9 introduces a new impairment model that is based on expected credit losses, instead of incurred credit losses, and that takes into account future information. There will be no material impairment effect for Eolus. Hedge accounting is not currently applied and thus will not impact Eolus’s financial position either.
IFRS 15 REVENUE FROM CONTRACTS WITH CUSTOMERSFrom 2018, IFRS 15 Revenue from Contracts with Customers replaces existing standards related to revenue recognition, such as IAS 18 Revenue and IAS 18 Construction Contracts. IFRS 15 is based on revenue being recognized when control of the good or service is passed to the customer,
as opposed to the existing basis of transfer of risks and benefits. IFRS 15 introduces a new method for determining when and how revenue is to be recognized. Eolus has two significant income streams that could be impact-ed by IFRS 15.
Revenue from transfer of project rights and signed construction contracts Revenue from wind farm contracts whereby the customer takes over the project rights and signs a construction contract with Eolus was recognized under IAS 18 and IAS 11 on the sale of the project company that normally includes project rights and permits for the farm, and on the date of the han-dover of the wind farm under the construction contract with Eolus for the construction of the wind farm. Under IFRS 15, revenue is to be recognized either by Eolus satisfying the performance obligation over time (successively) or at a point in time. Since the construction contracts entail that Eolus carries out work on land that the customer controls under leases, Eolus creates an asset that the customer controls as the asset is completed. In turn, this means that Eolus will apply the percentage of completion method from September 1, 2018.
Revenue from transfer of wind farms being builtRevenue from wind farm contracts whereby Eolus establishes the wind farm on the customer’s behalf was recognized under IAS 18 and IAS 11 on the date of the handover of the wind farm. Under IFRS 15, revenue is to be rec-ognized over time (successively) for a successive transfer of control in the accounts if Eolus does not have any alternative use for the sold wind farm and Eolus is entitled to receive payment from the customer for the work performed at any time. If one of these criteria is not fulfilled, revenue is to be recognized on completion and handover to the customer, following the current process. Since Eolus contracts the delivery of a certain wind farm to the customer, Eolus does not normally under IFRS 15’s definition have any alternative use for the sold wind farm. The extent to which Eolus is entitled to receive payment for work performed at any time depends on the contractual terms and the legislation applicable at any time, and is an assessment that is to be made on a contract-by-contract basis.
Accounting policies for revenue under IFRS 15 from September 1, 2018Percentage of completion for construction of wind farmsWhen applying the percentage of completion method, earnings are generat-ed in line with the degree of completion of the wind farm. Information about the following components is required to determine the earnings generated at any given time:• Revenue from construction: the nature of revenue must be that Eolus
can credit the revenue in the form of actual payments or consideration to the company.
• Expense: expenses attributable to Eolus’s construction corresponding to the revenue.
• Degree of completion: stages of completion of wind farms.
The fundamental condition for the percentage of completion method is that it must be possible to reliably quantify revenue and expenses based on the degree of completion. The effect of the percentage of completion method is that the earnings trend of construction in progress is directly reflected in the accounts. Percentage of completion involves an element of uncertainty. Sometimes unforeseen events occur that make the end result of construction projects either higher and lower than expected. It is particularly difficult to assess results at the start of construction projects and for projects that ex-tend over a long period of time. Provisions for losses are established as soon as they become known. Balance sheet items, accrued income and advance payments from cus-tomers will be recognized net on a project-by-project basis. The construction
NOTES
NOTE 1 GENERAL INFORMATION AND SIGNIFICANT ACCOUNTING POLICIES
NOTES

ANNUAL REPORT EOLUS VIND AB 2017/2018 53
projects that have higher accrued income than advance payments from customers will be recognized as current assets, while the projects that have higher advance payments from customers than accrued income will be classified as non-interest-bearing current liabilities.
Financial effects of transition to IFRS 15Eolus will apply the percentage of completion method for construction proj-ects, once the terms have been fulfilled, for the fiscal year beginning Septem-ber 1, 2018. Total revenue for a contract will remain unchanged and will not impact Eolus’s cash flows. We have completed our assessment of the finan-cial effects of the transition to the percentage of completion method. Since work on construction in progress commenced on September 1, 2018, but no stages have been completed, there will be no change to the financial statements on the transition to IFRS 15. However, opening equity will be negatively impacted by approximately SEK 20 M on September 1, 2018 due to a variable parameter for determining the final price in a contract with a customer.
IFRS 16 LEASESEolus is making preparations for the introduction of IFRS 16, which will come into force on September 1, 2019. An assessment of how the standard will impact the balance sheet is continuing. Based on the preliminary assess-ment, the change in the recognition of leases will require capitalization of leases in an insignificant amount compared with the total assets. Under the new standard, lease payments will be divided in two: amortization and inter-est expense, compared with the current standard under which they are rec-ognized as operating expenses. The exceptions are leases with a term of 12 months or less and leases of low value. Eolus intends to introduce the standard based on the simplified transition method, entailing that the com-parative year is not restated and instead the accumulated effect is adjusted in the opening balance of retained earnings on August 31, 2019.
CONSOLIDATION BASISThe consolidated financial statements encompass the Parent Company and its subsidiaries. The financial statements for the Parent Company and subsidiaries included in the consolidated financial statements pertain to the same period and have been prepared in accordance with the same accounting policies as for the Group.
SubsidiariesSubsidiaries are defined as all companies over which the Group exercises a controlling influence. The Group controls a company when the Group is ex-posed to, or has rights to, variable returns from its holding in the company and has the ability to impact those returns through exercising its influence over the company. Subsidiaries are included in the consolidated financial statements from the acquisition date, meaning the date on which the Group gains a controlling influence, and are included in the consolidated financial statements until the date on which the controlling influence ceases. Business combinations are recognized in accordance with the acquisi-tion method. The purchase consideration comprises the fair value of ac-quired assets, liabilities and issued shares. The purchase consideration also includes the fair value of all assets and liabilities that are part of any contract-ed, contingent purchase considerations. Acquisition-related costs are ex-pensed when they arise and are recognized as other expenses. Identifiable assets acquired and liabilities assumed are initially measured at fair value on the acquisition date. For each acquisition, the Group determines whether all non-controlling interests in the acquired company are measured at fair value or at the proportionate share of net assets of the acquired company. The amount by which the purchase consideration, any non-controlling interests and the fair value of previous shareholdings exceeds the fair value of the Group’s share of identifiable assets acquired is recognized as goodwill. If the amount is less than the fair value of the acquired subsidiary’s assets, the difference is recognized directly in the statement of comprehensive income. In accordance with common practice in the industry, wind power proj-ects are often conducted in separate companies. This means that acquisi-tions and divestments of projects and completed wind turbines are conduct-
ed as share transactions. These transactions are classified as asset acquisitions since the main aim is to acquire wind power facilities and there are either no other operations or administration, or these are of minor importance. The assets that are acquired in this manner are measured at fair value in the consolidated financial statements, and no goodwill arises.
Associated companiesAssociated companies are all companies over which the Group exercises a significant but not a controlling influence, which generally applies to share-holdings comprising between 20% and 50% of the votes. Holdings in asso-ciated companies are recognized in accordance with the equity method and are initially measured at cost and, thereafter, the carrying amount is increased or decreased to recognize the Group’s share of the associated company’s profit or loss after the acquisition date. The Group’s carrying amounts for holdings in associated companies include goodwill identified on acquisition.
Non-controlling interestsNon-controlling interests are the portion of the earnings and net assets of a non-wholly owned subsidiary that accrue to other owners than Parent Company shareholders. Their share of earnings is included in net profit for the year in the consolidated income statement and the share of net assets is included in equity in the consolidated statement of financial position.
Translation of accounts of foreign subsidiariesItems in the subsidiaries’ balance sheets are presented in their respective functional currencies, which is normally the same as the local currency in that specific country. The Group’s financial statements are presented in SEK, which is the Parent Company’s functional currency. The income statements and balance sheets of the foreign subsidiaries are translated to SEK. The balance sheets are translated at the closing day rate. The income statements are translated at the average exchange rate for the period. Exchange rate differences arising on translation do not impact net profit for the year and instead are recognized in other comprehensive income in the consolidated financial statements. The foreign exchange rates recognized under the section “Receivables and liabilities in foreign currencies” were used.
RECEIVABLES AND LIABILITIES IN FOREIGN CURRENCIESReceivables and liabilities in foreign currencies are translated at the closing day rate, and unrealized exchange rate gains and losses are included in profit or loss.
EUR NOK USD
Closing day rate, Aug 31, 2018 10.6372 1.0929 9.1044
Average exchange rate for the period 2017/2018 10.0493 1.0497 8.4305
Closing day rate, Aug 31, 2017 9.4839 1.0211 7.9725
Average exchange rate for the period 2016/2017 9.6278 1.0497 8.7713
RELATED-PARTY TRANSACTIONSTransactions with related parties take place are subject to market-based conditions. Related parties refer to the companies over which the Group exercises a controlling or significant influence in terms of operational and financial decision-making. The sphere of related parties also includes the companies and natural persons who have the opportunity to exercise a controlling or significant influence over the Group’s financial and operational decisions.
SEGMENT REPORTINGOperating segments are recognized in a manner that corresponds to the internal reporting to the chief operating decision maker (CODM). The CODM is the function that is responsible for allocating resources and assessing the performance of the operating segments. For the Group, this function has been identified as the CEO.
NOTES

54 ANNUAL REPORT EOLUS VIND AB 2017/2018
Eolus’s operating segments are described in Note 3 and comprise: • Project development involving pre-study, project development, divestment
and establishment of wind power facilities. This also includes technical and management consultancy services for wind power stakeholders.
• Asset management which pertains to full asset management services for external and internal wind power facilities.
• Electricity generation encompassing the operation of wholly or partly owned wind turbines, the sale of electric power and electricity certificates pertaining to these wind turbines.
CASH FLOW STATEMENTThe cash flow statement was prepared in accordance with the indirect meth-od. The recognized cash flow only includes transactions entailing incoming and outgoing payments. Cash and cash equivalents are included in cash and bank balances, and current investments with insignificant value fluctua-tions and original due dates of less than three months.
REVENUERevenue is recognized to the extent that it is probable that the economic benefits will accrue to the Group and if revenue can be reliably measured. Revenue is measured at the fair value of what has been received or will be received, excluding value-added tax. Sales proceeds are recognized when the following criteria have been fulfilled:
Sale of wind power facilitiesRevenue is recognized when the material risks and benefits associated with ownership of the facilities have been transferred to the purchaser and when the amount of revenue can be reliably measured. The projects comprise three phases: pre-study, project development and establishment. The estab-lishment stage is completed after final commissioning. Revenue is recog-nized in net sales in connection with handover to the customer. For cases in which the customer takes over the project rights and signs a construction contract with Eolus, revenue is recognized on the sale of the project compa-ny that normally includes project rights and permits for the farm, and on the date of the handover of the wind farm under the construction contract with Eolus for the construction of the wind farm. Since there are relatively few, but large, projects in the establishment stage at any one time, sales and earnings may vary considerably from quarter to quarter and fiscal year to fiscal year. The project development operations are mainly financed by equity, advance payments from customers and credit facilities.
Sale of administrative and technical management servicesRevenue from administrative and technical management services is recog-nized in the period in which the services were essentially carried out.
Sale of electricityRevenue attributable to the sale of produced electricity is recognized in the period in which delivery is made.
InterestInterest income is recognized as financial income through application of the effective-interest method.
DividendsDividends are recognized in profit or loss when the shareholders’ rights to receive payment have been determined.
INTANGIBLE ASSETSIn connection with the divestment of the Jenåsen wind farm, Eolus acquired the right to 96% of the electricity certificates that the wind farm will generate over the 15-year certificate period. This right was acquired for a non-recur-ring amount and recognized as an intangible asset. Electricity certificates are recognized as inventory as they are issued, at which point production-based amortization of the intangible asset item will take place.
PROPERTY, PLANT AND EQUIPMENTProperty, plant and equipment are recognized at cost less accumulated depreciation and any impairment. Expenses for improving the performance of the assets beyond the original level increase the carrying amount of the assets. Expenses for repairs and maintenance are recognized as costs in profit or loss. Property, plant and equipment are depreciated systematically over the estimated useful lives of the assets. The useful life is tested at the end of ev-ery accounting period and is adjusted as necessary. Any residual value of the asset is taken into account when determining the depreciable amount of the asset. The straight-line depreciation method is applied to all types of assets.
The following depreciation periods are applied: Number of yearsBuildings and land improvements 20 yearsWind turbines, foundations and electrical installations 20 yearsEquipment 5 years
IMPAIRMENT OF NON-FINANCIAL ASSETSIf there is an indication that an asset subject to depreciation has declined in value, the recoverable amount of the asset is calculated. The asset is impaired to its recoverable amount if the calculated recoverable amount is less than the carrying amount. The recoverable amount is the highest of the net realizable value and value in use in the operations. For wind power facilities recognized as non-current assets or invento-ries, impairment testing takes place at the end of every quarter by preparing calculations showing the remaining expected cash flows of each asset. The key parameters in preparing these calculations are the assumptions regard-ing future generation, remaining service lives, the market prices of electricity and electricity certificates, operating expenses and the discount rate.
FINANCIAL ASSETS
ClassificationThe Group classifies its financial assets in the following categories.• Available-for-sale financial assets.• Financial assets measured at fair value through profit or loss. • Loan receivables and accounts receivable measured at amortized cost
using the effective interest method.
Classification depends on the purpose for which the financial asset was acquired. The classification of financial assets is determined when they are first recognized. All purchases and sales of financial assets are recognized on the transaction date.
Available-for-sale financial assetsAvailable-for-sale financial assets are assets that are not derivatives and are either identified as available for sale or cannot be classified into any of the other categories. The Group’s available-for-sale financial assets comprise securities.
Financial assets measured at fair value through profit or lossFinancial assets measured at fair value through profit or loss are financial assets held for trading. A financial asset is classified in this category if it was principally acquired for the purpose of being sold within the near future. Derivatives are always classified as held for trading. Assets in this category are classified as current assets if they are expected to be settled within 12 months, otherwise they are classified as non-current assets. The Group’s assets in this category comprise currency futures and inter-est rate derivatives. The Group does not apply hedge accounting. Gains and losses arising as a result of changes in fair value attributable to the category of financial assets measured at fair value through profit or loss are recognized in the periods in which they arise. Changes in the fair value of currency deriv-atives are recognized in profit or loss under other income/expenses.
NOTES

ANNUAL REPORT EOLUS VIND AB 2017/2018 55
Loan receivables and accounts receivableLoan receivables and accounts receivable are non-derivative financial assets that have fixed or fixable payments that are not listed on an active market. Loan receivables and accounts receivable are initially measured at fair value and are subject to regular and systematic analysis to determine the amounts at which the receivables are expected to be received. If a loan receivable is deemed to be doubtful, a reserve is established comprising the difference between the carrying amount and the expected cash flow. Losses attributable to doubtful receivables are recognized in profit or loss under other operating expenses, refer to Note 8. Any interest income on loan receivables is included in financial income. The Group’s accounts receivable, other current receivables, blocked bank balances and accrued interest income are included in this category.
Recognition and measurementPurchases and sales of financial assets are recognized at the trade date, that is, the date on which the Group commits to purchase or sell the asset. Financial instruments are initially measured at fair value plus transaction costs, which applies to all financial assets not measured at fair value through profit or loss. Financial assets measured at fair value through profit or loss are initially measured at fair value, while attributable transaction costs are recognized in profit or loss. Financial assets are derecognized from the balance sheet when the right to receive cash flows from the instrument has expired or been transferred and the Group has assumed essentially all risks and benefits connected with the right of ownership. Financial assets mea-sured at fair value through profit or loss are measured at fair value after the date of acquisition. Loan receivables and accounts receivable are initially recognized after the date of acquisition at amortized cost by applying the effective interest method. Dividend income from securities is recognized in profit or loss as a portion of financial income once the Group’s right to receive payment has been established.
Impairment principles for financial assets – Loan receivables and accounts receivableAt the end of each reporting period, the Group assesses whether there is objective evidence that a financial asset or group of financial assets requires impairment. A financial asset or group of financial assets requires impairment and is impaired only if there is objective evidence of an impairment require-ment due to one or more events having occurred after the asset was first recognized (a loss event) and that this event (or these events) has an effect, that can be reliably estimated, on the estimated future cash flows for the financial asset or group of financial assets. For the loan receivables and accounts receivable categories, impair-ment is calculated as the difference between the carrying amount of the asset and the present value of estimated future cash flows (excluding future loan losses that have not occurred), discounted to the original effective interest of the financial asset. The asset’s carrying amount is impaired and this impairment loss is recognized in the consolidated income statement.
FINANCIAL LIABILITIESThe Group’s financial liabilities are divided into two categories:• Financial liabilities measured at fair value through profit or loss. • Financial liabilities measured at amortized cost.
Financial liabilities measured at fair value through profit or loss comprise currency and interest rate derivatives. Other financial liabilities are initially measured at fair value less any transaction costs that have arisen. In subse-quent periods, these liabilities are measured at amortized cost in accordance with the effective interest method. Eolus’s accounts payable, borrowing and other current liabilities and accrued expenses are included in this category.
FAIR VALUE MEASUREMENTFair value is the price that would be received at the measurement date on selling an asset or paid on transferring a liability in an orderly transaction be-tween market participants at the measurement date. Financial instruments
measured at fair value are classified either as fair value in profit or loss or available for sale. Measurement can be based on any of the following conditions:• Quoted market prices (unadjusted) in active markets for identical assets
or liabilities (level 1).• Inputs other than quoted prices that are observable for the asset or liabili-
ty, either directly (quoted prices) or indirectly (derived from quoted prices) (level 2).
• Unobservable market inputs for the asset or liability (level 3).
The fair value of financial instruments traded in an active market is based on quoted market prices on the balance sheet date. A market is considered to be active if quoted prices from a stock exchange, broker, industrial group, pricing service or supervisory authority are readily and regularly available and these prices represent actual and regularly occurring market transactions at arm’s length. The fair value of financial instruments not traded in an active market (for example, OTC derivatives) is determined using valuation tech-niques. Market information is used for this as far as possible when it is avail-able, whereas company-specific information is used as little as possible. If all significant inputs required for measurement are observable, then level 2 measurement is applied. The fair value of unquoted securities is based on cash flows discounted at an interest rate based on the market interest rate and a risk mark-up specific to these unquoted securities. The fair value of currency futures is determined by using the exchange rates for currency futures on the balance sheet date where the resulting value is discounted to the present value, meaning level 2. Eolus currently recognizes all financial instruments at level 2. If one or more significant inputs are not based on observable market information, the instrument in question is classified as level 3. Eolus does not currently recognize any financial instruments belonging to this category. No reclassifications between the various categories took place during the period.
WIND TURBINE INVENTORIES, WIND TURBINES UNDER CONSTRUCTION AND PROJECTS UNDER DEVELOPMENTWind turbine inventories are the wind turbines that are available for sale, but that are operational and generate electricity because they have not been divested. At the end of every quarter, a wind turbine that has not been divested after 12 months is reclassified from an inventory to a tangible asset. An exception can be made if divestment discussions are advanced and ex-pected to lead to divestment of the turbine in the near future. Wind turbines classified as inventories have been measured at adjusted cost, meaning that the carrying amount of each wind turbine is adjusted each quarter to meet the decline in value that takes place. The procedure is described in more detail under the heading “Impairment of non-financial assets.” Wind turbines classified as non-current assets are reclassified to wind turbine inventories before being divested. Reclassification also takes place in cases where divestment discussions are advanced and expected to lead to divestment of the turbine in the next quarter. Sales of wind turbines in inventories are recognized under net sales. Wind turbines under construction are wind turbines that are being built. Projects under development are the project development activities being conducted. All projects that have incurred costs of at least KSEK 10 are in-cluded in the portfolio. The project portfolio is reviewed at the end of every quarter and impairment losses are recognized if, for example, a project has not been approved by the regulator. Wind turbines under construction and projects under development are measured at the lowest of costs incurred and fair value.
PROVISIONSProvisions are recognized when the Group has a legal or informal commit-ment due to previous events and when it is probable that a payment will be required to settle the commitment and the amount can be reliably calcu-lated. For cases in which the company expects an established provision to
NOTES

56 ANNUAL REPORT EOLUS VIND AB 2017/2018
be compensated by an external party, for example, within the framework of an insurance contract, such expected compensation is recognized as a sep-arate asset, but only when it is essentially certain that compensation will be received. If the time value is significant, the future payment is calculated at its present value. The calculations are made by applying a discount rate that reflects the short-term market expectations taking into account specific risks associated with the commitment. An increase in the commitment is recog-nized as an interest expense.
Provisions for after-treatment costsAccording to the Swedish Environmental Code, the regulatory authority is entitled to require that guarantees be provided for security with respect to dismantling and after-treatment of the wind power facility. The main costs for dismantling and after-treatment are estimated for each facility with guid-ance from investigations carried out for specific turbines. Provisions are established at the present value of the calculated future cost. Provisions are continuously adjusted upward using the discount rate and this upward adjustment is recognized as a borrowing cost (interest expense). The asset’s carrying amount is adjusted if it is classified as a non-current asset.
CONTINGENT LIABILITIESContingent liabilities comprise possible commitments originating from events that have occurred and whose occurrence is confirmed only by the occur-rence or non-occurrence of one or several uncertain future events, which are not within Eolus’s control. Contingent liabilities may also be a commit-ment originating from events that have occurred but that have not been recognized as a liability or a provision because it is not likely that the commit-ment will be settled or the amount of the commitment cannot be reliably calculated.
EMPLOYEE BENEFITS
Severance paySeverance pay is paid when employment is terminated before the normal age of retirement or when the employee accepts voluntary redundancy in exchange for such remuneration. Eolus recognizes severance pay when the Group has an existing legal or informal commitment when it is more probably that an outflow of resources will be required to settle the commitment than not, and when the amount can be reliably calculated.
PensionsEolus’s pension obligations only encompass defined-contribution plans. A defined-contribution plan is a pension plan under which the Group pays fixed contributions to a separate legal entity. The Group does not have any legal or informal obligations to pay additional contributions if this legal entity does not have sufficient assets to pay all of the remuneration to the employ-ees that is associated with the employees’ service in current and earlier periods. The Group’s payments into defined-contribution pension plans are charged to net profit for the year in the year to which they are attributable.
LeasesNon-current assets utilized under leases are classified in accordance with the financial implication of the leasing agreement. The leasing of non-current assets, whereby the Group essentially assumes the risks and benefits asso-ciated with ownership, are classified as finance leases. Financial leases are recognized at the start of the lease period at the lower of the fair value of the leasing object and the present value of the minimum leasing fees. Other leasing agreements are classified as operating leases. Payments made over the lease period are expensed in profit or loss in a straight line over the lease period. Eolus only has leasing agreements classified as operating leases.
INCOME TAXThe tax expense for the period includes current and deferred tax. Tax is rec-ognized in profit or loss, except when the tax pertains to items recognized in other comprehensive income or directly in equity. In such cases, the tax is also recognized in other comprehensive income and equity, respectively.
All tax liabilities and tax assets are valued at nominal amounts in accordance with the tax rules and at the tax rates decided or announced and which, with all likelihood, will be adopted. Deferred tax is recognized on the balance- sheet date in accordance with the balance sheet method for temporary differences between the tax and accounting values of the assets and liabilities. Deferred tax assets are recognized for all deductible temporary differences, including loss carryforwards, to the extent that it is probable that a taxable profit will be available against which the deductible temporary differences can be utilized.
ASSESSMENTS, ESTIMATES AND ASSUMPTIONSCertain estimates and assumptions are made when the Board of Directors and CEO prepare the financial statements in accordance with applicable accounting policies that affect the carrying amounts of assets, liabilities, in-come and costs. The areas in which estimates and assumptions are of great significance to the Group and that could impact the income statement and balance sheet if they were to change are described below:
Provisions for doubtful receivablesAccounts receivable are initially measured at fair value and thereafter at the expected realizable value. An estimate of doubtful receivables is based on the conduct of an objective evaluation of all amounts outstanding at the end of the year. Losses attributable to doubtful receivables are recognized in profit or loss under other operating expenses. Refer to Note 8.
After-treatment costsThe costs for dismantling and after-treatment are estimated for each facility with guidance from investigations carried out for specific turbines. The basis is a standard value per megawatt (MW) of installed capacity. The residual value is handled as a deductible item in the disposal analysis and is taken into account in these standard amounts. The time factor is taken into ac-count through discounting. The price trend can be assumed to be equal to the long-term inflation target of 2%, while a certain level of technological progress should reduce the cost trend. These assumptions are continuously evaluated.
Legal disputesProvisions for disputes are estimates of the future cash flows required to settle obligations. Disputes primarily refer to contractual obligations pertain-ing to agreements with customers and suppliers, but other types of disputes also arise in the course of normal business activities.
ASSESSMENT OF USEFUL LIVES FOR PROPERTY, PLANT AND EQUIPMENTBased on experience gained and in light of improvements in technological performance, the Board has deemed that a depreciation period of 20 years reflects the expected useful life. These assumptions that form the basis of the assessment are continuously reevaluated and local differences are also taken into consideration. The useful lives for all components of the wind tur-bines, foundations and electrical installations are deemed to be the same, which is why there is no further division.
ASSESSMENT OF IMPAIRMENT REQUIREMENTS FOR WIND POWER PROJECTSAt the end of every quarter, the carrying amounts of the Group’s project port-folio are analyzed to determine whether any indications exist that these carry-ing amounts have declined. Should such an indication exist, a comparison is made between the estimated final establishment cost and the project’s acquisition value to an investor. An impairment requirement exists if the esti-mated establishment cost is higher than the acquisition value of the project to an investor. Other factors, such as permits, could also impact the realiz-ability of the project and thus its value. Any impairment is recognized directly in profit or loss.
NOTES

ANNUAL REPORT EOLUS VIND AB 2017/2018 57
FINANCIAL RISK MANAGEMENT AT EOLUSThrough its operations, Eolus is exposed to a variety of financial risks: market risk (interest rate risk, currency risk and energy price risk), credit risk and li-quidity and refinancing risk. The Group’s overall risk management focuses on the unpredictably of the financial markets and seeks to minimize poten-tially adverse effects on the Group’s earnings. These financial risks include the impact of changed interest expense for floating interest loans, the impact of exchange rate fluctuations on wind turbine purchases, the risk of changes in electricity and electricity certificate prices, the risk of the company not hav-ing access to the necessary financing for future projects and the company having insufficient short-term liquidity to meet its existing payment commit-ments. Risk is managed by the finance function following a written finance and risk policy that is adopted every year by the Board of Directors if chang-es are made, otherwise its current form applies. Follow-ups of the Group’s finance and risk policy are reported to the Board every quarter.
MARKET RISKEolus’s primary operations comprise developing wind power facilities and divesting wind power facilities when they are turnkey facilities and have be-come operational. Most of the company’s market risks are both direct and indirect since Eolus’s customers also need to manage these risks and Eolus may thus be indirectly impacted by lower demand and/or lower sales prices.
Interest rate riskEolus’s customers usually borrow for their investments in wind power. Con-sequently, interest rates affect demand for wind power facilities. The Group’s loans are primarily attributable to the construction of wind power facilities and financing the wind power portfolio that is owned and which generates electricity. Interest on these credit facilities is currently floating, refer to Note 23. Borrowing raised at fixed interest rates exposes the Group to interest rate risk pertaining to fair value. Changes in market interest rates can have an impact on future earnings and profitability, mainly regarding wind power facilities under construction that are financed by bank loans. Under the ad-opted finance and risk policy, the average fixed-interest term linked to electricity generation is not to be less than 2.5 years and the nominal amount for interest rate derivatives is not to exceed 100% of interest- bearing liabilities to credit institutions. This can be achieved by a combination of fixed-interest loans, loans at variable interest rates and derivative instru-ments. The aim of interest rate derivatives is to swap floating interest rates for fixed interest rates. At August 31, 2018, the Group had interest rate derivatives outstanding that amounted to a nominal SEK 90 M (90), of which SEK 45 M falls due in 2020 and SEK 45 M in 2023. Including interest rate derivatives, the loan portfolio had an average fixed-interest period of 0.9 years on the closing date. Interest-bearing liabilities amounted to SEK 368.7 M (33.9) at August 31, 2018. On the closing date, more than 100% (100) of the Group’s liabilities to credit institutions, attributable to
electricity generation operations, were covered by interest rate hedging in-struments. The deviations from the finance and risk policy were approved by the Board of Directors. Excluding interest rate derivatives, the average inter-est rate was 1.85% (1.85). Including interest rate derivatives, the average interest rate was 2.3% (3.6). A change in interest rates of +/- 1 percentage point would have an earnings impact of +/- SEK 3.7 M (0.3). A correspond-ing change would have an earnings impact of +/- SEK 11 M (11) attributable to the market value of interest rate derivatives.
Currency riskEolus’s currency risk exposure primarily arises due to a large portion of purchases of wind turbines and sales of wind farms taking place in EUR. Exchange rate fluctuations can thus affect the profitability of wind farm proj-ects. The Group’s finance and risk policy stipulates how the risk of negative effects of changes in exchange rates is to be managed. The policy entails that at least 75% and at most 125% of the forecast net flow (inward and outward payments in EUR) within 12 months is to be managed using, for ex-ample, currency futures, currency swaps, loans in foreign currency or curren-cy deposits. Calculated flows later than 12 months but within 24 months may be managed at a maximum of 75%. The risk inherent in forecast flows later than 24 months is not managed. At August 31, 2018, the Group had outstanding currency hedges amounting to a nominal EUR 10.0 M (13.0). All currency futures fall due within 12 months and pertain to sales forwards. Signed currency futures, together with forecast inflows for the next 12 months, amount to about 102% of forecast outflows. The forecast net inflow includes the agreed purchase consideration for wind farms under construction, and raised and repaid loans in EUR. Only the EUR/SEK rate was hedged during the year. A change in the EUR/SEK exchange rate of SEK 1 at the end of the fiscal year would result in a net earnings impact of +/- SEK 2.9 M (28.3), given the translation of currency accounts and currency futures outstanding at August 31, 2018.
Energy price riskThe market price of electricity varies over time and the price trend of electric-ity certificates depends on the rate at which the generation of renewable electricity is expanded in relation to the quota obligation that consumers have to purchase electricity certificates. Eolus hedges a predetermined por-tion of the generation volume, which means that volume and profile risk is reduced. Hedging takes place with a number of the largest electricity traders to minimize counterparty risk. Electricity certificates are recognized in income in conjunction with generation of the corresponding electricity and are physi-cally received from the Swedish Energy Agency in the month after being earned. The future transfer price of electricity and electricity certificates is the single most important parameter in customers’ investment calculations. Accordingly, Eolus’s operations are affected in both the short and long term by trends in the forward market for electricity and electricity certificates.
PARENT COMPANY’S ACCOUNTING POLICIES The Parent Company prepares its annual reports in accordance with the Swedish Annual Accounts Act and the Swedish Financial Accounting Stan-dards Board’s recommendation RFR 2 Accounting for Legal Entities. RFR 2 entails that the Parent Company’s annual report for the legal entity is to apply all IFRSs and statements approved by the EU as far as possible under the framework of the Annual Accounts Act and by taking into account the con-nection between accounting and taxation. The recommendation also states the exceptions and additions that may be made compared with reporting under IFRS. The Group’s and the Parent Company’s accounting policies have the following differences. Participations in subsidiaries are recognized in the Parent Company according to the cost method. Certain financial assets are measured at fair value in the consolidated financial statements. These are measured at the lower of cost and fair value in the Parent Company’s
accounts. The Parent Company applies the exception under RFR2 to disap-ply IAS 39. Instead, financial instruments are recognized and measured based on their cost pursuant to the Swedish Annual Accounts Act. The Parent Company recognizes appropriations in accordance with the alterna-tive method stated in RFR 2 Accounting for Legal Entities. The amounts deposited in untaxed reserves comprise taxable temporary differences. Deferred tax liabilities attributable to the untaxed reserves are not recognized separately in the Parent Company due to the connection between account-ing and taxation. The amounts are included in untaxed reserves instead. None of the amendments to RFR 2 Accounting for Legal Entities have impacted the Parent Company’s financial statements.
AMENDMENTS TO RFR 2 THAT HAVE NOT YET COME INTO FORCENone of the coming amendments to RFR 2 are expected to have a significant impact on the Parent Company’s financial statements.
NOTE 2 FINANCIAL RISK MANAGEMENT
NOTES

58 ANNUAL REPORT EOLUS VIND AB 2017/2018
Eolus closely follows the market to understand how it works and its correla-tion to the price of other energy sources and business cycles, etc. As a re-sult, fluctuations in the price of electricity affect the Group’s potential custom-ers. Existing agreements and contracts are not considered to be financial instruments but are regarded as physical deliveries of electricity. No market valuation takes place since it is deemed that fixed-price contracts do not comprise financial instruments.
CREDIT RISKCredit risk, or counterparty risk, is defined as the risk of incurring a loss if the counterparty does not fulfill its commitments. Commercial credit risk encom-passes customers’ solvency and is managed by closely monitoring payment behavior, following up customers’ financial statements and maintaining regu-lar communication. The Group’s total credit risk is divided each year between a small number of customers that account for a relatively large percentage of the Group’s accounts receivable, refer to Note 20. All customers are highly transparent, including marketplaces for electricity trading. During periods of temporary excess liquidity, investments may only be made by deposits with banks that are under the supervision of a financial supervisory agency in a Nordic country or by deposits with or purchases of instruments issued by the Swedish National Debt Office. The fixed-term period for each individual investment of surplus liquidity may not be longer than three months. Investments with longer fixed-term periods require separate decisions.
InvestmentsThe Group’s cash flow generated from operating activities and from the divestment of turnkey operational facilities and wind turbines from invento-ries/non-current assets is used for developing new projects and financing operating activities. Surplus liquidity is to be invested with counterparties that have high credit ratings and thus low credit risk. The Group’s risks regarding interest income are relatively limited. The current interest rate of 0% on bank balances entails that there is no interest income from credit institutions for the 2017/2018 fiscal year.
LIQUIDITY AND REFINANCING RISKThe company’s operations are financed by borrowings from credit institutions in addition to equity. Liquidity risk is defined as the risk of the Group being adversely affected by shortcomings in managing and controlling cash and cash equivalents and payment flows. Refinancing risk pertains to the risk of experiencing difficulties in secur-ing financing for the operations at a given point in time. Eolus’s project operations largely comprise constructing wind turbines for which customer contracts have already been signed. The company works continuously on preparing 36-month cash flow forecasts for the Group. The management closely monitors rolling forecasts for trends in net debt/cash flows and to
ensure that the Group has sufficient liquidity available to meet operational needs. For wind turbines that are sold as operational to customers, the company endeavors to match payment plans, in terms of liquidity, from customers with the plans that the company has with the largest suppliers of each specific project. In July 2016, three credit agreements were signed with Handelsbanken. All agreements have a 29-month term. The loans comprise an overdraft facil-ity of SEK 75 M, a framework credit agreement of SEK 255 M for project financing and a construction loan of SEK 600 M. Construction loans for establishing the Jenåsen wind farm were terminated when the wind farm was handed over to the customer. The overdraft facility was unutilized on the balance sheet date, while the framework credit agreement was fully utilized. Given that some wind power facilities are available for sale and that the mortgaged facilities that conduct electricity generation are covered by sepa-rate loans, the Board adopted in its finance and risk policy that new loans are to be raised with short tenors. However, the company has previous credit facilities of SEK 8.7 M (14.7) with long tenors, and that fall due later than five years. Loans are to be raised with different credit institutions to reduce refinancing risk. A shorter term structure requires a higher equity/assets ratio and liquidi-ty preparedness. The Group’s equity/assets ratio may not fall below 30%. Continuous dialog is maintained with credit institutions for renegotiating new facilities in good time prior to due dates. To achieve optimal and cost- efficient access to financing, such financing is to be matched to the tenors of ongoing wind power projects. Separate covenants are in place for liabilities to credit institutions. Covenants for current credit agreements pertain to the equity/assets ratio and interest coverage ratio. If these undertakings are not met, the bank can withdraw the credit facilities. In the 2017/2018 fiscal year, all of the covenants to credit institutions were met. Interest-bearing liabilities amounted to SEK 368.7 M (33.9), of which SEK 8.7 M (14.7) is non-current. The fixed-term period for loans amounted to about one year (three) at the end of the fiscal year, with an average interest rate of 1.85% (1.85) excluding interest- rate derivatives. Refer to Note 17 for disclosures about remaining liquidity flows pertaining to financial liabilities.
CAPITAL RISKThe Group’s targets for its capital structure are to safeguard the Group’s ability to pursue its operations so that it can generate returns for sharehold-ers and value for stakeholders, and to maintain an optimal capital structure to keep costs for capital down. To maintain or adjust its capital structure, the Group can change the dividends it pays to shareholders, repay capital to shareholders, issue new shares or sell assets to reduce its liabilities.
GROUP PARENT COMPANYLoan maturity structure Aug 31, 2018 Aug 31, 2017 Aug 31, 2018 Aug 31, 2017
6 months or less 255,000 11,369 255,000 -
6-12 months 30,000 7,840 30,000 -
1-5 years 75,000 - 75,000 -
More than 5 years 8,740 14,700 - -
Total 368,740 33,909 360,000 -
NOTES

ANNUAL REPORT EOLUS VIND AB 2017/2018 59
2017/2018Project
developmentAsset
managementElectricity
generationJoint
eliminationsTotal
Group
Segment revenue
Net sales, external customers 1,336,048 15,722 14,207 - 1,365,977
Inter-segment transactions 405 606 - -1,011 -
Other revenue 14,492 6,835 1,206 - 22,533
Expenses -1,149,589 -20,692 -16,829 1,011 -1,186,100
(of which depreciation and impairment) (-5,297) (-70) (-9,398) - (-14,765)
Operating profit/loss 201,356 2,471 -1,416 - 202,411
Interest income 10,737
Interest expense -14,269
Profit before tax 198,879
Tax -4,566
Net profit for the year 194,313
Segment’s assets at August 31, 2018 1,026,806 4,655 32,180 831,361 1,895,002
Assets include:Purchase of non-current assets 1,388 - - - 1,388
Of net sales in the Electricity Generation operating segment, KSEK 2,593 (4,701) refers to sales of electricity certificates. The carrying amounts of wind turbines during the period were impaired by KSEK 6,315 to adjust to the changed price levels in the market. The entire amount pertains to the impairment of non-current assets.
Project development: involving pre-study, project development, construction and sale of wind power facilities. This also includes technical and management consultancy services for wind power stakeholders.
Asset management: pertains to full asset management services for owners of wind power facilities.
Electricity generation: encompassing the operation of wholly or partly owned wind turbines, the sale of electric power and the divestment of electricity certificates allocated to producers of renewable electricity.
NOTE 3 OPERATING SEGMENTS
NOTES

60 ANNUAL REPORT EOLUS VIND AB 2017/2018
The Parent Company’s sales primarily comprise turnkey wind power projects. The structure of the contracts varies and sales can be made of the following: wind power facilities that are constructed directly for the customer or facility/parts of wind turbines that are already operational and in inventories, shares in project companies and projects with relevant permits. A separate follow-up assignment after projects with relevant permits or shares in project companies are divested may involve constructing wind turbines for customers on the basis of a contractor agreement. The generation of electric power from completed turbines in inventories comprises a small portion of the Parent Company’s revenue. All of the Parent Company’s sales took place in Sweden.
NOTE 4 REVENUE
2016/2017Project
developmentAsset
managementElectricity
generationJoint
eliminationsGroup
total
Segment revenue
Net sales, external customers 1,027,012 13,905 24,751 - 1,065,668
Inter-segment transactions 378 374 - -752 -
Other revenue 2,928 9,979 4,472 - 17,379
Expenses -985,795 -22,795 -34,976 752 -1,042,814
(of which depreciation and impairment) (-1,282) (-32) (-22,109) - (-23,423)
Operating profit/loss 44,523 1,463 -5,753 - 40,233
Interest income -3,691
Interest expense -2,318
Profit before tax 34,224
Tax -9,720
Net profit for the year 24,504
Segment’s assets at August 31, 2017 520,326 - 100,908 279,530 900,764
Assets include:Purchase of non-current assets 6,698 - - - 6,698
100% (100) of the Group’s revenue is attributable to Sweden. One customer accounts for 83% of revenue. In the preceding year, three customers accounted for 70% of income: 33%, 27% and 20%.
Non-current assets Aug 31, 2018 Aug 31, 2017
Sweden 35,531 99,320
Estonia 16,530 15,886
Total 52,061 115,206
NOTES

ANNUAL REPORT EOLUS VIND AB 2017/2018 61
2017/2018 2016/2017
Salaries and other
remuneration
Social security expenses (of which
pension costs)
Salaries and other
remuneration
Social security expenses (of which
pension costs)
Sweden – Parent Company 20,931 9,907 23,430 11,505
(2,600) (3,338)
Sweden – subsidiaries 4,521 1,978 -
(418) (-)
Estonia 281 100 250 87
(-) (-)
Group 25,733 11,985 23,680 11,592
(3,018) (3,338)
2017/2018 2016/2017
Salaries and other
remuneration(of which bonus)
Pensioncosts
Salaries and other
remuneration(of which bonus)
Pension costs
Board of Directors and CEO 3,726 527 3,058 379
(-) (13)
Other employees 22,007 2,491 20,622 2,959
(-) (58)
Group 25,733 3,018 23,680 3,338
(-) (71)
Aug 31, 2018 Aug 31, 2017
Gender distribution, Board of Directors and other senior executives
Number at balance-sheet date
Of whom men Number at balance- sheet date
Of whom men
Board of Directors 6 4 6 4
CEO and other senior executives 4 3 4 3
Group and Parent Company 10 7 10 7
2017/2018 2016/2017
Average number of employeesAverage number
of employeesOf whom men Average number
of employeesOf whom men
Sweden – Parent Company 25 17 32 22
Sweden – subsidiaries 9 7
Estonia 1 1 1 1
Group 35 25 33 23
The members of the Parent Company’s management team also comprise Group Management.
Eolus has established a bonus and share ownership program for all of the company’s employees. A bonus is paid if the company achieves earnings targets set by the Board of Directors. The bonus corresponds to half a month’s salary and is paid in the form of a cash payment and/or shares. Under the share ownership program, an additional bonus may be paid in the form of bonus shares to individuals acquiring shares in the company, and retaining them for three years, for a portion or their entire bonus pay-ment instead of a cash payment. The liabilities under this program amount to insignificant amounts on each balance sheet date. There is no dilution for existing shareholders since no new shares are issued under the program.
NOTE 5 SALARIES, REMUNERATION AND NUMBER OF EMPLOYEES
NOTES

62 ANNUAL REPORT EOLUS VIND AB 2017/2018
CONDITIONS FOR BOARD OF DIRECTORSThe Annual General Meeting held on January 28, 2018 resolved that the Chairman of the Board would receive an annual fee of KSEK 350 and other Directors would each receive a fee of KSEK 150. No remuneration was paid to Directors other than the Board fees described below and the transactions reported in Notes 5 and 28. Proposals on remuneration of the Board of Directors are presented by the Nomination Committee.
CONDITIONS FOR THE CEORemuneration of the CEO is determined by the Board. CEO Per Witalisson received salary, pension benefits and car benefits during the fiscal year. The age of retirement is 65. The employment contract can be terminated with a mutual notice period of six months.
CONDITIONS FOR SENIOR EXECUTIVESFor the 2017/2018 fiscal year, the members of Group Management are con-sidered to be senior executives. Remuneration of other senior executives is determined by the CEO in consultation with the Chairman of the Board. The level of remuneration is to be based on such factors as position, expertise, experience and performance. Remuneration comprises fixed salary and may also comprise pension, variable salary and other benefits. The variable salary is to be based on the achievement of quantitative and qualitative targets. The company’s pension obligations are covered in all cases by continuous pension premiums. No Board fees are paid to employees of the Eolus Group. There are no agreements on severance pay.
Remuneration and other benefits 2017/2018Basic salary/
Board feeVariable
remunerationPension
costsCar benefits Total
Board of Directors:
Chairman of the Board Hans-Göran Stennert 350 - - - 350
Director Fredrik Daveby 150 - - - 150
Director Sigrun Hjelmquist 150 - - - 150
Director Hans Johansson 150 - - - 150
Director Hans Linnarson 150 - - - 150
Director Bodil Rosvall Jönsson 150 - - - 150
Senior executives:
Per Witalisson, CEO 1,758 - 399 53 2,210
Marcus Landelin, Deputy CEO 1,522 - 337 45 1,904
Other senior executives (2 individuals) 2,086 - 462 110 2,658
Total 6,466 - 1,198 208 7,872
Remuneration and other benefits 2016/2017Basic salary/
Board feeVariable
remunerationPension
costsCar benefits Total
Board of Directors:
Chairman of the Board Hans-Göran Stennert 350 - - - 350
Director Fredrik Daveby 150 - - - 150
Director Sigrun Hjelmquist 150 - - - 150
Director Hans Johansson 150 - - - 150
Director Hans Linnarson 150 - - - 150
Director Bodil Rosvall Jönsson 150 - - - 150
Senior executives:
Per Witalisson, CEO 1,959 13 379 53 2,404
Marcus Landelin, Deputy CEO 1,499 - 336 44 1,879
Other senior executives (2 individuals) 2,091 13 462 97 2,663
Total 6,649 26 1,177 194 8,046
NOTE 6 REMUNERATION OF BOARD OF DIRECTORS, CEO AND OTHER SENIOR EXECUTIVES
NOTES
ANNUAL REPORT EOLUS VIND AB 2017/2018 63
NOTE 7 REMUNERATION OF AUDITORS
GROUP PARENT COMPANY2017/2018 2016/2017 2017/2018 2016/2017
PricewaterhouseCoopers
Audit assignment 484 475 484 475
Audit activities in addition to the audit assignment 165 57 15 57
Tax consultancy - - - -
Other services 890 562 1,040 562
Total 1,539 1,094 1,539 1,094
EY
Other services 150 30 150 30
Total 150 30 150 30
Assertum Audit OÜ
Audit assignment 20 19 - -
Total 20 19 - -
Revisorgruppen Tröndelag AS
Audit assignment 18 18 - -
Total 18 18 - -
Total 1,727 1,161 1,689 1,124
NOTE 8 OTHER OPERATING INCOME AND OTHER OPERATING EXPENSES
GROUP PARENT COMPANYOther operating income 2017/2018 2016/2017 2017/2018 2016/2017
Exchange rate gains attributable to project activities 13,835 2,230 13,832 2,839
Capital gains attributable to sale of wind power facilities - - - 182
Capital gains attributable to other non-current assets 232 319 101 309
Invoiced expenses 8,051 13,881 6,247 13,426
Other 416 950 240 218
Total 22,533 17,379 20,420 16,974
Other operating expenses 2017/2018 2016/2017 2017/2018 2016/2017
Exchange rate losses attributable to project activities -5,016 -3,891 -4,972 -3,891
Capital losses attributable to sale of wind power facilities - - -2,553 -1,527
Capital losses attributable to other non-current assets - - -4,508 -4,876
Fair value of change in currency derivatives -351 -4,593 - -
Other - -420 - -
Total -5,367 -8,904 -12,033 -10,294
Eolus manages the risk in future forecast payment flows in accordance with an established finance and risk policy. The difference between the price paid and forward rate on maturity results in exchange rate gains and exchange rate losses, which are recognized as other operating income and other operating expenses, respectively.
NOTES

64 ANNUAL REPORT EOLUS VIND AB 2017/2018
NOTE 11 INCOME TAX
GROUP PARENT COMPANY2017/2018 2016/2017 2017/2018 2016/2017
Current tax:
Current tax on profit for the year -22,927 -34,328 -22,842 -34,310
Current tax attributable to prior periods - -1,466 - -
Total current tax -22,927 -35,794 -22,842 -34,310
Deferred tax:
Origination and reversal of temporary differences 15,395 26,074 -166 -86
Deferred tax due to changes in tax rate 2,966 - - -
Total deferred tax 18,361 26,074 -166 -86
Tax -4,566 -9,720 -23,008 -34,396
NOTE 10 APPROPRIATIONS AND UNTAXED RESERVES
PARENT COMPANYAppropriations 2017/2018 2016/2017
Change in tax allocation reserve -21,068 -13,310
Depreciation in excess of plan 23,564 4,317
Group contributions received/paid 17,988 98,540
Total 20,484 89,547
Untaxed reserves Aug 31, 2018 Aug 31, 2017
Tax allocation reserve 128,714 107,645
Accumulated depreciation in excess of plan 11,743 35,306
Total 140,457 142,951
NOTE 9 FINANCIAL INCOME AND EXPENSES
GROUP PARENT COMPANYInterest income 2017/2018 2016/2017 2017/2018 2016/2017
Loans and receivables 2,727 2,187 -10 113
Loans and receivables to Group companies - - 592 357
Total financial income 2,727 2,187 582 470
Interest expense 2017/2018 2016/2017 2017/2018 2016/2017
Bank loans -6,586 -7,464 -1,951 -599
Liabilities to Group companies - - -281 -987
Total financial expenses -6,586 -7,464 -2,232 -1,586
Other financial items 2017/2018 2016/2017 2017/2018 2016/2017
Exchange rate differences intra-Group receivables and liabilities 15,574 -10,163 13,819 -8,938
Exchange rate differences in cash and cash equivalents 914 4,284 -81 4,346
Exchange rate differences, other -8,478 1 -8,846 -
Other financial expenses -10,484 -3,162 -1,425 -1,706
Fair value of change in interest rate derivatives 2,801 8,308 - -
Total financial expenses 327 -732 3,467 -6,298
of which attributable to balance sheet items measured at fair value 2,801 8,308 - -
NOTES
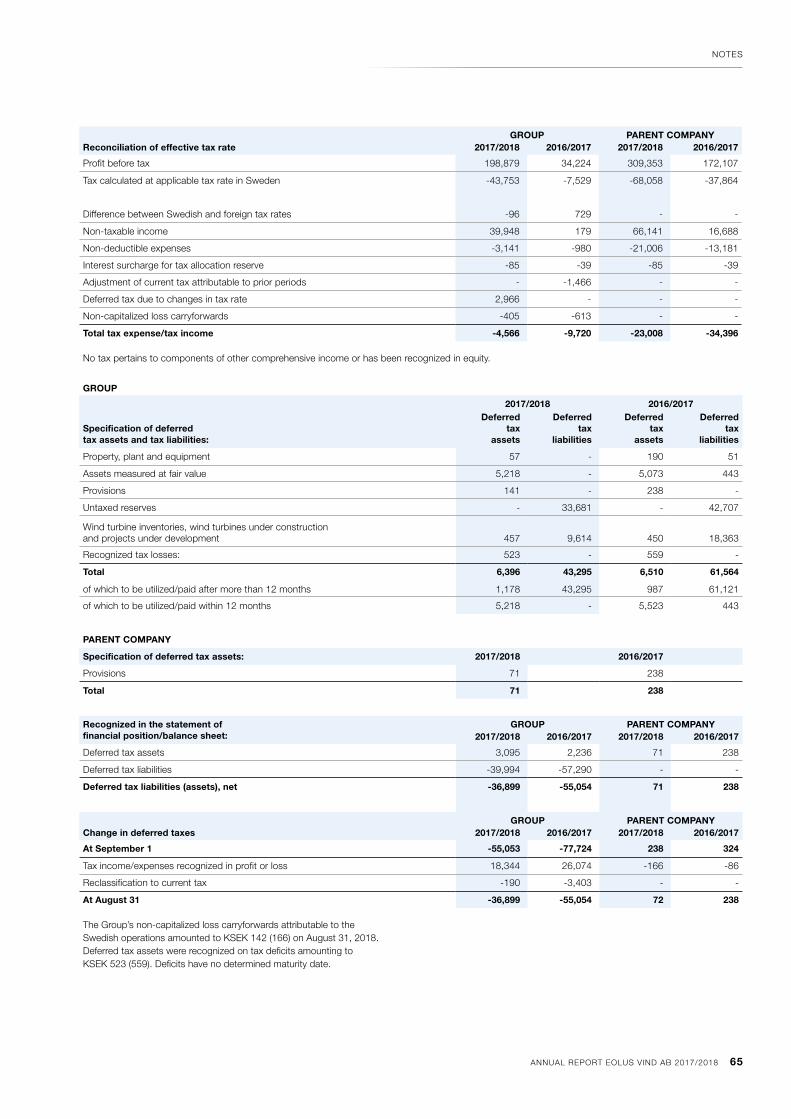
ANNUAL REPORT EOLUS VIND AB 2017/2018 65
GROUP
2017/2018 2016/2017
Specification of deferred tax assets and tax liabilities:
Deferred tax
assets
Deferred tax
liabilities
Deferred tax
assets
Deferred tax
liabilities
Property, plant and equipment 57 - 190 51
Assets measured at fair value 5,218 - 5,073 443
Provisions 141 - 238 -
Untaxed reserves - 33,681 - 42,707
Wind turbine inventories, wind turbines under construction and projects under development 457 9,614 450 18,363
Recognized tax losses: 523 - 559 -
Total 6,396 43,295 6,510 61,564
of which to be utilized/paid after more than 12 months 1,178 43,295 987 61,121
of which to be utilized/paid within 12 months 5,218 - 5,523 443
PARENT COMPANY
Specification of deferred tax assets: 2017/2018 2016/2017
Provisions 71 238
Total 71 238
Recognized in the statement of financial position/balance sheet:
GROUP PARENT COMPANY2017/2018 2016/2017 2017/2018 2016/2017
Deferred tax assets 3,095 2,236 71 238
Deferred tax liabilities -39,994 -57,290 - -
Deferred tax liabilities (assets), net -36,899 -55,054 71 238
GROUP PARENT COMPANYChange in deferred taxes 2017/2018 2016/2017 2017/2018 2016/2017
At September 1 -55,053 -77,724 238 324
Tax income/expenses recognized in profit or loss 18,344 26,074 -166 -86
Reclassification to current tax -190 -3,403 - -
At August 31 -36,899 -55,054 72 238
The Group’s non-capitalized loss carryforwards attributable to the Swedish operations amounted to KSEK 142 (166) on August 31, 2018. Deferred tax assets were recognized on tax deficits amounting to KSEK 523 (559). Deficits have no determined maturity date.
GROUP PARENT COMPANYReconciliation of effective tax rate 2017/2018 2016/2017 2017/2018 2016/2017
Profit before tax 198,879 34,224 309,353 172,107
Tax calculated at applicable tax rate in Sweden -43,753 -7,529 -68,058 -37,864
Difference between Swedish and foreign tax rates -96 729 - -
Non-taxable income 39,948 179 66,141 16,688
Non-deductible expenses -3,141 -980 -21,006 -13,181
Interest surcharge for tax allocation reserve -85 -39 -85 -39
Adjustment of current tax attributable to prior periods - -1,466 - -
Deferred tax due to changes in tax rate 2,966 - - -
Non-capitalized loss carryforwards -405 -613 - -
Total tax expense/tax income -4,566 -9,720 -23,008 -34,396
No tax pertains to components of other comprehensive income or has been recognized in equity.
NOTES

66 ANNUAL REPORT EOLUS VIND AB 2017/2018
NOTE 13 PROPERTY, PLANT AND EQUIPMENT
GROUP PARENT COMPANY
2017/2018
Land and
buildings
Wind turbines
Equip-ment
Construc-tions in
progress and advance
payments
Total Land and
buildings
Wind turbines
Equip-ment
Construc-tions in
progress and advance
payments
Total
Opening accumulated cost 13,669 199,696 25,027 4,799 243,190 2,533 48,589 20,811 4,799 76,732
Investments 251 - 118 1,019 1,388 - - 35 1,019 1,054
Sales and disposals -151 - -643 - -794 - -41,767 -583 - -42,350
Reclassifications - -91,963 4,560 -5,818 -93,221 - - 4,280 -5,818 -1,538
Exchange rate differences 1,287 2,382 55 - 3,724 - - - - -
Closing accumulated cost 15,056 110,115 29,116 - 154,286 2,533 6,822 24,543 - 33,898
Opening accumulated depreciation - -87,631 -21,322 - -108,953 - -7,744 -17,784 - -25,528
Depreciation for the year - -7,187 -1,263 - -8,450 - -2,414 -1,058 - -3,472
Sales and disposals - - 584 - 584 - 8,794 584 - 9,378
Reclassifications - 26,485 - - 26,485 - - - - -
Exchange rate differences - -1,801 -16 - -1,816 - - - - -
Closing accumulated depreciation - -70,134 -22,017 - -92,150 - -1,364 -18,258 - -19,622
Opening accumulated impairment -2,312 -20,484 - - -22,796 -2,312 -5,368 - - -7,680
Impairment for the year - -6,315 - - -6,315 - -2,052 - - -2,052
Reclassifications - 19,008 - - 19,008 - 7,420 - - 7,420
Exchange rate differences - -10 - - -10 - - - - -
Closing accumulated impairment -2,312 -7,801 - - -10,113 -2,312 - - - -2,312
Net carrying amount at year-end 12,744 32,180 7,100 - 52,024 221 5,458 6,285 - 11,964
During the fiscal year, 0 (0) wind turbines previously recognized as inventories were reclassified as non-current assets.
During the fiscal year, 5 (12) new wind turbines recognized as non-current assets were reclassified to inventories and subsequently sold.
NOTE 12 INTANGIBLE ASSETS
GROUP PARENT COMPANYCertificates Aug 31, 2018 Aug 31, 2017 Aug 31, 2018 Aug 31, 2017
Opening accumulated cost - - - -
Investments 96,162 - 96,162 -
Closing accumulated cost 96,162 - 96,162 -
In connection with the divestment of the Jenåsen wind farm, Eolus acquired the right to 96% of the electricity certificates that the wind farm will generate over the 15-year certificate period. This intellectual property right was acquired for a non-recurring amount of EUR 9 M, corresponding to SEK 96.2 M. The total acquired volume is expected to amount to
264,000 electricity certificates per year over a 15-year period, meaning a total of 3,960,000 electricity certificates. Electricity certificates are recognized as inventory as they are issued, at which point the intangible asset item will be impaired.
NOTES

ANNUAL REPORT EOLUS VIND AB 2017/2018 67
PREMISES EQUIPMENTKSEK Group Parent Company Group Parent Company
2017/2018 1,825 1,509 803 648
2018/2019 1,789 1,481 746 615
2019/2020 1,165 868 409 367
2020/2021 948 651 212 212
2021/2022 79 54 - -
Total 5,806 4,563 2,170 1,842
INVESTMENT COMMITMENTSNo agreements regarding the acquisition of property, plant and equipment or intangible assets had been signed on the closing date. LEASING AGREEMENTSThe Group has entered into leasing agreements regarding office premises, cars and office machines. The related costs for these are included in profit
or loss. The leasing periods vary between three months and three years and most leasing agreements can be extended at the end of the lease period on market-based conditions. However, the agreements are usually discontinued.
Paid and future lease payments pertaining to operating leasing agreements for premises and equipment amounted to the following for the fiscal year:
INVESTMENTS AND SALES OF PROJECTS AND COMPLETED WIND TURBINESIn accordance with industry practice, wind power projects are often con-ducted in separate companies. This means that certain acquisitions and di-vestments of projects and completed wind turbines are conducted as share transactions.
A number of such transactions were carried out in the 2017/2018 and 2016/2017 fiscal years. All of these transactions are deemed to be sales or investments of assets and thus are not recognized as business combina-tions. Assets acquired through share transactions are measured at fair value on the acquisition date.
GROUP PARENT COMPANY
2016/2017
Land and
buildings
Wind turbines
Equip-ment
Construc-tions in
progress and advance
payments
Total Land and
buildings
Wind turbines
Equip-ment
Construc-tions in
progress and advance
payments
Total
Opening accumulated cost 13,645 454,674 24,953 - 493,271 2,533 81,963 21,006 - 105,502
Investments 385 - 1,514 4,799 6,698 - - 1,235 4,799 6,034
Sales and disposals -327 - -1,440 - -1,767 - -33,374 -1,430 - -34,804
Reclassifications - -254,915 - - -254,915 - - - - -
Exchange rate differences -34 -61 -1 - -96 - - - - -
Closing accumulated cost 13,669 199,697 25,027 4,799 243,190 2,533 48,589 20,811 4,799 76,732
Opening accumulated depreciation - -136,393 -21,377 - -157,770 - -5,622 -18,466 - -24,088
Depreciation for the year - -13,620 -1,315 - -14,935 - -3,978 -696 - -4,674
Sales and disposals - 1 1,378 - 1,379 - 3,571 1,378 - 4,949
Reclassifications - 62,323 -10 - 62,313 - -1,715 - - -1,715
Exchange rate differences - 59 1 - 60 - -
Closing accumulated depreciation - -87,631 -21,322 - -108,953 - -7,744 -17,784 - -25,528
Opening accumulated impairment -2,312 -73,866 - - -76,178 -2,312 -9,639 - - -11,951
Impairment for the year - -8,489 - - -8,489 - - - - -
Reclassifications - 61,871 - - 61,871 - 4,271 - - 4,271
Closing accumulated impairment -2,312 -20,484 - - -22,796 -2,312 -5,368 - - -7,680
Net carrying amount at year-end 11,357 91,583 3,705 4,799 111,443 221 35,477 3,027 4,799 43,524
NOTE 14 COMMITMENTS
NOTES

68 ANNUAL REPORT EOLUS VIND AB 2017/2018
NOTE 15 OTHER SECURITIES HELD AS NON-CURRENT ASSETS
Holdings in other companies Number of participations Equity/votes (%) Aug 31, 2018 Aug 31, 2017
Långmarken Wind AB 50 10/10
Slättens Vind AB 22,575 2/2 722 1,242
Carrying amount 722 1,242
Information about equity refers to adjusted equity, which means including the equity portion of untaxed reserves. Net profit for the year according to the Annual Report has correspondingly been adjusted, where necessary, by the equity portion of change in untaxed reserves for the year.
Holdings in other companies Corp. Reg. No. Registered office Profit/loss Equity
Långmarken Wind AB 559032-9636 Hässleholm -16,758 1,298
Slättens Vind AB 559022-2583 Vara 1,490 65,290
NOTE 16 PARTICIPATIONS IN GROUP COMPANIES
2017/2018 2016/2017
At September 1 137,696 187,831
Acquisitions 250 150
Divestments - -100
Shareholders’ contributions, net 3,083 -10,343
Impairment -76,500 -54,353
Reversal of impairment - 14,511
At August 31 64,529 137,696
Profit from participations in Group companies 2017/2018 2016/2017
Impairment -90,743 -54,352
Reversal of impairment - 14,511
Dividends 300,641 60,890
Gain attributable to divestments - 60
209,898 21,109
Subsidiaries and sub-subsidiaries are listed in the table below.
Group companies Number of participations Equity/votes (%) Aug 31, 2018 Aug 31, 2017
Eolus Vind Amnehärad AB 1,000 100/100 69 69
Amnehärad Vindkraft Aktiebolag
Blekinge Offshore AB 560 60/60 - -
Bosberget Vindkraft AB 1,000 100/100 - -
Ekovind AB 130,000 100/100 25,002 65,002
Baltic Wind Energy
Eolus Elnät AB 1,000 100/100 100 100
Eolus Oy 2,500 100/100 99 99
Eolus Pörtom Vind Oy
Eolus Vind Norge AS 23,000 100/100 5,707 2,624
Stigafjell Vind AS
Eolus North America Inc. 100/100
Comstock LLC
Crescent Peak Renewables LLC
ENA BESS 1 LLC
ENA BESS 2 LLC
Wind Wall Development LLC
Wind Wall 1 LLC
NOTES

ANNUAL REPORT EOLUS VIND AB 2017/2018 69
Group companies Number of participations Equity/votes (%) Aug 31, 2018 Aug 31, 2017
Eolus Vindpark Ett AB 500 100/100 50 50
Eolus Vindpark Fem AB 500 100/100 50 50
Eolus Vindpark Sju AB 500 100/100 50 50
Eolus Vindpark Nio AB 500 100/100 50 50
Eolus Vindpark Elva AB 500 100/100 50 50
Eolus Vindpark Tretton AB 500 100/100 50 50
Eolus Vindpark Femton AB 500 100/100 50 50
Eolus Vindpark Sjutton AB 500 100/100 50 50
Eolus Vindpark Nitton AB 500 100/100 50 50
Eolus Vindpark Tjugo AB
Eolus Vindpark 23 AB 500 100/100 50 50
Eolus Vindpark 24 AB
Eolus Vindpark 25 AB 500 100/100 50 50
Eolus Vindpark 26 AB
Eolus Vindpark 27 AB 500 100/100 50 50
Eolus Vindpark 28 AB
Eolus Vindpark 29 AB 500 100/100 50 -
Eolus Vindpark 30 AB
Eolus Vindpark 31 AB 500 100/100 50 -
Vindpark Sötterfällan AB
Eolus Vindpark 33 AB 500 100/100 50 -
Eolus Vindpark 34 AB
Eolus Vindpark 35 AB 500 100/100 50 -
Eolus Vindpark 36 AB
Eolus Vindpark 37 AB 500 100/100 50 -
Eolus Vindpark 38 AB
Eolus Wind Power Management AB 500 100/100 50 50
Kattegatt Vindkraft AB 16,500 100/100 1,724 1,724
Linusvind AB 50,000 100/100 50 450
Lunnekullen Vindkraft AB 1,000 100/100 - -
Långmarken Vindkraft AB 1,000 100/100 100 100
Lärkeskogen Vindkraft AB 1,000 100/100 93 93
Näset Vindkraft AB 1,000 100/100 - -
SIA Eolus 2,000 100/100 25 25
Andruves wind SIA
Virzas wind SIA
Gulbji wind SIA
Melderi wind SIA
Pienava wind SIA
Unas wind SIA
Dobele wind SIA
Osi wind SIA
Mekji wind SIA
Valpene wind SIA
Skogaryd Vindkraft AB 1,000 100/100 100 100
Skuggetorp Vindkraft AB 1,000 100/100 100 100
Svenska Vindbolaget AB 1,430 100/100 27,200 63,300
Eolus Vindpark Tjugoett AB
Uddevalla Vind AB 1,000 100/100 102 102
Vingkraft Rönnerum AB 1,000 100/100 100 100
Ölme Vindkraft AB 1,000 100/100 3,058 3,058
Carrying amount 64,529 137,696
NOTES

70 ANNUAL REPORT EOLUS VIND AB 2017/2018
Group companiesCorp.
Reg. No.Registered
office
Eolus Vind Amnehärad AB 556738-6312 Hässleholm
Amnehärad Vindkraft Aktiebolag 556719-3569 Hässleholm
Blekinge Offshore AB 556761-1727 Karlshamn
Bosberget Vindkraft AB 556755-4810 Hässleholm
Ekovind AB 556343-8208 Hässleholm
Baltic Wind Energy 10869166 Saare County,Estonia
Eolus Elnät AB 556639-2477 Hässleholm
Eolus Oy 2622599-6 Vaasa, Finland
Eolus Pörtom Vind Oy 2456946-1 Vaasa, Finland
Eolus Vind Norge AS 998127068 Stjørdal, Norway
Stigafjell Vind AS 998390966 Stjørdal, Norway
Eolus North America Inc. 47-5083428 Nevada, USA
Comstock LLC 35-2541188 Nevada, USA
Crescent Peak Renewables LLC 27-2068025 Delaware, USA
ENA BESS 1 LLC 61-1906369 Nevada, USA
ENA BESS 2 LLC 35-2645294 Nevada, USA
Wind Wall Development LLC 32-0514251 Nevada, USA
Wind Wall 1 LLC 81-5141504 Nevada, USA
Eolus Vindpark Ett AB 556925-8139 Hässleholm
Eolus Vindpark Fem AB 556935-0365 Hässleholm
Eolus Vindpark Sju AB 556935-0381 Hässleholm
Eolus Vindpark Nio AB 556935-0472 Hässleholm
Eolus Vindpark Elva AB 556935-0498 Hässleholm
Eolus Vindpark Tretton AB 556935-0449 Hässleholm
Eolus Vindpark Femton AB 556935-0464 Hässleholm
Eolus Vindpark Sjutton AB 556935-0514 Hässleholm
Eolus Vindpark Nitton AB 556924-5136 Hässleholm
Eolus Vindpark Tjugo AB 556924-5128 Hässleholm
Eolus Vindpark 23 AB 556956-6168 Hässleholm
Eolus Vindpark 24 AB 556956-6176 Hässleholm
Eolus Vindpark 25 AB 556956-6028 Hässleholm
Eolus Vindpark 26 AB 556956-6010 Hässleholm
Eolus Vindpark 27 AB 556956-6002 Hässleholm
Eolus Vindpark 28 AB 559121-3193 Hässleholm
Eolus Vindpark 29 AB 559136-0002 Hässleholm
Eolus Vindpark 30 AB 559121-3292 Hässleholm
Group companiesCorp.
Reg. No.Registered
office
Eolus Vindpark 31 AB 559135-9988 Hässleholm
Vindpark Sötterfällan AB 559121-3185 Hässleholm
Eolus Vindpark 33 AB 559163-5106 Hässleholm
Eolus Vindpark 34 AB 559164-6798 Hässleholm
Eolus Vindpark 35 AB 559193-5114 Hässleholm
Eolus Vindpark 36 AB 559164-6541 Hässleholm
Eolus Vindpark 37 AB 559163-5122 Hässleholm
Eolus Vindpark 38 AB 559164-6996 Hässleholm
Eolus Wind Power Management AB 556912-1352 Hässleholm
Kattegatt Vindkraft AB 556411-7371 Hässleholm
Lunnekullen Vindkraft AB 556705-3045 Hässleholm
Linusvind AB 556832-0054 Hässleholm
Långmarken Vindkraft AB 556773-8033 Hässleholm
Lärkeskogen Vindkraft AB 556731-4710 Hässleholm
Näset Vindkraft AB 556721-1023 Hässleholm
SIA Eolus 40103392542 Riga, Latvia
Andruves wind SIA 40103703482 Riga, Latvia
Virzas wind SIA 40103702650 Riga, Latvia
Gulbji wind SIA 40103702769 Riga, Latvia
Melderi wind SIA 40103730387 Riga, Latvia
Pienava wind SIA 40103730508 Riga, Latvia
Unas wind SIA 40103761071 Riga, Latvia
Dobele wind SIA 40103786319 Riga, Latvia
Osi wind SIA 40103806530 Riga, Latvia
Mekji wind SIA 40103800684 Riga, Latvia
Valpene wind SIA 50103851451 Riga, Latvia
Skogaryd Vindkraft AB 556773-9791 Hässleholm
Skuggetorp Vindkraft AB 556773-7993 Hässleholm
Svenska Vindbolaget AB 556759-9013 Hässleholm
Eolus Vindpark Tjugoett AB 556924-5110 Hässleholm
Uddevalla Vind AB 556707-1278 Hässleholm
Vingkraft Rönnerum AB 556796-9836 Hässleholm
Ölme Vindkraft AB 556755-5965 Hässleholm
NOTES

ANNUAL REPORT EOLUS VIND AB 2017/2018 71
Aug 31, 2018 <3 months 3 months-1 year 1-2 years 2-5 years >5 years Total
Borrowing 257,199 33,434 4,137 83,191 812 378,773
Accounts payable 140,806 - - - - 140,806
Derivatives 950 2,850 3,800 6,261 - 13,861
Other financial liabilities 99,840 8 - 264 - 100,112
Total 498,795 36,292 7,937 89,716 812 633,552
Aug 31, 2017 <3 months 3 months-1 year 1-2 years 2-5 years >5 years Total
Borrowing 11,202 10,357 2,196 6,175 5,011 34,941
Accounts payable 28,276 - - - - 28,276
Derivatives 963 2,890 3,854 8,244 1,959 17,910
Other financial liabilities 2,735 8 - 797 - 3,540
Total 43,176 13,255 6,050 15,216 6,970 84,667
The table below presents the remaining contractual maturities of the financial liabilities. The amounts stated in the table are the contractual and undis-counted cash flows. All currency derivatives have negative market values. The negative total market value of currency derivatives was KSEK 814
(neg: 463) on the closing date. Contractual interest rate derivatives had negative market values on the closing date. The total negative market value of interest rate derivatives was KSEK 11,833 (neg: 14,634) on the closing date.
NOTE 18 PARTICIPATIONS IN ASSOCIATED COMPANIES
GROUP
CARRYING AMOUNT
Participations in associated companiesCorp.
Reg. No.Registered
officeCapital/votes
(%)Aug 31, 2018 Aug 31, 2017
Isgrannatorp Drift AB 556787-6833 Kristianstad 33/33 37 37
Triventus AB 556627-3016 Falkenberg 40/40 - 3,725
Carrying amount 37 3,763
FINANCIAL INFORMATION REGARDING THE GROUP’S ASSOCIATED COMPANIES (RELATES TO ENTIRE ASSOCIATED COMPANIES, NOT ONLY THE GROUP’S PARTICIPATING INTEREST)
Income statement 2017/2018 2016/2017
Operating income 5,753 13,422
Operating expenses -5,836 -21,496
Operating loss -83 -8,074
Net financial items -4,310 1,702
Tax - -
Net loss for the period -4,393 -6,372
Balance sheet Aug 31, 2018 Aug 31, 2017
Non-current assets 3,210 1,642
Current assets 11,225 28,519
Total assets 14,435 30,161
Equity 11,811 9,347
Provisions - 16,499
Non-current liabilities - 2,100
Current liabilities 2,624 2,215
Total equity and liabilities 14,435 30,161
NOTE 17 FINANCIAL RISK MANAGEMENT
NOTES

72 ANNUAL REPORT EOLUS VIND AB 2017/2018
NOTE 19 WIND TURBINE INVENTORIES, WIND TURBINES UNDER CONSTRUCTION AND PROJECTS UNDER DEVELOPMENT
GROUP PARENT COMPANYAug 31, 2018 Aug 31, 2017 Aug 31, 2018 Aug 31, 2017
Wind turbine inventories - 9,325 - 9,325
Wind turbines under construction and projects under development 574,666 335,515 392,045 173,705
Total 574,666 344,840 392,045 183,030
Profit/loss from participations in associated companies 2017/2018 2016/2017
Triventus AB -3,725 -2,570
Other -864 -1,604
Total loss from participations in associated companies -4,589 -4,175
Change in participations in associated companies 2017/2018 2016/2017
At September 1 3,761 8,075
Share in profits -3,725 -4,175
Divestments - -139
Other 1 -
At August 31 37 3,761
PARENT COMPANY
CARRYING AMOUNT
Participations in associated companiesCorp.
Reg. No.Registered
officeCapital/votes
(%)Aug 31, 2018 Aug 31, 2017
Triventus AB 556627-3016 Falkenberg 40/40 - 3,725
Carrying amount - 3,725
Change in participations in associated companies 2017/2018 2016/2017
At September 1 3,725 8,700
Impairment -3,725 -4,775
Divestments - -200
At August 31 - 3,725
NOTES

ANNUAL REPORT EOLUS VIND AB 2017/2018 73
NOTE 20 ACCOUNTS RECEIVABLE AND OTHER CURRENT RECEIVABLES
GROUP PARENT COMPANYAug 31, 2018 Aug 31, 2017 Aug 31, 2018 Aug 31, 2017
Accounts receivable 53,018 25,686 51,505 23,760
Other current receivables 37,023 44,493 13,299 18,723
Total 90,041 70,180 64,804 42,483
Other current receivables relate to: Aug 31, 2018 Aug 31, 2017 Aug 31, 2018 Aug 31, 2017
VAT receivables 12,689 2,464 11,682 2,430
Receivables from related parties - - - -
Blocked accounts - 19,632 - -
Other receivables 24,334 22,397 1,617 16,293
Total 37,023 44,493 13,299 18,723
The credit risk of accounts receivable that have not yet fallen due for payment or been impaired is considered low. Because customers represent various categories, such as municipalities, companies and private individuals, and due to the geographically dispersed nature of these, it is considered unlikely that all would experience financial difficulties at the same point in time. Eolus has historically low bad debt losses and performs a credit rating review of all new customers. Accounts receivables that have fallen due for payment but have not been impaired have undergone a thorough individual assessment and are not considered to carry a material risk of losses.
GROUP PARENT COMPANYCredit exposure Aug 31, 2018 Aug 31, 2017 Aug 31, 2018 Aug 31, 2017
Accounts receivable, not yet fallen due or impaired 9,386 6,811 9,152 5,405
Accounts receivable, past due but not impaired 43,632 18,845 42,353 18,355
Reserve for doubtful receivables - 30 - -
Total accounts receivables 53,018 25,686 51,505 23,760
At August 31, 2018, past due accounts receivable for which no reserve was considered necessary amounted to KSEK 43,632 (18,815).
The amount of KSEK 24,169 of past due accounts receivable was settled after the balance sheet date.
Age analysis of accounts receivable, past due but not impaired Aug 31, 2018 Aug 31, 2017 Aug 31, 2018 Aug 31, 2017
<30 days 24,169 3,302 24,169 3,302
30-90 days 840 2,754 643 2,552
91-180 days 195 208 - 6
>180 days 18,428 12,581 17,541 12,495
Total past due but not impaired accounts receivable 43,632 18,845 42,353 18,355
Age analysis of accounts receivable, past due and impaired Aug 31, 2018 Aug 31, 2017 Aug 31, 2018 Aug 31, 2017
>180 days - 30 - -
Total past due and impaired accounts receivable - 30 - -
Provisions for doubtful receivables correspond to 0% (0) of the total accounts receivable.
Provision for doubtful receivables Aug 31, 2018 Aug 31, 2017 Aug 31, 2018 Aug 31, 2017
Provision at beginning of year 30 - - -
Provision for doubtful receivables for the year - 30 - -
Written-off receivables -30 - - -
Amount at year-end - 30 - -
Provisions for the reversals of reserves for doubtful receivables are included in the item “other operating expenses” in profit or loss.
GROUP PARENT COMPANYRecognized amount for accounts receivable per currency Aug 31, 2018 Aug 31, 2017 Aug 31, 2018 Aug 31, 2017
SEK 15,098 13,133 13,585 11,207
EUR 37,920 12,553 37,920 12,553
Total KSEK 53,018 25,686 51,505 23,760
The ten largest customers represent 99% (83) of the Group’s total accounts receivable. A single customer accounts for 46% (57).
NOTES

74 ANNUAL REPORT EOLUS VIND AB 2017/2018
NOTE 21 ACCRUALS
GROUP PARENT COMPANYPrepaid expenses and accrued income Aug 31, 2018 Aug 31, 2017 Aug 31, 2018 Aug 31, 2017
Prepaid rental charges 321 148 321 148
Other prepaid expenses 3,313 3,237 1,414 2,303
Accrued income 2,339 4,455 410 2,079
Total 5,973 7,840 2,145 4,530
Accrued expenses and deferred income Aug 31, 2018 Aug 31, 2017 Aug 31, 2018 Aug 31, 2017
Accrued payroll expenses and personnel costs 9,047 6,341 8,065 6,294
Accrued expenses and deferred income pertaining to projects 45,044 23,624 45,044 23,624
Other accrued expenses 7,516 2,517 6,328 1,274
Total 61,606 32,483 59,437 31,192
NOTE 22 SHARE CAPITAL AND EARNINGS PER SHARE
Disclosure on number of shares Aug 31, 2018 Aug 31, 2017
Number of issued and fully paid shares
Class A shares (number of votes per share 1) quotient value SEK 1 1,285,625 1,285,625
Class B shares (number of votes per share 1/10) quotient value SEK 1 23,621,375 23,621,375
Number of issued and fully paid shares 24,907,000 24,907,000
The specification of changes in equity can be found in the consolidated statement of changes in equity. Reserves consist of exchange rate differences arising in connection with the translation of the financial statements of foreign subsidiaries.
The Parent Company has no potential common shares, which is why earnings per share are the same before and after dilution for the reported years.
GROUP
Earnings per share, before and after dilution 2017/2018 2016/2017
Earnings attributable to Parent Company shareholders 194,460 25,317
Weighted average number of outstanding common shares 24,907,000 24,907,000
Earnings per share, before and after dilution 7.81 1.02
NOTES

ANNUAL REPORT EOLUS VIND AB 2017/2018 75
NOTE 23 BORROWING
GROUP PARENT COMPANYNon-current borrowing from credit institutions Aug 31, 2018 Aug 31, 2017 Aug 31, 2018 Aug 31, 2017
Bank loans (variable interest rate) 81,780 12,740 75,000 -
Total non-current borrowing 81,780 12,740 75,000 -
Current borrowing
Bank loans (variable interest rate) 286,960 21,169 285,000 -
Total current liabilities 286,960 21,169 285,000 -
Total borrowing 368,740 33,909 360,000 -
For information on pledged assets for loans raised, refer to Note 28.
BANK LOANSThe Group’s and Parent Company’s exposure, on the basis of loans, to interest rate changes and contractual dates for renegotiations of interest rates are as follows:
GROUP PARENT COMPANYAug 31, 2018 Aug 31, 2017 Aug 31, 2018 Aug 31, 2017
6 months or less 368,740 33,909 360,000 -
Total 368,740 33,909 360,000 -
Borrowing per currency Aug 31, 2018 Aug 31, 2017 Aug 31, 2018 Aug 31, 2017
SEK 368,740 33,245 360,000 -
EUR 0 664 - -
Total 368,740 33,909 360,000 -
BANK OVERDRAFT FACILITIES
GROUP PARENT COMPANYAug 31, 2018 Aug 31, 2017 Aug 31, 2018 Aug 31, 2017
Amount granted 75,000 75,000 75,000 75,000
Unutilized credit is included in current borrowing and amounts to - - - -
NON-CURRENT LIABILITIESThe Group’s and Parent Company’s non-current liabilities. Maturity dates as presented below:
GROUP PARENT COMPANYAug 31, 2018 Aug 31, 2017 Aug 31, 2018 Aug 31, 2017
1-5 years 80,980 7,840 75,000 -
More than 5 years 800 4,900 - -
Total 81,780 12,740 75,000 -
Special undertakings, known as covenants, are in place for liabilities to credit institutions. If these undertaking are not fulfilled, the credit providers can withdraw the credit facilities. In the 2017/2018 fiscal year, all of the covenants were fulfilled.
NOTES

76 ANNUAL REPORT EOLUS VIND AB 2017/2018
NOTE 24 PROVISIONS
GROUP
After-treatment costs for disposal of wind turbines
Lease fees
Total
At September 1, 2017 3,421 368 3,789
Recognized in profit or loss
additional provisions, interest 115 - 115
reversed amounts pertaining to divested turbines -1,615 -182 -1,797
At August 31, 2018 1,921 186 2,107
After-treatment costs for disposal of wind turbines
Lease fees
Total
At September 1, 2016 6,718 881 7,599
Recognized in profit or loss
additional provisions, interest 146 - 146
reversed amounts pertaining to divested turbines -3,443 -513 -3,956
At August 31, 2017 3,421 368 3,789
COMMITMENTS REGARDING AFTER-TREATMENTAccording to the Swedish Environmental Code, financial guarantees must be provided as security for dismantling and after-treating the locations of wind turbines. The costs for dismantling and after-treatment are estimated for each facility with guidance from investigations carried out for particular turbines. The basis is a normal value of SEK 250 per megawatt (MW) of installed capacity for steel hubs. About SEK 100 per MW is added if the turbine is constructed using concrete. The amounts apply to the cost sce-nario at September 1, 2011. The residual value is handled as a deductible item in the disposal analysis and is taken into account in these standard amounts. The time factor is taken into account through discounting. The price trend can be assumed to be equal to the long-term inflation target of 2%, while a certain level of technological progress should
reduce the cost trend. Provisions are established at the present value of the calculated future cost. In accordance with IAS 37, point 60, provisions are continuously adjusted upward using the discount rate and this upward adjustment is recognized as a borrowing cost (interest expense). COMMITMENTS REGARDING FUTURE LEASINGThe provision pertains to the commitment to pay future leases for turbines that have been sold.
PARENT COMPANYThe Parent Company’s provisions at August 31, 2018 comprise KSEK 325 (1,081) in after-treatment costs and KSEK 186 (368) in lease fees, or a total of KSEK 511 (1,449).
NOTE 25 FINANCIAL INSTRUMENTS – DISCLOSURE ON FAIR VALUE PER CATEGORY
GROUP
Aug 31, 2018 Carrying amount Fair value Level
Assets in the balance sheet
Loan receivables and accounts receivable
Cash and cash equivalents 739,825 739,825 2
Accounts receivable 53,018 53,018 2
Other current receivables 25 25 2
Blocked bank balances 5,000 5,000 2
Other financial assets 20,953 20,953 2
Accrued interest income 388 388 2
Liabilities in the balance sheet
Liabilities measured at fair value through profit or loss
Derivate liabilities
Currency futures 814 814 2
Interest rate swaps 11,833 11,833 2
Liabilities measured at amortized cost
Interest-bearing liabilities 368,740 368,740 2
Accounts payable 140,806 140,806 2
Accrued interest expense 849 849 2
NOTES

ANNUAL REPORT EOLUS VIND AB 2017/2018 77
DERIVATIVE INSTRUMENTSEolus does not apply hedge accounting. Derivative instruments for manag-ing currency and interest rate risk are recognized as current assets or current liabilities and classified as held for trading. Changes in the value of currency derivatives are recognized in profit or loss as other operating income or other operating expenses. Changes in the value of interest- rate derivatives are recognized in net financial items.
DESCRIPTION OF FAIR VALUEInterest-bearing liabilitiesThe fair value of interest-bearing liabilities is calculated by discounting future cash flows of capital amounts and interest discounted to the current market interest rate.
DerivativesCurrency futures are measured at fair value by discounting the difference between the contracted forward rate and the forward rate and can be agreed on the balance sheet date for the remaining contract period. The fair value of interest rate swaps is based on a discounting of expected future cash flows according to the contracts’ terms and conditions and due dates, using the market interest rate as the baseline.
Other financial assets and liabilitiesFor accounts receivable, other receivables/liabilities, accrued income and expenses and accounts payable with a remaining term of less than six months, the carrying amount is considered to reflect the fair value.
Aug 31, 2017 Carrying amount Fair value Level
Assets in the balance sheet
Loan receivables and accounts receivable
Cash and cash equivalents 201,509 201,509 2
Accounts receivable 25,686 25,686 2
Other current receivables 1,157 1,157 2
Blocked bank balances 24,632 24,632 2
Other financial assets 25,517 25,517 2
Accrued interest income 328 328 2
Liabilities in the balance sheet
Liabilities measured at fair value through profit or loss
Derivate liabilities
Currency futures 154 154 2
Currency swaps 309 309 2
Interest rate swaps 14,634 14,634 2
Liabilities measured at amortized cost
Interest-bearing liabilities 33,909 33,909 2
Accounts payable 28,276 28,276 2
Accrued interest expense 29 29 2
NOTE 26 RECONCILIATION BETWEEN PROFIT BEFORE TAX AND NET CASH FLOW
GROUP PARENT COMPANYNon-cash items 2017/2018 2016/2017 2017/2018 2016/2017
Depreciation and impairment of property, plant and equipment 14,765 23,423 -1,896 2,118
Unrealized exchange rate differences 2,195 -148 2,195 4,346
Capital gains from divestment of non-current assets -231 -319 9,871 3,693
Changes in provisions -1,682 -3,833 -936 -904
Measurement of derivatives at fair value 351 4,592 - -
Other - - - 607
Total 15,399 23,715 9,234 9,860
NOTES

78 ANNUAL REPORT EOLUS VIND AB 2017/2018
NOTE 28 PLEDGED ASSETS AND CONTINGENT LIABILITIES
GROUP PARENT COMPANYPledged assets for liabilities to credit institutions 2017/2018 2016/2017 2017/2018 2016/2017
Chattel mortgages 603,000 603,000 580,000 580,000
Wind turbines and leases used as collateral 15,288 50,707 - -
Blocked bank balances - 19,632 - -
Shares in associated companies 34 34 - -
Total 618,322 673,373 580,000 580,000
CONTINGENT LIABILITIESThe Group has contingent liabilities pertaining to legal claims that have arisen in the normal business operations. No significant provisions, other than those that have been made (Note 24), are expected to arise on the basis of these.
PARENT COMPANYContingent liabilities 2017/2018 2016/2017
Contingent liabilities for the benefit of subsidiaries 5,000 69,885
Total 5,000 69,885
NOTE 27 CHANGES IN LIABILITIES ATTRIBUTABLE TO FINANCING ACTIVITIES
Loan liabil-ities falling due within
1 year
Loan liabil-ities falling
due after 1 year
Other liabilities
Total
At September 1, 2017 -21,169 -12,740 -797 -34,706
Cash flow -265,752 -69,040 599 -334,193
Exchange rate differences -39 - -66 -105
At August 31, 2018 -286,960 -81,780 -264 -369,004
Loan liabil-ities falling due within
1 year
Loan liabil-ities falling
due after 1 year
Other liabilities
Total net liability
At September 1, 2016 -31,558 -50,216 -854 -82,628
Cash flow 10,389 37,476 - 47,865
Exchange rate differences - - 57 57
At August 31, 2017 -21,169 -12,740 -797 -34,706
NOTES

ANNUAL REPORT EOLUS VIND AB 2017/2018 79
NOTE 29 RELATED-PARTY TRANSACTIONS
OWNER STRUCTURE AT AUGUST 31, 2018
Largest shareholdersNo. of
Class A shares No. of
Class B shares Share of
equity (%)Share of votes
(%)
Domneåns Kraftaktiebolag 357,900 2,012,869 9.5 15.3
Hans-Göran Stennert, directly and through endowment insurance 380,100 518,984 3.6 11.8
Åke Johansson 194,720 567,200 3.1 6.9
Hans Johansson and Borgunda bygghandel, through companies 169,520 58,506 0.9 4.8
Försäkringsaktiebolaget Avanza Pension - 1,491,679 6.0 4.1
Johan Markensten - 808,080 3.2 2.2
Nordnet Pensionsförsäkring AB 500 659,675 2.7 1.8
Ingvar Svantesson 43,750 200,175 1.0 1.8
M A C O Business Development AB - 490,471 2.0 1.3
Swedbank Försäkring - 487,967 2.0 1.3
Other shareholders 139,135 16,325,769 66.0 48.7
Total 1,285,625 23,621,375 100.0 100.0
No Board members or other senior executives had any direct or indirect share transactions with the Group in 2017/2018 or 2016/2017, other than the remuneration stated in Note 6.
PARENT COMPANY’S TRANSACTIONS WITH OTHER GROUP COMPANIES0.0% (0.0) of the Parent Company’s sales pertain to intra-Group invoicing. The Parent Company’s operating expenses include intra-Group purchases at only insignificant amounts. The same pricing policies apply to both purchases and sales between Group companies as to transactions with external parties.
In September, Eolus acquired the wholly owned subsidiary Eolus North America, Inc, a solar and battery storage project in western US with a capacity of 500 MW and 250 MW, respectively. The project is in an early stage of development and is on the waiting list for a grid connection to deliver electricity to California.
In September, Eolus signed an agreement with Siemens Gamesa for the delivery of seven wind turbines of the SWT-DD-130 model with a capacity of 4.3 MW, each to the Norwegian Stigafjellet project, located in Bjerkreim south of Stavanger. These wind farms will be deployed in the second half of 2020 and are subject to a sale agreement with ewz.
In September, Eolus signed a credit agreement with Swedbank comprising liquidity and construction loans totaling SEK 1,050 M. The four-year agree-
ment ensures financing for Eolus’s expansion in this forthcoming period in terms of both financing ongoing and future establishments for which Eolus provides the financing during the construction phase, and ensuring high liquidity for the operating activities.
In October, Eolus signed agreement with KGAL to divest the Bäckhammar wind farm in Sweden with an installed capacity of 130 MW for a preliminary purchase price of EUR 131 M. At the same time, Eolus placed an order for wind turbines from Vestas. Bäckhammar will comprise 22 Vestas V136-4.2 MW and nine Vestas V150-4.2 MW. Eolus will construct the wind farm and KGAL will provide financing during construction. Bäckhammar is scheduled to be completed in August 2020 and Eolus was commissioned to deliver asset management services for the facility.
NOTE 30 SIGNIFICANT EVENTS AFTER THE END OF THE REPORTING PERIOD
NOTES

80 ANNUAL REPORT EOLUS VIND AB 2017/2018
The undersigned affirm that these consolidated financial statements and this Annual Report have been prepared in accordance with International Financial Reporting Standards (IFRS) as adopted by the EU and generally accepted accounting principles, and provide a true and fair view of the Group’s and the Parent Company’s financial position and earnings,
and that the Directors’ Report provides a fair review of the Group’s and Parent Company’s operations, financial position and earnings and describes the material risks and
uncertainty factors faced by the companies included in the Group.
Hässleholm, November 28, 2018
Hans-Göran Stennert
Chairman
Hans Linnarson
Board member
Fredrik Daveby
Board member
Hans Johansson
Board member
Sigrun Hjelmquist
Board member
Bodil Rosvall Jönsson
Board member
Per Witalisson
CEO
Our auditor’s report was submitted on November 28, 2018.
PricewaterhouseCoopers AB
SIGNATURES
Eva Carlsvi
Authorized Public Accountant

ANNUAL REPORT EOLUS VIND AB 2017/2018 81
AUDITOR’S REPORT
AUDITOR’S REPORTTo the general meeting of the shareholders of Eolus Vind AB (publ), corporate identity number 556389-3956
REPORT ON THE ANNUAL ACCOUNTS AND CONSOLIDATED ACCOUNTS
OpinionsWe have audited the annual accounts and consolidated accounts of Eolus Vind AB (publ) for the year 1st September 2017 to 31 August 2018, excluding the corporate governance report on pages 37-39. The annual accounts and consolidated accounts of the company are included on pages 32-80 in this document. In our opinion, the annual accounts have been prepared in accordance with the Annual Accounts Act and present fairly, in all material respects, the financial position of the parent company as of 31 August 2018 and its financial performance and cash flow for the year then ended in accordance with the Annual Accounts Act. The consolidated accounts have been prepared in accordance with the Annual Accounts Act and present fairly, in all material respects, the financial position of the group as of 31 August 2018 and their financial performance and cash flow for the year then ended in accordance with International Financial Reporting Standards (IFRS), as adopted by the EU, and the Annual Accounts Act. Our opinion does not include the corporate governance report on pages 37-39. The statutory administration report is consistent with the other parts of the annual accounts and consolidated accounts. We therefore recommend that the general meeting of shareholders adopts the income statement and balance sheet for the parent company and the group. Our opinions in this report on the annual accounts and consolidated accounts are consistent with the content of the supplementary report that has been submitted to the Parent Company’s Audit Committee in accordance with Article 11 of the Auditors Ordinance (537/2014).
Basis for OpinionsWe conducted our audit in accordance with International Standards on Auditing (ISA) and generally accepted auditing standards in Sweden. Our responsibilities under those standards are further described in the Auditor’s Responsibilities section. We are independent of the parent com-pany and the group in accordance with professional ethics for accountants in Sweden and have otherwise fulfilled our ethical responsibilities in accor-dance with these requirements. This means that, based on our best know-ledge and belief, no prohibited services referred to in Article 5.1 of the Auditors Ordinance (537/2014) have been provided to the audited compa-ny or, as the case may be, its parent company or its controlled company
within the EU. We believe that the audit evidence we have obtained is sufficient and appropriate to provide a basis for our opinions.
Our audit approachAudit focus and scopeWe designed our audit by determining materiality and assessing the risks of material misstatement in the consolidated financial statements. In parti-cular, we considered where management made subjective judgements; for example, in respect of significant accounting estimates that involved making assumptions and considering future events that are inherently un-certain. As in all of our audits, we also addressed the risk of management override of internal controls, including among other matters consideration of whether there was evidence of bias that represented a risk of material misstatement due to fraud. We tailored the scope of our audit in order to perform sufficient work to enable us to provide an opinion on the consolidated financial statements as a whole, taking into account the structure of the Group, the accounting processes and controls, and the industry in which the group operates.
MaterialityThe scope of our audit was influenced by our application of materiality. An audit is designed to obtain reasonable assurance whether the financial statements are free from material misstatement. Misstatements may arise due to fraud or error. They are considered material if individually or in aggregate, they could reasonably be expected to influence the economic decisions of users taken on the basis of the financial statements. Based on our professional judgement, we determined certain quantita-tive thresholds for materiality, including the overall materiality for the financi-al statements as a whole. These, together with qualitative considerations, helped us to determine the scope of our audit and the nature, timing and extent of our audit procedures and to evaluate the effect of misstatements, both individually and in aggregate on the financial statements as a whole.
Key audit mattersKey audit matters of the audit are those matters that, in our professional judgment, were of most significance in our audit of the annual accounts and consolidated accounts of the current period. These matters were addressed in the context of our audit of, and in forming our opinion there-on, the annual accounts and consolidated accounts as a whole, but we do not provide a separate opinion on these matters.
KEY AUDIT MATTER
Revenue recognition – sale of wind farms
Eolus Vind has a business plan and strategy which implies the construction and sale of wind farms, either directly or via companies.
During the financial year, Eolus sold the projects Vilseberga, Jenåsen and the project rights to Kråktorpet. Each separate transaction is individually produced and the contracts contain specific terms and conditions which, amongst other things, stipulate the payment model to apply and which also stipulate the respective parties’ commitments and requirements for completion of the contract within the determined time period.
The business approach and associated contract comprises a complex area where various interpretations of the executed transaction and the associated contract terms can have a significant impact on the company’s accounting and revenue recognition.
HOW OUR AUDIT ADDRESSED THE KEY AUDIT MATTER
Each separate contract for the sale of a wind farm, either directly or via a company, is individually produced and contains various regulations and clauses. In our audit we have:
• Audited the company’s calculation of capital gains by reconciling the calculation against the sales contracts
• Audited the company’s bookkeeping regarding sales at company level
• Audited the company’s bookkeeping regarding sales at Group level
• Examined to determine if the classification of capital gains has been handled correctly in accordance with the company’s accounting principles.
In performing our audit, we have noted no significant deviations.

82 ANNUAL REPORT EOLUS VIND AB 2017/2018
AUDITOR’S REPORT
KEY AUDIT MATTER
Impairment testing of wind farms in operation
Refer to Note 1 page 56 of the annual financial statements “Assessments, estimates and assumptions”, and Note 13 page 66 “Tangible fixed assets”.
The reported value of the commissioned wind farms amounted, as at 31 August 2018, to MSEK 32. The market prices of electricity and electrici-ty certificates have been low for a couple of years, but has increased during 2017/2018. Low prices are indications of factors which can impact the valuation of the wind farms. Due to this, the company has performed write-downs amounting to MSEK 6. The company undertakes write- down tests on an on-going basis to ensure the correctness of the value of the assets. The company has not identified any further impairment requirements.
Certain of the assumptions and assessments made by management in conjunction with the impairment testing regarding future cash flows and circumstances are complex and have a major impact on the calculation of the value in use. This applies, in particular, to the assessment of the future price levels of electricity and of electricity certificates and of the discount rate, where limited deviations result in a major impact on the calculation of the value in use.
HOW OUR AUDIT ADDRESSED THE KEY AUDIT MATTER
We have studied company management’s impairment tests. These calcula-tions contain the company’s assessments regarding future cash flows and the choice of discount rates. The assumption on future price developments as regards electricity and electricity certificates has been based on price forecasts estimated by external expertise.
In performing our audit we have obtained an understanding of the manner in which macro economic developments impact Eolus Vind, and how the Board of Directors and company management work to compile information to serve as the basis of their decision making. The impairment tests have been examined through our:
• Assessment of the correctness of the calculation models
• Checking of the calculation and assessment of the applied WACC
• Comparison of input data regarding planned production against externaldata and we have undertaken a reasonability assessment comparingsuch data with data regarding historical production.
• Comparison of input data regarding estimated operating costs and otherdata against the company’s forecasts and we have undertaken a reaso-nability assessment comparing such data with historical information.
• Executed sensitivity analyses regarding, amongst other things, changesin price developments and the discount rate.
In performing our audit, we have noted no significant deviations.
Valuation of projects in progress
Eolus Vind reports projects in progress in its balance sheet associated with the design of wind farms. The projects are realized when Eolus Vind sells the project as a construction-ready project or when the wind farm is already constructed and is either sold to a client or moved to the inventory. A project can also be realized through the sale of project rights.
The reported value of projects in progress amounted at 31 August 2018 to MSEK 575.
This balance sheet item is significant in its size and with the current electri-city prices and prices of electricity certificates, the valuation of projects in progress is a focus area in our audit.
Each project is valued individually and the company considers the realiza-tion potential of the project in the long and short term. The value of a project which is not seen to be realizable is written down immediately. This takes place, for example, when a project is rejected in the working permit process.
We have studied company management’s assessments and have challeng-ed them as regarding these assessments.
In performing our audit, we have obtained an understanding of the manner in which macro economic developments impact Eolus Vind and how the Board of Directors and company management work to compile information to serve as the basis of their decision making. Projects in progress have been audited on the basis of our:
• detailed testing to determine that the costs referring to the projectsactually refer to relevant project costs
• studied the company’s assessment of the realization of projects in theshort and long term
• assessed the inherent parameters, such as the time plans and budgets,in the projects for which a contract has already been signed with a client
• discussed and assessed projects included in the business plan andbudget with management and followed up the outcome against lastyear’s business plan and budget
• performed random sample testing for the remaining projects includedin the project portfolio and obtained comments from project managersregarding the status and assessed value of the projects.
In performing our audit, we have noted no significant deviations.
Other Information than the annual accounts and consolidated accountsThis document also contains other information than the annual accounts and consolidated accounts and is found on pages 1-31 and 84-87. The Board of Directors and the Managing Director are responsible for this other information.
Our opinion on the annual accounts and consolidated accounts does not cover this other information and we do not express any form of assurance conclusion regarding this other information.
In connection with our audit of the annual accounts and consolidated accounts, our responsibility is to read the information identified above and consider whether the information is materially inconsistent with the annual accounts and consolidated accounts. In this procedure we also take into account our knowledge otherwise obtained in the audit and assess whether the information otherwise appears to be materially misstated.
If we, based on the work performed concerning this information, conclude that there is a material misstatement of this other information, we are required to report that fact. We have nothing to report in this regard.
Responsibilities of the Board of Directors and the Managing DirectorThe Board of Directors and the Managing Director are responsible for the preparation of the annual accounts and consolidated accounts and that they give a fair presentation in accordance with the Annual Accounts Act and, concerning the consolidated accounts, in accordance with IFRS as adopted by the EU. The Board of Directors and the Managing Director are also responsible for such internal control as they determine is necessary to enable the preparation of annual accounts and consolidated accounts that are free from material misstatement, whether due to fraud or error.

ANNUAL REPORT EOLUS VIND AB 2017/2018 83
AUDITOR’S REPORT
In preparing the annual accounts and consolidated accounts, The Board of Directors and the Managing Director are responsible for the assessment of the company’s and the group’s ability to continue as a going concern. They disclose, as applicable, matters related to going concern and using the going concern basis of accounting. The going concern basis of ac-counting is however not applied if the Board of Directors and the Managing Director intends to liquidate the company, to cease operations, or has no realistic alternative but to do so. The Board’s Audit Committee shall, without affecting the other tasks and responsibilities of the Board, monitor the company’s financial reporting, among other things.
Auditor’s responsibilityOur objectives are to obtain reasonable assurance about whether the annual accounts and consolidated accounts as a whole are free from mate-rial misstatement, whether due to fraud or error, and to issue an auditor’s report that includes our opinions. Reasonable assurance is a high level of assurance, but is not a guarantee that an audit conducted in accordance with ISAs and generally accepted auditing standards in Sweden will always detect a material misstatement when it exists. Misstatements can arise from fraud or error and are considered material if, individually or in the aggregate, they could reasonably be expected to influence the economic decisions of users taken on the basis of these annual accounts and consolidated accounts. A further description of our responsibility for the audit of the annual accounts and consolidated accounts is available on Revisorsinspektionen’s website: www.revisorsinspektionen.se/revisornsansvar. This description is part of the auditor´s report.
REPORT ON OTHER LEGAL AND REGULATORY REQUIREMENTS
OpinionsIn addition to our audit of the annual accounts and consolidated accounts, we have also audited the administration of the Board of Directors and the Managing Director of Eolus Vind AB (publ) for the year 1 September 2017 to 31 August 2018 and the proposed appropriations of the company’s profit or loss. We recommend to the general meeting of shareholders that the profit be appropriated in accordance with the proposal in the statutory adminis-tration report and that the members of the Board of Directors and the Managing Director be discharged from liability for the financial year.
Basis for OpinionsWe conducted the audit in accordance with generally accepted auditing standards in Sweden. Our responsibilities under those standards are further described in the Auditor’s Responsibilities section. We are independent of the parent company and the group in accordance with professional ethics for accountants in Sweden and have otherwise fulfilled our ethical responsi-bilities in accordance with these requirements. We believe that the audit evidence we have obtained is sufficient and appropriate to provide a basis for our opinions.
Responsibilities of the Board of Directors and the Managing DirectorThe Board of Directors is responsible for the proposal for appropriations of the company’s profit or loss. At the proposal of a dividend, this includes an assessment of whether the dividend is justifiable considering the require-ments which the company’s and the group’s type of operations, size and risks place on the size of the parent company’s and the group’s equity, consolidation requirements, liquidity and position in general. The Board of Directors is responsible for the company’s organization and the administration of the company’s affairs. This includes among other things continuous assessment of the company’s and the group’s financial situation and ensuring that the company’s organization is designed so that the accounting, management of assets and the company’s financial
affairs otherwise are controlled in a reassuring manner. The Managing Director shall manage the ongoing administration according to the Board of Directors’ guidelines and instructions and among other matters take measures that are necessary to fulfil the company’s accounting in accor-dance with law and handle the management of assets in a reassuring manner.
Auditor’s responsibilityOur objective concerning the audit of the administration, and thereby our opinion about discharge from liability, is to obtain audit evidence to assess with a reasonable degree of assurance whether any member of the Board of Directors or the Managing Director in any material respect:
• has undertaken any action or been guilty of any omission which can give rise to liability to the company, or
• in any other way has acted in contravention of the Companies Act, the Annual Accounts Act or the Articles of Association.
Our objective concerning the audit of the proposed appropriations of the company’s profit or loss, and thereby our opinion about this, is to assess with reasonable degree of assurance whether the proposal is in accordance with the Companies Act. Reasonable assurance is a high level of assurance, but is not a guarantee that an audit conducted in accordance with generally accepted auditing standards in Sweden will always detect actions or omissions that can give rise to liability to the company, or that the proposed appropri-ations of the company’s profit or loss are not in accordance with the Companies Act. A further description of our responsibility for the audit of the adminis-tration is available on Revisorsinspektionen’s website: www.revisorsinspek-tionen.se/revisornsansvar. This description is part of the auditor’s report.
Audit of the corporate governance reportThe Board of Directors is responsible for the corporate governance report on pages 37-39 and for ensuring that it is prepared in accordance with the Annual Accounts Act. Our examination of the corporate governance statement is conducted in accordance with FAR’s auditing standard RevU 16 The auditor’s exami-nation of the corporate governance statement. This means that our exami-nation of the corporate governance statement is different and substantially less in scope than an audit conducted in accordance with International Standards on Auditing and generally accepted auditing standards in Sweden. We believe that the examination has provided us with sufficient basis for our opinions. A corporate governance report has been prepared. Disclosure in ac-cordance with Chapter 6. § 6 subparagraphs 2-6 of the Annual Accounts Act and Chapter 7. § 31, second paragraph of the same Act are consistent with the annual accounts and consolidated accounts and are in accordan-ce with the Annual Accounts Act. PricewaterhouseCoopers AB was appointed Eolus Vind AB (publ)’s auditor at the Annual General Meeting on 28 January 2017, and has been the company’s auditor since 24 January 2015.
Hässleholm, 28 November 2018PricewaterhouseCoopers AB
Eva CarlsviAuthorised Public Accountant

84 ANNUAL REPORT EOLUS VIND AB 2017/2018
BOARD OF DIRECTORS
HANS-GÖRAN STENNERT CHAIRMAN OF THE BOARD
FREDRIK DAVEBY BOARD MEMBER
SIGRUN HJELMQUIST BOARD MEMBER
HANS JOHANSSON BOARD MEMBER
Born: 1954Elected: 2008, Chairman since 2009.Education and background: Holds a Master of Business Administration degree and has extensive experience from positions and assign-ments in the IKEA Group, including Board member of the IKEA Group’s holding company INGKA Holding BV in 1993-2007. He served as Chairman of the Board for the last nine years of this period.
Other assignments: Chairman of the Board of Entreprenörinvest Sverige AB. Board member of Cuptronic Technology AB and Winplantan AB.Shareholding in Eolus: 380,100 Class A shares, of which 378,000 Class A shares are held through endowment insurance, and 518,984 Class B shares, of which 516,984 Class B shares are held through endowment insurance.
Born: 1962Elected: 2009Education and background: Agriculturalist. President of Swedish Automobile Association since 2014. President of Länsförsäkring Kronoberg 2002-2014. Many Board assign-ments in the Länsförsäkringar Alliance, including Board member of Länsförsäkringar AB 2010-2014. Head of Members at Södra Skogsägarna 1997-2002 and previously held positions at the
Swedish Government Offices and the Federation of Swedish Farmers.Other assignments: President of Swedish Automobile Association.Shareholding in Eolus: 10,000 Class B shares
Born: 1956Elected: 2011Education and background: Master of Science in Engineering and Licentiate of Engi-neering in Applied Physics degrees from the Royal Swedish Institute of Technology. Executive Partner, Facesso AB. Active in the Ericsson Group 1979-2000, most recently as President of Ericsson Components AB. Investment Manager at BrainHeart Capital 2000-2005.
Other assignments: Chairman of the Board of Facesso AB. Board member of Addnode Group AB (publ), Edgeware AB (publ), Ragn-Sells- företagen AB, Transcendent Group AB and IGOT AB.Shareholding in Eolus: 1,000 Class B shares
Born: 1965Elected: 2016Education and background: Extensive experi-ence in the Swedish building materials trade through duties at the purchasing firm Woody Bygghandel AB which has 50 member compa-nies, and in operations at the family firm Borgunda Bygghandel where he is the CEO.
Other assignments: CEO and Chairman of Borgunda Bygghandel AB and CEO or Board member in the associated subsidiaries. Chair-man of the Boards of Borgunda Tributo AB and Borgunda Uterque AB. Member of the Boards of Woody Bygghandel AB and Borgunda Gård AB. Partner of Borgunda Fastighet Handelsbolag.Shareholding in Eolus: 169,520 Class A shares and 58,455 Class B shares.
BOARD OF DIRECTORS

ANNUAL REPORT EOLUS VIND AB 2017/2018 85
OTHER DISCLOSURES REGARDING THE BOARD OF DIRECTORS AND SENIOR EXECUTIVES The assignments of Board members and senior executives described above pertain to assignments outside the Eolus Group and do not include assignments as deputy Board members. Reported shareholdings comprise both direct, indirect and related parties’ share-holdings in accordance with the shareholder register maintained by Euroclear on August 31, 2018 and thereafter with any changes known by Eolus. Members of the Board were elected at the Annual General Meeting on January 27, 2018 for the period until the 2019 Annual General Meeting.
No separate agreements with major share-holders, customers, suppliers or other parties exist under which Board members or senior executives have been elected or appointed. No agreements exist with Eolus or any of its subsidiaries concerning benefits after the completion of each assignment. There are no close family ties between the company’s Board members and senior executives. Nor do any conflicts of interest exist, whereby the private interests of Board members and senior executives could conflict with those of Eolus. All Board members and senior executives can be reached by contacting Eolus’s head office.
HANS LINNARSON BOARD MEMBER
BODIL ROSVALL JÖNSSON BOARD MEMBER
Born: 1952Elected: 2017Education and background: Electronics engineer and B.A. Experience from a number of different assignments as CEO of Swedish international industrial companies for more than 30 years, such as Enertec Component AB, CTC AB, Asko Cylinda AB. Leading positions within the Electrolux Group and CEO of Husqvarna AB.
Other assignments: Chairman of the Board of Nibe Industrier AB, Hörberg Petersson Tronic AB, LWW Group AB and Scandbio AB. Board member of Inission AB, Nordiska Plast AB, Plastinject Aktiebolag and Zinkteknik i Bredaryd Aktiebolag.Shareholding in Eolus: 2,500 Class B shares
Born: 1970Elected: 2017Education and background: Master of Busi-ness Administration from the Faculty of Econom-ics and Business Administration, Lund Universi-ty. Senior Advisor at Hypergene and Navet and member of office Board at Handelsbanken Malmö-Triangeln. Former CEO of the Business Region Skåne and Enterprise Manager at Skåne
County Council 2013-2016, CEO of Minc 2006-2013 as well as positions within E.On 1996-2006.Other assignments: CEO and Board member of BRJ Management AB.Shareholding in Eolus: 4,000 Class B shares
BOARD OF DIRECTORS

86 ANNUAL REPORT EOLUS VIND AB 2017/2018
Electricity certificates A technology-neutral system for promoting the expansion of renew-able electricity generation. Producers of renewable electricity receive a certificate for each MWh (megawatt hour) generated, which is then sold to quota obligation electricity consumers.
Electricity Price Area Geographical divisions to highlight areas that require transmission and generation capacity to be expanded to better meet consumption in the area in question.
Renewable energy Renewable energy originates from sources that are continuously replenished at a rapid pace, such as wind, water, solar and biomass. Nuclear power is not considered a renewable energy form since it is based on finite resources.
Operational turbines Turbines that have undergone final commissioning and are generating electricity.
Installed capacity For wind power, capacity is measured in MW and states the perfor-mance of the wind turbine according to design data.
Intermittent energy source A method of generating power where the level of power generated varies over time depending on external factors. For wind power, this means how much and when the wind blows, and for photovoltaics, how much sunlight the cells receive depending on the time of day and weather.
Hub height The height of the hub plus the nacelle.
Nord Pool The Nordic Power Exchange.
Normal year The definition of an average year of a generated amount of electricity. Determined based on long-term calculations from the Swedish Meteorological and Hydrological Institute (SMHI).
Offshore Wind power constructed in bodies of water.
Swept area The area of the circle swept by the rotor blades. A turbine with a rotor diameter of 126 meters will have a swept area of more than 12,500 square meters, nearly the same area as two soccer fields.
Availability A measurement for the amount of total time that a wind turbine has been available to generate electricity.
Total height Height of a wind turbine when one of the blades is at its highest point.
Constructed turbines Turbines that have been constructed, undergone final commis-sioning and been taken over from the turbine supplier. The turbine is either transferred to the customer as a turnkey facility or is trans-ferred to Eolus’s inventories.
Volatility A measurement of the price varia-tion of a product (for example, electricity) over a period of time.
Transmission capacity The amount of electricity that can be transmitted between different areas via the electricity grid.
Units The unit of measurement for energy is kilowatt hours. 1 MWh = 1,000 kWh 1 GWh = 1,000,000 kWh 1 TWh = 1,000,000,000 kWh
The unit of measurement for capacity is watts. 1 MW = 1,000,000 W 1 GW = 1,000,000,000 W
GLOSSARY
A normal Swedish house uses about 5,000 kWh of electricity per year. This means that:
A wind turbine that produces 10 GWh (10,000,000 kWh) supplies 2,000 houses with electricity per year.
1 MWh is sufficient for 0.2 houses
1 GWh is sufficient for 200 houses
1 TWh is sufficient for 200,000 houses
GLOSSARY
x 2,000

ANNUAL REPORT EOLUS VIND AB 2017/2018 87
The Annual General Meeting will be held at Hässleholms Kulturhus on Saturday, January 26, 2019 at 3:00 p.m. In conjunction with the Annual General Meeting, Eolus will hold its traditional wind power seminar.
Anyone wishing to participate in the Annual General Meeting must:• be registered as a shareholder in the shareholder
register maintained by Euroclear Sweden AB on January 21, 2019.
• have notified the company of their attendance by not later than January 21, 2019 at 4:00 p.m. When notifying the company, name, personal identity number or corporate registration number, telephone number, address, shareholding and, where applicable, any details concerning proxies and advisors must be included.
• To be eligible to participate in the Annual General Meeting, shareholders whose shares are regis-tered in the name of a trustee must also request that their shares be temporarily re-registered in their own names in the shareholder register main-tained by Euroclear Sweden AB. Shareholders must inform the trustee thereof well in advance of January 21, 2019, which is the date on which such registration must be completed to ensure their inclusion in the shareholder register printed by Euroclear Sweden AB on the date specified.
DEFINITION OF ALTERNATIVE PERFORMANCE MEASURES
Return on equity after tax Rolling 12-month earnings relative to average equity.
Return on capital employed Profit after financial items plus interest expense ex-pressed as a percentage of average capital employed.
Equity per share before/after dilution Equity divided by the number of shares at the end of the period before/after dilution.
Net liability/cash Interest-bearing liabilities minus cash and cash equivalents.
Earnings per share before/after dilution Net profit for the period divided by the weighted average number of shares during the year before/after dilution.
Operating margin Operating profit ex-pressed as a percentage of net sales.
Equity/assets ratio Equity relative to total assets at the end of the period.
Capital employed Total assets minus non-interest-bearing liabilities.
Change in fair value of financial derivatives Relates to the change in fair value of financial instruments, which is calculated using methods and based on observable in-put data for the asset or liability, either directly (prices) or indirectly (derived from prices).
Profit margin Profit/loss after financial items expressed as a percentage of net sales.
This section contains definitions of certain financial non-IFRS measures compared with the closest comparable financial IFRS mea-sure. Financial non-IFRS measures have lim-itations as analytical tools and should not be considered in isolation or as a replacement for financial measures produced in conformity
with IFRS. Financial non-IFRS measures are reported to enhance investors’ assessment of the company’s operational result, to provide assistance when forecasting future periods and to simplify comparisons of earnings be-tween periods. The management uses these non-IFRS measures to, for example, evaluate
operating activities compared with earlier re-sults, for internal planning and for forecasts. The financial non-IFRS measures presented in this report may differ from similar measures used by other companies.
Interim report Q1, January 24, 2018Annual General Meeting January 26, 2018Interim report Q2, April 25, 2019Interim report Q3, July 4, 2019Year-end report 2018/2019 October 23, 2019
ANNUAL GENERAL MEETING
FINANCIAL CALENDAR
Eolus Vind AB (“Eolus”) is a public company with Corporate Registration Number 556389-3956. The company is based in Hässleholm, Sweden. This Annual Report has been published in Swedish and English. The Swedish Annual Report is the official version. The Annual Report consists of the Directors’ Report (pages 32-36), the Corporate Governance Report (pages 37-39) and the financial statements (pages 40-83).
All monetary values are expressed in Swedish kronor (SEK), unless otherwise stated. The value in Swedish kronor is abbreviated SEK, thousand kronor (KSEK) and million kronor (SEK M). Figures in brackets refer to the preceding fiscal year, 2016/2017.
Cover photo: The Jenåsen Wind Farm. Photos: Daniel Larsson, Johan Funke, Fotograf Cecilia, Barman Consulting AB and Eolus. Layout: Mustasch Reklambyrå AB. Printed by: Norra Skåne Offset. Translation: The Bugli Company.
ANNUAL GENERAL MEETING, FINANCIAL CALENDAR, DEFINITION OF ALTERNATIVE PERFORMANCE MEASURES

EO
LU
S V
IND
AB
AN
NU
AL
RE
PO
RT
20
17
/20
18
ANNUAL REPORT
2017/2018
Eolus Vind is a leading Nordic wind power developer. Eolus creates value at every level of project develop-ment, establishment and operation of renewable energy facilities. We offer attractive and competitive investment opportunities in the Nordic region, Baltic countries and the US to both local and international investors.
Since the company’s inception in 1990, Eolus has been involved in the construction of more than 540 wind turbines with a capacity of nearly 930 MW. The Eolus Group currently has customer contracts for asset management services with an installed capacity of more than 400 MW. Eolus Vind AB has approximately 8,200 shareholders. Eolus’s Class B share is traded on Nasdaq Stockholm, Small Cap.
Eolus Vind ABBox 95, SE-281 21 Hässleholm, Sweden
Street address:Tredje Avenyen 3
Tel: +46 (0)10-199 88 00 E-mail: [email protected]