Embed Size (px)
Citation preview

AnnuAl RepoRt 2016


Malwatte Valley Plantations PLC | Annual Report 2016 1
VisionOur vision is to become the model plantation company in the worldthrough innovation, diversification and high quality standards
Mission Malwatte Valley Plantations PLC is committed to achieved excellence and the highest quality standards in every sphere of activity by optimising productivity and developing its employees. We will become an increasingly profitable, stable and growth oriented model private plantation sector securing an acceptable return on investment through its core business as well as by diversification into other sectors, whilst affording the highest priority for environmental and social needs

Malwatte Valley Plantations PLC | Annual Report 20162
CoRpoRAte infoRMAtion
Name of the companyMalwatte Valley Plantations PLC(PQ 111)
Date of incorporation22nd June 1992
Board of DirectorsMr. Frits Bogtstra MBA, BSc (Hon) (UK) - Chairman Mr. Lucas Bogtstra - Managing DirectorMr. T. R. GerlachMr. S. N Dharmaratna FCA, FSCMA, CGMA(UK), ACMA(UK), DBAMs. C. A. GerlachMr. K. A. S. Gunasekara BA (Cey), SLASMr. G. Chamindra De Silva MBA, FCA, FCMA(UK), FCCA (UK), CA (SD) Mr. K. G. M. Piyaratne FCA, ACMA(U.K.), CPA(Canada), FSCMA, MSc (Mgt&IT)Mr. A. N. De Silva
SecretariesManagement Applications (Pvt) Ltd.12, Rotunda Gardens,Colombo – 03.Tel. No: 2445751/2327595
Registered officeNo. 280, Dam Street,Colombo – 12, Sri Lanka.Tel. No: 5388800
AuditorsErnst & YoungChartered AccountantsNo. 201, De Sarem Place,Colombo - 10.
BankersHatton National Bank PLCUnion Bank of Colombo PLCNDB BankPeople’s BankDFCC Bank

Malwatte Valley Plantations PLC | Annual Report 2016 3
Contents
VISION & MISSION 1
CORPORATE INFORMATION 2
FINANCIAL HIGHLIGHTS 4
CHAIRMAN’S REVIEW 5
BOARD OF DIRECTORS 7
CORPORATE GOVERNANCE 10
RISK MANAGEMENT 13
AUDIT COMMITTEE REPORT 15
REMUNERATION COMMITTEE REPORT 17
REPORT OF THE COMMITTEE ON RELATED PARTY TRANSACTIONS 18
DIRECTOR’S REPORT 19
DIRECTORS RESPONSIBILITIES 20
INDEPENDENT AUDITOR’S REPORT 21
STATEMENTS OF PROFIT OR LOSS 22
STATEMENTS OF COMPREHENSIVE INCOME 23
STATEMENTS OF FINANCIAL POSITION 24
STATEMENTS OF CHANGES IN EQUITY 26
STATEMENTS OF CASH FLOWS 27
NOTES TO THE FINANCIAL STATEMENTS 29
SHAREHOLDERS & INVESTORS INFORMATION 81
FREE HOLD AND LEASE HOLD LANDS AND BUILDINGS 86
NOTICE OF MEETING 89
FORM OF PROxY 91

Malwatte Valley Plantations PLC | Annual Report 20164
finAnCiAl HigHligHts
Company 2016 2015 12(Month) 12(Month) Rs.’000 Rs.’000Turnover 2,857,081 2,881,044
Gross Profit (6,748) (114,922)
Operating Profit 124,331 (242,774)
Gross Profit on Cost of Sales (%) (0.2) (4)
Gross profit on Turnover (%) (0.2) (4)
Profit/(Loss) Before Tax 72,586 (270,537)
Tax expenses 10,132 8,524
Profit/(loss) After Tax 62,453 (279,062)
Fixed Assets 3,931,674 3,750,006
Current Assets 1,428,827 1,522,466
Current Liabilities 904,645 926,528
Shareholders Fund 2,785,458 2,590,667
Capital expenditure 153,258 167,633
Earnings Per Share (Rs.) 0.28 (1.25)
Net Assets Per share (Rs.) 12.48 11.62
Dividend Per Share (Rs.) - -
Stated Capital 373,000 373,000
Capital Employed 3,439,168 3,235,494
Net Assets 2,785,458 2,590,667
Return on Capital Employed (%) 2 (9)
Market Capitalisation 626,545,443 752,270,975

Malwatte Valley Plantations PLC | Annual Report 2016 5
CHAiRMAn’s ReView
I am happy to be able to open this review with the announcement that our company in the year under review has made a profit of Rs. 62,500,414/=, which is a tremendous turn-around from 2015 when we recorded a loss. This turn-around is only partly due to a better NSA in the latter part of 2016; mostly it is due to very hard work put in by all our staff and employees, effective cost management and timely and strategic business decisions. Details will be given in the sector reviews below.
OverviewYour company manages approximately 5,000 Ha of tea and 2,000 Ha of rubber, and has a workforce of nearly 9,000.
Tea sector The total tea production of Sri Lanka during 2016 was 292.60 million kgs, compared to 328.8 million kgs in 2015, which is a decrease of 11%. The total tea export during 2016 was 288.7 million kgs, with an export value of Rs. 184.7 billion.
The average price in the auction increased by Rs. 71.69 from the year before. This increase was a result of increasing demand while the local production actually decreased. Towards the end of 2016 the prices improved considerably, and remained good in early 2017, too.
The Company spent a sum of Rs. 153.25 million under Capital Expenditure on new clearings and diversification. This will no doubt help to strengthen future earnings of your company.
Rubber sectorA decline in rubber production in the country was observed for the fifth consecutive year in 2016, largely as a result of adverse weather conditions and a halt of tapping in some instances because of depressed marketing conditions. It declined by 10.7% to 79.1 million kilograms, the lowest production volume in the past 50 years.
Rubber prices also declined in 2016 as a result of a slowdown in global demand and the low international crude oil prices. In US Dollar terms the price of natural rubber per kilogram declined by 27.3% to US$ 1.60 in 2016 from US$ 2.20 in 2015. As a result of this, achieving a profit in rubber cultivation remains a serious challenge.
Cost of ProductionIn spite of a considerable wage increase of 17%, the cost of production increased within reasonable limits. The above has been made possible by spirited team work and close monitoring
at every level. In a situation where most of our costs are fixed and labour wages are not related to productivity the above achievement is admirable and has contributed to achieving positive results for the year under review.
Exports The Tea Export arm of your company recorded a revenue of approximately Rs. 900.3 million for the year compared to Rs. 831.1 million the year before.
The year under review saw the start of our branding process which should lead to positioning your company as a brand name in the international tea market. Our goal would be to enter niche markets in order to get premium prices for our exquisite teas. In 2017 we have started to participate in Trade Fairs.
The company is currently shipping it’s teas to destinations such as Azerbaijan, Russia, Kyrgyzstan, Japan, China, Germany and Canada.
The Rubber Export arm of your company is steadily progressing despite the depressed global marketing conditions. We intend to develop this further in the coming years. We are currently shipping our rubber to Malaysia, Pakistan, Czech Republic, Brazil, Germany, Netherlands, India and Bangla Desh.
Our Spice and Fruit Export from our diversified projects will commence no sooner commercial volumes are harvested.
Crop diversificationThe program of crop diversification whereby we are planting large extents of pepper, mandarin, avocado and cardamom was continued in 2016. In the year under review we have harvested 3,600 kgs of pepper. We have also commenced the nurseries for oil palm which would be planted later in 2017. Your company still believes that income generated from these diversification projects may become the “life blood” of our Company in the years to come.
Factory development and mechanizationThe company has acquired a tea cleaning facility which will considerably improve the quality of our teas for export. It has been set up in our warehouse in Elakanda, Wattala.
WelfareThe year under review saw the start of a housing scheme in Ledgerwatte Estate. 125 houses will be built with the support of a grant from the Indian Government. Your company has
Chairman’s Review

Malwatte Valley Plantations PLC | Annual Report 20166
already undertaken the obtaining of the necessary approvals, infrastructure clearing and site preparation. We are still waiting for the Indian grant money to come so that the work can be completed.
Human ResourcesWe believe that the overall quality of our products and the satisfaction of our customer are greatly dependent on the quality of life of our employees and the satisfaction they obtain by working with us. Therefore we will endeavor to assure that our employees’ quality of life and their skills are continuously improved.
TrainingThe Company has implemented a structured process oriented training policy, which is supported by a comprehensive training need analysis and a training plan. In the year under review a new training program was conducted to give financial training to non-financial managers such as Superintendents and Assistant-Superintendents.
IncentivesA strategic Incentive Scheme was introduced in the year under review for more categories of staff. It focuses on improvement of product quality and increasing crop on estate level.
CHAiRMAn’s ReView
Inter Plantations Rugby7’s – 2016The annual Inter Plantations Rugby7’s tournament, which is the premier sports festival in the plantations sector and it’s most looked forward to event, was organized for the seventeenth consecutive year by the Dickoya/Maskeliya Cricket Club. In the year under review your company became the champions, beating Bogawantalawa Plantations by 17 – 12 and Mr. Dushmantha Herath, Assistant-Superintendent of Sarnia Estate, became player of the Tournament. It was a fine reward for your Company’s commitment to sports and team spirit within the organization.
AcknowledgmentsI wish to thank our employees for their tireless work during the year under review which is one of the main reasons for the turn-around. I also wish to thank our Buyers, Brokers, Bankers and all other stake holders for their continued support and my fellow directors on the Board in managing our company during this year.
Mr. F BogtstraChairman 25 May 2017

Malwatte Valley Plantations PLC | Annual Report 2016 7
Mr. Frits Bogtstra(Chairman)Mr. Frits Bogtstra completed a degree in Electrical and Electronic Engineering at King’s College University of London in 1978. In 1998 he finished a Master’s degree in Business Administration with a focus on competitive strategy, international enterprise and corporate financial strategy.
He was active in the field of software development relating to engine test benches for manufacturing quality control and R&D, medical equipment and internal and external ballistics.
He has been working as a manager for a reputed German car manufacturer since 1986, with responsibilities throughout the field of software development and engineering, data centre management, supplier management and outsourcing of IT operations.
In the field of corporate financial controlling, he developed controlling systems and processes for the efficient and cost optimised assembly of engines and associated logistics using just in time and just in sequence supply methods to minimise cost of capital bound by material in work.
He currently manages an international project dealing with the standardisation and rollout of business and IT processes for automobile sales and financial services worldwide.
He was appointed as Chairman 4 December 2015
Mr. Lucas Bogtstra(Managing Director)
Mr. Lucas Bogtstra joined Malwatte Valley Plantations in 1998 and was appointed to the Boards of Malwatte Valley Plantations and its holding Company, Wayamba Plantations (Pvt) Ltd in 2003.
He was appointed as MD/CEO from 4 December 2015.
He commenced his career with the John Keells Group in 1978 and has since served on many private sector boards. Apart from being a Planter, he also has vast experience in import, export, manufacture and trading.
He is responsible for setting up and managing the export arm of the Company in 2008 and it’s modern warehouse complex at Wattala in 2009.
BoARd of diReCtoRs
Mr. Thomas Randolph Gerlach(Director)
Mr. Thomas Randolph Gerlach has had his law studies at the University of Utrecht-Netherlands. He served a period of five years, up to 1986 as a Legal Aid Consultant in Legal Aid Association in the Hague, Netherlands. He has worked as Project Manager, Orveco B.V. Holland a company manufacturing Organic fertilizer for a period of eight years up to 1994.
He took over as Managing Director Dutch Plantin B.V. Holland a company marketing coir fibre dust worldwide. He is also a Director since 1994 of Seilaani Ltd, Sri Lankan company producing processed coir fibre dust “cocopeat”.
During 2003 he joined Malwatte Valley Plantations PLC and is currently the Group Executive Director. He is also the Group Executive Director of Wayamba Plantations (Pvt) Ltd, the holding company of Malwatte Valley Plantations PLC.
Mr. Sunil Noel Dharmaratna(Director)
Mr. Sunil Dharmaratna was appointed to the Board of Directors of Malwatte Valley Plantations PLC on 24th April 2013 as Director Finance and currently works as Director Leisure/ Projects.
Mr. Dharmaratna is a Fellow Member of Institute of Chartered Accountants of Sri Lanka (ICA). Associate member of Chartered Institute of management Accountants (UK) ACMA, Fellow and Founder Member of the Society of Certified Management Accountants, Sri Lanka (FSCMA), Associate Member of the Chartered Global Management Accountants (CGMA). He served as a member of the Council of CIMA Sri Lanka Branch for a period of two years. He obtained his Doctorate in Business Administration from University of International Education and Research, India in 2016.
He has successfully completed Hospitality Industry Advance Professional Development Programme in Hotel Administration at Cornell University, New York (USA).
He counts 39 years of experience and expertise in the Financial, Plantation, Real Estate, and Leisure Sectors, and held key Management Positions as Chief Accountant at Aitken Spence Hotel management, Director Finance Hotel Management Division of John Keells Holdings Limited and Senior Vice president and Head of Finance at John Keells PLC.
Board of Directors

Malwatte Valley Plantations PLC | Annual Report 20168
He has also been involved in many CSR and community service projects in many parts of the country and is a past Multiple Council Chairman of the International Association of Lions Clubs Multiple District 306 Sri Lanka. He was awarded the Title of Desabandu for community service work and is a Justice of Peace (All Island).
Mr. K. A. S. Gunasekera(Director)
Mr. K. A. S. Gunasekera joined the Sri Lanka Administrative Services in 1970 and has more than 38 years of experience in holding public sector Senior Management positions in various sectors, out of which twenty five years as secretary to eight ministries covering subject areas of public utilities, housing, justice, plantation management, environment, forestry, natural resources, urban development, sports parliamentary affairs, youth, cultural, information and broadcasting. After retirement in 2004 from public services he was appointed as chairman of public utilities commission for a period of four years.
He has assisted for more than 30 years in policy development; regulatory and institutional reform and development in the field of public utilities, urban infrastructure, environmental management and public administration in Sri Lanka. Provided leadership and guidance in initiating rural water supply policy and institutional framework and legal and institutional reform in the Water Sector introducing community and private sector partnerships. Involved in setting up of the Environmental Impact Assessment (EIA) Process and Environment Protection Licensing (EPL) System, making an amendment to the National Environmental Act and developing National Environmental Policy, Cleaner production Policy and Strategy, Solid Waste Management Strategy, Air Quality Monitoring program, Environmental NGO Forum, School Environmental Societies andEnvironmental Pioneering Brigade.
He also provided leadership in developing and managing World Bank funded environmental projects, legal and judicial reforms as well as ADB and JBIC funded Plantations Reform project and Plantation Development Project. He was appointed to the Board of Malwatte Valley Plantations PLC as a Director from 2009.
He resigned during the year on 15/03/2015 and rejoined on 23/09/2015
Mr. Chamindra de Silva(Director)
Mr. Chamindra De Silva is a Senior Chartered Accountant with over thirty years of post qualifying experience in industry and commerce. Currently he is the Chief Financial Officer at Alliance Finance Company PLC and immediately prior to joining the Alliance Finance Company, over a long period, he functioned as the Group Finance Director of Swedish Trading Group of Companies, a leading business conglomerate in the country. He is also an Independent, Non Executive Director of Malwatte Valley Plantations PLC, a leading Plantation company and functions as the head of its Audit Committee.
Mr. De Silva has been a former vice-president of the ACCA (UK)- Sri Lanka Branch and a member of the council of CIMA Sri Lanka branch, having completed both CIMA and ACCA examinations in the late 70s. He has also been a member of the Institute of Marketing UK, the Institute of management Services-UK and a recipient of the CIMA award for the Accounting & Information Systems in the Colombo University’s MBA program 89/90.
He also has extensive experience in the field of managerial education specialising in the fields of Finance and Strategy and functioned over a decade as the course director for Financial Management in the prestigious MBA program University of Colombo. He has also been the chief examiner for Financial Management at the country’s premier accounting body, the Institute of Chartered Accountant’s of Sri Lanka and currently an active participant in the ICASL’s graduate and post graduate management education.
Ms. Claudia A. Gerlach(Director)
A national of the Netherlands, Ms. Claudia Gerlach obtained a bachelor degree in Hotel Management and Tourism from the Klessheim College of Tourism in Salzburg, Austria. From 1977 onwards, Ms. Gerlach has been active for 30 years in international freight forwarding and logistics. She held several Managing Director positions for international logistic service providers based in Europe. From 2009 Ms. Gerlach owns her own management consulting company, offering management consulting and interim management services. Her field of expertise is business strategy, general management and international logistics/supply chain management.
BoARd of diReCtoRs

Malwatte Valley Plantations PLC | Annual Report 2016 9
Mr. K. G. M. Piyaratne(Director)Mr. Piyaratne is a fellow member of the Institute of the Chartered Accountants of Sri Lanka, member of the Institute of Chartered Management Accountants of UK, Chartered Professional Accountatnt (CPA) of Canada and Masters degree holder of Management and information Technology from University of Kelaniya. He is a Senior Chartered Accountant with over twenty five years Experience in Industry and Commerce. He was reappointed to the Board as Director Finance of Malwatte Valley Plantions PLC in 2015. Prior to joining the Company he served as an Accountant, Mahaweli Engineering & Construction Agency. Manager, Someswaran Jayawickrama & Co. He has also served as Director Finance Sri Lanka Broadcasting corporation, Chief Accountant, Ceylinco Cisco Secutrity Corporation (Pvt) Ltd., and Ernst & Young, Doha, State of Qatar as Audit/Tax Accountant.
He Rejoined the board with effect from 26 September 2015
Mr. A. N. De Silva(Director)
Mr. A. N. de Silva is a senior banker counting over four decades of allround experience in commercial banking with Hatton National Bank PLC & Union Bank of Colombo PLC. He also currently serves as an Independent Non Executive Director of Hatton National Bank PLC. He was elected an Associate of the Chartered Institute of Bankers, London, UK, on completion of his banking examinations in 1978 and has received training in banking & management from several local & overseas institutions.
He joined the Board of Malwatte Valley Plantations PLC as an Independent Non Executive Director with effect from 2nd April 2015 & is the Chairman of the Company’s Finance & Adminstration Board Sub Committee.
BoARd of diReCtoRs
Board of Directors

Malwatte Valley Plantations PLC | Annual Report 201610
Corporate Governance is about the way in which the Board oversees the managing of a Company by its managers, and how Board Members are in turn accountable to shareholders and the Company.
Corporate Governance influences how the objectives of the Company are set and achieved, risks identified and managed and organisational performance optimised. The Board of Directors ensures that all activities of the Board are conducted upholding the highest standards of transparency, accountability and ethics.
The Company is primarily guided by the Code of best practices on Corporate Governance issued by the Institute of CharteredAccountants of Sri Lanka and the Listing Rules of the ColomboStock Exchange on Corporate Governance. This report sets out the Company’s Corporate Governance practices.
The Board of DirectorsThe Board of Directors comprise of nine Directors including the Chairman and Managing Director / CEO. The Company believes that the present composition of the Board has at its disposal, a vast reservoir of knowledge and experience in all areas of theCompany’s operations and the names of the Directors are given in the Directors report.
The Board meets at least nine times each year and in addition a regular update takes place in the months when no formal meeting is scheduled. The agenda for each Board Meeting is set by the Company Secretary in consultation with the Chairman. Board members receive a monthly report of the Company’s activities which incorporate updates on progress against objectives and the management of business risks.
The Board of Directors are responsible for;• Providing direction and guidance to the Company in
the formulation of its strategies, with emphasis on the medium and long term in the pursuance of its operational and financial goals
• Implementing and monitoring of such strategies.
• Reviewing and ratifying systems in operation relating to risk management, internal control, codes of conduct and compliance with the laws, statutes and regulations.
• Reviewing monitoring and ratifying all capital expenditure, acquisitions and divestitures.
• Monitoring senior management performance
CoRpoRAte goVeRnAnCe
• Overseeing Systems of Internal Control and Risk Management
• Ensuring that due attention is given to annual and interim financial statements prior to Publication
• Determining the quantum of the final dividend for approval by the shareholders.
• Approving and monitoring Financial and other Reporting
• Monitoring Systems of Governance and Compliance
The Board in discharging its duties seeks independent professional advice from external parties when necessary at the Company’s expense.
The Company Secretaries advise the Board on matters relating to the Companies Act, Colombo Stock Exchange regulations and other applicable rules and regulations and ensures appropriate, timely and accurate information is submitted to the Board and its committees.
All company directors bring independent judgment to bear on issues of strategy, performance, resources, key appointments and standards.
New directors receive a full introduction to the Company. This consists of information covering the operations of the Board as well as meetings with the Board, Chief Executive and other Executive Directors. All Non-Executives have direct contact with the Company’s senior executives between Board meetings and also visit the Company’s operations in order to familiarise themselves with its activities and to meet and engage with staff.
Board CompositionThe Board currently comprises of the Chairman four Executive Directors including MD/CEO and three Independent Non- Executive Directors. The Board functions effectively and efficiently and is considered to be of an appropriate size. The directors provide the Company with the knowledge, mix of skills, experience and networks of contacts required. The Board Committees comprise of directors with a variety of relevant skills and experience so that no undue reliance is placed on any individual.
The Non-Executive Directors combine broad business and commercial experience with independent and objective judgement. The balance between Non-Executive and ExecutiveDirectors enables the Board to provide clear and effective

Malwatte Valley Plantations PLC | Annual Report 2016 11
CoRpoRAte goVeRnAnCe
leadership and maintain the highest standards of integrity across the Company’s business activities.
Company InformationThe Board recognizes that the decision making process is highly dependent on the quality of information furnished. As such, all Directors have full and unrestricted access to any information pertaining to Malwatte Valley Plantations PLC.
The Managing Director/CEO plays a key role in ensuring that all Directors have full and timely access to information relevant to matters that will be deliberated at the Board meeting. The agenda and set of Board papers are circulated in advance of the Board meetings. A comprehensive balance of financial and nonfinancial information is encapsulated in the papers covering strategic, operational, financial, regulatory and marketing issues.
All Directors have access to the advice and services of the Company Secretary, who ensures that the Board receives appropriate and timely information for its decision-making, that Board procedures are followed and the statutory and regulatory requirements are met. The Secretary also assists the Chairman in ensuring that all Directors are properly briefed on issues arising at Board meetings. The Board believes that the current Company Secretary is capable of carrying out the appropriate duties to ensure the effective functioning of the Board while the terms of appointment permit the removal and appointment by the Board as a whole.
Appointment of DirectorsThere is a clear and transparent procedure for the appointment of Directors to the Board. The Articles of Association of the Company empower the Board of Directors to either fill a casual vacancy in the directorate or appoint additional directors. In terms of the Articles of Association any Director appointed by the Board holds office until the next Annual General Meeting at which he seeks election by the shareholders.
Management CommitteeThe Board of Directors devotes adequate time to the fulfillment of their duties as Directors of the Company. The Board has delegated the day to day operations of the Company and the group to the Management Committee. The Management Committee is chaired by the Managing Director who is also the Chief Executive Officer, and meets once a month. The committee comprises of Heads of Divisions such as Plantation, Finance, Marketing and Legal.
The functions of the Management Committee are to innovate, develop, implement and review the strategies in order to achieve the corporate objectives and discuss matters in relation to the operational activities of the Company.
Directors RemunerationThe total remuneration of the Directors is disclosed in Note 9 to the Financial Statements.
Accountability and AuditThe Statement of Director ’s Responsibilities are presented onPage 20 of the Annual Report.
The Board has implemented a sound system of internal control and Risk Management to safeguard the shareholders investment and the Company’s assets. The details of the Company’s Risk Management system are provided on Page 13 and 14 of this Annual Report.
In order to strengthen the finance controls separate finance committee has been formed chaired by Non-Executive Director Mr. Nilanth De Silva. This committee functioned throught the year 2016.
Audit CommitteeThe Audit Committee consists of the following members:Mr. G. C. de SilvaMr. K. A. S. Gunasekera
Two of the above Non-Executive Directors of the company have a wide experience in Plantation and Finance enabling them to have a sound control over operations as well as finance.
Objectives of the Internal Audit CommitteeAudit Committee was set up with the following objectives while keeping in line with the objectives defined by the Securities and Exchange Commission.
To evaluate internal control procedure with close liaison with internal auditors and ensure smooth operation with a sound control over the operations.
• Continuous implementation of improvements and corrective action on deviations observed by internal auditors and monitoring the success of implementation.
• Analytical review of the business risks towards the Company and making sure sufficient risk management techniques are in operation based on observations.
Governance
Malwatte Valley Plantations PLC | Annual Report 201612
• To ensure that the Company adheres to all statutory compliance and carries out the operation in accordance with commercially and ethically accepted management practices.
• Enhancing the public confidence in the credibility and objective of financial statements.
• Ensure the greater independence of internal and external auditors and providing autonomous reporting system.
• The Audit Committee also assists the Board of Directors to maintain the stewardship responsibilities towards shareholders.
Activities of the Audit Committee• Review the compliance with corporate governance
requirements.
• Advising and suggesting scope and responsibilities of internal audits.
• Assisting in conducting investigations.
• Liaison with Internal and External Auditors.
• Assessing and commenting on all financial reports internal and external, audit findings.
• Communication with Directors and Managers on further investigations on audit findings before corrective action.
• Implementation of corrective action required and follow-up on success of implementation.
ComplianceThe Board is conscious of its responsibility to shareholders, the Government and the Society in which it operates and is unequivocally committed to upholding ethical behavior in conducting its business. The Board strives to ensure that the Company complies with the laws and regulations of the Country.
CoRpoRAte goVeRnAnCe

Malwatte Valley Plantations PLC | Annual Report 2016 13
Risk MAnAgeMent
Governance
The Company operates in an evolving environment which exposes it to different types of risks especially being in the Agricultural Sector which is very sensitive to Weather patterns. An effective risk management system is an important area of business management which would attempt to prevent many events which would otherwise have adverse effects on the business.
Risk Management ProcessThe Risk Management Process is designed to ensure identification of any circumstances that would adversely affect the goals of the Company. Our Risk Management Process ensures that we accept or manage unavoidable risks and uncertainties are minimised. The Company has a systematic process of risk management that is aligned with its strategy. The Main Risk factors falls into three categories namely Strategic Risk, Financial Risk and Operational Risk
1. Strategic Risks1.1 Wage Structure (Rating HIGH)Trade Unions Play an active role in determining wages. The wage structure is not aligned to worker productivity. Every two years when wages are revised as per the collective agreement it affects the cost of production and gratuity liability substantially there by the competitiveness and profitability. Risk management strategies in place are as follows;Increase land and worker productivityOptimise labour deployment and maximise productivityMotivate employees through better HR practicesContinuous dialogue with Trade Unions and workers in order to bring wage structure in line with productivity
1.2 Impact of Climate Change (Rating HIGH)Crops are seasonal and subject to changes in weather. The loss of crop and quality of the harvest affect the market share, earnings and profitability. In order to mitigate this risk, the Company has adopted soil and soil moisture conservation methods, soil improvement, intercropping, crop diversification and establishment and management of shade trees, selection of suitable lands for new planting or replanting, use of drought and heat tolerant cultivars.
1.3 Business Risk (Rating MODERATE)Non implementation of Revenue enhancing and Cost saving measures, Strategic Plans and Initiatives on profitable investments results in reducing future growth of the Company reducing revenue, cash flow and profitability.
In order to mitigate business risks the Board of Directors and the management committee hold regular meetings to formalise strategies and plans for the future. The use of Best Practices in Agriculture and Company Diversification Policy also contributes in mitigating business risks.
1.4 Political and Environmental Risks (Rating HIGH)Political and Economic upheaval in key markets and volatility of the world economy causes rapid fluctuations in Tea prices.
The main risk factor is that fluctuating prices affect profitability and reduce profit margins.
In order to mitigate these risks the Company focuses mainly on producing quality Teas and has been very successful in the Uva Regions where Malwatte Valley Plantations obtains the highest averages on a continuous basis and also its factories output is maintained at high volumes with the increased market high prices in the Uva Region.
In order to mitigate risks further the Company converts low yielding Tea lands to cultivate subsidiary crops.
Rubber extents are being increased and rubber Re-planting is given a prominent place with the Company maintaining a very low cost of production when compared with industry norms.
2. Operational Risk2.1 Product Quality (Rating HIGH)Non maintenance of product Quality lowers DemandThis results in buyers curtailing purchases and looking for new suppliers. This will drop market prices and erode market share.
In order to mitigate these risks the Company maintains a regular dialogue with buyers and brokers to obtain feedback, and take prompt and corrective action on Broker Reports.
Also the Company on a continuous basis improves its manufacturing processes both in Tea and Rubber to produce quality products.
2.2 Human Resource (Rating MODERATE)Reduction in resident manpower, low productivity, immobility within estates / between estates and difficulty in retaining management / supervisory staff.

Malwatte Valley Plantations PLC | Annual Report 201614
Risk MAnAgeMent
Lack of Human Resources will make it difficult for the Company in achieving the targeted crops. If there are work disruptions to operations and performance it will affect productivity and profitability.
In order to mitigate these risks, the Company maintains a close Dialogue with employees, staff training and development programmed are in place to improve performance, determine remuneration in line with the Industry Several programs are in place to uplift the living standards of employees and their families. These have resulted in a better relationship with the workforce. The Company has performance oriented reward schemes to motivate staff and labour force. This helps high performers to improve earnings which motivate them further.
2.3 Reputation Risk (Rating MODERATE)Reputation risk refers to compliance of legal and statutory requirements and ethical practices as well as maintaining loyalty and trust worthiness among stakeholders.
These risks will result in the Company losing of reputation, fines and even litigation.
In order to mitigate these losses, the Company ensures highest standards of business conduct in adopting a code of Corporate Governance by all employees, senior management and Board of Directors. Seek expert legal advice to incorporate risk mitigatory clauses in drafting legal contracts and agreements. Maintain effective Internal Control Systems to minimise fraud and error. Close dialogue with Golden Shareholder. Membership in Employers Federation, Ceylon Chamber of Commerce and Planters Association of Ceylon.
2.4 Risk of Land Acquisitions (Rating LOW)The Company is exposed to the risk of acquisition of productive land for public purposes. These are as far as possible resolved by discussion and negotiation to minimise losses. Compensation claims are lodged for any lands acquired.
3. Financial Risk3.1 Liquidity (Rating MODERATE)Sufficient working capital including readily available funds is crucial for the Industry.
The risk arises in the event of inadequacy of funds that affect sustainability of operations, leading to funding at higher costs or postponement of other important investments.
In order to mitigate these liquidity risks the Company maintains cash flow and budgetary controls system for effective monitoring, priorities capital investments and borrowings are planned within the Company’s ability to repay.
3.2 Credit Risk (Rating MODERATE)The Company sells most of its produce through the auction mechanism. There is satisfactory system to control and maximise the recovery of debts arising from direct sales as there are stipulated settlement dates for auction produce. Direct exports are usually covered by letters of credit or bank drafts.
3.3 Finance Costs (Rating MODERATE)This mainly refers to high finance costs resulting from fluctuating Interest rates.
Finance costs have a direct impact on profitability and cash flows.
In order to mitigate these losses the Company has resorted to concessionary funding from available sources. The Company fully utilised the ADB credit Line and E-Friends scheme of HNB,at lower interest cost. The Company also obtained multi facilities from various banks so as to ensure maximum advantage from varying terms offered by different financial Institutions.
3.4 Foreign Exchange Risk (Rating HIGH)This affects Companie’s profitability with fluctuating exchange rates.
This affects the Companies exports.
In order to mitigate the losses, exchange rate movement are monitored and outlook is closely followed in respect of currencies in which the company carries exposure. Tea Exports have a direct exposure in respect of this risk which the Company closely monitors.

Malwatte Valley Plantations PLC | Annual Report 2016 15
Audit CoMMittee RepoRt
Governance
1. Composition The Board appointed Audit Committee of Malwatte Valley Plantations PLC consists of two members, Mr G. C. De Silva and Mr. A.N. De Silva both of whom are independent Non Executive Directors. Mr. G. C. de Silva who is the Chairman of the committee is a Fellow member of the Institute of Chartered Accountants of Sri Lanka. The Company secretary functions as the secretary of the Audit Committee.
2. Role of the Committee The committee operates within the Terms of Reference’ formally approved by the Board which defines its objectives and responsibilities. The role and functions of the committee are further regulated by the ‘Rules on Corporate Governance’ of the listing rules of the Colombo Stock Exchange. The key objective of the committee is to assist the Board of Directors in discharging its responsibilities towards all stakeholders and to ensure that sound corporate governance practices are upheld within the Company. The committee is empowered among other things to examine any matters relating to the financial affairs of the Company, review any activity within the company review the adequacy of internal controls adherence to statutory and regulatory requirements, ensuring the objectivity and the independence of external and internal auditors, business risk assessment and adherence to accounting policies.
3. Meetings During the financial year ended 31 /12/2016 the committee held two meetings. The Managing Director, Director Finance attended all audit committee meetings by invitation. When required, other senior officers of the Company are invited to attend these meetings and to clarify any observations by the internal auditors .
Additionally, as discussed under No.6 of this report opportunity is also taken to discuss internal audit related issues in the ‘Financial and Administration Monitoring Committee’ meetings that is held at monthly intervals.
4. Financial Reporting The management has the primary responsibility for the financial statements and the reporting process. The Audit Committee oversees the Company’s financial reporting process to ensure the reliability of the information provided to the stakeholders. In this context, the committees receives, discuss and reviews with the management and the internal and external auditors the quarterly financial statements and the annual report and
accounts prior to their issuance. The committee focuses on the responsibility of the key judgments and estimates in the preparation of financial statements, appropriateness of significant accounting policies adopted in preparation of financial statements and the extent of compliance with the Sri Lanka Accounting Standards and applicable disclosure requirements.
During this financial year, an important initiative was implemented by way of a monthly detailed review of financial affairs of the company and for this purpose a separate committee was established under the leadership of Mr A.N.De Silva. This committee referred to as the ‘Financial and Administration Monitoring Committee’ (FAMCOM) is attended by all key decision makers that include the two range directors namely for Tea and Rubber. This monthly meeting serves the purpose that the non executive directors are afforded with the opportunity to discuss at length the key strategic issues in the financial as well as internal control related areas are discussed in detail.
5. Statutory and Regulatory Compliance A procedure has been laid down for reporting on the statutory compliance of the company. Such reported exceptions are followed up to ensure appropriate corrective action. Due compliance with all requirements is monitored through this process.
6. Internal Audit The Audit Committee exercises oversight over the internal audit function. The committee approved the annual internal audit program and reviewed the reports by internal auditors concerning operational issues and effectiveness of internal control systems. These reviews examined the management responses for the issues raised as well as the implementation of agreed recommendations. This function will be further strengthened during the next financial year.
During the last Audit committee meeting a decision was taken to further strengthen the succession of the position company’s chief internal auditor and accordingly the recruitment of another internal auditor with extensive industry experience was approved. Further a decision was taken to outsource the internal audit of the head office and finance department by a reputed firm of Chartered Accountants with a view to strengthen the aspect of independence and internal control.

Malwatte Valley Plantations PLC | Annual Report 201616
Audit CoMMittee RepoRt
7. Corporate Governance The committee also reviewed the level of compliance with corporate governance rules as per Sec. 7.10 of the Listing Rules of the Colombo Stock Exchange and is satisfied that the Company has complied with all mandatory requirements of this code.
8. External Audit The external auditors were given adequate access by the committee to ensure they had no cause to compromise their independence and objectivity, prior to commencement of the Annual audit. The Audit Committee also reviewed the external auditor’s management fetter of the previous year together with the management’s responses thereto. The committee has also received a declaration from the external auditors as required by the Companies Acl No. 07 of 2007. Confirming that they do not have any relationship or interest in the Company which may have a bearing on their independence. The Audit Committee has recommended to the board that Ernst & Young be re- appointed as statutory auditors for the financial year ending 31 December 2017 subject to the approval by the shareholders at the forthcoming Annual General Meeting.
9. Conclusion Chamindra de Silva Chairman - Audit Committee Based on the review of reports submitted by the external and internal auditors and the information received during the deliberations, the committee is satisfied that the internal controls and procedures in place are adequately designed and have been operating effectively to provide reasonable assurance that the Company’s assets are safeguarded and that steps are being taken to continuously improve the Internal control environment maintained within the Company. The committee is also satisfied that the financial position of the Company is regularly monitored and that the Company has adopted appropriate accounting policies and that the financial statements of the Company are reliable.
Chimindra de Silva Chairman - Audit Committee
Colombo 25th May 2017

Malwatte Valley Plantations PLC | Annual Report 2016 17
ReMuneRAtion CoMMittee RepoRt
Governance
The Remuneration Committee consists of two Independent Non- Executive Directors including the Chairman of the committee. Mr. K.A.S. Gunasekara who counts more than 38 years of experience in the Sri Lanka Administrative Services and has worked in many Government Ministries as the Secretary. The Managing Director assists the Committee by providing all relevant information and participating in its analysis and deliberations, except when his own compensation package is reviewed.
Tine Committee is responsible for determining the compensation packages of the Director/CEO as well of the key management personnel. In addition, they lay down guidelines and parameters for the compensation structure of the management staff of Malwatte Valley Plantations PLC.
The Company Policy on remuneration packages is to attract and retain competent professionals and an experienced workforce, and motivate, encourage and reward high performers. The Company’s structured performance evaluation methodology ensures provision of compensation appropriate for the Company and commensurate with each employee’s level of expertise and contribution bearing in mind the performance of the business and Shareholder returns.
In carrying out its tasks the committee reviewed data concerning all categories of staff among comparable companies.
The committee will meet from time to time and review the Company’s compensation structure to ensure alignment with strategic priorities and with compensation offered by comparable companies.
K. A. S. GunasekaraMember - Remuneration Committee
Colombo 25th May 2017

Malwatte Valley Plantations PLC | Annual Report 201618
RepoRt of tHe CoMMittee on RelAted pARty tRAnsACtions
The committee comprises Mr. Chamindra de Silva (Chairman), Mr. K A S Gunasekera,Mr. Nilanth de Silva. Mr. Lucas Bogtstra (Managing Director/CEO) , Mr. Mahinda Piyaratne (Director Finance & Audit) will participate by invitation.
The committee has reviewed the related party transactions during the period under review and the minutes of the committee has been forwarded to the attention of the Board of Directors.
The committee has identified the relevant related parties and being at an incipient stage of this committee, the committee commenced their meetings in December 2016. Also the Chairman and the committee and the members will address the methodology, policy and procedures to be adopted that will effectively enable the committee to review the related party transactions in the next financial year.
Chamindra de Silva Chairman - Committee on Related Party Transactions
Colombo 25th May 2017

Malwatte Valley Plantations PLC | Annual Report 2016 19
diReCtoRs RepoRt
Stated CapitalThe total Issued and Paid-up Ordinary Shares capital of the Company as at 31st December 2016 consists of Voting Shares amounting to Rs. 350,000,010/- and Non-Voting Shares amounting to Rs. 23,000,000/-.
Major ShareholdersThe names of the 20 largest shareholders of the Company as at 31st December 2016 together with an analysis of shareholders are given in the shareholder and investor information pages of the Report.
Fixed AssetsThe Company has invested Rs.153million on acquisition of fixed assets during the year which includes acquisition of plant and machinery, motor vehicles, land improvements, land and buildings etc. Information relating to the movements of fixed assets is given in the notes to the accounts.
DonationsNo Donations have been made during the year under review.
DirectorsThe following Directors held Office during the period under review:
Mr. Frits Bogtstra - Chairman Mr. Lucas Bogtstra - Managing Director/ CEOMr. T. R. Gerlach - Executive DirectorMr. K. G. M. Priyaratne - Executive Director Mr. S. N. Dharmaratna - Executive DirectorMs. C. A. Gerlach - Non-Executive DirectorMr, G. Chamindra De Silva - Independent Non-Executive
DirectorMr. Nilanth De Silva - Independent Non-Executive
DirectorMr. K. A. S. Gunasekara - Independent Non-Executive
DirectorDirectors Direct and Indirect ShareholdingsDetails pertaining to Directors shareholdings as required under the Colombo Stock Exchange Rules are given in the shareholder and Investor information pages of this report.Interest Register - Particulars of entries made during the year Related Party Disclosures of the Company are disclosed in Note No’s 32.1 and 32.2 to tine Financial Statements.
TaxationAccording to the Inland Revenue Act, the Company needs to pay income tax on its agricultural activities at the rate of 10% (Section 48A - Inland Revenue Act).
Contingent LiabilitiesDuring the period under review, except as in the Notes given to the financial statements no known contingent liabilities exist.
Directors Interest in ContractsDuring the period under review, except as in the notes given to the financial statements, no Director of the Company has direct or indirect interest in any other contract entered into by the Company.
AuditorsThe Accounts for the year under review have been audited by M/s. Ernst and Young, who are eligible to offer themselves for re-appointment The remuneration paid to them for the year 2016 was Rs. 3,200,000/-. A Resolution relating to their re-appointment and authorizing the Directors to determine their remuneration will be proposed at the Annual General Meeting. As far as the Directors are aware, the Auditors do not have any relationship (other than as Auditors) with the Company.
DividendsThe directors have not recommended a dividend for this financial year.
Going ConcernThe Board being satisfied that the Company has adequate resources to continue its operation in the foreseeable future has adopted the going concern basis in preparing the financial statements.
By Order of the Board
Management Applications (Private) Limited Secretaries
Colombo Dated 24th May 2017
Governance

Malwatte Valley Plantations PLC | Annual Report 201620
diReCtoRs ResponsiBilities
The Companies Act requires the Directors to prepare Financial Statements for each financial year giving a true and fair view of the State of Affairs of the Company as at the end of the financial year and of the Profit and Loss of the Company for the financial year. In preparing the financial statements, appropriate accounting policies have been selected and applied consistently, reasonable and prudent judgment and estimates have been made, and applicable accounting standards have been followed.
The Directors are responsible for ensuring that the Company keeps sufficient accounting records to disclose with reasonable accuracy the financial position of the Company and for ensuring that the Financial Statements have been prepared and presented in accordance with the Sri Lanka Accounting Standards and provide the information required by the Companies Act No.7 of 2007 and the Rules of the Colombo Stock Exchange. They are also responsible for taking reasonable measures to safeguard the assets of the Company, and in that context to have proper to the establishment of appropriate systems of internal control with a view to the prevention and detection of frauds and other irregularities.The Auditors have earned out reviews and sample checks on the system of internal controls as they considered appropriate and necessary for expressing their opinion on the financial statements. The Directors have extended full co-operation to the Auditors and have provided them with every opportunity to carry out their statutory obligation of expressing an opinion on the financial statements.
Compliance ReportThe Directors also confirm that to the best of their knowledge all taxes and levies payable by the Company, all contributions, levies and taxes payable on behalf of and in respect of the employees and all other known statutory obligations as were due as at the Balance Sheet date have been either duly paid or appropriately provided for in the financial statements.
By Order of the Board
Management Applications (Private) Limited Secretaries
Colombo 24th May 2017

Malwatte Valley Plantations PLC | Annual Report 2016 21
independent AuditoR’s RepoRt
MPDC/NKMS/SJJC
INDEPENDENT AUDITOR’S REPORT TO THE SHAREHOLDERS OF MALWATTE VALLEY PLANTATIONS PLC
Report on the Financial StatementsWe have audited the accompanying Financial Statements of Malwatte Valley Plantations PLC (“the Company”), and the Consolidated Financial Statements of the Company and its subsidiary, Prime Real Estates Australia (Pvt) Ltd. (“Group”), which comprise the Statement of Financial Position as at December 31, 2016, and the Statement of profit or loss, Statement of Comprehensive Income, Statement of Changes in Equity and, Statement of Cash Flows for the year then ended, and a summary of significant Accounting Policies and other explanatory information.
Board’s Responsibility for the Financial StatementsThe Board of Directors (“Board”) is responsible for the preparation of these financial statements that give a true and fair view in accordance with Sri Lanka Accounting Standards and for such internal control as Board determines is necessary to enable the preparation of financial statements that are free from material misstatement, whether due to fraud or error.
Auditor’s ResponsibilityOur responsibility is to express an opinion on these financial statements based on our audit. We conducted our audit in accordance with Sri Lanka Auditing Standards. Those standards require that we comply with ethical requirements and plan and perform the audit to obtain reasonable assurance about whether the financial statements are free from material misstatement.
An audit involves performing procedures to obtain audit evidence about the amounts and disclosures in the financial statements. The procedures selected depend on the auditor’s judgment, including the assessment of the risks of material misstatement of the financial statements, whether due to fraud or error. In making those risk assessments, the auditor considers internal control relevant to the entity’s preparation of the financial statements that give a true and fair view in
order to design audit procedures that are appropriate in the circumstances, but not for the purpose of expressing an opinion on the effectiveness of the entity’s internal control. An audit also includes evaluating the appropriateness of accounting policies used and the reasonableness of accounting estimates made by Board, as well as evaluating the overall presentation of the financial statements.
We believe that the audit evidence we have obtained is sufficient and appropriate to provide a basis for our audit opinion.
Opinion In our opinion, the consolidated financial statements give a true and fair view of the financial position of the Group as at December 31, 2016, and of its financial performance and cash flows for the year then ended in accordance with Sri Lanka Accounting Standards. Report on Other Legal and Regulatory RequirementsAs required by section 163 (2) of the Companies Act No. 07 of 2007, we state the following:
a) The basis of opinion, scope and limitations of the audit are as stated above.
b) In our opinion:• we have obtained all the information and explanations
that were required for the audit and, as far as appears from our examination, proper accounting records have been kept by the Company,
• the financial statements of the Company give a true and fair view of its financial position as at December 31, 2016, and of its financial performance and cash flows for the year then ended in accordance with Sri Lanka Accounting Standards, and
• the financial statements of the Company and the Group comply with the requirements of sections 151 and 153 of the Companies Act No.07 of 2007.
15 May 2017Colombo
Ernst & Young Chartered Accountants 201 De Saram Place P.O. Box 101 Colombo 10 Sri Lanka
Tel : + 94 11 2463500 Fax Gen : + 94 11 2697369 Tax : + 94 11 5578180 [email protected] ey.com
Partners: W R H Fernando FCA FCMA M P D Cooray FCA FCMA R N de Saram ACA FCMA Ms. N A De Silva FCA Ms. Y A De Silva FCA W K B S P Fernando FCA FCMA Mr K R M Fernando FCA ACMA Ms. L K H L Fonseka FCA A P A Gunasekara FCA FCMA A Hearth FCA D K Hulangamuwa FCA FCMA LLB (Lond) H M A Jayesinghe FCA FCMA Ms. A A Ludowyke FCA FCMA Ms. G G S Manatunga FCA N M Sulaiman ACA ACMA B E Wijesuriya FCA ACMA
Principal T P M Ruberu FCMA, FCCA
A member firm of Ernst & Young Global Limited
Financial Reports

Malwatte Valley Plantations PLC | Annual Report 201622
stAteMent of pRofit oR lossFor the year ended 31 December 2016
Group Company 2016 2015 2016 2015As at 31 December 2016 Notes Rs. Rs. Rs. Rs. Revenue 6 2,938,042,568 2,919,284,479 2,857,080,988 2,881,044,544Cost of sales (2,938,824,745) (3,032,953,730) (2,863,829,535) (2,995,967,182)Gross profit /(loss) (782,177) (113,669,251) (6,748,547) (114,922,638)Gain on change in fair value of biological assets 17.1 165,593,637 61,400,215 165,593,637 61,400,215 Other income 7 122,539,963 63,995,226 122,539,963 63,995,226Administrative expenses (162,962,176) (253,320,378) (157,054,237) (253,247,543)Results from operating activities 124,389,247 -241,594,188 124,330,816 -242,774,740Finance Income 8.1 80,332,823 71,942,965 80,332,823 71,942,965Finance expenses 8.2 (104,038,802) (72,620,252) (104,038,802) (72,620,252)Interest paid to Government on finance lease 8.3 (28,039,007) (27,085,414) (28,039,007) (27,085,414)Net finance cost (51,744,986) (27,762,701) (51,744,986) (27,762,701)Profit/ (Loss) before tax 9 72,644,261 (269,356,889) 72,585,830 (270,537,441)Tax (expense) /Reversal 10 (10,143,847) (8,524,650) (10,132,058) (8,524,651)Profit / (Loss) for the year 62,500,414 (277,881,539) 62,453,772 (279,062,092)Basic earnings/ (loss) per share (Rs.) 11.1 0.28 (1.24) 0.28 (1.25)Dividend per Share (Rs.) 11.2 - - - -
The accounting policies and notes on pages 29 through 80 form an integral part of the financial statements.

Malwatte Valley Plantations PLC | Annual Report 2016 23
Group Company 2016 2015 2016 2015As at 31 December 2016 Notes Rs. Rs. Rs. Rs. Profit for the year 62,500,414 (277,881,539) 62,453,772 (279,062,092)Other comprehensive income for the year, net of tax Net other comprehensive income/(Loss) to be reclassified to profit or Loss in subsequent period Net (loss) / gain on available for sale financial assets 15.3 (9,970) (7,125) (9,970) (7,125)Tax effect 10.2 - - - - Exchange Differences on translation of foreign operations 6,355,778 (1,587,186) - - Tax effect - - - - Total Net other comprehensive income/(Loss) to be reclassified to profit or Loss in subsequent period 6,345,808 (1,594,311) (9,970) (7,125)Net other comprehensive income/(Loss) not be reclassified to profit or Loss in subsequent period Actuarial gains/ (losses) on defined benefit plans 27 157,106,686 26,072,408 157,106,686 26,072,408 Tax effect 10.2 (24,760,014) (4,109,012) (24,760,014) (4,109,012)Total Net other comprehensive income/(Loss) not be reclassified to profit or Loss in subsequent period 132,346,672 21,963,396 132,346,672 21,963,396 Total Other comprehensive income for the year, net of tax 138,692,481 20,369,085 132,336,702 21,956,271 Total comprehensive income for the year, net of tax 201,192,895 (257,512,454) 194,790,474 (257,105,821)
The accounting policies and notes on pages 29 through 80 form an integral part of the financial statements.
stAteMent of CoMpReHensiVe inCoMeFor the year ended 31 December 2016
Financial Reports
Malwatte Valley Plantations PLC | Annual Report 201624
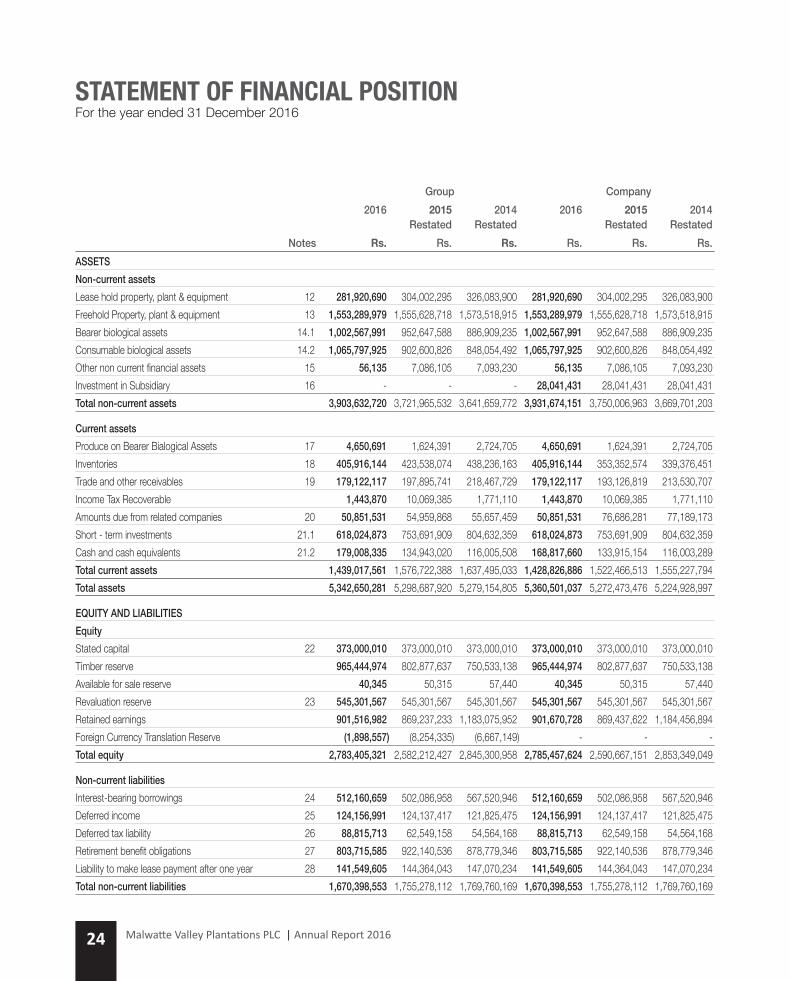
stAteMent of finAnCiAl positionFor the year ended 31 December 2016
Group Company 2016 2015 2014 2016 2015 2014 Restated Restated Restated Restated Notes Rs. Rs. Rs. Rs. Rs. Rs.ASSETSNon-current assets Lease hold property, plant & equipment 12 281,920,690 304,002,295 326,083,900 281,920,690 304,002,295 326,083,900 Freehold Property, plant & equipment 13 1,553,289,979 1,555,628,718 1,573,518,915 1,553,289,979 1,555,628,718 1,573,518,915 Bearer biological assets 14.1 1,002,567,991 952,647,588 886,909,235 1,002,567,991 952,647,588 886,909,235 Consumable biological assets 14.2 1,065,797,925 902,600,826 848,054,492 1,065,797,925 902,600,826 848,054,492 Other non current financial assets 15 56,135 7,086,105 7,093,230 56,135 7,086,105 7,093,230 Investment in Subsidiary 16 - - - 28,041,431 28,041,431 28,041,431 Total non-current assets 3,903,632,720 3,721,965,532 3,641,659,772 3,931,674,151 3,750,006,963 3,669,701,203
Current assets Produce on Bearer Bialogical Assets 17 4,650,691 1,624,391 2,724,705 4,650,691 1,624,391 2,724,705 Inventories 18 405,916,144 423,538,074 438,236,163 405,916,144 353,352,574 339,376,451 Trade and other receivables 19 179,122,117 197,895,741 218,467,729 179,122,117 193,126,819 213,530,707 Income Tax Recoverable 1,443,870 10,069,385 1,771,110 1,443,870 10,069,385 1,771,110 Amounts due from related companies 20 50,851,531 54,959,868 55,657,459 50,851,531 76,686,281 77,189,173 Short - term investments 21.1 618,024,873 753,691,909 804,632,359 618,024,873 753,691,909 804,632,359 Cash and cash equivalents 21.2 179,008,335 134,943,020 116,005,508 168,817,660 133,915,154 116,003,289 Total current assets 1,439,017,561 1,576,722,388 1,637,495,033 1,428,826,886 1,522,466,513 1,555,227,794 Total assets 5,342,650,281 5,298,687,920 5,279,154,805 5,360,501,037 5,272,473,476 5,224,928,997
EQUITY AND LIABILITIES Equity Stated capital 22 373,000,010 373,000,010 373,000,010 373,000,010 373,000,010 373,000,010 Timber reserve 965,444,974 802,877,637 750,533,138 965,444,974 802,877,637 750,533,138 Available for sale reserve 40,345 50,315 57,440 40,345 50,315 57,440 Revaluation reserve 23 545,301,567 545,301,567 545,301,567 545,301,567 545,301,567 545,301,567 Retained earnings 901,516,982 869,237,233 1,183,075,952 901,670,728 869,437,622 1,184,456,894 Foreign Currency Translation Reserve (1,898,557) (8,254,335) (6,667,149) - - - Total equity 2,783,405,321 2,582,212,427 2,845,300,958 2,785,457,624 2,590,667,151 2,853,349,049
Non-current liabilities Interest-bearing borrowings 24 512,160,659 502,086,958 567,520,946 512,160,659 502,086,958 567,520,946 Deferred income 25 124,156,991 124,137,417 121,825,475 124,156,991 124,137,417 121,825,475 Deferred tax liability 26 88,815,713 62,549,158 54,564,168 88,815,713 62,549,158 54,564,168 Retirement benefit obligations 27 803,715,585 922,140,536 878,779,346 803,715,585 922,140,536 878,779,346 Liability to make lease payment after one year 28 141,549,605 144,364,043 147,070,234 141,549,605 144,364,043 147,070,234 Total non-current liabilities 1,670,398,553 1,755,278,112 1,769,760,169 1,670,398,553 1,755,278,112 1,769,760,169

Malwatte Valley Plantations PLC | Annual Report 2016 25
Current liabilities Trade and other payables 29 357,693,320 301,463,368 302,115,276 353,452,117 301,333,290 301,980,407 Liability to make lease payment within one year 28 2,814,438 2,706,191 2,602,106 2,814,438 2,706,191 2,602,106 Amounts due to related companies 30 - - - 20,039,657 - - Interest-bearing borrowings payable within one year 24 176,972,465 246,573,385 144,602,780 176,972,465 212,034,295 82,463,748 Dividend payables 403,701 5,716,630 5,324,702 403,701 5,716,630 5,324,703 NBT payables 504,458 330,003 305,190 504,458 330,003 305,190 VAT Payable 17,336 177,060 - 17,336 177,060 - Bank overdraft 21.3 350,440,688 404,230,743 209,143,625 350,440,688 404,230,743 209,143,625 Total current liabilities 888,846,406 961,197,381 664,093,678 904,644,860 926,528,213 601,819,779 Total liabilities 2,559,244,959 2,716,475,493 2,433,853,847 2,575,043,413 2,681,806,325 2,371,579,948 Total equity and liabilities 5,342,650,281 5,298,687,920 5,279,154,805 5,360,501,037 5,272,473,476 5,224,928,997 These Financial Statements are in compliance with the requirements of the Companies Act No. 07 of 2007
Chief Financial Officer The Board of Directors is responsible for the preparation and presentation of these Financial Statements.
Approved and signed for and on behalf of the Board of Directors of Malwatte Valley Plantations PLC
DIRECTOR DIRECTOR
The accounting policies and notes on pages 29 through 80 form an integral part of the financial statements. 15 May 2017 Colombo
stAteMent of finAnCiAl positionFor the year ended 31 December 2016
Group Company 2016 2015 2014 2016 2015 2014 Restated Restated Restated Restated Notes Rs. Rs. Rs. Rs. Rs. Rs.
Financial Reports

Malwatte Valley Plantations PLC | Annual Report 201626
stAteMent of CHAnges in eQuityFor the year ended 31 December 2016
Group Foreign Currency Stated Timber Available for Revaluation Translation Retained Total Capital Reserve Sale Reserve Reserve Reserve Earnings Equity Rs. Rs. Rs. Rs. Rs. Rs. Rs.Balance as at 01 January 2015 373,000,010 750,533,138 57,440 545,301,567 (6,667,149) 1,180,351,247 2,842,576,253 Impact of the amendments of LKAS 16 & LKAS 41 ( Refer Note No 34 ) - - - - - 2,724,705 2,724,705 Balance as at 01 January 2015 - Restated 373,000,010 750,533,138 57,440 545,301,567 (6,667,149) 1,183,075,952 2,845,300,958 Loss for the period - - - - - (277,881,539) (276,781,225)Total Other comprehensive income for the year, net of tax - - (7,125) - (1,587,186) 21,963,396 20,369,085 Transferred to the Timber Reserve - 62,500,529 - - - (62,500,529) - Realised gain on harvested timber trees - (10,156,030) - - - 10,156,030 - Dividends - - - - - (5,576,077) (5,576,077)Balance as at 31 December 2015 373,000,010 802,877,637 50,315 545,301,567 (8,254,335) 869,237,233 2,583,312,741 Loss for the period - - - - - 62,500,414 62,500,414 Total Other comprehensive income for the year, net of tax - - (9,970) - 6,355,778 132,346,672 138,692,481 Transferred to the Timber Reserve - 162,567,337 - - - (162,567,337) - Realised gain on harvested timber trees - - - - Dividends - - - - - Balance as at 31 December 2016 373,000,010 965,444,974 40,345 545,301,567 (1,898,557) 901,516,982 2,783,405,322
Company Stated Timber Available for Revaluation Retained Total Capital Reserve Sale Reserve Reserve Earnings Equity Rs. Rs. Rs. Rs. Rs. Rs.
Balance as at 01 January 2015 ( as previouly reported ) 373,000,010 750,533,138 57,440 545,301,567 1,181,732,189 2,850,624,344 Impact of the amendments of LKAS 16 & LKAS 41 ( Refer Note No 34 ) 2,724,705 2,724,705Balance as at 01 January 2015 - Restated 373,000,010 750,533,138 57,440 545,301,567 1,184,456,894 2,853,349,049 Loss for the period - - - - (279,062,092) (279,062,092)Total Other comprehensive income for the year, net of tax - - (7,125) - 21,963,396 21,956,271 Transferred to the Timber Reserve - 62,500,529 - - (62,500,529) - Realised gain on harvested timber trees (10,156,030) 10,156,030 - Dividends - - - - (5,576,077) (5,576,077)Balance as at 31 December 2015 373,000,010 802,877,637 50,315 545,301,567 869,437,622 2,590,667,151 Loss for the period - - - - 62,453,772 62,453,772 Total Other comprehensive income for the year, net of tax - - (9,970) - 132,346,672 132,336,702 Transferred to the Timber Reserve - 162,567,337 - - (162,567,337) - Realised gain on harvested timber trees Balance as at 31 December 2016 373,000,010 965,444,974 40,345 545,301,567 901,670,729 2,785,457,625
The accounting policies and notes on pages 29 through 80 form an integral part of the financial statements.

Malwatte Valley Plantations PLC | Annual Report 2016 27
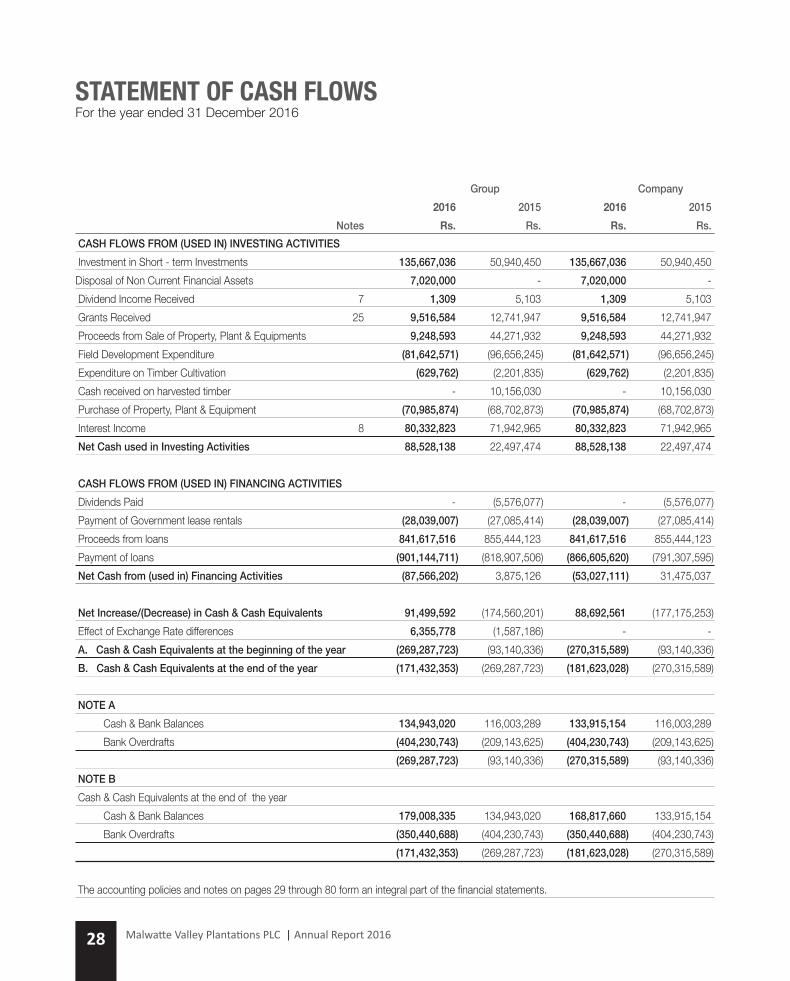
stAteMent of CAsH flowsFor the year ended 31 December 2016
Group Company 2016 2015 2016 2015 Notes Rs. Rs. Rs. Rs. CASH FLOWS FROM OPERATING ACTIVITIES Net Profit / (Loss) before Taxation 72,644,261 (269,356,889) 72,585,830 (270,537,441) ADJUSTMENTS FOR Dividend Income 7 (1,309) (5,103) (1,309) (5,103) Interest Income 8.1 (80,332,823) (71,942,965) (80,332,823) (71,942,965) Depreciation/Amortisation 12/13/14 123,228,386 114,097,741 123,228,386 114,097,741 Provision for Defined Benefit Plan 27 127,127,412 133,136,550 127,127,412 133,136,550 Amortisation of Grants 25 (9,497,010) (10,430,005) (9,497,010) (10,430,005) Finance Costs 8.2/8.3 132,077,809 99,705,666 132,077,809 99,705,666 Profit on disposal of Property, Plant & Equipments 7 (5,344,593) (18,751,202) (5,344,593) (18,751,202)Gain on change in fair value of biological assets 14 (165,593,637) (61,400,215) (165,593,637) (61,400,215) Written off of amount due to related parties 7,186,158 7,186,158 7,186,158 7,186,158 Operating Profit before Working Capital Changes 201,494,654 (77,760,265) 201,436,223 (78,940,817) (Increase)/Decrease in Trade and other receivables 25,523,883 12,273,713 20,750,933 12,105,613 (Increase)/Decrease in Inventories 17,621,930 14,698,089 (52,563,570) (13,976,123) Increase/(Decrease) in Trade and other payables 48,209,748 (55,914) 44,114,437 (53,315) (Increase)/Decrease in amounts due from Related Parties (3,077,821) (6,488,568) 18,648,592 (6,683,266) Increase/(Decrease) in amounts due to Related Parties - - 20,039,657 - Cash Generated from Operations 289,772,394 (57,332,945) 252,426,272 (87,547,908) Finance Costs Paid (104,038,802) (72,620,252) (104,038,802) (72,620,252) ESC/ Income Tax Paid (6,750,259) (7,276,652) (6,750,259) (7,276,652) Defined Benefit Plan Costs paid 27 (88,445,677) (63,702,952) (88,445,677) (63,702,952) Net Cash from Operating Activities 90,537,656 (200,932,801) 53,191,534 (231,147,764)
Financial Reports
Malwatte Valley Plantations PLC | Annual Report 201628
stAteMent of CAsH flowsFor the year ended 31 December 2016
Group Company 2016 2015 2016 2015 Notes Rs. Rs. Rs. Rs. CASH FLOWS FROM (USED IN) INVESTING ACTIVITIES Investment in Short - term Investments 135,667,036 50,940,450 135,667,036 50,940,450 Disposal of Non Current Financial Assets 7,020,000 - 7,020,000 - Dividend Income Received 7 1,309 5,103 1,309 5,103 Grants Received 25 9,516,584 12,741,947 9,516,584 12,741,947 Proceeds from Sale of Property, Plant & Equipments 9,248,593 44,271,932 9,248,593 44,271,932 Field Development Expenditure (81,642,571) (96,656,245) (81,642,571) (96,656,245) Expenditure on Timber Cultivation (629,762) (2,201,835) (629,762) (2,201,835) Cash received on harvested timber - 10,156,030 - 10,156,030 Purchase of Property, Plant & Equipment (70,985,874) (68,702,873) (70,985,874) (68,702,873) Interest Income 8 80,332,823 71,942,965 80,332,823 71,942,965 Net Cash used in Investing Activities 88,528,138 22,497,474 88,528,138 22,497,474 CASH FLOWS FROM (USED IN) FINANCING ACTIVITIES Dividends Paid - (5,576,077) - (5,576,077) Payment of Government lease rentals (28,039,007) (27,085,414) (28,039,007) (27,085,414) Proceeds from loans 841,617,516 855,444,123 841,617,516 855,444,123 Payment of loans (901,144,711) (818,907,506) (866,605,620) (791,307,595) Net Cash from (used in) Financing Activities (87,566,202) 3,875,126 (53,027,111) 31,475,037 Net Increase/(Decrease) in Cash & Cash Equivalents 91,499,592 (174,560,201) 88,692,561 (177,175,253) Effect of Exchange Rate differences 6,355,778 (1,587,186) - - A. Cash & Cash Equivalents at the beginning of the year (269,287,723) (93,140,336) (270,315,589) (93,140,336) B. Cash & Cash Equivalents at the end of the year (171,432,353) (269,287,723) (181,623,028) (270,315,589) NOTE A Cash & Bank Balances 134,943,020 116,003,289 133,915,154 116,003,289 Bank Overdrafts (404,230,743) (209,143,625) (404,230,743) (209,143,625) (269,287,723) (93,140,336) (270,315,589) (93,140,336) NOTE B Cash & Cash Equivalents at the end of the year Cash & Bank Balances 179,008,335 134,943,020 168,817,660 133,915,154 Bank Overdrafts (350,440,688) (404,230,743) (350,440,688) (404,230,743) (171,432,353) (269,287,723) (181,623,028) (270,315,589) The accounting policies and notes on pages 29 through 80 form an integral part of the financial statements.

Malwatte Valley Plantations PLC | Annual Report 2016 29
notes to tHe finAnCiAl stAteMentsFor the year ended 31 December 2016
1. REPORTING ENTITY1.1 Domicile and legal form Malwatte Valley Plantations PLC (the Company) was
incorporated and domiciled in Sri Lanka, under the Companies Act. No. 17 of 1982. (The Company was re-registered under the Companies Act No. 07 of 2007) in terms of the provisions of the Conversion of Public Corporation and Government Owned Business Undertakings into Public Companies Act No. 23 of 1987.
The registered office of the Company is located at No. 280, Dam Street, Colombo 12, and Plantations are situated in the planting districts of Bandarawela, Badulla and Awissawella.
The ordinary shares of the Company are listed on the Colombo Stock Exchange of Sri Lanka.
The Consolidated Financial Statements of Malwatte Valley Plantations PLC as at and for the year ended 31 December 2016 comprise the Company and its Subsidiary namely Prime Real Estate Australia (Pvt) Ltd which incorporated and domiciled in Australia (together referred to as the ‘Group’).
The Financial Statements of the Company and the Group comprise the Statement of Profit or Loss, Statement of Comprehensive Income, Statement of Financial Position, Statement of Changes in Equity, Statement of Cash Flows together with Accounting Policies and Notes to the Financial Statements.
The Financial Statements of all companies in the Group are prepared for a common financial year, which ends on 31 December.
1.2 Principal activities and nature of operations
During the year, the principal activities of the Company were cultivation, manufacture and sale of Black Tea, Rubber and other crops.
The subsidiary of the group engaged in the business of real estate and construction.
1.3 Parent enterprise The Company’s parent undertaking is Wayamba
Plantation Managements (Pvt) Ltd.
1.4 Date of authorization for issues The Financial Statements of Malwatte Valley Plantations
PLC for the year ended 31 December 2016 were authorized for issue in accordance with a resolution of the Board of Directors on 15 May 2017.
1.5 Responsibility for Financial Statements The responsibility of the directors in relation to the
Financial Statements is set out in the Statement of Directors’ responsibility report in the Annual Report.
2 BASIS OF PREPARATION2.1 Statement of compliance The Financial Statements of the Company and the
Group have been prepared in accordance with Sri Lanka Accounting and Auditing Standards Act. No. 15 of 1995 which requires compliance with Sri Lanka Accounting Standards promulgated by The Institute of Chartered Accountants of Sri Lanka (CASL), and with the requirements of the Companies Act. No. 07 of 2007.
2.2 Basis of measurement These Financial Statements have been prepared in
accordance with the historical cost convention other than consumable biological assets, produce on bearer biological asset, Land & buildings and financial instruments that have been measured at fair value and where appropriate specific policies are explained in the succeeding notes.
No adjustments have been made for inflationary factors in the Financial Statements.
2.3 Functional and presentation currency The Financial Statements are presented in Sri Lankan
Rupees (Rs.) which is the Group’s presentation currency. Functional Currency of the subsidiary is Australian Dollars. All financial information presented in Sri Lankan Rupees has been given to the nearest rupee, unless stated otherwise.
Financial Reports
Malwatte Valley Plantations PLC | Annual Report 201630
2.4 Materiality and aggregation Each material class of similar items is presented
separately in the Consolidated Financial Statements. Items of a dissimilar nature or function are presented separately unless they are immaterial.
3 SUMMARY OF SIGNIFICANT ACCOUNTING POLICIES
3.1 Comparative information The presentation and classification of the financial
statements of the current year are comparable with those of the previous year.
3.2 Changes to the Accounting Policies & estimates
Initial application of Amendments to LKAS 16 & 41 – Produce growing on bearer plants
Amendments to LKAS 16 - Property, Plant & Equipment and LKAS 41 – Agriculture, require entity to recognise agricultural produce growing on Bearer Plants at fair value less cost to sell separately from its bearer plants prior to harvest. After initial recognition, changes in the fair value of such agricultural produce growing on Bearer Plants, recognised in profit or loss at the end of each reporting period.
Accordingly, the Group has applied these amendments retrospectively in the Financials Statements. For the details refer note 36.
3.3 Going concern The financial statements have been prepared on the
assumption that the company is a going concern. The Directors have made an assessment of the Group’s ability to continue as a going concern in the foreseeable future, and they do not foresee a need for liquidation or cessation of trading, to justify adopting the going concern basis in preparing these financial statements.
3.4 Basis of Consolidation The consolidated financial statements comprise the
financial statements of the Group and its subsidiaries as at 31 December 2016. Control is achieved when the Group is exposed, or has rights, to variable returns from its involvement with the investee and has the ability to affect those returns through its power over the investee.
Specifically, the Group controls an investee if, and only if, the Group has:
• Power over the investee (i.e., existing rights that give it the current ability to direct the relevant activities of the investee)
• Exposure, or rights, to variable returns from its involvement with the investee
• The ability to use its power over the investee to affect its returns
Generally, there is a presumption that a majority of voting rights result in control. To support this presumption and when the Group has less than a majority of the voting or similar rights of an investee, the Group considers all relevant facts and circumstances in assessing whether it has power over an investee, including:
• The contractual arrangement with the other vote holders of the investee
• Rights arising from other contractual arrangements
• The Group’s voting rights and potential voting rights
The Group re-assesses whether or not it controls an investee if facts and circumstances indicate that there are changes to one or more of the three elements of control. Consolidation of a subsidiary begins when the Group obtains control over the subsidiary and ceases when the Group loses control of the subsidiary. Assets, liabilities, income and expenses of a subsidiary acquired or disposed of during the year are included in the consolidated financial statements from the date the Group gains control until the date the Group ceases to control the subsidiary.
Profit or loss and each component of Other
Comprehensive Income (OCI) are attributed to the equity holders of the parent of the Group and to the non-controlling interests, even if this results in the non-controlling interests having a deficit balance. When necessary, adjustments are made to the financial statements of subsidiaries to bring their accounting policies into line with the Group’s accounting policies. All intra-group assets and liabilities, equity, income, expenses and cash flows relating to transactions between members of the Group are eliminated in full on consolidation.
notes to tHe finAnCiAl stAteMentsFor the year ended 31 December 2016

Malwatte Valley Plantations PLC | Annual Report 2016 31
A change in the ownership interest of a subsidiary, without a loss of control, is accounted for as an equity transaction.
If the Group loses control over a subsidiary, it
derecognises the related assets (including goodwill), liabilities, non-controlling interest and other components of equity while any resultant gain or loss is recognised in profit or loss. Any investment retained is recognised at fair value.
3.4.1 Business Combinations and Good will Business combinations are accounted for using
the acquisition method. The cost of an acquisition is measured as the aggregate of the consideration transferred, measured at acquisition date fair value and the amount of any Non-Controlling Interest in the acquiree. For each business combination, the Group elects whether it measures the Non-Controlling Interest in the acquiree either at fair value or at the proportionate share of the acquiree’s identifiable net assets. Acquisition-related costs are expensed as incurred and included in administrative expenses.
When the Group acquires a business, it assesses the financial assets and liabilities assumed for appropriate classification and designation in accordance with the contractual terms, economic circumstances and pertinent conditions as at the acquisition date.
If the business combination is achieved in stages, any previously held equity interest is remeasured at its acquisition date fair value and any resulting gain or loss is recognised in profit or loss.
Any contingent consideration to be transferred by the acquirer will be recognised at fair value at the acquisition date. Contingent consideration classified as an asset or liability that is a financial instrument and within the scope of LKAS 39 Financial Instruments: Recognition and Measurement, is measured at fair value with changes in fair value recognised either in profit or loss or as a change to OCI. If the contingent consideration is not within the scope of LKAS 39, it is measured in accordance with the appropriate SLFRS. Contingent consideration that is classified as equity is not remeasured and subsequent settlement is accounted for within equity.
Goodwill is initially measured at cost, being the excess of the aggregate of the consideration transferred and the amount recognised for non-controlling interests, and any previous interest held, over the net identifiable assets acquired and liabilities assumed. If the fair value of the net assets acquired is in excess of the aggregate consideration transferred, the Group re-assesses whether it has correctly identified all of the assets acquired and all of the liabilities assumed and reviews the procedures used to measure the amounts to be recognised at the acquisition date. If the reassessment still results in an excess of the fair value of net assets acquired over the aggregate consideration transferred, then the gain is recognised in profit or loss.
After initial recognition, goodwill is measured at cost less any accumulated impairment losses. For the purpose of impairment testing, goodwill acquired in a business combination is, from the acquisition date, allocated to each of the Group’s cash-generating units that are expected to benefit from the combination, irrespective of whether other assets or liabilities of the acquiree are assigned to those units.
Where goodwill has been allocated to a cash-generating unit and part of the operation within that unit is disposed of, the goodwill associated with the disposed operation is included in the carrying amount of the operation when determining the gain or loss on disposal. Goodwill disposed in these circumstances is measured based on the relative values of the disposed operation and the portion of the cash-generating unit retained.
3.5 Current versus non-current classification The Group presents assets and liabilities in statement
of financial position based on current/non -current classification. An asset as current when it is:
• Expected to be realised or intended to sold or consumed in normal operating cycle
• Held primarily for the purpose of trading
• Expected to be realised within twelve months after the reporting period
Or
• Cash or cash equivalent unless restricted from being exchanged or used to settle a liability for at least twelve months after the reporting period
notes to tHe finAnCiAl stAteMentsFor the year ended 31 December 2016
Financial Reports

Malwatte Valley Plantations PLC | Annual Report 201632
All other assets are classified as non-current.
A liability is current when:
• It is expected to be settled in normal operating cycle • It is held primarily for the purpose of trading • It is due to be settled within twelve months after the
reporting period Or • There is no unconditional right to defer the settlement
of the liability for at least twelve months after the reporting period
` The Group classifies all other liabilities as non-current.
Deferred tax assets and liabilities are classified as non-current assets and liabilities.
3.6 Fair Value Measurement The Group measures financial instruments and non-
financial assets at fair value at each statement of financial position date. Fair value related disclosures for financial instruments and non-financial assets that are measured at fair value or where fair values are disclosed are summarised in the following notes:
• Consumable biological assets - Note 14.2• Produce on bearer biological asset - Note 17• Financial Instrument (including those carried at
amortized cost)
Fair value is the price that would be received to sell an asset or paid to transfer a liability in an orderly transaction between market participants at the measurement date. The fair value measurement is based on the presumption that the transaction to sell the asset or transfer the liability takes place either:
• In the principal market for the asset or liability Or • In the absence of a principal market, in the most
advantageous market for the asset or liability
The principal or the most advantageous market must be accessible by the Group.
The fair value of an asset or a liability is measured using the assumptions that market participants would use
notes to tHe finAnCiAl stAteMentsFor the year ended 31 December 2016
when pricing the asset or liability, assuming that market participants act in their economic best interest.
A fair value measurement of a non-financial asset takes into account a market participant’s ability to generate economic benefits by using the asset in its highest and best use or by selling it to another market participant that would use the asset in its highest and best use.
The Group uses valuation techniques that are
appropriate in the circumstances and for which sufficient data are available to measure fair value, maximising the use of relevant observable inputs and minimising the use of unobservable inputs.
All assets and liabilities for which fair value is measured or disclosed in the financial statements are categorised within the fair value hierarchy, described as follows, based on the lowest level input that is significant to the fair value measurement as a whole:
• Level 1 — Quoted (unadjusted) market prices in active markets for identical assets or liabilities
• Level 2 — Valuation techniques for which the lowest level input that is significant to the fair value measurement is directly or indirectly observable
• Level 3 — Valuation techniques for which the lowest level input that is significant to the fair value measurement is unobservable
For assets and liabilities that are recognised in the financial statements on a recurring basis, the Group determines whether transfers have occurred between levels in the hierarchy by re-assessing categorisation (based on the lowest level input that is significant to the fair value measurement as a whole) at the end of each reporting period.
External valuers are involved for valuation of significant assets, such as Consumable biological assets, and significant liabilities, such as retirement benefit obligation. Involvement of external valuers is decided upon annually by the Management Committee after discussion with and approval by the Company’s Audit Committee. Selection criteria include market knowledge, reputation, independence and whether professional standards are maintained. The Management Committee decides, after discussions with the Group’s external valuers, which valuation techniques and inputs to use for each case.

Malwatte Valley Plantations PLC | Annual Report 2016 33
notes to tHe finAnCiAl stAteMentsFor the year ended 31 December 2016
For the purpose of fair value disclosures, the Group has determined classes of assets and liabilities on the basis of the nature, characteristics and risks of the asset or liability and the level of the fair value hierarchy as explained above.
3.7 Foreign currencies The Group’s consolidated financial statements are
presented in Sri Lankan Rupees, which is also the parent company’s functional currency. For each entity the Group determines the functional currency and items included in the financial statements of each entity are measured using that functional currency.
Transactions in foreign currencies are initially recorded by the Group’s entities at their respective functional currency spot rates at the date the transaction first qualifies for recognition.
Monetary assets and liabilities denominated in foreign currencies are translated at the functional currency spot rates of exchange at the reporting date.
Differences arising on settlement or translation of monetary items are recognised in statement of profit or loss with the exception of monetary items that are designated as part of the hedge of the Group’s net investment of a foreign operation. These are recognised in other comprehensive income until the net investment is disposed of, at which time, the cumulative amount is reclassified to statement of profit or loss. Tax charges and credits attributable to exchange differences on those monetary items are also recorded in other comprehensive income.
Non-monetary items that are measured in terms of historical cost in a foreign currency are translated using the exchange rates at the dates of the initial transactions. Non-monetary items measured at fair value in a foreign currency are translated using the exchange rates at the date when the fair value is determined. The gain or loss arising on translation of non-monetary items measured at fair value is treated in line with the recognition of the gain or loss on the change in fair value of the item (i.e., translation differences on items whose fair value gain or loss is recognised in OCI or profit or loss are also recognised in OCI or profit or loss, respectively).
3.8 Cash dividend and non-cash distribution to equity holders of the parent
The Company recognises a liability to make cash or non-cash distributions to equity holders of the parent when the distribution is authorised and the distribution is no longer at the discretion of the Company. A distribution is authorised when it is approved by the shareholders. A corresponding amount is recognised directly in equity.
Non-cash distributions are measured at the fair value of the assets to be distributed with fair value remeasurement recognised directly in equity.
Upon distribution of non-cash assets, any difference between the carrying amount of the liability and the carrying amount of the assets distributed is recognised in the statement of profit or loss.
3.9 Property, plant and equipment The group applies the requirements of LKAS 16 on
“Property Plant and Equipment” in accounting for its owned assets which are held for and use in the provision of the services , for rental to other or for administration purpose and are expected to be used for more than one year.
3.9.1 Recognition and measurement Property, Plant and Equipment is recognised if it is
probable that future economic benefit associated with the assets will flow to the Group and cost of the asset can be reliably measured.
Items of property, plant and equipment are measured at cost (or at fair value in the case of consumable biological asset and land & building), less accumulated depreciation and accumulated impairment losses, if any.
3.9.2 Owned assets The cost of property, plant and equipment includes
expenditures that are directly attributable to the acquisition of the asset. Such costs includes the cost of replacing part of the property, plant and equipment and borrowing costs for long-term construction projects if the recognition criteria are met. The cost of self-constructed assets includes the cost of materials and direct labor, any other cost directly attributable to bringing the asset to a working condition for its intended
Financial Reports

Malwatte Valley Plantations PLC | Annual Report 201634
use, and the costs of dismantling and removing the items and restoring the site on which they are located. Purchased software that is integral to the functionality of the related equipment is capitalized as a part of that equipment.
When significant parts of property, plant and equipment are required to be replaced at intervals, the entity recognizes such parts as individual assets with specific useful lives and depreciation, respectively. Likewise, when a major inspection is preformed, its cost is recognized in the carrying amount of the plant and equipment as a replacement if the recognition criteria are satisfied. All other repair and maintenance costs are recognised in the statement of profit or loss as incurred. The present value of the expected cost for the decommissioning of the asset after its use is included in the cost of the respective asset if the recognition criteria for a provision are met.
Land and buildings are measured at fair value less accumulated depreciation on buildings and impairment charged subsequent to the date of the revaluation. Valuations are performed with sufficient frequency to ensure that the fair value of a revalued asset does not differ materially from its carrying amount. The company’s policy is to revalue Land and Buildings once in every four years.
Capital work in progress is transferred to the respective asset accounts at the time, the asset is ready for utilization or at the time the asset is commissioned.
3.9.3 Leased assets The determination of whether an arrangement is
(or contains) a lease is based on the substance of the arrangement at the inception of the lease. The arrangement is, or contains, a lease if fulfilment of the arrangement is dependent on the use of a specific asset or assets and the arrangement conveys a right to use the asset or assets, even if that right is not explicitly specified in an arrangement.
Group as a lessee A lease is classified at the inception date as a finance
lease or an operating lease. A lease that transfers substantially all the risks and rewards incidental to ownership to the Group is classified as a finance lease.
Finance leases are capitalised at the commencement of the lease at the inception date fair value of the leased property or, if lower, at the present value of the minimum lease payments. Lease payments are apportioned between finance charges and reduction of the lease liability so as to achieve a constant rate of interest on the remaining balance of the liability. Finance charges are recognised in finance costs in the statement of profit or loss.
A leased asset is depreciated over the useful life of the asset. However, if there is no reasonable certainty that the Group will obtain ownership by the end of the lease term, the asset is depreciated over the shorter of the estimated useful life of the asset and the lease term.
Operating lease payments are recognised as an operating expense in the statement of profit or loss on a straight-line basis over the lease term.
3.9.4 De-recognition An item of property, plant and equipment and any
significant part initially recognised is derecognised upon disposal or when no future economic benefits are expected from its use or disposal. Any gain or loss arising on derecognition of the asset (calculated as the difference between the net disposal proceeds and the carrying amount of the asset) is included in the statement of profit or loss when the asset is derecognized and gains are not classified as revenue.
3.9.5 Land improvement cost Permanent land improvement costs are those costs
incurred in making major infrastructure development and building new access roads on leasehold lands.
These costs have been capitalized and amortised over the remaining lease period.
Permanent impairments to land development costs are charged to the Statement of Profit or Loss in full or reduced to the net carrying amounts of such assets in the year of occurrence after ascertaining the loss.
3.9.6 Biological Assets Biological assets are classified in to mature biological
assets and immature biological assets. Mature biological assets are those that have attained harvestable specifications or are able to sustain regular harvests.
notes to tHe finAnCiAl stAteMentsFor the year ended 31 December 2016

Malwatte Valley Plantations PLC | Annual Report 2016 35
Immature biological assets are those that have not yet attained harvestable specifications. Tea, rubber, other plantations and nurseries are classified as biological assets.
Biological assets are further classified as bearer biological assets and consumable biological assets. Bearer biological asset includes tea and rubber trees, those that are not intended to be sold or harvested, however used to grow for harvesting agricultural produce from such biological assets. Consumable biological assets includes managed timber trees those that are to be harvested as agricultural produce or sold as biological assets.
The entity recognize the biological assets when, and only when, the entity controls the assets as a result of past event, it is probable that future economic benefits associated with the assets will flow to the entity and the fair value or cost of the assets can be measured reliably.
3.9.6.1 Bearer Biological Asset The bearer biological assets are measured at cost less
accumulated depreciation and accumulated impairment losses, if any, in terms of LKAS 16 – Property Plant & Equipment.
The cost of land preparation, rehabilitation, new planting, replanting, crop diversification, inter planting and fertilising, etc., incurred between the time of planting and harvesting (when the planted area attains maturity), are classified as immature plantations. These immature plantations are shown at direct costs plus attributable overheads. The expenditure incurred on bearer biological assets (Tea, Rubber) which comes into bearing during the year, is transferred to mature plantations.
3.9.6.2 Infilling Cost on Bearer Biological Assets The land development costs incurred in the form of
infilling have been capitalised to the relevant mature field, only where the number of plants per hectare exceeded 3,000 plants and, also if it increases the expected future benefits from that field, beyond its pre-infilling performance assessment. Infilling costs so capitalised are depreciated over the newly assessed remaining useful economic life of the relevant mature plantation, or the unexpired lease period, whichever is lower.
Infilling costs that are not capitalised have been charged to the Profit or Loss Statement in the year in which they are incurred.
3.9.6.3 Borrowing Cost Borrowing costs that are directly attributable to
acquisition, construction or production of a qualifying asset, which takes a substantial period of time to get ready for its intended use or sale are capitalised as a part of the asset.
Borrowing costs that are not capitalised are recognised as expenses in the period in which they are incurred and charged to the Profit or Loss Statement.
The amounts of the borrowing costs which are eligible for capitalisation are determined in accordance with the in LKAS 23 - Borrowing Costs’.
Borrowing costs incurred in respect of specific loans that are utilised for field development activities have been capitalised as a part of the cost of the relevant immature plantation. The capitalisation will cease when the crops are ready for commercial harvest.
The amount so capitalised and the capitalisation rates are disclosed in Notes to the Financial Statements.
3.9.6.4 Consumable Biological Asset Consumable biological assets includes managed timber
trees those that are to be harvested as agricultural produce or sold as biological assets. Expenditure incurred on consumable biological assets (managed timber trees) is measured on initial recognition and at the end of each reporting period at its fair value less cost to sell in terms of LKAS 41. The cost is treated as approximation to fair value of young plants as the impact on biological transformation of such plants to price during this period is immaterial. The fair value of timber trees are measured using DCF method taking in to consideration the current market prices of timber, applied to expected timber content of a tree at the maturity by an independent professional valuer. All other assumptions and sensitivity analysis are given in Note 14.2
The gain or loss arising on initial recognition of consumable biological assets at fair value less cost to
notes to tHe finAnCiAl stAteMentsFor the year ended 31 December 2016
Financial Reports

Malwatte Valley Plantations PLC | Annual Report 201636
sell and from a change in fair value less cost to sell of consumable biological assets are included in profit or loss for the period in which it arises.
Permanent impairments to Biological Asset are charged to the Profit or Loss Statement in full and reduced to the net carrying amounts of such asset in the year of occurrence after ascertaining the loss.
3.9.6.5 Nursery Plants Nursery cost includes the cost of direct materials,
direct labour and an appropriate proportion of directly attributable overheads, less provision for overgrown plants.
3.9.6.6 Produce on Bearer Biological Assets In accordance with LKAS 41, company recognise
agricultural produce growing on bearer plants at fair value less cost to sell. Change in the fair value of such agricultural produce recognized in profit or loss at the end of each reporting period.
For this purpose, quantities of harvestable agricultural produce ascertained based on harvesting cycle of each crop category by limiting to one harvesting cycle based on last day of the harvest in the immediately preceding cycle. Further, 50% of the crop in that harvesting cycle considered for the valuation.
For the valuation of the harvestable agricultural produce, the company uses the following price formulas.
Tea – Bought Leaf rate (current month) less cost of harvesting & transport
Rubber – latex Price (95% of current RSS1 Price) less cost of tapping & transport
3.9.7 Depreciation and amortisation (a) Depreciation Depreciation is recognized in Statement of Profit
or Loss on a straight-line basis over the estimated useful economic lives of each part of an item of Property, Plant & Equipment. Assets held under finance leases are depreciated over the shorter of the lease term and the useful lives of equivalent owned assets unless it is reasonably certain that the Group will have ownership by the end of the lease term. Lease period of land acquired from JEDB/
SLSPC will be expired in year 2045. The estimated useful lives for the current and comparative periods are as follows:
No. of years Rate (%) Building & Roads 40 2.50 Plant and other machinery 20/13.33 5.00/7.50 Motor vehicles – Supervisory 5 20.00 Motor vehicles – Utility 10 10.00 Equipment 8 12.50 Land Improvements 10 10.00 Furniture and fittings 10 10.00 Sanitation water supply & Electricity 20 5.00 Mature plantations No. of years Rate
(Replanting and new planting) (%) Tea 33 1/3 3.00 Rubber & Other 20 5.00 Depreciation of an asset begins when it is available
for use and ceases at the earlier of the date on which the asset classified as held for sale or is derecognized. Depreciation methods, useful lives and residual values are reassessed at the reporting date and adjusted prospectively, if appropriate. Mature plantations are depreciated over their useful lives or unexpired lease period, whichever is lower.
No depreciation is provided for immature plantations.
(b) Amortisation The leasehold rights of assets taken over from
JEDB/SLSPC are amortised in equal amounts over the shorter of the remaining lease periods and the useful lives as follows:
No. of years Rate (%) Right to use of land 53 1.89 Improvements to land 30 3.33 Buildings 25 4.00 Machinery 15 6.67 Mature plantations (Tea & Rubber) 30 3.33
3.10 Financial instruments A financial instrument is any contract that gives rise to
a financial asset of one entity and a financial liability or equity instrument of another entity.
notes to tHe finAnCiAl stAteMentsFor the year ended 31 December 2016

Malwatte Valley Plantations PLC | Annual Report 2016 37
3.10.1. Financial assets
3.10.1.1 Initial Recognition and Measurement Financial assets are classified, at initial recognition, as
financial assets at fair value through profit or loss, loans and receivables, held-to-maturity investments, AFS financial assets, or as derivatives designated as hedging instruments in an effective hedge, as appropriate. All financial assets are recognised initially at fair value plus, in the case of financial assets not recorded at fair value through profit or loss, transaction costs that are attributable to the acquisition of the financial asset.
Purchases or sales of financial assets that require delivery of assets within a time frame established by regulation or convention in the market place (regular way trades) are recognised i.e., the date that the Group commits to purchase or sell the asset.
The Group’s financial assets include cash and short term deposits, investments, trade and other receivables, available for sale financial assets.
3.10.1.2 Subsequent Measurement The subsequent measurement of financial assets
depends on their classification as described below:
(a)Financialassetsatfairvaluethroughprofitorloss
Financial assets at fair value through profit or loss include financial assets held for trading and financial assets designated upon initial recognition at fair value through profit or loss. Financial assets are classified as held for trading if they are acquired for the purpose of selling or repurchasing in the near term.
Financial assets at fair value through profit or loss are carried in the statement of financial position at fair value with net changes in fair value recognised in finance income or finance costs in the Profit or Loss Statement.
The Group has not designated any financial assets as at fair value through profit or loss.
(b) Loans and receivables
Loans and receivables are non-derivative financial assets with fixed or determinable payments that are not quoted in an active market. After initial measurement, such financial assets are subsequently measured at
amortized cost using the effective interest rate method (EIR), less impairment. Amortized cost is calculated by taking into account any discount or premium on acquisition and fees or costs that are an integral part of the EIR. The EIR amortization is included in finance income in the Profit or Loss Statement. The losses arising from impairment are recognised in the Profit or Loss Statement in finance costs for loans and in cost of sales or other operating expenses for receivables.
Loans and receivables comprise of trade receivables, amounts due from related parties, deposits, advances and other receivables.
(c) Held-to-maturity investments
Non-derivative financial assets with fixed or determinable payments and fixed maturities are classified as held-to-maturity when the Group has the positive intention and ability to hold them to maturity. After initial measurement, held-to-maturity investments are measured at amortised cost using the effective interest method, less impairment.
Amortised cost is calculated by taking into account any discount or premium on acquisition and fees or costs that are an integral part of the EIR. The EIR amortisation is included in finance income in the Profit or Loss Statement. The losses arising from impairment are recognised in the Profit or Loss Statement in finance costs.
The Group has not designated any financial assets as held to maturity.
(d)Availableforsalefinancialinvestments
AFS financial assets include equity investments and debt securities. Equity investments classified as AFS are those that are neither classified as held for trading nor designated at fair value through profit or loss. Debt securities in this category are those that are intended to be held for an indefinite period of time and that may be sold in response to needs for liquidity or in response to changes in the market conditions.
After initial measurement, AFS financial assets are subsequently measured at fair value with unrealised gains or losses recognised in OCI and credited in the AFS reserve until the investment is derecognised, at which time the cumulative gain or loss is recognised in other operating income, or the investment is determined
notes to tHe finAnCiAl stAteMentsFor the year ended 31 December 2016
Financial Reports

Malwatte Valley Plantations PLC | Annual Report 201638
to be impaired, when the cumulative loss is reclassified from the AFS reserve to the statement of profit or loss in finance costs. Interest earned whilst holding AFS financial assets is reported as interest income using the EIR method.
The Group evaluates whether the ability and intention to sell its AFS financial assets in the near term is still appropriate. When, in rare circumstances, the Group is unable to trade these financial assets due to inactive markets, the Group may elect to reclassify these financial assets if the management has the ability and intention to hold the assets for foreseeable future or until maturity.
For a financial asset reclassified from the AFS category, the fair value carrying amount at the date of reclassification becomes its new amortised cost and any previous gain or loss on the asset that has been recognised in equity is amortised to profit or loss over the remaining life of the investment using the EIR. Any difference between the new amortised cost and the maturity amount is also amortised over the remaining life of the asset using the EIR. If the asset is subsequently determined to be impaired, then the amount recorded in equity is reclassified to the statement of profit or loss.
Available for sale financial investment comprise of invested in quoted shares.
3.10.1.3 Derecognition A financial asset (or, where applicable, a part of a
financial asset or part of a group of similar financial assets) is derecognised when:
• The rights to receive cash flows from the asset have expired
• The Group has transferred its rights to receive cash flows from the asset or has assumed an obligation to pay the received cash flows in full without material delay to a third party under a ‘pass-through’ arrangement; and either (a) the Group has transferred substantially all the risks and rewards of the asset, or (b) the Group has neither transferred nor retained substantially all the risks and rewards of the asset, but has transferred control of the asset.
When the Group has transferred its rights to receive cash flows from an asset or has entered into a pass-through arrangement, it evaluates if and to what extent it
has retained the risks and rewards of ownership. When it has neither transferred nor retained substantially all of the risks and rewards of the asset, nor transferred control of the asset, the asset is recognised to the extent of the Group’s continuing involvement in the asset. In that case, the Group also recognises an associated liability. The transferred asset and the associated liability are measured on a basis that reflects the rights and obligations that the Group has retained.
Continuing involvement that takes the form of a
guarantee over the transferred asset is measured at the lower of the original carrying amount of the asset and the maximum amount of consideration that the Group could be required to repay.
3.10.1.4 Impairment of financial assets The Group assesses at each reporting date whether
there is any objective evidence that a financial asset or a group of financial assets is impaired and if such has been incurred, the amount of the loss is measured as the difference between the assets carrying amount and the present value of estimated future cash flows.
Evidence of impairment may include indications that the debtors or a group of debtors is experiencing significant financial difficulty, default or delinquency in interest or principal payments, the probability that they will enter bankruptcy or other financial reorganisation and when observable data indicate that there is a measurable decrease in the estimated future cash flows, such as changes in arrears or economic conditions that correlate with defaults.
3.10.1.4.1 Financial assets carried at amortised cost For financial assets carried at amortised cost, the Group
first assesses whether impairment exists individually for financial assets that are individually significant, or collectively for financial assets that are not individually significant. If the Group determines that no objective evidence of impairment exists for an individually assessed financial asset, whether significant or not, it includes the asset in a group of financial assets with similar credit risk characteristics and collectively assesses them for impairment. Assets that are individually assessed for impairment and for which an impairment loss is, or continues to be, recognised are not included in a collective assessment of impairment.
notes to tHe finAnCiAl stAteMentsFor the year ended 31 December 2016

Malwatte Valley Plantations PLC | Annual Report 2016 39
The amount of any impairment loss identified is measured as the difference between the asset’s carrying amount and the present value of estimated future cash flows (excluding future expected credit losses that have not yet been incurred). The present value of the estimated future cash flows is discounted at the financial asset’s original effective interest rate.
The carrying amount of the asset is reduced through the
use of an allowance account and the loss is recognised in the statement of profit or loss. Interest income (recorded as finance income in the statement of profit or loss) continues to be accrued on the reduced carrying amount and is accrued using the rate of interest used to discount the future cash flows for the purpose of measuring the impairment loss. Loans together with the associated allowance are written off when there is no realistic prospect of future recovery and all collateral has been realised or has been transferred to the Group. If, in a subsequent year, the amount of the estimated impairment loss increases or decreases because of an event occurring after the impairment was recognised, the previously recognised impairment loss is increased or reduced by adjusting the allowance account. If a write-off is later recovered, the recovery is credited to finance costs in the statement of profit or loss.
3.10.1.4.2 Available for sale financial Assets For AFS financial assets, the Group assesses at each
reporting date whether there is objective evidence that an investment or a group of investments is impaired.
In the case of equity investments classified as AFS, objective evidence would include a significant or prolonged decline in the fair value of the investment below its cost. ‘Significant’ is evaluated against the original cost of the investment and ‘prolonged’ against the period in which the fair value has been below its original cost. When there is evidence of impairment, the cumulative loss – measured as the difference between the acquisition cost and the current fair value, less any impairment loss on that investment previously recognised in the statement of profit or loss – is removed from OCI and recognised in the statement of profit or loss. Impairment losses on equity investments are not reversed through profit or loss; increases in their fair value after impairment are recognised in OCI.
The determination of what is ‘significant’ or ‘prolonged’
requires judgement. In making this judgement, the Group
evaluates, among other factors, the duration or extent to which the fair value of an investment is less than its cost.
In the case of debt instruments classified as AFS, the impairment is assessed based on the same criteria as financial assets carried at amortised cost. However, the amount recorded for impairment is the cumulative loss measured as the difference between the amortised cost and the current fair value, less any impairment loss on that investment previously recognised in the statement of profit or loss.
Future interest income continues to be accrued based on the reduced carrying amount of the asset, using the rate of interest used to discount the future cash flows for the purpose of measuring the impairment loss. The interest income is recorded as part of finance income. If, in a subsequent year, the fair value of a debt instrument increases and the increase can be objectively related to an event occurring after the impairment loss was recognised in the statement of profit or loss, the impairment loss is reversed through the statement of profit or loss.
3.10.2 Financial liabilities
3.10.2.1 Initial recognition and measurement Financial liabilities within the scope of LKAS 39 are
classified as financial liabilities at fair value through profit or loss, loans and borrowings, or as derivatives designated as hedging instruments in an effective hedge, as appropriate. The Group determines the classification of its financial liabilities at initial recognition.
All financial liabilities are recognised initially at fair value and, in the case of loans and borrowings, carried at amortized cost. This includes directly attributable transaction costs.
The Group’s financial liabilities include trade and other payables, bank overdrafts and loans and borrowings.
3.10.2.2 Subsequent measurement The subsequent measurement of financial liabilities
depends on their classification as described below:
(a)Financialliabilitiesatfairvaluethroughprofitorloss
Financial liabilities at fair value through profit or loss include financial liabilities held for trading and financial
notes to tHe finAnCiAl stAteMentsFor the year ended 31 December 2016
Financial Reports
Malwatte Valley Plantations PLC | Annual Report 201640
liabilities designated upon initial recognition as at fair value through profit or loss.
Financial liabilities are classified as held for trading if they are incurred for the purpose of repurchasing in the near term. This category also includes derivative financial instruments entered into by the Group that are not designated as hedging instruments in hedge relationships as defined by LKAS 39. Separated embedded derivatives are also classified as held for trading unless they are designated as effective hedging instruments.
Gains or losses on liabilities held for trading are recognised in the statement of profit or loss.
Financial liabilities designated upon initial recognition at fair value through profit or loss are designated at the initial date of recognition, and only if the criteria in LKAS 39 are satisfied. The Group has not designated any financial liability as at fair value through profit or loss.
(b) Loans and borrowings
After initial recognition, interest bearing loans and borrowings are subsequently measured at amortized cost using the effective interest rate method. Gains and losses are recognised in the Profit or Loss Statement when the liabilities are derecognised as well as through the effective interest rate method (EIR) amortization process.
Other financial liabilities comprise interest bearing loans and borrowings, trade payables, other payables, income tax payables and amounts due to related parties.
3.10.2.3 Derecognition A financial liability is derecognised when the obligation
under the liability is discharged or cancelled or expires.
When an existing financial liability is replaced by another from the same lender on substantially different terms, or the terms of an existing liability are substantially modified, such an exchange or modification is treated as the derecognition of the original liability and the recognition of a new liability. The difference in the respective carrying amounts is recognised in the Profit or Loss Statement.
3.10.3 Offsetting of financial instruments Financial assets and financial liabilities are offset and
the net amount reported in the Consolidated Statement of Financial Position if, and only if, there is a currently enforceable legal right to offset the recognised amounts and there is an intention to settle on a net basis, or to realize the assets and settle the liabilities simultaneously
Financial risk management objectives and policies have been disclosed under Note 37.
3.11 Inventories
Finish goods manufactured from agricultural produce of biological assets
These are valued at the lower of cost and estimated net realizable value. Net realizable value is the estimated selling price at which stocks can be sold in the ordinary course of business after allowing for cost of realization and/or cost of conversion from their existing state to saleable condition.
Input materials, Spares and consumables
At actual cost on weighted average basis. Agricultural produce harvested from biological
assets
Agricultural produce harvested from its biological assets are measured at their fair value less cost to sell at the point of harvest. The finished and semi-finished inventories from agriculture produce are valued by adding the cost of conversion to the fair value of the agricultural produce.
3.12 Cash and cash equivalents Cash and cash equivalents comprise cash balances
and call deposits. Bank overdrafts that are repayable on demand form and integral part of the Group’s cash management and are included as a component of cash and cash equivalents for the purpose of the Statement of Cash Flows.
3.13 Impairment of Non-Financial Assets The Group assesses, at each reporting date, whether
there is an indication that an asset may be impaired. If any indication exists, or when annual impairment testing for an asset is required, the Group estimates the asset’s recoverable amount. An asset’s recoverable amount is the higher of an asset’s or cash-generating unit’s (CGU)
notes to tHe finAnCiAl stAteMentsFor the year ended 31 December 2016

Malwatte Valley Plantations PLC | Annual Report 2016 41
fair value less costs of disposal and its value in use. The recoverable amount is determined for an individual asset, unless the asset does not generate cash inflows that are largely independent of those from other assets or groups of assets. When the carrying amount of an asset or CGU exceeds its recoverable amount, the asset is considered impaired and is written down to its recoverable amount.
In assessing value in use, the estimated future cash flows are discounted to their present value using a pre-tax discount rate that reflects current market assessments of the time value of money and the risks specific to the asset. In determining fair value less costs of disposal, recent market transactions are taken into account. If no such transactions can be identified, an appropriate valuation model is used. These calculations are corroborated by valuation multiples, quoted share prices for publicly traded companies or other available fair value indicators.
The Group bases its impairment calculation on detailed budgets and forecast calculations, which are prepared separately for each of the Group’s CGUs to which the individual assets are allocated. These budgets and forecast calculations generally cover a period of five years. For longer periods, a long-term growth rate is calculated and applied to project future cash flows after the fifth year.
Impairment losses of continuing operations, including impairment on inventories, are recognised in the statement of profit or loss in expense categories consistent with the function of the impaired asset, except for properties previously revalued with the revaluation taken to OCI. For such properties, the impairment is recognised in OCI up to the amount of any previous revaluation.
For assets excluding goodwill, an assessment is made
at each reporting date to determine whether there is an indication that previously recognised impairment losses no longer exist or have decreased. If such indication exists, the Group estimates the asset’s or CGU’s recoverable amount. A previously recognised impairment loss is reversed only if there has been a change in the assumptions used to determine the asset’s recoverable amount since the last impairment loss was recognised. The reversal is limited so that the carrying amount of the asset does not exceed its
notes to tHe finAnCiAl stAteMentsFor the year ended 31 December 2016
recoverable amount, nor exceed the carrying amount that would have been determined, net of depreciation, had no impairment loss been recognised for the asset in prior years. Such reversal is recognised in the statement of profit or loss unless the asset is carried at a revalued amount, in which case, the reversal is treated as a revaluation increase.
Goodwill is tested for impairment annually as at 31 March and when circumstances indicate that the carrying value may be impaired.
Impairment is determined for goodwill by assessing the recoverable amount of each CGU (or group of CGUs) to which the goodwill relates. When the recoverable amount of the CGU is less than its carrying amount, an impairment loss is recognised. Impairment losses relating to goodwill cannot be reversed in future periods.
Intangible assets with indefinite useful lives are tested for impairment annually as at 31 March at the CGU level, as appropriate, and when circumstances indicate that the carrying value may be impaired.
3.14 Liabilities and provisions Provisions are recognised when the Group has a
present obligation (legal or constructive) as a result of a past event, it is probable that an outflow of resources embodying economic benefits will be required to settle the obligation and a reliable estimate can be made of the amount of the obligation. When the Group expects some or all of a provision to be reimbursed, the reimbursement is recognised as a separate asset, but only when the reimbursement is virtually certain. The expense relating to any provision is presented in the Profit or Loss Statement net of any reimbursement.
3.15 Employees’ benefits (a)Definedcontributionplans–Employees’
ProvidentFundandEmployees’TrustFund
A defined contribution plan is a post-employment benefit plan under which an entity pays fixed contributions into a separate entity and will have no legal or constructive obligation to pay further amounts. Obligations for contributions to Provident and Trust Funds covering all employees are recognized as an expense in profit and loss in the periods during which services are rendered by employees.
Financial Reports

Malwatte Valley Plantations PLC | Annual Report 201642
The Company contributes 12% on consolidated salary of the employees to Ceylon Planters’ Provident Society (CPPS) / Estate Staff Provident Society (ESPS) / Employees’ Provident Fund (EPF)
All the employees of the Company are members of the Employees Trust Fund to which the Company contributes 3% on the consolidated salary of such employees.
(b)Definedbenefitplan
A defined benefit plan is a post-employment benefit plan other than a defined contribution plan. The liability recognised in the Financial Statements in respect of defined benefit plan is the present value of the defined benefit obligation at the Reporting date. The defined benefit obligation is calculated annually using the projected unit credit method. The present value of the defined benefit obligation is determined by discounting the estimated future cash flows using the interest rates that are denominated in the currency in which the benefits will be paid, and that have terms to maturity approximating to the terms of the related liability.
Actuarial gains and losses arising from experience
adjustments and changes in actuarial assumptions are recognised in Other Comprehensive Income in the period in which they arise. Actuarial gains & losses recognised in other comprehensive income are recognised immediately in retained earnings and are not reclassified to profit or loss. Past service costs are recognised immediately in the Statement of Profit or Loss.
The provision has been made for retirement gratuities from the first year of service for all employees, in conformity with LKAS 19, “Employee Benefits”. However, under the Payment of Gratuity Act No. 12 of 1983, the liability to an employee arises only on completion of 5 years of continued service.
The Liability is not externally funded.
The key assumptions used in determining the retirement benefit obligations are given in Note 27.
3.16 Capital commitments and contingencies Capital commitments and contingent liabilities of the
Group have been disclosed in the respective Notes to the Financial Statements.
3.17 Events occurring after the reporting period All material events after the Statement of Financial
Position date have been considered where appropriate; either adjustments have been made or adequately disclosed in the Financial Statements.
3.18 Earnings per share The Group presents basic earnings per share (EPS) for
its ordinary shares. Basic EPS is calculated by dividing the profit or loss attributable to ordinary shareholders of the Parent by the weighted average number or ordinary shares outstanding during the period.
3.19 Deferred income - Grants and subsidies Government grants are recognized where there is
reasonable assurance that the grant will be received and all attached conditions will be complied with. When the grant relates to an expense item, it is recognized as income over the period necessary to match the grant on a systematic basis to the costs that it is intended to compensate. Where the grant relates to an asset, it is recognized as deferred income and released to income in equal amounts over the expected useful life of the related asset.
Where the Group receives non-monetary grants, the asset and the grant are recorded gross at nominal amounts and released to the Statement of Profit or Loss over the expected useful life and pattern of consumption of the benefit of the underlying asset by equal annual installments. Where loans of similar assistance are provided by governments or related institutions with an interest rate below the current applicable market rate, the effect of this favorable interest is regarded as additional Government grant.
3.20 Statement of Profit or Loss For the purpose of presentation of Statement of Profit
or Loss, the function of expenses method is adopted as it represents fairly the elements of the Group’s performance.
notes to tHe finAnCiAl stAteMentsFor the year ended 31 December 2016

Malwatte Valley Plantations PLC | Annual Report 2016 43
3.20.1 Revenue Revenue is recognized to the extent that it is probable
that the economic benefits will flow to the Group and the revenue can be reliably measured, regardless of when the payment is being made. Revenue is measured the fair value of the consideration received or receivable, taking into account contractually defined terms of payment and excluding taxes or duty.
(a) Revenue from the sale of goods is recognized when the significant risks and rewards of ownership of the goods have passed to the buyer, usually on delivery of the goods. Revenue is recorded at invoice value net of brokerage, sale expenses and other levies related to revenue.
(b) Gains and losses on disposal of an item of property, plant and equipment are determined by comparing the net sales proceeds with the carrying amounts of property, plant and equipment and are recognized within other operating income in the Statement of Profit or Losss.
(c) Interest income is recognized on accrual basis.
(d) Dividend Income is recognised when the Group’s right to receive the payment is established, which is generally when shareholders approve the dividend.
(e) Rental income arising from operating leases on investment properties is accounted for on a straight line basis over the lease terms
3.20.2 Expenses All expenditure incurred in the running of the business
and in maintaining the property, plant and equipment in a state of efficiency is charged to revenue in arriving at the profit for the year.
3.20.3 Financing income and expenses Finance income comprises interest income on funds
invested. Interest income is recognized in the Statement of Profit or Loss as it accrues.
Finance expenses comprise interest payable on borrowing. Borrowing costs that are not directly attributable to the acquisition, construction or production of a qualifying asset are recognised in profit or loss using the effective interest method.
The interest expense component of finance lease payment is allocated to each period during the lease term so as to produce a constant periodic rate of interest on the remaining balance of the liability.
Foreign currency gains and losses are reported on a net basis.
3.20.4 Taxes
3.20.4.1 Current Income Tax Current income tax assets and liabilities are measured
at the amount expected to be recovered from or paid to the taxation authorities. The tax rates and tax laws used to compute the amount are those that are enacted or substantively enacted, at the reporting date in the countries where the Group operates and generates taxable income.
Current income tax relating to items recognised directly in equity is recognised in equity and not in the statement of profit or loss. Management periodically evaluates positions taken in the tax returns with respect to situations in which applicable tax regulations are subject to interpretation and establishes provisions where appropriate.
3.20.4.2 Deferred Tax Deferred tax is provided using the liability method on
temporary differences between the tax bases of assets and liabilities and their carrying amounts for financial reporting purposes at the reporting date.
Deferred tax liabilities are recognised for all taxable temporary differences, except:
• When the deferred tax liability arises from the initial recognition of goodwill or an asset or liability in a transaction that is not a business combination and, at the time of the transaction, affects neither the accounting profit nor taxable profit or loss
• In respect of taxable temporary differences associated with investments in subsidiaries, associates and interests in joint ventures, when the timing of the reversal of the temporary differences can be controlled and it is probable that the temporary differences will not reverse in the foreseeable future.
notes to tHe finAnCiAl stAteMentsFor the year ended 31 December 2016
Financial Reports

Malwatte Valley Plantations PLC | Annual Report 201644
notes to tHe finAnCiAl stAteMentsFor the year ended 31 December 2016
Deferred tax assets are recognised for all deductible temporary differences, the carry forward of unused tax credits and any unused tax losses. Deferred tax assets are recognised to the extent that it is probable that taxable profit will be available against which the deductible temporary differences, and the carry forward of unused tax credits and unused tax losses can be utilised, except:
• When the deferred tax asset relating to the deductible temporary difference arises from the initial recognition of an asset or liability in a transaction that is not a business combination and, at the time of the transaction, affects neither the accounting profit nor taxable profit or loss
• In respect of deductible temporary differences associated with investments in subsidiaries, associates and interests in joint ventures, deferred tax assets are recognised only to the extent that it is probable that the temporary differences will reverse in the foreseeable future and taxable profit will be available against which the temporary differences can be utilized.
The carrying amount of deferred tax assets is reviewed at each reporting date and reduced to the extent that it is no longer probable that sufficient taxable profit will be available to allow all or part of the deferred tax asset to be utilised. Unrecognised deferred tax assets are re-assessed at each reporting date and are recognised to the extent that it has become probable that future taxable profits will allow the deferred tax asset to be recovered.
Deferred tax assets and liabilities are measured at the tax rates that are expected to apply in the year when the asset is realised or the liability is settled, based on tax rates (and tax laws) that have been enacted or substantively enacted at the reporting date.
Deferred tax relating to items recognised outside profit or loss is recognised outside profit or loss. Deferred tax items are recognised in correlation to the underlying transaction either in OCI or directly in equity.
Deferred tax assets and deferred tax liabilities are offset if a legally enforceable right exists to set off current tax assets against current tax liabilities and the deferred taxes relate to the same taxable entity and the same taxation authority.
Tax benefits acquired as part of a business combination, but not satisfying the criteria for separate recognition at that date, are recognised subsequently if new information about facts and circumstances change. The adjustment is either treated as a reduction in goodwill (as long as it does not exceed goodwill) if it was incurred during the measurement period or recognised in profit or loss.
3.21 Statement of cash flow The Statement of Cash Flow has been prepared using
the “Indirect Method”. Interest paid is classified as operating cash flows, interest and dividends received are classified as investing cash flows while dividends paid and Government grants received are classified as financing cash flows, for the purpose of presenting the Cash Flow Statement.
3.22 Segment reporting Segmental information is provided for the different
business segments of the Group. An operating segment is a component of the Group that engages in business activities from which it may earn revenues and incur expenses, including revenues and expenses that relate to transactions with any of the Group’s other components.
Since the individual segments are located close to each other and operate in the same industrial environment, the need for geographical segmentation has no material impact.
The activities of the segments are described on Note 6 in the Notes to the Financial Statements. The group transfers products from one industry segment for use in another. Inter-segment transfers are based on fair market prices.
Revenue and expenses directly attributable to each segment are allocated to the respective segments. Revenue and expenses not directly attributable to a segment are allocated on the basis of their resource utilisation, wherever possible.
Assets and liabilities directly attributable to each segment are allocated to the respective segments. Assets and liabilities, which are not directly attributable to a segment, are allocated on a reasonable basis wherever possible. Unallocated items comprise mainly interest bearing loans, borrowings, and expenses.

Malwatte Valley Plantations PLC | Annual Report 2016 45
notes to tHe finAnCiAl stAteMentsFor the year ended 31 December 2016
Segment capital expenditure is the total cost incurred during the period to acquire segment assets that are expected to be used for more than one accounting period.
All operating segments’ operating results are reviewed regularly to make decisions about resources to be allocated to the segment and assess its performance, and for which discrete financial information is available.
4. USE OF ESTIMATES AND JUDGMENTS The preparation of Financial Statements in conformity
with SLFRS requires management to make judgments, estimates and assumptions that influence the application of accounting policies and the reported amounts of assets, liabilities, income and expenses. Judgments and estimates are based on historical experience and other factors, including expectations that are believed to be reasonable under the circumstance. Hence, actual experience and results may differ from these judgments and estimates.
Estimates and underlying assumptions are reviewed on an ongoing basis. Revisions to accounting estimates are recognized in the period in which the estimate is revised, if the revision affects only that period and any future periods affected.
Information about significant areas of estimation uncertainty and critical judgments in applying accounting policies that have the most significant effect on the amounts recognised in the Financial Statements is included in the following notes.
4.1 Taxation Deferred tax assets are recognised for unused tax
losses to the extent that it is probable that taxable profit will be available against which the losses can be utilised. Significant management judgment is required to determine the amount of deferred tax assets that can be recognised, based upon the likely timing and the level of future taxable profits together with future tax planning strategies. Unused tax losses as of 31 December 2016 are given in Note 26.
4.2 Retirement benefit obligations The present value of the retirement benefit obligations
depends on a number of factors that are determined on an actuarial basis using a number of assumptions. Key assumptions used in determining the retirement benefit obligations are given in Note 27. Any changes in these assumptions will impact the carrying amount of retirement benefit obligations.
4.3 Fair Valuation of Consumable Biological Assets
The fair value of managed timber depends on number of factors that are determined on a discounted cash flow method using various different financial and non-financial assumptions. The growth of the trees is determined by various biological factors that are highly unpredictable. Any change to the assumptions will impact the fair value of biological assets. Key assumptions and sensitivity analysis of the biological assets are given in Note 14.2.
4.4 Impairment of non-financial assets. Impairment exists when the carrying value of an asset
or cash generating unit exceeds its recoverable amount, which is the higher of its fair value less costs of disposal and its value in use. The fair value less costs of disposal calculation is based on available data from binding sales transactions, conducted at arm’s length, for similar assets or observable market prices less incremental costs for disposing of the asset. The value in use calculation is based on a DCF model. The cash flows are derived from the budget for the next five years and do not include restructuring activities that the Group is not yet committed to or significant future investments that will enhance the asset’s performance of the CGU being tested. The recoverable amount is sensitive to the discount rate used for the DCF model as well as the expected future cash-inflows and the growth rate used for extrapolation purposes. These estimates are most relevant to goodwill and other intangibles with indefinite useful lives recognised by the Group.
Financial Reports

Malwatte Valley Plantations PLC | Annual Report 201646
notes to tHe finAnCiAl stAteMentsFor the year ended 31 December 2016
5 SRI LANKA ACCOUNTING STANDARDS (SLFRS / LKAS) ISSUED BUT NOT YET EFFECTIVE
Standards issued but not yet effective up to the date of issuance of the company’s financial statements are listed below. This listing of standards and interpretations issued are those that the company reasonably expects to have an impact on disclosures, financial position or performance when applied at a future date. The company intends to adopt these standards when they become effective.
Impending Accountings standards / Standards issued not yet effective
Certain new accounting standards and amendments / improvements to existing standards have been published, that are not mandatory for 31 December 2016 reporting periods. None of those have been early adopted by the Group.
SLFRS 9 Financial Instruments: Classification and Measurement
SLFRS 9, as issued reflects the first phase of work on measurement of LKAS 39 and applies to classification and measurement of financial assets and liabilities. This
standard is effective for the annual periods beginning on or after 01 January 2018.
SLFRS 15 Revenue from Contracts with
Customers
SLFRS 15 establishes a comprehensive framework for determining whether, how much and when revenue is recognized. It replaces existing revenue recognition guidance, including LKAS 18 Revenue, LKAS 11 Construction Contracts and IFRIC 13 Customer Loyalty Programs. This standard is effective for the annual periods beginning on or after 01 January 2018.
SLFRS 16 –Leases
SLFRS 16 sets out the principles for the recognition, measurement, presentation and disclosure of leases and requires lessees to account for all leases under a single on balance sheet model similar to the accounting for finance leases, under LKAS 17 except for few exemptions for leases for “low value” assets and short term leases with a lease term of 12 months or less. This standard is effective for the annual periods beginning on or after 01 January 2019.

Malwatte Valley Plantations PLC | Annual Report 2016 47
notes to tHe finAnCiAl stAteMentsFor the year ended 31 December 2016
6 REVENUE Group Company 2016 2015 2016 2015 Rs. Rs. Rs. Rs.
6.1 Industry Segment Revenue Tea 1,620,594,579 1,709,560,272 1,620,594,579 1,709,560,272 Rubber 245,265,404 263,123,849 245,265,404 263,123,849 Coconut 2,641,927 3,010,238 2,641,927 3,010,238 Others 1,069,540,658 943,590,120 988,579,078 905,350,185 Total 2,938,042,568 2,919,284,479 2,857,080,988 2,881,044,544 6.2 Segment Informationa) Segment Revenue Tea Revenue 1,620,594,579 1,709,560,272 1,620,594,579 1,709,560,272 Revenue Expenditure (1,496,240,753) -1,702,919,189 (1,496,240,753) (1,702,919,189) Depreciation (54,755,539) -56,386,070 (54,755,539) (56,386,070) Other Non Cash Expenditure (112,134,917) -118,591,702 (112,134,917) (118,591,702) Segment Results (42,536,630) (168,336,688) (42,536,630) (168,336,688) Rubber Revenue 245,265,404 263,123,849 245,265,404 263,123,849 Revenue Expenditure (227,383,554) -225,129,907 (227,383,554) (225,129,907) Depreciation (34,473,204) -33,500,096 (34,473,204) (33,500,096) Other Non Cash Expenditure (13,537,545) -10,290,271 (13,537,545) (10,290,271) Segment Results (30,128,899) (5,796,425) (30,128,899) (5,796,425) Coconut Revenue 2,641,927 3,010,238 2,641,927 3,010,238 Revenue Expenditure (1,573,199) (1,427,308) (1,573,199) (1,427,308) Depreciation - - - - Other Non Cash Expenditure - - - - - Segment Results 1,068,728 1,582,931 1,068,728 1,582,931 Others Others Revenue 1,069,540,658 943,590,120 988,579,078 905,350,185 Revenue Expenditure (998,726,034) -884,709,189 (923,730,824) (847,722,640) Depreciation - - - - Other Non Cash Expenditure - - - - - Segment Results 70,814,624 58,880,931 64,848,254 57,627,545
Financial Reports

Malwatte Valley Plantations PLC | Annual Report 201648
notes to tHe finAnCiAl stAteMentsFor the year ended 31 December 2016
6 REVENUE (Contd.) Group Company 2016 2015 2016 2015 Rs. Rs. Rs. Rs.
6.2 Segment Information (Contd..) Total Revenue 2,938,042,568 2,919,284,479 2,857,080,988 2,881,044,544 Revenue Expenditure (2,723,923,540) (2,814,185,592) (2,648,928,330) (2,777,199,044) Depreciation (89,228,743) (89,886,166) (89,228,743) (89,886,166) Other Non Cash Expenditure (125,672,462) (128,881,973) (125,672,462) (128,881,973) Segment Results (782,177) (113,669,251) (6,748,547) (114,922,638) Gains on fair value of biological assets 165,593,637 61,400,215 165,593,637 61,400,215 Other Income and Gains 122,539,963 63,995,226 122,539,963 63,995,226 Finance Income 80,332,823 71,942,965 80,332,823 71,942,965 Administrative Expenses (162,962,176) (253,320,378) (157,054,237) (253,247,543) Government Lease Interest (28,039,007) (27,085,414) (28,039,007) (27,085,414) Finance Cost (104,038,802) (72,620,252) (104,038,802) (72,620,252) Operating Profit / (Loss) of the Company 72,644,261 (269,356,889) 72,585,830 (270,537,441)
b) Segment Assets
Non Current Assets Tea 2,201,737,519 2,100,003,900 2,201,737,519 2,100,003,900 Rubber 864,968,311 825,001,532 864,968,311 825,001,532 Coconut - - - - Unallocated 836,926,890 796,960,101 864,968,322 825,001,532 3,903,632,720 3,721,965,532 3,931,674,152 3,750,006,963 Current Assets Tea 428,227,265 463,093,597 428,227,265 463,093,597 Rubber 70,737,113 77,060,989 70,737,113 77,060,989 Coconut 281,821 304,168 281,821 304,168 Unallocated 939,771,362 1,036,263,633 929,580,687 982,007,758 1,439,017,561 1,576,722,387 1,428,826,886 1,522,466,512 Total Assets 5,342,650,281 5,298,687,919 5,360,501,038 5,272,473,475

Malwatte Valley Plantations PLC | Annual Report 2016 49
notes to tHe finAnCiAl stAteMentsFor the year ended 31 December 2016
6 REVENUE (Contd.) Group Company 2016 2015 2016 2015 Rs. Rs. Rs. Rs.
c) Segment Liabilities Non Current Liabilities and Deferred Income Tea 1,298,864,272 1,386,669,708 1,298,864,272 1,386,669,708 Rubber 98,647,919 105,316,687 98,647,919 105,316,687 Unallocated 246,619,799 263,291,717 246,619,799 263,291,717 1,644,131,990 1,755,278,111 1,644,131,990 1,755,278,111 Current Liabilities Tea 406,918,389 426,202,978 406,918,389 426,202,978 Rubber 61,922,364 64,856,975 61,922,364 64,856,975 Unallocated 415,764,441 435,468,260 415,764,441 435,468,260 884,605,194 961,197,380 884,605,194 926,528,212 Total Liabilities 2,528,737,184 2,716,475,491 2,528,737,184 2,681,806,323 d) Segment Capital Expenditure Field Development Tea 10,948,802 9,666,364 10,948,802 9,666,364 Rubber 28,866,057 49,537,131 28,866,057 49,537,131 39,814,859 59,203,495 39,814,859 59,203,495 Property, Plant & Equipment Tea 46,637,238 44,703,662 46,637,238 44,703,662 Rubber 25,112,359 24,071,203 25,112,359 24,071,203 71,749,597 68,774,865 71,749,597 68,774,865 Unallocated 41,832,092 37,452,748 41,832,092 37,452,748 41,832,092 37,452,748 41,832,092 37,452,748 Total Capital Expenditure 153,396,548 165,431,108 153,396,548 165,431,108
Financial Reports

Malwatte Valley Plantations PLC | Annual Report 201650
7 OTHER INCOME Profit on disposal of property, plant & equipment 5,344,593 18,751,202 5,344,593 18,751,202 Dividend income 1,309 5,103 1,309 5,103 Sale of trees 69,465,693 10,668,708 69,465,693 10,668,708 Amortisation of Government grants 9,497,010 10,430,005 9,497,010 10,430,005 Sundry income 29,377,415 22,781,158 29,377,415 22,781,158 Revenue Grant 3,551,280 1,359,050 3,551,280 1,359,050 Write back dividend income 5,300,000 - 5,300,000 - Distress loan interest 2,663 - 2,663 - Total 122,539,963 63,995,226 122,539,963 63,995,226
8 FINANCE EXPENSES8.1 Finance Income Interest income 80,332,823 71,942,965 80,332,823 71,942,965 Total 80,332,823 71,942,965 80,332,823 71,942,965 8.2 Finance Expenses Interest on Overdraft 41,107,598 26,046,688 41,107,598 26,046,688 Interest on Finance Lease 5,779,708 3,440,228 5,779,708 3,440,228 Interest on Term Loan 51,484,717 38,867,825 51,484,717 38,867,825 VAT on Finance Lease Interest 114,126 558,144 114,126 558,144 Bank Charges & Others 710,953 1,010,415 710,953 1,010,415 Interest on Packing Credit 4,728,971 2,696,952 4,728,971 2,696,952 Interest on short term borrowing 112,729 - 112,729 - Total 104,038,802 72,620,252 104,038,802 72,620,252 8.3 Interest paid to Government on finance lease 28,039,007 27,085,414 28,039,007 27,085,414 Total 28,039,007 27,085,414 28,039,007 27,085,414
Group Company 2016 2015 2016 2015 Rs. Rs. Rs. Rs.
notes to tHe finAnCiAl stAteMentsFor the year ended 31 December 2016

Malwatte Valley Plantations PLC | Annual Report 2016 51
Group Company 2016 2015 2016 2015 Rs. Rs. Rs. Rs.
notes to tHe finAnCiAl stAteMentsFor the year ended 31 December 2016
9 PROFIT / (LOSS) BEFORE TAXATION Profit/ (Loss) before tax is stated after charging all expenses including the following: Directors’ emoluments 17,615,000 15,384,000 17,615,000 15,384,000 Auditors’ fees 4,358,747 4,223,135 4,191,803 4,150,300 Depreciation /Amortisation Leasehold Property 6,775,383 6,775,383 6,775,383 6,775,383 Immovable Estate Assets On Finance Lease 15,306,221 15,306,222 15,306,221 15,306,222 Tangible Assets 69,424,613 61,098,243 69,424,613 61,098,243 Immature/Mature Plantations 31,722,169 30,917,892 31,722,169 30,917,892 Personnel Cost Defined Benefit Plan Costs - Gratuity 127,127,412 133,136,550 127,127,412 133,136,550 Salaries and Wages 918,051,105 1,081,742,891 918,051,105 1,081,742,891 Defined Contribution Plan Costs - EPF & ETF 124,707,337 145,545,439 124,707,337 145,545,439 10 INCOME TAX EXPENSE10.1 Statement of Profit or Loss (I) Current Tax Expense Income taxes on current year’s profit (10.3) 10,867,658 7,911,052 10,855,868 7,911,052 Under / (Over)provision in respect of previous years (2,230,353) (3,262,380) (2,230,353) (3,262,380) 8,637,305 4,648,672 8,625,515 4,648,672 (II) Deferred Tax Expense Deferred Tax Charge or (Reversal) 1,506,541 3,875,978 1,506,541 3,875,978 1,506,541 3,875,978 1,506,541 3,875,978 Net Tax Charge or (Reversal) reported in Statement of Profit or Loss 10,143,847 8,524,650 10,132,058 8,524,651
Financial Reports

Malwatte Valley Plantations PLC | Annual Report 201652
10.2 Statement of Other Comprehensive Income Tax effect on Net (loss) / gain on available for sale financial assets - - - - Tax Effect on Actuarial gains/ (losses) on defined benefit plans 24,760,014 4,109,012 24,760,014 4,109,012 Net Tax Charge directly to Other Comprehensive Income 24,760,014 4,109,012 24,760,014 4,109,012
The Company is liable to income tax at the rate of 10% on its agriculture profits and 28% on manufacturing profits and other income earned during the year. According to the Section 13 (t) of the Inland Revenue Act No.10 of 2006, any profits and income derived from the sale of any share, a right to any share, a bonus share or a share warrant in respect of which the share transaction levy under section 7 of the Finance Act No 05 of 2005, has been charged, are exempt from income tax. Hence there’s no deferred tax liability with regard to investment in quoted public shares.
Group Company 2016 2015 2016 2015 Rs. Rs. Rs. Rs.
10.3 Reconciliation of Accounting Profit to Income Tax Expense
Profit/ (Loss) before tax 72,644,261 (269,356,889) 72,585,830 (270,537,441) Effective tax rate % 28% 28% 28% 28% Tax effect on profit before tax 20,340,393 (75,419,929) 20,324,032 (75,750,484) Tax effect on deductible expenses for tax purposes (156,294,023) (117,052,603) (156,294,023) (117,052,603) Tax effect on non-deductible expenses for tax purposes 76,867,776 76,867,776 74,196,046 76,867,776 Tax effect on Total statutory income (61,773,945) (115,604,756) (61,773,945) (115,935,311) Tax effect on other sources of income 21,827,823 22,788,955 21,827,823 22,788,955 Tax effect on Tax exempt Income 61,773,945 115,604,756 61,773,945 115,935,311 Tax effect on Qualifying relief (3,332,216) (6,901,769) (3,332,216) (6,901,769) Tax effect on Utilisation of tax losses (7,639,738) (7,976,134) (7,639,738) (7,976,134) Income Tax on current year profits 10,855,868 7,911,052 10,855,868 7,911,052 Subsidiary - Income Tax Provision 11,790 - - - Under / (Over)provision in respect of previous years (2,230,353) (3,262,380) (2,230,353) (3,262,380) Income Tax charge for the year 8,637,305 4,648,672 8,625,515 4,648,672 Deferred tax charge/ (reversal) 1,506,541 3,875,978 1,506,541 3,875,978 Total income tax expense 10,143,847 8,524,650 10,132,057 8,524,650
notes to tHe finAnCiAl stAteMentsFor the year ended 31 December 2016
10 INCOME TAX EXPENSE (Contd) Group Company 2016 2015 2016 2015 Rs. Rs. Rs. Rs.

Malwatte Valley Plantations PLC | Annual Report 2016 53
11 EARNINGS / (LOSS) PER SHARE AND DIVIDEND PER SHARE 11.1 Earnings / (Loss) per Share Basic earnings/ (loss) per Share The calculation of the basic earnings /(loss) per share is based on after tax profit for the year divided by the weighted average number of
ordinary shares outstanding during the period and calculated as follows. Group Company 2016 2015 2016 2015 Rs. Rs. Rs. Rs. Amount used as the Numerator Profit / (Loss) attributable to ordinary shareholders (Rs. ) 62,500,414 -277,881,539 62,453,772 -279,062,092 Amount used as the Denominator Weighted average number of ordinary shares 223,042,992 223,042,992 223,042,992 223,042,992 Basic earnings / (loss) per share (Rs. ) 0.28 (1.25) 0.28 (1.25) 11.2 Dividend per Share First & final proposed dividend Rs. Nil per share (2015 - Nill per share) (Rs.) - - - - Number of ordinary shares 223,042,992 223,042,992 223,042,992 223,042,992 Dividend per share (Rs.) - - - -
notes to tHe finAnCiAl stAteMentsFor the year ended 31 December 2016
Financial Reports

Malwatte Valley Plantations PLC | Annual Report 201654
notes to tHe finAnCiAl stAteMentsFor the year ended 31 December 2016
12 LEASEHOLD PROPERTY, PLANT & EQUIPMENT Right-to-use of Land 12.1 192,903,671 199,679,054 192,903,671 199,679,054 Immovable Leased Bearer Biological Assets 12.2 83,347,562 93,501,658 83,347,562 93,501,658 Immovable Leased assets (other than leasehold right to bear land and bearer biological assets) 12.3 5,669,457 10,821,583 5,669,457 10,821,583 281,920,690 304,002,295 281,920,690 304,002,295 12.1 Right-to-use of Land “Right-To-Use of Land on Lease” as above was previously titled “Leasehold Right to Bare Land”. The change is in order to comply with
Statement of Recommended Practice (SoRP) issued by the Institute of Chartered Accountants of Sri Lanka dated 19 December 2012. Such leases have been executed for all estates for a period of 53 years.
This right-to-use land is amortized over the remaining lease term or useful life of the right whichever is shorter and is disclosed under non-current assets. The Statement of Recommended Practice (SoRP) for right-to-use of land does not permit further revaluation of right-to-use land. . The values taken into the Statement of Financial Position as at 22 June 1992 and amortization of the right to use of land up to 31 December 2016 are as follows.
Group Accumulated Revaluation Amortization Amortization Amortization as at as at for the 22.06.92 01.01.16 year 31.12.16 2016 2015 Rs. Rs. Rs. Rs Rs. Rs. Right-to-use of Land 359,095,312 159,416,258 6,775,383 166,191,641 192,903,671 199,679,054
Company Accumulated Revaluation Amortization Amortization Amortization as at as at for the 22.06.92 01.01.16 year 31.12.16 2016 2015 Rs. Rs. Rs. Rs Rs. Rs. Right-to-use of Land 359,095,312 159,416,258 6,775,383 166,191,641 192,903,671 199,679,054
The leasehold property is being amortised by equal amounts over a 53 year period and the unexpired period of the lease as at the Statement of Financial Position date is 29 years.
Group Company 2016 2015 2016 2015 Rs. Rs. Rs. Rs.
Malwatte Valley Plantations PLC | Annual Report 2016 55
notes to tHe finAnCiAl stAteMentsFor the year ended 31 December 2016
12.2 Immovable Leased Assets In terms of the ruling of the UITF of the Institute of Chartered Accountants of Sri Lanka prevailed at the time of privatisation of plantation estates, all immovable assets in these estates under finance leases have been taken into the books of the Company retroactive to 22nd June 1992. For this purpose the Board decided at its meeting on March 8, 1995 that these assets would be taken at their book values as they appear in the books of the JEDB/SLSPC,on the day immediately preceding the date of formation of the Company. These assets are taken into the 22nd June 1992 balance sheet and amortised as follows:
12.2.1. Immovable Leased Bearer Biological Assets Group Company Mature Plantations Mature Plantations Tea Rubber 2016 2015 Tea Rubber 2016 2015 Rs. Rs. Rs. Rs. Rs. Rs. Rs. Rs. Capitalised Value (18th June, 1992) 176,688,366 127,934,487 304,622,853 304,622,853 176,688,366 127,934,487 304,622,853 304,622,853 Amortisation As at 1st January 122,455,222 88,665,974 211,121,196 200,967,100 122,455,222 88,665,974 211,121,196 200,967,100 Amortisation for the year 5,889,612 4,264,483 10,154,095 10,154,095 5,889,612 4,264,483 10,154,095 10,154,095 As at 31st December 128,344,834 92,930,457 221,275,291 211,121,195 128,344,834 92,930,457 221,275,291 211,121,195 Carrying amount 48,343,532 35,004,030 83,347,562 93,501,658 48,343,532 35,004,030 83,347,562 93,501,658
Investment in plantation assets which were immature at the time of handing over to the company by way of estate leases are shown under immature plantation (revalued as at 22nd June 1992). all of which have been transferred to mature Plantations as at Statement of Financial Position date.
However, since then all such investments in Immature Plantations attributable to JEDB/SLSPC period have been transferred to Mature Plantations. These mature tea and rubber were classified as bearer biological assets in terms of LKAS 41 - Agriculture. The carrying value of the bearer biological assets leased from JEDB/SLSPC is recognised at cost less amortisation. Further investments in such plantations to bring them to maturity are shown in Note 14.1.
12.2.2. Immovable Leased assets (other than leasehold right to bear land and bearer biological assets)
Group Company Land Buildings Machinery Land Buildings Machinery Development 2016 2015 Development 2016 2015 Rs. Rs. Rs. Rs. Rs. Rs. Rs. Rs. Rs. Rs. Capitalised Value (18 June, 1992) 18,757,900 113,171,583 16,503,578 148,433,061 148,433,061 18,757,900 113,171,583 16,503,578 148,433,061 148,433,061 Amortisation - As at 1 January 14,711,671 106,396,228 16,503,578 137,611,477 132,459,352 14,711,671 106,396,228 16,503,578 137,611,477 132,459,352 Amortisation for the year 625,263 4,526,863 - 5,152,126 5,152,127 625,263 4,526,863 - 5,152,126 5,152,127 As at 31 December 15,336,935 110,923,092 16,503,578 142,763,604 137,611,478 15,336,935 110,923,092 16,503,578 142,763,604 137,611,478 Carrying amount 3,420,965 2,248,491 - 5,669,457 10,821,583 3,420,965 2,248,491 - 5,669,457 10,821,583
12 LEASEHOLD PROPERTY, PLANT & EQUIPMENT (Contd)
Financial Reports

Malwatte Valley Plantations PLC | Annual Report 201656
13 FREEHOLD PROPERTY, PLANT & EQUIPMENT Assets acquired on finance Lease Water & Capital Group Land Buildings Motor Plant & Furniture & Equipments Land Sanitation and Work in Motor Total Total At Valuation At Valuation Vehicles Machinery Fittings Improvement Others Progress Vehicles Machinery 2016 2015 Rs. Rs. Rs. Rs. Rs. Rs. Rs. Rs. Rs. Rs. Rs. Rs. Rs. Cost or valuation Balance as at 01 January 821,011,758 599,998,386 111,329,220 166,270,971 30,397,763 116,055,511 39,662,578 67,618,877 3,507,105 87,705,668 92,513,416 2,136,071,256 2,137,077,908 Additions - 296,359 3,292,228 15,621,854 57,000 7,600,087 - 46,340 3,657,082 41,178,648 - 71,749,598 68,744,865 Disposals - - (7,379,190) - - - - - - (5,200,000) - (12,579,190) (69,709,525) Transfers In / (Out) - - - - - - - - (763,724) - - (763,724) (71,992) Balance as at 31 December 821,011,758 600,294,745 107,242,258 181,892,825 30,454,763 123,655,598 39,662,578 67,665,217 6,400,463 123,684,316 92,513,416 2,194,477,940 2,136,041,256 Accumulated Depreciation Balance as at 01 January - 82,156,575 79,672,236 121,060,665 22,287,431 89,797,608 28,323,766 44,698,977 - 50,955,667 61,489,613 580,442,538 563,558,991 Charge for the year - 15,401,572 15,146,317 8,646,010 1,946,613 4,580,205 3,295,434 2,864,330 - 13,441,785 4,102,347 69,424,613 61,098,243 On Disposals - - (7,379,190) - - - - - - - - (1,300,000) - (8,679,190) (44,214,698) Balance as at 31 December - 97,558,147 87,439,363 129,706,675 24,234,044 94,377,813 31,619,200 47,563,307 - 63,097,452 65,591,960 641,187,961 580,442,536 Carrying Value As at 31 December 2016 821,011,758 502,736,598 19,802,895 52,186,150 6,220,719 29,277,785 8,043,378 20,101,910 6,400,463 60,586,864 26,921,456 1,553,289,979 1,555,628,718 As at 31 December 2015 821,011,758 517,841,811 31,656,984 45,210,306 8,110,332 26,257,903 11,338,812 22,919,900 3,507,105 36,750,001 31,023,803 1,555,628,718
Assets acquired on finance Lease Water & Capital Company Land Buildings Motor Plant & Furniture & Equipments Land Sanitation and Work in Motor Total Total At Valuation At Valuation Vehicles Machinery Fittings Improvement Others Progress Vehicles Machinery 2016 2015 Rs. Rs. Rs. Rs. Rs. Rs. Rs. Rs. Rs. Rs. Rs. Rs. Rs. Cost or valuation Balance as at 01 January 821,011,758 599,998,386 111,329,220 166,270,971 30,397,763 116,055,511 39,662,578 67,618,877 3,507,105 87,705,668 92,513,416 2,136,071,256 2,137,077,908 Additions - 296,359 3,292,228 15,621,854 57,000 7,600,087 - 46,340 3,657,082 41,178,648 - 71,749,598 68,744,865 Disposals - - (7,379,190) - - - - 0 - (5,200,000) - (12,579,190) (69,709,525) Transfers In / (Out) - - - - - - - - (763,724) - - (763,724) (71,992) Balance as at 31 December 821,011,758 600,294,745 107,242,258 181,892,825 30,454,763 123,655,598 39,662,578 67,665,217 6,400,463 123,684,316 92,513,416 2,194,477,940 2,136,041,256 Accumulated Depreciation Balance as at 01 January - 82,156,575 79,672,236 121,060,665 22,287,431 89,797,608 28,323,766 44,698,977 - 50,955,667 61,489,613 580,442,538 563,558,991 Charge for the year - 15,401,572 15,146,317 8,646,010 1,946,613 4,580,205 3,295,434 2,864,330 - 13,441,785 4,102,347 69,424,613 61,098,243 On Disposals - - (7,379,190) - - - - - - (1,300,000) - (8,679,190) (44,214,698) Balance as at 31 December - 97,558,147 87,439,363 129,706,675 24,234,044 94,377,813 31,619,200 47,563,307 - 63,097,452 65,591,960 641,187,961 580,442,536 Carrying Value As at 31 December 2016 821,011,758 502,736,598 19,802,895 52,186,150 6,220,719 29,277,785 8,043,378 20,101,910 6,400,463 60,586,864 26,921,456 1,553,289,979 1,555,628,718 As at 31 December 2015 821,011,758 517,841,811 31,656,984 45,210,306 8,110,332 26,257,903 11,338,812 22,919,900 3,507,105 36,750,001 31,023,803 1,555,628,718
notes to tHe finAnCiAl stAteMentsFor the year ended 31 December 2016

Malwatte Valley Plantations PLC | Annual Report 2016 57
13 FREEHOLD PROPERTY, PLANT & EQUIPMENT Assets acquired on finance Lease Water & Capital Group Land Buildings Motor Plant & Furniture & Equipments Land Sanitation and Work in Motor Total Total At Valuation At Valuation Vehicles Machinery Fittings Improvement Others Progress Vehicles Machinery 2016 2015 Rs. Rs. Rs. Rs. Rs. Rs. Rs. Rs. Rs. Rs. Rs. Rs. Rs. Cost or valuation Balance as at 01 January 821,011,758 599,998,386 111,329,220 166,270,971 30,397,763 116,055,511 39,662,578 67,618,877 3,507,105 87,705,668 92,513,416 2,136,071,256 2,137,077,908 Additions - 296,359 3,292,228 15,621,854 57,000 7,600,087 - 46,340 3,657,082 41,178,648 - 71,749,598 68,744,865 Disposals - - (7,379,190) - - - - - - (5,200,000) - (12,579,190) (69,709,525) Transfers In / (Out) - - - - - - - - (763,724) - - (763,724) (71,992) Balance as at 31 December 821,011,758 600,294,745 107,242,258 181,892,825 30,454,763 123,655,598 39,662,578 67,665,217 6,400,463 123,684,316 92,513,416 2,194,477,940 2,136,041,256 Accumulated Depreciation Balance as at 01 January - 82,156,575 79,672,236 121,060,665 22,287,431 89,797,608 28,323,766 44,698,977 - 50,955,667 61,489,613 580,442,538 563,558,991 Charge for the year - 15,401,572 15,146,317 8,646,010 1,946,613 4,580,205 3,295,434 2,864,330 - 13,441,785 4,102,347 69,424,613 61,098,243 On Disposals - - (7,379,190) - - - - - - - - (1,300,000) - (8,679,190) (44,214,698) Balance as at 31 December - 97,558,147 87,439,363 129,706,675 24,234,044 94,377,813 31,619,200 47,563,307 - 63,097,452 65,591,960 641,187,961 580,442,536 Carrying Value As at 31 December 2016 821,011,758 502,736,598 19,802,895 52,186,150 6,220,719 29,277,785 8,043,378 20,101,910 6,400,463 60,586,864 26,921,456 1,553,289,979 1,555,628,718 As at 31 December 2015 821,011,758 517,841,811 31,656,984 45,210,306 8,110,332 26,257,903 11,338,812 22,919,900 3,507,105 36,750,001 31,023,803 1,555,628,718
Assets acquired on finance Lease Water & Capital Company Land Buildings Motor Plant & Furniture & Equipments Land Sanitation and Work in Motor Total Total At Valuation At Valuation Vehicles Machinery Fittings Improvement Others Progress Vehicles Machinery 2016 2015 Rs. Rs. Rs. Rs. Rs. Rs. Rs. Rs. Rs. Rs. Rs. Rs. Rs. Cost or valuation Balance as at 01 January 821,011,758 599,998,386 111,329,220 166,270,971 30,397,763 116,055,511 39,662,578 67,618,877 3,507,105 87,705,668 92,513,416 2,136,071,256 2,137,077,908 Additions - 296,359 3,292,228 15,621,854 57,000 7,600,087 - 46,340 3,657,082 41,178,648 - 71,749,598 68,744,865 Disposals - - (7,379,190) - - - - 0 - (5,200,000) - (12,579,190) (69,709,525) Transfers In / (Out) - - - - - - - - (763,724) - - (763,724) (71,992) Balance as at 31 December 821,011,758 600,294,745 107,242,258 181,892,825 30,454,763 123,655,598 39,662,578 67,665,217 6,400,463 123,684,316 92,513,416 2,194,477,940 2,136,041,256 Accumulated Depreciation Balance as at 01 January - 82,156,575 79,672,236 121,060,665 22,287,431 89,797,608 28,323,766 44,698,977 - 50,955,667 61,489,613 580,442,538 563,558,991 Charge for the year - 15,401,572 15,146,317 8,646,010 1,946,613 4,580,205 3,295,434 2,864,330 - 13,441,785 4,102,347 69,424,613 61,098,243 On Disposals - - (7,379,190) - - - - - - (1,300,000) - (8,679,190) (44,214,698) Balance as at 31 December - 97,558,147 87,439,363 129,706,675 24,234,044 94,377,813 31,619,200 47,563,307 - 63,097,452 65,591,960 641,187,961 580,442,536 Carrying Value As at 31 December 2016 821,011,758 502,736,598 19,802,895 52,186,150 6,220,719 29,277,785 8,043,378 20,101,910 6,400,463 60,586,864 26,921,456 1,553,289,979 1,555,628,718 As at 31 December 2015 821,011,758 517,841,811 31,656,984 45,210,306 8,110,332 26,257,903 11,338,812 22,919,900 3,507,105 36,750,001 31,023,803 1,555,628,718
Financial Reports
notes to tHe finAnCiAl stAteMentsFor the year ended 31 December 2016

Malwatte Valley Plantations PLC | Annual Report 201658
13.1 The assets shown above are those movable assets vested in the Company by gazette notification at the date of formation of the company (22nd June 1992) and all investments in tangible assets by the company since its formation. The assets taken over by way of estate leases are set out in notes 12.1 & 12.2.
13.2 Details on assets pledged under facilities are given under the Note 31 of the financial statements.
13.3 Revaluation of land and buildings From 1 January 2013, the Company has changed its accounting policy for the measurement of Freehold land and buildings
to the revaluation model, since the Company believes that revaluation model more effectively demonstrates the financial position of land and buildings.. The Freehold Land and Building on freehold land were revalued by Mr. G.J. Sumanasena, Incorporated Valuer as of 31 December 2013 and the results of such valuation were incorporated in the financial statements as at that date. Such assets were valued on the basis of Contractor’s Test Method - Land and Building. Fair value is determined by reference to market-based evidence. Valuations are based on active market prices, adjusted for any difference in the nature, location or condition of the specific property. The surplus arising from the revaluation was transferred to a revaluation reserve.
13.4 If land and buildings were measured using the cost model, the carrying amounts would be as follows:
2016 2015 Rs. Rs.
Cost 854,504,931 854,208,572 Accumulated depreciation (96,416,641) (86,652,947) Carrying value 758,088,290 767,555,625 13.5 The cost of fully depreciated and still in use assets of the company amounts to Rs. 314 Mn as of 31 December 2016 (2015 -
278 Mn ).
14 BIOLOGICAL ASSETS 14.1 Bearer Biological Assets
Group Immature Plantations Mature Plantations Tea Rubber Other Total Tea Rubber Other Total 2016 2015 Rs. Rs. Rs. Rs. Rs. Rs. Rs. Rs. Rs. Rs.
Cost As at 1 January 43,985,287 316,548,136 112,882,016 473,415,439 427,453,089 357,265,092 22,266,216 806,984,397 1,280,399,836 1,183,743,591 Additions during the year 10,948,802 28,866,057 41,827,712 81,642,571 - 19,353,705 - 19,353,705 100,996,276 144,713,413 Transfers (from)/to - (19,353,705) - (19,353,705) - - - - (19,353,705) (48,057,168) As at 31 December 54,934,089 326,060,488 154,709,728 535,704,305 427,453,089 376,618,797 22,266,216 826,338,102 1,362,042,407 1,280,399,836
Depreciation As at 1 January - - - - 162,213,427 145,642,536 19,896,284 327,752,247 327,752,247 296,834,356 Charge for the year - - - - 12,823,592 18,678,657 219,920 31,722,169 31,722,169 30,917,892 As at 31 December - - - - 175,037,019 164,321,193 20,116,204 359,474,416 359,474,416 327,752,248 Carrying amount 54,934,089 326,060,488 154,709,728 535,704,305 252,416,070 212,297,604 2,150,012 466,863,686 1,002,567,991 952,647,588
notes to tHe finAnCiAl stAteMentsFor the year ended 31 December 2016

Malwatte Valley Plantations PLC | Annual Report 2016 59
notes to tHe finAnCiAl stAteMentsFor the year ended 31 December 2016
Company Immature Plantations Mature Plantations Tea Rubber Other Total Tea Rubber Other Total 2016 2015 Rs. Rs. Rs. Rs. Rs. Rs. Rs. Rs. Rs. Rs.
Cost As at 1 January 43,985,287 316,548,136 112,882,016 473,415,439 427,453,089 357,265,092 22,266,216 806,984,397 1,280,399,836 1,183,743,591 Additions during the year 10,948,802 28,866,057 41,827,712 81,642,571 - 19,353,705 - 19,353,705 100,996,276 144,713,413 Transfers (from)/to - (19,353,705) - (19,353,705) - - - - (19,353,705) (48,057,168) As at 31 December 54,934,089 326,060,488 154,709,728 535,704,305 427,453,089 376,618,797 22,266,216 826,338,102 1,362,042,407 1,280,399,836
Depreciation As at 1 January - - - - 162,213,427 145,642,536 19,896,284 327,752,247 327,752,247 296,834,356
Charge for the year - - - - 12,823,592 18,678,657 219,920 31,722,169 31,722,169 30,917,892 As at 31 December - - - - 175,037,019 164,321,193 20,116,204 359,474,416 359,474,416 327,752,248 Carrying amount 54,934,089 326,060,488 154,709,728 535,704,305 252,416,070 212,297,604 2,150,012 466,863,686 1,002,567,991 952,647,588 These are investments in immature/mature plantations since the formation of the Company. The assets (including plantation
assets) taken over by way of estate leases are set out in Notes 12.2.1 and 12.2.2. Further investment in immature plantations taken over by way of these leases are shown in the above note. When such plantations become mature, the additional investments since take over to bring them to maturity, will be moved from immature to mature under this note.
The Company has elected to measure the bearer biological assets at cost using LKAS 16 - Property, Plant & Equipment.
Specific borrowings have not been obtained to finance the planting expenditure. Hence, borrowing costs were not capitalised during the year under Immature Plantations.
14.2 Consumable Biological Assets Group Company 2016 2015 2016 2015 Rs. Rs. Rs. Rs.
As at 1 January 902,600,826 848,054,492 902,600,826 848,054,492 Increase due to development 629,762 2,201,835 629,762 2,201,835 Gain/(loss) arising from changes in fair value less cost to sell 162,567,337 62,500,529 162,567,337 62,500,529 Cost of Harvested Timber trees - (10,156,030) (10,156,030) As at 31 December 1,065,797,925 902,600,826 1,065,797,925 902,600,826 Managed trees include commercial timber plantations cultivated on estates. The cost of immature trees is treated as
approximate fair value particularly on the ground of little biological transformation has taken place and impact of the biological transformation on price is not material. When such Plantations become mature, the additional investments since taken over to bring them to maturity are transferred from Immature to Mature.
The fair value of managed trees was ascertained since the LKAS 41 is only applicable for managed agricultural activities in terms of the ruling issued by The Institute of Chartered Accountants of Sri Lanka. The valuation was carried by Messers Perera Sivaskantha & Company, incorporated valuers, using Discounted Cash Flow (DCF) methods. In ascertaining the fair value of timber, physical verification was carried out covering all the estates which have Commercial timber trees.
Financial Reports
14 BIOLOGICAL ASSETS (Contd)

Malwatte Valley Plantations PLC | Annual Report 201660
14.3.1 INFORMATION ABOUT FAIR VALUE MEASUREMENTS USING SIGNFICANT UNOBSERVABLE INPUT (LEVEL3)
Non Financial Assets
Valuation Technique
Unobservable Inputs Range of Unobservable Inputs (Probability weighted average)
Relation of Unobservable Inputs to Fair Value
Consumable Biological Assets
Discounted Cash Flow Method
Discounted RateOptimum rotation (Maturity)Volume at rotationPrice per cu. Meter
14.00%25 years0.01- 21.23 cu’ MeterRs.3,250/= to Rs.16,775/=
The higher the discount rate, the lesser the fair valueLower the rotation period, the higher the fair valueThe higher the volume, the higher the fair valueThe higher the price per cu. Meter. the higher the fair value
The valuations, as presented in the external valuation models based on net present values, take into account the long term
exploitation of the timber plantations. The market rates applied has been arrived at after discounting. The commodity markets are inherently volatile and that long term price projection are highly unpredictable. The sensitivity analysis regarding selling price and discount rate variations every investor to reasonably challenge the financial impact of the assumptions used in the LKAS 41 against his own assumptions.
14.2.1 Sensitivity Analysis
Sensitivity variation sales price Values as appearing in the Statement of Financial Position are very sensitive to price changes with regard to the average sales
prices applied. Simulations made for timber show that a rise or decrease by 10% of the estimated future selling price has the following effect on the net present value of biological assets:
Impact on Consumable Biological Assets Rs. Rs. -10% +10%
As At 31 December 2016 (106,583,725) 106,574,987 As At 31 December 2015 (90,260,083) 90,260,083
Sensitivity variation discount rate Values as appearing in the Statement of Financial Position are very sensitive to changes of the discount rate applied.
Simulations made for timber trees show that a rise or decrease by 1% of the estimated future discount rate has the following effect on the net present value of biological assets:
Impact on Consumable Biological Assets Rs. Rs. -1% +1%
As At 31 December 2016 5,707,915 (5,180,964) As At 31 December 2015 2,516,162 (2,341,898)
The carrying amount of biological assets pledged as securities for liabilities are nil for year 2016 (2015 - nil).
There are no commitments for the development or acquisition of biological assets .
notes to tHe finAnCiAl stAteMentsFor the year ended 31 December 2016
14 BIOLOGICAL ASSETS (Contd)

Malwatte Valley Plantations PLC | Annual Report 2016 61
notes to tHe finAnCiAl stAteMentsFor the year ended 31 December 2016
15 OTHER NON CURRENT FINANCIAL ASSETS
Group Company Long Term Investments 2016 205 2016 2015 Rs. Rs. Rs. Rs. 15.1 Held to Maturity Investments Investment in Debentures Central Finance Company PLC - 7,020,000 - 7,020,000 - 7,020,000 - 7,020,000 Group Company 2016 2015 No. of 2016 2015 Rs. Rs. Shares Rs. Rs. 15.2 Available for sale financial Instruments Agalawatte Plantation PLC 1,750 2,050 100 1,750 2,050 Balangoda Plantation PLC 1,220 1,760 100 1,220 1,760 Bogawantalawa Plantation PLC 1,455 1,635 150 1,455 1,635 Hapugasthenne Plantation PLC 1,560 2,270 100 1,560 2,270 Horana Plantation PLC 1,790 2,140 100 1,790 2,140 Kahawatte Plantation PLC 3,770 3,720 100 3,770 3,720 Kegalle Plantation PLC 4,850 6,650 100 4,850 6,650 Kotagala Plantation PLC 890 1,780 100 890 1,780 Kelani Valley Plantation, PLC 5,990 7,000 100 5,990 7,000 Madulsima Plantation PLC 750 800 100 750 800 Namunukula Plantation PLC 7,370 6,050 100 7,370 6,050 Talawakelle Plantation PLC 3,100 3,160 100 3,100 3,160 Udapussellawa Plantation PLC 1,940 2,790 100 1,940 2,790 Watawala Plantation PLC 19,700 24,300 1,000 19,700 24,300 Total Available for sale instruments 56,135 66,105 2,350 56,135 66,105 Total Other financial assets 56,135 7,086,105 56,135 7,086,105
15.3 Net (loss) / gain on available for sale financial assets (9,970) (7,125) (9,970) (7,125)
Financial Reports

Malwatte Valley Plantations PLC | Annual Report 201662
15.4 Fair Value Hierarchy for Financial Assets as at 31 December 2016 Level 1 Level 2 Level 3 Financial Asset Type Date of Total (Quoted (Significant (Significant
Valuation prices in observable unobservable (Rs.) active markets) inputs) inputs)
Rs. Rs. Rs. Investment in quoted equity shares 31-Dec-16 56,135 56,135 - - Total 56,135 56,135 - - 16 INVESTMENT IN SUBSIDIARY Group Company 2016 2015 2016 2015 Rs. Rs. Rs. Rs.
Prime Real Estate Australia (Pvt) Ltd - - 28,041,431 28,041,431 - - 28,041,431 28,041,431 The Group has invested in Prime Real Estate Australia (Pvt) Ltd, which involved in the business of construction & real
estate in Australia. With effect from 27 February 2014, Prime Real Estate Australia Pty Ltd became a fully owned foreign subsidiary of Malwatte Valley Plantations PLC. The subsidiaries functional currency is Australian Dollars. The summarized financial information of the Group’s investment in Prime Real Estate Australia (Pvt) Ltd is as follows;
2016 2015 Rs. Rs Number of Shares Invested 242,510 242,510 Holding % by the MVPL 100% 100%
2016 2015 Rs. Rs. Current Assets 10,190,675 75,982,288 Current liabilities (15,798,454) (51,138,924) Revenue 80,961,580 38,239,936 Cost of Sales (74,995,210) (36,986,549) Administrative Expenses (5,907,939) (72,835) Profit/(Loss) Before tax 58,431 1,180,551 Income Tax Expense (11,789) - Profit/( loss) for the year 46,642 1,180,551 Total Comprehensive income/(loss) for the year 46,642 1,180,551
notes to tHe finAnCiAl stAteMentsFor the year ended 31 December 2016
15 OTHER NON CURRENT FINANCIAL ASSETS (Contd)

Malwatte Valley Plantations PLC | Annual Report 2016 63
17 PRODUCE ON BEARER BIOLOGICAL ASSETS Group Company 2016 2015 2016 2015 Rs. Rs. Rs. Rs.
As at 1st January - as previously reported 1,624,391 - 1,624,391 - Impact of the amendments of LKAS 16 and LKAS 41 - 2,724,705 - 2,724,705 As at 1st January - restated 1,624,391 2,724,705 1,624,391 2,724,705 Change in fair value less cost to sell 3,026,300 (1,100,314) 3,026,300 (1,100,314) As at 31st December 4,650,691 1,624,391 4,650,691 1,624,391 17.1 Fair Value Hierarchy for Non Financial Level 1 Level 2 Level 3 Assets as at 31 December 2016 (Quoted prices (Significant (Significant Date of in active observable unobservable Valuation markets) inputs) inputs) Non Financial Asset Type Rs. Rs. Rs. Produce on Bearer Biological assets 31-Dec-15 - 1,624,391 - 31-Dec-16 - 4,650,691 -
17.2 Gain/(Loss) on Fair Value of Biological Assets
Group Company 2016 2015 2016 2015 Rs. Rs. Rs. Rs. Consumable Biological Assets - Gain/(loss) arising from changes in fair value less cost to sell - Note No 14.2 162,567,337 62,500,529 162,567,337 62,500,529 Produce on Bearer Biologal Assets - Gain/(Loss) arising from changes in fair value less cost to sell - Note No 17 3,026,300 (1,100,314) 3,026,300 (1,100,314) Total Change in Fair Value of Biological Assets 165,593,637 61,400,215 165,593,637 61,400,215 18 INVENTORIES Input Materials 48,023,828 49,516,894 48,023,828 49,516,894 Nurseries 7,205,886 6,150,544 7,205,886 6,150,544 Consumables & Spares 20,930,658 17,908,547 20,930,658 17,908,547 Harvested Crops 334,667,095 284,687,913 334,667,095 284,687,913 Construction Inventory - 70,185,500 - - 410,827,467 428,449,398 410,827,467 358,263,898 Less: Provision for Obsolete Stocks (4,911,323) (4,911,324) (4,911,323) (4,911,324) 405,916,144 423,538,074 405,916,144 353,352,574
notes to tHe finAnCiAl stAteMentsFor the year ended 31 December 2016
Financial Reports

Malwatte Valley Plantations PLC | Annual Report 201664
19 TRADE AND OTHER RECEIVABLES Group Company 2016 2015 2016 2015 Rs. Rs. Rs. Rs. Produce debtors 17,157,385 48,258,859 17,157,385 48,258,859 Advances & Prepayments 29,586,198 19,229,961 29,586,198 19,229,961 Other debtors 59,332,228 61,186,812 59,332,228 56,417,889 Staff Debtors 58,851,122 64,615,754 58,851,122 64,615,754 WHT Recoverable 8,510,864 5,670,294 8,510,864 5,670,294 ESC Recoverable 10,323,244 3,572,985 10,323,244 3,572,985 183,761,040 202,534,664 183,761,040 197,765,742 Less: Provision for Impairment (4,638,923) (4,638,923) (4,638,923) (4,638,923) 179,122,117 197,895,741 179,122,117 193,126,819
19.1 Movement In The Provision For Impairment Individually Collectively Total Impaired Impaired Rs. Rs. Rs. As At 01 January 2015 - 4,638,923 4,638,923 Charge for the year - - - As At 31 December 2015 - 4,638,923 4,638,923 Charge for the year - - - As At 31 December 2016 - 4,638,923 4,638,923
Group Company 2016 2015 2016 2015 Rs. Rs. Rs. Rs.
20 AMOUNTS DUE FROM RELATED PARTIES
Uva Resorts & Residencies (Pvt)Ltd 11,903,688 9,355,851 11,903,688 9,355,851 Bloemendal Flower Company (Pvt) Ltd 22,107,258 21,577,273 22,107,258 21,577,273 Oreocromis Dynamics (Pvt) Ltd 5,968,586 8,952,880 5,968,586 8,952,880 Bogtstra & Gerlach (Pvt) Ltd 2,468,269 2,468,269 2,468,269 2,468,269 Malwatte Hotel & Resort (Pvt) Ltd. 8,403,730 12,605,596 8,403,730 12,605,596 Prime Real Estate Australia Pty Ltd - - - 21,726,412 50,851,531 54,959,868 50,851,531 76,686,280
No interest is charged on these current account balances since those are not included under Intercompany Loans.
21 CASH AND CASH EQUIVALENTS21.1 Short term deposits Short term fixed deposits 618,024,873 753,691,909 618,024,873 753,691,909 Total 618,024,873 753,691,909 618,024,873 753,691,909
notes to tHe finAnCiAl stAteMentsFor the year ended 31 December 2016

Malwatte Valley Plantations PLC | Annual Report 2016 65
21.2 Favorable balances Cash at bank 167,664,162 130,338,520 167,664,162 130,338,520 Cash in hand 10,263,488 1,149,775 72,813 121,909 Cash in transits 1,076,898 3,445,339 1,076,898 3,445,339 Stamps 3,787 9,386 3,787 9,386 Total 179,008,335 134,943,020 168,817,660 133,915,154 21.3 Unfavorable balances Bank overdraft 350,440,688 404,230,743 350,440,688 404,230,743 Total 350,440,688 404,230,743 350,440,688 404,230,743 Short-term deposits are made for varying periods between one day and three months, depending on the immediate cash requirements of
the Company, and earn interest at the respective short-term deposit rates. The securities pledged have been disclosed in Note 31 to the financial statements.
22 STATED CAPITAL Group Company 2016 2015 2016 2015 Number Number Number Number Issued and Fully Paid Number of Shares No. of Voting Ordinary Shares including one Golden Share held by the Treasury which has special rights 202,792,332 202,792,332 202,792,332 202,792,332 No. of Non- Voting Ordinary Shares 20,250,660 20,250,660 20,250,660 20,250,660 223,042,992 223,042,992 223,042,992 223,042,992
Group Company 2016 2015 2016 2015 Rs. Rs. Rs. Rs. Stated Capital including one Golden Share held by the 350,000,010 350,000,010 350,000,010 350,000,010 Treasury which has special rights Issue of Non - Voting Ordinary Shares 23,000,000 23,000,000 23,000,000 23,000,000 373,000,010 373,000,010 373,000,010 373,000,010 Stated capital represents the amount paid to the company in respect of issuing 202,792,332 Ordinary Shares including one Golden Share
which has special rights and 20,250,660 Non-Voting Ordinary Shares.
23 Revaluation Reserve Group Company 2016 2015 2016 2015 Rs. Rs. Rs. Rs. At the beginning of the year 545,301,567 545,301,567 545,301,567 545,301,567 Transfers to general reserve - - - - At the end of the year 545,301,567 545,301,567 545,301,567 545,301,567The above revaluation reserve consists of net surplus resulting from the revaluation of property, plant and equipment as described in Note 12 and 13 to these financial statements. This unrealised amount cannot be distributed to shareholders.
notes to tHe finAnCiAl stAteMentsFor the year ended 31 December 2016
Financial Reports
Group Company 2016 2015 2016 2015 Rs. Rs. Rs. Rs.

Malwatte Valley Plantations PLC | Annual Report 201666
24 INTEREST BEARING LOANS AND BORROWINGS Group Company Repayable Repayable Repayable Repayable Total Total Repayable Repayable Repayable Repayable Total Total within After 1 year After 5 years After 1 year as at as at within After 1 year After 5 years After 1 year as at as at 1 year less than 31.12.2016 31.12.2015 1 year less than 31.12.2016 31.12.2015 5 years 5 years Rs. Rs. Rs. Rs. Rs. Rs. Rs. Rs. Rs. Rs. Rs. Rs. 24.1 Long-term Loans (ADB) Hatton National Bank PLC - - - - - 378,479 - - - - - 378,479 24.2 Long term Loans Lanka Mount Castle (Pvt) Ltd - - - - - 331,811 - - - - - 331,811 Hatton National Bank PLC - - - - - 29,230,000 - - - - - 29,230,000 National Development Bank PLC 89,700,000 269,100,000 - 269,100,000 358,800,000 431,100,000 89,700,000 269,100,000 - 269,100,000 358,800,000 431,100,000 Indian Overseas Bank PLC 29,900,006 94,683,322 - 94,683,322 124,583,328 143,700,029 29,900,006 94,683,322 - 94,683,322 124,583,328 143,700,029 National Development Bank PLC 22,363,200 74,548,000 - 74,548,000 96,911,200 - 22,363,200 74,548,000 - 74,548,000 96,911,200 - Sri Lanka Tea Board 4,305,555 26,694,445 - 26,694,445 31,000,000 - 4,305,555 26,694,445 - 26,694,445 31,000,000 - Westpac Loan -73-1702 - - - - - 34,539,091 - - - - - - 24.3 Short term Loans HNB - Packing Credit Loan - - - - - 66,799,830 - - - - - 66,799,830 Union Bank - Packing Credit Loan 13,891,150 - - - 13,891,150 - 13,891,150 - - - 13,891,150 - 24.4 Lease Creditors 16,812,554 47,134,892 - 47,134,892 63,947,436 42,581,105 16,812,554 47,134,892 - 47,134,892 63,947,436 42,581,105 Total 176,972,465 512,160,659 - 512,160,659 689,133,114 748,660,345 176,972,465 512,160,659 - 512,160,659 689,133,114 714,121,254
notes to tHe finAnCiAl stAteMentsFor the year ended 31 December 2016

Malwatte Valley Plantations PLC | Annual Report 2016 67
24 INTEREST BEARING LOANS AND BORROWINGS Group Company Repayable Repayable Repayable Repayable Total Total Repayable Repayable Repayable Repayable Total Total within After 1 year After 5 years After 1 year as at as at within After 1 year After 5 years After 1 year as at as at 1 year less than 31.12.2016 31.12.2015 1 year less than 31.12.2016 31.12.2015 5 years 5 years Rs. Rs. Rs. Rs. Rs. Rs. Rs. Rs. Rs. Rs. Rs. Rs. 24.1 Long-term Loans (ADB) Hatton National Bank PLC - - - - - 378,479 - - - - - 378,479 24.2 Long term Loans Lanka Mount Castle (Pvt) Ltd - - - - - 331,811 - - - - - 331,811 Hatton National Bank PLC - - - - - 29,230,000 - - - - - 29,230,000 National Development Bank PLC 89,700,000 269,100,000 - 269,100,000 358,800,000 431,100,000 89,700,000 269,100,000 - 269,100,000 358,800,000 431,100,000 Indian Overseas Bank PLC 29,900,006 94,683,322 - 94,683,322 124,583,328 143,700,029 29,900,006 94,683,322 - 94,683,322 124,583,328 143,700,029 National Development Bank PLC 22,363,200 74,548,000 - 74,548,000 96,911,200 - 22,363,200 74,548,000 - 74,548,000 96,911,200 - Sri Lanka Tea Board 4,305,555 26,694,445 - 26,694,445 31,000,000 - 4,305,555 26,694,445 - 26,694,445 31,000,000 - Westpac Loan -73-1702 - - - - - 34,539,091 - - - - - - 24.3 Short term Loans HNB - Packing Credit Loan - - - - - 66,799,830 - - - - - 66,799,830 Union Bank - Packing Credit Loan 13,891,150 - - - 13,891,150 - 13,891,150 - - - 13,891,150 - 24.4 Lease Creditors 16,812,554 47,134,892 - 47,134,892 63,947,436 42,581,105 16,812,554 47,134,892 - 47,134,892 63,947,436 42,581,105 Total 176,972,465 512,160,659 - 512,160,659 689,133,114 748,660,345 176,972,465 512,160,659 - 512,160,659 689,133,114 714,121,254
notes to tHe finAnCiAl stAteMentsFor the year ended 31 December 2016
Financial Reports

Malwatte Valley Plantations PLC | Annual Report 201668
notes to tHe finAnCiAl stAteMentsFor the year ended 31 December 2016
24 INTEREST BEARING LOANS AND BORROWINGS (Contd) Group Company
24.1 LONG TERM LOANS Repayable Repayable Repayable Repayable Total Total Repayable Repayable Repayable Repayable Total Total Rate of Terms of within After 1 year After 5 years After 1 year as at as at within After 1 year After 5 years After 1 year as at as at interest Re payments ASIAN DEVELOPMENT BANK LOAN 1 year less than 31.12.2016 31.12.2015 1 year less than 31.12.2016 31.12.2015 5 years 5 years Rs. Rs. Rs. Rs. Rs. Rs. Rs. Rs. Rs. Rs. Rs. Rs. Rs. 24.1.1 Through Hatton National Bank 2000/2001 Sub Loan 1 - - - - - 362,262 - - - - - 362,262 15.63% 1st Installment of Rs.362,262& 119
Monthly Installments of Rs.416,000 payable commenced from 01.02.2006
Sub Loan 2 - - - - - 16,217 - - - - - 16,217 15.63% 1st Installment of Rs.16,217& 119 Monthly Installments of Rs.27,800 payable commenced from 01.02.2006
- - - - - 378,479 - - - - - 378,479 24.2 Other Long Term Loans 24.2.1 Lanka Mount Castle (Pvt) Ltd Loan -02 - - - - - 331,805 - - - - - 331,805 - 72 equal monthly installments - - - - - 331,805 - - - - - 331,805 24.2.2 Hatton National Bank - - - - 29,230,000 - - - - - 29,230,000 - Capital to be paid after an initial
grace period of 10 months by 48 installments commenced from September 2012
- - - - - 29,230,000 - - - - - 29,230,000 24.2.3 National Development Bank NDB Dollar Loan 89,700,000 269,100,000 - 269,100,000 358,800,000 431,100,000 89,700,000 269,100,000 - 269,100,000 358,800,000 431,100,000 6.10% Capital to be paid after an initial
grace period of 24 months by 60 installments commenced from January 2016
89,700,000 269,100,000 - 269,100,000 358,800,000 431,100,000 89,700,000 269,100,000 - 269,100,000 358,800,000 431,100,000 24.2.4 Indian Oversea Bank Indian Overseas Bank PLC 29,900,006 94,683,322 - 94,683,322 124,583,328 143,700,029 143,700,029 94,683,322 - 94,683,322 124,583,328 143,700,029 6.10% Capital to be paid after an initial
grace period of 25 months by 85 equal monthly installments commencing from 1 May 2016
29,900,006 94,683,322 - 94,683,322 124,583,328 143,700,029 143,700,029 94,683,322 - 94,683,322 124,583,328 143,700,029 24.2.5 National Development Bank 22,363,200 74,548,000 74,548,000 96,911,200 - - - - - - - - One month AWPLR+1.5
59 equal monthly installments 22,363,200 74,548,000 - 74,548,000 96,911,200 - - - - - - - 24.2.6 Sri Lanka Tea Board 4,305,555 26,694,445 26,694,445 31,000,000 - - - - - - - - Central bank 12 month
AWPLR+1% 36 equal monthly installments
24.3 SHORT TERM INTEREST BEARING BORROWINGS 24.3.1 HNB - Packing Credit Loan - - - - - - 66,799,830 - - - - 66,799,830 This loan has been provide for
3 months. After completion of 3 months that will be renewed again
24.3.2 Union Bank - Packing Credit Loan - 13,891,150 - - - 13,891,150 - - - - 13,891,150 - This loan has been provide for 3 months. After completion of 3 months that will be renewed again

Malwatte Valley Plantations PLC | Annual Report 2016 69
24 INTEREST BEARING LOANS AND BORROWINGS (Contd) Group Company
24.1 LONG TERM LOANS Repayable Repayable Repayable Repayable Total Total Repayable Repayable Repayable Repayable Total Total Rate of Terms of within After 1 year After 5 years After 1 year as at as at within After 1 year After 5 years After 1 year as at as at interest Re payments ASIAN DEVELOPMENT BANK LOAN 1 year less than 31.12.2016 31.12.2015 1 year less than 31.12.2016 31.12.2015 5 years 5 years Rs. Rs. Rs. Rs. Rs. Rs. Rs. Rs. Rs. Rs. Rs. Rs. Rs. 24.1.1 Through Hatton National Bank 2000/2001 Sub Loan 1 - - - - - 362,262 - - - - - 362,262 15.63% 1st Installment of Rs.362,262& 119
Monthly Installments of Rs.416,000 payable commenced from 01.02.2006
Sub Loan 2 - - - - - 16,217 - - - - - 16,217 15.63% 1st Installment of Rs.16,217& 119 Monthly Installments of Rs.27,800 payable commenced from 01.02.2006
- - - - - 378,479 - - - - - 378,479 24.2 Other Long Term Loans 24.2.1 Lanka Mount Castle (Pvt) Ltd Loan -02 - - - - - 331,805 - - - - - 331,805 - 72 equal monthly installments - - - - - 331,805 - - - - - 331,805 24.2.2 Hatton National Bank - - - - 29,230,000 - - - - - 29,230,000 - Capital to be paid after an initial
grace period of 10 months by 48 installments commenced from September 2012
- - - - - 29,230,000 - - - - - 29,230,000 24.2.3 National Development Bank NDB Dollar Loan 89,700,000 269,100,000 - 269,100,000 358,800,000 431,100,000 89,700,000 269,100,000 - 269,100,000 358,800,000 431,100,000 6.10% Capital to be paid after an initial
grace period of 24 months by 60 installments commenced from January 2016
89,700,000 269,100,000 - 269,100,000 358,800,000 431,100,000 89,700,000 269,100,000 - 269,100,000 358,800,000 431,100,000 24.2.4 Indian Oversea Bank Indian Overseas Bank PLC 29,900,006 94,683,322 - 94,683,322 124,583,328 143,700,029 143,700,029 94,683,322 - 94,683,322 124,583,328 143,700,029 6.10% Capital to be paid after an initial
grace period of 25 months by 85 equal monthly installments commencing from 1 May 2016
29,900,006 94,683,322 - 94,683,322 124,583,328 143,700,029 143,700,029 94,683,322 - 94,683,322 124,583,328 143,700,029 24.2.5 National Development Bank 22,363,200 74,548,000 74,548,000 96,911,200 - - - - - - - - One month AWPLR+1.5
59 equal monthly installments 22,363,200 74,548,000 - 74,548,000 96,911,200 - - - - - - - 24.2.6 Sri Lanka Tea Board 4,305,555 26,694,445 26,694,445 31,000,000 - - - - - - - - Central bank 12 month
AWPLR+1% 36 equal monthly installments
24.3 SHORT TERM INTEREST BEARING BORROWINGS 24.3.1 HNB - Packing Credit Loan - - - - - - 66,799,830 - - - - 66,799,830 This loan has been provide for
3 months. After completion of 3 months that will be renewed again
24.3.2 Union Bank - Packing Credit Loan - 13,891,150 - - - 13,891,150 - - - - 13,891,150 - This loan has been provide for 3 months. After completion of 3 months that will be renewed again
Financial Reports

Malwatte Valley Plantations PLC | Annual Report 201670
notes to tHe finAnCiAl stAteMentsFor the year ended 31 December 2016
24 INTEREST BEARING LOANS AND BORROWINGS (Contd) Group Company Repayable Repayable Total Total Repayable Repayable Total Total within after 01 Year As At As At within after 01 Year As At As At 01 Year Less than 31.12.2016 31.12.2015 01 Year Less than 31.12.2016 31.12.2015 05 Years 05 Years Rs. Rs. Rs. Rs. Rs. Rs. Rs. Rs.
24.4 LEASE CREDITORS24.4.1 Hatton National Bank PLC Motor Vehicles Gross Liability 20,907,037 51,765,330 72,672,367 51,645,614 20,907,037 51,765,330 72,672,367 51,645,614 Finance Charge (4,094,485) (4,630,445) (8,724,930) (9,064,510) (4,094,485) (4,630,445) (8,724,930) (9,064,510) Net Liability 16,812,552 47,134,885 63,947,437 42,581,104 16,812,552 47,134,885 63,947,437 42,581,104 25 DEFERRED INCOME Group Company 2016 2015 2016 2015 Deferred Grants and Subsidies Rs. Rs. Rs. Rs.
As at 1 January 124,137,417 121,825,475 124,137,417 121,825,475 Add : Grants received / (refunded) during the year 9,516,584 12,741,947 9,516,584 12,741,947 Less : Amortisation for the year (9,497,010) (10,430,005) (9,497,010) (10,430,005) As at 31 December 124,156,991 124,137,417 124,156,991 124,137,417
The Company has received funding from the Plantation Housing and Social Welfare Trust and Asian Development Bank for the development of workers facilities such as re-roofing of line rooms, latrines, water supply and sanitation etc. The amounts spent are included under the relevant classification of property, plant & equipment and the grant component is reflected under Deferred Grants and Subsidies.

Malwatte Valley Plantations PLC | Annual Report 2016 71
notes to tHe finAnCiAl stAteMentsFor the year ended 31 December 2016
26 DEFERRED TAX LIABILITY Group Company
2016 2015 2016 2015 Temporary Tax Effect Temporary Tax Effect Temporary Tax Effect Temporary Tax Effect Difference Difference Difference Difference Rs. Rs. Rs. Rs. Rs. Rs. Rs. Rs. As at 1 January 1,074,945,851 62,549,158 656,168,191 54,564,168 1,074,945,851 62,549,158 656,168,191 54,564,168 Amount originating during the year 246,256,365 26,266,555 418,777,660 7,984,990 246,256,365 26,266,555 418,777,660 7,984,990 As at 31 December 1,321,202,216 88,815,713 1,074,945,851 62,549,158 1,321,202,216 88,815,713 1,074,945,851 62,549,158 Temporary difference of Property, Plant and Equipment (including mature and immature plantation) 1,499,382,118 178,554,706 1,476,089,921 177,759,270 1,499,382,118 178,554,706 1,476,089,921 177,759,270 Temporary difference of Biological assets 1,070,448,616 107,044,862 902,600,826 90,260,083 1,070,448,616 107,044,862 902,600,826 90,260,083 Temporary difference of retirement benefit obligation (803,715,585) (126,665,576) (922,140,536) (145,329,348) (803,715,585) (126,665,576) (922,140,536) (145,329,348) Carried forward tax losses (444,912,933) (70,118,278) (381,604,360) (60,140,847) (444,912,933) (70,118,278) (381,604,360) (60,140,847) As at 31 December 1,321,202,216 88,815,713 1,074,945,851 62,549,158 1,321,202,216 88,815,713 1,074,945,851 62,549,158
The effective tax rate used to calculate deferred tax liability for all the Temporary Differences other than Biological Assets as at 31 December, 2016 is 15.76% (2015-15.76%) for the company.
The effective tax rate used to calculate deferred tax liability for Biological Assets as at 31 December, 2016 is 10% (2015-10%) for the company.
27 RETIREMENT BENEFIT OBLIGATIONS Group Company 2016 2015 2016 2015 Rs. Rs. Rs. Rs. As at 1 January 922,140,536 878,779,346 922,140,536 878,779,346 Interest Cost 92,214,054 87,877,935 92,214,054 87,877,935 Current Service Cost 34,913,358 45,258,615 34,913,358 45,258,615 Actuarial (Gain) / Loss (157,106,686) (26,072,408) (157,106,686) (26,072,408) Payments for the year (88,445,677) (63,702,952) (88,445,677) (63,702,952) As at 31 December 803,715,585 922,140,536 803,715,585 922,140,536
LKAS 19 requires the use of actuarial techniques to make a reliable estimate of the amount of retirement benefit that employees have earned in return for their service in the current and prior periods using the Projected Unit Credit Method and discount that benefit in order to determine the present value of the retirement benefit obligation and the current service cost. This require an entity to determine how much benefit is attributable to the current and prior periods and to make estimates about demographic variables and financial variables that will influence the cost of the benefit. The following key assumptions were made in arriving at the above figure.
Financial Reports

Malwatte Valley Plantations PLC | Annual Report 201672
According to the actuarial valuation report issued by Actuarial & Management Consultants (Pvt) Limited, a firm of professional actuaries as at 31 December 2016 the actuarial present value of promised retirement benefits amounted to Rs. 803,715,585/=. If the company had provided for gratuity on the basis of 14 days wages & half months salary for each completed year of service, the liability would have been Rs. 1,295,588,737/=. Hence, there is a contingent liability of Rs. 491,873,152/= , which would crystallise only if the company ceases to be a going concern. The following payments are expected from the defined benefit plan obligation in future years.
Monthly Paid Staff Daily paid Staff 2016 2015 Rs. Rs. Rs. Rs. Within the next 12 months 23,697,369 170,010,983 193,708,352 151,917,851 Between 2 and 5 years 15,926,180 196,858,985 212,785,165 255,503,592 Beyond 5 years 10,015,825 387,206,243 397,222,068 514,719,094 49,639,374 754,076,211 803,715,585 922,140,536
The weighted average duration of the Defined Benefit plan obligation at the end of the reporting period is 3.18years and 7.31Years for staff and workers respectively. The key assumptions used by Actuarial & Management Consultants (Pvt) Limited include the following;
2016 2015 (i) Rate of Interest 12% 10% (ii) Rate of Salary Increase Workers 15% (every two years) 15% (every two years) Staff - Executives 5% (per annum) 5% (per annum) Staff - Estate Staff and Non Executives 15% (every three years) 15% (every three years) (iii) Retirement Age Workers 60 years 60 years Staff 58 years 58 years (iv) Daily Wage Rate Rs. 500/- Rs. 450/-
27 RETIREMENT BENEFIT OBLIGATIONS (Contd)
notes to tHe finAnCiAl stAteMentsFor the year ended 31 December 2016

Malwatte Valley Plantations PLC | Annual Report 2016 73
27 RETIREMENT BENEFIT OBLIGATIONS (Contd)
27.1 Sensitivity Analysis Values appearing in the financial statements are very sensitive to the changes in financial and non-financial assumptions used. A sensitivity was carried out as follows:
Impact on Retirement Benefit Obligation Rs. Rs. A one percentage point change in the discount rate. +1% -1% As at 31 December 2016 (44,507,673) 50,328,295 As at 31 December 2015 (61,016,339) 69,744,829 A one percentage point change in the salary / wage increment rate. +1% -1% As at 31 December 2016 (25,922,608) (24,692,428) As at 31 December 2015 35,468,963 (33,651,085)
Group Company 2016 2015 2016 2015 Rs. Rs. Rs. Rs.
28 LIABILITY TO MAKE LEASE PAYMENT Gross Liability As at 31 December 244,374,699 252,963,699 244,374,699 252,963,699 Finance cost allocated to future periods (100,010,656) -105,893,465 (100,010,656) -105,893,465 Net Liability 144,364,043 147,070,234 144,364,043 147,070,234 Payable within one year Gross liability 8,589,000 8,589,000 8,589,000 8,589,000 Finance cost allocated to future periods (5,774,562) (5,882,809) (5,774,562) (5,882,809) Net liability transferred to current liabilities 2,814,438 2,706,191 2,814,438 2,706,191 Payable within two to five years Gross liability 34,356,000 34,356,000 34,356,000 34,356,000 Finance cost allocated to future periods (21,926,533) (22,404,590) (21,926,533) (22,404,590) Net liability 12,429,467 11,951,410 12,429,467 11,951,410 Payable after five years Gross liability 201,429,699 210,018,699 201,429,699 210,018,699 Finance cost allocated to future periods (72,309,561) (77,606,066) (72,309,561) (77,606,066) Net liability 129,120,138 132,412,633 129,120,138 132,412,633 Net liability payable after one year 141,549,605 144,364,043 141,549,605 144,364,043
notes to tHe finAnCiAl stAteMentsFor the year ended 31 December 2016
Financial Reports

Malwatte Valley Plantations PLC | Annual Report 201674
The lease of the estates have been amended, with effect from 22nd June 1996 to an amount substantially higher than the previous lease rental of Rs. 500/= per estate per annum. The first rental payable under the revised basis is Rs. 8.59 million from 22nd June 1996. This amount is to be inflated annually by the Gross Domestic Product (GDP) deflator, and is in the form of a contingent rental. The Statement of Recommended Practice (SoRP) for Right-to-use of Land on Lease was approved by the Council of the Institute of Chartered Accountants of Sri Lanka on 19th December 2012. Subsequently, the amendments to the SoRP along with the modification to the title as Statement of Alternative Treatment (SoAT) were approved by the Council on 21st August 2013. The Company has not reassessed the Right-to-use of Land because this is not a mandatory requirement. However, if the liability is reassessed according to the alternative treatment (SoAT) on the assumption that the lease rent is increased constantly by GDP deflator of 4% and discounted at a rate of 13% ,liability would be as follows.
Rs. Gross Liability = 1,635,335,191 Finance Charges = (1,090,834,648) Net Liability = 544,500,543
The above reassessed liability is not reflected in these Financial Statements.
29 TRADE AND OTHER PAYABLES Group Company 2016 2015 2016 2015 Rs. Rs. Rs. Rs. Trade Creditors 149,408,361 120,760,894 149,408,361 120,760,894 Employee Related Creditors 151,982,448 137,648,443 151,982,448 137,648,443 Accrued Expenses 11,869,821 11,678,140 11,869,821 11,548,062 Others 44,432,690 31,375,891 40,191,487 31,375,891 357,693,320 301,463,368 353,452,117 301,333,290 30 AMOUNTS DUE TO RELATED COMPANIES Group Company 2016 2015 2016 2015 Relationship Rs. Rs. Rs. Rs. Prime Real Estate Australia (Pvt) Ltd. Related Company - - 20,039,657 - - - 20,039,657 -
notes to tHe finAnCiAl stAteMentsFor the year ended 31 December 2016
28 LIABILITY TO MAKE LEASE PAYMENT (Contd)

Malwatte Valley Plantations PLC | Annual Report 2016 75
notes to tHe finAnCiAl stAteMentsFor the year ended 31 December 2016
31 SECURITIES PLEDGED Following assets have been pledged as security for liabilities.
Carrying amount of assets pledged
Nature of Liability Loan/Facility Security Rs. 2016 2015 Rs. Rs.
A.D.B. Loan through HNB 92,153,096 Primary mortgage over leasehold - 378,479 rights of Warwick, Unugalla, Ledgerwatte, Hakgalla, Ellawela Estates.
Overdraft - HNB 254,000,000 Primary mortgage over leasehold 202,635,442 251,832,319 rights of Warwick, Hakgalla, Ledgerwatte, Unugalla, Keenakelle, Downside & Queentown Estates.
Overdraft - Union Bank 160,000,000 Primary mortgage over leasehold 146,462,071 152,367,106 rights of Dyraba & Aislaby Estates.
HNB - Long Term Loan 122,830,000 Primary mortgage over leasehold - 29,230,000 rights of Land, Buildings and immovable Machinery of Chelsea, Attempitiya and Uva Ketawela.
National Developemnt Bank PLC USD 3,000,000 Primary mortgage over leasehold 358,800,000 431,100,000 -Long term Loan rights of Land, Buildings and
immovable Machinery of Neluwa & Uva Highlands
Indian Overseas Bank PLC USD 1,000,000 Primary mortgage over leasehold 124,583,328 143,700,029 -Long term Loan rights of Land, Buildings and
immovable Machinery of St James Estate
National Developemnt Bank PLC 111,820,000 Primary mortgage over leasehold 96,911,200 - -Long term Loan rights over Land, Plantations,
buildings and Plant & Machinery of Moralioya Estate
` Further mortgage over Lease hold rights over land, Plantations, Buildings, and Plant & Machinery of Neluwa and Uva Highlands Estates
Sri Lanka Tea Board 31,000,000 Broker proceeds 31,000,000 - Long Term Loan
Financial Reports

Malwatte Valley Plantations PLC | Annual Report 201676
32 CAPITAL COMMITMENTS 2016 2015 Rs. Rs.
Followings are the capital commitments as at the Statement of Financial Position date. Contracted , but not provided for Nill Nil Total Nil Nil
33 CONTINGENCIES There are no known contingent liabilities exist as at the Statement of Financial Position date.
34 EVENTS AFTER THE REPORTING PERIOD There have been no material events occurring after the Statement of Financial Position date that require adjustments or
disclosures in the Financial statements.
35 RELATED PARTY DISCLOSURES35.1 Details of Significant Related Party Disclosures are as follows.
Transactions with the parent and related entities Amount Charged/ (Credited)
Nature of 2016 2015 Nature of the Company Relationship Name of Director Transaction Rs. Rs. Oreocromis Dynamics (Pvt) Ltd. Related Company Mr. Lucas Bogtstra Advances 2,984,294 2,984,293
Mr.T. R. Gerlach
Bloemendal Flower Company (Pvt) Ltd. Related Company Mr. Lucas Bogtstra Advances (529,985) (465,970) Mr.T. R. Gerlach
Malwatte Hotel and Resort (Private) Ltd. Related Company Mr. Lucas Bogtstra Advances 4,201,866 4,201,865 Mr.T. R. Gerlach
Uva Resorts & Residencies (Pvt) Ltd Related Company Mr. Lucas Bogtstra Advances (2,547,837) (6,022,598) Mr.S. N. Dharmaratna Mr. T. R. Gerlach
Prime Real Estate Australia (Pvt) Ltd Subsidiary Mr. Lucas Bogtstra Advances 1,686,755 (194,698) Mr. S.N. Dharmaratna Mr.T. R.Gerlach Ms.S. D. T. Dharmaratna
35.2 Transactions with the key management personnel of the company or parent
There were no material transactions with the Key Management Personnel of the Company and its parent other than those disclosed in Notes 20 & 35.1 to the Financial Statements.
36 IMPACT OF AMENDMENTS TO LKAS 16 AND LKAS 41
Amendment to LKAS 16 and LKAS 41, on bearer plants, harvestable biological assets growing on the bearer plants are measured at their fair value less cost to sell and accounted retrospectively.
notes to tHe finAnCiAl stAteMentsFor the year ended 31 December 2016

Malwatte Valley Plantations PLC | Annual Report 2016 77
notes to tHe finAnCiAl stAteMentsFor the year ended 31 December 2016
The Company applied above amendment for the first time, which is effective for annual periods beginning on or after 1 January 2016. The nature and the effect of the changes are disclosed below.
2015 2015 2015 Previously Adjustment Restated Reported Amount Amount Amount Rs. Rs. Rs. STATEMENT OF PROFIT OR LOSS Change in Fair Value of Biological Assets 62,500,529 (1,100,314) 61,400,215 STATEMENT OF FINANCIAL POSITION Produce on Bearer Bialogical Assets ( Note No 17 ) As at the beginning of the year - 2,724,705 2,724,705 As at the end of the year - 1,624,391 1,624,391 Accumulated Profit / (Loss) As at the beginning of the year 1,181,732,189 2,724,705 1,184,456,894 As at the end of the year 867,813,233 1,624,389 869,437,622 37. FINANCIAL RISK MANAGEMENT OBJECTIVES AND POLICIES
The Group’s principal financial liabilities comprise loans and borrowings and trade and other payables. The main purpose of these financial liabilities is to finance the Group’s operations. The Group has loan and other receivables, trade and other receivables, and cash and short-term deposits that arrive directly from its operations. Accordingly the Group has exposure to namely Credit Risk, Liquidity Risk, Currency Risk and Interest Rate Risk from its use of financial instruments. This note presents information about the Group’s exposure to each of the above risks, the Group’s objectives, policies and processes for measuring and managing risk.
Credit risk
This is the risk of financial loss to the Group if a customer or counterparty to a financial instrument fails to meet its
contractual obligations, and arise principally from the Group’s receivable from customers.
Liquidity risk
Liquidity risk arises when the Group is unable to meets its financial obligations due to insufficient cash flow situations. The Group’s approach to managing liquidity is to ensure, as far as possible, that it will always have sufficient liquidity to meet its liabilities when due, under both normal and stressed conditions, without incurring unacceptable losses or risking damage to the Group’s reputation
Currency risk
The Group is exposed to currency risk on sales and purchases and long term loan obligations that are denominated in a currency other than the respective functional currency of the Group. The currency in which these transactions primarily denominated is in USD.
Financial Reports

Malwatte Valley Plantations PLC | Annual Report 201678
Interest rate risk
Interest Rate Risk is the potential for losses that may arise due to adverse movement of interest rates, mainly on floating interest rates. The Group manages its interest rate risk by having a balanced portfolio of fixed and variable rate loans and borrowings. The Group has not engaged in any interest rate swap agreements.
37.1 Financial Risk Management Framework
The Board of Directors has the overall responsibility for the establishment and oversight of the group’s financial risk management framework which includes developing and monitoring the Group’s financial risk management policies. The Group financial risk management policies are established to identify, quantify and analyze the financial risks faced by the Group, to set appropriate risk limits and controls and to monitor financial risks and adherence to limits. Financial risk management policies and systems are reviewed regularly to reflect changes in market conditions and the Group’s activities.
The Audit Committee of the Company oversees how management monitors compliance with the Group’s financial risk management policies and procedures and reviews the adequacy of the financial risk management framework in relation to the risks faced by the Group.
37.2 Credit Risk Credit Risk is the risk of financial loss to the Group if a customer or counterparty to a financial instrument fails to meet its
contractual obligations, and arise principally from the Group’s receivable from customers and from its financing activities including deposits with banks and financial institutions foreign exchange transactions and other financial instruments.
37.2.1 Trade and Other Receivables The Group’s exposure to credit risk is influenced by the individual characteristics of each customer. The Group’s credit policy
is monitored at the Board level. The new customers are analysed individually for credit worthiness before Group’s standard payment and delivery terms and conditions are offered. Group review includes external ratings, when available and in some cases, bank references, purchases limit etc. which also subject to under review on quarterly basis. The past experience of the Management is considered when revisions are made to terms and conditions.
The Group establishes an allowance for impairment that represents its estimate of incurred losses in respect of trade and other receivables.
The maximum exposure to credit risk for trade receivables of the company at the reporting date is Rs.17.15 Mn. The
Comapny has a minimal credit risk of its trade receivables as the repayment is guaranteed within seven days by the Tea and Rubber auction systems.
37.2.2 Investments Credit risks from invested balance with the financial institutions are managed by the Board of Directors. Investments of
surplus funds are made only with approved counterparties and within credit limits assigned to them. The limits are set to minimize the concentration of risks and therefore mitigate financial loss through potential counterparty’s failure.
37.2.3 Cash and Cash Equivalents The Group held cash and Cash Equivalents of Rs.179 Mn as at 31st December 2016 (2015 – Rs.134.Mn) which represents
its maximum credit exposure on these assets.
notes to tHe finAnCiAl stAteMentsFor the year ended 31 December 2016

Malwatte Valley Plantations PLC | Annual Report 2016 79
37.3 Liquidity Risk Liquidity risk is the risk that the Group will encounter difficulty in meeting the obligations associated with its financial liabilities
that are settled by delivering cash or another financial asset. The Group’s approach to managing liquidity is to ensure, as far as possible, that it will always have sufficient liquidity to meet its liabilities when due, under both normal and stressed conditions, without incurring unacceptable losses or risking damage to the Group’s reputation.
The Group does not concentrate on a single financial institution, thereby minimizing the exposure to liquidity risk through diversification of funding sources. The Group aims to fund investment activities of the individual and Group level by funding the long-term investment with long term financial sources and short term investment with short term financing. Where necessary the Group consults the Treasury Department and Strategic Business Development Unit in Parent Company for scrutinizing the funding decisions.
The Table below summarizes the maturity profile of the Groups financial liabilities based on contractual undiscounted
payments. As at 31st Dec 2016 Less than 3 to 12 2 to 5 years >5 years Total
3 Months (Rs.) Months (Rs.) (Rs.) (Rs.) (Rs.)
Interest bearing loans & borrowing 34,103,139 102,309,418 512,160,651 - 648,573,208 Trade payables 149,408,361 - - - - 183,511,500 102,309,418 512,160,651 - 648,573,208 37.4 Market Risk Market risk is the risk that the fair value or future cash flows of a financial instrument will fluctuate because of changes
in market prices. Market prices comprise four types of risk: interest rate risk, currency risk & other price risk such as equity price risk. Financial instrument affected by market risk include loans & borrowings, deposits & derivative financial instruments.
notes to tHe finAnCiAl stAteMentsFor the year ended 31 December 2016
Financial Reports
Malwatte Valley Plantations PLC | Annual Report 201680
37.4.1 Interest Rate Risk Interest rate risk is the risk that the fair value or future cash flows of a financial instrument will fluctuate because of changes
in market interest rates. The Group’s exposure to the risk of changes in market interest rates relates primarily to the Group’s long-term debt obligations with floating interest rates. The Group manages its interest rate risk by having a balanced portfolio of fixed and variable rate loans and borrowings. The Group has not engaged in any interest rate swap agreements.
Interest rate sensitivity The following table demonstrates the sensitivity to a reasonably possible change in interest rates on that portion of loans
and borrowings affected. With all other variables held constant, the group’s Profit Before Tax is affected through the impact on floating rate borrowings as follows:
Increase/ decrease Effect on profit
in Interest rate before tax Rs.
2016 +1% 464,441 -1% (464,441) 2015 +1% 6,864,529 -1% (6,864,529) 33.4.2 Foreign Currency Risk The Group is exposed to currency risk on sales and purchases that are denominated in a currency other than the respective
functional currency of the Group. The Group is exposed to currency risk on sales, purchases and borrowings. These currency primarily is USD.
notes to tHe finAnCiAl stAteMentsFor the year ended 31 December 2016

Malwatte Valley Plantations PLC | Annual Report 2016 81
sHAReHoldeRs & inVestoRs infoRMAtion
Distribution of Shares (Voting)
No of Shares Held No of share Holders No of share Holders % Total Holdings Total Holdings %
1 – 1,000 8,195 42.86% 3,632,234 1.79%
1,001 – 10,000 10,545 55.15% 20,784,018 10.24%
10,001 – 100,000 328 1.71% 10,397,966 5.13%
100,001 – 1,000,000 45 .24% 11,164,498 5.51%
1,000,001 & over 7 .04% 156,822,615 77.33%
Grand Total 19,120 100.00% 202,792,331 100.00% Analysis Report of Share Holders as at 31/12/2016
No of Shares Held No of share Holders No of share Holders % Total Holdings Total Holdings %
Individual 19,029 99.52% 44,314,988 21.85%
Institution 91 .48% 158,477,343 78.15%
Grand Total 19,120 100.00% 202,792,331 100.00% Share Holders Categorized Summary Report as at 31/12/2016 (Non Voting)
No of Shares Held No of share Holders No of share Holders % Total Holdings Total Holdings %
1,000 291 56.84% 108,896 .54%
1,001 – 10,000 161 31.45% 739,858 3.65%
10,001 – 100,000 50 9.76% 1,515,979 7.49%
100,001 – 1,000,000 8 1.56% 1,457,926 7.20%
1,000,001 & over 2 .39% 16,428,001 81.12%
Grand Total 512 100.00% 20,250,660 100.00%
Analysis Report of Share Holders as at 31/12/2016
No of Shares Held No of share Holders No of share Holders % Total Holdings Total Holdings %
Individual 484 94.53% 2,490,900 12.30%
Institution 28 5.47% 17,759,760 87.70%
Grand Total 512 100.00% 20,250,660 100.00%
Residence 510 99.61% 20,080,008 99.16%
Non Residence 2 .39% 170,652 .84%
Grand Total 512 100.00% 20,250,660 100.00%
Other Information

Malwatte Valley Plantations PLC | Annual Report 201682
sHAReHoldeRs & inVestoRs infoRMAtion
Top 20 Voting Shareholder’s List As At 31St December 2016
No’s Name/Address No. of Shares %
01 Wayamba Plantation (Private) Limited 135,839,160 66.98
02 Phillip Securities (Pvt) Ltd 961,815 .47
03 Peoples Leasing Finance PLC/Carlines Holdings (Pvt) Ltd 9,370,436 4.62
04 EST. Mariapillai Radhakrishnan 3,620,000 1.79
05 Pershing LLC S/A Avernach Grauson& Co. 2,500,000 1.23
06 Carlines Holdings (Pvt) Ltd 836,756 .41
07 Mr. M I Samsudeen 1,773,052 .87
08 Dr. Niranjan Deepal Gunawardena 1,044,834 .52
09 Almas Organisation (Pvt) Ltd., 2,675,133 1.32
10 Employees Provident Fund 792,000 .39
11 Mr. Hasim Abdul Nasar 500,000 0.25
12 Mr. Panagodage Somadasa 705,966 .35
13 Tranz Dominion,L.L.C. 520,000 .26
14 Mr. Kangasu Chelvadurai Vignarajah 438,000 .22
15 Mr. T L MohomadNawash 304,900 .15
16 Mr. M ShirajRazeen 281,700 .14
17 Mr. Asitha Kumar Seneviratne 259,980 .13
18 Mr. M S R Shamsudeen 238,947 .12
19 Star Lanka Holding (Pvt) Ltd., 239,233 .12
20 Mr. O W Dharmatilake 315,482 .16
Public Shareholding % - 33.02

Malwatte Valley Plantations PLC | Annual Report 2016 83
sHAReHoldeRs & inVestoRs infoRMAtion
Top 20 Non-Voting Shareholder’s List As At 31St December 2016
No’s Name/Address No. of Shares %
01 Commercial Bank Of CeyLanka Mountcastle (Pvt) Ltd 16,428,001 81.13
02 Wadock Mackenzie Limited/Mr. H. M. S. Abdulhussein 225,012 1.11
03 Employees provident Fund 346,000 1.71
04 Mr. Yusuf Husseinally Abdulhussein 164,500 .81
05 Mr. L. A. P. K. Liyanwala 191,331 .94
06 Phillip Securities (Pte) Ltd 137,099 .68
07 Mr. M. A. U. Gunathilake 176,381 .87
08 Seylan Bank/JayanthaDewage 112,000 .55
09 Eskimo Fashion Knitwear (Pvt) Ltd 90,000 .44
10 Peoples Leasing Finance PLC/Carlines Holdings (Pvt) Ltd 73,022 .36
11 Mr. W Don Padmasena 71,500 .35
12 Mr. Sujeewa Chandana Hiththatiyage 175,058 0.86
13 Merchant Bank of Sri Lanka PLC/S A C A Samarasinghe 57,000 .28
14 Peoples Leasing Finance PLC/Mr. M. A. U. Gnanathilake 106,926 .53
15 Mr. L. A. J. FiedelisMorais 50,000 .25
16 Mr. Yaddehige Jayatissa 50,000 .25
17 Mr. M. H. M. Fawsan 55,724 .28
18 Mr. Sivapatham Loheswaran 86,510 .43
19 Mr. A. K. Sampath Mendis 66,950 .33
20 Essajee Carimjee Insurance Brokers (PVT) Ltd 50,400 .25
Public Shareholding % -18.87
Directors Shareholdings in the Company - VOTING
Name As at 31.12.2016 As at 31.12.2015 Mr. W. L. Bogtstra 106,546 106,546Mr. Lucas Bogtstra 100,000 100,000Mr. T. R. Gerlach Nil Nil Mrs. C. A. Gerlach Nil Nil Mr. S. N. Dharmaratna Nil Nil Mr. A. N. De Silva Nil Nil Mr. K. A. S. Gunasekera Nil Nil Mr. G. C. De Silva Nil Nil Mr. Frits Bogtstra Nil Nil
Other Information

Malwatte Valley Plantations PLC | Annual Report 201684
sHAReHoldeRs & inVestoRs infoRMAtion
Directors Shareholdings in the Company – NON-VOTING
Name As at 31.12.2016 As at 31.12.2015 Mr. W L Bogtstra Nil NilMr. Lucas Bogtstra Nil NilMr. T R Gerlach Nil NilMrs. C A Gerlach Nil NilMr. S N Dharmaratna Nil NilMrs. F L Bogtstra Nil NilMr. K A S Gunasekera Nil NilMr. G C De Silva Nil NilMr. Frits Bogtstra Nil Nil
Stock ExchangeInterim Financial Statements for the forth quarter 31st December 2016 has been submitted to the Colombo Stock Exchange as required by the listing rules.
Market Value Voting - 2016 Voting -2015 Non Voting - 2016 Non Voting - 2015
Highest 3.30 3.70 3.00 3.60
Lowest 2.50 3.10 2.80 3.10
Year End 2.80 3.40 2.90 3.10

Malwatte Valley Plantations PLC | Annual Report 2016 85
sHAReHoldeRs & inVestoRs infoRMAtion FIVE YEAR SUMMARY
12 (Month) 12 (Month) 12 (Month) 12 (Month) 12 (Month) Rs.’000 Rs.’000 Rs.’000 Rs.’000 Rs.’000 2016 2015 2014 2013 2012
Turnover 2,857,081 2,881,044 3,581,342 3,769,684 2,965,020
Gross Profit (6,748) (114,922) 133,943 426,867 400,372
Operating Profit 124,331 (242,774) 66,258 400,716 401,586
Gross Profit on Cost of Sales (%) (0.2) (4) 4 13 16
Gross profit on Turnover (%) (0.2) (4) 4 11 14
Profit/(Loss) Before Tax 72,586 (270,537) 53,246 382,192 368,092
Tax expenses 10,132 8,524 29,186 (19,905) 50,355
Profit/(loss) After Tax 62,453 (279,062) 24,060 402,097 317,738
Fixed Assets 3,931,674 3,750,006 3,669,701 3,485,474 2,818,303
Current Assets 1,428,827 1,522,466 1,552,503 1,631,968 1,014,574
Current Liabilities 904,645 926,528 601,820 651,120 523,485
Shareholders Fund 2,785,458 2,590,667 2,850,624 2,773,769 2,093,897
Capital expenditure 153,258 167,633 219,685 121,838 177,869
Earnings Per Share (Rs.) 0.28 (1.25) 0.11 1.67 1.28
Net Assets Per share (Rs.) 12.48 11.62 12.78 12.44 8.46
Dividend Per Share (Rs.) - - 0.025 0.10 5.00
Stated Capital 373,000 373,000 373,000 373,000 373,000
Capital Employed 3,439,168 3,235,494 3,565,215 3,401,802 3,309,392
Net Assets 2,785,458 2,590,667 2,850,624 2,773,769 2,093,897
Return on Capital Employed (%) 2 (8) 2 12 12
Market Capitalisation 626,545,443 752,270,975 912,565,490 971,263,000 1,156,774
Other Information

Malwatte Valley Plantations PLC | Annual Report 201686
fRee Hold And leAse Hold lAnds And Buildings
LEASE HOLD BUILDINGS
COMPANY ESTATE NAME LOCATION NO OF BUILDINGS
BUILDINGS AT VALUATION
(RS.)MALWATTE VALLEY PLANTATIONS PLC
AISLABY BANDARAWELA 52 3,438,945
NELUWA BANDARAWELA 40 5,606,195UVA HIGHLAND BANDARAWELA 38 10,731,585UNUGALLA HALI-ELA 53 3,403,012 WARWICK AMBEWELA 20 763,718HUGOLAND LUNUWATTE 17 1,438,569DOWNSIDE WELIMADA 65 2,217,251 ST JAMES HALI-ELA 56 10,531,114ATTAMPITIYA ATTAMPITIYA 28 22,197,555 DICKWELLA HALI-ELA 58 2,782,070 LEDGERWATTE HALI-ELA 43 7,507,444SARNIA BADULLA 66 12,235,154 QUEENTOWN HALI-ELA 81 2,926,380
WELIMADA WELIMADA 52 4,232,457DYRABBA MIRAHAWATTE 69 7,482,764 UVA KETAWELA HALI-ELA 14 2,586,801MORALIOYA RUWANWELLA 52 696,548SUNNYCROFT WAHARAKA 53 3,801,242TALDUA AVISSAWELLA 44 1,681,283 CHESTERFORD GONAGALDENIYA 14 673,009 GLENESK AMITHIRIGALA 10 821,221 VINCIT GONAGALDENIYA 36 3,755,524 HAKGALLA BORAGAS 22 1,352,285REGIONAL OFFICE BADULLA 1 309,457
113,171,583

Malwatte Valley Plantations PLC | Annual Report 2016 87
fRee Hold And leAse Hold lAnds And Buildings
Other Information
COMPANY ESTATE NAME LOCATION NO OF BUILDINGS
BUILDINGS AT VALUATION
(RS.)HEAD OFFICE NO. 280, DAM STREET,
COLOMBO 121 149,807,251
STORES WATTALA 1 205,390,014
CIRCUIT BUNGLOW AMBEWELA 1 3,601,401
TALDUA MANOR TALDUA 1 8,307,302
USWETAKEIYAWA WATTALA 1 687,590
367,793,558
AISLABY BANDARAWELA 11,230,182
DOWNSIDE WELIMADA 4,927,864
HUGOLAND LUNUWATTE 3,194,609
NELUWA BANDARAWELA 4,973,039
UVA HIGHLANDS BANDARAWELA 11,230,429
ATTAMPITIA ATTAMPITIYA 10,914,518
WARWICK AMBEWELA 7,376,842
UNUGALLE HALI-ELA 7,940,862
DICKWELLA HALI-ELA 16,352,570
DYRAABA MIRAHAWATTE 4,104,070
SARNIA BADULLA 31,916,983
ST JAMES HALI-ELA 10,249,338
LEDGERWATTE HALI-ELA 5,789,590
QUEENSTOWN HALI-ELA 13,413,392
WELIMADA WELIMADA 19,792,016
UVE KETAWELA HALI-ELA 2,712,839
CHESTERFORD GONAGALDENIYA 6,860,504
GLENESK AMITHIRIGALA 2,946,907
MORALIOYA RUWANWELLA 18,405,292
SUNNYCROFT WAHARAKA 25,282,029
TALDUA AVISSAWELLA 6,310,433
VINCIT GONAGALDENIYA 6,576,877
232,501,185
Total Free Hold Buildings 600,294,745
FREE HOLD BUILDINGS

Malwatte Valley Plantations PLC | Annual Report 201688
LEASE HOLD LANDS
COMPANY ESTATE NAME LOCATION LAND EXTENT (HA)
LAND AT VALUATION
(RS.)MALWATTE VALLEY PLANTATIONS PLC
AISLABY BANDARAWELA 731 22,768,576
NELUWA BANDARAWELA 246 8,614,953UVA HIGHLAND BANDARAWELA 369 13,155,751UNUGALLA HALI-ELA 888 23,737,735WARWICK AMBEWELA 450 14,605,197HUGOLAND LUNUWATTE 142 5,116,541DOWNSIDE WELIMADA 380 12,680,606ST JAMES HALI-ELA 356 12,006,097ATTAMPITIYA ATTAMPITIYA 565 19,348,427DICKWELLA HALI-ELA 604 18,154,521LEDGERWATTE HALI-ELA 1134 28,570,074SARNIA BADULLA 1015 31,129,334QUEENTOWN HALI-ELA 610 18,281,903WELIMADA WELIMADA 374 12,517,680DYRABBA MIRAHAWATTE 460 14,853,803UVA KETAWELA HALI-ELA 268 9,324,075MORALIOYA RUWANWELLA 433 11,310,368SUNNYCROFT WAHARAKA 726 16,425,745TALDUA AVISSAWELLA 795 18,296,178CHESTERFORD GONAGALDENIYA 317 8,670,841GLENESK AMITHIRIGALA 303 8,324,899VINCIT GONAGALDENIYA 911 23,515,798HAKGALLA BORAGAS 217 7,686,210
359,095,312
FREE HOLD LANDSHEAD OFFICE NO. 280, DAM STREET,
COLOMBO 120.2872(HA) 567,750,000
STORES WATTALA 1.0066(HA) 184,931,500Land GALBANTHOTAWATTE 77 (PERCH) 15,524,000LAnd VAKARAI 9 (ACRE) 52,806,258
821,011,758
fRee Hold And leAse Hold lAnds And Buildings

Malwatte Valley Plantations PLC | Annual Report 2016 89
notiCe of Meeting
Other Information
NOTICE IS HEREBY GIVEN THAT THE TWENTY THIRD (23RD) ANNUAL GENERAL MEETING OF MALWATTE VALLEY PLANTATIONS PLC, WILL BE HELD ON FRIDAY 23RD JUNE 2017 AT 10.30 A.M. AT THE AUDITORIUM OF THE SRI LANKA FOUNDATION, NO. 100, INDEPENDENCE SQUARE, COLOMBO 7 for the following purpose:
AGENDA1 To receive and consider the Report of the Directors, Statement of Accounts and the Balance Sheet of the
Company for the year ended 31st December 2016, and the Report of the Auditors thereon.
2 To pass the following Ordinary Resolution pursuant to Section 211 of the Companies Act, No. 7 of 2007.
“Resolved that Mr. K. A. S. Gunasekera who has reached the age of 75 years be and is hereby re-elected a Director of the Company and it is hereby declared that the age limit of 70 years referred to in Section 210 of the Companies Act, No. 7 of 2007 shall not apply to the said Director”.
3 Re-appointment of Auditors
“Resolved to re-appoint M/s. Ernst and Young, Chartered Accountants as Auditors of the Company, and to authorize the Directors to determine their remuneration”.
4 To authorize the Directors to determine Donations for the year 2017, and up to the date of the next Annual General Meeting.
BY ORDER OF THE BOARD
Management Applications (Private) LimitedSecretaries
Colombo Dated 24th May 2017
Note:1 A member is entitled to appoint a proxy to attend and vote at the Meeting on his/her behalf. A form of
proxy is enclosed for this purpose.
2 A proxy need not be a member of the Company.
3 To be valid the completed Form of Proxy should be lodged at the Registered Office of the Company at No. 280, Dam Street, Colombo 12, not less than 48 hours before the appointed time for holding the meeting.
4 For security reasons Shareholders/Proxy holders attending the Meeting are kindly requested to bring their National Identity Card or Passport.

Malwatte Valley Plantations PLC | Annual Report 201690
note

Malwatte Valley Plantations PLC | Annual Report 2016 91
foRM of pRoxy
Other Information
*I/We .................................................................................................................................................................................................of ........................................................................................................................................................................................................being * a shareholder(s)/ member (s) of Malwatte Valley Plantations PLC hereby appoint:(1) .......................................................................................................................................................................................................of ........................................................................................................................................................................................................or failing him, Mr. Frits Bogtstra, (Chairman of the Company), of Colombo or failing him, one of the Directors of the Company as *my/our Proxy to represent me/us and * ……………………………………to vote on *my/our behalf at the TWENTY THIRD (23rd) ANNUAL GENERAL MEETING of the company to be held on Friday, 23rd June 2017, at 10.30 a.m. and at every poll which may be taken in consequent of the aforesaid meeting and at any adjournment thereof:
*I/we indicate *my/our vote on the resolutions below as follows: FOR AGAINST
1 To receive and consider the Report of the Directors, Statement of Accounts and the Balance Sheet of the Company for the year ended 31st December 2016 and the Report of the Auditors thereon.
2 To pass the following Ordinary Resolution pursuant to Section 211 of the Companies Act, No. 7 of 2007:
“Resolved that Mr. K. A. S. Gunasekera who has reached the age of 75 years be and is hereby re-elected a Director of the Company and it is hereby declared that the age limit of 70 years referred to in Section 210 of the Companies Act, No. 7 of 2007 shall not apply to the said Director”.
3 Re-appointment of Director
“Resolved to re-appoint M/s. Ernst and Young, Chartered Accountants as Auditors of the Company, and to authorize the Directors to determine their remuneration”.
4 To authorize the Directors to determine Donations for the year 2017 and up to the date of the next Annual General Meeting.
Signed this ……………………….day of …………………….Two Thousand and Sixteen.
Note: 1. * Please delete the inappropriate words. 2. Instructions as to completion appear on the reverse. 3. If you wish your proxy to speak at the meeting you should interpolate the words “to speak and” at the asterisk
immediately before the words “to vote”.
.......................................................... *Signature/s

Malwatte Valley Plantations PLC | Annual Report 201692
Instructions as to Completion
1. To be valid this Form of Proxy should be deposited at the Registered Office of the company No. 280, Dam Street, Colombo 12, not less than forty eight (48) hours before the time fixed for the Meeting.
2. In perfecting the Form of Proxy, ensure that all details are eligible.
3. If you wish to appoint a person other than the Chairman (or failing him, one of the Directors) as your Proxy, please insert the relevant details at (1) overleaf and initial against this entry.
4. Please indicate with an “X” in the space provided how your Proxy is to vote on each resolution. If no indication is given, the Proxy in his discretion will vote, as he thinks fit.
5. In the case of a Company/Corporation, the Proxy must be under its Common Seal which should be affixed and attested in the manner prescribed by its Articles of Association.
6. In the case of a proxy signed by an Attorney, the Power of Attorney must be deposited at the Registered Office for Registration, if such power of Attorney has not already been registered with the Company.


![Communism in India - Marxists...DOCUMENTS: COMMUNISM IN INDIA JUSTUS M. VAN DER ]~A:tOEF Indian Maoism, Peking, and Bangla Desh * The Bangla Dash crisis and the eruption of a fun-scale](https://img.dokumen.tips/doc/110x75/61347242dfd10f4dd73bbc68/communism-in-india-marxists-documents-communism-in-india-justus-m-van-der.jpg)