Embed Size (px)
Citation preview

2015Standard Bank (Mauritius) Limited
Annual report

Financial highlights 6Non-financial performance 8
Chairman and chief executive’s review 10 Macroeconomic review 11
Management discussion and analysis 13
Corporate governance report 45
Sustainability report 70Statement of compliance 73
Statement of management‘s responsibility for financial reporting 74
Secretary’s certificate 75Independent auditors’ report 76
Statement of financial position 80Statement of profit or loss and other comprehensive income 81
Statement of cash flows 82Statement of changes in equity 83
Notes to and forming part of the financial statements 84
3
BUSINESS REVIEW
ENSURING OUR SUSTAINABILITY
ANNUAL FINANCIAL STATEMENTS
Contents
We capitalise on the business-friendly environment of Mauritius, and the extensive
footprint and expert capacity of the Group to offer first-class banking services to our
clients.
Photo: Mauritius

54 Standard Bank Mauritius Annual integrated report 2015
01 Serving our customers
02 Growing our people
03 Delivering to our shareholders
04 Being proactive
05 Working in teams
06 Constantly raising the bar
07 Respecting each other
08 Upholding the highest levels of integrity
Our valuesOur success and growth over the long-term is built on making a difference in the communities in which we operate. We are committed to moving Mauritius forward.
Client centricityRealising our vision depends on placing our clients at the centre of everything we do. Strong of our knowledge and unique presence in Africa, we create value to clients by understanding their needs and what matters to them, and offering the products, services and solutions they need to grow their business.
BUSINESS REVIEW
Financial highlights
6 Standard Bank Mauritius Annual integrated report 2015
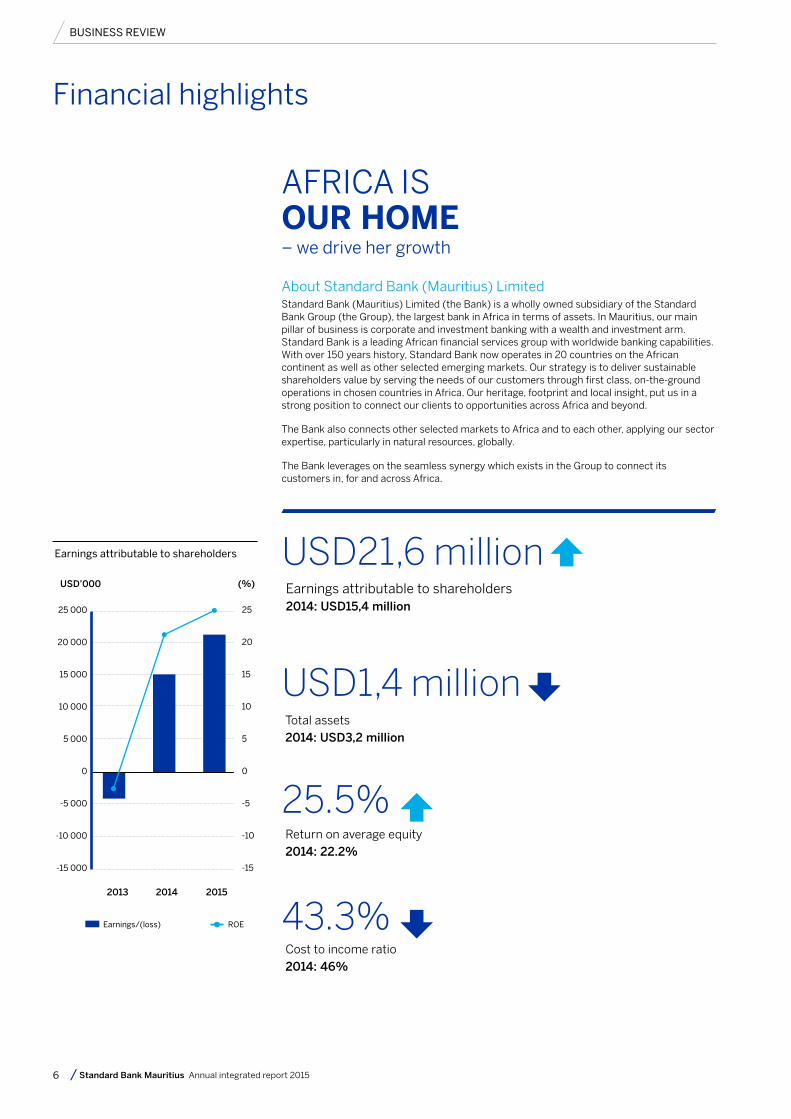
Earnings attributable to shareholders
(%)USD’000
25 000
20 000
15 000
10 000
5 000
0
-5 000
-10 000
-15 000
25
20
15
10
5
0
-5
-10
-15
2013 2014 2015
Earnings/(loss) ROE¢
USD21,6 millionEarnings attributable to shareholders2014: USD15,4 million
USD1,4 million
25.5%
43.3%
Total assets2014: USD3,2 million
Return on average equity2014: 22.2%
Cost to income ratio2014: 46%
About Standard Bank (Mauritius) LimitedStandard Bank (Mauritius) Limited (the Bank) is a wholly owned subsidiary of the Standard Bank Group (the Group), the largest bank in Africa in terms of assets. In Mauritius, our main pillar of business is corporate and investment banking with a wealth and investment arm. Standard Bank is a leading African financial services group with worldwide banking capabilities. With over 150 years history, Standard Bank now operates in 20 countries on the African continent as well as other selected emerging markets. Our strategy is to deliver sustainable shareholders value by serving the needs of our customers through first class, on-the-ground operations in chosen countries in Africa. Our heritage, footprint and local insight, put us in a strong position to connect our clients to opportunities across Africa and beyond.
The Bank also connects other selected markets to Africa and to each other, applying our sector expertise, particularly in natural resources, globally.
The Bank leverages on the seamless synergy which exists in the Group to connect its customers in, for and across Africa.
AFRICA ISOUR HOME– we drive her growth

7
Earnings/(loss) attributable to shareholders
Statement of financial positionTotal loansTotal assetsTotal depositsShareholder’s fundsTier 1 capitalRisk-weighted assets
Performance ratios (%)Return on average total assetsReturn on average equityReturn on average tier 1 capitalCost to income ratioNon-interest income to total incomeLoan to deposit ratio
Capital adequacy ratioCapital to risk-weighted assets
Asset qualityNon-performing loansNPL ratio (%)Allowance fo loan impairment lossesCredit loss ratioNumber of employees
Dec 14
USD’000
15 416
280 2803 230 9233 048 544
77 18774 733
450 435
0.71%22.18%20.63%45.96%51.15%12.23%
22.14%
40 22214.35%(1 125)
(0.33%)116
Dec 13
USD’000
(4 263)
399 1002 393 9702 132 492
61 72757 747
522 145
(0.16%)(6.15%)(7.38%)50.63%41.22%18.72%
16.51%
70 625 17.70% 18 7384.42%
116
Dec 15
USD’000
21 605
106 2531 418 9021 243 957
88 81687 211
214 015
1.52%25.54%24.77%43.32%55.97%9.20%
50.51%
14 90814.03%(4 949)
(2.46%)120
CORPORATE AND INVESTMENT BANKING
We provide services to larger domestic corporates, multinationals, management companies, governments, parastatals and financial institutions. Standard Bank combines the advantages of the business friendly environment of Mauritius, the expertise of a rich in-country talent base and the synergy within its global distribution network to provide tailor-made corporate and investment banking solutions to its clients.
WHAT WE OFFER
DEPARTMENTS
These include the support and back office functions facilitating the smooth and effective running of the Bank.
ENABLING FUNCTIONS
Global markets
Risk Compliance
Finance Legal
Information technology Group real estate services
Operations Marketing and communication
Human capital
Transactional products and services
Investment banking
International wealth and investment
Our business structure

BUSINESS REVIEW
Non-financial performance
8 Standard Bank Mauritius Annual integrated report 2015
StrategyStandard Bank (Mauritius) Limited (the Bank) aspiration to be the leading financial service institution, in, for and across Africa remained a key driver in 2015. The Bank kept on growing in its core markets and made steady progress against the country goals and objectives supporting its strategy. Client centricity and consistent service delivery remained the two main pillars upon which the Bank focused to reinforce and enhance its clients’ experience and optimise value to stakeholders.
Client centricityThe Bank renewed its commitment to deliver on its purpose: put the clients at the heart of everything we do. Strong of our knowledge and unique presence in Africa, we create value to customers by understanding their needs through their lives, offering the products, services and solutions they need to grow their business; providing these quickly, efficiently and earning and keeping their trust. This is fully embedded in the initiatives developed throughout the year.
Consistent service deliveryThe Bank is committed to deliver a high quality and consistent service to our customers by implementing initiatives that differentiate us from the service rendered by others. We aim to promote a proactive, client focused and confident culture. By creating a significant difference in our efficiency to respond to client needs and consistently exploring possibilities to grow their business in Africa, we optimise value to our shareholders, employees and society at large.
Other highlightsStandard Bank’s marketing and communication strategy focuses on building the Standard Bank brand, positioning our strength in Africa, our heritage, our pioneering spirit and our ability to connect customers to the right solutions.
Our marketing and communication initiatives in 2015 supported the continued growth of the brand equity, reinforcing the country’s strategy and providing the platform for business to engage with our clients and stakeholders.
AdvertisingOur strategy was backed by the Corporate and Investment Banking (CIB) brand image advertising, reinforcing our experience, credibility and presence in Africa. The campaign with the tagline ‘They call it Africa. We call it home.’ showcased Standard Bank as the partner for growth in Africa with its unique footprint, knowledge and a deep specialisation in natural resources. It also highlighted the accolades received by Standard Bank in Africa.
SponsorshipsSponsorships are an integral part of Standard Bank’s social responsibility and communication strategies. Sponsorships are essential in building our brand and creating relevance in the markets in which we operate by providing the right platform to connect with our customers and stakeholders. We have been a leading sponsor of the arts and sport for many years. The initiatives sponsored in Mauritius during the year were as follows:
Standard Bank ChampionshipThe Bank has continuously played a key role in supporting golf in Mauritius over the past few years. This year, the Bank spread its wings to the African golf scene through the Standard Bank Africa Invitational Regional Golf Series which culminated in the Standard Bank Championship.
This event which took place in October 2015 on the Heritage Golf Course was strictly for Standard Bank’s guests who qualified through the Standard Bank Africa Regional Golf Series. Ten professional players from the local golf scene also participated in the event.
Blues dan JazzThe Bank’s collaboration with l’Institut Français de Maurice (IFM) in 2015 saw the creation of ‘Blues dan Jazz, IFM & Standard Bank Jazz Series’, with African jazz musicians flying to Mauritius in order to open new horizons and opportunities for the local artists. On 11 April 2015, French jazzman Louis Sclavis and the young South African talent Nduduzo Makhathini, winner of the Standard Bank 2015 Young Artist Award for jazz played together with two local jazz prodigies Kersley Pytambar and Kersley Sham in a unique concert at IFM.
Ernest Wiehe Jazz FestivalStandard Bank is regarded by all in the music industry as the leading sponsor and supporter of jazz, having made a major contribution in providing this formerly neglected genre with a much needed boost through annual showcases and music development programmes and workshops.
The Bank’s commitment in the promotion of local jazz is in line with Standard Bank Group sponsorship philosophy. Since 2013, the Bank has been the main sponsor of the Ernest Wiehe Jazz Festival (EWJF). This year’s edition was held in September 2015 with several well-known jazz artists lined up to participate in this event namely Sébastien Margéot Project, Nicolas Folmer, Gina Jean-Charles and the Blues and Beyond Quartet amongst others.

9
Events The Bank carried out a number of hospitality and business events during the year, including a golf championship, a karting competition, a wine tasting, a football match and a bowling night.

BUSINESS REVIEW
Chairman and chief executive’s review
10 Standard Bank Mauritius Annual integrated report 2015
The Board of the Standard Bank (Mauritius) Limited (the Bank) is pleased
to present its fourteenth Annual Report for the year ended 31 December 2015.
OverviewThe Bank has consolidated its African-centric
strategy in 2015 and this has enabled the Bank to deliver superior return on equity and growth in
earnings. During the year, we have ensured that we remain relevant and responsive to our customers and
aligned to our client value proposition to targeted segments.
PerformanceThe financial performance for 2015 was superior to results
delivered in prior years and reflected a robust earnings growth, which translated into a profit of USD21,6 million. Financial metrics
were all enhanced with return on equity improving from 22.2% to 25.5% and cost to income ratio at 43.3%, whilst the asset base has
declined by 62% in line with our strategy. The Bank has also recovered USD2,9 million as a settlement agreement for one of the non-
performing loans.
StrategyThe Bank’s strategy has been spanned over a three year period and is aligned
to Standard Bank Group (the Group) strategy and risk appetite. Our focus remains strong, aimed at improving the effectiveness of our execution as we
continue to progress against the objectives that underpin our strategy.
Corporate governance and directorateThe Bank continues to embed governance and compliance to standards. The Bank has
instilled regulatory best practice across its operations and adheres to the requirements of the Bank of Mauritius guidelines on corporate governance as well as the Code of
Banking Practice. This further enhances the highest standards of corporate governance in line with local market practices as well as the Group’s guidelines. There were no changes to
the directorate in 2015.
We would like to extend our thanks to our customers, staff and board members for their continued support throughout 2015.
LOUIS RIvALLAND Chairman
Louis Rivalland / Lakshman Bheenick
LAKSHMAN BHEENICKChief Executive
16 March 2016

11
Macroeconomic review
Along with the continued weakness of the European growth, emerging markets being hit by the fall in commodity prices, oil prices hitting an all-time low, the global economic environment has remained uncertain in 2015. External demand has remained weak, dampening the overall GDP growth.
With economic growth remaining sluggish in recent years, hampered by a weak global economy, the Mauritian economy remained under challenge this year. A key contributor to domestic growth was the tourism industry, on the back of diversified markets and improved air access. However weak investment flows from both the public and private sector along with the poor performance of the construction sector which has remained stagnant over the past few years, has continued to fuel the low growth rate. Against a backdrop of economic difficulties and uncertainties, economic growth for 2015 has been revised downward to 3.4%, similar to the past two years. This has raised fears that the country gets stuck in a “middle-income country trap”.
The setting-up of a “high powered committee” by the Mauritian government on ‘Achieving Economic Miracle and vision 2030’ is a welcoming move in the current economic environment as it would provide the necessary impetus to boost investment and propel the economy to a high-income status.
The government has also announced its plan to invest MUR75 billion over the next five years for the creation of “Smart Cities” as well as enabling road decongestion, electricity and water supply, and port infrastructure. It is expected that this new economic vision will boost economic growth to an ambitious 5.5% a year from 2017. To deliver this, the challenge for Mauritius will be to develop a more competitive economy, geared towards sectors with strong added value.
Mauritius maintained its credit rating of Baa1, following Moody’s Investors Services latest country-wide evaluation report. The ‘resilience and diversification of the local economy and robust institutional capacity’ were cited as reasons for maintaining its stable outlook on the island economy.
The country remained heavily dependent on imports of food and fuel, which have a heavy weighting in the Consumer Price Index (CPI). Local CPI data showed that inflationary pressures in the economy remained moderate for the year with headline inflation having decreased over 2015, driven by decreasing commodities prices. Headline inflation hit its lowest value since June 1988 at 1.2% in September to rise marginally to 1.3% in December 2015. Latest CPI data
showed that inflationary pressures in the economy will remain moderate in 2016 unless we see a significant rise in demand on the back of economic growth. Domestic inflation remained at low levels on the back of subdued domestic demand conditions.
Against this backdrop of low investment, the monetary policy committee has lowered the repo rate for the first time since June 2013 by 25 basis points (bsp) to close at 4.4% in an attempt to boost economic activity.
The monetary policy committee is in favor of having an efficient policy framework in view of bridging the gap between the key repo rate and money market rates. Throughout the year, they highlighted the need for an effective monetary policy transmission mechanism, which would ensure the effectiveness of policy impulses to the real sector.
Significant excess liquidity in the banking system continued to depress money market yields and reflect a distorted interest rate structure. Consequently, the Bank of Mauritius (BoM) has come up with a new monetary policy operational framework and has embarked on a programme of effective liquidity management in the banking system. An array of instruments has been employed in the money market to mop up excess liquidity, with the Central Bank thus increasing issuance of its own paper in an effort to drain excess liquidity. In order not to exacerbate the excess liquidity conditions in the system, the BoM conducted sterilised interventions by way of Rupee deposits placed by banks for a period of one year. Excess liquidity in the domestic money market stood at MUR10 billion in December after peaking at MUR16 billion in May. This liquidity withdrawal process has helped push treasury bill yields higher over the last 6 months of the year.
Although the weighted average yield on 91-day, 182-day and 364-day Government of Mauritius treasury bills (tbills) were on the downside in the first half of 2015, it started to rise in the second half of the year. However, despite the overall reduction in banks’ excess reserves and the associated pick-up in yields, interbank money market rates failed to adjust accordingly for the major part of 2015.
Headline inflation 2015
3
2.5
2
1.5
1
0.5
0
Jan 15 Mar 15 May 15 Jul 15 Sep 15 Nov 15
Headline inflation
Treasury bills rate, 3M money market rate, repo rate
54.5
43.5
32.5
21.5
10.5
0
Jan 1505 05 05 05 05 05 05 05 05 05 05 05
Mar 15 Apr 15Feb 15 May 15 Jun 15 Jul 15 Aug 15 Sep 15 Oct 15 Nov 15 Dec 15
91-days tbills 182-days tbills 364-days tbills Key repo rate 3M money market rate

BUSINESS REVIEW Macroeconomic review continued
12 Standard Bank Mauritius Annual integrated report 2015
Exchange rates evolution is critical for the economy, given the key role it plays in the export of goods and services. The fluctuations of the Rupee against the Euro and the US Dollar remained a cause for concern this year, with the Rupee appreciating against the Euro and hence weakening export competiveness. The US Dollar has strengthened significantly against the Euro this year, as the European Central Bank (ECB) maintained a loose monetary policy, in response to low inflation and modest growth, while the Federal Reserve Bank (FRB) tightened its monetary stance. Further interest rate hikes are expected in the US going forward.
Given the Mauritian Rupee’s past record of tracking the Euro against the Dollar, the
USD/MUR was mostly range-bound since July trading between 35 and 36. However this pair moved closer to 36 in December and was mainly attributable to the decline in EUR/USD towards year-end, following ECB policy of further quantitative easing and the FRB hiking rates by a quarter percentage point. The BoM continues to look to stabilise the MUR on a trade-weighted basis, but preferring to manage this via the EUR/MUR pair and thus leaving the EUR/USD as a by-product of EUR/USD moves. Separately, the decision of the State Trading Corporation to purchase 50% or more of its foreign exchange requirements from domestic banks contributed to restore the free interplay of market forces in determining the exchange rate.
Overall, the financial system is assessed to be sound and resilient. Looking ahead, a key challenge for the domestic financial system will be related to the process of interest rate and excess liquidity in the banking system as well as decline in asset quality, which need to be carefully monitored to ensure financial stability. Most analysts however expect economic growth to remain sluggish at an annual average of around 3.6% in 2016, hampered by an uncertain global economic environment and slow progress on domestic reforms.
USD/MUR Spot
37.00
36.00
35.00
34.00
33.00
32.00
31.00
30.00
29.00
28.00
Jan15 Feb15 Mar15 Apr15 May15 Jun15 Jul15 Aug15 Sep15 Oct15 Nov15 Dec15 Jan16
EUR/USD Spot
1.25
1.20
1.15
1.10
1.05
1.00
0.95
Jan15 Feb15 Mar15 Apr15 May15 Jun15 Jul15 Aug15 Sep15 Oct15 Nov15 Dec15 Jan16
Source: Bank of Mauritius, Statistics Mauritius, Mauritius Statistical Office, Economist Intelligence Unit

13
Despite the challenging economic environment, revenue growth was sustained, underpinned by the three pillars of our business: transactional products and services, investment banking and global markets business.
Review by business linesCorporate and investment bankingThe Bank’s focus remains in Corporate and Investment Banking (CIB), with a wealth and investment arm. The Bank’s client coverage model was key to our strategy which includes a strong focus on clients whose businesses are aligned to our African strategy. This model promotes a deep understanding of our clients’ needs and objectives. This enabled us to provide clients with the solutions they require and strengthen our client engagement model and client value proposition. It will ensure that we have increased insight and knowledge of our client base, sectors and industries and in so doing, have an improved understanding of their needs.
Transactional products and servicesAs a provider of Transactional Products and Services (TPS), the Bank provides amongst other services, cash management structures tailored to meet clients’ needs, efficient and secure transactional capabilities and trade finance solutions.
TPS recorded an even better performance in 2015, with revenue growth of 18%. Earnings growth of 423% was further supported by the partial recovery of an impaired asset during the year.
Cash management, trade finance and investor services are the three main revenue drivers of TPS. Although cash management recorded good revenue growth, challenges were faced in the other areas.
Cash management witnessed a 19% growth in the number of registered profiles for our electronic banking platform: business online, as more clients were encouraged to use this payments platform. On the transactional side we have witnessed an increase of 14% for client’s instructions channelled through Business Online as compared to prior year. Total payments processed electronically reached an appreciable 73% in December 2015.
Following the balance sheet re-structuring exercise that started off in 2014, a drop of 60% in the asset book was registered, with short-term assets closing at USD27 million. On the other hand, the deposit base was further enhanced with a 15% liability growth to reach USD2 billion on average in 2015. This in turn positively impacted earnings growth, with the average deposits base contributing significantly to the 42% increase in net interest income during the year.
Investor services revised its business strategy and operating model during the year with the aim to improve efficiency and competitive positioning. The roll out of the on-line securities platform to our clients as well as the Bank’s strategic alliance with Bank of New York Mellon (BNYM) has allowed our clients to take advantage of the state of the art securities platform of BNYM.
Shrinkage of Assets Under Custody (AUC) was registered, attributable to declining market prices and early redemptions from investors due to an adverse market environment. The AUC at year end stood at USD210 million, representing a 28% decrease compared to prior year, which resulted in a 16% decline in our fees income.
Reduced activity was noted from our main Trade Finance clients on the back of the economic slowdown and lower commodities prices which has adversely impacted the business activities of our clients who are mostly African focused. Although trade finance assets grew marginally by 1% to close at USD6,7 million, revenues delivered negative growth of 28% compared to prior year, on account of a drop of 35% in trade finance fees on account of reduced LC activities and guarantees.
Focus for 2016 will remain on the Standard Bank Group’s (the Group) clients who can benefit of using Mauritius’ jurisdiction as their procurement and treasury centre.
Global marketsGlobal markets gives Standard Bank’s clients access to the market using various funding, risk mitigation and yield enhancement strategies. Given the Group’s expanding African footprint, our value proposition remains our ability to provide access to markets unavailable from other sources and be a leading provider of African products across a number of asset classes.
Global markets total revenues were down by 3% this year, on the back of lower interest earned as a result of a change in funds transfer pricing profiling methodology, while earnings registered a marginal growth of 2%. However despite a volatile environment during the year, Global markets performed well with trading revenues up by 19%, closing
at USD10,7 million, underpinned by client driven revenues. The main contributor was the sales desk which grew year on year by 40%, with the desk benefitting from existing and new client flows. Moreover, given the high volatility prevailing in the forex markets, demand for hedging solutions was strong and the desk was able to convert a number of opportunities. The high volatility was also positive for the FX flow trading desk which ended the year with a 26% growth. During the year, the Bank continued its efforts of optimising its balance sheet in a bid to boost net interest income. The Bank will continue its efforts in diversifying revenues with sustained growth in forex and other markets.
Investment banking Investment banking was mainly impacted by the change in strategy implemented in 2013 with the exit of some cross-border facilities originated through the Bank’s African franchise and partly by a few early prepayments of some loans originated in country. The total revenue saw a drop of 19% year on year, driven by a reduction of 62% in the structured debt portfolio from prior year to close at USD69 million. The implementation of a performing portfolio provisioning during the year, coupled with assets repayments has released some credit provisioning, which translated into an earnings growth of 13% compared to prior year.
The Bank’s focus is to continue to pursue investment banking opportunities in Mauritius as well as the pan-African market.
International wealth and investment A wealth management product offer has been crafted and has been rolled out in 2015, which saw a greater alignment of the offering to clients of International Wealth and Investment (IWI) to the Mauritian franchise. The services offering has expanded from banking and transactional services to include trust & fiduciary services, specialised lending and investment services. These services are all offered out of the Jersey office, but the Mauritius platform helps deliver these services through a single point of contact.
Other African mandate has taken form with a focused sales & marketing effort and quarterly visits to our target markets in Southern Africa. Based on the engagement with local stakeholders, in particular the introductions from CIB, have led to new client acquisitions that meet the IWI thresholds.
Income for IWI was flat compared to the prior year and stood at USD550 000 at year end. Focus is on driving client acquisition and as a result, liabilities growth edged at 40% to reach USD123 million.
Management Discussion and Analysis
Standard Bank (Mauritius) Limited (the Bank) has maintained a strong momentum in business, with a commendable performance of our banking operations for 2015, testament to the Bank’s commitment to embed its underlying strategy.
The results

BUSINESS REVIEW Management Discussion and Analysis continued
14 Standard Bank Mauritius Annual integrated report 2015
EnablersHuman capitalHuman Capital (HC) covers a wide-ranging of functions such as resourcing, learning & development, talent management, succession planning, amongst others. The highlights of the year were the implementation of various HC projects to ensure alignment with the Group’s best practices. The transformation project was implemented to ensure that HC is aligned to the business and enabling more capacity of the HC business partners and effectively partnering business. A comprehensive plan was implemented for 2015 to 2017 with deliverables to be tracked.
To further embed the talent management framework, a focused assessment and development plan for executive committee members and identified talent was introduced. The individual development plans will be rolled out during the course of 2016 to ensure the retention of talent.
2015 saw the implementation of HC systems to streamline processes and enhance the service delivery to business and ensure operational excellence within HC. The systems implemented were the Recruitment Management System (RMS) to assist the HC team to track the resourcing process from the time the vacancy arises until the appointment is made. The Learning Management System (LMS) replaced the previous e-learning system to provide an improved learning platform.
There was also the implementation of the employee benefits & tax project to ensure alignment of employee benefits across the rest of Africa operations as well as tax compliance, this project was successfully completed with minor recommendations to enhance employee benefits such as implementing long service awards.
All HC policies and procedures were updated and aligned with local legislation and centre policies were finalised. The staff handbook was also reviewed and will be distributed during 2016. There was further roll out of the Employee value Proposition (EvP) deliverables such as a salary survey presentation to all staff to position Bank’s remuneration philosophy and rating in the market.
Another key project was the job grading and evaluation exercise to ensure that grades and jobs are aligned with similar jobs at centre and across Africa. This has resulted in reviewing job descriptions and grading the jobs accordingly. The organisational effectiveness team at centre is key in ensuring the finalisation of this project, which is expected to be in the first quarter of 2016.
Operations Operations covers a wide range of critical enablement functions within the Bank, consisting of operations support, payments, trade services, global markets operations, reconciliations, facilities, procurement, and client services.
Operations focus for the year was to provide top quality services supporting both our internal and external stakeholders. The successful implementation during the year of the salesforce service cloud now enables a consolidated approach in the delivery on the strategic initiative of a consistent client service experience. It enables the logging and tracking of client’s queries and requests, facilitating the measurement of resolution against service level agreements. The system also facilitates the gathering of clients query management data for analysis and any remedial action.
To improve on operational efficiency and with a view to introduce digitisation, the teams have been working on an imaging workflow system for two operational processes, namely customer payments and the anti money laundering alerts handling. This will also result in a paperless environment and promote the smooth retrieval of information and documents for regulatory investigations.
The team has been continuously working in a mature control environment and early warning capability resulting in satisfactory audit ratings obtained for the different departments, namely the global market operations, payments, client service, reconciliations and operations processing centre.
Following the implementation of the automated Know Your Client (KYC) solution known as GoldTier, the teams have made good progress in refining the data contained therein.
The regulatory environment has been quite dynamic in 2015, with the Central Bank directing its requirements on two main areas namely:
• Regulatory reporting: whereby a new platform (XBRL) has been identified for the Bank of Mauritius (BoM) daily and monthly reporting.
• Direct Debit system: this is a four-party arrangement for collection of money between a payer and an originator through their respective banks.
The Bank has also been conferred the Deutsche Bank Straight-Through-Processing (STP) awards for the excellent quality of payments instructions sent.
A high-risk committee was constituted early in the year, mandated to review, approve or decline high risk accounts for both CIB and IWI. All new accounts having a high-risk element will require approval by the high-risk committee before on boarding.
A Business Control Unit (BCU), responsible for all risk and compliance aspects for both IWI and CIB, was set up during the year to reflect best practice, thereby acting as the first line of defence for the business.
Looking ahead
In 2016, we will continue to focus on growing our client franchise with a relentless focus on client excellence, leveraging our unique footprint and product capabilities, and optimising cross-selling opportunities.
We will maintain cost discipline, absorbing increasing regulatory and compliance requirements. Our focus on managing the risks in our business will continue, while investing in technology that enables greater efficiency and consistency in delivering services to our clients.

15
External forces review Legal and institutional environmentThe powers of the BoM have been extended since the last budget speech. BoM is responsible for the regulation, licensing, registration and overseeing of the payment systems, clearing houses and the issuance and quality of payment instruments and may impose administrative penalties on a financial institution.
Moreover BoM will also participate in the launching of a gold fund, it is empowered to purchase and sell gold or shares or units in gold funds. It is also possible for the BoM, with the Board’s approval, to create, out of its net profits, reserves for monetary policy purposes or such other specific purposes as the BoM may determine in conformity with accounting principles applicable to central banks and best international practices. The BoM may also meet any loss incurred in a financial year from that general reserve Fund.
The Banking Act 2004 has also been amended to cater for the following:
Subject to the BoM’s approval, authenticated copies of license and audited latest financial statements can be displayed instead of originals. Further, an anomaly in the law has been corrected in adding Section 124 of Income Tax Act where banks will not be breaching confidentiality if there is a request from the Mauritius Revenue Authority (MRA) to furnish information for the purpose of making an assessment or to collect tax or for MRA to comply with any request for exchange of information under a double taxation/exchange of information agreement with a government of a foreign country.
Following an amendment in the Borrower Protection Act 2007, the Bank is now required to perform its due diligence on debt repayment capacity not only of the borrower but also of his guarantor.
The Financial Services Act 2007 has been amended to cater, amongst others, for the establishment of a financial services promotion agency to conduct promotional activities for the development of the financial services industry, while enhancing the image of Mauritius as a clean and reputable financial centre.
The Asset Recovery Act has been amended to allow the Financial Intelligence Unit (FIU) to take over the functions and powers conferred on the director of public prosecutions with respect to the enforcement authority. The Bank will thus be replying to the FIU rather than to the Enforcement Authority Unit (EAU) under the director of prosecution office with respect to
account monitoring orders or restraining orders.
Following the recent upheavals in the financial industry, i.e. the existence of various ponzi scheme, the minister of financial services, good governance and institutional reforms has introduced the Good Governance and Integrity Reporting Act. The main objective of the Act is to encourage and foster a culture of integrity and good governance in Mauritius and stimulate integrity reporting in the public and private sectors. It also encourages positive reports of acts of good governance and discloses and deters malpractices. Last but not the least, is to recover unexplained wealth as well as protect and reward persons making genuine disclosures and reports of malpractices.
A notable development is the change in fiscal year which now runs from 1 July to 30 June instead of a calendar year.
In terms of the mandatory Corporate Social Responsibility (CSR) contribution, corporates can now choose their own programme in accordance with their own CSR framework.
Codes and guidelinesIn 2013, the Government of the United States of America and the Government of Mauritius signed an Inter-Governmental Agreement (IGA) to improve international tax compliance and to implement FATCA. The IGA requires, in particular, the exchange of certain information with respect to the United States of America and Mauritius reportable accounts on an automatic basis, pursuant to the provisions of Article 6 of the tax information exchange agreement between the two countries. This was followed by the signing of another agreement known as the model 1 IGA to further improve international tax compliance. The MRA issued its guidance note on FATCA in May 2015 which was intended to provide practical assistance to financial institutions, businesses and officials in dealing with the application of FATCA. In August 2015, the Bank submitted its first FATCA return.
Mauritius, as a member of the early adopters group, has made a commitment to early implementation of the new global standard for automatic exchange of information for tax purposes (the CRS developed by the OECD). Mauritius has also signed the multilateral competent authority agreement in October 2014 which provides for automatic exchange of information with other early adopter competent authorities.
The MRA has recently issued a draft guideline on the requirements of the common reporting standards. The first exchange of information under the common reporting standards will take place as from September 2018. Consequently the requirement to apply due diligence procedures to record tax residence of clients opening new accounts will take effect as from 1 January 2017.
The BoM is currently considering the coverage limit of a deposit insurance scheme in Mauritius. As such they are busy collating data on aggregate of Rupee deposits and Rupee equivalent of foreign currency deposit for both segment A and B.
The BoM has amended the guideline on credit concentration risk to allow large credit exposure limits to be increased from 600% to 800% of the Bank’s capital base with immediate effect.

BUSINESS REVIEW Management Discussion and Analysis continued
16 Standard Bank Mauritius Annual integrated report 2015
Financial reviewTable 1: Performance against objectives by key areas Note: As part of the strategic positioning, Standard Bank has exited most cross-border assets during 2015 and is focusing solely on growing its originating exposures in 2016.
ROE expected to be at 19%.
ROA was expected to be maintained at 0.77%.
Following the change in strategy, Net Interest Income (NII) was expected to decrease by 7% and Non-Interest Revenue (NIR) expected to grow marginally by 1%.
Costs expected to increase by 12%.
Return on Equity (ROE)
Return on Average Assets (ROA)
Operating income
Operating expenses
ROE was ahead of planned results at 26%, driven by robust revenue growth, further supported by credit recovery of one impaired asset of USD2,9 million as well as a 16% drop in total operating costs.
ROA has edged up to 1.5% as a result of reduction in total assets coupled with higher earnings earned.
NII was only 3% lower, driven by delays in exiting term assets book and lower interest rate environment compared to budget. NIR rose by 9%, enhanced by strong performance from trading income and transactional fees.
Operating costs have improved by 16% on account of operational efficiencies as well as benefitting from the weakening of the MUR/USD rate.
Following the revamp of the asset book, ROE is expected to be around 20%.
ROA is expected to decrease to 0.68% on account of reduced profitability.
NII is expected to increase by 7% on account of enhanced margins and increased term lending. NIR is expected to increase slightly by 2%.
Operating cost is expected to increase by 15% driven mainly by additional headcount and increased IT costs.
Objectives 2016Performance 2015Objectives 2015

17
The ratio expected to be contained at 53%.
Expected decrease of 31% in loan and advances following new strategy refinement.
Expected decrease of 48% in customer deposits mainly due to the redeployment of a cross-border deposit into investments.
Ratio of Non-Performing Loans (NPL) to gross loans was not expected to deteriorate further.
Capital management was targeted to be maintained at 20% to support the Bank’s risk appetite.
Cost to income
Loans & advances growth
Deposit growth
Portfolio quality
Capital management
Cost to income ratio improved to 43% on the back of improved trading revenue, enhanced net interest income resulting from delays in transferring cross-border assets and lower operational expenses due to the weakening of the MUR/USD rate.
Loan and advances were 47% behind target due to delays encountered in converting new assets in the pipeline, coupled with the early repayments of some assets.
Deposits were 26% down on budget on account of deposits withdrawals at year end for investment purposes.
The ratio of NPLs to gross loans has been maintained at 14%. Recovery of one NPL and write off of three other fully impaired assets, coupled with a reduction in the asset book has contributed to keep the ratio flat.
The capital adequacy ratio stood at 50%, with tier 1 ratio closing at 40%.
Additional IT support and systems costs are expected to increase the cost to income ratio to 51%.
The loan book is expected to grow by 112% driven by both short-term and medium-term assets.
Deposits are expected to increase by 57% from new business.
NPL ratio is expected to improve further following potential recovery.
Capital adequacy ratio is expected to close around 22%.
Objectives 2016Performance 2015Objectives 2015
BUSINESS REVIEW Management Discussion and Analysis continued
18 Standard Bank Mauritius Annual integrated report 2015
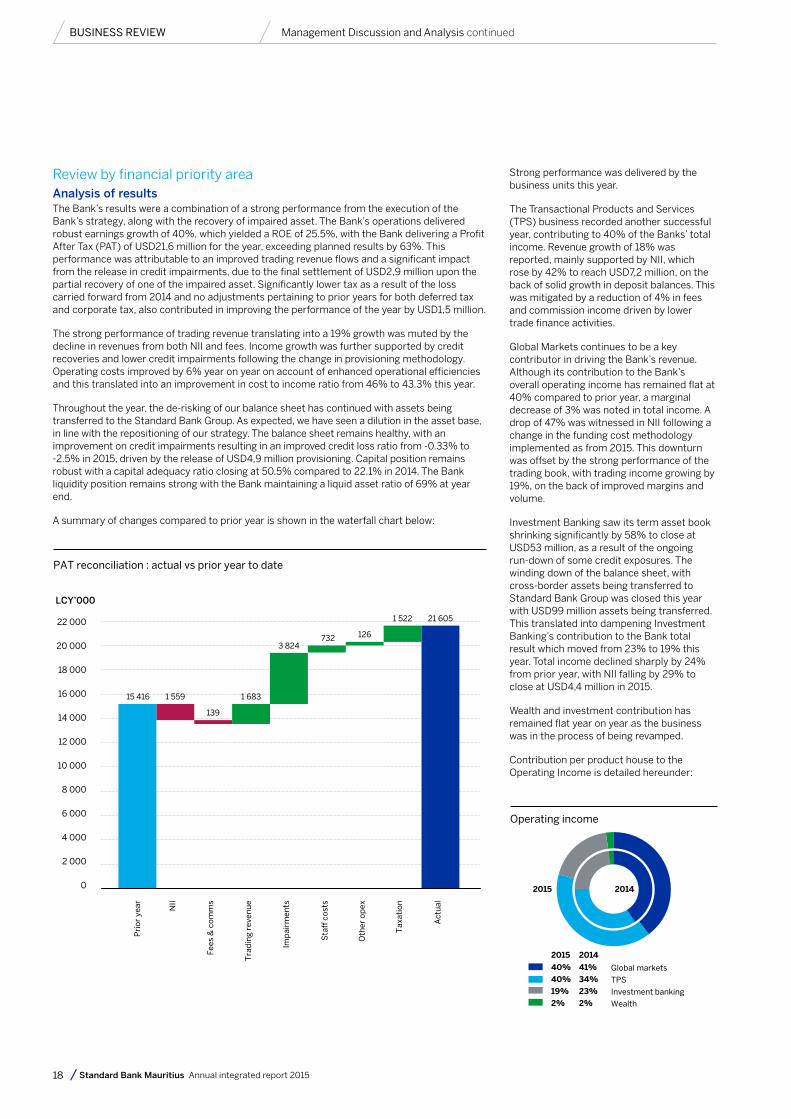
Review by financial priority areaAnalysis of resultsThe Bank’s results were a combination of a strong performance from the execution of the Bank’s strategy, along with the recovery of impaired asset. The Bank’s operations delivered robust earnings growth of 40%, which yielded a ROE of 25.5%, with the Bank delivering a Profit After Tax (PAT) of USD21,6 million for the year, exceeding planned results by 63%. This performance was attributable to an improved trading revenue flows and a significant impact from the release in credit impairments, due to the final settlement of USD2,9 million upon the partial recovery of one of the impaired asset. Significantly lower tax as a result of the loss carried forward from 2014 and no adjustments pertaining to prior years for both deferred tax and corporate tax, also contributed in improving the performance of the year by USD1,5 million.
The strong performance of trading revenue translating into a 19% growth was muted by the decline in revenues from both NII and fees. Income growth was further supported by credit recoveries and lower credit impairments following the change in provisioning methodology. Operating costs improved by 6% year on year on account of enhanced operational efficiencies and this translated into an improvement in cost to income ratio from 46% to 43.3% this year.
Throughout the year, the de-risking of our balance sheet has continued with assets being transferred to the Standard Bank Group. As expected, we have seen a dilution in the asset base, in line with the repositioning of our strategy. The balance sheet remains healthy, with an improvement on credit impairments resulting in an improved credit loss ratio from -0.33% to -2.5% in 2015, driven by the release of USD4,9 million provisioning. Capital position remains robust with a capital adequacy ratio closing at 50.5% compared to 22.1% in 2014. The Bank liquidity position remains strong with the Bank maintaining a liquid asset ratio of 69% at year end.
A summary of changes compared to prior year is shown in the waterfall chart below:
Strong performance was delivered by the business units this year.
The Transactional Products and Services (TPS) business recorded another successful year, contributing to 40% of the Banks’ total income. Revenue growth of 18% was reported, mainly supported by NII, which rose by 42% to reach USD7,2 million, on the back of solid growth in deposit balances. This was mitigated by a reduction of 4% in fees and commission income driven by lower trade finance activities.
Global Markets continues to be a key contributor in driving the Bank’s revenue. Although its contribution to the Bank’s overall operating income has remained flat at 40% compared to prior year, a marginal decrease of 3% was noted in total income. A drop of 47% was witnessed in NII following a change in the funding cost methodology implemented as from 2015. This downturn was offset by the strong performance of the trading book, with trading income growing by 19%, on the back of improved margins and volume.
Investment Banking saw its term asset book shrinking significantly by 58% to close at USD53 million, as a result of the ongoing run-down of some credit exposures. The winding down of the balance sheet, with cross-border assets being transferred to Standard Bank Group was closed this year with USD99 million assets being transferred. This translated into dampening Investment Banking’s contribution to the Bank total result which moved from 23% to 19% this year. Total income declined sharply by 24% from prior year, with NII falling by 29% to close at USD4,4 million in 2015.
Wealth and investment contribution has remained flat year on year as the business was in the process of being revamped.
Contribution per product house to the Operating Income is detailed hereunder:
PAT reconciliation : actual vs prior year to date
LCY’000
22 000
20 000
18 000
16 000
14 000
12 000
10 000
8 000
6 000
4 000
2 000
0
Pri
or
year
NII
Fee
s &
co
mm
s
Tra
din
g re
ven
ue
Imp
airm
ents
Sta
ff c
ost
s
Oth
er o
pex
Tax
atio
n
Act
ual
15 416 1 559
139
1 683
3 824732 126
1 522 21 605
Operating income
40%
40%
19%
2%
41%
34%
23%
2%
¢
¢¢¢
2015
2015
2014
2014
Global markets
TPS
Investment banking
Wealth

19
Revenue growthAgainst all headwinds, total revenues have remained flat in 2015, reinforcing the evidence of our strategy having been properly executed.
Net interest incomeUnderpinning our strategy was the reduction of our credit portfolio within the African franchise. This was translated by the exit of USD99 million cross-border exposures throughout the year, which in turn contributed to a 10% decline in NII, closing at USD14,2 million. Through better optimisation of the balance sheet this year coupled with improving liquidity management, revenue streams have improved and have compensated for the drop in interest income following the run-down of cross-border term assets.
Interest income was 19% lower compared to prior year mainly due to a reduction in the customer asset base. Similarly, interest expense was down 33%, on the back of various factors, namely borrowings repayments from the exit of cross-border exposures and the withdrawal of funds from one sovereign fund.
A net interest margin compression was noted from 0.9% to 0.6% supported by declining term asset base with higher margins, coupled with low yielding excess funds placements.
Non-interest revenueNIR grew by 10% during the year, driven by good growth in trading revenue, which stepped up at 19%, mitigated by a 1% reduction in net fee and commission income. Other revenue was 21% down due to one off fees received in prior year.
Fees and commission income has marginally decreased by 1% to reach USD7,2 million. Contributors to the fees and commission line were transactional fees which grew by 13% on the back of increased volumes and as a result of increased online business activity. This increase was offset by reduced trade finance revenues which were 31% down to reach USD1 million, following a drop in trade finance activities. Knowledge based fees recorded a decline of 22% to reach USD600 000 mostly driven by weaker corporate activity as well as the Euro weakening by 16% during the year.
revenue for the year. Corporate sales benefited from the onboarding of new clients. Margins on corporate sales improved significantly by 31%, despite year to date FX spot volumes remaining at the same level as last year. The retail desk, however, reported negative growth in income, and was 17% down last year.
Demand for structured products picked up at a rapid pace in early 2015 following the slump in 2014. Structured products saw an increase of 193% in income year-on-year. This was on the back of high volatility prevailing in the forex markets, mainly in the first quarter, which translated into hedging opportunities for the key clients of the desk.
The FX flow trading segment equally benefited from the high volatility on the FX markets as well as good corporate flows and improved margins. The desk achieved a 26% growth in income year-on-year. The money market trading desk, on the other hand, reported negative growth of 60% in 2015 as a result of a reduction in forward and swap activities.
Other revenue was 21% lower resulting from the non-recurrence of fees received in prior year.
Credit impairmentIn 2015, we noted the partial recovery of an impaired asset to the tune of USD2,9 million.This was further enhanced by an additional release of USD600 000 following the change in provisioning methodology from a regulatory rate of 1% charged on the loan portfolio to a Performing Portfolio Provisioning (PPP) methodology of 0.53% as from March 2015. The repayments of some cross-border and originating assets contributed to a further USD1,3 million of portfolio provisioning being released this year. Previously impaired assets against which full provision was held, was written-off during the year for USD19,9 million.
The credit loss ratio has improved from -0.33% to -2.5% in 2015, based on the credit impairment release coupled with gross loan and advances declining by 62%.
During the year, in August 2015, an additional provision of 50% was raised to fully provide for one client who was already impaired in December 2014 when a 50% specific provisioning was charged. NPL as a percentage of gross loans has improved from 14.4% to 14%.
Trading incomeGlobal markets performed well, generating solid results for the year. Its performance was underpinned by the strength of the sales and flow trading desks. Revenue growth of 19% was recorded to reach USD10,6 million. Contributing to the increase was strong growth from the sales desk including corporate and structured products as well as FX flow trading desk.
The FX sales desk, which include the corporate, retail and structured products segments, contributed 76% to total trading
¢
¢
Net interest income
32 000
22 000
12 000
2 000
-8 000
1.60
1.40
1.20
1.00
0.80
0.60
0.40
0.20
0.00
2013 20152014
(%)USD’000
Interest income
Interest expense
Net interest margin
2014 20152013
Non-interest revenue
USD’000
8 000
7 000
6 000
5 000
4 000
3 000
2 000
1 000
0
Other banks related fees and commission
Foreign service fees
Card based commission
Documentation & administration fees
Knowledge based fees
Electronic banking transaction fees
Point of representation transaction fees
¢¢¢¢¢¢¢
A detailed analysis of performing and non-performing loans is provided in the financial risk management report on page 106.

BUSINESS REVIEW Management Discussion and Analysis continued
20 Standard Bank Mauritius Annual integrated report 2015
Operating expensesThe Bank maintains its cost containment initiative through streamlining of processes and improving efficiencies in all areas. The Bank continues to invest in staff and infrastructure to provide excellent customer service and deliver on strategic priorities. The Bank reported a 6% decrease in its total cost base, translating into an enhanced cost to income ratio moving from 46% to 43.3% this year.
Staff costs, remains a major component of the Bank total expenses, representing 47% of the Bank’s overall costs. This has however declined by 10% compared to prior year, resulting from the weakening of the Mauritian Rupee exchange rate against US Dollar by 14%.
Other operating expenses witnessed a decrease of 6% to USD7,4 million, mainly benefitting from the depreciation of the USD/MUR exchange rate as most of the Bank’s expenses are Rupee dominated. However some increases were noted in IT costs and professional fees which were incurred in respect of legal fees for the recovery of impaired assets. Most of the other controllable costs have decreased and were lower than prior year due to diligent cost management and operational efficiencies.
¢¢
Cost and income growth
(%)
70
50
30
10
0
-10
2013 2014 2015
Cost growth
Income growth
Cost to income ratio
Staff costs expensesStaff costsFixed remunerationvariable remuneration and other costs
Total staff costs
2015
USD’000
2014
USD’000
2013
USD’000
3 9962 534
6 529
4 2393 015
7 254
4 2593 641
7 900

21
TaxIn 2014 the Bank wrote off some of the previously impaired exposures of USD27 million that resulted in a tax loss of USD8,9 million which was brought forward to 2015. This translated in the Bank bearing no corporate tax charge this year, thus explaining this year’s reduced tax charge, which is mainly attributable to special levy.
Additional write offs of USD19,9 million were made this year relating to previous impaired assets and this adversely impacted our deferred tax asset, which resulted in a further tax loss for 2015.
As a result, the effective tax rate of the Bank as a percentage of the total tax charge to the profit before tax moved from 17% to 7% in 2015.
DividendsDividends of USD10 million were paid to the Bank’s shareholder during the year.
Statement of financial positionTotal assets decreased by 56% to USD1,4 billion, as a result of a reduction in the Bank’s placements, fuelled by the withdrawal of deposits from a sovereign fund. Deposits from banks increased this year following a pick-up in regional treasury activities. Borrowing from Standard Bank Isle of Man was down as repayment of term assets translated into lower funding requirements.
Cash and cash equivalentsCash and balances with banks was down by 66% to reach USD858 million as a result of lower placements with group banks, driven by shrinkage in the volume of the customer deposit base.
Loans and advancesGross loans and advances to customers witnessed a decline of 62% to reach USD106 million while loans to banks grew by 27%, fuelled by increased regional activities.
Customer balances inclusive of NPLs for 2015, closed at USD106 million. The reduction in credit exposures is aligned to the Bank’s strategy to focus on its core activities related to our African aspirations. This significantly impacted the Segment B sector as cross-border assets were transferred to the Group. Despite this decline, the asset book remains skewed towards Segment B, in line with our strategy.
Credit losses at year end was at -2.5%, with total allowance for credit loan losses totalling USD5,5 million at 31 December 2015.
Operating expensesOther operating expensesIT support costsDepreciation and amortisationProfessional feesPremisesOthers
Total other operating costs
Total operating costs
Cost to income ratio
2015
USD’000
2014
USD’000
2013
USD’000
874795
1 541907
3 302
7 420
13 948
43.32%
353903
1 3621 0933 841
7 552
14 806
45.96%
624820
1 0381 124
3 226
6 832
14 732
50.63%
Composition of gross loans and advances
74% Term loans
7% Call loans
6% Trade finance loans
13% Overdrafts
Term loans ( 2014 - 72% )
Call loans ( 2014 - 4% )
Trade finance loans ( 2014 - 2% )
Overdrafts ( 2014 - 22% )
¢
¢¢¢
Loans and advances book has recorded activities in term and call loans. A decrease in overdraft facilities were noted on account of lower limits utilisation and trade finance facilities have remained flat year-on-year. Term loan facilities have dropped from USD201 million to USD79 million in 2015. Activities in Segment B assets remain a significant portion of our book and were at 72% of the portfolio mix (2014: 79%). Appropriate framework in terms of policies and risk appetite were in place to manage the cross-border segment activities during the year.
The Bank continued to support the plans for one local textile company under the Restructure Working Group (RWG) in which the Bank participated along with other banks to help local textile companies in terms of current cash flow challenges and supported some financial and operational restructuration to meet medium and long-term sustainability.
As at 31 December 2015, the loan to deposit ratio stood at 17.8%. (2014: 12.2%).
¢¢
¢¢
Customer loans and advances
USD’000
250
200
150
100
50
0
2014 2015
Term loans
Call loans
Trade finance loans
Overdrafts
BUSINESS REVIEW Management Discussion and Analysis continued
22 Standard Bank Mauritius Annual integrated report 2015
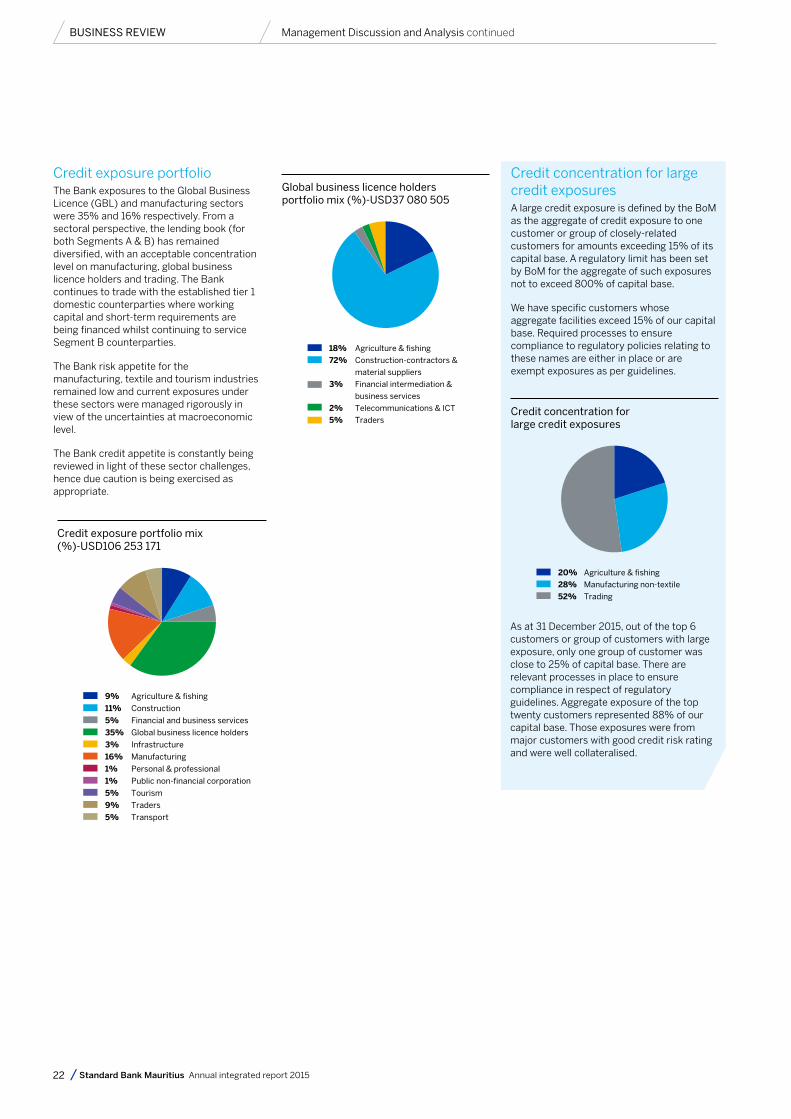
Credit exposure portfolio mix(%)-USD106 253 171
¢¢¢¢¢¢¢¢¢¢¢
9% Agriculture & fishing
11% Construction
5% Financial and business services
35% Global business licence holders
3% Infrastructure
16% Manufacturing
1% Personal & professional
1% Public non-financial corporation
5% Tourism
9% Traders
5% Transport
Credit concentration for large credit exposures
¢¢¢
20% Agriculture & fishing
28% Manufacturing non-textile
52% Trading
Global business licence holders portfolio mix (%)-USD37 080 505
¢¢
¢
¢
¢
18% Agriculture & fishing
72% Construction-contractors &
material suppliers
3% Financial intermediation &
business services
2% Telecommunications & ICT
5% Traders
Credit exposure portfolioThe Bank exposures to the Global Business Licence (GBL) and manufacturing sectors were 35% and 16% respectively. From a sectoral perspective, the lending book (for both Segments A & B) has remained diversified, with an acceptable concentration level on manufacturing, global business licence holders and trading. The Bank continues to trade with the established tier 1 domestic counterparties where working capital and short-term requirements are being financed whilst continuing to service Segment B counterparties.
The Bank risk appetite for the manufacturing, textile and tourism industries remained low and current exposures under these sectors were managed rigorously in view of the uncertainties at macroeconomic level.
The Bank credit appetite is constantly being reviewed in light of these sector challenges, hence due caution is being exercised as appropriate.
As at 31 December 2015, out of the top 6 customers or group of customers with large exposure, only one group of customer was close to 25% of capital base. There are relevant processes in place to ensure compliance in respect of regulatory guidelines. Aggregate exposure of the top twenty customers represented 88% of our capital base. Those exposures were from major customers with good credit risk rating and were well collateralised.
Credit concentration for large credit exposuresA large credit exposure is defined by the BoM as the aggregate of credit exposure to one customer or group of closely-related customers for amounts exceeding 15% of its capital base. A regulatory limit has been set by BoM for the aggregate of such exposures not to exceed 800% of capital base.
We have specific customers whose aggregate facilities exceed 15% of our capital base. Required processes to ensure compliance to regulatory policies relating to these names are either in place or are exempt exposures as per guidelines.

23
The top 6 most significant concentrations in respect of customer or group of customers as at 31 December 2015 were as follows:
The Bank has in place an industry portfolio concentrations model and policy which regulates management of our sector concentration in an active manner. Limits have been set defining the Bank’s credit appetite with particular attention paid to sectors with potential credit concerns.
Trading assetsTrading assets consist of treasury bills, treasury notes and money market placements. During the year, the money markets desk has significantly reduced their placement activities as a result of lower turnover in the forward and swap books. Trading assets was down from USD184 million to USD39 million.
Trading liabilitiesThere were no trading liabilities at year-end.
Derivative assets and liabilitiesDerivative assets and derivative liabilities increased by 100% and 127% to reach USD9 million and USD8,6 million respectively, driven by increased client flows in structured product sales during the year.
Investment securitiesFinancial investments was made up of treasury bills and decreased by 82% to close at USD400 000, following a reduction in the banking book requirements activities.
DepositsCustomer deposits decreased by 62% to reach USD1,1 billion (2014: USD3 billion), primarily on the back of the outflow of funds from a sovereign fund of USD1,5 billion. Notable growth was experienced in current accounts which went up by 15%, while term and call deposits decreased by 87% and 29% respectively. The savings portfolio has reduced by 5%.
SectorTrading (3 clients of the same group)Manufacturing non-textile (2 clients)Agriculture & fishing (1 client)
Exposure
USD’000
Percentage of capital base
37 90020 76215 000
73 662
35%19%14%
Analysis of deposits
¢
¢
¢
¢
51% Call accounts
( 2014 - 28% )
27% Current accounts
( 2014 - 9% )
21% Fixed deposits
( 2014 - 63% )
0.76% Saving accounts
( 2014 - 0.76% )

BUSINESS REVIEW Management Discussion and Analysis continued
24 Standard Bank Mauritius Annual integrated report 2015
Deposits from banksDeposits from banks increased by USD56 million as a result of increased intragroup deposits.
Other borrowed fundsThis represents term funding from Standard Bank Isle of Man to cater for cross-border term assets and has reduced by 75% as a result of repayment of term assets.
Subordinated debtThe Bank has an outstanding subordinated debt of USD25 million from Standard Bank of South Africa (SBSA). Under the Basel III guidelines on eligible capital, effective 1 July 2014, an additional 10% of the tier 2 subordinated loan has been phased out this year in the computation of tier 2 capital. The remaining USD20 million will be progressively phased out over the next 8 years, beginning 1 July 2016.
Off-balance sheet items
Deposit splits
¢¢
USD’000
3 500
3 000
2 500
2 000
1 500
1 000
500
0
2013 2014 2015
Segment B Segment A
Off-balance sheet exposure per sectorSectorManufacturingTelecommunications & ICTGovt & Institutional Org (GIO) & infrastructurePersonalTransport (airlines, shipping & others)Commerce & trading (wholesale, retail & other dealers )Property holdingInvestment holdingFinancial intermediation & business servicesConstructionMedia & entertainment and recreational activityAgriculture & fishingMining & quarryingEnergy
2015
USD’000
2014
USD’000
2013
USD’000
1 0182 836
9233
1563 0395 400
-523
2 759--
1 1001 862
18 817
2232 455
105313160
8 815-
4 56023 01017 379
--
1 0002 642
60 662
3 9831 241
1 036480167
9 5583
2 03510 703
-2 9802 293
16 8612 800
54 140

25
Off-balance sheet exposure decreased to from USD61 million to USD19 million in 2015 as a result of decreased non-fund based facilities to clients in the construction and financial intermediation & business services sector.
Off-balance sheet exposure by geographical concentration
Credit qualityThe NPLs ratio to total loans fell from 14.4% to 14% as at end of December 2015. The Bank wrote off some of the existing impaired accounts but is however pursuing with the legal action initiated on these names. It should be noted that despite the write off’s, the NPLs ratio fell only by 0.32% as the loan book was adversely impacted following the run-down of our credit exposures, translating into a decline of 62% year-on-year.
The credit impairment provision stood at USD5,5 million at the end of the financial year. A change in provisioning methodology was implemented in March 2015, through the introduction of PPP which has moved from a regulatory rate of 1% to 0.53% charged on the Bank’s loan portfolio. To maintain the 1% provision, in line with the BoM guidelines, the difference is being appropriated from retained earnings to a statutory credit risk reserve. The Bank also raised additional portfolio provisioning of 1% representing USD5 000 on exposures in the personal sector, in line with the macro prudential policy measures guideline. A detailed analysis of performing and non-performing loans is provided in the financial risk management section on pages 106-107.
The quality of the lending book remains healthy with only two assets classified as impaired, duly provisioned for. The Bank nevertheless has managed within the difficult economic conditions in specific sectors such as property, to progress some recoveries and work outs. Our largest NPL falls within the property sector and is expected to be closed in the first quarter of 2016. Legal actions are still in progress on the other NPL names. Our credit appetite on sector exposure is being managed within the Bank’s approved framework to ensure acceptable level of concentration of risk and cross-border activities managed under our country risk management policy. This policy is in line with regulatory requirement and our business strategic deliverables as far as asset build up is concerned.
Sectors which are still under close watch remain the textile, property sector, construction and recently the Global Business Licence sector with cross-border trade financing. The Bank has adopted a conservative approach vis-a-vis these sectors and exposures are managed rigorously.
During the year, two accounts were renegotiated, of which one was fully repaid at year end. Three assets have been subject to write off for which full provisions were held.
CountryFranceMauritiusMozambiqueSouth AfricaGermanyTanzaniaUK
2015
USD’000
2 577 14 439
630 793 129 249
2
18 817
Provisioning and asset qualityProvisions at beginning of the yearProvisions made during the yearProvisions released during the yearAmounts written offBad debts recovered
Provisions at end of the year
Key Ratios (%)Income statement charge to total loansTotal provisioning to non-performing loansSpecific provisions to impaired creditsTotal provisions to total loans
2015
USD
2014
USD
2013
USD
30 443 626 596 382
(2 593 848) (19 993 815)(2 952 000)
5 500 345
-2.46 36.89 20.28 28.65
58 880 650 1 782 619
(2 580 110) (27 311 533)
(328 000)
30 443 626
-0.33 75.69
0.44 10.86
40 142 746 20 808 367 (2 048 017)
(22 446) -
58 880 650
-0.40 146.39 46.59 21.01

BUSINESS REVIEW Management Discussion and Analysis continued
26 Standard Bank Mauritius Annual integrated report 2015
Risk management frameworkThe Bank‘s philosophy is that responsibility for risk management resides at all levels within the Bank and therefore uses the three lines of defence model which promotes transparency, accountability and consistency through clear identification and segregation of risks.
Management of business lines and legal entities
Measures, assesses and controls risks through the day-to-day activities of the business, within the frameworks set by the second line of defence.
Consists of
Responsibilities
Risk management function
Governance and assurance function excluding internal audit
Sets frameworks within the parameters set by the board;
provides independent oversight of the first line of defence; and
reports to management and board governance committees.
Group internal audit (administratively part of governance and assurance)
Sets the internal audit framework;
provides independent assessment of first and second lines of defence; and
reports to board audit committee.
Third line of defence
Second line of defence
First line of defence
Control or mitigate
Measure and monitor
Structure
Governance
Management information and reporting
Risk appetite
Assess
Identify
Liquidity risk
Operational risk
Credit risk
Compliance risk
Country risk
Market risk
Types of risk
Risk management IntroductionEffective risk management is fundamental to the successful execution of the Bank’s strategy, as it pursues its vision to build the leading financial organisation in, for and across Africa. The role of the risk management function is to ensure that the full spectrum of risks faced by the Bank are properly identified, assessed, measured and managed in the pursuit of its goals.
The Bank’s approach to managing risk is to adopt a risk and governance framework that enables management to maximise risk adjusted returns while remaining within the board-approved risk appetite and risk tolerance levels. This approach ultimately ensures the protection of the Bank’s reputation and is consistent with our objective of increasing shareholder value. The material types of risks the Bank’s faces are as per below.
Risk management
process

27
GovernanceGovernance documents comprise standards, frameworks and policies which set out the requirements for effective oversight of risks. These governance documentation are approved by the relevant board or management committees and are aligned to the Group’s standards and frameworks.
Risk governance standards have been developed for all major risk types that the Bank is exposed to, to ensure that all material risks to the Bank’s strategic and financial objectives are identified and
Structure
managed proactively. These standards are modified to recognise local laws and regulations. The risk governance standards are part of the Group’s governance infrastructure, reflecting the expectations and requirements of the Board and its committees in respect of key risk areas. The standards set out minimum control requirements and ensure alignment and consistency in the manner in which the major risk types and capital management metrics across the Bank are dealt with, from identification to reporting.
Policies are developed where required on specific items as stated within the standards and are reviewed every two years or earlier if required. Details with regards to the implementation of these policies within each particular business unit are set out in the processes and procedures manual. Compliance with the standards, policies and procedures is controlled by risk management team through annual self-assessments by business units and independent reviews by the third line of defence risk functions.
Board
Board sub-committees
Conduct review and risk committee
Asset and liability management
committee
Management and oversight of
Liquidity riskInterest rate risk
Market risk
Management and oversight of
Legal riskCompliance riskOperational risk
Reputational risk
Management and oversight of
Credit risk
Management and oversight of
New/amendedproducts,services,
business process
Management and oversight of
Procurementstrategies &
recommendations
Operational risk and compliance
committeeCredit committee
New products committee
Procurement committee
Credit committeeAudit committee
Executive Committee (EXCO)
Group internal audit
Chief executive

BUSINESS REVIEW Management Discussion and Analysis continued
28 Standard Bank Mauritius Annual integrated report 2015
Board and sub-committeesThe Board takes ultimate responsibility for management of risk and is required to ensure that an effective risk management process exists and is maintained throughout the Bank. The Board appoints board members to three separate board sub-committees (board risk management/conduct review committee, board credit committee and board audit committee) to assist in discharging its duties in relation to the management of risk.
Details about the constitution, responsibilities, focus areas and summary of the key terms of reference of the Board and the board sub-committees are set out in the corporate governance report section of this annual report starting from page 45.
Management committeesDetails of the management committees such as Executive Committee (EXCO), Asset and Liability Committee (ALCO), Operational Risk and Compliance Committee (OPCO) and Credit Risk Management Committee (CRMC) are provided in the corporate governance report section of this annual report starting from page 45.
New products committeeThe purpose of the New Products Committee (NPC) is to facilitate the introduction of new products, services, businesses, legal entities systems or processes in a coordinated and effective manner which is consistent with our overall strategic, business and risk management focus.
The objectives of the NPC are:
• to ensure that any significant risks that could arise from the introduction or amendment of businesses, products or services, systems and processes are properly identified and appropriately addressed by the relevant parties;
• to achieve greater consistency in decision-making through standardising the requirements for the approval process of new products;
• to ensure that feasible and viable support and control processes and systems are in place to support the deployment of new products;
• to ensure that risks from interdependencies associated with the roll out of CIB products across multiple African countries are properly identified and mitigated in a coherent manner; and
• to ensure adequate control and effective maintenance of the NPC process itself.
The NPC is a sub-committee of EXCO, chaired by chief finance officer and consists of a minimum of five EXCO members depending on the type of product/service being introduced. The NPC meets as and when required.
Procurement committeeThe procurement committee meets on a monthly basis, is comprised of permanent members being the chief finance officer (chairperson), head: risk, head: legal and procurement manager.
The purpose of the procurement committee is to ensure that the procurement strategies and recommendations are viewed in a systematic and consistent manner, according to our business priorities, commercial standards and ethical principles before making commitments to suppliers.
Risk management The risk management team provides the day-to-day oversight on management of risk and promotes the risk culture across the Bank. It is responsible to create and maintain the risk practices across the Bank as defined by the Group risk and to ensure that controls are in place for all risk categories.
The risk management team maintains its objectivity by being independent of operations. The head: risk has a direct reporting line into the country chief executive and to the regional head: risk, East Africa.
The risk function is subject to internal audits from group internal audit on an annual basis where it is assessed by specialised teams for each of the different types of risk. Internal audit provides an annual assessment on the adequacy and effectiveness of the Bank’s processes for controlling its activities, managing its risks and ensuring good governance. It reports and provides recommendations on significant issues related to the risk management, control and governance processes within the Bank.
For the past five years, the risk function has been awarded clean internal audit reports with no significant findings which can be translated in a control environment that is well managed, strong and mature in its approach.

29
Risk governance continues to ensure that regulatory and business requirements are fully embedded in our business processes and governance frameworks across all risk functions. Hence, in addition to ensuring adequacy of credit risk governance, it fully incorporates operational risk, market risk and liquidity risk. This role falls under the responsibility of the head: risk governance who reports into the country head: risk and to the rest of Africa head: risk governance.
Risk management function
Compliance teamThe compliance team proactively supports senior management and business through effective compliance risk management practices to ensure all business is within statutory supervisory and regulatory requirements thereby mitigating regulatory sanctions and reputational risk. Compliance is also subject to annual internal audit.
Credit risk
Manager: compliance
Operational risk
Manager: compliance
Market & liquidity risk
Money Laundering Reporting Officer (MLRO)
Risk managementCredit risk
Governance
Operational risk
Market & liquidity risk
Chief executive Head: risk & compliance

BUSINESS REVIEW Management Discussion and Analysis continued
30 Standard Bank Mauritius Annual integrated report 2015
Risk categories and risk management processThe principal risks that the Bank is exposed to and the management thereof are described below:
Comprises of:
� Counterparty risk - the risk of loss as a result of failure by a counterparty to meet its financial and/or contractual obligations to the Bank.
� Concentration risk - the risk of loss arising from an excessive concentration of exposure, inter alia, to a single counterparty or counterparty segment, an industry, a market, a product, a financial instrument or type of security, a country or geography, or a maturity.
� Country risk - the risk of loss when political or economic conditions or events in that particular country reduce the ability of counterparties in that country to meet their financial obligations to the Bank.
Governance structure is supported by clearly defined mandates and delegated authorities as documented in policies.
Prior to the credit process being invoked, all facility proposals in respect of new counterparties are referred to the Pre-Credit Committee (PCC), a business forum whose role is to consider the nature and extent of the business and industry involved in, the structure of the transaction, the Bank’s exposure and strategy to the counterparty, the industry risk concentration, country risk, potential cross sells and risk versus reward.
various guiding principles documented in the credit policy govern the credit risk management process:
� For all credit-related proposals, risk and reward must be consistently matched. As a result capital allocation should be prioritised to yield the most beneficial return on capital, as adjusted for expected loss.
� Tenors should as a rule be appropriate for the purpose of the transaction with due consideration of the sustainability of the cash flows of the counterparty/business. Long dated commitments are required to have appropriate mitigants, such as repricing triggers, financial covenants, break clauses, rating triggers, margin calls or physical security in the event of changes or deterioration in prospects for originally-envisaged repayment flows.
� The ‘two sources of repayment’ principle is adhered to, with the proviso that guarantees or other security yielding measurable and independent value may be accepted in lieu of a secondary source of repayment in those cases, where only one source is evident in the hands of the applicant. The primary source of repayment should be from a reasonable, credible and sustainable source within the ordinary course of operations of the business. Security lending is not desirable.
� Drawdown on any facilities is permitted only after all necessary legal documentation has been properly executed and the Bank has been provided with proof of all necessary corporate, legislative and regulatory approvals.
� All conditions precedent have been fulfilled or waived, as the case may be, and particularly after all security has been signed and confirmed to be correct.
� Facilities are required to be monitored for any negative changes to the risk inherent in the exposure. This includes, but is not limited to ongoing adherence to terms and conditions attached to the facilities, testing of any covenants in existence in keeping with the measurement frequency declared in the credit sanction, maintaining an awareness of news, current affairs and other information emerging into the public domain which may have a bearing on counterparty risk; the appearance of significant changes in the conduct of
Credit riskIdentification
Management

31
Risk that the Bank is unable to meet its obligations when they fall due.
This may be caused by the inability to liquidate assets or to obtain funding to meet its requirements.
accounts, including persistent excesses or declining fluctuations in working capital facilities. Any material deterioration in risk requires the exposure to be placed on watchlist which requires an even closer monitoring of the account.
� Existing exposures with no increased facilities or extensions of tenors are required to be reviewed on an annual basis.
Counterparty risk is measured using three components i.e.:
� the probability of default of the counterparty;
� the current and potential future exposure; and
� the recovery rate based on collaterals.
Every counterparty is assigned a risk grading based on an appropriate rating model.
Rating models are used to achieve objectivity, comparability and consistency in the process.
Probability of default is assigned to each risk grade such that the long run average default rate predicted by the model is the best estimate of population default rate over the economic cycle.
ALCO sets liquidity risk management policies approved by the Board which are consistent with the Group standards and which ensure that funding obligations and payment obligations can be met at all times under normal and stressed conditions.
The following major principles form part of a cohesive liquidity risk management framework:
� Ensuring structural liquidity mismatch that is the Bank has sufficient inflows to meet its outflows in different time bands on the maturity ladder. Assessment of liquidity mismatch is done separately for every major currency. Liquidity gap limits are set for each maturity bucket.
� Basel III liquidity metrics are embedded in our liquidity risk framework. Two new ratios now form an integral part of management of liquidity risk, namely the Liquidity Coverage Ratio (LCR) and the Net Stable Funding Ratio (NSFR). They are calculated using internal assumptions.
� The LCR requires us to continuously maintain a stock of liquid assets (or contingency liquidity) to cover stressed net cash outflows for a 30 calendar day period. This ratio is required to be above 105%. The ratio is obtained by dividing the available amount of contingency liquidity by the stressed net cash outflows as determined for the bank-specific and systemic stress scenarios run by the Bank.
� The NSFR is defined as the amount of “available stable funding” relative to the amount of “required stable funding”, with the ratio required to be above 102.5%.
Credit risk
Liquidity risk Identification
Measurement
Management

BUSINESS REVIEW Management Discussion and Analysis continued
32 Standard Bank Mauritius Annual integrated report 2015
Liquidity risk
� An added guideline is observed to monitor the proportion of long-term deposits as a percentage of the total deposit base. Referred to as the long-term funding ratio, which is defined as the total deposits with a remaining term to maturity exceeding 6 months as a percentage of total deposits. The long-term funding ratio is a transparent and practical measure for the funding desk to target and monitor the pace of raising long-term deposits.
� The foreign currency lending limit is also referred to as the own resources lending limit, restricts the extent of foreign currency lending from the foreign currency deposit base, thereby introducing a simple metric for the management of foreign currency liquidity risk.
� Minimum levels of prudential liquid assets are held in accordance with prudential requirements of local banking supervision authorities. The Bank needs to hold additional unencumbered marketable assets, in excess of any minimum prudential liquid asset requirement, to cater for volatile depositor withdrawals, draw-downs under committed facilities, collateral calls and so on.
� To ensure that the Bank does not place undue reliance on any single entity as a funding source, limits on the short dated deposits from any customer are set as a percentage of total deposits. Limits as a percentage of total deposits, are also set for the sum of 10 largest single deposit counterparties.
� The daily cash flow management report forms an integral part of the ongoing liquidity management process and is a crucial tool for management and the funding team to proactively anticipate and plan for large cash outflows.
� Liquidity stress and scenario testing is used to gauge potential vulnerability to exceptional but plausible events. The Bank must regularly conduct liquidity stress testing and maintain associated contingent funding plans to cater for, at the minimum, a bank-specific liquidity crisis and a systemic crisis.
� In order to assess our Basel III readiness, our liquidity risk framework now requires us to calculate and monitor a LCR as per the Basel III framework.
�Contingency funding plans are a continuation from the liquidity stress tests and are designed to mitigate the risks identified in the stress tests. The liquidity contingency plan provides the Bank with clearly defined response strategies that includes appropriate and timely guidelines, processes and procedures for managing liquidity during a crisis. On a monthly basis a dashboard of early warning liquidity risk indicators is prepared and submitted to head office.
Management
Established process in place for the on-going measurement and monitoring of net funding requirements to ensure the liquidity position is sufficient to meet day-to-day, cyclical and long-term liquidity needs.
Short-term projected cash flows for major currencies are measured and monitored in order to anticipate future funding requirements.
Behavioural liquidity assumptions used are reviewed on an annual basis to ensure continued validity. Measurement of liquidity risks deals specifically and separately with normal market conditions and stress market conditions.
During the year the Bank maintained its liquidity positions within the approved limits. Appropriate liquidity buffers were held in excess of regulatory, prudential and internal stress-testing requirements, taking into account risk appetite and market conditions.
Measurement

33
Market risk policy approved by the Board sets out the major principles for market risk management:
� Market risk is managed through setting of risk appetite limits for the Bank in terms of value at Risk (vaR), FX Delta (present value of foreign currency position reflecting how exposed the Bank is to fluctuations in exchange rates) and Pv01 (changes in present value of future cash flows). The accuracy of vaR metric is tested by means of a back testing programme that is an ex-post comparison of the risk measure generated by the vaR model against actual daily changes in portfolio value attributable to changes in market variables.
� Risk appetite limits are reviewed on an annual basis as part of the business planning and budgeting process by the market risk desk at head office and adopted at ALCO.
� Escalation procedures are clear and unambiguous in the event of a breach of a limit.
� Pricing and risk metrics used in production systems, are independently validated before their use and periodically thereafter to reconfirm the continued applicability of the model.
� Independent daily price verification is carried out on liquid variables and at least monthly for illiquid variables.
Management
Daily measurement of trading exposures under normal market conditions is based on the following parameters:
� vaR being the 5th percentile of the 1-day holding period profit and loss distribution, calculated on a historical simulation basis with 250 days’ worth of historical data updated monthly. Measurement of daily trading exposures under stress market conditions takes account of a holding period of 10-days and is the highest loss that could be recorded, if the worst 10-day market movement observed during the historical period (5 years) were to recur.
� FX Delta being the present value of foreign currency positions reflecting how exposed the Bank is to fluctuations in exchange rates. Pv01 being the change in the present value or mark-to-market value of the portfolio as a result of moving interest rates up by 1 basis point (0.01%).
The Bank also stress tests its trading exposures on a daily basis and measures the impact of severe exchange rates and interest rates historical and hypothetical events as follows:
(i) Cross market stress test
� Cross market stress scenarios are drawn from historical events that reflect periods of abnormal market movements, market crashes and unusual correlations between different asset classes, reduced liquidity or crisis situations for the country. These scenarios will represent movements observed in risk factors across different markets and portfolios are stressed accordingly.
Measurement
Risk of a change in the actual or effective market value or earnings of a portfolio of financial instruments caused by an adverse move in market variables such as equity, bond and commodity prices, currency exchange rates, interest rates, credit spreads, recovery rates, correlations and implied volatilities in all of the above.
Market riskIdentification

BUSINESS REVIEW Management Discussion and Analysis continued
34 Standard Bank Mauritius Annual integrated report 2015
Market risk
Interest rate risk
(ii) IR hypothetical stress test
� Interest rate scenarios are included in order to get an understanding of the impact of standardised rate shocks in each interest rate bearing portfolio. We assess the impact of the following scenarios: a parallel yield curve shift, a yield curve flattener (rates stressed more in the short-end decreasing in the long-end) and yield curve steepener (rates stressed by less in short-end increasing in the long-end).
(iii) FX historical stress test
� The 1-day and 10-day historical scenarios are taken as the worst up move and worst down move in the USD/MUR spot rate in 1-day and 10-day respectively. We can thus assess the impact of historical FX rate movements on the FX portfolio where positions are mainly run in USD/MUR.
The Bank also simulates a financial crisis on:
� historical events such as the Russian crisis in 1998, 9/11 terrorist attack in New York, Long-Term Capital Management L.P. (LTCM) bail out in 1998, bond crisis in 2003.
� hypothetical scenarios such as the Flight to Quality, Dollar Flight, weakness in Chinese economy and Euro crisis.
The above stress results are tabled to ALCO on a monthly basis.
A forward-looking net interest income forecast is used to quantify the Bank’s anticipated interest rate exposure. This approach involves the forecasting of both changing balance sheet structures and interest rate scenarios, to determine the effect these changes may have on future earnings. Balance sheet projections and the impact on NII due to rate changes cover a minimum of 12 months forecasting.
A second measure of interest rate exposure involves looking at long-term sensitivity to interest rate changes and is known as Economic value of Equity (EvE). EvE measures the long-term interest rate risk and identifies what the long-term effects of interest rate shocks are on the balance sheet. The focus of EvE is the change in the market value of equity and is calculated as the expected change in net present value of all expected future cash flows (including off-balance sheet instruments) over a period of five years given a considered rate shock.
Measurement
This risk is the loss arising from a decrease in the market value or earnings of a portfolio of financial instruments caused by adverse movement in interest rates. The source of interest rate risk arises from the different repricing characteristics of banking assets and liabilities.
Identification
The Bank’s approach to managing interest rate risk is governed by its interest rate risk policy which incorporates recommended best practices. Daily management of interest rate risk is under the purview of the global markets department and reviewed by ALCO on a monthly basis. Interest rate risk is managed through the setting of risk appetite limits for the Bank in terms of NII sensitivity.
Management

35
Identification
Management
Operational risk
Operational risk is the risk of loss resulting suffered from inadequate or failed internal processes, people and systems or from external events. This definition excludes reputational risk and strategic risk.
Operational risk contains specific sub-risks that are subject to management and oversight dedicated specialist functions and which include the following:
Operational risk is recognised as a distinct risk category which the Bank strives to manage within acceptable levels through the promotion of sound operational risk management practices. It is not an objective to eliminate all exposures to operational risk as this would be neither commercially viable nor indeed possible. The Bank’s approach to managing operational risk is to adopt practices that are “fit for purpose” to increase the efficiency and effectiveness of the Bank’s resources, minimise losses and utilise opportunities.
The primary responsibility for managing operational risk forms part of the day-to-day responsibilities of management and employees at all levels. Business line management is ultimately responsible for owning and managing risks resulting from their activities. These risks are managed where they arise.
The well embedded operational risk framework sets out a structured, consistent approach for managing operational risk across the Bank and is based on the following core components.
The Integrated Operational Risk (IOR) management function approach which was adopted in 2014, is independent from business line management and is part of the second line of defence. It is responsible for:
� developing and maintaining the operational risk governance framework;
� facilitating business’ adoption of the framework, oversight and reporting; and
� challenging the risk profile.
The function proactively analyses root causes, trends and emerging threats, advises on the remediation of potential control weaknesses and recommends best practice solutions.
Information risk
Risk of accidental or intentional unauthorised use, modification, disclosure or destruction of information resources, which would compromise the confidentiality, integrity or availability of information.
Is subject to the same governance and rigour applied to the management of operational risk.
The Bank views information as one of its critical assets and seeks to maintain its confidentiality, retain its integrity and ensure its appropriate availability. Information Risk Management (IRM) deals with all aspects of information in its physical and electronic forms.
It focuses on the creation, use, transmission, storage, disposal and destruction of information.
Legal risk
Exposure to the adverse consequences of non-compliance with legal or statutory responsibilities and/or inaccurately drafted contracts and their execution, as well as the absence of written agreements or inadequate agreements.
This includes the exposure to new laws as well as changes in interpretations of existing law by appropriate authorities.
Compliance risk
Risk of legal or regulatory sanctions, financial loss or loss to reputation that the Group may suffer as a result of its failure to comply with laws, regulations, and codes of conduct and standards of good practice applicable to its financial services activities.
Taxation risk
Possibility of suffering unexpected loss, financial or otherwise, as a result of the application of tax systems, whether in legislative systems, rulings or practices, applicable to the entire spectrum of taxes and other fiscal imposts to which the Bank is subject.
Financial crime control
Risk of economic loss, reputational risk and regulatory sanction arising from any type of financial crime against the Group. Financial crime includes fraud, money laundering, violent crime and misconduct by staff, customers, suppliers, business partners, stakeholders and third parties.

BUSINESS REVIEW Management Discussion and Analysis continued
36 Standard Bank Mauritius Annual integrated report 2015
The Bank inculcates the culture of self-assessment where each business unit/enabling function is required to analyse its business activities and critical processes to identify the key operational risks to which it is exposed, and assess the adequacy and effectiveness of its controls.
For any area where management concludes that the level of residual risk is beyond an acceptable level, it is required to define action plans to reduce the level of risk. These assessments are facilitated, monitored and challenged by the operational risk team at least annually.
The implementation of a comprehensive RCSA process is an integral element of operational risk management and is compulsory throughout the Bank.
The RCSA is a live document which gets updated by the business for any new activity and any action required out of recurring incidents that indicate a deficiency in process or controls or any findings out of internal or external audit reports that warrant attention.
Action items are closely monitored to completion and any overdue plans are reported in the OPCO, the EXCO and the board conduct review and risk committee.
Indicators are used across the Bank to monitor the relevant risks and controls highlighted in the RCSA process. They are constructed based on key operational risk events, their potential effect, causes and their underlying controls. They are set in consultation with both senior management and people involved in day-to-day business operations which ensures standardisation and consistency in reporting.
The implementation of the Key Risk Indicators (KRI) process is an integral element in providing an early warning indicator of a potential increase in risk exposure and/or a potential breakdown of controls and is compulsory throughout the Bank.
Each indicator has trigger thresholds to provide an early-warning indicator of potential risk exposures and/or a potential breakdown of controls.
Action plans are defined to remedy breaches in the indicators or where improvements are required. These action plans are tracked, monitored and reported to OPCO. Indicators are reassessed on an annual basis or whenever there is a significant change in the internal or external environment.
The past year has seen a review of the indicators for various business units to ensure more meaningful and relevant early-warning indicators.
An operational risk incident can be defined as an event leading to the actual outcome of a business process to differ from the expected outcome, due to inadequate or failed processes, people and systems, or due to external factors or circumstances with an effect i.e. there has been some form of impact arising from the event.
The definition of operational risk incidents includes not only events resulting in actual loss, but those resulting in non-financial impacts and near misses. This process is intended to enable the root cause of individual incidents, or trends of incidents, to be analysed and actions taken to reduce the risk of recurrence and enhance controls.
The identification, recording, management and reporting of operational risk incidents is key to the management of operational risk in the Bank.
All operational risk incidents are recorded and reported in compliance with legal and regulatory requirements and sound international practice.
Care is also taken when dealing with boundary events to ensure that other risk types that fall outside the scope of operating risk incident are appropriately excluded.
For the purposes of operational risk, boundary events refer to those incidents that manifest themselves in other risk types, such as credit risk and market risk, but have relevance for operational risk because they were due to operational breakdowns or failures consistent with the definition of operational risk.
The incident data collection process ensures that all relevant operational risk incidents are captured on a centralised database within 48 hours after the incident is recognised. All incidents are then analysed for root causes and clear action plans, with responsibilities and target dates to address any weaknesses identified, are formulated and implemented.
1. Risk Controls Self-Assessment (RCSA)
2. Indicators
3. Incident management & reporting

37
Operational risk is measured as a percentage of gross income.
As at 31 December 2015, the operational loss as a percentage of gross income amounted to 0.01% (2014: 0.1%). The control environment has proved to be well managed, strong and mature in its approach.
The Bank has adopted the Basel II standardised approach to the calculation of operational risk capital. As at 31 December 2015, the capital requirement in respect of operational risk amounted to USD52 million (2014: USD54 million).
Risk appetite and stress testingRisk appetite is an expression of the amount or type of risk the Bank is willing to take to meet our financial and strategic objectives. It reflects the Bank’s capacity to sustain losses while continuing to meet obligations as they fall due under both normal and a range of stressed conditions.
Risk appetite is expressed through various parameters namely an agreed tolerance for profit and loss volatility, the economic capital requirement being consistent with the available capital, the risk adjusted returns generated from risk-taking being acceptable, stress tests limits, portfolio analysis and concentration limits, which serve to identify and constrain threats to disproportionate earnings volatility and capital. Risk appetite limits are set by the Board to guide risk taking across the various areas of the Bank.
Stress testing is a key risk management tool within the Group and facilitates a forward-looking perspective of the organisation’s risk profile or risk tendency. Stress tests are conducted at business line and legal entity level.
Stress testing supports a number of business processes including:
� strategic planning and budgeting;
� capital planning and management, and the setting of capital buffers;
� liquidity planning and management;
� informing the setting of risk tolerance;
� providing a forward looking assessment of the impact of stress conditions on the risk profile;
� identifying and proactively mitigating risks through actions such as reviewing and changing risk limits, limiting exposures and hedging;
� facilitating the development of risk mitigation or contingency plans across a range of stressed conditions; and
� communicating with internal and external stakeholders.
The stress testing model uses a projection methodology that links risk and finance model inputs to macroeconomic factors. This requires an understanding of the specific risk drivers within portfolios and their impact on financial metrics and portfolio performance.
Credit risk represents the largest source of risk the Bank is exposed to hence it receives a higher degree of focus. Additionally both market risk and operational risk data are used as inputs to the stress model. Liquidity stress testing is also performed and is discussed in further details in the liquidity risk section.
Whilst the substance of the stress testing exercise has not changed from previous stress testing exercises run in country it should be noted that, a new stress testing approach has been validated, approved by the respective governance committees and rolled out in 2015. The new approach allows for more granular inputs of different variables, better engagement with the heads of the different risk types and is proven to be more versatile to cater for various assumptions and addresses the limitations of the previous model. The new approach also takes account business risk via loss of NIR under the stressed scenarios.
Stress testing is conducted using macroeconomic stress scenarios as well as bank specific scenarios based on the composition of the Bank’s loans and advances. Whilst the macro economic scenario specifies a suite of parameters that define changes in or levels of a number of macroeconomic drivers (e.g. GDP, interest rates and inflation), the Bank specific scenarios
To ensure efficient and adequate mitigation of operational risk, appropriate framework, standards, policies, processes and systems are developed and maintained across the Bank. These are also aided by clear segregation of duties, dual controls, regular checks and effective reconciliations. Additionally, transfer of risk to some extent are carried out through the insurance and outsourcing where relevant.
Insurance policies are purchased to mitigate potential losses associated with operational risk. The Bank, as a subsidiary of the Group, maintains a comprehensive insurance programme as additional protection against potential losses from fraud, theft, loss of physical assets and professional liability claims.
Risks associated with outsourcing arrangements are effectively managed and governed by an outsourcing policy in place, reviewed and approved annually by the Board. Prior to entering into any outsourcing arrangement, the Bank ensures that responsibilities for all outsourcing arrangements are clearly understood, outsourcing objectives are achieved, outsourcing arrangements comply with regulatory requirements and all risks pertaining to outsourcing arrangements have been addressed.
Process validation checks are carried out periodically for the various business units across the Bank. This exercise provides an insight in respect of the controls of the current environment and highlights any gaps that need to be addressed. Results of these exercises are collected and analysed as part of the standard monthly reporting cycle. By this, a permanent enhancement/reinforcement of the processes is ensured. The outcomes of checks carried out last year yielded satisfactory results with no significant findings to report on.
With an objective to increase awareness on operational risk across the Bank, training sessions are held at least annually for all staff across the Bank. The training covers the operational risk framework, business resilience and operational risk standards and policies that have been adopted in-country. It also highlights all the aspects that staff must know to ensure adherence.
MeasurementManagement

BUSINESS REVIEW Management Discussion and Analysis continued
38 Standard Bank Mauritius Annual integrated report 2015
seek to articulate the significant risk concentrations that management perceives in the portfolio; rather than placing reliance on in-depth modelling of economic scenarios which might be prone to model and estimation risks.
Stress testing results inform decision-making at the appropriate management levels, including strategic business decisions of the Board and senior management. Bank wide macroeconomic stress testing is conducted at least twice a year across all major risk types for a range of common scenarios and are also reported at board level. This allows the Bank to monitor its risk profile and risk tendency against its risk appetite.
The appropriateness of the macroeconomic stress scenarios and the severity of the relevant scenarios used for capital planning are approved by the Board and senior management on semi-annual basis.
Business continuity management and resilienceBusiness Continuity Management (BCM) is defined as a holistic management process that identifies potential impacts that threaten the Bank. It provides a framework for building resilience and the capability for an effective response that safeguards the interest of key stakeholders, reputation, brand and value-creating activities.
The Bank has business resiliency and continuity plans in place to ensure its ability to operate on an on-going basis and limit losses on the event of severe business disruptions. These are tested at least twice a year.
Crisis management is based on a streamlined command and control process for managing the business through a crisis to full recovery. These processes may also be deployed to manage non-operational crises, at the discretion of senior management.
The Bank takes all reasonable steps to ensure that in the event of a crisis or disaster, critical business operations and services will be maintained and all business operations and services returned to normal in a planned and prioritised and timely sequence. The Bank continues to ensure that business continuity is managed in an effective manner through a framework of policies, procedures and tools to identify, assess, monitor, control and report such risks.
Whilst each business unit is responsible for their own BCM, closely supported by risk who will provide the governance, steer, oversight and reporting of BCM, there is a BCM forum which meets on a half-yearly basis. This forum is used to make tactical discussions around BCM decisions. It is chaired by head: risk and attended by all business areas coordinators to discuss BCM activities such as reporting, testing, recovery facilities, awareness and simulations among others.
BCM reporting is also well embedded across the Bank. A monthly BCM management information report card provides the minimum standard of what needs to be in place with regards to business continuity, tracks progress and highlights gaps in the BCM programme. This report card is submitted on a monthly basis to head office and also tabled at the relevant risk committees.
Contingency and recovery plans for core services, key systems and priority business activities have been developed and are revisited as part of existing management processes to ensure that continuity strategies and plans remain relevant. The Bank has a fully equipped disaster recovery
site which is also tested twice a year.
Country riskCountry risk, also referred to as cross-border transfer risk, is the uncertainty that a client or counterparty, including the relevant sovereign, will be able to fulfil its obligations to the Group due to political or economic conditions in the host country.
Country risk is managed in accordance with the Group’s risk and model governance standards. All countries to which the Group is exposed are reviewed at least annually. For each of these countries, internal rating models are employed to determine ratings for country, sovereign, transfer and convertibility risk. In determining the ratings, extensive use is made of the Group’s network of operations, country visits and external information sources.
The internal model is continuously updated to reflect economic and political changes to individual countries. The results of this process are compared with those of reputable rating agencies in order to validate the consistency of the risk model.
Compliance riskCompliance risk is the risk of legal or regulatory sanction, financial loss or damage to reputation that may occur as a result of a failure to comply with laws, regulations, codes of conduct and standards of good practice applicable to our financial services activities.
The compliance frameworkThe group compliance function comprises areas of expertise including regulatory support (web based training and regulatory developments), the sanctions desk, the conflicts control room, market abuse surveillance, money laundering and terrorist financing control, and the operational support unit which includes reporting, policy oversight, budgetary management and information technology projects. The Bank does receive and derives full support of group business function.
The scope of the compliance function’s responsibilities includes managing regulatory relationships, advising business on the appropriateness of structures and products from a compliance perspective, and fulfilling an advisory role regarding regulatory expectations. Moreover, the Bank manages its compliance risk in accordance with its compliance governance standard. The compliance function operates independently of business as a second line of defence function. Our approach to managing compliance risk is proactive as a core risk management activity.
Compliance risk is managed at various levels across the Bank:
� Staff training and communication to improve institutional capability
Compulsory compliance training was rolled out during the year followed by mandatory assessment that englobes various key subject matter such as treating customers fairly principles, customer protection legislations, outside business interest, conflicts of interest, code of ethics and values and of course anti-money laundering and sanctions programmes. Compliance training, development and awareness play a key role in the maintenance of a compliance culture in the Bank and the mitigation of compliance risk.
� Compliance manual
The compliance manual provides reference and guidance on relevant compliance risk management matters. The Bank’s compliance manual is not intended to be procedural in nature, but contains information adequate to provide guidance to business units defining staff responsibilities in respect of compliance.

39
� Compliance policy and compliance standards
While the compliance manual provides guidance on key compliance matters, the compliance policy and compliance standards set out the minimum compliance standards that should be adhered to. It is made available to all staffs via the compliance website.
� Regulatory universe
The regulatory universe determines on an annual basis the universe of legislations, guidelines, policies and regulations applicable to each entity in the Bank. It helps manage the compliance risks within each business unit. The methodology to derive the universe is as follows:
� identification of the applicable regulatory requirements;
� categorisation into core, ancillary or imminent; and
� prioritisation of these regulatory requirements into high, medium or low risk.
Business units are thereafter required to ensure that controls are in place within their department to ensure that breaches to any regulations or legislations applicable to them are avoided.
� Compliance monitoring
Monitoring is conducted taking into account the risk profile and circumstances of each business unit. Business operations are monitored on a regular basis to provide appropriate assurance that business is conducted in accordance with regulatory requirements.
� Regulators/supervision
The Bank operates in a highly regulated environment. Supervision is regularly undertaken by both the BoM for activities falling under our banking licence and the financial services commission for the activities falling under the Securities Act of which distribution of financial products and investment advisory. Regulatory interaction takes place between the regulator and the banking industry through various subs committees and the banking committee.
The Bank has enhanced its account opening process and implemented an automated risk grading system thereby strengthening the opening, processing, storage and retrieval of KYC compliance documentation.
� Treating customers fairly/customer complaints
The complexity of financial services offerings continues to evolve and treating customers fairly and educating customers is becoming an important concept in dealing with our customers. The Bank has a set of procedures that is in place to align to regulatory requirements, market environment and to enable customers to provide any positive or negative feedback to the Bank.
� Conflicts of interest
A clear process and policy is in place to manage potential conflicts of interest. Business units must always act with due regards to the interest of customers in potential conflict of interest situations.
� Money laundering control
The Bank has in place a robust business acceptance process to mitigate against the risk of individuals/companies using our system for the laundering of money and has invested heavily in setting up an automated system for account opening with relevant screening tools and risk grading calculator embedded. MLRO tracks suspicious transaction via the automated alert monitoring system which will trigger alerts based on the different rules set to identify any suspicious transaction. Sanction screening on client database takes place on a regular basis.
An Anti-Money Laundering (AML) process manual defining the internal controls and other procedures is in place in order to combat money laundering and terrorism financing. The AML process manual defines the roles and responsibilities of different stakeholders within the Bank.
ReportingRegular reporting of key information is an important risk management tool to ensure the business units are operating within agreed levels of risk appetite, and emerging risks which may potentially impact on the achievement of financial objectives are addressed timeously.
Risk reporting is performed at different levels within the Bank in accordance with different timing requirements dependent on the nature of the information reported. On a monthly basis, reporting of credit, market, compliance and operational risk issues are done at the respective management committees and to the head office.
On a quarterly basis, risk reports are provided to the board risk management and conduct review committee. The summaries of these detailed reports together with an executive summary of risk issues prepared by the head: risk and compliance and head: credit are tabled and discussed at the board risk sub-committee. The Bank also has in place a materiality and escalation matrix where risk tolerances and an escalation procedure for reporting to the appropriate line manager/head office matrix are defined.
Reputational riskSafeguarding the Bank’s reputation is of paramount importance. There is growing emphasis, worldwide on reputational risks arising from compliance breaches, as well as from ethical considerations linked to countries, clients and sectors. The Bank’s compliance framework and processes are designed to minimise the reputational impact of the event giving rise to reputational risk.
The Bank operates in a highly regulated environment. Supervision is regularly undertaken by both the BoM for activities falling under our banking licence and the financial services commission for the activities falling under the Securities Act of which distribution of financial products and investment advisory. Regulatory interaction takes place between the regulator and the banking industry through various subs committees and the banking committee.

BUSINESS REVIEW Management Discussion and Analysis continued
40 Standard Bank Mauritius Annual integrated report 2015
Capital managementThe Bank’s capital management function is designed to ensure that regulatory requirements are met at all times and that the Bank is capitalised in line with the Bank’s risk appetite and target ratios, both of which are approved by the Board. The ultimate objective of capital management is to protect the Bank’s depositors and providers of debt funding and capital from events that could put their funds at risk.
The main regulatory requirements to be complied with are those specified in the Banking Act 2004 and related guidelines which are aligned to Basel II and Basel III.
Basel IIIBasel III is a comprehensive set of reform measures, developed by the Basel Committee on Banking Supervision (BCBS), to strengthen the regulation, supervision and risk management of the banking sector. These measures aim to:
� improve the global banking sector’s ability to absorb shocks arising from financial and economic stress, whatever the source;
� improve risk management and governance; and
� strengthen banks’ transparency and disclosures.
Basel III implementation in MauritiusThe BoM has adopted a phased approach to the implementation of Basel III with the issue of the BoM guideline on scope and application of Basel III and eligible capital. Regulatory capital adequacy is measured through three risk-based ratios:
Common Equity Tier 1 (CET 1): ordinary share capital, share premium and retained earnings divided by total risk-weighted assets.
Tier 1: CET 1 plus perpetual, non-cumulative instruments with principal loss absorption features issued under the Basel III rules divided by total risk-weighted assets. Perpetual non-cumulative preference shares issued under Basel I and II are included in tier 1 capital but are subject to regulatory phase-out requirements over a 10-year period, effective from 1 July 2014.
Total capital adequacy: tier 1 plus other items such as the general allowance for credit impairments and subordinated debt with principal loss-absorption features issued under Basel III divided by total risk-weighted assets. Subordinated debt issued under Basel I and Basel II are included in total capital but are subject to regulatory phase-out requirements, over a 10-year period effective from 1 July 2014.
A transitional arrangement was in place for banks to comply with the Basel III principles on capital, with banks to fully implement these by 2020. Basel III also introduces the concept of Capital Conservation Buffer (CCB) which aims at promoting the conservation of capital and the build-up of adequate buffers above the minimum during normal times (i.e. outside periods of stress) which can be drawn down as losses are incurred during a stressed period.
The Bank has been compliant with the minimum requirements to date.
The calculation of regulatory capital is based on net counterparty exposures after recognising a limited set of qualifying collateral. A prescribed percentage, the risk-weighting of which is based on the perceived credit rating of each counterparty, is then applied to the net exposure.
For exposures that have been rated by approved credit assessment institutions, the process prescribed by the BoM is used to ascribe public issue ratings into comparable assets. For counterparties for which there are no credit ratings available, exposures are classified as unrated and a 100% risk-weighting is applied for determining regulatory capital charge.
The Bank uses the ratings assigned by Fitch to banks to determine the risk-weighting of exposure with banks.
2016 2017 2018 2019 20202015
Bank of Mauritius minimum ratios (capital as a percentage of risk-weighted assets) effective 1 January each year
14.00
12.00
10.00
8.00
6.00
4.00
2.00
0
CET 1¢ ¢ CCB ¢ Additional tier 1 ¢ Tier 2
10
2.50
1.50
6.00
2.00
1.50
6.50
2.63
0.630.88
6.50
3.25
1.250.25
6.50
3.50
1.88
6.50
3.50
2.50
6.50
10 10.62511.25 11.875
12.5
(%)
Capital to risk-weighted assets
2013 2014 2015
¢ Capital Capital to risk-weighted assets
(%)USD’000
1,000 000
900 000
800 000
700 000
600 000
500 000
400 000
300 000
200 000
100 000
0
50
40
30
20
10
0
¢ Risk-weighted assets
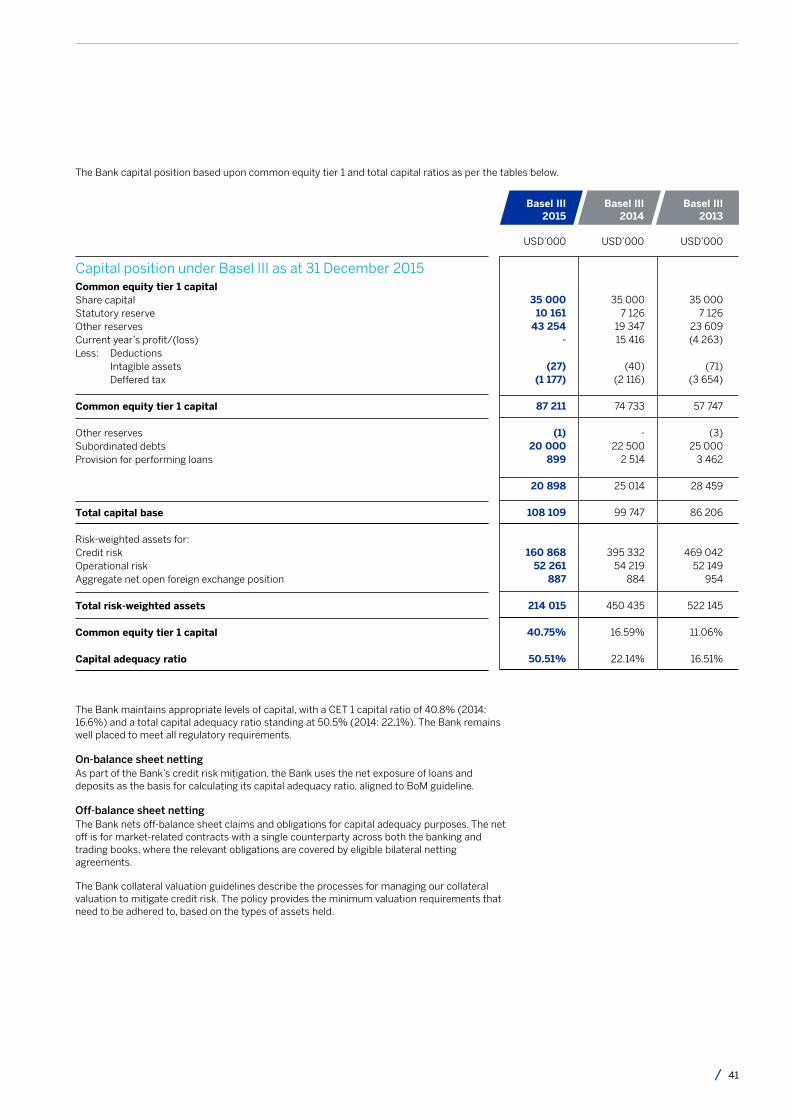
41
The Bank capital position based upon common equity tier 1 and total capital ratios as per the tables below.
The Bank maintains appropriate levels of capital, with a CET 1 capital ratio of 40.8% (2014: 16.6%) and a total capital adequacy ratio standing at 50.5% (2014: 22.1%). The Bank remains well placed to meet all regulatory requirements.
On-balance sheet nettingAs part of the Bank’s credit risk mitigation, the Bank uses the net exposure of loans and deposits as the basis for calculating its capital adequacy ratio, aligned to BoM guideline.
Off-balance sheet netting The Bank nets off-balance sheet claims and obligations for capital adequacy purposes. The net off is for market-related contracts with a single counterparty across both the banking and trading books, where the relevant obligations are covered by eligible bilateral netting agreements.
The Bank collateral valuation guidelines describe the processes for managing our collateral valuation to mitigate credit risk. The policy provides the minimum valuation requirements that need to be adhered to, based on the types of assets held.
Capital position under Basel III as at 31 December 2015Common equity tier 1 capitalShare capitalStatutory reserveOther reservesCurrent year’s profit/(loss)Less: Deductions Intagible assets Deffered tax
Common equity tier 1 capital
Other reservesSubordinated debtsProvision for performing loans
Total capital base
Risk-weighted assets for:Credit riskOperational riskAggregate net open foreign exchange position
Total risk-weighted assets
Common equity tier 1 capital
Capital adequacy ratio
Basel III2015
USD’000
Basel III2014
USD’000
Basel III2013
USD’000
35 00010 161
43 254-
(27)(1 177)
87 211
(1)20 000
899
20 898
108 109
160 86852 261
887
214 015
40.75%
50.51%
35 0007 126
19 34715 416
(40)(2 116)
74 733
-22 500
2 514
25 014
99 747
395 33254 219
884
450 435
16.59%
22.14%
35 0007 126
23 609(4 263)
(71)(3 654)
57 747
(3)25 000
3 462
28 459
86 206
469 04252 149
954
522 145
11.06%
16.51%

BUSINESS REVIEW Management Discussion and Analysis continued
42 Standard Bank Mauritius Annual integrated report 2015
The Bank uses the following collaterals for credit risk mitigation:
� cash – cash collateral which has been deposited on account held with the Bank;� listed shares – shares that are listed on the stock exchange or on a licensed exchange;� fixed or immovable property – residential, commercial and agricultural property taken under a
fixed charge; and� floating/movable assets – plant, equipment and machinery, stock, receivable and other
assets taken under a floating charge.
Under the standardised approach to credit risk, the Bank’s eligible guarantors are sovereign entities, public sector enterprises, banks and securities firms with a lower risk-weight than that of the counterparty.
The following table shows details of mitigations taken by the Bank.
Exposures subject to the standardised approach per risk-weighting as at 31 December 2015
MitigationGuarantee - Standard Bank of South AfricaGuarantee - Local Bank
Total credit risk exposure% exposure covered by bank guarantee
USD’000
9 42295
9 517
1 555 0630.61%
Credit riskOn-balance sheet assets Cash items Claims on sovereigns Claims on banks Claims on central bank Claims on PSE Claims on corporates Past due claims Other assets/fixed assets
Total
Non-market related off-balance sheet risk-weighted assets Direct credit substitute Transaction-related contingent items Trade related contingencies Other commitments
Total
Market related off-balance sheet risk-weighted assets Interest rate contracts Foreign exchange contracts
Total
Total credit risk
Operational riskAggregate net open foreign exchange position
Total risk-weighted assets
2015
Nominalamount
USD’000
2014 2013
--
29 989--
89 29711 2629 758
140 307
8 558349760
4 181
13 848
56 708
6 713
160 868
52 261887
214 015
0-200-100
20-1000-150
20-15020-15050-150
100
20-10020-10020-10020-100
9 4212 234
11 655
11 655
11 655
15617 210
1 262 18429 804
-89 042
7 5369 758
1 415 690
17 9792 9323 801
20 906
45 618
65393 102
93 755
1 555 063
1 555 063
--
42 046--
251 83316 72215 226
325 827
57 9261 017
2 0683 092
64 103
1645 238
5 402
395 332
54 219884
450 435
--
16 636--
356 59730 53918 322
422 094
39 2592 2882 985
-
44 632
7381 578
2 316
469 042
52 149954
522 145
Mitigation Risk-weight%
Risk-weighted assets
USD’000

43
Internal Capital Adequacy Assessment Process (ICAAP)ICAAP considers the qualitative capital management processes within the organisation and includes the organisation’s governance, risk management, capital management and financial planning standards and frameworks. Furthermore, the quantitative internal assessments of the organisation’s business models are used to assess capital requirements to be held against all risks the Bank is or may become exposed to, in order to meet current and future needs as well as to assess the Bank’s resilience under stressed conditions.
The Group has embedded sound internal capital adequacy assessment processes throughout the Group in all its subsidiaries. The Bank is aligned to the Group and has implemented the BoM guideline on supervisory review process since 2011. The ICAAP document is reviewed on an annual basis and is approved by the Board. Periodic reviews are made to ensure that the Bank remains well capitalised after considering all material risks.
The Bank consciously maintains a risk management culture and practices that are conservative and rigorous. It considers that:
� Risk appetite is an integral part of the Bank’s strategy and business plans.
� All material risks are appropriately managed and mitigated and there are back-up action plans that have been identified for execution should the capital levels of the Bank ever fall below levels deemed acceptable by the Board, management, or BoM.
Credit risk consumes approximately 75% of total regulatory capital usage and as such represents the largest source of risk that the Bank is exposed to. Credit risk therefore receives a high degree of management focus, and sufficient resources are assigned to ensure that the risk is mitigated.
Stress testing is conducted using macroeconomic stress scenarios as well as bank specific scenarios based on the composition of the loan book and liquidity profile. Stress testing is performed annually as part of the Bank’s ICAAP process and is updated semi-annually. The Bank reassesses its stress scenarios on a yearly basis. For 2014, the Bank used the following stress scenarios:
i) Macroeconomic stress scenarios;
� Risk aversion hits Africa markets
� Commodities stress
ii) Management expertise stress scenarios;
� Credit stress - single obligor default assessed
� Liquidity stress – impact of removing sovereign wealth fund from depositor base
Capital buffers are considered adequate. While stress results for capital adequacy are within requirements, the Bank will nonetheless remain alert to possible deterioration of economic conditions to trigger a re-assessment of capital levels and initiate early remedial action should circumstances dictate.
Stress results are analysed and any departure from our risk appetite statement will trigger mitigating actions.
The Bank’s sets its risk appetite to ensure that it achieves its strategic objectives without taking on levels of risk that are too high when considering all its stakeholders’ interests. It reflects the capacity to sustain losses and continue to meets its obligations as they fall due, under a range of stress conditions. The Bank’s risk appetite statement is made up of four dimensions:
� regulatory total capital adequacy ratio;
� stressed earnings;
� liquidity; and
� unacceptable risk.
For the purposes of ICAAP, the Bank maintains a capital buffer of 2% above the regulatory requirement.
Related party transactionsAll exposures to related parties are reported at the risk management/conduct review committee. As per BoM guideline on related party transactions, a “related party” means:
� a person who has significant interest in the financial institution or the financial institution has significant interest in the person;
� a director or senior officer of the financial institution;
� close family members of the above;
� an entity that is controlled by a person described above; and
� a person or class of persons who has been designated by the BoM as a related party.
The Bank adheres to the BoM guideline on related party transactions as well as group policy with regards to related party.
The Bank did not have any non-exempt related party exposure as at 31 December 2015.
The Bank has exempted related party exposure with members of the Group as part of interbank transactions in relations to its treasury operations.
A detailed analysis of related party transactions in the notes to the accounts is available on page 154.

PeopleWe are committed to creating a
great place to work where our people feel deeply connected with
our purpose and our clients, are empowered and recognised for
delivering against our strategic objectives, and have made the most of
every opportunity to achieve their full potential.
44 Standard Bank Mauritius Annual integrated report 2015
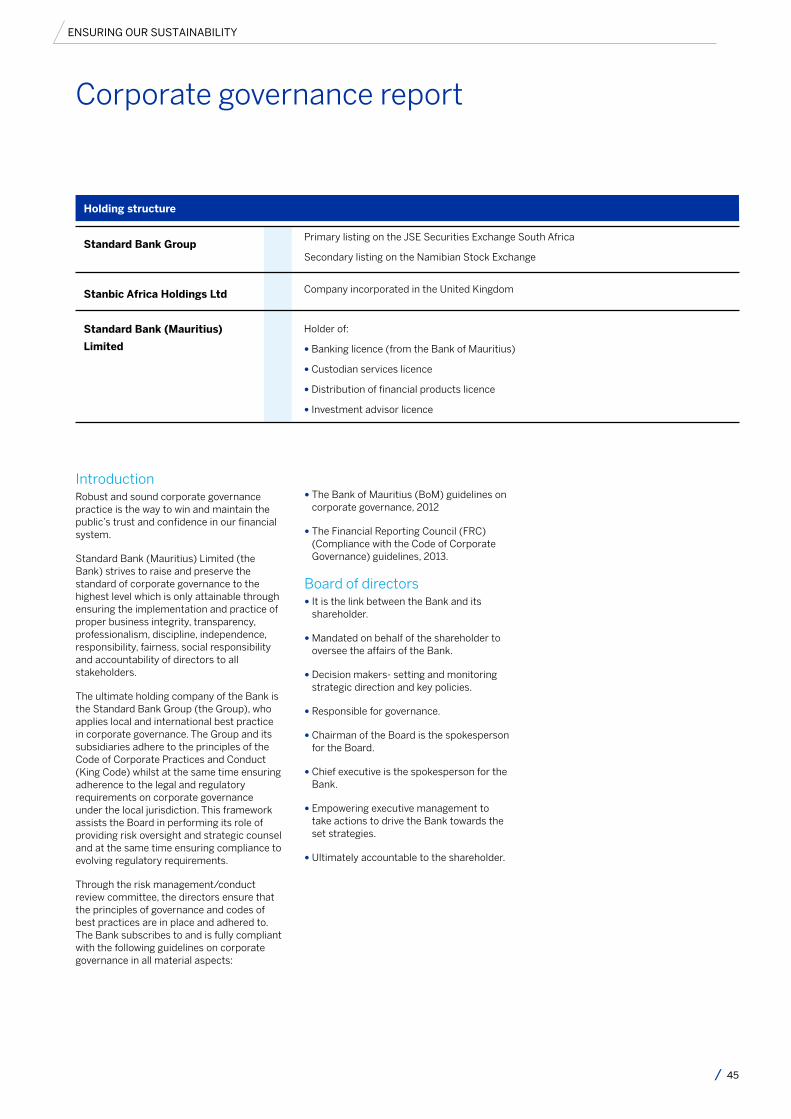
45
Corporate governance report
ENSURING OUR SUSTAINABILITY
Primary listing on the JSE Securities Exchange South Africa
Secondary listing on the Namibian Stock ExchangeStandard Bank Group
Company incorporated in the United KingdomStanbic Africa Holdings Ltd
Holder of:
� Banking licence (from the Bank of Mauritius)
� Custodian services licence
� Distribution of financial products licence
� Investment advisor licence
Standard Bank (Mauritius)
Limited
Introduction Robust and sound corporate governance practice is the way to win and maintain the public’s trust and confidence in our financial system.
Standard Bank (Mauritius) Limited (the Bank) strives to raise and preserve the standard of corporate governance to the highest level which is only attainable through ensuring the implementation and practice of proper business integrity, transparency, professionalism, discipline, independence, responsibility, fairness, social responsibility and accountability of directors to all stakeholders.
The ultimate holding company of the Bank is the Standard Bank Group (the Group), who applies local and international best practice in corporate governance. The Group and its subsidiaries adhere to the principles of the Code of Corporate Practices and Conduct (King Code) whilst at the same time ensuring adherence to the legal and regulatory requirements on corporate governance under the local jurisdiction. This framework assists the Board in performing its role of providing risk oversight and strategic counsel and at the same time ensuring compliance to evolving regulatory requirements.
Through the risk management/conduct review committee, the directors ensure that the principles of governance and codes of best practices are in place and adhered to. The Bank subscribes to and is fully compliant with the following guidelines on corporate governance in all material aspects:
� The Bank of Mauritius (BoM) guidelines on corporate governance, 2012
� The Financial Reporting Council (FRC) (Compliance with the Code of Corporate Governance) guidelines, 2013.
Board of directors� It is the link between the Bank and its
shareholder.
� Mandated on behalf of the shareholder to oversee the affairs of the Bank.
� Decision makers- setting and monitoring strategic direction and key policies.
� Responsible for governance.
� Chairman of the Board is the spokesperson for the Board.
� Chief executive is the spokesperson for the Bank.
� Empowering executive management to take actions to drive the Bank towards the set strategies.
� Ultimately accountable to the shareholder.
Holding structure

Corporate Governance Report continued
46 Standard Bank Mauritius Annual integrated report 2015
ENSURING OUR SUSTAINABILITY
Currently, the Board comprises of 7 members with a suitable breadth of backgrounds and professional experience from the financial, legal, accounting and commercial sectors, and the structure is as follows:
On 9 February 2016, Mr Clive Robert Tasker has been appointed as non-executive director and on 4 March 2016, Mrs Marie Desirée Jean Lim Kong joined the board of directors as an independent director.
The strong presence of independent and non-executive directors on the Board brings objective, unfettered and independent judgement to the Board. The composition of the Board and its committees is regularly reviewed to ensure that the balance and mix of diversity is maintained and that the Board retains its effectiveness at all times.
Chairman and chief executive Whilst the chairman and chief executive are collectively responsible for the leadership of the Bank and for promoting the highest standards of integrity and probity, there is a clear and effective division of accountability and responsibility between the chairman and the chief executive. These roles are carried out by two different persons and each plays a distinctive role but complementing each other to ensure that there is a balance of power and authority and no individual has unfettered powers of decision and control.
The chairman provides leadership and governance of the Board so as to create the conditions for overall board’s and individual director’s effectiveness, and ensures that all key and appropriate issues are discussed by the Board in a timely manner. The chairman ensures that all members of the Board are provided with timely, adequate and accurate information and that the strategies and policies adopted by the Board are effectively implemented by the chief executive and management.
The chief executive shoulders the responsibility for the execution of the day-to-day running of the Bank’s affairs. He develops and proposes the Bank’s strategies and policies for consideration by the Board. He runs the daily business supported by the executive committee which he chairs.
Board of directors François GAMET
Georges LEUNG SHING
Louis RIVALLAND (Chaiman)
Michele AH SEE
Lakshman BHEENICK (Chief Executive)
Duncan WESTCOTT
Stephen SCALI
Executive directors
Non-executive directors
Independent directors

47
Personal Profile� Aged 43
� Holder of a BA (Hons) In Economy from University of Manchester (England) in 1995
Current� Appointed executive director on 18 May 2010
� Chief executive of Standard Bank (Mauritius) Limited
� Also assumes the role of head: corporate and investment banking at the Bank
Personal Profile� Aged 49
� Holder of a MA (ord) from University of Aberdeen (Scotland)
� Member of the Institute of Chartered Accountants of England and Wales
Current� Appointed as executive director on 17 February 2014
� Joined Standard Bank (Mauritius) Limited in February 2009
Executive directors
Lakshman BHEENICK
Michele AH SEE
Chief Executive
Executive Director
�Joined Standard Bank (Mauritius) Limited in June 2006 as head: global markets
Previous� Worked for Barclays Bank Plc where he
successfully lead the debt capital issuance in Mauritius and Botswana
� Occupies the post of head: risk and compliance at the Bank
Previous� Worked 10 years for the State Bank of
Mauritius. Headed the value management office, the credit underwriting division and the corporate banking division
� Worked for Somers Baker in UK and PricewaterhouseCoopers Mauritius in audit
The executive directors are members of the Board who are also in full time employment with the Bank.

Corporate Governance Report continued
48 Standard Bank Mauritius Annual integrated report 2015
ENSURING OUR SUSTAINABILITY
Personal Profile
� Aged 45
� Holder of a Bachelor Degree In Actuarial Sciences and Statistics
� Fellow of the Institute of Actuaries of United Kingdom
� Fellow of the Institute of Actuaries of South Africa
Current
� Appointed as non-executive director in 2007
� Appointed chairman of Standard Bank (Mauritius) Limited since April 2010
� Group chief executive of Swan Insurance and the Anglo Mauritius Assurance Company and their subsidiaries
Personal Profile
� Aged 46
� Holder of a Master’s Degree in Finance from Ecole De Commerce Sup de Co Amiens in France
Current
� Appointed as non-executive director in February 2014
� Member of the board risk management/conduct review committee and the board credit committee
� Currently the chief executive officer of Standard Advisory (China) Limited
Non-executive directorsIn accordance with the BoM guidelines on corporate governance (2012), an annual review of all directors having served for more than six years is carried out to ascertain independence of such directors and ensure that such directors are fit and proper to continue to act on the Board, as non-executive directors instead of independent directors.
After his six years as an independent director, Mr Louis Rivalland was supported by the Board to act as a non-executive director and maintains his role of chairman of the board of directors.
Mr François Gamet also qualifies as non-executive director of the Bank.
Louis RIvALLAND
François GAMET
Chairman
Non-Executive Director
� Member of the board of directors of some major institutions in some other countries
Previous
� Served as president of the Joint Economic Council
� Served as president of the Insurers’ Association of Mauritius.
� Previously board member of the Mauritius Revenue Authority
� Former member of the Financial Services Consultative Council
Previous
� Held the following positions within the Standard Bank Group: head: West Africa and Mauritius and head: corporate and investment banking at Standard Bank Russia
� Previously worked as global head: power and infrastructure and director energy finance at Standard Bank Plc in England
� Employed as investment manager and Head of infrastructure with Actis in the United Kingdom
� Served as director of Globeleq, in Houston, USA

49
Independent directors
Personal Profile
� Aged 65
� Holder of a BSc Economics from the University of Wales
� Fellow of the Institute of Chartered Accountants in England and Wales
Current
� Appointed independent director in September 2010
� Appointed chairman of board risk management/conduct review committee
Personal Profile
� Aged 70
� Holder of a BSc Economics from the University of London
� Fellow of the Institute of Chartered Accountants in England and Wales
� Associate of the Chartered Institute of Taxation in England and Wales
Current
� Appointed independent director in January 2011
Duncan WESTCOTT
Georges LEUNG SHING
Chairman of Board Risk Management/Conduct Review Committee
Chairman of Board Audit Committee
� Currently presides as the CFO of Shout it Now (an aids awareness NGO based in Cape Town, South Africa)
Previous
� Previously a partner of PricewaterhouseCoopers in South Africa
� Appointed chairman of board audit committee
� Member of the board of the risk management/conduct review committee
� Member of the board of directors of several other institutions
Previous
� Served as president of the Mauritius Chamber of Agriculture and the Mauritius Sugar Producers Association
Personal Profile
� Aged 60
� Holder of a BA LLB from the University of Natal, Pietermaritzburg
� Holder of an Advanced Management Programme from Wharton Business School University of Pennsylvania.
Current
� Appointed non-executive director in February 2016
Clive TASKER
Non-Executive Director
Previous
� Chief executive Standard Bank Africa from March 2008 to December 2011
� Head: corporate banking international, corporate and investment banking, Standard Bank Group from January 2012 to December 2012
� CEO for Standard Advisory (China) Limited, a position he occupied from January 2013 until his retirement in September 2015

Corporate Governance Report continued
50 Standard Bank Mauritius Annual integrated report 2015
ENSURING OUR SUSTAINABILITY
Personal Profile
� Aged 43
� Holder of a Juris Doctor from Harvard Law School, USA
� Holder of a MA in Industrial Relations from the University of Warwick in England
� Admitted to the New York Bar in 2002
� Non-practising solicitor of England and Wales
Current
� Appointed independent director in June 2011
Personal Profile
� Aged 43
� Holder of a BA (Hons) Accounting & Finance from the University of Leeds
� Chartered Accountant
Current
� Appointed independent director in March 2016
Stephen SCALI
Desirée LIM KONG
Chairman of Board Credit Committee
Independent Director
� Appointed chairman of board credit committee
� Member of board audit committee
� Head of the Mauritius Office of Conyers Dill and Pearman
Previous
� Acted as in-house legal counsel at vodafone Group Plc and Merrill Lynch
� Served as chief executive of an International Trust Company in Mauritius
Previous
� Worked as head of finance and IT at Etoile d’Orient Group of Companies
� Held the position of account executive in the corporate banking business unit and assistant manager in the credit risk business unit of the Mauritius Commercial Bank Ltd

51
Appointment of directors
Company secretary
Director
Company secretary
Appointed by the shareholder at the annual meeting held in March every year
Provides guidance to the Board
Bank’s constitution provides for annual re-election of all directors
Ensures the Board remains cognisant of its duties and responsibilities
After six years of tenure, a director no longer qualifies as an independent director
Informs the Board of relevant changes in legislations and governance best practices
No limits on the number of times a director may stand for re-election
Oversees the induction of new directors
Directors’ remuneration are decided at the board of directors and approved by the shareholder
Training of directors
Independent directors and qualifying non-executive directors receive fixed fees for service on the Board and board committees

Corporate Governance Report continued
52 Standard Bank Mauritius Annual integrated report 2015
ENSURING OUR SUSTAINABILITY
Role and duties of the BoardThe Board is collectively responsible for the long-term success of the Bank and delivery of sustainable shareholder value. Its role is to provide leadership of the Bank within a framework of prudent and effective controls which enables risks to be assessed and managed.
� Regular interaction between the Board and executive management.
� Senior executive committee members are requested to make presentations as required.
� Directors have free and unrestricted access to management team and to the Bank’s information.
� Directors are provided with the services of external legal advisers when required.
� Succession planning is an integral part of ensuring effective management.
� There is an ongoing requirement to strengthen the talent pool to ensure adequate succession in the short or long-term.
� Ongoing board education remains a focus: directors are kept abreast of all applicable legislations and regulations, changes to rules, standards and codes, as well as relevant sector developments that could affect the Bank and its operations.
� In the course of 2015, some directors attended a workshop on board performance and evaluation delivered by the Mauritius Institute of Directors, an orientation program for directors delivered by the compliance executives of the Group and duly approved by the BoM.
� Annual assessment of the Board is conducted against the objectives set.
� Board assessment is made to review and further the Board’s effectiveness.
� New points for implementation are recorded.
� Performances of the chairman, chief executive, independent directors and company secretary are assessed annually.
� Assessment of the Board and its committees are also carried out annually in terms of structure, process and effectiveness.
� In 2015, individual questionnaires were completed, the consolidated feedback tabulated and discussed at the board meeting in November 2015. No major concern has been highlighted.
� An overall positive collective performance has been noted.
� The Group has its own set of values and code of ethics (the code).
� The Board strives to ensure effective management in line with the code.
� The code seeks to empower employees and support responsible decision making at all levels.
� The aim is to adhere to the highest set of standards for responsible business practice.
� The code details acceptable and unacceptable practices.
� Ethical incident reporting is encouraged and supported.
� The Bank adhered to the code in conjunction with the 2013 Code of Ethics of the Mauritius Bankers Association.
� Map out the Bank’s goals and plans for achieving those goals.
� Ensures that any action is aligned to the Bank’s values, performance and sustainability.
� Continuously monitor financial performance.
� Annually review and approve major changes to relevant Bank’s policies.
� Ensure that an adequate budget and planning process exists.
� Approve budgets.
1. Access to information and resources
5. Succession planning
2. Training
3. Board effectiveness and evaluation
4. Ethics and organisational integrity
6. Strategy

53
� Ensure proper and effective risk management procedures are adhered to.
� Responsible for financial, operational and internal control systems.
� Ensure proper adherence to compliance policies and procedures.
� Provide adequate reporting to stakeholders on the Bank’s compliance status.
� Continue to implement board succession plans
� Consider the impact of regulatory changes
� Measure progress against strategic objectives
� Continue to monitor the Bank’s operational and financial performance
� Annual review of corporate governance procedures.
� Annual assessment of achievements against set objectives.
� Delegate power, authorities and discretions to the chief executive and sub-committees for efficient decision making process.
� Define terms of reference and procedures to be followed by all board sub-committees.
� Assess performance of chief executive and management team.
� Assess and considers reports from management team.
� Propose to shareholder for approval, the remuneration of independent and qualifying non-executive directors.
� Approve external auditor’s fees following recommendation from board audit committee.
� Review matters such as code of ethics, environmental and social issues.
� Dividends paid by the Bank are an integral part of the capital management process. Capital that is surplus to business operational requirements must be declared and paid as dividend.
7. Risk and compliance
8. General governance
9. Dividend policy
The year ahead

Corporate Governance Report continued
54 Standard Bank Mauritius Annual integrated report 2015
ENSURING OUR SUSTAINABILITY
Board audit committee
Assists the Board in discharging its responsibilities for monitoring the quality of the financial statements of the Bank. It reviews the accounting policies, financial reporting and regulatory compliance practices of the Bank and the Bank’s system and standards of internal controls, and monitors processes for internal audit and external audit.
Reviewing of audit plans with external auditors;
consider with management areas of concern and procedures being implemented to monitor and resolve those issues;
assess reports from external auditors with regard to deviations and weaknesses in accounting and operational controls and ensure that any issues are resolved promptly;
obtaining comfort from external auditors that proper accounting records are being kept;
ensure adequate capital and provisions for bad debts and assess the formulae applied by the Bank to calculate charges and levels of general debt within the framework of the Group’s policy;
review accounting process/policies set up by the Bank, effect any change as considered necessary and appropriate to accommodate best practices and consider the adequacy of disclosures;
assess the performance of financial management and review the quality of internal accounting control systems and reports produced by financial management;
assess reports on major misappropriation and other operational risks;
review interim and audited annual financial statements and other financial information required to be submitted to shareholder;
introduce measures to improve the credibility and objectivity of the Bank’s financial statements and reports;
evaluate significant alterations from the audit and the efficiency of major adjustments processed at year-end;
review the basis on which the Bank has been determined a going concern and make a recommendation to the Board;
evaluate reports produced by the internal audit departments of the Group detailing the adequacy and overall effectiveness of the Bank’s internal audit function and its implementation by management;
assess audit mandate on an annual basis;
review the Bank’s compliance plan, with specific reference to the procedures for identifying regulatory risks and controlling their impact on the Group as well as ensuring that the Bank’s policy complies with relevant regulatory and legal requirements;
Summary of key terms of reference
Board audit committee Duncan WESCOTT
Georges LEUNG SHING (Chairman)
Stephen SCALI

55
discuss reports and letters received from the banking supervisory authorities and/or other regulatory bodies and management’s responses thereto with regards to compliance and the duties and responsibilities of the board of directors of the Bank;
monitor compliance with relevant legislations;
consider reports by the executive management on measures implemented to ensure compliance with the statutes, internal policies and procedures and controls, including accounting systems and record keeping controls, information systems and technology controls, internal audit processing, management information systems and reports applied to the day-to-day management of the business and review the internal control structure including financial control, accounting systems and reporting;
assess and advise on potential conflicts of interest of a material nature;
review complaints handling and complaints reporting procedures; and
undertake any other such reviews as may be required by the Board to ensure that the committee is fulfilling its responsibilities.
� Continue to monitor internal financial controls and key accounting developments that are likely to affect the Bank
� Continue to monitor the activities of external audit, internal audit and compliance as they pertain to the regulatory and internal control environment of the Bank
� Review reports from management
The year ahead
Summary of key terms of reference
In line with the realities of risk, regulation, technology and competition that
characterise our operating context, we continue to invest significantly in our
diversified operations, our people and culture, our systems and infrastructure, and our brand.
Photo: Mozambique

Corporate Governance Report continued
56 Standard Bank Mauritius Annual integrated report 2015
ENSURING OUR SUSTAINABILITY
Risk management/conduct review committee Provides oversight and advice to the Board on current and potential future risk exposures of the Bank and future risk strategy. It reviews the Bank’s compliance with approved risk appetite and oversees the operation of the Bank’s policy framework and submissions to regulators.
Consider legal issues that could have a significant impact on the Bank’s business;
assess reports from compliance manager(s) with regards to matters pertaining to legislations, regulations and reputational risks;
evaluate management reports detailing the efficacy of the risk management procedures, their implementation throughout the Bank and any recommendations to be implemented;
monitor external developments with regards to the practice of corporate accountability and the reporting current, emerging and prospective risks;
seek such independent professional advice as necessary to perform its duties;
evaluate efficacy of insurance coverage;
recommend risk philosophy, strategy and policies for approval and adoption by the board audit committee and the board of directors and ensuring that these are in line with the Bank’s policy;
ensure compliance overall risk profile of the Bank;
review procedures dealing with related party transactions, the disclosure of information to customers, the resolution of customer complaints and compliance with the Group’s code of Banking practice and ethics;
have due regard for the principles of governance and codes of best practice; and
ensure that the chief executive facilitates training programmes for directors and senior management to enable them to have a robust understanding of the nature of the business, the nature of the risks, the consequences of risks being inadequately managed and the techniques for managing the risks effectively.
Summary of key terms of reference
� Continue to monitor the current and future risk profile of the Bank to ensure the Bank is managed within risk appetite relative to strategy
� Continue to monitor capital adequacy of the Bank and review the impact of significant transactions on capital
The year ahead
Risk management/conduct review committee
Lakshman BHEENICK
Duncan WESCOTT (Chairman)
Georges LEUNG SHING
François GAMET
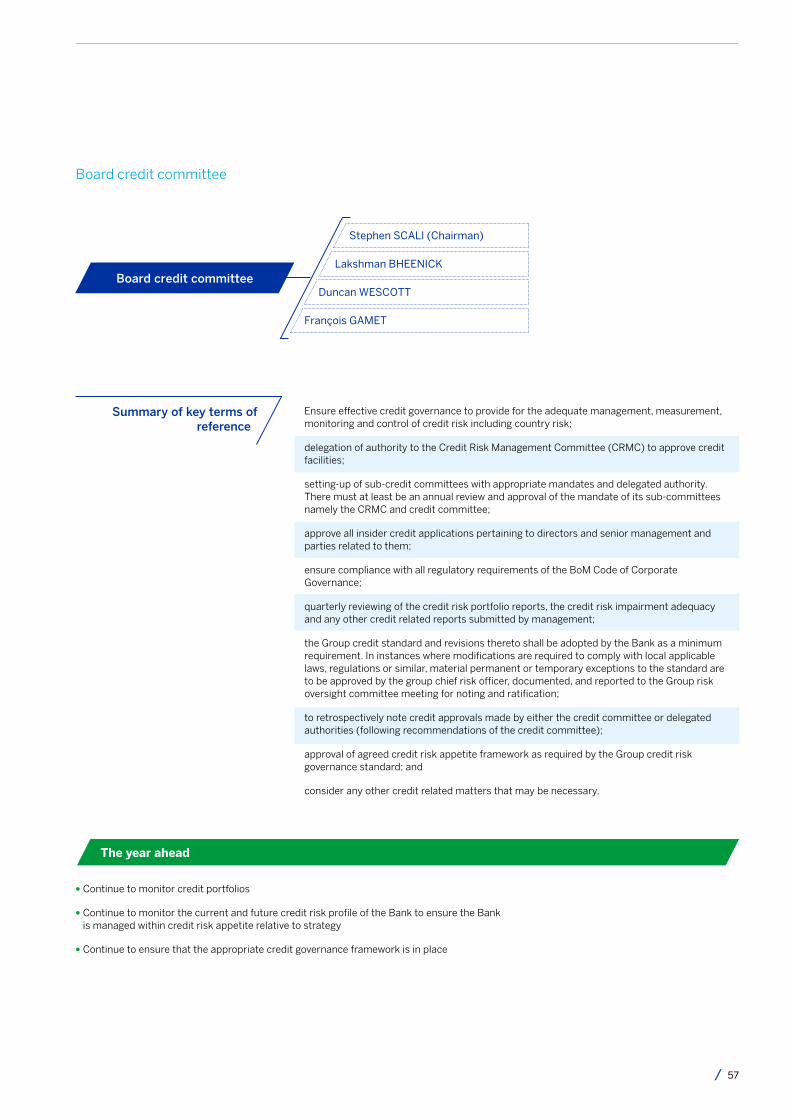
57
Board credit committee
Ensure effective credit governance to provide for the adequate management, measurement, monitoring and control of credit risk including country risk;
delegation of authority to the Credit Risk Management Committee (CRMC) to approve credit facilities;
setting-up of sub-credit committees with appropriate mandates and delegated authority. There must at least be an annual review and approval of the mandate of its sub-committees namely the CRMC and credit committee;
approve all insider credit applications pertaining to directors and senior management and parties related to them;
ensure compliance with all regulatory requirements of the BoM Code of Corporate Governance;
quarterly reviewing of the credit risk portfolio reports, the credit risk impairment adequacy and any other credit related reports submitted by management;
the Group credit standard and revisions thereto shall be adopted by the Bank as a minimum requirement. In instances where modifications are required to comply with local applicable laws, regulations or similar, material permanent or temporary exceptions to the standard are to be approved by the group chief risk officer, documented, and reported to the Group risk oversight committee meeting for noting and ratification;
to retrospectively note credit approvals made by either the credit committee or delegated authorities (following recommendations of the credit committee);
approval of agreed credit risk appetite framework as required by the Group credit risk governance standard; and
consider any other credit related matters that may be necessary.
Summary of key terms of reference
� Continue to monitor credit portfolios
� Continue to monitor the current and future credit risk profile of the Bank to ensure the Bank is managed within credit risk appetite relative to strategy
� Continue to ensure that the appropriate credit governance framework is in place
The year ahead
Board credit committeeLakshman BHEENICK
Stephen SCALI (Chairman)
Duncan WESCOTT
François GAMET

Corporate Governance Report continued
58 Standard Bank Mauritius Annual integrated report 2015
ENSURING OUR SUSTAINABILITY
There is in place a board audit committee. There is no sub-committee of the Board on corporate governance matters. All corporate governance matters are tabled at full board and there is a standing item on corporate governance on the Board’s agenda. There is no requirement to have a separate corporate governance committee under BoM guidelines on corporate governance and as the Bank is a 100% subsidiary company, it is felt that this can be taken at the main board.
Board and committee meetingsA board meeting is held every quarter with an additional annual meeting to consider the Bank’s strategy. Ad hoc meetings are called if and when necessary. Directors are provided with comprehensive board documentation at least four days prior to each of the scheduled meetings.
Codes, regulations and complianceOne fundamental principle of the Bank is to comply with all legislations, regulations and codes in its journey to achieve its goals. Compliance is assessed via management reports.
The Bank networks with regulators and other stakeholders when applying legislative and regulatory controls. The Bank aims to ensure that regulatory requirements are embedded in the Bank’s operations in a way that drives long-term business value.
Louis RIvALLAND2 (Chairman) 6/6
Lakshman BHEENICK1 6/6
Michele AH SEE1 6/6
François GAMET2 3/6
Stephen SCALI3 5/6
Georges LEUNG SHING3 6/6
Duncan WESTCOTT3 6/6
Duncan WESCOTT3 (Chairman) 4/4
Lakshman BHEENICK1 4/4
Michele AH SEE1 N/A
Louis RIvALLAND2 N/A
François GAMET2 3/4
Stephen SCALI3 N/A
Georges LEUNG SHING3 4/4
Georges LEUNG SHING3 (Chairman) 5/5
Lakshman BHEENICK1 N/A
Michele AH SEE1 N/A
Louis RIvALLAND2 N/A
François GAMET2 N/A
Stephen SCALI3 5/5
Duncan WESTCOTT3 5/5
Stephen SCALI3 (Chairman) 4/4
Lakshman BHEENICK1 4/4
Michele AH SEE1 N/A
Louis RIvALLAND2 N/A
François GAMET2 2/4
Georges LEUNG SHING3 4/4
Duncan WESTCOTT3 4/4
1 Executive director2 Non-executive director3 Independent director
1 Executive director2 Non-executive director3 Independent director
1 Executive director2 Non-executive director3 Independent director
1 Executive director2 Non-executive director3 Independent director
Board ofdirectors
Risk management/ conduct review committee
Board auditcommittee
Board creditcommittee
Board of directors-meeting attendance

59
Dealing in securities, conflicts of interests and related party transactionsIn its quest to ensure that business is conducted professionally and in an ethical manner, the Group has implemented guidelines to restrict directors and embargoed employees from dealing in its securities.
A personal account trading policy was introduced to prevent directors and employees from trading in securities during closed periods. Continuous compliance with the policy is ensured and any breaches of policy are dealt with in line with the provisions of the policy and JSE listings requirements.
A further conflict of interest policy has been applied requiring directors and employees to disclose any conflict of interest situation including disclosure of any directorships held in any other legal entity.
All transactions with a related party are carried out on terms and conditions that are at least favourable to the Bank at market terms and conditions. The risk management/conduct review committee is responsible to monitor and review related party transactions.
All transactions with a related party are carried out on terms and conditions that are at least favourable to the Bank at market terms and conditions. The risk management/conduct review committee is responsible to monitor and review related party transactions.
Directorship held in listed companies is as follows:
Relationships with shareholdersThe board of directors has the important role of overseeing management performance on behalf of shareholders.
Shareholders necessarily have little voice in the day-to-day management of corporate operations, but have the right to elect representatives (directors) to look out for their interests and to receive the information they need to make investment and voting decisions.
Connecting with our stakeholdersOur relevance to the markets and societies in which we operate depends on continued and meaningful engagement with all our stakeholders. The Bank’s stakeholder management approach involves the application of the Bank’s resources to build and maintain good relationships with stakeholders. This helps the Bank to understand the expectations of society, minimising reputational risk and form strong partnerships all of which support commercial sustainability.
Shareholder feedback and concernsIn order to receive feedback from shareholders and to deal with any concern that they might have the Bank has set up specific procedures.
Louis RIvALLAND
Georges LEUNG SHING
Duncan WESTCOTT
Stephen SCALI
Lakshman BHEENICK
Michele AH SEE
François GAMET
Air Mauritius Limited, ENL Land Limited, Ireland Blyth Limited, New Mauritius Hotels Ltd, Swan General Ltd
Omnicane Ltd and The Mauritius Development Investment Trust Co Ltd
Nil
Nil
Nil
Nil
Nil
Names of companiesNames of directors

Corporate Governance Report continued
60 Standard Bank Mauritius Annual integrated report 2015
ENSURING OUR SUSTAINABILITY
SustainabilityManagement of the Group’s economic, social and environmental impacts and responsibilities most effectively is being systematically entrenched in the Group's culture through the emphasis placed on the application of the Group’s vision and values in all its operations. The monitoring and reporting of sustainability issues is an evolving discipline within the Group. The Group’s annual sustainability report provides comprehensive commentary on the Group’s sustainability and transformation efforts, as well as key non-financial performance indicators. The report aims to present a balanced view and disclose relevant and material information to the Group’s stakeholders. The Group’s sustainability report is guided by the Global Reporting Initiative’s (GRI) G3 sustainability reporting guidelines and the Group reports against the indicators in the GRI financial services sector supplement.
Going concernOn the recommendation of the board audit committee, the Board annually considers and assesses the going concern basis for the preparation of financial statements at the year end. At the interim reporting period, a similar process is followed to enable the Board to consider whether or not there is sufficient reason for this conclusion to be affirmed.
Shareholders’ calendar
Financial year end
Annual general meeting of shareholders
Publication of financial statements
Annual report
Quarterly unaudited financial statements
31 March quarter end
30 June quarter end
30 September quarter end
December
March
March
June
September
December
We have financial solutions for every banking need to help connect you to a world
of opportunity.
Photo: Nigeria

61
Executive management
Profile�Joined Standard Bank(Mauritius) Limited in June 2006 as head: global markets
� Chief executive of Standard Bank (Mauritius) Limited
�Also assumes the role of head: corporate and investment banking at the Bank
� Appointed executive director on 18 May 2010
� Holder of a BA (Hons) In Economy from University of Manchester
Profile� Joined Standard Bank (Mauritius) Limited in February 2009
� Occupies the post of head: risk and compliance at the Bank
� Appointed as executive director on 17 February 2014
� Holder of a MA (ord) from University of Aberdeen (Scotland)
� Member of the Institute of Chartered Accountants of England
Profile � Joined Standard Bank (Mauritius) Limited in 2001 as financial manager
� Acceded to head: finance in 2006
� Fellow member of the Association of Chartered Certified Accountants (FCCA)
� Debuted her career in audit and taxation with Kemp Chatteris, Clay Ratnage Chartered Accountants in London
Lakshman BHEENICK
Michele AH SEE
Nathalie POMPON-NEMORIN
Chief Executive
Head: Risk and Compliance
Chief Financial Officer
(England) in 1995
� Worked for Barclays Bank Plc where he successfully lead the debt capital issuance in Mauritius and Botswana
and Wales
� Worked 10 years for the State Bank of Mauritius. Headed the value management office, the credit underwriting division and the corporate banking division
� Worked for Somers Baker in UK and PricewaterhouseCoopers Mauritius in audit
� Previously worked at Investec Bank (Mauritius) Ltd

Corporate Governance Report continued
62 Standard Bank Mauritius Annual integrated report 2015
ENSURING OUR SUSTAINABILITY
Profile � Joined Standard Bank (Mauritius) Limited in 2011 as head: global markets
� Holder of an MBA from the City University Business School (UK) and a Master in International Economics and
Finance from Brandeis University (USA)
� Fellow member of the Association of Chartered Certified Accountants (FCCA)
Profile � Joined Standard Bank (Mauritius) Limited in February 2014 as head: corporate banking and transactional
products and services
� Holder of a BSc (Hons) Economics from Loughborough University (UK)
� Previously worked and held various positions such as group treasurer and head of eBusiness division at the State Bank of
Meenakshi SANDRASAGREN
Daniel NG TSEUNG
Head: Global Markets
Head: Corporate Banking and Transactional Products and Services
� Previously employed at Air Mauritius as head of treasury for a period of thirteen years
� Worked for MEDIA as financial controller
� Work for De Chazal Du Mée and Philips ELL & Gross
Mauritius
� Also previously employed as treasurer at the Hongkong and Shanghai Banking Corporation (HSBC)
Profile � Joined Standard Bank (Mauritius) Limited in August 2014 as head: wealth and investment
� Holder of a bachelor degree with Honours in Electronics and Telecom Engineering from the University of Mumbai
and a Masters in Business Administration from the Indian Institute of Management Ahmedabad
� Currently enrolled and has completed levels I and II of a Chartered Financial Analyst course
� Previously chief executive officer of Credere Wealth Management in London
vikrant BHALERAO
Head: Wealth and Investment
� Previously held the position of associate director at Clariden Leu AG, Clariden Leu Europe, Private Banking, London
� Worked for Bank of America, Principal Investing Group, Asia for a period of five years and BNP Paribas Private Bank, Mumbai, India for a period of 3 years as an investment advisor.

63
Profile � Joined Standard Bank (Mauritius) Limited in 2006 as head: credit
� Holder of a BSc (Hons) in Financial Services from University of Manchester
� Associate of IFS School of Finance (formerly Chartered Institute of Bankers) ACIB UK
� Member of the Mauritius Institute of Bankers.
Neekeea RAMEN
Head: Credit
� Worked for 17 years at the State Bank of Mauritius in the retail, corporate banking and international trade finance division
� In 2004, joined the Mauritius Post and Cooperative Bank Ltd (MPCB) as head of corporate with assignment of setting up and managing the corporate banking
Profile � Joined Standard Bank (Mauritius) Limited in April 2005
� Appointed regional CIB head of operations: West Africa and Francophone Region
� Holder of a BSc (Hons) in Information Technology from the British Computer Society
Robin vEERAPEN
Head: Operations
� Previously worked at the State Bank of Mauritius and Hongkong and Shanghai Banking Corporation (HSBC) for 14 years
Profile � Joined Standard Bank (Mauritius) Limited in 2010 as corporate lawyer
� Holder of an LLB (Hons) from the University of Mauritius, an LLM in Commercial and Corporate Law from the
University of London and a diploma in French Law from the Université de Droit, d’Economie et des Sciences D’Aix en
Provence
Reshmee A KISTNAMAH
Head: Legal and Company Secretary
� Previously worked at Harel Mallac Group in charge of the legal and corporate secretarial department

Corporate Governance Report continued
64 Standard Bank Mauritius Annual integrated report 2015
ENSURING OUR SUSTAINABILITY
Profile � Newly appointed head: human capital in November 2015 with Standard Bank (Mauritius) Limited.
� Holder of a Bachelor of Commerce, Honours in Human Resource Management and Masters in Social Sciences all
from the University of Natal in Durban, South Africa. Also holder of a Masters in Organisational Psychology from the
University of Cape Town
� Previously employed as the country head HR of Deutsche Bank, Mauritius
Profile � Joined Standard Bank (Mauritius) Limited in 2007 as head: electronic banking and later as client access
manager
� Holder of a Licence Professionnelle Commerce, option Commerce Electronique from Université de La Réunion and
a diplôme de technologie, mention Informatique de Gestion from the Mauritius Chambers of Commerce and Industry
� Currently reading a Master- Administration des Enterprises via the Mauritius Chambers of Commerce and Industry
Aelander MOOTOOSAMY
Adjhmir BHUGALOO
Head: Human Capital
Chief Information Officer
� Formerly held various HR positions at Barclays Bank Plc, Simply Talented International (Cape Town), Compagnie Mauricienne de Textile, Rogers Group, Air Mauritius and Illovo & Co Ltd
� In the past, occupied the post of junior lecturer for South African Labour Law and Psychometric Assessment at the University of Cape Town
� Registered Psychologist with the Health Professional Council of South Africa
� Previously employed at the Hongkong and Shanghai Banking Corporation (HSBC)
Profile � Appointed head: human capital in June 2013. Employment with Standard Bank (Mauritius) Limited
ended in December 2015
� Holder of a BA Honours degree in Human Resources from the University of Johannesburg and an advanced diploma in
Executive Coaching from the Graduate School of Business at the University of Cape Town
Hein LIEBENBERG
Head: Human Capital
� Previously employed as the HR business partner for PBB Africa and head of human resources in Standard Bank Namibia
� Held various senior HR positions in industries such as motor retail, steel and engineering, logistics and paint manufacturing and retail
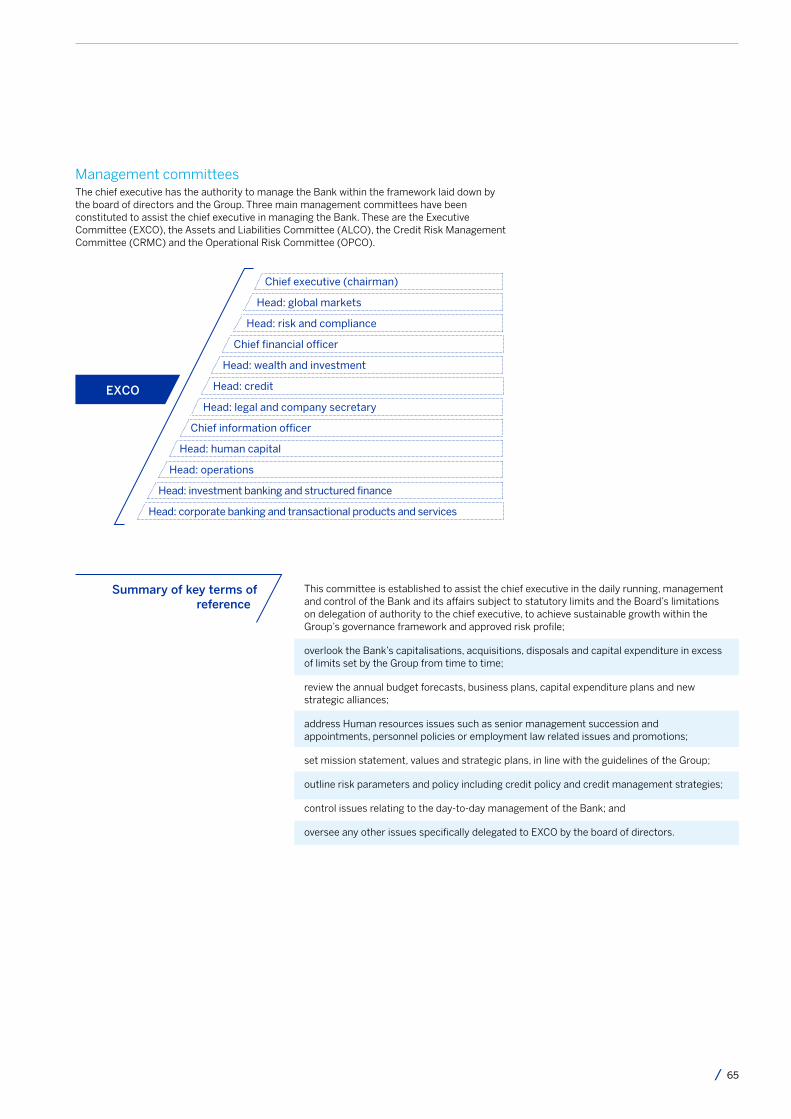
65
Management committeesThe chief executive has the authority to manage the Bank within the framework laid down by the board of directors and the Group. Three main management committees have been constituted to assist the chief executive in managing the Bank. These are the Executive Committee (EXCO), the Assets and Liabilities Committee (ALCO), the Credit Risk Management Committee (CRMC) and the Operational Risk Committee (OPCO).
EXCO
This committee is established to assist the chief executive in the daily running, management and control of the Bank and its affairs subject to statutory limits and the Board’s limitations on delegation of authority to the chief executive, to achieve sustainable growth within the Group’s governance framework and approved risk profile;
overlook the Bank’s capitalisations, acquisitions, disposals and capital expenditure in excess of limits set by the Group from time to time;
review the annual budget forecasts, business plans, capital expenditure plans and new strategic alliances;
address Human resources issues such as senior management succession and appointments, personnel policies or employment law related issues and promotions;
set mission statement, values and strategic plans, in line with the guidelines of the Group;
outline risk parameters and policy including credit policy and credit management strategies;
control issues relating to the day-to-day management of the Bank; and
oversee any other issues specifically delegated to EXCO by the board of directors.
Summary of key terms of reference
Chief executive (chairman)
Head: wealth and investment
Head: corporate banking and transactional products and services
Head: human capital
Head: credit
Head: global markets
Head: risk and compliance
Head: legal and company secretary
Head: investment banking and structured finance
Head: operations
Chief information officer
Chief financial officer

Corporate Governance Report continued
66 Standard Bank Mauritius Annual integrated report 2015
ENSURING OUR SUSTAINABILITY
The purpose of ALCO is to monitor and control all trading book risk and banking book liquidity risk and interest rate risk in accordance with the risk appetite set by group ALCO. ALCO meets on a monthly basis with a minimum of 10 meetings a year;
review limits, guidelines or trigger breaches and agree remedial actions in order to align exposures with agreed appetite;
approve market risk, liquidity risk and banking book interest rate risk policies;
ensure effective capital management governance is in place;
review and note the impact of internal and external factors on the net interest margin; and
recommend to the Board policies and guidelines under which the Bank will manage the matters such as:
� balance sheet growth;
� deposits, advances and investments;
� foreign exchange activities and positions; and
� market, liquidity, credit and operational risk management.
Summary of key terms of reference
ALCO
Chief executive (chairman)
Head: credit
Head: wealth and investment
Head: global markets
Head: risk and compliance
Head: investment banking and structured finance
Head: corporate banking and transactional products and services
Chief financial officer
Its objectives are to maximise net interest margins and trading-related earnings, achieve a deposit, lending and investment profile consistent with the Bank’s budgetary and strategic targets, and manage risks within levels which comply with the Group and/or regulatory authority limits and grow the Bank’s balance sheet size and after tax profits in line with budget.

67
Quorum required: three core members;
chief financial officer can act as alternate to chief executive/head: corporate and investment banking; and
establish principles under which the country is prepared to assume credit risk and the overall framework for the consistent and unified governance, identification, measurement, management and reporting of credit risk.
CRMCCore members
Other voting members
Summary of key terms of reference
Quorum: four members and should include the chairperson;
discuss risk, compliance and legal reports submitted to OPCO;
agree on the level of operational risk and risk appetite, operational risk and compliance strategies, governance standards and policies;
agree on the operational risk mitigation and/or risk transfer mechanisms; and
review audit reports and any other monitoring reports relating to operational risk and compliance.
Summary of key terms of reference
OPCO
Head: risk and compliance (chairperson)
Chief executive
Head: wealth and investment
Head: global markets
Head: operations
Head: legal and company secretary
Head: corporate banking and transactional products and services
Chief financial officer
Head: risk (chairperson)
Chief executive/head: corporate and investment banking
Head: corporate banking and transactional products and services
Head: global markets
Head: investment banking and structured finance
Chief financial officer (and act as alternate to the chief executive/head: corporate and investment banking)
Corporate Governance Report continued
68 Standard Bank Mauritius Annual integrated report 2015
ENSURING OUR SUSTAINABILITY
GovernanceAt the heart of our strategy lies the value we place on our people. Thus effective management and remuneration of our talent is a core competency in the Bank. Rewards provide one of the most powerful strategic methods for a manager to motivate staff and are fundamentally linked with budget management. The Group aims to have remuneration policies and programmes that will enable it to attract, retain and motivate the top calibre talent that supports organisational objectives.
The Bank aims to apply this policy in line with the Group remuneration strategy and therefore endeavours to:
� apply the full range of rewards to attract, retain and deploy teams of people with passion and skills;
� provide a reward package, including long and short-term incentives, that is understood, supported and valued by our people and recognises competencies and behaviours/values that help foster organisational success;
� improve the equity, transparency, communication and education of the reward philosophy, the reward elements, the pay structures and market salary data;
� facilitate the up skilling of line management to become owners of the ‘pay decision’ and committed to the ‘pay for contribution’ principle; and
� allow the Bank to compete effectively in the labour market and to attract and retain highly competent staff with remuneration practices that are more sensitive to the diverse needs of our people throughout Africa.
In the course of 2015, the Bank participated in the annual local banking survey run by HAY (Africa). The results were made available to the senior executive team. This allowed the managers to gauge where the remuneration of their various resources is pitched compared to the market. The Bank aims at paying at least as per median for all positions, and up to the 75th percentile for scarce skills in the local market.
Talent management frameworkThe Bank’s talent management process aims to improve the Bank’s ability to engage critical talent and develop the capability of our people. For us to be successful, it is critical that we develop the capabilities of our people, have clear roles and deliverables, live by common values and establish a culture which is based on confidence and client excellence.
The Group talent approach complements enduring performance management to help develop our people and motivate them to perform. This group approach will enable us to develop a clearer understanding of capabilities needed across the Bank, as well as identify and fill capability gaps/shortages in critical areas by balancing internal development and mobility with external hiring.
Key outcomes of our improved talent process are to have a proper engagement with talent on career aspirations and progression; and to build succession for critical roles within the franchise.
In country, as part of the strategic goals for 2015, a talent project plan has been put in place to ensure that talent in the Bank is developed and retained. Key development programmes have been devised, with the tracking to be implemented in 2016.
Recognition programmeRecognising employees who go the extra mile is an integral part of the Standard Bank way to build a high performing organisation. The Beyond Excellence programme is a tool for all employees to recognise colleagues who stand out as exceptional performers above and beyond what is considered part of the day-to-day job. In this programme, there are three recognition schemes:
� Everyday Recognition is an instant recognition scheme that line managers can give to reward their direct reports, such as:
� thank you rewards: certificates, plaques, handwritten notes, public recognition;
� time off and leave: recognition days (an extra day off-up to four per year); and
� discretionary rewards: treats such as chocolate, restaurant vouchers, theatre tickets, spa vouchers, shopping vouchers, etc.
� Everyone Recognition is designed for colleague-to-colleague recognition. An employee can nominate a colleague for a recognition reward from his line manager; and
� Mark of Excellence is a high-profile annual recognition award ceremonies and recognition rewards designed to recognise the top performers within each Business Unit (BU) and Group Enabling Function (GEF).
During 2015 the Beyond Excellence recognition programme was very well supported by the various BU and a total 50 employees were recognised during the year.
These awards are nominations based and are conditional on business performance.
Chief executiveThe chief executive receives a remuneration package and qualifies for long-term incentives. He is not subject to a retention agreement. The components of his package are as follows:
� guaranteed remuneration - based on his market value and the role that he plays;
� annual bonus incentive - used to incentivise the achievement of the Group's objectives; and
� pension - provides a competitive post-retirement benefit in line with the Group's employees.
Statement of remuneration philosophy

69
Remuneration structure Executive directors and non-executive directors feesThe following amount represents the sum paid to executive and non-executive directors for the year under review:
Directors’ service contractsThere were no non-executive service contracts between the Bank and its directors during the year.
Auditors’ fees and fees for other servicesThe audit fees payable for the financial year under review is tabled hereunder:
Louis RIvALLANDDuncan WESTCOTT Georges LEUNG SHINGStephen SCALI
Total non-executive directors
Lakshman BHEENICKMichele AH SEE
Total executive directors
Total non-executive and executive directors
USD
15 21020 37716 72815 818
68 134
468 764 234 108
702 872
771 006
KPMGAudit feesNon-audit fees
2015
USD’000
2014
USD’000
2013
USD’000
78 450-
78 450
71 060-
71 060
68 000-
68 000

70 Standard Bank Mauritius Annual integrated report 2015
ENSURING OUR SUSTAINABILITY
Introduction - Standard Bank Group’s (the Group) sustainability journeyThe very nature of our business positions us to help our customers and stakeholders manage social and environmental challenges and invest for the future, which in turn contributes to the viability and sustainable growth of local markets and national economies. The success of our customers, clients and stakeholders guarantees future business, which underpins our sustainability.
The Group will contribute to the socioeconomic development of the countries in which we operate in a way that is consistent with the nature and size of our operations. We will provide responsible financial services and products, bearing in mind the needs of society, our customers, our staff, our shareholders, the environment and future generations.
In formulating our strategy and determining our strategic priorities, we consider the full range of issues that influence the sustainability of our business and that of the social, economic and physical environments in which we operate and which, in turn, have a direct impact on our future viability.
An issue is material when it impacts our ability to remain commercially viable and socially relevant to the societies in which we operate. In particular, material issues are those that have a strong bearing on our stakeholders’ assessments and decisions about the Standard Bank (Mauritius) Limited’s (the Bank) long-term sustainability and its commitment to their needs. The stakeholders included were: shareholders, customers, employees, suppliers, regulators and society and the environment. We also take into consideration those factors that affect the financial stability and growth of economies and in turn our own business.
Our effectiveness in managing our material issues affects our ability to achieve our strategic objectives. The inputs into identifying our material issues are:
� our strategy;
� our values and code of ethics;
� internal and external stakeholder engagement;
� dialogues between executive management;
� risk management and regulation; and
� global challenges and national priorities.
Other material issues relevant to the Group include consumer indebtedness, leadership and development, employee relations, compensation & benefits, employee wellbeing, climate change, regulatory changes, decentralised procurement, ethical procurement and corporate social investment.
We grow our people to be influential in shaping external opinion about our chosen markets. Serving our customers is on top of our list of priorities and through outstanding customer service and promoting the attitude that every role has a customer, we deliver deeper relationships and partnership to manage collaborative decisions.
We aim to be an employer of choice for talented local people who understand local dynamics, and who can provide the nuanced insight we need to achieve our strategy. We have well-developed talent management and leadership development programmes in place to nurture the skills we need to meet our strategic objectives. Our people management focus includes increasing engagement with our employees and building morale across the Group. It is important to ensure that our people feel part of the Group and are able to apply an enterprise-wide mindset to their decisions and deliverables, irrespective of where they are based. Our ability to compete effectively and further develop our business depends on our ability to attract talented people.
Our priority is still on improving on the good governance practices in place and it has been further strengthened this year by focusing on the full automation of the procedure to pay entire cycle, from requisitioning to payment.
Consequently, several aspects of the management information system have been reviewed and enhanced for a more efficient and effective usage of the data relative to procurement of goods and services.
Our supplier management process has assisted us in improving our vendors’ deliverables and in obtaining the best economic value for our sourced range of various category items of goods and services.
Health and safetyThe Bank has a health and safety policy. Our policy is reviewed when necessary and risk assessments carried out when any major organisational or alteration to our offices are made. In addition the health and safety management system undertakes risk assessments and formulates risk management plans to identify, prevent and manage occupational health and safety risks. We also have a health and safety committee which meets every two months with representation of both employers and employees. Relevant findings are addressed ‘so far as practicable’. Minutes are then filed with the local authorities. Over and above, the Bank keeps track of health and safety activities with respect of any accidents, near misses and training carried out. Directors, managers and staff are fully involved to promote a ‘positive health and safety culture’ within the Bank in terms of competence, control, co-operation and communication.
Our priority is still on improving on the good governance practices in place and it has been further strengthened this year by focusing on the full automation of the procedure to pay entire cycle, from requisitioning to payment.
Sustainability report

71
Energy consumptionFactors that drive the implementation of energy efficiency projects are the increasing cost of electricity, the security of supply in certain areas and our objective to reduce our carbon footprint. Our long-term objective is to implement an energy management strategy with achievable targets across all our operations with the lessons learnt in South Africa used to drive energy efficiency in our operations on the rest of the continent. The amount spent on electricity to perform our day-to-day activities is approximately MUR9,2 million a year for the Mauritius operation, thus managing this cost materially contributes to our sustainable long-term financial performance.
During 2015, the total amount of energy consumed at the Bank was 1,093,975 kilowatt hours (2014: 1,256,299 kilowatt hours).
We adopted cost saving initiatives and these reduced consumption by 13% compared to 2014, representing a saving of MUR1,3 million.
Diesel consumption for 2015 was nil due to the fact that we had no substantial powercuts (2014 was 0 Litres).
CommunityThe Bank strives to be a trusted corporate citizen and aims to uplift the society in which we operate.
We support projects that are in line with our business objectives and have a sustainable impact on our community. The main areas of intervention regarding Corporate Social Responsibility activities for the Bank are health, environment and education.
The projects carried by the Bank in 2015 were as follows:
� sponsor transport services for kids suffering from cancer following treatment in hospital (Project managed by Link to Life);
� psychological support services to kids suffering from cancer as well as their parents (Project managed by Link to Life); and
� counselling services to be provided to 26 children and young adults from underprivileged backgrounds who have mental disabilities (Project managed by Reve et Espoir).
Education is the driving force behind uplifting society and the Bank firmly believes that education promotes socioeconomic development. Our involvement in this area is through:
ScholarshipsFor the past four years, the Bank has launched a scholarship programme to allow bright students with limited financial means to follow undergraduate courses at the University of Mauritius. In 2015, the total number of students benefiting from the Standard Bank scholarship amounted to thirty, with the Bank financing their university fees as well as providing a monthly stipend to each beneficiary.
Staff involvementThe Bank marked Nelson Mandela International Day, celebrated on 18 July every year, by encouraging all employees to give their time to the community. The objective of Mandela Day is to inspire individuals to take action to help change the world for the better, and in doing so build a global movement for good. Ultimately we seek to empower communities everywhere. The Bank gave the opportunity to its employees to give back time to the community by allowing them to help a Non-Governmental Organisations (NGOs) that they have at heart.
The NGOs that were selected for this initiative were:
� Joie de vivre universelle
� Angel Special School
� La Ruche
� La Colombe
� ARISE
� Case Noyale RCA
Equator principlesThe equator principles are a set of standards for managing social and environmental issues in project finance. As a signatory to the equator principles we are bound to ensure that the customers to whom we lend capital evaluate and actively avoid, manage or mitigate the social and environmental impacts of the projects for which they require financing. Applying the equator principles to our project financing will result in a number of associated benefits, including:
� improved environmental and social risk management with an anticipated benefit to long-term investment performance;
� improved relationships with stakeholders and reputation;
� addressing social and environmental impacts more systematically and accountably;
� increased potential for partnerships that address impacts on the environment and provide environmental and social benefits to affected communities;
�increased opportunity for being the lead arranger in large syndicated project finance loans; and
� increased business opportunities in the international project finance arena.
Looking aheadWe understand that we can only generate sustainable profits and superior shareholder returns if we conduct our business in a responsible and inclusive way. Strengthening our reputation and building trust through ethical conduct and maintaining good relationships with customers, employees and other stakeholders enable us to create value over the long-term.

Culture
72 Standard Bank Mauritius Annual integrated report 2015
We understand that our ability to succeed ultimately
depends on our culture and ensuring it embraces everything
we need to deliver our strategy. As an essential determinant of the
culture we wish to build, our dynamic and engaged teams are charged with
living the Group’s values each day and holding themselves accountable for the
business celebrating success and learning from their mistakes.

73
(Section 75 (3) of the Financial Reporting Act)
Name of public interest entity: Standard Bank (Mauritius) Limited
Reporting period: Year ended 31 December 2015
We, the Directors of Standard Bank (Mauritius) Limited, confirm that to the best of our knowledge the PIE has not complied with section 3.5 of the code and the reasons for non-compliance are as follows:
�Corporate governance committee
�There is no corporate governance committee as all corporate governance matters are taken up at the full board.
16 March 2016
Statement of compliance
LOUIS RIvALLAND Chairman
LAKSHMAN BHEENICKChief Executive

Statement of management’s responsibility for financial reporting
74 Standard Bank Mauritius Annual integrated report 2015
ANNUAL FINANCIAL STATEMENTS
The financial statements for the Standard Bank (Mauritius) Limited (the Bank) presented in this annual report have been prepared by management, which is responsible for their integrity, consistency, objectivity and reliability. International Financial Reporting Standards as well as the requirements of the Banking Act 2004 and the guidelines issued there under have been applied and management has exercised its judgement and made best estimates where deemed necessary.
The Bank has designed and maintained its accounting systems, related internal controls and supporting procedures, to provide reasonable assurance that financial records are complete and accurate and that assets are safeguarded against loss from unauthorised use or disposal. These supporting procedures include careful selection and training of qualified staff, the implementation of organisation and governance structures providing a well defined division of responsibilities, authorisation levels and accountability for performance, and the communication of the Bank’s policies, procedures manuals and guidelines of the Bank of Mauritius (BoM) throughout the Bank.
The Bank’s board of directors, acting in part through the audit committee and conduct review committee and risk policy committee which comprise independent directors who are not officers or employees of the Bank, oversees management’s responsibility for financial reporting, internal controls, assessment and control of major risk areas, and assessment of significant and related party transactions.
The Bank’s internal auditor, who has full and free access to the audit committee, conducts a well designed program of internal audits in coordination with the Bank’s external auditors. In addition, the Bank’s compliance function maintains policies, procedures and programs directed at ensuring compliance with regulatory requirements.
Pursuant to the provisions of the Banking Act 2004, the BoM makes such examination and inquiry into the operations and affairs of the Bank as it deems necessary.
The Bank’s external auditors, KPMG, have full and free access to the board of directors and its committees to discuss the audit and matters arising there from, such as their observations and fairness of financial reporting and the adequacy of internal controls.
16 March 2016
LOUIS RIvALLAND Chairman
GEORGES LEUNG SHING Director
LAKSHMAN BHEENICKChief Executive

75
Secretary’s certificate
In accordance with section 166 (d) of the Companies Act 2001, we certify that to the best of our knowledge and belief, the Bank has filed with the Registrar of Companies, all such returns as are required of the Bank under the Companies Act 2001.
RESHMEE A KISTNAMAHCompany Secretary
Independent auditors’ report to the member of Standard Bank (Mauritius) Limited
76 Standard Bank Mauritius Annual integrated report 2015
ANNUAL FINANCIAL STATEMENTS
Report on the financial statementsWe have audited the financial statements of Standard Bank (Mauritius) Limited (the Bank), which comprise the statement of financial position as at 31 December 2015 and the statements of profit or loss and other comprehensive income, changes in equity and cash flows for the year then ended, and the notes to the financial statements which include a summary of significant accounting policies and other explanatory notes, as set out on pages 80 to 156.
This report is made solely to the Bank’s member, in accordance with Section 205 of the Mauritius Companies Act. Our audit work has been undertaken so that we might state to the Bank’s member those matters that we are required to state in an auditors’ report and for no other purpose. To the fullest extent permitted by law, we do not accept or assume responsibility to anyone other than the Bank and the Bank’s member, for our audit work, for this report, or for the opinions we have formed.
Directors’ responsibility for the financial statementsThe Bank’s directors are responsible for the preparation and fair presentation of these financial statements in accordance with International Financial Reporting Standards and in compliance with the requirements of the Mauritius Companies Act and Banking Act and for such internal control as management determines is necessary to enable the preparation of financial statements that are free from material misstatement, whether due to fraud or error.
Auditors’ responsibilityOur responsibility is to express an opinion on these financial statements based on our audit. We conducted our audit in accordance with International Standards on Auditing. Those standards require that we comply with ethical requirements and plan and perform the audit to obtain reasonable assurance about whether the financial statements are free from material misstatement.
An audit involves performing procedures to obtain audit evidence about the amounts and disclosures in the financial statements. The procedures selected depend on the auditors’ judgement, including the assessment of the risks of material misstatement of the financial statements, whether due to fraud or error. In making those risk assessments, the auditors consider internal control relevant to the Bank’s preparation and fair presentation of the financial statements in order to design audit procedures that are appropriate in the circumstances, but not for the purpose of expressing an opinion on the effectiveness of the Bank’s internal control. An audit also includes evaluating the appropriateness of accounting policies used and the reasonableness of accounting estimates made by directors, as well as evaluating the overall presentation of the financial statements.
We believe that the audit evidence we have obtained is sufficient and appropriate to provide a basis for our audit opinion.

77
Independent auditors’ report to the member of Standard Bank (Mauritius) Limited (continued)OpinionIn our opinion, the financial statements give a true and fair view of the financial position of the Bank as at 31 December 2015 and of its financial performance and cash flows for the year then ended in accordance with International Financial Reporting Standards and in compliance with the requirements of the Mauritius Companies Act.
Report on other legal and regulatory requirementsMauritius Companies Act We have no relationship with or interests in the Bank other than in our capacity as auditors.
We have obtained all the information and explanations we have required.
In our opinion, proper accounting records have been kept by the Bank as far as it appears from our examination of those records.
Banking ActIn our opinion, the financial statements have been prepared on a basis consistent with that of the preceding year and are complete, fair and properly drawn up and comply with the Banking Act and the regulations and guidelines of the Bank of Mauritius.
The explanations or information called for or given to us by the officers or agents of the Bank were satisfactory.
The Financial Reporting Act 2004The directors are responsible for preparing the corporate governance report. Our responsibility is to report on the extent of compliance with the Code of Corporate Governance as disclosed in the financial statements and on whether the disclosure is consistent with the requirements of the Code.
In our opinion, the disclosure in the financial statements is consistent with the requirements of the Code.
16 March 2016

79
ANNUAL FINANCIAL STATEMENTS Summarised annual financial statements continued
Main heading
78 Standard Bank Mauritius Annual integrated report 2015
We understand that our commercial success and
social relevance over the long term depends on placing our
clients at the centre of everything we do, and ensuring
that the outcomes of our activities are a catalyst for growth on this
continent we call home.
Photo: Johannesburg, South Africa
78 Standard Bank Mauritius Annual integrated report 2015 79

ANNUAL FINANCIAL STATEMENTS
Statement of financial positionAs at 31 December 2015
80 Standard Bank Mauritius Annual integrated report 2015
AssetsCash and cash equivalentsTrading assetsDerivative assets held for risk managementLoans and advances to banksLoans and advances to customersInvestment securities Property, plant and equipmentIntangible assetsDeferred taxOther assets
Total assets
LiabilitiesDeposits from banksDeposits from customersTrading liabilitiesDerivative liabilities held for risk managementOther borrowed fundsSubordinated liabilitiesCurrent tax payableOther liabilities
Total liabilities
Shareholders’ equityShare capitalOther reservesRetained earnings
Total equity attributable to equity holders
Total equity and liabilities
Approved by the board of directors and authorised for issue on 16 March 2016.
Note
789
10111213141516
17188919202122
23
2015
USD
858 078 800 39 163 539
9 016 819 393 710 692 100 752 826
474 659 2 871 608
26 645 1 177 000
13 629 313
1 418 901 901
79 148 172 1 164 809 245
- 8 618 009
10 996 984 25 000 000
539 000 40 974 564
1 330 085 974
35 000 000 10 561 693
43 254 234
88 815 927
1 418 901 901
2014
USD
2 497 991 968 184 035 481
4 503 937 270 117 616
249 836 871 2 661 958 3 294 570
40 554 2 116 000
16 324 078
3 230 923 033
22 885 089 3 025 659 257
23 342 017 3 796 297
43 455 945 25 000 000
- 9 597 039
3 153 735 644
35 000 000 7 423 062
34 764 327
77 187 389
3 230 923 033
2013
USD
1 429 027 700223 637 126
6 047 463351 186 580340 219 697
16 498 2184 160 125
71 4283 654 00019 467 651
2 393 969 988
355 725 8161 776 766 143
2 349 1536 065 708
154 292 41225 000 000
248 44611 794 793
2 332 242 471
35 000 0007 378 766
19 348 751
61 727 517
2 393 969 988
DirectorGeorges Leung Shing
ChairmanLouis Rivalland
Chief ExecutiveLakshman Bheenick
The notes on pages 84 to 156 form part of these financial statements.

81
Statement of profit or loss and other comprehensive incomeFor the year ended 31 December 2015
Interest income Interest expense Net interest income Fee and commission income Fee and commission expense Net fee and commission income Net trading incomeNet income from other financial instruments carried at fair valueOther operating income Operating income Net impairment loss reversal/(charge) on financial assetsPersonnel expensesOperating leaseDepreciation and amortisationOther expenses Profit/(loss) before income tax Income tax (expense)/credit Profit/(loss) for the year Profit/(loss) attributable to equity holders Other comprehensive incomeItems that are or may be reclassified to profit or lossNet gain/(loss) on available-for-sale financial assets
Other comprehensive income/(loss) for the year
Total comprehensive income/(loss) for the year
Total comprehensive income/(loss) attributable to equity holders
The notes on pages 84 to 156 form part of these financial statements.
Note
25
26
272829
303132
13 & 1433
34
2015
USD
21 146 140 (6 969 130)
14 177 010
7 384 020(230 643)
7 153 377
10 897 175(245 678)
219 336
10 870 833
32 201 220
4 949 466 (6 529 347)
(649 625) (794 909)
(5 974 611)
(8 999 026)
23 202 194(1 596 711)
21 605 483
21 605 483
868
868
21 606 351
21 606 351
2014
USD
26 117 645 (10 381 726)
15 735 919
7 717 934(485 645)
7 232 289
8 683 797 284 976 278 958
9 247 731
32 215 939
1 125 491 (7 254 866)
(808 337) (902 607)
(5 838 034)
(13 678 353)
18 537 586(3 122 010)
15 415 576
15 415 576
4 539
4 539
15 420 115
15 420 115
2013
USD
29 751 601(12 672 892)
17 078 709
8 138 815(623 196)
7 515 619
4 110 844 68 344 282 171
4 461 359
29 055 687
(18 738 168)(7 899 980)
(789 070)(820 472)
(5 222 592)
(33 470 282)
(4 414 595) 151 527
(4 263 068)
(4 263 068)
(35 691)
(35 691)
(4 298 759)
(4 298 759)

ANNUAL FINANCIAL STATEMENTS
Statement of cash flowsFor the year ended 31 December 2015
82 Standard Bank Mauritius Annual integrated report 2015
Cash flows from operating activitiesProfit/(loss) for the yearAdjusted for: Depreciation and amortisation(Gain)/loss on sale of assets Net impairment (gain)/loss on financial assets Income tax expense/(credit)Changes in operating assets and liabilities Decrease/(increase) in trading assets Decrease/(increase) in derivative financial instruments held for risk management (Increase)/decrease in loans and advances to banks Decrease in loans and advances to customers Decrease/(increase) in other assets (Decrease)/increase in trading liabilities Increase/(decrease) in deposits from banks Decrease in other borrowed funds(Decrease)/increase in deposits from customers Increase/(decrease) in other liabilities Decrease/(increase) in investment securitiesIncome tax paid
Net cash (used in)/from operating activities
Cash flows from investing activitiesSale of investment securities1
Capital expenditure on property, plant and equipment Proceeds from sale of property, plant and equipment Capital expenditure intangible assets
Net cash (used in)/from investing activities
Cash flows from financing activitiesDecrease in subordinated liabilities Dividends paid
Net cash (used in)/from financing activities
Net (decrease)/increase in cash and cash equivalents Cash at the beginning of the year
Total cash at end of the year
1Movement in investment securities relating to treasury bills and bonds have been reclassified to operating activities.
Note
13 & 14
30
13
14
20
7
2015
USD
21 605 483
794 908(5 735)
(4 949 466) 1 596 711
144 871 942 308 830
(123 593 076) 154 033 510 2 694 765
(23 342 017) 56 263 084
(32 458 961)(1 860 850 012)
31 280 609 2 188 168 -
(1 629 561 257)
- (360 891)
8 980 -
(351 911)
-(10 000 000)
(10 000 000)
(1 639 913 168) 2 497 991 968
858 078 800
2014
USD
15 415 576
902 607 -
(1 125 491) 3 122 010
39 601 645(725 886)
81 068 964 91 508 317 2 851 579 20 992 864 (332 840 728) (110 836 467)
1 248 893 113 (2 157 999)
(28 377) (1 498 071)
1 055 143 656
13 869 176 (48 564)
- - 13 820 612
- -
-
1 068 964 268 1 429 027 700
2 497 991 968
2013
USD
(4 263 068)
820 472 1 105 18 738 168
(151 527)
(49 014 872)(179 323)
(218 155 196) 49 565 256
(839 470)(2 579 886)
11 912 182(59 042 070)
237 363 938 4 226 054 1 429 935
(851 554)
(11 019 856)
-(520 960)
1 072(54 089)
(573 977)
(20 000 000) -
(20 000 000)
(31 593 833) 1 460 621 533 1 429 027 700

83
Statement of changes in equityFor the year ended 31 December 2015
Balance at 31 December 2012
Loss for the yearNet change in fair value of available-for-sale financial assets
Total comprehensive loss for the yearShare-based paymentsTransfer between reserves
Balance at 31 December 2013
Income for the yearNet change in fair value of available-for-sale financial assets
Total comprehensive income for the year
Share-based payments
Balance at 31 December 2014
Income for the yearNet change in fair value of available-for-sale financial assets
Total comprehensive income for the year
Share-based paymentsTransfer to statutory reserveTransfer to general banking reserve
Transactions with owners of the Bank
Dividend to equity holders
Balance at 31 December 2015
Note
Otherreserves
USD
427 148
-(35 691)
(35 691) 59 248
(198 483)
(139 235)
252 222
- 4 539 4 539
39 757
39 757
296 518
- 868
868
(208 831) - 311 927
103 096
-
400 482
35
Retainedearnings
USD
23 413 336
(4 263 068) -
(4 263 068) - 198 483
198 483
19 348 751
15 415 576 - 15 415 576
-
-
34 764 327
21 605 483 -
21 605 483
231 018(3 034 667)
(311 927)
(3 115 576)
(10 000 000)
43 254 234
TotalUSD
65 967 028
(4 263 068)(35 691)
(4 298 759) 59 248 -
59 248
61 727 517
15 415 576 4 539 15 420 115
39 757
39 757
77 187 389
21 605 483 868
21 606 351
22 187 - -
22 187
(10 000 000)
88 815 927
Share capital
USD
35 000 000
--
---
-
35 000 000
--
-
-
-
35 000 000
--
-
---
-
-
35 000 000
23
Statutory reserve
USD
7 126 544
--
---
-
7 126 544
--
-
-
-
7 126 544
--
-
-3 034 667
-
3 034 667
-
10 161 211

ANNUAL FINANCIAL STATEMENTS
Notes to and forming part of the financial statementsFor the year ended 31 December 2015
84 Standard Bank Mauritius Annual integrated report 2015
1. General informationStandard Bank (Mauritius) Limited (the Bank) is a company domiciled in Mauritius. The address of the Bank‘s registered office is Level 9, Tower A, 1 Cybercity, Ebène, Mauritius.
The Bank obtained its banking licence issued by the Bank of Mauritius (BoM) effective from November 2001.
The Bank is primarily involved in investment and corporate banking with a wealth and investment arm. The Bank also acts as primary dealer in the secondary market for government treasury bills effective as from 1 June 2007.
The Bank is also involved in the distribution of financial products and offering of custody services.
The Bank holds the following licences that fall under the regulatory purview of the Financial Services Commission (FSC):
� Distribution of financial products. (effective from 17 August 2010);
� Investment adviser (restricted) (effective from 20 August 2010);
� Investment adviser (representative) (effective from 20 August 2010); and
� Custody licences: non-collective investment schemes (effective from 7 February 2007) and collective investment schemes (effective from 17 April 2009).
2. Basis of preparation
(a) Statement of complianceThe annual financial statements are prepared in accordance with International Financial Reporting Standards (IFRS) as issued by the International Accounting Standards Board (IASB), its interpretations adopted by the IASB and guidelines and guidance notes issued by the BoM, in so far as the operation of the Bank is concerned.
(b) Basis of measurementThe annual financial statements have been prepared on the historical cost basis except for the following material items in the statement of financial position:
Items Measurement basis
Derivative financial instruments Fair value
Non-derivative financial instrument at fair value through profit and loss Fair value
Available-for-sale financial asset Fair value
Liabilities for cash-settled share-based payment arrangement Fair value
Assets and liabilities held-for-trading Fair value
The following principal accounting policy elections in terms of IFRS have been made, with reference to the detailed accounting policies shown in brackets:
�purchases and sales of financial assets under a contract whose terms require delivery of the asset within the time frame established generally by regulation or convention in the marketplace concerned are recognised and derecognised using trade date accounting (significant accounting policies (2) financial Instruments);
�intangible assets and property and equipment are accounted for at cost less accumulated amortisation and impairment (significant accounting policies (4) intangible assets and property plant and equipment); and
�the portfolio exception to measure the fair value of certain groups of assets and financial liabilities on a net basis (significant accounting policies (3) fair value measurement).
(c) Functional and presentation currency The annual financial statements are presented in United States Dollars (USD), which is the Bank’s functional currency as well as reporting currency.
As at 31 December 2015, the exchange rate of the Mauritian Rupee against USD was 35.85 (2014: 31.75).
(d) Use of estimates and judgementsThe preparation of the annual financial statements in conformity with IFRS requires management to make judgements, estimates and assumptions that affect the application of bank accounting policies and the reported amounts of assets, liabilities, income and expenses. Actual results may differ from these estimates.
Estimates and underlying assumptions are reviewed on an ongoing basis. Revisions to accounting estimates are recognised prospectively.
Information about significant areas of estimation, uncertainty and critical judgements in applying accounting policies that have the most significant effect on the amount recognised in the annual financial statements as described in note 5.
(e) Changes in accounting policiesThe accounting policies are consistent with those reported in the previous year except as required in terms of the adoption of the following as set out in note 2.1.
Adoption of new and amended standards and interpretation effective for the current financial periodThe Bank has adopted the following new and amended IFRS as at 1 January 2015 with no material impact on the Bank’s accounting policies or results with no restatement of prior period results.
Early adoption of revised standards.
The revised standards and interpretations did not have any effect on the Bank’s and company’s reported earnings or financial statement position and had no material impact on the accounting policies.
Amendment to IAS 16 property, plant and equipment (IAS 16) and IAS 41 agriculture (IAS 41) - expands the scope paragraph to include bearer plants, which is to be accounted for in the same way as property, plant and equipment. Consequently, IAS 41 was amended to exclude bearer plants from the scope.
85
�Annual improvements 2012 – 2014: the IASB issued various amendments and clarifications to existing IFRS, the most notable being the amendment to IFRS 7 financial instruments: disclosure for servicing contracts and offsetting financial assets and financial liabilities for interim periods.
�Annual improvements 2010 – 2012 cycle and 2011 – 2013 cycle: the IASB issued various amendments and clarifications to existing IFRS, none of which had a significant impact on the Standard Bank Group’s (the Group) financial statements.
�Amendment to IAS 1 presentation of financial statements (IAS 1) – the amendment to IAS 1 clarifies that materiality applies to the whole set of financial statements and that the inclusion of immaterial information can inhibit the usefulness of financial disclosures. The amendment further explains that professional judgement should be used in determining where and in what order information should be presented in the financial statements. During the year the Bank reviewed its financial statements to identify disclosures that were considered to be immaterial as well as to consider ways of better presenting financial information.
The revised standards did not have any effect on the Bank’s reported earnings or financial statement position and had no material impact on the accounting policies. The IAS 1 amendment resulted in the Group and company removing immaterial information from its financial statement disclosures as well as, in several instances, amending the format of its disclosures to better reflect and explain the disclosed financial information.
2.1 Significant accounting policies The accounting policies set out below have been applied consistently to all periods presented in the annual financial statements.
(a) Foreign currency transactionsForeign currency transactions are translated into the respective functional currencies of bank entities at exchange rates prevailing at the date of the transactions. Foreign exchange gains and losses resulting from the settlement of such transactions and from the translation of monetary assets and liabilities denominated in foreign currencies at year end exchange rates are recognised in profit or loss.
Non-monetary assets and liabilities denominated in foreign currencies that are measured at historical cost are translated using the exchange rate at the transaction date, and those measured at fair value are translated at the exchange rate at the date that the fair value was determined. Exchange rate differences on non-monetary items are accounted for based on the classification of the underlying items. Foreign exchange gains and losses on equities (debt) classified as available-for-sale financial assets are recognised in the available-for-sale reserve in Other Comprehensive Income (OCI) whereas the exchange differences on equities and debt that are classified as held at fair value through profit or loss are reported as part of the fair value gain or loss in profit or loss.
Foreign currency differences arising on translation are generally recognised in profit or loss. However, foreign currency differences arising from the translation of available-for-sale equity instruments are recognised in the OCI with the exception of impairment, in which case foreign currency differences that have been recognised in the OCI are reclassified to profit or loss.

ANNUAL FINANCIAL STATEMENTS Notes to and forming part of the financial statements continued
86 Standard Bank Mauritius Annual integrated report 2015
(b) Financial instruments
(i) Initial recognition and measurement Financial instruments include all financial assets and liabilities. These instruments are typically held for liquidity, investment or trading purposes on the date at which they are originated. Regular purchases and sales of financial assets are recognised on the trade date at which the Bank commits to purchase or sell the asset. All other financial assets and liabilities (including assets and liabilities designated at fair value through profit or loss) are initially recognised on the trade date at which the Bank becomes a party to the contractual provisions of the instrument.Investment securities are initially measured at fair value plus incremental direct transaction costs and subsequently accounted for depending on their classification as either held-to-maturity, fair value through profit or loss, or available-for-sale.
All financial instruments are measured initially at fair value plus, for an item not at fair value through profit or loss, transaction costs that are directly attributable to its acquisition or issue.
Held-to-maturity
Loans and receivable
Available-for-sale
Financial assets
Financial liabilities
Derivative
Financial instruments
Offsetting
Other
Held-for-trading
Designated at fair value through profit or loss
Designated at fair value through profit or loss
Held-for-trading
Amortised cost

87
Nature
Held-to-maturity
Loans and receivables
Available-for-sale
Held-for-trading
Designated at fair value through profit or loss
Non-derivative financial assets with fixed or determinable payments and fixed maturities that management has both the positive intent and ability to hold-to-maturity.
Non-derivative financial assets with fixed or determinable payments that are not quoted in an active market, other than those classified by the Bank as at fair value through profit or loss or available-for-sale.
Financial assets that are generally strategic capital investments held for an indefinite period of time, which may be sold in response to needs for liquidity or changes in interest rates, exchange rates or equity prices, or non-derivative financial assets that are not classified within another category of financial assets.
Those financial assets acquired or incurred principally for the purpose of selling or repurchasing in the near term, those forming part of a portfolio of identified financial instruments that are managed together and for which there is evidence of a recent actual pattern of short-term profit-taking, and commodities that are acquired principally by the Bank for the purpose of selling in the near future and generating a profit from fluctuations in price or broker-traders’ margin. Derivatives are always categorised as held-for-trading.
Financial assets are designated to be measured at fair value in the following instances:�this designation eliminates or significantly reduces an accounting mismatch that would otherwise arise. Under this criterion, the main class of financial instruments designated by the Bank are investment securities. The designation significantly reduces measurement inconsistencies that would have otherwise arisen. For example, where the related derivatives were treated as held-for-trading and the underlying financial instruments were carried at amortised cost. This category also includes financial assets used to match investment contracts or insurance contract liabilities;�banks of financial assets, are managed, and their performance evaluated, on a fair value basis in accordance with a documented risk management or investment strategy, and reported to the Bank’s key management personnel on a fair-value basis. Under this criterion, certain private equity, short-term insurance and other investment portfolios have been designated at fair value through profit or loss; or �financial instruments containing one or more embedded derivatives that significantly modify the instruments’ cash flows.
Financial assets
(ii) Subsequent measurementSubsequent to initial measurement, financial instruments are measured either at fair value or amortised cost, depending on their classifications as follows:
Held-to-maturity
Loans and receivables
Available-for-sale
Held-for-trading
Designated at fair value through profit or loss
Amortised cost using the effective interest method with interest recognised in interest income, less any impairment losses which are recognised as part of credit impairment charges.
Directly attributable transaction costs and fees received are capitalised and amortised through interest income as part of the effective interest rate.
Amortised cost using the effective interest method, less any impairment losses.
Origination transaction costs and origination fees received that are integral to the effective rate are capitalised to the value of the loan and amortised through interest income as part of the effective interest rate.
All of the Bank’s loans and advances are included in the loans and receivables category.
Financial assets are subsequently measured at fair value.
Unrealised gains or losses are recognised directly in the available-for-sale reserve until the financial asset is derecognised or impaired.
When debt (equity) available-for-sale financial assets are disposed of, the cumulative fair value adjustments in OCI are reclassified to interest income (other revenue).
Fair value, with gains and losses arising from changes in fair value (including interest and dividends) recognised in trading revenue. The fair value designation is made on initial recognition and is irrevocable. Subsequent to initial recognition, the fair values are re-measured at each reporting date.
Gains and losses arising from changes in fair value are recognised in interest income (interest expense) for all debt financial assets (financial liabilities) and in other revenue within Non-Interest Revenue (NIR) for all equity instruments.
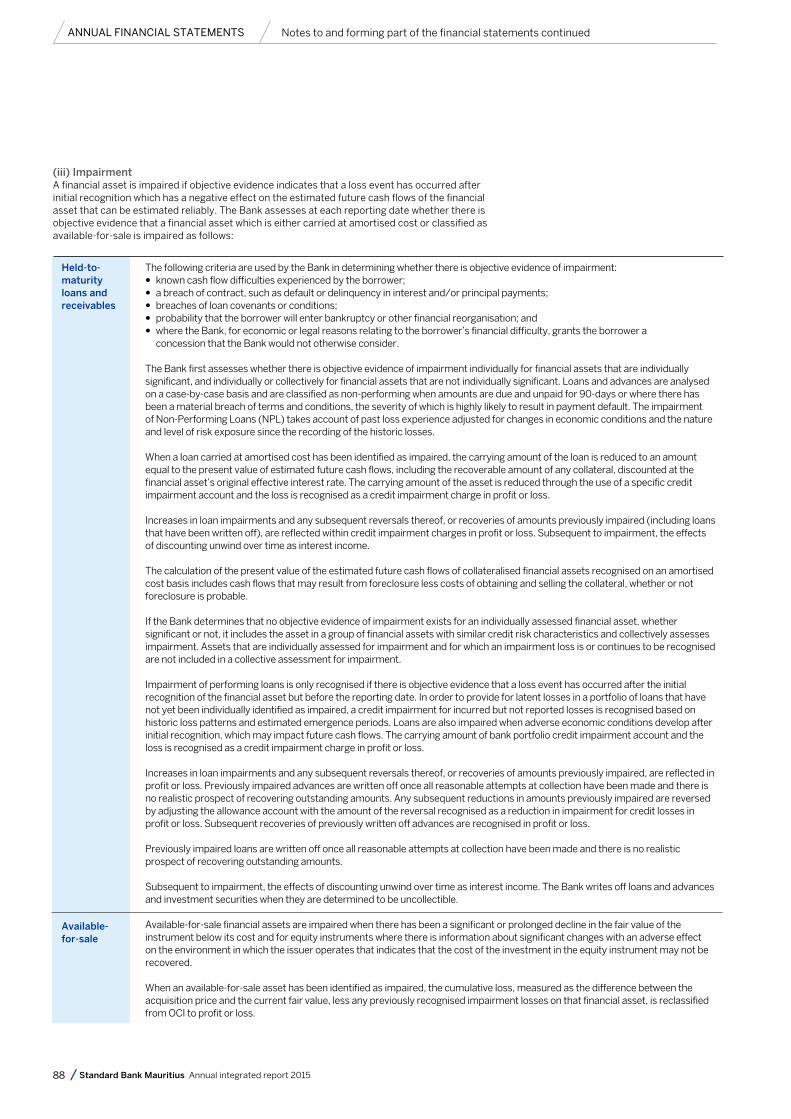
88 Standard Bank Mauritius Annual integrated report 2015
(iii) ImpairmentA financial asset is impaired if objective evidence indicates that a loss event has occurred after initial recognition which has a negative effect on the estimated future cash flows of the financial asset that can be estimated reliably. The Bank assesses at each reporting date whether there is objective evidence that a financial asset which is either carried at amortised cost or classified as available-for-sale is impaired as follows:
Held-to-maturity loans and receivables
The following criteria are used by the Bank in determining whether there is objective evidence of impairment:�known cash flow difficulties experienced by the borrower; �a breach of contract, such as default or delinquency in interest and/or principal payments; �breaches of loan covenants or conditions; �probability that the borrower will enter bankruptcy or other financial reorganisation; and �where the Bank, for economic or legal reasons relating to the borrower’s financial difficulty, grants the borrower a concession that the Bank would not otherwise consider.
The Bank first assesses whether there is objective evidence of impairment individually for financial assets that are individually significant, and individually or collectively for financial assets that are not individually significant. Loans and advances are analysed on a case-by-case basis and are classified as non-performing when amounts are due and unpaid for 90-days or where there has been a material breach of terms and conditions, the severity of which is highly likely to result in payment default. The impairment of Non-Performing Loans (NPL) takes account of past loss experience adjusted for changes in economic conditions and the nature and level of risk exposure since the recording of the historic losses.
When a loan carried at amortised cost has been identified as impaired, the carrying amount of the loan is reduced to an amount equal to the present value of estimated future cash flows, including the recoverable amount of any collateral, discounted at the financial asset’s original effective interest rate. The carrying amount of the asset is reduced through the use of a specific credit impairment account and the loss is recognised as a credit impairment charge in profit or loss.
Increases in loan impairments and any subsequent reversals thereof, or recoveries of amounts previously impaired (including loans that have been written off), are reflected within credit impairment charges in profit or loss. Subsequent to impairment, the effects of discounting unwind over time as interest income.
The calculation of the present value of the estimated future cash flows of collateralised financial assets recognised on an amortised cost basis includes cash flows that may result from foreclosure less costs of obtaining and selling the collateral, whether or not foreclosure is probable.
If the Bank determines that no objective evidence of impairment exists for an individually assessed financial asset, whether significant or not, it includes the asset in a group of financial assets with similar credit risk characteristics and collectively assesses impairment. Assets that are individually assessed for impairment and for which an impairment loss is or continues to be recognised are not included in a collective assessment for impairment.
Impairment of performing loans is only recognised if there is objective evidence that a loss event has occurred after the initial recognition of the financial asset but before the reporting date. In order to provide for latent losses in a portfolio of loans that have not yet been individually identified as impaired, a credit impairment for incurred but not reported losses is recognised based on historic loss patterns and estimated emergence periods. Loans are also impaired when adverse economic conditions develop after initial recognition, which may impact future cash flows. The carrying amount of bank portfolio credit impairment account and the loss is recognised as a credit impairment charge in profit or loss.
Increases in loan impairments and any subsequent reversals thereof, or recoveries of amounts previously impaired, are reflected in profit or loss. Previously impaired advances are written off once all reasonable attempts at collection have been made and there is no realistic prospect of recovering outstanding amounts. Any subsequent reductions in amounts previously impaired are reversed by adjusting the allowance account with the amount of the reversal recognised as a reduction in impairment for credit losses in profit or loss. Subsequent recoveries of previously written off advances are recognised in profit or loss.
Previously impaired loans are written off once all reasonable attempts at collection have been made and there is no realistic prospect of recovering outstanding amounts.
Subsequent to impairment, the effects of discounting unwind over time as interest income. The Bank writes off loans and advances and investment securities when they are determined to be uncollectible.
Available-for-sale financial assets are impaired when there has been a significant or prolonged decline in the fair value of the instrument below its cost and for equity instruments where there is information about significant changes with an adverse effect on the environment in which the issuer operates that indicates that the cost of the investment in the equity instrument may not be recovered.
When an available-for-sale asset has been identified as impaired, the cumulative loss, measured as the difference between the acquisition price and the current fair value, less any previously recognised impairment losses on that financial asset, is reclassified from OCI to profit or loss.
ANNUAL FINANCIAL STATEMENTS Notes to and forming part of the financial statements continued
Available-for-sale

89
If, in a subsequent period, the amount relating to impairment loss decreases and the decrease can be linked objectively to an event occurring after the impairment loss was recognised in profit or loss, the impairment loss is reversed through profit or loss for available-for-sale debt instruments. Any reversal of an impairment loss in respect of an available-for-sale equity instrument is recognised directly in OCI.
(iv) ReclassificationReclassifications of financial assets are permitted only in the following instances:
Held-to-maturity
Available-for-sale
Held-for-trading
Where the Bank is to sell more than an insignificant amount of held-to-maturity investments, the entire category would be tainted and reclassified as available-for-sale assets with the difference between amortised cost and fair value being accounted for in OCI.
The Bank may choose to reclassify financial assets that would meet the definition of loans and receivables if the Bank, at the date of reclassification, has the intention and ability to hold these financial assets for the foreseeable future or until maturity.
The Bank may choose to reclassify held-for-trading non-derivative financial assets in the following instances:�non-derivative trading assets out of the held-for-trading category if the financial asset is no longer held for the purpose of selling it in the near term;�non-derivative trading assets that would not otherwise have met the definition of loans and receivables are permitted to be reclassified out of the held-for-trading category only in rare circumstances; and�non-derivative trading assets that would meet the definition of loans and receivables out of the held-for- trading or available-for-sale categories if the Bank, at the date of reclassification, has the intention and ability to hold these financial assets for the foreseeable future or until maturity.
Reclassifications are made at fair value as of the reclassification date. Effective interest rates for financial assets reclassified to loans and receivables, held-to-maturity and available-for-sale categories are determined at the reclassification date. Subsequent increases in estimates of cash flows adjust the financial asset’s effective interest rates prospectively.
On reclassification of a trading asset, all embedded derivatives are reassessed and, if necessary, accounted for separately.
Nature
Held-for-trading
Designated at fair value through profit or loss
At amortised cost
Those financial liabilities incurred principally for the purpose of re-purchasing in the near term, those that form part of a portfolio of identified financial instruments that are managed together and for which there is evidence of a recent actual pattern of short-term profit taking.
Financial liabilities are designated to be measured at fair value in the following instances: �to eliminate or significantly reduce an accounting mismatch that would otherwise arise �where the financial liabilities are managed and their performance evaluated and reported on a fair value basis; and �where the financial liability contains one or more embedded derivatives that significantly modify the financial asset’s cash flows.
All other financial liabilities are not included in the above categories.
(v) Financial liabilities
(vi) Subsequent measurementSubsequent to initial measurement, financial liabilities are classified in their respective categories and measured at either amortised cost or fair value as follows:
Held-for-trading
Designated at fair value through profit or loss
At amortised cost
Fair value, with gains and losses arising from changes in fair value (including interest and dividends) recognised in trading revenue.
Fair value, with gains and losses recognised in interest expense for all financial liabilities.
Amortised cost using the effective interest method with interest recognised in interest expense.

90 Standard Bank Mauritius Annual integrated report 2015
(vii) Derecognition of financial assets and liabilitiesFinancial assets and liabilities are derecognised in the following instances:
Financial assets
Financial assets are derecognised when the contractual rights to receive cash flows from the financial assets have expired, or where the Bank has transferred its contractual rights to receive cash flows on the financial asset such that it has transferred substantially all the risks and rewards of ownership of the financial asset. Any interest in transferred financial assets that is created or retained by the Bank is recognised as a separate asset or liability.
The Bank enters into transactions whereby it transfers assets recognised in its statement of financial position, but retains either all or a portion of the risks or rewards of the transferred assets. If all or substantially all risks and rewards are retained, then the transferred assets are not derecognised. Transfers of assets with retention of all or substantially all risks and rewards include securities lending and repurchase agreements.
When assets are sold to a third party with a concurrent total rate of return swap on the transferred assets, the transaction is accounted for as a secured financing transaction, similar to repurchase transactions. In transactions where the Group neither retains nor transfers substantially all the risks and rewards of ownership of a financial asset, the asset is derecognised if control over the asset is lost. The rights and obligations retained in the transfer are recognised separately as assets and liabilities as appropriate.
In transfers where control over the asset is retained, the Bank continues to recognise the asset to the extent of its continuing involvement, determined by the extent to which it is exposed to changes in the value of the transferred asset.
The Bank derecognises a financial liability when its contractual obligations are discharged or cancelled or expired.
ANNUAL FINANCIAL STATEMENTS Notes to and forming part of the financial statements continued
Financial liabilities
Where an existing financial asset is replaced by another from the same party on substantially different terms, or the terms of an existing financial assets are substantially modified, such an exchange or modification is treated as a derecognition of the original asset and the recognition of a new asset, with the difference in the respective carrying amounts being recognised in profit or loss. In all other instances, the renegotiated asset effective interest rate is re-determined taking into account the renegotiated terms.
Where an existing liability is replaced by another from the same party on substantially different terms, or the terms of an existing financial liability are substantially modified, such an exchange or modification is treated as a derecognition of the original liability and the recognition of a new liability, with the difference in the respective carrying amounts being recognised in profit or loss. In all other instances, liabilities’ effective interest rate is re-determined taking into account the renegotiated terms.
Deposits and subordinated liabilitiesDeposits and subordinated liabilities are the Bank’s sources of debt funding.
When the Bank sells a financial asset and simultaneously enters into a “repo” or “stock lending” agreement to repurchase the asset (or a similar asset) at a fixed price on a future date, the arrangement is accounted for as a deposit, and the underlying asset continues to be recognised in the Bank’s financial statements.
The Bank classifies capital instruments as financial liabilities or equity instruments in accordance with the substance of the contractual terms of the instruments.
Deposits and subordinated liabilities are initially measured at fair value plus transaction costs, and subsequently measured at their amortised cost using the effective interest method, except where the Bank designates the liabilities at fair value through profit or loss (refer to significant accounting policies fair value measurement and financial assets and liabilities designated at fair value through profit or loss).

91
Financial guarantee contractsA financial guarantee contract is a contract that requires the Bank (issuer) to make specified payments to reimburse the holder for a loss it incurs because a specified debtor fails to make payment when due in accordance with the original or modified terms of a debt instrument. Financial guarantee contracts are initially recognised at fair value, which is generally equal to the premium received, and then amortised over the life of the financial guarantee. Subsequent to initial recognition, the financial guarantee liability is measured at the higher of the:�present value of any expected payment, when a payment under the guarantee has become probable; and�unamortised premium.
Derivatives and embedded derivativesIn the normal course of business, the Bank enters into a variety of derivative transactions for trading purposes. Derivative financial instruments are entered into for trading purposes and for hedging foreign exchange, interest rate, inflation, credit, commodity and equity exposures. Derivative instruments used by the Bank for trading activities include swaps, options, forwards, futures and other similar types of instruments based on foreign exchange rates, credit risk, inflation risk, interest rates and the prices of commodities and equities. Derivatives are initially recognised at fair value. Derivatives that are not designated in a qualifying hedge accounting relationship are classified as held-for-trading with all changes in fair value being recognised within trading revenue. This includes forward contracts to purchase or sell commodities, where net settlement occurs or where physical delivery occurs and the commodities are held to settle another derivative contract. All derivative instruments are carried as financial assets when the fair value is positive and as financial liabilities when the fair value is negative. Embedded derivatives included in hybrid instruments are treated and disclosed as separate derivatives when their economic characteristics and risks are not closely related to those of the host contract, the terms of the embedded derivative are the same as those of a stand-alone derivative and the combined contract is not measured at fair value through profit or loss. The financial host contracts are accounted for and measured applying the rules of the relevant financial instrument category. The method of recognising fair value gains and losses on derivatives designated as a hedging instrument depends on the nature of the hedge relationship.
Other
OffsettingFinancial assets and liabilities are offset and the net amount reported in the statement of financial position when there is a legally enforceable right to set-off the recognised amounts and there is an intention to settle the asset and the liability on a net basis, or to realise the asset and settle the liability simultaneously. Income and expenses are presented on a net basis only when permitted by the accounting standards, or for gains and losses arising from a group of similar transactions.
Renegotiated loans If the terms of a financial asset are renegotiated or modified or an existing financial asset is replaced with a new one due to financial difficulties of the borrower, then an assessment is made whether the financial asset should be derecognised. If the cash flows of the renegotiated asset are substantially different, then the contractual rights to cash flows from the original financial asset are deemed to have expired.
Loans that would otherwise be past due or impaired and whose terms have been renegotiated and exhibit the characteristics of a performing loan are reset to performing loan status. Loans whose terms have been renegotiated are subject to ongoing review to determine whether they are considered to be impaired or past due.
(c) Fair value
In terms of IFRS, the Bank is either required to or elects to measure a number of its financial assets and financial liabilities at fair value. Regardless of the measurement basis, the fair value is required to be disclosed, with some exceptions, for all financial assets and financial liabilities.
Fair value is the price that would be received to sell an asset or paid to transfer a liability in an orderly transaction in the principal (or most advantageous) market between market participants at the measurement date under current market conditions. Fair value is a market based measurement and uses the assumptions that market participants would use when pricing an asset or liability under current market conditions. When determining fair value it is presumed that the entity is a going concern and is not an amount that represents a forced transaction, involuntary liquidation or a distressed sale.
In estimating the fair value of an asset or a liability, the Bank takes into account the characteristics of the asset or liability that market participants would take into account when pricing the asset or liability at measurement date.
Inputs and valuations techniques
Portfolio valuations
Day one profit/loss
Fair value
Cost exception
Fair value hierarchy
Hierarchy transfers
Fair value level

92 Standard Bank Mauritius Annual integrated report 2015
Inputs and valuation techniquesFair value is measured based on quoted market prices or dealer price quotations for identical assets and liabilities that are traded in active markets, which can be accessed at the measurement date, and where those quoted prices represent fair value. If the market for an asset or liability is not active or the instrument is not quoted in an active market, the fair value is determined using other applicable valuation techniques that maximise the use of relevant observable inputs and minimises the use of unobservable inputs. These include the use of recent arm’s length transactions, discounted cash flow analyses, pricing
models and other valuation techniques commonly used by market participants.
Fair value measurements are categorised into level 1, 2 or 3 within the fair value hierarchy based on the degree to which the inputs to the fair value measurements are observable and the significance of the inputs to the fair value measurement.
Where discounted cash flow analyses are used, estimated future cash flows are based on management’s best estimates and a market related discount rate at the reporting date for an asset or liability with similar terms and conditions.
If an asset or a liability measured at fair value has both a bid and an ask price, the price within the bid-ask spread that is most representative of fair value is used to measure fair value.
The Bank’s valuation control framework governs internal control standards, methodologies, and procedures over its valuation processes, which include the following valuation techniques and main inputs and assumptions per type of instrument.
ANNUAL FINANCIAL STATEMENTS Notes to and forming part of the financial statements continued
Items
Derivative financial instruments
Trading assets and trading liabilities
Description
Derivative financial instruments comprise foreign exchange, interest rate, commodity, credit and equity derivatives that are either held-for-trading or designated as hedging instruments in hedge relationships.
Trading assets and liabilities comprise instruments which are part of the Bank’s underlying trading activities. These instruments primarily include sovereign and corporate debt, commodities, collateral, collateralised lending agreements and equity securities.
Valuation technique
Standard derivative contracts are valued using market accepted models and quoted parameter inputs. More complex derivative contracts are modelled using more sophisticated modelling techniques applicable to the instrument. Techniques include:
�discounted cash flow model;
�Black-Scholes model; and
�combination technique models.
Where there are no recent market transactions in the specific instrument, fair value is derived from the last available market price adjusted for changes in risks and information since that date. Where a proxy instrument is quoted in an active market, the fair value is determined by adjusting the proxy fair value for differences between the proxy instrument and the financial investment being fair valued. Where proxies are not available, the fair value is estimated using more complex modelling techniques. These techniques include discounted cash flow and Black-Scholes models using current market rates for credit, interest, liquidity, volatility and other risks. Combination techniques are used to value unlisted equity securities and include inputs such as earnings and dividend yields of the underlying entity.
Main inputs and assumptions(Level 2 and 3 fair value hierarchy items)
�Discount rate*
�Spot prices of the underlying
�Correlation factors
�Volatilities
�Dividend yields
�Earnings yield
�Valuation multiples

93
Items
Financial investments
Loans and advances to banks and customers
Deposits from bank and customers
Description
Financial investments are non-trading financial assets and primarily comprise of sovereign and corporate debt, listed and unlisted equity instruments, listed sovereign or corporate debt, investments in debentures issued by the South African Reserve Bank (SARB), investments in mutual fund investments and unit-linked investments.
Loans and advances comprise:
�Loans and advances to banks: call loans, loans granted under resale agreements and balances held with other banks.
�Loans and advances to customers: mortgage loans (home loans and commercial mortgages), other asset-based loans, including collateralised debt obligations (instalment sale and finance leases), and other secured and unsecured loans (card debtors, overdrafts, other demand lending, termlending and loans granted under resale agreements).
Deposits from banks and customers comprise amounts owed to banks and customers, deposits under repurchase agreements, negotiable certificates of deposit, credit-linked deposits and other deposits.
Valuation technique
For certain loans fair value may be determined from the market price of a recently occurring transaction adjusted for changes in risks and information between the transaction and valuation dates. Loans and advances are reviewed for observed and verified changes in credit risk and the credit spread is adjusted at subsequent dates if there has been an observable change in credit risk relating to a particular loan or advance. In the absence of an observable market for these instruments, discounted cash flow models are used to determine fair value. Discounted cash flow models incorporate parameter inputs for interest rate risk, foreign exchange risk, liquidity and credit risk, as appropriate. For credit risk, probability of default and loss given default parameters are determined using Credit Default Swaps (CDS) markets, where available and appropriate, as well as the relevant terms of the loan and loan counterparty such as the industry classification and subordination of the loan.
For certain deposits, fair value may be determined from the market price on a recently occurring transaction adjusted for all changes in risks and information between the transaction and valuation dates. In the absence of an observable market for these instruments discounted cash flow models are used to determine fair value based on the contractual cash flows related to the instrument. The fair value measurement incorporates all market risk factors including a measure of the Group’s credit risk relevant for that financial liability. The market risk parameters are valued consistently to similar instruments held as assets stated in the section above. The credit risk of the reference asset in the embedded CDS in credit-linked deposits is incorporated into the fair value of all credit-linked deposits that are designated to be measured at fair value through profit or loss. For collateralised deposits that are designated to be measured at fair value through profit or loss, such as securities repurchase agreements, the credit enhancement is incorporated into the fair valuation of the liability.
Main inputs and assumptions(Level 2 and 3 fair value hierarchy items)
�Discount rate*
* Discount rates, where applicable, include the risk-free rate, risk premiums, liquidity spreads, credit risk (own and counterparty as appropriate), timing of settlement, storage/service costs, prepayment and surrender risk assumptions and recovery rates/loss given default.

94 Standard Bank Mauritius Annual integrated report 2015
ANNUAL FINANCIAL STATEMENTS Notes to and forming part of the financial statements continued
Portfolio valuations The Bank has elected the portfolio exception to measure the fair value of certain groups of financial assets and financial liabilities. This exception permits the Group of financial assets and financial liabilities to be measured at fair value on a net basis. Day one profit or loss For financial instruments, where the fair value of the financial instrument differs from the transaction price, the difference is commonly referred to as day one profit or loss. Day one profit or loss is recognised in profit or loss immediately where the fair value of the financial instrument is either evidenced by comparison with other observable current market transactions in the same instrument, or is determined using valuation models with only observable market data as inputs.
Day one profit or loss is deferred where the fair value of the financial instrument is not able to be evidenced by comparison with other observable current market transactions in the same instrument, or determined using valuation models that utilise non-observable market data as inputs. The timing of the recognition of deferred day one profit or loss is determined individually depending on the nature of the instrument and availability of market observable inputs. It is either amortised over the life of the transaction, deferred until the instrument’s fair value can be determined using market observable inputs, or realised through settlement.
Cost exception Where the fair value of investments in equity instruments or identical instruments do not have a quoted price in an active
market, and derivatives that are linked to and must be settled by delivery of such equity instruments, are unable to be reliably determined, those instruments are measured at cost less impairment losses. Impairment losses on these financial assets are not reversed.
Fair value hierarchy The Bank’s financial instruments that are both carried at fair value and for which fair value is disclosed are categorised by level of fair value hierarchy. The different levels are based on the degree to which the inputs to the fair value measurements are observable and the significance of the inputs to the fair value measurement.
Hierarchy transfer policy Transfers of financial assets and financial liabilities between levels of the fair value hierarchy are deemed to have occurred at the end of the reporting period.
(d) Employee benefits
Post-employment benefits
Termination benefits
Short-term benefit
Employee benefits
Defined contribution plans
State pension plan
Hierarchy levels The levels have been defined as follows:
Level 1:Fair value is based on quoted market prices (unadjusted) in active markets for an identical financial asset or liability. An active market is a market in which transactions for the asset or liability take place with sufficient frequency and volume to provide pricing information on an ongoing basis.
Level 2:Fair value is determined through valuation techniques based on observable inputs, either directly, such as quoted prices, or indirectly, such as those derived from quoted prices. This category includes instruments valued using quoted market prices in active markets for similar instruments, quoted prices for identical or similar instruments in markets that are considered less than active or other valuation techniques where all significant inputs are directly or indirectly observable from market data.
Level 3:Fair value is determined through valuation techniques using significant unobservable inputs. This category includes all instruments where the valuation technique includes inputs not based on observable data and the unobservable inputs have a significant effect on the instrument’s valuation. This category includes instruments that are valued based on quoted prices for similar instruments where significant unobservable adjustments or assumptions are required to reflect differences between the instrument being valued and the similar instrument.

95
Type
Defined pension plans
Termination benefits
Short-term benefits
State pension plan
Description
The Bank operates a defined contribution plan.
A defined contribution plan is a pension plan under which the Bank pays fixed contributions into a separate entity.
The Bank has no legal or constructive obligations to pay further contributions if the fund does not hold sufficient assets to pay all employees the benefits relating to employee service in the current and prior periods.
The Bank pays contributions to a privately administered pension scheme on a contractual basis. The Bank has no further payment obligations once the contributions have been paid.
Termination benefits are recognised when the Bank is committed, without realistic possibility of withdrawal, to a formal detailed plan to terminate employment before the normal retirement date, or to provide termination benefits as a result of an offer made to encourage voluntary redundancy when it is probable that the offer will be accepted, and the number of acceptances can be estimated reliably.
Short-term benefits consist of salaries, accumulated leave payments, profit share, bonuses and any non-monetary benefits such as medical aid contributions.
Statutory contributions to the National Pension Scheme.
Statement of financial position
No direct impact.
A liability is recognised for the termination benefit representing the best estimate of the amount payable.
A liability is recognised for the amount expected to be paid under short-term cash bonus plans or accumulated leave if the Bank has a present legal or constructive obligation to pay this amount as a result of past service provided by the employee and the obligation can be estimated reliably.
A liability is recognised for the amount contributed by the employee.
Statement of othercomprehensive income
Accruals are recognised for unpaid contribution.
No direct impact.
No direct impact.
Income statement
The contributions are recognised as employee benefit expense in profit or loss when they are due.
Prepaid contributions are recognised as an asset to the extent that a cash refund or a reduction in the future payments is available.
Termination benefits are recognised as an expense if the Bank has made an offer encouraging voluntary redundancy, it is probable that the offer will be accepted, and the number of acceptances can be estimated reliably.
Short-term employee benefit obligations are measured on an undiscounted basis and are expensed as the related service is provided.
Expensed to profit or loss in the period in which they fall due.

96 Standard Bank Mauritius Annual integrated report 2015
ANNUAL FINANCIAL STATEMENTS Notes to and forming part of the financial statements continued
(e) Cash and cash equivalentsCash and cash equivalents comprise notes and coins on hand, unrestricted balances held with central banks and highly liquid assets with original maturities of three months or less from the acquisition date, which are subject to insignificant risk of changes in their fair value, and are used by the Bank in the management of its short-term commitments.
Cash and cash equivalents are carried at amortised cost in the statement of financial position.
(f) Non-financial assets (intangible assets and property and equipment)
Type
Tangible assets
Initial andsubsequent
measurement
Equipment, furniture, vehicles and other tangible assets are measured at cost less accumulated depreciation and accumulated impairment losses. Cost includes expenditure that is directly attributable to the acquisition of the asset.
Purchased software that is integral to the functionality of the related equipment is capitalised as part of the equipment.
Costs that are subsequently incurred are included in the asset’s related carrying amount or are recognised as a separate asset, as appropriate, only when it is probable that future economic benefits will flow to the Bank and the cost of the item can be measured reliably. Expenditure, which does not meet these criteria, is recognised in profit or loss as incurred. Depreciation, impairment losses and gains and losses on disposal of assets are included in profit or loss.
Where significant parts of an item of property or equipment have different useful lives, they are accounted for as separate items (major components)
Useful lives,depreciation/amortisation method or fair value basis
Property, plant and equipment are depreciated from the date that the assets are available for use.
Depreciation is calculated to write off the cost of items of property and equipment less their estimated residual values using the straight-line basis over the estimated useful lives of the assets. Depreciation is recognised in the profit or loss.
There has been no change to the estimated useful lives and depreciation method from those applied in the previous financial year.
Depreciation methods, useful lives and residual values are reviewed at each reporting date.
Impairment
Intangible assets that are subject to amortisation and other non-financial assets are reviewed for impairment at each reporting date and tested for impairment whenever events or changes in circumstances indicate that the carrying amount may not be recoverable.
An impairment loss is recognised in profit or loss for the amount by which the asset’s carrying amount exceeds its recoverable amount. The recoverable amount is the higher of an asset’s fair value less costs to sell and value in use. Fair value less costs to sell is determined by ascertaining the current market value of an asset and deducting any costs related to the realisation of the asset.
In assessing value in use, the estimated future cash flows are discounted to their present value using a pre-tax discount rate that reflects current market assessments of the time value of money and the risks specific to the asset.
For the purposes of assessing impairment, assets that cannot be tested individually are
Derecogntion
Items of property and equipment are derecognised on disposal or when future economic benefits are expected from their use or disposal. The gain or loss on derecognition is recognised in the profit or loss and is determined as the difference between the net disposal proceeds and the carrying amount of the non-financial asset.
Computer equipment
Office equipment
Furniture and fittings
Motor vehicles
3-5 years
8 years
2-10 years
5 years
Tangible assets
Intangible asset
Non-financial assets
Equipment
Computer software

97
Type
Tangible assets
Computer software
of property, plant and equipment.
Any gain or loss on disposal of an item of property and equipment (calculated as the difference between the net proceeds from disposal and the carrying amount of the item) is recognised within other income in profit or loss.
Costs associated with developing or maintaining computer software programs and the acquisition of software licenses are recognised as an expense as incurred.
However, direct computer software development costs that are clearly associated with an identifiable and unique system, which will be controlled by the Bank and have a probable future economic benefit beyond one year, are recognised as intangible assets.
Capitalisation is further limited to development cost where the Bank is able to demonstrate its intention and ability to complete and use the software and can reliably measure the costs to complete the development.
Direct costs include software development employee costs and an appropriate portion of relevant overheads.
Subsequent expenditure on computer software is capitalised only when it increases the future economic benefits embodied in the specific asset to which it relates.
Useful lives,depreciation/amortisation method or fair value basis
Amortisation is recognised from the date that the assets are available for use.
Amortisation is calculated to write off the cost of items of computer software less their estimated residual values using the straight-line basis over the estimated useful lives of the assets not exceeding five years.
Amortisation is recognised in the profit or loss. The carrying amount of capitalised computer software is reviewed annually and is written down when the carrying amount exceeds the recoverable amount.
Amortisation methods, useful lives and residual values are reviewed at each financial year-end and adjusted, if necessary.
Derecogntion
grouped at the lowest levels for which there are separately identifiable cash inflows from continuing use (cash-generating units).
An impairment loss is reversed if there has been a change in the estimates used to determine the recoverable amount.
An impairment loss is reversed through profit or loss only to the extent that the asset’s carrying amount does not exceed the carrying amount that would have been determined, net of depreciation or amortisation, if no impairment loss had been recognised.
Impairment
Initial andsubsequent
measurement

98 Standard Bank Mauritius Annual integrated report 2015
ANNUAL FINANCIAL STATEMENTS Notes to and forming part of the financial statements continued
(g) Equity-linked transactions
Equity-settled share-based payments
Cash-settled share-based payments
The Bank operates both equity-settled and cash-settled share-based compensation plans. All share options are accounted for as share-based payment transactions.
The fair value of equity-settled share options is determined on the grant date and accounted for as staff costs over the vesting period of the share options, with a corresponding increase in the share-based payment reserve. Non-market vesting conditions are not considered in the valuation but are included in the estimate of the number of options expected to vest. At each reporting date, the estimate of the number of options expected to vest is reassessed and adjusted against income and equity over the remaining vesting period.
On vesting of share options, amounts previously credited to the share-based payment reserve are transferred to retained earnings.
Cash-settled share-based payments settled are accounted for as liabilities at fair value until settled. The liability is recognised over the vesting period and is revalued at every reporting date and on settlement. Any changes in the fair value liability are recognised in operating expenses-staff costs.
(h) Leases
Type
Finance lease lessee
Operating lease lessee
Description
Leases, where the Bank assumes substantially all the risks and rewards incidental to ownership, are classified as finance leases.
All other leases are classified as operating leases.
Leases of assets are classified as operating leases if the lessor retains a significant portion of the risks and rewards of ownership.
Statement of financial position
The leased asset is capitalised at the inception of the lease at the lower of the fair value of the leased asset and the present value of the minimum lease payments together with an associated liability to the lessor.
Lease payments less the interest component, which is calculated using the interest rate implicit in the lease or the Bank’s incremental borrowing rate, are recognised as a capital repayment which reduces the liability to the lessor.
Accruals for unpaid lease charges, together with a straight-line lease asset or liability, being the difference between actual payments and the straight-line lease expense are recognised.
Income statement
A lease finance cost, determined with reference to the interest rate implicit in the lease or the Bank’s incremental borrowing rate, is recognised within interest expense over the lease period.
Payments made under operating leases, net of any incentives received from the lessor, are recognised in profit or loss on a straight-line basis over the term of the lease. Contingent rentals are expensed as they are incurred.
When an operating lease is terminated before the lease period has expired, any payment required to be made to the lessor by way of penalty is recognised as an expense in the period in which termination takes place.
Equity-settled share-based payments
Cash-settled share-based payments
Equity-linked transactions
Financial leases
Operating leases
Leases
Lessee
Lessee

99
Type
Non-current assets/disposal that are either held-for-sale
Description
Comprising assets and liabilities that are expected to be recovered primarily through sale rather than continuing use (including regular purchases and sales in the ordinary course of business).
Statement offinancial position
Immediately before classification as held-for-sale, the assets are re-measured in accordance with the Bank’s accounting policies and tested for impairment. Hereafter, the assets are measured at the lower of their carrying amount and fair value less costs to sell.
Assets and liabilities (or components of a disposal group) are presented separately in the statement of financial position.
Statement of other comprehensive income
OCI movements are presented separately.
Income statement
Impairment losses on initial classification as held-for-sale and subsequent gains and losses on re-measurement are recognised in profit or loss.
Property and equipment and intangible assets once classified as held-for-sale, are not depreciated or amortised.
(i) Non-current assets held-for-sale
(j) Provisions, contingent assets and contingent liabilities
Provisions
Contingent assets
Contingent liabilities
Provisions, contingent assets and contingent liabilities
Provision for restructuring
Provision for onerous contracts
Non-current assets held-for-sale
Non-Current assets held-for-sale/disposal groups

100 Standard Bank Mauritius Annual integrated report 2015
Provisions
Contingents assets
Contingent Liabilities
Provisions are recognised when the Bank has a present legal or constructive obligation as a result of past events and it is probable that an outflow of resources embodying economic benefits will be required to settle the obligation and a reliable estimate of the amount of the obligation can be made. Provisions are determined by discounting the expected future cash flows using a pre-tax discount rate that reflects current market assessments of the time value of money and, where appropriate, the risks specific to the liability. The Bank provisions typically (when applicable) include the following:
Provisions for legal claimsProvisions for legal claims are recognised on a prudent basis for the estimated cost for all legal claims that have not been settled or reached conclusion at the reporting date. In determining the provision management considers the probability and likely settlement (if any). Reimbursements of expenditure to settle the provision are recognised when and only when it is virtually certain that the reimbursement will be received.
Provisions for restructuringA provision for restructuring is recognised when the Bank has approved a detailed formal plan, and the restructuring either has commenced or has been announced publicly. Future operating costs or losses are not provided for.
Provisions for onerous contractsA provision for onerous contracts is recognised when the expected benefits to be derived by the Bank from a contract are lower than the unavoidable cost of meeting its obligations under the contract. The provision is measured at the present value of the lower of the expected cost of terminating the contract and the expected net cost of continuing with the contract. Before a provision is established, the Bank recognises any impairment loss on the assets associated with that contract.
Contingent assets are not recognised in the annual financial statements but are disclosed when, as a result of past events, it is probable that economic benefits will flow to the Bank, but this will only be confirmed by the occurrence or non-occurrence of one or more uncertain future events which are not wholly within the Bank control.
Contingent liabilities, which include certain guarantees other than financial guarantees, and letters of credit pledged as collateral security, are possible obligations that arise from past events whose existence will be confirmed only by the occurrence, or non-occurrence, of one or more uncertain future events not wholly within the Bank’s control. Contingent liabilities are not recognised in the financial statements but are disclosed in the notes to the financial statements unless they are remote.
ANNUAL FINANCIAL STATEMENTS Notes to and forming part of the financial statements continued
(k) Taxation
Type
Current tax-determined for current period transactions and events
Description, recognitionand measurement
Current tax and deferred tax are recognised in profit or loss except to the extent they relate to items recognised directly in equity or in OCI.
Current tax is the expected tax payable on the taxable income for the year, using tax rates enacted or substantively enacted at the reporting date, and any adjustment to tax payable in respect to prior years.
Description, recognition
Offsetting
Current and deferred tax assets and liabilities are offset if there is a legally enforceable right to offset current tax liabilities and assets, and they relate to income taxes levied by the same tax authority on the same taxable entity but they intend to settle current tax liabilities and assets on a net basis or their tax assets and liabilities will be realised simultaneously.
Direct taxation
Indirect taxTaxation
Current tax
Deferred tax

101
Type
Deferred tax-determined for future tax consequences
Indirect taxation
Description, recognitionand measurement
Deferred tax is recognised in respect of temporary differences between the carrying amounts of assets and liabilities for financial reporting purposes and the amounts used for taxation purposes. Deferred tax is not recognised for:
�temporary differences on the initial recognition of assets or liabilities in a transaction that is not a business combination and that effects neither accounting nor taxable profit or loss.
Deferred tax is measured at the tax rates that are expected to be applied to the temporary differences when they reverse, based on the laws that have been enacted or substantively enacted by the reporting date.
The amount of deferred tax provided is based on the expected manner of realisation or settlement of the carrying amount of the asset or liability and is not discounted.
Deferred tax asset are recognised for unused tax losses, tax credits and deductible temporary differences to the extent that it is probable that future taxable profits will be available against which they can be utilised. Deferred tax assets are reviewed at each reporting date and are reduced to the extent that it is no longer probable that the related tax benefit will be realised.
Indirect taxes, including non-recoverable Value Added Tax (VAT), skills development levies and other duties for banking activities are recognised in profit or loss and disclosed separately in the income statement.
Offsetting
N/A
(l) Revenue and expenditure
Net fee and commision revenue
Trading income
Other revenue
Revenue and expenditure
Net interest income
Non-interest revenue
Banking activities

102 Standard Bank Mauritius Annual integrated report 2015
ANNUAL FINANCIAL STATEMENTS Notes to and forming part of the financial statements continued
Type
Bank activities
Description
Net interest income
Net fee and commissionrevenue
Trading revenue
Other revenue
Recogniton and measurement
Interest income and expense are recognised in profit or loss on an accrual basis using the effective interest method for all interest-bearing financial instruments, except for those classified at fair value through profit or loss. In terms of the effective interest method, interest is recognised at a rate that exactly discounts estimated future cash payments or receipts through the expected life of the financial instrument or, where appropriate, a shorter period, to the carrying amount of the financial asset or liability. Direct incremental transaction costs incurred and origination fees received, including loan commitment fees, as a result of bringing margin-yielding assets or liabilities into the statement of financial position, are capitalised to the carrying amount of financial instruments that are not at fair value through profit or loss and amortised as interest income or expense over the life of the asset or liability as part of the effective interest rate.
Where the estimates of payments or receipts on financial assets are revised (except those that have been reclassified or financial liabilities that are subsequently revised refer to significant accounting policies (2.1) financial instruments), the carrying amount of the financial asset or financial liability is adjusted to reflect actual and revised estimated cash flows. The carrying amount is calculated by computing the present value of the estimated cash flows at the financial asset or financial liability’s original effective interest rate.
Any adjustment to the carrying value is recognised in Net Interest Income (NII).
Where financial assets have been impaired, interest income continues to be recognised on the impaired value based on the original effective interest rate.
Fair value gains and losses on realised debt financial instruments, including amounts reclassified from OCI in respect of available-for-sale debt financial assets, and excluding those classified as held-for-trading, are included in NII.
Interest income and expense on all trading assets and liabilities are considered to be incidental to the Bank’s trading operations and are presented together with all other changes in the fair value of trading assets and liabilities in net trading income (refer to significant accounting policies below (net trading revenue)).
Fair value changes on other derivatives held for risk management purposes, and other financial assets and liabilities carried at fair value through profit or loss, are presented in net income from other financial instruments carried at fair value through profit or loss and in the statement of profit or loss and OCI (refer to significant accounting policies (below) other revenue).
Fee and commission income, including transactional fees, account servicing fees, investment management fees, sales commission, placement fees and syndication fees are recognised as the related services are performed. Fees and commission income and expense that are integral to the effective interest rate on a financial asset or liability are included in the measurement of the effective interest rate. Loan syndication fees, where the Bank does not participate in the syndication or participates at the same effective interest rate for comparable risk as other participants, are recognised as revenue when the syndication has been completed. Syndication fees that do not meet these criteria are capitalised as origination fees and amortised as interest income.
The fair value of issued financial guarantee contracts on initial recognition is amortised as income over the term of the contract.
Fee and commission expense included in net fee and commission income are mainly transaction and service fees relating to financial instruments, which are expensed as the services are received. Expenditure is recognised as fee and commission expenses where the expenditure is linked to production of fee and commission revenue.
Net trading revenue comprises all gains and losses related to trading assets and liabilities, and include all realised and unrealised fair value changes, interest, dividends and foreign exchange differences.
Other revenue includes gains and losses on equity instruments designated at fair value through profit or loss, gains and losses on realised available-for-sale financial assets, dividends relating to those financial instruments and underwriting profit from the Bank’s short-term insurance operations and related insurance activities.
Net income from financial instruments designated at fair value though profit or loss includes all gains and losses from changes in the fair value of undated financial assets and liabilities, including dividend income arising on these financial instruments.

103
Other significant accounting policies
Segment reporting
Statutory credit risk reserve
(m) Other significant accounting policies
Related parties
Segment reporting
Statutory credit risk reserve
Related parties
An operating segment is a component of the Bank engaged in business activities, whose operating results are reviewed regularly by management in order to make decisions about resources to be allocated to segments and assessing segment performance. The Bank’s identification of segments and the measurement of segment results is based on the Bank’s internal reporting to the chief operating decision maker.
Transactions between segments are priced at market-related rates.
In accordance with the BoM Guidelines, the Bank’s business has been split into segment A and segment B:
�Segment A relates to banking business other than segment B business.
�Segment B is essentially directed to the provision of international financial services that give rise to foreign source income. Such services may be fund based or non-fund based.
The statutory credit risk reserve represents the amount by which local regulatory authorities requires an impairment provision which exceeds the IFRS impairments provision.
For the purposes of these financial statements, parties are considered to be related to the Bank if they have the ability, directly or indirectly, to control the Bank or exercise significant influence over the Bank in making financial and operating decisions, or vice versa, or where the Bank is subject to common control or common significant influence. Related parties may be individuals or other entities.
New standards and interpretations not yet adopted The following new or revised standards, amendments and interpretations are not yet effective for the year ended 31 December 2015 and have not been applied in preparing these annual financial statements.
Pronouncement
IFRS 9
Effective date
Annual periods beginning on or after 1 January 2018.
Title
Financial instruments This standard will replace the existing standard on the recognition and measurement of financial instruments and requires all financial assets to be classified and measured on the basis of the entity’s business model for managing the financial assets and the contractual cash flow characteristics of the financial assets.
The accounting for financial assets differs in various other areas to existing requirements such as embedded derivatives and the recognition of fair value adjustments in OCI.
All changes in the fair value of financial liabilities that are designated at fair value through profit or loss due to changes in own credit risk will be required to be recognised within OCI.
The standard has introduced a new expected-loss impairment model that will require more timely recognition of expected credit losses. This new model will apply to financial assets measured at either amortised cost or fair value through OCI, as well as loan commitments when there is present commitment to extend credit (unless these are measured at fair value through profit or loss).
With the exception of purchased or originated credit impaired financial assets, expected credit losses are required to be measured through a loss allowance at an amount equal to either 12-month expected credit losses or full lifetime expected credit losses.
A loss allowance for full lifetime expected credit losses is required for a financial instrument if the credit risk of that financial instrument has increased significantly since initial recognition as well as for certain contract assets or trade receivables. For all other financial instruments, expected credit losses are measured at an amount equal to 12-month expected credit losses.
The revised general hedge accounting requirements are better aligned with an entity’s risk management activities, provide additional opportunities to apply hedge accounting and various simplifications in achieving hedge accounting.
The standard will be applied retrospectively. The impact on the annual financial statements has not yet been fully determined.

104 Standard Bank Mauritius Annual integrated report 2015
ANNUAL FINANCIAL STATEMENTS Notes to and forming part of the financial statements continued
Pronouncement
IFRS 10 and IAS 28 (amendments)
IFRS 11 (amendments)
IFRS 15
IAS 27 (amendments)
IFRS 16
Effective date
Annual periods beginning on or after 1 January 2016
Annual periods beginning on or after 1 January 2016
Annual periods beginning on or after 1 January 2018
Annual periods beginning on or after 1 January 2016
Annual periods beginning on or after 1 January 2019
Title
Sale or contribution of assets between an investor and its associate or joint ventureThe amendments address an inconsistency between the requirements in IFRS 10 and those in IAS 28, in dealing with the sale or contribution of assets between an investor and its associate or joint venture. The main consequence of the amendments is that a full gain or loss is recognised when a transaction involves a business (whether it is housed in a subsidiary or not). A partial gain or loss is recognised when a transaction involves assets that do not constitute a business, even if these assets are housed in a subsidiary.
The amendments will be applied prospectively and are not expected to have a material impact on the Group’s financial statements.
Joint arrangements: accounting for acquisitions of interests in joint operationsThe amendments specify the appropriate accounting treatment for acquisitions of interests in joint operations in which the activities of the joint operation constitute a business.The amendments will be applied prospectively and are not expected to have a material impact on the Group’s financial statements.
Revenue from contracts with customersThis standard will replace the existing revenue standards and their related interpretations. The standard sets out the requirements for recognising revenue that applies to all contracts with customers (except for contracts that are within the scope of the standards on leases, insurance contracts or financial instruments).
The core principle of the standard is that revenue recognised reflects the consideration to which the company expects to be entitled in exchange for the transfer of promised goods or services to the customer.
The standard incorporates a five step analysis to determine the amount and timing of revenue recognition.
The standard will be applied retrospectively. The impact on the annual financial statements has not yet been fully determined.
Equity method in separate financial statementsThe amendments allow entities preparing separate financial statements to utilise the equity method to account for investments in subsidiaries, joint ventures and associates.
The standard will be applied retrospectively. The impact on the company’s annual financial statements has not yet been fully determined.
LeasesThis standard will replace the existing standard IAS 17 leases as well as the related interpretations and sets out the principles for the recognition, measurement, presentation and disclosure of leases for both parties to a contract, being the lessee (customer) and the lessor (supplier).
The core principle of this standard is that the lessee and lessor should recognise all rights and obligations arising from leasing arrangements on balance sheet.
The most significant change pertaining to the accounting treatment of operating leases is from the lessees’ perspective. IFRS 16 eliminates the classification of leases as either operating leases or finance leases as is required by IAS 17 and introduces a single lessee accounting model, where a Right of Use (ROU) asset together with a liability for the future payments is to be recognised for all leases with a term of more than 12 months, unless the underlying asset is of low value.
The lessor accounting requirements in IAS 17 has not changed substantially in terms of this standard as a result a lessor continues to classify its leases as operating leases or finance leases and accounts for these as it is currently done in terms of IAS 17.
In addition, the standard requires lessor to provide enhanced disclosures about its leasing activities and in particular about its exposure to residual value risk and how it is managed.
The standard will be applied retrospectively. The impact on the annual financial statements has not yet been fully determined.

105
3. Financial risk management
Introduction and overviewThis note presents information about the Bank’s exposure to financial risks and the Bank’s management of capital.
For information on the Bank’s financial risk management framework and definition of the various types of risks that affect the Bank, please refer to the risk management section of the management discussion and analysis.
The Bank has exposure to the following risk from financial instruments:
�credit risk;
�liquidity risk; and
�market risk.
We aim to be the leading corporate and investment banking business in, for and across
Africa, with a deep specialisation in natural resources.
Photo: Kenya

106 Standard Bank Mauritius Annual integrated report 2015 106
ANNUAL FINANCIAL STATEMENTS Notes to and forming part of the financial statements continued
20
15
US
D
91
34
4 9
12
-
14 9
08
25
9
106
25
3 1
71
(4 9
12 7
94
)
(58
7 5
51)
(5 5
00
34
5)
100
75
2 8
26 -
An
alys
is o
f cre
dit
qu
alit
y
Max
imu
m e
xpo
sure
to
cre
dit
ris
k
At
amo
rtis
ed c
ost
s
Nei
ther
pas
t d
ue
nor
imp
aire
d
Pas
t d
ue
bu
t n
ot im
pai
red
Ind
ivid
ual
ly im
pai
red
To
tal g
ross
am
ou
nt
All
ow
ance
fo
r im
pai
rmen
t
Ind
ivid
ual
Col
lect
ive
To
tal a
llo
wan
ce f
or
imp
airm
ent
Net
car
ryin
g a
mo
un
t
Ava
ilab
le-f
or-
sale
20
14
US
D
24
0 0
58
475
-
40
22
2 0
22
28
0 2
80
49
7
(2
7 9
29
58
0)
(2
514
04
6)
(30
44
3 6
26
)
24
9 8
36
871
-
20
13
US
D
32
6 1
50
38
5
65
04
8
72 8
84
914
39
9 1
00
34
7
(5
5 4
18 4
11)
(3
46
2 2
39
)
(5
8 8
80
65
0)
34
0 2
19 6
97 -
Loan
s an
d a
dva
nce
s to
cu
sto
mer
sLo
an a
nd
ad
van
ces
to b
anks
Inve
stm
ent
secu
riti
es
(a)
Cre
dit
ris
k T
he
tab
les
bel
ow s
et o
ut
info
rmat
ion
ab
out
the
cred
it q
ual
ity
of fi
nan
cial
ass
ets
and
th
e al
low
ance
for
imp
airm
ent
/los
s h
eld
by
the
Ban
k ag
ain
st t
hos
e as
sets
:
20
15
US
D
39
3 7
10 6
92 - -
39
3 7
10 6
92 - - -
39
3 7
10 6
92 -
20
14
US
D
2
70 1
17 6
16
-
-
270
117
616
-
-
-
270
117
616
-
20
13
US
D
35
1 18
6 5
80
-
-
35
1 18
6 5
80
-
-
-
35
1 18
6 5
80
-
20
15
US
D
4
74 6
59
-
-
474
65
9
-
-
-
-
474
65
9
20
14
US
D
2
66
1 9
58
-
-
2 6
61
95
8
-
-
-
-
2 6
61
95
8
20
13
US
D
16 4
98
218
-
-
16 4
98
218
-
-
-
-
16 4
98
218
As
at 3
1 D
ecem
ber
20
15, t
he
Ban
k’s
max
imu
m e
xpos
ure
to
off-
bal
ance
sh
eet
cred
it r
isk
was
US
D3
3 9
62
75
6 (
20
14: U
SD
85
76
1 5
59
).

107
20
15
US
D
17
53
3 4
44
53
7 5
93
-
74
35
3 8
52
92
42
4 8
89 - - - -
11 5
62
375
11 5
62
375
Ag
ain
st n
eith
er p
ast
du
e n
or
imp
aire
d
Pro
per
ty
Eq
uit
ies
Cas
h
Oth
er fl
oati
ng
char
ges/
assi
gnm
ents
an
d p
led
ges
To
tal
Pas
t d
ue
bu
t n
ot
imp
aire
d
Floa
tin
g ch
arge
Pro
per
ty
Ag
ain
st in
div
idu
ally
imp
aire
d
Floa
tin
g ch
arge
Pro
per
ty
20
14
US
D
22
12
2 4
14
1 4
33
16
6
85
42
9
216
40
7 4
11
24
0 0
48
42
0 - - -
23
66
3 3
73
16
55
8 5
33
40
22
1 9
06
20
13
US
D
51
419
70
0
1 3
52
23
1
1 3
16 7
48
29
6 3
46
62
1
35
0 4
35
30
0
65
04
5 -
65
04
5
53
775
273
19 1
09
64
1
72 8
84
914
Loan
s an
d a
dva
nce
s to
cu
sto
mer
sLo
an a
nd
ad
van
ces
to b
anks
Inve
stm
ent
secu
riti
es
Co
llat
eral
hel
d a
nd
oth
er c
red
it e
nh
ance
men
ts, a
nd
th
eir
fin
anci
al e
ffec
t
20
15
US
D
- - - - - - - - - - -
20
14
US
D
- - - - - - - - - - -
20
13
US
D
- - - - - - - - - - -
20
15
US
D
- - - - - - - - - - -
20
14
US
D
- - - - - - - - - - -
20
13
US
D
- - - - - - - - - - -
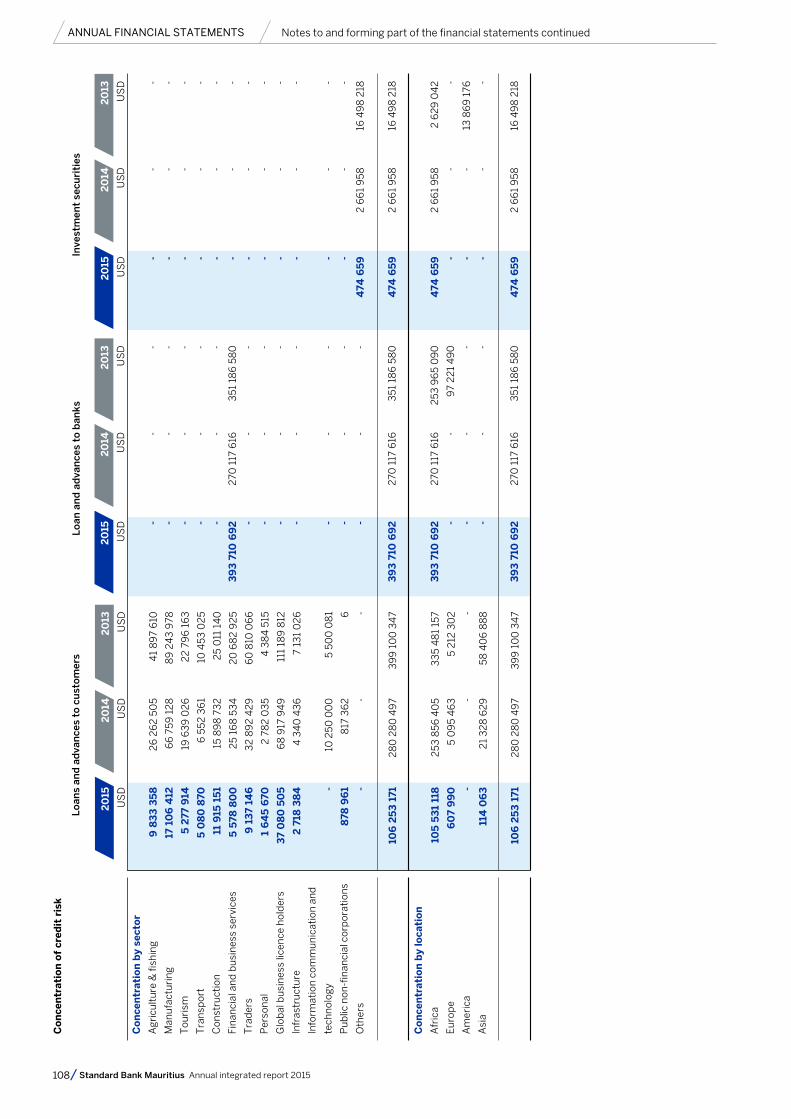
108 Standard Bank Mauritius Annual integrated report 2015
ANNUAL FINANCIAL STATEMENTS Notes to and forming part of the financial statements continued
20
15
US
D
9 8
33
35
8
17 1
06
412
5 2
77 9
14
5 0
80
870
11 9
15 1
51
5 5
78 8
00
9 1
37
146
1 6
45
670
37
08
0 5
05
2 7
18 3
84 -
878
96
1 -
106
25
3 1
71
105
53
1 11
8
60
7 9
90 -
114
06
3
106
25
3 1
71
Co
nce
ntr
atio
n b
y se
cto
r
Agr
icu
ltu
re &
fish
ing
Man
ufa
ctu
rin
g
Tou
rism
Tra
nsp
ort
Con
stru
ctio
n
Fin
anci
al a
nd
bu
sin
ess
serv
ices
Tra
der
s
Per
son
al
Glo
bal
bu
sin
ess
licen
ce h
old
ers
Infr
astr
uct
ure
Info
rmat
ion
com
mu
nic
atio
n a
nd
tech
nol
ogy
Pu
blic
non
-fin
anci
al c
orp
orat
ion
s
Oth
ers
Co
nce
ntr
atio
n b
y lo
cati
on
Afr
ica
Eu
rop
e
Am
eric
a
Asi
a
20
14
US
D
26
26
2 5
05
66
75
9 1
28
19
63
9 0
26
6 5
52
36
1
15
89
8 7
32
25
16
8 5
34
32
89
2 4
29
2 7
82
03
5
68
917
94
9
4 3
40
43
6
10
25
0 0
00
817
36
2 -
28
0 2
80
49
7
25
3 8
56
40
5
5 0
95
46
3 -
21
32
8 6
29
28
0 2
80
49
7
20
13
US
D
41
89
7 6
10
89
24
3 9
78
22
79
6 1
63
10 4
53
02
5
25
011
14
0
20
68
2 9
25
60
810
06
6
4 3
84
515
111
189
812
7 13
1 0
26
5 5
00
08
1 6 -
39
9 1
00
34
7
33
5 4
81
157
5 2
12 3
02
-
58
40
6 8
88
39
9 1
00
34
7
Loan
s an
d a
dva
nce
s to
cu
sto
mer
sLo
an a
nd
ad
van
ces
to b
anks
Inve
stm
ent
secu
riti
es
Co
nce
ntr
atio
n o
f cr
edit
ris
k
20
15
US
D
- - - - -
39
3 7
10 6
92 - - - - - - -
39
3 7
10 6
92
39
3 7
10 6
92 -
-
-
39
3 7
10 6
92
20
14
US
D
- - - - -
270
117
616
- - - - - - -
270
117
616
270
117
616
-
-
-
270
117
616
20
13
US
D - - - - -
35
1 18
6 5
80
- - - - - - -
35
1 18
6 5
80
25
3 9
65
09
0
97
22
1 4
90
-
-
35
1 18
6 5
80
20
15
US
D
- - - - - - - - - - - -
474
65
9
474
65
9
474
65
9
-
-
-
474
65
9
20
14
US
D
- - - - - - - - - - - -
2 6
61
95
8
2 6
61
95
8
2 6
61
95
8
-
-
-
2 6
61
95
8
20
13
US
D - - - - - - - - - - - -
16 4
98
218
16 4
98
218
2 6
29
04
2
-
13 8
69
176
-
16 4
98
218
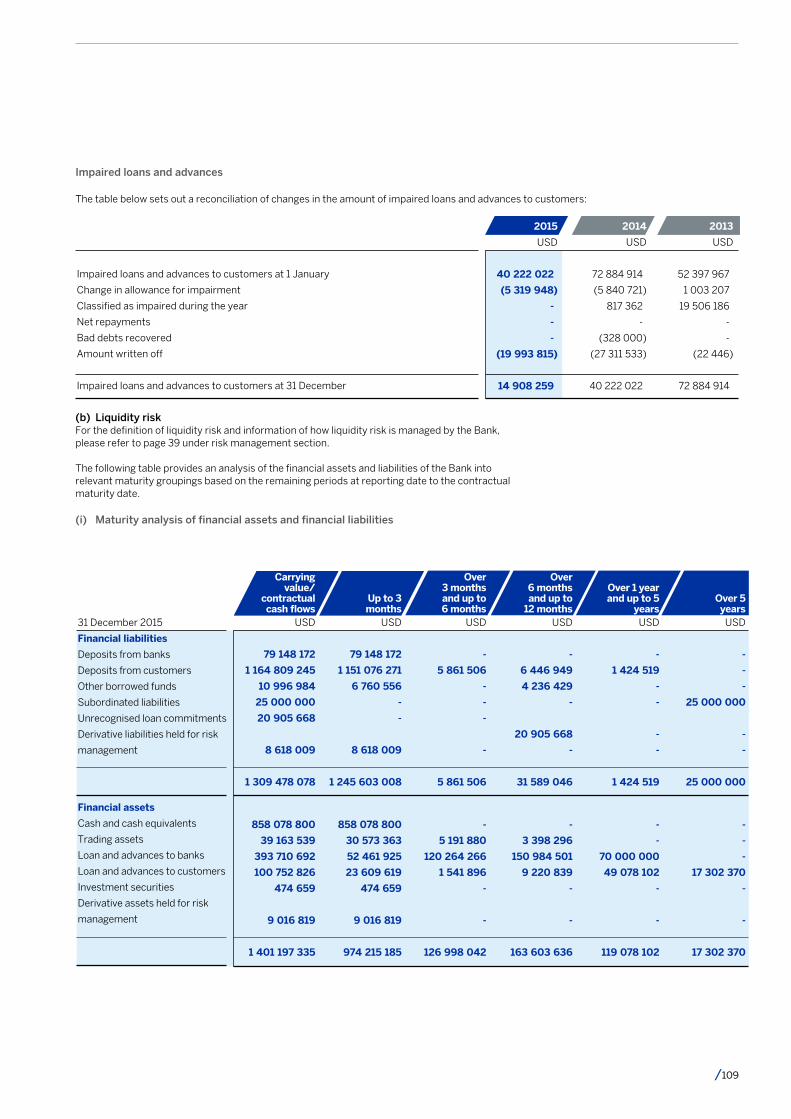
109
Impaired loans and advances
The table below sets out a reconciliation of changes in the amount of impaired loans and advances to customers:
Impaired loans and advances to customers at 1 January
Change in allowance for impairment
Classified as impaired during the year
Net repayments
Bad debts recovered
Amount written off
Impaired loans and advances to customers at 31 December
2015
USD
40 222 022
(5 319 948)
-
-
-
(19 993 815)
14 908 259
2014
USD
72 884 914
(5 840 721)
817 362
-
(328 000)
(27 311 533)
40 222 022
2013
USD
52 397 967
1 003 207
19 506 186
-
-
(22 446)
72 884 914
(b) Liquidity riskFor the definition of liquidity risk and information of how liquidity risk is managed by the Bank, please refer to page 39 under risk management section.
The following table provides an analysis of the financial assets and liabilities of the Bank into relevant maturity groupings based on the remaining periods at reporting date to the contractual maturity date.
(i) Maturity analysis of financial assets and financial liabilities
31 December 2015
Financial liabilities
Deposits from banks
Deposits from customers
Other borrowed funds
Subordinated liabilities
Unrecognised loan commitments
Derivative liabilities held for risk
management
Financial assets
Cash and cash equivalents
Trading assets
Loan and advances to banks
Loan and advances to customers
Investment securities
Derivative assets held for risk
management
USD
79 148 172
1 151 076 271
6 760 556
-
-
8 618 009
1 245 603 008
858 078 800
30 573 363
52 461 925
23 609 619
474 659
9 016 819
974 215 185
USD
79 148 172
1 164 809 245
10 996 984
25 000 000
20 905 668
8 618 009
1 309 478 078
858 078 800
39 163 539
393 710 692
100 752 826
474 659
9 016 819
1 401 197 335
Carrying value/
contractualcash flows
Up to 3 months
USD
-
6 446 949
4 236 429
-
20 905 668
-
31 589 046
-
3 398 296
150 984 501
9 220 839
-
-
163 603 636
USD
-
5 861 506
-
-
-
-
5 861 506
-
5 191 880
120 264 266
1 541 896
-
-
126 998 042
Over 3 monthsand up to6 months
Over 6 monthsand up to
12 monthsUSD
-
-
-
25 000 000
-
-
25 000 000
-
-
-
17 302 370
-
-
17 302 370
USD
-
1 424 519
-
-
-
-
1 424 519
-
-
70 000 000
49 078 102
-
-
119 078 102
Over 1 year and up to 5
yearsOver 5 years

Carrying value/
contractualcash flows
Up to 3 months
Over 3 monthsand up to6 months
Over 6 monthsand up to
12 months
Over 1 year and up to 5
yearsOver 5 years
110 Standard Bank Mauritius Annual integrated report 2015
ANNUAL FINANCIAL STATEMENTS Notes to and forming part of the financial statements continued
31 December 2014
Financial liabilities
Deposits from banks
Deposits from customers
Other borrowed funds
Trading liabilities
Subordinated liabilities
Unrecognised loan commitments
Derivative liabilities held for risk
management
Financial assets
Cash and cash equivalents
Trading assets
Loan and advances to banks
Loan and advances to customers
Investment securities
Derivative assets held for risk
management
USD
2 601 758
2 975 821 582
38 278 088
23 342 017
-
-
3 796 297
3 043 839 742
2 497 991 968
184 035 481
730 780
120 360 325
-
4 503 937
2 807 622 491
USD
22 885 089
3 025 659 257
43 455 945
23 342 017
25 000 000
15 462 256
3 796 297
3 159 600 861
2 497 991 968
184 035 481
270 117 616
280 280 497
2 661 958
4 503 937
3 239 591 457
USD
-
5 815 811
5 177 857
-
-
-
-
10 993 668
-
-
195 243 263
17 685 152
-
-
212 928 415
USD
20 283 331
40 756 312
-
-
-
15 462 256
-
76 501 899
-
-
24 128 372
6 759 691
2 661 958
-
33 550 021
USD
-
-
-
-
25 000 000
-
-
25 000 000
-
-
-
42 186 727
-
-
42 186 727
USD
-
3 265 552
-
-
-
-
-
3 265 552
-
-
50 015 201
93 288 602
-
-
143 303 803
31 December 2013
Financial liabilities
Deposits from banks
Deposits from customers
Trading liabilities
Subordinated liabilities
Other liabilities
Unrecognised loan commitments
Derivative liabilities held for risk
management
Other borrowed funds
Financial assets
Cash and cash equivalents
Trading assets
Loan and advances to banks
Loan and advances to customers
Investment securities
Derivative assets held for risk
management
355 725 816
825 700 043
-
-
11 794 793
-
6 065 708
5 796 495
1 205 082 855
1 429 027 700
223 637 126
-
154 995 789
497 883
6 047 463
1 814 205 961
355 725 816
1 776 766 143
2 349 153
25 000 000
11 794 793
3 000 000
6 065 708
154 292 412
2 334 994 025
1 429 027 700
223 637 126
351 186 580
399 100 347
16 498 218
6 047 463
2 425 497 434
-
298 239 624
-
-
-
-
-
-
298 239 624
-
-
97 144 381
3 006 109
14 358 711
-
114 509 201
-
259 781 833
2 349 153
-
-
3 000 000
-
-
265 130 986
-
-
74 740 351
42 552 625
1 641 624
-
118 934 600
-
-
-
25 000 000
-
-
-
-
25 000 000
-
-
-
34 247 146
-
-
34 247 146
-
393 044 643
-
-
-
-
-
148 495 917
541 540 560
-
-
179 301 848
164 298 678
-
-
343 600 526

111
(ii) Depositor concentrations
MUR deposits
Single depositor
Top ten depositors
Other foreign currency deposits
Single depositor
Top ten depositors
2015
%
12.10
61.82
6.44
31.66
2014
%
43.83
74.46
34.88
74.22
2013
%
19.66
49.10
24.29
58.89
Unencumbered surplus liquidity
Long-term funding ratio
2015
USD’000
505
3.44%
2014
USD’000
1 174
2.29%
2013
USD’000
805
11.44%
(iii) Liquidity reserves
Cash in hand
Foreign currency notes and coins
Unrestricted balances with central bank
Interbank placements
Balances with banks abroad
Government of Mauritius bonds/treasury bills
2015
USD
117 085
38 446
18 419 552
-
839 503 717
17 268 782
875 347 582
2014
USD
99 206
28 564
7 284 540
9 449 674
2 481 129 984
28 206 679
2 526 198 647
2013
USD
179 625
53 002
12 186 184
-
1 416 608 889
29 558 819
1 458 586 519

112 Standard Bank Mauritius Annual integrated report 2015
ANNUAL FINANCIAL STATEMENTS Notes to and forming part of the financial statements continued
(c) Market riskFor the definition of market risk and information of how market risk is managed by the Bank, please refer to page 42 under risk management section.
(i) Assets and liabilities subject to market risk between trading and non-trading portfolios:
Carrying amount
31 December 2015
Assets subject to market risk
Cash and cash equivalents
Trading assets
Derivative assets held for risk management
Loans and advances to banks
Loans and advances to customers
Investment securities
Liabilities subject to market risk
Deposits from banks
Deposits from customers
Trading liabilities
Derivative liabilities held for risk management
Other borrowed funds
Subordinated liabilities
31 December 2014
Assets subject to market risk
Cash and cash equivalents
Trading assets
Derivative assets held for risk management
Loans and advances to banks
Loans and advances to customers
Investment securities
Liabilities subject to market risk
Deposits from banks
Deposits from customers
Trading liabilities
Derivative liabilities held for risk management
Other borrowed funds
Subordinated liabilities
31 December 2013
Assets subject to market risk
Cash and cash equivalents
Trading assets
Derivative assets held for risk management
Loans and advances to banks
Loans and advances to customers
Investment securities
Liabilities subject to market risk
Deposits from banks
Deposits from customers
Trading liabilities
Derivative liabilities held for risk management
Other borrowed funds
Subordinated liabilities
USD
858 078 800
39 163 539
9 016 819
393 710 692
100 752 826
474 659
79 148 172
1 164 809 245
-
8 618 009
10 996 984
25 000 000
2 497 991 968
184 035 481
4 503 937
270 117 616
249 836 871
2 661 958
22 885 089
3 025 659 257
23 342 017
3 796 297
43 455 945
25 000 000
1 429 027 700
223 637 126
6 047 463
351 186 580
340 219 697
16 498 218
355 725 816
1 776 766 143
2 349 153
6 065 708
154 292 412
25 000 000
Trading portfolios
USD
-
39 163 539
-
-
-
-
-
-
-
-
-
-
-
184 035 481
-
-
-
-
-
-
23 342 017
-
-
-
-
223 637 126
-
-
-
-
-
-
2 349 153
-
-
-
Non-trading portfolios
USD
858 078 800
-
9 016 819
393 710 692
100 752 826
474 659
79 148 172
1 164 809 245
-
8 618 009
10 996 984
25 000 000
2 497 991 968
-
4 503 937
270 117 616
249 836 871
2 661 958
22 885 089
3 025 659 257
-
3 796 297
43 455 945
25 000 000
1 429 027 700
-
6 047 463
351 186 580
340 219 697
16 498 218
355 725 816
1 776 766 143
-
6 065 708
154 292 412
25 000 000

113
(ii) Exposure to market risks – Value at Risk The Bank applies a Value at Risk (VaR) methodology to its trading and non-trading portfolios, to estimate the market risk of positions held and the maximum losses expected, based upon a number of assumptions for various changes in market conditions. The Assets and Liabilities Committee (ALCO) sets limits on the value of risk that may be acceptable for the Bank, which are monitored on a daily basis by market risk.
VaR is a statistically based estimate of the potential loss on the current portfolio from adverse market movements. It expresses the ‘maximum’ amount the Bank might lose, but only to a certain level of confidence (95%). There is therefore a specified statistical probability (5%) that actual loss could be greater than the VaR estimate.
Max
20.0
15.3
14.6
14.6
2.0
Desk name
Bankwide
FX trading
Consolidated interest rate trading
Money markets trading
Money markets banking
Undiversified normal VaR
Diversified effect
Min
1.8
0.1
1.9
1.9
0.0
Avg
7.3
3.0
6.4
6.4
1.2
31-Dec-15
11.1
1.5
11.1
11.1
0.3
12.6
1.6
Limit
51.0
41.0
30.0
29.7
254.0
Diversified normal VaR exposures (USD’000)
(iii) Stress testsStress tests provide an indication of the potential size of losses that could arise in extreme conditions. The stress tests carried out by the Bank include: cross market stress testing where stress movements are applied to each risk factors across different markets; IR hypothetical stress testing where stress movements are applied to different interest rate scenarios and FX historical stress testing, where the impact of FX rate movements on the FX portfolio.
As VaR constitutes an integral part of the Bank’s market risk control regime, VaR limits are established by the Board annually for all trading non-trading portfolios. Actual exposure against limits, together with a consolidated group-wide VaR, is reviewed daily by Bank’s treasury and market risk.
The quality of the VaR model is continuously monitored by back-testing the VaR results for trading books. All back-testing exceptions and any exceptional revenues on the profit side of the VaR distribution are investigated.
Max
220.7
217.6
105.0
105.0
123.4
Desk name
Bankwide
FX trading
Consolidated Interest rate trading
Money markets trading
Money markets banking
Undiversified normal VaR
Diversified effect
Min
24.9
0.9
25.0
25.0
1.1
Avg
69.5
41.6
46.1
45.9
10.9
31-Dec-15
45.8
14.6
46.8
46.8
2.3
61.5
15.6
Limit
690.0
670.0
130.0
128.5
1 339.0
Stress VaR Exposures (USD’000)

114 Standard Bank Mauritius Annual integrated report 2015
(iv) Trading portfolio VaR by risk typeThe table below shows the minimum, maximum, average and year end normal VaR (1-day holding period) and stress VaR (10-day holding period) values for the last three years on the foreign exchange book. The average VaR is considered to be insignificant when compared to the Bank’s capital base and was contained well within the risk appetite of the Bank.
(v) Interest rate riskFor the definition of interest rate risk and information of how interest rate risk is managed by the Bank, please refer to page 44 under risk management section.
The Bank’s operations are subject to the risk of interest rate fluctuations to the extent that interest-earning assets and interest-bearing liabilities mature or are repriced at different times. Risk management activities are aimed at maximising NII; given market interest rate levels are consistent with the Bank’s strategies. The Board sets limits on the level of mismatch of interest rate repricing that may be undertaken.
The table below summarises the Bank’s exposure to interest rate risks. The Bank’s assets and liabilities at carrying amount are categorised by their repricing dates:
Normal VaR 2015
Normal VaR 2014
Normal VaR 2013
Stress VaR 2015
Stress VaR 2014
Stress VaR 2013
Year end
1 530
11 040
48 690
14 610
113 890
224 320
Min
110
6 120
48 690
910
67 320
223 710
Max
15 330
54 050
100 140
217 560
618 600
984 650
Avg
2 978
26 430
79 676
41 628
340 098
542 430
ANNUAL FINANCIAL STATEMENTS Notes to and forming part of the financial statements continued
31 December 2015
Financial assets
Cash and cash equivalents
Derivative assets held for risk management
Loans and advances to banks
Loans and advances to customers
Investment securities
Financial liabilities
Deposits from banks
Deposits from customers
Derivative liabilities held for risk management
Other borrowed funds
Subordinated liabilities
USD
-
-
103 940 587
1 541 896
474 659
105 957 142
-
12 308 456
-
-
25 000 000
37 308 456
68 648 686
USD
858 078 800
9 016 819
289 770 106
82 513 010
-
1 239 378 735
79 148 172
829 347 912
8 618 009
5 555 556
-
922 669 649
316 709 086
Less than 3months
Between3 months and
1 year
USD
858 078 800
9 016 819
393 710 692
100 752 826
474 659
1 362 033 796
79 148 172
1 164 809 245
8 618 009
10 996 984
25 000 000
1 288 572 410
73 461 386
USD
-
-
-
16 697 920
-
16 697 920
-
323 152 878
-
5 441 429
-
328 594 307
(311 896 387)
Over1 year Total
USD USD USDUSD

115
31 December 2014
Financial assets
Cash and cash equivalents
Trading assets
Derivative assets held for risk management
Loans and advances to banks
Loans and advances to customers
Investment securities
Financial liabilities
Deposits from banks
Deposits from customers
Trading liabilities
Derivative liabilities held for risk management
Other borrowed funds
Subordinated liabilities
USD
-
-
-
270 102 416
4 331 438
2 661 958
277 095 812
20 283 331
24 662 708
-
-
-
25 000 000
69 946 039
207 149 773
USD
2 497 991 968
184 035 481
4 503 937
-
234 377 974
-
2 920 909 360
2 601 758
3 000 996 549
23 342 017
3 796 297
-
-
3 030 736 621
(109 827 261)
Less than 3 months
Between3 months and
1 year
USD
2 497 991 968
184 035 481
4 503 937
270 117 616
249 836 871
2 661 958
3 209 147 831
22 885 089
3 025 659 257
23 342 017
3 796 297
43 455 945
25 000 000
3 144 138 605
65 009 226
USD
-
-
-
15 200
11 127 459
-
11 142 659
-
-
-
-
43 455 945
-
43 455 945
(32 313 286)
Over1 year Total
31 December 2013
Financial assets
Cash and cash equivalents
Trading assets
Derivative assets held for risk management
Loans and advances to banks
Loans and advances to customers
Investment securities
Financial liabilities
Deposits from banks
Deposits from customers
Trading liabilities
Derivative liabilities held for risk management
Other borrowed funds
Subordinated liabilities
-
-
-
296 169 794
6 824 872
15 249 893
318 244 559
40 450 630
125 036 973
2 349 153
-
5 796 495
-
173 633 251
144 611 308
1 429 027 700
223 637 126
6 047 463
-
302 491 061
1 248 325
1 962 451 675
166 779 272
1 651 605 763
-
6 065 708
-
-
1 824 450 743
138 000 932
1 429 027 700
223 637 126
6 047 463
351 186 580
340 219 697
16 498 218
2 366 616 784
355 725 816
1 776 766 143
2 349 153
6 065 708
154 292 412
25 000 000
2 320 199 232
46 417 552
-
-
-
55 016 786
30 903 764
-
85 920 550
148 495 914
123 406
-
-
148 495 917
25 000 000
322 115 237
(236 194 687)

116 Standard Bank Mauritius Annual integrated report 2015
ANNUAL FINANCIAL STATEMENTS Notes to and forming part of the financial statements continued
The management of interest rate risk against interest rate gap limits is supplemented by monitoring the sensitivity of the Bank’s financial assets and liabilities to various standard and non-standard interest rate scenarios. Analysis of the Bank’s sensitivity to an increase or decrease in market interest rate, assuming no asymmetrical movement in yield curves on a constant balance sheet position, is as follows:
The Bank has assets and liabilities primarily in USD, EUR, GBP, MUR and ZAR. These 5 currencies constitute 97% of the balance sheet with USD being the primary component with an 83% weighting on the overall balance sheet. A stress test of a 100 basis points (bps) (shock increased from 75bps due to changing US interest rate environment) increase in USD interest rates on the USD book would have resulted into an increase in NII of USD2 900 687. A stress test of a 100bps decrease in USD interest rates on the USD book would have resulted into a decrease in NII of USD3 649 229. The Bank’s banking book has been within the set limit for the past three years.
The table below shows the NII sensitivity for a change of 100bps:
NII sensitivity for a 100bps increase (75bps for 2014 and 2013)
NII sensitivity for a 100bps decrease (75bps for 2014 and 2013)
2015
26.49%
-33.42%
2014
9.51%
-9.51%
2013
8.60%
-8.91%
Note that we experienced a sharp increase in the sensitivity given that we actively and deliberately positioned the book for an interest rate hike in the United States by increasing the floating rate assets.
(vi) Currency riskThe Bank is exposed to currency risk through fluctuations in foreign currency exchange rates on its foreign currency positions. The Bank’s main operations in addition to USD are in EUR, GBP, ZAR and MUR. Limits on the level of exposure by currency and in total for both overnight and intra-day positions are being set by the Board and are monitored on an ongoing basis. As the Bank’s reporting currency is in USD, any fluctuations between movements in the reporting currency and the foreign currencies will be reflected on the financial statements as foreign currency gains or losses.
The table below summarises the Bank’s exposure to foreign currency at year end:
Currency
MUR
GBP
EUR
ZAR
Others
2015
USD
(341 366)
6 014
6 146
62 582
74 872
(191 752)
2014
USD
136 150
(3 126)
2 621
4 659
35 257
175 561
2013
USD
(352 598)
9 993
6 213
1 313
22 460
(312 619)
(d) Capital managementFor details and information on capital management please refer to pages 56 to 60 of the risk management section.
4. Fair values of financial instruments
In terms of IFRS, the Bank is either required to or elects to measure a number of its assets and liabilities at fair value, being the price that would be received to sell an asset or paid to transfer a liability in an orderly transaction between market participants at the measurement date. The existence of quoted prices in an active market represents the best evidence of fair value. Where such prices exist, they are used in determining the fair value of its assets and liabilities. Where quoted market prices are unavailable, the Bank establishes fair value using valuation techniques that incorporate inputs that are observable either directly (that is, as prices) or indirectly (that is, derived from prices) for such assets and liabilities. Where such inputs are not available, the Bank makes use of unobservable inputs in establishing fair value.
The Bank has established processes to independently validate the inputs into all fair value measurements. Independent price valuation discrepancies are reported to the Bank’s ALCO in order to ensure that fair value measurements are within acceptable risk tolerances and are fairly stated. The valuation models and techniques used in determining fair values are subject to independent validation and approval by appropriate technical teams respectively and are reviewed on at least an annual basis or more frequently if considered appropriate.

117
4. Fair values of financial instruments continued
The table below categorises the Bank’s assets and liabilities as at 31 December 2015 between that which is financial and non-financial. All financial assets and liabilities have been classified according to their measurement category.
31 December 2015
Assets
Cash and cash equivalents
Trading assets
Derivative assets held for risk
management
Loans and advances to banks
Loans and advances to customers
Investment securities
Liabilities
Deposits
Trading liabilities
Derivative liabilities held for risk
management
Other borrowed funds
Subordinated liabilities
USD
-
-
-
-
-
474 659
474 659
-
-
-
-
-
-
USD
-
39 163 539
9 016 819
-
-
-
48 180 358
-
-
8 618 009
-
-
8 618 009
TradingAvailable-for-sale
USD
-
-
-
-
-
-
-
1 243 957 417
-
-
10 996 984
25 000 000
1 279 954 401
USD
858 078 800
-
-
393 710 692
106 253 171
-
1 358 042 663
-
-
-
-
-
-
Loans & receivables
Other amortised
costs
USD
858 078 800
39 153 539
9 016 819
393 710 692
100 752 826
474 659
1 401 187 335
1 243 957 417
-
8 618 009
10 996 984
25 000 000
1 288 572 410
USD
858 078 800
39 153 539
9 016 819
393 710 692
100 752 826
474 659
1 401 187 335
1 243 957 417
-
8 618 009
10 996 984
25 000 000
1 288 572 410
Carrying value
Fairvalue
31 December 2014
Assets
Cash and cash equivalents
Trading assets
Derivative assets held for risk
management
Loans and advances to banks
Loans and advances to customers
Investment securities
Liabilities
Deposits
Trading liabilities
Derivative liabilities held for risk
management
Other borrowed funds
Subordinated liabilities
-
-
-
-
-
2 661 958
2 661 958
-
-
-
-
-
-
-
184 035 481
4 503 937
-
-
-
188 539 418
-
23 342 017
3 796 297
-
-
27 138 314
7 284 540
-
-
-
-
-
7 284 540
3 048 544 346
-
-
43 455 945
25 000 000
3 117 000 291
2 490 707 428
-
-
270 117 616
249 836 871
-
3 010 661 915
-
-
-
-
-
-
2 497 991 968
184 035 481
4 503 937
270 117 616
249 836 871
2 661 958
3 209 147 831
3 048 544 346
23 342 017
3 796 297
43 455 945
25 000 000
3 144 138 605
2 497 991 968
184 035 481
4 503 937
270 117 616
249 836 871
2 661 958
3 209 147 831
3 048 544 346
23 342 017
3 796 297
43 455 945
25 000 000
3 144 138 605

118 Standard Bank Mauritius Annual integrated report 2015
ANNUAL FINANCIAL STATEMENTS Notes to and forming part of the financial statements continued
31 December 2013
Assets
Cash and cash equivalents
Trading assets
Derivative assets held for risk
management
Loans and advances to banks
Loans and advances to customers
Investment securities
Liabilities
Deposits
Trading liabilities
Derivative liabilities held for risk
management
Other borrowed funds
Subordinated liabilities
USD
-
-
-
-
-
16 498 218
16 498 218
-
-
-
-
-
-
USD
-
223 637 126
6 047 463
-
-
-
229 684 589
-
2 349 153
6 065 708
-
-
8 414 861
TradingAvailable-for-sale
USD
12 418 811
-
-
-
-
-
12 418 811
2 132 491 959
-
-
154 292 412
25 000 000
2 311 784 371
USD
1 416 608 889
-
-
351 186 580
340 219 697
-
2 108 015 166
-
-
-
-
-
-
Loans & receivables
Other amortised
costs
USD
1 429 027 700
223 637 126
6 047 463
351 186 580
340 219 697
16 498 218
2 366 616 784
2 132 491 959
2 349 153
6 065 708
154 292 412
25 000 000
2 320 199 232
USD
1 429 027 700
223 637 126
6 047 463
351 186 580
340 219 697
16 498 218
2 366 616 784
2 132 491 959
2 349 153
6 065 708
154 292 412
25 000 000
2 320 199 232
Carrying value
Fairvalue
The tables that follow analyse the Bank’s financial assets and liabilities that are measured at fair value at the end of the reporting period, by level of fair value hierarchy as required by IFRS. The different levels are based on the extent to which observable market data and inputs are used in the calculation of the fair value of the financial assets and liabilities. The levels of the hierarchy are defined as follows:
Level 1 – fair values are based on quoted market prices (unadjusted) in active markets for an identical financial asset or liability. An active market is a market in which transactions for the asset or liability take place with sufficient frequency and volume to provide pricing information on an ongoing basis.
Level 2 – fair values are calculated using valuation techniques based on observable inputs, either directly (that is, as prices) or indirectly (that is, derived from prices). This category includes financial assets and liabilities valued using quoted market prices in active markets for similar financial assets or liabilities, quoted prices for identical or similar financial assets or liabilities in markets that are considered less than active or other valuation techniques where all significant inputs are directly or indirectly derived or corroborated from observable market data.
Level 3 – fair values are based on valuation techniques using significant unobservable inputs. This category includes financial assets and liabilities where the valuation technique includes unobservable inputs that have a significant effect on the financial asset or liability’s valuation. This category includes financial assets and liabilities that are valued based on quoted prices for similar financial assets or liabilities and for which significant unobservable adjustments or assumptions are required to reflect differences between the financial assets or liabilities.

119
Level 1
USD
858 078 800
-
-
-
18 756 979
-
8 409 274
885 245 053
-
921 385 830
-
-
-
-
921 385 830
31 December 2015
Assets
Cash and cash equivalents
Trading assets
Derivative assets held for risk management
Loans and advances to banks
Loans and advances to customers
Investment securities
Other assets
Liabilities
Deposits from banks
Deposits from customers
Trading liabilities
Derivative liabilities held for risk management
Other borrowed funds
Subordinated liabilities
Level 2
USD
-
39 163 539
9 016 819
393 710 692
85 850 559
474 659
4 097 161
532 313 429
79 148 172
243 423 415
-
8 618 009
10 996 984
25 000 000
367 186 580
Level 3
USD
-
-
-
-
1 645 633
-
1 122 878
2 768 511
-
-
-
-
-
-
-
Carrying value
USD
858 078 800
39 153 539
9 016 819
393 710 692
106 253 171
474 659
13 629 313
1 420 316 993
79 148 172
1 164 809 245
-
8 618 009
10 996 984
25 000 000
1 288 572 410
Fair value
USD
858 078 800
39 153 539
9 016 819
393 710 692
106 253 171
474 659
13 629 313
1 420 316 993
79 148 172
1 164 809 245
-
8 618 009
10 996 984
25 000 000
1 288 572 410
2 497 991 968
-
-
-
59 953 204
-
8 777 684
2 566 722 856
-
1 122 896 301
-
-
-
-
1 122 896 301
31 December 2014
Assets
Cash and cash equivalents
Trading assets
Derivative assets held for risk management
Loans and advances to banks
Loans and advances to customers
Investment securities
Other assets
Liabilities
Deposits from banks
Deposits from customers
Trading liabilities
Derivative liabilities held for risk management
Other borrowed funds
Subordinated liabilities
-
184 035 481
4 503 937
270 117 616
217 545 078
2 661 958
-
678 864 070
22 885 089
1 902 762 956
23 342 017
3 796 297
43 455 945
25 000 000
2 021 242 304
-
-
-
-
2 782 215
-
-
2 782 215
-
-
-
-
-
-
-
2 497 991 968
184 035 481
4 503 937
270 117 616
280 280 497
2 661 958
8 777 684
3 248 369 141
22 885 089
3 025 659 257
23 342 017
3 796 297
43 455 945
25 000 000
3 144 138 605
2 497 991 968
184 035 481
4 503 937
270 117 616
280 280 497
2 661 958
8 777 684
3 248 369 141
22 885 089
3 025 659 257
23 342 017
3 796 297
43 455 945
25 000 000
3 144 138 605

120 Standard Bank Mauritius Annual integrated report 2015
ANNUAL FINANCIAL STATEMENTS Notes to and forming part of the financial statements continued
Level 1
USD
1 429 027 700
-
-
-
-
-
11 684 939
1 440 712 639
-
1 341 952 599
-
-
-
-
1 341 952 599
31 December 2013
Assets
Cash and cash equivalents
Trading assets
Derivative assets held for risk management
Loans and advances to banks
Loans and advances to customers
Investment securities
Other assets
Liabilities
Deposits from banks
Deposits from customers
Trading liabilities
Derivative liabilities held for risk management
Other borrowed funds
Subordinated liabilities
Level 2
USD
-
223 637 126
4 916 639
351 186 580
335 835 182
2 629 042
-
918 204 569
355 725 816
434 813 544
2 349 153
5 853 190
154 292 412
25 000 000
978 034 115
Level 3
USD
-
-
1 130 824
-
4 384 515
13 869 176
-
19 384 515
-
-
-
212 518
-
-
212 518
Carrying value
USD
1 429 027 700
223 637 126
6 047 463
351 186 580
340 219 697
16 498 218
11 684 939
2 378 301 723
355 725 816
1 776 766 143
2 349 153
6 065 708
154 292 412
25 000 000
2 320 199 232
Fair value
USD
1 429 027 700
223 637 126
6 047 463
351 186 580
340 219 697
16 498 218
11 684 939
2 378 301 723
355 725 816
1 776 766 143
2 349 153
6 065 708
154 292 412
25 000 000
2 320 199 232
Fair value measurement disclosuresLevel 2 and level 3
The valuation techniques used in determining the fair value of assets and liabilities classified within level 2 and level 3 of the fair value hierarchy include the discounted cash flow model, Black-Scholes model, earnings multiple and sustainable earnings valuation methods and other valuation techniques commonly used by market participants. Such models are populated using market parameters that are corroborated by reference to independent market data, where possible, or alternative sources such as third party quotes, recent
transaction prices or suitable proxies. The inputs used include discount rates (including credit spreads), liquidity discount rates, risk-free and volatility rates, risk premiums, volatilities and correlations.
The fair value of level 3 assets and liabilities is determined using valuation techniques which incorporate assumptions that are not supported by prices from observable current market transactions in the same asset or liability and are not based on available observable market data. Changes in these assumptions could affect the reported fair values of these financial assets and liabilities. Where discounted cash flow analyses are
used, estimated future cash flows are based on management’s best estimates and a market-related discount rate at the reporting date for a financial asset or liability with similar terms and conditions.
Level 2 financial assets and financial liabilities
The following table sets out the company’s principal valuation techniques as at 31 December 2015 used in determining the fair value of its financial assets and financial liabilities that are classified within level 2 of the fair value hierarchy.
2015/2014/2013 Valuation basis/technique Main assumptions
Derivative instruments
Trading assets
Investments securities
Loans and advances to banks
Loans and advances to customers
Trading liabilities
Deposits from banks
Deposits from customers
Discounted cash flow modelBlack-Scholes modelMultiple valuation technique
Discounted cash flow modelBlack-Scholes model
Discounted cash flow modelBlack-Scholes modelMultiple valuation technique
Discounted cash flow model
Discounted cash flow model
Discounted cash flow model
Discounted cash flow model
Discounted cash flow model
Discount rateRisk-free rate, volatility rateValuation multiples
Discount rateRisk-free rate
Discount rate, liquidity discount rateRisk-free rateValuation multiples Discount rate
Discount rate
Discount rate
Discount rate
Discount rate

121
The following table provides a reconciliation of the opening to closing balance for all financial assets that are measured at fair value and incorporate inputs that are not based on observable market data (level 3).
Balance at 1 January 2013OriginationsSettlementsTransfers into level 3
Balance at 31 December 2013/1 January 2014
OriginationsSettlementsTransfers into level 3
Balance at 31 December 2014/31 December 2015
Derivative assets
USD
- - -
1 130 824
1 130 824
- (1 130 824)
-
-
Investment securities
USD
- - - 13 869 176
13 869 176
- (13 869 176)
-
-
The following table provides a reconciliation of the opening to closing balance for all financial liabilities that are measured at fair value and incorporate inputs that are not based on observable market data (level 3).
Balance at 31 December 2012/1 January 2013Transfers into level 3
Balance at 31 December 2013/1 January 2014Settlements
Balance at 31 December 2014/31 December 2015
Derivative liabilities
USD
-212 518
212 518(212 518)
-
Although the Bank believes that its estimates of fair values are appropriate, changing one or more of these assumptions to reasonably possible alternative values could impact the fair value of its assets and liabilities. The behaviour of the unobservable parameters used to fair value level 3 financial assets and liabilities is not necessarily independent, and may often hold a relationship with other observable and unobservable market parameters. Where material and possible, such relationships are captured in the
valuation by way of correlation factors, though these factors are, themselves, frequently unobservable. In such instances, the range of possible and reasonable fair value estimates is taken into account when determining appropriate model adjustments.
The table below indicates the valuation techniques and main assumptions used in the determination of the fair value of the level 3 financial assets and liabilities measured at fair value on a recurring basis. The table
further indicates the effect that a significant change in one or more of the inputs to a reasonably possible alternative assumption would have on profit or loss at the reporting date (where the change in the input would change the fair value of the asset or liability significantly). The changes in the inputs that have been used in the analysis below have been determined taking into account several considerations such as the nature of the asset or liability and the market within which the asset or liability is transacted.
(1%) - 1%(1%) - 1%
(1) - 1
(1%) - 1%
1% - 1% (1) - 1
1% - 1%
1% - 1%
1% - 1%
Derivative instruments
Trading assets
Investment securities
Loans and advances to customers
Trading liabilities
Discounted cash flow modelBlack-Scholes modelCombination technique
Discounted cash flow model
Discounted cash flow model
Combination technique
Discounted cash flow model
Discounted cash flow model
Discount rateRisk-free rate, volatility rateMultiple
Discount rate
Discount rate, liquidity discount rateMultipleLiquidity discount rate
Discount rate
Discount rate
2015/2014/2013 Valuation basis/technique Main assumptionsVariance in fair value
measurement
The valuation techniques used in determining the fair value of financial assets and liabilities classified within level 3.

122 Standard Bank Mauritius Annual integrated report 2015
ANNUAL FINANCIAL STATEMENTS Notes to and forming part of the financial statements continued
5. Use of estimates and judgement
Key sources of estimation uncertainty
Allowances for credit losses
Assets accounted for at amortised cost are evaluated for impairment on a basis described in accounting policy 2.1 (b) (iii).
The specific counterparty component of the total allowances for impairment applies to loans and advances evaluated individually for impairment and are based upon management’s best estimate of the present value of the cash flows that are expected to be received. In estimating these cash flows, management makes judgements about a counterparty’s financial situation and the net realisable value of any underlying collateral. Each impaired asset is assessed on its merits, and the workout strategy and estimate of cash flows considered recoverable are independently approved by management.
Critical accounting judgements in applying the Bank’s accounting policies Collectively assessed impairment allowances cover credit losses inherent in portfolios of loans and advances with similar economic characteristics when there is objective evidence to suggest impairments, but the individual impaired items cannot yet be identified. A component of collectively assessed allowances is for country risks. In assessing the need for collective loan loss allowances, management considers factors such as credit quality, portfolio size, concentrations, and economic factors. In order to estimate the required allowance, assumptions are made to define the way inherent losses are modelled and to determine the required input parameters, based on historical experience and current economic conditions. The accuracy of the allowances depends on how well these estimate future cash flows for specific counterparty allowances and the model assumptions and parameters used in determining collective allowances.
Determining fair valuesThe determination of fair value for financial assets and liabilities for which there is no observable market price requires the use of valuation techniques as described in accounting policy 2.1 (c). For financial instruments that trade infrequently and have little price transparency, fair value is less objective, and requires varying degrees of judgement depending on liquidity, concentration, uncertainty of market factors, pricing assumptions and other risks affecting the specific instrument.
Financial asset and liability classificationThe Bank’s accounting policies provide scope for assets and liabilities to be designated on inception into different accounting categories in certain circumstances:
In classifying financial assets or liabilities as “trading”, the Bank has determined that it meets the description of trading assets and liabilities set out in accounting policy 2.1 (b) (ii).
Details of the Bank’s classification of financial assets and liabilities are given in note 4.

123
20
15
US
D
18 5
75 0
84
39
16
3 5
39
3 9
90
613
32
6 8
43
26
44
9 0
07
474
65
9
2 8
71 6
08
26
64
5
870
912
11 5
49
714
104
29
8 6
24
23
110
70
0
104
88
0 4
15
-
3 4
11 4
73
-
-
36
0 0
00
7 8
48
58
3
139
611
171
-
1 6
14 0
53
14 4
55
02
4
16 0
69
077
155
68
0 2
48
Ass
ets
Cas
h a
nd
cas
h e
qu
ival
ents
Tra
din
g as
sets
Der
ivat
ive
asse
ts h
eld
for
risk
man
agem
ent
Loan
s an
d a
dva
nce
s to
ban
ks
Loan
s an
d a
dva
nce
s to
cu
stom
ers
Inve
stm
ent
secu
riti
es
Pro
per
ty, p
lan
t an
d e
qu
ipm
ent
Inta
ngi
ble
ass
ets
Def
erre
d t
ax a
sset
s
Oth
er a
sset
s
To
tal a
sset
s
Lia
bil
itie
s
Dep
osit
s fr
om b
anks
Dep
osit
s fr
om c
ust
omer
s
Tra
din
g lia
bili
ties
Der
ivat
ives
liab
iliti
es h
eld
for
risk
man
agem
ent
Oth
er b
orro
wed
fun
ds
Su
bor
din
ated
liab
iliti
es
Cu
rren
t ta
x lia
bili
ties
Oth
er li
abili
ties
To
tal l
iab
ilit
ies
Sh
areh
old
ers’
eq
uit
y
Sh
are
cap
ital
Oth
er r
eser
ves
Ret
ain
ed e
arn
ings
To
tal e
qu
ity
attr
ibu
tab
le t
o
equ
ity
ho
lder
s
To
tal e
qu
ity
and
liab
ilit
ies
20
14
US
D
16
86
1 9
84
184
03
5 4
81
1 8
13 7
24
73
0 7
80
54
52
6 5
61
2 6
61
95
8
3 2
94
570
40
55
4
1 0
27
912
11
95
6 3
34
276
94
9 8
58
1 78
4 3
67
103
93
4 5
82
23
34
2 0
17
1 6
19 4
44
-
-
-
7 5
94
20
8
138
274
618
-
1 4
08
64
4
12 6
89
34
5
14 0
97
98
9
152
372
60
7
20
13
US
D
12 4
18 8
12
22
3 6
37
126
2 7
30
52
0 -
50
99
4 0
93
2 6
29
04
2
4 1
60
12
5
71 4
28
1 70
6 9
12
14 8
04
99
0
313
15
3 0
48
-
167
06
0 8
03
2 3
49
15
3
1 6
05
60
5 - -
119
018
5 4
22
077
176
55
6 6
56
-
1 3
64
32
8
11 9
72 2
67
13 3
36
59
5
189
89
3 2
51
Seg
men
t A
Seg
men
t B
Ban
k
6. S
egm
enta
l rep
orti
ng
Sta
tem
ent
of
fin
anci
al p
osi
tio
n a
s at
31
Dec
emb
er 2
015
20
15
US
D
83
9 5
03
716 -
5 0
26
20
6
39
3 3
83
84
9
74 3
03
819 -
-
-
30
6 0
88
2 0
79 5
99
1 3
14 6
03
277
56
03
7 4
72
1 0
59
92
8 8
30 -
5 2
06
53
6
10
99
6 9
84
25
00
0 0
00
179
00
0
33
12
5 9
81
1 19
0 4
74 8
03
35
00
0 0
00
8 9
47
64
0
28
79
9 2
10
72 7
46
85
0
1 2
63
22
1 6
53
20
14
US
D
2
48
1 12
9 9
84
-
2 6
90
213
26
9 3
86
83
6
19
5 3
10 3
10
-
-
-
1 0
88
08
8
4 3
67
744
2 9
53
973
175
21
100
72
2
2 9
21
724
675
-
2 1
76 8
53
43
45
5 9
45
25
00
0 0
00
-
2 0
02
83
1
3 0
15 4
61
02
6
35
00
0 0
00
6 0
14 4
18
22
074
98
2
63
08
9 4
00
3 0
78 5
50
42
6
20
13
US
D
1 4
16 6
08
88
8 -
3 3
16 9
43
35
1 18
6 5
80
28
9 2
25
60
4
13 8
69
176
- -
1 9
47
08
8
4 6
62
66
1
2 0
80
816
94
0
35
5 7
25
816
1 6
09
70
5 3
40 -
4 4
60
10
3
154
29
2 4
12
25
00
0 0
00
129
42
8
6 3
72 7
16
2 1
55
68
5 8
15
35
00
0 0
00
6 0
14 4
38
7 3
76 4
84
48
39
0 9
22
2 2
04
076
73
7
20
15
US
D
85
8 0
78 8
00
39
16
3 5
39
9 0
16 8
19
39
3 7
10 6
92
100
75
2 8
26
474
65
9
2 8
71 6
08
26
64
5
1 17
7 0
00
13 6
29
313
1 4
18 9
01
90
1
79
14
8 1
72
1 16
4 8
09
24
5
-
8 6
18 0
09
10
99
6 9
84
25
00
0 0
00
53
9 0
00
40
974
56
4
1 3
30
08
5 9
74
35
00
0 0
00
10 5
61
69
3
43
25
4 2
34
88
815
92
7
1 4
18 9
01
90
1
20
14
US
D
2 4
97
99
1 9
68
18
4 0
35
48
1
4 5
03
93
7
270
117
616
24
9 8
36
871
2 6
61
95
8
3 2
94
570
40
55
4
2 1
16 0
00
16
32
4 0
78
3 2
30
92
3 0
33
22
88
5 0
89
3 0
25
65
9 2
57
23
34
2 0
17
3 7
96
29
7
43
45
5 9
45
25
00
0 0
00
-
9 5
97
03
9
3 1
53
73
5 6
44
35
00
0 0
00
7 4
23
06
2
34
76
4 3
27
77 1
87
38
9
3 2
30
92
3 0
33
20
13
US
D
1 4
29
02
7 70
0
22
3 6
37
126
6 0
47
46
3
35
1 18
6 5
80
34
0 2
19 6
97
16 4
98
218
4 1
60
12
5
71 4
28
3 6
54
00
0
19 4
67
65
1
2 3
93
96
9 9
88
35
5 7
25
816
1 77
6 7
66
14
3
2 3
49
15
3
6 0
65
70
8
154
29
2 4
12
25
00
0 0
00
24
8 4
46
11 7
94
79
3
2 3
32
24
2 4
71
35
00
0 0
00
7 3
78 7
66
19 3
48
75
1
61
727
517
2 3
93
96
9 9
88
Not
e
7 8 9 10 11 12 13 14 15 16 17 18 8 9 19 20 21
22
23

124 Standard Bank Mauritius Annual integrated report 2015
ANNUAL FINANCIAL STATEMENTS Notes to and forming part of the financial statements continued
20
15
US
D
2 0
15 4
30
(1
24
8 9
34
)
766
49
6
48
2 9
13
(2
30
64
3)
25
2 2
70
4 6
78 1
13
(24
5 6
78)
219
33
6
4 6
51
771
5 6
70 5
37
317
44
3
(1
149
79
8)
(114
39
7)
(79
4 9
09
)
(93
2 8
11)
(2
674
472
)
2 9
96
06
5
(58
2 8
54
)
2 4
13 2
11
Inte
rest
inco
me
Inte
rest
exp
ense
Net
inte
rest
inco
me
Fee
and
com
mis
sion
inco
me
Fee
and
com
mis
sion
exp
ense
Net
fee
an
d c
om
mis
sio
n in
com
e
Net
trad
ing
inco
me
Net
(los
s)/i
ncom
e fr
om o
ther
fina
ncia
l
inst
rum
ents
car
ried
at f
air v
alue
Oth
er in
com
e
Op
erat
ing
inco
me
Net
impa
irm
ent l
oss
reve
rsal
/(ch
arge
)
on fi
nanc
ial a
sset
s
Per
sonn
el e
xpen
ses
Ope
ratin
g le
ase
expe
nses
Dep
reci
atio
n an
d am
ortis
atio
n
Oth
er e
xpen
ses
Pro
fit/
(lo
ss)
bef
ore
inco
me
tax
Inco
me
tax
(exp
ense
)/cr
edit
Pro
fit/
(lo
ss)
for
the
year
20
14
US
D
3 3
20
10
0
(1 7
61
39
8)
1 5
58
70
2
700
92
2
(3
09
45
2)
39
1 4
70
4 1
02
00
0
28
4 9
76
278
95
8
4 6
65
93
4
6 6
16 1
06
(1 9
85
)
(1 4
89
914
)
(16
6 0
06
)
(90
2 6
07)
(1 2
60
48
6)
(3
82
0 9
98
)
2 7
95
10
8
(2 0
78 0
10)
717
09
8
20
13
US
D
5 3
76 1
56
(1 8
25
516
)
3 5
50
64
0
1 3
41
189
(4
35
53
4)
90
5 6
55
3 9
77 6
72
68
34
4
28
2 1
71
4 3
28
18
7
8 7
84
48
2
(25
8 3
42
)
(2 1
54
99
5)
(23
8 5
62
)
(82
0 4
72)
(1 4
35
42
4)
(4
90
7 79
5)
3 8
76 6
87
(616
08
8)
3 2
60
59
9
Seg
men
t A
Seg
men
t B
Ban
k
Inco
me
stat
emen
t fo
r th
e ye
ar e
nd
ed 3
1 D
ecem
ber
20
15
20
15
US
D
19
13
0 7
10
(5
72
0 1
96
)
13 4
10 5
14
6 9
01
107 -
6
90
1 10
7
6
219
06
2 - -
6 2
19 0
62
26
53
0 6
83
4 6
32
02
3
(5 3
79 5
49
)
(53
5 2
28
)
-
(5 0
41
80
0)
(
6 3
24
55
4)
20
20
6 1
29
(1 0
13 8
57)
19
19
2 2
72
20
14
US
D
2
2 7
97
54
5
(8
62
0 3
28
)
14
177
217
7 0
17 0
12
(17
6 1
93
)
6 8
40
819
4 5
81
797 - -
4 5
81
797
2
5 5
99
83
3
1 12
7 4
76
(5 7
64
95
2)
(64
2 3
31)
-
(4 5
77 5
48
)
(9
85
7 3
55
)
15
74
2 4
78
(1 0
44
00
0)
14
69
8 4
78
20
13
US
D
2
4 3
75 4
45
(1
0 8
47
376
)
13
52
8 0
69
6 7
97
62
6
(18
7 6
62
)
6 6
09
96
4
13
3 1
72
- -
133
172
2
0 2
71 2
05
(18
479
82
6)
(
5 7
44
98
5)
(5
50
50
8)
-
(
3 7
87
168
)
(2
8 5
62
48
7)
(8
29
1 2
82
)
767
615
(7
52
3 6
67)
20
15
US
D
21
146
14
0
(6
96
9 1
30
)
14 1
77 0
10
7 3
84
02
0
(2
30
64
3)
7 15
3 3
77
10
89
7 17
5
(2
45
678
)
219
33
6
10 8
70 8
33
32
20
1 2
20
4 9
49
46
6
(6 5
29
34
7)
(64
9 6
25
)
(79
4 9
09
)
(5
974
611
)
(8 9
99
02
6)
23
20
2 1
94
(1 5
96
711
)
21
60
5 4
83
20
14
US
D
26
117
64
5
(10
38
1 72
6)
1
5 7
35
919
7 7
17 9
34
(4
85
64
5)
7 2
32
28
9
8 6
83
79
7
28
4 9
76
278
95
8
9 2
47
731
32
215
93
9
1 12
5 4
91
(7
25
4 8
66
)
(8
08
33
7)
(9
02
60
7)
(5
83
8 0
34
)
(13
678
35
3)
18 5
37
58
6
(3 1
22
010
)
15 4
15 5
76
20
13
US
D
2
9 7
51
60
1
(12
672
89
2)
17 0
78 7
09
8 1
38
815
(62
3 1
96
)
7 5
15 6
19
4 1
10 8
44
68
34
4
28
2 1
71
4 4
61
35
9
29
05
5 6
87
(18
73
8 1
68
)
(7 8
99
98
0)
(78
9 0
70)
(82
0 4
72)
(5 2
22
59
2)
(33
470
28
2)
(4 4
14 5
95
)
151
52
7
(4 2
63
06
8)
Not
e
25 26 27 28 29 30 31 32
13&
14
33 34

125
20
15
US
D
2 4
13 2
11
86
8
86
8
2 4
14 0
79
2 4
14 0
79
2 4
14 0
79
Pro
fit/(
loss
) fo
r th
e ye
ar
Oth
er c
om
pre
hen
sive
inco
me
Net
gai
n/(
loss
) on
ava
ilab
le-f
or-s
ale
finan
cial
ass
ets
Oth
er c
om
pre
hen
sive
inco
me/
(lo
ss)
for
the
year
To
tal c
om
pre
hen
sive
in
com
e/(l
oss
)
for
the
year
To
tal c
om
pre
hen
sive
inco
me/
(lo
ss)
attr
ibu
tab
le t
o e
qu
ity
ho
lder
s
20
14
US
D
717
09
8
4 5
39
4 5
39
721
63
7
721
63
7
721
63
7
20
13
US
D
3 2
60
59
9
(35
69
1)
(35
69
1)
3 2
24
90
8
3 2
24
90
8
3 2
24
90
8
Seg
men
t A
Seg
men
t B
Ban
k
Sta
tem
ent
of
pro
fit
or
loss
an
d o
ther
co
mp
reh
ensi
ve in
com
e as
at
31
Dec
emb
er 2
015
20
15
US
D
19 1
92
272
- -
19 1
92
272
19 1
92
272
19 1
92
272
20
14
US
D
14
69
8 4
78
- -
14 6
98
478
14 6
98
478
14 6
98
478
20
13
US
D
(7 5
23
66
7) - -
(7 5
23
66
7)
(7 5
23
66
7)
(7 5
23
66
7)
20
15
US
D
21
60
5 4
83
86
8
86
8
21
60
6 3
51
21
60
6 3
51
21
60
6 3
51
20
14
US
D
15 4
15 5
76
4 5
39
4 5
39
15 4
20
115
15 4
20
115
15 4
20
115
20
13
US
D
(4 2
63
06
8)
(35
69
1)
(35
69
1)
(4 2
98
75
9)
(4 2
98
75
9)
(4
29
8 7
59
)
Not
e

126 Standard Bank Mauritius Annual integrated report 2015
ANNUAL FINANCIAL STATEMENTS Notes to and forming part of the financial statements continued
Bank total
Cash in hand
Foreign currency notes and coins
Unrestricted balances with central bank
Interbank placements
Balances with banks abroad
2015
USD
117 085
38 446
18 419 553
-
839 503 716
858 078 800
2014
USD
99 206
28 564
7 284 540
9 449 674
2 481 129 984
2 497 991 968
2013
USD
179 625
53 002
12 186 184
-
1 416 608 889
1 429 027 700
7. Cash and cash equivalents
Cash and cash equivalents consist of:
Segment A
Cash in hand
Foreign currency notes and coins
Interbank placements
Unrestricted balances with central bank
Segment B
Balances with banks abroad
117 085
38 446
-
18 419 553
18 575 084
839 503 716
99 206
28 564
9 449 674
7 284 540
16 861 984
2 481 129 984
179 625
53 002
-
12 186 185
12 418 812
1 416 608 888
Trading assets
Bank total & segment A
Non-derivatives
Treasury bills
Treasury notes
Money market
16 793 922
-
22 369 617
39 163 539
25 544 721
-
158 490 760
184 035 481
26 153 262
776 515
196 707 349
223 637 126
8. Trading assets and liabilities
Trading liabilities
Bank total & segment A
Derivative liabilities-money market - 23 342 017 2 349 153

127
9. D
eriv
ativ
e as
sets
/Lia
bili
ties
hel
d fo
r ri
sk m
anag
emen
t
Fair
val
ues
Th
e fa
ir v
alu
e of
a d
eriv
ativ
e fin
anci
al in
stru
men
t re
pre
sen
ts, f
or q
uot
ed in
stru
men
ts, t
he
qu
oted
mar
ket
pri
ce a
nd
for
un
qu
oted
inst
rum
ents
, th
e p
rese
nt
valu
e of
th
e p
osit
ive
or n
egat
ive
cash
flow
s, w
hic
h w
ould
hav
e oc
curr
ed if
th
e ri
ghts
an
d o
blig
atio
ns
aris
ing
from
th
at in
stru
men
t w
ere
clos
ed o
ut
in a
n o
rder
ly m
arke
t p
lace
tra
nsa
ctio
n a
t ye
ar e
nd
. Th
e B
ank
use
s d
eriv
ativ
es t
o m
anag
e it
s ex
pos
ure
to
fore
ign
cu
rren
cy, i
nte
rest
rat
e an
d c
red
it r
isk.
Th
e in
stru
men
ts u
sed
incl
ud
e in
tere
st s
wap
s, c
ross
cu
rren
cy s
wap
s, fo
rwar
d c
ontr
acts
, op
tion
s.
Fai
r va
lue
asse
ts
US
D
8 6
38
6 9
75 4
02
2 0
32
779
-
9 0
16 8
19
8 6
38
3 7
49
16
1
23
2 8
14
3 9
90
613
-
3 2
26
24
1
1 7
99
96
5
-
5 0
26
20
6
Ban
k t
ota
l
Inte
rest
rat
e
Op
tion
s
Fore
ign
exc
han
ge
Cre
dit
Seg
men
t A
Inte
rest
rat
e
Op
tion
s
Fore
ign
exc
han
ge
Seg
men
t B
Inte
rest
rat
e
Op
tion
s
Fore
ign
exc
han
ge
Cre
dit
Fai
r va
lue
liab
ilit
ies
US
D
8 6
38
6 9
75 1
68
1 6
34
20
3
-
8 6
18 0
09
8 6
38
3 2
26
00
6
176
82
9
3 4
11 4
73
-
3 7
49
16
2
1 4
57
374
-
5 2
06
53
6
No
min
al
amo
un
t
US
D
65
3 4
39
415
70
3 8
65
22
3 2
71 7
76
-
63
9 6
29
08
0
65
3 4
39
32
2 6
17 5
77
19 5
70 0
65
34
2 8
41
08
1 -
93
08
6 2
88
20
3 7
01
711 -
29
6 7
87
99
9
20
15
Fai
r va
lue
asse
ts
US
D
213
99
8
2 6
34
35
2
1 6
55
58
7
-
4 5
03
93
7
2
13 9
98
1
50
3 9
62
9
5 7
64
1 8
13 7
24
-
1 13
0 3
89
1
55
9 8
24 -
2 6
90
213
Fai
r va
lue
liab
ilit
ies
US
D
213
99
8
2 6
34
35
2
98
4 0
54
-
3 7
96
29
7 -
1 13
0 3
90
4
89
05
4
1 6
19 4
44
213
99
8
1 5
03
85
5
45
9 0
00 -
2
176
85
3
No
min
al
amo
un
t
US
D
5 9
37
52
5
186
13
0 4
33
103
23
1 9
85 -
29
5 2
99
94
3
5 9
37
52
5
143
50
9 2
64
21
69
3 4
05
171
140
19
4 -
42
62
1 16
9
81
53
8 5
80 -
124
15
9 7
49
20
14
Fai
r va
lue
asse
ts
US
D
68
2 6
90
2 9
19 4
90
1 3
10 3
62
1 13
4 9
21
6 0
47
46
3
6
82
69
0
2
014
99
9
3
2 8
31
2 7
30
52
0 -
90
4 4
91
1 2
77 5
31
1 13
4 9
21
3 3
16 9
43
Fai
r va
lue
liab
ilit
ies
US
D
68
2 6
90
3 0
23
30
9
2 1
47
189
212
52
0
6 0
65
70
8 -
90
4 4
91
70
1 11
4
1 6
05
60
5
68
2 6
90
2 1
18 8
18
1 4
46
075
212
52
0
4 4
60
10
3
No
min
al
amo
un
t
US
D
11 2
21
612
141
168
073
95
15
8 2
21
15 0
00
00
0
26
2 5
47
90
6
11 2
21
612
108
60
9 1
41
5 4
18 7
32
125
24
9 4
85 -
32
55
8 9
32
89
73
9 4
89
15 0
00
00
0
137
29
8 4
21
20
13
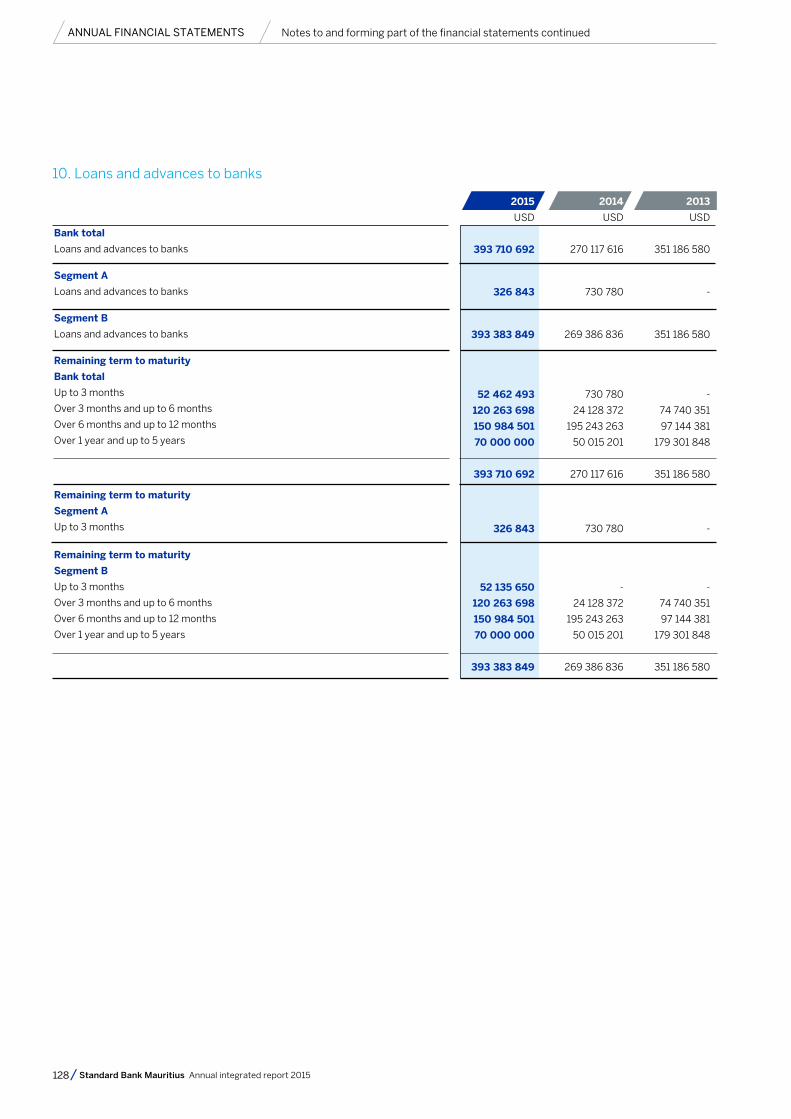
128 Standard Bank Mauritius Annual integrated report 2015
ANNUAL FINANCIAL STATEMENTS Notes to and forming part of the financial statements continued
Bank total
Loans and advances to banks
Segment A
Loans and advances to banks
Segment B
Loans and advances to banks
Remaining term to maturity
Bank total
Up to 3 months
Over 3 months and up to 6 months
Over 6 months and up to 12 months
Over 1 year and up to 5 years
Remaining term to maturity
Segment A
Up to 3 months
Remaining term to maturity
Segment B
Up to 3 months
Over 3 months and up to 6 months
Over 6 months and up to 12 months
Over 1 year and up to 5 years
2015
USD
393 710 692
326 843
393 383 849
52 462 493
120 263 698
150 984 501
70 000 000
393 710 692
326 843
52 135 650
120 263 698
150 984 501
70 000 000
393 383 849
2014
USD
270 117 616
730 780
269 386 836
730 780
24 128 372
195 243 263
50 015 201
270 117 616
730 780
-
24 128 372
195 243 263
50 015 201
269 386 836
2013
USD
351 186 580
-
351 186 580
-
74 740 351
97 144 381
179 301 848
351 186 580
-
-
74 740 351
97 144 381
179 301 848
351 186 580
10. Loans and advances to banks

129
Bank total
Personal loans
Corporate customers
Entities outside Mauritius
Less specific allowance for impairment 11 (d)
Less collective allowance for impairment 11 (d)
Loans and advances to customers
Segment A
Personal loans
Corporate customers
Less specific allowance for impairment
Less collective allowance for impairment 11 (e)
Loans and advances to customers
Segment B
Personal loans
Corporate customers
Entities outside Mauritius
Less specific allowance for impairment
Less collective allowance for impairment 11 (e)
2015
USD
1 645 670
68 020 923
36 586 578
106 253 171
(4 912 794)
(587 551)
100 752 826
537 744
30 941 966
31 479 710
(4 912 851)
(117 852)
26 449 007
1 107 926
37 078 957
36 586 578
74 773 461
57
(469 699)
74 303 819
2014
USD
1 519 520
128 748 063
150 012 914
280 280 497
(27 929 580)
(2 514 046)
249 836 871
1 519 520
59 830 114
61 349 634
(6 374 928)
(448 145)
54 526 561
-
68 917 949
150 012 914
218 930 863
(21 554 652)
(2 065 901)
195 310 310
2013
USD
1 789 402
167 217 715
230 093 230
399 100 347
(55 418 411)
(3 462 239)
340 219 697
1 789 402
56 027 904
57 817 306
(6 420 565)
(402 648)
50 994 093
-
111 189 811
230 093 230
341 283 041
(48 997 846)
(3 059 591)
289 225 604
11. Loans and advances to customers

130 Standard Bank Mauritius Annual integrated report 2015
Bank total
Up to 3 months
Over 3 months and up to 6 months
Over 6 months and up to 12 months
Over 1 year and up to 5 years
Over 5 years
Remaining term to maturity
Segment A
Up to 3 months
Over 3 months and up to 6 months
Over 6 months and up to 12 months
Over 1 year and up to 5 years
Over 5 years
Remaining term to maturity
Segment B
Up to 3 months
Over 3 months and up to 6 months
Over 6 months and up to 12 months
Over 1 year and up to 5 years
Over 5 years
2015
USD
33 008 529
2 784 938
9 220 839
50 905 818
10 333 047
106 253 171
27 742 582
537 592
-
3 197 988
-
31 478 162
5 265 947
2 247 346
9 220 839
47 707 830
10 333 047
74 775 009
2014
USD
120 360 325
6 759 691
17 685 153
93 288 602
42 186 726
280 280 497
38 949 993
6 411 342
1 530 066
14 458 233
-
61 349 634
81 410 332
348 349
16 155 087
78 830 369
42 186 726
218 930 863
2013
USD
154 995 789
42 552 625
3 006 109
164 298 678
34 247 146
399 100 347
34 224 742
15 435 085
1 353 235
6 713 996
90 248
57 817 306
120 771 047
27 117 540
1 652 874
157 584 682
34 156 898
341 283 041
(a) Remaining term to maturity
ANNUAL FINANCIAL STATEMENTS Notes to and forming part of the financial statements continued

131
Bank total
Agriculture and fishing
Manufacturing
Tourism
Transport
Construction
Financial and business services
Traders
Personal
Global business licence holders
Others
Segment A
Agriculture and fishing
Manufacturing
Tourism
Transport
Construction
Financial and business services
Traders
Personal
Others
Segment B
Agriculture and fishing
Manufacturing
Tourism
Transport
Construction
Financial and business services
Traders
Personal
Global business licence holders
Others
2015
USD
9 833 358
17 106 412
5 277 914
5 080 870
11 915 151
5 578 800
9 137 146
1 645 670
37 080 505
3 597 345
106 253 171
-
3 311 495
-
-
11 915 151
5 578 800
6 537 627
537 744
3 597 345
31 478 162
9 833 358
13 794 917
5 277 914
5 080 870
-
-
2 599 519
1 107 926
37 080 505
-
74 775 009
2014
USD
26 262 505
66 759 128
19 639 026
6 552 361
15 898 732
25 168 534
32 892 429
2 782 035
68 917 949
15 407 798
280 280 497
-
6 482 929
-
-
14 866 787
21 819 127
11 513 644
1 519 520
5 147 627
61 349 634
26 262 505
60 276 199
19 639 026
6 552 361
1 031 945
3 349 407
21 378 785
1 262 515
68 917 949
10 260 171
218 930 863
2013
USD
41 897 610
89 243 978
22 796 163
10 453 025
25 011 140
20 682 925
60 810 066
4 384 515
111 189 811
12 631 114
399 100 347
-
7 606 104
15
-
18 061 761
17 420 965
5 808 026
1 789 402
7 131 033
57 817 306
41 897 610
81 637 874
22 796 148
10 453 025
6 949 379
3 261 960
55 002 040
2 595 113
111 189 812
5 500 080
341 283 041
(b) Credit concentration of risk by industry sectors

132 Standard Bank Mauritius Annual integrated report 2015
Africa
Europe
Oceania & others
2015
USD
105 531 118
607 990
114 063
106 253 171
2014
USD
253 952 588
5 095 443
21 232 466
280 280 497
2013
USD
335 481 157
5 212 302
58 406 888
399 100 347
(c) Segmental analysis geographical area
ANNUAL FINANCIAL STATEMENTS Notes to and forming part of the financial statements continued
Balance at 31 December 2012
Provision for credit impairment for the year
Loans written off out of allowance
Provisions released
Balance at 31 December 2013
Provision for credit impairment for the year
Loans written off out of allowance
Bad debts recovered
Provisions released
Balance at 31 December 2014
Provision for credit impairment for the year
Loans written off out of allowance
Bad debts recovered
Provisions released
Balance at 31 December 2015
Specific allowances for
impairment
USD
36 057 398
19 407 181
(22 446)
(23 722)
55 418 411
1 080 175
(27 311 533)
(328 000)
(929 473)
27 929 580
469 402
(19 993 815)
(2 952 000)
(540 373)
4 912 794
(d) Allowance for credit impairment
Portfolio allowances for
impairment
USD
4 085 348
1 401 186
-
(2 024 295)
3 462 239
702 444
-
-
(1 650 637)
2 514 046
126 980
-
-
(2 053 475)
587 551
Total
USD
40 142 746
20 808 367
(22 446)
(2 048 017)
58 880 650
1 782 619
(27 311 533)
(328 000)
(2 580 110)
30 443 626
596 382
(19 993 815)
(2 952 000)
(2 593 848)
5 500 345
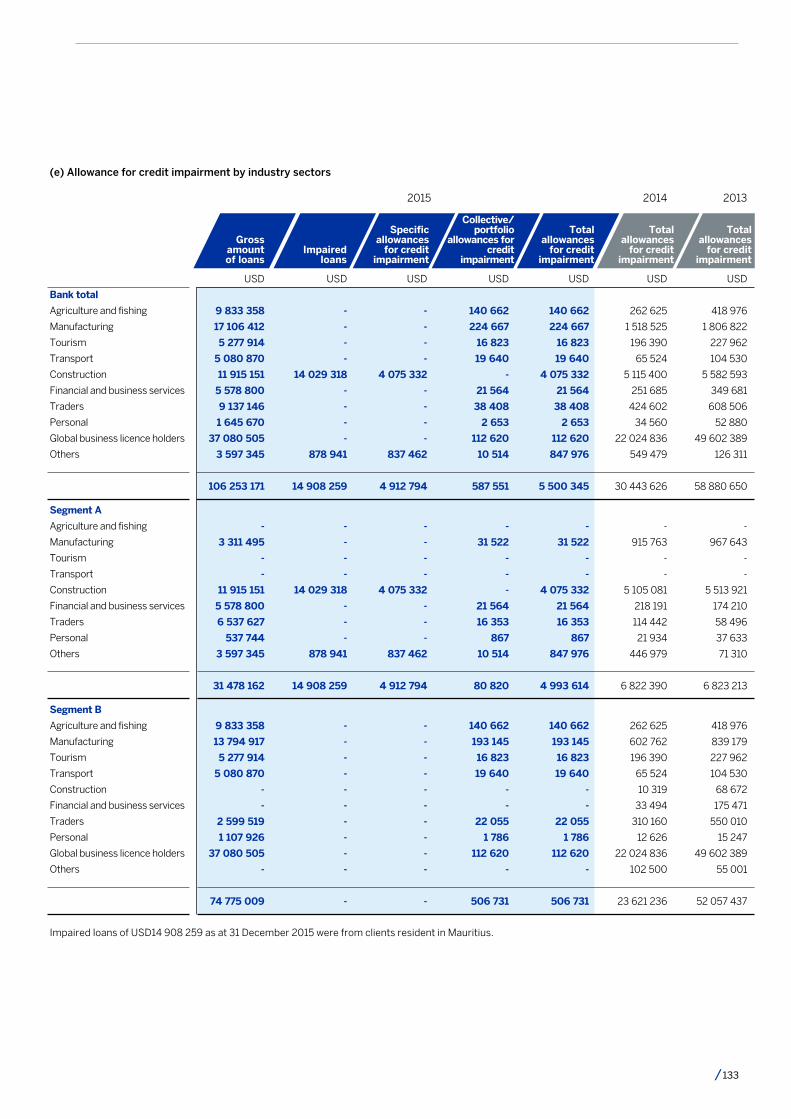
133
USD
9 833 358
17 106 412
5 277 914
5 080 870
11 915 151
5 578 800
9 137 146
1 645 670
37 080 505
3 597 345
106 253 171
-
3 311 495
-
-
11 915 151
5 578 800
6 537 627
537 744
3 597 345
31 478 162
9 833 358
13 794 917
5 277 914
5 080 870
-
-
2 599 519
1 107 926
37 080 505
-
74 775 009
Bank total
Agriculture and fishing
Manufacturing
Tourism
Transport
Construction
Financial and business services
Traders
Personal
Global business licence holders
Others
Segment A
Agriculture and fishing
Manufacturing
Tourism
Transport
Construction
Financial and business services
Traders
Personal
Others
Segment B
Agriculture and fishing
Manufacturing
Tourism
Transport
Construction
Financial and business services
Traders
Personal
Global business licence holders
Others
USD
-
-
-
-
14 029 318
-
-
-
-
878 941
14 908 259
-
-
-
-
14 029 318
-
-
-
878 941
14 908 259
-
-
-
-
-
-
-
-
-
-
-
USD
-
-
-
-
4 075 332
-
-
-
-
837 462
4 912 794
-
-
-
-
4 075 332
-
-
-
837 462
4 912 794
-
-
-
-
-
-
-
-
-
-
-
USD
140 662
224 667
16 823
19 640
-
21 564
38 408
2 653
112 620
10 514
587 551
-
31 522
-
-
-
21 564
16 353
867
10 514
80 820
140 662
193 145
16 823
19 640
-
-
22 055
1 786
112 620
-
506 731
USD
140 662
224 667
16 823
19 640
4 075 332
21 564
38 408
2 653
112 620
847 976
5 500 345
-
31 522
-
-
4 075 332
21 564
16 353
867
847 976
4 993 614
140 662
193 145
16 823
19 640
-
-
22 055
1 786
112 620
-
506 731
(e) Allowance for credit impairment by industry sectors
Collective/ portfolio
allowances for credit
impairment
USD
262 625
1 518 525
196 390
65 524
5 115 400
251 685
424 602
34 560
22 024 836
549 479
30 443 626
-
915 763
-
-
5 105 081
218 191
114 442
21 934
446 979
6 822 390
262 625
602 762
196 390
65 524
10 319
33 494
310 160
12 626
22 024 836
102 500
23 621 236
USD
418 976
1 806 822
227 962
104 530
5 582 593
349 681
608 506
52 880
49 602 389
126 311
58 880 650
-
967 643
-
-
5 513 921
174 210
58 496
37 633
71 310
6 823 213
418 976
839 179
227 962
104 530
68 672
175 471
550 010
15 247
49 602 389
55 001
52 057 437
Specific allowances
for credit impairment
Impairedloans
Gross amount of loans
Total allowances
for credit impairment
Total allowances
for credit impairment
Total allowances
for credit impairment
2015 2014 2013
Impaired loans of USD14 908 259 as at 31 December 2015 were from clients resident in Mauritius.

134 Standard Bank Mauritius Annual integrated report 2015
Bank total
Manufacturing
Construction
Global business licence holders
Others
Segment A
Manufacturing
Construction
Others
Segment B
Global business licence holders
USD
-
4 075 332
-
837 462
4 912 794
-
4 075 332
837 462
4 912 794
-
-
USD
866 171
5 105 081
21 554 652
403 676
27 929 580
866 171
5 105 081
403 676
6 374 928
21 554 652
21 554 652
USD
(866 171)
(1 029 749)
(21 554 652)
433 786
(23 016 786)
(866 171)
(1 029 749)
433 786
(1 462 134)
(21 554 652)
(21 554 652)
(f) Charges/(charge offs) for specific allowances for credit impairments
ANNUAL FINANCIAL STATEMENTS Notes to and forming part of the financial statements continued
Specific allowances
for credit impairment
Specific allowances
for credit impairment
Charges/ (charge
offs)for the year
20142015 2013

135
Unlisted – available-for-sale
Comprising of
Treasury notes
Corporate bonds
Segment A
Treasury bills/notes issued by Government of Mauritius
Treasury notes
Segment B
Corporate bonds
2015
USD
474 659
-
474 659
-
474 659
474 659
-
2014
USD
2 661 958
-
2 661 958
-
2 661 958
2 661 958
-
2013
USD
2 629 042
13 869 176
16 498 218
-
2 629 042
2 629 042
13 869 176
12. Investment securities
Bank total
Up to 3 months
Over 3 months and up to 6 months
Over 6 months and up to 12 months
Over 1 year and up to 5 years
Segment A
Up to 3 months
Over 3 months and up to 6 months
Over 6 months and up to 12 months
Segment B
Over 6 months and up to 12 months
474 659
-
-
-
474 659
474 659
-
-
474 659
-
-
-
2 661 958
-
-
2 661 958
-
2 661 958
-
2 661 958
-
-
497 883
1 641 624
14 358 711
-
16 498 218
497 883
1 641 624
489 535
2 629 042
13 869 176
13 869 176
Maturity analysis

136 Standard Bank Mauritius Annual integrated report 2015
ANNUAL FINANCIAL STATEMENTS Notes to and forming part of the financial statements continued
Computer equipment
USD
2 727 776
374 696
(151 030)
2 951 442
33 225
(90 207)
2 894 460
321 003
-
114 874
3 330 337
516 460
486 532
315 356
1 318 348
520 002
(47 820)
1 790 530
437 313
-
2 227 843
1 102 494
1 103 930
1 633 094
Bank total and segment A
Cost
Balance at 1 January 2013
Acquisitions
Disposals
Balance at 31 December 2013
Acquisitions
Disposals
Balance at 31 December 2014
Acquisitions
Disposals
Transfers2
Balance at 31 December 2015
Depreciation and impairment losses
Balance at 1 January 2013
Depreciation for the year
Disposal
Balance at 31 December 2013
Depreciation for the year
Disposal
Balance at 31 December 2014
Depreciation for the year
Disposal
Balance at 31 December 2015
Carrying amounts
Balance at 31 December 2015
Balance at 31 December 2014
Balance at 31 December 2013
Office equipment
USD
1 342 822
36 509
(66 551)
1 312 780
8 833
-
1 321 613
1 045
-
(510 038)
812 620
497 706
95 800
(335 220)
258 286
98 301
-
356 587
87 784
-
444 371
368 249
965 026
1 054 494
Furnitureand fittings
USD
1 838 386
89 556
(168 821)
1 759 121
6 506
-
1 765 627
38 843
-
395 164
2 199 634
247 379
193 059
(100 699)
339 739
238 840
-
578 579
241 422
-
820 001
1 379 633
1 187 048
1 419 382
Motorvehicles
USD
57 795
20 199
-
77 994
-
-
77 994
-
(14 974)
-
63 020
12 522
12 317
-
24 839
14 589
-
39 428
14 090
(11 730)
41 788
21 232
38 566
53 155
Total
USD
5 966 779
520 960
(386 402)
6 101 337
48 564
(90 207)
6 059 694
360 891
(14 974)
-
6 405 611
1 274 067
787 708
(120 563)
1 941 212
871 732
(47 820)
2 765 124
780 609
(11 730)
3 534 003
2 871 608
3 294 570
4 160 125
13. Property, plant and equipment
There were no capitalised borrowing costs related to the acquisition of equipment during the year (2014: nil).
There is no significant property or equipment for which title is restricted or which is pledged as security for liabilities.
2 Transfers relate to reclassification of fixed assets from assets under construction.
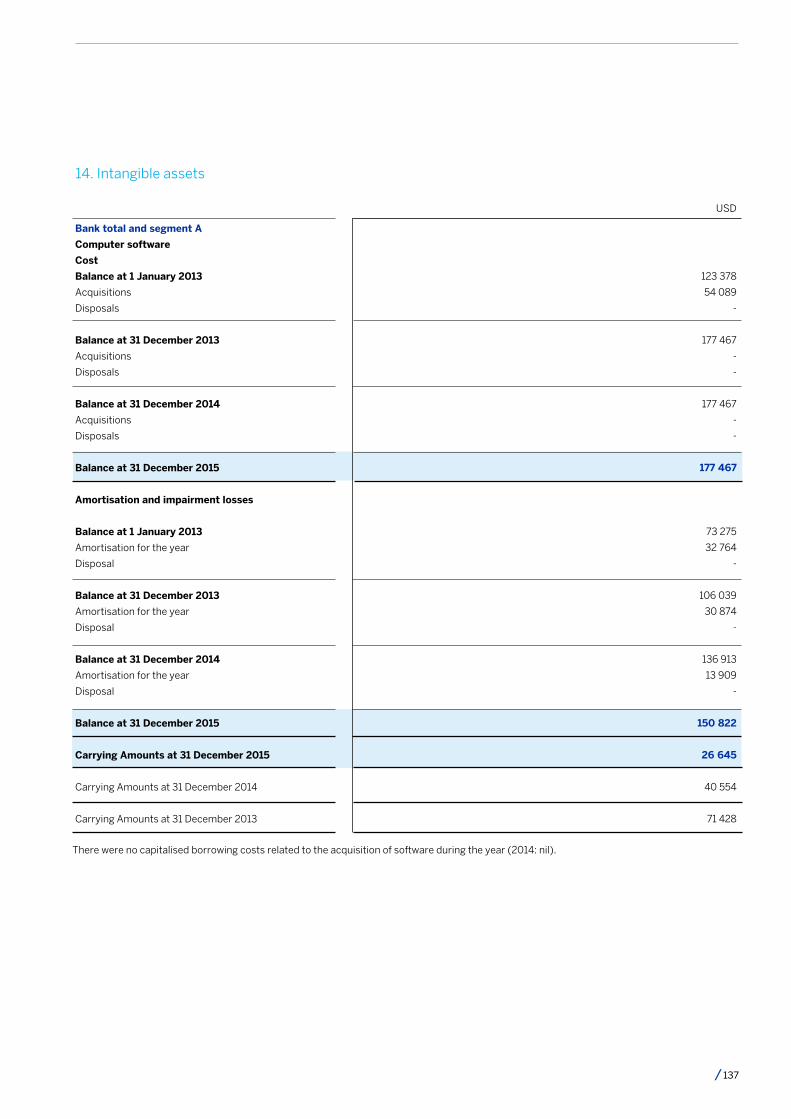
137
14. Intangible assets
Bank total and segment A
Computer software
Cost
Balance at 1 January 2013
Acquisitions
Disposals
Balance at 31 December 2013
Acquisitions
Disposals
Balance at 31 December 2014
Acquisitions
Disposals
Balance at 31 December 2015
Amortisation and impairment losses
Balance at 1 January 2013
Amortisation for the year
Disposal
Balance at 31 December 2013
Amortisation for the year
Disposal
Balance at 31 December 2014
Amortisation for the year
Disposal
Balance at 31 December 2015
Carrying Amounts at 31 December 2015
Carrying Amounts at 31 December 2014
Carrying Amounts at 31 December 2013
USD
123 378
54 089
-
177 467
-
-
177 467
-
-
177 467
73 275
32 764
-
106 039
30 874
-
136 913
13 909
-
150 822
26 645
40 554
71 428
There were no capitalised borrowing costs related to the acquisition of software during the year (2014: nil).

138 Standard Bank Mauritius Annual integrated report 2015
ANNUAL FINANCIAL STATEMENTS Notes to and forming part of the financial statements continued
Bank total
At 1 January
Income statement charge
Effect of change in tax rate
At 31 December
Segment A
At 1 January
Income statement charge
Effect of change in tax rate
At 31 December
Segment B
At 1 January
Income statement charge
Effect of change in tax rate
At 31 December
2015
USD
2 116 000
(939 000)
-
1 177 000
1 027 912
(157 000)
-
870 912
1 088 088
(782 000)
-
306 088
2014
USD
3 654 000
(480 000)
(1 058 000)
2 116 000
1 706 912
(211 912)
(467 088)
1 027 912
1 947 088
(268 088)
(590 912)
1 088 088
2013
USD
2 579 000
1 160 000
(85 000)
3 654 000
1 773 912
(72 298)
5 298
1 706 912
805 088
1 232 298
(90 298)
1 947 088
15. Deferred taxThe movement on the deferred tax amount is as follows:
Deferred tax assets:
General provision for bad and doubtful debts
Unutilised tax losses
Other temporary differences
Deferred tax liabilities:
Other temporary differences
Accelerated depreciation
769 000
293 000
357 000
1 419 000
-
(242 000)
(242 000)
1 732 000
377 000
109 000
2 218 000
-
(102 000)
(102 000)
3 687 000
-
103 000
3 790 000
(14 000)
(122 000)
(136 000)
Deferred income tax assets and liabilities are attributable to the following items:
General provision for bad and doubtful debts
Other temporary differences
Accelerated depreciation
963 000
(164 000)
140 000
939 000
1 955 000
(397 000)
(20 000)
1 538 000
(1 147 000)
153 000
(81 000)
(1 075 000)
The deferred tax charge/(release) in the income statement comprises the following differences:
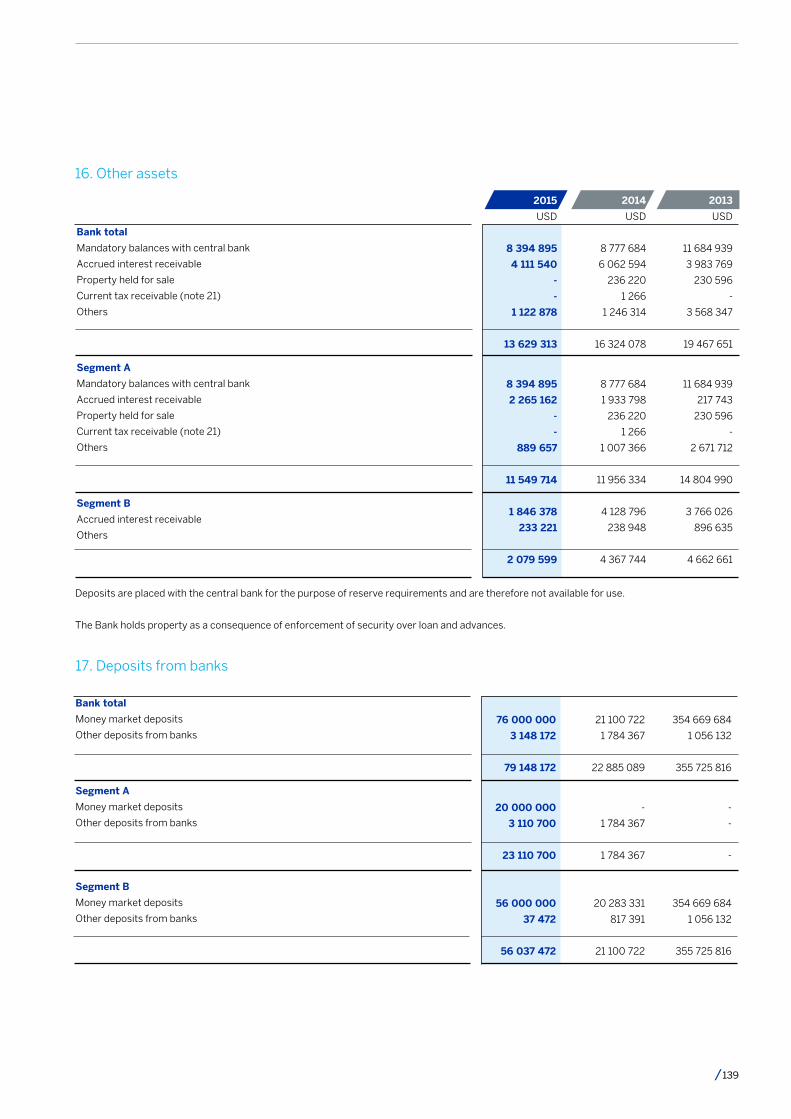
139
Bank total
Mandatory balances with central bank
Accrued interest receivable
Property held for sale
Current tax receivable (note 21)
Others
Segment A
Mandatory balances with central bank
Accrued interest receivable
Property held for sale
Current tax receivable (note 21)
Others
Segment B
Accrued interest receivable
Others
2015
USD
8 394 895
4 111 540
-
-
1 122 878
13 629 313
8 394 895
2 265 162
-
-
889 657
11 549 714
1 846 378
233 221
2 079 599
2014
USD
8 777 684
6 062 594
236 220
1 266
1 246 314
16 324 078
8 777 684
1 933 798
236 220
1 266
1 007 366
11 956 334
4 128 796
238 948
4 367 744
2013
USD
11 684 939
3 983 769
230 596
-
3 568 347
19 467 651
11 684 939
217 743
230 596
-
2 671 712
14 804 990
3 766 026
896 635
4 662 661
16. Other assets
Deposits are placed with the central bank for the purpose of reserve requirements and are therefore not available for use.
The Bank holds property as a consequence of enforcement of security over loan and advances.
Bank total
Money market deposits
Other deposits from banks
Segment A
Money market deposits
Other deposits from banks
Segment B
Money market deposits
Other deposits from banks
76 000 000
3 148 172
79 148 172
20 000 000
3 110 700
23 110 700
56 000 000
37 472
56 037 472
21 100 722
1 784 367
22 885 089
-
1 784 367
1 784 367
20 283 331
817 391
21 100 722
354 669 684
1 056 132
355 725 816
-
-
-
354 669 684
1 056 132
355 725 816
17. Deposits from banks

140 Standard Bank Mauritius Annual integrated report 2015
ANNUAL FINANCIAL STATEMENTS Notes to and forming part of the financial statements continued
Bank total
Corporates
- Demand deposits
Current accounts
Savings accounts
Call accounts
-Time deposits
Up to 3 months
Over 3 months and up to 6 months
Over 6 months and up to 12 months
Over 1 year and up to 5 years
Segment A
- Demand deposits
Current accounts
Savings accounts
Call accounts
-Time deposits
Up to 3 months
Over 3 months and up to 6 months
Over 6 months and up to 12 months
Over 1 year and up to 5 years
Segment B
- Demand deposits
Current accounts
Call accounts
-Time deposits
Up to 3 months
Over 3 months and up to 6 months
Over 6 months and up to 12 months
Over 1 year and up to 5 years
2015
USD
321 954 856
8 885 357
590 545 617
218 330 555
16 989 360
6 678 981
1 424 519
1 164 809 245
42 205 971
8 885 357
45 959 721
1 563 759
3 110 045
1 760 863
1 394 699
104 880 415
279 748 885
544 585 896
216 766 796
13 879 315
4 918 118
29 820
1 059 928 830
2014
USD
280 031 049
9 278 187
858 029 473
1 828 482 873
40 756 312
5 815 811
3 265 552
3 025 659 257
17 059 722
9 278 187
13 037 598
51 967 411
8 393 573
947 678
3 250 413
103 934 582
262 971 327
844 991 875
1 776 515 462
32 362 739
4 868 133
15 139
2 921 724 675
2013
USD
265 987 817
14 835 236
1 061 129 546
320 790 414
57 747 147
56 109 244
166 739
1 776 766 143
10 362 224
14 835 236
10 774 231
23 741 676
56 277 796
50 919 618
150 022
167 060 803
255 625 593
1 050 355 315
297 048 738
1 469 351
5 189 626
16 717
1 609 705 340
18. Deposits from customers
19. Other borrowed funds
Bank total & segment B
Borrowings from banks 10 996 984 43 455 945 154 292 412
Borrowings from banks represent long-term funding for various facilities from Standard Bank Isle of Man.

141
20. Subordinated liabilities
Lender
SBSA
Date issued
December 2012
Maturity date
December 2022
Rate
USD 3 months Libor + 3.26% p.a.
Notional valueUSD
25 000 000
Carrying valueUSD
25 000 000
The Bank did not have any defaults of principal, interest or other breaches with respect to its subordinated liabilities in 2013 to 2015.
Bank total and segment B
SBSA
Bank total
Income tax based on chargeable income
Advanced payments made
Segment A
Income tax based on chargeable income
Advanced payments made
Segment B
Income tax based on chargeable income
Advanced payments made
539 000
-
539 000
360 000
-
360 000
179 000
-
179 000
1 064 000
(1 065 266)
(1 266)
905 000
(661 752)
243 248
159 000
(403 514)
(244 514)
1 100 000
(851 554)
248 446
716 000
(596 982)
119 018
384 000
(254 572)
129 428
21. Current tax liabilities
2015
USD
25 000 000
2014
USD
25 000 000
2013
USD
25 000 000

142 Standard Bank Mauritius Annual integrated report 2015
ANNUAL FINANCIAL STATEMENTS Notes to and forming part of the financial statements continued
Accrued interest payable
Accrued expense
Unsettled money market transactions
Others
Segment A
Accrued interest payable
Accrued expense
Others
Segment B
Accrued interest payable
Accrued expense
Unsettled money market transactions
Others
200 573
1 391 556
32 812 260
6 570 175
40 974 564
105 011
1 391 556
6 352 016
7 848 583
95 562
-
32 812 260
218 159
33 125 981
756 281
609 014
-
8 231 744
9 597 039
63 986
609 014
6 921 208
7 594 208
692 295
-
-
1 310 536
2 002 831
1 765 982
959 370
-
9 069 441
11 794 793
182 714
232 900
5 006 463
5 422 077
1 583 268
726 470
-
4 062 978
6 372 716
22. Other liabilities
Authorised capital:
Ordinary (40 000 000 shares of USD1 each)
Issued and paid capital:
Ordinary (35 000 000 shares of USD1 each)
Unpaid capital:
Ordinary (5 000 000 shares of USD1 each)
40 000 000
35 000 000
5 000 000
40 000 000
35 000 000
5 000 000
40 000 000
35 000 000
5 000 000
23. Share capital
2015
USD
2014
USD
2013
USD

143
Guarantees on account of customers
Letters of credit and other obligations on account of customers
Spot foreign exchange contracts
Accepted letters of credit
Other contingent liabilities
Segment A
Guarantees on account of customers
Letters of credit and other obligations on account of customers
Spot foreign exchange contracts
Accepted letters of credit
Other contingent liabilities
Segment B
Guarantees on account of customers
Letters of credit and other obligations on account of customers
Spot foreign exchange contracts
Accepted letters of credit
Other contingent liabilities
15 015 504
3 801 068
1 540 351
5 895 624
411 287 779
437 540 326
1 150 737
2 080 033
35 886
296 181
24 532 031
28 094 868
13 864 767
1 721 035
1 504 465
5 626 443
386 755 748
409 472 458
50 323 250
10 338 866
3 992 642
9 637 188
160 370 269
234 662 215
1 192 440
2 715 085
6 584
68 343
36 419 899
40 402 351
49 130 810
7 623 781
3 986 059
9 568 845
123 950 370
194 259 865
39 219 295
19 637 863
1 496 755
4 715 688
167 576 049
232 645 650
2 253 442
4 489 849
390 269
610 934
28 874 000
36 618 494
36 965 853
15 148 014
1 106 486
4 104 754
138 702 050
196 027 157
24. Contingent liabilities
2015
USD
2014
USD
2013
USD

144 Standard Bank Mauritius Annual integrated report 2015
ANNUAL FINANCIAL STATEMENTS Notes to and forming part of the financial statements continued
Bank total
Interest income
Loans and advances to banks
Loans and advances to customers
Investment securities
Others
Total interest income
Interest expense
Deposits from banks
Deposits from customers
Subordinated liabilities
Total interest expense
Net interest income
Segment A
Interest income
Loans and advances to banks
Loans and advances to customers
Investment securities
Others
Total interest income
Interest expense
Deposits from banks
Deposits from customers
Total interest expense
Net interest income
Segment B
Interest income
Loans and advances to banks
Loans and advances to customers
Investment securities
Others
Total interest income
Interest expense
Deposits from banks
Deposits from customers
Subordinated liabilities
Total interest expense
Net interest income
12 333 332
8 570 076
46 440
196 292
21 146 140
(1 079 696)
(5 056 803)
(832 631)
(6 969 130)
14 177 010
70 926
1 828 700
46 440
69 364
2 015 430
(39 247)
(1 209 687)
(1 248 934)
766 496
12 262 406
6 741 376
-
126 928
19 130 710
(1 040 449)
(3 847 116)
(832 631)
(5 720 196)
13 410 514
13 437 715
12 469 821
71 577
138 532
26 117 645
(2 849 883)
(6 711 403)
(820 440)
(10 381 726)
15 735 919
59 899
3 050 092
71 577
138 532
3 320 100
(20 088)
(1 741 310)
(1 761 398)
1 558 702
13 377 816
9 419 729
-
-
22 797 545
(2 829 795)
(4 970 093)
(820 440)
(8 620 328)
14 177 217
12 036 329
16 358 608
1 163 974
192 690
29 751 601
(6 444 177)
(5 169 160)
(1 059 555)
(12 672 892)
17 078 709
32 786
4 065 912
1 163 974
113 484
5 376 156
(14 556)
(1 810 960)
(1 825 516)
3 550 640
12 003 543
12 292 696
-
79 206
24 375 445
(6 429 620)
(3 358 200)
(1 059 556)
(10 847 376)
13 528 069
25. Net interest income
2015
USD
2014
USD
2013
USD

145
Fee and commission income
Corporate banking customer fees
Corporate banking credit related fees
Investment banking fees
Custody fees
Total fee and commission income
Fee and commission expense
Net fee and commission income
Segment A
Fee and commission income
Corporate banking customer fees
Corporate banking credit related fees
Investment banking fees
Custody fees
Total fee and commission income
Fee and commission expense
Net fee and commission income
Segment B
Fee and commission income
Corporate banking customer fees
Corporate banking credit related fees
Investment banking fees
Total fee and commission income
Fee and commission expense
Net fee and commission income
5 021 828
1 360 643
597 171
404 378
7 384 020
(230 643)
7 153 377
43 526
35 009
-
404 378
482 913
(230 643)
252 270
4 978 302
1 325 634
597 171
6 901 107
-
6 901 107
4 151 540
2 295 745
762 871
507 778
7 717 934
(485 645)
7 232 289
108 068
65 075
20 000
507 779
700 922
(309 452)
391 470
4 043 472
2 230 669
742 871
7 017 012
(176 193)
6 840 819
3 996 443
2 494 297
1 035 576
612 499
8 138 815
(623 196)
7 515 619
172 596
50 146
505 948
612 499
1 341 189
(435 534)
905 655
3 823 847
2 444 151
529 628
6 797 626
(187 662)
6 609 964
26. Net fee and commission income
2015
USD
2014
USD
2013
USD
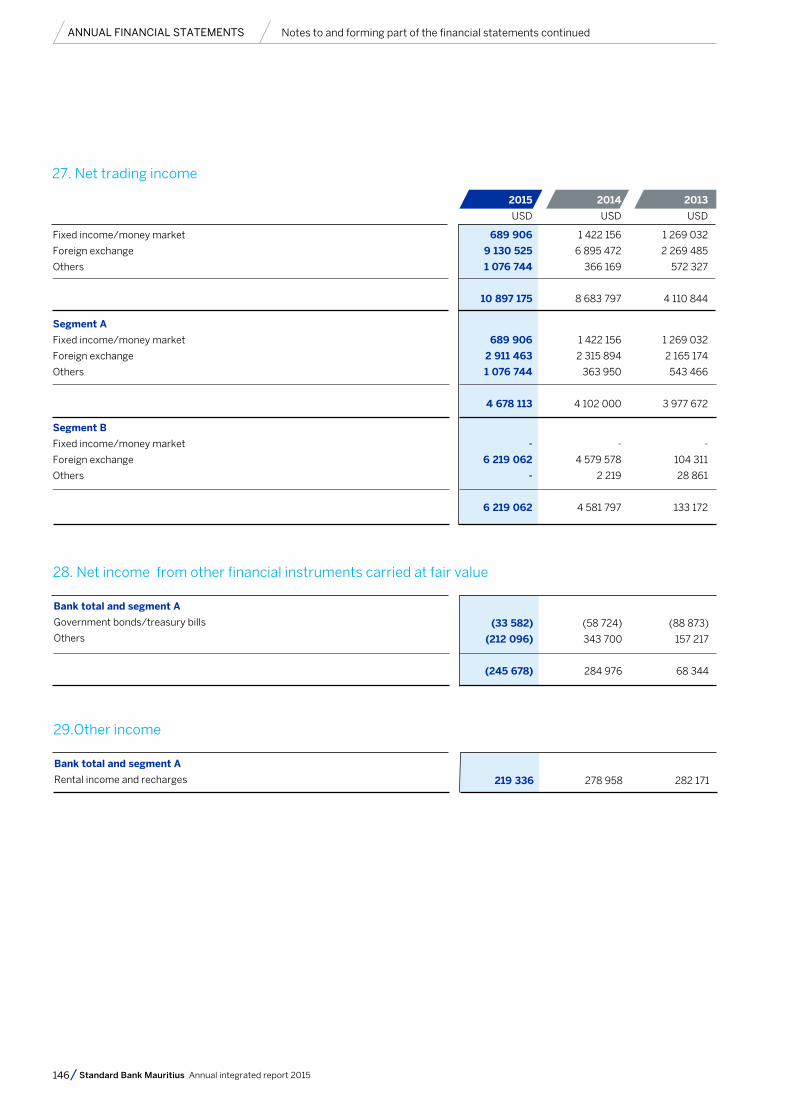
146 Standard Bank Mauritius Annual integrated report 2015
ANNUAL FINANCIAL STATEMENTS Notes to and forming part of the financial statements continued
Fixed income/money market
Foreign exchange
Others
Segment A
Fixed income/money market
Foreign exchange
Others
Segment B
Fixed income/money market
Foreign exchange
Others
689 906
9 130 525
1 076 744
10 897 175
689 906
2 911 463
1 076 744
4 678 113
-
6 219 062
-
6 219 062
1 422 156
6 895 472
366 169
8 683 797
1 422 156
2 315 894
363 950
4 102 000
-
4 579 578
2 219
4 581 797
1 269 032
2 269 485
572 327
4 110 844
1 269 032
2 165 174
543 466
3 977 672
-
104 311
28 861
133 172
27. Net trading income
2015
USD
2014
USD
2013
USD
Bank total and segment A
Government bonds/treasury bills
Others
(33 582)
(212 096)
(245 678)
(58 724)
343 700
284 976
(88 873)
157 217
68 344
28. Net income from other financial instruments carried at fair value
Bank total and segment A
Rental income and recharges 219 336 278 958 282 171
29.Other income

147
Bank total
Loans and advances to customers
Accepted letters of credit
Segment A
Loans and advances to customers
Accepted letters of credit
Segment B
Loans and advances to customers
Accepted letters of credit
(4 887 919)
(61 547)
(4 949 466)
(318 350)
907
(317 443)
(4 569 569)
(62 454)
(4 632 023)
(1 029 120)
(96 371)
(1 125 491)
2 668
(683)
1 985
(1 031 788)
(95 688)
(1 127 476)
18 691 011
47 157
18 738 168
252 233
6 109
258 342
18 438 778
41 048
18 479 826
30. (a) Net impairment (loss reversal)/charge on financial assets
2015
USD
2014
USD
2013
USD
Bank total
Provision made
Provision released
Recoveries
Segment A
Provision made
Provision released
Recoveries
Segment B
Provision made
Provision released
Recoveries
596 382
(2 532 301)
(2 952 000)
(4 887 919)
484 867
(803 217)
-
(318 350)
111 515
(1 729 084)
(2 952 000)
(4 569 569)
1 782 619
(2 483 739)
(328 000)
(1 029 120)
1 055 892
(1 053 224)
-
2 668
727 409
(1 431 197)
(328 000)
(1 031 788)
20 738 766
(2 047 755)
-
18 691 011
843 128
(590 895)
-
252 233
19 895 638
(1 456 860)
-
18 438 778
(b) Breakdown of net impairment (loss reversal)/charge on loans and advances to customers

148 Standard Bank Mauritius Annual integrated report 2015
ANNUAL FINANCIAL STATEMENTS Notes to and forming part of the financial statements continued
Bank total
Wages and salaries
Other personnel expenses
Compulsory social security obligations
Contributions to defined contribution plans
Share-based payment - cash settled
Segment A
Wages and salaries
Other personnel expenses
Compulsory social security obligations
Contributions to defined contribution plans
Share-based payment - cash settled
Segment B
Wages and salaries
Other personnel expenses
Compulsory social security obligations
Contributions to defined contribution plans
Share-based payment - cash settled
4 142 059
1 854 766
97 826
412 510
22 186
6 529 347
729 404
326 618
17 227
72 642
3 907
1 149 798
3 412 655
1 528 148
80 599
339 868
18 279
5 379 549
4 260 127
2 248 732
109 626
460 308
176 073
7 254 866
874 892
461 816
22 514
94 532
36 160
1 489 914
3 385 235
1 786 916
87 112
365 776
139 913
5 764 952
5 267 541
1 945 750
120 944
506 497
59 248
7 899 980
1 436 905
530 771
32 992
138 165
16 162
2 154 995
3 830 636
1 414 979
87 952
368 332
43 086
5 744 985
31. (a) Personnel expenses
2015
USD
2014
USD
2013
USD
(b) Share-based payments
The Bank has two equity-settled schemes, namely the group share incentive scheme and the equity growth scheme. The group share incentive scheme confers rights to employees to acquire ordinary shares at the value of the Standard Bank Group (SBG) share price at the date the option is granted. The equity growth scheme was implemented in 2005 and represents appreciation rights allocated to employees. The eventual value of the right is effectively settled by the issue of shares equivalent in value to the value of the rights.

149
Type A
Type B
Type C
Type D
Type E
3, 4, 5
5, 6, 7
2, 3, 4
2, 3, 4
3, 4, 5
50, 75, 100
50, 75, 100
50, 75, 100
33, 67, 100
33, 67, 100
10 years
10 years
10 years
10 years
10 years
Year % vesting Expiry
Equity growth scheme reconciliation
Rights outstanding at beginning of year
Granted
Exercised1
Lapsed
Transfer out
Rights outstanding at end of year2
188
-
-
-
(188)
-
188
-
-
-
188
938
-
(750)
-
188
2015 2014 2013
(i) Equity growth scheme
Appreciationright price (cents) Participation rights
1 During the year, no SBG (2014: nil) shares were issued to settle the outstanding appreciated rights value.2 At 31 December 2015, the Bank did not have to issue any (2014: 60) SBG shares to settle outstanding appreciated rights value.
There were no outstanding rights to employees as at 31 December 2015:The following rights granted to employees, including executive directors had not been exercised at 31 December 2014:
Weighted averageprice (cents) Rights expiry date
Number ofrights
Award pricerange (cents)
9.800 Year to 31 December 2017188 9.800
Share incentive scheme reconciliation
Options outstanding at beginning of year
Transfers
Granted
Exercised
Lapsed
Options outstanding at end of year
99 320
(12 050)
-
(10 782)
-
76 488
123 750
-
-
(24 430)
-
99 320
179 350
8 500
-
(34 200)
(29 900)
123 750
2015 2014 2013
(ii) Share incentive scheme
Option pricerange (cents) Number of options
-
-
-
-
9.8
-
6.239 – 11.194
-
6.239 – 11.194
-
The weighted average SBG share price for the period to 31 December 2015 year end was ZAR147.88 (2014: ZAR134.84)
The two schemes have five different sub-types of vesting categories as illustrated by the table below:

150 Standard Bank Mauritius Annual integrated report 2015
The following options granted to employees had not been exercised at 31 December 2015:
Weighted averageprice (cents)
Option expiry date
Number ofordinary shares
Option pricerange (cents)
9.8009.2006.23911.1949.880
Year to 31 December 2017Year to 31 December 2018Year to 31 December 2019Year to 31 December 2020Year to 31 December 2021
2 0001 500
13 30015 81343 875
76 488
9.8009.2006.23911.1949.880
ANNUAL FINANCIAL STATEMENTS Notes to and forming part of the financial statements continued
(iii) Deferred Bonus Scheme (DBS)
In 2012, changes were made to the existing DBS to provide for a single global incentive deferral scheme across the regions. The purpose of the DBS 2012 is to encourage a longer-term outlook in business decision-making and closer alignment of performance with long-term value creation.
All employees granted an annual performance award over a threshold have part of their award deferred. The award is indexed to the SBG’s share price and accrues notional dividends during the vesting period, which are payable on vesting. The awards vest in three equal amounts at 18-months, 30-months and 42-months from the date of award. The final payout is determined with reference to the SBG’s share price on vesting date.
The final value is calculated with reference to the number of units multiplied by the SBG share price, and is delivered in cash in Mauritius. The award also accrues notional dividends during the vesting period, payable at vesting.
The provision in respect of liabilities at 31 December 2015 and the amount charged for the year under the scheme amounts to USD103 981.
The following options granted to employees had not been exercised at 31 December 2015:
Weighted averageprice (cents)
Option expiry date
Number ofordinary shares
Option pricerange (cents)
9.8009.2006.23911.1949.880
Year to 31 December 2017Year to 31 December 2018Year to 31 December 2019Year to 31 December 2020Year to 31 December 2021
2 0003 500
19 60024 97049 250
99 320
9.8009.2006.23911.1949.880
Reconciliation
Units outstanding at beginning of year
Granted
Transferred out
Exercised
Lapsed
Units outstanding at end of the year
Weighted average fair value at grant date (R)
Expected life (years)
Risk-free interest rate (%)
19 165
12 310
-
(9 296)
-
22 179
156.96
2.51
8.23
13 593
11 151
-
(5 579)
-
19 165
126.87
2.51
7.12
2015
units
2014
units

151
Bank total
Operating lease expense
Segment A
Operating lease expense
Segment B
Operating lease expense
649 625
114 397
535 228
808 337
166 006
642 331
789 070
238 562
550 508
32. Operating lease expenses
2015
USD
2014
USD
2013
USD
Bank total
Buildings
Less than 1 year
Between 1 and 5 years
411 283
541 225
952 508
464 393
712 968
1 177 361
491 916
1 195 785
1 687 701
Operating lease commitments
The future minimum lease payments under non-cancellable operating lease are as follows:
Bank total
Motor vehicle and equipment
Less than 1 year
Between 1 and 5 years
49 854
31 593
81 447
97 204
69 601
166 805
58 677
101 390
160 067
Bank total
Software licensing and other information technology cost
Others
Segment A
Software licensing and other information technology cost
Others
Segment B
Software licensing and other information technology cost
Others
874 347
5 100 264
5 974 611
153 970
778 841
932 811
720 377
4 321 423
5 041 800
299 897
5 538 137
5 838 034
61 589
1 198 897
1 260 486
238 308
4 339 240
4 577 548
623 601
4 598 991
5 222 592
170 109
1 265 315
1 435 424
453 492
3 333 676
3 787 168
33. Other expenses
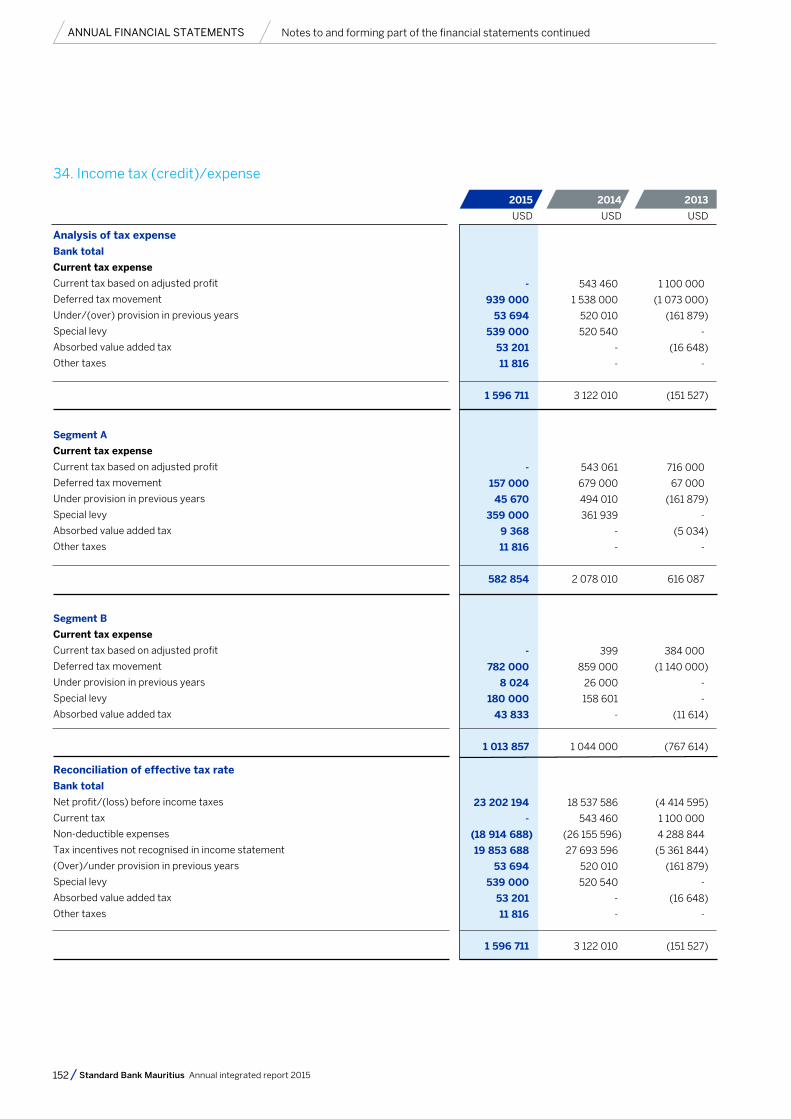
152 Standard Bank Mauritius Annual integrated report 2015
ANNUAL FINANCIAL STATEMENTS Notes to and forming part of the financial statements continued
Analysis of tax expense
Bank total
Current tax expense
Current tax based on adjusted profit
Deferred tax movement
Under/(over) provision in previous years
Special levy
Absorbed value added tax
Other taxes
Segment A
Current tax expense
Current tax based on adjusted profit
Deferred tax movement
Under provision in previous years
Special levy
Absorbed value added tax
Other taxes
Segment B
Current tax expense
Current tax based on adjusted profit
Deferred tax movement
Under provision in previous years
Special levy
Absorbed value added tax
Reconciliation of effective tax rate
Bank total
Net profit/(loss) before income taxes
Current tax
Non-deductible expenses
Tax incentives not recognised in income statement
(Over)/under provision in previous years
Special levy
Absorbed value added tax
Other taxes
-
939 000
53 694
539 000
53 201
11 816
1 596 711
-
157 000
45 670
359 000
9 368
11 816
582 854
-
782 000
8 024
180 000
43 833
1 013 857
23 202 194
-
(18 914 688)
19 853 688
53 694
539 000
53 201
11 816
1 596 711
543 460
1 538 000
520 010
520 540
-
-
3 122 010
543 061
679 000
494 010
361 939
-
-
2 078 010
399
859 000
26 000
158 601
-
1 044 000
18 537 586
543 460
(26 155 596)
27 693 596
520 010
520 540
-
-
3 122 010
1 100 000
(1 073 000)
(161 879)
-
(16 648)
-
(151 527)
716 000
67 000
(161 879)
-
(5 034)
-
616 087
384 000
(1 140 000)
-
-
(11 614)
(767 614)
(4 414 595)
1 100 000
4 288 844
(5 361 844)
(161 879)
-
(16 648)
-
(151 527)
34. Income tax (credit)/expense
2015
USD
2014
USD
2013
USD

153
Segment A
Net profit before income taxes
Current tax
Non-deductible expenses
Tax incentives not recognised in income statement
Under/(over) provision in previous years
Special levy
Absorbed value added tax
Other taxes
Segment B
Net profit/(loss) before income taxes
Current tax
Non-deductible expenses
Tax incentives not recognised in income statement
Under provision in previous years
Special levy
Absorbed value added tax
2 996 065
-
(632 570)
789 570
45 670
359 000
9 368
11 816
582 854
20 206 129
-
(18 282 118)
19 064 118
8 024
180 000
43 833
1 013 857
2 795 108
543 061
937 931
(258 931)
494 010
361 939
-
-
2 078 010
15 742 478
399
218 007
640 993
26 000
158 601
-
1 044 000
3 876 687
716 000
925 185
(858 185)
(161 879)
-
(5 034)
-
616 087
(8 291 282)
384 000
3 363 658
(4 503 658)
-
-
(11 614)
(767 614)
USD USD USD
35. Other reserves
Balance at end of year 2012/beginning of year 2013
Net gains on available-for-sale financial investments
Share-based payment
Transfer between reserves
Balance at end of year 2013/beginning of year 2014
Net gains on available-for-sale financial investments
Share-based payment
Balance at end of year 2014/beginning of year 2015
Net gain on available-for-sale financial investments
Share-based payment
Transfer to general banking reserve
Balance at end of year 2015
28 708
(35 691)
-
-
(6 983)
4 539
-
(2 444)
868
-
-
(1 576)
398 440
-
59 248
(198 483)
259 205
-
39 757
298 962
-
(208 831)
-
90 131
427 148
(35 691)
59 248
(198 483)
252 222
4 539
39 757
296 518
868
(208 831)
311 927
400 482
Fair value reserves
Share-based payment Total
-
-
-
-
-
-
-
-
-
-
311 927
311 927
Credit riskreserves
USD
2015
USD
2014
USD
2013
USD
The fair value reserves include the cumulative net change in the fair value of available-for-sale investments, excluding impairment losses until the investment is derecognised.
The fair value of share options is determined on the grant date and accounted for as staff costs over the vesting period of the share options, with a corresponding increase in the share-based payment reserve.

154 Standard Bank Mauritius Annual integrated report 2015
ANNUAL FINANCIAL STATEMENTS Notes to and forming part of the financial statements continued
Bank total
Loans and other facilities
Undrawn credit facilities
Segment A
Loans and other facilities
Undrawn credit facilities
Segment B
Loans and other facilities
Undrawn credit facilities
20 905 668
-
20 905 668
15 462 256
4 316 391
11 145 865
3 000 000
-
3 000 000
36. Commitments
2015
USD
2014
USD
2013
USD
Emoluments:
Full time directors
Non-executive directors
Key management personnel
Emoluments – key management personnel
Short-term employee benefits
Recharges3
Share-based payments
702 872
68 134
1 363 127
1 637 339
(279 857)
5 645
1 363 127
756 129
61 251
1 340 873
1 381 367
(68 036)
27 542
1 340 873
315 613
78 989
1 870 058
948 193
-
921 865
1 870 058
37. Related parties
2015
USD
2014
USD
2013
USD
3 Recharges for services rendered.

155
USD
5 000 000
1 098 468 565
1 496 112
20 171
3 110 675
10 996 984
25 000 000
-
9 501 350
1 707 534
-
972 192
(140 501)
956 041
10 000 000
Statement of financial position
Assets
Loans and advances
Balances and placements
Accrued interest
Liabilities
Accrued interest
Bank deposits
Other borrowed funds
Subordinated debt
Non-bank deposits
Income statement
Other interest receivable
Other interest payable
Other income
Other expenses
Recharges
Management fees
Transactions with owner
Dividend paid
USD
116 298 000
85 489
135 502
-
56 013 294
-
-
415 269
2 712 518
165 436
219 336
9 312
(194 733)
-
-
USD
2 678 571
2 619 306 802
3 242 204
252 725
-
43 455 945
25 000 000
-
8 444 624
3 342 545
-
1 412 796
-
1 083 316
-
USD
100 000 000
237 641
134 094
-
20 283 331
-
-
179 702
4 025 965
306 754
278 958
-
(1 774)
-
-
USD
3 436 364
1 813 845 546
1 980 173
1 026 258
324 642 538
154 292 412
25 000 000
-
6 651 763
6 626 857
-
662 340
-
884 204
-
USD
100 000 000
13 291 588
529 443
286 215
30 027 146
-
-
2 627 497
3 347 079
635 377
282 171
-
-
-
-
Other related entities
2015 2014 2013
The above transactions entered into are in the normal course of business and at arm’s length.
Parent
Other related entitiesParent
Other related entitiesParent

156 Standard Bank Mauritius Annual integrated report 2015
ANNUAL FINANCIAL STATEMENTS Notes to and forming part of the financial statements continued
38. Holding companies
The immediate holding company is Stanbic Africa Holdings Ltd, a company incorporated in the United Kingdom and the ultimate holding company is Standard Bank Group, a company incorporated in South Africa.

standardbank.mu
Standard Bank (Mauritius) Limited is a wholly owned subsidiary of the Standard Bank Group, Africa’s largest bank by assets. We are a major player in our targeted segments and provide Corporate and Investment Banking and
Wealth and Investment services. Our vision is to be the leading financial services organisation in, for and across Africa, delivering exceptional client experiences and superior value. Africa is our home, we drive her growth.
Cover image: Mauritius