Embed Size (px)
Citation preview
Annual report 2015
New foundations

Annual report 2015
New foundations

ContentsINTRODUCTION 2SES at a glance 3Organisation 4Financial highlights 5Introduction by the Chairman of the Board of Directors 6Foreword from the President and CEO 8
GLOBALISATION 12Global fleet GEO-MEO 14Channel Count 16
VERTICALISATION 17Video 19Enterprise 21Mobility 23Government 25
INNOVATION 26Next Generation Satellites 29Next Generation Constellations 31Next Generation Talent 32
SOCIETY 33e-lections - Satellite connectivity increasing electoral transparency 34e-health - Why satellite is vital to developing a globally unified e-health system 35e-mergency.lu - Re-establishing communications in emergency situations 36
CORPORATE GOVERNANCE 37
FINANCIAL REVIEW BY MANAGEMENT 58
CONSOLIDATED FINANCIAL STATEMENTS 65
SES ANNUAL ACCOUNTS 117

2 SES Annual Report 2015
INTRODUCTION
INTRODUCTION GLOBALISATION VERTICALISATION SOCIETYINNOVATION CORPORATE GOVERNANCE
FINANCIAL REVIEW
FINANCIAL STATEMENTS
SES ANNUAL ACCOUNTS
• SES at a glance• Organisation• Financial highlights• Introduction by the Chairman
of the Board of Directors• Foreword from the President
and CEO
3SES Annual Report 2015
SES at a glance SES is proud to be the world’s leading satellite-enabled solutions provider. We connect people, businesses and communities across the globe, reaching 99% of the world’s population. By enabling thousands of services in homes, companies and institutions, we enrich the lives of billions of people and drive worldwide digitisation. We provide reliable data connectivity between businesses and communities that spurs economic growth, stretching across land, sea and sky to surpass all other forms of communications infrastructure. Our innovative high-speed broadband solutions fundamentally change the travel experience for passengers, whether on short-haul flights or week-long cruises. We support governments and institutions, offering seamless communication for ministries, embassies, troops and agencies with powerful security and defence networks.
The centrepiece of our operations is a fleet of 52 geostationary (GEO) satellites in orbit at 36,000km above Earth. O3b’s 12 medium earth orbit (MEO) satellites augment our operations, flying at 8,000km. We are the first satellite provider in the world to deliver a differentiated and entirely scalable GEO-MEO offer with powerful technical capabilities. Our future GEO wide beam, GEO High Throughput Satellites (HTS) and MEO high throughput systems fuel an unparalleled service delivery. Combined with our ground operations, this unique fleet enables us to develop differentiated services across numerous market segments and geographies. Our high performance and powerful solutions appeal to many different customers for their scalability, reliability, customisation, and cost effectiveness.
SES ensures excellence across four main pillars: Video, Enterprise, Mobility and Government. With experts and offices in 21 countries, we serve more than 700 broadcasters, businesses, institutions and governments in more than 130 countries.
We provide video distribution globally to broadcasters, cable TV programmers, telecommunications and mobile operators, and Internet Service Providers (ISPs). Our clients include the majority of the leading blue-chip broadcasters and platforms on all continents. We reach over 1 billion people in 317 million TV households with multiple access modes, including 42 million IPTV homes. We operate the world’s leading video platform and largest high definition (HD) platform by far, delivering consistent bandwidth of 4 to 5 Gigabits per second per spacecraft to ensure flawless video quality. We enable broadcasters to deliver more than 7,200 TV channels to global audiences, including over 2,200 HD channels, and 19 in Ultra HD. We also provide value-added services along the technical value chain for the preparation and transmission of content via linear and non-linear platforms. This includes internet and mobile handsets so that we integrate our services into seamless and comprehensive next-generation video delivery.
SES provides a differentiated global offer for data communications, including specialised VSAT services directed at businesses worldwide. We reach more than one million simultaneous fixed internet connections with an average bitrate of 12 Megabits per second. Each year, we exchange 57 Gigabits per second of data traffic with the internet, delivering close to 219,573 Terabytes of data to thousands of global internet points of presence (POPs). We further differentiate our offering with continued investment in both GEO and MEO high throughput infrastructure. Together with O3b, SES serves customers in sectors including telecommunications, oil & gas, banking, transportation, health and education. We deliver unprecedented access to a unique, ubiquitous, high performance and future-proof network.
Satellite is the only architecture capable of delivering connectivity to aeronautical and maritime platforms, meeting the growing needs of these industries by guaranteeing 100% coverage of land, sea and air. We serve all three major global in-flight connectivity providers, offering 4 Gigabits per second of potential in-flight bandwidth. Through our combined offer with O3b, we have initiated a new era of maritime connectivity, beginning with innovative solutions for cruise ships. O3b serves four Royal Caribbean cruise ships providing them with more bandwidth than the entire maritime industry combined. Dedicated beams on O3b satellites follow the ships wherever they go, transmitting a constant 500 Mbps of coverage to guests and crew.
We serve the diverse needs of governments and multilateral agencies around the world, satisfying the increasing demand for high-bandwidth satellite-based applications. Our network is globally redundant, secure and highly reliable, providing end-to-end solutions for civilian, security and defence applications, information gathering, and humanitarian purposes such as e-health, e-learning, e-lections and e-mergency. Our Galileo/EGNOS contracts further strengthen our partnerships with the European agencies and governments. With SES Government Solutions, we are a leading provider of commercial satellite communication solutions to the U.S. government. Our services assist multiple missions, including enabling the worldwide exchange of information with embassies and troops abroad.
These four focal areas will propel SES into the future. We are prepared to meet changing needs caused by global digitisation and increased complexity. We go beyond providing a communications infrastructure to delivering customised end-to-end solutions that are scalable, reliable and future proof. Building on these strengths, we are prepared to adapt responsively to seize new opportunities.
4 SES Annual Report 2015
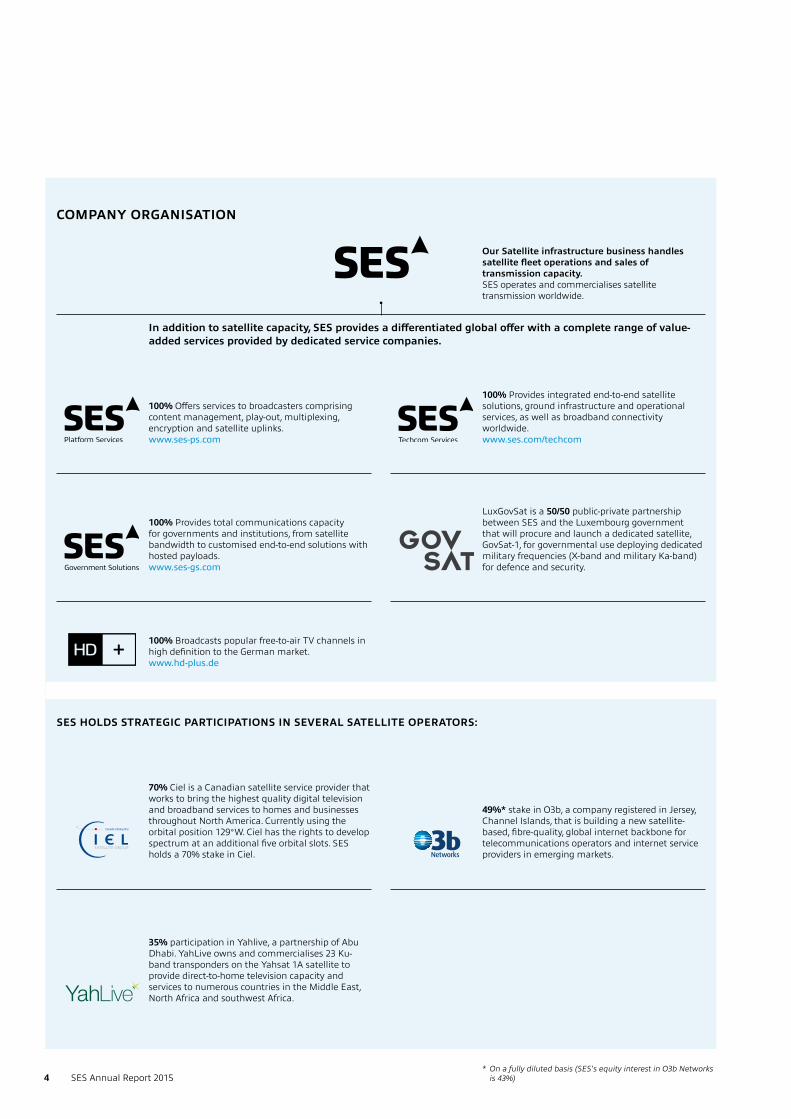
COMPANY ORGANISATION
Our Satellite infrastructure business handles satellite fleet operations and sales of transmission capacity. SES operates and commercialises satellite transmission worldwide.
100% Offers services to broadcasters comprising content management, play-out, multiplexing, encryption and satellite uplinks.www.ses-ps.com
100% Provides total communications capacity for governments and institutions, from satellite bandwidth to customised end-to-end solutions with hosted payloads.www.ses-gs.com
100% Broadcasts popular free-to-air TV channels in high definition to the German market.www.hd-plus.de
LuxGovSat is a 50/50 public-private partnership between SES and the Luxembourg government that will procure and launch a dedicated satellite, GovSat-1, for governmental use deploying dedicated military frequencies (X-band and military Ka-band) for defence and security.
70% Ciel is a Canadian satellite service provider that works to bring the highest quality digital television and broadband services to homes and businesses throughout North America. Currently using the orbital position 129°W. Ciel has the rights to develop spectrum at an additional five orbital slots. SES holds a 70% stake in Ciel.
35% participation in Yahlive, a partnership of Abu Dhabi. YahLive owns and commercialises 23 Ku-band transponders on the Yahsat 1A satellite to provide direct-to-home television capacity and services to numerous countries in the Middle East, North Africa and southwest Africa.
100% Provides integrated end-to-end satellite solutions, ground infrastructure and operational services, as well as broadband connectivity worldwide.www.ses.com/techcom
49%* stake in O3b, a company registered in Jersey, Channel Islands, that is building a new satellite-based, fibre-quality, global internet backbone for telecommunications operators and internet service providers in emerging markets.
SES HOLDS STRATEGIC PARTICIPATIONS IN SEVERAL SATELLITE OPERATORS:
In addition to satellite capacity, SES provides a differentiated global offer with a complete range of value-added services provided by dedicated service companies.
* On a fully diluted basis (SES's equity interest in O3b Networks is 43%)

INTRODUCTION GLOBALISATION VERTICALISATION SOCIETYINNOVATION CORPORATE GOVERNANCE
FINANCIAL REVIEW
FINANCIAL STATEMENTS
SES ANNUAL ACCOUNTS
• SES at a glance• Organisation• Financial highlights• Introduction by the Chairman
of the Board of Directors• Foreword from the President
and CEO
5SES Annual Report 2015
FINANCIAL HIGHLIGHTS
€1,494.2 million €2,014.5million
0
1,000
2,0001,862.5 1,919.1
REVENUE (millions of euros)
0
1,000
2,000
1,364.7 1,428.0
EBITDA (millions of euros)
0
1
2
1.491.41
AVERAGE WEIGHTEDEARNINGS PER SHARE (euro)
0
2.5
5
2.79 2.77
NET DEBT/EBITDA
€7.4 billion
€894.6 million €1.30
2013 2014
2,014.5
2015 2013 2014
1,494.2
2015
2013 2014
1.34
2015 2013 2014
2.54
2015
Revenue up 5% versus 2014(-3.2% at constant FX) 2014: €1,919.1 million
Operating profit up 1.4% (-5.2% at constant FX)2014: €882.6 million
Contract backlog 2014: €7.3 billion
€674.0 million Profit a�er tax +5.0% 2014: €642.4 million
Dividend per Class A share2014: €1.18
EBITDA up 4.6% (-3.6% at constant FX)2014: €1,428.0 million
6 SES Annual Report 2015
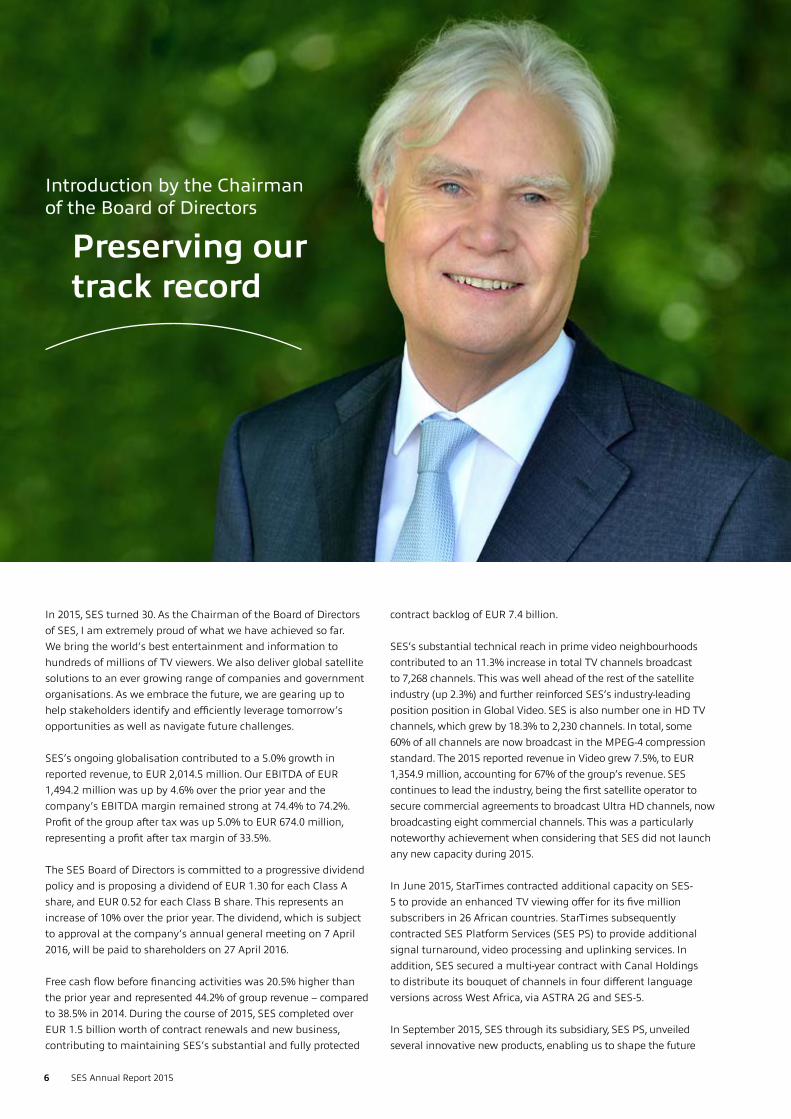
In 2015, SES turned 30. As the Chairman of the Board of Directors of SES, I am extremely proud of what we have achieved so far. We bring the world’s best entertainment and information to hundreds of millions of TV viewers. We also deliver global satellite solutions to an ever growing range of companies and government organisations. As we embrace the future, we are gearing up to help stakeholders identify and efficiently leverage tomorrow’s opportunities as well as navigate future challenges.
SES’s ongoing globalisation contributed to a 5.0% growth in reported revenue, to EUR 2,014.5 million. Our EBITDA of EUR 1,494.2 million was up by 4.6% over the prior year and the company’s EBITDA margin remained strong at 74.4% to 74.2%. Profit of the group after tax was up 5.0% to EUR 674.0 million, representing a profit after tax margin of 33.5%.
The SES Board of Directors is committed to a progressive dividend policy and is proposing a dividend of EUR 1.30 for each Class A share, and EUR 0.52 for each Class B share. This represents an increase of 10% over the prior year. The dividend, which is subject to approval at the company’s annual general meeting on 7 April 2016, will be paid to shareholders on 27 April 2016.
Free cash flow before financing activities was 20.5% higher than the prior year and represented 44.2% of group revenue – compared to 38.5% in 2014. During the course of 2015, SES completed over EUR 1.5 billion worth of contract renewals and new business, contributing to maintaining SES’s substantial and fully protected
contract backlog of EUR 7.4 billion.
SES’s substantial technical reach in prime video neighbourhoods contributed to an 11.3% increase in total TV channels broadcast to 7,268 channels. This was well ahead of the rest of the satellite industry (up 2.3%) and further reinforced SES’s industry-leading position position in Global Video. SES is also number one in HD TV channels, which grew by 18.3% to 2,230 channels. In total, some 60% of all channels are now broadcast in the MPEG-4 compression standard. The 2015 reported revenue in Video grew 7.5%, to EUR 1,354.9 million, accounting for 67% of the group’s revenue. SES continues to lead the industry, being the first satellite operator to secure commercial agreements to broadcast Ultra HD channels, now broadcasting eight commercial channels. This was a particularly noteworthy achievement when considering that SES did not launch any new capacity during 2015.
In June 2015, StarTimes contracted additional capacity on SES-5 to provide an enhanced TV viewing offer for its five million subscribers in 26 African countries. StarTimes subsequently contracted SES Platform Services (SES PS) to provide additional signal turnaround, video processing and uplinking services. In addition, SES secured a multi-year contract with Canal Holdings to distribute its bouquet of channels in four different language versions across West Africa, via ASTRA 2G and SES-5.
In September 2015, SES through its subsidiary, SES PS, unveiled several innovative new products, enabling us to shape the future
Introduction by the Chairman of the Board of Directors
Preserving our track record
INTRODUCTION GLOBALISATION VERTICALISATION SOCIETYINNOVATION CORPORATE GOVERNANCE
FINANCIAL REVIEW
FINANCIAL STATEMENTS
SES ANNUAL ACCOUNTS
• SES at a glance• Organisation• Financial highlights• Introduction by the Chairman
of the Board of Directors• Foreword from the President
and CEO
7SES Annual Report 2015
of video distribution across multiple devices. These include FLUID HUB, which provides managed cloud-based services on a variety of video platforms. In addition, LIQUID VOD distributes VOD content over satellite in areas underserved by terrestrial alternatives and delivers premium content to an increasing number of users, without incremental distribution costs.
SES combines global coverage across multiple frequency bands with innovative IP-based solutions and robust network management systems to support a range of major global clients and service providers. Today, SES’s global fleet reaches over one million simultaneous fixed internet connections worldwide and delivers consistent, high quality connectivity.
Our Enterprise vertical pipeline is growing strongly. In March 2015, Airbus Defence and Space signed a multi-year, multi-transponder agreement to deliver managed global satellite communication services to corporate customers in the mining, energy and humanitarian sectors. ITC Global subsequently contracted the use of three satellites to deploy a powerful enterprise network on behalf of a major global oil producer. These contracts were followed by an agreement with X2nSat, which doubled the Ku-band capacity that they are using on SES-2.
Then in August 2015, SES Techcom Services entered into partnership with Post Telecom to develop and introduce satellite and cloud-based communication solutions, using SES’s global fleet. Finally, In October 2015, SES signed a multi-year contract with Softwire Digital Solutions for capacity on NSS-10 to provide important e-learning facilities to underserved areas in Nigeria. Following this agreement, SES announced a multi-year deal to provide Ku-band capacity on NSS-12 to Intersat, enabling the expansion of internet service offerings in East Africa. In addition, SES Techcom Services and SOLARKIOSK AG entered into a two-year partnership to deliver worldwide high-quality connectivity using satellite to provide Internet access to underserved areas, initially in Africa.
The SES Mobility vertical accounts for 3% of SES’s group revenue. In 2015 the reported revenue grew 47.4% to EUR 52.9 million. SES has continued to scale up its investments and capabilities to support major global service providers in delivering a superior user experience, which meets rapidly growing passenger demand for connectivity.
In aeronautical connectivity, SES has built on its strong commercial relationships with the world-leading service integrators - Global Eagle Entertainment, Gogo and Panasonic. In March 2015, Global Eagle Entertainment (GEE) signed a significant pre-commitment for Ku-band wide-beam and HTS capacity aboard SES-12, SES-14 and SES-15 to take advantage of the combined coverage over North and South America, the Atlantic Ocean, Western Europe, the Middle East and Asia-Pacific. GEE is already using Ku-band capacity on SES’s existing satellite fleet and, in October 2015, signed new multi-year, multi-transponder agreements to secure additional bandwidth on six SES satellites. In maritime, KVH Industries signed a multi-year agreement to use capacity on SES-4 to serve increasing demand from commercial vessels for a variety of applications.
Our Government vertical accounts for 13% of group revenue. In 2015 the reported revenue was up 18.8% to EUR 255.6 million. During 2015, SES continued to develop its global Government business during 2015, notably with the investment in LuxGovSat, a jointly incorporated entity of SES and the Luxembourg Government.
SES Government Solutions serves a wide range of U.S. Government agencies and continues to build on over 40 years of working with the U.S. Government, by securing a number of important new contract wins. This includes a 14-year contract with Raytheon Integrated Defense Systems, and a five-year contract with the University of Colorado to host a NASA-funded payload on SES-14. Other new business secured by SES GS included a one-year task order, with four one-year option periods, to support forces deployed to the U.S. Central Command (USCENTCOM) area of operation. In addition, SES GS agreed a one-year contract to provide O3b's services and ground equipment for the National Oceanic and Atmospheric Agency (NOAA) in American Samoa, enabling NOAA to expand its broadband connectivity outside the continental U.S.
Following its participation in the financing round, SES now has a 43% equity interest and has interests over warrants in O3b, which deliver a fully diluted interest of 49%. In December 2015, O3b completed USD 460 million of incremental financing, used to support future growth. O3b will expand its satellite constellation from 12 to 20 satellites, a fleet increase of 67%, to accommodate growing demand for its high-throughput and low-latency solution. O3b’s success complements SES's achievements, which continue to attract and retain loyal customers.
All in all, SES is continuing to invest in new satellite programmes as a key driver of sustainable future growth. Between the end of 2015 and the end of 2017, SES will have launched seven new satellites, including SES-9, launched on 4 March 2016*, which will add 180 incremental wide beam transponders and 36 GHz of HTS capacity. These growth investments are expected to generate incremental annualised revenue of between EUR 250 million and EUR 300 million (equivalent to around 15% of FY 2015 group revenue).
On behalf of the Board of Directors I am proud of this set of positive results for the business year 2015. These are steeped in continuity and reflect the consistent implementation of strategy focused on built in scalability to serve rapidly increasing demand for global solutions, development of differentiated capabilities in the four market verticals as well as shaping the future user experience, entrenching satellite’s key role in the digital ecosystem.
I will conclude my Chairman’s statement by thanking the Executive team and the entire SES community for dynamically framing the strategy, executing on it, and building on SES’s new foundations.
Romain Bausch
* Subsequent to the approval of the consolidated financial statements by the SES Board of Directors
8 SES Annual Report 2015
Our space journey is laying the ground for new foundations. These build on our unique 30-year heritage and seize the full potential of the digitisation opportunities where we play an essential role. At SES, we believe in setting dynamic foundations that reflect and shape the rapidly evolving nature of our industry. They also define our differentiated capabilities, and enable us to have a positive impact on the markets we serve.
Importantly, these new foundations give us the firm belief that we can fulfil our leading aspiration: to be the foremost satellite-enabled provider of communication solutions to our clients and users around the world. In doing so, we want to be an indispensable contributor to global digitisation. This is how we’re thinking, therefore, about our new foundations.
As a first foundation, we are developing the strongest and most scalable satellite-enabled technology platform. Beyond today’s proven business models in our industry, we believe that the top clients in the four market verticals we serve (Video, Enterprise, Mobility, Government) will increasingly seek regional and global solutions. In many cases, these will require managing hybrid satellite- and land-based networks. The ubiquitous and flexible regional and global coverage, timely market access and holistic ground-system delivery are key elements where we are investing and already serve as key differentiators.
SES is starting from an unsurpassed foundation on this front, with 52 satellites in the GEO orbit and 12 satellites in the MEO
orbit through our affiliate O3b. The combined constellation is supported by a total of 20 SES and partner teleports deployed in 15 countries. Our 1,332 global experts serve long-standing clients in over 130 countries, and operate from our 21 offices deployed in all the regions. They form the ranks of strongly qualified natural market teams with superior regional insights and differentiated capabilities per market vertical. This combination of global assets, best-in-class talents, and a borderless operating model gives us the knowledge base to use as a springboard to scale up further.
Notwithstanding the unique strengths of the present, the strongest contributions to our first foundation are in the making and about to be deployed. Specifically, we launched SES-9 on 4 March 2016*, and have six more committed satellite developments in 2016 and 2017. These six programmes cover SES-10, SES-11, SES-12, SES-14, SES-15, and SES-16 (GovSat). Each programme plays an instrumental role in scaling up our capabilities in the four market verticals we serve. They will create a marked expansion of our regional and global reach. In fact, they will add an aggregate 12% to our wide-beam capacity on a global level, and 21% in developing markets. The hybrid nature of our programmes allows us to also add a total of 36 GHz of high throughput narrow beams. Additionally, O3b has eight satellites in manufacturing with the first batch of four scheduled for launch in early 2018 and the second to follow shortly after, bringing an aggregated incremental capacity of over 100 Gbps. Last but not least, the exciting acquisition of RR Media in the first quarter of 2016 further accelerates the globalisation of SES’s service business, establishing a leading
Foreword from the President and CEO
Building on new foundations
* Subsequent to the approval of the consolidated financial statements by the SES Board of Directors
INTRODUCTION GLOBALISATION VERTICALISATION SOCIETYINNOVATION CORPORATE GOVERNANCE
FINANCIAL REVIEW
FINANCIAL STATEMENTS
SES ANNUAL ACCOUNTS
• SES at a glance• Organisation• Financial highlights• Introduction by the Chairman
of the Board of Directors• Foreword from the President
and CEO
9SES Annual Report 2015
global provider in next generation video and media services. This is an important milestone in executing SES’s differentiated strategy focused on globalisation, verticalisation and dematuring. RR Media provides scalable, converged digital media services for over 1,000 global customers, using an optimised combination of satellite and fibre. Viewers will now have access to a boundless array of global content from multi-platform TV operators and over 100 VOD platforms, delivered to them both online and with direct-to-home (DTH) satellite services.
This is a good opportunity to clarify our perspective on hybrid technology, as the concept has been central to our thought process in recent years. It has also been instrumental to scaling up our efforts in an optimal manner. Hybrid is about enabling the smarter combination of technological elements, to deliver the most efficient solutions. At the level of our satellites, we create multi-mission payloads that combine multiple frequency bands, and within each optimises usage with digital processing. All of this is built using advanced platforms and propulsion forms. At the level of applications, hybrid is about enabling smarter networks by combining terrestrial and satellite strengths, delivering connectivity and content in the most cost and quality effective ways for the largest number of households and users. Our SES-12, SES-14 and SES-15 programmes and our video industry-wide SAT>IP initiative are the latest examples of this approach.
As a second foundation, we are building the strongest expertise in the four market verticals (Video, Enterprise, Mobility, and Government) that can yield differentiated solutions to our clients. In each and every vertical we are experiencing an increasing pull to shape and deliver customised solutions. This requires scalable capabilities that can fully leverage our investments and areas of expertise across regions. We are therefore determined to acquire these distinct capabilities through a combination of winning thought leadership and focused resources.
In Video, our differentiation is built around the provisioning of end-to-end solutions to clients in all the markets we serve. The SES Next Generation Video approach starts with unsurpassed technical reach in prime neighbourhoods providing leading broadcasters the highest possible and most efficient audience penetration. Interestingly, the Financial Times articles listing of the top-10 pay-TV operators globally included five that relied on SES. SES next generation video also covers the provisioning of ancillary media services across linear and non-linear distributions to create the best viewer experience.
These ubiquitous capabilities enabled us to grow our total channel count reaching 7,268 TV channels by the end of 2015, underpinned by a record of almost 11.3% growth (18% HD channel growth from Q4 2014 to Q4 2015) in HD channels. In fact, with 2,230 HD channels carried by SES, we achieve a 26% market share (among all HD channels worldwide). Importantly, our push for improved viewing quality allowed us to finish the year with seven commercial UHD channels on air by the end of 2015, making SES
again the first satellite operator to introduce a next generation video experience.
In the Enterprise vertical, SES combines a truly global coverage across multiple frequency bands with innovative IP-based solutions and robust network management systems. We serve users’ needs for higher speeds and consistently high quality coverage, and actively respond to the proliferation of applications and the universal demand for broadband. Together with O3b, we offer a unique range of services distinguished by their scalability, scope and flexibility and provide connectivity to customers in sectors including telecommunications, oil & gas, banking, transportation, health and education.
Moving forward we go beyond infrastructure to address dynamic market demands, and offer flexible packages directly to customers as managed services. This will streamline the customer experience and expand the depth of the value chain. One example is SES Enterprise+ broadband, a high-speed product launched in Africa. Overall, network demand will continue to grow, as industry experts predict that the Internet of Things will reach 50 billion connected devices by 2020, and SES Enterprise products will ensure we are prepared to meet these challenges.
In the Mobility sector, we continue to scale up our investments and capabilities to support the delivery of superior user and traveller experiences in the air and at the sea. We further expanded our commercial relationship with Global Eagle Entertainment (GEE), a key customer for both our existing fleet and our future high throughput capacity. As we also extended our collaboration with Panasonic and Gogo, SES now serves the three major global inflight connectivity providers. On the sea, O3b delivers more bandwidth to four large connected cruise ships than the rest of the maritime industry combined, a leap marking the beginning of a new era of maritime connectivity.
In order to satisfy the rapidly growing global customer demand for connectivity on the move, SES is investing EUR 1 billion in the next two years in three innovative high-throughput satellites: SES-12, SES-14, and SES-15. With significant amount of capacity pre-committed and sufficient incremental capacity in Ku- and C-band, these satellites will underpin our sustainable growth in the Mobility sector from 2017 onwards.
The Government vertical developed significantly in 2015 with the procurement of SES-16/GovSat for LuxGovSat, a joint venture with the Luxembourg government. This satellite will provide dedicated military frequencies for government and institutional requirements over Europe, the Middle East and Africa. The Luxembourg government committed to a significant amount of capacity on the satellite, which will provide high-powered and fully-steerable spot beams to support multiple government specific missions. The programme is optimally suited to support Luxembourg’s contribution to European defence, such as NATO’s Alliance Ground Surveillance (AGS) programme. As per our strategic plan, we have
10 SES Annual Report 2015
also engaged in a number of new government markets, including a 12-transponder deal with the Kativik Government in Canada. In spite of a challenging budgetary environment in the U.S., the team established SES as the world leader in commercially hosted government payloads with new programmes contracted with NASA, the Federal Aviation Administration (FAA), Raytheon Integrated Defense systems, the University of Colorado, and U.S. Central Command in 2015.
We see a growing demand in the Government sector for civilian applications related to schooling and distance learning, civil protection, e-medicine, emergency response and disaster recovery. Military demand also increases as missions that require sophisticated Unmanned Aerial Vehicles (UAV) to support Intelligence, Surveillance and Reconnaissance (ISR) efforts become a strong driver for growth over the long term.
As a third foundation, we must support and accelerate the scalability of resources downstream in order to fast-track the development and deployment of solutions and applications. Our business remains infrastructure centric, and our forte is rooted in the quality, scalability and deployment of our satellite fleet. Notwithstanding this anchor, the advent of new technologies and accelerated supplies of satellite capacity, such as high throughput, places the onus on us to identify and enable the new markets and applications that can benefit from these advancements. While remaining true to our infrastructure core upstream, we want to support the scalability of distribution capabilities in our industry in the form of solutions and applications to ensure that development opportunities are seized and realised downstream.
As a fourth foundation, the differentiation we are constantly seeking to achieve must be relevant first and foremost to our clients. In all our works, we must ask what tangible impacts and improvements we bring to end users and be satisfied with their sustainability. Only then we can be confident that our solutions are associated by our clients with enhanced value. Differentiation, therefore, is reaffirmed as a foundational element of our business model, and we are mindful that this has to be increasingly customised according to market verticals.
Differentiation at SES puts the focus on capabilty-driven strategy per market vertical, which is far more compelling to our long-standing clients than mere infrastructure.
In Video, this is manifested in our unique combination of prime neighbourhoods, technical reach, hybrid platforms and ancillary services that create high value for our clients and ultimately their end-users. The exceptional growth in the end-to-end video platform we serve, the uninterrupted growth in the number of channels we broadcast globally, the unique growth in HD channels, and being the premier provider in UHD, all demonstrate our capabilities. Furthermore, RR Media and SES PS will create a new stand-alone media services provider, focused on offering customers optimised content management and distribution solutions. The strength
of the SES PS and RR Media combined network will come from leveraging their multiple satellite positions as well as a large fibre network to deliver content both online and with DTH services.
In Enterprise, our differentiation is achieved through the global coverage of our satellites across multiple frequency bands with an overlay of IP-based solutions and completed by robust network management systems. This means that our Tier One clients can best serve leading government organisations and commercial institutions across diverse economic sectors where digitisation has become a table-stake requirement.
In Mobility, our differentiation is working with our clients to create new user experiences from scratch. We have done so actively by teaming up with the world’s leading service integrators to enable improved connectivity in the Aeronautical segment. Our affiliate O3b has done the same in the Maritime segment providing Royal Caribbean with unprecedented connectivity. Just imagine that four of their ships have more connectivity than all the other cruise ships in the world, and imagine how this translates into a unique traveller experience.
In Government, our differentiation is built upon two elements. First, we have a unique ability to deliver end-to-end solutions to the most demanding civilian or defence and security programmes, starting with the U.S. government. Secondly, we are also thought leaders in defining new ways for government to access commercial connectivity and ancillary services. Our up-and-running Pathfinder programmes with the U.S. Government, as well as the Wide Area Augmentation Systems (WAAS) and Global Scale Observations of the Limb and Disk (GOLD) hosted payloads under design, and finally the two European Geostationary Navigation Overlay Service (EGNOS) payloads under operation to support the European Galileo navigation systems, are prime examples. SES has also been a leading voice in the evolution of GovSatCom programmes, with LuxGovSat (SES-16) as a unique example of leadership in business model and market positioning. This satellite is slated for launch in 2017, and has already garnered considerable market traction including the multi-year support of the Alliance Ground Programme (AGS).
These four foundations are possible first and foremost because of the community of 1,332 colleagues who are bringing the best of SES to each and every client we serve around the world. I am particularly proud of the diversity of our ranks, with 55 nationalities and the role of women in our institution and the industry at large growing. Our human capital agenda was strengthened this year with the roll-out of a knowledge management system that leads the industry to connect our best ideas and experiences, collectively and individually, to every client we serve. Simply put, each member of our global community can tap into the system to access the ever-increasing intellectual capital that is relevant to the mission at hand and also leverage the instant networking tools to find new solutions to emerging needs. This also paves the way for the digital office of the future that will enable SES to operate seamlessly and
INTRODUCTION GLOBALISATION VERTICALISATION SOCIETYINNOVATION CORPORATE GOVERNANCE
FINANCIAL REVIEW
FINANCIAL STATEMENTS
SES ANNUAL ACCOUNTS
• SES at a glance• Organisation• Financial highlights• Introduction by the Chairman
of the Board of Directors• Foreword from the President
and CEO
11SES Annual Report 2015
efficiently across regions. Our Learning and Development agenda introduced the High Potential programme in 2014, which puts 54 of our talented young managers through a multi-year accelerated programme to best equip them for their future leadership roles.
Our new foundations enable us to achieve outstanding value creation. SES is at the forefront of an industry revolution that offers greater opportunities than ever before, and we are ready to grasp these with both hands. We will further enhance the benefits to customers across all market verticals by actively evolving our activities in concert with our industrial partners. I am confident that the combination of our committed teams and innovative approach, which delivers differentiated solutions on a global scale, will continue to deliver outstanding shareholder value.
I will now invite you to read in the following pages the insightful facets of some of the most exciting works that SES is undertaking around the world to cement its new foundations.
Karim Michel Sabbagh

12 SES Annual Report 2015
GLOBALISATION

xx xxx
13SES Annual Report 2015
14 SES Annual Report 2015
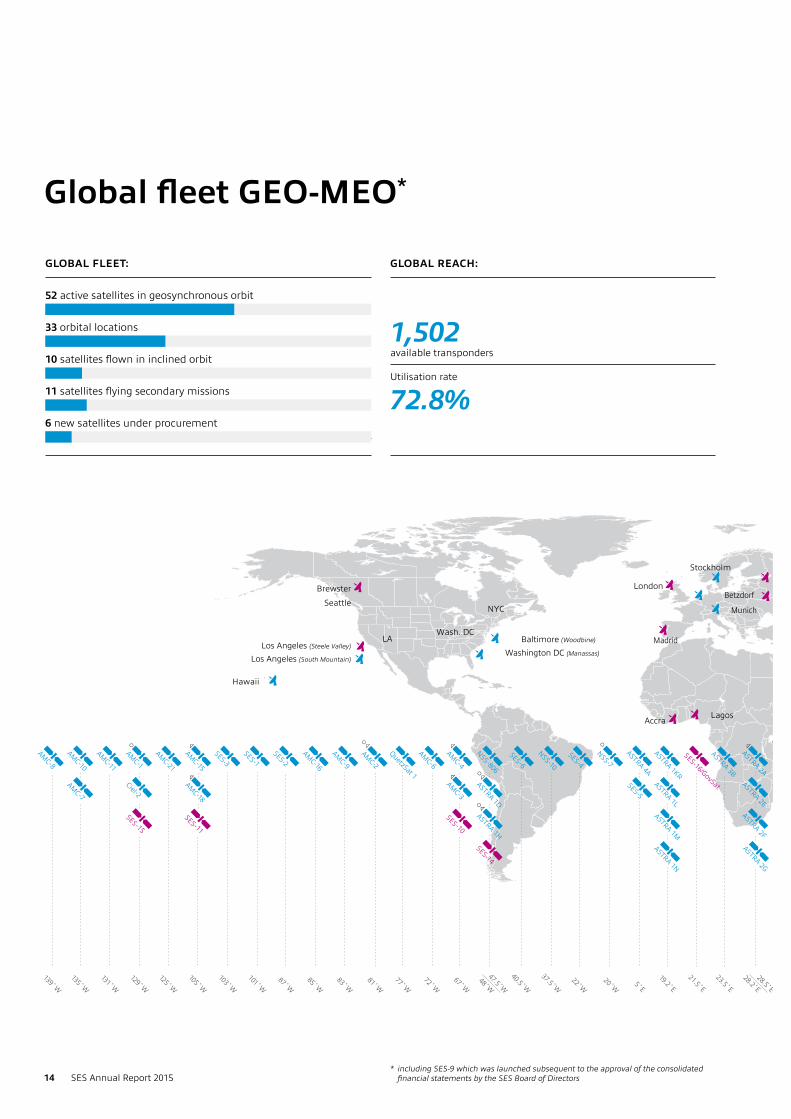
GLOBAL FLEET:
52 active satellites in geosynchronous orbit
33 orbital locations
10 satellites flown in inclined orbit
11 satellites flying secondary missions
6 new satellites under procurement
SES-16/GovSat
April 2016
Global fleet GEO-MEO*
GLOBAL REACH:
1,502 available transponders
Utilisation rate
72.8%
* including SES-9 which was launched subsequent to the approval of the consolidated financial statements by the SES Board of Directors
INTRODUCTION GLOBALISATION VERTICALISATION SOCIETYINNOVATION CORPORATE GOVERNANCE
FINANCIAL REVIEW
FINANCIAL STATEMENTS
SES ANNUAL ACCOUNTS
• Global fleet GEO-MEO• Channel Count
15SES Annual Report 2015
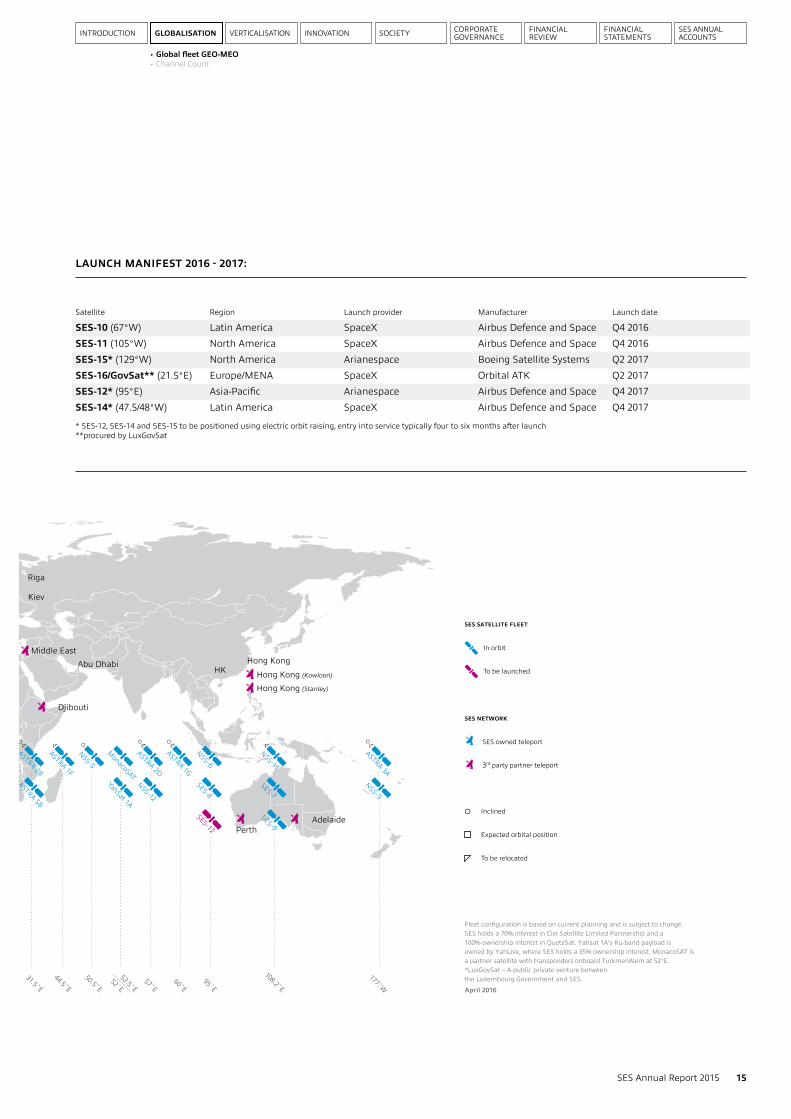
* SES-12, SES-14 and SES-15 to be positioned using electric orbit raising, entry into service typically four to six months after launch**procured by LuxGovSat
LAUNCH MANIFEST 2016 - 2017:
Satellite Region Launch provider Manufacturer Launch date
SES-10 (67°W) Latin America SpaceX Airbus Defence and Space Q4 2016SES-11 (105°W) North America SpaceX Airbus Defence and Space Q4 2016 SES-15* (129°W) North America Arianespace Boeing Satellite Systems Q2 2017 SES-16/GovSat** (21.5°E) Europe/MENA SpaceX Orbital ATK Q2 2017SES-12* (95°E) Asia-Pacific Arianespace Airbus Defence and Space Q4 2017 SES-14* (47.5/48°W) Latin America SpaceX Airbus Defence and Space Q4 2017
SES-16/GovSat
April 2016
16 SES Annual Report 2015
46,3% 47,4% 47,0% 46,8% 47,1%
45,6% 43,9% 43,8% 43,6% 43,4%
4,8% 5,4% 5,4% 5,7% 5,0% 3,3% 3,3% 3,8% 3,9% 4,6%
0%
5%
10%
15%
20%
25%
30%
35%
40%
45%
50%
YE11 YE12 YE13 YE14 YE15
Satellite
Cable
Terrestrial
IPTV
26%Cable
27%Terrestrial
Satellite
35%
12%IPTV
5˚E
19.2˚E
23.5˚E
28.2˚E
31.5˚E
51m 35m 49m 15m117m
North America
84m
Latin America
25m
Europe
156m
317m IP
SES reach worldwideSatellite homes
127mCable homes
148mIPTV homes
42m
Africa
8m
Asia-Pacific
44m
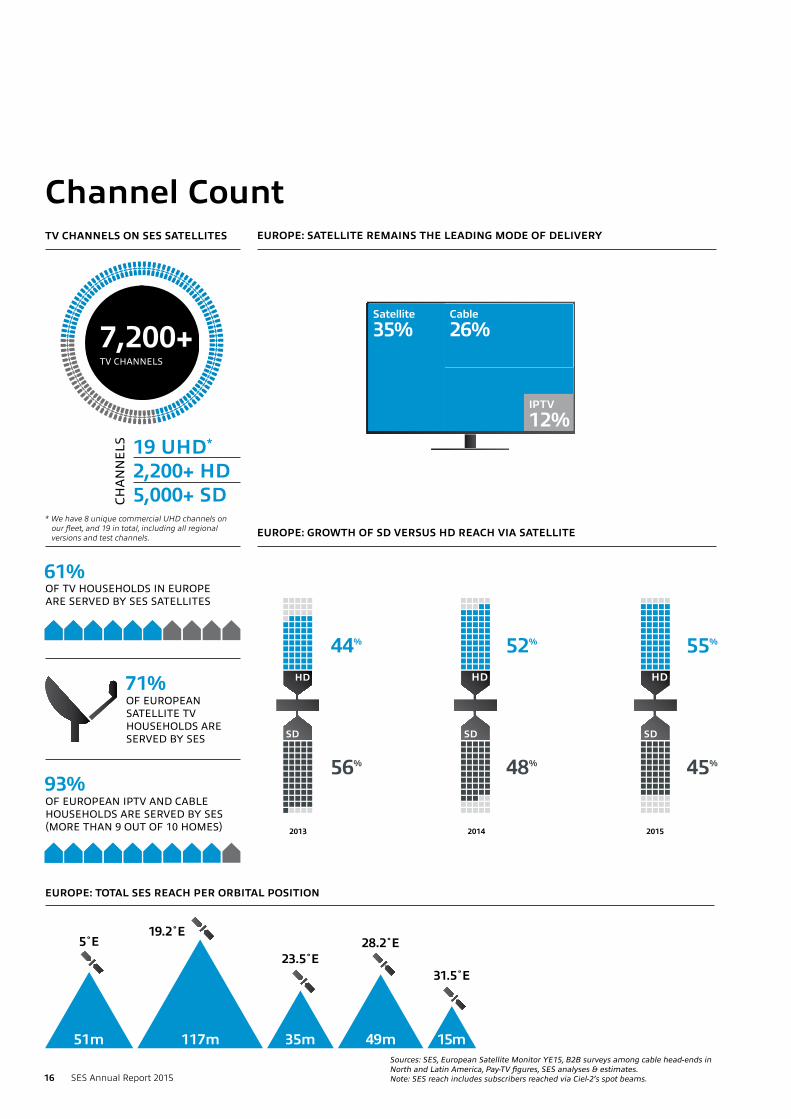
19 UHD* 2,200+ HD5,000+ SD
EUROPE: GROWTH OF SD VERSUS HD REACH VIA SATELLITE
EUROPE: SATELLITE REMAINS THE LEADING MODE OF DELIVERY
2013
56%
44%
48%
52%
2014
45%
55%
2015
TV CHANNELS ON SES SATELLITES
GERMANY: MARKET SHARE OF MODES OF TV RECEPTION EUROPE: IPTV EVOLUTION
EUROPE: TOTAL SES REACH PER ORBITAL POSITION
7,200+ TV CHANNELS
CHA
NN
ELS
61%
* We have 8 unique commercial UHD channels on our fleet, and 19 in total, including all regional versions and test channels.
71% OF EUROPEAN SATELLITE TV HOUSEHOLDS ARE SERVED BY SES
SES REACH WORLDWIDE
93% OF EUROPEAN IPTV AND CABLE HOUSEHOLDS ARE SERVED BY SES(MORE THAN 9 OUT OF 10 HOMES)
OF TV HOUSEHOLDS IN EUROPEARE SERVED BY SES SATELLITES
IPTV HOMES (INDIRECT REACH)
PI PI2014 2015
42 m38 mCABLE HOMES (INDIRECT REACH)
2014 2015
149 m 148 mSATELLITE HOMES (DIRECT REACH)
2014 2015
125m 127m
0
5
10
15
20
25
30
YE11 YE12 YE13 YE14 YE15
IInn mm
iilllliioo
nnss
Sources: SES, European Satellite Monitor YE15, B2B surveys among cable head-ends in North and Latin America, Pay-TV figures, SES analyses & estimates. Note: SES reach includes subscribers reached via Ciel-2’s spot beams.
Channel Count
17SES Annual Report 2015
VERTICALISATION

18 SES Annual Report 2015
INTRODUCTION GLOBALISATION VERTICALISATION SOCIETYINNOVATION CORPORATE GOVERNANCE
FINANCIAL REVIEW
FINANCIAL STATEMENTS
SES ANNUAL ACCOUNTS
• Video • Enterprise • Mobility • Government
19SES Annual Report 2015
VideoThe video industry is developing rapidly, thanks to the acceleration of two intertwined trends. One is customers’ demand for flexible video services across multiple platforms and screens, which follow them as they go about their daily life. This coincides with the second trend, an increase in demand for video content that is continually higher quality, yet needs a future proof, scalable and efficient capacity to transmit it. These two elements are pushing demand for satellite and fostering growth in our Video segment. The strong drive to High Definition (HD) TV continues to generate momentum, with Ultra HD – as next generation video – on the horizon. We also see a surge in demand from developing economies as their purchasing power and appetite for video increases.
SES is well positioned to take advantage of this rapidly developing landscape. Video remains the largest market segment for us, representing 67% of our revenue in 2015. Our excellent technical infrastructure gives us unique capabilities. We serve large geo-graphical areas to deliver thousands of channels. We broadcast in the highest quality, including HD and Ultra HD. We take a leading role in developing new video ecosystems. We take care of our customers by creating end-to-end solutions and on-demand products that we tailor to their needs. Consequently, SES is able to ensure that our clients are able to satisfy their customer’s demands for variety and flexibility.
SES global reach continued to lead the industry in 2015 with our service transmitting to 317 million households, touching more than 1 billion people. This number breaks down to an impressive demonstration of our penetration in all world markets. In regions where we are well established we continue to lead the market, delivering to 154 million TV households in Europe and 84 million in North America. SES is committed to building our presence in developping markets, serving 8 million homes in Africa, 25 in Latin America, and 44 million in Asia. Our coverage in this particular market will now expand with the imminent introduction of SES-9 delivering increased capacity over Northeast Asia, South Asia & Indonesia.
Growing household reach translates into further growing attraction for broadcasters. In 2015 SES grew its impressive global channel neighbourhood and transmitted an industry record number of TV channels, including virtually all blue chip broadcasters. Our TV channel count grew by 11.3% to 7,268 channels during 2015, compared with an overall growth of 2% for the rest of the industry. The superior development was driven by the continued introduction of new HD channels across Europe and North America, as well as the further expansion of our Video business across emerging markets. HD grew by 18% to 2,230 channels, representing 31% of the total TV channels on SES satellites, and forming by far the largest single HD infrastructure in the world. By the end of 2015 our German HD platform, HD+ had 1.84 million subscribers representing a 11.3% increase over
the previous year. This growth is supported by a continuously strong backlog of over 1.1 million customers in their free-trail period.
The extended video services delivered by SES platform services and our Video vertical act as a catalyst in the market and drive SES growth. We provide several innovative solutions that enable our customers to expand also beyond their linear offering. This in turn allows them to respond to the need for affordable content delivery across multiple platforms. Now our customers can also deliver on-demand services over satellite or internet, on any device. Our LUCID OVD product is an end-to-end online video solution that enables DTH platform operators to complement their video business with online video and a multiscreen user experience. The FLUID HUB product provides customers with efficient, automated archiving, processing, and distribution on a variety of video platforms. Both FLUID and LUCID products launched in September 2015 at IBC in Amsterdam.
With more TV channels than ever before, SES’s leading role as a TV broadcasting infrastructure and driver of global digitisation is confirmed. SES is well placed to leverage major growth opportunities, especially in new and emerging markets. Our current satellite launch programme will be a dynamic engine for this future growth, delivering a 21% increase in capacity for emerging markets by the end of 2017.

20 SES Annual Report 2015

INTRODUCTION GLOBALISATION VERTICALISATION SOCIETYINNOVATION CORPORATE GOVERNANCE
FINANCIAL REVIEW
FINANCIAL STATEMENTS
SES ANNUAL ACCOUNTS
• Video • Enterprise • Mobility • Government
21SES Annual Report 2015
EnterpriseThe way we live and connect with each other is changing, thanks to internet-based applications and the rising affordability of smart phones and tablets. This evolution has in turn caused an increased demand for reliable and high-speed broadband access. Individuals who never had access before want to reap the social and economic benefits of connectivity, while those who are already connected want higher speed, uninterrupted, and ubiquitous connectivity. In this era of change, SES satellite services intersect with multiple ecosystems making us uniquely situated to play a key role in the future of data.
To prepare for this universal demand for broadband, SES has invested in a differentiated offering that combines GEO wide beam, GEO high throughput and MEO ultra high throughput payloads. With this infrastructure in the sky, we can distribute enormous capacities with service packages that are scalable and flexible to customer’s needs. Together with O3b, we provide unprecedented access to a high performance, scalable, future-proof network to serve sectors such as telecommunications, oil & gas, banking, transportation, health and education. SES’s global fleet now reaches more than 1 million simultaneous fixed internet connections. Since 2013, we have tripled our number of managed IP platforms over the last three years, growing the average bitrate per customer site from 4 Mbps to 12 Mbps. SES now exchanges 57Gbps of data traffic with the internet per year, delivering close to 219,573 Terabytes of data to thousands of global internet points of presence (POPs).
Enterprise customers are located across the globe and have a diverse range of goals. We are particularly proud that SES satellites now deliver e-learning solutions to rural communities in Nigeria and provide e-banking services in Cameroon. In the Middle East, connectivity provided by SES satellites ensures seamless operations on remote oil and gas sites. Broadband access enriches underserved communities in India, while satellites connect schools in Mexico. Additionally the European market remains strong, and is growing as Astra Connect services make it possible for remote and isolated rural homes to enjoy the same connectivity as urban communities. In 2015, we also had a particular focus on extending our relationships with long-term partners. As part of this we delivered solutions that will meet Airbus Defence and Space’s expanding needs for global connectivity moving forward.
SES goes beyond infrastructure to meet dynamic market demands. Leveraging the unique strength of our combined fleet, SES and O3b offer the flexibility and scalability needed for the future. Our differentiated offer is ready to serve future applications that will demand even higher throughputs and better value. Meanwhile our service reaches to the end of the value chain with packaged products designed to meet customer needs. We define this trajectory with our new family of Plus products, Enterprise+ acting
as the first ambassador for this business rationale. This product is a pre-defined and pay-as-you-go offer that ensures prompt and affordable broadband service. Already launched successfully in five African countries, products like this are the first of a whole-service approach that delivers scalable performance with plug-and-play simplicity.
Our latest procurements will take us further into the broadband market, including SES-14, SES-15 and the high throughput payloads aboard SES-12. This strength is supported by O3b’s focus on ultra high throughput capacity satellites with 12 already in operation and eight more to be launched in the coming years. Expanding our service enables us to connect millions more as we work relentlessly to innovate, and focus on strategic partnerships across the industry. Our customers will continue to see an increase in managed services and products under the umbrella of the Plus product family, designed for their specific needs. Our leading service that anticipates demand and creates innovative solutions will create new opportunities available for everyone, strengthening connection throughout the globe.

22 SES Annual Report 2015
INTRODUCTION GLOBALISATION VERTICALISATION SOCIETYINNOVATION CORPORATE GOVERNANCE
FINANCIAL REVIEW
FINANCIAL STATEMENTS
SES ANNUAL ACCOUNTS
• Video • Enterprise • Mobility • Government
23SES Annual Report 2015
MobilityConsumers today expect constant access to their networks, so communications must reach across land, sea and sky. This demand is compounded by the recent accessibility of travel and the affordability of mobile devices. This has created a dramatic boom in maritime and aeronautical markets, and drives global demand for connectivity on the move. Satellite is the only communications infrastructure that can guarantee 100% coverage across land, sea and sky, launching a new era of satellite connectivity that SES is already serving. The SES fleet is unique in its global coverage, making us perfectly positioned to take advantage of this brand new market demand. Our satellite coverage spans the globe, ensuring constant connection for any moving vehicle, planes or boats, regardless of their route.
In 2014, we affirmed our commitment to this market by defining the Mobility vertical as one of our four core business areas. Already in 2015 we delivered dramatic results, as SES technology differentiates itself in the market. The SES fleet in GEO, combined with O3b’s satellites in MEO, offers a globally scalable and flexible service that is unsurpassed. We tailor our solutions according to customer demand to ensure we meet their needs. Our satellites supply massive bandwidth and ubiquitous service to customers, attracting them to our service. This high-quality service has firmly established our reputation in the mobility market for both aeronautical and maritime companies. These industries are only beginning to reap the benefits of increased connectivity for their customers, and also their internal processes. Internally in the aviation industry, connectivity drives value by enabling load optimisation. In the maritime segment it allows companies to monitor vessels, and prepare for maintenance before a ship reaches harbour. Optimising internal procedures thanks to connectivity is beneficial, but even more compelling is the passenger connectivity service that SES makes possible. Thanks to our satellite service both industries meet the unprecedented connectivity demands of their passengers. We are transforming the travel experience by allowing people and organisations to remain connected wherever they are in the world, on land, sea and in the air.
Our service is now crucial to the airline industry, where our high-performance, satellite-based inflight connection services are a key differentiator for airlines in their competitive market. In 2015, a record 3.5 billion people travelled via air, 80% of whom have a smart device and expect constant and reliable high speed connections. This leads to an exceptional growth in high performance connectivity. SES is a pioneer in this industry and led the market by signing all three of the world’s major inflight connectivity providers, Global Eagle Entertainment, Gogo and Panasonic.
In the maritime segment, the flexibility of SES satellite service provides for a variety of connectivity needs. Whether they are luxury cruise ships, superyachts, merchant ships or fishing boats, we tailor our connectivity offering to match their distinct specifications. Our solution’s scalability is particularly attractive to the cruise ship industry, as this dramatic new demand for connectivity is universal to all passengers. Internet service can now be a key differentiator to transform travel experience, and Royal Caribbean Cruises saw this opportunity. SES is the largest investor in O3b Networks. O3b currently provides dedicated services to 4 of Royal Caribbean’s largest cruise ships. Beams from O3b’s constellation follow the ships delivering 500 Mbps connecting more than 6,000 guests and crew. In fact, each of these ships is served by O3b with more bandwidth than all other cruise ships in the world combined.
Custom service that combines the power of our high bandwidth GEO satellites, O3b’s MEO constellation, and our future high throughput infrastructure is a focus for SES, defined as our Plus service offering. Our global fleet of 52 satellites include a strong collection of satellites and orbital slots over transoceanic routes and the developed markets, which drive our growth in Mobility. SES continues to lead in procurement for this market, and we will launch three high throughput satellites in the coming years, SES-12, SES-14 and SES-15. Our fleet and partnership with O3b provides a solid foundation for an impressive line-up of partnerships. These enablers and unique discriminators position SES at the forefront of the Mobility vertical, ready to connect people across the globe.

24 SES Annual Report 2015
INTRODUCTION GLOBALISATION VERTICALISATION SOCIETYINNOVATION CORPORATE GOVERNANCE
FINANCIAL REVIEW
FINANCIAL STATEMENTS
SES ANNUAL ACCOUNTS
• Video • Enterprise • Mobility • Government
25SES Annual Report 2015
GovernmentMore and more governments and institutions see the potential uses that developments in communications technology offer. As new forms of connectivity become possible, we see this sector increase its use of high-bandwidth satellite-based applications for security, defence, communications and civil projects. The U.S. military led the adoption of satellite services for governments in the early 2000s, bringing about nearly a decade of double-digit growth in this market segment. Today, defence departments and federal agencies worldwide are enhancing capabilities as they seek to acquire the same kinds of space-based communications and earth-sensing capabilities the U.S. government has used since the 1990s.
SES has served this unique sector for decades, differentiating itself with unsurpassed quality and unique service capabilities. We continue to meet the increasing demands of governments and multilateral agencies around the world with a secure and highly reliable global network. Our built-in redundancies for civilian, security and defence applications make SES a reliable partner for government and institutional projects. Our global fleet and teleport network offer a diverse array of satellite infrastructure that incorporates both commercial and specialised government frequencies. We design our solutions together with each partner to deliver end-to-end packages tailor-made for security, defence, and information gathering, as well as for humanitarian activities such as e-health, e-learning, e-lections, or e-mergencies. The global government vertical has enabled SES to build on a strong foundation of U.S. government business, and to offer similar services to other governments and institutions, particularly within NATO, the Middle East and the Asia-Pacific region.
The U.S. Government remains the largest customer within the SES global government market segment, even with federal budget constraints that have slowed growth over the past three years. Despite tight budget measures and difficult market conditions, the U.S. team boasted strong new business performance in 2015, and outperformed the competition. Our U.S. government team, SES Government Solutions, won contracts to carry a payload for NASA that will transmit data of the Sun’s impact on the Earth’s thermosphere and ionosphere and a GPS-related Wide Area Augmentation System sensor for the U.S. Federal Aviation Administration. SES also supports multiple missions for the U.S., including enabling the worldwide information exchange between embassies and troops abroad.
On the international front, 2015 was a landmark year for the SES Government sector. SES led the fastest growing sub-segment of the government and institutional market, hosted and dedicated payloads. Early in the year, SES invested in LuxGovsat, a jointly incorporated entity of SES and the Luxembourg Government, to provide Ka and X-band services on a dedicated satellite for NATO
and NATO member states. The Galileo and EGNOS contracts have further strengthened our partnerships with European agencies and governments. In Africa, we began a new network and relationship with Niger’s ministry of Defence to deliver critical communications capability to a dozen bases throughout the country. In Burkina Faso, SES Techcom Services installed a secure and comprehensive communications platform to support the presidential elections. Finally, as an illustration of a growing and diversifying portfolio of global Government customers, SES signed deals with five new countries in 2015. The largest of these was a 12-transponder deal with a regional government in Canada, awarded in the fourth quarter. Revenue from international government partnerships doubled from 1.5% to 3% of total revenue over the last three years.
The diversification and growth of our global Government portfolio has just begun. We will continue to build on our success with new and innovative business models such as LuxGovSat, and lead in the hosted payload arena. New government demand is growing for satellite services that enable applications such as e-health, e-learning and e-administration, and SES is ready to explore the possibilities of these exciting projects with our government and institutional partners. SES is an expert at leveraging synergies with new concepts and customised proven products across global regions. This is a unique capability and we are now launching a family of products that will be designed based on it all under one umbrella, (Plus). With this campaign, and our demonstrated strength in this sector, we expect the Government segment to serve as one of the fastest growing verticals for SES in 2016 and beyond.
26 SES Annual Report 2015
INNOVATION
27SES Annual Report 2015
28 SES Annual Report 2015
INTRODUCTION GLOBALISATION VERTICALISATION SOCIETYINNOVATION CORPORATE GOVERNANCE
FINANCIAL REVIEW
FINANCIAL STATEMENTS
SES ANNUAL ACCOUNTS
• Next Generation Satellites• Next Generation Constellations• Next Generation Talent
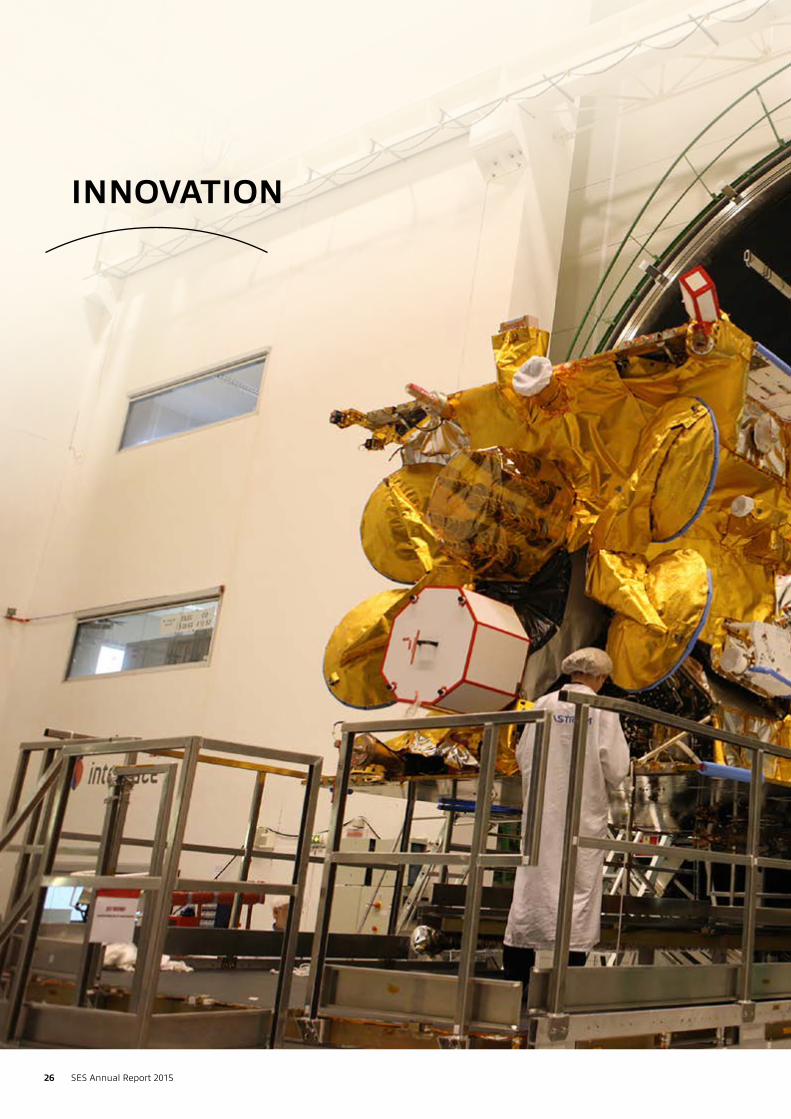
Next Generation SatellitesOur industry is experiencing major shifts due to recent design and technology revolutions. New approaches to satellite engineering create exciting opportunities to expand our capabilities and differentiate our offer. As SES makes another leap forward in the field of connectivity, the new mantra for satellites focuses on three key elements: lightweight, efficient with beams, and fast to market.
LIGHTWEIGHT: ELECTRIC PROPULSION
To launch our satellites into orbit, we use rockets with finite load capacity. By decreasing the weight of the satellite, we can either save on launch costs, or add more features to expand service capabilities. Fuel for propulsion has typically been one of the most significant weight loads aboard the satellite. It represents at least half of the satellite’s total weight, at least two thirds of which is burnt within a couple of days on the satellite’s flight to its final destination.
The next generation of satellites solve this problem by reinventing traditional propulsion systems. Instead of using heavy chemical propulsion systems, they use electric propulsion that requires only 20% of the mass of chemical propellant. With this new system, electricity ionises highly compressed Xenon gas, and then accelerates it to create thrust. The electricity required comes from the satellite’s solar panels. Since compressed Xenon gas has a low mass and high density, tanks are 10% of their original size. This provides the space and weight savings needed to significantly reduce launch costs or add payloads to expand the satellite’s service capabilities.
Industry forecasts suggest that by 2020 the propulsion of half of all commercial telecommunications satellites will be electric. At SES, we have already procured satellites with this new technology. We will use the weight savings provided by electric propulsion to meet the needs of our customers by adding service payloads to satellites, or growing our fleet, to reinforce SES’s reputation for excellence.
EFFICIENT WITH BEAMS: DIGITAL PROCESSING
A key objective for satellite innovation is to create technology in the sky that is as flexible as we are on the ground. Until now, satellites launched with a static allocation of spectrum capacity. This defined a satellite’s technical capabilities during its nominal lifespan of 15 years. The next generation of satellites have cognitive capabilities produced by on-board microprocessors, enabling them to be more reactive.
The new technology brings many benefits. Customer signals will improve transmission on multiple beams in a single loop, seamlessly connecting gateways and users anywhere in the satellite’s footprint. The on-board microprocessors will improve
transmission reliability. They will take over all the actions associated with satellite housekeeping – within their orbital slot and reacting to temperature and voltage changes – making the satellites far less reliant on human interaction. Finally, the built in processors will learn from the traffic and capacity patterns to predict service usage for different time frames so they can optimise spectrum use.
The future satellite is highly adaptable, resulting in better spectrum allocation and a larger variety of services. It will enable us to change the mission of a satellite, even after it has been launched. This flexibility offers a world of new possibilities – for SES and our customers.
FAST TO MARKET: EFFICIENT CONSTRUCTION
Satellite manufacturers continuously seek opportunities to streamline their processes. Building a satellite from scratch enabled the customisation their customers needed, but cost time. Now that satellite technology is more mature, the industry can break this dynamic and build fast-to-market satellites. This is attractive for the cost savings incurred, and because it allows us to respond more quickly to market and customer needs.
By using basic elements that have already been proven, engineers are able to minimise the time required to design and build a satellite. The outer skin or base platform of many satellites will look the same, however the functionality will be tailored to customer needs. For example, we select from a cluster of engine options – between manual, automatic and all-electric – to create our ideal satellite. We decide what we need for functionality, and then the manufacturer puts the pieces together.
These streamlined developments in construction coincide perfectly with the increased launch capacity now available to us. Efficient construction creates an economy of scale that makes SES ready to lead the industry into a future where satellite services are everywhere. We strive to make satellite communications accessible to everyone, and these advancements take us one step closer to the age of dense and high connectivity.
29SES Annual Report 2015

30 SES Annual Report 2015
INTRODUCTION GLOBALISATION VERTICALISATION SOCIETYINNOVATION CORPORATE GOVERNANCE
FINANCIAL REVIEW
FINANCIAL STATEMENTS
SES ANNUAL ACCOUNTS
• Next Generation Satellites• Next Generation Constellations• Next Generation Talent
Next Generation ConstellationsThe new goalposts for innovation are longevity and reuse. At SES, we have internalised these values to design a future where our satellites use resources more efficiently and prolong the life of our investments.
REUSABLE ROCKETS
All of our satellites launch into their orbit with a burst of energy from a powerful rocket. These engines represent a significant portion of the cost of placing a satellite in orbit. The ability to reuse the first stage of a rocket could result in significant savings to the cost of the launcher, and therefore our launch budget. This is why we strongly support our launch partners’ efforts to develop cost-effective ways to re-use parts of their rockets.
On 21 December 2015, we saw the first milestone toward the reusability goal achieved when SpaceX completed a terrestrial landing of the first stage of its Falcon 9 rocket. This success came after two failed attempts to land on floating water platforms. On 4 March 2016*, SES participated in this new era of rocket development when it launched SES-9 with SpaceX’s Falcon 9 rocket. This launch did not include a reusability mission, but instead focused on ensuring that the maximum launch speed was achieved. The launch of SES-9 represented the first time SpaceX achieved a Geostationary Transfer Orbit (GTO) with an upgraded engine. To show our commitment to reusable rockets, SES is ready to be the first customer to use a refurbished first stage of a SpaceX Falcon 9 rocket.
SpaceX is pioneering the development of a reusable first stage, but other launch organisations are also working towards reusable rockets. The European Space Agency is considering the reusability goal, with an eventual evolution of their Ariane 6 rocket planned to have reusable first stage engines. We anticipate that this new age of space travel will have a strong positive influence on our business, specifically for our customers.
REFUELLING SATELLITES
Our fleet is one of our most valuable assets, so extending the commercial life of our satellites is a primary focus, as that would postpone investment in replacements. Currently, a satellite carries fuel to last for a nominal lifetime of 15 years after it launches. Therefore, SES encourages the development of technologies that enable us to use our satellites in orbit longer.
To achieve the goal of life extension, we are working with two companies focused on developing solutions. One of these companies is creating a technology akin to a mobile gas station that will work in orbit, refuelling multiple satellites using a specialised robotic arm. In this approach, the customer will pay
for the fuel loaded. The other company’s approach is to attach their satellite to a client satellite, to take over orbital control. This extends the life of the client’s satellite for the duration of their contract, after which the life extension satellite will detach and move on to another client satellite. Both concepts still need to overcome technical and commercial challenges to be successful, yet positive results will give SES a tool to defer new investments at a reasonable cost.
At SES we are enthusiastic about the potential that these technologies represent. We are currently in negotiations with both companies to have each extend the life of one of our satellites once their services are operational.
MODULARITY
The times of stable market demand belong to the past. The media and telecommunications business is now evolving at a high speed, creating changes for our industry. The current timeframe of making and launching geostationary satellites means that we must anticipate the market for up to 20 years. Therefore, SES is searching for novel ways to meet the challenge of such dynamic market demand. To do this we intend to disrupt our design cycle and create a more fluid and flexible service format by changing the static nature of satellites.
Currently SES is looking into the potential of a connector system to give us the capability to change the service payloads of a satellite in orbit. The system acts like building blocks,using changeable modules of service payloads to achieve flexibility for our customers.New satellites will include the proper receiving hardware, and we will deliver modules that connect to the hardware of the satellite in orbit when needed. New SES satellites that are launched will act as delivery systems, disposing of the old module and installing a new module before beginning their own mission. This connector technique already exists and was used by several institutional projects. SES is embracing the challenge of adapting such building blocks with a commercial perspective. If we succeed in achieving a commercially viable modular system, the possibilities are exciting. Satellites will become hosts for temporary guest modules, and SES can be more flexible in responding to market and customer demands.
At SES, we know that our strength comes from embracing new technologies and our commitment to pushing space innovation further. Looking into the future, we see countless possibilities as we release ourselves from single-use equipment and inflexible satellites. Changing the technical approach of our satellite system enables us to broaden our commercial outlook. By increasing our scalability and scope of service, we move another step closer to democratising satellite services.
* Subsequent to the approval of the consolidated financial statements by the SES Board of Directors 31SES Annual Report 2015
32 SES Annual Report 2015
Next Generation TalentSES’s success is a story of more than simply bold strategy and advanced technology. It is the story of the exceptional talent and dedication of a unique community of professionals. Our reputation for excellence is built on more than 30 years of remarkable reliability and impressive innovation, two elements that exist only because of our dedicated team.
STRENGTH IN DIVERSITY
SES employees demonstrate an unsurpassed mix of capabilities and expertise that empowers innovation and excellence in all our departments. We value each of our staff members, as they drive our company to continuously set industry standards. A review of our history provides the context to better envision the SES workforce.
In 2015, a handful of our team celebrated 30 years with us. This group, together with our other long-term employees, are the foundation of our organisation. They helped build SES from the ground up, and their extensive experience, dedication and institutional memory hold inestimable value. Our success means we continue to grow, and in 2015 we also welcomed dozens of new colleagues. These individuals bring a wide variety of backgrounds and skill sets that will complement the team and our pursuit of excellence. Today, we are proud that our team’s specialised skills, curiosity and eagerness to contribute distinguish them in the business world.
The SES team spans a diversity of functions, specialisations, nationalities, and seniority, highlighting our focus on talent management. Diversity in all things is a key factor of our talent strategy. We know that connecting generations, genders, nationalities, cultures and professional backgrounds is essential to building a full-strength team. The management of human resources is a primary focus at SES because we know it takes constant care to orchestrate the perfect harmony of skills and abilities.
GUIDING DEVELOPMENT
The SES strategy builds on a foundation of four pillars: Video, Enterprise, Mobility and Government. These markets define our business focus, and our talent management practices. Inside SES, we foster skill growth aligned to this strategy, refining our capabilities to remain competitive in these markets.
In 2015, we took a fresh look at our career development framework to match the needs of the company and our employees. We now encourage lateral movement within our organisation to develop knowledge and experience across our four market segments. Conducted at the end of 2014, our internal Voice of the Employee survey provided an excellent basis for the change project. In early 2015, we held a number of roundtable discussions about the results with groups of employees in different locations and functions.
Thanks to these discussions, we were able to refine implementation strategies and update our mid-year performance review process. The internal mentoring programme now extends to a wider range of employees, and talent review sessions take place on a regular basis. Two dedicated programmes also serve our development needs. Our two-year Associate Programme brings a handful of talented university graduates to us each year to embark on a series of six-month cross-functional and cross-regional assignments. Additionally, our High Potential programme nurtures a small group of employees at different seniority levels with a dedicated development agenda including off-site events, mentoring, access to additional training, and action-learning projects.
Promoting a culture of performance and growth is integral to our success, and remains a top priority. We continually set new industry benchmarks with our dedication to development. By expanding the talent bench in each function and systematically matching that with our succession planning, we ensure that the SES talent pipeline is ready for the future.
MARKET KNOWLEDGE
Some of our most valuable assets are in-house knowledge and collaborative work networks. These two elements not only ensure efficient work processes, they also foster innovation. This is why it’s so important that we support our staff with the resources and tools they need to work and cooperate.
Our newly defined focus on four market segments highlighted the importance of knowledge networking. To support staff excellence in these areas, 2015 saw the initiation of two distinct programmes. The first, Knowledge Networking at SES, builds on the existing SES knowledge management landscape with tools to expand our access to in-house information. This initiative ensures that business-critical knowledge related to each market segment is available to the right people at the right time. Our Knowledge Networking initiative goes even further by also launching a ‘Digital Workplace’ to make online collaboration between colleagues easier. The second project, SES office of the future, is still in early development. It focuses on creating a workplace where location and time zone differences take a back seat, while online collaboration, anywhere and anytime access to information, and flexible working processes can all happen naturally.
Providing our professionals with the best possible work environ-ment, and the tools they need to ensure an effective global approach is crucial. Our HR programme encompasses recruitment, develop-ment, and innovative workplace practices to support our goals at every step, propelling us into the future. SES is proud to be the home of professionals who think ahead, are willing to roll-up their sleeves, are bold and perseverant, and bring the best of SES to the world.

33SES Annual Report 2015
SOCIETY
34 SES Annual Report 2015
e-lectionsSatellite connectivity increasing electoral transparency
The administration of an election can seem overwhelming to many governments as they face pressure to report results immediately, while still maintaining the highest level of integrity. Satellite connectivity can support administrations as they tackle these challenges. By delivering connectivity to even the most remote locations, satellite ensures secure coverage for an entire country. This is vital during an election campaign. By installing e-lection terminals at voting booths across a country, training to the electoral team can be done ahead of elections and real-time results can be monitored, validated, and announced immediately during the elections.
E-LECTIONS IN BURKINA FASO
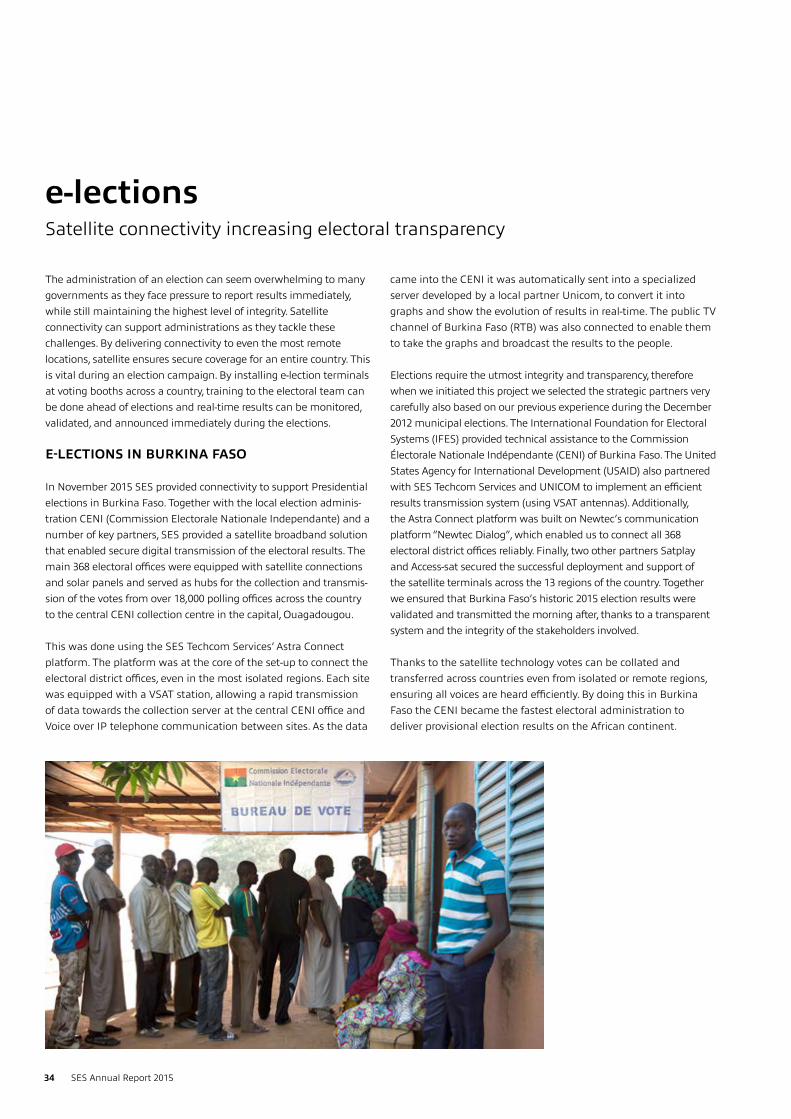
In November 2015 SES provided connectivity to support Presidential elections in Burkina Faso. Together with the local election adminis-tration CENI (Commission Electorale Nationale Independante) and a number of key partners, SES provided a satellite broadband solution that enabled secure digital transmission of the electoral results. The main 368 electoral offices were equipped with satellite connections and solar panels and served as hubs for the collection and transmis-sion of the votes from over 18,000 polling offices across the country to the central CENI collection centre in the capital, Ouagadougou.
This was done using the SES Techcom Services’ Astra Connect platform. The platform was at the core of the set-up to connect the electoral district offices, even in the most isolated regions. Each site was equipped with a VSAT station, allowing a rapid transmission of data towards the collection server at the central CENI office and Voice over IP telephone communication between sites. As the data
came into the CENI it was automatically sent into a specialized server developed by a local partner Unicom, to convert it into graphs and show the evolution of results in real-time. The public TV channel of Burkina Faso (RTB) was also connected to enable them to take the graphs and broadcast the results to the people.
Elections require the utmost integrity and transparency, therefore when we initiated this project we selected the strategic partners very carefully also based on our previous experience during the December 2012 municipal elections. The International Foundation for Electoral Systems (IFES) provided technical assistance to the Commission Électorale Nationale Indépendante (CENI) of Burkina Faso. The United States Agency for International Development (USAID) also partnered with SES Techcom Services and UNICOM to implement an efficient results transmission system (using VSAT antennas). Additionally, the Astra Connect platform was built on Newtec’s communication platform “Newtec Dialog”, which enabled us to connect all 368 electoral district offices reliably. Finally, two other partners Satplay and Access-sat secured the successful deployment and support of the satellite terminals across the 13 regions of the country. Together we ensured that Burkina Faso’s historic 2015 election results were validated and transmitted the morning after, thanks to a transparent system and the integrity of the stakeholders involved.
Thanks to the satellite technology votes can be collated and transferred across countries even from isolated or remote regions, ensuring all voices are heard efficiently. By doing this in Burkina Faso the CENI became the fastest electoral administration to deliver provisional election results on the African continent.
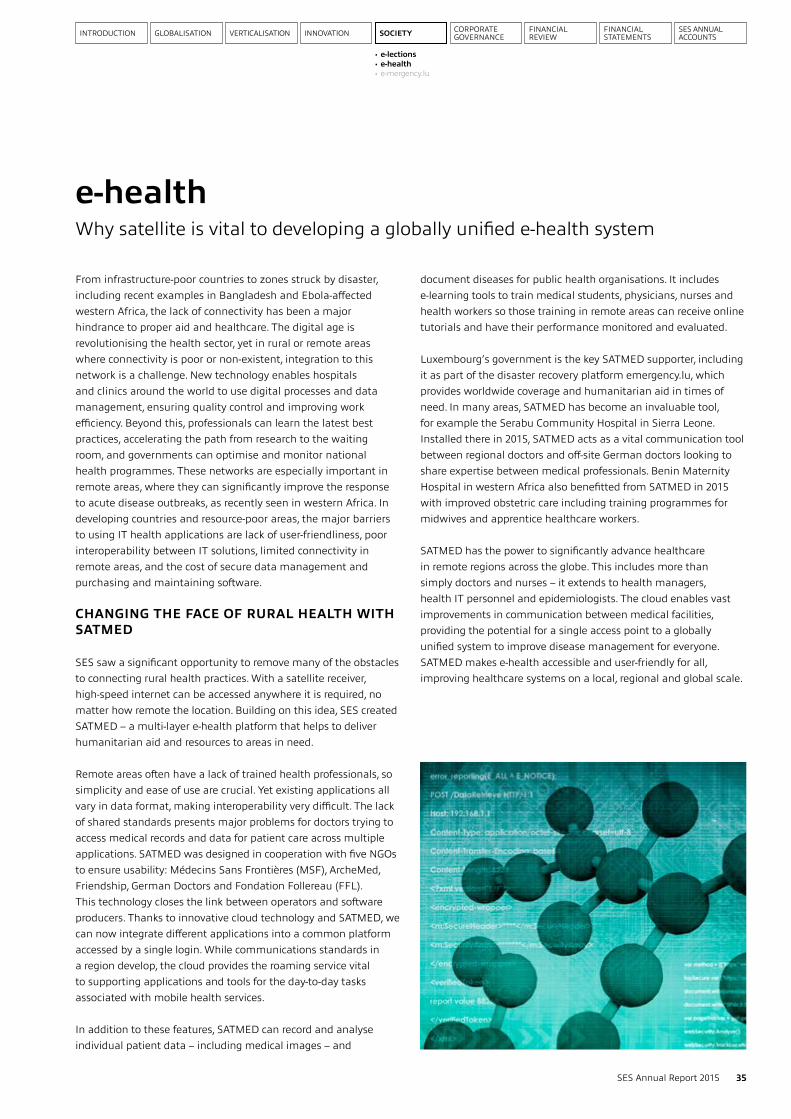
INTRODUCTION GLOBALISATION VERTICALISATION SOCIETYINNOVATION CORPORATE GOVERNANCE
FINANCIAL REVIEW
FINANCIAL STATEMENTS
SES ANNUAL ACCOUNTS
• e-lections • e-health• e-mergency.lu
35SES Annual Report 2015
e-health Why satellite is vital to developing a globally unified e-health system
From infrastructure-poor countries to zones struck by disaster, including recent examples in Bangladesh and Ebola-affected western Africa, the lack of connectivity has been a major hindrance to proper aid and healthcare. The digital age is revolutionising the health sector, yet in rural or remote areas where connectivity is poor or non-existent, integration to this network is a challenge. New technology enables hospitals and clinics around the world to use digital processes and data management, ensuring quality control and improving work efficiency. Beyond this, professionals can learn the latest best practices, accelerating the path from research to the waiting room, and governments can optimise and monitor national health programmes. These networks are especially important in remote areas, where they can significantly improve the response to acute disease outbreaks, as recently seen in western Africa. In developing countries and resource-poor areas, the major barriers to using IT health applications are lack of user-friendliness, poor interoperability between IT solutions, limited connectivity in remote areas, and the cost of secure data management and purchasing and maintaining software.
CHANGING THE FACE OF RURAL HEALTH WITH SATMED
SES saw a significant opportunity to remove many of the obstacles to connecting rural health practices. With a satellite receiver, high-speed internet can be accessed anywhere it is required, no matter how remote the location. Building on this idea, SES created SATMED – a multi-layer e-health platform that helps to deliver humanitarian aid and resources to areas in need.
Remote areas often have a lack of trained health professionals, so simplicity and ease of use are crucial. Yet existing applications all vary in data format, making interoperability very difficult. The lack of shared standards presents major problems for doctors trying to access medical records and data for patient care across multiple applications. SATMED was designed in cooperation with five NGOs to ensure usability: Médecins Sans Frontières (MSF), ArcheMed, Friendship, German Doctors and Fondation Follereau (FFL). This technology closes the link between operators and software producers. Thanks to innovative cloud technology and SATMED, we can now integrate different applications into a common platform accessed by a single login. While communications standards in a region develop, the cloud provides the roaming service vital to supporting applications and tools for the day-to-day tasks associated with mobile health services.
In addition to these features, SATMED can record and analyse individual patient data – including medical images – and
document diseases for public health organisations. It includes e-learning tools to train medical students, physicians, nurses and health workers so those training in remote areas can receive online tutorials and have their performance monitored and evaluated.
Luxembourg’s government is the key SATMED supporter, including it as part of the disaster recovery platform emergency.lu, which provides worldwide coverage and humanitarian aid in times of need. In many areas, SATMED has become an invaluable tool, for example the Serabu Community Hospital in Sierra Leone. Installed there in 2015, SATMED acts as a vital communication tool between regional doctors and off-site German doctors looking to share expertise between medical professionals. Benin Maternity Hospital in western Africa also benefitted from SATMED in 2015 with improved obstetric care including training programmes for midwives and apprentice healthcare workers.
SATMED has the power to significantly advance healthcare in remote regions across the globe. This includes more than simply doctors and nurses – it extends to health managers, health IT personnel and epidemiologists. The cloud enables vast improvements in communication between medical facilities, providing the potential for a single access point to a globally unified system to improve disease management for everyone. SATMED makes e-health accessible and user-friendly for all, improving healthcare systems on a local, regional and global scale.
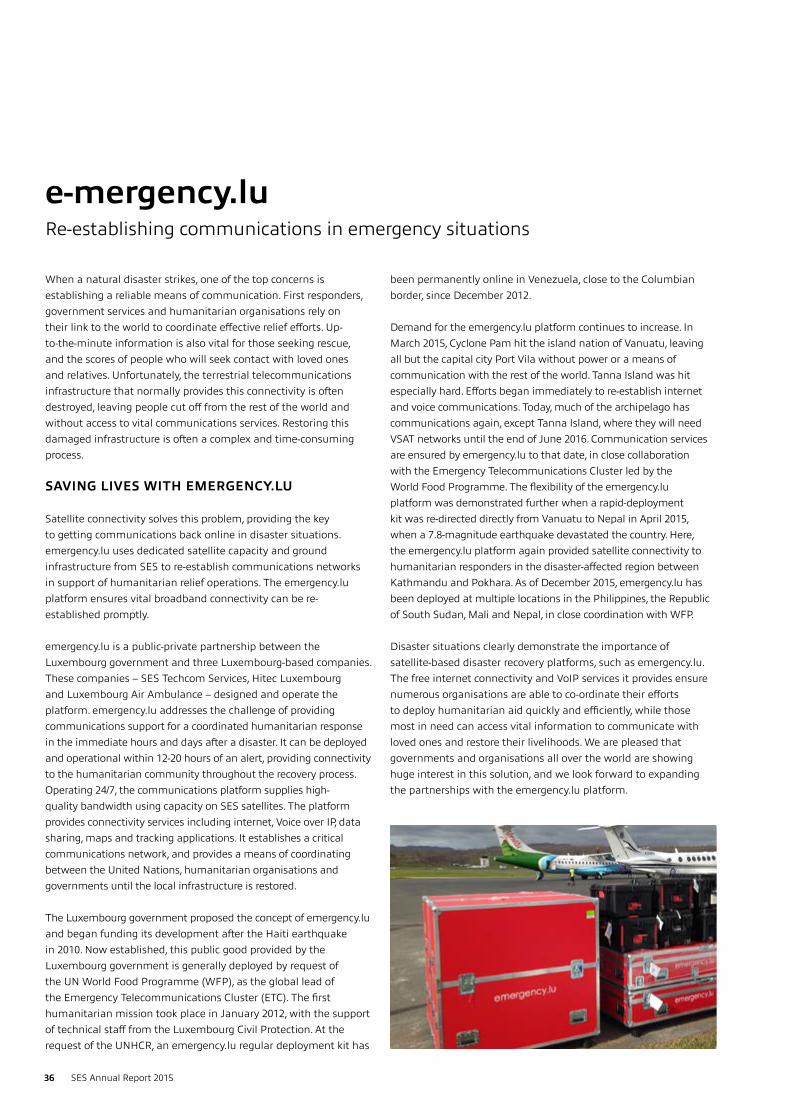
36 SES Annual Report 2015
e-mergency.luRe-establishing communications in emergency situations
When a natural disaster strikes, one of the top concerns is establishing a reliable means of communication. First responders, government services and humanitarian organisations rely on their link to the world to coordinate effective relief efforts. Up-to-the-minute information is also vital for those seeking rescue, and the scores of people who will seek contact with loved ones and relatives. Unfortunately, the terrestrial telecommunications infrastructure that normally provides this connectivity is often destroyed, leaving people cut off from the rest of the world and without access to vital communications services. Restoring this damaged infrastructure is often a complex and time-consuming process.
SAVING LIVES WITH EMERGENCY.LU
Satellite connectivity solves this problem, providing the key to getting communications back online in disaster situations. emergency.lu uses dedicated satellite capacity and ground infrastructure from SES to re-establish communications networks in support of humanitarian relief operations. The emergency.lu platform ensures vital broadband connectivity can be re-established promptly.
emergency.lu is a public-private partnership between the Luxembourg government and three Luxembourg-based companies. These companies – SES Techcom Services, Hitec Luxembourg and Luxembourg Air Ambulance – designed and operate the platform. emergency.lu addresses the challenge of providing communications support for a coordinated humanitarian response in the immediate hours and days after a disaster. It can be deployed and operational within 12-20 hours of an alert, providing connectivity to the humanitarian community throughout the recovery process. Operating 24/7, the communications platform supplies high-quality bandwidth using capacity on SES satellites. The platform provides connectivity services including internet, Voice over IP, data sharing, maps and tracking applications. It establishes a critical communications network, and provides a means of coordinating between the United Nations, humanitarian organisations and governments until the local infrastructure is restored.
The Luxembourg government proposed the concept of emergency.lu and began funding its development after the Haiti earthquake in 2010. Now established, this public good provided by the Luxembourg government is generally deployed by request of the UN World Food Programme (WFP), as the global lead of the Emergency Telecommunications Cluster (ETC). The first humanitarian mission took place in January 2012, with the support of technical staff from the Luxembourg Civil Protection. At the request of the UNHCR, an emergency.lu regular deployment kit has
been permanently online in Venezuela, close to the Columbian border, since December 2012.
Demand for the emergency.lu platform continues to increase. In March 2015, Cyclone Pam hit the island nation of Vanuatu, leaving all but the capital city Port Vila without power or a means of communication with the rest of the world. Tanna Island was hit especially hard. Efforts began immediately to re-establish internet and voice communications. Today, much of the archipelago has communications again, except Tanna Island, where they will need VSAT networks until the end of June 2016. Communication services are ensured by emergency.lu to that date, in close collaboration with the Emergency Telecommunications Cluster led by the World Food Programme. The flexibility of the emergency.lu platform was demonstrated further when a rapid-deployment kit was re-directed directly from Vanuatu to Nepal in April 2015, when a 7.8-magnitude earthquake devastated the country. Here, the emergency.lu platform again provided satellite connectivity to humanitarian responders in the disaster-affected region between Kathmandu and Pokhara. As of December 2015, emergency.lu has been deployed at multiple locations in the Philippines, the Republic of South Sudan, Mali and Nepal, in close coordination with WFP.
Disaster situations clearly demonstrate the importance of satellite-based disaster recovery platforms, such as emergency.lu. The free internet connectivity and VoIP services it provides ensure numerous organisations are able to co-ordinate their efforts to deploy humanitarian aid quickly and efficiently, while those most in need can access vital information to communicate with loved ones and restore their livelihoods. We are pleased that governments and organisations all over the world are showing huge interest in this solution, and we look forward to expanding the partnerships with the emergency.lu platform.

37SES Annual Report 2015
CORPORATE GOVERNANCE
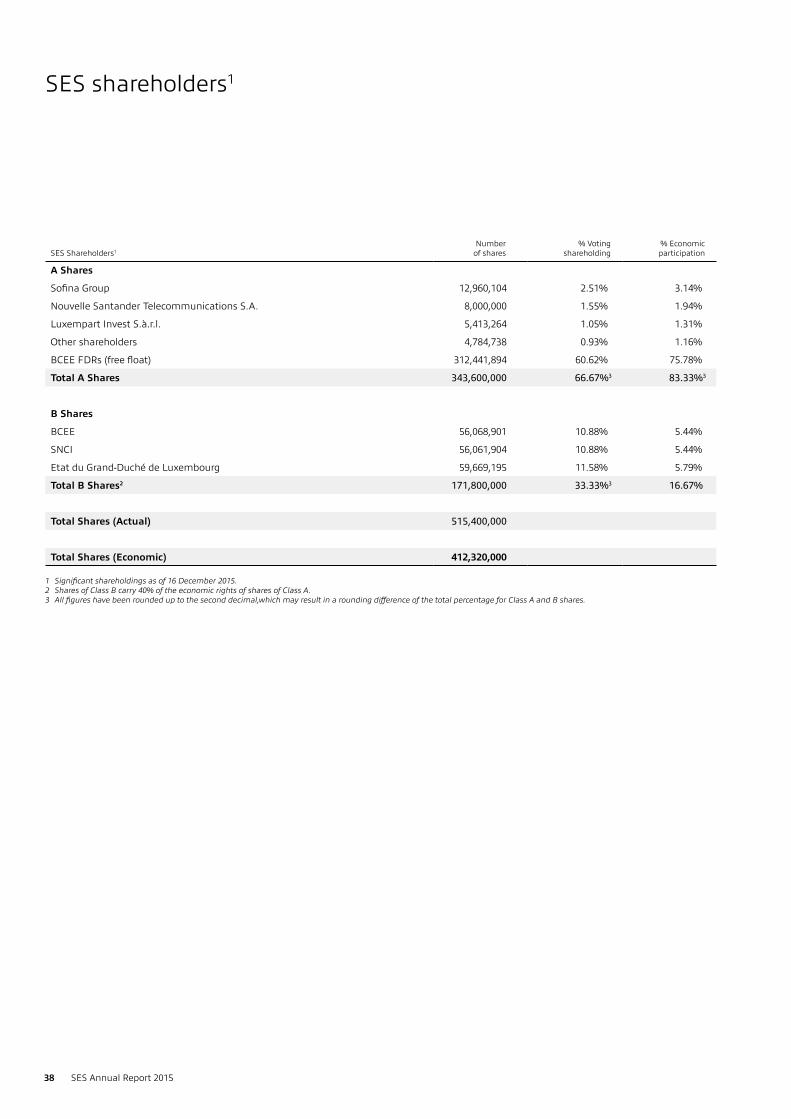
SES Shareholders1Number
of shares% Voting
shareholding% Economic participation
A Shares
Sofina Group 12,960,104 2.51% 3.14%
Nouvelle Santander Telecommunications S.A. 8,000,000 1.55% 1.94%
Luxempart Invest S.à.r.l. 5,413,264 1.05% 1.31%
Other shareholders 4,784,738 0.93% 1.16%
BCEE FDRs (free float) 312,441,894 60.62% 75.78%
Total A Shares 343,600,000 66.67%3 83.33%3
B Shares
BCEE 56,068,901 10.88% 5.44%
SNCI 56,061,904 10.88% 5.44%
Etat du Grand-Duché de Luxembourg 59,669,195 11.58% 5.79%
Total B Shares2 171,800,000 33.33%3 16.67%
Total Shares (Actual) 515,400,000
Total Shares (Economic) 412,320,000
1 Significant shareholdings as of 16 December 2015.2 Shares of Class B carry 40% of the economic rights of shares of Class A.3 All figures have been rounded up to the second decimal,which may result in a rounding difference of the total percentage for Class A and B shares.
38 SES Annual Report 2015
SES shareholders1

INTRODUCTION GLOBALISATION VERTICALISATION SOCIETYINNOVATION CORPORATE GOVERNANCE
FINANCIAL REVIEW
FINANCIAL STATEMENTS
SES ANNUAL ACCOUNTS
39SES Annual Report 2015
INTRODUCTION
SES has been listed on the Luxembourg Stock Exchange since 1998 and on Euronext Paris since 2004. The company follows the ‘Ten Principles of Corporate Governance’ adopted by the Luxembourg Stock Exchange (its home market), as revised in 2013, a copy of which can be found at www.bourse.lu/corporate-governance. SES also complies with the governance rules applied by companies listed in Paris, where the majority of the trading in SES FDRs takes place. In the instance of conflicting compliance requirements, for example the publication of the individual remuneration of the members of its Executive Committee and its Board members, SES follows the rules of its home market by reporting the aggregate amount of the direct and indirect remuneration of the members of the Executive Committee, with the fixed and the variable components of the benefits being separately identified.
SES meets all the recommendations made by the ‘Ten Principles’ except with regard to Recommendation 3.9, which states that the committees created by the Board should only have advisory powers. The SES Board has delegated some decision-making powers to the Remuneration Committee. For the full details of these powers, see the charter of the Remuneration Committee on the SES website (www.ses.com). After each meeting of the Remuneration Committee, its Chairman reports to the Board about the latest Remuneration Committee discussions.
The company is continuously increasing the flow of information to its shareholders via the corporate governance section of its website, and communicates with its shareholders through the dedicated e-mail address: [email protected]. In line with Luxem-bourg law, the company allows shareholders to receive all corporate documentation, including the documents for shareholder meetings, in electronic format.
In this context, the SES website contains a regularly updated stream of information, such as the latest version of the company’s main governance documents, be it the articles of incorporation, the corporate governance charter (including the charters of the various committees set up by the Board) and the separate sections on the composition and the mission of the Board, the Board’s committees and the Executive Committee. This section also contains the SES Code of Conduct and Ethics, the SES Dealing Code, the financial calendar and any other information that may be of interest to the company’s shareholders.
ORGANISATION PRINCIPLES
Created on 16 March 2001 under the name of SES GLOBAL, SES is incorporated in Luxembourg. On 9 November 2001, SES became the parent company of SES ASTRA, originally created in 1985. A copy of SES’s articles of incorporation, in its latest version, is available in the corporate governance section of the company’s website.
THE ANNUAL GENERAL MEETING OF SHAREHOLDERS
Under Luxembourg company law, the company’s Annual and/or Extraordinary General Meetings represent the entire body of shareholders of the company. They have the widest powers, and resolutions passed by such meetings are binding upon all shareholders, whether absent, abstaining from voting or voting against the resolutions.
The meetings are presided by the Chairman of the Board or, in his absence, by one of the Vice Chairmen of the Board or, in their absence, by any other person appointed by the meeting. Any shareholder who is recorded in the company’s shareholder register 14 business days before the meeting is authorised to attend and to vote at the meeting. A shareholder may act at any meeting by appointing a proxy (who does not need to be a shareholder).
The company has issued two classes of shares: Class A and Class B shares.
The state of Luxembourg holds a direct 11.58% voting interest in the Company and two indirect interests, both of 10.88%, through two state owned banks, Banque et Caisse d’Epargne de l’Etat and Société Nationale de Crédit et d’Investissement. These shares constitute the Company’s Class B shares.
Although they constitute separate classes of shares, Class A and Class B shares have the same rights except that the shares of Class B entitle their holders to only 40% of the dividend, or in case the company is dissolved, to 40% of the net liquidation proceeds paid to shareholders of Class A. Class B shares are not freely traded. Each share, whether of Class A or Class B, is entitled to one vote. In accordance with the company’s articles of incorporation, no shareholder of Class A may hold, directly or indirectly, more than 20%, 33% or 50% of the company’s shares unless it has obtained prior approval from a meeting of the shareholders. Such limit is calculated by taking into account the shares of all classes held by a shareholder of Class A.
A shareholder or a potential shareholder who plans to acquire by whatever means, directly or indirectly, more than 20%, 33% or 50% of the shares of the company must inform the Chairman of the Board of such intention. The Chairman will then inform the government of Luxembourg of the planned acquisition, which may only be opposed by the government within three months of receiving such information, should it determine that such an acquisition is against the general public interest.
In case of no opposition from the government of Luxembourg, the Board shall convene an extraordinary meeting of shareholders, which may decide at a majority as provided for in article 67-1 of the law of 10 August 1915, as amended, regarding commercial companies, to authorise the shareholder or potential shareholder to acquire more than 20%, 33% or 50% of the shares.
In accordance with article 8 of the Luxembourg law of January 11, 2008 any shareholder or FDR holder acquiring or disposing of shares or FDRs respectively, is required to inform the company and the Commission de Surveillance du Secteur Financier within four business days of the proportion of voting rights held as a result of such acquisition or disposal where that proportion reaches, exceeds or falls below the thresholds of 5%, 10%, 15%, 20%, 25%, 33 1/3% 50% or 66 2/3%.
The annual general meeting is held on the first Thursday in April. Each registered shareholder will receive written notice of the annual general meeting, including the time of the meeting and the agenda, at least 30 days prior to the meeting. Holders of the company’s FDRs will be represented at the meeting by Banque et Caisse d’Epargne de l’Etat acting as fiduciary. Each FDR will represent one Class A share. If a holder of FDRs wishes to attend the annual general meeting of shareholders in person, that shareholder needs to convert at least one FDR into an A share. In order to facilitate the attendance of the meeting by FDR holders, the company will pay the applicable charge for a conversion of up to 10,000 FDRs for a short period prior to the annual general meeting.
Notice of the meeting and of the proposed agenda will also be published in the international press. The fiduciary will circulate the draft resolutions to both international clearing systems, Clearstream and Euroclear, allowing FDR holders to give their voting instructions to the fiduciary in time for the meeting. At the same time, the draft resolutions will be made available on the company’s website. Unless the fiduciary has received specific instructions from the FDR holder, the fiduciary will vote in favour of the proposals submitted by the Board. One or more shareholders owning together at least 5% of the shares of SES have the right to add items on the agenda of the AGM and may deposit draft resolutions regarding items listed in the agenda or proposed to be added to the agenda. This request will need to be made in writing (via mail or e-mail) and received no later than the twenty-second day preceding the AGM and will need to include a justification or draft resolution to be adopted at the AGM. The written request must include a contact address to which the Company can confirm receipt within 48 hours from the receipt of the request.
No later than fifteen days preceding the AGM, the Company will then publish a revised agenda.
The meeting may deliberate validly only if at least half of the Class A shares and at least half of the Class B shares are represented. In the event that the required quorum is not reached, the meeting will be reconvened in accordance with the form prescribed by the articles of incorporation. It may then validly deliberate without consideration of the number of represented shares.
The proceedings are held in French, but an English translation is provided by the company. A French version of the AGM minutes and the results of the
Chairman’s report on corporate governance and internal control procedures
40 SES Annual Report 2015
shareholders’ votes will be published on the SES website within 15 days after the annual general meeting.
With the exception of the procedure described above, whenever a shareholder intends to hold more than 20%, 33% or 50%, all the resolutions of the meeting are adopted by a simple majority vote except if otherwise provided for by Luxembourg company law. The annual general meeting held on 2 April 2015 was attended by 99.621% of the company’s shareholders. As the 787,600 FDRs held by the company did not participate in the vote, the participation in the vote was reduced to 99.465% of the company’s shares.
During the 2015 annual general meeting, the shareholders approved the 2014 financial results and the allocation of the 2014 profits, granted discharge to the external auditor and the directors, re-elected PwC as the company’s external auditor for another year, granted an authorisation to SES to buy back its own shares, and ratified the co-optation of two directors. The shareholders also approved the directors’ fees, which remained unchanged in comparison to 2014. Shareholders agreed that directors participating in more than one committee meeting on the same day will receive the remuneration for one meeting only. Finally, shareholders elected six Directors for a term of three years with a minimum majority of 96.827% of the votes expressed.
All of the Board’s other proposals were carried by a majority of at least 98.612% of the votes expressed. In accordance with article 67-1 of the Luxembourg company law, abstentions are not considered when determining whether a resolution has been passed or not. The detailed results of the shareholders’ votes are available in the corporate governance section of the company’s website.
THE BOARD OF DIRECTORS AND ITS COMMITTEES
MISSIONThe Board of Directors is responsible for defining the company’s strategic objectives as well as its overall corporate plan. The Board approves, upon proposal from the Executive Committee, the annual consolidated accounts of the company and the appropriation of results, the group’s medium-term business plan, the consolidated annual budget of the company and the management report to be submitted to the meeting of shareholders. It also approves major investments and is responsible vis-à-vis shareholders and third parties for the management of the company, which it delegates to the Executive Committee.
COMPOSITIONThe Board of SES is composed of 18 non-executive directors, four of them female. In accordance with the company’s articles of association, two-thirds of the Board members represent holders of Class A shares and one-third of the Board members represent holders of Class B shares. The mandates of the current directors will expire at the annual general
meeting of shareholders in April 2016, 2017 and 2018, respectively. On 1 January 2015, Mr Romain Bausch, President and CEO until 3 April 2014 has assumed the position of Chairman of the Board of Directors. Mr Romain Bausch is currently assisted by two Vice Chairmen, Messrs François Tesch and Jean-Paul Zens, each one elected on the basis of proposals submitted by directors representing shareholders of Class A and of Class B shares, respectively.
In the event of a vacancy on the Board, the remaining directors may, upon a proposal from the Nomination Committee and on a temporary basis, fill such a vacancy by a majority vote. In this case, the next annual general meeting of shareholders will definitively elect the new director, who will complete the term of the director whose seat became vacant.
In accordance with internal regulations, at least one-third of the Board members must be independent directors. A Board member is considered independent if he or she has no relationship of any kind with the company or management that may impact his or her judgment.
Independence for these purposes is defined as:
(i) not having been a director for more than 12 years(ii) not having been an employee or officer of the
company over the previous five years(iii) not having had a material business relationship
with the company in the previous three years and(iv) not representing a significant shareholder
owning directly or indirectly more than 5% of the company’s shares.
Nine of the current Board members are considered independent:
Mses Bridget Cosgrave, Tsega Gebreyes and Katrin Wehr-Seiter and Messrs Marc Beuls, Marcus Bicknell, Jacques Espinasse, Conny Kullman, Ramu Potarazu and Marc Speeckaert.
Of the nine directors who are not considered independent, six represent a significant shareholder owning more than 5% of the company’s shares, two have been a director for more than 12 years and one has had a recent employment relationship with the company.
Mr Pierre Margue, Vice President Legal and Corporate Affairs, acts as secretary of the Board of Directors.
RULES OF FUNCTIONINGThe Board of Directors meets when required by the company’s business, and at least once per quarter. It can only validly deliberate if a majority of the directors are present or represented. The resolutions of the Board are passed by a simple majority of votes of the voting directors present or represented, not considering abstentions. Any material contract that is proposed to be signed by the company or any of its wholly controlled operating subsidiaries with a shareholder owning, directly or indirectly, at least 5% of the shares of the company is subject to
a prior authorisation by the Board. In 2015, there were no transactions between the company and a shareholder owning directly or indirectly at least 5% of the company’s shares.
ACTIVITIES OF THE BOARD OF DIRECTORS IN 2015The Board of Directors held seven meetings in 2015, with an average attendance rate of more than 94%. Each director participated in at least five of the seven Board meetings. After endorsement by the Audit and Risk Committee, the Board approved the 2014 audited accounts, including the proposed dividend, as well as the results for the first half of 2015. During the year, the Board approved the updated strategic plan as well as a business plan for the period 2015-2020, which served as the basis for the 2016 budget approved by the Board in December. As part of the continued education of the Board, external legal counsel provided training on certain governance matters, with a focus on the market abuse directive and its implications for the company’s directors under Luxembourg law. As a consequence thereof, the company has adapted its way of communicating with its directors.
During the year 2015, the Board approved various matters including changes to the terms of reference for Board members and an increase in SES’s participation in O3b on a fully diluted basis. Four Board members (François Tesch, Marc Speeckaert, Tsega Gebreyes and Katrin Wehr-Seiter) did not participate in the O3b discussion and in the vote on this topic, because they each represent a party that holds an investment in O3b.
During 2015, the Board also decided to launch a new share buyback programme, which was implemented on Euronext Paris through the filing of a ‘notice d’information’ on 3 April 2015. The 2015 programme was limited to the following two objectives:
(i) to meet the company’s obligations under its executive share ownership and stock option plans; and
(ii) to operate under the framework of a liquidity contract signed with Rothschild.
Under this programme, the company is authorised to buy back up to 10 million Class A shares and 5 million Class B shares at prices between EUR 20 and 45 per Class A share and EUR 8 and 18 per Class B share. As of 31 December 2015, the company had purchased 3,716,782 A-shares in the form of FDRs, at an average price of EUR 32.36864 EUR per FDR.
Finally, the Board noted updates on the procurement of several satellites as well as to the company’s risk management report. The Executive Committee regularly informed the Board about the group’s activities and financial situation, as well as about O3b. It noted updates on: (i) company’s tax framework; (ii) commercial go-to-market perspective; (iii) WRC-15; (iv) asset management framework; (v) corporate social responsibility; and (vi) several HR matters.

INTRODUCTION GLOBALISATION VERTICALISATION SOCIETYINNOVATION CORPORATE GOVERNANCE
FINANCIAL REVIEW
FINANCIAL STATEMENTS
SES ANNUAL ACCOUNTS
• Chairman’s report on corporate governance and internal control procedures
41SES Annual Report 2015
During 2015, the Chairman of the Board and the Board Secretary organized the regular Board evaluation exercise. At each meeting, directors receive a report on on-going matters and the Chairmen of the three committees set up by the Board present a report on the latest developments discussed in these respective committees. In addition, a business report is distributed to the members of the Board on a monthly basis, as well as a monthly Investor Relations report.
On 31 December 2015 the 18 members of the Board of Directors were:
MR ROMAIN BAUSCHBorn on 3 July 1953, Mr Bausch was President and CEO of SES from May 1995 to April 2014, following a career in the Luxembourg civil service (Ministry of Finance). Before joining SES as its chief executive, Mr Bausch occupied key positions in the banking, media and telecommunications sectors and spent a five-year term as a Director and Vice Chairman of SES. Mr Bausch was appointed to the Board of SES in April 2013 and he is Vice Chairman of the Board of Directors of O3b Networks and a Director of SES ASTRA. Mr Bausch is Chairman of the Board of Directors of SES. He is also a member of the Boards of Directors of Aperam, BIP Investment Partners, Compagnie Financière La Luxembourgeoise and the Luxembourg Future Fund, as well as the Chairman of the CNFP (Conseil National des Finances Publiques) of Luxembourg. He graduated with a degree in economics (specialisation in business administration) from the University of Nancy. He holds an honorary doctorate from the Sacred Heart University in Luxembourg. He is a member of the SES Remuneration Committee and of its Nomination Committee.
Mr Bausch is a Luxembourg national. He is not an independent Director, because of his recent employment relationship with SES.
MR FRANÇOIS TESCHBorn on 16 January 1951. Mr Tesch became a Director on 15 April 1999. He is Chief Executive Officer of Luxempart S.A. He graduated with a degree in economics from the Faculté d’Aix en Provence and holds an M.B.A. from INSEAD (Institut Européen d’Administration des Affaires). Mr Tesch is also Chairman of the Board of Foyer S.A. of Luxempart S.A. and of Financière de Tubize S.A., and Vice Chairman of the Board of SES and a member of the Nomination Committee of SES.
Mr Tesch is a Luxembourg national. He is not an independent Director, because he has been a director for more than 12 years.
MR JEAN-PAUL ZENSBorn on 8 January 1953. Mr Zens became a director on 7 May 2002, and was elected Vice Chairman on the same date. Mr Zens is also a member of the Board of Directors of SES ASTRA and Entreprise des Postes et Télécommunications, Luxembourg. He is currently Director of the Media and Communications
department of the Ministry of State in Luxembourg. He holds a law degree and a degree in psychology and communications sciences from the University of Strasbourg. Mr Zens is the Chairman of the SES Nomination Committee and a member of its Remuneration Committee.
Mr Zens is a Luxembourg national. He is not an independent director, because he represents an important shareholder.
MR SERGE ALLEGREZZABorn on 25 October 1959. Mr Allegrezza became a director on 11 February 2010. He is currently the Director General of Statec, the Luxembourg Institute for Statistics and Economic Studies, a post he has held since April 2003. He was Conseiller de Gouvernement 1ère classe at the Ministry of Economics, responsible for internal market policy, and is the Chairman of the Observatory for Competitiveness. He is also the Chairman of the Board of Directors of Entreprise des Postes et Télécommunications and of the Board of LuxTrust i.n.c and a member of the Conseil Economique et Social. Mr Allegrezza, was a part-time lecturer at the IAE/University of Nancy 2, and has a Master in economics and a PhD in applied economics. Mr Allegrezza is a member of the Nomination Committee of SES.
Mr Allegrezza is a Luxembourg national. He is not an independent director, because he represents an important shareholder.
MR MARC BEULSBorn on 15 September 1956, Mr Beuls became a director on 7 April 2011. He serves as a Member of the Board of Directors at Maris Ltd, a Mauritian holding company investing in frontier markets in Africa and Qaelum NV, Belgium, which provides software solutions for quality control of medical imaging. He is the Chairman of American Prepaid Value VAS LLC, USA, which develops value added services for the wireless prepaid market. He is the former President and CEO of Millicom International Cellular S.A., a position he held from 1998 to 2009. Prior to joining Millicom in 1992 as Senior Vice President in charge of finance and treasury, Mr Beuls worked for Generale Bank in Belgium, specialising in project and trade financing in emerging markets. Mr Beuls graduated from the Limburg Business School, currently UHasselt, holding a degree in economics with a major in finance. Mr Beuls is a member of the Audit and Risk Committee of SES.
Mr Beuls is a Belgian national. He is an independent director.
MR MARCUS BICKNELLBorn on 28 February 1948. Mr Bicknell became a director on 6 May 2005. Mr Bicknell is a director of New Media Foundry Ltd. and of Langstaff-Ellis Ltd., both non-listed companies in the United Kingdom, is a member of the Development Board of the Royal Academy of Dramatic Art and is a director of Inspire Young People. From 1986 to 1990 he was Commercial Director of Société Européenne des Satellites. Mr
Bicknell holds an M.A. Honours Degree in physical anthropology from Cambridge University. Mr Bicknell is a member of the Remuneration Committee and of the Nomination Committee of SES.
Mr Bicknell is a British national. He is an independent director.
MR MARC COLASBorn on 13 May 1955, Mr Colas became a director on 21 February 2013. He was the general secretary of the Council of Ministers of the Luxembourg government from 2004 to 2013, and he retired in 2015 as Administrateur Général in the Presidency of the Government, in the Prime Minister’s Office. Prior to that, he held several positions in the Luxembourg civil service, in the Ministry of Finance, in the Ministry for the Civil Service and Administrative Reform, in the Ministry of Home Affairs, and since 2000 in the Presidency of the government, in the Prime Minister’s Office. From 2001-2006, Mr Colas was a member of the Audit Committee of the European Investment Bank. He was also a member of the Board of Œuvre Nationale de Secours Grande-Duchesse Charlotte until October 2015. He is presently working as an independent consultant. He was appointed to the Conseil d’État in December 2015. Mr Colas graduated with a master degree in law from the University of Strasbourg and holds a double Master of Business Administration (Finance and Marketing) from the Richard T. Farmer School of Business at the University of Oxford (Ohio). Mr Colas is a member of the Audit and Risk Committee of SES.
Mr Colas is a Luxembourg national. He is not an independent director because he represents an important shareholder.
MS BRIDGET COSGRAVEBorn on 1 July 1961. Ms Cosgrave became a director on 3 April 2008. She is President and Founder of EVERY EUROPEAN DIGITAL, a company deploying Internet of Things infrastructure, focused on Poland, CEE and the Baltics. She is advisor and investor in UKKO VERKOT OY in Finland, and Board member at EUSKALTEL in Spain. Ms Cosgrave was with Belgacom S.A. from 2001-2007 as a member of the Executive Committee, where she was Executive Vice President of the Enterprise division, Chairman, President and founding CEO of BICS S.A., and Board Member of Belgacom Mobile (Proximus) and Telindus Group. She previously served as Director General of DIGITALEUROPE and Deputy Director General of ETSI. Ms Cosgrave holds an M.B.A. from London Business School and a B.A. (Hons.) in Economics & History from Queen’s University in Canada. Ms Cosgrave is a member of the Audit and Risk Committee of SES.
Ms Cosgrave is a dual Irish and Canadian national. She is an independent director.
42 SES Annual Report 2015
MR HADELIN DE LIEDEKERKE BEAUFORTBorn on 29 April 1955. Mr de Liedekerke Beaufort became a director on 17 April 2000. He is currently a director of Santander Telecommunications, a privately held company, as well as a director of other private companies with interests in various fields such as financial, communication and real estate developments. Mr de Liedekerke Beaufort graduated from the Ecole Hôtelière de Lausanne. Mr de Liedekerke Beaufort is a member of the Remuneration Committee of SES.
Mr de Liedekerke Beaufort is a French national. He is not an independent director, because he has been a director for more than 12 years.
MR JACQUES ESPINASSEBorn on 12 May 1943. Mr Espinasse became a director on 6 May 2005. In May 2007, after five years of duty, he retired as a member of the Management Board and Chief Financial Officer of Vivendi. Mr Espinasse is the former Chief Operations Officer of TPS. He is a member of the Supervisory Boards of Axa Belgium and Hammerson Plc, and Chairman of the Fondation JED Belgique. He holds a B.B.A. and an M.B.A. from the University of Michigan. Mr Espinasse is a member of the Audit and Risk Committee of SES.
Mr Espinasse is a Belgian and French national. He is an independent director.
MR JEAN-CLAUDE FINCKBorn on 22 January 1956. Mr Finck became a director on 31 May 2001. Mr Finck is Chief Executive Officer of Banque et Caisse d’Epargne de l’Etat, and a member of the Boards of Directors of Bourse de Luxembourg S.A., Luxair S.A., Cargolux S.A., La Luxembourgeoise S.A., La Luxembourgeoise Vie S.A., Paul Wurth S.A., and La Banque Postale Asset Management. Mr Finck graduated with a degree in economics from the University of Aix/Marseille. Mr Finck is a member of the Remuneration Committee and of the Audit and Risk Committee of SES.
Mr Finck is a Luxembourg national. He is not an independent director, because he represents an important shareholder.
MS TSEGA GEBREYESBorn on 14 December 1969. Ms Tsega Gebreyes became a director on 4 April 2013. She is the Founding Director of Satya Capital Limited. She served as Chief Business Development and Strategy Officer of Celtel International BV and Senior Advisor to Zain. She was also Founding Partner of the New Africa Opportunity Fund, LLP and has worked with McKinsey and Citicorp. Ms Gebreyes is a director of Ison Growth, Satya Capital Limited and Sonae. She is a Senior Advisor to TPG Growth. She has a double major in Economics and International Studies from Rhodes College and holds an M.B.A. from Harvard Business School.
Ms Gebreyes is an Ethiopian national. She is an independent director.
MR CONNY KULLMANBorn on 5 July 1950. Mr Kullman became a director on 5 April 2012. He was a Director General, CEO and Chairman of Intelsat. After working until 1983 as a Systems Engineer for Saab-Ericsson Space AB in Sweden, he joined Intelsat in Washington DC, where he held several positions before becoming the company’s Director General and CEO in 1998. Mr Kullman became the CEO of Intelsat, Ltd. in 2001, and in 2005 Chairman of Intelsat, Ltd., and CEO and President of Intelsat (Bermuda), Ltd., positions from which he retired in 2006. Mr Kullman graduated with a Master of Science in Electronic Engineering from the Chalmers University of Technology in Gothenburg in 1974. Mr Kullman is the Chairman of the Remuneration Committee and a member of the Nomination Committee of SES.
Mr Kullman is a Swedish national. He is an independent director.
MR RAMU POTARAZUBorn on 10 August 1961. Mr Potarazu became a director on 20 February 2014. He is the CEO of Binary Fountain. He is the Founder and former CEO of Vubiquity. Prior to founding Vubiquity, Mr Potarazu spent 15 years in various positions at Intelsat (1991-2006). He became Intelsat’s Vice President of Operations and CIO in 1996 and its Vice President, Commercial Restructuring in 2000. In 2001 Mr Potarazu became President of Intelsat Global Service Corporation and from 2002 to 2006 he was President and Chief Operating Officer of Intelsat Ltd. Prior to joining Intelsat, Mr Potarazu held several engineering positions. Mr Potarazu graduated with a BS in Computer Science and in Mathematics from Oklahoma Christian University. He also holds an MSc in Electrical Engineering from the John Hopkins University and was a member of the Stanford Executive Program.
Mr Potarazu is a U.S. national. He is an independent director.
MS ANNE-CATHERINE RIESBorn on 1 April 1973. Ms Ries became a director on 1 January 2015. Ms Ries is Senior Policy Advisor to the Prime Minister and Minister for Media and Communications in Luxembourg with a focus on telecom and digital development strategies. She has recently been appointed coordinator of the newly launched government initiative ‘Digital Lëtzebuerg’. Ms Ries graduated with a law degree from the Université de Paris II and the University of Oxford. She holds a postgraduate LL.M. degree with honours from the London School of Economics, where she specialised in Telecommunications, Information Technology and European Competition Law. After starting her professional career in a law firm in Paris, she joined the Permanent Representation of Luxembourg to the EU in Brussels in 2000. Upon her return to Luxembourg and over the last decade, her focus has been on attracting technology companies to establish and develop in Luxembourg. She is a Director of Entreprise des Postes et Télécommunications Luxembourg.
Ms Ries is a Luxembourg and French national. She is not an independent director, because she represents an important shareholder.
MR VICTOR RODBorn on 26 April 1950. Mr Rod became a director on 23 November 1995. He retired as President of Commissariat aux Assurances on 31 December 2014. He is the Chairman of the Board of Directors of Banque et Caisse d’Epargne de l’Etat, Luxembourg. Mr Rod graduated with a degree in law from the University of Nancy.
Mr Rod is a Luxembourg national. He is not an independent director, because he represents an important shareholder.
MR MARC SPEECKAERTBorn on 23 May 1951. Mr Speeckaert became a director on 6 May 2005. He is the Managing Director of Sofina S.A. and a director of several non-listed corporations, as well as of Rapala (which is listed on the Helsinki Stock Exchange), and of Mersen (which is listed on Euronext Paris). Mr Speeckaert graduated with a degree in applied economics and holds a Master in Business and Administration from the Université Catholique de Louvain (UCL) in Belgium. He also participated in an Advanced Management Program from Wharton, University of Pennsylvania (USA). Mr Speeckaert is the Chairman of the Audit and Risk Committee of SES.
Mr Speeckaert is a Belgian national. He is an independent director.
MS KATRIN WEHR-SEITERBorn on 27 January 1970. Ms Wehr-Seiter became a director on 1 January 2015. She is a Managing Director of BIP Investment Partners SA. Prior to joining BIP, she served as a Principal at global investment firm Permira and also worked as an independent strategy consultant as well as a Senior Advisor to international private equity group Bridgepoint. She started her professional career at Siemens AG where she held various positions in strategy consulting and engineering. She serves as a Director of several non-listed corporations as well as Nanogate AG (listed on the Frankfurt stock exchange). Ms Wehr-Seiter holds an MBA from INSEAD and an MSc in Mechanical Engineering from the Technical University of Chemnitz.
Ms Wehr-Seiter is a German national. She is an independent director.

INTRODUCTION GLOBALISATION VERTICALISATION SOCIETYINNOVATION CORPORATE GOVERNANCE
FINANCIAL REVIEW
FINANCIAL STATEMENTS
SES ANNUAL ACCOUNTS
• Chairman’s report on corporate governance and internal control procedures
43SES Annual Report 2015
THE BOARD OF DIRECTORS AS OF 25 FEBRUARY 2016
From left to right:Mr Victor Rod, Mr Jean-Claude Finck, Ms Katrin Wehr-Seiter, Mr Romain Bausch, Ms Anne-Catherine Ries, Mr Jacques Espinasse, Mr Marc Beuls, Mr Ramu Potarazu, Ms Bridget Cosgrave, Mr Marc Speeckaert and Mr Marc Colas, Mr Marcus BicknellSeated: Ms Tsega Gebreyes, Mr Jean-Paul Zens, Mr François Tesch, Mr Conny Kullman, Mr Hadelin de Liedekerke Beaufort
Mr Serge Allegrezza was not present the day of the photo shooting
44 SES Annual Report 2015
COMMITTEES OF THE BOARD OF DIRECTORS
THE CHAIRMAN’S OFFICEThe Chairman and the two Vice Chairmen are members of the Chairman’s Office. The Chairman’s Office prepares the agenda for the Board meetings, allowing the Vice Chairmen to coordinate the preparation of the Board meetings with the directors of their respective share classes.
At 31 December 2015 the members were:
← Mr Romain Bausch ← Mr François Tesch ← Mr Jean-Paul Zens
The Chairman’s Office met six times during 2015, with a members’ attendance rate of 100%.
THE REMUNERATION COMMITTEEIn accordance with general corporate governance standards, the company’s Board established a Remuneration Committee, which determines the remuneration of the members of the Executive Committee, and which advises on the overall remuneration policies applied throughout the company. It reports to the Board at each meeting through its Chairman. The Remuneration Committee is comprised of six members, at least a third of which are independent Board members in line with the SES internal regulations. At 31 December 2015, the Remuneration Committee was composed of the following six non-executive directors:
← Mr Conny Kullman (Chairman of the Remuneration Committee, independent)
← Mr Romain Bausch ← Mr Marcus Bicknell (independent)
← Mr Hadelin de Liedekerke Beaufort ← Mr Jean-Claude Finck ← Mr Jean-Paul Zens
The Remuneration Committee held three meetings, with an attendance rate of better than 94%. Matters addressed related to the determination of the 2015 stock option grant and the 2014 bonuses for members of the Executive Committee. The Remuneration Committee further determined the number of performance shares allocated to the members of the Executive Committee for their performance in 2014, and it adopted the 2015 business objectives which are used as one element in the determination of their bonuses for 2015. After each meeting, the Board is briefed in writing about the work of the Remuneration Committee.
The Remuneration Committee also oversees the implementation of the decision under which the members of the Executive Committee must within five years hold the equivalent of an annual salary’s worth of registered shares in the company (with the President and CEO of SES having to hold shares two years’ worth of his annual salary).
THE AUDIT AND RISK COMMITTEEAs part of its overall corporate governance, the Board established an Audit and Risk Committee, which assists the Board in carrying out its oversight responsibilities in relation to corporate policies, risk management, internal control, internal and external audit and financial and regulatory reporting practices. The Committee has an oversight function and provides a link between the internal and external auditors and the Board. The Audit and Risk Committee is comprised of six members, four of whom are independent Board members, in line with the SES internal regulations.
The current members of the Audit and Risk Committee are:
← Mr Marc Speeckaert, Chairman of the Audit and Risk Committee (independent)
← Mr Marc Beuls (independent) ← Mr Marc Colas ← Ms Bridget Cosgrave (independent) ← Mr Jacques Espinasse (independent) ← Mr Jean-Claude Finck
The Audit and Risk Committee held four meetings, with a members’attendance rate of better than 91%.
The meetings were dedicated in particular to the review of the 2014 financial results before their submission to the Board and their subsequent approval by the shareholders at the statutory annual general meeting, and to the review of the results of the first half of 2015. Members of the Board also had the opportunity to communicate any comments they had on the company’s quarterly results through the Chairman of the Audit and Risk Committee prior to the publication of these results.
The Audit and Risk Committee reviewed the company’s statement on internal control systems prior to its inclusion in the annual report, approved the Internal Audit plan, and received bi-annual updates on the Internal Audit activities and on the follow-up of the major recommendations. It also reviewed the 2014 PwC Management letter.
The Audit and Risk Committee further continued to encourage management in its efforts to eliminate as many non-operating legal entities as possible. The Audit and Risk Committee proposed to the Board and to the shareholders to appoint PwC as external auditor for 2015.
The Audit and Risk Committee received bi-annual updates on risk management from the SES risk management committee and held a discussion on IT and cyber-security. The Committee received updates on (i) business continuity; (ii) risk management of the company’s space systems and related insurance; (iii) potential impact of IFRS-15 on SES; and (iv) SES Satellite Leasing and the business undertaken by the group in the Isle of Man. It also discussed the framework for limited non-audit engagements to be performed by PwC. After each meeting, the Board is briefed in writing about the work of the Audit and Risk Committee.
THE NOMINATION COMMITTEEIn line with best practice in corporate governance, the Board established a Nomination Committee, whose role is to identify and nominate suitable candidates for the Board of Directors, for election by the annual general meeting of shareholders. Such proposals are based on submissions from shareholders for a number of candidates at least equal to the number of posts to be filled for each class of shareholders. The Nomination Committee also proposes candidates for Executive Committee membership for election by the Board. The Nomination Committee is
OUR GOVERNANCE STRUCTURE
THE CHAIRMAN’S OFFICE The Chairman’s Office prepares the agenda for the Board meetings.
THE REMUNERATION COMMITTEE The Remuneration Committee determines the remuneration of the members of the Executive Committee, and advises on the overall remuneration policies applied throughout the company. It acts as administrator of the company’s Long Term Equity Plans.
THE AUDIT AND RISK COMMITTEE The Audit and Risk Committee assists the Board in carrying out its oversight responsibilities in relation to corporate policies, risk management, internal control, internal and external audit and financial and regulatory reporting practices.
THE NOMINATION COMMITTEE The Nomination Committee identifies and nominates suitable candidates for the Board of Directors, for election by the annual general meeting of shareholders. It also identifies and nominates suitable candidates for the Executive Committee.
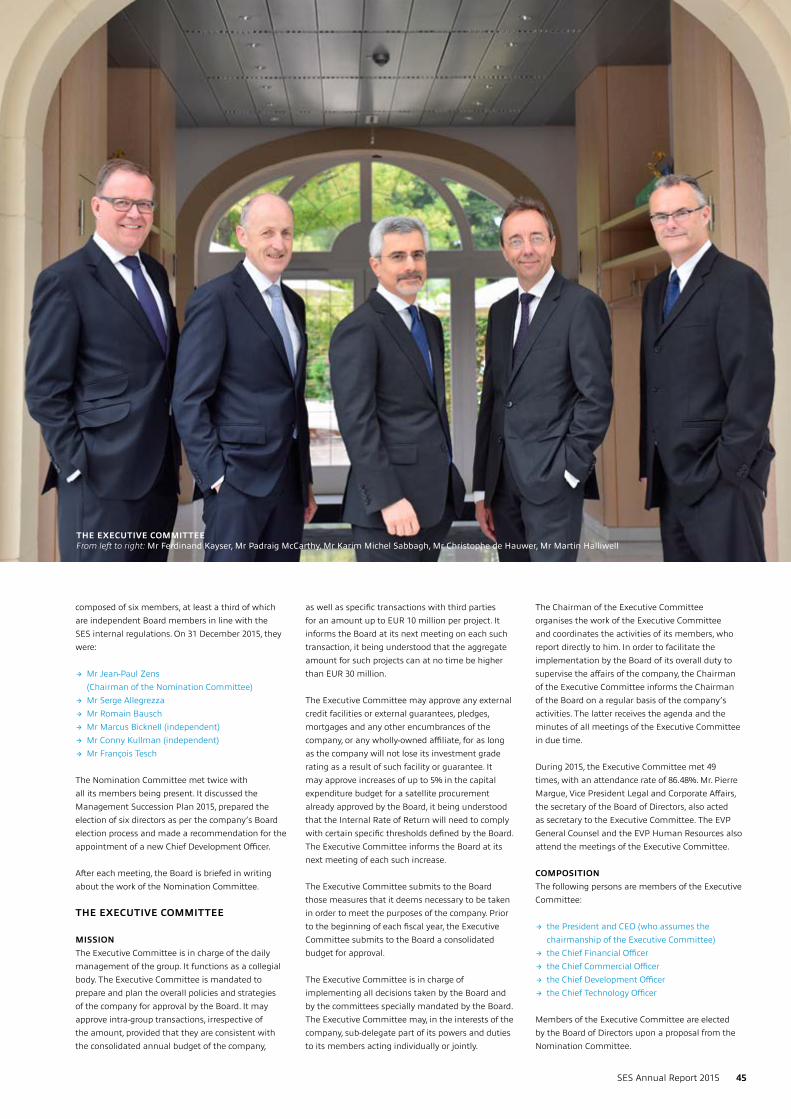
INTRODUCTION GLOBALISATION VERTICALISATION SOCIETYINNOVATION CORPORATE GOVERNANCE
FINANCIAL REVIEW
FINANCIAL STATEMENTS
SES ANNUAL ACCOUNTS
• Chairman’s report on corporate governance and internal control procedures
45SES Annual Report 2015
composed of six members, at least a third of which are independent Board members in line with the SES internal regulations. On 31 December 2015, they were:
← Mr Jean-Paul Zens (Chairman of the Nomination Committee)
← Mr Serge Allegrezza ← Mr Romain Bausch ← Mr Marcus Bicknell (independent) ← Mr Conny Kullman (independent) ← Mr François Tesch
The Nomination Committee met twice with all its members being present. It discussed the Management Succession Plan 2015, prepared the election of six directors as per the company’s Board election process and made a recommendation for the appointment of a new Chief Development Officer.
After each meeting, the Board is briefed in writing about the work of the Nomination Committee.
THE EXECUTIVE COMMITTEE
MISSIONThe Executive Committee is in charge of the daily management of the group. It functions as a collegial body. The Executive Committee is mandated to prepare and plan the overall policies and strategies of the company for approval by the Board. It may approve intra-group transactions, irrespective of the amount, provided that they are consistent with the consolidated annual budget of the company,
as well as specific transactions with third parties for an amount up to EUR 10 million per project. It informs the Board at its next meeting on each such transaction, it being understood that the aggregate amount for such projects can at no time be higher than EUR 30 million.
The Executive Committee may approve any external credit facilities or external guarantees, pledges, mortgages and any other encumbrances of the company, or any wholly-owned affiliate, for as long as the company will not lose its investment grade rating as a result of such facility or guarantee. It may approve increases of up to 5% in the capital expenditure budget for a satellite procurement already approved by the Board, it being understood that the Internal Rate of Return will need to comply with certain specific thresholds defined by the Board. The Executive Committee informs the Board at its next meeting of each such increase.
The Executive Committee submits to the Board those measures that it deems necessary to be taken in order to meet the purposes of the company. Prior to the beginning of each fiscal year, the Executive Committee submits to the Board a consolidated budget for approval.
The Executive Committee is in charge of implementing all decisions taken by the Board and by the committees specially mandated by the Board. The Executive Committee may, in the interests of the company, sub-delegate part of its powers and duties to its members acting individually or jointly.
The Chairman of the Executive Committee organises the work of the Executive Committee and coordinates the activities of its members, who report directly to him. In order to facilitate the implementation by the Board of its overall duty to supervise the affairs of the company, the Chairman of the Executive Committee informs the Chairman of the Board on a regular basis of the company’s activities. The latter receives the agenda and the minutes of all meetings of the Executive Committee in due time.
During 2015, the Executive Committee met 49 times, with an attendance rate of 86.48%. Mr. Pierre Margue, Vice President Legal and Corporate Affairs, the secretary of the Board of Directors, also acted as secretary to the Executive Committee. The EVP General Counsel and the EVP Human Resources also attend the meetings of the Executive Committee.
COMPOSITIONThe following persons are members of the Executive Committee:
← the President and CEO (who assumes the chairmanship of the Executive Committee)
← the Chief Financial Officer ← the Chief Commercial Officer ← the Chief Development Officer ← the Chief Technology Officer
Members of the Executive Committee are elected by the Board of Directors upon a proposal from the Nomination Committee.
THE EXECUTIVE COMMITTEE From left to right: Mr Ferdinand Kayser, Mr Padraig McCarthy, Mr Karim Michel Sabbagh, Mr Christophe de Hauwer, Mr Martin Halliwell
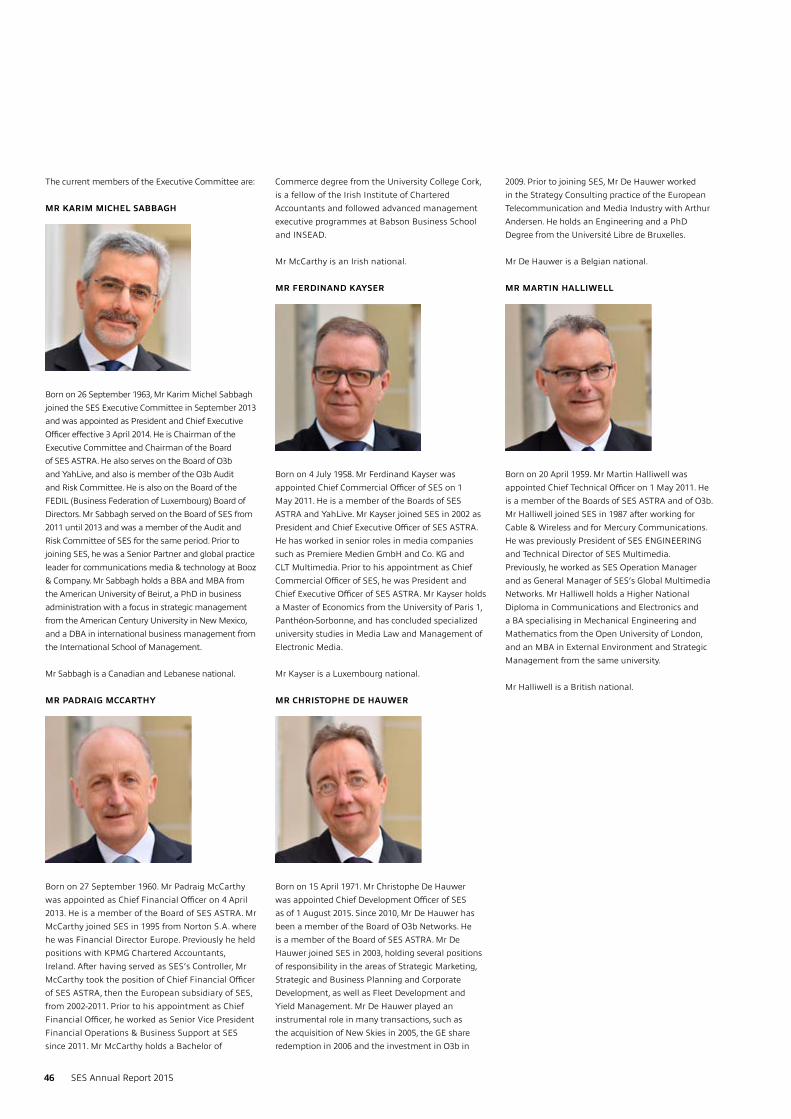
46 SES Annual Report 2015
The current members of the Executive Committee are:
MR KARIM MICHEL SABBAGH
Born on 26 September 1963, Mr Karim Michel Sabbagh joined the SES Executive Committee in September 2013 and was appointed as President and Chief Executive Officer effective 3 April 2014. He is Chairman of the Executive Committee and Chairman of the Board of SES ASTRA. He also serves on the Board of O3b and YahLive, and also is member of the O3b Audit and Risk Committee. He is also on the Board of the FEDIL (Business Federation of Luxembourg) Board of Directors. Mr Sabbagh served on the Board of SES from 2011 until 2013 and was a member of the Audit and Risk Committee of SES for the same period. Prior to joining SES, he was a Senior Partner and global practice leader for communications media & technology at Booz & Company. Mr Sabbagh holds a BBA and MBA from the American University of Beirut, a PhD in business administration with a focus in strategic management from the American Century University in New Mexico, and a DBA in international business management from the International School of Management.
Mr Sabbagh is a Canadian and Lebanese national.
MR PADRAIG MCCARTHY
Born on 27 September 1960. Mr Padraig McCarthy was appointed as Chief Financial Officer on 4 April 2013. He is a member of the Board of SES ASTRA. Mr McCarthy joined SES in 1995 from Norton S.A. where he was Financial Director Europe. Previously he held positions with KPMG Chartered Accountants, Ireland. After having served as SES’s Controller, Mr McCarthy took the position of Chief Financial Officer of SES ASTRA, then the European subsidiary of SES, from 2002-2011. Prior to his appointment as Chief Financial Officer, he worked as Senior Vice President Financial Operations & Business Support at SES since 2011. Mr McCarthy holds a Bachelor of
Commerce degree from the University College Cork, is a fellow of the Irish Institute of Chartered Accountants and followed advanced management executive programmes at Babson Business School and INSEAD.
Mr McCarthy is an Irish national.
MR FERDINAND KAYSER
Born on 4 July 1958. Mr Ferdinand Kayser was appointed Chief Commercial Officer of SES on 1 May 2011. He is a member of the Boards of SES ASTRA and YahLive. Mr Kayser joined SES in 2002 as President and Chief Executive Officer of SES ASTRA. He has worked in senior roles in media companies such as Premiere Medien GmbH and Co. KG and CLT Multimedia. Prior to his appointment as Chief Commercial Officer of SES, he was President and Chief Executive Officer of SES ASTRA. Mr Kayser holds a Master of Economics from the University of Paris 1, Panthéon-Sorbonne, and has concluded specialized university studies in Media Law and Management of Electronic Media.
Mr Kayser is a Luxembourg national.
MR CHRISTOPHE DE HAUWER
Born on 15 April 1971. Mr Christophe De Hauwer was appointed Chief Development Officer of SES as of 1 August 2015. Since 2010, Mr De Hauwer has been a member of the Board of O3b Networks. He is a member of the Board of SES ASTRA. Mr De Hauwer joined SES in 2003, holding several positions of responsibility in the areas of Strategic Marketing, Strategic and Business Planning and Corporate Development, as well as Fleet Development and Yield Management. Mr De Hauwer played an instrumental role in many transactions, such as the acquisition of New Skies in 2005, the GE share redemption in 2006 and the investment in O3b in
2009. Prior to joining SES, Mr De Hauwer worked in the Strategy Consulting practice of the European Telecommunication and Media Industry with Arthur Andersen. He holds an Engineering and a PhD Degree from the Université Libre de Bruxelles.
Mr De Hauwer is a Belgian national.
MR MARTIN HALLIWELL
Born on 20 April 1959. Mr Martin Halliwell was appointed Chief Technical Officer on 1 May 2011. He is a member of the Boards of SES ASTRA and of O3b. Mr Halliwell joined SES in 1987 after working for Cable & Wireless and for Mercury Communications. He was previously President of SES ENGINEERING and Technical Director of SES Multimedia. Previously, he worked as SES Operation Manager and as General Manager of SES’s Global Multimedia Networks. Mr Halliwell holds a Higher National Diploma in Communications and Electronics and a BA specialising in Mechanical Engineering and Mathematics from the Open University of London, and an MBA in External Environment and Strategic Management from the same university.
Mr Halliwell is a British national.
INTRODUCTION GLOBALISATION VERTICALISATION SOCIETYINNOVATION CORPORATE GOVERNANCE
FINANCIAL REVIEW
FINANCIAL STATEMENTS
SES ANNUAL ACCOUNTS
• Chairman’s report on corporate governance and internal control procedures
47SES Annual Report 2015
REMUNERATION
REMUNERATION OF THE MEMBERS OF THE BOARD OF DIRECTORSThe annual general meeting of shareholders determines the remuneration of the members of the Board of Directors for attending Board and committee meetings. In 2015, the shareholders decided to maintain the fees paid to the directors at the previous year’s level with a majority of 99.550%. Directors receive a fixed fee of EUR 40,000 per year, whereas the Vice Chairmen receive an annual fixed fee of EUR 48,000 and the Chairman receives EUR 100,000 per year.
A Director, chairing one of the committees set up by the Board, if not the Chairman of the Board of Directors, receives an additional remuneration of EUR 8,000 per year. A Director, chairing the Audit and Risk Committee, if not the Chairman of the Board of Directors, receives an additional remuneration of EUR 9,600 per year.
The shareholders also maintained the fees at EUR 1,600 for each meeting of the Board or a Committee of the Board attended, except for the meetings of the Audit and Risk Committee for which directors receive EUR 1,920 per meeting. A director participating in more than one Committee meeting on the same day will receive the attendance fee for one meeting only. Half of the attendance fee is paid if the director participates in the meeting via telephone or videoconference.
All these fees are net of any Luxembourgish withholding taxes. The total net remuneration fees paid for the year 2015 to the members of the Board of Directors (net of the Luxembourgish withholding tax) amounted to EUR 1,038,667, of which EUR 243,200 was paid as variable fees, with the remaining EUR 795,467 representing the fixed part of the Board fees. The gross overall figure for the year 2015 was EUR 1,298,333
COMPANY STOCK OWNED BY MEMBERS OF THE BOARD OF DIRECTORSOn 31 December 2015, the members of the Board of Directors and their closely associated family members owned a combined total of 823,127 shares and FDRs (representing 0.16% of the company’s share capital).
Transactions made by members of the Board of Directors are published on the company’s website under Management Disclosures. In accordance with the company’s dealing code, directors require prior permission before dealing in SES shares or FDRs.
REMUNERATION OF THE MEMBERS OF THE EXECUTIVE COMMITTEEThe remuneration of the members of the Executive Committee is determined by the Remuneration Committee. It is composed of a fixed part and a variable part. The total gross remuneration paid to the six members of the Executive Committee for the year 2015 (including Mr Gerson Souto until
31 July 2015) amounted to EUR 9,078,741.89, of which EUR 3,358,112.95 represented the fixed part and EUR 5,720,628.94 the variable part. The direct remuneration paid to the members of the Executive Committee amounted to EUR 4,671,377.47, whereas the indirect remuneration was EUR 4,407,364.42. The indirect remuneration also contains the benefits derived by the members of the Executive Committee from the company’s executive stock option plan and the long-term incentive plan, as adopted by the Board of Directors.
During 2015, the members of the Executive Committee were awarded a combined total of 308,463 options to acquire company FDRs at an exercise price of EUR 33.23, the price being based on the average of the closing price on Euronext Paris of the first 15 trading days following the Remuneration Committee meeting at which the options were authorised. A quarter of those options vested on 1 January 2016, and the remaining quarters vest on 1 January 2017, 1 January 2018, and 1 January 2019 respectively. In 2015, members of the Executive Committee were granted 12,463 restricted shares as part of the company’s long-term incentive plan, as well as 37,389 performance shares. These shares will vest on 1 June 2018.
During 2015, Messrs Martin Halliwell, Ferdinand Kayser, Padraig McCarthy and Gerson Souto (a member of the Executive Committee until 31 July 2015) sold some or all of the restricted shares which vested on 1 June. Mr Karim Michel Sabbagh exercised some of his stock options during the course of the year. SES publishes the details of all transactions made by its Board members and by the members of its Executive Committee on its website: http://www.ses.com/management-disclosures.
Each member of the Executive Committee is entitled to two years of base salary in case his contract is terminated without cause. If a member resigns, he is not entitled to any such compensation.
COMPANY STOCK OWNED BY MEMBERS OF THE EXECUTIVE COMMITTEE
On 31 December 2015, the five members of the Executive Committee owned a combined total of 114,782 shares and FDRs (representing 0.02% of the company’s share capital), 198,136 unvested restricted and performance shares and 918,628 options. Transactions made by members of the Executive Committee are published on the company’s website under Management Disclosures. Members of the Executive Committee are required to comply with the company’s dealing code.
EXTERNAL AUDITOR
In accordance with the Luxembourg law on commercial companies, the company’s annual and consolidated accounts are certified by an external auditor appointed by the annual general meeting of shareholders. On 2 April 2015, and based upon a proposal from the Board, the shareholders re-elected
PwC as the company’s external auditor for one year and approved its remuneration, with a majority of more than 99.521%. The mandate of PwC will expire at the annual general meeting on 7 April 2016.
BUSINESS RISKS AND THEIR MITIGATION
This section contains a summary of the main risks that SES may face during the normal course of its business. However:
• this section does not purport to contain an exhaustive list of the risks faced by SES and SES may be significantly affected by risks that it has not identified or considered not to be material;
• some risks faced by SES, whether they are mentioned in this section or not, may arise from external factors beyond SES’s control; and
• where mitigations are mentioned in this section, there is no guarantee that such mitigations will be effective (in whole or in part) to remove or reduce the effect of the risk.
OUR KEY RISKS:
1. Risks relating to procurement2. Risks relating to satellites3. Risks relating to insurance4. Risks relating to customers5. Risks relating to the satellite communications
market6. Risks relating to SES’s strategic development7. Risks related to Regulatory and Corporate8. Risks relating to finance
1. RISKS RELATING TO PROCUREMENTRisk of launch delays and/or launch failuresSES is planning to launch [seven] satellites between 2016 and 2017. The launch of any of these satellites carries a risk of delay for a variety of reasons, including the late availability of the satellite or co-passenger satellite (if there is a co-passenger) for shipment to the launch site, the late availability of the launch service, or last-minute technical problems arising on the satellite, the co-passenger satellite or the launcher.
A launch delay or failure could have a material negative effect on revenue and also potentially cause the loss of frequency rights at certain orbital positions. Satellite launch and in-orbit insurance policies do not compensate for lost revenues due to the loss of customers or for consequential losses resulting from any launch delay or failure.
SES attempts to mitigate the risk of a launch delay interrupting existing services by leaving adequate time margins in procurement schedules for replacement satellites.
There is always an inherent risk of launch failure resulting in a reduced satellite lifetime (in case of
48 SES Annual Report 2015
incorrect orbit injection), reduced functionality of the satellite or the total loss of a mission.
SES attempts to mitigate the risk of launch failure in several ways, including by detailed technical risk management of each satellite and launch vehicle programme, asset insurance for each launch, and a staggered fleet deployment scheme (allowing assets to be repurposed in the case of single satellite failure so as to ensure a minimum impact on customers and revenues).
Risk of dependency on launch service providersSES is largely dependent on Arianespace and SpaceX to launch its satellites into space. SES may incur significant delays in launching new satellites in the event of a prolonged unavailability of one of those two systems. Dependency on a small number of launch service providers may reduce SES’s negotiating power.
Risk of dependency on satellite manufacturers and secondary suppliersSES is dependent on six major satellite manufacturers for the construction of its satellites.
Dependency on a small number of satellite manufacturers may reduce SES’s negotiating power and access to advanced technologies (which may only be available to certain suppliers). It may also result in a higher concentration of risk – SES may incur significant delays in procuring new satellites in the event of prolonged problems at one of these satellite manufacturers. Further, the difficulties caused by any technical problems with the design of a particular model of satellite may be multiplied if several satellites of that design are purchased.
In addition, there are a limited number of second tier suppliers of certain key components for communication satellites. SES may incur significant delays in procuring new satellites in the event of prolonged problems at one of these secondary suppliers.
SES attempts to mitigate these risks relating to procurement by a constant monitoring of its supplier base, maintaining multiple procurement sources and developing relationships with new suppliers where possible.
2. RISKS RELATING TO SATELLITESRisk of in-orbit failureOne or more of SES’s satellites may suffer in-orbit failures where the impact, if any, can range from a partial impairment of its commercial capabilities to a total loss of the asset. In the event of such a failure, SES may not be able to continue to provide service to its customers from the same orbital slot or at all.
SES attempts to mitigate the risk of in-orbit failure by careful vendor selection and high quality in-orbit operations. SES’s fleet is diversified by manufacturer and satellite type, reducing the likelihood of widespread technical problems. The impacts of such failures on customer service and related revenues may be mitigated by an in-orbit backup strategy,
pursuant to which customers on an impaired satellite may possibly be transferred to another satellite in the fleet. In addition, SES has in place a restoration agreement with another satellite operator pursuant to which customers on an impaired satellite may possibly be transferred to another satellite in that operator’s fleet in order to protect continuity of service. However, there is no guarantee that these mitigations will be entirely effective, especially in the event of the failure of several satellites.
For example, several of SES’s satellites are operating beyond the end of their design lives and have experienced various technical anomalies. These satellites have already completed the primary missions for which they were designed and have been redeployed for secondary missions. Satellites in secondary missions are used for various reasons, such as developing new orbital locations, safeguarding spectrum rights and providing redundant capacity for satellites in their primary missions. These satellites’ technical capabilities do not generally need to be fully utilised in operating their secondary missions, which potentially mitigates the effects of further technical failures.
In addition, eleven of SES’s Lockheed Martin A2100 satellites have experienced technical problems with their solar array circuits. The extent of the problem varies depending on the satellite, but it may reduce both the operational life of the satellite and the number of usable transponders, leading to a reduction in the revenue generated by the satellite. NSS-6, AMC-8, AMC-10, AMC-15 and AMC-16 experienced further solar array degradation in 2015, which impaired power generation. In the cases of AMC-10 and AMC-16, this degradation led to a reduction in commercial capacity. Such failures on any of the affected satellites can also impair SES’s ability to maintain pricing levels and to place new customers on the satellite. All of the satellites with solar array issues, other than AMC-4 and NSS-7, are still being used for their primary missions.
NSS 12, a satellite built by Space Systems Loral, has also experienced solar array power losses. However, these appear to be less severe than the Lockheed Martin A2100 solar array issue and SES does not believe a specific mitigation plan is needed at this point.
Several of SES’s satellites (AMC-4, ASTRA 1G, ASTRA 1H, ASTRA 1KR, ASTRA 1M, ASTRA 2B, NSS 7, SES-3 and QuetzSat-1) have experienced various other anomalies.
Technical failures have resulted in a reduction of available capacity on ASTRA 1G and a reduction in the operational life of ASTRA 1H. SES considers that there is no risk of a recurrence of these issues on these satellites.
ASTRA 1M, a key asset at the 19.2°E prime orbital position, has currently lost redundancy on its propulsion subsystem. Further technical problems on this sub-system could result in the loss of the
satellite. However, SES believes that such an event is unlikely and the risk is mitigated by the additional capacity at this orbital position.
QuetzSat-1 has experienced a loss of redundancy in its data handling equipment and further technical problems with this equipment could result in the loss of the satellite. However, SES believes that this is unlikely and the risk has also been mitigated by the uploading of a software patch which allows partial restoration of the on-board redundancy.
In-orbit insurance constitutes an additional financial mitigation against the risk of impairment, subject to the limitations of such insurance.
Risk of short operational lifeThe design life of SES’s satellites is typically 15 years. In the event of changes in the expected fuel life of the satellite, in-orbit anomalies or other technical factors, its actual life may be shorter than this. This could lead to the satellite being depreciated faster than anticipated and the lifetime revenue generated by the satellite being reduced, diminishing the overall return on investment for the asset. SES attempts to mitigate the risk of a reduced operational life by careful vendor selection and high quality in-orbit operations.
3. RISKS RELATING TO INSURANCEInsurance coverage riskSES’s satellites may be subject to damage or loss from events that might not be covered by insurance policies. SES maintains launch and initial in-orbit insurance, in-orbit insurance and third-party liability insurance for its satellites. The insurance policies generally contain exclusions for losses resulting from:
• military or similar action;• any anti-satellite device;• electromagnetic and radio interference (except for
physical damage to a satellite directly resulting from this interference);
• confiscation by any governmental body;• insurrection and similar acts or governmental
action to prevent such acts;• nuclear reaction or radiation contamination;• wilful or intentional acts causing the loss or failure
of satellites; and• terrorism
The insurance policies do not provide compensation for business interruption, loss of market share, reputational damage, loss of revenue, incidental and consequential damages and similar losses that might arise from the failure of a satellite launch, incorrect orbital placement or the failure of a satellite to perform according to specifications. In addition, SES’s in-orbit insurance only covers losses in excess of the risk retention level selected by SES.
The in-orbit insurance policies may exclude from coverage failures arising from pre-existing defects, such as defects in solar array and battery anomalies on some existing satellites. In addition, SES will not be fully reimbursed if the cost of a replacement satellite

INTRODUCTION GLOBALISATION VERTICALISATION SOCIETYINNOVATION CORPORATE GOVERNANCE
FINANCIAL REVIEW
FINANCIAL STATEMENTS
SES ANNUAL ACCOUNTS
• Chairman’s report on corporate governance and internal control procedures
49SES Annual Report 2015
exceeds the sum insured. As a consequence, the loss, damage or destruction of any satellites as a result of any of these events could result in material increases in costs or reductions in expected revenues or both.
SES has reviewed its approach to in-orbit insurance of its satellites and, in recognition of the excellent procurement and operating record, has adopted a policy of limited self-insurance. Premiums are paid to a wholly-owned subsidiary, thus reducing the amount of insurance premiums paid to external insurance companies.
If any event occurs that is covered by the in-orbit insurance, the payment of the sum insured could result in material increases in costs.
SES has third party liability insurance that covers damage suffered by third parties resulting from accidents such as launch failures and satellite collisions. It is subject to an annual combined single limit of EUR 500 million of coverage.
Insurance availability riskSatellite insurance is a cyclical market subject to the laws of supply and demand. The amount of capacity currently available in the market is adequate to cover SES’s satellite programmes. However, events outside of SES’s control – including large losses and shifts of insurance capacity from space to other lines of business – could change this situation. This could result in increases in the amount of insurance premiums paid by SES to cover its risks and affect its ability to obtain the desired level of coverage. SES’s self-insurance programme improves its flexibility to accommodate variations in market conditions.
4. RISKS RELATING TO CUSTOMERSRisk of key customer lossSES depends on a number of key customers whose loss (or non-renewal) would reduce SES’s revenues. SES’s five largest commercial customers represented 27.9% of SES’s total revenues in 2015. The total revenue generated from contracts with the U.S. Government (and customers serving the U.S. Government) represented approximately 10% of SES’s total revenues in 2015.
If key customers reduce their reliance on SES by developing or increasing relationships with other satellite operators (or moving to other telecommunications solutions) and such key customers cannot be replaced, SES’s revenues may be impacted negatively.
SES’s main existing satellite capacity agreements for the direct-to-home business in Europe typically have contract durations of ten years, with some contracts for longer periods. If SES is unsuccessful in obtaining the renewal of its satellite capacity agreements when they come up for renewal on commercial terms similar to those currently reflected in its agreements, revenues could be adversely affected for some time.
SES’s customer base is subject to constant change. Bankruptcy of key customers or customer
consolidation resulting from mergers and acquisitions can reduce demand for SES’s satellites capacity, thereby affecting SES’s revenues.
Risks relating to customer creditSES may suffer a financial loss if any of its customers fails to fulfil its contractual payment obligations.
The level of customer credit risk may increase as SES grows revenues in emerging markets, because credit risk tends to be higher in these markets (compared to the markets of Europe and North America).
This risk is mitigated principally through a customer credit policy that includes credit checks, credit profiles, deposits or other forms of security, monitoring of payment performance, and the application of a provisioning policy.
Further details are provided in Note [19] to the consolidated financial statements.
Risks inherent in international businessSES conducts business around the world. It is exposed to issues such as financial, regulatory, geopolitical, tax and trade risks in many jurisdictions. Political and financial stability in some jurisdictions may impact SES’s business in that country. In practice, it may be difficult for SES to enforce its legal rights in some jurisdictions.
The inherent uncertainties in doing business in certain jurisdictions may have a negative impact on SES’s results.
Risks inherent in doing business with the U.S. governmentThe proxy structure of the SES Government Solutions entity, in line with common practice for businesses serving certain segments of the U.S. Government, imposes various restrictions on SES’s Board of Directors and executive management in directly supervising the maintenance of an internal control system and imposing an internal audit structure. However, these restrictions are mitigated through having an agreement on a required risk management and internal control framework.
5. RISKS RELATING TO THE SATELLITE COMMUNICATIONS MARKETCompetition riskThe telecommunications market is fiercely competitive and SES faces competition from satellite, terrestrial and wireless networks.
SES faces competition from international, national and regional satellite operators. Some national operators receive tax and regulatory advantages in their countries that are not available to SES. The development of national satellite programmes may hinder SES’s ability to compete in those countries on normal economic terms.
In addition, SES competes with operators of terrestrial and wireless networks. Any increase in the technical effectiveness or geographic spread of
these terrestrial and wireless networks could result in a reduction in demand for SES’s satellites. Some terrestrial and wireless operators may receive state aid and subsidies not available to SES.
Competition in the telecommunications market could result in a demand reduction for SES’s satellite capacity and have a significant negative impact on SES’s revenues.
Technology riskThe satellite telecommunications industry is vulnerable to technological change. SES’s satellites could become obsolete due to unforeseen advances in telecommunications technology, leading to a reduction in demand for its services and a negative impact on revenues.
The use of new technology to improve signal compression rate could lead to a reduction in demand for SES’s satellites, which could lead to a negative impact on the results.
6. RISKS RELATING TO SES’S STRATEGIC DEVELOPMENTEmerging market riskSES’s development strategy includes targeting new geographical areas and emerging markets and developing joint ventures or partnerships with local telecommunications, media and financial businesses in order to improve market access for its services.
SES may be exposed to the inherent instability of doing business in those regions. Such inherent instability could have an adverse impact on SES’s revenue.
Please also see ‘Risks inherent in international business’ above.
In some emerging markets, customers may be less financially secure and run a higher risk of insolvency than in more developed markets. The failure of a customer could have an adverse impact on SES’s revenue.
Investment riskSES regularly evaluates opportunities to make strategic investments. These opportunities may not yield the expected benefits due to a number of factors, such as antitrust reviews, financing costs and regulatory approvals. If an investment is made, it may adversely affect SES’s results due to financing costs or the performance of the investment following acquisition. The success of any such investment is not guaranteed.
SES has a number of strategic investments in businesses that it does not fully control. As a result, SES is dependent in part on the co-operation of other investors and partners in protecting and realising the full potential of certain investments. SES may not be able to prevent strategic partners from taking actions that are contrary to SES’s business interests.
SES also invests in new and innovative projects such as O3b Networks, which often feature new
50 SES Annual Report 2015
technology or uncertain market demand. If the technology is not successful or demand does not materialise as planned, the value of SES’s investment may be reduced.
In relation to O3b, there can be no assurance that the business will not require further funding. If SES were to increase its investment in O3b to over 50%, it would have to include O3b’s indebtedness in SES’s financial statements. It may also have to purchase the shares of the minority investors at a fair market value.
SES has also earmarked certain funds for investment, which includes the replacement of existing satellites (often with increased capacity) and the launching of new satellites. The successful marketing and sale of new capacity is dependent on the underlying demand for satellite capacity in the targeted regional markets. If that demand does not materialise as anticipated, SES’s financial forecasts may not be met.
7. RISKS RELATED TO REGULATORY AND CORPORATELegal riskSES cannot always predict the impact of laws and regulations on its operations. The operation of the business is and will continue to be subject to the laws and regulations of the governmental authorities of the countries where SES operates or uses radio spectrum and offers satellite services or capacity, as well as to the frequency coordination process of the International Telecommunication Union (ITU). Regulation and legislation is extensive and outside SES’s direct control. New or modified rules, regulations, legislation or decisions by a relevant governmental entity or the ITU could materially and adversely affect operations.
The international nature of SES’s business means that it is subject to civil or criminal liability under the U.S., UK, EU and other regulations in relation to economic sanctions, export controls and anti-bribery requirements. International risks and violations of international regulations may negatively affect future operations or subject SES to criminal or civil enforcement actions.
Disputes in relation to SES’s business arise from time to time and can result in legal or arbitration proceedings. The outcome of these proceedings cannot be predicted. A negative outcome in a substantial litigation or arbitration case could have a material impact on SES’s business and financial position.
Spectrum access riskSES needs access to orbital slots and associated frequencies to permit it to maintain and develop its satellite system.
The ITU establishes radio regulations and is responsible for the allocation of frequency spectrum for particular uses and the allocation of orbital locations and associated frequency spectrum. SES can only access spectrum through ITU filings made by national administrations.
Orbital slots and associated frequencies are a limited resource. The ITU may reallocate spectrum from satellite to terrestrial uses. In addition, national administrations are increasingly charging for access to spectrum by the use of fees and auctions. The most recent World Radiocommunication Conference 2015 did not reallocate significant amounts of spectrum away from satellite, but it has set for study the use of bands that could be allocated to terrestrial mobile use inconsistent with satellite use at the next such conference in 2019. Certain national administrations are studying the alleged spectrum needs of terrestrial mobile and considering reallocation of satellite spectrum, which they can do independently of ITU radio regulations so long as they avoid international interference.
Any reallocation of spectrum from satellite to terrestrial uses or fees and charges by national administrations may have a significant adverse effect on SES’s current results and future prospects.
Spectrum coordination riskSES is required to coordinate the operation of its satellites with other satellite operators through the ITU so as to prevent or reduce interference between satellites. SES may also be required to coordinate any replacement satellite that has performance characteristics that differ from those of the satellite it replaces.
As a result of such coordination, SES may be required to modify the proposed coverage areas of its satellites, satellite design or transmission plans in order to eliminate or minimise interference with other satellites or ground-based facilities. Those modifications may mean that use of a particular orbital position is significantly restricted, possibly to the extent that it may not be economical to place a new satellite in that location. In addition, interference concerns of a country may affect the ability of SES’s satellite network to generate revenues, due to the operational restrictions that the country may impose.
Similarly, the performance of SES’s satellites in the affected areas could be adversely affected if ITU regulations or other legal constraints fail to prevent competing satellite operators from causing harmful interference by the operation of their satellites.
Spectrum bringing into use riskIf SES does not occupy unused orbital locations by specified deadlines, does not maintain satellites in the orbital locations it currently uses, or does not operate in all the frequency bands for which a licence has been received, then those orbital locations or frequency bands may become available for other satellite operators to use.
SES has access to a large portfolio of orbital locations that have been filed at the ITU through various administrations. For each filing, the ITU and the national regulators impose various conditions that have to be met in order to secure the spectrum. Operational issues such as satellite launch failure, launch delay or in-orbit failure might compromise the access to the spectrum at specific orbital locations.
SES is committed to the highest quality in satellite procurement and launch, which helps to reduce this risk. In addition, SES’s large fleet permits the relocation of in-orbit satellites in order to meet the regulatory conditions in many situations.
Regulatory riskSES may need to obtain and maintain approvals from authorities or other entities to offer or operate satellite capacity. For example, SES must obtain authorisations or landing rights in certain countries for satellites to be able to transmit signals to or receive signals from those countries. The failure to obtain landing rights or the authorisations necessary to operate satellites internationally to provide services could lead to loss of revenues.
Customers are responsible for obtaining regulatory approval for their operations. As a result, there may be governmental regulations of which SES is not aware or which may adversely affect the operations of customers. SES could lose revenues if customers’ current regulatory approvals do not remain sufficient in the view of the relevant regulatory authorities, or if additional necessary approvals are not granted on a timely basis, or at all, in all jurisdictions in which customers wish to operate or provide services, or if applicable restrictions in those jurisdictions become unduly burdensome.
Export controlU.S. companies and companies located in the United States must comply with U.S. export control laws in connection with any information, products or materials that they provide to foreign companies relating to communications satellites, associated equipment and data. SES’s U.S. operations may not be able to maintain normal international business activities and SES’s non-U.S. operations may not be able to source satellites, satellite related hardware, technology and services in the United States if:
• export licences are not obtained in a timely fashion;• export licences do not permit transfer of all items
requested;• launches are not permitted in the locations that SES
prefers; or• the requisite licence, when approved, contains
conditions or restrictions that pose significant commercial or technical problems.
Such occurrences could impede construction and delay the launch of any future satellites, adversely impacting current and/or future revenues.
External threat riskIn common with other satellite operators, SES is vulnerable to the risk of terrorist acts, sabotage, piracy, attack by anti-satellite devices, jamming, unintentional interference and natural disaster. Such external threats may lead to a temporary or permanent interruption in service and/or the loss of customers. Any such act could have a potentially significant adverse effect on SES’s results.

INTRODUCTION GLOBALISATION VERTICALISATION SOCIETYINNOVATION CORPORATE GOVERNANCE
FINANCIAL REVIEW
FINANCIAL STATEMENTS
SES ANNUAL ACCOUNTS
• Chairman’s report on corporate governance and internal control procedures
51SES Annual Report 2015
Cyber riskSES’s operations may be subject to hacking, malware and other forms of cyber-attack. Due to the fast-moving pace of new hacking techniques, the high sophistication of certain attackers and an increasingly hostile cyber -attack environment, it may be difficult to detect, determine the scope of, contain and remediate every such event.
Any inability to prevent or to detect the occurrence of cyber -attacks in a timely manner could result in a disruption of services or malfunctions, loss of customers, inadvertent violations of data protection, export control and other relevant laws, damage to SES’s reputation, or damage to SES’s properties, equipment and data. Furthermore, such event could result in large expenditures necessary to repair or replace such networks or information systems or to protect them from similar events in the future.
SES has protections in place to help protect its networks, and continues to work to implement additional protective measures intended to limit the risks associated with such attacks.
Risk of loss of key employeesSES has a number of key employees with highly specialised skills and extensive experience in their fields. If one of these employees was to leave, SES may have difficulty replacing him or her. SES attempts to mitigate the risk of losing key employees through retention programmes, succession planning and development plans.
If SES is unable to retain key employees or attract new highly qualified employees, it could have a negative impact on SES’s business, financial situation and results.
Unforeseen high impact riskSES’s operations may be subject to unforeseen events that are both improbable and have a high impact. Due to the unforeseen nature of the event, it is difficult to manage the impact of such events or predict the nature or extent of the damage. Such unforeseen events may have a significant negative impact on SES’s business, financial situation and results.
8. RISKS RELATING TO FINANCECash flow riskSES operates in accordance with a strong business model, but if, for any reason, SES is not successful in implementing its business model, then cash flow and capital resources may not be sufficient to repay indebtedness. If SES was unable to meet debt service obligations or comply with covenants, then a default under debt agreements would occur. To avoid a possible default or upon a default, SES could be forced to reduce or delay the completion or expansion of the satellite fleet, sell assets, obtain additional equity capital, or refinance or restructure its debt.
Debt rating riskA change in SES’s debt rating could affect the cost and terms of its debt, as well as its ability to raise
finance. SES’s policy is to attain, and retain, a stable BBB rating with Standard & Poor’s and Fitch, and a Baa2 rating with Moody’s. If SES’s credit rating was downgraded, it may affect SES’s ability to obtain financing and the terms associated with that financing. SES cannot guarantee that it will be able to maintain its credit ratings.
Tax riskSES’s financial results may be materially adversely affected by unforeseen additional tax assessments or other tax liabilities.
SES does business in many different countries and is therefore subject to taxation in multiple jurisdictions. SES makes provisions in its accounts for current and deferred tax assets and liabilities based on a continuous assessment of prevailing tax laws in those jurisdictions.
However, SES cannot always be certain of a tax authority’s application and interpretation of the tax law. SES may become subject to unforeseen material tax claims, including late payment interest and/or penalties. Such claims may arise for a number of reasons, including: the identification of a taxable presence of a non-indigenous group company in a taxing jurisdiction; transfer pricing adjustments; application of indirect taxes on certain business transactions after the event; and the disallowance of the benefits of a tax treaty. In addition, SES may be subject to retroactive tax assessments based on changes in laws in a particular tax jurisdiction. SES has implemented a tax risks mitigation charter based on (among others things) a framework of tax opinions for the financially material positions taken, transfer pricing policies and documentation covering the group’s important inter-company transactions, and procedures for accurate tax compliance in all jurisdictions.
Asset impairment riskSES’s non-current intangible and tangible assets are valued at historic cost less amortisation, depreciation (where relevant) and accumulated impairment charges. The resulting net book values are subject to validation each year through impairment testing procedures, where they are compared to the value-in-use of the asset, representing the present value of the future cash flows expected to be derived from the asset. Where future assumptions for a specific asset, as set out in the approved Business Plan, become less favourable, or the discount rates applied to the future cash flows increase, then this may result in the need for material asset impairment charges.
In the SES S.A. annual accounts, impairment testing – using value-in- use procedures similar to those outlined above – is performed on the carrying value of the shares in affiliate undertakings. If the carrying value of the relevant investment, or group of investments, is not substantiated by the value-in-use computed, and any shortfall is assessed as being of an other than temporary nature, then this could result in an impairment charge being taken to the income statement of the SES S.A. annual accounts in the period concerned.
Liquidity riskSES requires liquidity to maintain its operations and meet its obligations. Any liquidity problems may have a significant impact on SES’s operations and lead to the breach of contractual obligations. In case of liquidity needs, SES can call on uncommitted loans and a committed syndicated loan. In addition, if deemed appropriate based on prevailing market conditions, SES can access additional funds through its European Medium-Term Note programme or through commercial paper. SES’s debt maturity profile is tailored to allow the company to cover repayment obligations as they fall due. SES operates a centralised treasury function, which manages the liquidity of SES and seeks to optimise the funding costs. This is supported by a daily cash pooling mechanism.
Further details are provided in Note [19] to the consolidated financial statements.
Foreign currency riskSES’s reported financial performance can be impacted by movements in the U.S. dollar/euro exchange rate, as SES has significant operations whose functional currency is the U.S. dollar and liabilities denominated in U.S. dollar.
To mitigate this exposure, SES can enter into forward foreign exchange or similar derivatives contracts to hedge the exposure on financial debt or on the net assets.
Further details are provided in Note [19] to the consolidated financial statements.
Interest rate riskSES’s exposure to the risk of changes in market interest rates relates primarily to SES’s floating rate borrowings. SES carefully monitors and adjusts the mix between fixed and floating rate debt from time to time, responding to market conditions. Interest rate derivatives can be used to manage the interest rate risk. The terms of the derivatives are negotiated to match the terms of the hedged item to maximise the effectiveness of the hedge.
Further details are provided in Note [19] to the consolidated financial statements.
Counterparty riskSES’s exposure relates to the potential default of a counterparty holding financial assets (cash and cash equivalents held for trading financial assets, loans, receivables and derivative instruments), with the maximum exposure being equal to the carrying amount of these instruments.
The counterparty risk from a cash management perspective is reduced by the implementation of several cash pools, accounts and related paying platforms with different counterparties. To mitigate the counterparty risk, SES only deals with recognised financial institutions with an appropriate credit rating – generally ‘A’ and above. All counterparties are financial institutions that are regulated and
52 SES Annual Report 2015
controlled by the national financial supervisory authorities of the applicable countries. The counterparty risk portfolio is analysed on a quarterly basis. Moreover, to reduce this counterparty risk, the portfolio is diversified as regards the main counterparties, ensuring a well-balanced relationship for all categories of products (derivatives as well as deposits).
Further details are provided in Note [19] to the consolidated financial statements.
INTERNAL CONTROL PROCEDURES
OBJECTIVEThe Board has overall responsibility for ensuring that SES maintains a sound system of internal controls, including financial, operational and compliance controls. Such a system is an integral part of the corporate governance strategy of the company.
Internal control procedures help to ensure the proper management of risks and provide reasonable assurance that the business objectives of the company can be achieved.
The internal control procedures are defined and implemented by the company to ensure:
← the compliance of actions and decisions with applicable laws, regulations, standards, internal rules and contracts
← the efficiency and effectiveness of operations and the optimal use of the company’s resources
← the correct implementation of the company’s internal processes, notably those to ensure the safeguarding of assets
← the integrity and reliability of financial and operational information, both for internal and external use
← that management’s instructions and directions are properly applied
← that material risks are properly identified, assessed, mitigated and reported
Like all control systems, internal controls cannot provide an absolute guarantee that risks of misstatement, losses or human error have been totally mitigated or eliminated.
CONTROL ENVIRONMENTSES has adopted a robust internal control framework based on a set of guidelines prepared by COSO (Committee of Sponsoring Organisations of the Treadway Commission). This framework provides reasonable assurance that the internal control objectives are being achieved; it is also consistent with the reference framework proposed by the French securities regulator, the ‘Autorité des Marchés Financiers’ (AMF).
The control environment is an essential element of the company’s internal control framework, as it sets the tone for the organisation. This is the foundation of the other components of internal control, providing discipline and structure.
The Board has delegated the design, implementation and maintenance of a rigorous and effective system of internal controls to the Executive Committee of SES, which in turn works closely with the other levels of management in establishing control policies and procedures.
The descriptions of the main SES functions and processes are electronically documented using Business Process Management software, with the support of the Operational Excellence Team. Policies and procedures are regularly updated as appropriate. The aim is to design and implement a common set of policies and procedures that best support the organisation and can be used company-wide.
The policies and procedures apply to all employees and officers of the SES group, and where appropriate to its directors as the general framework for their own business process design.
The policies and procedures take into account specificities of each legal entity and are adapted where necessary to their activity, size, organisation, and legal and regulatory environment.
A group-wide ‘Code of Conduct and Ethics’ has been in place since 2009. The Code is designed to enable all employees, officers and directors to take a consistent approach to integrity issues and to make sure that SES conducts its business in compliance with all applicable laws and regulations and observes the highest standards of business ethics. In 2015, mandatory refresher courses for all SES employees worldwide were continued to reinforce awareness and compliance by staff.
An SES Compliance Committee, composed of designated Compliance Officers in each main corporate location, is tasked with raising the staff’s awareness of the Code and ensures a consistent roll-out and training programme for the Code. The Committee meets regularly to discuss important topics or issues. Reflecting the company’s expansion into developing markets, the composition of the Compliance Committee includes representatives from SES’s offices in Africa, Asia, the Middle East and Latin America.
To ensure better compliance with the Data Compliance laws and regulations SES has appointed a Group Data Protection Officer.
Another key component of the control environment is the co-ordination of risk management with internal control. Risk management and internal control systems complement each other in controlling the company’s activities.
RISK MANAGEMENTSES has adopted a risk management policy based on principles proposed by COSO and ISO31000. The co-ordination of the implementation of this policy and the development of a risk register is the responsibility of a Risk Management Committee which reports to the Executive Committee of SES.
The Executive Committee in turn reports to the Board, which has the ultimate responsibility for oversight of the company’s risks and for ensuring that an effective risk management system is in place.
Common definitions and measures of risk management have been established and provided to the various risk owners to ensure that the risk management policy is properly implemented.
A risk management co-ordinator has been appointed in order to ensure the adequate review of the risks facing SES.
Each reported risk is categorised, assessed by the risk owners, and reviewed by the Risk Management Committee.
Key risk developments are periodically reported to the Executive Committee, the Audit and Risk Committee, and the Board.
INTERNAL CONTROL ACTIVITIESRegarding the internal controls in the area of accounting and financial reporting, the following should be noted:
← Staff involved in the company’s accounting and financial reporting is appropriately qualified and are kept up-to-date with relevant changes in International Financial Reporting Standards (‘IFRS’). Additionally, specific training and written guidance on particular matters is provided where needed. Written guidance, regularly updated for business developments and regulatory changes, is available to all relevant staff members and provides a summary of the company’s accounting and financial reporting policies and procedures.
← Controls have been established in the processing of accounting transactions to ensure appropriate authorisations for transactions, effective segregation of duties, and the complete and accurate recording of financial information.
← Completeness and timely recording of financial information is ensured through regular reviews, monitoring of specific key performance indicators, validation procedures by functional leaders and as an additional check, the process of internal and external audit.
← In accordance with the requirements of IFRS, SES discloses detailed information on the market, credit and foreign exchange risks to which it is exposed, as well as its strategy for managing those risks.
← The company relies on a comprehensive system of financial reporting. Strategic plans, business plans, budgets and the interim and full-year consolidated accounts of the company are drawn up and brought to the Board for approval. The Board also approves all significant investments. The Board receives monthly financial reports setting out the company’s financial performance in comparison to the approved budget and prior year figures.
← Any weaknesses in the system of internal controls identified by either internal or external auditors are promptly and fully addressed.
INTRODUCTION GLOBALISATION VERTICALISATION SOCIETYINNOVATION CORPORATE GOVERNANCE
FINANCIAL REVIEW
FINANCIAL STATEMENTS
SES ANNUAL ACCOUNTS
• Chairman’s report on corporate governance and internal control procedures
53SES Annual Report 2015
← The external auditors perform a limited review of the company’s half-year consolidated financial statements and a full audit of the annual consolidated financial statements.
Regarding the internal controls in the area of treasury management, the following should be noted:
← The treasury function uses specific software that helps to ensure the efficiency and control of the implementation of the SES’ hedging strategy for interest rate and foreign currency fluctuations. This software also aims to centralise the cash management of SES’s affiliates.
← In order to ensure enhanced security and efficiency of the bank payments process, the company is using a banking payments system that allows for secured authorisation and transfer of payments from the SAP accounting system directly to the bank.
← A clear segregation of duties and assignment of bank mandates between members of SES management, treasury and accounting departments is implemented.
← In order to streamline the cash management process, SES has centralised the in-house bank into one hub and further reduced the number of cash pools being used. This in-house banking system is fully integrated and managed by SAP.
← SES predominately uses forward currency contracts to eliminate or reduce the currency exposure on single deals, such as satellite procurements, tailoring the maturities to each milestone payment. The foreign currency risk might be in EUR or USD. The forward contracts are in the same currency as the hedged item and can cover up to 100% of the total value of the contract. It is the company’s policy not to enter into forward contracts until a firm commitment is in place, and to match the terms of the hedge derivatives to those of the hedged item to maximise effectiveness.
← The treasury activities with a significant potential risk, such as financial derivative transactions with external parties and in particular the hedging activities engaged during the year, are authorised within the framework approved by the Board.
← A short treasury report is issued every quarter to the Board as part of the financial reporting.
← To further strengthen these controls, a treasury policy is regularly updated. In addition, a Foreign Exchange Risk Management strategy, combined with a multiple year funding plan based on the SES strategic business plan, is also prepared and presented to the Audit and Risk Committee.
Regarding the internal controls in the area of tax management, the following should be noted:
← The main principles of SES’s tax risk management are laid down in the SES Tax Charter, Tax positions are analysed based on best authoritative interpretations and reported in internal tax technical memos or tax opinions from external tax consultancy firms. The tax department seeks, where possible, to achieve upfront tax clearances
with relevant local tax authorities with regard to the tax ramifications of main business ventures, corporate reorganisations and financing structures of the company.
← The transfer pricing team is responsible for continuously improving and fine-tuning transfer pricing documentation underpinning all significant cross-border inter-company transactions in the company. SES’s transfer pricing reports (including functional and economic analyses and benchmarking studies) are embedded in a framework consisting of a master file and a transfer pricing policy.
Regarding the internal controls in the area of satellite operations, the following should be noted:
← SES’s Technology Department is responsible for the procurement of satellites and launch vehicles, the procurement and maintenance of satellite-related ground infrastructure, and the administration, control and operations of the satellite fleet.
← The reporting of the satellite procurement and operations risk management process that is in place to monitor and assess sources of technical risks and to develop qualitative, quantitative and statistical methods which allow the mitigation of risk at the satellite fleet level has been integrated into the company’s Risk Management framework.
← The operational procedures for satellite control and payload management cover manoeuvres and configuration changes required in nominal situations as well as in case of technical emergencies. The controllers are trained and certified in the execution of such procedures. These procedures are periodically reviewed to ensure that they are up-to-date. Satellite control software is being used and fully validated electronic station-keeping procedures are being applied throughout the entire SES fleet.
← SES has designed crisis management systems and supporting infrastructure and tools in order to address satellite in-orbit anomaly situations at an appropriate management level. An effective ‘trouble tickets’ escalation process is used to provide effective and timely support to customers.
← The Satellite Contingency and Emergency Response Process reflects the current company’s organisational structure.
← In 2015 the alert notifications and escalation systems were successfully tested which included the participation of the respective Emergency Recovery teams and a post event analysis was conducted where areas of improvement were identified and test documentation updated.
← SES has adequate satellite control backup capability utilising the European and U.S.-based Satellite Operations Centres (‘SOCs’).
← Primary satellite operations in Europe are operated from the new technical facility in Betzdorf and the SOC in Gibraltar. Primary satellite operations in North America are operated from the new Satellite Operations Centre (‘SOC’) in Princeton. The SOC projects in Betzdorf and Princeton have increased the satellite control
efficiency and network security. ← SES has adequate satellite control backup capability utilising European and U.S. SOC:– In case of a major disaster impacting the
primary U.S. SOC, the primary European SOC will first take-over satellite operations, until the backup SOC in U.S. is staffed to take-over the operations;
– In case of a major disaster impacting the primary European SOC, Gibraltar and the primary U.S. SOC will first take-over satellite operations. Once staffed, the backup European SOC will take-over operations of several satellites to reduce the workload of the Gibraltar and primary U.S. SOC.
Adequate backup capabilities are currently implemented in the following areas:
← SPS has been equipped to be able to uplink control channels for DTH set-top boxes for the 19.2° orbital slot when Betzdorf is unavailable (not associated with telemetry, tracking and control (‘TT&C’)).
← At Woodbine, additional fuel and Uninterruptible Power Supply (‘UPS’) redundant facilities were installed to enhance the station emergency backup system.
← At Manassas, thermal scans were performed on all power distribution devices of the backup power systems and adjustments made to improve the reliability of the devices. Also, electronics were moved from potential ‘flood zone areas’ and the existing flood protection measures were enhanced to prevent potential damage.
← The TT&C function is currently provided for each satellite via at least two independent antenna sites. The sites are connected via a ground dual-redundant state-of-the-art network to at least two site diverse SOC’s.
← A backup Ground Control System for Loral and Airbus Defence and Space spacecraft has been installed in the U.S. to support the emergency disaster recovery capabilities of the European SOC.
← The global network that supports TT&C has been greatly strengthened by deploying a dual-redundant state-of-the-art Multi Protocol Label Switching (‘MPLS’) network connecting all the SOCs and TT&C sites worldwide.
← The alternative European back-up of the TT&C functions has been built out for SES needs with a fully operational backup plan for all ASTRA satellites.
Regarding the internal controls in the area of information and communication technology, the following should be noted:
← Management is committed to ensuring that its data, infrastructure and information technology systems are as secure as is reasonably practicable. Security controls, policies and procedures are in place to prevent unauthorised access to premises, computer systems, networks and data. Policies and procedures have been defined and implemented in order to address the more rigorous regulations governing handling of
54 SES Annual Report 2015
personally identifiable data. ← Management is committed to enhancing information security through the established Data Governance and Information Security Committee.
← Electronic information is regularly backed up and copies are stored off-site.
← SES has disaster recovery plans for its business applications. The regular annual testing of these activities which took place also in 2015 has confirmed that SES is in a good position to recover all mission critical back-office applications within their set recovery time objectives.
INFORMATION AND COMMUNICATION
Since January 2015 all SES’s main trading operations are now included and operated on a common SAP platform, sharing common processes and controls.
The new SAP Security and Authorisation function is committed to continually enhancing SAP access management, taking advantage of the newly implemented SAP Governance Risk and Compliance module which focuses on access and process controls.
To further support this process the SAP Security and Authorisation function has begun a project to define and implement a comprehensive SAP Security policy.
The operation of the SAP hosting platform continues to mature in various areas including data privacy, data encryption and intrusion detection. A detailed operational handbook is maintained to safeguard smooth and secure operation of the company’s ERP platform.
Internal communication ensures the effective circulation of information and supports the implementation of internal control and risk management by providing business and functional objectives, instructions and information to all levels of SES. The corporate intranet portal and collaboration tools are instrumental to sharing information throughout the company.
MONITORING ACTIVITIES
Monitoring is done in two ways: through ongoing evaluations or separate evaluations. Ongoing evaluations are performed by management as routine operations, built into business processes, and performed on a real-time basis, reacting to changing conditions.
The SES Internal Audit function performs separate evaluations of the relevance of, and compliance with, company policies and internal control procedures.
The mission of the Internal Audit function is to provide independent and objective assurance regarding the effectiveness and efficiency of business operations, the reliability of financial and operational reporting, and the company’s compliance with legal and regulatory requirements. In this context, Internal Audit is also tasked to support management with
identifying, preventing and minimising risks, as well as safeguarding the company’s assets.
To ensure an appropriate level of independence and communication, the Internal Audit function has a direct reporting line into the Audit and Risk Committee and reports functionally to the President and CEO.
The activities of the Internal Audit function are executed in accordance with an annual audit plan, which is reviewed and approved by the Audit and Risk Committee. This plan is derived from an annual risk assessment based on a risk mapping exercise relying on the SES risk register. The annual risk assessment responds to the need to dynamically link the audit plan to risks and exposures that may affect the organisation and its operations.
Internal Audit monitors the implementation of internal control recommendations and regularly reports on effective compliance to the President and CEO and to the Audit and Risk Committee.
Internal Audit also regularly co-ordinates audit planning and exchanges relevant information with the company’s external auditors.
The proxy structure of the SES Government Solutions entity, in line with common practice for businesses serving certain segments of the U.S. government, imposes various restrictions on the Board and executive management in directly supervising the maintenance of an internal control system and imposing an internal audit structure. The SES Internal Audit function did not perform any direct internal control review of this entity during 2015, in line with the imposed restrictions. However, these restrictions are mitigated through having agreement on a required risk management and internal control framework which is subject to evaluation and testing by a third-party internal audit function. An adequate reporting process of activities of the third-party audit function to the SES Internal Audit function and Audit and Risk Committee has been put in place.
It should be further noted that PwC, as external auditor, reviews the financial statements of SES Government Solutions.
INVESTOR RELATIONS
SES’s dedicated Investor Relations function reports to the Chief Financial Officer and works closely with the President and CEO. Its purpose is to develop and coordinate the group’s external financial communications and interactions with equity and debt investors, investment analysts, credit rating agencies, financial journalists and other external audiences, to monitor stock market developments, and to provide feedback and recommendations to the SES Executive Committee.
The Vice President, Investor Relations is responsible for the definition and execution of SES’s active Investor Relations programme and participation in investor conferences and similar events. Investor Relations also works closely with the group’s General Counsel to ensure that the group’s external communications are compliant with all applicable legal and regulatory requirements.

INTRODUCTION GLOBALISATION VERTICALISATION SOCIETYINNOVATION CORPORATE GOVERNANCE
FINANCIAL REVIEW
FINANCIAL STATEMENTS
SES ANNUAL ACCOUNTS
• Chairman’s report on corporate governance and internal control procedures
Year 2014 2013 2012 2011 2010 2009 2008
Scope 1 6,546 6,621 6,959 6,464 12,397 17,317 14,432
Scope 2 17,080 17,391 20,475 27,758 26,846 32,471 26,507
Scope 3 11,460 14,756 5,873 4,937 2,309
Total emissions 35,087 38,768 33,307 39,159 41,553 49,788 40,939
SES CO2 RESULTS
55SES Annual Report 2015
CORPORATE SOCIAL RESPONSIBILITY
The concept of Corporate Social Responsibility (CSR) is used to identify how a company’s values and conduct demonstrate responsibility towards the communities and societies in which it operates. To get an accurate overview of a company’s social responsibility a variety of factors need to be considered, including their environmental and ecological profile, educational contributions, charitable activities, human resources as well as their corporate strategy.
SES CSR goes beyond compliance with the compulsory legally elements and includes self-defined targets. SES has made a number of commitments and defined its best practices. This results in notable recognition by stakeholders, investors, customers and employees, and an excellent reputation as a company citizen.
In addition to complying with the existing framework, SES voluntarily discloses supplementary and non-financial information - via this current report – that according to the EU directive 2014/95 will only become mandatory as of 2018.
ENVIRONMENTSince 2008 SES has reported the CO2 emissions of its operations officially by participating in the Carbon Disclosure Project (CDP), which collects the data of all SES’s business activities and locations.
The data collection for CDP covers three scopes:
← Scope 1: Direct Combustibles (such as chemical fuels and gas) ← Scope 2: Indirect Energy consumption (purchased electricity or heat) ← Scope 3: Other Emissions (business travel, waste, refrigerants)
In 2014, the company’s activities related to operating and commercializing SES’s satellite fleet, as well as general administration, finance and marketing, generated approximately 35,087 tons of CO2 emissions worldwide, a decrease of 9 % compared to 2013.
Emissions from Scope 2 electricity consumption represented the largest component of SES’s total emissions in 2014 (approximately 48%). Scope 1 emissions were approximately 18%, both overall reduced by 3,681 tons. The Scope 3 part, business travel including the staff commuting, has decreased by 3,200 tons to 28% overall. Teleports generated the largest share of the emissions from Scope 1 and Scope 2 sources.
SES implemented a substantial carbon reduction plan at its headquarters site in Betzdorf, Luxembourg, and SES continues to support carbon reduction initiatives on an ongoing basis. SES is particularly focused on carbon reduction initiatives in connection with new building constructions and infrastructure upgrades. In Luxembourg, SES operates a Combined Heat and Power (CHP) unit, which reduces the emissions load of the general grid. In addition, since January 2010 SES’s headquarters have been using electricity sourced from hydropower, which can be considered CO2-free. The same applies to its operations in Sweden. The use of renewable energy has had a significant reduction of the company’s carbon emissions in Luxembourg (an estimated 6,000 tonnes). However, due to the carbon accounting rules, these emissions gains are not reflected in the company’s carbon disclosure figures. SES applies best practices in minimizing the environmental impact of outsourced activities, such as the manufacturing and launching of spacecraft. The company also ensures that the amount of
radiation emitted from earth stations respects or remains below the maximum levels defined by the countries of operation. SES’s compliance with this is checked through yearly audits that are conducted by both internal and by third-party accredited organisations that specialise in the field of industrial safety.
London-based start-up ET Index encourages “green” investment by providing investors with carbon emissions data and tracking, both for portfolios and individual companies. The company tracks direct greenhouse gas emissions, as well as factoring in things like electricity consumption, supply chain, and other indirect emissions. ET Index has produced a ranking of the 800 biggest companies in the world, based on relative emissions and weighted to allow comparison of the biggest to the smallest emitters on the list. Each business is given an intensity score, which gives the tons of carbon dioxide equivalent produced per $1 million (£650,000) in revenue. In 2015, SES was ranked 11th.
More details the Carbon Disclosure Project can be found at (www.cdproject.net).
56 SES Annual Report 2015
EDUCATION In Luxembourg SES pursued a partnership with the University of Luxembourg. Together the partnership is developing a centre of excellence and innovation for advanced information and communications technology in satellite systems. To bring this into reality SES is cooperating with the University’s Interdisciplinary centre for Security, Reliability and Trust (SnT). Additionally SES finances a chair in satellite, telecommunications and media law within the Faculty of Law Economics and Finance. Also in Luxembourg, SES has a cooperation agreement with Sacred Heart University Luxembourg, which covers both educational services for SES employees and student visits.
In Strasbourg, France, SES has continued funding a scholarship programme with the International Space University (ISU) to support students studying advanced space applications.
In Benin, Africa, SES also funds to scholarships for students from the African school of economics (ASE), to attend Princeton University, a partner in the United States.
In the U.S., SES supports the Stevens Institute of Technology, a coeducational research university located in Hoboken, New Jersey, with a Master’s Programme.
CHARITYThe entire team at SES is focused on charitable work, encompassing charity activities run by SES’s matching donations scheme, SES social clubs, and HR Learning and Development endorsed charity projects. SES charitable donations include yearly contributions to charities, one-off contributions to disaster-stricken areas, SES Gives Back! and a site-based charity run. SES’s charity activities engage and motivate SES colleagues who then inspire other colleagues to give back to the society and countries in which SES does business.
In 2015 SES matched employee donations to these charitable organisations: The Red Cross, The Red Crescent, Oxfam, Unicef, Médecins Sans Frontières / Doctors Without Borders, and Télécoms Sans Frontières.
In addition, SES is proud that its employees take independent initiatives to give back to society. In 2015 SES teams volunteered their funds and/or time to: The Singapore Cancer Society, the Leukemia and Lymphoma Society in the U.S., Martha’s table in the U.S., a clothing donation drive, Dragon boat racing for breast cancer research, the construction of the Green Village in Manila, building a Primary school in Tanzania, helping Syrian refugees relocate in Germany, a Burkina Faso kids scholarship, help towards the Fondation Lëtzebuerger Kannerduerf SOS Village d’Enfants / SOS Children’s Village, Fondation JED Belgique, and the Royal Academy of Dramatic Arts (RADA).
HUMAN RESOURCESAs of 31 December 2015, the SES group employed 1,314.5 individuals worldwide, counted in full time equivalents (FTEs). 462.2 FTEs are based in the Luxembourg headquarters, 405.1 in the rest of Europe, 357.3 in the United States and 89.9 in the rest of the world. The gender split within SES is 25% women and 75% men.
SES is an international company with 55 different nationalities represented in its employee population. Its leadership team includes 22 different nationalities at the Executive level, while SES’s high potential programme has employees of 19 different nationalities. The top five populations of nationalities in SES are the U.S. with 350 employees, Germany with 305, France represented by 102 people, the UK by 84, and Luxembourg with 69 people working at SES. SES HR initiatives that concern diversity, development, work place organisation and knowledge management are described in further detail on page 32 in the piece “Next Generation Talent”.
CORPORATESatellite technology holds an important role in the global communications infrastructure. SES’s company management and the corporate team hold the responsibility to reinforce and communicate this importance widely. To do this a range of activities were developed including passing on SES’s message about satellite relevance, developing its corporate strategy, and being innovative in its technological approach.
The role and relevance of Satellite in future and next generation network architectures is the leitmotif of SES’s narratives and a key ingredient of its societal engagement. SES takes every opportunity to convey this message, and in 2015 touched thousands of people with its story. In the second half of 2015 Luxembourg held the presidency of the European Union. As a part of this event, SES developed a very intense programme, hosting nearly 800 visitors at its headquarters in Betzdorf. Representatives of EU institutions, EU member states, and diplomates all came through its doors giving SES the occasion to discuss the importance of satellite with them. Over the course of 2015 SES also attended PR roadshows across the globe to convey this message, visiting Mexico, the Philippines, the UAE, Brazil, Cameroon, Nigeria, France, Germany, and the U.S.. SES delegates attended conferences for this purpose as well. SES participated at Euroconsult, ARTES, IBC, GSMA Mobile World Congress, Brussels Space Conference, Air Forum Paris, and Davos Global Agenda 2015, and hosted the SES Broadcast Forum and SES Industry Days. These initiatives all resulted in the acknowledgement of satellite’s key role in digitisation and growing visibility for satellite/space narratives beyond the industry.
The strategy of SES, which includes globalisation, verticalisation, innovation and a focus on applications, also plays an important role in its strategic narrative. SES’s strategy of verticalisation goes beyond its core video business to recognise the importance that satellite can have in other industries. By defining its verticals SES has given its business a laser focus on video, mobility, enterprise,
INTRODUCTION GLOBALISATION VERTICALISATION SOCIETYINNOVATION CORPORATE GOVERNANCE
FINANCIAL REVIEW
FINANCIAL STATEMENTS
SES ANNUAL ACCOUNTS
• Chairman’s report on corporate governance and internal control procedures
57SES Annual Report 2015
and government. This allows SES to clearly identify areas where its business can meet society’s needs. Beyond verticalisation, SES continues to take a thoughtful approach when considering how its business interests can integrate with a community’s needs. SES’s Elevate installer training programme is one such initiative, and SES has now trained over 4000 installers in 14 African countries.
Finally, SES accomplishments in innovation define its organisation as a thought leader, innovation driver, pioneer and investor. Under its innovation activities, SES supports and develops products and programmes that showcase the unique strength of satellite to tackle institutional, infrastructure and environmental challenges. emergency.lu, SATMED, and SES’s connected solar school programmes all demonstrate the key role satellite can play to improve the lives of people around the world. (each of these initiatives are described in greater detail in the society section starting on page 33.)
RESPONSIBILITY STATEMENT
The Board of Directors and the Executive Committee of the company reaffirm their responsibility to ensure the maintenance of proper accounting records disclosing the financial position of the group with reasonable accuracy at any time, and ensuring that an appropriate system of internal controls is in place to ensure the group’s business operations are carried out efficiently and transparently. In accordance with article 3 of the law of 11 January 2008 on the harmonisation of transparency requirements in relation to information about issuers whose securities are admitted to trading on a regulated market, we declare that, to the best of our knowledge, the annual statutory accounts, prepared in accordance with Luxembourg legal and regulatory requirements, and the consolidated financial statements for the year ended 31 December 2015, prepared in accordance with the International Financial Reporting Standards as adopted by the European Union, give a true and fair view of the assets, liabilities, financial position and profit of the year of SES taken individually, and of SES and its consolidated subsidiaries taken as a whole. In addition, the management report includes a fair review of the development and performance of the business and the position of SES taken individually, and of SES and its consolidated subsidiaries taken as a whole, together with a description of the principal risks and uncertainties that they face.
25 February 2016
Romain Bausch Chairman of the Board of Directors
Karim Michel Sabbagh President and CEO

58 SES Annual Report 2015
FINANCIAL REVIEW BY MANAGEMENT

59SES Annual Report 2015
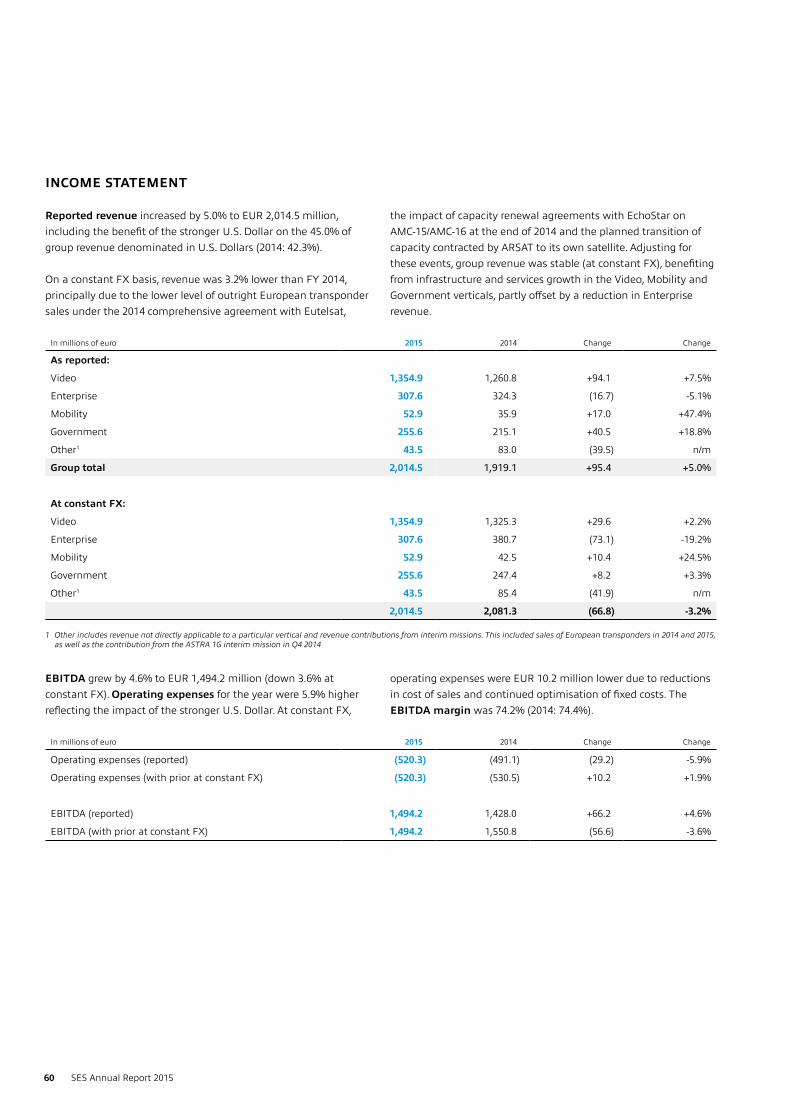
INCOME STATEMENT
Reported revenue increased by 5.0% to EUR 2,014.5 million, including the benefit of the stronger U.S. Dollar on the 45.0% of group revenue denominated in U.S. Dollars (2014: 42.3%).
On a constant FX basis, revenue was 3.2% lower than FY 2014, principally due to the lower level of outright European transponder sales under the 2014 comprehensive agreement with Eutelsat,
the impact of capacity renewal agreements with EchoStar on AMC-15/AMC-16 at the end of 2014 and the planned transition of capacity contracted by ARSAT to its own satellite. Adjusting for these events, group revenue was stable (at constant FX), benefiting from infrastructure and services growth in the Video, Mobility and Government verticals, partly offset by a reduction in Enterprise revenue.
EBITDA grew by 4.6% to EUR 1,494.2 million (down 3.6% at constant FX). Operating expenses for the year were 5.9% higher reflecting the impact of the stronger U.S. Dollar. At constant FX,
operating expenses were EUR 10.2 million lower due to reductions in cost of sales and continued optimisation of fixed costs. The EBITDA margin was 74.2% (2014: 74.4%).
In millions of euro 2015 2014 Change Change
As reported:
Video 1,354.9 1,260.8 +94.1 +7.5%
Enterprise 307.6 324.3 (16.7) -5.1%
Mobility 52.9 35.9 +17.0 +47.4%
Government 255.6 215.1 +40.5 +18.8%
Other1 43.5 83.0 (39.5) n/m
Group total 2,014.5 1,919.1 +95.4 +5.0%
At constant FX:
Video 1,354.9 1,325.3 +29.6 +2.2%
Enterprise 307.6 380.7 (73.1) -19.2%
Mobility 52.9 42.5 +10.4 +24.5%
Government 255.6 247.4 +8.2 +3.3%
Other1 43.5 85.4 (41.9) n/m
2,014.5 2,081.3 (66.8) -3.2%
In millions of euro 2015 2014 Change Change
Operating expenses (reported) (520.3) (491.1) (29.2) -5.9%
Operating expenses (with prior at constant FX) (520.3) (530.5) +10.2 +1.9%
EBITDA (reported) 1,494.2 1,428.0 +66.2 +4.6%
EBITDA (with prior at constant FX) 1,494.2 1,550.8 (56.6) -3.6%
1 Other includes revenue not directly applicable to a particular vertical and revenue contributions from interim missions. This included sales of European transponders in 2014 and 2015, as well as the contribution from the ASTRA 1G interim mission in Q4 2014
60 SES Annual Report 2015

INTRODUCTION GLOBALISATION VERTICALISATION SOCIETYINNOVATION CORPORATE GOVERNANCE
FINANCIAL REVIEW
FINANCIAL STATEMENTS
SES ANNUAL ACCOUNTS
In millions of euro 2015 2014 Change Change
Net interest expense (196.5) (199.3) +2.8 +1.4%
Capitalised interest 22.1 23.7 (1.6) -6.6%
Net foreign exchange gains 38.7 20.6 +18.1 n/m
Net financing costs (135.7) (155.0) +19.3 +12.5%
Profit before tax 758.9 727.6 +31.3 +4.3%
Income tax expense (84.9) (85.2) +0.3 +0.4%
Profit after tax 674.0 642.4 +31.6 +5.0%
Share of joint ventures and associates’ result (126.7) (39.0) (87.7) n/m
Non-controlling interests (2.4) (2.6) +0.2 +2.8%
Profit attributable to SES shareholders 544.9 600.8 (55.9) -9.3%
Operating profit grew by 1.4% to EUR 894.6 million (down 5.2% at constant FX). The increase in depreciation and amortisation expense of 9.9% was primarily due to the impact of the stronger U.S. Dollar. At constant FX, depreciation and amortisation
was 1.2% lower than 2014. The depreciation expense included an impairment charge against AMC-16 due to further power degradation being noted during the year.
Profit after tax grew by 5.0% to EUR 674.0 million. Net financing costs were EUR 19.3 million, or 12.5%, lower than the prior year, including an increase in net foreign exchange gains due to the positive impact of the stronger U.S. Dollar. SES’s refinancing
activities since the beginning of 2014 resulted in a 1.4% reduction in group net interest expense. The group’s income tax expense of EUR 84.9 million (2014: EUR 85.2 million) represented an effective tax rate of 11.2% (2014: 11.7%).
The effect of non-cash movements associated with the commencement of commercial operations by O3b Networks was the principal contributor to SES’s share of joint ventures and associates’ result being a loss of EUR 126.7 million. Consequently,
Net profit attributable to SES shareholders was EUR 544.9 million (2014: EUR 600.8 million), representing earnings per share of EUR 1.34 (2014: EUR 1.49).
In millions of euro 2015 2014 Change Change
Depreciation (536.8) (491.6) (45.2) -9.2%
Amortisation (62.8) (53.8) (9.0) -16.7%
Depreciation and amortisation (reported) (599.6) (545.4) (54.2) -9.9%
Depreciation and amortisation (with prior at constant FX) (599.6) (606.9) +7.3 +1.2%
Operating profit (reported) 894.6 882.6 +12.0 +1.4%
Operating profit (with prior at constant FX) 894.6 943.9 (49.3) -5.2%
CASH FLOW AND FINANCING
Net operating cash flow was 17.0% higher than the prior year, including the benefit of the stronger U.S. Dollar on group cash generation and other movements in working capital. The group’s cash conversion rate, measured as the ratio of net operating cash flow to EBITDA, was 97.1% (2014: 86.8%).
Investment in new satellite programmes contributed to an increase in investing activities. Free cash flow before financing activities was 20.5% higher than the prior year and represented 44.2% of group revenue (2014: 38.5%).
In millions of euro 2015 2014 Change Change
Net operating cash flow 1,450.6 1,239.5 +211.1 +17.0%
Investing activities (560.6) (501.1) (59.5) -11.9%
Free cash flow before financing activities 890.0 738.4 +151.6 +20.5%
61SES Annual Report 2015
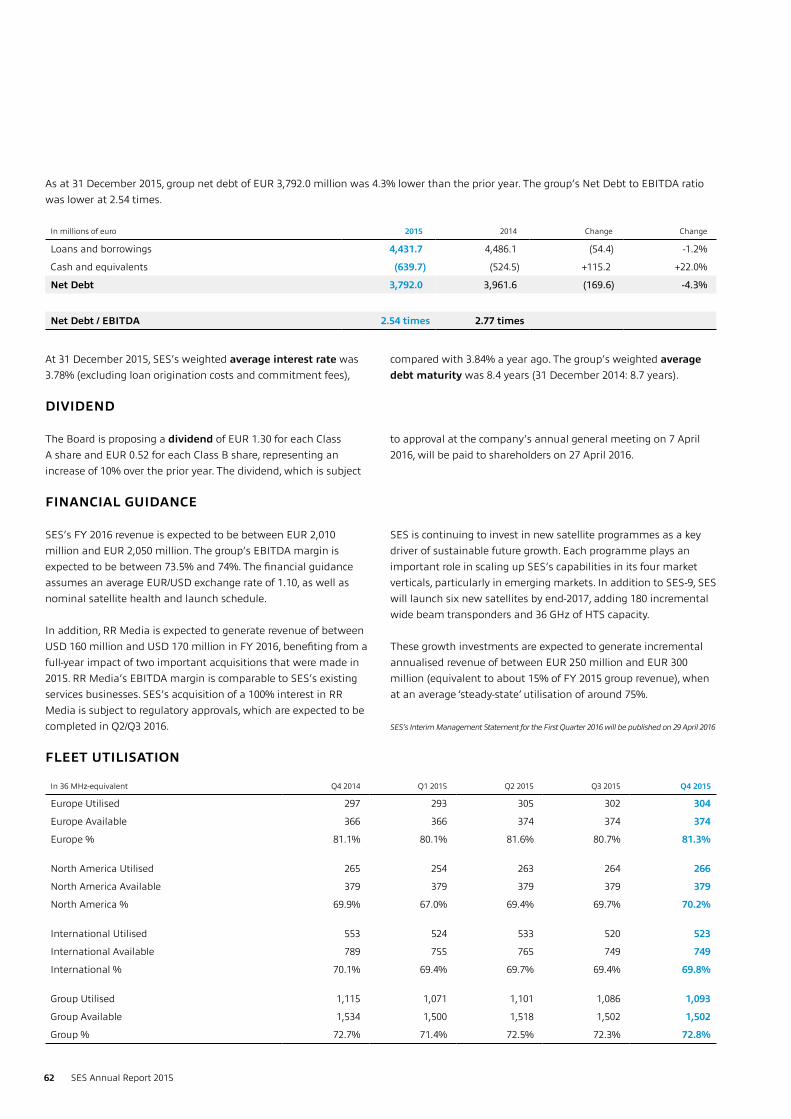
As at 31 December 2015, group net debt of EUR 3,792.0 million was 4.3% lower than the prior year. The group’s Net Debt to EBITDA ratio was lower at 2.54 times.
At 31 December 2015, SES’s weighted average interest rate was 3.78% (excluding loan origination costs and commitment fees),
compared with 3.84% a year ago. The group’s weighted average debt maturity was 8.4 years (31 December 2014: 8.7 years).
DIVIDEND
The Board is proposing a dividend of EUR 1.30 for each Class A share and EUR 0.52 for each Class B share, representing an increase of 10% over the prior year. The dividend, which is subject
to approval at the company’s annual general meeting on 7 April 2016, will be paid to shareholders on 27 April 2016.
FINANCIAL GUIDANCE
SES’s FY 2016 revenue is expected to be between EUR 2,010 million and EUR 2,050 million. The group’s EBITDA margin is expected to be between 73.5% and 74%. The financial guidance assumes an average EUR/USD exchange rate of 1.10, as well as nominal satellite health and launch schedule.
In addition, RR Media is expected to generate revenue of between USD 160 million and USD 170 million in FY 2016, benefiting from a full-year impact of two important acquisitions that were made in 2015. RR Media’s EBITDA margin is comparable to SES’s existing services businesses. SES’s acquisition of a 100% interest in RR Media is subject to regulatory approvals, which are expected to be completed in Q2/Q3 2016.
SES is continuing to invest in new satellite programmes as a key driver of sustainable future growth. Each programme plays an important role in scaling up SES’s capabilities in its four market verticals, particularly in emerging markets. In addition to SES-9, SES will launch six new satellites by end-2017, adding 180 incremental wide beam transponders and 36 GHz of HTS capacity.
These growth investments are expected to generate incremental annualised revenue of between EUR 250 million and EUR 300 million (equivalent to about 15% of FY 2015 group revenue), when at an average ‘steady-state’ utilisation of around 75%.
SES’s Interim Management Statement for the First Quarter 2016 will be published on 29 April 2016
FLEET UTILISATION
In millions of euro 2015 2014 Change Change
Loans and borrowings 4,431.7 4,486.1 (54.4) -1.2%
Cash and equivalents (639.7) (524.5) +115.2 +22.0%
Net Debt 3,792.0 3,961.6 (169.6) -4.3%
Net Debt / EBITDA 2.54 times 2.77 times
In 36 MHz-equivalent Q4 2014 Q1 2015 Q2 2015 Q3 2015 Q4 2015
Europe Utilised 297 293 305 302 304
Europe Available 366 366 374 374 374
Europe % 81.1% 80.1% 81.6% 80.7% 81.3%
North America Utilised 265 254 263 264 266
North America Available 379 379 379 379 379
North America % 69.9% 67.0% 69.4% 69.7% 70.2%
International Utilised 553 524 533 520 523
International Available 789 755 765 749 749
International % 70.1% 69.4% 69.7% 69.4% 69.8%
Group Utilised 1,115 1,071 1,101 1,086 1,093
Group Available 1,534 1,500 1,518 1,502 1,502
Group % 72.7% 71.4% 72.5% 72.3% 72.8%
62 SES Annual Report 2015

INTRODUCTION GLOBALISATION VERTICALISATION SOCIETYINNOVATION CORPORATE GOVERNANCE
FINANCIAL REVIEW
FINANCIAL STATEMENTS
SES ANNUAL ACCOUNTS
In Europe, reported revenue grew 1.6% (up 1.7% at constant FX) to EUR 1,034.5 million, as the lower level of outright transponder sales to Eutelsat (as part of the 2014 comprehensive agreement) was more than offset by the benefit of strong penetration of HD channels, the addition of the first commercial UHD channels, as well as continued growth in SES’s value-added services business.
North American revenue of EUR 389.5 million was 14.0% higher on a reported basis, including the benefit of the stronger U.S. Dollar. Revenue was 4.3% lower at constant FX, primarily as a result of the impact of the AMC-15/AMC-16 capacity renewals with EchoStar
at the end of 2014. This offset growth generated from the revenue contribution associated with the construction phase of the WAAS and GOLD hosted payload agreements.
Reported revenue from the International region increased 5.5% to EUR 590.5 million. At constant FX, revenue declined 10.2% due to the impact of the stronger U.S. Dollar on certain Enterprise customers and the planned migration of capacity contracted by ARSAT to its own satellite. This offset the benefit of important new business secured across emerging markets, contracted on a multi-year basis.
U.S. DOLLAR EXCHANGE RATE
REVENUE BY DOWNLINK REGION
2015 average 2015 closing 2014 average 2014
EUR 1 = U.S. dollar 1.1150 1.0887 1.3348 1.2141
In millions of euro Q4 2015 Q4 2014 Change Change 2015 2014 Change Change
As reported:
Europe 274.4 259.9 +14.5 +5.5% 1,034.5 1,017.7 +16.8 +1.6%
North America 96.7 88.8 +7.9 +8.9% 389.5 341.7 +47.8 +14.0%
International 150.8 163.8 (13.0) -7.9% 590.5 559.7 +30.8 +5.5%
Group total 521.9 512.5 +9.4 +1.8% 2,014.5 1,919.1 +95.4 +5.0%
At constant FX:
Europe 274.4 259.8 +14.6 +5.6% 1,034.5 1,016.8 +17.7 +1.7%
North America 96.7 101.7 (5.0) -4.9% 389.5 406.8 (17.3) -4.3%
International 150.8 183.4 (32.6) -17.8% 590.5 657.7 (67.2) -10.2%
Group total 521.9 544.9 (23.0) -4.2% 2,014.5 2,081.3 (66.8) -3.2%
BUSINESS SEGMENTATION
In millions of euro Infrastructure ServicesElimination/ Unallocated1 Group total
Revenue 1,727.3 526.3 (239.1) 2,014.5
EBITDA 1,450.0 87.5 (43.3) 1,494.2
2015 EBITDA margin 84.0% 16.6% 74.2%
2014 EBITDA margin (with prior at constant FX) 84.2% 16.3% 74.5%
1 Revenue elimination refers mainly to “pull-through” capacity provided by Infrastructure to Services; EBITDA impact represents unallocated corporate expenses
63SES Annual Report 2015
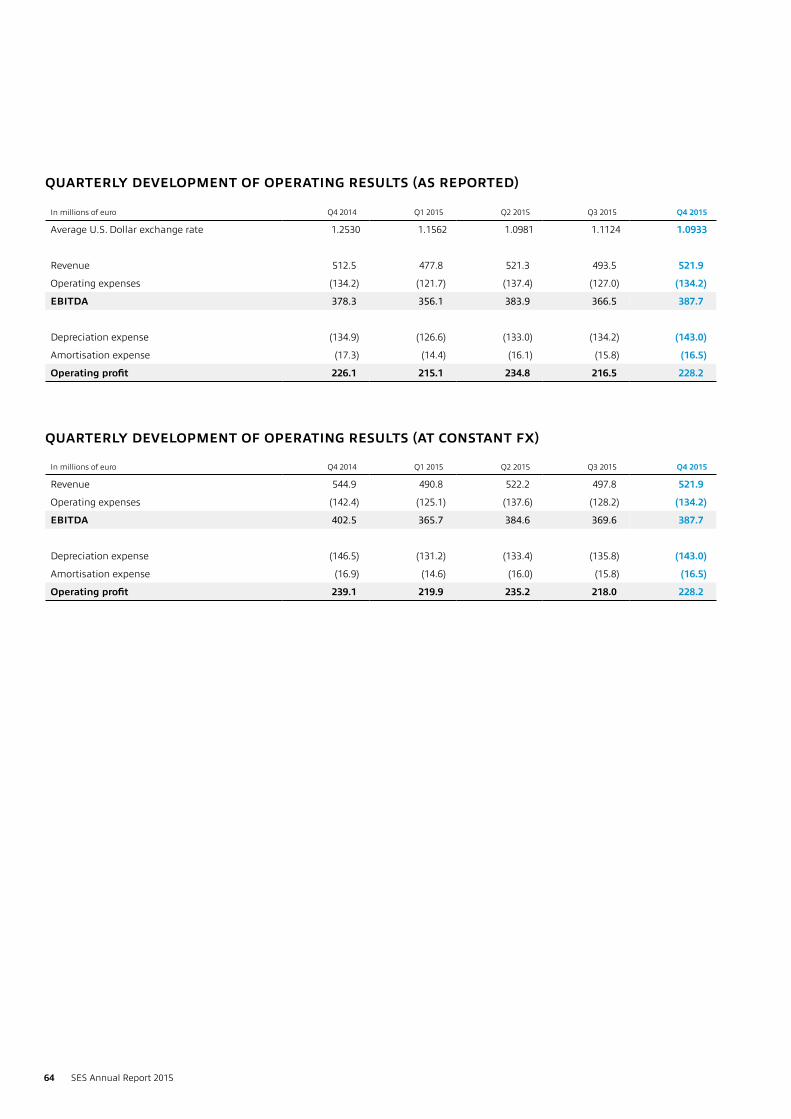
QUARTERLY DEVELOPMENT OF OPERATING RESULTS (AT CONSTANT FX)
In millions of euro Q4 2014 Q1 2015 Q2 2015 Q3 2015 Q4 2015
Average U.S. Dollar exchange rate 1.2530 1.1562 1.0981 1.1124 1.0933
Revenue 512.5 477.8 521.3 493.5 521.9
Operating expenses (134.2) (121.7) (137.4) (127.0) (134.2)
EBITDA 378.3 356.1 383.9 366.5 387.7
Depreciation expense (134.9) (126.6) (133.0) (134.2) (143.0)
Amortisation expense (17.3) (14.4) (16.1) (15.8) (16.5)
Operating profit 226.1 215.1 234.8 216.5 228.2
In millions of euro Q4 2014 Q1 2015 Q2 2015 Q3 2015 Q4 2015
Revenue 544.9 490.8 522.2 497.8 521.9
Operating expenses (142.4) (125.1) (137.6) (128.2) (134.2)
EBITDA 402.5 365.7 384.6 369.6 387.7
Depreciation expense (146.5) (131.2) (133.4) (135.8) (143.0)
Amortisation expense (16.9) (14.6) (16.0) (15.8) (16.5)
Operating profit 239.1 219.9 235.2 218.0 228.2
QUARTERLY DEVELOPMENT OF OPERATING RESULTS (AS REPORTED)
64 SES Annual Report 2015
xx xxx
65SES Annual Report 2015
CONSOLIDATED FINANCIAL STATEMENTS
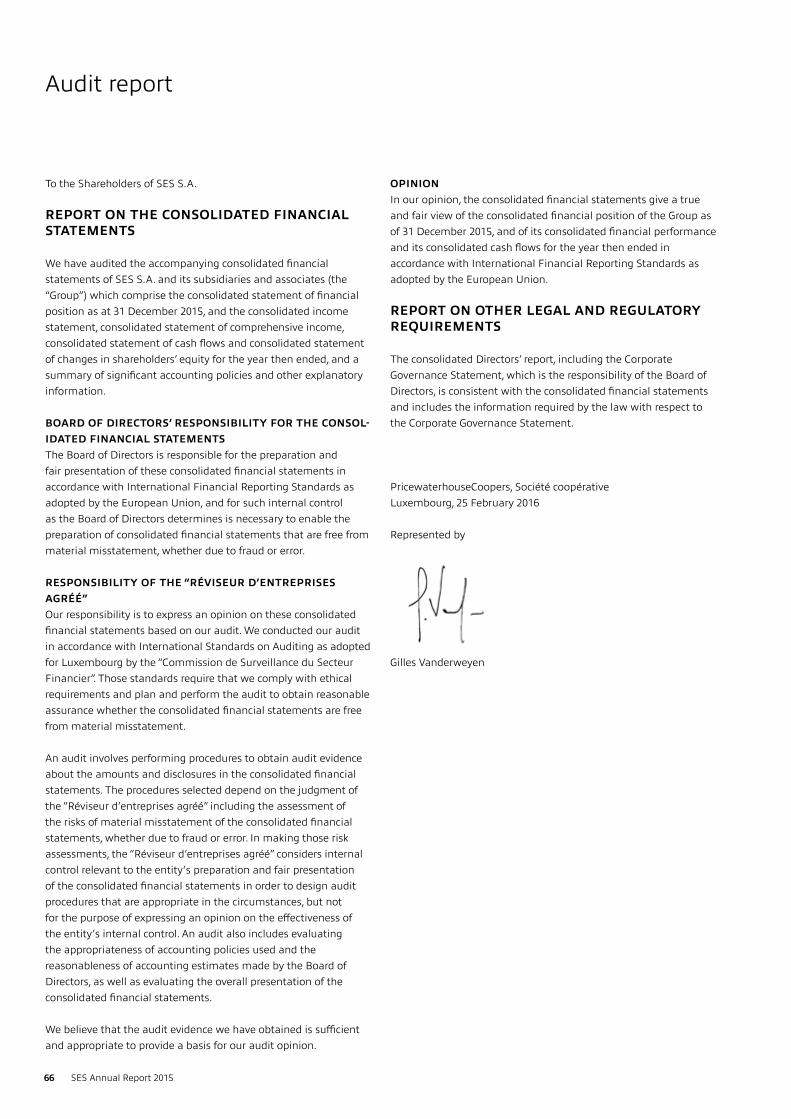
66 SES Annual Report 2015
To the Shareholders of SES S.A.
REPORT ON THE CONSOLIDATED FINANCIAL STATEMENTS
We have audited the accompanying consolidated financial statements of SES S.A. and its subsidiaries and associates (the “Group”) which comprise the consolidated statement of financial position as at 31 December 2015, and the consolidated income statement, consolidated statement of comprehensive income, consolidated statement of cash flows and consolidated statement of changes in shareholders’ equity for the year then ended, and a summary of significant accounting policies and other explanatory information.
BOARD OF DIRECTORS’ RESPONSIBILITY FOR THE CONSOL-IDATED FINANCIAL STATEMENTSThe Board of Directors is responsible for the preparation and fair presentation of these consolidated financial statements in accordance with International Financial Reporting Standards as adopted by the European Union, and for such internal control as the Board of Directors determines is necessary to enable the preparation of consolidated financial statements that are free from material misstatement, whether due to fraud or error.
RESPONSIBILITY OF THE “RÉVISEUR D’ENTREPRISES AGRÉÉ”Our responsibility is to express an opinion on these consolidated financial statements based on our audit. We conducted our audit in accordance with International Standards on Auditing as adopted for Luxembourg by the “Commission de Surveillance du Secteur Financier”. Those standards require that we comply with ethical requirements and plan and perform the audit to obtain reasonable assurance whether the consolidated financial statements are free from material misstatement.
An audit involves performing procedures to obtain audit evidence about the amounts and disclosures in the consolidated financial statements. The procedures selected depend on the judgment of the “Réviseur d’entreprises agréé” including the assessment of the risks of material misstatement of the consolidated financial statements, whether due to fraud or error. In making those risk assessments, the “Réviseur d’entreprises agréé” considers internal control relevant to the entity’s preparation and fair presentation of the consolidated financial statements in order to design audit procedures that are appropriate in the circumstances, but not for the purpose of expressing an opinion on the effectiveness of the entity’s internal control. An audit also includes evaluating the appropriateness of accounting policies used and the reasonableness of accounting estimates made by the Board of Directors, as well as evaluating the overall presentation of the consolidated financial statements.
We believe that the audit evidence we have obtained is sufficient and appropriate to provide a basis for our audit opinion.
OPINIONIn our opinion, the consolidated financial statements give a true and fair view of the consolidated financial position of the Group as of 31 December 2015, and of its consolidated financial performance and its consolidated cash flows for the year then ended in accordance with International Financial Reporting Standards as adopted by the European Union.
REPORT ON OTHER LEGAL AND REGULATORY REQUIREMENTS
The consolidated Directors’ report, including the Corporate Governance Statement, which is the responsibility of the Board of Directors, is consistent with the consolidated financial statements and includes the information required by the law with respect to the Corporate Governance Statement.
PricewaterhouseCoopers, Société coopérativeLuxembourg, 25 February 2016
Represented by
Gilles Vanderweyen
Audit report

INTRODUCTION GLOBALISATION VERTICALISATION SOCIETYINNOVATION CORPORATE GOVERNANCE
FINANCIAL REVIEW
FINANCIAL STATEMENTS
SES ANNUAL ACCOUNTS
In millions of euros 2015 2014
Revenue Note 3 2,014.5 1,919.1
Cost of sales Note 4 (183.6) (173.5)
Staff costs Note 4 (200.5) (194.5)
Other operating expenses Note 4 (136.2) (123.1)
Operating expenses Note 4 (520.3) (491.1)
EBITDA1 1,494.2 1,428.0
Depreciation expense Note 12 (536.8) (491.6)
Amortisation expense Note 14 (62.8) (53.8)
Operating profit Note 3 894.6 882.6
Finance income Note 6 53.1 33.8
Finance costs Note 6 (188.8) (188.8)
Net financing costs (135.7) (155.0)
Profit before tax 758.9 727.6
Income tax expense Note 7 (84.9) (85.2)
Profit after tax 674.0 642.4
Share of associates’ result, net of tax Notes 15 (126.7) (39.0)
Profit for the year 547.3 603.4
Attributable to:
Owners of the parent 544.9 600.8
Non-controlling interests 2.4 2.6
547.3 603.4
Basic earnings per share (in euro)
Class A shares Note 10 1.34 1.49
Class B shares Note 10 0.54 0.59
Diluted earnings per share (in euro)
Class A shares Note 10 1.33 1.48
Class B shares Note 10 0.53 0.59
1 Earnings before interest, taxes, depreciation, amortisation and share of associates’ result net of tax.
The notes are an integral part of the consolidated financial statements.
67SES Annual Report 2015
Consolidated income statementFor the year ended December 31, 2015
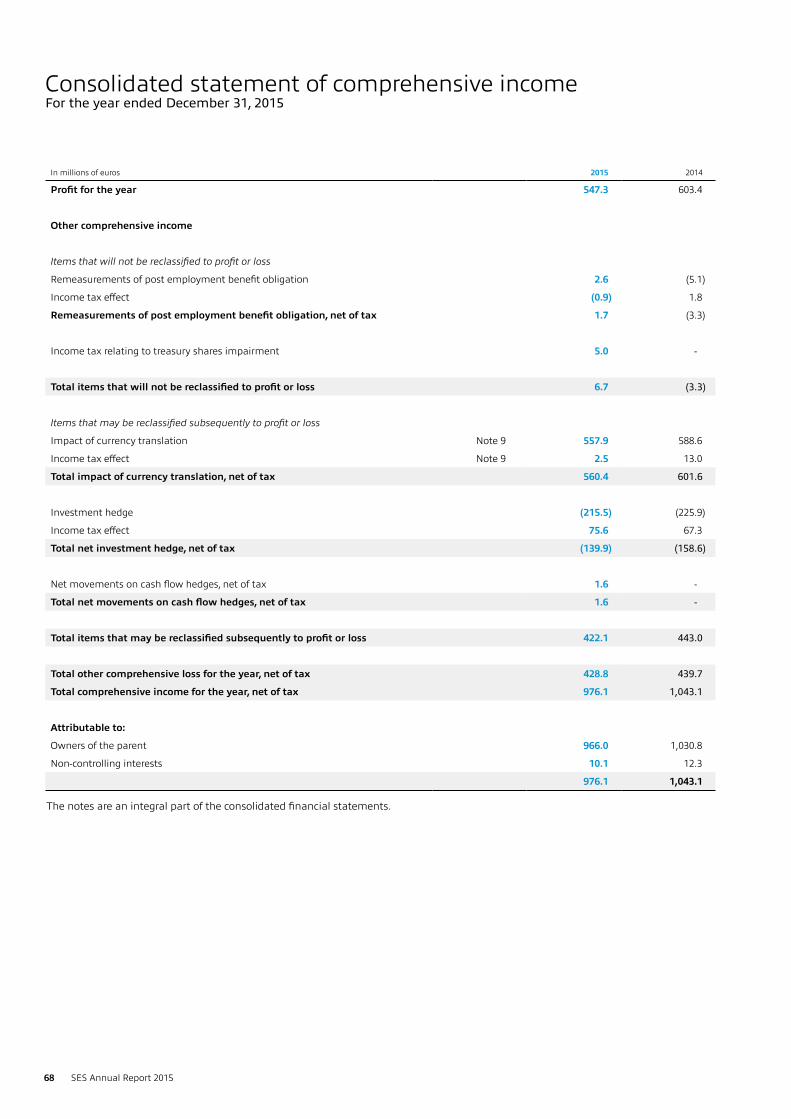
In millions of euros 2015 2014
Profit for the year 547.3 603.4
Other comprehensive income
Items that will not be reclassified to profit or loss
Remeasurements of post employment benefit obligation 2.6 (5.1)
Income tax effect (0.9) 1.8
Remeasurements of post employment benefit obligation, net of tax 1.7 (3.3)
Income tax relating to treasury shares impairment 5.0 -
Total items that will not be reclassified to profit or loss 6.7 (3.3)
Items that may be reclassified subsequently to profit or loss
Impact of currency translation Note 9 557.9 588.6
Income tax effect Note 9 2.5 13.0
Total impact of currency translation, net of tax 560.4 601.6
Investment hedge (215.5) (225.9)
Income tax effect 75.6 67.3
Total net investment hedge, net of tax (139.9) (158.6)
Net movements on cash flow hedges, net of tax 1.6 -
Total net movements on cash flow hedges, net of tax 1.6 -
Total items that may be reclassified subsequently to profit or loss 422.1 443.0
Total other comprehensive loss for the year, net of tax 428.8 439.7
Total comprehensive income for the year, net of tax 976.1 1,043.1
Attributable to:
Owners of the parent 966.0 1,030.8
Non-controlling interests 10.1 12.3
976.1 1,043.1
The notes are an integral part of the consolidated financial statements.
68 SES Annual Report 2015
Consolidated statement of comprehensive incomeFor the year ended December 31, 2015
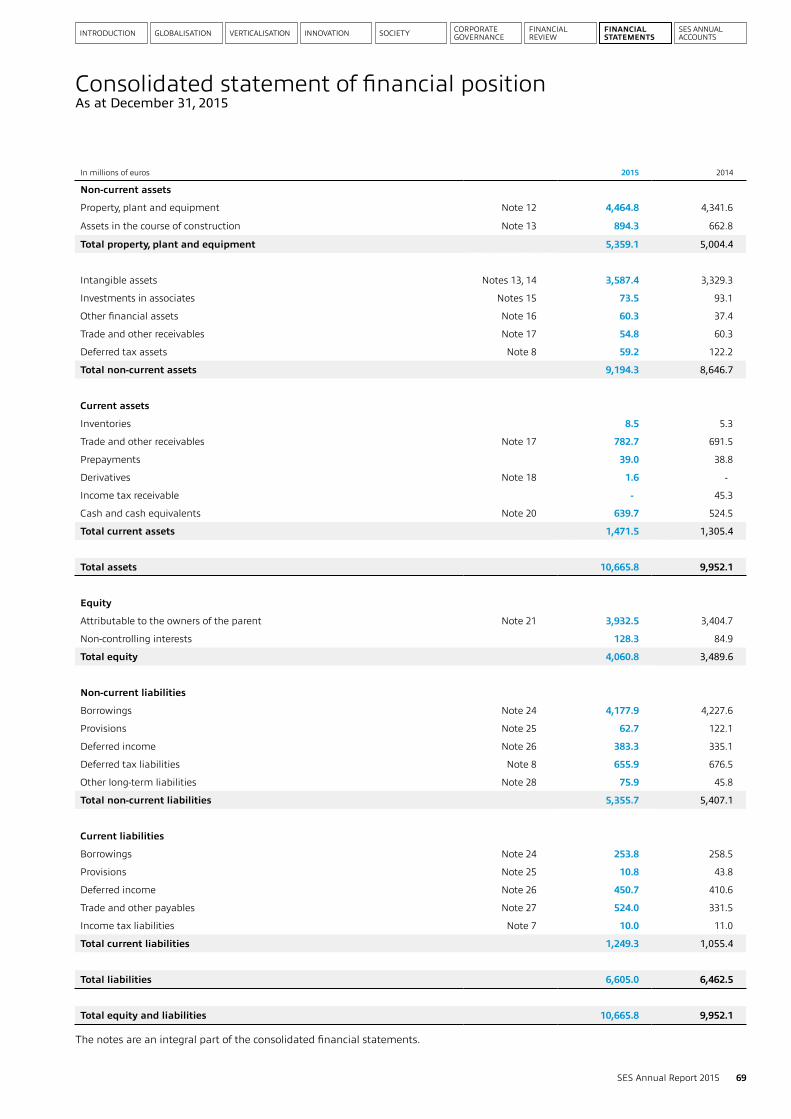
INTRODUCTION GLOBALISATION VERTICALISATION SOCIETYINNOVATION CORPORATE GOVERNANCE
FINANCIAL REVIEW
FINANCIAL STATEMENTS
SES ANNUAL ACCOUNTS
In millions of euros 2015 2014
Non-current assets
Property, plant and equipment Note 12 4,464.8 4,341.6
Assets in the course of construction Note 13 894.3 662.8
Total property, plant and equipment 5,359.1 5,004.4
Intangible assets Notes 13, 14 3,587.4 3,329.3
Investments in associates Notes 15 73.5 93.1
Other financial assets Note 16 60.3 37.4
Trade and other receivables Note 17 54.8 60.3
Deferred tax assets Note 8 59.2 122.2
Total non-current assets 9,194.3 8,646.7
Current assets
Inventories 8.5 5.3
Trade and other receivables Note 17 782.7 691.5
Prepayments 39.0 38.8
Derivatives Note 18 1.6 -
Income tax receivable - 45.3
Cash and cash equivalents Note 20 639.7 524.5
Total current assets 1,471.5 1,305.4
Total assets 10,665.8 9,952.1
Equity
Attributable to the owners of the parent Note 21 3,932.5 3,404.7
Non-controlling interests 128.3 84.9
Total equity 4,060.8 3,489.6
Non-current liabilities
Borrowings Note 24 4,177.9 4,227.6
Provisions Note 25 62.7 122.1
Deferred income Note 26 383.3 335.1
Deferred tax liabilities Note 8 655.9 676.5
Other long-term liabilities Note 28 75.9 45.8
Total non-current liabilities 5,355.7 5,407.1
Current liabilities
Borrowings Note 24 253.8 258.5
Provisions Note 25 10.8 43.8
Deferred income Note 26 450.7 410.6
Trade and other payables Note 27 524.0 331.5
Income tax liabilities Note 7 10.0 11.0
Total current liabilities 1,249.3 1,055.4
Total liabilities 6,605.0 6,462.5
Total equity and liabilities 10,665.8 9,952.1
The notes are an integral part of the consolidated financial statements.
69SES Annual Report 2015
Consolidated statement of financial positionAs at December 31, 2015
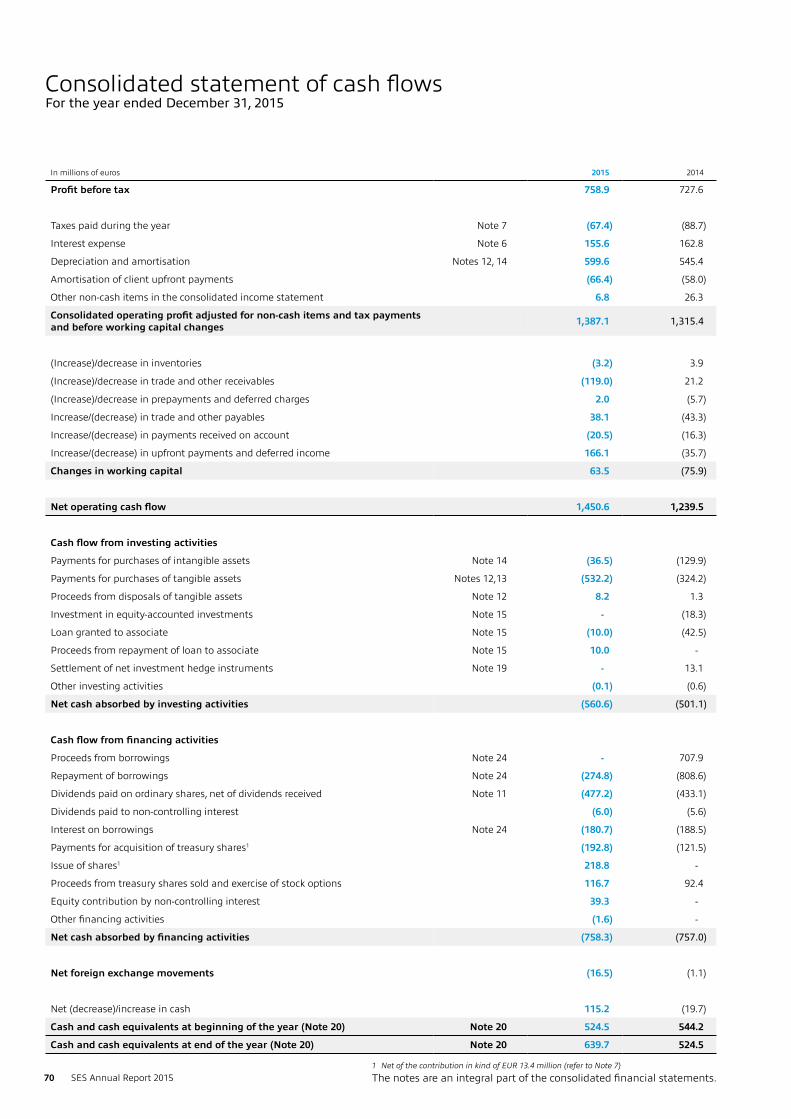
In millions of euros 2015 2014
Profit before tax 758.9 727.6
Taxes paid during the year Note 7 (67.4) (88.7)
Interest expense Note 6 155.6 162.8
Depreciation and amortisation Notes 12, 14 599.6 545.4
Amortisation of client upfront payments (66.4) (58.0)
Other non-cash items in the consolidated income statement 6.8 26.3
Consolidated operating profit adjusted for non-cash items and tax payments and before working capital changes 1,387.1 1,315.4
(Increase)/decrease in inventories (3.2) 3.9
(Increase)/decrease in trade and other receivables (119.0) 21.2
(Increase)/decrease in prepayments and deferred charges 2.0 (5.7)
Increase/(decrease) in trade and other payables 38.1 (43.3)
Increase/(decrease) in payments received on account (20.5) (16.3)
Increase/(decrease) in upfront payments and deferred income 166.1 (35.7)
Changes in working capital 63.5 (75.9)
Net operating cash flow 1,450.6 1,239.5
Cash flow from investing activities
Payments for purchases of intangible assets Note 14 (36.5) (129.9)
Payments for purchases of tangible assets Notes 12,13 (532.2) (324.2)
Proceeds from disposals of tangible assets Note 12 8.2 1.3
Investment in equity-accounted investments Note 15 - (18.3)
Loan granted to associate Note 15 (10.0) (42.5)
Proceeds from repayment of loan to associate Note 15 10.0 -
Settlement of net investment hedge instruments Note 19 - 13.1
Other investing activities (0.1) (0.6)
Net cash absorbed by investing activities (560.6) (501.1)
Cash flow from financing activities
Proceeds from borrowings Note 24 - 707.9
Repayment of borrowings Note 24 (274.8) (808.6)
Dividends paid on ordinary shares, net of dividends received Note 11 (477.2) (433.1)
Dividends paid to non-controlling interest (6.0) (5.6)
Interest on borrowings Note 24 (180.7) (188.5)
Payments for acquisition of treasury shares1 (192.8) (121.5)
Issue of shares1 218.8 -
Proceeds from treasury shares sold and exercise of stock options 116.7 92.4
Equity contribution by non-controlling interest 39.3 -
Other financing activities (1.6) -
Net cash absorbed by financing activities (758.3) (757.0)
Net foreign exchange movements (16.5) (1.1)
Net (decrease)/increase in cash 115.2 (19.7)
Cash and cash equivalents at beginning of the year (Note 20) Note 20 524.5 544.2
Cash and cash equivalents at end of the year (Note 20) Note 20 639.7 524.5
1 Net of the contribution in kind of EUR 13.4 million (refer to Note 7)
The notes are an integral part of the consolidated financial statements. 70 SES Annual Report 2015
Consolidated statement of cash flows For the year ended December 31, 2015
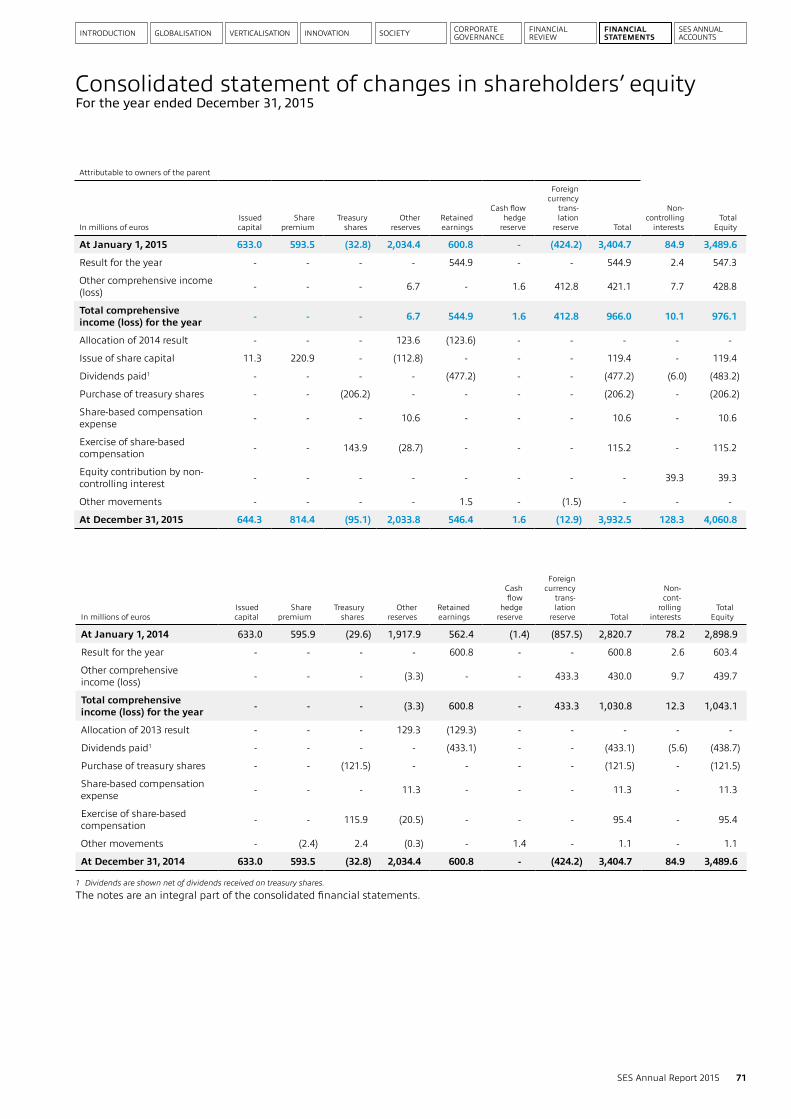
INTRODUCTION GLOBALISATION VERTICALISATION SOCIETYINNOVATION CORPORATE GOVERNANCE
FINANCIAL REVIEW
FINANCIAL STATEMENTS
SES ANNUAL ACCOUNTS
Attributable to owners of the parent
In millions of eurosIssued capital
Share premium
Treasury shares
Other reserves
Retained earnings
Cash flow hedge
reserve
Foreign currency
trans-lation
reserve Total
Non- controlling
interestsTotal
Equity
At January 1, 2015 633.0 593.5 (32.8) 2,034.4 600.8 - (424.2) 3,404.7 84.9 3,489.6
Result for the year - - - - 544.9 - - 544.9 2.4 547.3
Other comprehensive income (loss) - - - 6.7 - 1.6 412.8 421.1 7.7 428.8
Total comprehensive income (loss) for the year - - - 6.7 544.9 1.6 412.8 966.0 10.1 976.1
Allocation of 2014 result - - - 123.6 (123.6) - - - - -
Issue of share capital 11.3 220.9 - (112.8) - - - 119.4 - 119.4
Dividends paid1 - - - - (477.2) - - (477.2) (6.0) (483.2)
Purchase of treasury shares - - (206.2) - - - - (206.2) - (206.2)
Share-based compensation expense - - - 10.6 - - - 10.6 - 10.6
Exercise of share-based compensation - - 143.9 (28.7) - - - 115.2 - 115.2
Equity contribution by non-controlling interest - - - - - - - - 39.3 39.3
Other movements - - - - 1.5 - (1.5) - - -
At December 31, 2015 644.3 814.4 (95.1) 2,033.8 546.4 1.6 (12.9) 3,932.5 128.3 4,060.8
1 Dividends are shown net of dividends received on treasury shares.
The notes are an integral part of the consolidated financial statements.
In millions of eurosIssued capital
Share premium
Treasury shares
Other reserves
Retained earnings
Cash flow
hedge reserve
Foreign currency
trans-lation
reserve Total
Non- cont-
rolling interests
Total Equity
At January 1, 2014 633.0 595.9 (29.6) 1,917.9 562.4 (1.4) (857.5) 2,820.7 78.2 2,898.9
Result for the year - - - - 600.8 - - 600.8 2.6 603.4
Other comprehensive income (loss) - - - (3.3) - - 433.3 430.0 9.7 439.7
Total comprehensive income (loss) for the year - - - (3.3) 600.8 - 433.3 1,030.8 12.3 1,043.1
Allocation of 2013 result - - - 129.3 (129.3) - - - - -
Dividends paid1 - - - - (433.1) - - (433.1) (5.6) (438.7)
Purchase of treasury shares - - (121.5) - - - - (121.5) - (121.5)
Share-based compensation expense - - - 11.3 - - - 11.3 - 11.3
Exercise of share-based compensation - - 115.9 (20.5) - - - 95.4 - 95.4
Other movements - (2.4) 2.4 (0.3) - 1.4 - 1.1 - 1.1
At December 31, 2014 633.0 593.5 (32.8) 2,034.4 600.8 - (424.2) 3,404.7 84.9 3,489.6
71SES Annual Report 2015
Consolidated statement of changes in shareholders’ equityFor the year ended December 31, 2015
72 SES Annual Report 2015
NOTE 1 - CORPORATE INFORMATION
SES S.A. (“SES” or “the Company”) was incorporated on March 16, 2001 as a limited liability company (Société Anonyme) under Luxembourg Law. References to the ‘Group’ in the following notes are to the Company and its subsidiaries and associates. SES trades under “SESG” on the Luxembourg Stock Exchange and Euronext, Paris.
The consolidated financial statements of SES as at and for the year ended December 31, 2015 were authorised for issue in accordance with a resolution of the directors on February 25, 2016. Under Luxembourg Law the financial statements are approved by the shareholders at the annual general meeting.
NOTE 2 - SUMMARY OF SIGNIFICANT ACCOUNTING POLICIES
BASIS OF PREPARATIONThe consolidated financial statements have been prepared in accordance with International Financial Reporting Standards as issued by the International Accounting Standards Board and endorsed by the European Union (IFRS), as at December 31, 2015.
The consolidated financial statements have been prepared on a historical cost basis, except where fair value is required by IFRS as described below. The carrying values of recognised assets and liabilities that are hedged items in fair value hedges, and are otherwise carried at cost, are adjusted to record changes in the fair values attributable to the risks that are being hedged.
CHANGES IN ACCOUNTING POLICIESThe accounting policies adopted are consistent with those of the previous financial year, except for the following new and amended IFRS, effective from January 1, 2015 and adopted by the Group:
IAS 19 EMPLOYEE BENEFITS (REVISED) - AMENDMENTS TO IAS 19 (REVISED)This amendment clarifies the application of IAS 19, “Employee Benefits” (2011) - referred to as IAS 19 Employee Benefits (revised), to plans that require employees or third parties to contribute towards the cost of benefits. The amendment clarifies that the benefit of employee contributions linked to the length of services is recognised in profit or loss over the employee’s working life. Contributions that are not linked to service are reflected in the measurement of the benefit obligation. The amendment does not affect the accounting for voluntary contributions. The adoption of this amendment did not have any impact on the financial position and performance of the Group.
As part of its annual improvement project, the IASB slightly amended various standards. Annual Improvements 2010-2012 and Annual Improvements 2011-2013 published by the IASB on December 12, 2013 focus on areas of inconsistencies in IFRSs or where clarification of wording was required. The adoption of these
amendments did not have any impact on the financial position and performance of the Group.
BASIS OF CONSOLIDATIONThe consolidated financial statements comprise the financial statements of the Company and its controlled subsidiaries, after the elimination of all material inter-company transactions. Subsidiaries are consolidated from the date the Company obtains control until such time as control ceases. Acquisitions of subsidiaries are accounted for using the purchase method of accounting. The financial statements of subsidiaries and affiliates are prepared for the same reporting period as the Company, using consistent accounting policies. Adjustments are made to bring into line any dissimilar accounting policies that may exist. For details regarding the subsidiaries included in the consolidated financial statements see Note 33.
Total comprehensive income or loss within a subsidiary is attributed to the non-controlling interest even if that results in a deficit balance.
A change in the ownership interest in a subsidiary, without a loss of control, is accounted for as an equity transaction.
When the Group ceases to have control any retained interest in the entity is re-measured to its fair value at the date when control is lost, with the change in carrying amount recognized in profit or loss. The fair value is the initial carrying amount for the purposes of subsequently accounting for the retained interest as an associate, joint venture or financial asset. In addition, any amounts previously recognized in other comprehensive income in respect of that entity are accounted for as if the Group had directly disposed of the related assets or liabilities. This may mean that amounts previously recognized in other comprehensive income are reclassified to profit or loss.
INVESTMENTS IN ASSOCIATESThe Group has investments in associates which are accounted for using the equity method of accounting. An associate is an entity in which the Group has significant influence but not control.
Under the equity method, the investment in the associate is carried in the statement of financial position at cost plus post-acquisition changes in the Group’s share of the profit or loss of the associate. Goodwill relating to an associate is included in the carrying amount of the investment and is not amortised.
The Group determines at each reporting date whether there is any objective evidence that the investment in the associate is impaired. If this is the case, the Group calculates the amount of impairment as the difference between the recoverable amount of the associate and its carrying value and recognises the amount within “Share of associates’ result” in the consolidated income statement.
Notes to the consolidated financial statementsDecember 31, 2015
INTRODUCTION GLOBALISATION VERTICALISATION SOCIETYINNOVATION CORPORATE GOVERNANCE
FINANCIAL REVIEW
FINANCIAL STATEMENTS
SES ANNUAL ACCOUNTS
73SES Annual Report 2015
The Group’s share of post-acquisition profit or loss is recognised in the consolidated income statement, and its share of post-acquisition movements in other comprehensive income is recognised in other comprehensive income with a corresponding adjustment to the carrying amount of the investment. When the Group’s share of losses in an associate equals or exceeds its interest in the associate, including any other unsecured receivables, the Group does not recognise further losses, unless it has incurred legal or constructive obligations or made payments on behalf of the associate. In general the financial statements of associates are prepared for the same reporting year as the parent Company, using consistent accounting policies. Adjustments are made to bring in line any dissimilar accounting policies that may exist.
Profits and losses resulting from upstream and downstream transactions between the Group and its associate are recognised in the Group’s financial statements only to the extent of unrelated investor’s interests in the associates. Dilution gains and losses arising in investments in associates are recognised in the consolidated income statement.
The Group ceases to use the equity method of accounting on the date from which it no longer has significant influence over the associate, or when the interest becomes classified as an asset held for sale.
SIGNIFICANT ACCOUNTING JUDGMENTS AND ESTIMATES1) JudgmentsIn the process of applying the Group’s accounting policies, management has made the following judgments, apart from those involving estimations, which have the most significant effect on the amounts recognised in the financial statements:
(i) Treatment of orbital slot licence rights The Group’s operating companies have obtained rights
to operate satellites at certain orbital locations and using certain frequency bands. These licences are obtained through application to the relevant national and international regulatory authorities, and are generally made available for a defined period. Where the Group has obtained such rights through the acquisition of subsidiaries and associates, the rights have been identified as an asset acquired and recorded at the fair value attributed to the asset at the time of the acquisition as a result of purchase accounting procedure.
Because, on the expiry of such rights, management believes it will be in a position to successfully re-apply for their usage at insignificant incremental cost, such rights are deemed to have an indefinite life. Hence these assets are not amortised, but rather are subject to regular impairment reviews to confirm that the carrying value in the Group’s financial statements is still appropriate. More details are given in Note 14.
(ii) Taxation The Group operates in numerous tax jurisdictions and
management is required to assess tax issues and exposures across its entire operations and to accrue for potential liabilities based on its interpretation of country-specific tax law and best estimates. In conducting this review management assesses the magnitude of the issue and the likelihood, based on experience and specialist advice, as to whether it will result in a liability for the Group. If this is deemed to be the case then a provision is recognised for the potential taxation charges. More details are given in Notes 7 and 25.
One significant area of management's judgment is in the area of transfer pricing. Whilst the Group employs dedicated members of staff to establish and maintain appropriate transfer pricing structures and documentation, judgment still needs to be applied and hence potential tax exposures can be identified. The Group, as part of its overall assessment of liabilities for taxation, reviews in detail the transfer pricing structures in place and records provisions where this seems appropriate on a case by case basis.
(iii) Consolidation of entities in which the Group holds less than 50% Al Maisan Satellite Communication LLC
Management has concluded that the Group controls Al Maisan Satellite Communication LLC (“Al Maisan”), even though it holds 35% economic interest in this subsidiary, since it has the majority of the voting rights on the Board of Directors of Al Maisan and there is no other entity owning potential voting rights that could question SES' control.
SES has power over relevant activities of Al Maisan, such as budget approval, appointment and removal of the CEO and senior management team as well as the power to appoint or remove the majority of the Board members. The entity is therefore consolidated with a 65% of non-controlling interest.
LuxGovSat S.A. On February 12, 2015, SES and the Luxembourg Government
jointly incorporated the legal entity LuxGovSat S.A. (“LuxGovSat”) as a limited liability company (Société Anonyme) under Luxembourg Law. The Luxembourg Government and SES each equally subscribed for their interest in the equity of the new company.
Management has concluded that the Group controls LuxGovSat S.A. (“LuxGovSat”), as SES has power over relevant activities of LuxGovSat.
SES Government Solutions, Inc. SES Government Solutions, Inc., U.S.A. (“SES GS”) is subject
to specific governance rules and is managed through a Proxy Agreement, which was agreed with the Defense Security Service (“DSS”) (the government entity responsible for the
74 SES Annual Report 2015
protection of information which is shared with industry that is deemed classified or sensitive with respect to the national security of the United States of America) of the U.S. Department of Defense (“DOD”). A proxy agreement is an instrument intended to mitigate the risk of foreign ownership, control or influence when a foreign person acquires or merges with a U.S. entity that has a facility security clearance. A proxy agreement conveys a foreign owner's voting rights to proxy holders, comprising the proxy board. Proxy holders are cleared U.S. citizens approved by the DSS.
The DSS required that SES GS enter into a proxy agreement because it is indirectly owned by SES and SES GS has contracts with the DOD which contain certain classified information. The Proxy Agreement enables SES GS to participate in such contracts with the U.S. Government despite being owned by a non-U.S. corporation.
As a result of the Proxy Agreement, certain limitations are placed on the information which may be shared, and the interaction which may occur, between SES GS and other SES Group companies. The Proxy Holders, besides acting as directors of SES GS, are entitled to vote in the context of a trust relationship with SES on whose basis their activity is performed in the interest of SES's shareholders and of U.S. national security.
The Company's assessment of the allocation of powers over the relevant activities of SES GS encompassed the activities of operating and capital decision making, the appointment and remuneration of key management, and the exposure to the variability of financial returns based on the financial performance of SES GS.
Based on its assessment, the Company concluded that, from an IFRS 10 perspective, SES has and is able to use powers over the relevant activities of SES GS and has an exposure to variable returns from its involvement in SES GS, consistent with an assumption of control.
(iv) Investment in O3b Networks Limited (‘O3b Networks’) Management has assessed the level of influence that the Group
has on O3b Networks and determined that it has significant influence. This is because the Group neither appoints the majority of the Board members of O3b Networks, nor controls a simple majority for shareholder resolutions. Although SES is acting as a consultant to O3b Networks (through some technical and commercial committees), such consultancy role does not provide control over the relevant activities of O3b Networks and there is no “de facto” control over O3b Networks.
Consequently, this investment has been classified as an associate.
2) Estimation uncertaintyThe key assumptions concerning the future and other key sources of estimation uncertainty at the reporting date, that have a significant risk of causing a material adjustment to the carrying amounts of assets and liabilities within the next financial year(s), are described below. The Group based its assumptions and estimates on parameters available when the consolidated financial statements were prepared. Existing circumstances and assumptions about future developments, however, may change due to market changes or circumstances arising beyond the control of the Group. Such changes are reflected in the assumptions when they occur.
(i) Impairment testing for goodwill and other indefinite-life intangible assets
The Group determines whether goodwill and other indefinite-life intangible assets are impaired at least on an annual basis.
This requires an estimation of the value in use of the cash-generating units to which the goodwill and other indefinite-life intangible assets are allocated. Establishing the value in use requires the Group to make an estimate of the expected future pre-tax cash flows from the cash-generating unit and also to choose a suitable pre-tax discount rate and terminal growth rate in order to calculate the present value of those cash flows. More details are given in Note 14.
(ii) Impairment testing for space segment assets As described above the Group assesses at each reporting date
whether there is any indicator that an asset may be impaired. If any such indication exists, or when annual impairment testing for an asset is required, the Group determines an estimate of the recoverable amount. This requires an estimation of the value in use of the assets to ensure that this exceeds the carrying amount included in the consolidated financial statements. As far as this affects the Group's satellite assets, this estimation of the value in use requires estimations not only concerning the commercial revenues to be generated by each satellite, but also the impact of past in-orbit anomalies and their potential impact on the satellite’s ability to provide its expected commercial service.
Reflecting continuing solar array circuit health issues on the AMC-16 satellite, the Group has taken an impairment charge on this satellite of EUR 9.7 million in the year with the depreciation life of the satellite also being shortened prospectively from January 2016. As at December 31, 2014, an impairment charge of EUR 6.7 million was recorded on AMC-15.
BUSINESS COMBINATIONSBusiness combinations are accounted for using the acquisition method. The cost of an acquisition is measured as the aggregate of the consideration transferred, measured at acquisition date fair value and the amount of any non-controlling interest in the acquiree. For each business combination, the acquirer measures the non-controlling interest in the acquiree either at fair value or
Notes to the consolidated financial statementsDecember 31, 2015
INTRODUCTION GLOBALISATION VERTICALISATION SOCIETYINNOVATION CORPORATE GOVERNANCE
FINANCIAL REVIEW
FINANCIAL STATEMENTS
SES ANNUAL ACCOUNTS
75SES Annual Report 2015
at the proportionate share of the acquiree’s identifiable net assets. Acquisition costs incurred are expensed and included in other operating expenses.
When the Group acquires a business, it assesses the financial assets acquired and liabilities assumed for appropriate classification and designation in accordance with the contractual terms, economic circumstances and pertinent conditions as at the acquisition date. This includes the separation of embedded derivatives in host contracts by the acquiree. Assets acquired and liabilities assumed are recognized at fair value.
If the business combination is achieved in stages, the acquisition date carrying value of the acquirer’s previously held equity interest in the acquiree is remeasured to fair value at the acquisition date through profit or loss. Any contingent consideration to be transferred by the acquirer will be recognised at fair value at the acquisition date. Subsequent changes to the fair value of the contingent consideration which is deemed to be an asset or a liability will be recognised in accordance with IAS 39 in profit or loss. If the contingent consideration is classified as equity, it should not be remeasured until it is finally settled within equity.
PROPERTY, PLANT AND EQUIPMENTProperty, plant and equipment is initially recorded at acquisition or manufacturing cost, which for satellites includes the launcher cost and launch insurance, and is depreciated over the expected useful life. Other than in respect of supplier credits for delayed delivery of satellites, which are set off against the base cost of the satellite concerned, the financial impact of changes resulting from revisions to management's estimate of the cost of the property, plant and equipment is taken to the consolidated income statement of the period concerned.
Costs for the repair and maintenance of these assets are recorded as an expense.
Property, plant and equipment is depreciated using the straight-line method, generally based on the following useful lives:
Buildings 25 yearsSpace segment assets 10 to 19.5 yearsGround segment assets 3 to 15 yearsOther fixtures, fittings, tools and equipment 3 to 15 years
An item of property, plant and equipment is derecognised upon disposal or when no future economic benefits are expected from its use or disposal. Any loss or gain arising on derecognition of the asset is included in the profit and loss account in the year the asset is derecognised.
The residual values, useful lives and methods of depreciation of property, plant and equipment are reviewed at each financial year end and adjusted where necessary.
ASSETS IN THE COURSE OF CONSTRUCTIONThis caption includes satellites which are under construction. Incremental costs directly attributable to the purchase of satellites, including launch costs and other related expenses such as ground equipment and borrowing costs, are capitalised in the statement of financial position.
The cost of satellite construction may include an element of deferred consideration to satellite manufacturers referred to as satellite performance incentives. SES is contractually obligated to make these payments over the lives of the satellites, provided the satellites continue to operate in accordance with contractual specifications. Historically, the satellite manufacturers have earned substantially all of these payments. Therefore, SES accounts for these payments as deferred financing, capitalising the present value of the payments as part of the cost of the satellites and recording a corresponding liability to the satellite manufacturers. Interest expense is recognized on the deferred financing and the liability is accreted based on the passage of time and reduced as the payments are made.
Once the asset is subsequently put into service and operates in the manner intended by management, the expenditure is transferred to assets in use and depreciation commences.
BORROWING COSTSBorrowing costs that are directly attributable to the construction or production of a qualifying asset are capitalised as part of the cost of that asset. All other borrowing costs are recognised as an expense in the period in which they are incurred.
INTANGIBLE ASSETS1) GoodwillGoodwill is initially measured at cost, being the excess of the aggregate of the consideration transferred and the amount recognised for non-controlling interest over the net identifiable assets acquired and liabilities assumed. If this consideration is lower than the fair value of the net assets of the subsidiary acquired, the difference is recognised as income in the consolidated income statement.
After initial recognition, goodwill is measured at cost less any accumulated impairment losses. For the purpose of impairment testing, goodwill, from the acquisition date, is allocated to each of the Group’s cash-generating units that are expected to benefit from the combination, irrespective of whether other assets or liabilities of the acquiree are assigned to those units.
The carrying value of acquisition goodwill is reviewed for impairment annually, or more frequently if required to establish whether the value is still recoverable. The recoverable amount is defined as the higher of fair value less costs to sell and value in use. Impairment charges are recorded in the consolidated income statement. Impairment losses relating to goodwill cannot be reversed in future periods. The Group estimates value in use on the basis of the estimated discounted cash flows to be generated by a

76 SES Annual Report 2015
cash-generating unit which are based upon business plans approved by management. Beyond a five-year period, cash flows may be estimated on the basis of stable rates of growth or decline.
Where goodwill forms part of a cash-generating unit and part of the operation within that unit is disposed of, the goodwill associated with the operation disposed of is included in the carrying amount of the operation when determining the gain or loss on disposal of the operation. Goodwill disposed of in this circumstance is measured based on the relative values of the operation disposed of and the portion of the cash-generating unit retained.
2) Other intangibles(i) Orbital rights Intangible assets consist principally of rights of usage of orbital
frequencies and acquired transponder service agreements. The Group is authorized by governments to operate satellites at certain orbital locations. Governments acquire rights to these orbital locations through filings made with the International Telecommunication Union (“ITU”), a sub-organization of the United Nations. The Group will continue to have rights to operate at its orbital locations so long as it maintains its authorisations to do so. Those rights are reviewed at acquisition to establish whether they represent assets with a definite or indefinite life. Those assessed as being definite life assets are amortised on a straight-line basis over their estimated useful life not exceeding 21 years. Indefinite-life intangible assets are held at cost in the statement of financial position and are subject to impairment testing in line with the treatment outlined for goodwill above. The useful life of an intangible asset with an indefinite life is reviewed annually to determine whether indefinite life assessment continues to be supportable. If not, the change in the useful life assessment from indefinite to finite is made on a prospective basis. Orbital rights acquired for a non-cash consideration are initially measured at the fair value of the consideration given.
(ii) Software and development costs Costs associated with maintaining computer software
programmes are recognised as an expense as incurred. Development costs that are directly attributable to the design and testing of identifiable and unique software products controlled by the Group are recognised as intangible assets when the following criteria are met:
← it is technically feasible to complete the software product so that it will be available for use; ← management intends to complete the software product and use or sell it; ← there is an ability to use or sell the software product; ← it can be demonstrated how the software product will generate probable future economic benefits; ← adequate technical, financial and other resources to complete the development and to use or sell the software
product are available; and ← the expenditure attributable to the software product during its development can be reliably measured.
Directly attributable costs that are capitalised as part of the software product include the software development employee costs and an appropriate portion of relevant overheads.
Other development expenditures that do not meet these criteria are recognised as an expense as incurred. Development costs previously recognised as an expense are not recognised as an asset in a subsequent period.
Computer software development costs recognised as assets are amortised over their estimated useful life, which does not exceed seven years.
IMPAIRMENT OF OTHER NON-FINANCIAL ASSETSThe Group assesses at each reporting date whether there is an indication that an asset may be impaired. If any such indication exists, or when annual impairment testing for an asset is required, the Group makes an estimate of the recoverable amount.
The Group’s long-lived assets and definite-life intangible assets, including its in-service satellite fleet, are reviewed for impairment whenever events or changes in circumstances indicate that the carrying amount of such assets may not be recoverable. Impairments can arise from complete or partial failure of a satellite as well as other changes in expected discounted future cash flows. Such impairment tests are based on a recoverable value determined using estimated future cash flows and an appropriate discount rate. The estimated cash flows are based on the most recent business plans. If an impairment is identified, the carrying value will be written down to its recoverable amount.
INVESTMENTS AND OTHER FINANCIAL ASSETSFinancial assets in the scope of IAS 39 are classified as one of:
← financial assets at fair value through profit or loss; ← loans and receivables; ← held-to-maturity investments; or, ← available-for-sale financial assets.
When financial assets are recognised initially, they are measured at fair value, plus, in the case of investments not at fair value through profit or loss, directly attributable transaction costs. The Group determines the classification of its financial assets after initial recognition and, where allowed and appropriate, re-evaluates this designation at each financial year end.
All regular purchases and sales of financial assets are recognised on the trade date, that is to say the date that the Group is committed to the purchase or sale of the asset.
Notes to the consolidated financial statementsDecember 31, 2015
INTRODUCTION GLOBALISATION VERTICALISATION SOCIETYINNOVATION CORPORATE GOVERNANCE
FINANCIAL REVIEW
FINANCIAL STATEMENTS
SES ANNUAL ACCOUNTS
77SES Annual Report 2015
The following categories of financial asset as defined in IAS 39 are relevant in the Group’s financial statements.
1) Financial assets at fair value through profit or lossFinancial assets classified as held for trading are included in the category “financial assets at fair value through profit or loss”. Financial assets are classified as held for trading if they are acquired for the purpose of selling in the near term. Derivatives are also classified as held for trading unless they are designated and effective hedging instruments. Gains or losses on investments held for trading are recognised in the consolidated income statement.
2) Loans and receivablesLoans and receivables are non-derivative financial assets with fixed or determinable payments that are not quoted in an active market. Such assets are carried at amortised cost using the effective interest method. Gains and losses are recognised in the consolidated income statement when the loans and receivables are derecognised or impaired, as well as through the amortisation process.
IMPAIRMENT OF FINANCIAL ASSETS CARRIED AT AMOR-TISED COSTThe Group assesses at the end of each reporting period whether there is objective evidence that a financial asset or group of financial assets is impaired. A financial asset or a group of financial assets is impaired and impairment losses are incurred only if there is objective evidence of impairment as a result of one or more events that occurred after the initial recognition of the asset (a “loss event”) and that this loss event (or events) has an impact on the estimated future cash flows of the financial asset or group of financial assets that can be reliably estimated.
Evidence of impairment may include indications that a specific debtor or a group of debtors is experiencing significant financial difficulty, default or delinquency in servicing interest or principal payments. For example, where there are indicators that the debtor may enter bankruptcy or other financial reorganisation.
For “loans and receivables”, the amount of the loss is measured as the difference between the asset’s carrying amount and the present value of estimated future cash flows (excluding future credit losses that have not been incurred) discounted at the financial asset’s original effective interest rate. The carrying amount of the asset is reduced and the amount of the loss is recognised in the consolidated income statement. If a loan or held-to-maturity investment has a variable interest rate, the discount rate for measuring any impairment loss is the current effective interest rate determined under the contract. As a practical expedient, the Group may measure impairment on the basis of an instrument’s fair value using an observable market price.
If, in a subsequent period, the amount of the impairment loss decreases and the decrease can be related objectively to an event occurring after the impairment was recognised (such as
an improvement in the debtor’s credit rating), the reversal of the previously recognised impairment loss is recognised in the consolidated income statement.
INVENTORIESInventories primarily consist of equipment held for re-sale, work-in-progress, related accessories and network equipment spares and are stated at the lower of cost or net realisable value, with cost determined on a weighted average-cost method.
TRADE AND OTHER RECEIVABLESTrade receivables are recognised initially at fair value and subsequently measured at amortised cost using the effective interest method, less provision for impairment. Provisions are recognised when there is objective evidence that the Group will not be able to collect the debts. The Group evaluates the credit risk of its customers on an ongoing basis, classifying them into three categories: prime, market and sub-prime.
TREASURY SHARESTreasury shares are mostly acquired by the Group in connection with share-based compensation plans, and are presented as a set off to equity in the consolidated statement of financial position. Gains and losses on the purchase, sale, issue or cancellation of treasury shares are not recognised in the consolidated income statement, but in the equity.
CASH AND CASH EQUIVALENTSCash and cash equivalents comprise cash at banks and on hand, deposits and short-term, highly liquid investments readily convertible to known amounts of cash and subject to insignificant risk of changes in value. Cash on hand and in banks and short-term deposits which are held to maturity are carried at fair value.
REVENUE RECOGNITIONThe Group generates its revenues through two complementary channels:
← the direct commercialisation to customers of its extensive satellite assets and ground network, which is what the Group refers to as its “Infrastructure” operations; and, ← the provision of satellite-related products and services which are designed to generate additional markets for capacity on the satellite fleet (for example through the provision of digital platform services and retail two-way internet broadband access offerings) or to separately monetise skills and assets available in the Infrastructure operations, such as through the provision of engineering services. This is what the Group refers to as its “Services” business.
In the Infrastructure operations, revenues are generated predominantly from customer service agreements for the provision of satellite capacity over agreed periods by station-kept satellites at the Group’s primary orbital positions. The Group also includes as Infrastructure revenue income received from the following type

78 SES Annual Report 2015
Notes to the consolidated financial statementsDecember 31, 2015
of services: revenues arising under operating leases; occasional use revenues; uplinking and downlinking operations; income received in connection with satellite interim missions; and, proceeds from the sale of transponders if the revenue recognition criteria for the transaction are met. Other income received in connection with settlements under insurance claims or disputes with satellite manufactures are also included as part of revenue due to their relative insignificance.
All amounts received from customers under service agreements or operating lease contracts for satellite capacity are recognised on a straight-line basis at the fair value of the consideration received or receivable over the duration of the respective contracts - including any free-of-charge periods which may be included in the contract. Occasional use revenues, uplinking and downlinking revenues and interim mission revenues are recognised in the period that the service is delivered. The proceeds of transponder sales are recognised in the period of the transaction. Income received in connection with insurance and legal settlements are recognised in the period when they become receivable by the Group
Customer payments received in advance of the provision of service are recorded as deferred income in the statement of financial position, and for significant advance payments, interest is accrued on the amount received at the effective interest rate at the time of receipt. The unbilled portion of recognised revenues is disclosed within “Trade and other receivables”, allocated between current and non-current as appropriate.
Where satellite transponder services are provided in exchange for dissimilar goods and services, the revenue is measured at the fair value of the goods or services received where these can be reliably measured, otherwise at the fair value of the goods or services given up, adjusted by the amount of any cash or cash equivalents received.
Concerning revenue recognition in the Services operations, and specifically in the area of engineering services, the Group applies a percentage of completion analysis to allocate revenue arising on long-term construction contracts appropriately between the accounting periods concerned assuming the outcome can be estimated reliably.
DIVIDENDSThe Company declares dividends after the financial statements for the year have been approved. Accordingly dividends are recorded in the subsequent year’s financial statements.
PROVISIONSProvisions are recognised when the Group has a present legal or constructive obligation as a result of a past event and it is probable that an outflow of resources embodying economic benefits will be required to settle the obligation and the amount can be reliably estimated.
BORROWINGSBorrowings are recognised initially at fair value, net of transaction costs incurred. Borrowings are subsequently carried at amortised cost; any difference between the proceeds (net of transaction costs) and the redemption value is recognised in the consolidated income statement over the period of the borrowings using the effective interest method.
Fees paid on the establishment of loan facilities are recognised as transaction costs of the loan to the extent that it is probable that some or all of the facility will be drawn down. In this case, the fee is deferred until the draw-down occurs.
CURRENT TAXESCurrent tax assets and liabilities for current and prior periods are measured at the amount expected to be recovered from, or paid to, the taxation authorities. The tax rates and tax laws used to compute the amount are those that are enacted, or substantively enacted, at the reporting date.
DEFERRED TAXESDeferred tax is determined using the liability method on temporary differences at the reporting date between the tax bases of assets and liabilities and their carrying amounts for financial reporting purposes.
Deferred tax liabilities are recognised for all taxable temporary differences, except:
← where the deferred tax liability arises from the initial recognition of goodwill or of an asset or liability in a transaction that is not a business combination and, at the time of the transaction, affects neither the accounting profit nor taxable profit or loss; and ← in respect of taxable temporary differences associated with investments in subsidiaries where the timing of the reversal of the temporary differences can be controlled and it is probable that the temporary differences will not reverse in the foreseeable future.
Deferred tax assets are recognised for all deductible temporary differences, carry-forward of unused tax credits and unused tax losses, to the extent that it is probable that taxable profit will be available against which the deductible temporary differences, and the carry-forward of unused tax credits and unused tax losses can be utilised except:
← where the deferred tax asset relating to the deductible temporary difference arises from the initial recognition of an asset or liability in a transaction that is not a business combination and, at the time of the transaction, affects neither the accounting profit nor taxable profit or loss; and ← in respect of deductible temporary differences associated with investments in subsidiaries, deferred tax assets are recognised only to the extent that it is probable that the temporary differences will reverse in the foreseeable future and taxable
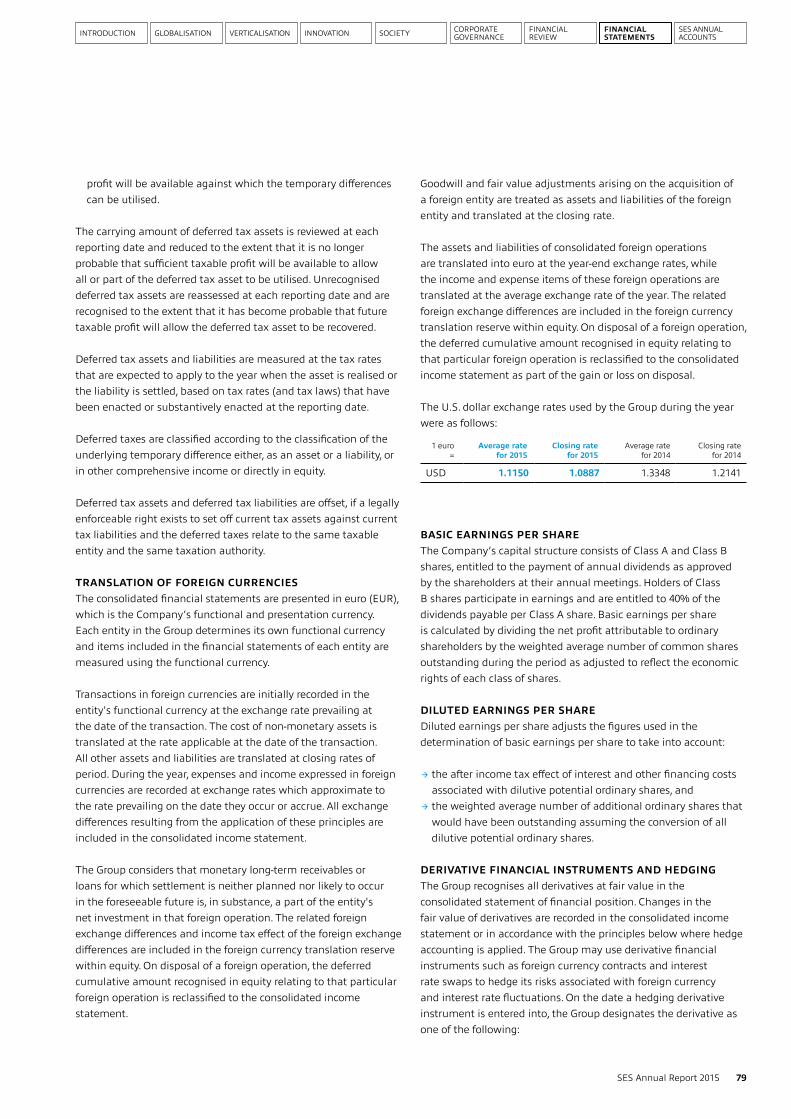
INTRODUCTION GLOBALISATION VERTICALISATION SOCIETYINNOVATION CORPORATE GOVERNANCE
FINANCIAL REVIEW
FINANCIAL STATEMENTS
SES ANNUAL ACCOUNTS
79SES Annual Report 2015
profit will be available against which the temporary differences can be utilised.
The carrying amount of deferred tax assets is reviewed at each reporting date and reduced to the extent that it is no longer probable that sufficient taxable profit will be available to allow all or part of the deferred tax asset to be utilised. Unrecognised deferred tax assets are reassessed at each reporting date and are recognised to the extent that it has become probable that future taxable profit will allow the deferred tax asset to be recovered.
Deferred tax assets and liabilities are measured at the tax rates that are expected to apply to the year when the asset is realised or the liability is settled, based on tax rates (and tax laws) that have been enacted or substantively enacted at the reporting date.
Deferred taxes are classified according to the classification of the underlying temporary difference either, as an asset or a liability, or in other comprehensive income or directly in equity.
Deferred tax assets and deferred tax liabilities are offset, if a legally enforceable right exists to set off current tax assets against current tax liabilities and the deferred taxes relate to the same taxable entity and the same taxation authority.
TRANSLATION OF FOREIGN CURRENCIESThe consolidated financial statements are presented in euro (EUR), which is the Company’s functional and presentation currency. Each entity in the Group determines its own functional currency and items included in the financial statements of each entity are measured using the functional currency.
Transactions in foreign currencies are initially recorded in the entity's functional currency at the exchange rate prevailing at the date of the transaction. The cost of non-monetary assets is translated at the rate applicable at the date of the transaction. All other assets and liabilities are translated at closing rates of period. During the year, expenses and income expressed in foreign currencies are recorded at exchange rates which approximate to the rate prevailing on the date they occur or accrue. All exchange differences resulting from the application of these principles are included in the consolidated income statement.
The Group considers that monetary long-term receivables or loans for which settlement is neither planned nor likely to occur in the foreseeable future is, in substance, a part of the entity's net investment in that foreign operation. The related foreign exchange differences and income tax effect of the foreign exchange differences are included in the foreign currency translation reserve within equity. On disposal of a foreign operation, the deferred cumulative amount recognised in equity relating to that particular foreign operation is reclassified to the consolidated income statement.
Goodwill and fair value adjustments arising on the acquisition of a foreign entity are treated as assets and liabilities of the foreign entity and translated at the closing rate.
The assets and liabilities of consolidated foreign operations are translated into euro at the year-end exchange rates, while the income and expense items of these foreign operations are translated at the average exchange rate of the year. The related foreign exchange differences are included in the foreign currency translation reserve within equity. On disposal of a foreign operation, the deferred cumulative amount recognised in equity relating to that particular foreign operation is reclassified to the consolidated income statement as part of the gain or loss on disposal.
The U.S. dollar exchange rates used by the Group during the year were as follows:
BASIC EARNINGS PER SHAREThe Company’s capital structure consists of Class A and Class B shares, entitled to the payment of annual dividends as approved by the shareholders at their annual meetings. Holders of Class B shares participate in earnings and are entitled to 40% of the dividends payable per Class A share. Basic earnings per share is calculated by dividing the net profit attributable to ordinary shareholders by the weighted average number of common shares outstanding during the period as adjusted to reflect the economic rights of each class of shares.
DILUTED EARNINGS PER SHAREDiluted earnings per share adjusts the figures used in the determination of basic earnings per share to take into account:
← the after income tax effect of interest and other financing costs associated with dilutive potential ordinary shares, and ← the weighted average number of additional ordinary shares that would have been outstanding assuming the conversion of all dilutive potential ordinary shares.
DERIVATIVE FINANCIAL INSTRUMENTS AND HEDGINGThe Group recognises all derivatives at fair value in the consolidated statement of financial position. Changes in the fair value of derivatives are recorded in the consolidated income statement or in accordance with the principles below where hedge accounting is applied. The Group may use derivative financial instruments such as foreign currency contracts and interest rate swaps to hedge its risks associated with foreign currency and interest rate fluctuations. On the date a hedging derivative instrument is entered into, the Group designates the derivative as one of the following:
1 euro =
Average rate for 2015
Closing rate for 2015
Average rate for 2014
Closing rate for 2014
USD 1.1150 1.0887 1.3348 1.2141
80 SES Annual Report 2015
Notes to the consolidated financial statementsDecember 31, 2015
Hedges which meet the criteria for hedge accounting are accounted for as follows:
1) Fair value hedgesChanges in the fair value of derivatives that are designated and qualify as fair value hedges are recorded in the consolidated income statement, together with any changes in the fair value of the hedged asset or liability that are attributable to the hedged risk. The group only applies fair value hedge accounting for hedging fixed interest risk on borrowings.
2) Cash flow hedgesIn relation to cash flow hedges (forward foreign currency contracts and interest rate swaps on floating-rate debt) - to hedge firm commitments or forecasted transactions, the portion of the gain or loss on the hedging instrument that is determined to be an effective hedge is recognised directly in equity as other comprehensive income and the ineffective portion is recognised in the income statement as finance income or cost. When the hedged commitment results in the recognition of an asset or a liability, then, at the time the asset or liability is recognised, the associated gains or losses that had previously been recognised in equity are included in the initial measurement of the acquisition cost or carrying amount of the asset or liability.
3) Hedge of a net investment in a foreign operationChanges in the fair value of a derivative or non-derivative instrument that is designated as a hedge of a net investment are recorded in the foreign currency translation reserve within equity to the extent that it is deemed to be an effective hedge. The ineffective portion is recognised in the consolidated income statement as finance income or cost.
Hedge accounting is discontinued when the hedging instrument expires or is sold, terminated or exercised, the hedge no longer qualifies for hedge accounting, or the Group revokes the designation. At that point in time, any cumulative gain or loss on the hedging instrument recognised in equity is kept in equity until the forecasted transaction occurs. If a hedged transaction is no longer expected to occur, the net cumulative gain or loss recognised in equity is transferred to net profit or loss for the period.
The Group formally documents all relationships between hedging instruments and hedged items, as well as its risk-management objective and strategy for undertaking various hedge transactions. This process includes allocating all derivatives that are designated as fair value hedges, cash flow hedges or net investment hedges to specific assets and liabilities in the statement of financial position or to specific firm commitments or forecasted transactions. The Group also formally assesses both at the inception of the hedge and on an ongoing basis, whether each derivative is highly effective in offsetting changes in fair values or cash flows of the hedged item. If it is determined that a derivative is not highly effective as a hedge, or if a derivative ceases to be a highly effective
hedge, the Group will discontinue hedge accounting prospectively. The ineffective portion of hedge is recognised in profit or loss.
DERECOGNITION OF FINANCIAL ASSETS AND LIABILITIES1) Financial assetsA financial asset is derecognised where:
← the right to receive cash flows from the asset has expired; ← the Group retains the right to receive cash flows from the asset, but has assumed an obligation to pay them in full without material delay to a third party under a ‘pass- through’ arrangement; or ← the Group has transferred its rights to receive cash flows from the asset and eithera) has transferred substantially all the risks and rewards of the
asset, or b) has neither transferred nor retained substantially all the risks
and rewards of the asset, but has transferred control of that asset.
Where the Group has transferred its rights to receive cash flows from an asset and has neither transferred nor retained substantially all the risks and rewards of the asset nor transferred control of the asset, the asset continues to be recognised to the extent of the Group’s continuing involvement in it. Continuing involvement that takes the form of a guarantee over the transferred asset is measured at the lower of the original carrying amount of the asset and the maximum amount of the consideration that the Group could be required to repay.
Where continuing involvement takes the form of a written and/or purchased option (including cash-settled options or similar provision) on the transferred asset, the extent of the Group’s continuing involvement is the amount of the transferred asset that the Group may repurchase, except that in the case of a written put option (including a cash-settled option or similar provision) on an asset measured at fair value, the extent of the Group’s continuing involvement is limited to the lower of the fair value of the transferred asset and the option exercise price.
OFFSETTING FINANCIAL INSTRUMENTSFinancial assets and liabilities are offset and the net amount reported in the balance sheet when there is a legally enforceable right to offset the recognized amounts and there is an intention to settle on a net basis or realize the asset and settle the liability simultaneously. The legally enforceable right must not be contingent on future events and must be enforceable in the normal course of business and in the event of default, insolvency or bankruptcy of the company or the counterparty.
2) Financial liabilitiesA financial liability is derecognised when the obligation under the liability is discharged, cancelled or expired. Where an existing financial liability is replaced by another from the same lender on substantially different terms, or the terms of an existing liability are
INTRODUCTION GLOBALISATION VERTICALISATION SOCIETYINNOVATION CORPORATE GOVERNANCE
FINANCIAL REVIEW
FINANCIAL STATEMENTS
SES ANNUAL ACCOUNTS
81SES Annual Report 2015
substantially modified, such an exchange or modification is treated as a derecognition of the original liability and the recognition of a new liability, and the difference in the respective carrying amount is recognised in profit or loss.
ACCOUNTING FOR PENSION OBLIGATIONSThe Company and certain subsidiaries operate defined benefit pension plans and/or defined contribution plans.
A defined contribution plan is a pension plan under which the Group pays fixed contributions into a separate entity. The Group has no legal or constructive obligations to pay further contributions if the fund does not hold sufficient assets to pay all employees the benefits relating to employee service in the current and prior periods. A defined benefit plan is a pension plan that is not a defined contribution plan.
Typically defined benefit plans define an amount of pension benefit that an employee will receive on retirement, usually dependent on one or more factors such as age, years of service and compensation.
The liability recognised in the balance sheet in respect of defined benefit pension plans is the present value of the defined benefit obligation at the end of the reporting period less the fair value of plan assets. The defined benefit obligation is calculated annually by independent actuaries using the projected unit credit method. The present value of the defined benefit obligation is determined by discounting the estimated future cash outflows using interest rates of high-quality corporate bonds that are denominated in the currency in which the benefits will be paid, and that have terms to maturity approximating to the terms of the related pension obligation. Actuarial gains and losses arising from experience adjustments and changes in actuarial assumptions are charged or credited to equity in other comprehensive income in the period in which they arise.
Past-service costs are recognised immediately in the consolidated income statement.
For defined contribution plans, the Group pays contributions to publicly or privately administered pension insurance plans on a mandatory, contractual or voluntary basis. The Group has no further payment obligations once the contributions have been paid. The contributions are recognised as employee benefit expense when they are due. Prepaid contributions are recognised as an asset to the extent that a cash refund or a reduction in the future payments is available.
EQUITY-SETTLED SHARE-BASED COMPENSATION PLANSEmployees (including senior executives) of the Group receive remuneration in the form of share-based compensation transactions, whereby employees render services as consideration for equity instruments (“equity-settled transactions”). The cost of equity-settled transactions is measured by reference to the
fair value at the date on which they are granted. The fair value is determined by an external valuer using a binomial model for the Stock Appreciation Rights Plan (“STAR Plan”) and Executive Incentive Compensation Plan (“EICP Plan”). A Black Scholes Model for Long-term Incentive Programme (“LTI”). Further details are given in Note 23. In valuing equity-settled transactions, no account is taken of any non-market performance conditions, other than conditions linked to the price of the Company’s shares, if applicable.
The cost of equity-settled transactions is recognised, together with a corresponding increase in equity, over the period in which the performance and/or service conditions are fulfilled, ending on the date on which the relevant employees become fully entitled to the award (the vesting date). The cumulative expense recognised for equity-settled transactions at each reporting date until the vesting date reflects the extent to which the vesting period has expired and the Group’s best estimate of the number of equity instruments that will ultimately vest. The consolidated income statement charge or credit for a period represents the movement in cumulative expense recognised as at the beginning and end of that period. No expense is recognised for awards that do not ultimately vest.
The dilutive effect of outstanding options is reflected as additional share dilution in the computation of earnings per share (see Note 10).
LEASESThe determination of whether an arrangement is, or contains a lease is based on the substance of the arrangement at inception date of whether the fulfilment of the arrangement is dependent on the use of a specific asset or assets or the arrangement conveys a right to use the asset.
Finance leases, which transfer to the Group substantially all risks and rewards incidental to ownership of the leased item, are capitalised at the inception of the lease at the fair market value of the leased item or, if lower, at the present value of the minimum lease payments. Lease payments are apportioned between the finance charges and reduction of the lease liability so as to achieve a constant rate of interest on the remaining balance of the liability. Finance costs are charged directly to expense. Capitalised leased assets are depreciated over the shorter of the estimated useful life of the asset or the lease term.
Leases where the lessor retains substantially all the risks and benefits of ownership of the asset are classified as operating leases. Operating lease payments are recognised as an expense in the consolidated income statement on a straight-line basis over the lease term.
NEW STANDARDS AND INTERPRETATIONS NOT YET ADOPTEDA number of new standards and amendments to standards and interpretations are relevant for the Group and effective for annual periods beginning after January 1, 2015, and have not been early adopted in preparing these consolidated financial statements:

In millions of euros 2015 Constant FX 2014
Change Favourable + /
Adverse
Revenue 2,014.5 2,081.3 -3.2%
Operating expenses (520.3) (530.5) +1.9%
EBITDA 1,494.2 1,550.8 -3.6%
EBITDA margin (%) 74.2% 74.5% -0.3% pts
Depreciation (536.8) (551.4) +2.6%
Amortisation (62.8) (55.5) -13.3%
Operating profit 894.6 943.9 -5.2%
82 SES Annual Report 2015
Notes to the consolidated financial statementsDecember 31, 2015
1) IFRS 9 Financial instrumentsIFRS 9, “Financial instruments”, addresses the classification, measurement and recognition of financial assets and financial liabilities. The complete version of IFRS 9 was issued in July 2014. It replaces the guidance in IAS 39 that relates to the classification and measurement of financial instruments. IFRS 9 retains but simplifies the mixed measurement model and establishes three primary measurement categories for financial assets: amortised cost, fair value through Other Comprehensive Income and fair value through profit or loss. The basis of classification depends on the entity’s business model and the contractual cash flow characteristics of the financial asset. Investments in equity instruments are required to be measured at fair value through profit or loss with the irrevocable option at inception to present changes in fair value in Other Comprehensive Income not recycling. There is now a new expected credit losses model that replaces the incurred loss impairment model used in IAS 39. For financial liabilities there were no changes to classification and measurement except for the recognition of changes in own credit risk in other comprehensive income, for liabilities designated at fair value through profit or loss. IFRS 9 relaxes the requirements for hedge effectiveness by replacing the bright line hedge effectiveness tests. It requires an economic relationship between the hedged item and hedging instrument and for the “hedged ratio” to be the same as the one management actually use for risk management purposes. Contemporaneous documentation is still required but is different to that currently prepared under IAS 39. The standard is effective for accounting periods beginning on or after January 1, 2018. This standard has not yet been endorsed by the European Union. Early adoption is permitted. The Group is yet to assess IFRS 9’s full impact.
2) IFRS 15 Revenue from contracts with customersIFRS 15, “Revenue from contracts with customers” deals with revenue recognition and establishes principles for reporting useful information to users of financial statements about the nature, amount, timing and uncertainty of revenue and cash flows arising from an entity’s contracts with customers. Revenue is recognised when a customer obtains control of a good or service and thus has the ability to direct the use and obtain the benefits from the good or service. The standard replaces IAS 18 “Revenue” and IAS 11 ‘Construction contracts’ and related interpretations. The standard
is effective for annual periods beginning on or after January 1, 2018 and earlier application is permitted. This standard has not yet been endorsed by the European Union. The Group performed a detailed assessment of the impact of IFRS 15 and concluded that the adoption of the standard will not have a material impact on the Group's consolidated financial statements.
There are no other IFRSs or IFRIC interpretations that are not yet effective that would be expected to have a material impact on the Group.
NOTE 3 - OPERATING SEGMENT
The Group does business in one operating segment, namely the provision of satellite-based data transmission capacity, and ancillary services, to customers around the world.
The Executive Committee, which is the chief operating decision-making committee in the Group’s corporate governance structure, reviews the Group’s financial reporting and generates those proposals for the allocation of the Group's resources which are submitted for validation to the Board of Directors. The main sources of financial information used by the Executive Committee in assessing the Group’s performance and allocating resources are:
← Analyses of Group revenues including the allocation of revenues between the geographical downlink regions; ← Overall Group profitability development at the operating and non-operating level; ← Internal and external analysis of expected future developments in the markets into which capacity is being delivered and of the commercial landscape applying to those markets.
When analysing the performance of the operating segment the comparative prior year figures are recomputed using the exchange rates applying for each month in the current period. These prior year figures are being presented at “constant FX”.
The segment's financial results for 2015 and 2014 are set out below.

INTRODUCTION GLOBALISATION VERTICALISATION SOCIETYINNOVATION CORPORATE GOVERNANCE
FINANCIAL REVIEW
FINANCIAL STATEMENTS
SES ANNUAL ACCOUNTS
In millions of euros 2014 Constant FX 2013
Change Favourable + /
Adverse -
Revenue 1,919.1 1,844.9 +4.0%
Operating expenses (491.1) (485.0) -1.3%
EBITDA 1,428.0 1,359.9 +5.0%
EBITDA margin (%) 74.4% 73.7% +0.7% pts
Depreciation (491.6) (464.0) -5.9%
Amortisation (53.8) (48.0) -12.1%
Operating profit 882.6 847.9 +4.1%
In millions of euros 2015 2014
Change Favourable +/
Adverse –
Europe 1,034.5 1,016.8 +1.7%
North America 389.5 406.8 -4.3%
International 590.5 657.7 -10.2%
Total 2,014.5 2,081.3 -3.2%
2015 In millions of euros Infrastructure Services Elim./unalloc. Total
Revenue 1,727.3 526.3 (239.1) 2,014.5
2014 In millions of euros Infrastructure Services Elim./unalloc. Total
Revenue 1,643.3 455.7 (179.9) 1,919.1
In millions of euros 2015 2014
Luxembourg (SES country of domicile) 42.1 38.4
United States of America 555.0 489.4
Germany 403.3 397.3
United Kingdom 306.5 294.9
France 140.3 153.0
Others 567.3 546.1
Total 2,014.5 1,919.1
83SES Annual Report 2015
At constant FX, the revenue allocated to the relevant downlink region developed as follows:
The Group's revenues from external customers is also analysed between the Infrastructure and Services elements. Sales between
the two, mainly sales of Infrastructure capacity to Services businesses, are eliminated on consolidation.
The Group’s revenues from external customers analysed by country using the customer’s billing address is as follows:
No single customer accounted for 10% or more of total revenue in 2015 or 2014.

In millions of euros 2015 2014
Costs associated with European Services business (84.0) (92.7)
Rental of third-party satellite capacity (37.7) (39.3)
Customer support costs (20.2) (13.4)
Other cost of sales (41.7) (28.1)
Total cost of sales (183.6) (173.5)
In millions of euros 2015 2014
Fees for statutory audit of annual and consolidated accounts 1.7 1.5
Fees charged for other assurance services 0.2 0.2
Fees charged for tax services 0.5 0.4
Fees charged for other non-audit services 0.1 0.2
Total audit and non-audit fees 2.5 2.3
In millions of euros 2015 2014
Luxembourg (SES country of domicile) 2,414.6 2,432.3
United States of America 2,937.3 2,760.3
The Netherlands 1,565.7 1,381.4
Isle of Man 1,431.2 1,145.4
Sweden 238.9 250.0
Others 358.8 364.3
Total 8,946.5 8,333.7
84 SES Annual Report 2015
Notes to the consolidated financial statementsDecember 31, 2015
The Group’s property, plant and equipment and intangible assets are located as set out in the following table. Note that satellites are allocated to the country where the legal owner of the asset is
incorporated. Similarly, orbital slot rights and goodwill balances are allocated to the attributable subsidiary.
NOTE 4 - OPERATING EXPENSES
The operating expense categories disclosed include the following types of expenditure:
1) Cost of sales (excluding staff costs and depreciation) represents cost categories which generally vary directly with revenue. Such costs include the rental of third-party satellite capacity, customer support costs, such as uplinking and monitoring, and other cost of sales which include the cost of equipment rental or purchased for integration and resale, largely as part of SES Services offerings.
2) Staff costs in the amount of EUR 200.5 million (2014: EUR 194.5 million) include gross salaries and employer’s social security payments, payments into pension schemes for employees, and charges arising under share-based payment schemes. At the year end the total full-time equivalent members of staff is 1,314 (2014: 1,237).
3) Other operating expenses in the amount of EUR 136.2 million (2014: EUR 123.1 million) are by their nature less variable to revenue development. Such costs include facility costs, in-orbit insurance costs, marketing expenses, general and administrative expenditure, consulting charges, travel-related expenditure and movements in provisions for debtors.
NOTE 5 - AUDIT AND NON-AUDIT FEES
For the years ended December 31, 2015 and 2014, respectively, the Group has recorded charges – both billed and accrued – from its
independent auditor and affiliated companies thereof, as set out below:

INTRODUCTION GLOBALISATION VERTICALISATION SOCIETYINNOVATION CORPORATE GOVERNANCE
FINANCIAL REVIEW
FINANCIAL STATEMENTS
SES ANNUAL ACCOUNTS
In millions of euros 2015 2014
Finance income
Interest income 14.4 13.2
Net foreign exchange gains 38.7 20.6
Total 53.1 33.8
Finance costs
Interest expenses on borrowings (excluding amounts capitalised) (155.6) (162.8)
Loan fees and origination costs and other (33.2) (24.9)
Value adjustments on financial assets - (1.1)
Total (188.8) (188.8)
In millions of euros 2015 2014
Current income tax
Current income tax charge (62.1) (141.5)
Adjustments in respect of prior periods (17.0) 9.6
Foreign withholding taxes (11.5) (11.0)
Total current income tax (90.6) (142.9)
Deferred income tax
Relating to origination and reversal of temporary differences 21.3 54.8
Relating to tax losses brought forward - 7.8
Changes in tax rate - 7.0
Adjustment of prior years (15.6) (11.9)
Total deferred income tax 5.7 57.7
Income tax income/(expense) per consolidated income statement (84.9) (85.2)
Consolidated statement of changes in equity
Current and Deferred Income tax related to items (charged) or credited directly in equity
Post-employment benefit obligation (0.9) 1.8
Impact of currency translation 2.5 13.0
Investment hedge - current tax 64.6 67.3
Investment hedge - deferred tax 11.0 -
Tax impact of the treasury shares impairment recorded in the statutory financial statements 5.0 -
Current and Deferred Income taxes reported in equity 82.2 82.1
85SES Annual Report 2015
Net foreign exchange gains mostly relates to revaluation of USD denominated bank accounts, deposits and other monetary items denominated in USD.
NOTE 6 - FINANCE INCOME AND COSTS
NOTE 7 - INCOME TAXES
Taxes on income comprise the taxes paid or owed in the individual countries, as well as deferred taxes. Current and deferred taxes can be analysed as follows:
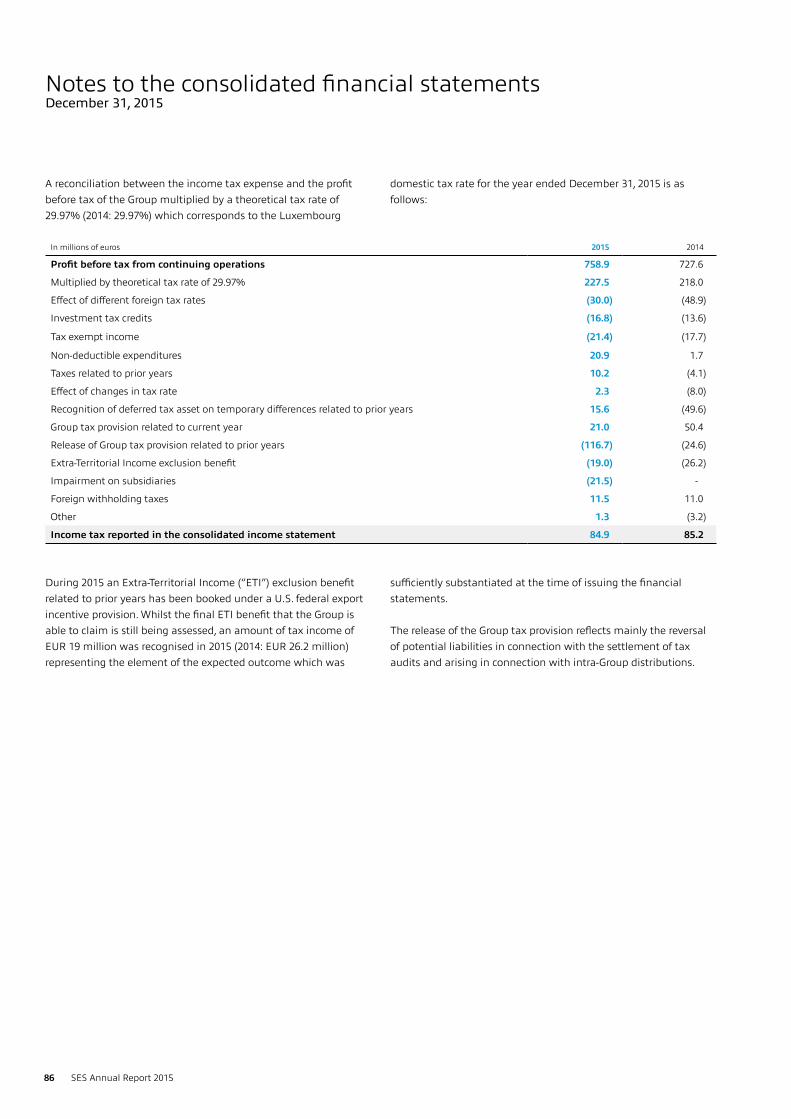
In millions of euros 2015 2014
Profit before tax from continuing operations 758.9 727.6
Multiplied by theoretical tax rate of 29.97% 227.5 218.0
Effect of different foreign tax rates (30.0) (48.9)
Investment tax credits (16.8) (13.6)
Tax exempt income (21.4) (17.7)
Non-deductible expenditures 20.9 1.7
Taxes related to prior years 10.2 (4.1)
Effect of changes in tax rate 2.3 (8.0)
Recognition of deferred tax asset on temporary differences related to prior years 15.6 (49.6)
Group tax provision related to current year 21.0 50.4
Release of Group tax provision related to prior years (116.7) (24.6)
Extra-Territorial Income exclusion benefit (19.0) (26.2)
Impairment on subsidiaries (21.5) -
Foreign withholding taxes 11.5 11.0
Other 1.3 (3.2)
Income tax reported in the consolidated income statement 84.9 85.2
86 SES Annual Report 2015
Notes to the consolidated financial statementsDecember 31, 2015
A reconciliation between the income tax expense and the profit before tax of the Group multiplied by a theoretical tax rate of 29.97% (2014: 29.97%) which corresponds to the Luxembourg
domestic tax rate for the year ended December 31, 2015 is as follows:
During 2015 an Extra-Territorial Income (“ETI”) exclusion benefit related to prior years has been booked under a U.S. federal export incentive provision. Whilst the final ETI benefit that the Group is able to claim is still being assessed, an amount of tax income of EUR 19 million was recognised in 2015 (2014: EUR 26.2 million) representing the element of the expected outcome which was
sufficiently substantiated at the time of issuing the financial statements.
The release of the Group tax provision reflects mainly the reversal of potential liabilities in connection with the settlement of tax audits and arising in connection with intra-Group distributions.
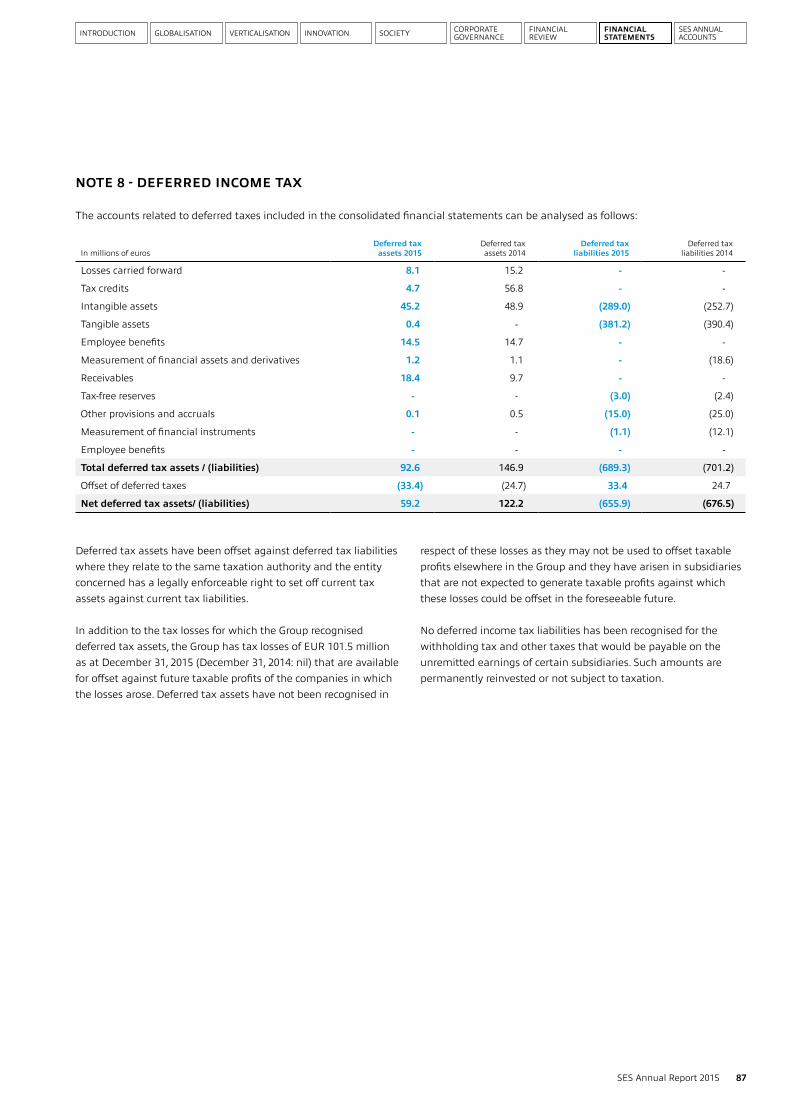
INTRODUCTION GLOBALISATION VERTICALISATION SOCIETYINNOVATION CORPORATE GOVERNANCE
FINANCIAL REVIEW
FINANCIAL STATEMENTS
SES ANNUAL ACCOUNTS
In millions of eurosDeferred tax
assets 2015Deferred tax assets 2014
Deferred tax liabilities 2015
Deferred tax liabilities 2014
Losses carried forward 8.1 15.2 - -
Tax credits 4.7 56.8 - -
Intangible assets 45.2 48.9 (289.0) (252.7)
Tangible assets 0.4 - (381.2) (390.4)
Employee benefits 14.5 14.7 - -
Measurement of financial assets and derivatives 1.2 1.1 - (18.6)
Receivables 18.4 9.7 - -
Tax-free reserves - - (3.0) (2.4)
Other provisions and accruals 0.1 0.5 (15.0) (25.0)
Measurement of financial instruments - - (1.1) (12.1)
Employee benefits - - - -
Total deferred tax assets / (liabilities) 92.6 146.9 (689.3) (701.2)
Offset of deferred taxes (33.4) (24.7) 33.4 24.7
Net deferred tax assets/ (liabilities) 59.2 122.2 (655.9) (676.5)
87SES Annual Report 2015
Deferred tax assets have been offset against deferred tax liabilities where they relate to the same taxation authority and the entity concerned has a legally enforceable right to set off current tax assets against current tax liabilities.
In addition to the tax losses for which the Group recognised deferred tax assets, the Group has tax losses of EUR 101.5 million as at December 31, 2015 (December 31, 2014: nil) that are available for offset against future taxable profits of the companies in which the losses arose. Deferred tax assets have not been recognised in
respect of these losses as they may not be used to offset taxable profits elsewhere in the Group and they have arisen in subsidiaries that are not expected to generate taxable profits against which these losses could be offset in the foreseeable future.
No deferred income tax liabilities has been recognised for the withholding tax and other taxes that would be payable on the unremitted earnings of certain subsidiaries. Such amounts are permanently reinvested or not subject to taxation.
NOTE 8 - DEFERRED INCOME TAX
The accounts related to deferred taxes included in the consolidated financial statements can be analysed as follows:
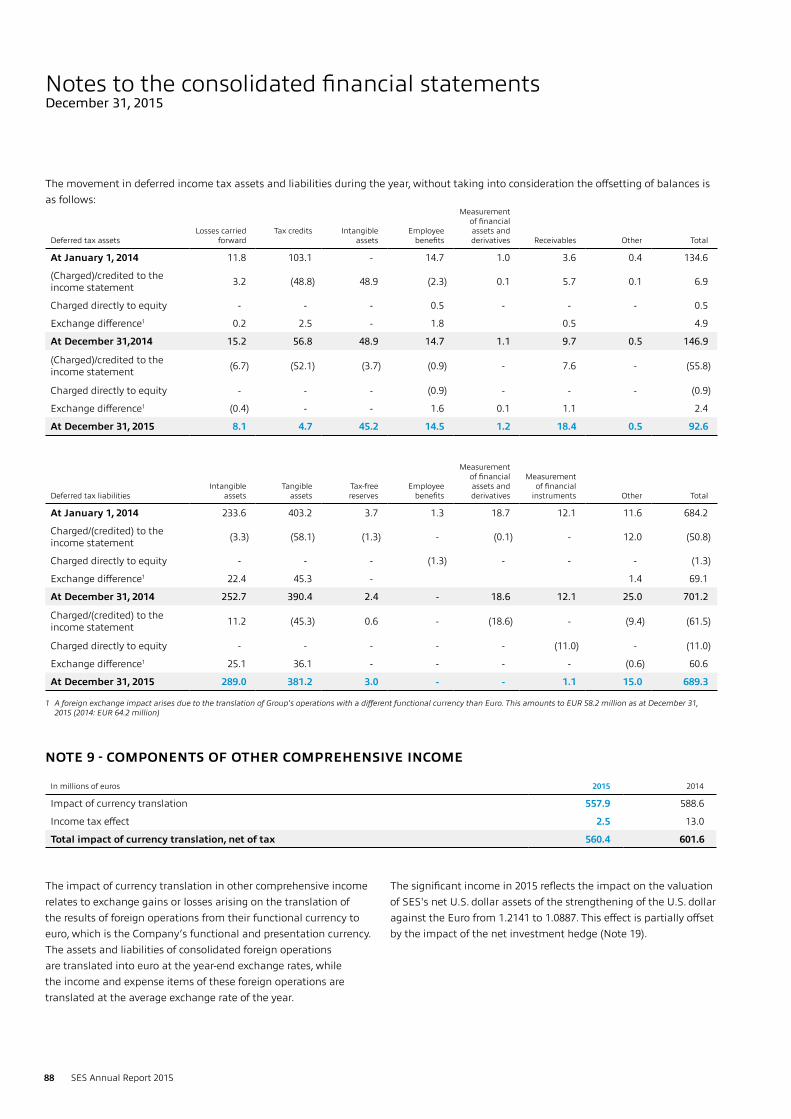
1 A foreign exchange impact arises due to the translation of Group's operations with a different functional currency than Euro. This amounts to EUR 58.2 million as at December 31, 2015 (2014: EUR 64.2 million)
In millions of euros 2015 2014
Impact of currency translation 557.9 588.6
Income tax effect 2.5 13.0
Total impact of currency translation, net of tax 560.4 601.6
Deferred tax assetsLosses carried
forwardTax credits Intangible
assets Employee
benefits
Measurement of financial assets and derivatives Receivables Other Total
At January 1, 2014 11.8 103.1 - 14.7 1.0 3.6 0.4 134.6
(Charged)/credited to the income statement 3.2 (48.8) 48.9 (2.3) 0.1 5.7 0.1 6.9
Charged directly to equity - - - 0.5 - - - 0.5
Exchange difference1 0.2 2.5 - 1.8 0.5 4.9
At December 31,2014 15.2 56.8 48.9 14.7 1.1 9.7 0.5 146.9
(Charged)/credited to the income statement (6.7) (52.1) (3.7) (0.9) - 7.6 - (55.8)
Charged directly to equity - - - (0.9) - - - (0.9)
Exchange difference1 (0.4) - - 1.6 0.1 1.1 2.4
At December 31, 2015 8.1 4.7 45.2 14.5 1.2 18.4 0.5 92.6
Deferred tax liabilitiesIntangible
assetsTangible
assetsTax-free reserves
Employee benefits
Measurement of financial assets and derivatives
Measurement of financial
instruments Other Total
At January 1, 2014 233.6 403.2 3.7 1.3 18.7 12.1 11.6 684.2
Charged/(credited) to the income statement (3.3) (58.1) (1.3) - (0.1) - 12.0 (50.8)
Charged directly to equity - - - (1.3) - - - (1.3)
Exchange difference1 22.4 45.3 - 1.4 69.1
At December 31, 2014 252.7 390.4 2.4 - 18.6 12.1 25.0 701.2
Charged/(credited) to the income statement 11.2 (45.3) 0.6 - (18.6) - (9.4) (61.5)
Charged directly to equity - - - - - (11.0) - (11.0)
Exchange difference1 25.1 36.1 - - - - (0.6) 60.6
At December 31, 2015 289.0 381.2 3.0 - - 1.1 15.0 689.3
88 SES Annual Report 2015
Notes to the consolidated financial statementsDecember 31, 2015
The movement in deferred income tax assets and liabilities during the year, without taking into consideration the offsetting of balances is as follows:
The impact of currency translation in other comprehensive income relates to exchange gains or losses arising on the translation of the results of foreign operations from their functional currency to euro, which is the Company’s functional and presentation currency. The assets and liabilities of consolidated foreign operations are translated into euro at the year-end exchange rates, while the income and expense items of these foreign operations are translated at the average exchange rate of the year.
The significant income in 2015 reflects the impact on the valuation of SES's net U.S. dollar assets of the strengthening of the U.S. dollar against the Euro from 1.2141 to 1.0887. This effect is partially offset by the impact of the net investment hedge (Note 19).
NOTE 9 - COMPONENTS OF OTHER COMPREHENSIVE INCOME

INTRODUCTION GLOBALISATION VERTICALISATION SOCIETYINNOVATION CORPORATE GOVERNANCE
FINANCIAL REVIEW
FINANCIAL STATEMENTS
SES ANNUAL ACCOUNTS
In millions of euros 2015 2014
Profit attributable to owners of the parent 544.9 600.8
In millions of euros 2015 2014
Profit attributable to owners of the parent 544.9 600.8
89SES Annual Report 2015
Basic earnings per share is calculated by dividing the net profit for the year attributable to ordinary shareholders of each class of shares by the weighted average number of shares outstanding during the year as adjusted to reflect the economic rights of each class of share.
For the year 2015, basic earnings per share of EUR 1.34 per A share (2014: EUR 1.49), and EUR 0.54 per B share (2014: EUR 0.59) have been calculated on the following basis:
The weighted average number of shares is based on the capital structure of the Company as described in Note 21.
Diluted earnings per share is calculated by adjusting the weighted average number of ordinary shares outstanding to assume conversion of all dilutive potential ordinary shares which are primarily related to the share-based compensation plans. A calculation is done to determine the number of shares that could have been acquired at fair value based on the monetary value of the subscription rights attached to outstanding share options.
The number of shares calculated as above is compared with the number of shares that would have been issued assuming the exercise of the share options and the difference, if it results in a dilutive effective, is considered to adjust the weighted average number of share.
For the year 2015, diluted earnings per share of EUR 1.33 per A share (2014: EUR 1.48), and EUR 0.53 per B share (2014: EUR 0.59) have been calculated on the following basis:
Weighted average number of shares, net of own shares held, for calculating basic earnings per share:
Weighted average number of shares, net of own shares held, for the purpose of calculating diluted earnings per share:
Dividends declared and paid during the year:
Dividends proposed for approval at the annual general meeting to be held on April 7, 2016, which are not recognised as a liability as at December 31, 2015:
Dividends are paid net of any withholding tax.
NOTE 10 - EARNINGS PER SHARE
NOTE 11 - DIVIDENDS PAID AND PROPOSED
2015 2014
Class A shares (in million) 338.8 336.8
Class B shares (in million) 170.6 168.8
Total 509.4 505.6
2015 2014
Class A shares (in million) 340.2 338.9
Class B shares (in million) 170.6 168.8
Total 510.8 507.7
In millions of euros 2015 2014
Class A dividend 2014: EUR 1.18 (2013: EUR 1.07) 398.4 361.2
Class B dividend 2014: EUR 0.47 (2013: EUR 0.43) 79.6 72.3
Total 478.0 433.5
In millions of euros 2015 2014
Class A dividend for 2015: EUR 1.30 (2014: EUR 1.18) 446.7 398.4
Class B dividend for 2015: EUR 0.52 (2014: EUR 0.47) 89.3 79.6
Total 536.0 478.0
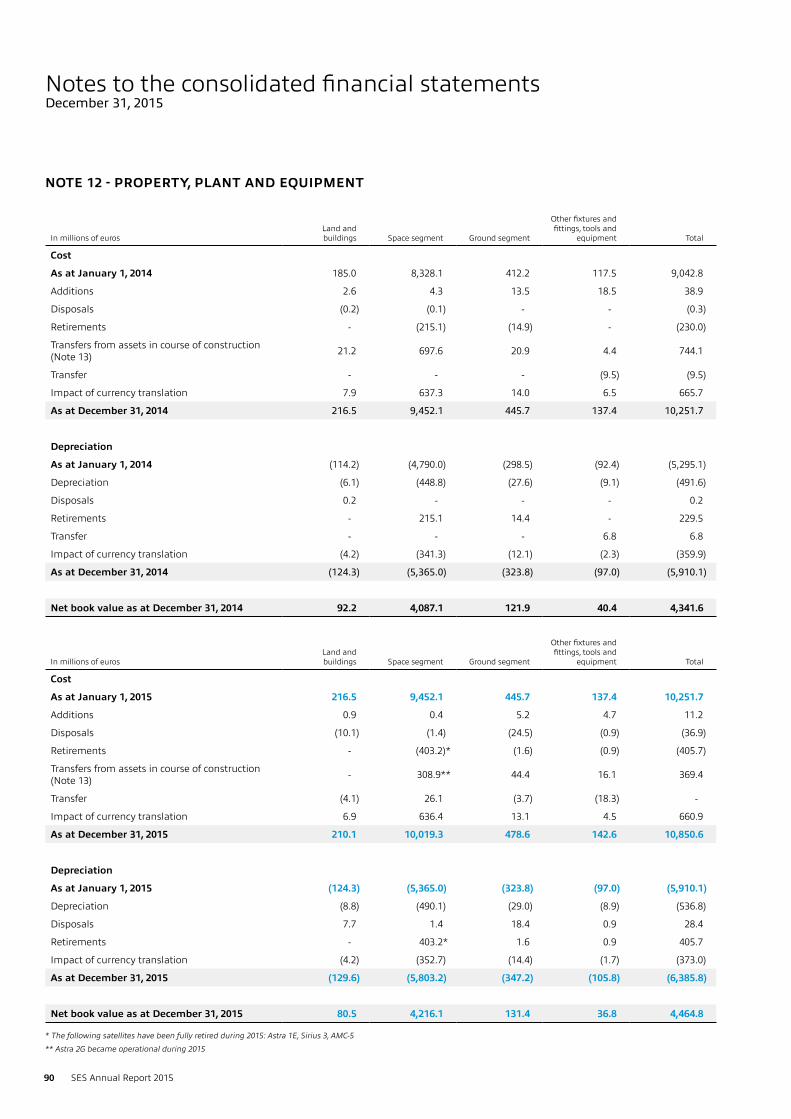
In millions of eurosLand and buildings Space segment Ground segment
Other fixtures and fittings, tools and
equipment Total
Cost
As at January 1, 2014 185.0 8,328.1 412.2 117.5 9,042.8
Additions 2.6 4.3 13.5 18.5 38.9
Disposals (0.2) (0.1) - - (0.3)
Retirements - (215.1) (14.9) - (230.0)
Transfers from assets in course of construction (Note 13) 21.2 697.6 20.9 4.4 744.1
Transfer - - - (9.5) (9.5)
Impact of currency translation 7.9 637.3 14.0 6.5 665.7
As at December 31, 2014 216.5 9,452.1 445.7 137.4 10,251.7
Depreciation
As at January 1, 2014 (114.2) (4,790.0) (298.5) (92.4) (5,295.1)
Depreciation (6.1) (448.8) (27.6) (9.1) (491.6)
Disposals 0.2 - - - 0.2
Retirements - 215.1 14.4 - 229.5
Transfer - - - 6.8 6.8
Impact of currency translation (4.2) (341.3) (12.1) (2.3) (359.9)
As at December 31, 2014 (124.3) (5,365.0) (323.8) (97.0) (5,910.1)
Net book value as at December 31, 2014 92.2 4,087.1 121.9 40.4 4,341.6
In millions of eurosLand and buildings Space segment Ground segment
Other fixtures and fittings, tools and
equipment Total
Cost
As at January 1, 2015 216.5 9,452.1 445.7 137.4 10,251.7
Additions 0.9 0.4 5.2 4.7 11.2
Disposals (10.1) (1.4) (24.5) (0.9) (36.9)
Retirements - (403.2)* (1.6) (0.9) (405.7)
Transfers from assets in course of construction (Note 13) - 308.9** 44.4 16.1 369.4
Transfer (4.1) 26.1 (3.7) (18.3) -
Impact of currency translation 6.9 636.4 13.1 4.5 660.9
As at December 31, 2015 210.1 10,019.3 478.6 142.6 10,850.6
Depreciation
As at January 1, 2015 (124.3) (5,365.0) (323.8) (97.0) (5,910.1)
Depreciation (8.8) (490.1) (29.0) (8.9) (536.8)
Disposals 7.7 1.4 18.4 0.9 28.4
Retirements - 403.2* 1.6 0.9 405.7
Impact of currency translation (4.2) (352.7) (14.4) (1.7) (373.0)
As at December 31, 2015 (129.6) (5,803.2) (347.2) (105.8) (6,385.8)
Net book value as at December 31, 2015 80.5 4,216.1 131.4 36.8 4,464.8
* The following satellites have been fully retired during 2015: Astra 1E, Sirius 3, AMC-5
** Astra 2G became operational during 2015
90 SES Annual Report 2015
Notes to the consolidated financial statementsDecember 31, 2015
NOTE 12 - PROPERTY, PLANT AND EQUIPMENT
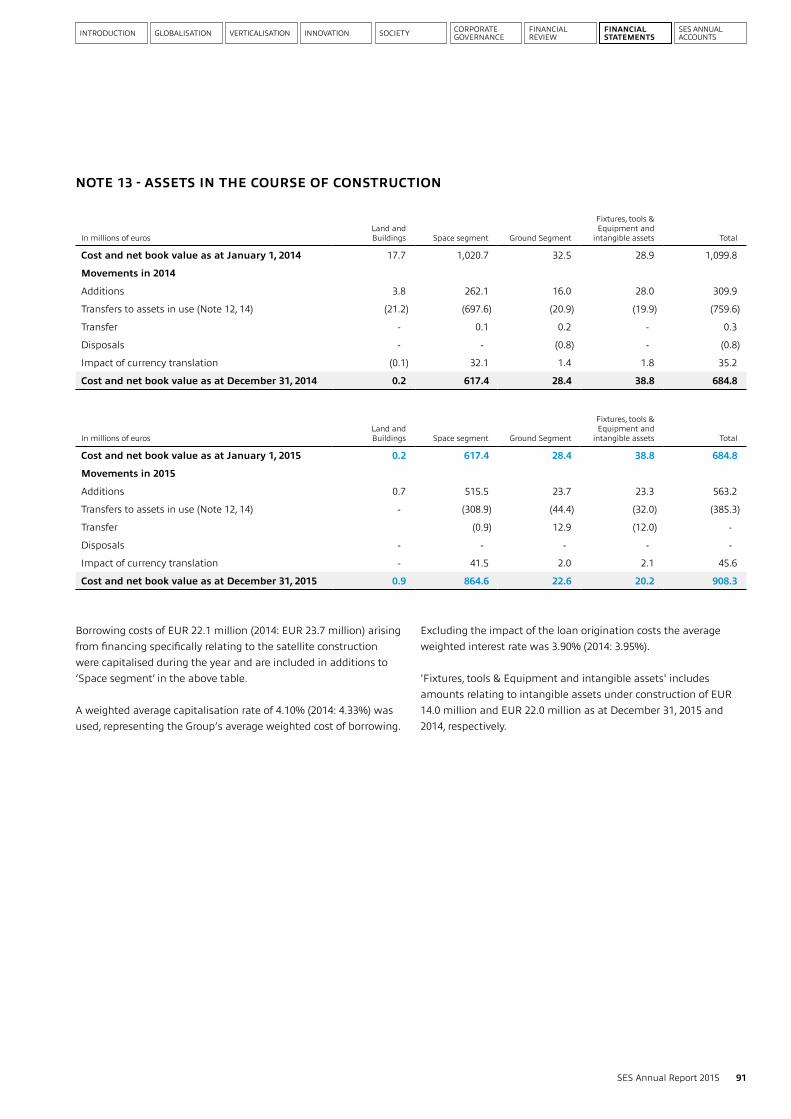
INTRODUCTION GLOBALISATION VERTICALISATION SOCIETYINNOVATION CORPORATE GOVERNANCE
FINANCIAL REVIEW
FINANCIAL STATEMENTS
SES ANNUAL ACCOUNTS
In millions of eurosLand and Buildings Space segment Ground Segment
Fixtures, tools & Equipment and
intangible assets Total
Cost and net book value as at January 1, 2014 17.7 1,020.7 32.5 28.9 1,099.8
Movements in 2014
Additions 3.8 262.1 16.0 28.0 309.9
Transfers to assets in use (Note 12, 14) (21.2) (697.6) (20.9) (19.9) (759.6)
Transfer - 0.1 0.2 - 0.3
Disposals - - (0.8) - (0.8)
Impact of currency translation (0.1) 32.1 1.4 1.8 35.2
Cost and net book value as at December 31, 2014 0.2 617.4 28.4 38.8 684.8
In millions of eurosLand and Buildings Space segment Ground Segment
Fixtures, tools & Equipment and
intangible assets Total
Cost and net book value as at January 1, 2015 0.2 617.4 28.4 38.8 684.8
Movements in 2015
Additions 0.7 515.5 23.7 23.3 563.2
Transfers to assets in use (Note 12, 14) - (308.9) (44.4) (32.0) (385.3)
Transfer (0.9) 12.9 (12.0) -
Disposals - - - - -
Impact of currency translation - 41.5 2.0 2.1 45.6
Cost and net book value as at December 31, 2015 0.9 864.6 22.6 20.2 908.3
91SES Annual Report 2015
NOTE 13 - ASSETS IN THE COURSE OF CONSTRUCTION
Borrowing costs of EUR 22.1 million (2014: EUR 23.7 million) arising from financing specifically relating to the satellite construction were capitalised during the year and are included in additions to ‘Space segment’ in the above table.
A weighted average capitalisation rate of 4.10% (2014: 4.33%) was used, representing the Group’s average weighted cost of borrowing.
Excluding the impact of the loan origination costs the average weighted interest rate was 3.90% (2014: 3.95%).
'Fixtures, tools & Equipment and intangible assets' includes amounts relating to intangible assets under construction of EUR 14.0 million and EUR 22.0 million as at December 31, 2015 and 2014, respectively.
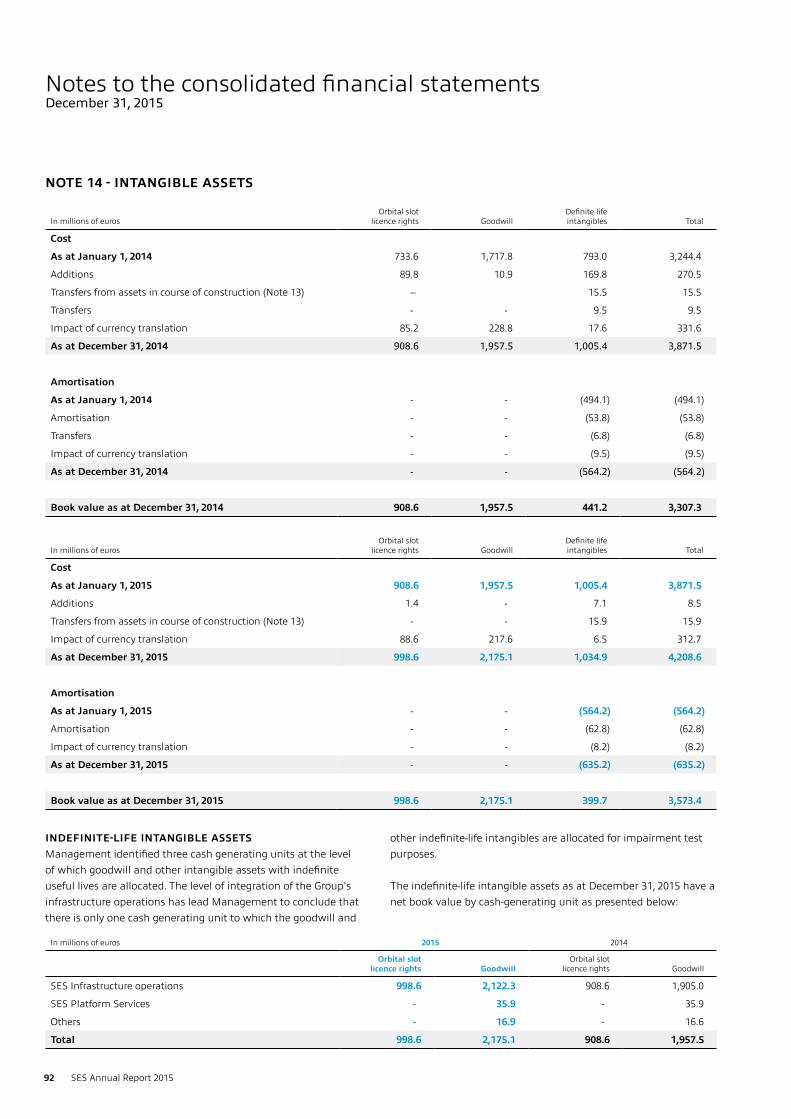
In millions of eurosOrbital slot
licence rights GoodwillDefinite life intangibles Total
Cost
As at January 1, 2014 733.6 1,717.8 793.0 3,244.4
Additions 89.8 10.9 169.8 270.5
Transfers from assets in course of construction (Note 13) -- 15.5 15.5
Transfers - - 9.5 9.5
Impact of currency translation 85.2 228.8 17.6 331.6
As at December 31, 2014 908.6 1,957.5 1,005.4 3,871.5
Amortisation
As at January 1, 2014 - - (494.1) (494.1)
Amortisation - - (53.8) (53.8)
Transfers - - (6.8) (6.8)
Impact of currency translation - - (9.5) (9.5)
As at December 31, 2014 - - (564.2) (564.2)
Book value as at December 31, 2014 908.6 1,957.5 441.2 3,307.3
In millions of eurosOrbital slot
licence rights GoodwillDefinite life intangibles Total
Cost
As at January 1, 2015 908.6 1,957.5 1,005.4 3,871.5
Additions 1.4 - 7.1 8.5
Transfers from assets in course of construction (Note 13) - - 15.9 15.9
Impact of currency translation 88.6 217.6 6.5 312.7
As at December 31, 2015 998.6 2,175.1 1,034.9 4,208.6
Amortisation
As at January 1, 2015 - - (564.2) (564.2)
Amortisation - - (62.8) (62.8)
Impact of currency translation - - (8.2) (8.2)
As at December 31, 2015 - - (635.2) (635.2)
Book value as at December 31, 2015 998.6 2,175.1 399.7 3,573.4
In millions of euros 2015 2014
Orbital slot licence rights Goodwill
Orbital slot licence rights Goodwill
SES Infrastructure operations 998.6 2,122.3 908.6 1,905.0
SES Platform Services - 35.9 - 35.9
Others - 16.9 - 16.6
Total 998.6 2,175.1 908.6 1,957.5
INDEFINITE-LIFE INTANGIBLE ASSETS Management identified three cash generating units at the level of which goodwill and other intangible assets with indefinite useful lives are allocated. The level of integration of the Group's infrastructure operations has lead Management to conclude that there is only one cash generating unit to which the goodwill and
other indefinite-life intangibles are allocated for impairment test purposes.
The indefinite-life intangible assets as at December 31, 2015 have a net book value by cash-generating unit as presented below:
92 SES Annual Report 2015
Notes to the consolidated financial statementsDecember 31, 2015
NOTE 14 - INTANGIBLE ASSETS
INTRODUCTION GLOBALISATION VERTICALISATION SOCIETYINNOVATION CORPORATE GOVERNANCE
FINANCIAL REVIEW
FINANCIAL STATEMENTS
SES ANNUAL ACCOUNTS
93SES Annual Report 2015
1) Orbital slot licence rightsInterests in orbital slot licence rights were acquired in the course of the acquisitions of the SES WORLD SKIES' entities and SES ASTRA AB, as well as through targeted acquisition of such rights from third parties. The Group believes that there is a high probability of being able to achieve the extension of these rights at no significant cost as and when the current agreements expire. Hence these assets are not amortised, but rather held in the statement of financial position at acquisition cost. Impairment testing procedures are performed at least once a year to assess whether the carrying value is still appropriate.
2) GoodwillImpairment testing procedures are performed at least once a year to assess whether the carrying value of goodwill is still appropriate. The annual impairment test is performed as at October 31 each year. The recoverable amount of the goodwill is determined based on a value-in-use calculation (Note 2) using the most recent business plan information approved by the Board of Directors which covers a period of up to five years. This period for the business plan is derived from the contractual basis for the satellite business.
Pre-tax discount rates in 2015 are between 5.93% and 6.34% (2014: 6.06% and 8.38% - comparatives adjusted to a comparable pre-tax basis) and were selected to reflect market interest rates and commercial spreads; the capital structure of businesses in the Group’s business sector; and the specific risk profile of the businesses concerned. Terminal growth rates used in the valuations are set at 2%, which reflect the most recent long-term planning assumptions approved by the Board and can be supported by reference to the trading performance of the companies concerned over a longer period.
Impairment testing of goodwill and intangibles with indefinite livesThe calculations of value in use are most sensitive to:
1) Movements in the underlying business plan assumptions Business plans are drawn up annually and generally provide
an assessment of the expected developments for a five-year period beyond the end of the year when the plan is drawn up. These business plans reflect both the most up-to-date assumptions concerning the CGU’s markets and also developments and trends in the business of the CGU. For the provision of satellite capacity these will particularly take into account the following factors:
← the expected developments in transponder fill rates, including the impact of the replacement capacity; ← any changes in the expected capital expenditure cycle - due to technical degradation of a satellite or through the identified need for replacement capacities; and ← any changes in satellite procurement, launch or cost assumptions.
2) Changes in discount rates Discount rates reflect management’s estimate of the risks
specific to each CGU. Management uses a pre-tax weighted average cost of capital as discount rate for each CGU. This reflects market interest rates of twenty-year bonds in the market concerned, the capital structure of businesses in the Group's business sector, and other factors, as necessary, applying specifically to the CGU concerned.
3) Growth rate assumptions used to extrapolate cash flows beyond the business planning period: ← Rates are based on the commercial experience relating to the CGUs concerned and the expectations for developments in the markets which they serve. ← As part of standard impairment testing procedures, the Company assesses the impact of changes in the discount rates and growth assumptions of the valuation surplus, or deficit as the case may be. Both discount rates and terminal values are simulated up to 2% below and above the CGU's specific rate used in the base valuation. In this way a matrix of valuations is generated which reveals the potential exposure to impairment charges for each CGU based on movements in the valuation parameters which are within the range of outcomes foreseeable at the valuation date. ← The most recent testing showed that the CGUs tested would have no impairment even in the least favourable case - a combination of lower terminal growth rates and higher discount rates. For this reason management believes that there is no combination of discount rates and terminal growth rates foreseeable at the valuation date which would result in the carrying value of indefinite-life intangible assets materially exceeding their recoverable amount. In addition to the changes in terminal growth rates and discount rates, no other reasonably possible change in another key assumption is expected to cause the CGU's carrying amounts to exceed their recoverable amount.
DEFINITE LIFE INTANGIBLE ASSETSThe Group’s primary definite life intangible asset is the agreement concluded by SES ASTRA with the Luxembourg government in relation to the usage of Luxembourg frequencies in the orbital positions of the geostationary arc from 45˚ West to 50˚ East for the period of January 1, 2001 to December 31, 2021. Given the finite nature of this agreement, these usage rights - valued at EUR 550.0 million at the date of acquisition - are being amortised on a straight-line basis over the 21-year term of the agreement.

In millions of euros 2015 2014
Non-current assets 439.9 399.3
Current assets 68.1 122.2
Non-current liabilities 444.2 395.7
Current liabilities 23.9 24.0
Revenue 22.5 3.7
Operating expenses (32.4) (22.3)
Depreciation and amortisation (69.9) (10.3)
Finance expense, net (45.6) (11.0)
Income tax (1.3) -
Net loss for the year (126.7) (39.8)
Other comprehensive income / (expenses) - -
Total comprehensive income (126.7) (39.8)
Dividends received from associate - -
In millions of euros 2015 2014
Operating lease commitments
Within one year 1.5 1.5
Years 2-5 2.5 3.4
Thereafter 0.4 0.5
Total 4.4 5.4
94 SES Annual Report 2015
Notes to the consolidated financial statementsDecember 31, 2015
NOTE 15 - INVESTMENT IN ASSOCIATES
O3B NETWORKS In July 2014, O3b Networks successfully launched satellites 5 to 8 of its Middle Earth Orbit constellation, followed by the launch of satellites 9 to 12 in December 2014. With these satellites in orbit, the full commercial services of O3b Networks can be commercialised.
During 2014, O3b Networks reached agreements with its shareholders and lenders on new financing arrangements, including an agreement with SES in April 2014 for a new Subordinated Shareholder Facility Agreement, and as such the level of uncertainty concerning the going concern of the investment has substantially reduced since 2014.
On November 30, 2015, O3b Networks completed a financing round in connection with the procurement of the next eight satellites in its fleet, that is satellites 13 to 20. This financing round had a total volume of new equity issuance of USD 143.0 million, out of which
an amount of USD 113.3 million, equivalent of EUR 107.8 million, was subscribed by SES. A corresponding liability is recorded as at December 31, 2015 related to SES's contribution to the capital increase.
As at December 31, 2015, SES has an interest of 42.65% in the issued share capital of O3b Networks (2014: 44.75%). SES also holds non-voting warrants in O3b Networks which carry no economic rights, for example to dividends, but are convertible at any time in to shares in the associate. On a fully diluted basis the interest in O3b Networks is 49.1%.The carrying value of SES’s equity interest in O3b Networks as at December 31, 2015 is EUR 73.3 million (2014: EUR 93.0 million), with the decrease reflecting the Group's share of O3b Networks' net loss during the year of EUR 126.7 million partly offset by an additional investment of EUR 107.0 million.
The Group's share of O3b Networks' assets, liabilities, income and expenses as at December 31, 2015 and 2014 and for the years then ended, which are included in the consolidated financial statements, are as follows:
As at December 31, 2015 and 2014 O3b Networks has no significant contingent liabilities.
As at December 31, 2015, the Group's share in O3b Networks capital commitments, which mainly relate to satellites procurement costs,
amounts to EUR 93.2 million (2014: EUR 5.7 million).
The Group's share in O3b Networks' operating lease commitments is as follows:
As at December 31, 2015 and 2014 the Group held no other significant investments in associates.
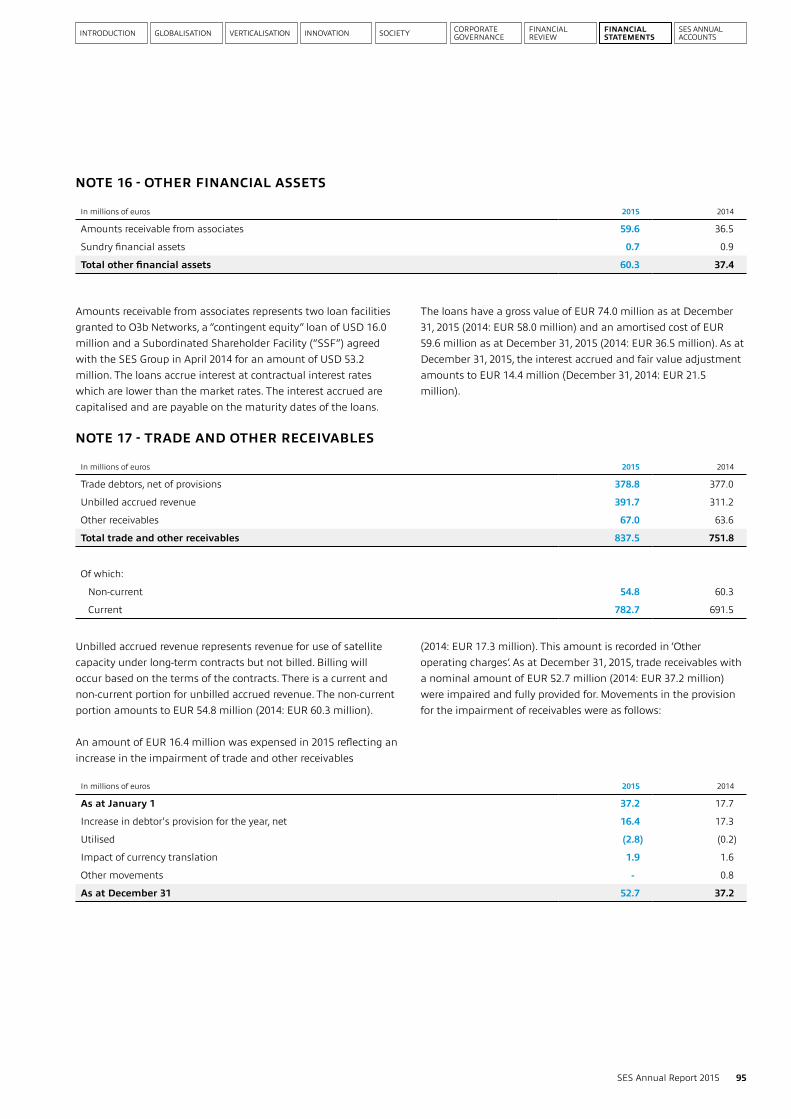
INTRODUCTION GLOBALISATION VERTICALISATION SOCIETYINNOVATION CORPORATE GOVERNANCE
FINANCIAL REVIEW
FINANCIAL STATEMENTS
SES ANNUAL ACCOUNTS
In millions of euros 2015 2014
Amounts receivable from associates 59.6 36.5
Sundry financial assets 0.7 0.9
Total other financial assets 60.3 37.4
In millions of euros 2015 2014
Trade debtors, net of provisions 378.8 377.0
Unbilled accrued revenue 391.7 311.2
Other receivables 67.0 63.6
Total trade and other receivables 837.5 751.8
Of which:
Non-current 54.8 60.3
Current 782.7 691.5
In millions of euros 2015 2014
As at January 1 37.2 17.7
Increase in debtor's provision for the year, net 16.4 17.3
Utilised (2.8) (0.2)
Impact of currency translation 1.9 1.6
Other movements - 0.8
As at December 31 52.7 37.2
95SES Annual Report 2015
Amounts receivable from associates represents two loan facilities granted to O3b Networks, a “contingent equity” loan of USD 16.0 million and a Subordinated Shareholder Facility (“SSF”) agreed with the SES Group in April 2014 for an amount of USD 53.2 million. The loans accrue interest at contractual interest rates which are lower than the market rates. The interest accrued are capitalised and are payable on the maturity dates of the loans.
The loans have a gross value of EUR 74.0 million as at December 31, 2015 (2014: EUR 58.0 million) and an amortised cost of EUR 59.6 million as at December 31, 2015 (2014: EUR 36.5 million). As at December 31, 2015, the interest accrued and fair value adjustment amounts to EUR 14.4 million (December 31, 2014: EUR 21.5 million).
Unbilled accrued revenue represents revenue for use of satellite capacity under long-term contracts but not billed. Billing will occur based on the terms of the contracts. There is a current and non-current portion for unbilled accrued revenue. The non-current portion amounts to EUR 54.8 million (2014: EUR 60.3 million).
An amount of EUR 16.4 million was expensed in 2015 reflecting an increase in the impairment of trade and other receivables
(2014: EUR 17.3 million). This amount is recorded in ‘Other operating charges’. As at December 31, 2015, trade receivables with a nominal amount of EUR 52.7 million (2014: EUR 37.2 million) were impaired and fully provided for. Movements in the provision for the impairment of receivables were as follows:
NOTE 16 - OTHER FINANCIAL ASSETS
NOTE 17 - TRADE AND OTHER RECEIVABLES
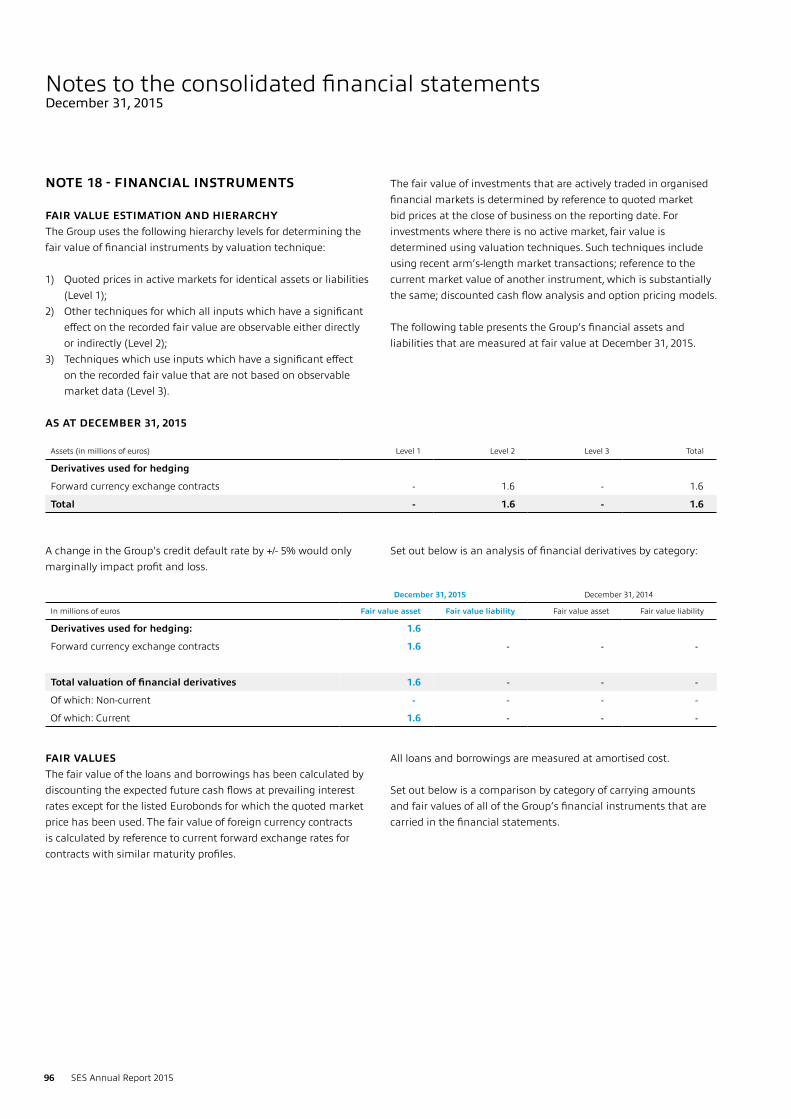
Assets (in millions of euros) Level 1 Level 2 Level 3 Total
Derivatives used for hedging
Forward currency exchange contracts - 1.6 - 1.6
Total - 1.6 - 1.6
December 31, 2015 December 31, 2014
In millions of euros Fair value asset Fair value liability Fair value asset Fair value liability
Derivatives used for hedging: 1.6
Forward currency exchange contracts 1.6 - - -
Total valuation of financial derivatives 1.6 - - -
Of which: Non-current - - - -
Of which: Current 1.6 - - -
96 SES Annual Report 2015
Notes to the consolidated financial statementsDecember 31, 2015
NOTE 18 - FINANCIAL INSTRUMENTS
FAIR VALUE ESTIMATION AND HIERARCHYThe Group uses the following hierarchy levels for determining the fair value of financial instruments by valuation technique:
1) Quoted prices in active markets for identical assets or liabilities (Level 1);
2) Other techniques for which all inputs which have a significant effect on the recorded fair value are observable either directly or indirectly (Level 2);
3) Techniques which use inputs which have a significant effect on the recorded fair value that are not based on observable market data (Level 3).
The fair value of investments that are actively traded in organised financial markets is determined by reference to quoted market bid prices at the close of business on the reporting date. For investments where there is no active market, fair value is determined using valuation techniques. Such techniques include using recent arm’s-length market transactions; reference to the current market value of another instrument, which is substantially the same; discounted cash flow analysis and option pricing models.
The following table presents the Group’s financial assets and liabilities that are measured at fair value at December 31, 2015.
A change in the Group's credit default rate by +/- 5% would only marginally impact profit and loss.
Set out below is an analysis of financial derivatives by category:
FAIR VALUESThe fair value of the loans and borrowings has been calculated by discounting the expected future cash flows at prevailing interest rates except for the listed Eurobonds for which the quoted market price has been used. The fair value of foreign currency contracts is calculated by reference to current forward exchange rates for contracts with similar maturity profiles.
All loans and borrowings are measured at amortised cost.
Set out below is a comparison by category of carrying amounts and fair values of all of the Group’s financial instruments that are carried in the financial statements.
AS AT DECEMBER 31, 2015
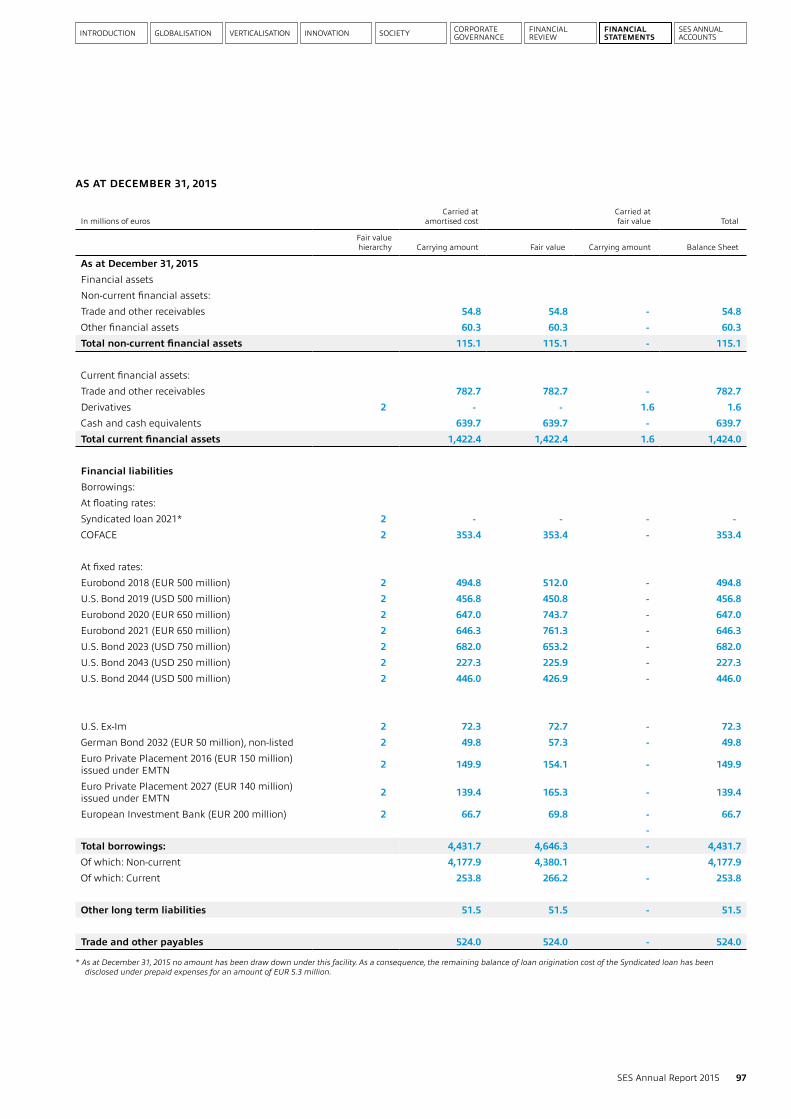
INTRODUCTION GLOBALISATION VERTICALISATION SOCIETYINNOVATION CORPORATE GOVERNANCE
FINANCIAL REVIEW
FINANCIAL STATEMENTS
SES ANNUAL ACCOUNTS
In millions of eurosCarried at
amortised cost Carried at
fair value Total
Fair value hierarchy Carrying amount Fair value Carrying amount Balance Sheet
As at December 31, 2015Financial assetsNon-current financial assets:Trade and other receivables 54.8 54.8 - 54.8Other financial assets 60.3 60.3 - 60.3Total non-current financial assets 115.1 115.1 - 115.1
Current financial assets:Trade and other receivables 782.7 782.7 - 782.7Derivatives 2 - - 1.6 1.6Cash and cash equivalents 639.7 639.7 - 639.7Total current financial assets 1,422.4 1,422.4 1.6 1,424.0
Financial liabilitiesBorrowings:At floating rates:Syndicated loan 2021* 2 - - - -COFACE 2 353.4 353.4 - 353.4
At fixed rates:Eurobond 2018 (EUR 500 million) 2 494.8 512.0 - 494.8U.S. Bond 2019 (USD 500 million) 2 456.8 450.8 - 456.8Eurobond 2020 (EUR 650 million) 2 647.0 743.7 - 647.0Eurobond 2021 (EUR 650 million) 2 646.3 761.3 - 646.3U.S. Bond 2023 (USD 750 million) 2 682.0 653.2 - 682.0U.S. Bond 2043 (USD 250 million) 2 227.3 225.9 - 227.3U.S. Bond 2044 (USD 500 million) 2 446.0 426.9 - 446.0
U.S. Ex-Im 2 72.3 72.7 - 72.3German Bond 2032 (EUR 50 million), non-listed 2 49.8 57.3 - 49.8Euro Private Placement 2016 (EUR 150 million) issued under EMTN 2 149.9 154.1 - 149.9
Euro Private Placement 2027 (EUR 140 million) issued under EMTN 2 139.4 165.3 - 139.4
European Investment Bank (EUR 200 million) 2 66.7 69.8 - 66.7-
Total borrowings: 4,431.7 4,646.3 - 4,431.7Of which: Non-current 4,177.9 4,380.1 4,177.9Of which: Current 253.8 266.2 - 253.8
Other long term liabilities 51.5 51.5 - 51.5
Trade and other payables 524.0 524.0 - 524.0
* As at December 31, 2015 no amount has been draw down under this facility. As a consequence, the remaining balance of loan origination cost of the Syndicated loan has been disclosed under prepaid expenses for an amount of EUR 5.3 million.
97SES Annual Report 2015
AS AT DECEMBER 31, 2015
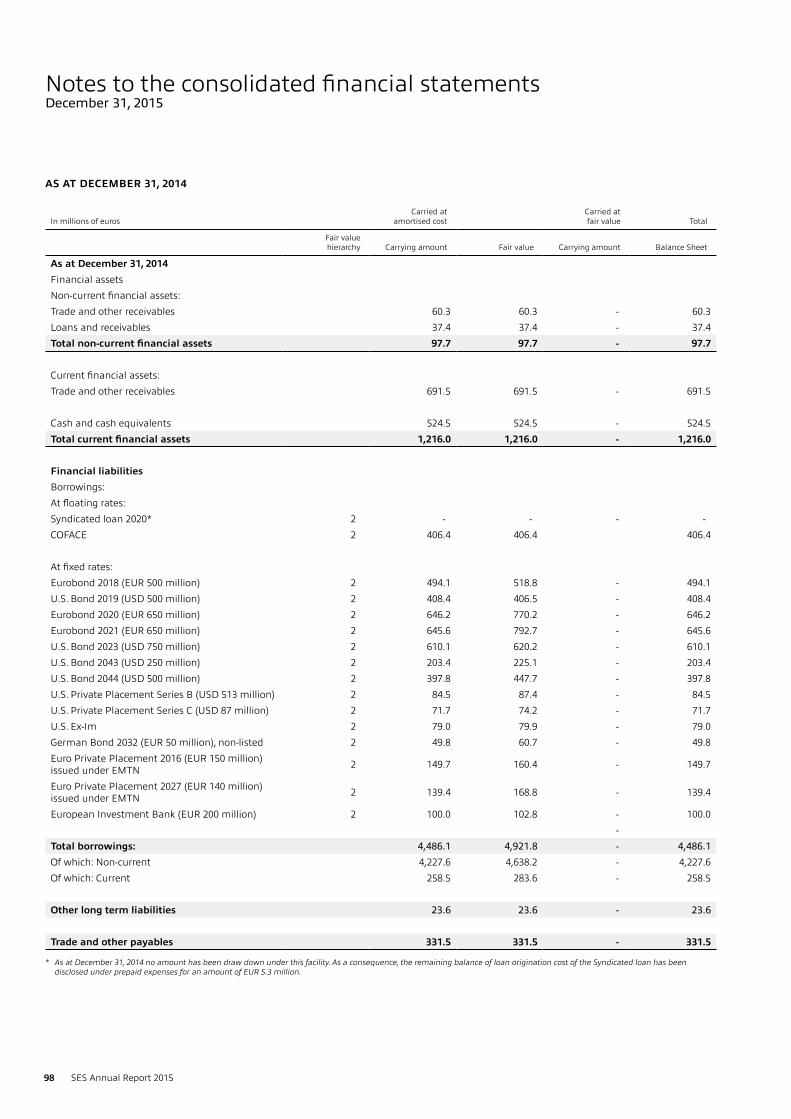
In millions of eurosCarried at
amortised cost Carried at
fair value Total
Fair value hierarchy Carrying amount Fair value Carrying amount Balance Sheet
As at December 31, 2014Financial assetsNon-current financial assets:Trade and other receivables 60.3 60.3 - 60.3Loans and receivables 37.4 37.4 - 37.4Total non-current financial assets 97.7 97.7 - 97.7
Current financial assets:Trade and other receivables 691.5 691.5 - 691.5
Cash and cash equivalents 524.5 524.5 - 524.5Total current financial assets 1,216.0 1,216.0 - 1,216.0
Financial liabilitiesBorrowings:At floating rates:Syndicated loan 2020* 2 - - - -COFACE 2 406.4 406.4 406.4
At fixed rates:Eurobond 2018 (EUR 500 million) 2 494.1 518.8 - 494.1U.S. Bond 2019 (USD 500 million) 2 408.4 406.5 - 408.4Eurobond 2020 (EUR 650 million) 2 646.2 770.2 - 646.2Eurobond 2021 (EUR 650 million) 2 645.6 792.7 - 645.6U.S. Bond 2023 (USD 750 million) 2 610.1 620.2 - 610.1U.S. Bond 2043 (USD 250 million) 2 203.4 225.1 - 203.4U.S. Bond 2044 (USD 500 million) 2 397.8 447.7 - 397.8U.S. Private Placement Series B (USD 513 million) 2 84.5 87.4 - 84.5U.S. Private Placement Series C (USD 87 million) 2 71.7 74.2 - 71.7U.S. Ex-Im 2 79.0 79.9 - 79.0German Bond 2032 (EUR 50 million), non-listed 2 49.8 60.7 - 49.8Euro Private Placement 2016 (EUR 150 million) issued under EMTN 2 149.7 160.4 - 149.7
Euro Private Placement 2027 (EUR 140 million) issued under EMTN 2 139.4 168.8 - 139.4
European Investment Bank (EUR 200 million) 2 100.0 102.8 - 100.0-
Total borrowings: 4,486.1 4,921.8 - 4,486.1Of which: Non-current 4,227.6 4,638.2 - 4,227.6Of which: Current 258.5 283.6 - 258.5
Other long term liabilities 23.6 23.6 - 23.6
Trade and other payables 331.5 331.5 - 331.5
* As at December 31, 2014 no amount has been draw down under this facility. As a consequence, the remaining balance of loan origination cost of the Syndicated loan has been disclosed under prepaid expenses for an amount of EUR 5.3 million.
98 SES Annual Report 2015
Notes to the consolidated financial statementsDecember 31, 2015
AS AT DECEMBER 31, 2014
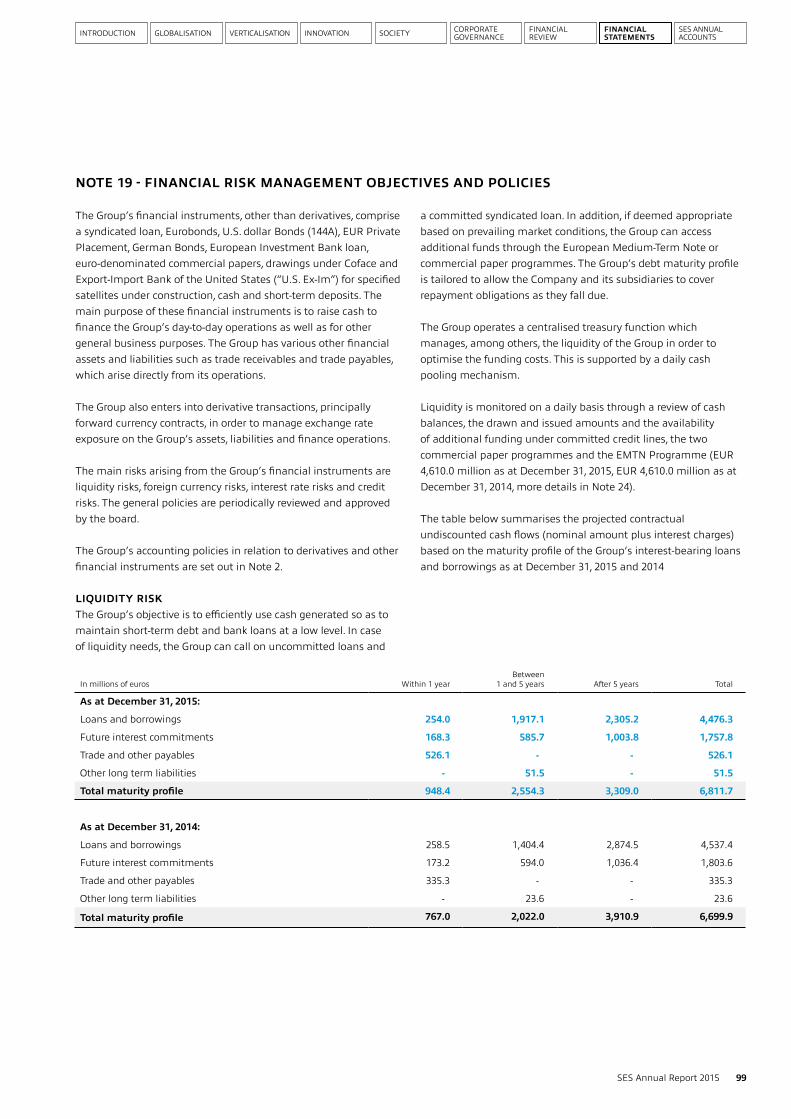
INTRODUCTION GLOBALISATION VERTICALISATION SOCIETYINNOVATION CORPORATE GOVERNANCE
FINANCIAL REVIEW
FINANCIAL STATEMENTS
SES ANNUAL ACCOUNTS
In millions of euros Within 1 yearBetween
1 and 5 years After 5 years Total
As at December 31, 2015:
Loans and borrowings 254.0 1,917.1 2,305.2 4,476.3
Future interest commitments 168.3 585.7 1,003.8 1,757.8
Trade and other payables 526.1 - - 526.1
Other long term liabilities - 51.5 - 51.5
Total maturity profile 948.4 2,554.3 3,309.0 6,811.7
As at December 31, 2014:
Loans and borrowings 258.5 1,404.4 2,874.5 4,537.4
Future interest commitments 173.2 594.0 1,036.4 1,803.6
Trade and other payables 335.3 - - 335.3
Other long term liabilities - 23.6 - 23.6
Total maturity profile 767.0 2,022.0 3,910.9 6,699.9
99SES Annual Report 2015
NOTE 19 - FINANCIAL RISK MANAGEMENT OBJECTIVES AND POLICIES
The Group’s financial instruments, other than derivatives, comprise a syndicated loan, Eurobonds, U.S. dollar Bonds (144A), EUR Private Placement, German Bonds, European Investment Bank loan, euro-denominated commercial papers, drawings under Coface and Export-Import Bank of the United States (“U.S. Ex-Im”) for specified satellites under construction, cash and short-term deposits. The main purpose of these financial instruments is to raise cash to finance the Group’s day-to-day operations as well as for other general business purposes. The Group has various other financial assets and liabilities such as trade receivables and trade payables, which arise directly from its operations.
The Group also enters into derivative transactions, principally forward currency contracts, in order to manage exchange rate exposure on the Group’s assets, liabilities and finance operations.
The main risks arising from the Group’s financial instruments are liquidity risks, foreign currency risks, interest rate risks and credit risks. The general policies are periodically reviewed and approved by the board.
The Group’s accounting policies in relation to derivatives and other financial instruments are set out in Note 2.
LIQUIDITY RISKThe Group’s objective is to efficiently use cash generated so as to maintain short-term debt and bank loans at a low level. In case of liquidity needs, the Group can call on uncommitted loans and
a committed syndicated loan. In addition, if deemed appropriate based on prevailing market conditions, the Group can access additional funds through the European Medium-Term Note or commercial paper programmes. The Group’s debt maturity profile is tailored to allow the Company and its subsidiaries to cover repayment obligations as they fall due.
The Group operates a centralised treasury function which manages, among others, the liquidity of the Group in order to optimise the funding costs. This is supported by a daily cash pooling mechanism.
Liquidity is monitored on a daily basis through a review of cash balances, the drawn and issued amounts and the availability of additional funding under committed credit lines, the two commercial paper programmes and the EMTN Programme (EUR 4,610.0 million as at December 31, 2015, EUR 4,610.0 million as at December 31, 2014, more details in Note 24).
The table below summarises the projected contractual undiscounted cash flows (nominal amount plus interest charges) based on the maturity profile of the Group’s interest-bearing loans and borrowings as at December 31, 2015 and 2014

December 31, 2015 in USD
December 31, 2014 in USD
USD statement of financial position exposure:
SES Americom 2,769.4 2,803.5
SES Holdings (NL) BV 1,720.3 1,608.7
SES Satellite Leasing 1,327.5 1,210.5
Total 5,817.2 5,622.7
Hedged with:
Private Placement - 189.6
U.S. Bonds 2,000.0 2,000.0
Other external borrowings 80.6 98.5
Total 2,080.6 2,288.1
Hedged proportion 36% 41%
100 SES Annual Report 2015
Notes to the consolidated financial statementsDecember 31, 2015
FOREIGN CURRENCY RISKSES operates in markets outside of the Eurozone, with procurement and sales facilities in various locations throughout the world. Consequently, SES uses certain financial instruments to manage its foreign currency exposure. Derivative financial instruments are used mainly to reduce the Group's exposure to market risks resulting from fluctuations in foreign exchange rates by creating offsetting exposures. SES is not a party to leveraged derivatives and, by policy, does not use derivative financial instruments for speculative purposes.
The Group has significant foreign operations whose functional currency is not denominated in Euro. The primary currency exposure in terms of foreign operations is the U.S. dollar and the Group has designated certain U.S. dollar-denominated debt as net investment hedges of these operations. The Group also has a corresponding exposure in the consolidated income statement. 45.2% (2014: 42.6%) of the Group’s sales and 50.5% (2014: 40.5%) of the Group’s operating expenses are denominated in U.S. dollars. The Group does not enter into any hedging derivatives to cover these currency exposures.
The Group uses predominantly forward currency contracts to eliminate or reduce the currency exposure arising from individual capital expenditure projects, such as satellite procurements, tailoring the maturities to each milestone payment. Depending on the functional currency of the entity with the capital expenditure commitment, the foreign currency risk might be in euro or U.S.
dollar. The forward contracts are in the same currency as the hedged item and can cover up to 100% of the total value of the contract. It is the Group’s policy not to enter into forward contracts until a firm commitment is in place, and to match the terms of the hedge derivatives to those of the hedged item to maximize effectiveness.
1) Cash flow hedges in relation to contracted commitments for capital expenditure
At December 31, 2015 (2014: nil) the Group held forward exchange contracts designated as hedges, relating to the capital expenditure for the procurement of the SES-14 satellite.
2) Hedge of net investment in foreign operations At December 31, 2015 and 2014, certain borrowings denominated in U.S. dollars were designated as hedges of the net investments in SES Americom, Inc., SES Holdings (Netherlands) BV and SES Satellite Leasing Limited to hedge the Group’s exposure to foreign exchange risk on these investments. As at December 31, 2015, all designated net investment hedges were assessed to be highly effective and a total loss of EUR 150.9 million net of tax of EUR 64.6 million (2014: loss of EUR 158.6 million net of tax of EUR 67.3 million) is included in equity accounts.
The following table demonstrates the hedged portion of USD statement of financial position exposure:
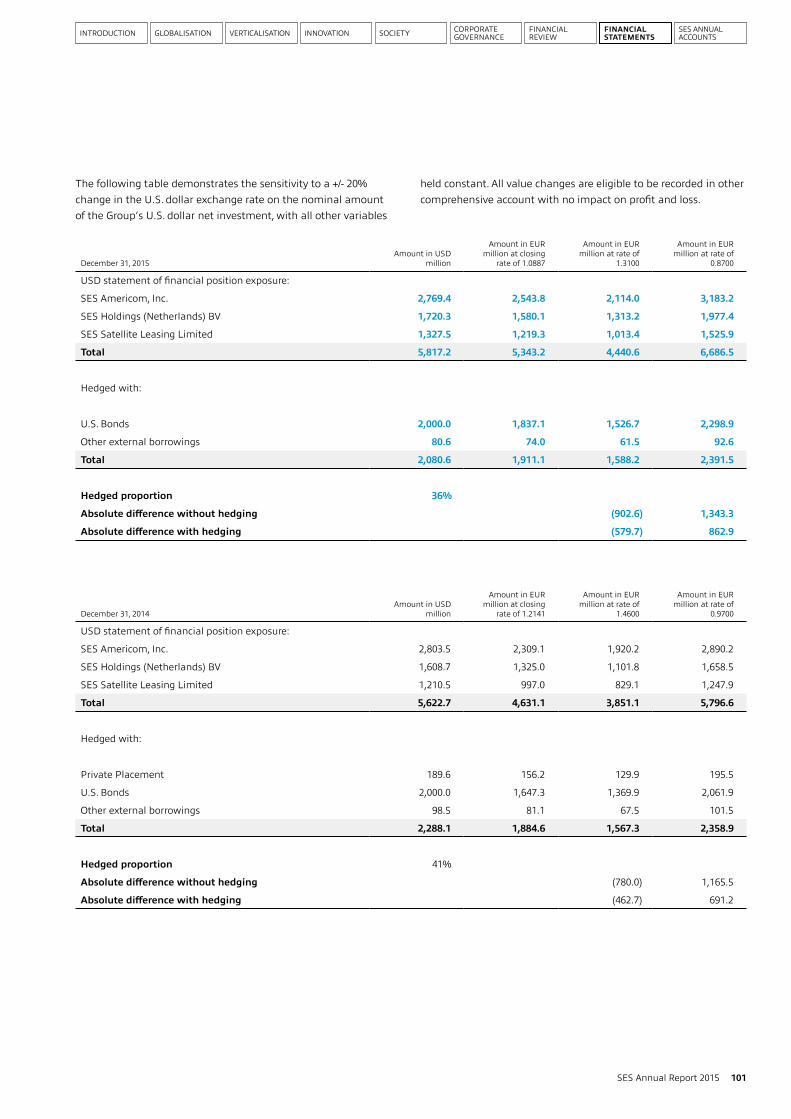
INTRODUCTION GLOBALISATION VERTICALISATION SOCIETYINNOVATION CORPORATE GOVERNANCE
FINANCIAL REVIEW
FINANCIAL STATEMENTS
SES ANNUAL ACCOUNTS
December 31, 2015Amount in USD
million
Amount in EUR million at closing
rate of 1.0887
Amount in EUR million at rate of
1.3100
Amount in EUR million at rate of
0.8700
USD statement of financial position exposure:
SES Americom, Inc. 2,769.4 2,543.8 2,114.0 3,183.2
SES Holdings (Netherlands) BV 1,720.3 1,580.1 1,313.2 1,977.4
SES Satellite Leasing Limited 1,327.5 1,219.3 1,013.4 1,525.9
Total 5,817.2 5,343.2 4,440.6 6,686.5
Hedged with:
U.S. Bonds 2,000.0 1,837.1 1,526.7 2,298.9
Other external borrowings 80.6 74.0 61.5 92.6
Total 2,080.6 1,911.1 1,588.2 2,391.5
Hedged proportion 36%
Absolute difference without hedging (902.6) 1,343.3
Absolute difference with hedging (579.7) 862.9
December 31, 2014Amount in USD
million
Amount in EUR million at closing
rate of 1.2141
Amount in EUR million at rate of
1.4600
Amount in EUR million at rate of
0.9700
USD statement of financial position exposure:
SES Americom, Inc. 2,803.5 2,309.1 1,920.2 2,890.2
SES Holdings (Netherlands) BV 1,608.7 1,325.0 1,101.8 1,658.5
SES Satellite Leasing Limited 1,210.5 997.0 829.1 1,247.9
Total 5,622.7 4,631.1 3,851.1 5,796.6
Hedged with:
Private Placement 189.6 156.2 129.9 195.5
U.S. Bonds 2,000.0 1,647.3 1,369.9 2,061.9
Other external borrowings 98.5 81.1 67.5 101.5
Total 2,288.1 1,884.6 1,567.3 2,358.9
Hedged proportion 41%
Absolute difference without hedging (780.0) 1,165.5
Absolute difference with hedging (462.7) 691.2
101SES Annual Report 2015
The following table demonstrates the sensitivity to a +/- 20% change in the U.S. dollar exchange rate on the nominal amount of the Group’s U.S. dollar net investment, with all other variables
held constant. All value changes are eligible to be recorded in other comprehensive account with no impact on profit and loss.
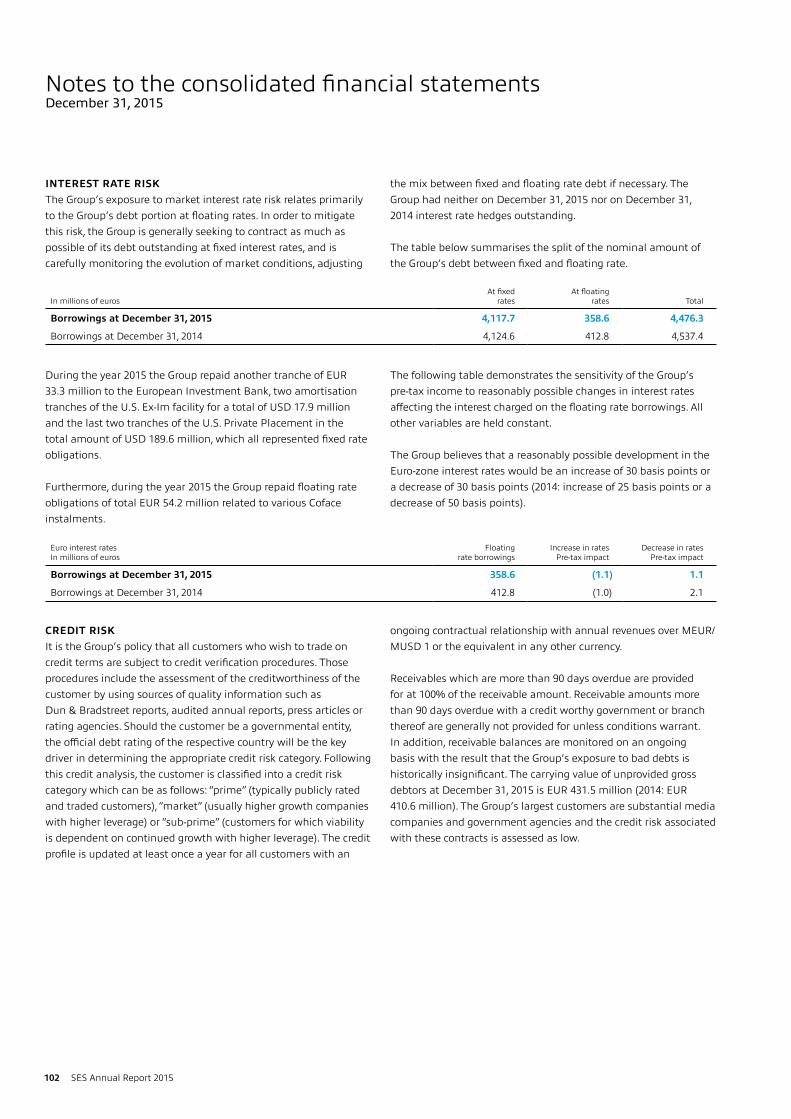
In millions of eurosAt fixed
ratesAt floating
rates Total
Borrowings at December 31, 2015 4,117.7 358.6 4,476.3
Borrowings at December 31, 2014 4,124.6 412.8 4,537.4
Euro interest ratesIn millions of euros
Floating rate borrowings
Increase in rates Pre-tax impact
Decrease in ratesPre-tax impact
Borrowings at December 31, 2015 358.6 (1.1) 1.1
Borrowings at December 31, 2014 412.8 (1.0) 2.1
102 SES Annual Report 2015
Notes to the consolidated financial statementsDecember 31, 2015
INTEREST RATE RISKThe Group’s exposure to market interest rate risk relates primarily to the Group’s debt portion at floating rates. In order to mitigate this risk, the Group is generally seeking to contract as much as possible of its debt outstanding at fixed interest rates, and is carefully monitoring the evolution of market conditions, adjusting
the mix between fixed and floating rate debt if necessary. The Group had neither on December 31, 2015 nor on December 31, 2014 interest rate hedges outstanding.
The table below summarises the split of the nominal amount of the Group’s debt between fixed and floating rate.
During the year 2015 the Group repaid another tranche of EUR 33.3 million to the European Investment Bank, two amortisation tranches of the U.S. Ex-Im facility for a total of USD 17.9 million and the last two tranches of the U.S. Private Placement in the total amount of USD 189.6 million, which all represented fixed rate obligations.
Furthermore, during the year 2015 the Group repaid floating rate obligations of total EUR 54.2 million related to various Coface instalments.
The following table demonstrates the sensitivity of the Group’s pre-tax income to reasonably possible changes in interest rates affecting the interest charged on the floating rate borrowings. All other variables are held constant.
The Group believes that a reasonably possible development in the Euro-zone interest rates would be an increase of 30 basis points or a decrease of 30 basis points (2014: increase of 25 basis points or a decrease of 50 basis points).
CREDIT RISKIt is the Group’s policy that all customers who wish to trade on credit terms are subject to credit verification procedures. Those procedures include the assessment of the creditworthiness of the customer by using sources of quality information such as Dun & Bradstreet reports, audited annual reports, press articles or rating agencies. Should the customer be a governmental entity, the official debt rating of the respective country will be the key driver in determining the appropriate credit risk category. Following this credit analysis, the customer is classified into a credit risk category which can be as follows: “prime” (typically publicly rated and traded customers), “market” (usually higher growth companies with higher leverage) or “sub-prime” (customers for which viability is dependent on continued growth with higher leverage). The credit profile is updated at least once a year for all customers with an
ongoing contractual relationship with annual revenues over MEUR/MUSD 1 or the equivalent in any other currency.
Receivables which are more than 90 days overdue are provided for at 100% of the receivable amount. Receivable amounts more than 90 days overdue with a credit worthy government or branch thereof are generally not provided for unless conditions warrant. In addition, receivable balances are monitored on an ongoing basis with the result that the Group’s exposure to bad debts is historically insignificant. The carrying value of unprovided gross debtors at December 31, 2015 is EUR 431.5 million (2014: EUR 410.6 million). The Group’s largest customers are substantial media companies and government agencies and the credit risk associated with these contracts is assessed as low.
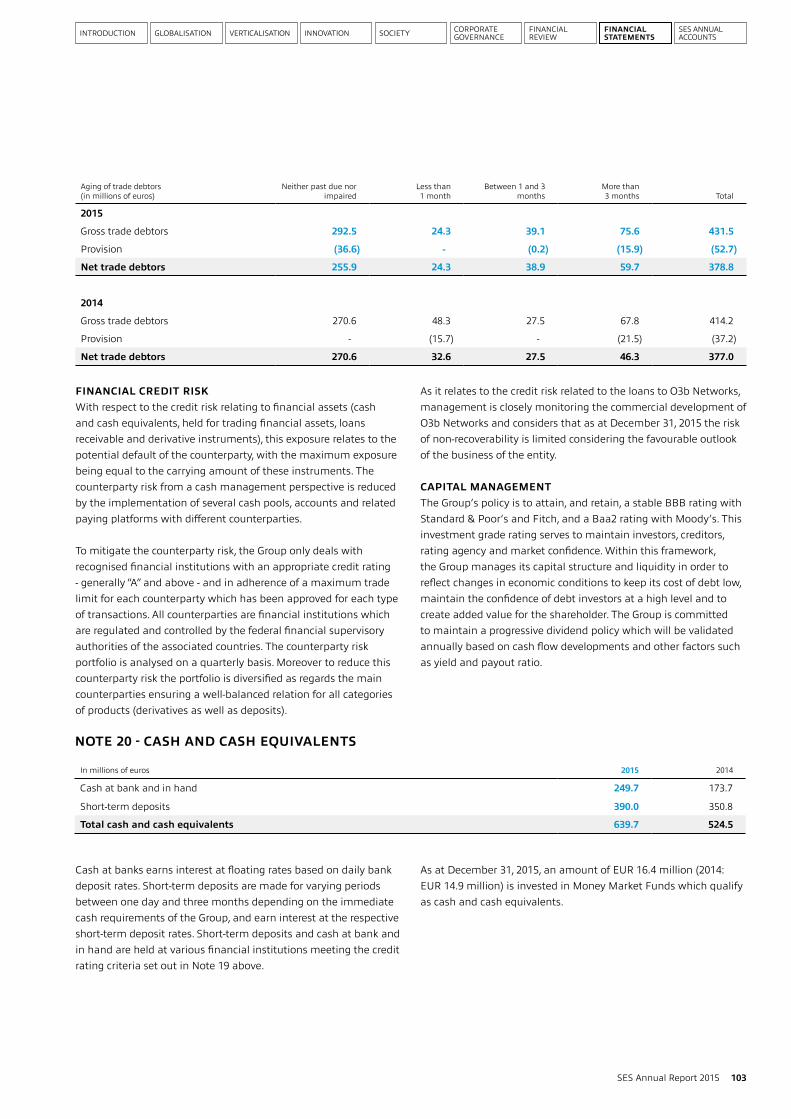
INTRODUCTION GLOBALISATION VERTICALISATION SOCIETYINNOVATION CORPORATE GOVERNANCE
FINANCIAL REVIEW
FINANCIAL STATEMENTS
SES ANNUAL ACCOUNTS
Aging of trade debtors (in millions of euros)
Neither past due nor impaired
Less than1 month
Between 1 and 3 months
More than3 months Total
2015
Gross trade debtors 292.5 24.3 39.1 75.6 431.5
Provision (36.6) - (0.2) (15.9) (52.7)
Net trade debtors 255.9 24.3 38.9 59.7 378.8
2014
Gross trade debtors 270.6 48.3 27.5 67.8 414.2
Provision - (15.7) - (21.5) (37.2)
Net trade debtors 270.6 32.6 27.5 46.3 377.0
In millions of euros 2015 2014
Cash at bank and in hand 249.7 173.7
Short-term deposits 390.0 350.8
Total cash and cash equivalents 639.7 524.5
NOTE 20 - CASH AND CASH EQUIVALENTS
103SES Annual Report 2015
FINANCIAL CREDIT RISKWith respect to the credit risk relating to financial assets (cash and cash equivalents, held for trading financial assets, loans receivable and derivative instruments), this exposure relates to the potential default of the counterparty, with the maximum exposure being equal to the carrying amount of these instruments. The counterparty risk from a cash management perspective is reduced by the implementation of several cash pools, accounts and related paying platforms with different counterparties.
To mitigate the counterparty risk, the Group only deals with recognised financial institutions with an appropriate credit rating - generally “A” and above - and in adherence of a maximum trade limit for each counterparty which has been approved for each type of transactions. All counterparties are financial institutions which are regulated and controlled by the federal financial supervisory authorities of the associated countries. The counterparty risk portfolio is analysed on a quarterly basis. Moreover to reduce this counterparty risk the portfolio is diversified as regards the main counterparties ensuring a well-balanced relation for all categories of products (derivatives as well as deposits).
As it relates to the credit risk related to the loans to O3b Networks, management is closely monitoring the commercial development of O3b Networks and considers that as at December 31, 2015 the risk of non-recoverability is limited considering the favourable outlook of the business of the entity.
CAPITAL MANAGEMENTThe Group’s policy is to attain, and retain, a stable BBB rating with Standard & Poor’s and Fitch, and a Baa2 rating with Moody’s. This investment grade rating serves to maintain investors, creditors, rating agency and market confidence. Within this framework, the Group manages its capital structure and liquidity in order to reflect changes in economic conditions to keep its cost of debt low, maintain the confidence of debt investors at a high level and to create added value for the shareholder. The Group is committed to maintain a progressive dividend policy which will be validated annually based on cash flow developments and other factors such as yield and payout ratio.
Cash at banks earns interest at floating rates based on daily bank deposit rates. Short-term deposits are made for varying periods between one day and three months depending on the immediate cash requirements of the Group, and earn interest at the respective short-term deposit rates. Short-term deposits and cash at bank and in hand are held at various financial institutions meeting the credit rating criteria set out in Note 19 above.
As at December 31, 2015, an amount of EUR 16.4 million (2014: EUR 14.9 million) is invested in Money Market Funds which qualify as cash and cash equivalents.
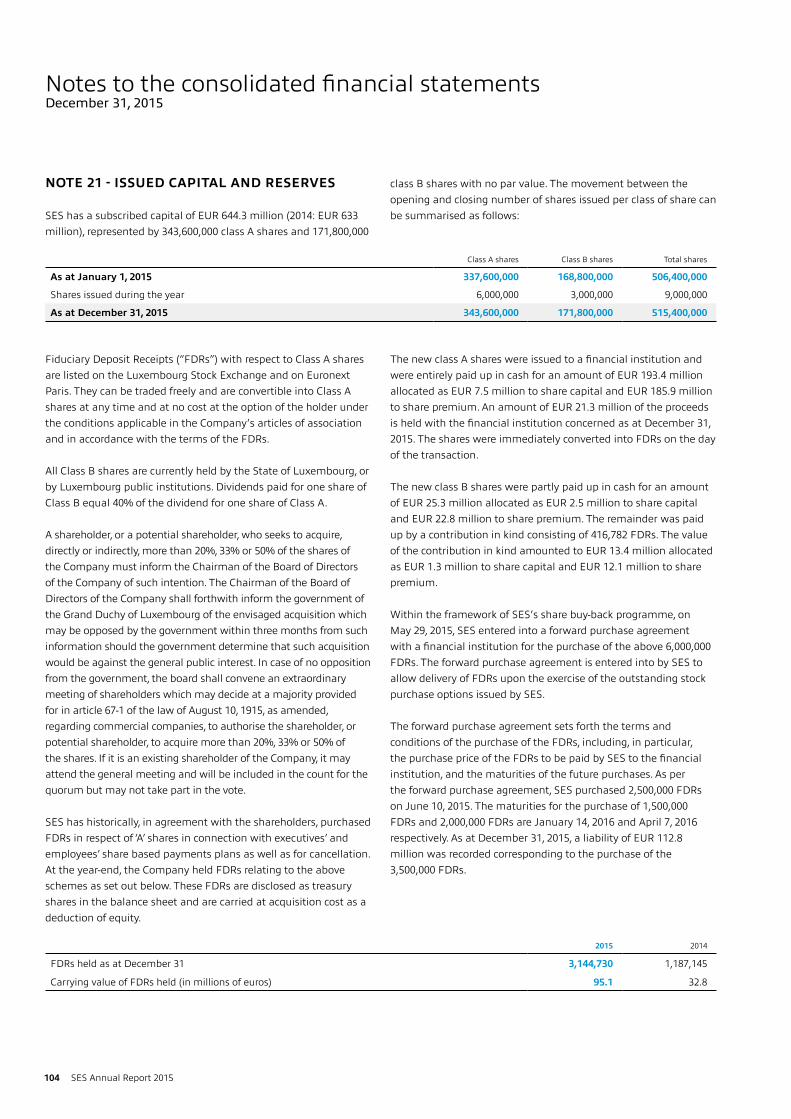
Class A shares Class B shares Total shares
As at January 1, 2015 337,600,000 168,800,000 506,400,000
Shares issued during the year 6,000,000 3,000,000 9,000,000
As at December 31, 2015 343,600,000 171,800,000 515,400,000
2015 2014
FDRs held as at December 31 3,144,730 1,187,145
Carrying value of FDRs held (in millions of euros) 95.1 32.8
104 SES Annual Report 2015
Notes to the consolidated financial statementsDecember 31, 2015
NOTE 21 - ISSUED CAPITAL AND RESERVES
SES has a subscribed capital of EUR 644.3 million (2014: EUR 633 million), represented by 343,600,000 class A shares and 171,800,000
class B shares with no par value. The movement between the opening and closing number of shares issued per class of share can be summarised as follows:
Fiduciary Deposit Receipts (“FDRs”) with respect to Class A shares are listed on the Luxembourg Stock Exchange and on Euronext Paris. They can be traded freely and are convertible into Class A shares at any time and at no cost at the option of the holder under the conditions applicable in the Company’s articles of association and in accordance with the terms of the FDRs.
All Class B shares are currently held by the State of Luxembourg, or by Luxembourg public institutions. Dividends paid for one share of Class B equal 40% of the dividend for one share of Class A.
A shareholder, or a potential shareholder, who seeks to acquire, directly or indirectly, more than 20%, 33% or 50% of the shares of the Company must inform the Chairman of the Board of Directors of the Company of such intention. The Chairman of the Board of Directors of the Company shall forthwith inform the government of the Grand Duchy of Luxembourg of the envisaged acquisition which may be opposed by the government within three months from such information should the government determine that such acquisition would be against the general public interest. In case of no opposition from the government, the board shall convene an extraordinary meeting of shareholders which may decide at a majority provided for in article 67-1 of the law of August 10, 1915, as amended, regarding commercial companies, to authorise the shareholder, or potential shareholder, to acquire more than 20%, 33% or 50% of the shares. If it is an existing shareholder of the Company, it may attend the general meeting and will be included in the count for the quorum but may not take part in the vote.
SES has historically, in agreement with the shareholders, purchased FDRs in respect of ‘A’ shares in connection with executives’ and employees’ share based payments plans as well as for cancellation. At the year-end, the Company held FDRs relating to the above schemes as set out below. These FDRs are disclosed as treasury shares in the balance sheet and are carried at acquisition cost as a deduction of equity.
The new class A shares were issued to a financial institution and were entirely paid up in cash for an amount of EUR 193.4 million allocated as EUR 7.5 million to share capital and EUR 185.9 million to share premium. An amount of EUR 21.3 million of the proceeds is held with the financial institution concerned as at December 31, 2015. The shares were immediately converted into FDRs on the day of the transaction.
The new class B shares were partly paid up in cash for an amount of EUR 25.3 million allocated as EUR 2.5 million to share capital and EUR 22.8 million to share premium. The remainder was paid up by a contribution in kind consisting of 416,782 FDRs. The value of the contribution in kind amounted to EUR 13.4 million allocated as EUR 1.3 million to share capital and EUR 12.1 million to share premium.
Within the framework of SES’s share buy-back programme, on May 29, 2015, SES entered into a forward purchase agreement with a financial institution for the purchase of the above 6,000,000 FDRs. The forward purchase agreement is entered into by SES to allow delivery of FDRs upon the exercise of the outstanding stock purchase options issued by SES.
The forward purchase agreement sets forth the terms and conditions of the purchase of the FDRs, including, in particular, the purchase price of the FDRs to be paid by SES to the financial institution, and the maturities of the future purchases. As per the forward purchase agreement, SES purchased 2,500,000 FDRs on June 10, 2015. The maturities for the purchase of 1,500,000 FDRs and 2,000,000 FDRs are January 14, 2016 and April 7, 2016 respectively. As at December 31, 2015, a liability of EUR 112.8 million was recorded corresponding to the purchase of the 3,500,000 FDRs.
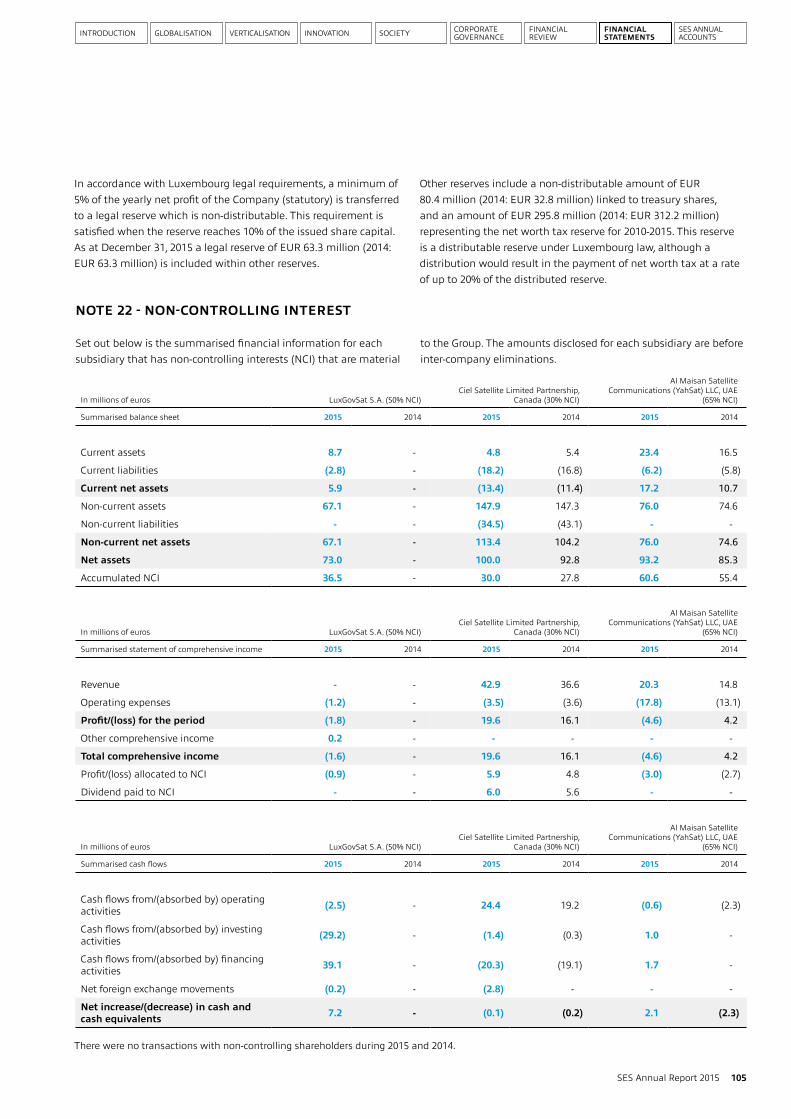
INTRODUCTION GLOBALISATION VERTICALISATION SOCIETYINNOVATION CORPORATE GOVERNANCE
FINANCIAL REVIEW
FINANCIAL STATEMENTS
SES ANNUAL ACCOUNTS
In millions of euros LuxGovSat S.A. (50% NCI)Ciel Satellite Limited Partnership,
Canada (30% NCI)
Al Maisan Satellite Communications (YahSat) LLC, UAE
(65% NCI)
Summarised balance sheet 2015 2014 2015 2014 2015 2014
Current assets 8.7 - 4.8 5.4 23.4 16.5
Current liabilities (2.8) - (18.2) (16.8) (6.2) (5.8)
Current net assets 5.9 - (13.4) (11.4) 17.2 10.7
Non-current assets 67.1 - 147.9 147.3 76.0 74.6
Non-current liabilities - - (34.5) (43.1) - -
Non-current net assets 67.1 - 113.4 104.2 76.0 74.6
Net assets 73.0 - 100.0 92.8 93.2 85.3
Accumulated NCI 36.5 - 30.0 27.8 60.6 55.4
In millions of euros LuxGovSat S.A. (50% NCI)Ciel Satellite Limited Partnership,
Canada (30% NCI)
Al Maisan Satellite Communications (YahSat) LLC, UAE
(65% NCI)
Summarised statement of comprehensive income 2015 2014 2015 2014 2015 2014
Revenue - - 42.9 36.6 20.3 14.8
Operating expenses (1.2) - (3.5) (3.6) (17.8) (13.1)
Profit/(loss) for the period (1.8) - 19.6 16.1 (4.6) 4.2
Other comprehensive income 0.2 - - - - -
Total comprehensive income (1.6) - 19.6 16.1 (4.6) 4.2
Profit/(loss) allocated to NCI (0.9) - 5.9 4.8 (3.0) (2.7)
Dividend paid to NCI - - 6.0 5.6 - -
In millions of euros LuxGovSat S.A. (50% NCI)Ciel Satellite Limited Partnership,
Canada (30% NCI)
Al Maisan Satellite Communications (YahSat) LLC, UAE
(65% NCI)
Summarised cash flows 2015 2014 2015 2014 2015 2014
Cash flows from/(absorbed by) operating activities (2.5) - 24.4 19.2 (0.6) (2.3)
Cash flows from/(absorbed by) investing activities (29.2) - (1.4) (0.3) 1.0 -
Cash flows from/(absorbed by) financing activities 39.1 - (20.3) (19.1) 1.7 -
Net foreign exchange movements (0.2) - (2.8) - - -
Net increase/(decrease) in cash and cash equivalents 7.2 - (0.1) (0.2) 2.1 (2.3)
There were no transactions with non-controlling shareholders during 2015 and 2014.
105SES Annual Report 2015
NOTE 22 - NON-CONTROLLING INTEREST
Set out below is the summarised financial information for each subsidiary that has non-controlling interests (NCI) that are material
to the Group. The amounts disclosed for each subsidiary are before inter-company eliminations.
In accordance with Luxembourg legal requirements, a minimum of 5% of the yearly net profit of the Company (statutory) is transferred to a legal reserve which is non-distributable. This requirement is satisfied when the reserve reaches 10% of the issued share capital. As at December 31, 2015 a legal reserve of EUR 63.3 million (2014: EUR 63.3 million) is included within other reserves.
Other reserves include a non-distributable amount of EUR 80.4 million (2014: EUR 32.8 million) linked to treasury shares, and an amount of EUR 295.8 million (2014: EUR 312.2 million) representing the net worth tax reserve for 2010-2015. This reserve is a distributable reserve under Luxembourg law, although a distribution would result in the payment of net worth tax at a rate of up to 20% of the distributed reserve.
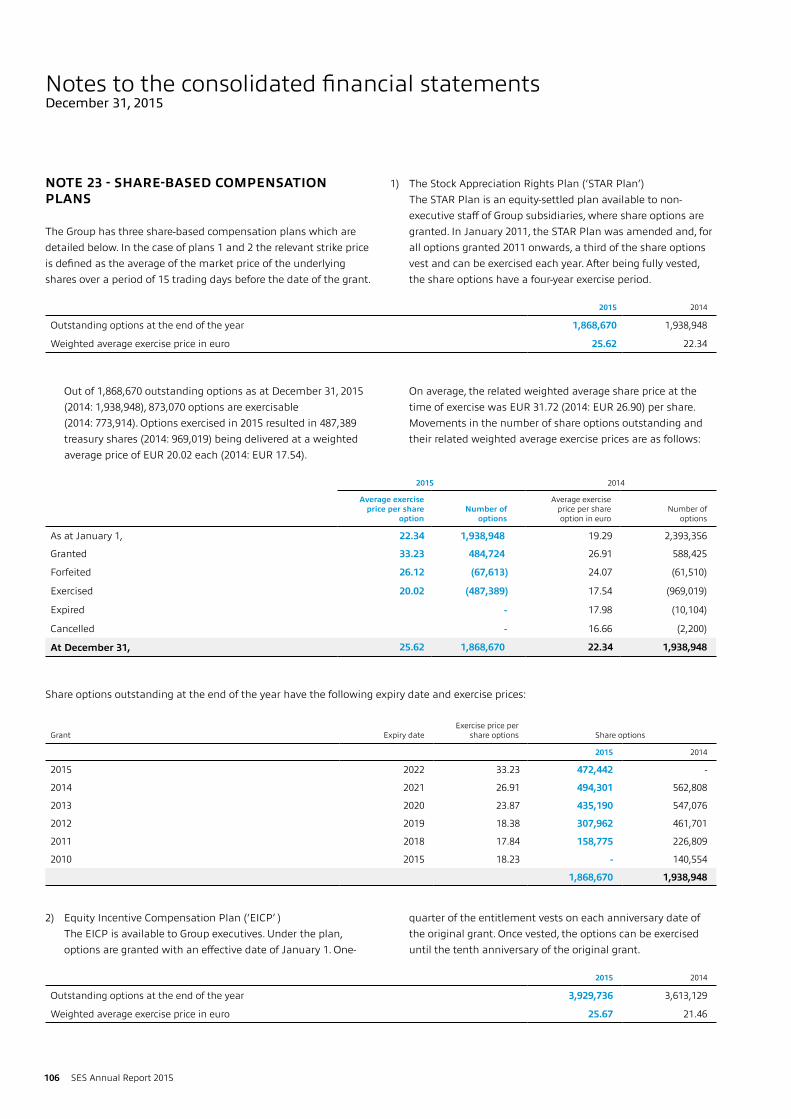
2015 2014
Outstanding options at the end of the year 1,868,670 1,938,948
Weighted average exercise price in euro 25.62 22.34
2015 2014
Outstanding options at the end of the year 3,929,736 3,613,129
Weighted average exercise price in euro 25.67 21.46
2015 2014
Average exercise price per share
optionNumber of
options
Average exercise price per share option in euro
Number of options
As at January 1, 22.34 1,938,948 19.29 2,393,356
Granted 33.23 484,724 26.91 588,425
Forfeited 26.12 (67,613) 24.07 (61,510)
Exercised 20.02 (487,389) 17.54 (969,019)
Expired - 17.98 (10,104)
Cancelled - 16.66 (2,200)
At December 31, 25.62 1,868,670 22.34 1,938,948
Grant Expiry date Exercise price per
share options Share options
2015 2014
2015 2022 33.23 472,442 -
2014 2021 26.91 494,301 562,808
2013 2020 23.87 435,190 547,076
2012 2019 18.38 307,962 461,701
2011 2018 17.84 158,775 226,809
2010 2015 18.23 - 140,554
1,868,670 1,938,948
106 SES Annual Report 2015
Out of 1,868,670 outstanding options as at December 31, 2015 (2014: 1,938,948), 873,070 options are exercisable
(2014: 773,914). Options exercised in 2015 resulted in 487,389 treasury shares (2014: 969,019) being delivered at a weighted average price of EUR 20.02 each (2014: EUR 17.54).
On average, the related weighted average share price at the time of exercise was EUR 31.72 (2014: EUR 26.90) per share.
Movements in the number of share options outstanding and their related weighted average exercise prices are as follows:
2) Equity Incentive Compensation Plan (‘EICP’ ) The EICP is available to Group executives. Under the plan,
options are granted with an effective date of January 1. One-
quarter of the entitlement vests on each anniversary date of the original grant. Once vested, the options can be exercised until the tenth anniversary of the original grant.
Share options outstanding at the end of the year have the following expiry date and exercise prices:
NOTE 23 - SHARE-BASED COMPENSATION PLANS
The Group has three share-based compensation plans which are detailed below. In the case of plans 1 and 2 the relevant strike price is defined as the average of the market price of the underlying shares over a period of 15 trading days before the date of the grant.
1) The Stock Appreciation Rights Plan (‘STAR Plan’) The STAR Plan is an equity-settled plan available to non-
executive staff of Group subsidiaries, where share options are granted. In January 2011, the STAR Plan was amended and, for all options granted 2011 onwards, a third of the share options vest and can be exercised each year. After being fully vested, the share options have a four-year exercise period.
Notes to the consolidated financial statementsDecember 31, 2015
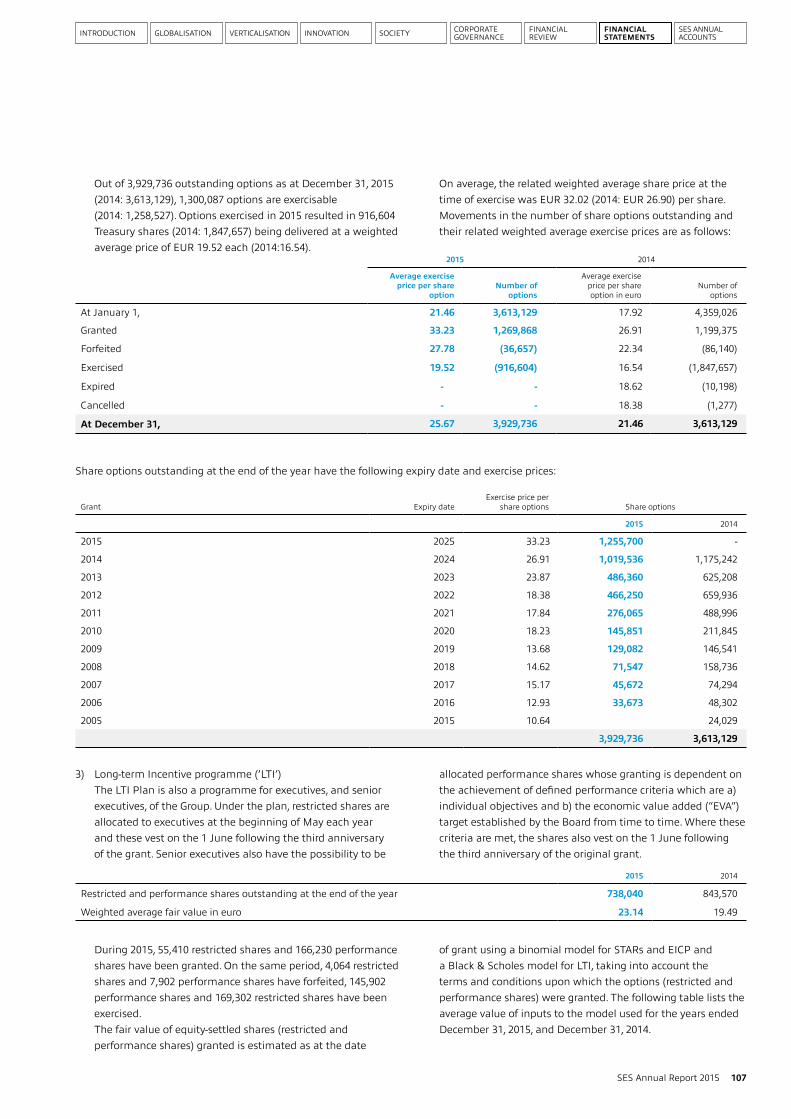
INTRODUCTION GLOBALISATION VERTICALISATION SOCIETYINNOVATION CORPORATE GOVERNANCE
FINANCIAL REVIEW
FINANCIAL STATEMENTS
SES ANNUAL ACCOUNTS
2015 2014
Restricted and performance shares outstanding at the end of the year 738,040 843,570
Weighted average fair value in euro 23.14 19.49
2015 2014
Average exercise price per share
optionNumber of
options
Average exercise price per share option in euro
Number of options
At January 1, 21.46 3,613,129 17.92 4,359,026
Granted 33.23 1,269,868 26.91 1,199,375
Forfeited 27.78 (36,657) 22.34 (86,140)
Exercised 19.52 (916,604) 16.54 (1,847,657)
Expired - - 18.62 (10,198)
Cancelled - - 18.38 (1,277)
At December 31, 25.67 3,929,736 21.46 3,613,129
Grant Expiry date Exercise price per
share options Share options
2015 2014
2015 2025 33.23 1,255,700 -
2014 2024 26.91 1,019,536 1,175,242
2013 2023 23.87 486,360 625,208
2012 2022 18.38 466,250 659,936
2011 2021 17.84 276,065 488,996
2010 2020 18.23 145,851 211,845
2009 2019 13.68 129,082 146,541
2008 2018 14.62 71,547 158,736
2007 2017 15.17 45,672 74,294
2006 2016 12.93 33,673 48,302
2005 2015 10.64 24,029
3,929,736 3,613,129
107SES Annual Report 2015
Out of 3,929,736 outstanding options as at December 31, 2015 (2014: 3,613,129), 1,300,087 options are exercisable
(2014: 1,258,527). Options exercised in 2015 resulted in 916,604 Treasury shares (2014: 1,847,657) being delivered at a weighted average price of EUR 19.52 each (2014:16.54).
On average, the related weighted average share price at the time of exercise was EUR 32.02 (2014: EUR 26.90) per share.
Movements in the number of share options outstanding and their related weighted average exercise prices are as follows:
3) Long-term Incentive programme (‘LTI’) The LTI Plan is also a programme for executives, and senior
executives, of the Group. Under the plan, restricted shares are allocated to executives at the beginning of May each year and these vest on the 1 June following the third anniversary of the grant. Senior executives also have the possibility to be
allocated performance shares whose granting is dependent on the achievement of defined performance criteria which are a) individual objectives and b) the economic value added (“EVA”) target established by the Board from time to time. Where these criteria are met, the shares also vest on the 1 June following the third anniversary of the original grant.
During 2015, 55,410 restricted shares and 166,230 performance shares have been granted. On the same period, 4,064 restricted shares and 7,902 performance shares have forfeited, 145,902 performance shares and 169,302 restricted shares have been exercised.
The fair value of equity-settled shares (restricted and performance shares) granted is estimated as at the date
of grant using a binomial model for STARs and EICP and a Black & Scholes model for LTI, taking into account the terms and conditions upon which the options (restricted and performance shares) were granted. The following table lists the average value of inputs to the model used for the years ended December 31, 2015, and December 31, 2014.
Share options outstanding at the end of the year have the following expiry date and exercise prices:

2015 EICP STARs LTI
Dividend yield (%) 5.50% 5.50% 4.84%
Expected volatility (%) 23.90% 23.90% 19.29%
Risk-free interest rate (%) 0.13% 0.13% -0.07%
Expected life of options (years) 9.67 7 3
Share price at inception (EUR) 31.00 31.00 31.00
Fair value per option/share (EUR) 2.64-2.79 2.63-2.73 26.7
Total expected cost for each plan (in millions of euros) 3.1 1.2 5.1
2014 EICP STARs LTI
Dividend yield (%) 5.73% 5.73% 5.06%
Expected volatility (%) 28.82% 28.82% 20.11%
Risk-free interest rate (%) 0.70% 0.70% 0.36%
Expected life of options (years) 9.67 7 3
Share price at inception (EUR) 27.06 27.06 27.06
Fair value per option/share (EUR) 3.52-3.87 3.55-3.81 23.55
Total expected cost for each plan (in millions of euros) 4.1 2.0 6.3
The expected life of options is based on historical data and is not necessarily indicative of exercise patterns that may occur. The expected volatility reflects the assumption that the historical volatility is indicative of future trends, which may or may not
necessarily be the actual outcome. The total charge for the period for share-based compensation payments amounted to EUR 10.6 million (2014: EUR 11.3 million).
108 SES Annual Report 2015
Notes to the consolidated financial statementsDecember 31, 2015
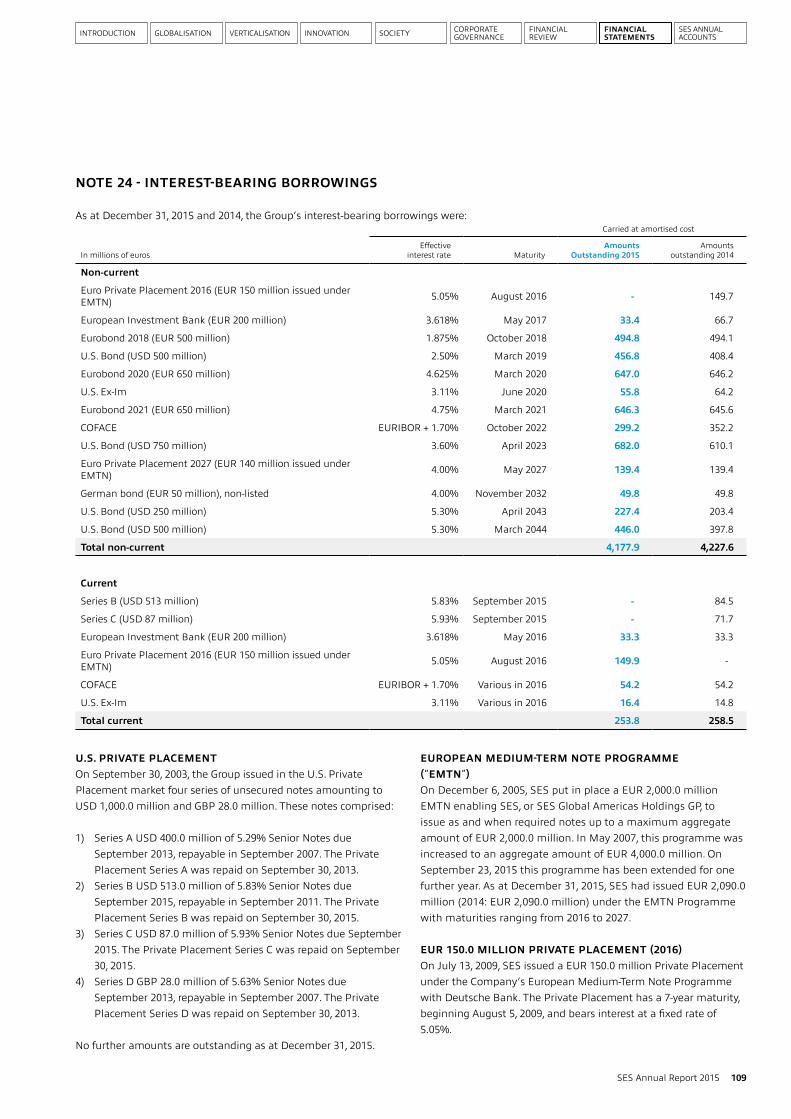
INTRODUCTION GLOBALISATION VERTICALISATION SOCIETYINNOVATION CORPORATE GOVERNANCE
FINANCIAL REVIEW
FINANCIAL STATEMENTS
SES ANNUAL ACCOUNTS
NOTE 24 - INTEREST-BEARING BORROWINGS
As at December 31, 2015 and 2014, the Group’s interest-bearing borrowings were:Carried at amortised cost
In millions of eurosEffective
interest rate MaturityAmounts
Outstanding 2015Amounts
outstanding 2014
Non-current
Euro Private Placement 2016 (EUR 150 million issued under EMTN) 5.05% August 2016 - 149.7
European Investment Bank (EUR 200 million) 3.618% May 2017 33.4 66.7
Eurobond 2018 (EUR 500 million) 1.875% October 2018 494.8 494.1
U.S. Bond (USD 500 million) 2.50% March 2019 456.8 408.4
Eurobond 2020 (EUR 650 million) 4.625% March 2020 647.0 646.2
U.S. Ex-Im 3.11% June 2020 55.8 64.2
Eurobond 2021 (EUR 650 million) 4.75% March 2021 646.3 645.6
COFACE EURIBOR + 1.70% October 2022 299.2 352.2
U.S. Bond (USD 750 million) 3.60% April 2023 682.0 610.1
Euro Private Placement 2027 (EUR 140 million issued under EMTN) 4.00% May 2027 139.4 139.4
German bond (EUR 50 million), non-listed 4.00% November 2032 49.8 49.8
U.S. Bond (USD 250 million) 5.30% April 2043 227.4 203.4
U.S. Bond (USD 500 million) 5.30% March 2044 446.0 397.8
Total non-current 4,177.9 4,227.6
Current
Series B (USD 513 million) 5.83% September 2015 - 84.5
Series C (USD 87 million) 5.93% September 2015 - 71.7
European Investment Bank (EUR 200 million) 3.618% May 2016 33.3 33.3
Euro Private Placement 2016 (EUR 150 million issued under EMTN) 5.05% August 2016 149.9 -
COFACE EURIBOR + 1.70% Various in 2016 54.2 54.2
U.S. Ex-Im 3.11% Various in 2016 16.4 14.8
Total current 253.8 258.5
109SES Annual Report 2015
U.S. PRIVATE PLACEMENTOn September 30, 2003, the Group issued in the U.S. Private Placement market four series of unsecured notes amounting to USD 1,000.0 million and GBP 28.0 million. These notes comprised:
1) Series A USD 400.0 million of 5.29% Senior Notes due September 2013, repayable in September 2007. The Private Placement Series A was repaid on September 30, 2013.
2) Series B USD 513.0 million of 5.83% Senior Notes due September 2015, repayable in September 2011. The Private Placement Series B was repaid on September 30, 2015.
3) Series C USD 87.0 million of 5.93% Senior Notes due September 2015. The Private Placement Series C was repaid on September 30, 2015.
4) Series D GBP 28.0 million of 5.63% Senior Notes due September 2013, repayable in September 2007. The Private Placement Series D was repaid on September 30, 2013.
No further amounts are outstanding as at December 31, 2015.
EUROPEAN MEDIUM-TERM NOTE PROGRAMME (“EMTN”)On December 6, 2005, SES put in place a EUR 2,000.0 million EMTN enabling SES, or SES Global Americas Holdings GP, to issue as and when required notes up to a maximum aggregate amount of EUR 2,000.0 million. In May 2007, this programme was increased to an aggregate amount of EUR 4,000.0 million. On September 23, 2015 this programme has been extended for one further year. As at December 31, 2015, SES had issued EUR 2,090.0 million (2014: EUR 2,090.0 million) under the EMTN Programme with maturities ranging from 2016 to 2027.
EUR 150.0 MILLION PRIVATE PLACEMENT (2016)On July 13, 2009, SES issued a EUR 150.0 million Private Placement under the Company’s European Medium-Term Note Programme with Deutsche Bank. The Private Placement has a 7-year maturity, beginning August 5, 2009, and bears interest at a fixed rate of 5.05%.
110 SES Annual Report 2015
Notes to the consolidated financial statementsDecember 31, 2015
EUR 500.0 MILLION EUROBOND (2018)On October 16, 2013, SES issued a EUR 500.0 million bond under the Company’s European Medium-Term Note Programme. The bond has a 5-year maturity and bears interest at a fixed rate of 1.875%.
144A BOND USD 500 MILLION (2019) On March 25, 2014, SES completed a 144A offering in the U.S. market issuing USD 500 million 5-year bond with a coupon of 2.50% and a final maturity date of March 25, 2019.
EUR 650.0 MILLION EUROBOND (2020)On March 9, 2010 (pricing March 1, 2010), SES issued a EUR 650.0 million bond under the Company’s European Medium-Term Note Programme. The bond has a 10-year maturity and bears interest at a fixed rate of 4.625%.
EUR 650.0 MILLION EUROBOND (2021)On March 11, 2011 (pricing March 2, 2011), SES issued a EUR 650.0 million bond under the Company’s European Medium-Term Note Programme. The bond has a 10-year maturity and bears interest at a fixed rate of 4.75%.
EUR 140.0 MILLION PRIVATE PLACEMENT (2027)Between May and July 2012, SES issued three individual tranches of a total EUR 140.0 million Private Placement under the Company's European Medium-Term Note Programme with ING Bank N.V. The Private Placement has a 15-year maturity, beginning May 31, 2012, and bears interest at a fixed rate of 4.00%.
EUR 200.0 MILLION EUROPEAN INVESTMENT BANK FUNDINGOn April 21, 2009, SES signed a financing agreement with the European Investment Bank concerning the investment by the Group in certain satellite investment projects. This facility, bearing interest at a fixed rate of 3.618%, is repayable in six annual instalments between May 2012 and May 2017.
GERMAN BOND ISSUE OF EUR 50.0 MILLIONOn October 29, 2012, the Group signed an agreement to issue EUR 50 million in the German bond (“Schuldschein”) market. The German bond bears a fixed interest rate of 4.0% and matures on November 12, 2032.
144A BOND USD 750.0 MILLION (2023)On April 4, 2013, SES completed a 144A offering in the U.S. market issuing USD 750 million 10-year bond with a coupon of 3.60% and a final maturity date on April 4, 2023.
144A BOND USD 250.0 MILLION (2043)On April 4, 2013, SES completed a 144A offering in the U.S. market issuing USD 250 million 30-year bond with a coupon of 5.30% and a final maturity date on April 4, 2043.
144A BOND USD 500.0 MILLION (2044) On March 25, 2014, SES completed a 144A offering in the U.S. market issuing USD 500 million 30-year bond with a coupon of 5.30% and a final maturity date of March 25, 2044.
SYNDICATED LOAN 2021In January 2014, the Group updated its previous syndicated loan facility (“Syndicated loan 2015”). The updated facility is being provided by 20 banks and has been structured as a 5 year multicurrency revolving credit facility with two one-year extension options at the discretion of the lenders. The facility is for EUR 1.2 billion and the interest payable is linked to a ratings grid. At the current SES rating of BBB / Baa2, the interest rate is 45 basis points over EURIBOR/LIBOR. On November 13, 2015 and November 23, 2015 respectively, the facility agreement has been amended and extended by one year to January 13, 2021. As at December 31, 2015 and 2014, no amount drawn from this facility.
EUR 522.9 MILLION COFACE FACILITYOn December 16, 2009, SES signed a financing agreement with COFACE (Compagnie Française d‘Assurance pour le Commerce Extérieur) in respect of the investment in four geostationary satellites (ASTRA 2E, ASTRA 2F, ASTRA 2G, ASTRA 5B). The facility is divided into five loans. The drawings under the facility are based on invoices from the supplier of the satellites. The first drawing was done on April 23, 2010 and all loan tranches became fully drawn in November 2014 Each Coface tranche is repayable in 17 equal semi-annual installments where Coface A has a final maturity date of August 1, 2022, Coface B and F are maturing on May 21, 2021 and Coface C and D are maturing on October 3, 2022. The entire facility bears interest at a floating rate of six month EURIBOR plus a margin of 1.7%.
USD 158.0 MILLION U.S. EX-IM FACILITYIn April 2011, SES signed a financing agreement with Ex-Im Bank (Export-Import Bank of the United States) over USD 158 million for the investment in one geostationary satellite (QuetzSat). At the in-orbit acceptance date of the satellite, the facility was fully drawn with USD 152.2 million which will be repaid in 17 equal semi-annual instalments starting on June 22, 2012. The loan has a final maturity date of June 22, 2020 and bears interest at a fixed rate of 3.11%.
FRENCH COMMERCIAL PAPER PROGRAMMEOn October 25, 2005, SES put in place a EUR 500.0 million “Programme de Titres de Créances Négociables” in the French market where the Company issued “Billets de Trésorerie” (commercial paper) in accordance with articles L.213-1 to L213-4 of the French Monetary and Financial Code and decree n°92.137 of February 13, 1992 and all subsequent regulations. The maximum outstanding amount of ‘Billet de Trésorerie’ issuable under the programme is EUR 500.0 million or its counter value at the date of issue in any other authorised currency. On June 5, 2015, this programme was extended for one further year. As at December 31, 2015 and 2014, no borrowings were outstanding under this programme.
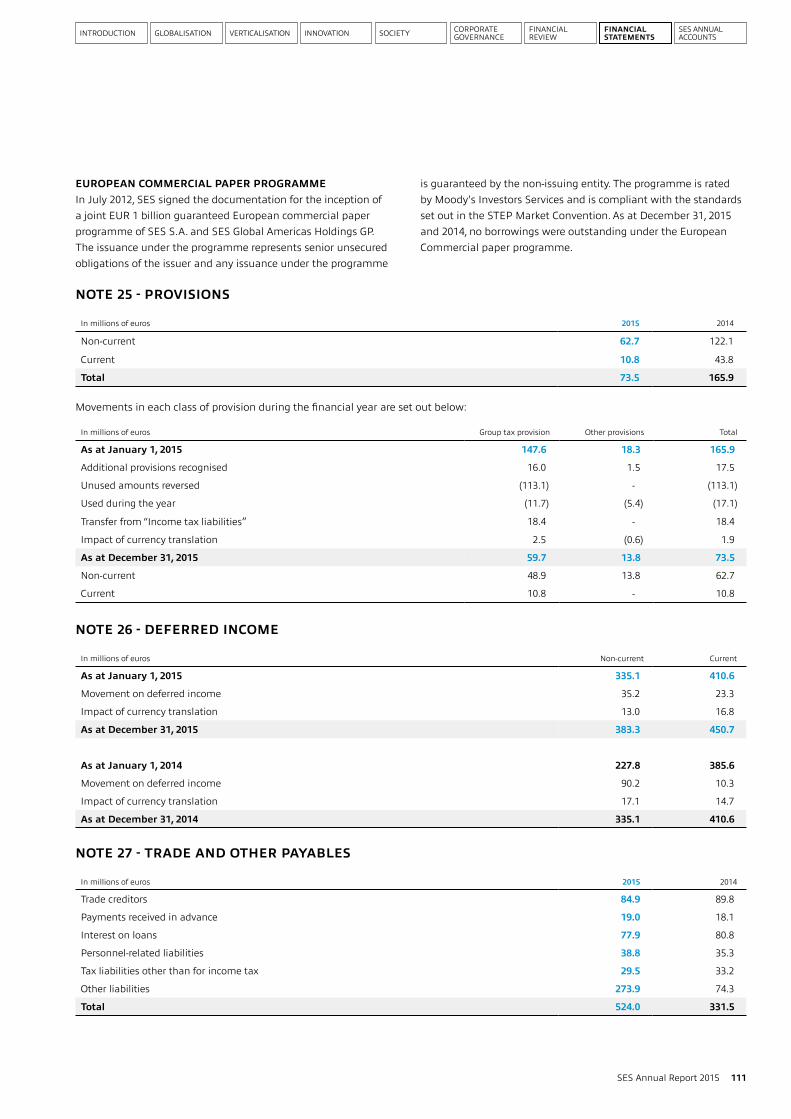
INTRODUCTION GLOBALISATION VERTICALISATION SOCIETYINNOVATION CORPORATE GOVERNANCE
FINANCIAL REVIEW
FINANCIAL STATEMENTS
SES ANNUAL ACCOUNTS
In millions of euros 2015 2014
Non-current 62.7 122.1
Current 10.8 43.8
Total 73.5 165.9
In millions of euros Group tax provision Other provisions Total
As at January 1, 2015 147.6 18.3 165.9
Additional provisions recognised 16.0 1.5 17.5
Unused amounts reversed (113.1) - (113.1)
Used during the year (11.7) (5.4) (17.1)
Transfer from “Income tax liabilities” 18.4 - 18.4
Impact of currency translation 2.5 (0.6) 1.9
As at December 31, 2015 59.7 13.8 73.5
Non-current 48.9 13.8 62.7
Current 10.8 - 10.8
In millions of euros Non-current Current
As at January 1, 2015 335.1 410.6
Movement on deferred income 35.2 23.3
Impact of currency translation 13.0 16.8
As at December 31, 2015 383.3 450.7
As at January 1, 2014 227.8 385.6
Movement on deferred income 90.2 10.3
Impact of currency translation 17.1 14.7
As at December 31, 2014 335.1 410.6
In millions of euros 2015 2014
Trade creditors 84.9 89.8
Payments received in advance 19.0 18.1
Interest on loans 77.9 80.8
Personnel-related liabilities 38.8 35.3
Tax liabilities other than for income tax 29.5 33.2
Other liabilities 273.9 74.3
Total 524.0 331.5
111SES Annual Report 2015
EUROPEAN COMMERCIAL PAPER PROGRAMMEIn July 2012, SES signed the documentation for the inception of a joint EUR 1 billion guaranteed European commercial paper programme of SES S.A. and SES Global Americas Holdings GP. The issuance under the programme represents senior unsecured obligations of the issuer and any issuance under the programme
is guaranteed by the non-issuing entity. The programme is rated by Moody's Investors Services and is compliant with the standards set out in the STEP Market Convention. As at December 31, 2015 and 2014, no borrowings were outstanding under the European Commercial paper programme.
NOTE 25 - PROVISIONS
Movements in each class of provision during the financial year are set out below:
NOTE 26 - DEFERRED INCOME
NOTE 27 - TRADE AND OTHER PAYABLES
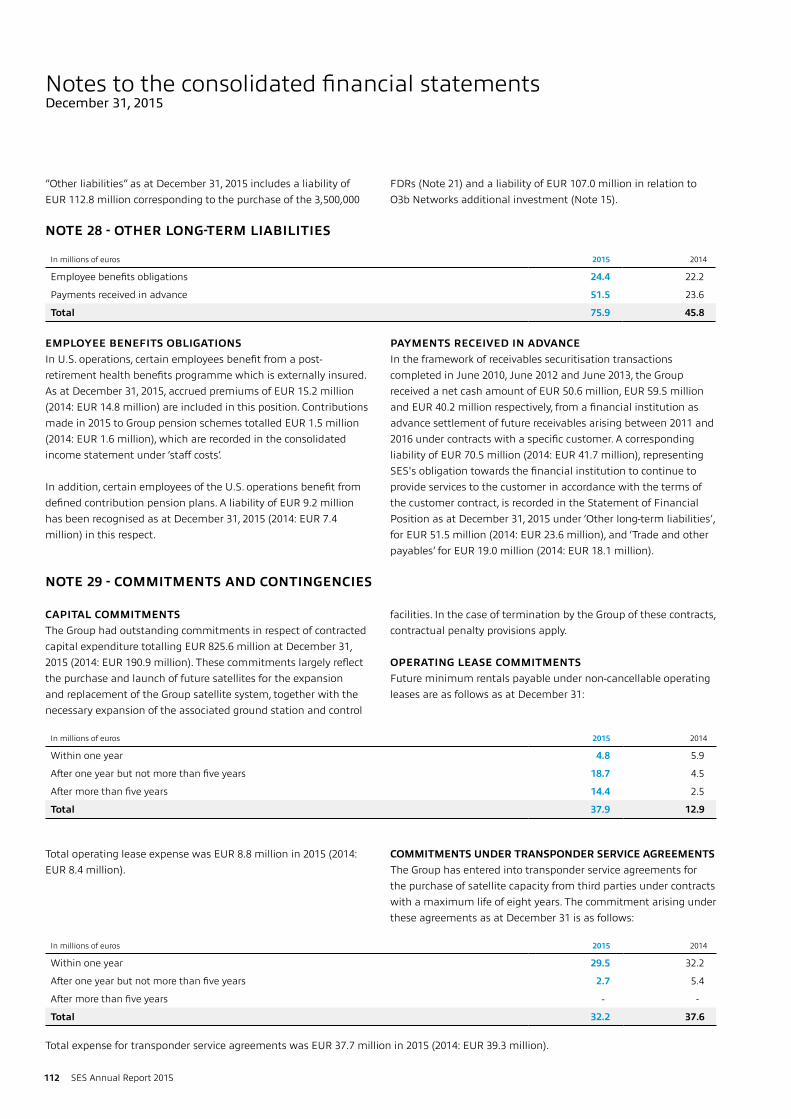
In millions of euros 2015 2014
Employee benefits obligations 24.4 22.2
Payments received in advance 51.5 23.6
Total 75.9 45.8
In millions of euros 2015 2014
Within one year 4.8 5.9
After one year but not more than five years 18.7 4.5
After more than five years 14.4 2.5
Total 37.9 12.9
In millions of euros 2015 2014
Within one year 29.5 32.2
After one year but not more than five years 2.7 5.4
After more than five years - -
Total 32.2 37.6
Total expense for transponder service agreements was EUR 37.7 million in 2015 (2014: EUR 39.3 million).
112 SES Annual Report 2015
EMPLOYEE BENEFITS OBLIGATIONS In U.S. operations, certain employees benefit from a post-retirement health benefits programme which is externally insured. As at December 31, 2015, accrued premiums of EUR 15.2 million (2014: EUR 14.8 million) are included in this position. Contributions made in 2015 to Group pension schemes totalled EUR 1.5 million (2014: EUR 1.6 million), which are recorded in the consolidated income statement under ‘staff costs’.
In addition, certain employees of the U.S. operations benefit from defined contribution pension plans. A liability of EUR 9.2 million has been recognised as at December 31, 2015 (2014: EUR 7.4 million) in this respect.
PAYMENTS RECEIVED IN ADVANCEIn the framework of receivables securitisation transactions completed in June 2010, June 2012 and June 2013, the Group received a net cash amount of EUR 50.6 million, EUR 59.5 million and EUR 40.2 million respectively, from a financial institution as advance settlement of future receivables arising between 2011 and 2016 under contracts with a specific customer. A corresponding liability of EUR 70.5 million (2014: EUR 41.7 million), representing SES's obligation towards the financial institution to continue to provide services to the customer in accordance with the terms of the customer contract, is recorded in the Statement of Financial Position as at December 31, 2015 under ‘Other long-term liabilities’, for EUR 51.5 million (2014: EUR 23.6 million), and ‘Trade and other payables’ for EUR 19.0 million (2014: EUR 18.1 million).
NOTE 29 - COMMITMENTS AND CONTINGENCIES
CAPITAL COMMITMENTSThe Group had outstanding commitments in respect of contracted capital expenditure totalling EUR 825.6 million at December 31, 2015 (2014: EUR 190.9 million). These commitments largely reflect the purchase and launch of future satellites for the expansion and replacement of the Group satellite system, together with the necessary expansion of the associated ground station and control
facilities. In the case of termination by the Group of these contracts, contractual penalty provisions apply.
OPERATING LEASE COMMITMENTSFuture minimum rentals payable under non-cancellable operating leases are as follows as at December 31:
Total operating lease expense was EUR 8.8 million in 2015 (2014: EUR 8.4 million).
COMMITMENTS UNDER TRANSPONDER SERVICE AGREEMENTSThe Group has entered into transponder service agreements for the purchase of satellite capacity from third parties under contracts with a maximum life of eight years. The commitment arising under these agreements as at December 31 is as follows:
Notes to the consolidated financial statementsDecember 31, 2015
“Other liabilities” as at December 31, 2015 includes a liability of EUR 112.8 million corresponding to the purchase of the 3,500,000
FDRs (Note 21) and a liability of EUR 107.0 million in relation to O3b Networks additional investment (Note 15).
NOTE 28 - OTHER LONG-TERM LIABILITIES
INTRODUCTION GLOBALISATION VERTICALISATION SOCIETYINNOVATION CORPORATE GOVERNANCE
FINANCIAL REVIEW
FINANCIAL STATEMENTS
SES ANNUAL ACCOUNTS
In millions of euros 2015 2014
Remuneration including bonuses 4.7 5.2
Pension benefits 0.7 0.7
Share-based compensation plans 3.4 12.6
Other benefits 0.3 0.3
Total 9.1 18.8
113SES Annual Report 2015
LITIGATIONThere were no significant litigation claims against the Group as at December 31, 2015.
GUARANTEESOn December 31, 2015 the Group had outstanding bank guarantees for an amount of EUR 152.7 million (2014: EUR 78.1 million) with respect to performance and warranty guarantees for services of satellite operations.
NOTE 30 - RELATED PARTIES
The state of Luxembourg holds a direct 11.58% voting interest in the Company and two indirect interests, both of 10.88%, through two state owned banks, Banque et Caisse d’Epargne de l’Etat and Société Nationale de Crédit et d’Investissement. These shares constitute the Company’s Class B shares, which are described in more detail in Note 21.
The total payments to directors for attendance at board and committee meetings in 2015 amounted to EUR 1.3 million (2014: EUR 1.3 million). These payments are computed on a fixed and variable basis, the variable part being based upon attendance at board and committee meetings.
In 2015, SES recognised revenue of EUR 4.3 million (2014: EUR 7.2 million) from O3b Networks Limited in connection with the provision of satellite-related services to that company. O3b Networks Limited has commitments to SES for similar services totalling EUR 9.9 million, of which EUR 3.8 million will be incurred within one year and EUR 6.1 million between 2 and 5 years (refer also to Note 15).
There were no other significant transactions with related parties. Other balances with O3b Networks Limited include loans receivable and payable for the capital increase (Note 16).
The key management of the Group, defined as the Group’s Executive Committee, received compensation as follows:
Total share-based payment instruments allocated to key management as at December 31, 2015 were 1,116,764 (2014: 893,150).
NOTE 31 - EUTELSAT SETTLEMENT
On January 30, 2014 SES and Eutelsat Communications announced the conclusion of a series of agreements including a comprehensive settlement of legal proceedings concerning the right to operate at the 28.5 degrees East orbital position and containing long-term commercial as well as frequency coordination elements.
← The first agreement ends the arbitral procedure between Eutelsat and SES that was initiated in October 2012 under the rules of the International Chamber of Commerce in Paris. The dispute concerned a right of use of 500 MHz spectrum at the 28.5 degrees East orbital position. Eutelsat ceased to operate this spectrum on 3 October 2013 and SES has operated this spectrum since that date. The dispute over this right of use has now been resolved, with SES continuing to operate its satellites at this location, and Eutelsat independently commercialising part of the capacity of the previously disputed frequencies. ← According to the second agreement between both companies, Eutelsat has therefore contracted long-term satellite capacity on the SES satellite fleet at the 28.5 degrees East orbital position. Eutelsat is commercialising over Europe on the SES fleet 125
MHz (eight Band-B transponders) of the formerly disputed 500 MHz. Eutelsat is also commercialising on the SES fleet the 250 MHz (12 Band-A transponders) which was not the subject of the legal proceedings. The 20 transponders are operated on three new satellites which SES is deploying at the 28.2/28.5 degrees East neighbourhood - ASTRA 2F, ASTRA 2E and ASTRA 2G. These satellites have been launched and commenced operational service. ← The third agreement between the two companies addresses technical frequency coordination under the rules of the International Telecommunication Union. It will allow both parties an optimised use of their respective spectrum at a number of orbital positions over Europe, the Middle East and Africa. It confirms and clarifies in technical terms the geographic coverage and transmission power levels for frequencies at these positions.
Within the framework of these agreements, SES is recognising revenues in connection with the sale of the 12 Band-A transponders, with eight of these recognised in 2014 and four recognised in 2015.
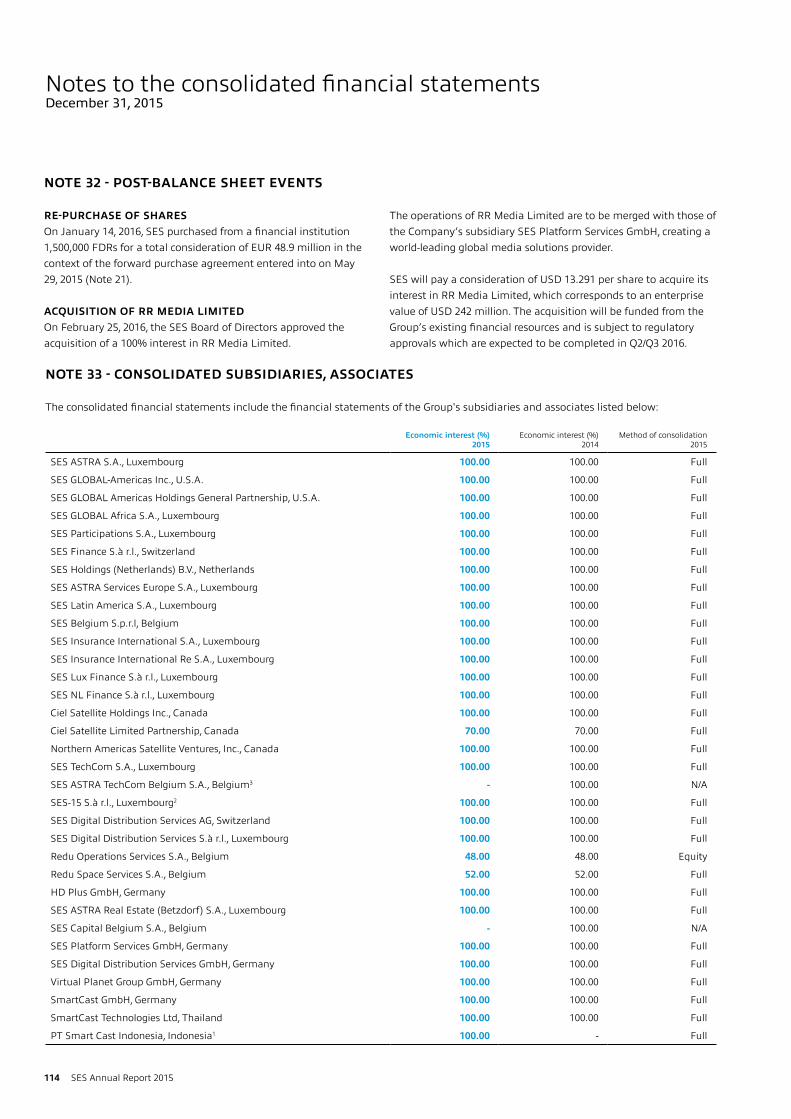
Economic interest (%) 2015
Economic interest (%) 2014
Method of consolidation 2015
SES ASTRA S.A., Luxembourg 100.00 100.00 Full
SES GLOBAL-Americas Inc., U.S.A. 100.00 100.00 Full
SES GLOBAL Americas Holdings General Partnership, U.S.A. 100.00 100.00 Full
SES GLOBAL Africa S.A., Luxembourg 100.00 100.00 Full
SES Participations S.A., Luxembourg 100.00 100.00 Full
SES Finance S.à r.l., Switzerland 100.00 100.00 Full
SES Holdings (Netherlands) B.V., Netherlands 100.00 100.00 Full
SES ASTRA Services Europe S.A., Luxembourg 100.00 100.00 Full
SES Latin America S.A., Luxembourg 100.00 100.00 Full
SES Belgium S.p.r.l, Belgium 100.00 100.00 Full
SES Insurance International S.A., Luxembourg 100.00 100.00 Full
SES Insurance International Re S.A., Luxembourg 100.00 100.00 Full
SES Lux Finance S.à r.l., Luxembourg 100.00 100.00 Full
SES NL Finance S.à r.l., Luxembourg 100.00 100.00 Full
Ciel Satellite Holdings Inc., Canada 100.00 100.00 Full
Ciel Satellite Limited Partnership, Canada 70.00 70.00 Full
Northern Americas Satellite Ventures, Inc., Canada 100.00 100.00 Full
SES TechCom S.A., Luxembourg 100.00 100.00 Full
SES ASTRA TechCom Belgium S.A., Belgium3 - 100.00 N/A
SES-15 S.à r.l., Luxembourg2 100.00 100.00 Full
SES Digital Distribution Services AG, Switzerland 100.00 100.00 Full
SES Digital Distribution Services S.à r.l., Luxembourg 100.00 100.00 Full
Redu Operations Services S.A., Belgium 48.00 48.00 Equity
Redu Space Services S.A., Belgium 52.00 52.00 Full
HD Plus GmbH, Germany 100.00 100.00 Full
SES ASTRA Real Estate (Betzdorf) S.A., Luxembourg 100.00 100.00 Full
SES Capital Belgium S.A., Belgium - 100.00 N/A
SES Platform Services GmbH, Germany 100.00 100.00 Full
SES Digital Distribution Services GmbH, Germany 100.00 100.00 Full
Virtual Planet Group GmbH, Germany 100.00 100.00 Full
SmartCast GmbH, Germany 100.00 100.00 Full
SmartCast Technologies Ltd, Thailand 100.00 100.00 Full
PT Smart Cast Indonesia, Indonesia1 100.00 - Full
114 SES Annual Report 2015
Notes to the consolidated financial statementsDecember 31, 2015
NOTE 33 - CONSOLIDATED SUBSIDIARIES, ASSOCIATES
The consolidated financial statements include the financial statements of the Group's subsidiaries and associates listed below:
NOTE 32 - POST-BALANCE SHEET EVENTS
RE-PURCHASE OF SHARESOn January 14, 2016, SES purchased from a financial institution 1,500,000 FDRs for a total consideration of EUR 48.9 million in the context of the forward purchase agreement entered into on May 29, 2015 (Note 21).
ACQUISITION OF RR MEDIA LIMITEDOn February 25, 2016, the SES Board of Directors approved the acquisition of a 100% interest in RR Media Limited.
The operations of RR Media Limited are to be merged with those of the Company’s subsidiary SES Platform Services GmbH, creating a world-leading global media solutions provider.
SES will pay a consideration of USD 13.291 per share to acquire its interest in RR Media Limited, which corresponds to an enterprise value of USD 242 million. The acquisition will be funded from the Group’s existing financial resources and is subject to regulatory approvals which are expected to be completed in Q2/Q3 2016.
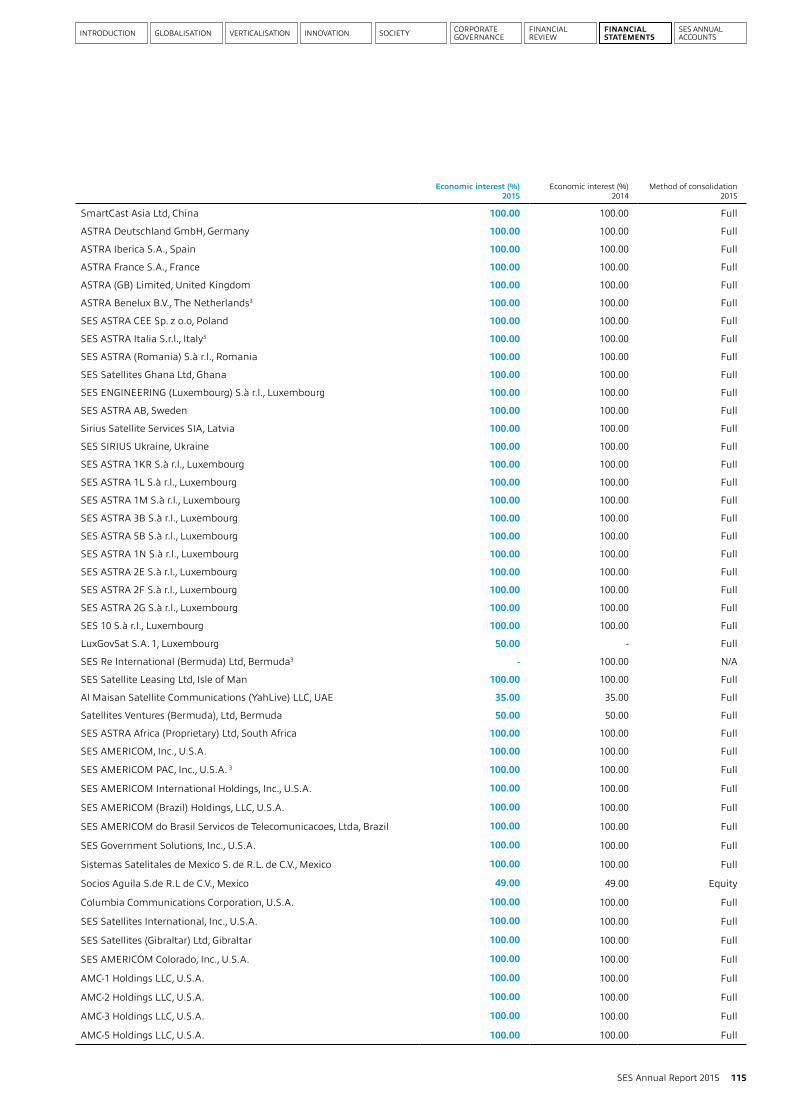
INTRODUCTION GLOBALISATION VERTICALISATION SOCIETYINNOVATION CORPORATE GOVERNANCE
FINANCIAL REVIEW
FINANCIAL STATEMENTS
SES ANNUAL ACCOUNTS
Economic interest (%) 2015
Economic interest (%) 2014
Method of consolidation 2015
SmartCast Asia Ltd, China 100.00 100.00 Full
ASTRA Deutschland GmbH, Germany 100.00 100.00 Full
ASTRA Iberica S.A., Spain 100.00 100.00 Full
ASTRA France S.A., France 100.00 100.00 Full
ASTRA (GB) Limited, United Kingdom 100.00 100.00 Full
ASTRA Benelux B.V., The Netherlands3 100.00 100.00 Full
SES ASTRA CEE Sp. z o.o, Poland 100.00 100.00 Full
SES ASTRA Italia S.r.l., Italy3 100.00 100.00 Full
SES ASTRA (Romania) S.à r.l., Romania 100.00 100.00 Full
SES Satellites Ghana Ltd, Ghana 100.00 100.00 Full
SES ENGINEERING (Luxembourg) S.à r.l., Luxembourg 100.00 100.00 Full
SES ASTRA AB, Sweden 100.00 100.00 Full
Sirius Satellite Services SIA, Latvia 100.00 100.00 Full
SES SIRIUS Ukraine, Ukraine 100.00 100.00 Full
SES ASTRA 1KR S.à r.l., Luxembourg 100.00 100.00 Full
SES ASTRA 1L S.à r.l., Luxembourg 100.00 100.00 Full
SES ASTRA 1M S.à r.l., Luxembourg 100.00 100.00 Full
SES ASTRA 3B S.à r.l., Luxembourg 100.00 100.00 Full
SES ASTRA 5B S.à r.l., Luxembourg 100.00 100.00 Full
SES ASTRA 1N S.à r.l., Luxembourg 100.00 100.00 Full
SES ASTRA 2E S.à r.l., Luxembourg 100.00 100.00 Full
SES ASTRA 2F S.à r.l., Luxembourg 100.00 100.00 Full
SES ASTRA 2G S.à r.l., Luxembourg 100.00 100.00 Full
SES 10 S.à r.l., Luxembourg 100.00 100.00 Full
LuxGovSat S.A. 1, Luxembourg 50.00 - Full
SES Re International (Bermuda) Ltd, Bermuda3 - 100.00 N/A
SES Satellite Leasing Ltd, Isle of Man 100.00 100.00 Full
Al Maisan Satellite Communications (YahLive) LLC, UAE 35.00 35.00 Full
Satellites Ventures (Bermuda), Ltd, Bermuda 50.00 50.00 Full
SES ASTRA Africa (Proprietary) Ltd, South Africa 100.00 100.00 Full
SES AMERICOM, Inc., U.S.A. 100.00 100.00 Full
SES AMERICOM PAC, Inc., U.S.A. 3 100.00 100.00 Full
SES AMERICOM International Holdings, Inc., U.S.A. 100.00 100.00 Full
SES AMERICOM (Brazil) Holdings, LLC, U.S.A. 100.00 100.00 Full
SES AMERICOM do Brasil Servicos de Telecomunicacoes, Ltda, Brazil 100.00 100.00 Full
SES Government Solutions, Inc., U.S.A. 100.00 100.00 Full
Sistemas Satelitales de Mexico S. de R.L. de C.V., Mexico 100.00 100.00 Full
Socios Aguila S.de R.L de C.V., Mexico 49.00 49.00 Equity
Columbia Communications Corporation, U.S.A. 100.00 100.00 Full
SES Satellites International, Inc., U.S.A. 100.00 100.00 Full
SES Satellites (Gibraltar) Ltd, Gibraltar 100.00 100.00 Full
SES AMERICOM Colorado, Inc., U.S.A. 100.00 100.00 Full
AMC-1 Holdings LLC, U.S.A. 100.00 100.00 Full
AMC-2 Holdings LLC, U.S.A. 100.00 100.00 Full
AMC-3 Holdings LLC, U.S.A. 100.00 100.00 Full
AMC-5 Holdings LLC, U.S.A. 100.00 100.00 Full
115SES Annual Report 2015
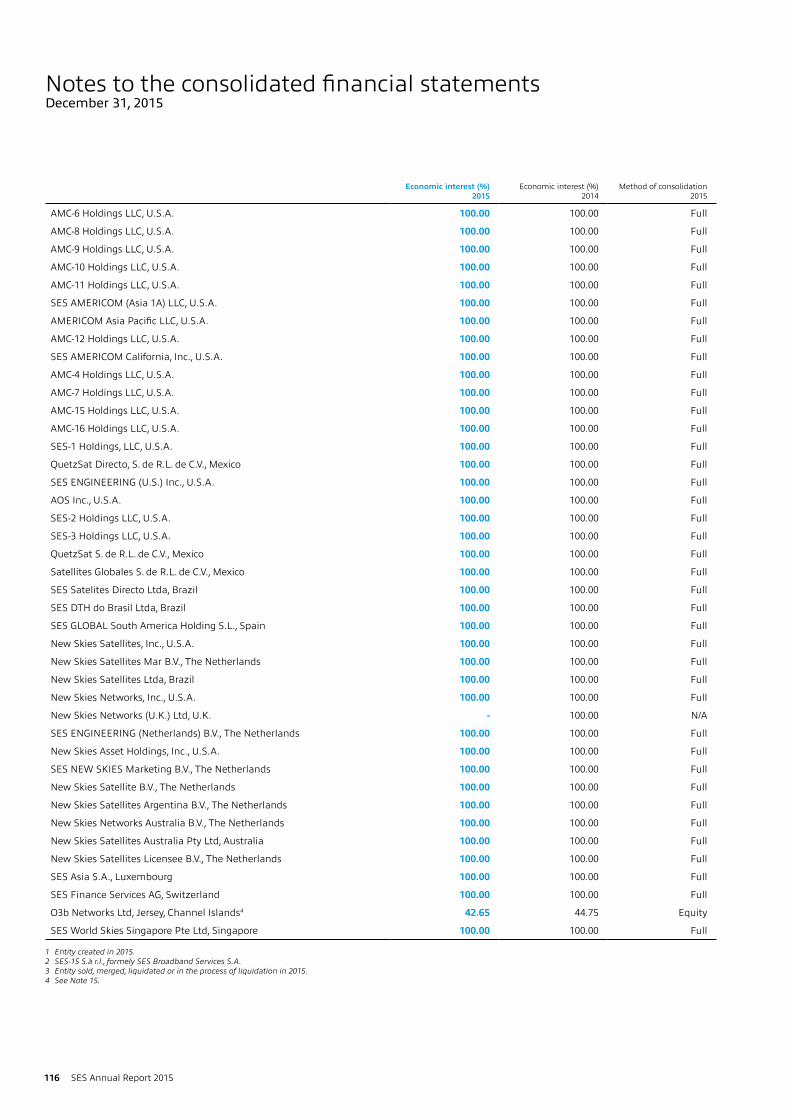
Economic interest (%) 2015
Economic interest (%) 2014
Method of consolidation 2015
AMC-6 Holdings LLC, U.S.A. 100.00 100.00 Full
AMC-8 Holdings LLC, U.S.A. 100.00 100.00 Full
AMC-9 Holdings LLC, U.S.A. 100.00 100.00 Full
AMC-10 Holdings LLC, U.S.A. 100.00 100.00 Full
AMC-11 Holdings LLC, U.S.A. 100.00 100.00 Full
SES AMERICOM (Asia 1A) LLC, U.S.A. 100.00 100.00 Full
AMERICOM Asia Pacific LLC, U.S.A. 100.00 100.00 Full
AMC-12 Holdings LLC, U.S.A. 100.00 100.00 Full
SES AMERICOM California, Inc., U.S.A. 100.00 100.00 Full
AMC-4 Holdings LLC, U.S.A. 100.00 100.00 Full
AMC-7 Holdings LLC, U.S.A. 100.00 100.00 Full
AMC-15 Holdings LLC, U.S.A. 100.00 100.00 Full
AMC-16 Holdings LLC, U.S.A. 100.00 100.00 Full
SES-1 Holdings, LLC, U.S.A. 100.00 100.00 Full
QuetzSat Directo, S. de R.L. de C.V., Mexico 100.00 100.00 Full
SES ENGINEERING (U.S.) Inc., U.S.A. 100.00 100.00 Full
AOS Inc., U.S.A. 100.00 100.00 Full
SES-2 Holdings LLC, U.S.A. 100.00 100.00 Full
SES-3 Holdings LLC, U.S.A. 100.00 100.00 Full
QuetzSat S. de R.L. de C.V., Mexico 100.00 100.00 Full
Satellites Globales S. de R.L. de C.V., Mexico 100.00 100.00 Full
SES Satelites Directo Ltda, Brazil 100.00 100.00 Full
SES DTH do Brasil Ltda, Brazil 100.00 100.00 Full
SES GLOBAL South America Holding S.L., Spain 100.00 100.00 Full
New Skies Satellites, Inc., U.S.A. 100.00 100.00 Full
New Skies Satellites Mar B.V., The Netherlands 100.00 100.00 Full
New Skies Satellites Ltda, Brazil 100.00 100.00 Full
New Skies Networks, Inc., U.S.A. 100.00 100.00 Full
New Skies Networks (U.K.) Ltd, U.K. - 100.00 N/A
SES ENGINEERING (Netherlands) B.V., The Netherlands 100.00 100.00 Full
New Skies Asset Holdings, Inc., U.S.A. 100.00 100.00 Full
SES NEW SKIES Marketing B.V., The Netherlands 100.00 100.00 Full
New Skies Satellite B.V., The Netherlands 100.00 100.00 Full
New Skies Satellites Argentina B.V., The Netherlands 100.00 100.00 Full
New Skies Networks Australia B.V., The Netherlands 100.00 100.00 Full
New Skies Satellites Australia Pty Ltd, Australia 100.00 100.00 Full
New Skies Satellites Licensee B.V., The Netherlands 100.00 100.00 Full
SES Asia S.A., Luxembourg 100.00 100.00 Full
SES Finance Services AG, Switzerland 100.00 100.00 Full
O3b Networks Ltd, Jersey, Channel Islands4 42.65 44.75 Equity
SES World Skies Singapore Pte Ltd, Singapore 100.00 100.00 Full
1 Entity created in 2015.2 SES-15 S.à r.l., formely SES Broadband Services S.A.3 Entity sold, merged, liquidated or in the process of liquidation in 2015.4 See Note 15.
116 SES Annual Report 2015
Notes to the consolidated financial statementsDecember 31, 2015
117SES Annual Report 2015
SES ANNUAL ACCOUNTS

118 SES Annual Report 2015
TO THE SHAREHOLDERS OF SES S.A.
We have audited the accompanying annual accounts of SES S.A., which comprise the balance sheet as at 31 December 2015, the profit and loss account for the year then ended and a summary of significant accounting policies and other explanatory information.
BOARD OF DIRECTORS’ RESPONSIBILITY FOR THE ANNUAL ACCOUNTSThe Board of Directors is responsible for the preparation and fair presentation of these annual accounts in accordance with Luxembourg legal and regulatory requirements relating to the preparation of the annual accounts, and for such internal control as the Board of Directors determines is necessary to enable the preparation of annual accounts that are free from material misstatement, whether due to fraud or error.
RESPONSIBILITY OF THE “RÉVISEUR D’ENTREPRISES AGRÉÉ”Our responsibility is to express an opinion on these annual accounts based on our audit. We conducted our audit in accordance with International Standards on Auditing as adopted for Luxembourg by the “Commission de Surveillance du Secteur Financier”. Those standards require that we comply with ethical requirements and plan and perform the audit to obtain reasonable assurance about whether the annual accounts are free from material misstatement.
An audit involves performing procedures to obtain audit evidence about the amounts and disclosures in the annual accounts. The procedures selected depend on the judgment of the “Réviseur d’entreprises agréé”, including the assessment of the risks of material misstatement of the annual accounts, whether due to fraud or error. In making those risk assessments, the “Réviseur d’entreprises agréé” considers internal control relevant to the entity’s preparation and fair presentation of the annual accounts in order to design audit procedures that are appropriate in the circumstances, but not for the purpose of expressing an opinion on the effectiveness of the entity’s internal control. An audit also includes evaluating the appropriateness of accounting policies used and the reasonableness of accounting estimates made by the Board of Directors, as well as evaluating the overall presentation of the annual accounts.
We believe that the audit evidence we have obtained is sufficient and appropriate to provide a basis for our audit opinion.
OPINIONIn our opinion, the annual accounts give a true and fair view of the financial position of SES S.A. as of 31 December 2015, and of the results of its operations for the year then ended in accordance with Luxembourg legal and regulatory requirements relating to the preparation of the annual accounts.
PricewaterhouseCoopers, Société coopérativeLuxembourg, 25 February 2016
Represented by
Gilles Vanderweyen
Audit report
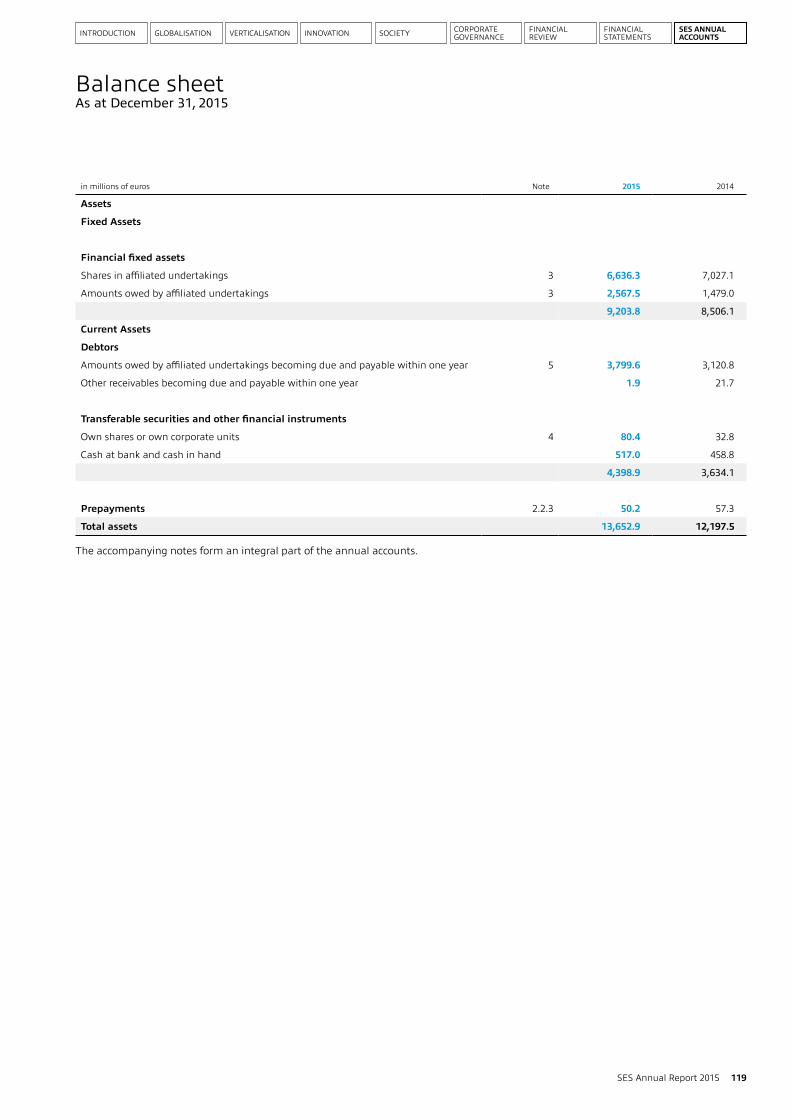
INTRODUCTION GLOBALISATION VERTICALISATION SOCIETYINNOVATION CORPORATE GOVERNANCE
FINANCIAL REVIEW
FINANCIAL STATEMENTS
SES ANNUAL ACCOUNTS
in millions of euros Note 2015 2014
Assets
Fixed Assets
Financial fixed assets
Shares in affiliated undertakings 3 6,636.3 7,027.1
Amounts owed by affiliated undertakings 3 2,567.5 1,479.0
9,203.8 8,506.1
Current Assets
Debtors
Amounts owed by affiliated undertakings becoming due and payable within one year 5 3,799.6 3,120.8
Other receivables becoming due and payable within one year 1.9 21.7
Transferable securities and other financial instruments
Own shares or own corporate units 4 80.4 32.8
Cash at bank and cash in hand 517.0 458.8
4,398.9 3,634.1
Prepayments 2.2.3 50.2 57.3
Total assets 13,652.9 12,197.5
119SES Annual Report 2015
Balance sheetAs at December 31, 2015
The accompanying notes form an integral part of the annual accounts.
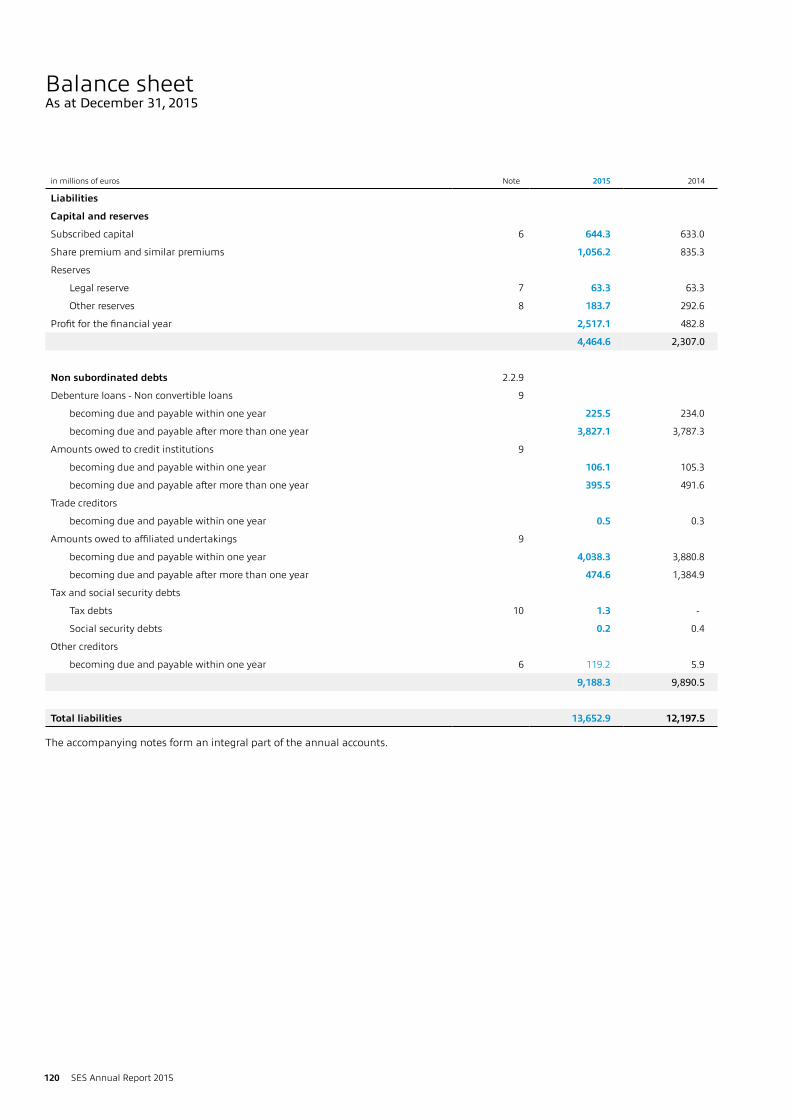
in millions of euros Note 2015 2014
Liabilities
Capital and reserves
Subscribed capital 6 644.3 633.0
Share premium and similar premiums 1,056.2 835.3
Reserves
Legal reserve 7 63.3 63.3
Other reserves 8 183.7 292.6
Profit for the financial year 2,517.1 482.8
4,464.6 2,307.0
Non subordinated debts 2.2.9
Debenture loans - Non convertible loans 9
becoming due and payable within one year 225.5 234.0
becoming due and payable after more than one year 3,827.1 3,787.3
Amounts owed to credit institutions 9
becoming due and payable within one year 106.1 105.3
becoming due and payable after more than one year 395.5 491.6
Trade creditors
becoming due and payable within one year 0.5 0.3
Amounts owed to affiliated undertakings 9
becoming due and payable within one year 4,038.3 3,880.8
becoming due and payable after more than one year 474.6 1,384.9
Tax and social security debts
Tax debts 10 1.3 -
Social security debts 0.2 0.4
Other creditors
becoming due and payable within one year 6 119.2 5.9
9,188.3 9,890.5
Total liabilities 13,652.9 12,197.5
120 SES Annual Report 2015
Balance sheetAs at December 31, 2015
The accompanying notes form an integral part of the annual accounts.
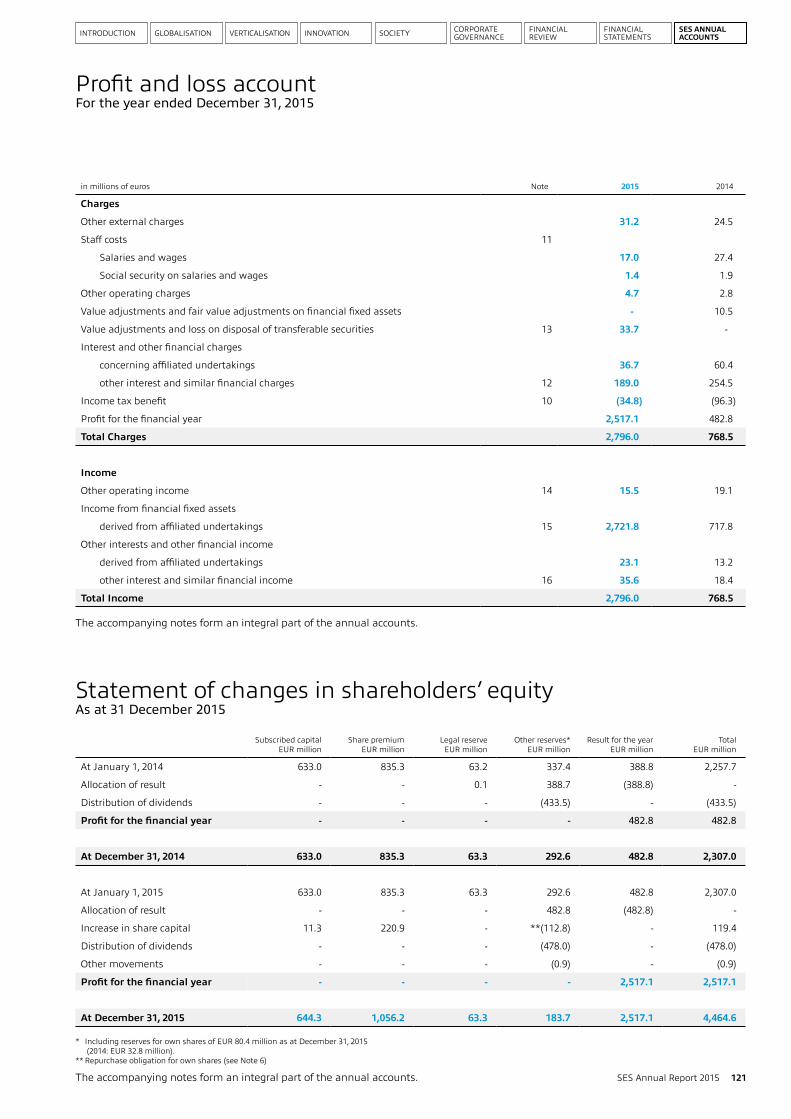
INTRODUCTION GLOBALISATION VERTICALISATION SOCIETYINNOVATION CORPORATE GOVERNANCE
FINANCIAL REVIEW
FINANCIAL STATEMENTS
SES ANNUAL ACCOUNTS
in millions of euros Note 2015 2014
Charges
Other external charges 31.2 24.5
Staff costs 11
Salaries and wages 17.0 27.4
Social security on salaries and wages 1.4 1.9
Other operating charges 4.7 2.8
Value adjustments and fair value adjustments on financial fixed assets - 10.5
Value adjustments and loss on disposal of transferable securities 13 33.7 -
Interest and other financial charges
concerning affiliated undertakings 36.7 60.4
other interest and similar financial charges 12 189.0 254.5
Income tax benefit 10 (34.8) (96.3)
Profit for the financial year 2,517.1 482.8
Total Charges 2,796.0 768.5
Income
Other operating income 14 15.5 19.1
Income from financial fixed assets
derived from affiliated undertakings 15 2,721.8 717.8
Other interests and other financial income
derived from affiliated undertakings 23.1 13.2
other interest and similar financial income 16 35.6 18.4
Total Income 2,796.0 768.5
Subscribed capital EUR million
Share premium EUR million
Legal reserve EUR million
Other reserves* EUR million
Result for the year EUR million
Total EUR million
At January 1, 2014 633.0 835.3 63.2 337.4 388.8 2,257.7
Allocation of result - - 0.1 388.7 (388.8) -
Distribution of dividends - - - (433.5) - (433.5)
Profit for the financial year - - - - 482.8 482.8
At December 31, 2014 633.0 835.3 63.3 292.6 482.8 2,307.0
At January 1, 2015 633.0 835.3 63.3 292.6 482.8 2,307.0
Allocation of result - - - 482.8 (482.8) -
Increase in share capital 11.3 220.9 - **(112.8) - 119.4
Distribution of dividends - - - (478.0) - (478.0)
Other movements - - - (0.9) - (0.9)
Profit for the financial year - - - - 2,517.1 2,517.1
At December 31, 2015 644.3 1,056.2 63.3 183.7 2,517.1 4,464.6
* Including reserves for own shares of EUR 80.4 million as at December 31, 2015 (2014: EUR 32.8 million).
** Repurchase obligation for own shares (see Note 6)
121SES Annual Report 2015
Profit and loss accountFor the year ended December 31, 2015
Statement of changes in shareholders’ equityAs at 31 December 2015
The accompanying notes form an integral part of the annual accounts.
The accompanying notes form an integral part of the annual accounts.
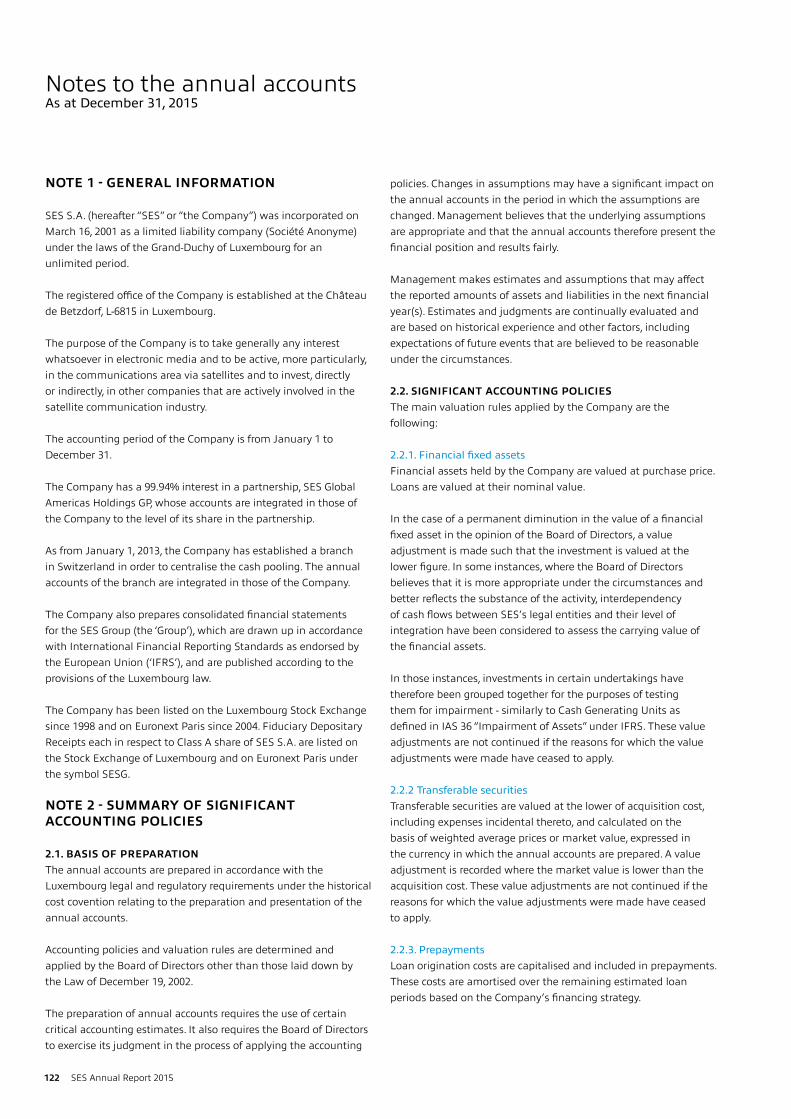
122 SES Annual Report 2015
NOTE 1 - GENERAL INFORMATION
SES S.A. (hereafter “SES” or “the Company”) was incorporated on March 16, 2001 as a limited liability company (Société Anonyme) under the laws of the Grand-Duchy of Luxembourg for an unlimited period.
The registered office of the Company is established at the Château de Betzdorf, L-6815 in Luxembourg.
The purpose of the Company is to take generally any interest whatsoever in electronic media and to be active, more particularly, in the communications area via satellites and to invest, directly or indirectly, in other companies that are actively involved in the satellite communication industry.
The accounting period of the Company is from January 1 to December 31.
The Company has a 99.94% interest in a partnership, SES Global Americas Holdings GP, whose accounts are integrated in those of the Company to the level of its share in the partnership.
As from January 1, 2013, the Company has established a branch in Switzerland in order to centralise the cash pooling. The annual accounts of the branch are integrated in those of the Company.
The Company also prepares consolidated financial statements for the SES Group (the ‘Group’), which are drawn up in accordance with International Financial Reporting Standards as endorsed by the European Union (‘IFRS’), and are published according to the provisions of the Luxembourg law.
The Company has been listed on the Luxembourg Stock Exchange since 1998 and on Euronext Paris since 2004. Fiduciary Depositary Receipts each in respect to Class A share of SES S.A. are listed on the Stock Exchange of Luxembourg and on Euronext Paris under the symbol SESG.
NOTE 2 - SUMMARY OF SIGNIFICANT ACCOUNTING POLICIES
2.1. BASIS OF PREPARATIONThe annual accounts are prepared in accordance with the Luxembourg legal and regulatory requirements under the historical cost covention relating to the preparation and presentation of the annual accounts.
Accounting policies and valuation rules are determined and applied by the Board of Directors other than those laid down by the Law of December 19, 2002.
The preparation of annual accounts requires the use of certain critical accounting estimates. It also requires the Board of Directors to exercise its judgment in the process of applying the accounting
policies. Changes in assumptions may have a significant impact on the annual accounts in the period in which the assumptions are changed. Management believes that the underlying assumptions are appropriate and that the annual accounts therefore present the financial position and results fairly.
Management makes estimates and assumptions that may affect the reported amounts of assets and liabilities in the next financial year(s). Estimates and judgments are continually evaluated and are based on historical experience and other factors, including expectations of future events that are believed to be reasonable under the circumstances.
2.2. SIGNIFICANT ACCOUNTING POLICIESThe main valuation rules applied by the Company are the following:
2.2.1. Financial fixed assetsFinancial assets held by the Company are valued at purchase price. Loans are valued at their nominal value.
In the case of a permanent diminution in the value of a financial fixed asset in the opinion of the Board of Directors, a value adjustment is made such that the investment is valued at the lower figure. In some instances, where the Board of Directors believes that it is more appropriate under the circumstances and better reflects the substance of the activity, interdependency of cash flows between SES’s legal entities and their level of integration have been considered to assess the carrying value of the financial assets.
In those instances, investments in certain undertakings have therefore been grouped together for the purposes of testing them for impairment - similarly to Cash Generating Units as defined in IAS 36 “Impairment of Assets” under IFRS. These value adjustments are not continued if the reasons for which the value adjustments were made have ceased to apply.
2.2.2 Transferable securitiesTransferable securities are valued at the lower of acquisition cost, including expenses incidental thereto, and calculated on the basis of weighted average prices or market value, expressed in the currency in which the annual accounts are prepared. A value adjustment is recorded where the market value is lower than the acquisition cost. These value adjustments are not continued if the reasons for which the value adjustments were made have ceased to apply.
2.2.3. PrepaymentsLoan origination costs are capitalised and included in prepayments. These costs are amortised over the remaining estimated loan periods based on the Company’s financing strategy.
Notes to the annual accountsAs at December 31, 2015
INTRODUCTION GLOBALISATION VERTICALISATION SOCIETYINNOVATION CORPORATE GOVERNANCE
FINANCIAL REVIEW
FINANCIAL STATEMENTS
SES ANNUAL ACCOUNTS
123SES Annual Report 2015
2.2.4. Dividends paid and receivedDividends are declared after the annual accounts for the year have been approved. Accordingly, dividends payable are recorded in the subsequent year’s annual accounts.
Dividends receivable from affiliated undertakings are recorded as income in the year in which they are approved by the subsidiary.
2.2.5. Convertible Profit Participating Convertible CertificatesReturns on the Profit Participating Convertible Certificates (PPCC) subscribed by the Company are calculated based on the cumulative profits of the issuer over the life of the certificate.
The Company’s entitlement to a return, in the form of Profit Participating Interest (PPI), is thus only certain at the date of maturity at which time the PPI will be established and recorded.
2.2.6. DebtorsDebtors are valued at their nominal value. They are subject to value adjustments where their recovery is uncertain. These value adjustments are not continued if the reasons for which the value adjustments were made have ceased to apply.
2.2.7. Foreign currency translationThe company maintains its books and records in Euro (EUR).
Transactions expressed in currencies other than Euro are translated into Euro at the exchange rates effective at the time of the transaction.
With the exception of fixed assets, all assets and liabilities denominated in foreign currencies are converted at the rate of exchange ruling at the balance sheet date. Realised and unrealised gains and losses are recognised in the profit and loss account.
Fixed assets acquired in currencies other than Euro are translated into Euro at the exchange rate effective at the time of the transaction. At the balance sheet date, these assets remain translated at historical exchange rates.
The foreign exchange result for the year has been presented on a net basis.
2.2.8. Derivative financial instrumentsThe Company may enter into derivative instruments, principally forward currency contracts, in order to manage exchange rate exposure on the Company's and Group’s assets, liabilities and financial operations.
Such financial instruments are used to reduce the Group’s exposure to risks in connection with operating liabilities denominated in U.S. dollars, such as milestone payments to satellite manufacturers. Such instruments are denominated in the same currency as the hedged item and can cover up to 100% of the total value of the hedged item (see Note 19). It is the
Company’s policy not to enter into such forward contracts until a firm commitment is in place, and to match the terms of hedge derivatives to those of the hedged item to maximize effectiveness.
Additionally, the Company has significant debenture loans denominated in U.S. dollar. The Company may enter into derivatives, such as forward currency contracts or cross-currency swaps in order to manage exchange rate exposure on foreign currency debt.
Financial derivatives are revalued at year-end using the closing rates. Both unrealised gains and losses resulting from the conversion of these contracts are recognised. Assets or liabilities generated by unrealised gains/losses are recognised and recorded under “amounts owed to/by affiliated undertakings” where the counterparty is a member of the SES Group.
SES does not use derivative financial instruments for speculative purposes.
2.2.9. DebtsDebts are recorded at their reimbursement value. Where the amount repayable on account is greater than the amount received, the difference is shown as an asset and is written off over the period of the debt based on a linear method.
2.2.10. Share-based compensationEmployees of the Company receive remuneration in the form of share-based compensation payments, whereby employees render services to the Company as consideration for equity instruments. Three active equity-settled share-based payment schemes have been established by SES S.A. and are available to some of the Company’s staff:
← The Stock Appreciation Rights Plan (STAR Plan) ← Executive Incentive Compensation Plan (EICP) ← Long-Term Incentive Programme (LTIP)
A charge is recognized in the profit and loss account upon exercise of the share option/shares.
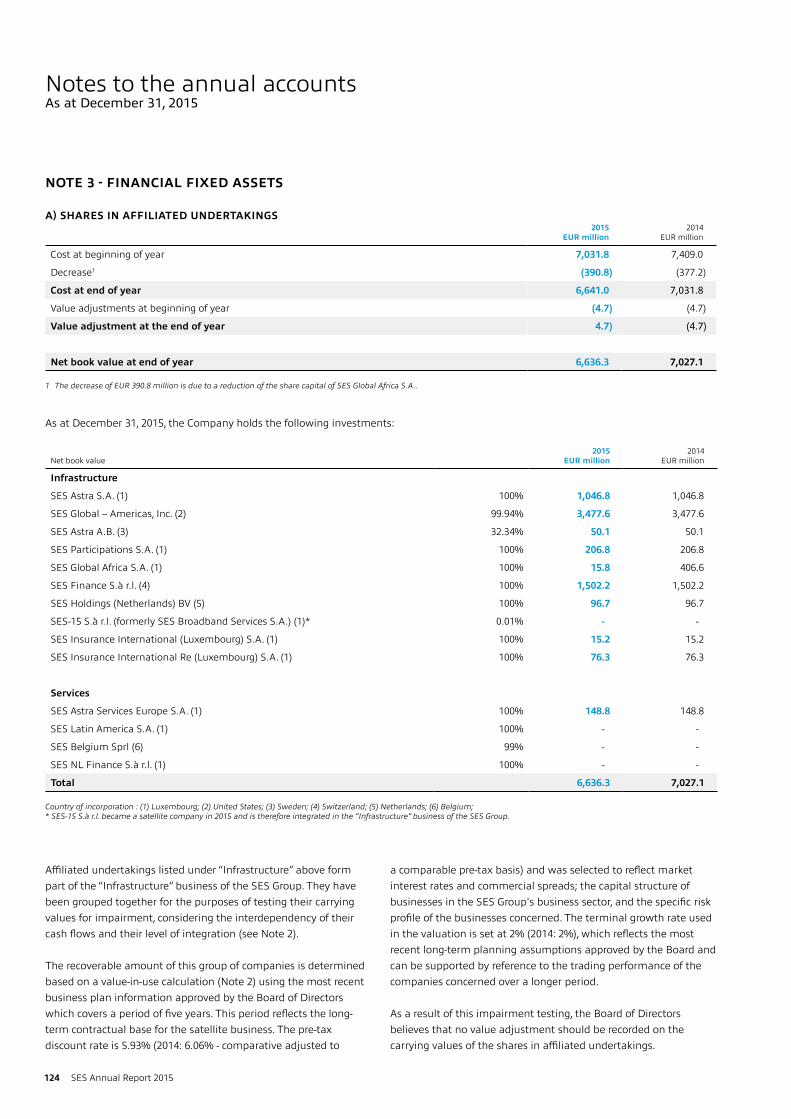
2015 EUR million
2014 EUR million
Cost at beginning of year 7,031.8 7,409.0
Decrease1 (390.8) (377.2)
Cost at end of year 6,641.0 7,031.8
Value adjustments at beginning of year (4.7) (4.7)
Value adjustment at the end of year 4.7) (4.7)
Net book value at end of year 6,636.3 7,027.1
1 The decrease of EUR 390.8 million is due to a reduction of the share capital of SES Global Africa S.A..
Net book value2015
EUR million2014
EUR million
Infrastructure
SES Astra S.A. (1) 100% 1,046.8 1,046.8
SES Global – Americas, Inc. (2) 99.94% 3,477.6 3,477.6
SES Astra A.B. (3) 32.34% 50.1 50.1
SES Participations S.A. (1) 100% 206.8 206.8
SES Global Africa S.A. (1) 100% 15.8 406.6
SES Finance S.à r.l. (4) 100% 1,502.2 1,502.2
SES Holdings (Netherlands) BV (5) 100% 96.7 96.7
SES-15 S.à r.l. (formerly SES Broadband Services S.A.) (1)* 0.01% - -
SES Insurance International (Luxembourg) S.A. (1) 100% 15.2 15.2
SES Insurance International Re (Luxembourg) S.A. (1) 100% 76.3 76.3
Services
SES Astra Services Europe S.A. (1) 100% 148.8 148.8
SES Latin America S.A. (1) 100% - -
SES Belgium Sprl (6) 99% - -
SES NL Finance S.à r.l. (1) 100% - -
Total 6,636.3 7,027.1
Country of incorporation : (1) Luxembourg; (2) United States; (3) Sweden; (4) Switzerland; (5) Netherlands; (6) Belgium; * SES-15 S.à r.l. became a satellite company in 2015 and is therefore integrated in the “Infrastructure” business of the SES Group.
Affiliated undertakings listed under “Infrastructure” above form part of the “Infrastructure” business of the SES Group. They have been grouped together for the purposes of testing their carrying values for impairment, considering the interdependency of their cash flows and their level of integration (see Note 2).
The recoverable amount of this group of companies is determined based on a value-in-use calculation (Note 2) using the most recent business plan information approved by the Board of Directors which covers a period of five years. This period reflects the long-term contractual base for the satellite business. The pre-tax discount rate is 5.93% (2014: 6.06% - comparative adjusted to
a comparable pre-tax basis) and was selected to reflect market interest rates and commercial spreads; the capital structure of businesses in the SES Group's business sector, and the specific risk profile of the businesses concerned. The terminal growth rate used in the valuation is set at 2% (2014: 2%), which reflects the most recent long-term planning assumptions approved by the Board and can be supported by reference to the trading performance of the companies concerned over a longer period.
As a result of this impairment testing, the Board of Directors believes that no value adjustment should be recorded on the carrying values of the shares in affiliated undertakings.
124 SES Annual Report 2015
Notes to the annual accountsAs at December 31, 2015
NOTE 3 - FINANCIAL FIXED ASSETS
A) SHARES IN AFFILIATED UNDERTAKINGS
As at December 31, 2015, the Company holds the following investments:
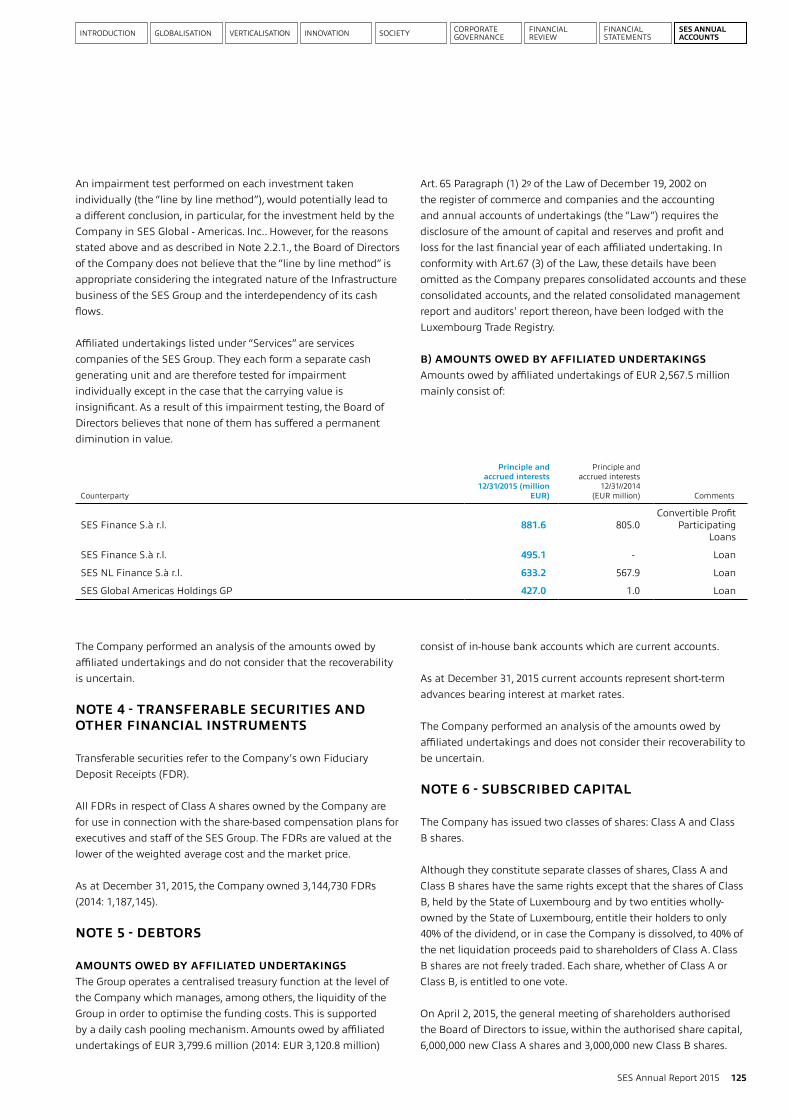
INTRODUCTION GLOBALISATION VERTICALISATION SOCIETYINNOVATION CORPORATE GOVERNANCE
FINANCIAL REVIEW
FINANCIAL STATEMENTS
SES ANNUAL ACCOUNTS
Counterparty
Principle and accrued interests
12/31/2015 (million EUR)
Principle and accrued interests
12/31//2014 (EUR million) Comments
SES Finance S.à r.l. 881.6 805.0Convertible Profit
Participating Loans
SES Finance S.à r.l. 495.1 - Loan
SES NL Finance S.à r.l. 633.2 567.9 Loan
SES Global Americas Holdings GP 427.0 1.0 Loan
An impairment test performed on each investment taken individually (the “line by line method”), would potentially lead to a different conclusion, in particular, for the investment held by the Company in SES Global - Americas. Inc.. However, for the reasons stated above and as described in Note 2.2.1., the Board of Directors of the Company does not believe that the “line by line method” is appropriate considering the integrated nature of the Infrastructure business of the SES Group and the interdependency of its cash flows.
Affiliated undertakings listed under “Services” are services companies of the SES Group. They each form a separate cash generating unit and are therefore tested for impairment individually except in the case that the carrying value is insignificant. As a result of this impairment testing, the Board of Directors believes that none of them has suffered a permanent diminution in value.
Art. 65 Paragraph (1) 2º of the Law of December 19, 2002 on the register of commerce and companies and the accounting and annual accounts of undertakings (the “Law”) requires the disclosure of the amount of capital and reserves and profit and loss for the last financial year of each affiliated undertaking. In conformity with Art.67 (3) of the Law, these details have been omitted as the Company prepares consolidated accounts and these consolidated accounts, and the related consolidated management report and auditors' report thereon, have been lodged with the Luxembourg Trade Registry.
B) AMOUNTS OWED BY AFFILIATED UNDERTAKINGSAmounts owed by affiliated undertakings of EUR 2,567.5 million mainly consist of:
The Company performed an analysis of the amounts owed by affiliated undertakings and do not consider that the recoverability is uncertain.
NOTE 4 - TRANSFERABLE SECURITIES AND OTHER FINANCIAL INSTRUMENTS
Transferable securities refer to the Company’s own Fiduciary Deposit Receipts (FDR).
All FDRs in respect of Class A shares owned by the Company are for use in connection with the share-based compensation plans for executives and staff of the SES Group. The FDRs are valued at the lower of the weighted average cost and the market price.
As at December 31, 2015, the Company owned 3,144,730 FDRs (2014: 1,187,145).
NOTE 5 - DEBTORS
AMOUNTS OWED BY AFFILIATED UNDERTAKINGSThe Group operates a centralised treasury function at the level of the Company which manages, among others, the liquidity of the Group in order to optimise the funding costs. This is supported by a daily cash pooling mechanism. Amounts owed by affiliated undertakings of EUR 3,799.6 million (2014: EUR 3,120.8 million)
consist of in-house bank accounts which are current accounts.
As at December 31, 2015 current accounts represent short-term advances bearing interest at market rates.
The Company performed an analysis of the amounts owed by affiliated undertakings and does not consider their recoverability to be uncertain.
NOTE 6 - SUBSCRIBED CAPITAL
The Company has issued two classes of shares: Class A and Class B shares.
Although they constitute separate classes of shares, Class A and Class B shares have the same rights except that the shares of Class B, held by the State of Luxembourg and by two entities wholly-owned by the State of Luxembourg, entitle their holders to only 40% of the dividend, or in case the Company is dissolved, to 40% of the net liquidation proceeds paid to shareholders of Class A. Class B shares are not freely traded. Each share, whether of Class A or Class B, is entitled to one vote.
On April 2, 2015, the general meeting of shareholders authorised the Board of Directors to issue, within the authorised share capital, 6,000,000 new Class A shares and 3,000,000 new Class B shares.
125SES Annual Report 2015
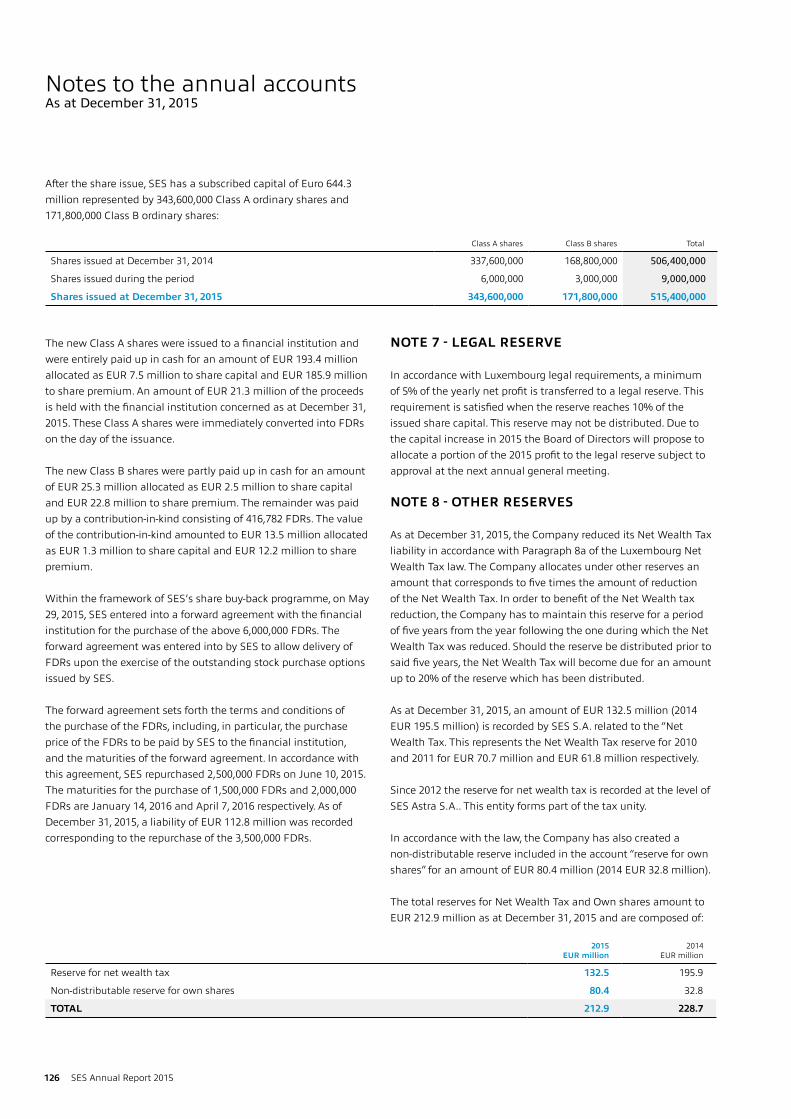
After the share issue, SES has a subscribed capital of Euro 644.3 million represented by 343,600,000 Class A ordinary shares and 171,800,000 Class B ordinary shares:
Class A shares Class B shares Total
Shares issued at December 31, 2014 337,600,000 168,800,000 506,400,000
Shares issued during the period 6,000,000 3,000,000 9,000,000
Shares issued at December 31, 2015 343,600,000 171,800,000 515,400,000
2015 EUR million
2014 EUR million
Reserve for net wealth tax 132.5 195.9
Non-distributable reserve for own shares 80.4 32.8
TOTAL 212.9 228.7
126 SES Annual Report 2015
Notes to the annual accountsAs at December 31, 2015
The new Class A shares were issued to a financial institution and were entirely paid up in cash for an amount of EUR 193.4 million allocated as EUR 7.5 million to share capital and EUR 185.9 million to share premium. An amount of EUR 21.3 million of the proceeds is held with the financial institution concerned as at December 31, 2015. These Class A shares were immediately converted into FDRs on the day of the issuance.
The new Class B shares were partly paid up in cash for an amount of EUR 25.3 million allocated as EUR 2.5 million to share capital and EUR 22.8 million to share premium. The remainder was paid up by a contribution-in-kind consisting of 416,782 FDRs. The value of the contribution-in-kind amounted to EUR 13.5 million allocated as EUR 1.3 million to share capital and EUR 12.2 million to share premium.
Within the framework of SES’s share buy-back programme, on May 29, 2015, SES entered into a forward agreement with the financial institution for the purchase of the above 6,000,000 FDRs. The forward agreement was entered into by SES to allow delivery of FDRs upon the exercise of the outstanding stock purchase options issued by SES.
The forward agreement sets forth the terms and conditions of the purchase of the FDRs, including, in particular, the purchase price of the FDRs to be paid by SES to the financial institution, and the maturities of the forward agreement. In accordance with this agreement, SES repurchased 2,500,000 FDRs on June 10, 2015. The maturities for the purchase of 1,500,000 FDRs and 2,000,000 FDRs are January 14, 2016 and April 7, 2016 respectively. As of December 31, 2015, a liability of EUR 112.8 million was recorded corresponding to the repurchase of the 3,500,000 FDRs.
NOTE 7 - LEGAL RESERVE
In accordance with Luxembourg legal requirements, a minimum of 5% of the yearly net profit is transferred to a legal reserve. This requirement is satisfied when the reserve reaches 10% of the issued share capital. This reserve may not be distributed. Due to the capital increase in 2015 the Board of Directors will propose to allocate a portion of the 2015 profit to the legal reserve subject to approval at the next annual general meeting.
NOTE 8 - OTHER RESERVES
As at December 31, 2015, the Company reduced its Net Wealth Tax liability in accordance with Paragraph 8a of the Luxembourg Net Wealth Tax law. The Company allocates under other reserves an amount that corresponds to five times the amount of reduction of the Net Wealth Tax. In order to benefit of the Net Wealth tax reduction, the Company has to maintain this reserve for a period of five years from the year following the one during which the Net Wealth Tax was reduced. Should the reserve be distributed prior to said five years, the Net Wealth Tax will become due for an amount up to 20% of the reserve which has been distributed.
As at December 31, 2015, an amount of EUR 132.5 million (2014 EUR 195.5 million) is recorded by SES S.A. related to the “Net Wealth Tax. This represents the Net Wealth Tax reserve for 2010 and 2011 for EUR 70.7 million and EUR 61.8 million respectively.
Since 2012 the reserve for net wealth tax is recorded at the level of SES Astra S.A.. This entity forms part of the tax unity.
In accordance with the law, the Company has also created a non-distributable reserve included in the account “reserve for own shares” for an amount of EUR 80.4 million (2014 EUR 32.8 million).
The total reserves for Net Wealth Tax and Own shares amount to EUR 212.9 million as at December 31, 2015 and are composed of:
INTRODUCTION GLOBALISATION VERTICALISATION SOCIETYINNOVATION CORPORATE GOVERNANCE
FINANCIAL REVIEW
FINANCIAL STATEMENTS
SES ANNUAL ACCOUNTS
An amount of EUR 29.2 million of the total EUR 80.4 million of non-distributable reserves for own shares is deemed to be covered by the share premium.
NOTE 9 - NON SUBORDINATED DEBTS
A) NON CONVERTIBLE LOANSU.S. Private PlacementOn September 30, 2003, SES, through SES Global Americas Holdings GP, issued in the U.S. Private Placement market four series of unsecured notes amounting to USD 1,000.0 million and GBP 28.0 million. These notes comprised:
← Series A USD 400.0 million of 5.29% Senior Notes due September 2013, amortising as of September 2007. The Private Placement Series A was reimbursed on September 30, 2013. ← Series B USD 513.0 million of 5.83% Senior Notes due September 2015, amortising as of September 2011. The Private Placement Series B was repaid on September 30, 2015. ← Series C USD 87.0 million of 5.93% Senior Notes due September 2015. The Private Placement Series C was repaid on September 30, 2015. ← Series D GBP 28.0 million of 5.63% Senior Notes due September 2013, amortising as of September 2007. The Private Placement Series D was reimbursed on September 30, 2013.
No amounts are outstanding as of December 31, 2015.
European Medium-Term Note Programme (EMTN)On December 6, 2005, SES put in place a EUR 2,000.0 million EMTN enabling SES, or SES Global Americas Holdings GP, to issue as and when required notes up to a maximum aggregate amount of EUR 2,000.0 million. In May 2007, this programme was increased to an aggregate amount of EUR 4,000.0 million. As of December 31, 2015, SES has issued EUR 2,090.00 million (2014: EUR 2,090.0 million) under the EMTN Programme with maturities ranging from 2016 to 2027.
EUR 150.0 million Private Placement (2016)On July 13, 2009, SES issued a EUR 150.0 million Private Placement under the Company’s European Medium-Term Note Programme with Deutsche Bank. The Private Placement has a 7-year maturity, beginning August 5, 2009, and bears interest at a fixed rate of 5.05%.
EUR 500 million Eurobond (2018)On October 16, 2013, SES issued a EUR 500.0 million bond under the Company’s European Medium-Term Note Programme. The bond has a 5-year maturity and bears interest at a fixed rate of 1.875%.
EUR 650 million Eurobond (2020)On March 9, 2010 (pricing March 1, 2010), SES issued a EUR 650.0 million bond under the Company’s European Medium-Term Note Programme. The bond has a 10-year maturity and bears interest at a fixed rate of 4.625%.
EUR 650 million Eurobond (2021)On March 11, 2011 (pricing March 2, 2011), SES issued a EUR 650.0 million bond under the Company’s European Medium-Term Note Programme. The bond has a 10-year maturity and bears interest at a fixed rate of 4.75%.
EUR 140 million Private Placement (2027)Between May and July 2012, SES issued three individual tranches of a total EUR 140.0 million Private Placement under the Company’s European Medium-Term Note Programme with ING Bank N.V.. The Private Placement has a 15-year maturity, beginning May 31, 2012, and bears interest at a fixed rate of 4.00%.
144A Bond USD 750 million (2023)On April 4, 2013, SES completed a 144A offering in the U.S. market issuing a USD 750 million (EUR 688.9 million at December 31, 2015) 10-year bond with a coupon of 3.60% and a final maturity date on April 4, 2023.
144A Bond USD 250 million (2043)On April 4, 2013, SES completed a 144A offering in the U.S. market issuing a USD 250 million (EUR 229.6 million at December 31, 2015) 30-year bond with a coupon of 5.30% and a final maturity date on April 4, 2043.
144A Bond USD 500 million (2019) On March 25, 2014, SES completed a 144A offering in the U.S. market issuing a USD 500 million (EUR 459.3 million at December 31, 2015) 5-year bond with a coupon of 2.50% and a final maturity date of March 25, 2019.
144A Bond USD 500 million (2044) On March 25, 2014, SES completed a 144A offering in the U.S. market issuing a USD 500 million 30-year bond with a coupon of 5.30% and a final maturity date of March 25, 2044.
German Bond issue of EUR 50.0 million (2032)On October 29, 2012, SES signed an agreement to issue EUR 50 million in the German bond (Schuldschein) market. The German bond bears a fixed interest rate of 4.0% and matures on November 12, 2032.
The maturity profile of notes and bonds is as follows as at December 31, 2015 and 2014:
127SES Annual Report 2015
2015 EUR million
2014 EUR million
Within one year (1) 225.5 234.0
Total within one year 225.5 234.0
Between one to two years - 150.0
Between two to five years 1,609.3 500.0
After five years 2,217.8 3,137.3
Total after one year 3,827.1 3,787.3
(1) Includes accrued interest in the amount of EUR 75.5 million at year-end 2015 (2014: EUR 77.8 million)
2015 EUR million
2014 EUR million
European Investment Bank 33.6 33.9
COFACE facility 55.9 56.4
US Ex-Im 16.6 15.0
Becoming due and payable within one year (1) 106.1 105.3
European Investment Bank 33.4 66.7
COFACE facility 304.5 358.6
US Ex-Im 57.6 66.3
Becoming due and payable after more than one year 395.5 491.6
(1) Includes accrued interests in the amount of EUR 2.4 million at year-end 2015 (2014: EUR 3.0 million)
128 SES Annual Report 2015
EUR 200.0 million European Investment Bank fundingOn April 21, 2009, SES signed a financing agreement with the European Investment Bank for the investment by the Group in certain satellite investment projects. This facility, bearing interest at a fixed rate of 3.618%, is repayable in six annual instalments between May 2012 and May 2017.
Syndicated loan 2021In January 2014, the Group updated its previous syndicated loan facility (Syndicated loan 2015). The updated facility is being provided by 20 banks and has been structured as a 5 year multicurrency revolving credit facility with two one-year extension options at the discretion of the lenders. The facility is for EUR 1.2 billion and the interest payable is linked to a ratings grid. At the current SES rating of BBB / Baa2, the interest rate is 45 basis points over EURIBOR/LIBOR. On November 13, 2015 and November 23, 2015 respectively, the facility agreement has been amended and extended by one year to January 13, 2021. As at December 31, 2015 and as at December 31, 2014 no amount is drawn from this facility.
EUR 522.9 million COFACE facilityOn December 16, 2009, SES signed a financing agreement with the Compagnie Française d’Assurance pour le Commerce Extérieur (Coface) in respect of the investment in four geostationary satellites (ASTRA 2E, ASTRA 2F, ASTRA 2G, ASTRA 5B). The facility is divided into five loans. The drawings under the facility are based on invoices from the supplier of the satellites. The first drawing was
done on April 23, 2010 and all loan tranches became fully drawn in November 2014. Each Coface tranche is repayable in 17 equal semi-annual instalments where Coface A has a final maturity date of August 1, 2022, Coface B and F will mature on May 21, 2021 and Coface C and D will mature on October 3, 2022. The facility bears interest at a floating rate of six month EURIBOR plus a margin of 1.7%.
USD 158 million U.S. Ex-Im facilityIn April 2011, SES signed a financing agreement with the Export-Import Bank of the United States (US Ex-Im) for USD 158 million for the investment in one geostationary satellite (QuetzSat-1). At the in-orbit acceptance date of the satellite, the facility was fully drawn with USD 152.2 million which is being repaid in 17 equal semi-annual instalments beginning on June 22, 2012. The loan has a final maturity date of June 22, 2020 and bears interest at a fixed rate of 3.11%.
The maturity profile of the amounts drawn is as follows as at December 31, 2015 and 2014:
B) AMOUNTS OWED TO CREDIT INSTITUTIONSAs at December 31, 2015 and 2014, the amount owed to credit institutions was as follows:
Notes to the annual accountsAs at December 31, 2015
INTRODUCTION GLOBALISATION VERTICALISATION SOCIETYINNOVATION CORPORATE GOVERNANCE
FINANCIAL REVIEW
FINANCIAL STATEMENTS
SES ANNUAL ACCOUNTS
2015 EUR million
2014 EUR million
Between one and two years 104.0 204.6
Between two and five years 204.0 199.5
After five years 87.5 87.5
Total 395.5 491.6
2015 EUR million
2014 EUR million
Long-term loans (maturity after 5 years) 166.7 1,108.8
Term loans (between 1 - 5 years) 307.9 276.1
Notes due within one year 1,043.8 1,452.6
Current accounts 2,994.5 2,428.2
Total 4,512.9 5,265.7
129SES Annual Report 2015
During the year 2015 SES repaid another tranche of EUR 33.3 million to the European Investment Bank and two tranches of the U.S. Ex-Im facility for a total of USD 17.9 million.
Furthermore, during the year 2015 SES repaid floating rate obligations totaling EUR 54.2 million related to various Coface instalments.
Committed and uncommitted loan facilitiesAs at December 31, 2015 and as at December 31, 2014, the Company had not made any drawings under uncommitted loan facilities.
C) AMOUNTS OWED TO AFFILIATED UNDERTAKINGSAmounts owed to affiliated undertakings of EUR 4,512.9 million (2014: EUR 5,265.7 million) include the following:
As at December 31, 2015 long-term loans included:
← A loan for a total amount of USD 106 million with a maturity of December 2022 bearing interest at a rate of 4.00% with SES Americom Inc.. ← A loan for a total amount of USD 50 million with a maturity date of May 2025 at a rate of 4.2% that has been entered into in 2015 with SES Satellites Gibraltar Ltd.. ← A loan for a total amount of EUR 23 million with a maturity date of May 2025 at a rate of 2% that has been entered into in 2015 with SES Astra Real Estate S.A..
In 2015, long-term loans with New Skies Satellites B.V. have been repaid early for an amount of USD 225 million, and with SES Global Americas Inc. for USD 966 million.
The term loans outstanding as at December 31, 2015 included:
← A loan for a total amount of USD 334 million with a maturity of January 2019 bearing interest at a rate of 4% with SES Finance S.à r.l..
The notes outstanding as at December 31, 2015, included:
← Two loans for a total amount of EUR 543.3 million maturing in November 2016 bearing interest at a rate of 0.36% with SES Participation S.A.. ← A loan for a total amount of EUR 500.5 million maturing in
November 2018 bearing interest at a rate of 0.63% with a maturity of November 2018 with SES Lux Finance S.à r.l..
As at December 31, 2015 and 2014 current accounts represent short-term debts bearing interest at market rates.
NOTE 10 - TAX DEBT
The Company is subject to the tax regulations in Luxembourg, in Switzerland for the Swiss branch, and in the U.S. for the partnership.
In accordance with Article 164bis of the Luxembourg income tax law, SES S.A. is the head of the Luxembourg tax unity with its subsidiaries as follows:
- SES Astra S.A.- SES Asia S.A.- SES-15 S.à r.l. (formerly SES Broadband Services S.A.)- SES-10 S.à r.l.- SES Participations S.A.- SES Global Africa S.A.- SES Astra 3B S.à r.l.- SES Astra 1KR S.à r.l.- SES Astra 1L S.à r.l.- SES Astra 1M S.à r.l.- SES Engineering S.à r.l.- SES Astra 1N S.à r.l.
2015 EUR million
2014 EUR million
Wages and salaries 17.0 27.4
Social security costs 1.4 1.9
Total 18.4 29.3
2015 EUR million
2014 EUR million
Dividends received from affiliated undertakings 2,721.8 717.8
Total 2,721.8 717.8
2015 EUR million
2014 EUR million
Interest charges 179.9 184.9
Foreign exchange losses net - 54.1
Loan origination costs 9.1 15.5
Total 189.0 254.5
NOTE 12 - OTHER INTEREST AND SIMILAR FINANCIAL CHARGES
Other interest and similar financial charges include the following:
130 SES Annual Report 2015
- SES Astra 5B S.à r.l.- SES Astra 2E S.à r.l.- SES Astra 2F S.à r.l.- SES Astra 2G S.à r.l. - SES Digital Distribution Services S.à r.l.- SES Astra Services Europe S.A.- SES Lux Finance S.à r.l.- SES NL Finance S.à r.l.- SES Astra Real Estate (Betzdorf) S.A.- SES Techcom S.A.- SES Latin America S.A.- SES Insurance International (Luxembourg) S.A.- SES Insurance International Re (Luxembourg) S.A.
The balance sheet position takes into consideration the net tax payable or receivable of the tax unity to the Luxembourg tax authorities, which is due by the head of the tax unity, being SES S.A..
The respective tax charge/income of each subsidiary is computed and recharged on a stand-alone basis via intercompany accounts.
In 2015, the tax sharing agreement in place between the Company and its subsidiaries has been amended and allows the Company not to accept the recharge of tax income from its subsidiaries if it is not able itself to use that tax income for that year. The recharge of the tax income of SES Astra 5B S.à r.l. and SES Astra 2G S.à r.l related to prior years has been adjusted in 2015 impacting the intercompany payable/receivable account up to the amount that SES S.A. is able to use in 2015.
NOTE 11 - STAFF COSTS
As at December 31, 2015, the number of full time equivalent employees was 68 (2014: 68) and the average number of employees in the workforce for 2015 was 67 (2014: 68.5). Staff costs can be analysed as follows:
Notes to the annual accountsAs at December 31, 2015
NOTE 13 - VALUE ADJUSTMENTS AND LOSS ON DISPOSAL OF TRANSFERABLE SECURITIES
The balance of EUR 33.7 million is composed of a loss on disposal of the Company’s FDRs for EUR 19.0 million and a value adjustment on outstanding FDRs as of December 31, 2015 for EUR 14.7 million.
A value adjustment has been recorded to account for the FDRs at the lower of their weighted average cost and market price. The value of the SES’s share listed on Euronext Paris was EUR 25.575 as at December 31, 2015 which results in a total value adjustment of EUR 14.7 million.
NOTE 14 - OTHER OPERATING INCOME
Other operating income amounting to EUR 15.5 million (2014: EUR 19.1 million) consists mainly of group recharge revenues from advisory support services rendered to various affiliates.
NOTE 15 - INCOME FROM FINANCIAL FIXED ASSETS
Income from financial fixed assets derived from affiliated undertakings consists of the following:
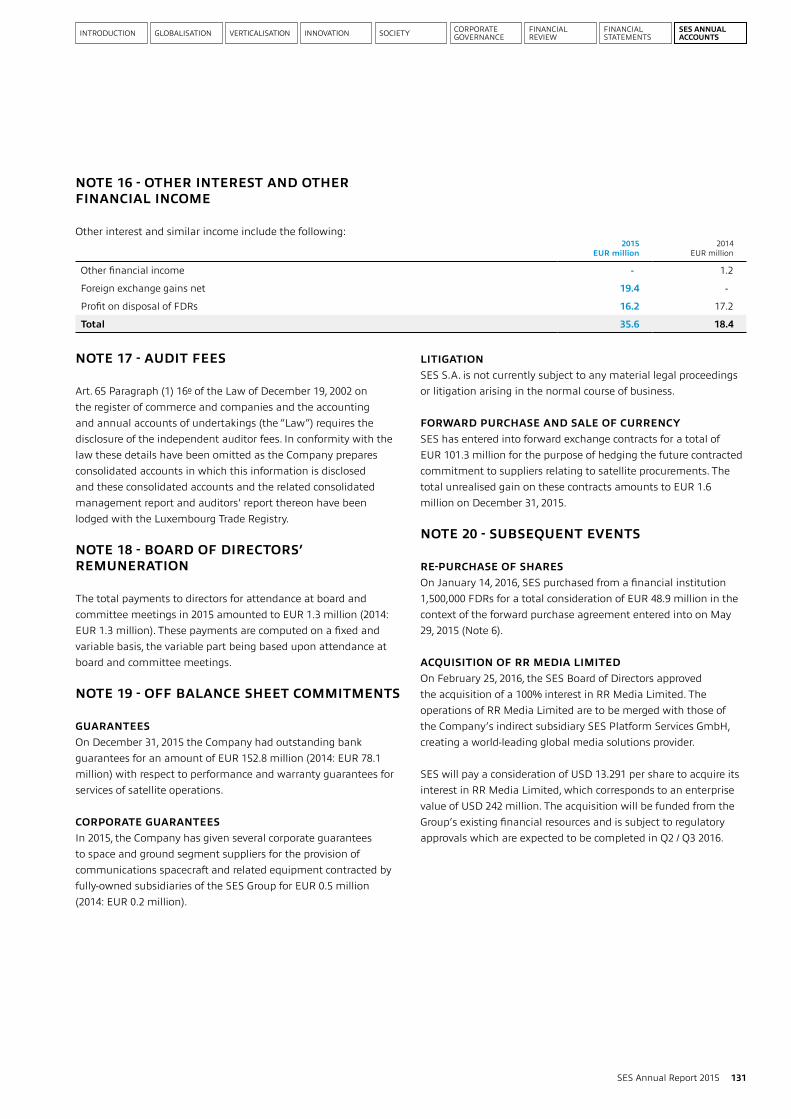
INTRODUCTION GLOBALISATION VERTICALISATION SOCIETYINNOVATION CORPORATE GOVERNANCE
FINANCIAL REVIEW
FINANCIAL STATEMENTS
SES ANNUAL ACCOUNTS
NOTE 16 - OTHER INTEREST AND OTHER FINANCIAL INCOME
Other interest and similar income include the following:2015
EUR million2014
EUR million
Other financial income - 1.2
Foreign exchange gains net 19.4 -
Profit on disposal of FDRs 16.2 17.2
Total 35.6 18.4
NOTE 17 - AUDIT FEES
Art. 65 Paragraph (1) 16º of the Law of December 19, 2002 on the register of commerce and companies and the accounting and annual accounts of undertakings (the “Law”) requires the disclosure of the independent auditor fees. In conformity with the law these details have been omitted as the Company prepares consolidated accounts in which this information is disclosed and these consolidated accounts and the related consolidated management report and auditors' report thereon have been lodged with the Luxembourg Trade Registry.
NOTE 18 - BOARD OF DIRECTORS’ REMUNERATION
The total payments to directors for attendance at board and committee meetings in 2015 amounted to EUR 1.3 million (2014: EUR 1.3 million). These payments are computed on a fixed and variable basis, the variable part being based upon attendance at board and committee meetings.
NOTE 19 - OFF BALANCE SHEET COMMITMENTS
GUARANTEESOn December 31, 2015 the Company had outstanding bank guarantees for an amount of EUR 152.8 million (2014: EUR 78.1 million) with respect to performance and warranty guarantees for services of satellite operations.
CORPORATE GUARANTEESIn 2015, the Company has given several corporate guarantees to space and ground segment suppliers for the provision of communications spacecraft and related equipment contracted by fully-owned subsidiaries of the SES Group for EUR 0.5 million (2014: EUR 0.2 million).
LITIGATIONSES S.A. is not currently subject to any material legal proceedings or litigation arising in the normal course of business.
FORWARD PURCHASE AND SALE OF CURRENCYSES has entered into forward exchange contracts for a total of EUR 101.3 million for the purpose of hedging the future contracted commitment to suppliers relating to satellite procurements. The total unrealised gain on these contracts amounts to EUR 1.6 million on December 31, 2015.
NOTE 20 - SUBSEQUENT EVENTS
RE-PURCHASE OF SHARESOn January 14, 2016, SES purchased from a financial institution 1,500,000 FDRs for a total consideration of EUR 48.9 million in the context of the forward purchase agreement entered into on May 29, 2015 (Note 6).
ACQUISITION OF RR MEDIA LIMITEDOn February 25, 2016, the SES Board of Directors approved the acquisition of a 100% interest in RR Media Limited. The operations of RR Media Limited are to be merged with those of the Company’s indirect subsidiary SES Platform Services GmbH, creating a world-leading global media solutions provider.
SES will pay a consideration of USD 13.291 per share to acquire its interest in RR Media Limited, which corresponds to an enterprise value of USD 242 million. The acquisition will be funded from the Group’s existing financial resources and is subject to regulatory approvals which are expected to be completed in Q2 / Q3 2016.
131SES Annual Report 2015
FINANCIAL CALENDAR 2016
Annual General Meeting of Shareholders: 7 April 2016 Dividend payment: 27 April 2016First quarter trading update: 29 April 2016Announcement of first half results: 29 July 2016 Third quarter trading update: 28 October 2016
LISTED SECURITY
Fiduciary Depositary Receipts each in respect of one A shareof SES S.A. are listed on the Stock Exchange of Luxembourgand on NYSE Euronext Paris under the symbol SESG.
FIDUCIARY AGENT
Banque et Caisse d’Epargne de l’Etat16, rue Ste ZitheL-2954 LuxembourgTel: +352 40 151
SHAREHOLDER ENQUIRIES
SES S.A.Investor RelationsL-6815 Château de BetzdorfLuxembourgTel: +352 710 725 490Fax: +352 710 725 [email protected]
132 SES Annual Report 2015
Information for shareholders


IMPRESSUM
All brand and product names may be registered trade marks and are hereby acknowledged. It is our policy to produce the document constituting our annual report with a minimum impact on the environment. To this end the paper used is 100% chlorine free woodpulp from sustainable forests, using thinnings and waste from the timber industry and is totally recyclable and biodegradable. Our printers are fully accredited to the ISO 14001 environmental management system. They utilise vegetable based inks and operate a direct computer to plate repro system, eliminating the need for film with its chemicals such as developer and acid fixers. This report is printed on Heaven 42, an environmentally responsible 100% recycled paper made from 100% post–consumer waste and bleached chlorine free (PCF).
Designed by BizartPrinted by Print Solutions
Photo credit: SES, Rainer Buecken, Getty Images, Shutterstock

For more information about SES, visit www.ses.com or email [email protected]
REGISTERED OFFICE AND GROUP HEADQUARTERS SES S.A.Château de BetzdorfL-6815 LuxembourgRegistre de commerceRCS Luxembourg B 81.267
SATELLITE SERVICES COMPANIES SES Government Solutions2010 Corporate Ridge, Suite 550McLean, VA 22102USATel +1 703 610 1000Fax +1 703 610 [email protected]
SES Platform ServicesBetastrasse 1-10D-85774 UnterföhringGermanyTel +49 89 1896 2100 Fax +49 89 1896 3659 www.ses.com/platform-services
SES TechCom Services9 rue Pierre WernerL-6815 LuxembourgTel +352 710 725 259Fax +352 710 725 575www.ses.com/techcom
HD+ GmbHBetastrasse 1-10D-85774 UnterföhringGermanyTel +49 900 1 904 599Fax +49 89 1896 3602www.hd-plus.de
REGIONAL OFFICES 1. Accra
1st Ringway4, Ringway Estate Osu, AccraGhanaTel +233 302 201 464
2. BucharestAmerica House West Wing, 2nd floor 4-8 Nicolae Titulescu RoadDistrict 1, BucharestRomaniaTel +40 21 222 1751
3. Dubai office Thuraya Tower 1 Office 507PO Box 502866DubaiUAETel +971 45515731
4. The HagueRooseveltplantsoen 4 2517 KR The HagueThe NetherlandsTel +31 70 306 4100
5. IstanbulMaya Akar CenterBuyukdere Cad. 100-102 C Blok No: 434394 Esentepe-SisliTurkeyTel +90 212 318 90 93
6. JohannesburgThe Pivot Block E 2nd Floor Monte Casino Boulevard Fourways JohannesburgSouth AfricaTel +27 11 081 8200
7. Kiev14 Patorzhinskogo str. of. 66 UA-01001 Kiev UkraineTel +380 44 531 90 90
8. London3 Dorset Rise London EC4Y 8EN United KingdomTel +44 20 76 32 79 20
9. Madridc/ Velázquez, 47 - 2º b 28001 MadridSpainTel +34 91 41 11 746
10. Mexico Campos Elíseos No. 188Piso 8Colonia PolancoMexico CityD.F. 11560MexicoTel +52 55 5283 2420
11. MoscowBlagoveschensky pereulok 1aOffice 108 RU - 123001 MoscowRussiaTel +7 495 357 07 30
12. MunichBetastrasse 1-10 85774 Unterföhring GermanyTel +49 89 18 96 21 00
13. Paris4, rue Halévy 75009 Paris FranceTel +33 1 42 68 00 09
14. Princeton4 Research Way Princeton, NJ 08540-6684 USATel +1 609 987 4000
15. RigaSirius Riga Skyport Zakusalas Krastmala 3Of. 2041509 Riga LatviaTel +371 6 720 09 47
16. São PauloAv. das Nações Unidas, 12551 9º andar São Paulo, SPBrasilTel +55 11 3443 7452
17. Singapore501 Orchard Road #18-00 Wheelock Place Singapore 238880Tel +65 6593 3600
18. StockholmKista Science Tower Färögatan 33 SE-164 51 Kista SwedenTel +46 8 505 645 00
19. WarsawPl. Pilsudskiego 2, building 2 00-073 Warszawa PolandTel +48 22 332 78 50
20. Washington, D.C.1129 20th Street, N.W. Suite 1000 Washington, D.C. 20036 USATel +1 202 478-7100