Embed Size (px)
Citation preview
Annual Report 2015
Financial Information
1 TERUMO CORPORATION Annual Report 2015 Financial Information
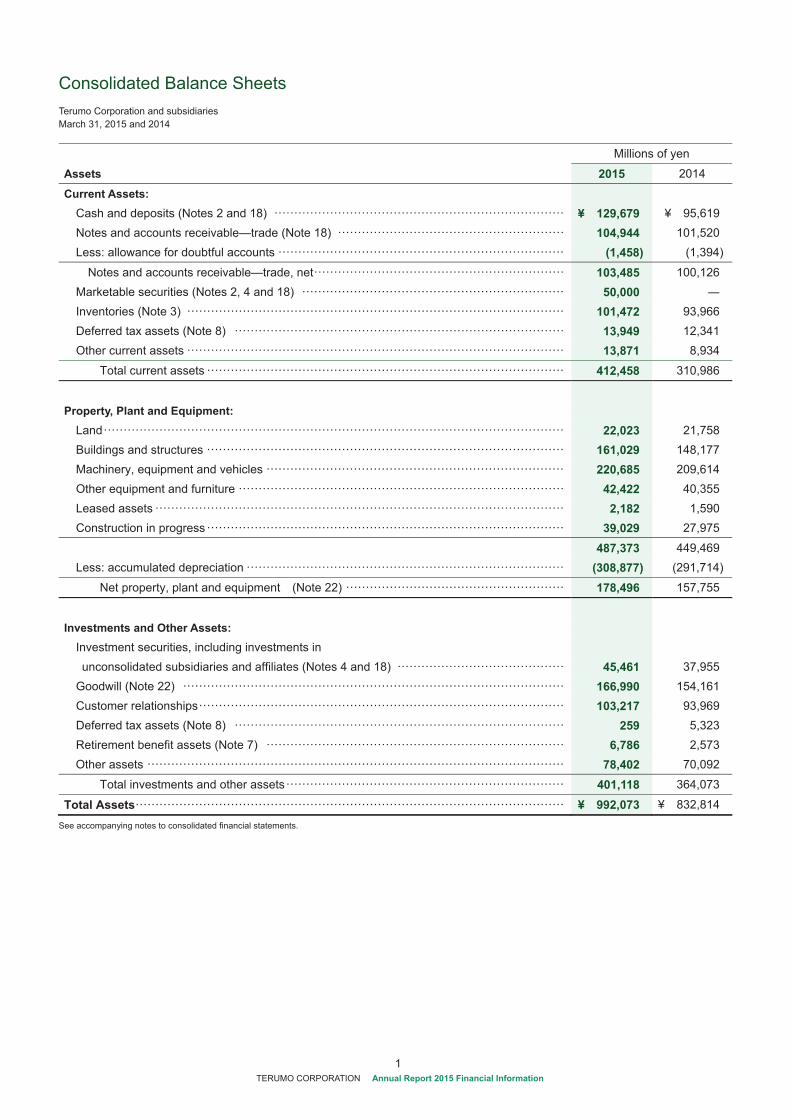
Consolidated Balance Sheets Terumo Corporation and subsidiaries March 31, 2015 and 2014
Millions of yen
Assets 2015 2014
Current Assets: Cash and deposits (Notes 2 and 18) ········································································· ¥ 129,679 ¥ 95,619 Notes and accounts receivable—trade (Note 18) ························································· 104,944 101,520 Less: allowance for doubtful accounts ········································································ (1,458) (1,394)
Notes and accounts receivable—trade, net ······························································· 103,485 100,126 Marketable securities (Notes 2, 4 and 18) ·································································· 50,000 Inventories (Note 3) ······························································································· 101,472 93,966 Deferred tax assets (Note 8) ··················································································· 13,949 12,341 Other current assets ······························································································· 13,871 8,934
Total current assets ·························································································· 412,458 310,986
Property, Plant and Equipment: Land ···················································································································· 22,023 21,758 Buildings and structures ·························································································· 161,029 148,177 Machinery, equipment and vehicles ··········································································· 220,685 209,614 Other equipment and furniture ·················································································· 42,422 40,355 Leased assets ······································································································· 2,182 1,590 Construction in progress ·························································································· 39,029 27,975
487,373 449,469 Less: accumulated depreciation ················································································ (308,877) (291,714)
Net property, plant and equipment (Note 22) ······················································· 178,496 157,755
Investments and Other Assets:
Investment securities, including investments in unconsolidated subsidiaries and affiliates (Notes 4 and 18) ·········································· 45,461 37,955
Goodwill (Note 22) ································································································ 166,990 154,161 Customer relationships ···························································································· 103,217 93,969 Deferred tax assets (Note 8) ··················································································· 259 5,323 Retirement benefit assets (Note 7) ··········································································· 6,786 2,573 Other assets ········································································································· 78,402 70,092
Total investments and other assets ······································································ 401,118 364,073
Total Assets ············································································································ ¥ 992,073 ¥ 832,814
See accompanying notes to consolidated financial statements.
2 TERUMO CORPORATION Annual Report 2015 Financial Information
Millions of yen
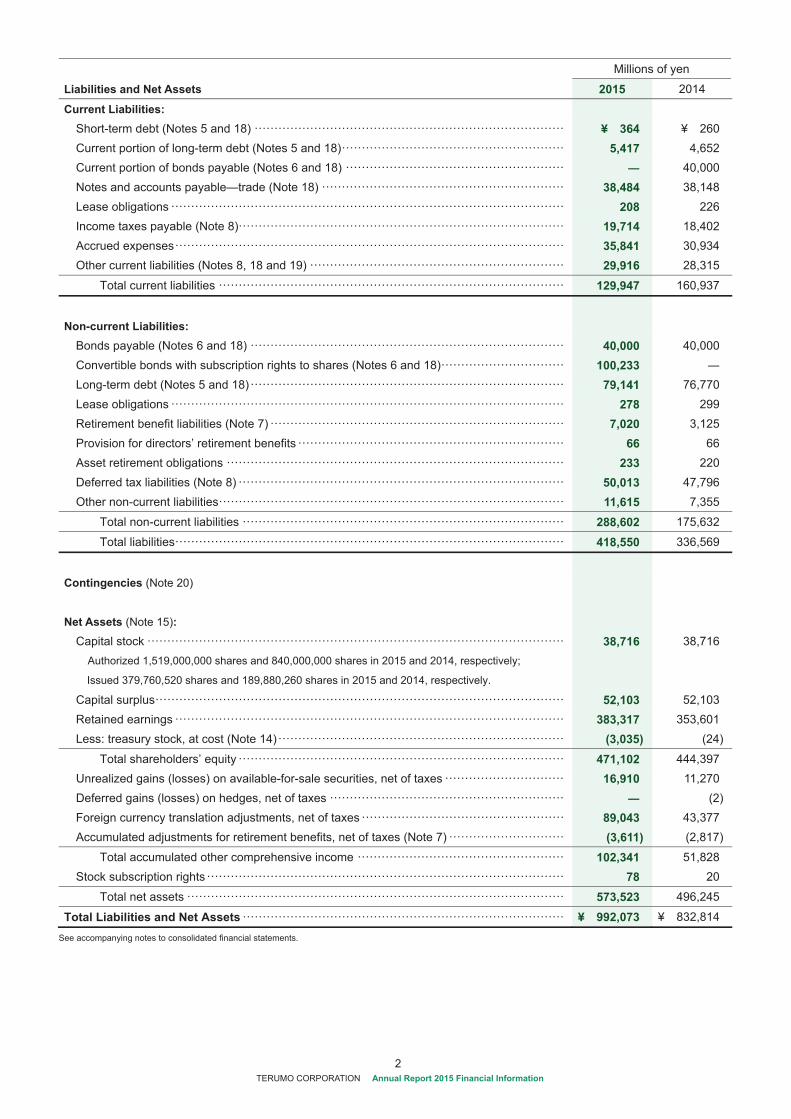
Liabilities and Net Assets 2015 2014
Current Liabilities: Short-term debt (Notes 5 and 18) ·············································································· ¥ 364 ¥ 260 Current portion of long-term debt (Notes 5 and 18) ························································ 5,417 4,652 Current portion of bonds payable (Notes 6 and 18) ······················································· 40,000 Notes and accounts payable—trade (Note 18) ····························································· 38,484 38,148 Lease obligations ··································································································· 208 226 Income taxes payable (Note 8)·················································································· 19,714 18,402 Accrued expenses ·································································································· 35,841 30,934 Other current liabilities (Notes 8, 18 and 19) ································································ 29,916 28,315
Total current liabilities ······················································································· 129,947 160,937
Non-current Liabilities:
Bonds payable (Notes 6 and 18) ··············································································· 40,000 40,000 Convertible bonds with subscription rights to shares (Notes 6 and 18) ······························· 100,233 Long-term debt (Notes 5 and 18) ··············································································· 79,141 76,770 Lease obligations ··································································································· 278 299 Retirement benefit liabilities (Note 7) ·········································································· 7,020 3,125 Provision for directors’ retirement benefits ··································································· 66 66 Asset retirement obligations ····················································································· 233 220 Deferred tax liabilities (Note 8) ·················································································· 50,013 47,796 Other non-current liabilities ······················································································· 11,615 7,355
Total non-current liabilities ················································································· 288,602 175,632
Total liabilities ·································································································· 418,550 336,569
Contingencies (Note 20) Net Assets (Note 15):
Capital stock ········································································································· 38,716 38,716 Authorized 1,519,000,000 shares and 840,000,000 shares in 2015 and 2014, respectively;
Issued 379,760,520 shares and 189,880,260 shares in 2015 and 2014, respectively.
Capital surplus ······································································································· 52,103 52,103 Retained earnings ·································································································· 383,317 353,601 Less: treasury stock, at cost (Note 14) ········································································ (3,035) (24)
Total shareholders’ equity ·················································································· 471,102 444,397 Unrealized gains (losses) on available-for-sale securities, net of taxes ······························ 16,910 11,270 Deferred gains (losses) on hedges, net of taxes ··························································· (2)Foreign currency translation adjustments, net of taxes ··················································· 89,043 43,377 Accumulated adjustments for retirement benefits, net of taxes (Note 7) ····························· (3,611) (2,817)
Total accumulated other comprehensive income ···················································· 102,341 51,828 Stock subscription rights ·························································································· 78 20
Total net assets ······························································································· 573,523 496,245
Total Liabilities and Net Assets ················································································· ¥ 992,073 ¥ 832,814
See accompanying notes to consolidated financial statements.
3 TERUMO CORPORATION Annual Report 2015 Financial Information
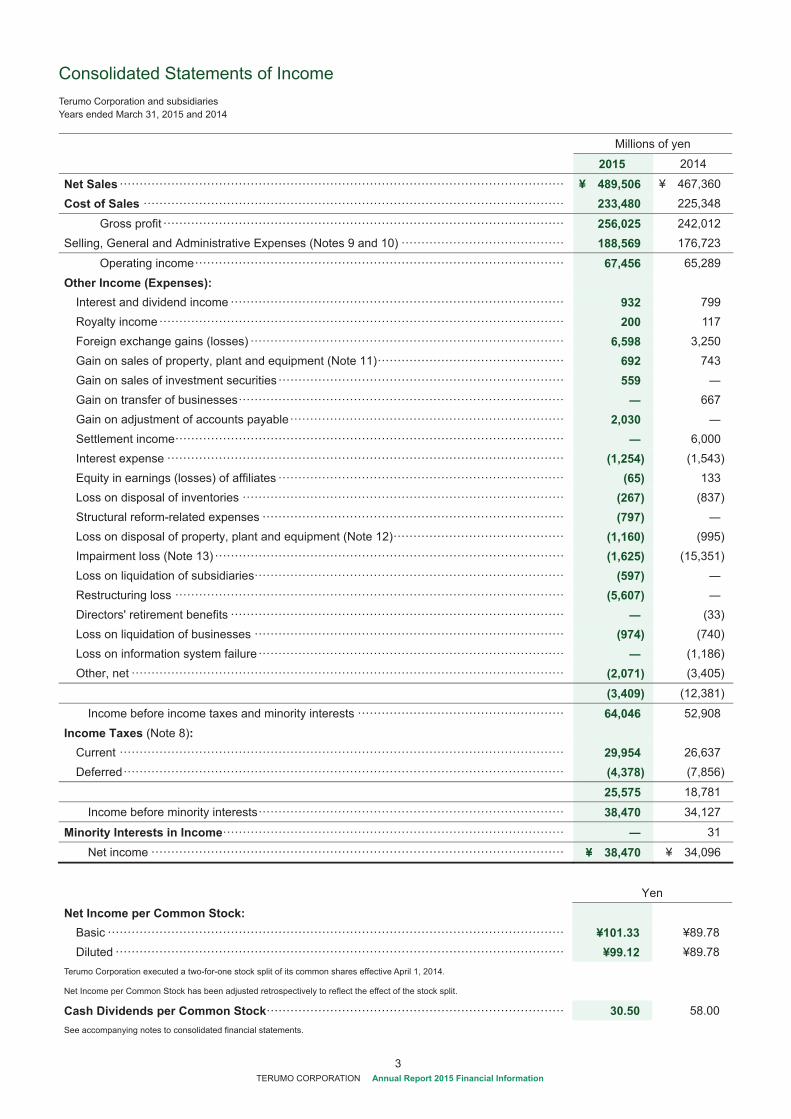
Consolidated Statements of Income Terumo Corporation and subsidiaries Years ended March 31, 2015 and 2014
Millions of yen
2015 2014
Net Sales ················································································································ ¥ 489,506 ¥ 467,360 Cost of Sales ·········································································································· 233,480 225,348
Gross profit ····································································································· 256,025 242,012 Selling, General and Administrative Expenses (Notes 9 and 10) ········································· 188,569 176,723
Operating income ····························································································· 67,456 65,289 Other Income (Expenses):
Interest and dividend income ···················································································· 932 799 Royalty income ······································································································ 200 117 Foreign exchange gains (losses) ··············································································· 6,598 3,250 Gain on sales of property, plant and equipment (Note 11) ··············································· 692 743 Gain on sales of investment securities ········································································ 559 Gain on transfer of businesses ·················································································· 667 Gain on adjustment of accounts payable ····································································· 2,030 Settlement income ·································································································· 6,000 Interest expense ···································································································· (1,254) (1,543)Equity in earnings (losses) of affiliates ········································································ (65) 133 Loss on disposal of inventories ················································································· (267) (837)Structural reform-related expenses ············································································ (797) Loss on disposal of property, plant and equipment (Note 12) ··········································· (1,160) (995)Impairment loss (Note 13) ························································································ (1,625) (15,351)Loss on liquidation of subsidiaries·············································································· (597) Restructuring loss ·································································································· (5,607) Directors' retirement benefits ···················································································· (33)Loss on liquidation of businesses ·············································································· (974) (740)Loss on information system failure ············································································· (1,186)Other, net ············································································································· (2,071) (3,405)
(3,409) (12,381)
Income before income taxes and minority interests ···················································· 64,046 52,908 Income Taxes (Note 8):
Current ················································································································ 29,954 26,637 Deferred ··············································································································· (4,378) (7,856)
25,575 18,781
Income before minority interests ············································································· 38,470 34,127
Minority Interests in Income ······················································································ 31
Net income ········································································································ ¥ 38,470 ¥ 34,096
Yen
Net Income per Common Stock: Basic ··················································································································· ¥101.33 ¥89.78 Diluted ················································································································· ¥99.12 ¥89.78
Terumo Corporation executed a two-for-one stock split of its common shares effective April 1, 2014.
Net Income per Common Stock has been adjusted retrospectively to reflect the effect of the stock split.
Cash Dividends per Common Stock ··········································································· 30.50 58.00 See accompanying notes to consolidated financial statements.
4 TERUMO CORPORATION Annual Report 2015 Financial Information
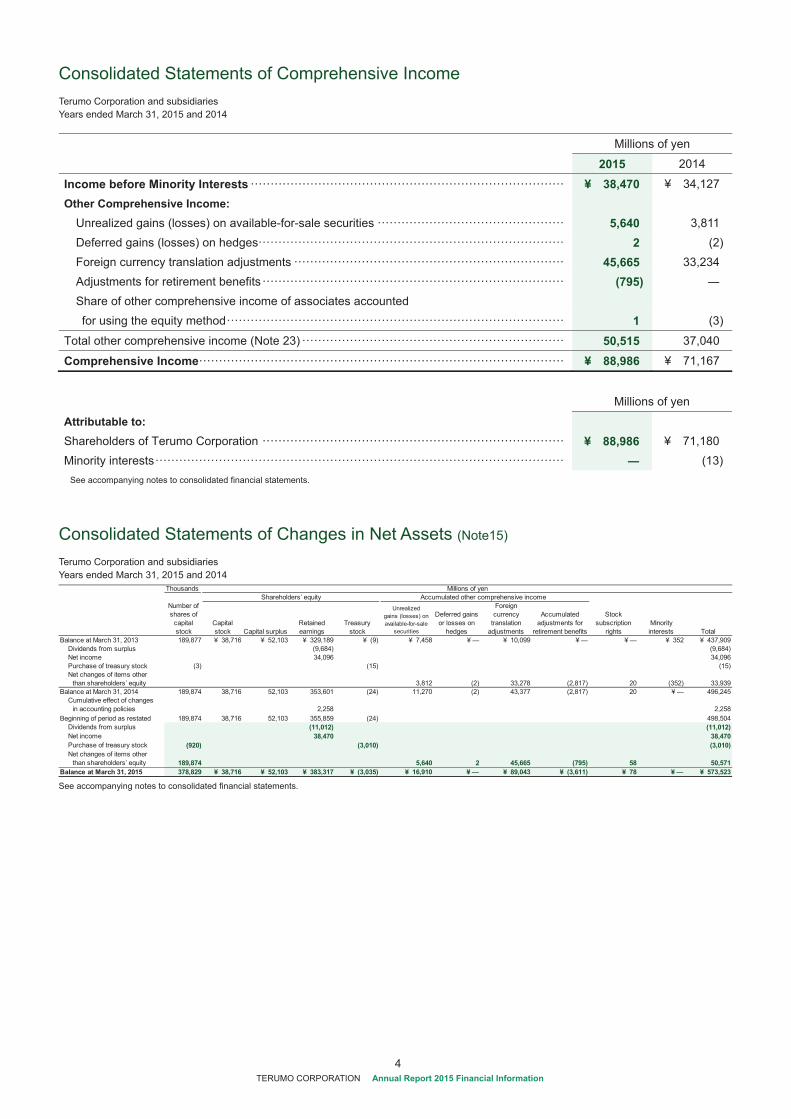
Consolidated Statements of Comprehensive Income Terumo Corporation and subsidiaries Years ended March 31, 2015 and 2014
Millions of yen
2015 2014
Income before Minority Interests ··············································································· ¥ 38,470 ¥ 34,127 Other Comprehensive Income:
Unrealized gains (losses) on available-for-sale securities ··············································· 5,640 3,811 Deferred gains (losses) on hedges············································································· 2 (2)Foreign currency translation adjustments ···································································· 45,665 33,234 Adjustments for retirement benefits ············································································ (795) Share of other comprehensive income of associates accounted for using the equity method ····················································································· 1 (3)
Total other comprehensive income (Note 23) ·································································· 50,515 37,040
Comprehensive Income ···························································································· ¥ 88,986 ¥ 71,167
Millions of yen
Attributable to: Shareholders of Terumo Corporation ············································································ ¥ 88,986 ¥ 71,180 Minority interests ······································································································· (13)
See accompanying notes to consolidated financial statements.
Consolidated Statements of Changes in Net Assets (Note15) Terumo Corporation and subsidiaries Years ended March 31, 2015 and 2014 See accompanying notes to consolidated financial statements.
Thousands
Number ofshares of
capitalstock
Capitalstock Capital surplus
Retainedearnings
Treasurystock
Unrealizedgains (losses) onavailable-for-sale
securities
Deferred gainsor losses on
hedges
Foreigncurrency
translationadjustments
Accumulatedadjustments for
retirement benefits
Stocksubscription
rightsMinorityinterests Total
Balance at March 31, 2013 189,877 ¥ 38,716 ¥ 52,103 ¥ 329,189 ¥ (9) ¥ 7,458 ¥ ¥ 10,099 ¥ ¥ ¥ 352 ¥ 437,909Dividends from surplus (9,684) (9,684)Net income 34,096 34,096Purchase of treasury stock (3) (15) (15)Net changes of items other
than shareholders’ equity 3,812 (2) 33,278 (2,817) 20 (352) 33,939Balance at March 31, 2014 189,874 38,716 52,103 353,601 (24) 11,270 (2) 43,377 (2,817) 20 ¥ 496,245
Cumulative effect of changesin accounting policies 2,258 2,258
Beginning of period as restated 189,874 38,716 52,103 355,859 (24) 498,504Dividends from surplus (11,012) (11,012)Net income 38,470 38,470Purchase of treasury stock (920) (3,010) (3,010)Net changes of items other
than shareholders’ equity 189,874 5,640 2 45,665 (795) 58 50,571Balance at March 31, 2015 378,829 ¥ 38,716 ¥ 52,103 ¥ 383,317 ¥ (3,035) ¥ 16,910 ¥ ¥ 89,043 ¥ (3,611) ¥ 78 ¥ ¥ 573,523
Shareholders’ equityMillions of yen
Accumulated other comprehensive income
5 TERUMO CORPORATION Annual Report 2015 Financial Information
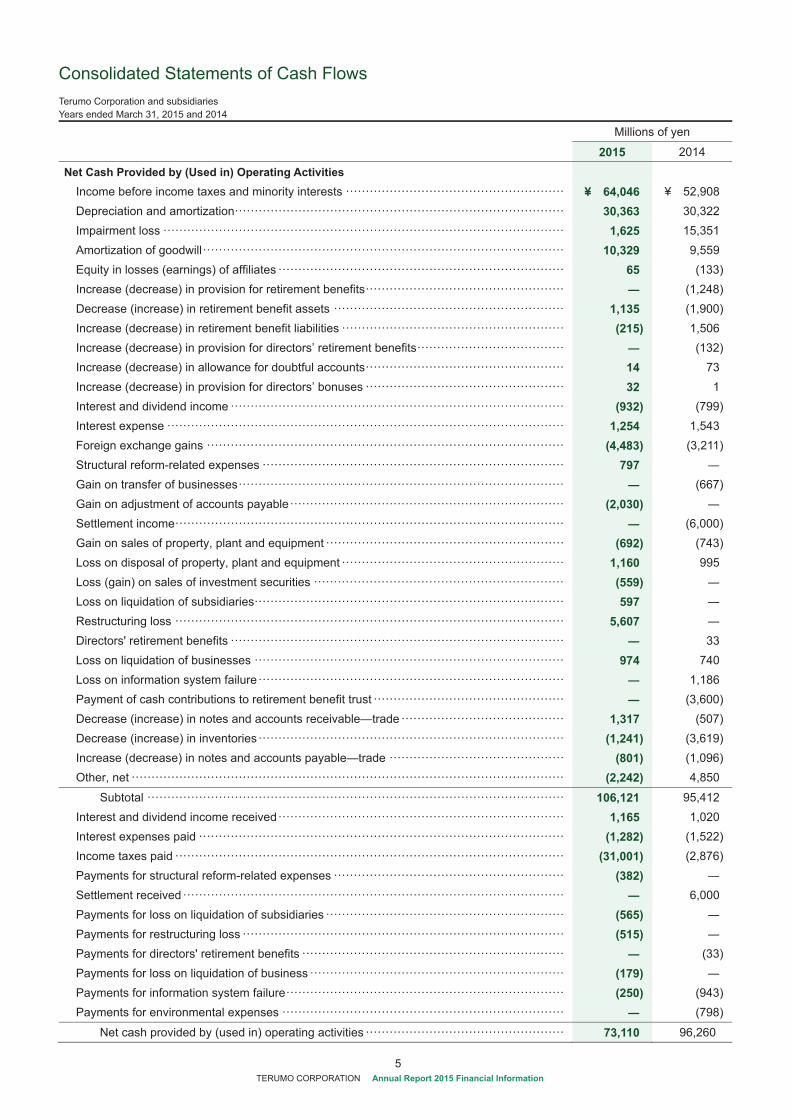
Consolidated Statements of Cash Flows Terumo Corporation and subsidiaries Years ended March 31, 2015 and 2014
Millions of yen
2015 2014
Net Cash Provided by (Used in) Operating Activities Income before income taxes and minority interests ······················································· ¥ 64,046 ¥ 52,908 Depreciation and amortization ··················································································· 30,363 30,322 Impairment loss ····································································································· 1,625 15,351 Amortization of goodwill ··························································································· 10,329 9,559 Equity in losses (earnings) of affiliates ········································································ 65 (133)Increase (decrease) in provision for retirement benefits ·················································· (1,248)Decrease (increase) in retirement benefit assets ·························································· 1,135 (1,900)Increase (decrease) in retirement benefit liabilities ························································ (215) 1,506 Increase (decrease) in provision for directors’ retirement benefits ····································· (132)Increase (decrease) in allowance for doubtful accounts ·················································· 14 73 Increase (decrease) in provision for directors’ bonuses ·················································· 32 1 Interest and dividend income ···················································································· (932) (799)Interest expense ···································································································· 1,254 1,543 Foreign exchange gains ·························································································· (4,483) (3,211)Structural reform-related expenses ············································································ 797 Gain on transfer of businesses ·················································································· (667)Gain on adjustment of accounts payable ····································································· (2,030) Settlement income ·································································································· (6,000)Gain on sales of property, plant and equipment ···························································· (692) (743)Loss on disposal of property, plant and equipment ························································ 1,160 995 Loss (gain) on sales of investment securities ······························································· (559) Loss on liquidation of subsidiaries·············································································· 597 Restructuring loss ·································································································· 5,607 Directors' retirement benefits ···················································································· 33 Loss on liquidation of businesses ·············································································· 974 740 Loss on information system failure ············································································· 1,186 Payment of cash contributions to retirement benefit trust ················································ (3,600)Decrease (increase) in notes and accounts receivable—trade ········································· 1,317 (507)Decrease (increase) in inventories ············································································· (1,241) (3,619)Increase (decrease) in notes and accounts payable—trade ············································ (801) (1,096)Other, net ············································································································· (2,242) 4,850
Subtotal ········································································································· 106,121 95,412 Interest and dividend income received ········································································ 1,165 1,020 Interest expenses paid ···························································································· (1,282) (1,522)Income taxes paid ·································································································· (31,001) (2,876)Payments for structural reform-related expenses ·························································· (382) Settlement received ································································································ 6,000 Payments for loss on liquidation of subsidiaries ···························································· (565) Payments for restructuring loss ················································································· (515) Payments for directors' retirement benefits ·································································· (33)Payments for loss on liquidation of business ································································ (179) Payments for information system failure ······································································ (250) (943)Payments for environmental expenses ······································································· (798)
Net cash provided by (used in) operating activities ·················································· 73,110 96,260
6 TERUMO CORPORATION Annual Report 2015 Financial Information
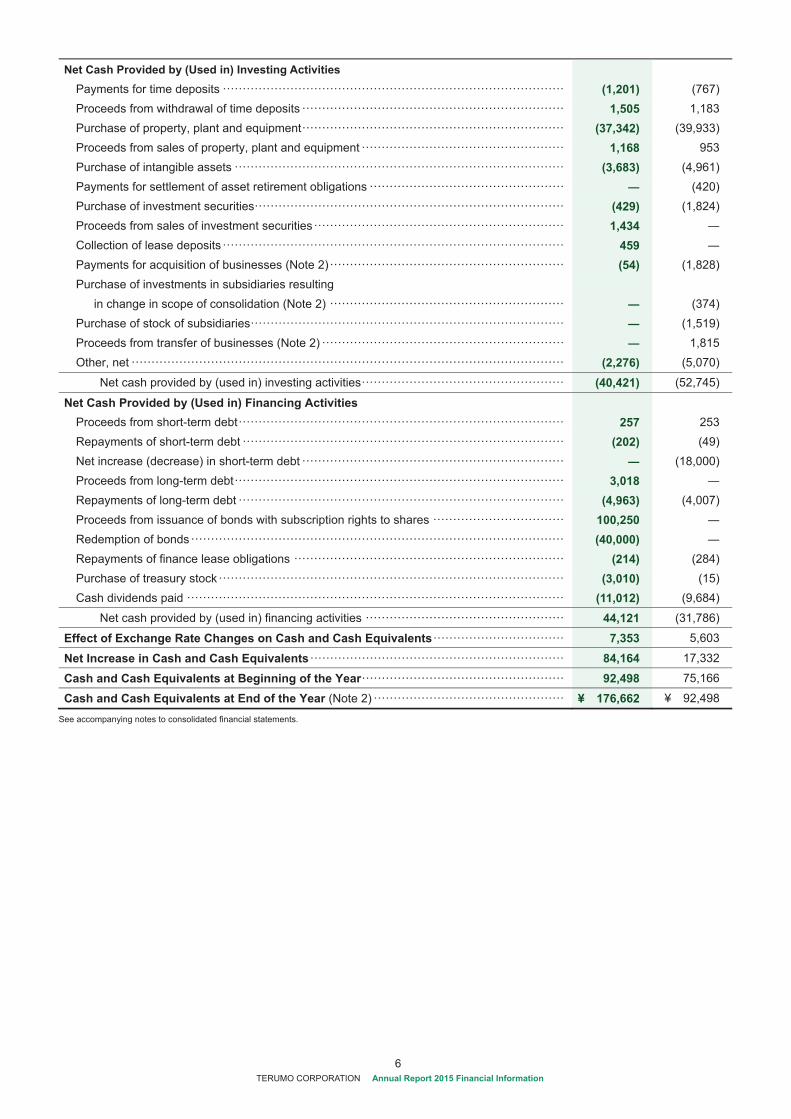
Net Cash Provided by (Used in) Investing Activities Payments for time deposits ······················································································ (1,201) (767) Proceeds from withdrawal of time deposits ·································································· 1,505 1,183 Purchase of property, plant and equipment ·································································· (37,342) (39,933) Proceeds from sales of property, plant and equipment ··················································· 1,168 953 Purchase of intangible assets ··················································································· (3,683) (4,961) Payments for settlement of asset retirement obligations ················································· (420) Purchase of investment securities ·············································································· (429) (1,824) Proceeds from sales of investment securities ······························································· 1,434 Collection of lease deposits ······················································································ 459 Payments for acquisition of businesses (Note 2) ··························································· (54) (1,828) Purchase of investments in subsidiaries resulting in change in scope of consolidation (Note 2) ··························································· (374) Purchase of stock of subsidiaries ··············································································· (1,519) Proceeds from transfer of businesses (Note 2) ····························································· 1,815 Other, net ············································································································· (2,276) (5,070)
Net cash provided by (used in) investing activities ··················································· (40,421) (52,745)
Net Cash Provided by (Used in) Financing Activities Proceeds from short-term debt ·················································································· 257 253 Repayments of short-term debt ················································································· (202) (49) Net increase (decrease) in short-term debt ·································································· (18,000) Proceeds from long-term debt ··················································································· 3,018 Repayments of long-term debt ·················································································· (4,963) (4,007) Proceeds from issuance of bonds with subscription rights to shares ································· 100,250 Redemption of bonds ······························································································ (40,000) Repayments of finance lease obligations ···································································· (214) (284) Purchase of treasury stock ······················································································· (3,010) (15) Cash dividends paid ······························································································· (11,012) (9,684)
Net cash provided by (used in) financing activities ·················································· 44,121 (31,786)
Effect of Exchange Rate Changes on Cash and Cash Equivalents ································· 7,353 5,603
Net Increase in Cash and Cash Equivalents ································································ 84,164 17,332
Cash and Cash Equivalents at Beginning of the Year ··················································· 92,498 75,166
Cash and Cash Equivalents at End of the Year (Note 2) ················································ ¥ 176,662 ¥ 92,498
See accompanying notes to consolidated financial statements.
7 TERUMO CORPORATION Annual Report 2015 Financial Information
NOTES TO CONSOLIDATED FINANCIAL STATEMENTS Terumo Corporation and subsidiaries
1. SUMMARY OF SIGNIFICANT ACCOUNTING POLICIES
(a) Basis of Presenting Consolidated Financial Statements Terumo Corporation (the “Company”) and domestic subsidiaries
maintain their official accounting records in Japanese yen and in
accordance with the provisions set forth in the Japanese Financial
Instruments and Exchange Law and its related accounting
regulations, and in conformity with accounting principles generally
accepted in Japan (“Japanese GAAP”), which are different in certain
respects as to application and disclosure requirements of
International Financial Reporting Standards. The accounts of
consolidated overseas subsidiaries are prepared in accordance with
either International Financial Reporting Standards or U.S. generally
accepted accounting principles, with adjustments for five specified
items as applicable.
The accompanying consolidated financial statements have been
reformatted and translated into English (with some expanded
descriptions) from the consolidated financial statements of the
Company prepared in accordance with Japanese GAAP and filed
with the appropriate Local Finance Bureau of the Ministry of Finance
as required by the Japanese Financial Instruments and Exchange
Law. Some supplementary information included in the statutory
Japanese language consolidated financial statements is not
presented in the accompanying consolidated financial statements.
(b) Principles of Consolidation The consolidated financial statements include the accounts of the
Company and subsidiaries, except for an immaterial subsidiary. All
significant intercompany balances, transactions and unrealized
profits have been eliminated in consolidation. Investments in
affiliated companies with 20% to 50% ownership and the immaterial
subsidiary not consolidated are stated at their underlying net equity
value.
Assets and liabilities of subsidiaries are valued at their full fair
value, including a portion, if any, attributable to minority shareholders,
at the time the Company acquires control of the respective subsidiary.
(c) Foreign Currency Translation All short-term and long-term assets and liabilities denominated in
foreign currencies are translated into Japanese yen at the exchange
rates as of the balance sheet date.
The balance sheet accounts of consolidated foreign subsidiaries
are translated into Japanese yen at exchange rates as of the balance
sheet date except for shareholders’ equity, which is translated at
historical rates. Differences arising from such translations are shown
as “Foreign currency translation adjustments” in a separate
component of net assets in the consolidated balance sheets.
Revenue and expense accounts of consolidated foreign
subsidiaries are translated into Japanese yen at annual average
exchange rates.
(d) Cash and Cash Equivalents The Company considers cash and deposits, which can be
withdrawn on demand without diminution of principal and with
original maturities of three months or less, to be cash and cash
equivalents.
(e) Investments The accounting standards for financial instruments require the
Company to classify its securities into one of the following four
categories: trading, held-to-maturity, available-for-sale securities or
securities of unconsolidated subsidiaries and affiliates. All of the
Company's securities are classified as held-to-maturity securities,
available-for-sale securities or securities of unconsolidated
subsidiaries or affiliates and included in investment securities in the
consolidated balance sheets.
To comply with the accounting standards for financial instruments,
available-for-sale securities with a market value are carried at market
value. The difference, net of tax, between the acquisition cost and
the carrying value of available-for-sale securities, including
unrealized gains and losses, is recognized in “Unrealized gains
(losses) on available-for-sale securities” in a separate component of
net assets in the consolidated balance sheets. Available-for-sale
securities without a market value are principally carried at cost. The
cost of available-for sale securities sold is principally computed
based on the moving average method.
(f) Inventories Inventories are stated at cost, principally using the average
method. Inventories are written down to their net realizable value
when there is evidence of deterioration in value.
(g) Property, Plant and Equipment Property, plant and equipment are stated at cost. Routine
maintenance and repairs and minor replacement costs are charged
to expenses as incurred. Depreciation is computed by the straight-
line depreciation method based on the following estimated useful
lives:
Buildings and structures: 3–60 years
Machinery, equipment and vehicles 4–15 years
(h) Allowance for Doubtful Accounts Allowance for doubtful accounts is provided to cover probable
losses on notes and accounts receivable due to customer defaults at
an estimated amount based on past collection experience for current
receivables, and individual account by account analysis for specific
overdue receivables.
8 TERUMO CORPORATION Annual Report 2015 Financial Information
(i) Goodwill Goodwill, which represents the excess cost over the fair value of
the net assets acquired at acquisition dates of investments in
subsidiaries, is principally amortized over 10–20 years which is the
expected period to be benefited.
(j) Intangible assets Intangible assets are amortized on a straight-line basis.
Customer relationships are mainly amortized over 20 years which
is the estimated useful life.
(k) Income Taxes Income taxes are accounted for under the asset and liability
method. Deferred tax assets and liabilities are recognized for the
future tax consequences attributable to differences between the
financial statement carrying amounts of existing assets and liabilities
and their respective tax bases and operating loss and tax credit
carry-forwards. Deferred tax assets and liabilities are measured
using enacted tax rates expected to apply to taxable income in the
years in which those temporary differences are expected to be
recovered or settled. The effect on deferred tax assets and liabilities
of a change in tax rates is recognized in income in the period that
includes the enactment date.
(l) Retirement Benefits The Company and certain subsidiaries have contributory and non-
contributory defined benefit plans for employees that provide for
pension or lump-sum benefit payments. In calculating retirement
benefit obligations, the Company and subsidiaries allocate the
projected retirement benefits to the period through the expected
retirement period based on the benefit formula basis.
Prior service cost is amortized by the straight-line method over a
period within the average remaining service years of employees
(mainly 10 years) at the time of recognition. Actuarial gain and loss
is amortized by the straight-line method over a period within the
average remaining service years of employees (mainly 10 years) at
the time of recognition, beginning from the fiscal year following the
respective fiscal year of recognition.
The Company decided to abolish the directors’ retirement benefit
program on April 20, 2006. The payment of retirement benefits
estimated on the abolished program according to the length of
service of eligible directors and audit and supervisory board
members through June 29, 2006 was approved at the Annual
General Meeting of Shareholders for the year ended March 2006
which was held on June 29, 2006. The payments will be made at the
time of each eligible person’s retirement.
(m) Leases Assets held under finance leases, except for certain immaterial
leases, are capitalized and depreciated over the lease terms, as
applicable.
(n) Derivatives and Hedge Accounting
The Company, in general, adopts the deferral method of hedge
accounting. Interest rate swaps that meet certain criteria are
accounted for under the special method provided by the accounting
standards as if the interest rates under the interest rate swaps were
originally applied to underlying borrowings.
Derivative financial instruments held by the Company and
subsidiaries include forward exchange contracts and interest rate
swap contracts. Forward exchange contracts are utilized to hedge
risks arising from changes in foreign exchange risk of monetary
assets and liabilities and forecast transactions denominated in
foreign currencies. Interest-rate swaps are utilized to manage
interest-rate risk of long-term debt.
Derivatives are stated at fair value.
The Company has developed a hedging policy to control various
aspects of derivative transactions, including authorization levels and
transaction volumes. Based on this policy, the Company hedges,
within certain limits, risks arising from changes in foreign currency
exchange rates and interest rates. The Company reviews the
effectiveness of all hedging instruments to take account of the
cumulative cash flows and any changes in the market.
The Company evaluates hedge effectiveness by comparing the
cumulative changes in cash flows from hedged items and
corresponding changes in hedging derivative instruments every half
year. With respect to interest rate swaps under the special method,
the evaluation of hedge effectiveness is omitted.
(o) Appropriation of Retained Earnings Under the Japanese Corporate Law, the appropriation of retained
earnings with respect to a given financial period is made by
resolution of the shareholders at a general meeting held subsequent
to the end of such financial period. The accounts for that period do
not, therefore, reflect such appropriation.
(p) Consumption Taxes Transactions subject to consumption taxes are recorded at
amounts exclusive of consumption taxes.
(q) Net Income and Cash Dividends per Common Stock Basic net income per common stock is computed by dividing net
income available to common shareholders by the weighted-average
number of common shares outstanding during the year.
Diluted net income per common stock is computed similarly to the
basic net income per common stock except that the average of
common shares outstanding is increased by the number of additional
common shares that would have been outstanding had potentially
dilutive common shares been issued.
Cash dividends per share are presented on an accruals basis and
include dividends to be approved after the balance sheet date, but
applicable to the year then ended.
(r) Research and Development Expenses Research and development expenses are charged to income
9 TERUMO CORPORATION Annual Report 2015 Financial Information
when incurred.
(s) Reclassification Certain prior year amounts have been reclassified to conform to
the current year presentation.
(t) Solution on Unification of Accounting Policies Applied to Foreign Subsidiaries for Consolidated Financial Statements
ASBJ PITF No. 18 requires that accounting policies and
procedures applied by a parent company and subsidiaries to similar
transactions and events under similar circumstances should, in
principle, be unified for the preparation of the consolidated financial
statements. PITF No. 18, however, as a tentative measure, allows a
parent company to prepare consolidated financial statements using
foreign subsidiaries’ financial statements prepared in accordance
with either International Financial Reporting Standards or U.S.
generally accepted accounting principles. In this case, adjustments
for the following five items are required in the consolidation process
so that their impact on net income is accounted for in accordance
with Japanese GAAP unless the impact is not material.
(i) Goodwill not subject to amortization
(ii) Actuarial gains and losses of defined-benefit retirement plans
recognized outside profit or loss
(iii) Capitalized expenditures for research and development
activities
(iv) Fair value measurement of investment properties, and
revaluation of property, plant and equipment and intangible assets
(v) Accounting for net income attributable to minority interests
(u) Accounting Periods of Consolidated Subsidiaries The year end consolidated balance sheet date is March 31.
Among the consolidated subsidiaries,
Terumo Medical Products (Hangzhou) Co., Ltd., Changchun
Terumo Medical Products Co., Ltd., Terumo Medical (Shanghai) Co.,
Ltd. and TERUMO (China) Holdings Co., Ltd. have a year end
balance sheet date of December 31, which is different from the year
end consolidated balance sheet date. Financial statements of these
subsidiaries for consolidation purposes were prepared as of the
consolidated balance sheet date.
(v) Accounting Standard for Retirement Benefits The Company and its consolidated domestic subsidiaries adopted
article 35 of the “Accounting Standard for Retirement Benefits”
(ASBJ Statement No.26, May 17, 2012 (hereinafter, “Statement
No.26”)) and article 67 of the “Guidance on Accounting Standard for
Retirement Benefits” (ASBJ Guidance No.25, March 26, 2015
(hereinafter, “Guidance No.25”)) from the current fiscal year, and
have changed the determination of retirement benefit obligations and
current service costs. In addition, the Company and its
consolidated domestic subsidiaries have changed the method of
attributing expected benefit to periods from a straight-line method to
a benefit formula basis and the method of determining discount rates.
In accordance with article 37 of Statement No.26, the effect of
changing the determination of retirement benefit obligations and
current service costs has been recognized in retained earnings at the
beginning of the current fiscal year.
As a result of the application, retirement benefit assets and
retained earnings increased by ¥3,509 million and ¥2,258 million at
the beginning of the current fiscal year, respectively. In addition,
operating income and income before income taxes and minority
interests increased by ¥632 million in the current fiscal year,
respectively.
Net assets per common stock, net income per common stock and
diluted net income per common stock for the current fiscal year
increased by ¥5.96, ¥1.67 and ¥1.63, respectively.
(w) New Accounting Pronouncements Revised Accounting Standard for Business Combinations
(ASBJ Statement No.21, September 13, 2013)
Revised Accounting Standard for Consolidated Financial
Statements (ASBJ Statement No.22, September 13, 2013)
Revised Accounting Standard for Business Divestitures (ASBJ
Statement No.7, September 13, 2013)
Revised Accounting Standard for Earnings Per Share (ASBJ
Statement No.2, September 13, 2013)
Revised Guidance on Accounting Standard for Business
Combinations and Accounting Standard for Business Divestitures
(ASBJ Guidance No.10, September 13, 2013)
Revised Guidance on Accounting Standard for Earnings Per
Share (ASBJ Guidance No.4, September 13, 2013)
(1) Summary
The above standards and guidance have been revised primarily in
relation to:
How changes of the investment in subsidiaries over which the Company continues to exert control should be treated by the
Company when additional stock of a subsidiary is acquired.
Treatment of acquisition related costs
Presentation of current net income and the change of minority interests to non-controlling interests
Provisional application of accounting treatments
(2) Effective date
Effective from the beginning of the fiscal year ending March 31,
2016.
Provisional application of the accounting standards is scheduled
to begin for business combinations effective after the beginning of
the fiscal year ending March 31, 2016.
(3) Effects of the application of the standards
The Company and its consolidated domestic subsidiaries are
currently in the process of determining the effects of these new
standards on the consolidated financial statements.
10 TERUMO CORPORATION Annual Report 2015 Financial Information
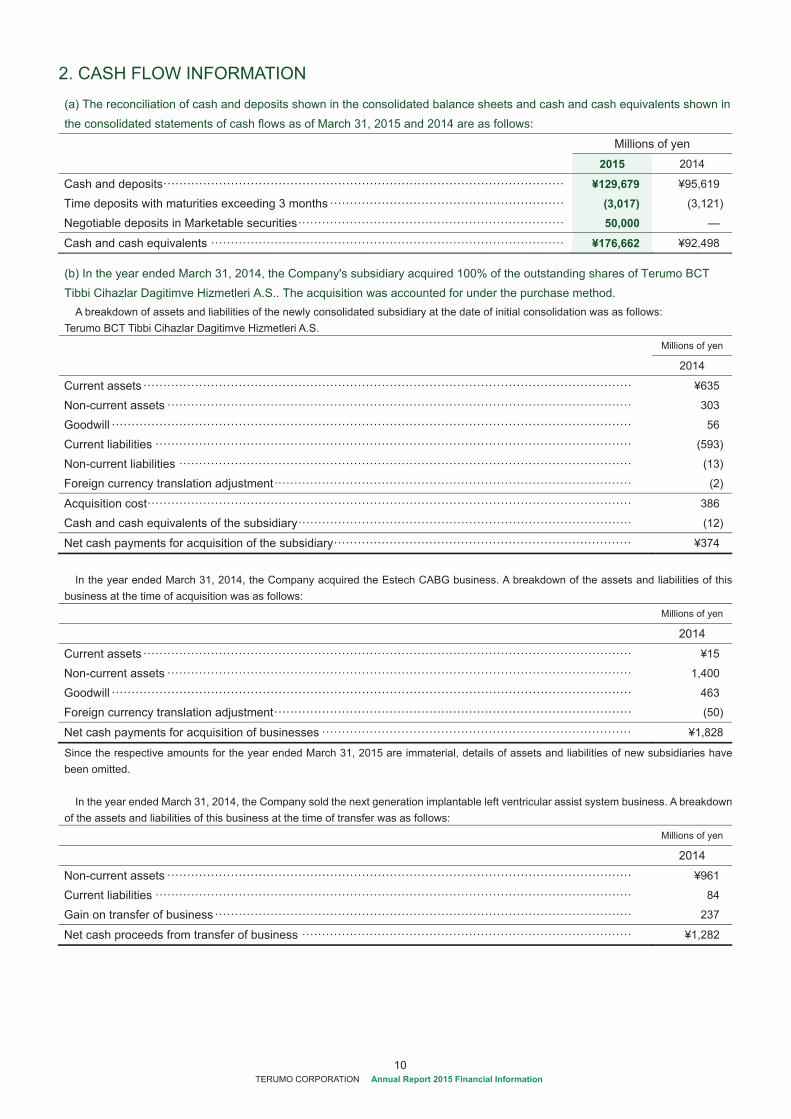
2. CASH FLOW INFORMATION
(a) The reconciliation of cash and deposits shown in the consolidated balance sheets and cash and cash equivalents shown in the consolidated statements of cash flows as of March 31, 2015 and 2014 are as follows:
Millions of yen
2015 2014
Cash and deposits ····································································································· ¥129,679 ¥95,619
Time deposits with maturities exceeding 3 months ··························································· (3,017) (3,121)
Negotiable deposits in Marketable securities ··································································· 50,000 —
Cash and cash equivalents ························································································· ¥176,662 ¥92,498
(b) In the year ended March 31, 2014, the Company's subsidiary acquired 100% of the outstanding shares of Terumo BCT Tibbi Cihazlar Dagitimve Hizmetleri A.S.. The acquisition was accounted for under the purchase method.
A breakdown of assets and liabilities of the newly consolidated subsidiary at the date of initial consolidation was as follows: Terumo BCT Tibbi Cihazlar Dagitimve Hizmetleri A.S. Millions of yen
2014
Current assets ··························································································································· ¥635
Non-current assets ····················································································································· 303
Goodwill ··································································································································· 56
Current liabilities ························································································································ (593)
Non-current liabilities ·················································································································· (13)
Foreign currency translation adjustment ·························································································· (2)
Acquisition cost ·························································································································· 386
Cash and cash equivalents of the subsidiary ···················································································· (12)
Net cash payments for acquisition of the subsidiary ··········································································· ¥374
In the year ended March 31, 2014, the Company acquired the Estech CABG business. A breakdown of the assets and liabilities of this
business at the time of acquisition was as follows: Millions of yen
2014
Current assets ··························································································································· ¥15
Non-current assets ····················································································································· 1,400
Goodwill ··································································································································· 463
Foreign currency translation adjustment ·························································································· (50)
Net cash payments for acquisition of businesses ·············································································· ¥1,828
Since the respective amounts for the year ended March 31, 2015 are immaterial, details of assets and liabilities of new subsidiaries have been omitted. In the year ended March 31, 2014, the Company sold the next generation implantable left ventricular assist system business. A breakdown
of the assets and liabilities of this business at the time of transfer was as follows: Millions of yen
2014
Non-current assets ····················································································································· ¥961
Current liabilities ························································································································ 84
Gain on transfer of business ········································································································· 237
Net cash proceeds from transfer of business ··················································································· ¥1,282
11 TERUMO CORPORATION Annual Report 2015 Financial Information
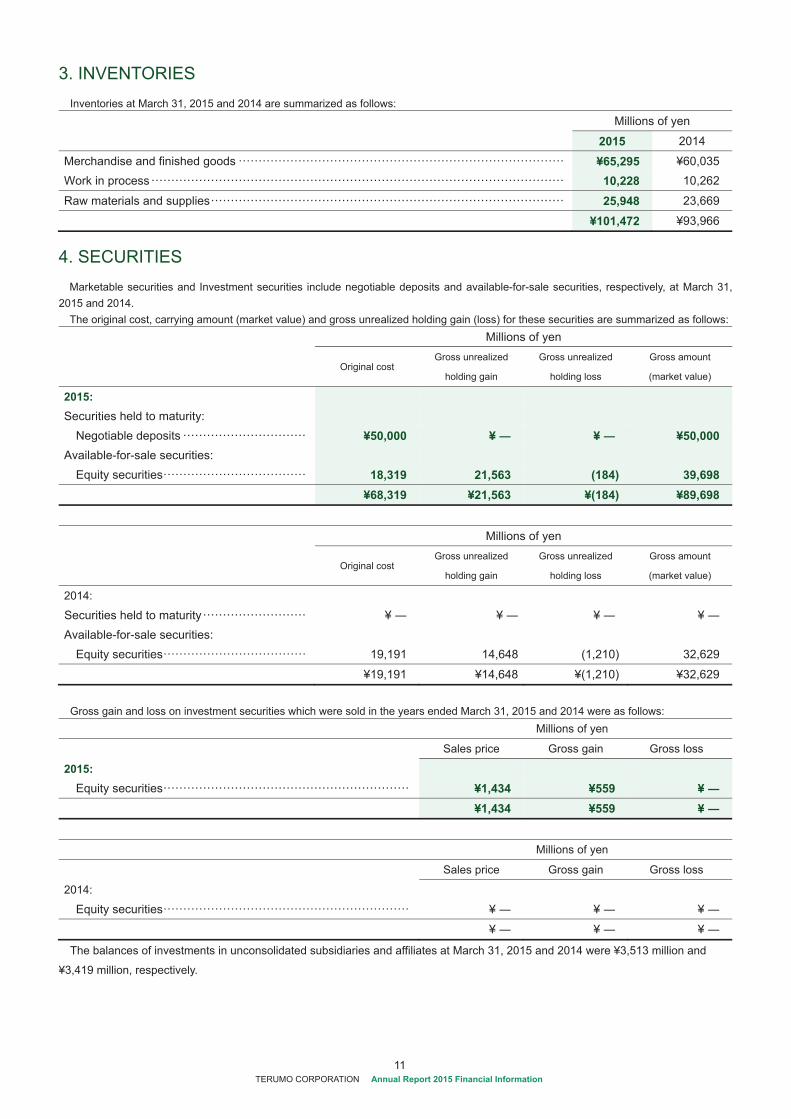
3. INVENTORIES Inventories at March 31, 2015 and 2014 are summarized as follows: Millions of yen
2015 2014
Merchandise and finished goods ·················································································· ¥65,295 ¥60,035 Work in process ········································································································ 10,228 10,262
Raw materials and supplies ························································································· 25,948 23,669
¥101,472 ¥93,966
4. SECURITIES Marketable securities and Investment securities include negotiable deposits and available-for-sale securities, respectively, at March 31,
2015 and 2014. The original cost, carrying amount (market value) and gross unrealized holding gain (loss) for these securities are summarized as follows: Millions of yen
Original cost
Gross unrealized
holding gain
Gross unrealized
holding loss
Gross amount
(market value)
2015: Securities held to maturity:
Negotiable deposits ······························· ¥50,000 ¥ ¥ ¥50,000 Available-for-sale securities:
Equity securities ···································· 18,319 21,563 (184) 39,698 ¥68,319 ¥21,563 ¥(184) ¥89,698
Millions of yen
Original cost
Gross unrealized
holding gain
Gross unrealized
holding loss
Gross amount
(market value)
2014: Securities held to maturity ·························· ¥ ¥ ¥ ¥ Available-for-sale securities:
Equity securities ···································· 19,191 14,648 (1,210) 32,629
¥19,191 ¥14,648 ¥(1,210) ¥32,629
Gross gain and loss on investment securities which were sold in the years ended March 31, 2015 and 2014 were as follows:
Millions of yen
Sales price Gross gain Gross loss
2015: Equity securities ······························································ ¥1,434 ¥559 ¥
¥1,434 ¥559 ¥
Millions of yen
Sales price Gross gain Gross loss
2014: Equity securities ······························································ ¥ ¥ ¥
¥ ¥ ¥
The balances of investments in unconsolidated subsidiaries and affiliates at March 31, 2015 and 2014 were ¥3,513 million and
¥3,419 million, respectively.
12 TERUMO CORPORATION Annual Report 2015 Financial Information
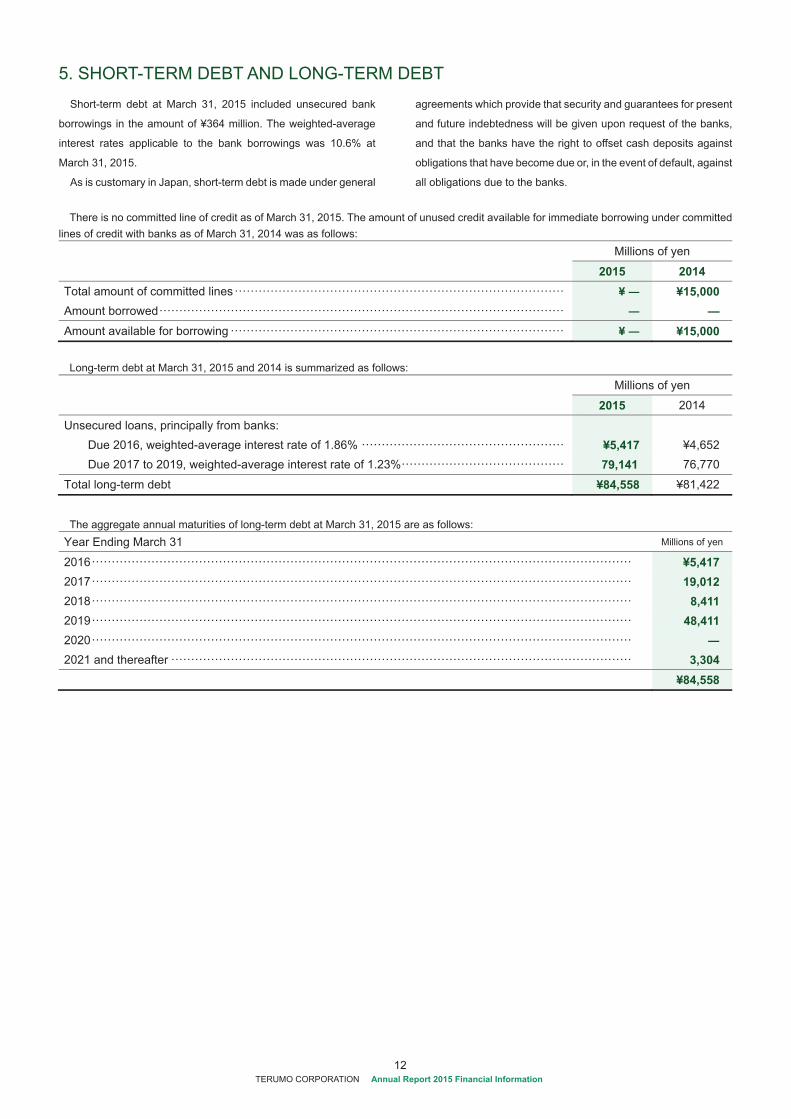
5. SHORT-TERM DEBT AND LONG-TERM DEBT Short-term debt at March 31, 2015 included unsecured bank
borrowings in the amount of ¥364 million. The weighted-average
interest rates applicable to the bank borrowings was 10.6% at
March 31, 2015.
As is customary in Japan, short-term debt is made under general
agreements which provide that security and guarantees for present
and future indebtedness will be given upon request of the banks,
and that the banks have the right to offset cash deposits against
obligations that have become due or, in the event of default, against
all obligations due to the banks.
There is no committed line of credit as of March 31, 2015. The amount of unused credit available for immediate borrowing under committed
lines of credit with banks as of March 31, 2014 was as follows: Millions of yen
2015 2014 Total amount of committed lines ··················································································· ¥ ¥15,000 Amount borrowed ······································································································ — Amount available for borrowing ···················································································· ¥ ¥15,000
Long-term debt at March 31, 2015 and 2014 is summarized as follows:
Millions of yen
2015 2014
Unsecured loans, principally from banks: Due 2016, weighted-average interest rate of 1.86% ··················································· ¥5,417 ¥4,652 Due 2017 to 2019, weighted-average interest rate of 1.23% ········································· 79,141 76,770
Total long-term debt ¥84,558 ¥81,422
The aggregate annual maturities of long-term debt at March 31, 2015 are as follows:
Year Ending March 31 Millions of yen
2016 ········································································································································ ¥5,417 2017 ········································································································································ 19,012 2018 ········································································································································ 8,411 2019 ········································································································································ 48,411 2020 ········································································································································ 2021 and thereafter ···················································································································· 3,304 ¥84,558
13 TERUMO CORPORATION Annual Report 2015 Financial Information
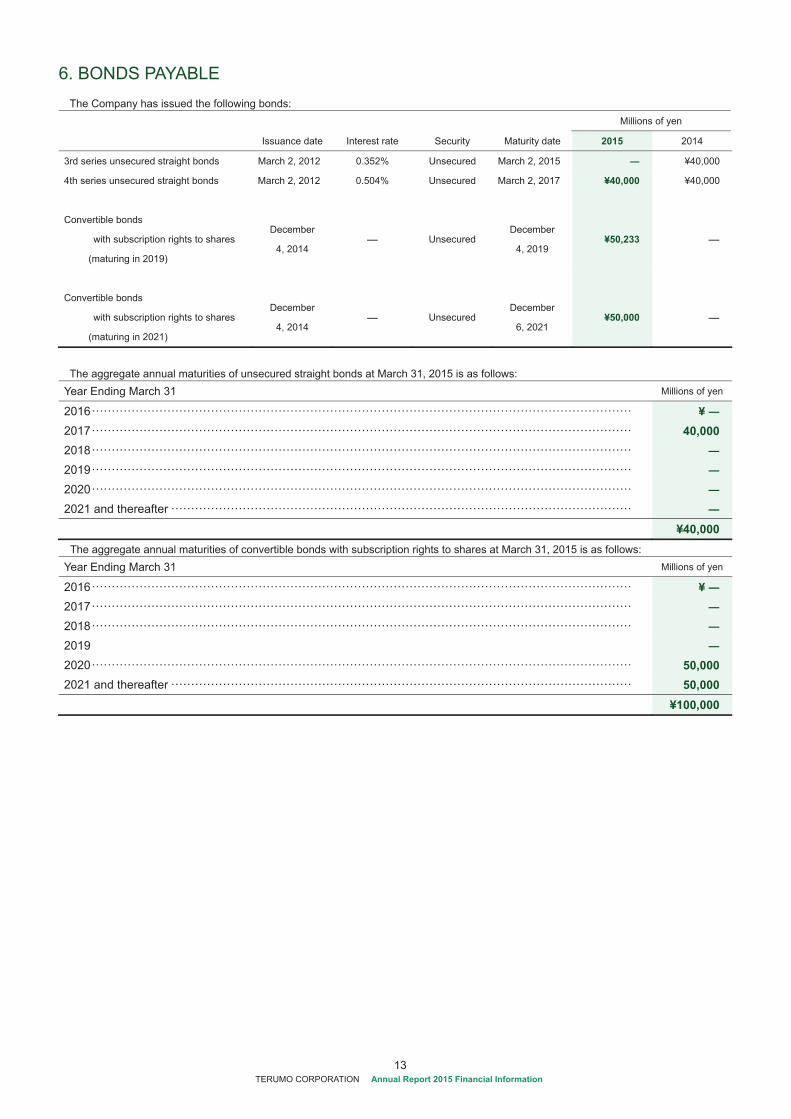
6. BONDS PAYABLE The Company has issued the following bonds:
Millions of yen
Issuance date Interest rate Security Maturity date 2015 2014
3rd series unsecured straight bonds March 2, 2012 0.352% Unsecured March 2, 2015 ¥40,000
4th series unsecured straight bonds March 2, 2012 0.504% Unsecured March 2, 2017 ¥40,000 ¥40,000
Convertible bonds
with subscription rights to shares
(maturing in 2019)
December
4, 2014 Unsecured
December
4, 2019 ¥50,233
Convertible bonds
with subscription rights to shares
(maturing in 2021)
December
4, 2014 Unsecured
December
6, 2021 ¥50,000
The aggregate annual maturities of unsecured straight bonds at March 31, 2015 is as follows:
Year Ending March 31 Millions of yen
2016 ········································································································································ ¥ 2017 ········································································································································ 40,000 2018 ········································································································································ 2019 ········································································································································ 2020 ········································································································································ 2021 and thereafter ····················································································································
¥40,000 The aggregate annual maturities of convertible bonds with subscription rights to shares at March 31, 2015 is as follows:
Year Ending March 31 Millions of yen
2016 ········································································································································ ¥ 2017 ········································································································································ 2018 ········································································································································ 2019 2020 ········································································································································ 50,000 2021 and thereafter ···················································································································· 50,000 ¥100,000
14 TERUMO CORPORATION Annual Report 2015 Financial Information
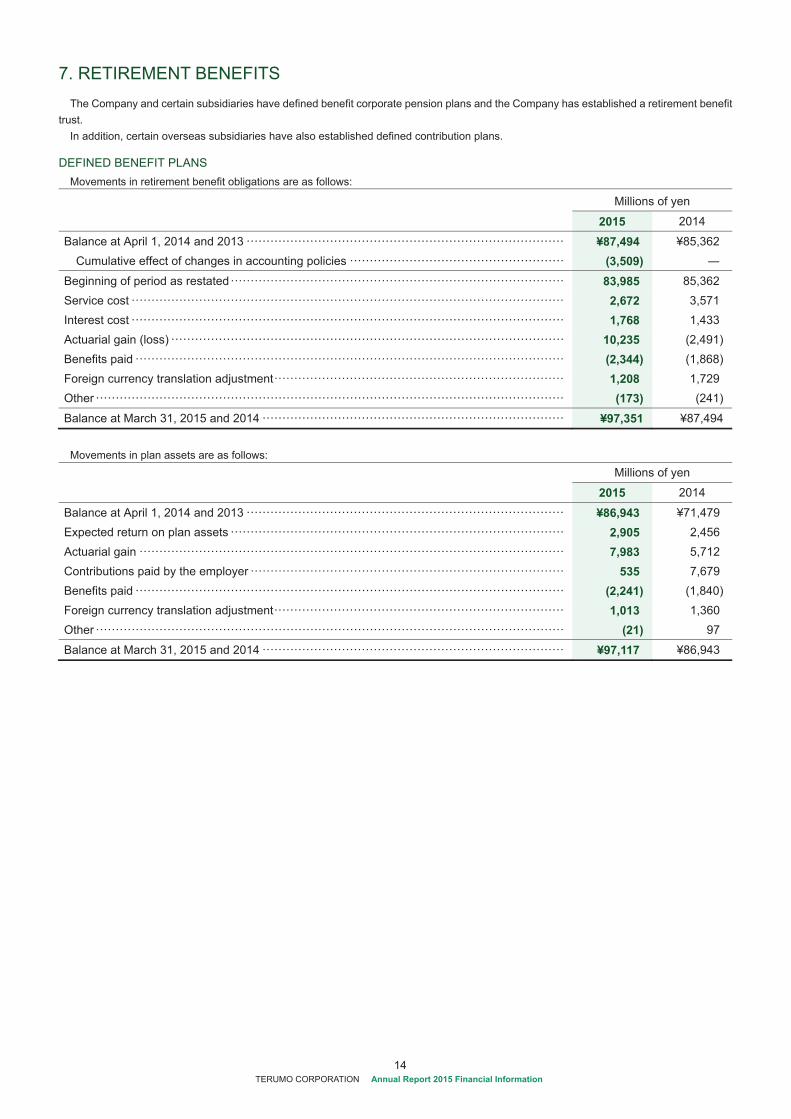
7. RETIREMENT BENEFITS The Company and certain subsidiaries have defined benefit corporate pension plans and the Company has established a retirement benefit
trust. In addition, certain overseas subsidiaries have also established defined contribution plans.
DEFINED BENEFIT PLANS Movements in retirement benefit obligations are as follows:
Millions of yen
2015 2014
Balance at April 1, 2014 and 2013 ················································································ ¥87,494 ¥85,362 Cumulative effect of changes in accounting policies ······················································ (3,509)
Beginning of period as restated ···················································································· 83,985 85,362 Service cost ············································································································· 2,672 3,571 Interest cost ············································································································· 1,768 1,433 Actuarial gain (loss) ··································································································· 10,235 (2,491)Benefits paid ············································································································ (2,344) (1,868)Foreign currency translation adjustment ········································································· 1,208 1,729 Other ······················································································································ (173) (241)
Balance at March 31, 2015 and 2014 ············································································ ¥97,351 ¥87,494
Movements in plan assets are as follows:
Millions of yen
2015 2014
Balance at April 1, 2014 and 2013 ················································································ ¥86,943 ¥71,479 Expected return on plan assets ···················································································· 2,905 2,456 Actuarial gain ··········································································································· 7,983 5,712 Contributions paid by the employer ··············································································· 535 7,679 Benefits paid ············································································································ (2,241) (1,840)Foreign currency translation adjustment ········································································· 1,013 1,360 Other ······················································································································ (21) 97
Balance at March 31, 2015 and 2014 ············································································ ¥97,117 ¥86,943

15 TERUMO CORPORATION Annual Report 2015 Financial Information
A reconciliation from the retirement benefit obligations and plan assets to retirement benefit liabilities (assets) is as follows: Millions of yen
2015 2014
Funded retirement benefit obligations ············································································ ¥96,527 ¥86,790 Plan assets ·············································································································· (97,117) (86,943)
(589) (153)Unfunded retirement benefit obligations ········································································· 823 705
Total net liability for retirement benefits at March 31, 2015 and 2014 ··································· ¥234 ¥552
Retirement benefit liabilities ························································································· ¥7,020 ¥3,125 Retirement benefit assets ··························································································· (6,786) (2,573)
Total net liability for retirement benefits at March 31, 2015 and 2014 ··································· ¥234 ¥552
Retirement benefit costs consisted of the following:
Millions of yen
2015 2014
Service cost ············································································································· ¥2,672 ¥3,571 Interest cost ············································································································· 1,768 1,433 Expected return on plan assets ···················································································· (2,905) (2,456)Net actuarial loss amortization ····················································································· 1,348 2,332 Past service costs amortization ···················································································· (150) (1,555)Other ······················································································································ 95
Total retirement benefit costs for the year ended March 31, 2015 and 2014 ·························· ¥2,829 ¥3,325
The pre-tax amount recognized in adjustments for retirement benefits consisted of the following:
Millions of yen
2015 2014
Past service costs ····································································································· ¥(150) ¥ Net actuarial losses ··································································································· 1,291
Total balance at March 31, 2015 and 2014 ····································································· ¥1,141 ¥
The pre-tax amount recognized in adjustments for retirement benefits consisted of the following:
Millions of yen
2015 2014
Past service costs that are yet to be recognized ······························································ ¥975 ¥1,125Net actuarial losses that are yet to be recognized ···························································· (6,504) (5,453)
Total balance at March 31, 2015 and 2014 ····································································· ¥(5,529) ¥(4,328)
A breakdown of plan assets by category is as follows:
2015 2014
Bonds ····················································································································· 50% 43% Equity securities ········································································································ 41 50 Cash and cash equivalents ························································································· 3 1 Other ······················································································································ 6 6
Total ····················································································································· 100% 100%
14% and 19% of the total plan assets were held by a retirement benefit trust established to cover the corporate pension plan benefits at March 31, 2015 and 2014, respectively.
Current and target asset allocations and historical and expected returns on various categories of plan assets have been considered in determining the long-term expected rate of return.
16 TERUMO CORPORATION Annual Report 2015 Financial Information
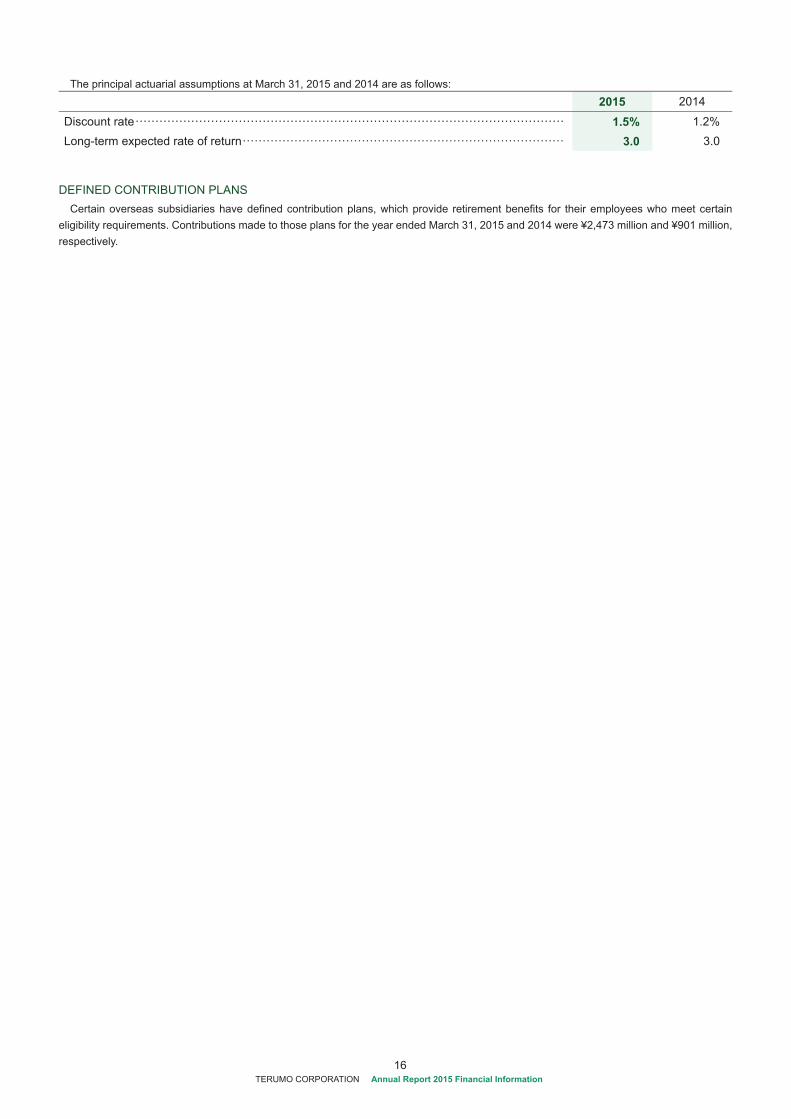
The principal actuarial assumptions at March 31, 2015 and 2014 are as follows:
2015 2014
Discount rate ············································································································ 1.5% 1.2% Long-term expected rate of return ················································································· 3.0 3.0
DEFINED CONTRIBUTION PLANS Certain overseas subsidiaries have defined contribution plans, which provide retirement benefits for their employees who meet certain
eligibility requirements. Contributions made to those plans for the year ended March 31, 2015 and 2014 were ¥2,473 million and ¥901 million, respectively.
17 TERUMO CORPORATION Annual Report 2015 Financial Information
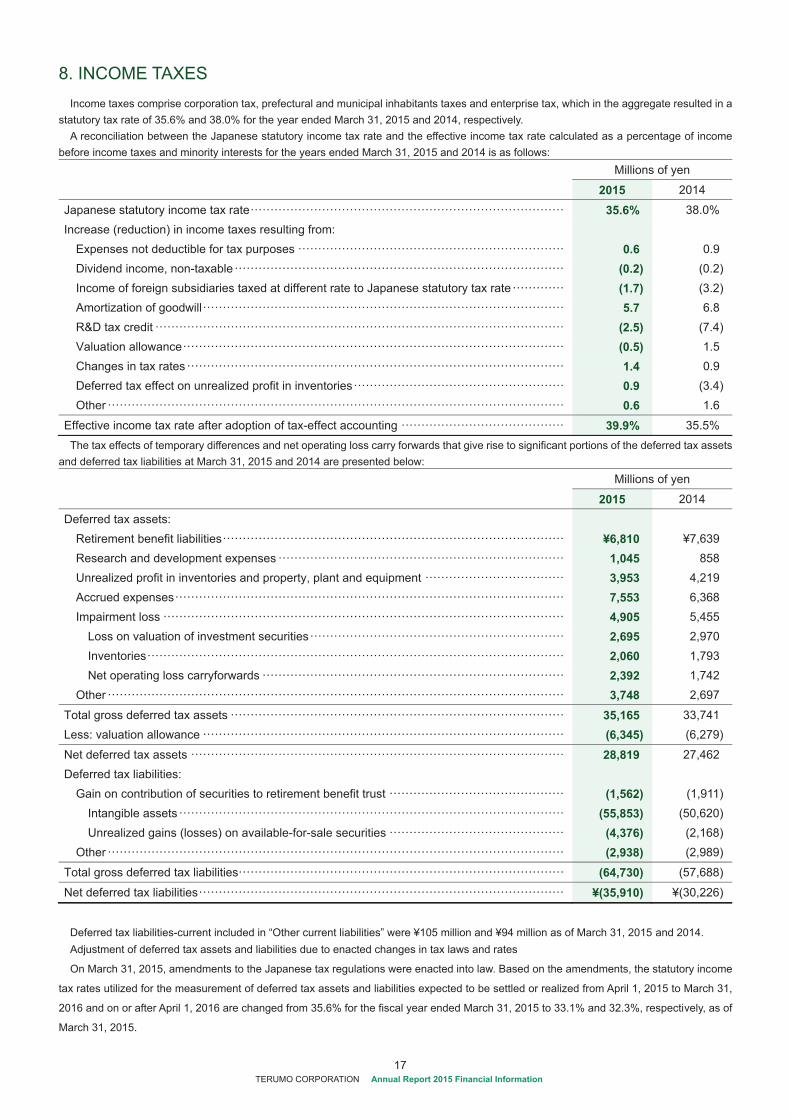
8. INCOME TAXES Income taxes comprise corporation tax, prefectural and municipal inhabitants taxes and enterprise tax, which in the aggregate resulted in a
statutory tax rate of 35.6% and 38.0% for the year ended March 31, 2015 and 2014, respectively. A reconciliation between the Japanese statutory income tax rate and the effective income tax rate calculated as a percentage of income
before income taxes and minority interests for the years ended March 31, 2015 and 2014 is as follows: Millions of yen
2015 2014
Japanese statutory income tax rate ··············································································· 35.6% 38.0% Increase (reduction) in income taxes resulting from:
Expenses not deductible for tax purposes ··································································· 0.6 0.9 Dividend income, non-taxable ··················································································· (0.2) (0.2)Income of foreign subsidiaries taxed at different rate to Japanese statutory tax rate ············· (1.7) (3.2)Amortization of goodwill ··························································································· 5.7 6.8 R&D tax credit ······································································································· (2.5) (7.4)Valuation allowance ································································································ (0.5) 1.5 Changes in tax rates ······························································································· 1.4 0.9 Deferred tax effect on unrealized profit in inventories ····················································· 0.9 (3.4)Other ··················································································································· 0.6 1.6
Effective income tax rate after adoption of tax-effect accounting ········································· 39.9% 35.5% The tax effects of temporary differences and net operating loss carry forwards that give rise to significant portions of the deferred tax assets
and deferred tax liabilities at March 31, 2015 and 2014 are presented below: Millions of yen
2015 2014
Deferred tax assets: Retirement benefit liabilities ······················································································ ¥6,810 ¥7,639 Research and development expenses ········································································ 1,045 858 Unrealized profit in inventories and property, plant and equipment ··································· 3,953 4,219 Accrued expenses ·································································································· 7,553 6,368 Impairment loss ····································································································· 4,905 5,455
Loss on valuation of investment securities ································································ 2,695 2,970 Inventories ········································································································· 2,060 1,793 Net operating loss carryforwards ············································································ 2,392 1,742
Other ··················································································································· 3,748 2,697
Total gross deferred tax assets ···················································································· 35,165 33,741 Less: valuation allowance ··························································································· (6,345) (6,279)
Net deferred tax assets ······························································································ 28,819 27,462 Deferred tax liabilities:
Gain on contribution of securities to retirement benefit trust ············································ (1,562) (1,911)Intangible assets ································································································· (55,853) (50,620)Unrealized gains (losses) on available-for-sale securities ············································ (4,376) (2,168)
Other ··················································································································· (2,938) (2,989)
Total gross deferred tax liabilities·················································································· (64,730) (57,688)
Net deferred tax liabilities ···························································································· ¥(35,910) ¥(30,226)
Deferred tax liabilities-current included in “Other current liabilities” were ¥105 million and ¥94 million as of March 31, 2015 and 2014.Adjustment of deferred tax assets and liabilities due to enacted changes in tax laws and rates
On March 31, 2015, amendments to the Japanese tax regulations were enacted into law. Based on the amendments, the statutory income
tax rates utilized for the measurement of deferred tax assets and liabilities expected to be settled or realized from April 1, 2015 to March 31,
2016 and on or after April 1, 2016 are changed from 35.6% for the fiscal year ended March 31, 2015 to 33.1% and 32.3%, respectively, as of
March 31, 2015.

18 TERUMO CORPORATION Annual Report 2015 Financial Information
Due to these changes in statutory income tax rates, net deferred tax assets (after deducting the deferred tax liabilities) decreased by ¥284
million as of March 31, 2015, deferred income tax expense recognized for the fiscal year ended March 31, 2015 increased by ¥730 million
and Unrealized gains (losses) on available-for-sale securities increased by ¥446 million.
9. SELLING, GENERAL AND ADMINISTRATIVE EXPENSES Significant components of selling, general and administrative expenses for the years ended March 31, 2015 and 2014 are as follows: Millions of yen
2015 2014
Promotion and advertising expenses ············································································· ¥15,972 ¥ 14,238Salaries and allowances ····························································································· 70,504 63,829Freight and packing expenses ····················································································· 11,035 10,547Research and development expenses ··········································································· 29,360 30,130Depreciation and amortization ······················································································ 25,070 22,748
10. RESEARCH AND DEVELOPMENT EXPENSES Research and development expenses charged to income for the years ended March 31, 2015 and 2014 were ¥29,360 million and ¥ 30,130
million, respectively.
11. GAIN ON SALES OF PROPERTY, PLANT AND EQUIPMENT A breakdown of gain on sales of property, plant and equipment is as follows: Millions of yen
2015 2014
Buildings and structures ····························································································· ¥166 ¥ 511 Machinery, equipment and vehicles ·············································································· 291 13 Land ······················································································································· 175 212 Other ······················································································································ 59 7
¥692 ¥743
12. LOSS ON DISPOSAL OF PROPERTY, PLANT AND EQUIPMENT A breakdown of loss on disposal of property, plant and equipment is as follows: Millions of yen
2015 2014
Buildings and structures ····························································································· ¥162 ¥126 Machinery, equipment and vehicles ·············································································· 722 496 Construction in progress ····························································································· 160 Other ······················································································································ 115 373
¥1,160 ¥995
19 TERUMO CORPORATION Annual Report 2015 Financial Information
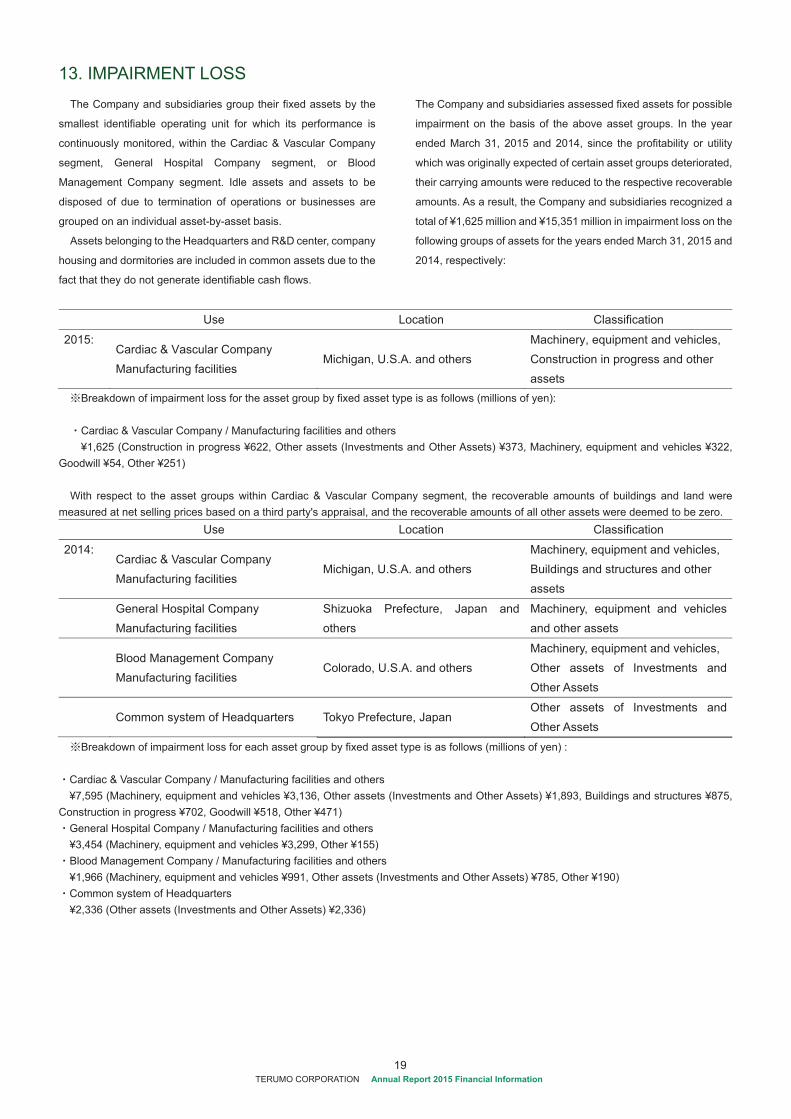
13. IMPAIRMENT LOSSThe Company and subsidiaries group their fixed assets by the
smallest identifiable operating unit for which its performance is
continuously monitored, within the Cardiac & Vascular Company
segment, General Hospital Company segment, or Blood
Management Company segment. Idle assets and assets to be
disposed of due to termination of operations or businesses are
grouped on an individual asset-by-asset basis.
Assets belonging to the Headquarters and R&D center, company
housing and dormitories are included in common assets due to the
fact that they do not generate identifiable cash flows.
The Company and subsidiaries assessed fixed assets for possible
impairment on the basis of the above asset groups. In the year
ended March 31, 2015 and 2014, since the profitability or utility
which was originally expected of certain asset groups deteriorated,
their carrying amounts were reduced to the respective recoverable
amounts. As a result, the Company and subsidiaries recognized a
total of ¥1,625 million and ¥15,351 million in impairment loss on the
following groups of assets for the years ended March 31, 2015 and
2014, respectively:
Use Location Classification
2015: Cardiac & Vascular Company Manufacturing facilities
Michigan, U.S.A. and others Machinery, equipment and vehicles, Construction in progress and other assets
Breakdown of impairment loss for the asset group by fixed asset type is as follows (millions of yen):
Cardiac & Vascular Company / Manufacturing facilities and others ¥1,625 (Construction in progress ¥622, Other assets (Investments and Other Assets) ¥373, Machinery, equipment and vehicles ¥322,
Goodwill ¥54, Other ¥251) With respect to the asset groups within Cardiac & Vascular Company segment, the recoverable amounts of buildings and land were
measured at net selling prices based on a third party's appraisal, and the recoverable amounts of all other assets were deemed to be zero. Use Location Classification
2014: Cardiac & Vascular Company Manufacturing facilities
Michigan, U.S.A. and others Machinery, equipment and vehicles, Buildings and structures and other assets
General Hospital Company Manufacturing facilities
Shizuoka Prefecture, Japan and others
Machinery, equipment and vehicles and other assets
Blood Management Company Manufacturing facilities
Colorado, U.S.A. and others Machinery, equipment and vehicles, Other assets of Investments and Other Assets
Common system of Headquarters Tokyo Prefecture, Japan
Other assets of Investments and Other Assets
Breakdown of impairment loss for each asset group by fixed asset type is as follows (millions of yen) : Cardiac & Vascular Company / Manufacturing facilities and others ¥7,595 (Machinery, equipment and vehicles ¥3,136, Other assets (Investments and Other Assets) ¥1,893, Buildings and structures ¥875,
Construction in progress ¥702, Goodwill ¥518, Other ¥471) General Hospital Company / Manufacturing facilities and others ¥3,454 (Machinery, equipment and vehicles ¥3,299, Other ¥155) Blood Management Company / Manufacturing facilities and others ¥1,966 (Machinery, equipment and vehicles ¥991, Other assets (Investments and Other Assets) ¥785, Other ¥190) Common system of Headquarters ¥2,336 (Other assets (Investments and Other Assets) ¥2,336)
20 TERUMO CORPORATION Annual Report 2015 Financial Information
With respect to the asset groups within Cardiac & Vascular
Company segment, the recoverable amounts of buildings and land
were measured at net selling prices based on a third party's
appraisal, and the recoverable amounts of all other assets were
deemed to be zero.
With respect to the asset groups within General Hospital
Company segment, the recoverable amounts were measured
using the value-in-use based on estimated future cash flows
discounted at a rate of 13.1%.
With respect to the asset groups within Blood Management
Company segment, the recoverable amounts were measured
using either the value-in-use based on estimated future cash flows
discounted at a rate of 13.1%, or the net selling price.
With respect to the Common system of Headquarters, since its
expected economic benefit became uncertain, an impairment loss
was recognized as above.
14. TREASURY STOCK At March 31, 2015 and 2014, the Company held 931 thousand
and 6 thousand shares of treasury stock for an aggregate cost of
¥3,035 million and ¥24 million, respectively.
The annual shareholders’ meeting held on June 29, 2004
approved a change to the Company's Articles of Incorporation so
that the Company may acquire its common stock to be held in
treasury based on decision by the Board of Directors.
15. NET ASSETS Under the Japanese Corporate Law (“the Law”) and related
regulations, the entire amount paid for new shares is required to be
designated as capital stock. However, a company may, by a
resolution of the Board of Directors, designate an amount not
exceeding one-half of the price of the new shares as additional
paid-in capital, which is included in capital surplus. In cases where
a dividend distribution of surplus is made, the smaller of an amount
equal to 10% of the dividend or the excess, if any, of 25% of capital
stock over the total of additional paid-in capital and legal earnings
reserve must be set aside as additional paid-in capital or legal
earnings reserve. Legal earnings reserve is included in retained
earnings in the accompanying consolidated balance sheets. Under
the Law, legal earnings reserve and additional paid-in capital could
be used to eliminate or reduce a deficit and capitalized by a
resolution of the shareholders’ meeting. Additional paid-in capital
and legal earnings reserve may not be distributed as dividends.
Under the Law, however, on condition that the total amount of legal
earnings reserve and additional paid-in capital remain equal to or
exceed 25% of common stock, they are available for distribution by
resolution of the shareholders’ meeting. Under the Law, all
additional paid-in capital and all legal earnings reserve may be
transferred to other capital surplus and retained earnings which are
potentially available for dividends.
The maximum amount that the Company can distribute as
dividends is calculated based on the non-consolidated financial
statements of the Company in accordance with the Law and related
regulations.
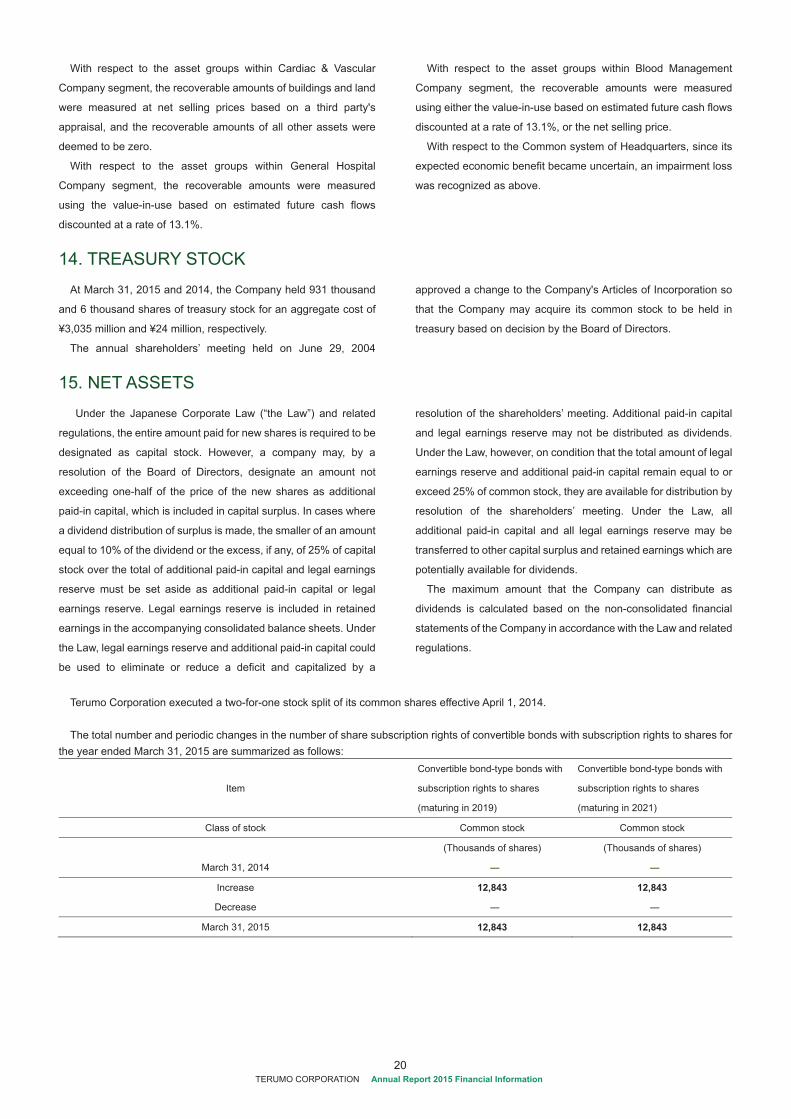
Terumo Corporation executed a two-for-one stock split of its common shares effective April 1, 2014. The total number and periodic changes in the number of share subscription rights of convertible bonds with subscription rights to shares for
the year ended March 31, 2015 are summarized as follows:
Item
Convertible bond-type bonds with
subscription rights to shares
(maturing in 2019)
Convertible bond-type bonds with
subscription rights to shares
(maturing in 2021)
Class of stock Common stock Common stock
(Thousands of shares) (Thousands of shares)
March 31, 2014
Increase 12,843 12,843
Decrease
March 31, 2015 12,843 12,843
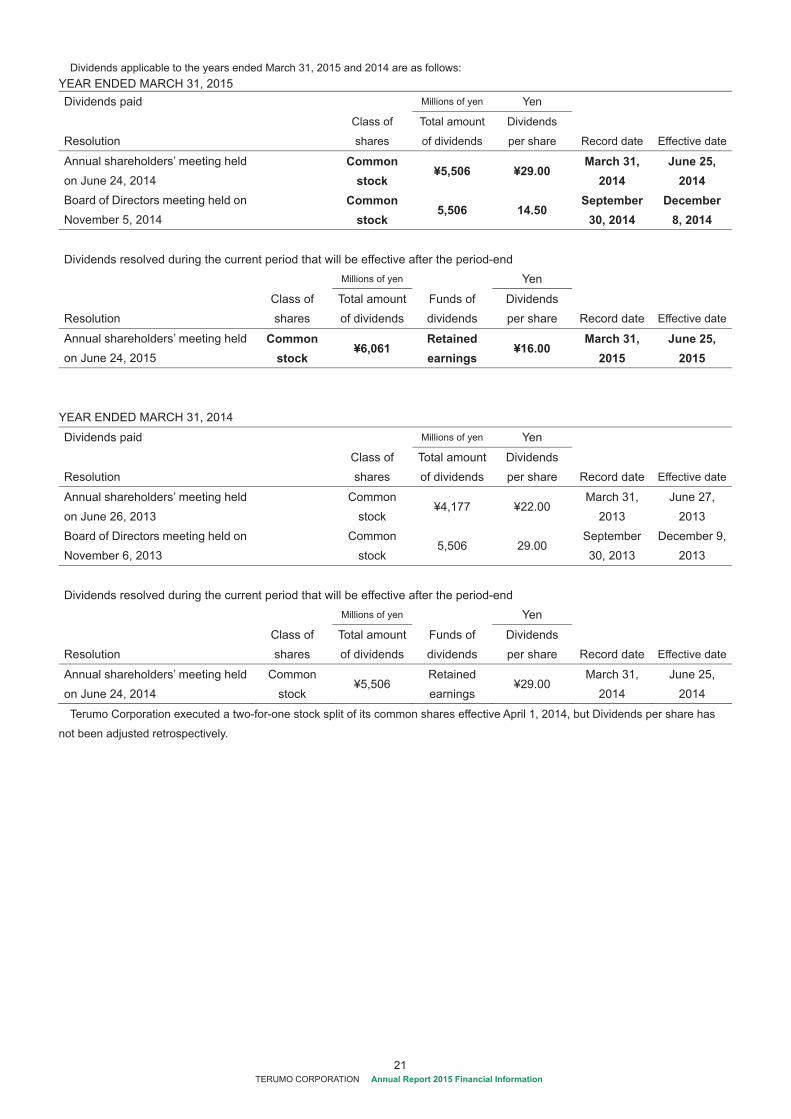
21 TERUMO CORPORATION Annual Report 2015 Financial Information
Dividends applicable to the years ended March 31, 2015 and 2014 are as follows: YEAR ENDED MARCH 31, 2015 Dividends paid Millions of yen Yen
Resolution Class of
shares
Total amount
of dividends
Dividends
per share Record date Effective date
Annual shareholders’ meeting held on June 24, 2014
Common stock
¥5,506 ¥29.00 March 31,
2014 June 25,
2014 Board of Directors meeting held on November 5, 2014
Common stock
5,506 14.50 September
30, 2014 December
8, 2014
Dividends resolved during the current period that will be effective after the period-end Millions of yen Yen
Resolution
Class of shares
Total amount of dividends
Funds of dividends
Dividends per share Record date Effective date
Annual shareholders’ meeting held on June 24, 2015
Common stock
¥6,061 Retained earnings
¥16.00 March 31,
2015 June 25,
2015
YEAR ENDED MARCH 31, 2014
Dividends paid Millions of yen Yen
Resolution Class of
shares Total amount of dividends
Dividends per share Record date Effective date
Annual shareholders’ meeting held on June 26, 2013
Common stock
¥4,177 ¥22.00 March 31,
2013 June 27,
2013 Board of Directors meeting held on November 6, 2013
Common stock
5,506 29.00 September 30, 2013
December 9, 2013
Dividends resolved during the current period that will be effective after the period-end Millions of yen Yen
Resolution Class of shares
Total amount of dividends
Funds of dividends
Dividends per share Record date Effective date
Annual shareholders’ meeting held on June 24, 2014
Common stock
¥5,506 Retained earnings
¥29.00 March 31,
2014 June 25,
2014
Terumo Corporation executed a two-for-one stock split of its common shares effective April 1, 2014, but Dividends per share has
not been adjusted retrospectively.
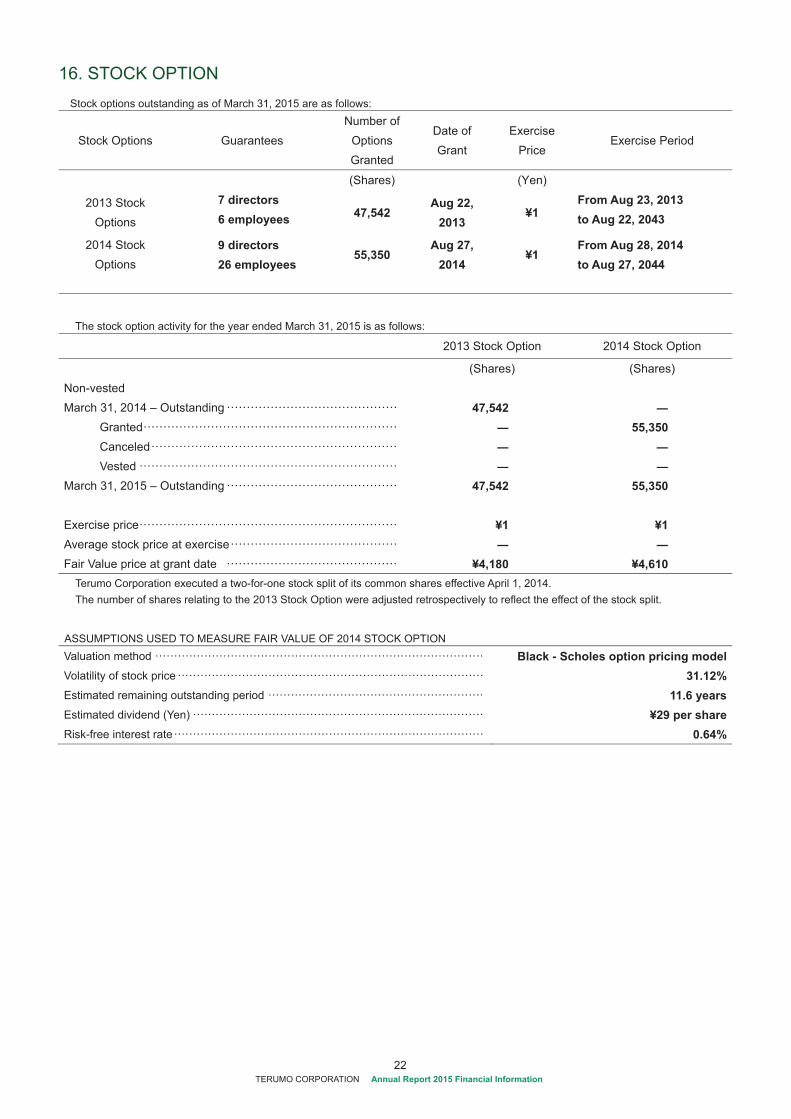
22 TERUMO CORPORATION Annual Report 2015 Financial Information
16. STOCK OPTION Stock options outstanding as of March 31, 2015 are as follows:
Stock Options Guarantees Number of
Options Granted
Date of Grant
Exercise Price
Exercise Period
(Shares) (Yen)
2013 Stock Options
7 directors 6 employees 47,542
Aug 22, 2013
¥1 From Aug 23, 2013 to Aug 22, 2043
2014 Stock Options
9 directors 26 employees
55,350 Aug 27,
2014 ¥1
From Aug 28, 2014 to Aug 27, 2044
The stock option activity for the year ended March 31, 2015 is as follows:
2013 Stock Option 2014 Stock Option
(Shares) (Shares) Non-vested March 31, 2014 – Outstanding ··········································· 47,542
Granted ································································ 55,350 Canceled ······························································ Vested ·································································
March 31, 2015 – Outstanding ··········································· 47,542 55,350 Exercise price ································································· ¥1 ¥1 Average stock price at exercise ·········································· Fair Value price at grant date ··········································· ¥4,180 ¥4,610
Terumo Corporation executed a two-for-one stock split of its common shares effective April 1, 2014. The number of shares relating to the 2013 Stock Option were adjusted retrospectively to reflect the effect of the stock split.
ASSUMPTIONS USED TO MEASURE FAIR VALUE OF 2014 STOCK OPTION
Valuation method ······················································································· Black - Scholes option pricing modelVolatility of stock price ················································································· 31.12%Estimated remaining outstanding period ························································· 11.6 yearsEstimated dividend (Yen) ············································································· ¥29 per shareRisk-free interest rate ·················································································· 0.64%
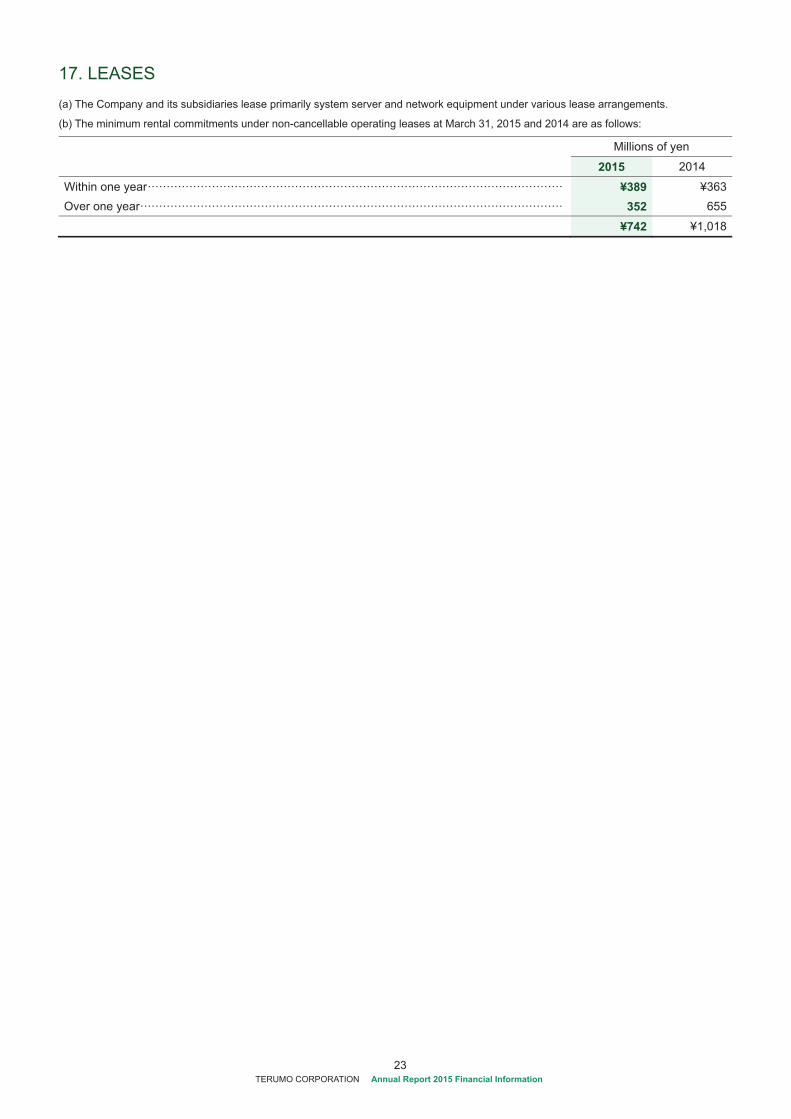
23 TERUMO CORPORATION Annual Report 2015 Financial Information
17. LEASES (a) The Company and its subsidiaries lease primarily system server and network equipment under various lease arrangements.
(b) The minimum rental commitments under non-cancellable operating leases at March 31, 2015 and 2014 are as follows:
Millions of yen
2015 2014
Within one year ·············································································································· ¥389 ¥363Over one year ················································································································ 352 655
¥742 ¥1,018
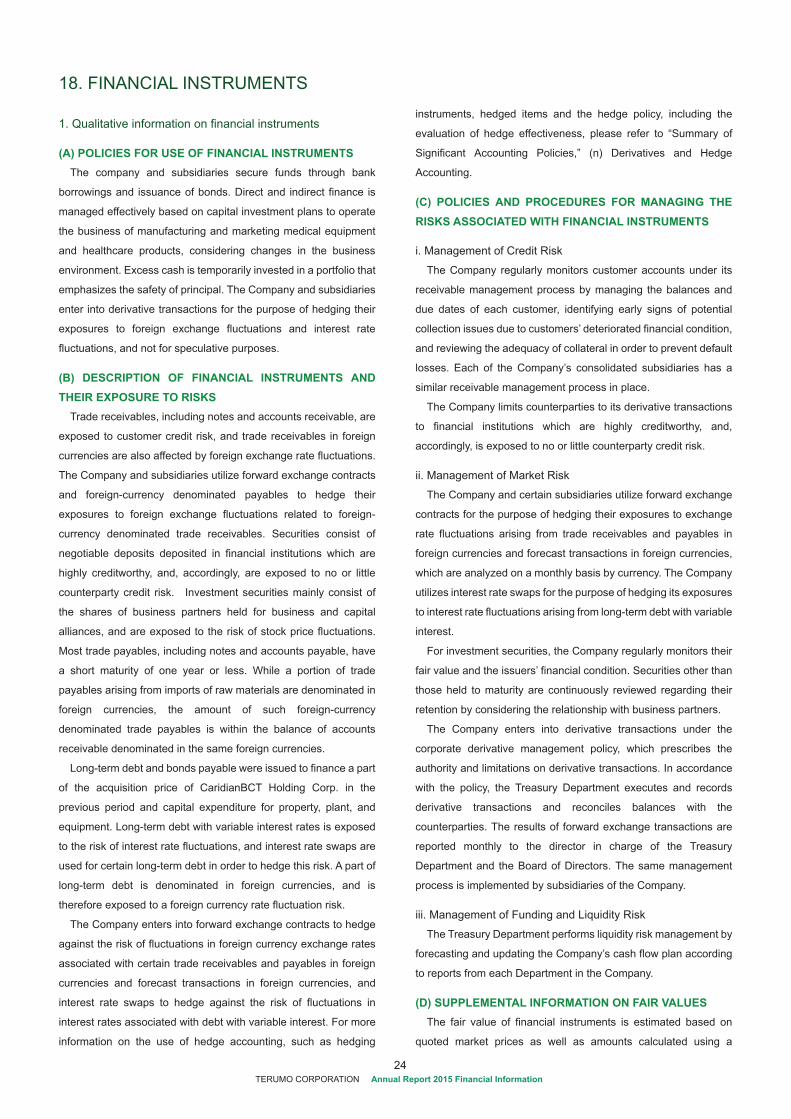
24 TERUMO CORPORATION Annual Report 2015 Financial Information
18. FINANCIAL INSTRUMENTS
1. Qualitative information on financial instruments
(A) POLICIES FOR USE OF FINANCIAL INSTRUMENTS The company and subsidiaries secure funds through bank
borrowings and issuance of bonds. Direct and indirect finance is
managed effectively based on capital investment plans to operate
the business of manufacturing and marketing medical equipment
and healthcare products, considering changes in the business
environment. Excess cash is temporarily invested in a portfolio that
emphasizes the safety of principal. The Company and subsidiaries
enter into derivative transactions for the purpose of hedging their
exposures to foreign exchange fluctuations and interest rate
fluctuations, and not for speculative purposes.
(B) DESCRIPTION OF FINANCIAL INSTRUMENTS AND THEIR EXPOSURE TO RISKS
Trade receivables, including notes and accounts receivable, are
exposed to customer credit risk, and trade receivables in foreign
currencies are also affected by foreign exchange rate fluctuations.
The Company and subsidiaries utilize forward exchange contracts
and foreign-currency denominated payables to hedge their
exposures to foreign exchange fluctuations related to foreign-
currency denominated trade receivables. Securities consist of
negotiable deposits deposited in financial institutions which are
highly creditworthy, and, accordingly, are exposed to no or little
counterparty credit risk. Investment securities mainly consist of
the shares of business partners held for business and capital
alliances, and are exposed to the risk of stock price fluctuations.
Most trade payables, including notes and accounts payable, have
a short maturity of one year or less. While a portion of trade
payables arising from imports of raw materials are denominated in
foreign currencies, the amount of such foreign-currency
denominated trade payables is within the balance of accounts
receivable denominated in the same foreign currencies.
Long-term debt and bonds payable were issued to finance a part
of the acquisition price of CaridianBCT Holding Corp. in the
previous period and capital expenditure for property, plant, and
equipment. Long-term debt with variable interest rates is exposed
to the risk of interest rate fluctuations, and interest rate swaps are
used for certain long-term debt in order to hedge this risk. A part of
long-term debt is denominated in foreign currencies, and is
therefore exposed to a foreign currency rate fluctuation risk.
The Company enters into forward exchange contracts to hedge
against the risk of fluctuations in foreign currency exchange rates
associated with certain trade receivables and payables in foreign
currencies and forecast transactions in foreign currencies, and
interest rate swaps to hedge against the risk of fluctuations in
interest rates associated with debt with variable interest. For more
information on the use of hedge accounting, such as hedging
instruments, hedged items and the hedge policy, including the
evaluation of hedge effectiveness, please refer to “Summary of
Significant Accounting Policies,” (n) Derivatives and Hedge
Accounting.
(C) POLICIES AND PROCEDURES FOR MANAGING THE RISKS ASSOCIATED WITH FINANCIAL INSTRUMENTS
i. Management of Credit Risk
The Company regularly monitors customer accounts under its
receivable management process by managing the balances and
due dates of each customer, identifying early signs of potential
collection issues due to customers’ deteriorated financial condition,
and reviewing the adequacy of collateral in order to prevent default
losses. Each of the Company’s consolidated subsidiaries has a
similar receivable management process in place.
The Company limits counterparties to its derivative transactions
to financial institutions which are highly creditworthy, and,
accordingly, is exposed to no or little counterparty credit risk.
ii. Management of Market Risk
The Company and certain subsidiaries utilize forward exchange
contracts for the purpose of hedging their exposures to exchange
rate fluctuations arising from trade receivables and payables in
foreign currencies and forecast transactions in foreign currencies,
which are analyzed on a monthly basis by currency. The Company
utilizes interest rate swaps for the purpose of hedging its exposures
to interest rate fluctuations arising from long-term debt with variable
interest.
For investment securities, the Company regularly monitors their
fair value and the issuers’ financial condition. Securities other than
those held to maturity are continuously reviewed regarding their
retention by considering the relationship with business partners.
The Company enters into derivative transactions under the
corporate derivative management policy, which prescribes the
authority and limitations on derivative transactions. In accordance
with the policy, the Treasury Department executes and records
derivative transactions and reconciles balances with the
counterparties. The results of forward exchange transactions are
reported monthly to the director in charge of the Treasury
Department and the Board of Directors. The same management
process is implemented by subsidiaries of the Company.
iii. Management of Funding and Liquidity Risk
The Treasury Department performs liquidity risk management by
forecasting and updating the Company’s cash flow plan according
to reports from each Department in the Company.
(D) SUPPLEMENTAL INFORMATION ON FAIR VALUES The fair value of financial instruments is estimated based on
quoted market prices as well as amounts calculated using a
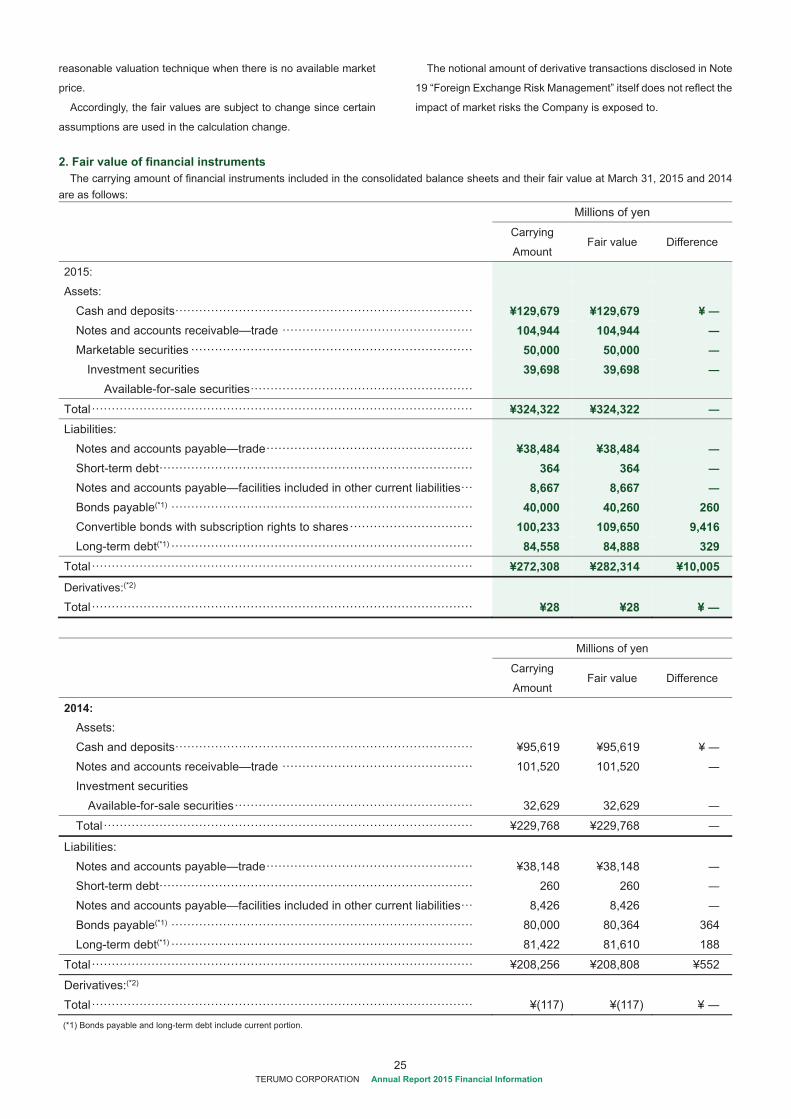
25 TERUMO CORPORATION Annual Report 2015 Financial Information
reasonable valuation technique when there is no available market
price.
Accordingly, the fair values are subject to change since certain
assumptions are used in the calculation change.
The notional amount of derivative transactions disclosed in Note
19 “Foreign Exchange Risk Management” itself does not reflect the
impact of market risks the Company is exposed to.
2. Fair value of financial instruments
The carrying amount of financial instruments included in the consolidated balance sheets and their fair value at March 31, 2015 and 2014 are as follows:
Millions of yen
Carrying
Amount Fair value Difference
2015:
Assets:
Cash and deposits ··········································································· ¥129,679 ¥129,679 ¥ Notes and accounts receivable—trade ················································ 104,944 104,944 Marketable securities ······································································· 50,000 50,000
Investment securities Available-for-sale securities ························································
39,698 39,698
Total ································································································ ¥324,322 ¥324,322
Liabilities: Notes and accounts payable—trade ···················································· ¥38,484 ¥38,484 Short-term debt ··············································································· 364 364 Notes and accounts payable—facilities included in other current liabilities ··· 8,667 8,667 Bonds payable(*1) ············································································ 40,000 40,260 260 Convertible bonds with subscription rights to shares ······························· 100,233 109,650 9,416 Long-term debt(*1) ············································································ 84,558 84,888 329
Total ································································································ ¥272,308 ¥282,314 ¥10,005
Derivatives:(*2) Total ································································································ ¥28 ¥28 ¥
Millions of yen
Carrying
Amount Fair value Difference
2014: Assets: Cash and deposits ··········································································· ¥95,619 ¥95,619 ¥
Notes and accounts receivable—trade ················································ 101,520 101,520
Investment securities
Available-for-sale securities ···························································· 32,629 32,629
Total ····························································································· ¥229,768 ¥229,768
Liabilities:
Notes and accounts payable—trade ···················································· ¥38,148 ¥38,148
Short-term debt ··············································································· 260 260
Notes and accounts payable—facilities included in other current liabilities ··· 8,426 8,426
Bonds payable(*1) ············································································ 80,000 80,364 364 Long-term debt(*1) ············································································ 81,422 81,610 188
Total ································································································ ¥208,256 ¥208,808 ¥552
Derivatives:(*2) Total ································································································ ¥(117) ¥(117) ¥
(*1) Bonds payable and long-term debt include current portion.
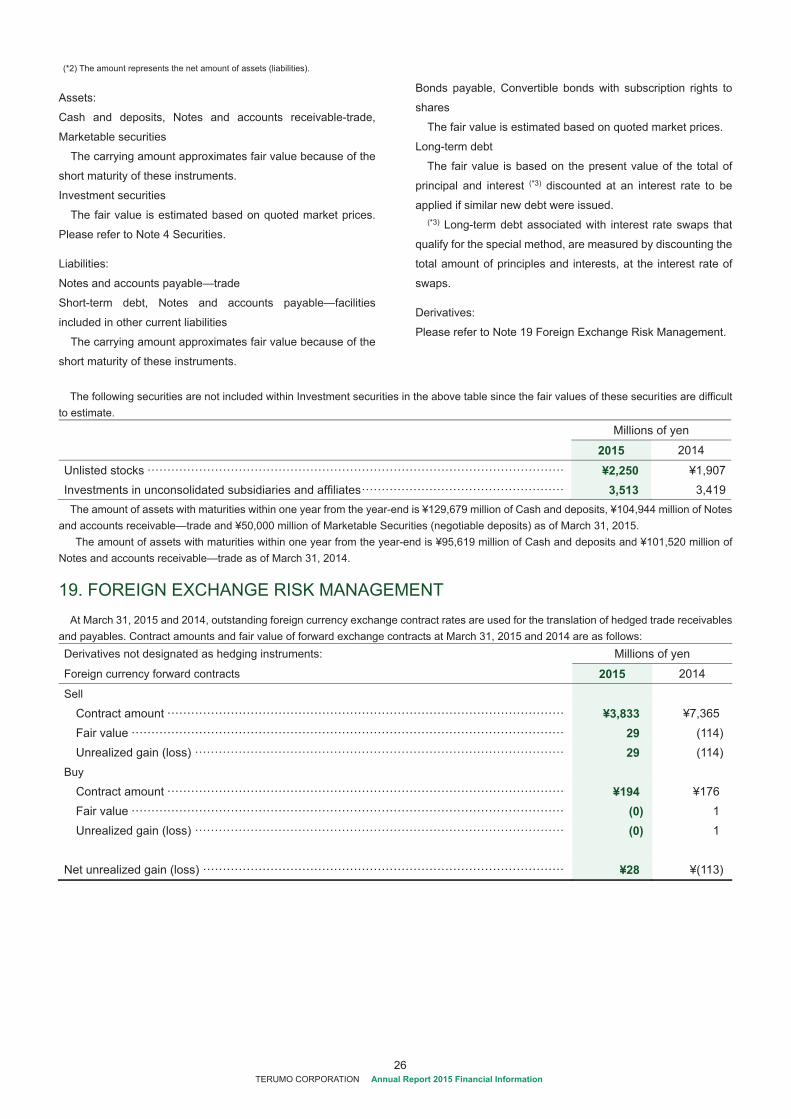
26 TERUMO CORPORATION Annual Report 2015 Financial Information
(*2) The amount represents the net amount of assets (liabilities).
Assets:
Cash and deposits, Notes and accounts receivable-trade,
Marketable securities
The carrying amount approximates fair value because of the
short maturity of these instruments.
Investment securities
The fair value is estimated based on quoted market prices.
Please refer to Note 4 Securities.
Liabilities:
Notes and accounts payable—trade
Short-term debt, Notes and accounts payable—facilities
included in other current liabilities
The carrying amount approximates fair value because of the
short maturity of these instruments.
Bonds payable, Convertible bonds with subscription rights to
shares
The fair value is estimated based on quoted market prices.
Long-term debt
The fair value is based on the present value of the total of
principal and interest (*3) discounted at an interest rate to be
applied if similar new debt were issued. (*3) Long-term debt associated with interest rate swaps that
qualify for the special method, are measured by discounting the
total amount of principles and interests, at the interest rate of
swaps.
Derivatives:
Please refer to Note 19 Foreign Exchange Risk Management.
The following securities are not included within Investment securities in the above table since the fair values of these securities are difficult
to estimate. Millions of yen
2015 2014
Unlisted stocks ········································································································· ¥2,250 ¥1,907Investments in unconsolidated subsidiaries and affiliates ··················································· 3,513 3,419
The amount of assets with maturities within one year from the year-end is ¥129,679 million of Cash and deposits, ¥104,944 million of Notes and accounts receivable—trade and ¥50,000 million of Marketable Securities (negotiable deposits) as of March 31, 2015.
The amount of assets with maturities within one year from the year-end is ¥95,619 million of Cash and deposits and ¥101,520 million of Notes and accounts receivable—trade as of March 31, 2014.
19. FOREIGN EXCHANGE RISK MANAGEMENT At March 31, 2015 and 2014, outstanding foreign currency exchange contract rates are used for the translation of hedged trade receivables
and payables. Contract amounts and fair value of forward exchange contracts at March 31, 2015 and 2014 are as follows: Derivatives not designated as hedging instruments: Millions of yen
Foreign currency forward contracts 2015 2014
Sell Contract amount ···································································································· ¥3,833 ¥7,365 Fair value ············································································································· 29 (114)Unrealized gain (loss) ····························································································· 29 (114)
Buy Contract amount ···································································································· ¥194 ¥176 Fair value ············································································································· (0) 1 Unrealized gain (loss) ····························································································· (0) 1
Net unrealized gain (loss) ··························································································· ¥28 ¥(113)
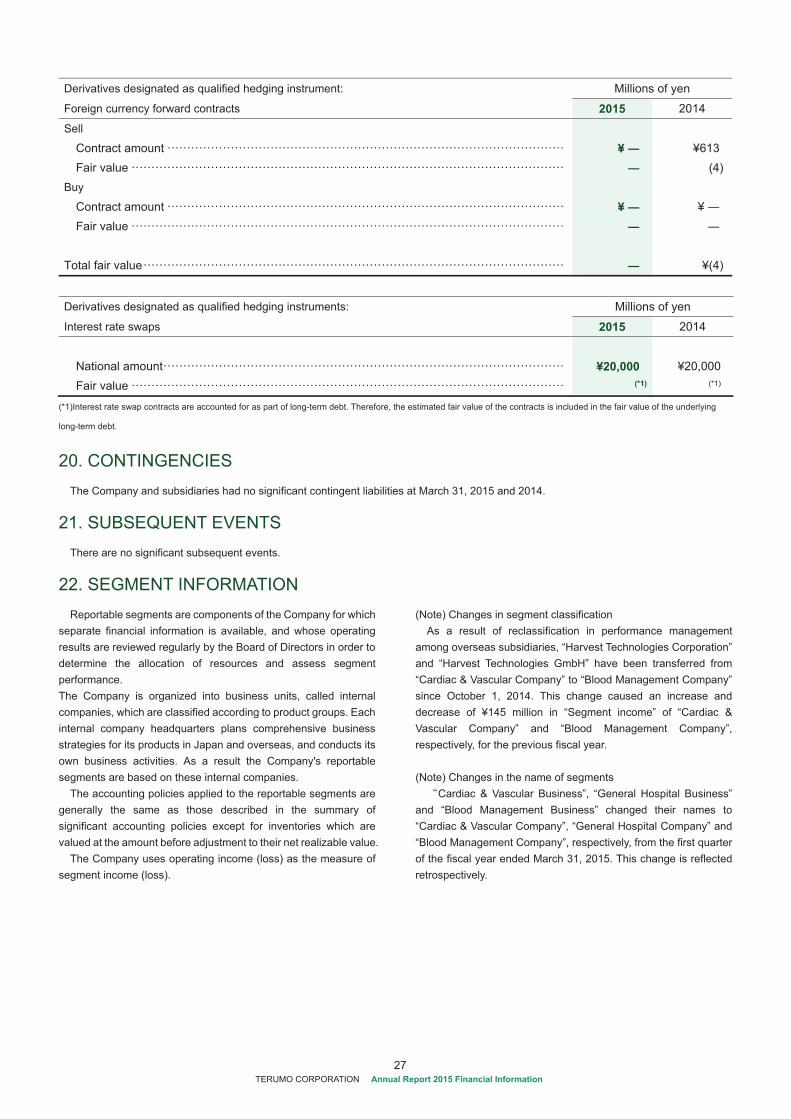
27 TERUMO CORPORATION Annual Report 2015 Financial Information
Derivatives designated as qualified hedging instrument: Millions of yen
Foreign currency forward contracts 2015 2014
Sell Contract amount ···································································································· ¥ ¥613 Fair value ············································································································· (4)
Buy Contract amount ···································································································· ¥ ¥ Fair value ·············································································································
Total fair value ·········································································································· ¥(4)
Derivatives designated as qualified hedging instruments: Millions of yen
Interest rate swaps 2015 2014
National amount ····································································································· ¥20,000 ¥20,000 Fair value ············································································································· (*1) (*1)
(*1)Interest rate swap contracts are accounted for as part of long-term debt. Therefore, the estimated fair value of the contracts is included in the fair value of the underlying
long-term debt.
20. CONTINGENCIES The Company and subsidiaries had no significant contingent liabilities at March 31, 2015 and 2014.
21. SUBSEQUENT EVENTS There are no significant subsequent events.
22. SEGMENT INFORMATIONReportable segments are components of the Company for which
separate financial information is available, and whose operating results are reviewed regularly by the Board of Directors in order to determine the allocation of resources and assess segment performance. The Company is organized into business units, called internal companies, which are classified according to product groups. Each internal company headquarters plans comprehensive business strategies for its products in Japan and overseas, and conducts its own business activities. As a result the Company's reportable segments are based on these internal companies.
The accounting policies applied to the reportable segments are generally the same as those described in the summary of significant accounting policies except for inventories which are valued at the amount before adjustment to their net realizable value.
The Company uses operating income (loss) as the measure of segment income (loss).
(Note) Changes in segment classification As a result of reclassification in performance management
among overseas subsidiaries, “Harvest Technologies Corporation” and “Harvest Technologies GmbH” have been transferred from “Cardiac & Vascular Company” to “Blood Management Company” since October 1, 2014. This change caused an increase and decrease of ¥145 million in “Segment income” of “Cardiac & Vascular Company” and “Blood Management Company”, respectively, for the previous fiscal year. (Note) Changes in the name of segments
Cardiac & Vascular Business”, “General Hospital Business” and “Blood Management Business” changed their names to “Cardiac & Vascular Company”, “General Hospital Company” and “Blood Management Company”, respectively, from the first quarter of the fiscal year ended March 31, 2015. This change is reflected retrospectively.
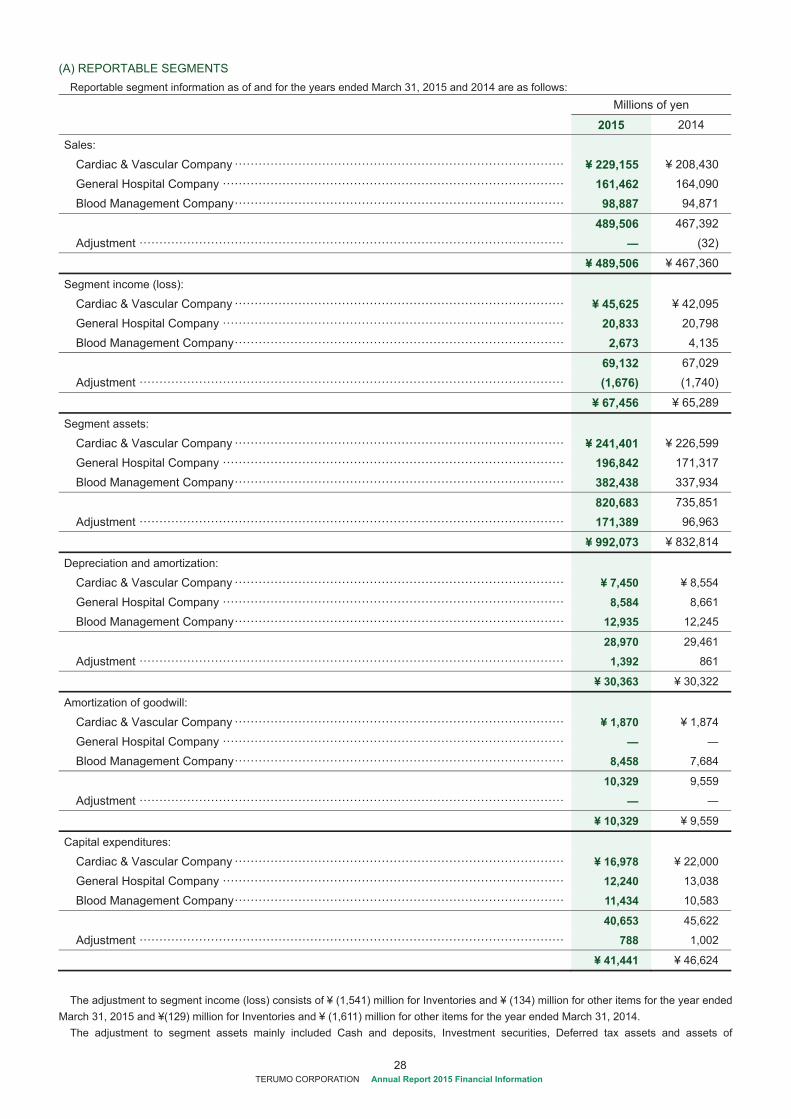
28 TERUMO CORPORATION Annual Report 2015 Financial Information
(A) REPORTABLE SEGMENTS Reportable segment information as of and for the years ended March 31, 2015 and 2014 are as follows: Millions of yen
2015 2014
Sales: Cardiac & Vascular Company ··················································································· ¥ 229,155 ¥ 208,430 General Hospital Company ······················································································ 161,462 164,090 Blood Management Company ··················································································· 98,887 94,871
489,506 467,392 Adjustment ··········································································································· (32)
¥ 489,506 ¥ 467,360
Segment income (loss): Cardiac & Vascular Company ··················································································· ¥ 45,625 ¥ 42,095 General Hospital Company ······················································································ 20,833 20,798 Blood Management Company ··················································································· 2,673 4,135
69,132 67,029 Adjustment ··········································································································· (1,676) (1,740)
¥ 67,456 ¥ 65,289
Segment assets: Cardiac & Vascular Company ··················································································· ¥ 241,401 ¥ 226,599 General Hospital Company ······················································································ 196,842 171,317 Blood Management Company ··················································································· 382,438 337,934
820,683 735,851 Adjustment ··········································································································· 171,389 96,963
¥ 992,073 ¥ 832,814
Depreciation and amortization: Cardiac & Vascular Company ··················································································· ¥ 7,450 ¥ 8,554
General Hospital Company ······················································································ 8,584 8,661
Blood Management Company ··················································································· 12,935 12,245
28,970 29,461
Adjustment ··········································································································· 1,392 861
¥ 30,363 ¥ 30,322
Amortization of goodwill:
Cardiac & Vascular Company ··················································································· ¥ 1,870 ¥ 1,874
General Hospital Company ······················································································
Blood Management Company ··················································································· 8,458 7,684
10,329 9,559
Adjustment ···········································································································
¥ 10,329 ¥ 9,559
Capital expenditures:
Cardiac & Vascular Company ··················································································· ¥ 16,978 ¥ 22,000
General Hospital Company ······················································································ 12,240 13,038
Blood Management Company ··················································································· 11,434 10,583
40,653 45,622
Adjustment ··········································································································· 788 1,002
¥ 41,441 ¥ 46,624
The adjustment to segment income (loss) consists of ¥ (1,541) million for Inventories and ¥ (134) million for other items for the year ended
March 31, 2015 and ¥(129) million for Inventories and ¥ (1,611) million for other items for the year ended March 31, 2014. The adjustment to segment assets mainly included Cash and deposits, Investment securities, Deferred tax assets and assets of
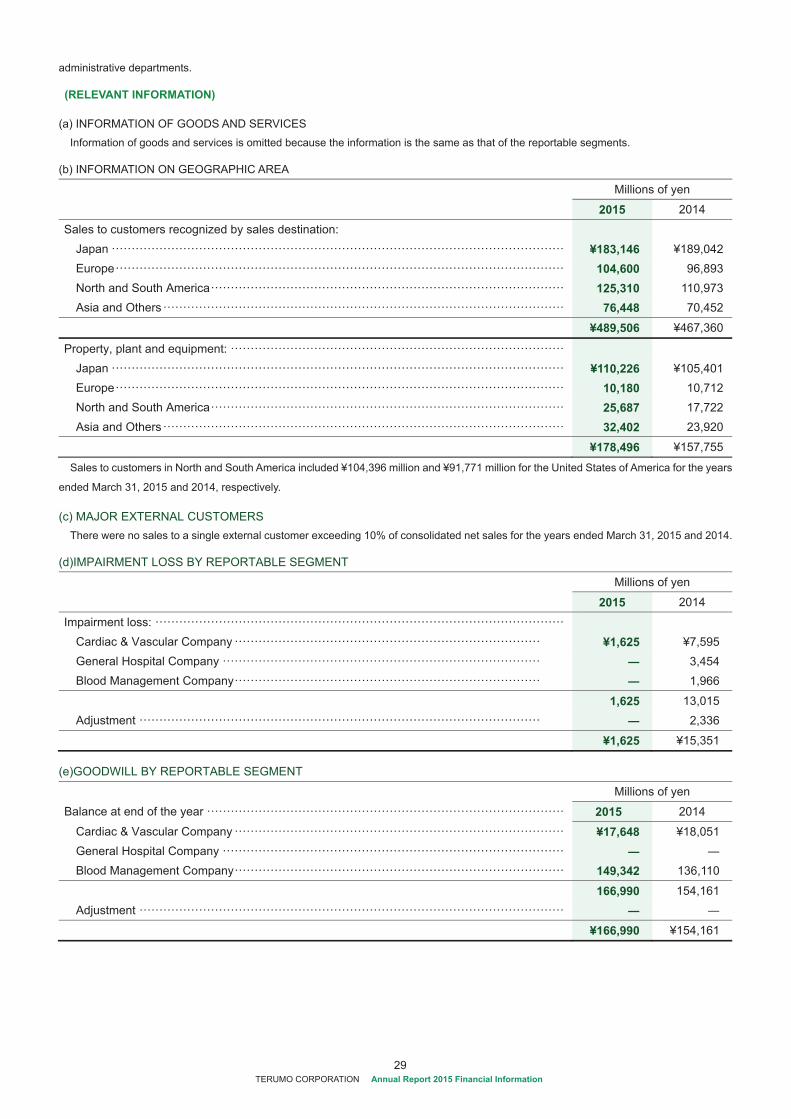
29 TERUMO CORPORATION Annual Report 2015 Financial Information
administrative departments.
(RELEVANT INFORMATION)
(a) INFORMATION OF GOODS AND SERVICES Information of goods and services is omitted because the information is the same as that of the reportable segments.
(b) INFORMATION ON GEOGRAPHIC AREA
Millions of yen
2015 2014
Sales to customers recognized by sales destination: Japan ·················································································································· ¥183,146 ¥189,042Europe ················································································································· 104,600 96,893North and South America ························································································· 125,310 110,973Asia and Others ····································································································· 76,448 70,452
¥489,506 ¥467,360
Property, plant and equipment: ···················································································· Japan ·················································································································· ¥110,226 ¥105,401Europe ················································································································· 10,180 10,712North and South America ························································································· 25,687 17,722Asia and Others ····································································································· 32,402 23,920
¥178,496 ¥157,755
Sales to customers in North and South America included ¥104,396 million and ¥91,771 million for the United States of America for the years
ended March 31, 2015 and 2014, respectively.
(c) MAJOR EXTERNAL CUSTOMERS There were no sales to a single external customer exceeding 10% of consolidated net sales for the years ended March 31, 2015 and 2014.
(d)IMPAIRMENT LOSS BY REPORTABLE SEGMENT
Millions of yen
2015 2014
Impairment loss: ······································································································· Cardiac & Vascular Company ············································································· ¥1,625 ¥7,595 General Hospital Company ················································································ 3,454 Blood Management Company ············································································· 1,966
1,625 13,015 Adjustment ····································································································· 2,336
¥1,625 ¥15,351
(e)GOODWILL BY REPORTABLE SEGMENT
Millions of yen
Balance at end of the year ·························································································· 2015 2014
Cardiac & Vascular Company ··················································································· ¥17,648 ¥18,051 General Hospital Company ······················································································ Blood Management Company ··················································································· 149,342 136,110
166,990 154,161 Adjustment ···········································································································
¥166,990 ¥154,161
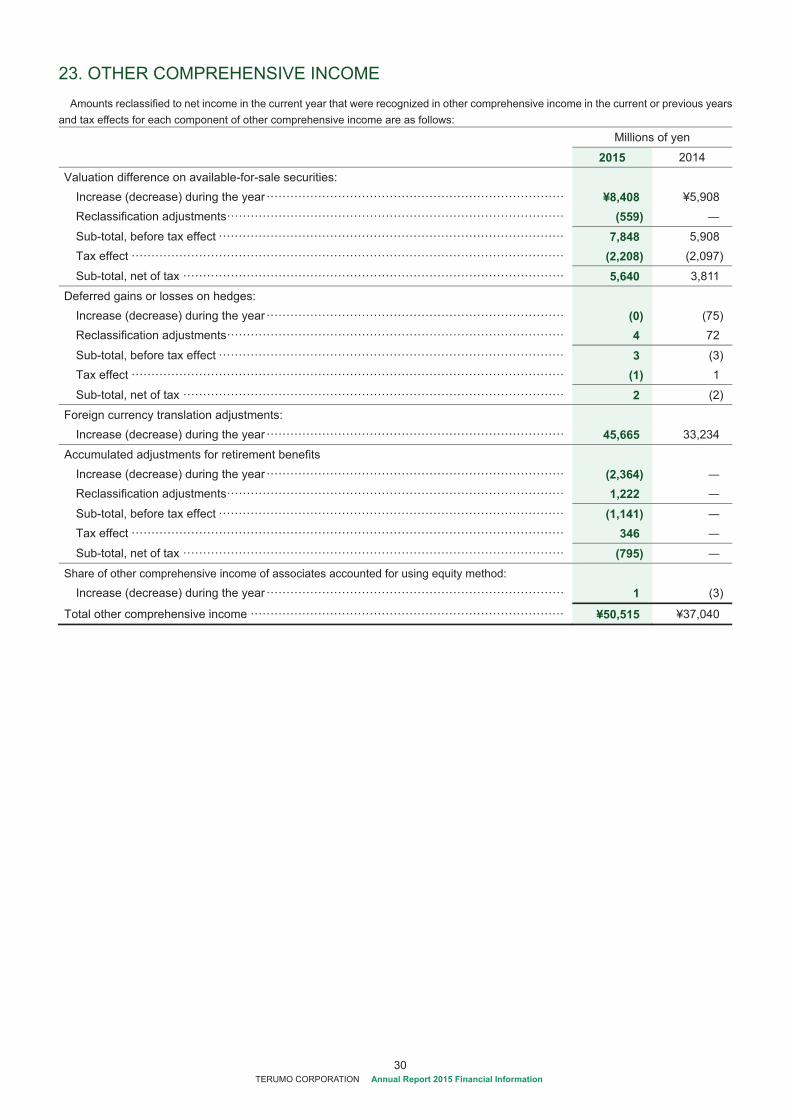
30 TERUMO CORPORATION Annual Report 2015 Financial Information
23. OTHER COMPREHENSIVE INCOME Amounts reclassified to net income in the current year that were recognized in other comprehensive income in the current or previous years
and tax effects for each component of other comprehensive income are as follows: Millions of yen
2015 2014
Valuation difference on available-for-sale securities: Increase (decrease) during the year ··········································································· ¥8,408 ¥5,908 Reclassification adjustments ····················································································· (559)
Sub-total, before tax effect ······················································································· 7,848 5,908 Tax effect ············································································································· (2,208) (2,097)
Sub-total, net of tax ································································································ 5,640 3,811
Deferred gains or losses on hedges: Increase (decrease) during the year ··········································································· (0) (75)Reclassification adjustments ····················································································· 4 72
Sub-total, before tax effect ······················································································· 3 (3)Tax effect ············································································································· (1) 1
Sub-total, net of tax ································································································ 2 (2)
Foreign currency translation adjustments: Increase (decrease) during the year ··········································································· 45,665 33,234
Accumulated adjustments for retirement benefits Increase (decrease) during the year ··········································································· (2,364)
Reclassification adjustments ····················································································· 1,222
Sub-total, before tax effect ······················································································· (1,141)
Tax effect ············································································································· 346
Sub-total, net of tax ································································································ (795)
Share of other comprehensive income of associates accounted for using equity method:
Increase (decrease) during the year ··········································································· 1 (3)
Total other comprehensive income ··············································································· ¥50,515 ¥37,040
31 TERUMO CORPORATION Annual Report 2015 Financial Information

© Terumo Corporation October 2015Tokyo Opera City Tower, 3-20-2 Nishi-Shinjuku, Shinjuku-ku, Tokyo 163-1450, JapanTokyo Of�ce