Embed Size (px)
Citation preview

ANNUAL REPORT 2014Nick Scali Limited


Page
Chairman and Managing Director’s Review 2
Financial Report 4
Corporate Governance Statement 5
Directors’ Report 9
Shareholder Information 46
Contents

2
Operating Performance
It is pleasing to report that for the year ended 30
June 2014 your Company achieved another record
trading profit with Underlying Net Profit After Tax
reaching $14.2 million compared with $12.2 million
in the fiscal 2013 year, an increase of 16.3%.
The result was founded on strong sales revenue
of $141.4m, up 11% on the previous year and a
continuation of several years of growth.
The furniture market remained somewhat subdued
and highly competitive throughout the year.
Consumer demand remained volatile month by
month and the improved and encouraging result
confirms the strength of the Nick Scali brand and
the appeal of its product range to consumers.
Sales Revenue was assisted by the Company’s
well established strategy of selectively opening
new stores in areas considered to have strong
growth potential. It is particularly pleasing however
to report that in the year to June 2014, comparable
store sales also grew and were 6.3% ahead of
the previous year. Given the generally soft market
conditions, it points to a stronger relative market
position achieved by the Company. Targeted
marketing activity and a focus on careful selection
of product ranges with compelling price points
continue to remain the building blocks of the
business and were large contributors to the growth
in comparable store sales.
Gross Margin remained solid at 60.4% and whilst
slightly lower than last year’s 60.8%, was a very
satisfactory result given the weaker AUD, pressures
from supplier price increases and increased
discounting in the highly competitive market.
While operating expenses increased due to the
opening of new stores and inflationary pressures,
as a percentage to sales they decreased from
46.4% in fiscal 2013 to 45.3% this year, illustrating
management’s continued focus on controlling
costs in line with sales growth and also economies
of scale benefits as the Company grows.
During the year, the Company opened 2 new
stores both of which were Nick Scali branded
stores. These were in Castle Hill (NSW) and Taylors
Lakes (VIC). The total number of stores at 30 June
2014 was 39, comprising 34 Nick Scali stores and
5 Sofas2Go stores.
The Company acquired a property at Caringbah
(NSW) subsequent to 30 June 2014 and intends to
redevelop this site during calendar 2015. A lease
on a property for a distribution centre in Western
Australia has also been secured and plans are
in place to open up to three stores in that State
by the end of fiscal 2015. Directors believe that
the Company has considerable room for further
expansion of its store network, with a number of
other sites in existing markets also currently under
negotiation for opening in the new financial year.
It has been another positive year for the Company
and its people, and the Directors take this
opportunity to thank all employees for their efforts
towards achieving the strong sales and profit
result. The Directors also thank shareholders for
their continued support.
Chairman and Managing Director’s Review

Annual Report 2014 3
Dividend
The Directors have declared a fully franked
Final Dividend of 7.0 cents per share. The
record date will be 8 October 2014 with the
dividend payable on 30 October 2014. When
added to the Interim Dividend of 6.0 cents per
share, the Total Dividend for the year is 13.0
cents per share fully franked.
Outlook
The current year has opened with a strong
pipeline of orders to be delivered which should
underwrite robust sales revenue and profit in
the early months of the 2015 financial year.
As the furniture market is closely tied to the
housing market and to consumer confidence,
further growth in the 2015 financial year will
be largely dependent on housing construction
and consumer attitudes to spending as well as
the rate of new store openings.
The Company has a strong balance sheet,
supported by a healthy cash position and
minimal debt and thus is in an excellent
position to drive its growth strategy further in
the period ahead to deliver additional value to
shareholders.
Chairman and Managing Director’s Review (continued)

4
Financial Report - Year Ended 30 June 2014
Page
Notes to the Financial StatementsNote 1: Statement of Significant Accounting Policies 21
Note 2: Revenue 27
Note 3: Operating Expenses and Losses/(Gains) 27
Note 4: Income Tax 28
Note 5: Dividends 29
Note 6: Auditors’ Remuneration 29
Note 7: Earnings Per Share 29
Note 8: Receivables 30
Note 9: Inventories 30
Note 10: Other Financial Assets 30
Note 11: Other Assets 30
Note 12: Property, Plant and Equipment 31
Note 13: Intangible Assets 32
Note 14: Payables 33
Note 15: Provisions 34
Note 16: Contributed Equity 34
Note 17: Reserves 35
Note 18: Operating Lease Commitments 35
Note 19: Capital Commitments 35
Note 20: Contingent Liabilities 36
Note 21: Events Subsequent to Reporting Date 36
Note 22: Statement of Cash Flows 36
Note 23: Related Party Disclosures 37
Note 24: Director and Executive Disclosures 38
Note 25: Share-based Payment Plans 38
Note 26: Financial Risk Management
Objectives and Policies 39
Note 27: Capital Management 41
Note 28: Segment Information 41
Note 29: Corporate Information 41
Page
Corporate Governance Statement 5Directors’ Report 9Statement of Income 16Statement of Comprehensive Income 17Statement of Financial Position 18Statement of Changes in Equity 19Statement of Cash Flows 20Notes to the Financial Statements 21Directors’ Declaration 42 Independent Auditor’s Report 43 Auditor’s Independence Declaration 45

page title continued
Annual Report 2014 5
The Board of Nick Scali Limited is responsible for the
direction and supervision of the Company’s business and
for its overall corporate governance. The Board recognises
the need to maintain the highest standards of behaviour,
ethics and accountability.
The Board is committed to effective corporate governance
in order to ensure accountability and transparency
to shareholders and other stakeholders, including
customers, employees, staff and regulatory bodies. This
includes ensuring that internal controls and reporting
procedures are adequate and effective. Responsibility
for the management of the day to day operations and
administration of the Company is delegated to the
Managing Director.
Effective corporate governance is achieved through
the structure and operation of the Board and its sub-
committees. There are two sub-committees – the Audit
Committee and the Remuneration Committee. The
members of these committees are the three non executive
directors. The Board and its sub-committees work
with senior management to monitor, review and refine
corporate governance standards.
The ASX Limited Corporate Governance Council has
established the Corporate Governance Principles and
Recommendations (2nd Edition). The Company has
applied and followed the ASX Recommendations except
to the extent set out below.
Lay solid foundations for management and oversightRole of the Board
The primary functions of the Board include:
i. formulating and approving the objectives, strategies
and long-term plans for the Company’s continued
development and operation, in conjunction with
management;
ii. monitoring the implementation of these objectives,
strategies and long-term plans to ensure the
Company, to the best of its ability, delivers value to
Shareholders;
iii. monitoring the Company’s overall performance and
financial results, including adopting annual budgets
and approving the Company’s financial statements;
iv. selecting and reviewing the performance of the
Managing Director;
v. ensuring significant business risks are identified and
appropriately managed;
vi. ensuring that the Company meets the statutory,
regulatory and reporting requirements of the ASX
Limited and the Corporations Act;
vii. ensuring that the Company, its directors, officers,
employees and Associates are aware of and comply
with all relevant laws and regulations;
viii. reporting to Shareholders on performance; and
ix. deciding on the payment of dividends to Shareholders.
Each incoming director receives a letter of appointment
setting out the key terms and conditions of his or her
appointment and the Company’s expectations of them in
that role.
The Board has established an Audit Committee and a
Remuneration Committee, both of which operate under a
formal charter. From time to time the Board may determine
to establish specific purpose sub-committees to deal with
specific issues.
At least once a year the Remuneration Committee and
the Managing Director review the performance of each
member of the Company’s senior executive team against
agreed performance measures, and with consideration to
the Managing Director’s recommendation, they determine
changes in remuneration in respect of each senior
executive. This process was followed during the reporting
period. For further discussion regarding executive
remuneration please refer to the “Remunerate fairly and
responsibly” section of the report.
Structure of the Board to add valueThe Board currently consists of the Chairman, the
Managing Director and three non-executive directors.
The term of a director’s appointment is governed by the
Company’s Constitution. At least one-third of directors,
other than the Managing Director must retire and seek re-
election at each annual general meeting of the Company.
Corporate Governance Statement

6
Corporate Governance Statement (continued)
The background and skills of each of the non-executive
directors is complementary. This assists the Board in
effectively reviewing and challenging the performance of
management and the exercise of independent judgement.
The skills, qualifications, experience and relevant expertise of
each director, are summarised in the Directors section of the
Directors’ Report contained within this report.
Three of the non-executive directors, John Ingram (who is
Chairman), Greg Laurie and Carole Molyneux are independent.
They do not hold a material amount of shares in the Company;
they do not receive any financial benefit from the Company,
apart form the directors fees disclosed in this report; and they
have not previously been directly employed by, professionally
engaged with, nor had a material contractual relationship with
the Company. These directors provide the Company with
relevant information to enable the Company to continually
assess this independence.
The current structure of the Board adds value to the Company
due to the extensive knowledge, expertise and experience in
the retail sector and other relevant functional areas.
The Board has not established a nomination committee;
instead the responsibility for these practices rests with the
full Board. A formal performance evaluation of the Board
is undertaken annually which includes a review of Board
activities generally, including its effectiveness, composition
and processes. The review seeks written input and comment
from each director and the Chairman oversees the compilation
and evaluation of the review results, ensures discussion with
all directors and directs any outcomes from the review. When
considering the size and composition of the Board, the
intention of the Directors is to achieve a balance between the
need for a mix of skills and diversity of background, whilst
ensuring that the size of the board is appropriate and effective
given the size of the organisation.
Each director has the right of access to all relevant Company
information and to the Company’s executives, and, if required,
may seek independent professional advice at the Company’s
expense. The Company Secretary is responsible for ensuring
that Board policy and procedures are followed.
Promote ethical and responsible decision-makingThe Company has established its own Code of Ethics
embracing high standards of personal and corporate conduct
and the Company is committed to ensuring that it conducts
its business in accordance with high standards of ethical
behaviour. The Code of Ethics, applicable to directors and
employees, covers various issues including compliance,
confidential information, intellectual property, representation,
Company assets, employment issues and conflicts of interest.
The Code of Ethics requires, among other things, that
every director, officer, employee, agent, sub-contractor and
consultant of the Company must:
– act honestly and fairly in all dealings;
– understand the regulatory compliance requirements
applicable to their duties and treat those requirements as
essential to the performance of those duties;
– co-operate with relevant regulatory authorities;
– act professionally and with courtesy and integrity; and
– maintain the confidentiality of the Company’s affairs other
than as required by the Company or law.
The Company also has a Share Trading Policy for directors
and employees. Subject at all times to not being in possession
of inside information, directors, officers (and their related
entities) may deal in Nick Scali Limited securities during the
eight (8) week period commencing on the second business
day following:
– an announcement of Nick Scali Limited’s full year financial
results, and
– an announcement of Nick Scali Limited’s half year financial
results, and
– the Annual General Meeting of Nick Scali Limited, and
– any announcement by the Company indicating expected
results, provided that such a trading window does not
extend beyond the end of a Nick Scali Limited financial
reporting period (half year or full year); in which case the
window will instead close at the end of that reporting
period.
Approval to trade outside these windows will only be granted
in exceptional personal circumstances, upon prior notice to
and approval from:
– in the case of directors, the Chairman;
– in the case of the Chairman, the Chairman of the Audit
Committee;
– in the case of officers, the Managing Director.
Directors and designated employees are encouraged to give
prior notification to the Company Secretary of any proposed
dealing in the Company’s securities and in any event must
advise the Company Secretary as soon as possible after a
trade has occurred.
The Board recognises that it is the individual responsibility of
each director and employee to ensure he or she complies
with the spirit and the letter of insider trading laws and that
notification to the Company Secretary in no way implies
approval of any transaction.
Diversity policyThe Company has developed a Diversity Policy which has
been approved by the Board. The Board is responsible for
the Diversity Policy, and maintains oversight to ensure its
objectives are met, with assistance from management.
The Company understands and recognises the value in having
a diverse workforce from which to draw on. It aims to ensure
that all its employees, regardless of gender, age, ethnicity or
cultural background have equal access to any opportunities in
the workplace, based on merit.

Annual Report 2014 7
Corporate Governance Statement (continued)
The Company’s objectives in relation to gender diversity are:
1. To recruit from a diverse range of people.
2. To ensure all employees have equal access opportunities
in the workplace.
3. To ensure there is equal pay for equal work.
4. To continue to build an environment that is accepting of a
diverse range of backgrounds and views.
Safeguard integrity in financial reportingStatement by Managing Director and Chief Financial
Officer
Prior to the Board’s adoption of the annual financial statements
of the Company, the Managing Director and Chief Financial
Officer certify in writing that:
i. The Company’s financial results present a true and fair
view, in all material respects, of the Company’s financial
condition and operational results and are in accordance
with applicable accounting standards.
ii. With regard to the financial records and systems of risk
management and internal compliance and control of the
Company: the financial records of the Company have
been properly maintained in accordance with Section 286
of the Corporations Act 2001;
iii. The statements made above regarding the integrity of the
financial statements are founded on a sound system of
risk management and internal compliance and control
which, in all material respects, implements the policies
adopted by the Board of Directors;
iv. The risk management and internal compliance and
control systems of the Company and consolidated entity
relating to financial reporting, compliance and operations
objectives are operating efficiently and effectively, in all
material respects, and
v. Subsequent to balance date, no changes or other matters
have arisen that would have a material effect on the
operation.
Audit Committee
As at the date of this report, the Audit Committee consists
of three non-executive directors, being Mr John Ingram, Mr
Nick Scali and Mr Greg Laurie (Chairman). The Chairman of
the Audit Committee must not be the Chairman of the Board.
Audit Committee meetings are held regularly throughout the
year. The Audit Committee operates under a Charter approved
by the Board. The Audit Committee’s responsibilities under the
Charter are to:
i. assist the Board to discharge fiduciary responsibilities
with regard to the Company’s accounting, control and
reporting practices by monitoring the internal control
environment and management over corporate assets;
ii. review and recommend to the Board the adoption of the
Company’s annual and half-yearly financial statements,
iii. review internal controls and any changes thereto approved
and submitted by the Company’s Chief Financial Officer;
iv. provide assurance regarding the quality and reliability of
financial information used by the Board;
v. review the Company’s risk management policies and
internal control processes;
vi. liaise with and review the performance of the external
auditor, who is invited to attend Audit Committee meetings
to report on audit findings and other financial and control
matters; and
vii. ensure that information systems, processes and
technology are reviewed periodically for future sustainability
and the adequacy of controls.
Four Audit Committee Meetings were held during the year
with the Managing Director and Chief Financial Officer also
attending. In addition to these meetings the Chairman of the
Audit Committee met periodically with management and the
external auditors.
Make timely and balanced disclosureThe Board is aware of its obligation under the Continuous
Disclosure requirements of the ASX Limited and the Company
maintains a written policy designed to ensure compliance with
its disclosure obligations. The Managing Director is responsible
for monitoring compliance with Continuous Disclosure,
assisted by the senior management team. All notices to
the ASX Limited are approved by the Board, or in some
circumstances by the Chairman, and other communication
from the Company can only be made by the Managing
Director or the Chief Financial Officer. Copies of presentation
material prepared for analysts are released immediately to the
ASX Limited.
Respect the rights of shareholdersAll employees of the Company are required to deal in an
ethical and responsible manner towards all stakeholders of the
Company. This includes shareholders and non shareholder
groups, such as customers and suppliers.
The Company recognises and respects the rights of
shareholders as indicated by the following:
– The Company uses the services of a reputable share
registry to deal with shareholder matters, including
dividend payments and general communication with
shareholders.
– The Company’s auditor is invited to attend the Annual
General Meeting in order to be available to answer
shareholder queries.
– As an accompaniment to the Annual Report and Half Year
Financial Report, the Company prepares and releases
to the market a Results Presentation which provides
additional information for shareholders.
– The Annual Report and announcements to the ASX
Limited are included on the Company’s website.

8
Corporate Governance Statement (continued)
Recognise and manage riskThe Audit Committee recommends to the Board the policy
and overall direction of risk management for the Company.
Responsibility for day to day management of risk rests with
Management. The Audit Committee reports to the Board in
relation to matters relevant to its responsibilities. During the
reporting period, the Audit Committee, and through it the
Board, received a number of reports on the operation and
effectiveness of the policies, processes and controls within the
Company.
The Company’s risk management approach is to identify
events or circumstances relevant to the Company’s objectives
(risks and opportunities), assess them in terms of likelihood
and magnitude of impact, determine a response strategy,
and monitor progress. Management is encouraged to view
the management and reporting of risk as a core component
of the planning and management practices of the Company,
undertaken on a continual basis.
The Board considers its approach to risk oversight and
management is appropriate for the Company, given its size
and business complexity, and seeks to continually improve the
Company’s management of risk.
Work, Health and Safety (WHS)An important focus for the Board is to ensure the safety and
wellbeing of all our employees.
The Company has a WHS committee, made up of
representatives from operations, stores, warehouse and
Head Office.
The WHS Committee meets regularly to oversee and manage
the WHS risk for the Company. During these meetings the
WHS Committee will report on, review and follow up any WHS
issues or incidents that occurred.
Remunerate fairly and responsiblyThe Company discloses the nature and amount of the fee
or salary of each director and each Executive Officer, in
accordance with the Corporations Act. For further details see
the section of the Directors’ Report entitled Remuneration of
Directors and named Key Management Personnel, included
within the Financial Report.
The Company’s executive remuneration packages are
currently based on a combination of fixed and performance
based remuneration. The performance measures are a
combination of financial results achieved by the Company and
the achievement of individual targets for each executive.
The Company has adopted an Executive Performance
Rights Plan. Subject to Board Approval, key executives
and other employees may be granted rights under the plan,
as recommended by the Managing Director. The exercise
of rights for conversion into Ordinary Shares is subject to a
performance hurdle. Subject to achieving that performance
hurdle, the relevant number of rights can be exercised
between the third and the fifth anniversary of their grant date.
Remuneration Committee
The Remuneration Committee currently consists of the non-
executive Board members Mr John Ingram (Chairman), Mr
Nick Scali and Mr Greg Laurie, and is responsible for:
i. Reviewing remuneration arrangements of senior
management, including the Managing Director.
ii. Reviewing and approving any discretionary component of
short and long term incentives for the Managing Director
and senior executives.
iii. Recommending to the Board any increase in the
remuneration of existing senior employees of the Company
for which Board approval is required.
iv. Recommending to the Board the remuneration of new
senior executives appointed by the Company, for approval
by the Board.
v. The setting of overall guidelines for Human Resources
policy, within which Senior Management determines
specific policies.
vi. Reviewing the performance of the Board and its sub.
committees.
The Committee has formally met two times in the last twelve
months. Discussion on matters relating to remuneration
and human resources in general also regularly take place at
meetings of the Board.

page title continued
Annual Report 2014 9
DirectorsYour directors submit their report for the year ended
30 June 2014.
The names and details of the Company’s Directors in office at
any time during the financial year or until the date of this report
are as follows. Directors were in office for this entire period
unless otherwise stated.
Non-Executive DirectorsJohn W Ingram, AM, FCPA,
Independent Non-Executive Chairman
Experience and expertise
John was appointed to the Board as non-executive Chairman
on 7 April 2004. John was formerly Managing Director of
Crane Group Limited.
Other Current Directorships
Independent Director of Australian Super
Former Directorships in the last three years
Non-Executive Director of United Group Limited, April 2003 to
November 2012.
Special Responsibilities
Member of the Audit Committee and the Remuneration
Committee.
Nick D Scali,
Non-Executive Director
Experience and expertise
Nick founded the business of Nick Scali over 50 years ago and
continues to act as a consultant to the Company. He was solely
responsible for managing the business until Anthony (his son)
joined in 1982. Nick is considered a pioneer and innovator in
the importing and retailing of furniture into Australia. Over the
years, he has served on a number of public company boards,
founded other enterprises, introduced modular kitchens into
the Australian market and in doing so founded a new industry,
and has made major contributions towards the Australian
Italian community, including serving as the President of the
Italian Chamber of Commerce for 4 years.
Other Current Directorships
Director of the Italian Chamber of Commerce
Former Directorships in the last three years
None
Special Responsibilities
Member of the Audit Committee and the Remuneration
Committee.
Greg R Laurie, BCom,
Independent Non-Executive Director
Experience and expertise
Greg was appointed to the Board on 7 April 2004. He has
extensive experience in manufacturing and distribution
industries, and was the Finance Director of Crane Group
Limited from 1989 until his retirement from that role in 2003.
Other Current Directorships
Independent Non-Executive Director of Bradken Limited and
Big River Group Pty Limited.
Former Directorships in the last three years
None
Special Responsibilities
Chairman of the Audit Committee and a member of the
Remuneration Committee.
Carole Molyneux,
Independent Non-Executive Director
Experience and expertise
Carole was appointed to the Board on 26 June 2014. She
has extensive experience in retail and was the Chief Executive
Officer of Suzanne Grae, (part of the Sussan Retail Group), for
eighteen years until 2013.
Other Current Directorships
Independent Non-Executive Director of Malcolm Webster
Holdings and White Ribbon Australia.
Former Directorships in the last three years
Independent Non-Executive Director of Paraquad NSW,
March 2006 to May 2013.
Special Responsibilities
None
Directors’ Report

10
Directors’ Report (continued)
Executive DirectorAnthony J Scali, BCom,
Managing Director
Experience and expertise
Anthony is Managing Director of Nick Scali Limited. He joined
the Company full-time in 1982 after completing his Bachelor
of Commerce degree from the University of New South Wales.
Anthony has over 30 years experience in retail, and the
selection and direct sourcing of product from manufacturers
both in Australia and overseas.
Other Current Directorships
None
Former Directorships in the last three years
None
Special Responsibilities
As Managing Director Anthony is responsible for the
development and implementation of the Company’s strategy
for growth, as well as the overall operation of the business.
Alternate DirectorNicky D Scali, BCom,
Marketing Manager and Alternate Director to Nick Scali
Experience and expertise
Nicky joined the Company in 1991 after completing a
Bachelor of Commerce degree from Bond University. He has
gained considerable experience and expertise throughout the
business over the years, in particular in relation to marketing,
retail operations and IT.
Other Current Directorships.
None
Former Directorships in the last three years
None
Special Responsibilities
Nicky is responsible for the buying of all advertising media and
the development and execution of all creative strategies. He
also is responsible for the national retail sales teams.
Company SecretaryGary K Jenkins, Bcom, CPA, AGIA,
Chief Financial Officer and Company Secretary.
Gary joined Nick Scali Limited as Chief Financial Officer and
Company Secretary in November 2013. He has over 25 years
experience in senior financial management positions within a
number of industries, including recent retail industry experience
with Bras N Things.
Interests in the Shares of the CompanyThe beneficial interest of each Director in the contributed
equity of the Company are as follows:
No. of Ordinary Shares
John W Ingram
– Non-Executive Chairman 370,399
Nick D Scali
– Non-Executive Director Nil
Greg R Laurie
– Non-Executive Director 30,000
Carole Molyneux
– Non-Executive Director Nil
Anthony J Scali
– Managing Director
Nicky D Scali
– Alternate Director
* Shares are held by Scali Consolidated Pty Limited, a Director-related entity of Messrs Anthony and Nicky Scali.
At the date of this report, no Directors held options over
ordinary shares.
Principal ActivitiesThe principal activities of the Company during the period were
the sourcing and retailing of household furniture and related
accessories. No significant change in the nature of these
activities occurred during the period.
Operating and Financial ReviewNick Scali Limited is a furniture retailer operating primarily
on the east coast of Australia. The Company operates two
brands; the Nick Scali brand with 34 stores and Sofas2Go
with 5 stores. The two brands operate under the same
infrastructure provided by the Company but are positioned
differently to capture somewhat different customers within the
furniture market, which is heavily fragmented.
Key profitability drivers are the ability to continue to grow sales
and market share through a store network with appropriate
reach and to manage the style, quality and cost of the furniture
to maintain margins.
For the financial year ended 30 June 2014 the Company
reported a record NPAT result of $14.2m, up 16.3% on the
previous year’s underlying NPAT. The strong profit resulted
from higher sales revenue of $141.4m, which was up 11.0%
on last year. The increase in sales revenue was generated
by new store openings and by strong comparable store
sales growth of 6.3%. These were assisted by focussed
marketing activity and careful selection of the product range
and price points.
Gross Margin remained solid at 60.4%, slightly lower than
last year of 60.8%, with retail price increases offsetting a
weaker AUD, price pressures from suppliers and increased
discounting flowing from the highly competitive market.
} 40,500,0 00*

Annual Report 2014 11
Directors’ Report (continued)
Operating expenses increased due to the opening of new
stores and inflationary pressures but as a percentage to sales
these expenses decreased from 46.4% last year to 45.3%,
reflecting the continued focus on managing costs in line with
sales growth.
Cash flow from operating activities during the year was
$22.4m, up 13.7% on the previous year. Net cash flow from
all activities was $9.5m. The increased cash flow was primarily
due to EBITDA growth which was partly offset by higher
investment in inventory.
The Company remains ungeared with debt of $6.8m and
cash reserves (including customer deposits) of $35.9m. It is
therefore soundly positioned for further investment initiatives,
including strategic property purchases in key locations to
position the business well for the future and act as a hedge
against leased property cost increases.
Net Assets were $40.1m as at 30 June 2014, up $3.8m on
last year.
Store network
During the year, the Company opened 2 new stores both of
which were Nick Scali stores. The stores were opened in Castle
Hill (NSW) and Taylors Lakes (VIC) with both perfoming within
expectations. The total number of stores at 30 June 2014 was
39, comprising 34 Nick Scali stores and 5 Sofas2Go stores.
The Company acquired a property at Caringbah (NSW)
after 30 June 2014 and plans to redevelop this site during
calendar 2015.
The Company has also secured a lease for a distribution
centre in Western Australia, along with two sites for stores in
Perth with operations expected to commence in that State in
the second half of FY15.
Directors believe that the Company has considerable room for
further expansion of its store network, with a number of sites
currently under negotiation for opening in the new financial
year in existing markets.
Outlook and Risks
The furniture market is closely tied to the housing market and
consumer confidence, and is largely dependent on these two
external factors. While the Company experienced pleasing
overall growth during FY14, monthly sales continue to remain
volatile and Directors continue to be cautious for the FY15
year. Continuing low interest rates and sustained housing
construction should result in favourable market conditions.
Any further decline in the AUD against the USD will bring a risk
of gross margin decline and this will continue to be addressed
through product range and price point management, which to
date has been successful. Directors expect sales and profit to
improve over the next few years as the Company continues to
expand its store network.
The Company has a strong balance sheet, supported by a
healthy cash position and minimal debt which will enable the
Company to support its growth strategy.
DividendsDividends paid to members during the year were as follows:
2014 2013
$’000 $’000
Dividends on ordinary shares:
Final franked dividend for 30 June 2013:
6.0 cents (2012: 3.5 cents) 4,860 2,835
Interim franked dividend for 30 June 2014:
6.0 cents (2013: 6.0 cents) 4,860 4,860
9,720 7,695
In addition to the above dividends, since the end of the financial
year the directors have declared a fully franked final dividend of
$5,670,000 (7.0 cents per fully paid ordinary share) to be paid
on 30 October 2014 out of retained profits at 30 June 2014.
Significant Changes in State of AffairsThere were no significant changes in the state of affairs of the
Company during the year.
Significant Events after Reporting DateNo matters or circumstances have arisen since the end of the
financial year which significantly affected or may significantly
affect the operations of the Company, the results of those
operations, or the state of affairs of the Company in future
financial years.
Likely Developments and Expected ResultsRefer to the Operating and Financial Review on page
10 and 11.
Environmental Regulation and PerformanceThe Company’s operations are not regulated by any significant
environmental regulation under a law of the Commonwealth or
of a State or Territory.
The Directors are not aware of any particular or significant
environmental issues which have been raised in relation to the
Company’s operations during the financial period.

12
Directors’ Report (continued)
Directors’ IndemnificationDuring the financial period, the Company has indemnified all
the Directors and Executive Officers against certain liabilities
incurred as such by a Director or Officer, while acting in that
capacity. The premiums have not been determined on an
individual Director or Officer basis. The Directors have not
included details of the nature of the liabilities covered or the
amount of the premium paid in respect of the Directors’ and
Officers’ liability insurance contract, as such disclosure is
prohibited under the terms of the contract.
No other agreement to indemnify Directors or Officers have
been entered into, nor have any payments in relation to
indemnification been made, during or since the end of the
financial period, by the Company.
Indemnification of AuditorsTo the extent permitted by law, the Company has agreed to
indemnify its auditors, Ernst & Young, as part of the terms of
audit engagement agreement against claims by third parties
arising from the audit (for an unspecified amount) – except for
any loss in respect of any matters which are finally determined
to have resulted from Ernst & Young’s negligent, wrongful
or wilful acts or omissions. No payment has been made to
indemnify Ernst & Young during or since the financial year.
Directors’ and other Officers’ EmolumentsThe Company discloses the nature and amount of the fee
or salary of each Director and each Executive Officer, in
accordance with the Corporations Act.
Remuneration Report – AuditedThis report outlines the remuneration arrangements in place
for Directors and Executives of the Company.
Remuneration Philosophy
The quality of Nick Scali Limited’s Directors and Executives
is a major factor in the overall performance of the Company.
The Company believes it is essential to attract and retain
high quality and committed employees. To this end,
the Company embraces the following principles in its
remuneration framework.
Executive Remuneration
The Company should provide appropriate rewards to attract
and retain key personnel. Base salaries and short term
incentives should be determined at the discretion of the
Remuneration Committee having regard to the nature of
each role, the experience of the individual employee and the
performance of the individual. Market information should be
used to benchmark base salaries.
For executives who report directly to the Managing Director, a
portion of the remuneration should be at risk by way of short
term incentives.
The Company has adopted an Executive Performance Rights
Plan. Key executives and other employees may be granted
rights under the Plan, as recommended by the Managing
Director and approved by the Board.
Non-Executive Directors Remuneration
Non-Executive Directors are paid an annual fee, which is
periodically reviewed. The review is the responsibility of the
Remuneration Committee. The Committee may seek advice
from external parties in making a determination.
Non-Executive Directors do not receive bonuses and they are
not entitled to participate in the Executive Performance Rights
Plan.
Remuneration Committee
The Remuneration Committee currently consists of the Non-
Executive Board members and is responsible for:
i. Reviewing remuneration arrangements of senior
management, including the Managing Director.
ii. Reviewing and approving any discretionary component of
short and long term incentives for the Managing Director
and senior executives.
iii. Recommending to the Board any increase in the
remuneration of existing senior employees of the
Company for which Board approval is required.
iv. Recommending to the Board the remuneration of new
senior executives appointed by the Company.
v. The setting of overall guidelines for Human Resources
policy, within which Senior Management determines
specific policies.
vi. Reviewing the performance of the Board and its
sub-committees, with the advice of external parties if
appropriate.
The Committee has met two times in the last twelve months.
In addition, matters for consideration by the Committee
have been dealt with during various Board meetings, where
Remuneration Committee members were in attendance.
The Managing Director and Marketing Manager have a
minimum termination notice period of six months.
The Chief Financial Officer has a minimum termination notice
period of 3 months.
No such employment contracts exist for the Non-Executive
Directors.
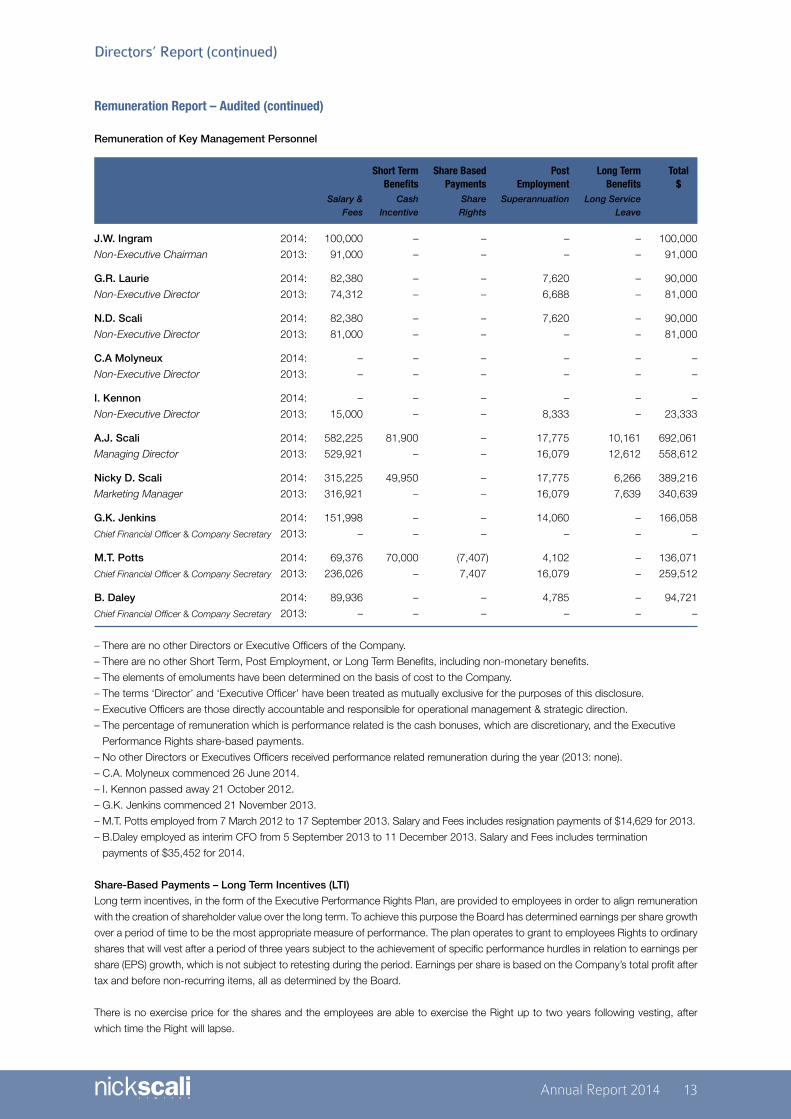
Annual Report 2014 13
Directors’ Report (continued)
Remuneration Report – Audited (continued)
Remuneration of Key Management Personnel
Short Term Share Based Post Long Term Total Benefits Payments Employment Benefits $ Salary & Cash Share Superannuation Long Service Fees Incentive Rights Leave
J.W. Ingram 2014: 100,000 – – – – 100,000
Non-Executive Chairman 2013: 91,000 – – – – 91,000
G.R. Laurie 2014: 82,380 – – 7,620 – 90,000
Non-Executive Director 2013: 74,312 – – 6,688 – 81,000
N.D. Scali 2014: 82,380 – – 7,620 – 90,000
Non-Executive Director 2013: 81,000 – – – – 81,000
C.A Molyneux 2014: – – – – – –
Non-Executive Director 2013: – – – – – –
I. Kennon 2014: – – – – – –
Non-Executive Director 2013: 15,000 – – 8,333 – 23,333
A.J. Scali 2014: 582,225 81,900 – 17,775 10,161 692,061
Managing Director 2013: 529,921 – – 16,079 12,612 558,612
Nicky D. Scali 2014: 315,225 49,950 – 17,775 6,266 389,216
Marketing Manager 2013: 316,921 – – 16,079 7,639 340,639
G.K. Jenkins 2014: 151,998 – – 14,060 – 166,058
Chief Financial Officer & Company Secretary 2013: – – – – – –
M.T. Potts 2014: 69,376 70,000 (7,407) 4,102 – 136,071
Chief Financial Officer & Company Secretary 2013: 236,026 – 7,407 16,079 – 259,512
B. Daley 2014: 89,936 – – 4,785 – 94,721
Chief Financial Officer & Company Secretary 2013: – – – – – –
– There are no other Directors or Executive Officers of the Company.
– There are no other Short Term, Post Employment, or Long Term Benefits, including non-monetary benefits.
– The elements of emoluments have been determined on the basis of cost to the Company.
– The terms ‘Director’ and ‘Executive Officer’ have been treated as mutually exclusive for the purposes of this disclosure.
– Executive Officers are those directly accountable and responsible for operational management & strategic direction.
– The percentage of remuneration which is performance related is the cash bonuses, which are discretionary, and the Executive
Performance Rights share-based payments.
– No other Directors or Executives Officers received performance related remuneration during the year (2013: none).
– C.A. Molyneux commenced 26 June 2014.
– I. Kennon passed away 21 October 2012.
– G.K. Jenkins commenced 21 November 2013.
– M.T. Potts employed from 7 March 2012 to 17 September 2013. Salary and Fees includes resignation payments of $14,629 for 2013.
– B.Daley employed as interim CFO from 5 September 2013 to 11 December 2013. Salary and Fees includes termination
payments of $35,452 for 2014.
Share-Based Payments – Long Term Incentives (LTI)
Long term incentives, in the form of the Executive Performance Rights Plan, are provided to employees in order to align remuneration
with the creation of shareholder value over the long term. To achieve this purpose the Board has determined earnings per share growth
over a period of time to be the most appropriate measure of performance. The plan operates to grant to employees Rights to ordinary
shares that will vest after a period of three years subject to the achievement of specific performance hurdles in relation to earnings per
share (EPS) growth, which is not subject to retesting during the period. Earnings per share is based on the Company’s total profit after
tax and before non-recurring items, all as determined by the Board.
There is no exercise price for the shares and the employees are able to exercise the Right up to two years following vesting, after
which time the Right will lapse.

14
Remuneration Report – Audited (continued)Share-Based Payments – Long Term Incentives (LTI) continued
The following table summarises the number and value of Rights granted, exercised or lapsed to Directors and named Executives
during the year.
Value of Rights Value of Rights Value of Rights Remuneration consisting granted (i) exercised forfeited of Rights $ $ $ %
Michael Potts – – (24,029) 3%
(i) The value of Rights granted during the period is recognised in remuneration expense over the vesting period of the Right.
The number of Rights on issue to Directors and named Executives as at the reporting date were as follows:
Balance at Rights Rights Rights Balance at Balance vested Vested during 1 July 2013 granted exercised forteited 30 June 2014 30 June 2014 the year No. No. No. No. No. No. No.
Michael Potts 38,462 – – (38,462) – – –
No Rights were granted during the year to Directors and named Executives.
Performance conditions in relation to Rights:
Company’s average percentage
compound EPS growth per annum Percentage of Rights Exercisable
Below 5% pa compound Nil
5% pa compound 50% of Rights exercisable
10% pa compound and above 100% of Rights exercisable
Greater than 5% pa compound and less Calculated on a pro rata basis between 50% and 100%
than 10% pa compound depending on Company’s EPS performance
Company’s EPS growth over the previous five financial years:
2010 2011 2012 2013 2014
Earnings per share growth 134% 3% -22% 35% 17%
MeetingsThe number of meetings of Directors (including meetings of committees of Directors) held during the year and the number of meetings
attended by each Director (including when represented by an alternate) were as follows:
Directors’ Meetings Meetings of Committees
Audit Remuneration
Number of meetings held: 10 4 2
Number of meetings attended:
J.W. Ingram 10 4 2
G.R. Laurie 10 4 2
N.D. Scali 7 3 –
C.A. Molyneux 1 1 n/a n/a
A.J. Scali 2 10 4 2
Nicky D. Scali 3 9 n/a n/a
1. C.A. Molyneux was appointed as a Non-Executive Director on 26th June 2014.
2. Mr A J Scali is not a member of the sub-committees, but was invited to attend these meetings and his attendance recorded.
3. Mr Nicky D Scali is an alternate Director and is not a member of the sub-committees.
Directors’ Report (continued)

Annual Report 2014 15
Audit Committee Remuneration Committee
The members of this The members of this
Committee are as follows: Committee are as follows:
Greg Laurie (Chairman) John Ingram (Chairman)
John Ingram Greg Laurie
Nick Scali Nick Scali
RoundingThe amounts contained in this report and in the financial report
have been rounded to the nearest $1,000 (where rounding is
applicable) under the option available to the Company under
ASIC Class Order 98/0100. The Company is an entity to which
the Class order applies.
Auditor’s Independence DeclarationThe Directors received the declaration from the auditor of
Nick Scali Limited and is included on page 45 of the Financial
Statements.
Non-Audit ServicesThere were no non-audit services provided by the Company’s
auditor, Ernst & Young during the year.
Signed in accordance with a resolution of the Board of Directors.
J.W. Ingram A.J. Scali
Chairman Managing Director
Sydney, 13 August 2014
Directors’ Report (continued)

16
Statement of Incomefor the year ended 30 June 2014
2014 2013 Notes $’000 $’000
Revenue from sale of goods 2 141,442 127,431
Cost of goods sold (56,019) (49,925)
Gross Profit 85,423 77,506
Other income 2 1,284 6,430
Marketing expenses (12,543) (11,404)
Employment expenses (22,297) (20,431)
General & Administration expenses (5,576) (4,826)
Property expenses (23,046) (21,812)
Distribution expenses (639) (612)
Depreciation and Amortisation (1,947) (1,734)
Finance Cost (301) (252)
Profit before Income Tax 20,358 22,865
Income Tax Expense 4 (6,122) (6,863)
Net Profit after Tax for the Year 14,236 16,002
Basic Earnings Per Share (cents per share) 7 17.6 cents 19.8 cents
Diluted Earnings Per Share (cents per share) 7 17.6 cents 19.8 cents
The above statement of income should be read in conjunction with the accompanying notes.

Annual Report 2014 17
Statement of Comprehensive Incomefor the year ended 30 June 2014
2014 2013 Notes $’000 $’000
Net profit after tax for the year 14,236 16,002
Other comprehensive income
Items that may be reclassified subsequently to profit or loss
Cash flow hedges gain/(loss) taken to equity (723) 661
Other comprehensive income/(loss) for the year (723) 661
Total Comprehensive Income for the year 13,513 16,663
The above statement of comprehensive income should be read in conjunction with the accompanying notes.
18
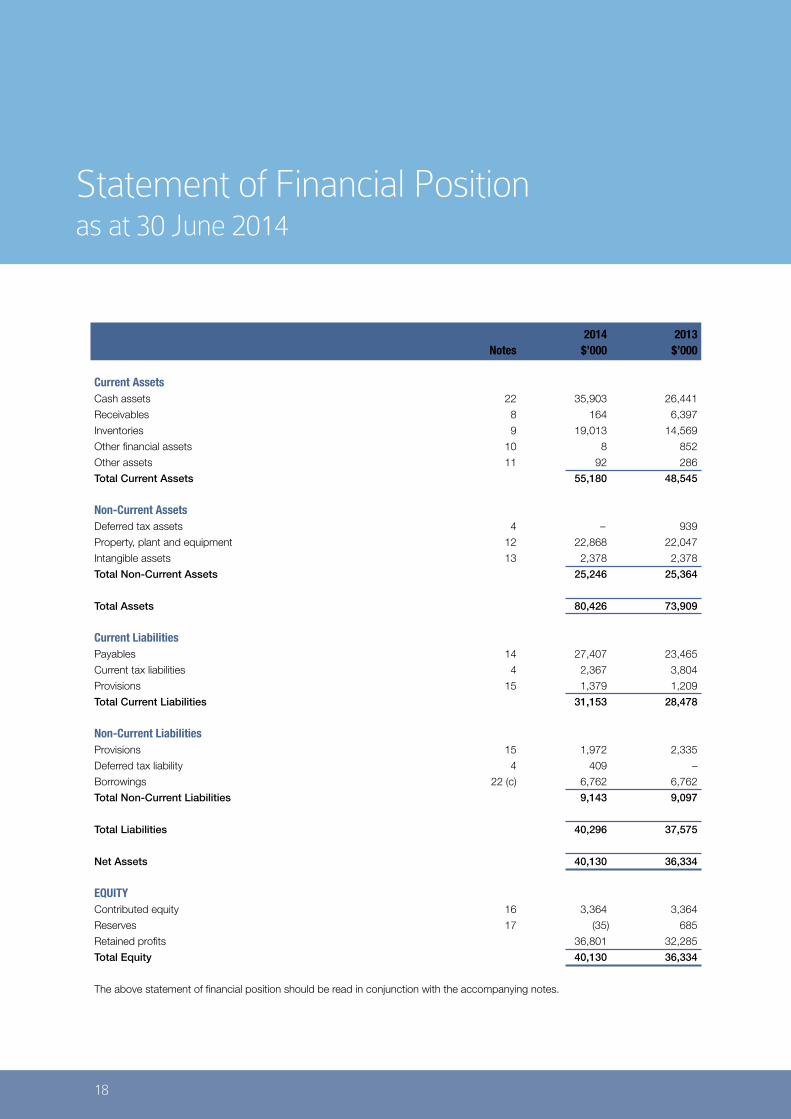
Statement of Financial Positionas at 30 June 2014
2014 2013 Notes $’000 $’000
Current AssetsCash assets 22 35,903 26,441
Receivables 8 164 6,397
Inventories 9 19,013 14,569
Other financial assets 10 8 852
Other assets 11 92 286
Total Current Assets 55,180 48,545
Non-Current AssetsDeferred tax assets 4 – 939
Property, plant and equipment 12 22,868 22,047
Intangible assets 13 2,378 2,378
Total Non-Current Assets 25,246 25,364
Total Assets 80,426 73,909
Current LiabilitiesPayables 14 27,407 23,465
Current tax liabilities 4 2,367 3,804
Provisions 15 1,379 1,209
Total Current Liabilities 31,153 28,478
Non-Current LiabilitiesProvisions 15 1,972 2,335
Deferred tax liability 4 409 –
Borrowings 22 (c) 6,762 6,762
Total Non-Current Liabilities 9,143 9,097
Total Liabilities 40,296 37,575
Net Assets 40,130 36,334
EQUITYContributed equity 16 3,364 3,364
Reserves 17 (35) 685
Retained profits 36,801 32,285
Total Equity 40,130 36,334
The above statement of financial position should be read in conjunction with the accompanying notes.

Annual Report 2014 19
Statement of Changes in Equityfor the year ended 30 June 2014
Equity Capital Cash flow Contributed benefits profits hedge Retained equity reserve reserve reserve profits Total Notes $’000 $’000 $’000 $’000 $’000 $’000
Year Ended 30 June 2014
As at 1 July 2013 3,364 13 78 594 32,285 36,334
Profit for the period – – – – 14,236 14,236
Other comprehensive loss – – – (723) – (723)
Total comprehensive income – – – (723) 14,236 13,513
Share-based payment – 3 – – – 3
Equity dividends 5 – – – – (9,720) (9,720)
As at 30 June 2014 16/17 3,364 16 78 (129) 36,801 40,130
Year Ended 30 June 2013
As at 1 July 2012 3,364 – 78 (67) 23,978 27,353
Profit for the period – – – – 16,002 16,002
Other comprehensive income – – – 661 – 661
Total comprehensive income – – – 661 16,002 16,663
Share-based payment – 13 – – – 13
Equity dividends 5 – – – – (7,695) (7,695)
As at 30 June 2013 16/17 3,364 13 78 594 32,285 36,334
The above statement of changes in equity should be read in conjunction with the accompanying notes.

20
Statement of Cash Flowsfor the year ended 30 June 2014
2014 2013 Notes $’000 $’000
Cash Flows from Operating ActivitiesReceipts from customers 166,298 135,762
Payments to suppliers and employees (139,104) (112,338)
Interest received 1,124 992
Income tax paid (5,902) (4,713)
Net Cash Flows from Operating Activities 22 (a) 22,416 19,703
Cash Flows from Investing ActivitiesPurchase of property, plant & equipment (2,933) (9,268)
Net Cash Flows (Used) in Investing Activities (2,933) (9,268)
Cash Flows from Financing ActivitiesPayment of dividends on ordinary shares 5 (9,720) (7,695)
Proceeds from borrowings – 3,262
Interest paid (301) (252)
Net Cash (Used) in Financing Activities (10,021) (4,685)
Net Increase in Cash Held 9,462 5,750
Add opening cash brought forward 26,441 20,691
Closing cash carried forward 22 (b) 35,903 26,441
The above statement of cash flows should be read in conjunction with the accompanying notes.

Annual Report 2014 21
Notes to the Financial Statementsfor the year ended 30 June 2014
(a) Basis of preparationThe financial report is a general purpose financial report, for a
for profit entity, which has been prepared in accordance with
the requirements of the Corporations Act 2001 and Australian
Accounting Standards. The financial report was authorised
for issue in accordance with a resolution of the Directors on
13 August 2014.
The financial report has also been prepared on a historical cost
basis, except for derivative financial instruments, which have
been measured at fair value.
The financial report is presented in Australian dollars and all
values are rounded to the nearest thousand dollars ($’000)
unless otherwise stated, under the option available to the
Company under ASIC Class Order 98/0100. The Company is
an entity to which the Class Order applies.
(b) Statement of complianceThe financial report complies with Australian Accounting
Standards. The financial report also complies with International
Financial Reporting Standards as issued by the International
Accounting Standards Board.
(c) Property, plant and equipmentAll classes of property, plant and equipment are measured at
cost, less accumulated depreciation and any impairment in
value. Depreciation is provided on a straight line basis on all
property, plant and equipment.
Major depreciation periods are:
2014 2013
Buildings 20-40 yrs 20-40 yrs
Office equipment 3-12 yrs 3-12 yrs
Furniture and fittings 3-15 yrs 3-15 yrs
Leasehold & building improvements 5-15 yrs 5-15 yrs
Motor vehicles 6 yrs 6 yrs
Leasehold improvements are depreciated at the shorter
of the depreciation period or the term of the lease. Land is
not depreciated.
The asset’s residual values, useful lives and depreciation
methods are reviewed and adjusted if appropriate at each
reporting date.
Impairment
The carrying values of property, plant & equipment are reviewed
for impairment when events or changes in circumstances
indicate the carrying value may not be recoverable. For an
asset that does not generate largely independent cash inflows,
the recoverable amount is determined for the cash-generating
unit to which it belongs. If any such indication exists and where
the carrying values exceed the estimated recoverable amount,
the assets or cash-generating units are written down to their
recoverable amount.
The recoverable amount of property, plant and equipment is
the greater of fair value less costs to sell and value in use. In
assessing value in use, the estimated future cash flows are
discounted to their present value using a pre-tax discount rate
that reflects current market assessments of the time value of
money and the risks specific to the asset.
Derecognition and disposal
An item of property, plant and equipment is derecognised
upon disposal or when no further future economic benefits are
expected from its use. Any gain or loss arising on derecognition
of the asset (calculated as the difference between the net
disposal proceeds and the carrying amount of the asset) is
included in the statement of income in the year the asset is
derecognised.
(d) LeasesLeases are classified at their inception as either operating
or finance leases based on the economic substance of
the agreement so as to reflect the risks and benefits incidental
to ownership.
Operating leases
Leases where the Lessor retains substantially all the risks and
benefits of ownership of the asset are classified as operating
leases. Operating leases are recognised as an expense in
the statement of income on a straight-line basis over the
lease term.
Note 1: Statement of Significant Accounting Policies

22
Notes to Financial Statements for year ended 30 June 2014 (continued)
The Company has received financial incentive contributions
from the lessor’s on certain stores. On receipt, these incentive
contributions are recorded as a liability in the financial
statements. The liability is reduced and amortised over the
lease term.
(e) InventoriesInventories are valued at the lower of cost and net realisable
value. Weighted average cost is used to value inventories.
Costs incurred in bringing each product to its present location
and condition are accounted for as follows:
Finished Goods: Purchase price plus freight, cartage and
import duties are included in the cost of finished goods. Net
realisable value is the estimated selling price in the ordinary
course of business, less estimated costs necessary to make
the sale.
(f) Employee entitlementsWages, salaries and annual leave
Liabilities for wages and salaries, including non-monetary
benefits of annual leave are recognised in other payables in
respect of employees’ services up to the reporting date. They
are measured at the amounts expected to be paid when the
liabilities are settled.
Long service leave
The liability for long service leave is recognised in the provision
for employee benefits and measured as the present value of
expected future payments to be made in respect of services
provided by employees up to the reporting date. Consideration
is given to expected future wage and salary levels, experience
of employee departures, and periods of service. Expected
future payments are discounted using market yields at the
reporting date on national government bonds with terms to
maturity and currencies that match, as closely as possible, the
estimated future cash outflows.
Share-based payments
The Company provides benefits to employees in the form of
share-based payments through its Executive Performance
Rights Plan. These equity settled share-based payments are
measured at the fair value of the Rights at grant date. Fair
value is determined by valuation. The fair value is expensed
on a straight line basis over the vesting period, with a
corresponding increase in equity, based on the Company’s
estimate of the number of shares that will eventually vest
giving consideration to the likelihood of employee turnover and
likelihood of non-market performance conditions being met.
At each reporting date the Company revises its estimate of
the number of Rights expected to vest. The impact of the
revision of the original estimates, if any, is recognised in profit
or loss over the remaining vesting period, along with the
reversal of any previous charges relating to Rights which may
have lapsed.
(g) Cash and cash equivalentsCash and short-term deposits in the statement of financial
position comprise cash at bank and in hand and short-term
deposits with an original maturity of six months or less.
For the purposes of the statement of cash flows, cash and
equivalents consist of cash and cash equivalents as defined
above, net of outstanding bank overdrafts.
(h) Foreign currency translationBoth the functional and presentation currency of the Company
is Australian dollars ($). Items included in the financial report
of the Company are measured using that functional currency.
Transactions in foreign currencies are initially recorded in the
functional currency by applying the exchange rates ruling at
the date of the transaction or at the hedged rate if qualifying
financial instruments have been used to reduce exposure.
Monetary assets and liabilities denominated in foreign
currencies are retranslated at the rate of exchange ruling at
the reporting date or hedged rates.
All exchange differences are recognised in the statement
of income, except when deferred in equity as qualifying cash
flow hedges.
(i) Derivative financial instrumentsThe Company enters into a variety of derivative financial
instruments to manage its exposure to foreign exchange rate
risk including forward foreign exchange contracts and options.
Derivatives are initially recognised at fair value on the date
a derivative contract is entered into and are subsequently
remeasured to their fair value at each reporting date.
Recognition of the resulting gain or loss depends on whether
the derivative is designated as a hedging instrument and the
nature of the item being hedged. As appropriate, the Company
designates derivatives as either hedges of the fair value of
recognised assets or liabilities of firm commitments (fair value
hedges) or hedges of highly probable forecast transactions
(cash flow hedges).
Cash flow hedge
The effective portion of changes in the fair value of derivatives
that are designated and qualify as cash flow hedges is
recognised in equity. The gain or loss relating to the ineffective
portion is recognised immediately in the statement of income.
Amounts accumulated in equity are recycled in the statement
of income in the periods when the hedged item will affect profit
or loss (for instance when the forecast sale that is hedged
takes place). However, when the forecast transaction that is
hedged results in the recognition of a non-financial asset (for
example, inventory) or a non-financial liability, the gains and
losses previously deferred in equity are transferred from equity
and included in the initial measurement of the asset or liability.
Note 1: Statement of Significant Accounting Policies (continued)

Annual Report 2014 23
Notes to Financial Statements for year ended 30 June 2014 (continued)
The Company tests each of the designated cash flow hedges
for effectiveness at each reporting date, prospectively and
retrospectively. Prospectively hedge effectiveness is assessed
using a Matched Terms approach. Where there is a change
in the terms of the forecast transaction or forward foreign
exchange contract, prospective effectiveness cannot be
assessed using the Matched Terms approach. As such, the
hedge is demonstrated to be effective using the Hypothetical
Derivative method where effectiveness is measured by
comparing the changes in the present value of the cash
flow arising from the hedged forecast transaction at the
forward rate, with the changes in the fair value of the forward
contract or hypothetical hedging instrument. Retrospective
effectiveness is tested using the Hypothetical Derivative
method. Effectiveness is measured on a cumulative dollar
offset basis whereby the changes in the present value of the
cash outflows arising from the forecast transaction at the
forward rate are compared with changes in the fair value of
the forward foreign exchange contract.
When a hedging instrument expires, is sold or terminated,
or when a hedge no longer meets the hedge accounting
criteria, any cumulative gain or loss existing in equity at that
time remains in equity and is recognised in the statement of
income when the forecast transaction is ultimately recognised
in the statement of income. When a forecast transaction is no
longer expected to occur, the cumulative gain or loss that was
deferred in equity is immediately transferred to the statement
of income.
(j) Revenue recognitionRevenue is recognised to the extent that it is probable that the
economic benefits will flow to the Company and the revenue
can be reliably measured. The following specific recognition
criteria must also be met before revenue is recognised.
Sale of goods
Revenue is recognised when the significant risks and rewards
of ownership of the goods have passed to the buyer and the
costs incurred or to be incurred in respect of the transaction
can be measured reliably. Risks and rewards are considered
passed to the buyer at the time of delivery of the goods to
the customer. Revenue recognised equals the fair value of the
consideration received or receivable.
Interest income
Revenue is recognised as interest accrues, using the effective
interest method. This is a method of calculating the amortised
cost of a financial asset and allocating the interest income over
the relevant period using the effective interest rate, which is
the rate that exactly discounts estimated future cash receipts
through the expected life of the financial asset to the net
carrying amount of the financial asset.
(k) Trade and other receivablesTrade receivables are recognised and carried at original invoice
amount less an allowance for any uncollectible amounts. An
allowance for doubtful debts is made when there is objective
evidence that the Company will not be able to collect the
debts. Bad debts are written off when identified.
(l) Trade and other payablesTrade and other payables are carried at amortised cost and
due to their short term nature they are not discounted. They
represent liabilities for goods and services provided to the
Company prior to the end of the financial year that are unpaid
and arise when the Company becomes obliged to make
future payments in respect of the purchase of these goods
and services. The amounts are unsecured and are usually paid
within 30 days of recognition.
(m) ProvisionsProvisions are recognised when the Company has a present
obligation (legal or constructive) as a result of a past event, it
is probable that an outflow of resources embodying economic
benefits will be required to settle the obligation and a reliable
estimate can be made of the amount of the obligation.
When the Company expects some or all of a provision to be
reimbursed, for example under an insurance contract, the
reimbursement is recognised as a separate asset but only
when the reimbursement is virtually certain. The expense
relating to any provision is presented in the income statement
net of any reimbursement.
If the effect of the time value of money is material, provisions
are discounted using a current pre-tax rate, that reflects
the risks specific to the liability. When discounting is used,
the increase in the provision due to the passage of time is
recognised as a borrowing cost.
Make good provision
A provision has been made for the present value of anticipated
costs of future restoration of leased premises. The provision
includes future cost estimates associated with restoring the
premises to it’s condition at the time the Company initially
leased the premises, subject to fair wear and tear.
The calculation of this provision requires assumptions such
as cost estimates and an assessment of the likelihood the
Company will continue to lease the premises at the end of the
current lease. These uncertainties may result in future actual
expenditure differing from the amounts currently provided. The
provision recognised for each site is periodically reviewed and
updated based on the facts and circumstances available at
the time. Changes to the estimated future costs for sites are
recognised in the statement of financial position by adjusting
the expense or asset (if applicable) and provision.
Note 1: Statement of Significant Accounting Policies (continued)
24
Notes to Financial Statements for year ended 30 June 2014 (continued)
(n) Contributed equityOrdinary share capital is recognised at the fair value of the
consideration received by the company. Any transaction cost
arising on the issue of ordinary shares are recognised directly
in equity as a reduction of the share proceeds received, net
of tax.
(o) Earnings per shareBasic earnings per share (EPS) is calculated as net profit
attributable to members, adjusted to exclude costs of servicing
equity (other than dividends), divided by the weighted average
number of ordinary shares, adjusted for any bonus element.
Diluted EPS is calculated as net profit attributable to members,
adjusted for:
– costs of servicing equity (other than dividends);
– the after tax effect of dividends and interest associated
with dilutive potential ordinary shares that have been
recognised as expenses; and
– other non-discretionary changes in revenues or expenses
during the period that would result from the dilution of
potential ordinary shares; divided by the weighted average
number of ordinary shares and dilutive potential ordinary
shares, adjusted for any bonus element.
(p) IntangiblesGoodwill
Goodwill on acquisition is initially measured at cost being
the excess of the cost of the business combination over the
acquirer’s interest in the net fair value of the identifiable assets,
liabilities and contingent liabilities. Following initial recognition,
goodwill is measured at cost less any accumulated impairment
losses. Goodwill is not amortised.
Goodwill is reviewed for impairment at each reporting date,
or more frequently if events or changes in circumstances
indicate that the carrying value may be impaired. Impairment
is determined by assessing the recoverable amount of the
cash-generating unit to which the goodwill relates. When the
recoverable amount of the cash-generating unit is less than the
carrying amount, an impairment loss is recognised. Impairment
losses recognised for goodwill are not subsequently reversed.
For the purpose of impairment testing, goodwill acquired in a
business combination is, from the acquisition date, allocated
to cash-generating units that are expected to benefit from
the synergies of the combination. Each unit to which the
goodwill is so allocated represents the lowest level within
the Company at which the goodwill is monitored for internal
management purposes.
When goodwill forms part of a cash-generating unit and
an operation within that unit is disposed of, the goodwill
associated with the operation disposed of is included in the
carrying amount of the operation when determining the gain
or loss on disposal of the operation. Goodwill disposed of in
this manner is measured based on the relative values of the
operation disposed of and the portion of the cash-generating
unit retained.
(q) Income taxCurrent tax assets and liabilities for the current and prior
periods are measured at the amount expected to be recovered
from or paid to the taxation authorities. The tax rates and tax
laws used to compute the amount are those that are enacted
or substantively enacted by the reporting date.
Deferred income tax is provided on all temporary differences
at the reporting date between the tax bases of assets and
liabilities and their carrying amounts for financial reporting
purposes. Deferred income tax liabilities are recognised for all
taxable temporary differences except:
– when the deferred income tax liability arises from the
initial recognition of an asset or liability in a transaction
that is not a business combination and, at the time of
the transaction, affects neither the accounting profit nor
taxable profit or loss; or
– when the taxable temporary differences associated with
investments in subsidiaries, associates and interests in
joint ventures, except where the timing of the reversal
of the temporary differences can be controlled and it is
probable that the temporary differences will not reverse in
the foreseeable future.
Deferred income tax assets are recognised for all deductible
temporary differences, carry-forward of unused tax assets and
unused tax losses, to the extent that it is probable that taxable
profit will be available against which the deductible temporary
differences, and the carry-forward of unused tax assets and
unused tax losses can be utilised, except:
– when the deferred income tax asset relating to the
deductible temporary difference arises from the initial
recognition of an asset or liability in a transaction that
is not a business combination and, at the time of the
transaction, affects neither the accounting profit nor
taxable profit or loss; or
– when the deductible temporary differences associated
with investments in subsidiaries, associates and interests
in joint ventures, deferred tax assets are only recognised to
the extent that it is probable that the temporary differences
will reverse in the foreseeable future and taxable profit will
be available against which the temporary differences can
be utilised.
The carrying amount of deferred income tax assets is reviewed
at each reporting date and reduced to the extent that it is no
longer probable that sufficient taxable profit will be available to
allow all or part of the deferred income tax asset to be utilised.
Unrecognised deferred income tax assets are reassessed at
each reporting date and are recognised to the extent that it
has become probable that future taxable profit will allow the
deferred tax asset to be recovered.
Note 1: Statement of Significant Accounting Policies (continued)

Annual Report 2014 25
Notes to Financial Statements for year ended 30 June 2014 (continued)
Deferred income tax, assets and liabilities are measured at the
tax rates that are expected to apply to the year when the asset
is realised or the liability is settled, based on tax rates (and tax
laws) that have been enacted or substantively enacted at the
reporting date.
Income taxes relating to items recognised directly in equity
are recognised in equity and not in profit or loss. Deferred
tax assets and deferred tax liabilities are offset only if a
legally enforceable right exists to set off current tax assets
against current tax liabilities and the deferred tax assets and
liabilities relate to the same taxable entity and the same
taxation authority.
(r) Other taxesRevenues, expenses and assets are recognised net of the
amount of GST except:
– when the GST incurred on a purchase of goods and
services is not recoverable from the taxation authority, in
which case the GST is recognised as part of the cost of
acquisition of the asset or as part of the expense item as
applicable; and
– receivables and payables, which are stated with the
amount of GST included.
The net amount of GST recoverable from, or payable to, the
taxation authority is included as part of receivables or payables
in the statement of financial position.
Cash flows are included in the statement of cash flows on
a gross basis and the GST component of cash flows arising
from investing and financing activities, which is recoverable
from, or payable to the taxation authority are classified as
operating cash flows.
Commitments and contingencies are disclosed net of
the amount of GST recoverable from, or payable to, the
taxation authority.
(s) Interest-bearing loans and borrowingsAll loans and borrowings are initially recognised at the
fair value of the consideration received less directly
attributable transaction costs.
After initial recognition, interest-bearing loans and borrowings
are subsequently measured at amortised cost using the
effective interest method. Fees paid on the establishment of
loan facilities that are yield related are included as part of the
carrying amount of the loans and borrowings.
Borrowings are classified as current liabilities unless the
Company has an unconditional right to defer settlement of the
liability for a least 12 months after the reporting date.
Borrowing costs are recognised as an expense when
incurred, unless they are directly attributable to the acquisition,
construction or production of a qualifying asset whereby they
are capitalised.
(t) Significant accounting judgements, estimates and assumptions
Significant accounting judgements
In the process of applying the Company’s accounting policies,
management has made the following judgements, apart from
those involving estimations, which have the most significant
effect on the amounts recognised in the financial statements:
Operating Lease Commitments
The Company has entered into commercial property leases
for its stores. The Company has determined that the
lessors retain all the significant risks and rewards of ownership
of these properties and has thus classified the leases as
operating leases.
Significant accounting estimates and assumptions
The carrying amounts of certain assets and liabilities are often
determined based on estimates and assumptions of future
events. The key estimates and assumptions that have a
significant risk of causing a material adjustment to the carrying
amounts of certain assets and liabilities within the next annual
reporting period are:
Impairment of goodwill
The Company determines whether goodwill is impaired at
least on an annual basis. This requires an estimation of the
recoverable amount of the cash-generating unit to which the
goodwill is allocated. The assumptions used in this estimation
of recoverable amount and the carrying amount of goodwill is
discussed in the financial report.
Estimation of useful lives of assets
The estimation of the useful lives of assets has been based on
historical experience as well as consideration of lease terms
(for assets used in or affixed to leased premises) and turnover
policies (for motor vehicles). In addition, the condition of the
assets is assessed at least once per year and considered
against the remaining useful life. Adjustments to useful lives
are made when considered necessary.
(u) Impairment of financial assetsThe Company assesses at each reporting date whether there
is an indication that an asset may be impaired. If any such
indication exists, or when annual impairment testing for an
asset is required, the Company makes an estimate of the
asset’s recoverable amount. An asset’s recoverable amount
is the higher of its fair value less costs to sell and its value in
use and is determined for an individual asset, unless the asset
does not generate cash inflows that are largely independent of
those from other assets or groups of assets and the asset’s
value in use cannot be estimated to be close to its fair value.
Note 1: Statement of Significant Accounting Policies (continued)

26
Notes to Financial Statements for year ended 30 June 2014 (continued)
In such cases the asset is tested for impairment as part of the
cash generating unit to which it belongs.
When the carrying amount of an asset or cash generating
unit exceeds its recoverable amount the asset or cash
generating unit is considered impaired and is written down to
its recoverable amount.
In assessing value in use, the estimated future cash flows are
discounted to their present value using a pre-tax discount
rate that reflects current market assessments of the time
value of money and the risks specific to the asset. Impairment
losses relating to continuing operations are recognised in
those expense categories consistent with the function of the
impaired asset.
(v) Derecognition of financial assets and financial liabilitiesFinancial assets
A financial asset (or, where applicable, a part of a financial
asset or part of a group of similar financial assets) is
derecognised when:
– the rights to receive cash flows from the asset have
expired;
– the Company retains the right to receive cash flows from
the asset, but has assumed an obligation to pay them in
full without material delay to a third party under a ‘pass-
through’ arrangement; or
– the Company has transferred its rights to receive cash
flows from the asset and either (a) has transferred
substantially all the risks and rewards of the asset, or (b)
has neither transferred nor retained substantially all the
risks and rewards of the asset, but has transferred control
of the asset.
When the Company has transferred its rights to receive
cash flows from an asset and has neither transferred nor
retained substantially all the risks and rewards of the asset
nor transferred control of the asset, the asset is recognised
to the extent of the Company’s continuing involvement in
the asset. Continuing involvement that takes the form of a
guarantee over the transferred asset is measured at the lower
of the original carrying amount of the asset and the maximum
amount of consideration received that the Company could be
required to repay.
Financial liabilities
A financial liability is derecognised when the obligation
under the liability is discharged, cancelled or expires. When
an existing financial liability is replaced by another from the
same lender on substantially different terms, or the terms of an
existing liability are substantially modified, such an exchange
or modification is treated as a derecognition of the original
liability and the recognition of a new liability, and the difference
in the respective carrying amounts is recognised in profit
or loss.
(w) New Accounting Standards and InterpretationsIn the current year the Company has adopted all of the
new and revised Standards and Interpretations issued by
the Australian Accounting Standards Board (AASB) that are
relevant for its operations and effective for the current annual
reporting period as below.
AASB13 Fair Value Measurement
AASB119 Employee Benefits
Amendments to AASB136 Recoverable Amount
Disclosures for Non-Financial
Assets
The adoption of these new and revised Standards and
Interpretations did not have any material impact on the
amounts recognised in the financial statements of the
Company, however they have impacted the disclosures
presented in the financial statements.
Certain new and revised Standards and Interpretations issued
by the Australian Accounting Standards Board (AASB) and the
International Accounting Standards Board (IASB) are not yet
effective for the current financial year as below.
AASB9 Financial Instruments
IFRS15 Revenue From Contracts With Customers
These standards have not been adopted by the Company for
the year ended 30 June 2014. The Directors have assessed
the impact of these Standards and Interpretations to the extent
relevant to the Company, and noted that there is no significant
impact of these changes for the 2014 Financial Year.
Note 1: Statement of Significant Accounting Policies (continued)

Annual Report 2014 27
Notes to Financial Statements for year ended 30 June 2014 (continued)
2014 2013 $’000 $’000
Note 2: RevenueSales revenue 141,442 127,431
Interest income 1,124 992
Sundry income (i) 160 5,438
Total other income 1,284 6,430
Total revenue 142,726 133,861
(i) Compensation for lease surrender
During the 2013 financial year, the NSW Government resumed the land at the Totally Home
centre located at Bella Vista in Sydney’s North West. As a consequence, the leases on
the two stores operated by Nick Scali Limited at the centre were terminated earlier than
the lease expiration date. The one off net gain on the surrender of the lease of $5.373m
has been included in Sundry Income in the 2013 financial year.
Note 3: Operating Expenses and Losses / (Gains)Profit before income tax has been determined after:
(a) Expenses
Property expenses
Operating lease rental - minimum lease payments 23,046 21,812
Other expenses includes:
Depreciation/Amortisation of non-current assets
Land & Buildings 180 192
Building improvements 96 24
Office equipment 573 450
Furniture and fittings 336 399
Leasehold improvements 694 604
Motor vehicles 68 65
1,947 1,734
Employee benefits expenses
Salaries and wages 15,591 14,346
Superannuation expense 1,557 1,330
Share-based payments / (reversal) 3 13
Other 5,146 4,742
22,297 20,431
(b) Losses/(gains)
Loss on disposal of property, plant and equipment 165 2
Unrealised foreign currency loss / (gain) (i) – 12
(i) Realised exchange gains and losses have been included in cost of sales.

28
Notes to Financial Statements for year ended 30 June 2014 (continued)
2014 2013 $’000 $’000
Note 4: Income TaxThe major components of income tax expense are:
Income Statement
Current income tax
Current income tax charge 6,072 6,881
Adjustments in respect of current income tax of previous years 4 –
Deferred income tax
Relating to origination and reversal of temporary differences 46 (18)
Income tax expense reported in the income statement 6,122 6,863
A reconciliation of income tax expense applicable to accounting profit before income
tax at the statutory income tax rate to income tax expense at the Company’s effective
income tax rate is as follows:
Accounting profit before income tax 20,358 22,865
At the statutory income tax rate of 30% (2013: 30%) 6,108 6,860
Adjustments in respect of current income tax of previous years 4 –
Other items (net) 10 3
Income tax expense reported in income statement 6,122 6,863
Effective income tax rate 30.1% 30.0%
Statement of Statement of Statement of Financial Position Income Comprehensive Income 2014 2013 2014 2013 2014 2013 $’000 $’000 $’000 $’000 $’000 $’000
Deferred income tax
Deferred income tax assets
Depreciation - tax rate (472) (421) 51 162 – –
Legal fees (1) – 1 (34) – –
Compensation for lease surrender (1,612) – – – – –
Interest accrued – – – (41) – –
Employee entitlements 797 720 (77) (70) – –
Audit fee accrual 20 16 (4) 4 – –
Superannuation accrual 48 52 4 (16) – –
Deferred rent 707 810 103 (14) – –
Unallocated Credit Note 35 – (35) – – –
Unrealised exchange gain/loss – 4 4 (7) – –
Make good 14 13 (1) (2) – –
Cashflow Hedge (Note 17) 55 (255) – – 310 (283)
(409) 939 46 (18) 310 (283)

Annual Report 2014 29
Notes to Financial Statements for year ended 30 June 2014 (continued)
2014 2013 $’000 $’000
Note 5: DividendsDeclared and paid during the year
Dividends on ordinary shares:
Final franked dividend for 30 June 2013: 6.0 cents (2012: 3.5 cents) 4,860 2,835
Interim franked dividend for 30 June 2014: 6.0 cents (2013: 6.0 cents) 4,860 4,860
9,720 7,695
Declared and unpaid
Final franked dividend for 30 June 2014: 7.0 cents (2013: 6.0 cents) 5,670 4,860
(not recognised as a liability as at 30 June)
Franking credit balance
The amount of franking credits available for the subsequent financial year are:
– franking account balance as at the end of the financial year at 30% (30 June 2013: 30%) 11,369 9,633
– franking credits that will arise from the payment of income tax payable as at
the end of the financial year 2,367 3,804
13,736 13,437
The amount of franking credits available for future reporting periods:
– impact on the franking account of dividends declared before the financial report
was authorised for issue but not recognised as a distribution to equity holders
during the period (2,430) (2,083)
11,306 11,354
The tax rate at which paid dividends have been franked is 30% (30 June 2013: 30%).
Dividends declared and unpaid will be franked at the rate of 30% (30 June 2013: 30%).
2014 2013 $ $Note 6: Auditors’ RemunerationAmounts received or due and receivable by Ernst & Young for:
– audit or review of the financial report of the Company 90,000 90,000
2014 2013 $’000 $’000Note 7: Earnings Per Share(a) Net profit after tax used in calculating basic earnings and diluted earnings per share 14,236 16,002
No. of No. of Shares Shares(b) Weighted number of shares outstanding used to calculate basic
and diluted earning per share 81,000,000 81,000,000
Cents Cents per Share per Share
Basic earnings per share 17.6 19.8
Diluted earnings per share 17.6 19.8
Earnings per Share for 2013 includes a one-off compensation gain for surrender of leases at Bella Vista
of $3.8m. Excluding the compensation gain the 2013 Basic and Diluted earnings per share was 15.1 cents.

30
Notes to Financial Statements for year ended 30 June 2014 (continued)
2014 2013 $’000 $’000
Note 8: ReceivablesCurrent
Trade debtors (i) 101 549
Sundry debtors (ii) 63 5,848
164 6,397
Terms and conditions relating to the above financial instruments:
(i) Trade debtors are non-interest bearing and generally less than 30 day terms.
Factors considered in determining impairment are in relation to the likelihood of collection.
As at 30 June, trade debtors that were past due but not impaired were as follows:
Not past due Past due but not impaired Past due
and not impaired and impaired
Total Current 0-30 days 31-60 days >60 days >60 days $’000 $’000 $’000 $’000 $’000 $’000
2014 101 85 12 – 4 –
2013 549 505 20 3 21 –
(ii) Sundry debtors are non-interest bearing and have repayment terms of between 30 and 60 days.
2014 2013 $’000 $’000
Note 9: InventoriesFinished goods 15,255 11,811
Stock in transit 3,758 2,758
19,013 14,569
Note 10: Other Financial Assets Deposits 8 1
Cash flow hedge receivable (Note 14) – 851
8 852
Note 11: Other AssetsPrepaid expenses 92 286

Annual Report 2014 31
Notes to Financial Statements for year ended 30 June 2014 (continued)
2014 2013 $’000 $’000
Note 12: Property, Plant and EquipmentLand & Buildings - at cost 15,718 15,261
Accumulated depreciation (491) (311)
15,227 14,950
Building improvements - at cost 792 792
Accumulated depreciation (181) (85)
611 707
Office equipment - at cost 5,960 5,177
Accumulated depreciation (3,779) (3,308)
2,181 1,869
Furniture & fittings - at cost 3,333 3,264
Accumulated depreciation (2,267) (1,952)
Impairment (46) (36)
1,020 1,276
Leasehold improvements - at cost 8,064 6,854
Accumulated depreciation (4,414) (3,796)
3,650 3,058
Motor vehicles - at cost 705 645
Accumulated depreciation (526) (458)
179 187
Total - at cost 34,572 31,993
Accumulated depreciation and amortisation (11,704) (9,946)
Total property, plant and equipment 22,868 22,047
Reconciliation of the carrying amounts of property, plant & equipment
at the beginning and end of the current financial year:
Land & Buildings
Carrying amount at beginning 14,950 8,117
Additions 457 6,996
Depreciation charged (180) (163)
15,227 14,950
Building improvements
Carrying amount at beginning 707 191
Additions – 569
Depreciation charged (96) (53)
611 707
Office Equipment
Carrying amount at beginning 1,869 1,721
Additions 886 608
Disposals (1) (10)
Depreciation charged (573) (450)
2,181 1,869

32
Notes to Financial Statements for year ended 30 June 2014 (continued)
2014 2013 $’000 $’000
Note 12: Property, Plant and Equipment (continued)Reconciliation of the carrying amounts of property, plant & equipment
at the beginning and end of the current financial year continued:
Furniture & fittings
Carrying amount at beginning 1,276 1,517
Additions 81 170
Disposals (1) (12)
Depreciation charged (326) (363)
Impairment (10) (36)
1,020 1,276
Leasehold improvements
Carrying amount at beginning 3,058 2,775
Additions 1,449 929
Disposals (163) (42)
Depreciation charged (694) (604)
3,650 3,058
Motor vehicles
Carrying amount at beginning 187 252
Additions 60 –
Disposals – –
Depreciation charged (68) (65)
179 187
Total
Carrying amount at beginning 22,047 14,573
Additions 2,933 9,272
Disposals (165) (64)
Depreciation and amortisation charged (1,947) (1,734)
22,868 22,047
Land & Buildings are subject to a registered first mortgage to secure bank loans relating to their purchase.
Note 13: Intangible AssetsGoodwill on acquisition of stores in Adelaide 2,378 2,378
No impairment loss was recognised in the current financial year.
Goodwill acquired through business combinations has been allocated to one individual cash generating unit for impairment testing, being the Adelaide stores and related distribution centre. The recoverable amount of the Adelaide stores has been determined based on a value in use calculation using cash flow projections based on financial budgets approved by senior management covering a five year period.
The pre-tax discount rate applied to cash flow projections is 14.9% (2013: 13.0%), which approximates the Company’s cost of capital. The growth rate used to extrapolate cash flow projections is 3.0% (2013: 0.0%) for the five years, which is considered to be a conservative representation of the long term average growth rate of the cash generating unit.
The following describes each key assumption on which management has based its cash flow projection when determining the value in use of the Adelaide stores.
A consistent gross margin of 60% (2013: 60%) has been assumed, based on the Company’s profit history of consistent store by store margins.
The continuity of leases on premises for the next five years has been assumed where appropriate.
The value in use calculation is most sensitive to assumptions relating to sales growth, cost of capital and terminal values.
However, it would require a significant adverse change in these assumptions to impact the existing non-impairment assessment. The significant adverse change is not expected.

Annual Report 2014 33
Notes to Financial Statements for year ended 30 June 2014 (continued)
2014 2013 $’000 $’000
Note 14: PayablesTrade creditors (i) 6,138 5,548
Other creditors and accruals (ii) 4,621 4,214
Cash flow hedge payable (iii) 182 –
Customer deposits 14,757 12,103
Annual leave 1,709 1,600
27,407 23,465
Terms and conditions relating to the above financial instruments
(i) Trade creditors are non-interest bearing and are normally settled on 30 day terms.
(ii Other creditors are non-interest bearing and have an average of 30 to 60 days.
(iii) Foreign currency forward contracts are initially recognised in the statement of financial position at cost and subsequently
remeasured to their fair value. Accordingly there is no difference between the carrying value and the fair value of derivative
financial instruments at reporting date.
All financial instruments for which fair value is recognised or disclosed are categorised with the fair value hierarchy, described as
follows, based on the lowest level input that is significant to the fair value measurement as a whole:
Level 1 Quoted market prices in an active market (that are unadjusted) for identical assets or liabilities
Level 2 Valuation techniques (for which the lowest level input that is significant to the fair value measurement
is directly or indirectly observable)
Level 3 Valuation techniques (for which the lowest level input that is significant to the fair value measurement
is unobservable)
All foreign currency forward contracts were measured at fair value using Level 2 method.
Valuation techniques
The foreign currency forward contracts are measured based on observable spot exchange rates, the yield curves of the respective
currencies as well as the currency basis spreads between the respective currencies.
Risk management activities
During the period, the Company designated foreign currency forward contracts as hedges of highly probable purchases of inventory
in US dollars. The forecast purchases are expected to occur during July 2014 to October 2014.
The terms of the foreign currency forward contracts have been negotiated to match the terms of the forecasted transactions. Both
parties of the contract have fully cash collateralised the foreign currency forward contracts, and therefore, effectively eliminated any
credit risk associated to the contracts (both the counterparty’s and the Company’s own credit risk). Consequently, the hedges were
assessed to be highly effective. As at 30 June 2014, an unrealised loss of $723,000 (30 June 2013: an unrealised gain of $661,000)
is in other comprehensive income.

34
Notes to Financial Statements for year ended 30 June 2014 (continued)
2014 2013 $’000 $’000
Note 15: ProvisionsCurrent
Long service leave 671 544
Deferred Rent 708 665
1,379 1,209
Non-Current
Long service leave 277 257
Deferred Rent 1,648 2,035
Make good 47 43
1,972 2,335
Deferred Long service Make rent leave good $’000 $’000 $’000Movement in provisions
2014
Balance as at 1 July 2013 2,700 801 43
Utilised (411) (30) (6)
Amounts provided 67 177 10
Balance as at 30 June 2014 2,356 948 47
2014 2013Number of employees
Number of full-time and part-time employees at balance date 265 246
Superannuation funds
The Company contributes to a number of superannuation funds which exist to provide benefits for employees and their dependants
on retirement, death or disability, subject to the rules of the funds. All of the funds are defined contribution funds and as such the
Company has no commitment to fund retirement benefits, other than as specified in the rules of the respective funds and the
requirements of the Superannuation Guarantee Charge Act.
2014 2013 $’000 $’000
Note 16: Contributed Equity81,000,000 (2013: 81,000,000) authorised and fully paid ordinary shares 3,364 3,364
2014 2014 2013 2013 Number of $’000 Number of $’000 ord shares ord shares
Movement in ordinary shares on issue
Balance at the beginning of the financial year 81,000,000 3,364 81,000,000 3,364
Balance at the end of the financial year 81,000,000 3,364 81,000,000 3,364
Terms and conditions of contributed equity
Ordinary shares are entitled to receive dividends as declared and, in the event of winding up the Company, to participate in the
proceeds from the sale of all surplus assets in proportion to the number of and amounts paid up on shares held. Ordinary shares
entitle their holder to one vote, either in person or by proxy, at a meeting of the Company.

Annual Report 2014 35
Notes to Financial Statements for year ended 30 June 2014 (continued)
2014 2013 $’000 $’000
Note 17: ReservesCapital profits reserve 78 78
Cash flow hedge reserve (129) 594
Equity benefits reserve 16 13
(35) 698
Capital profits reserve
Opening balance 78 78
Closing balance 78 78
Cash flow hedge reserve
Opening balance 594 (67)
Amounts recognised for cash flow hedges (484) 1,382
Income tax on items taken directly to or transferred from equity 310 (283)
Amounts transferred to non-financial assets (549) (438)
Closing balance (129) 594
Equity benefits reserve
Opening balance 13 –
Share-based payment 3 13
Closing balance 16 13
Nature and purpose of reserve
Capital profits reserve
This reserve is comprised wholly of the surplus on disposal of assets that were acquired prior to
the introduction of Capital Gains Tax provisions.
Cash flow hedge reserve
This reserve records the portion of the gain or loss on a hedging instrument in a cash flow hedge
that is determined to be an effective hedge.
Equity benefits reserve
This reserve is used to record the value of share-based payments provided to employees as
part of their remuneration. Refer to note 25 for further details of these plans.
Note 18: Operating Lease commitmentsOperating leasing expenditure commitments
Future minimum lease payments under non cancellable operating leases as at 30 June
are as follows:
– not later than one year 18,588 18,103
– later than one year but not later than five years 42,344 40,082
– later than 5 years 6,197 3,517
Aggregate expenditure contracted for at balance date 67,129 61,702
Operating leases are in respect of Nick Scali and Sofas2Go leased premises.
Leases are entered into for varying terms.
Rent reviews are based on CPI increases or fixed increases. In some cases there are market reviews, particularly when
exercising renewal options. A number of the leases contain options to renew in favour of the Company.
Note 19: Capital CommitmentsAs at 30 June 2014 the Company had committed to acquire a property at Caringbah (NSW) for a purchase price of $5.75m
excluding statutory costs, and the Company had paid a deposit of $287,500. The property was funded via a credit facility with
ANZ Bank for $3m and the balance from Company funds.

36
Notes to Financial Statements for year ended 30 June 2014 (continued)
2014 2013 $’000 $’000
Note 20: Contingent LiabilitiesThere are no contingent liabilities as at 30 June 2014 (2013:$Nil).
Note 21: Events Subsequent to Reporting DateNo significant events subsequent to reporting date have occurred that
require separate disclosure.
Note 22: Statement of Cash Flows(a) Reconciliation of net profit after tax to net cash flows from operations
Net Profit 14,236 16,002
Adjustments for
Depreciation of non-current assets 1,947 1,734
Loss on disposal of property, plant and equipment 165 2
Interest expense classified as investing cash flows 301 252
Share-based payments expense 3 13
Net fair value change on derivatives (723) 661
Compensation for lease surrender – 58
Changes in assets & liabilities
Decrease / (increase) in value of trade & other receivables 7,084 (6,534)
Increase in value of inventories (4,444) (920)
Decrease in value of prepayments and other assets 194 316
Increase in value of deposit (7) (1)
Increase in value of payables 3,942 5,555
Increase / (decrease) in value of provisions (193) 132
Increase / (decrease) in current tax liabilities (1,437) 2,168
(Increase) / decrease in deferred tax assets 939 10
Increase in deferred tax liability 409 255
Net cash flow from operating activities 22,416 19,703
(b) Reconciliation of Cash
Cash balances comprise:
– cash at bank 35,903 26,441
(c) Financing Facilities Available
The following operating lines of credit were available at balance date:
– credit facilities 9,762 14,362
– amount utilised (7,697) (8,379)
Unused credit facilities 2,065 5,983
The credit facilities provided are from St. George Bank ($6.8m) and HSBC ($3.0m).
The St George Bank facilities relate to 2 commercial bill facilities totalling $6.8m. This is in relation to the purchase of the property at
Alexandria in 2011 and Fyshwick in 2012. The fair values of the properties pledged was $13.5m as at 30 June 2014 (2013: $13.5m).
The facility for the Alexandria property is for a 5 year term and expires on July 2015. The facility for the Fyshwick property is for
a 3 year term and expires on November 2015. The loans are secured by a first mortgage over the property assets to which the
borrowing relates. Otherwise the Company’s assets are unencumbered. The HSBC facilities unclude $2.0m for documentary letters
of credit in relation to payment of overseas suppliers with $0.4m utilised and $1.0m for bank guarantees with $0.5m utilised.
The carrying value approximates the fair value of interest bearing liabilities. Fair values of the Company’s interest-bearing loans are
determined by using a disclounted cash flow method using discounted rate that refelcts the issuer’s borrowing rate as at the end of
the reporting period. The own non-performance risk as at 30 June 2014 was assessed to be insignificant.

Annual Report 2014 37
Notes to Financial Statements for year ended 30 June 2014 (continued)
Note 23: Related Party DisclosuresRelated party arrangements: Directors
The names of the Directors who have held office during the financial year, together with details of Directors’ remuneration, are set out
in the Director’s Report.
No Director has entered into a new material contract with the Company since the end of the previous financial period.
Details of existing contracts are disclosed as follows:
Auburn and Chatswood Leases
The Company leases premises at Auburn and Chatswood, both in New South Wales, from entities controlled by Messrs Anthony
Scali and Nicky Scali.
The following details the term and rent payable by the Company in respect of each of the above premises leased. Lease rentals are
determined on an arms length basis.
All other material terms of these leases are of a nature that would be typically entered into between unrelated parties.
Location 242-248 Parramatta Road, Auburn, NSW 575 Pacific Highway, Chatswood, NSW
Term The lease expired on 28 February 2014 and The lease expired on 31 March 2014 and
is currently on a month to month tenancy. is currently on a month to month tenancy.
The owners have agreed to finalise a new The owners have agreed to finalise a new
lease at commercial rates and on lease at commercial rates and on
commercial terms in the first quarter of FY15. commercial terms in the first quarter of FY15.
Rent and Outgoings $844,762 (plus GST) per annum $585,252 (plus GST) per annum
During the Year Ended 30 June 2014 the Company paid property lease rentals and outgoings to the personally related
entities of Messrs Anthony Scali and Nicky Scali totalling $1,430,014 (2013: $1,408,413) in relation to these premises.
Other related party transactions
Dealings between the Company and the Directors and personally-related entities were made during the year in the
ordinary course of business on normal commercial terms and conditions. The nature of these dealings were primarily
the reimbursement of personal expenses incurred on Company paid credit cards and the purchase of products
for their own use.
Related party arrangements: Key Management Personnel
Key management personnel are those who have authority and responsibility for planning, directing and controlling the activities of the
Company, directly or indirectly, including all directors (executive and otherwise). The remuneration of key management personnel is
as follows:
2014 2013 $ $
Short-term employee benefits 1,675,370 1,344,180
Share-based payments (i) (7,407) 7,407
Post-employment benefits 73,737 63,258
1,741,700 1,414,845
(i) For details of share-based payments to Key Management Personnel see the remuneration report (audited) within the directors’
report included on pages 12-14 of this financial report.

38
Notes to Financial Statements for year ended 30 June 2014 (continued)
Note 24: Director and Executive DisclosuresShareholdings of Specified Directors and Specified Executives
Balance Net BalanceShares held in Nick Scali Limited (number) 30 June 2013 Change 30 June 2014
Specified Directors
J.W. Ingram 370,399 – 370,399
A.J. Scali & N. D. Scali (Jnr) (i) 40,500,000 – 40,500,000
N.D. Scali 1,000,000 (1,000,000) –
G.R. Laurie 30,000 – 30,000
C.A. Molyneux – – –
Specified Executives
G.K. Jenkins – – –
(i) Shares are held by a personally-related entity of Messrs Anthony Scali and Nicky Scali.
Note 25: Share-based Payment PlansThe Company has an Executive Performance Rights Plan which is provided for executives and other employees. In accordance with
the provisions of the plan, executives and employees are awarded Rights to ordinary shares that will vest after a period of three years
subject to the achievement of specific performance hurdles in relation to earnings per share (EPS) growth, which is not retested during
the period. There is no exercise price for the shares and the employees are able to exercise the Right for up to two years following
vesting, after which time the Right will lapse.
In the 2013-14 financial year Rights were issued which include performance hurdles requiring compound annual EPS growth of
between 5% and 10%. Under the grant, 50% of the Rights are exercisable on the achievement of 5% EPS growth, 100% on the
achievement of 10% EPS growth, and for the achievement of between 5% and 10% EPS growth the number of Rights exercisable is
calculated on a pro-rata basis.
The expense recognised in relation to employee share rights during the year was $2,720 (2013: $12,724).
The following table reconciles the outstanding Rights granted under the Executive Performance Rights Plan at the beginning and end
of the financial year:
Balance at Granted during Forfeited during Excercised during Balance at Vested at start of year the year the year the year end of year end of year No. No. No. No. No. No.
58,462 10,000 38,462 – 30,000 –
Fair Value of Rights Granted
The fair value of Rights at grant date is valued under risk neutral conditions. Under these conditions the value of the Right is equivalent
to the share price reduced by the present value of dividends payable on the shares until vesting. The present value of the dividends is
deducted from the share price because the Right holder is not entitled to dividend until the Rights are exercised. The valuation assumes
that the Rights are exercised as they vest.
The key assumptions used for determining fair value at grant date are as follows:
2014 2013
Share Price at Grant Date $2.00 $1.30
Dividend Yield 6.0% 6.0%
Franking Rate 30.0% 30.0%
Imputations credits valuation factor 65.0% 65.0%
Implied pre-tax effective dividend yield 7.7% 7.7%

Annual Report 2014 39
Notes to Financial Statements for year ended 30 June 2014 (continued)
Note 26: Financial Risk Management Objectives and PoliciesDetails of the significant accounting policies and methods adopted, including the criteria for recognition, the basis of measurement
and the basis on which income and expenses are recognised, in respect of each class of financial asset, financial liability and equity
instrument are disclosed in note 1 to the financial statements.
Market risk is the risk that changes in market prices, such as interest rates and exchange rates, will affect the Company’s income or the
value of its holdings of financial instruments. The objective of market risk management is to manage and monitor market risk exposures
within acceptable parameters, whilst optimising the return on risk.
The Company has exposure to the following risks from its use of financial instruments:
– Credit risk
– Liquidity risk
– Interest rate risk
– Foreign exchange risk
This note presents information about the Company’s exposure to each of the above risks, the Company’s objectives, policies and
processes for measuring and managing risk, and the Company’s management of capital. Further financial quantitative disclosures are
included throughout these financial statements.
The Company’s financial risk management policies are established to identity and analyse the risks faced by the Company, to set
appropriate risk limits and controls, and to monitor risks and adherence to limits. Risk management policies and systems are reviewed
regularly to reflect changes in market conditions and the consolidated entity’s activities.
The Board of Directors has overall responsibility for the establishment and oversight of the Company’s risk management framework.
The Board has established an Audit Committee, which is responsible for developing and monitoring the Company’s risk management
policies. The Committee provides regular reports to the Board of Directors on its activities.
The Company’s principal financial instruments comprise bank loans, and cash and short-term deposits. The main purpose of these
financial Instruments is to raise finance for and fund the Company’s operations. The Company has various other financial instruments
such as trade debtors and trade creditors, which arise directly from its operations. It is, and has been throughout the year, the
Company’s policy that no trading in financial Instruments shall be undertaken.
Interest rate risk
Financial instruments utilised that are subject to interest, and therefore interest rate risk, are cash and commercial bills. Management
continually monitor the exposure to interest rate risk. The following table sets out the carrying amount by maturity of the financial
instruments exposed to interest rate risk at reporting date. The fair value of the cash and commercial bills shown below are based on
the face value of those financial instruments.
<1 Year <5 Year Total Weighted Average $’000 $’000 $’000 Effective Interest rate
Year ended 30 June 2014
Floating rate Cash Assets 35,903 – 35,903 3.8%
Year ended 30 June 2013
Floating rate Cash Assets 26,441 – 26,441 4.4%
Year ended 30 June 2014
Floating rate Commercial Bills - Liabilities – 6,762 6,762 4.4%
Year ended 30 June 2013
Floating rate Commercial Bills - Liabilities – 6,762 6,762 4.6%

40
Notes to Financial Statements for year ended 30 June 2014 (continued)
Note 26: Financial Risk Management Objectives and Policies (continued)Interest rate risk (continued)
The following table demonstrates the sensitivity to a reasonably possible change in the interest rate.
Increase / decrease Effect on profit Effect on in interest rates before tax equity $’000 $’000
2014 + 100 basis points 291 –
- 100 basis points (291) –
2013 + 100 basis points 197 –
- 100 basis points (197) –
Foreign Currency Risk
All of the Company’s sales are denominated in the functional currency (Australian dollars), whilst the majority of stock purchases are
denominated in currencies other than the Company’s functional currency, primarily US dollars. Where appropriate the Company has
used forward currency contracts and options to manage its currency exposures; and where the qualifying criteria has been met, they
have been designated as hedging instruments for the purposes of hedge accounting.
As at 30 June 2014, the Company has Trade Payables of $1,693,601 (2013: $1,869,666) and Stock In Transit of $3,561,420 (2013:
$2,295,700) denominated in USD, all of which are covered by designated cash flow hedges (June 2013: all hedged). As a result,
the sensitivity to a reasonably possible change in the US dollar exchange rate is minimal. The cash flows relating to cash flow hedge
positions held at year end are expected to occur in July through to October 2014, and the profit and loss is expected to be affected
through cost of sales as the hedged items (inventory) are sold to customers. All forecast transactions subject to hedge accounting
have occurred or are highly likely to occur.
Credit Risk
Credit risk refers to the risk that a counterparty will default on its contractual obligations resulting in a financial loss to the the Company.
In most cases, the Company requires full and final payment either prior to, or upon delivery of the goods to the customer. In limited
cases where credit is provided, the Company trades on credit terms with recognised, creditworthy third parties. Customers who wish
to trade on credit terms are subject to credit verification procedures. In addition, receivable balances are monitored on an ongoing
basis with the result that the Company’s exposure to bad debts is not significant. There are no significant concentrations of credit risk
within the Company.
All amounts past due in excess of 30 days are individually assessed and provided for as doubtful if reasonable doubt as to
collectability exists.
With respect to credit risk arising from financial assets of the Company, which comprise of cash and cash equivalents and receivables,
the Company’s maximum exposure to credit risk, excluding the value of any collateral or other security, at reporting date to recognised
financial assets is in the carrying amount, net of any provisions for doubtful debts, as disclosed in the statement of financial position
and notes to the financial statements. Cash and cash equivalents are only invested with corporations which are approved by the Board.
Refer to note 8 for receivables past due and not impaired.
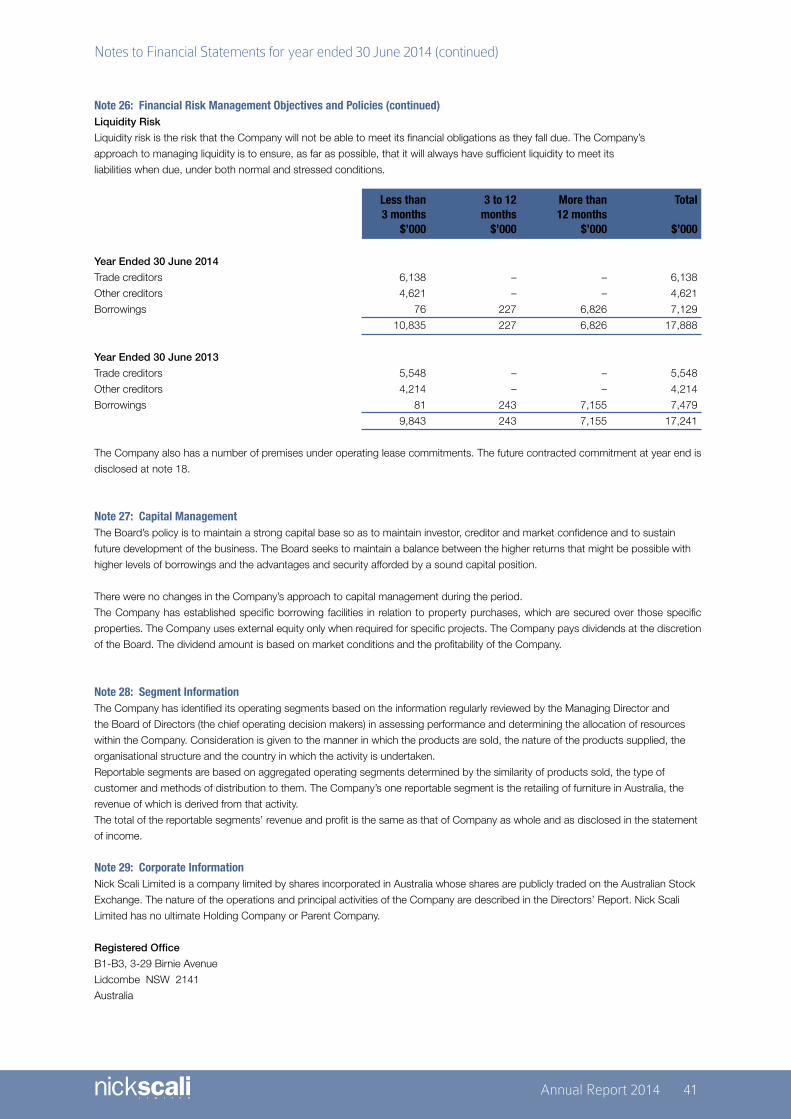
Annual Report 2014 41
Notes to Financial Statements for year ended 30 June 2014 (continued)
Note 26: Financial Risk Management Objectives and Policies (continued)Liquidity Risk
Liquidity risk is the risk that the Company will not be able to meet its financial obligations as they fall due. The Company’s
approach to managing liquidity is to ensure, as far as possible, that it will always have sufficient liquidity to meet its
liabilities when due, under both normal and stressed conditions.
Less than 3 to 12 More than Total 3 months months 12 months $’000 $’000 $’000 $’000
Year Ended 30 June 2014
Trade creditors 6,138 – – 6,138
Other creditors 4,621 – – 4,621
Borrowings 76 227 6,826 7,129
10,835 227 6,826 17,888
Year Ended 30 June 2013
Trade creditors 5,548 – – 5,548
Other creditors 4,214 – – 4,214
Borrowings 81 243 7,155 7,479
9,843 243 7,155 17,241
The Company also has a number of premises under operating lease commitments. The future contracted commitment at year end is
disclosed at note 18.
Note 27: Capital ManagementThe Board’s policy is to maintain a strong capital base so as to maintain investor, creditor and market confidence and to sustain
future development of the business. The Board seeks to maintain a balance between the higher returns that might be possible with
higher levels of borrowings and the advantages and security afforded by a sound capital position.
There were no changes in the Company’s approach to capital management during the period.
The Company has established specific borrowing facilities in relation to property purchases, which are secured over those specific
properties. The Company uses external equity only when required for specific projects. The Company pays dividends at the discretion
of the Board. The dividend amount is based on market conditions and the profitability of the Company.
Note 28: Segment InformationThe Company has identified its operating segments based on the information regularly reviewed by the Managing Director and
the Board of Directors (the chief operating decision makers) in assessing performance and determining the allocation of resources
within the Company. Consideration is given to the manner in which the products are sold, the nature of the products supplied, the
organisational structure and the country in which the activity is undertaken.
Reportable segments are based on aggregated operating segments determined by the similarity of products sold, the type of
customer and methods of distribution to them. The Company’s one reportable segment is the retailing of furniture in Australia, the
revenue of which is derived from that activity.
The total of the reportable segments’ revenue and profit is the same as that of Company as whole and as disclosed in the statement
of income.
Note 29: Corporate InformationNick Scali Limited is a company limited by shares incorporated in Australia whose shares are publicly traded on the Australian Stock
Exchange. The nature of the operations and principal activities of the Company are described in the Directors’ Report. Nick Scali
Limited has no ultimate Holding Company or Parent Company.
Registered Office
B1-B3, 3-29 Birnie Avenue
Lidcombe NSW 2141
Australia

42
Directors’ Declaration
Directors’ Declaration
In accordance with a resolution of the Directors of Nick Scali Limited, we state that:
1) In the opinion of the Directors :
(a) the financial statements and notes of the Company are in accordance with the Corporations Act 2001, including:
(i) giving a true and fair view of the Company’s financial position as at 30 June 2014 and of the performance for the year
ended on that date; and
(ii) complying with Accounting Standards and Corporations Regulations 2001.
(b) the financial statements and notes are also complying with International Financial Reporting Standards as disclosed
in note 1(b)
(c) there are reasonable grounds to believe that the Company will be able to pay its debts as and when they become
due and payable.
2) This declaration has been made after receiving the declarations required to be made to the Directors in accordance with section
295A of the Corporations Act 2001 for the financial year ended 30 June 2014.
On behalf of the Board
J.W. Ingram A.J. Scali
Chairman Managing Director
Sydney, 13 August 2014

Annual Report 2014 43
Independent Auditor’s Report

44
Independent Auditor’s Report (continued)

Annual Report 2014 45
Auditor’s Independence Declaration

46
Shareholder Information
Additional information required by the Australian Securities Exchange and not shown elsewhere in this report is as follows.
The information is current as at 30 June 2014.
(a) Distribution of shareholders, by size of holding
Shareholders No. Of OrdinaryCategory Shareholders
1 to 1,000 182
1,001 to 5,000 282
5,001 to 10,000 108
10,001 to 100,000 86
100,001 and Over 19
677
(b) Twenty largest shareholders
No. Of Ordinary Percentage ofName Shares held Capital Held
SCALI CONSOLIDATED PTY LIMITED 40,500,000 50.00%
RBC DEXIA INVESTOR SERVICES AUSTRALIA NOMINEES PTY LTD 9,315,416 11.50%
CITICORP NOMINEES PTY LTD 7,213,110 8.91%
NATIONAL NOMINEES LIMITED 4,740,927 5.85%
MOLVEST PTY LTD 3,000,000 3.70%
RBC INVESTOR SERVICES AUSTRALIA NOMINEES PTY LTD 2,372,450 2.93%
JP MORGAN NOMINEES AUSTRALIA LIMITED 1,921,738 2.37%
HSBC CUSTODY NOMINEES (AUSTRALIA) LIMITED 1,689,476 2.09%
BNP PARIBAS NOMS PTY LTD 1,129,695 1.39%
RBC DEXIA INVESTOR SERVICES AUSTRALIA NOMINEES PTY LTD 1,125,191 1.39%
GRAHGER CAPITAL SECURITIES PTY LTD 900,000 1.11%
GRAHGER CAPITAL SECURITIES PTY LTD 600,000 0.74%
RBC INVESTOR SERVICES AUSTRALIA NOMINEES PTY LTD 511,420 0.63%
GRAHGER CAPITAL SECURITIES PTY LTD 500,000 0.62%
HSBC CISTODY NOMINEES (AUSTRALIA) LIMITED 366,423 0.45%
BOND STREET CUSTODIANS LIMITED 310,000 0.38%
GRAHGER CAPITAL SECURITIES PTY LTD 300,000 0.37%
CITICORP NOMINEES PTY LTD 284,337 0.35%
MR BERNARD CHOON YIN HUI 150,000 0.19%
GRAHGER CAPITAL SECURITIES PTY LTD 100,000 0.12%
77,030,183 95.10%

Annual Report 2014 47
(c) Substantial shareholders
The names of substantial shareholders who have notified the Company in
accordance with section 617B of the Corporations Act 2001:
No. Of Ordinary Percentage ofShareholder Shares held Capital Held
Scali Consolidated Pty Limited 40,500,000 50.00%
Perpetual Trustees Australia Limited 12,484,902 15.41%
Commonwealth Bank of Australia 4,968,552 6.13%
57,953,454 71.54%
(d) Voting Rights
All ordinary shares carry one vote per share without restriction.
Shareholder Information (continued)

48
Corporate Information
New South Wales
Alexandria
Auburn
Bankstown
Belrose
Campbelltown
Caringbah
Castle Hill
Chatswood
Kotara
Moore Park
Tuggerah
Warrawong
Australian Capital
Territory
Fyshwick
Victoria
Chirnside
Essendon
Frankston
Mildura
Moorabbin
Nunawading
Richmond
Springvale
South Wharf
Taylors Lakes
South Australia
Gepps Cross
Marion
Mile End
Glynde
Queensland
Aspley
Bundall
Fortitude Valley
Jindalee
Macgregor
Maroochydore
Townsville
Registered OfficeB1-B3, 3-29 Birnie Avenue
Lidcombe, NSW 2141
Telephone: 02 9748 4000
Facsimile: 02 9748 4022
Website: www.nickscali.com.au
Company SecretaryGary Jenkins
AuditorsErnst & Young
Ernst & Young Building
680 George Street
Sydney NSW 2000
SolicitorsDimarco Lawyers
Level 7, 67 Castlereagh Street
Sydney NSW 2000
BankersNational Australia Bank Limited
Nick Scali LimitedABN 82 000 403 896
Store Locations
New South Wales
Moore Park
Prospect
Campbelltown
Australian Capital
Territory
Fyshwick
Victoria
Springvale
Share RegistryLink Market Services Limited
Level 12, 680 George Street
Sydney NSW 2000
Locked Bag A14 Sydney South NSW 1235
Telephone: 02 8280 7100
Facsimile: 02 9287 0303
Email: [email protected]
Website: www.linkmarketservices.com.au
Stock ExchangeThe Company is listed on the Australian Securities Exchange.
The home exchange in Sydney
ASX code: NCK
Annual General MeetingThe Annual General Meeting will be held at 12pm
On Thursday 30th October 2014
At Nick Scali Limited Head Office