Embed Size (px)
Citation preview
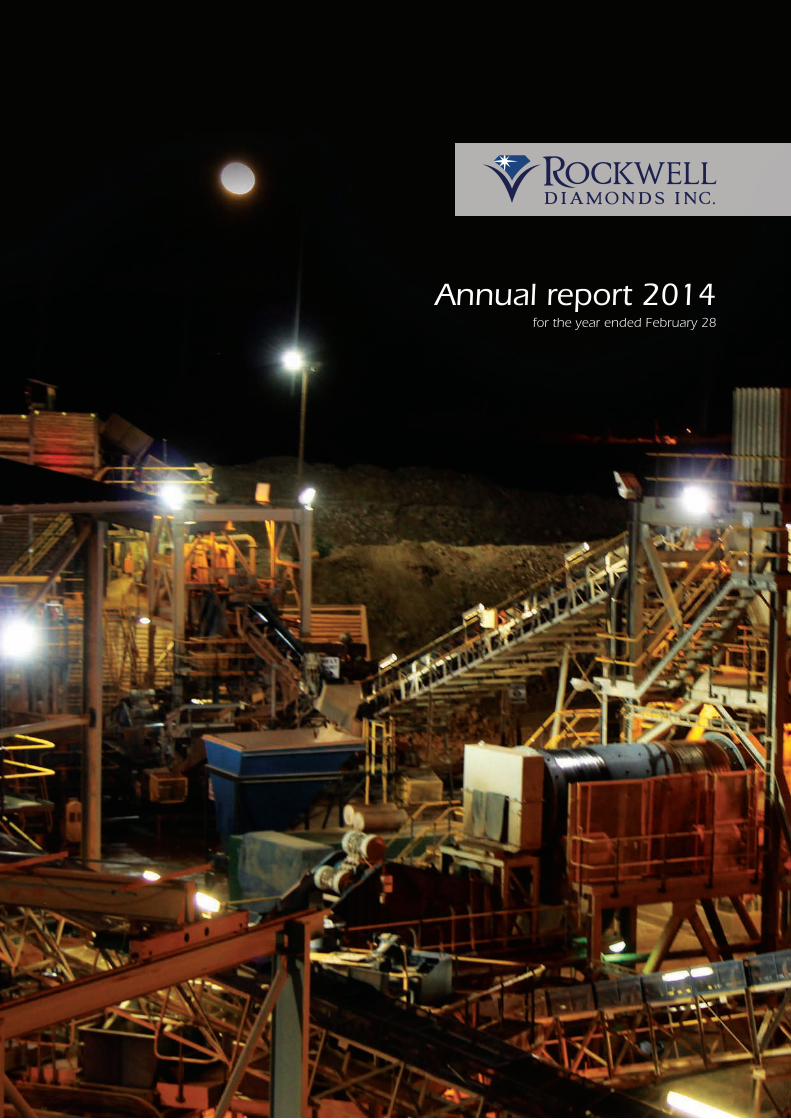
Annual report 2014for the year ended February 28
WHO IS ROCKWELL?
CONTENTS
Rockwell is in the business of developing and operating alluvial diamond mines.
Its medium-term goal is to become a mid-
tier diamond mining company processing
500,000 cubic meters per month of
quality gravels in the Middle Orange
Region (“MOR”) of South Africa. Rockwell’s
operations and development projects are
all located in the Republic of South Africa.
At February 28, 2014, the Group had
three existing mines in operation, namely
Saxendrift, Saxendrift Hill Complex
(“SHC”) and the recently commissioned
Niewejaarskraal Mine, which had
previously been on care and maintenance
since 2007. All three mines are located
in the MOR region of South Africa.
The Company has an economic interest in a fourth operating property. Rockwell’s operation
at the Tirisano Mine has been on care and maintenance since December 2012. However,
royalty mining agreements were subsequently put in place at Tirisano, where independent
contractors (or royalty miners) mine for own risk and reward, with the Company receiving a
12.5% royalty income based on gross revenue from the carats recovered and sold through
the Company’s tender process.
The Company is considering the development of a fifth mining property prospect.
A Preliminary Economic Assessment has been completed during the first quarter of
fiscal 2014 on the Wouterspan project, which could provide further expansion of the
Company’s Middle Orange operations in future. The Group has a pipeline of other projects
with further future development potential under consideration and evaluation at present.
Rockwell continues to evaluate strategic opportunities through mergers and acquisitions
as they arise, in order to expand its mineral resources and provide new opportunities to
develop the additional production.
Rockwell’s operations have a track record of producing large gem quality diamonds, which
comprise a significant proportion of its production profile. The larger diamonds recovered
from Rockwell’s mines are mostly acquired for investment purposes. In order to participate
further in the diamond value chain from production to retail sale, the Company has a
beneficiation agreement in place. This arrangement enables it to sell rough +2.8 carat sized
diamonds, and receive 90% of the fair value sales price at sale and receive the remaining
10% through, and participate equally in, the retail profit on the sale of its stones after
polishing and finishing.
TSX: RDI | JSE: RDI
Currency values throughout this report are presented in Canadian dollars,
unless otherwise indicated.
1 The story of the Alana 2 Highlights 3 Business strategy 4 How we operate 5 Strategic beneficiation partnership 6 Board of Directors 7 Senior management team 8 Chairman’s letter10 Chief Executive Officer’s report16 Chief Financial Officer’s report18 Summary of quarterly results
Operational review20 Mineral resource summary21 Our operational footprint22 Operational organogram24 Operational review
Governance33 Sustainability review38 Corporate governance
Financial statements51 Directors’ report54 Management’s responsibilities and approval55 Independent auditors’ report56 Consolidated statements of financial position57 Consolidated statements of profit or loss and
other comprehensive income58 Consolidated statements of changes in equity59 Consolidated statements of cash flow60 Notes to the consolidated financial statements
ibc Corporate informationCover: The complex 100,000m3 Niewejaarskraal
processing plant that was commissioned during fiscal 2014, comprising the dense media separator;
in field screen and Bulk X-ray system.

Rockwell Diamonds Annual report 2014 1
Looking for the Alana
Finding the Alana (August 2013)
Exploration pitting at SHC: A method used to evaluate
the quality of gravel to be mined
James Campbell (CEO) and Wikus de Winnaar (GM: MOR Operations) at a trench such as the one where the Alana was eventually found
Penelope Mohale (Mining Geologist) and Mulalo Ndwammbi (Mining Manager: SHC): Responsible for
geology and mining when the Alana was recovered
Large stone plots : Used to determine the possible location of large stones
Location of the Alana
Mining the gravels
The people on the team
Locating the right mining
area
Mining the gravels
Liberating the gravels
Loading and hauling the gravel
Geological daily report: Description of the gravel containing the Alana
Mulalo examines the pit the day before
the discovery
Recovering the Alana (September 2013)
Polishing the Alana
The SHC processing plant: Gravel is screened and prepped before processing through the
Bulk X-ray sorters
At the cutting factory the stone was analyzed in 3D to identify the best cuts and value for recovery
from the stone
The Alana: 169 carats (13 September 2013)
The 109 carat Alana stone: Fancy yellow, no visual flaws
and octahedral shape.
Selling the Alana (March 2014)
ROCKWELL’S DIAMOND PIPELINE: THE STORY OF THE ALANA An exceptional gem quality diamond recovered at Saxendrift Hill Complex
Large boulders act as trap sites
The Alana was named after Alana Claire Norton (daughter of Glenn Norton, Group Technical Manager), who was born on September 13, 2013, the day the Alana stone was recovered.

2 Rockwell Diamonds Annual report 2014
HIGHLIGHTSPerformance overview
FINANCIAL OVERVIEW�• Gross diamond revenues up 39% to
$45.2 million: Underpinned by a 52%
increase in diamond sales revenue
�• Seven consecutive quarters of US dollar
denominated revenue growth
�• Average price per carat of
US$1,484 compared to US$1,314 per
carat for fiscal 2013
�• Production costs up 25% to
$39.2 million: Emerging economies
of scale against 52% improvement in
value of diamond sales
�• An operating profit before depreciation
and amortization of $6.0 million, up
from $1.1 million in prior year
�• Reported loss before tax of
$10.5 million: Narrowed from
$13.9 million
�• Normal operations produced cash
flow of $5.3 million (prior to working
capital movements): $2.7 million after
working capital movements, before
investments amounting to $8.7 million
in property, plant and equipment
OPERATIONAL OVERVIEW�• Met short-term goal of delivering
three producing operations from
MOR: SHC and Niewejaarskraal
commissioned, increasing total monthly
processing capacity to 340,000m3
�• Annual diamond production* up 27%
from 28% increase in volume processed
�• Five rough diamonds exceeding
115 carats recovered in MOR, the
largest of which was 287 carats
�• Carat production at Saxendrift
processing plant up 12% to
9,338 carats, despite a 10% decline
in volumes of gravel processed
�• Production ramp up of new internally
funded Bulk X-ray processing plant
at SHC completed: Production sold at
average value of US$2,781 per carat
�• Sale of lossmaking Klipdam Mine
completed in April 2013: Proceeds
reinvested in new processing plant at
Niewejaarskraal
�• Niewejaarskraal brought back into
production: DMS (dense media
separation) plant and Bulk X-ray system
commissioned on schedule
�• Fleet optimization program initiated to
cost effectively renew aging fleet: To
improve earthmoving availabilities and
facilitate higher mining volumes
�• The royalty mining contractor strategy
on track: Positive income of
US$1.2 million from Tirisano property
VOLUMES OF GRAVEL PROCESSED*
UP28%
CARAT PRODUCTION*
UP27%
AVERAGE PRICE PER CARAT*
UP13%
Feb 28 2014
Feb 28 2013
Volume (cubic meters) 3,761,062 2,929,997
Production (carats) 27,776 21,871
Sales (carats) 26,272 20,737
Average price per carat (US$) 1,484 1,314
Revenue ($) 45,169,410 32,405,263
Average $ exchange rate (R/$) 9.53 8.37
Gross (loss)/profit ($) 32,626 (6,102,603)
Expenses ($) 11,847,015 7,069,816
Total comprehensive loss ($) 8,978,094 22,509,549
Basic and diluted loss per common share (cents) 21.30 22.55
Total assets ($) 79,336,624 85,724,412
Net cash and cash equivalents ($) (1,761,085) 2,730,705
Inventories (carats) 2,752 1,248
All dollar figures stated herein are
expressed in Canadian dollars, unless
otherwise stated.
*From Company owned properties.
ANNUAL REVENUE
UP39%
Rockwell Diamonds Annual report 2014 3
BUSINESS STRATEGY
Rockwell’s medium-term organic growth strategy is focussed on the Middle Orange River properties where it has a good track record of
profitably producing large, high valued diamonds. Good progress is being made towards its objective of increasing monthly volumes mined
from its Middle Orange River operations to 500,000m3. This includes the commissioning of two new internally funded mines in fiscal 2014
that were partly enabled by decisive action to address the lossmaking operations.
SCORECARD: DELIVERY ON CORPORATE OBJECTIVES
Objective Progress during fiscal 2013
Optimizing production mines to deliver better returns by driving down costs and improving metallurgical processes
• Saxendrift Mine: Grade improvements led to 12% increase in carat production after integrating Saxendrift Extension into mine plan
• Initiated fleet optimization plan to cost effectively renew aging fleet:Implementation in progress to improve availabilities and facilitate higher mining volumes
• Tirisano Property: Royalty mining strategy led to additional income of US$1.2 million from royalties
Leveraging production profile through further development of assets with a focus on minimizing the dilution of existing shareholders
• Achieved short-term target to deliver three producing operations in MOR• Commissioned two internally funded mines at SHC and Niewejaarskraal, increasing
MOR processing capacity to 340,000m3 per month
Adding value downstream from the Company’s exceptional gemstone diamond production through strategic beneficiation partnerships
• Beneficiation JV with Diacore: $4.1 million additional revenue generated in fiscal 2014 from the profit share on the sale of diamonds through this channel
• Current ‘beneficiation pipeline’ of more than 6,000 carats provides additional revenue potential
Creating scale and critical mass to smooth and increase Rockwell’s production and revenue profile through active management of the portfolio of properties, by acquiring select alluvial diamond projects or recycling non-productive and lossmaking assets
• More than doubled monthly production capacity in MOR: Commissioned SHC and Niewejaarskraal
• Ongoing review of accretive consolidation opportunities in the southern African diamond sector: Strict set of acquisition criteria
• Reviewing options to bring Wouterspan to account: Preference for phased and internally funded options
Conducting geological investigations, including drilling and bulk sampling on new project areas adjacent to the existing operations
• Contiguous exploration of existing resources at Saxendrift Extension property to increase current mine life: Leverage fixed assets at Saxendrift
• Focused exploration and trial mining program at SHC: Maximize resource potential and develop contiguous areas
• Upgrade inferred resource at Niewejaarskraal: Trial mining to upgrade resource to indicated level with eventual declaration of probable reserves
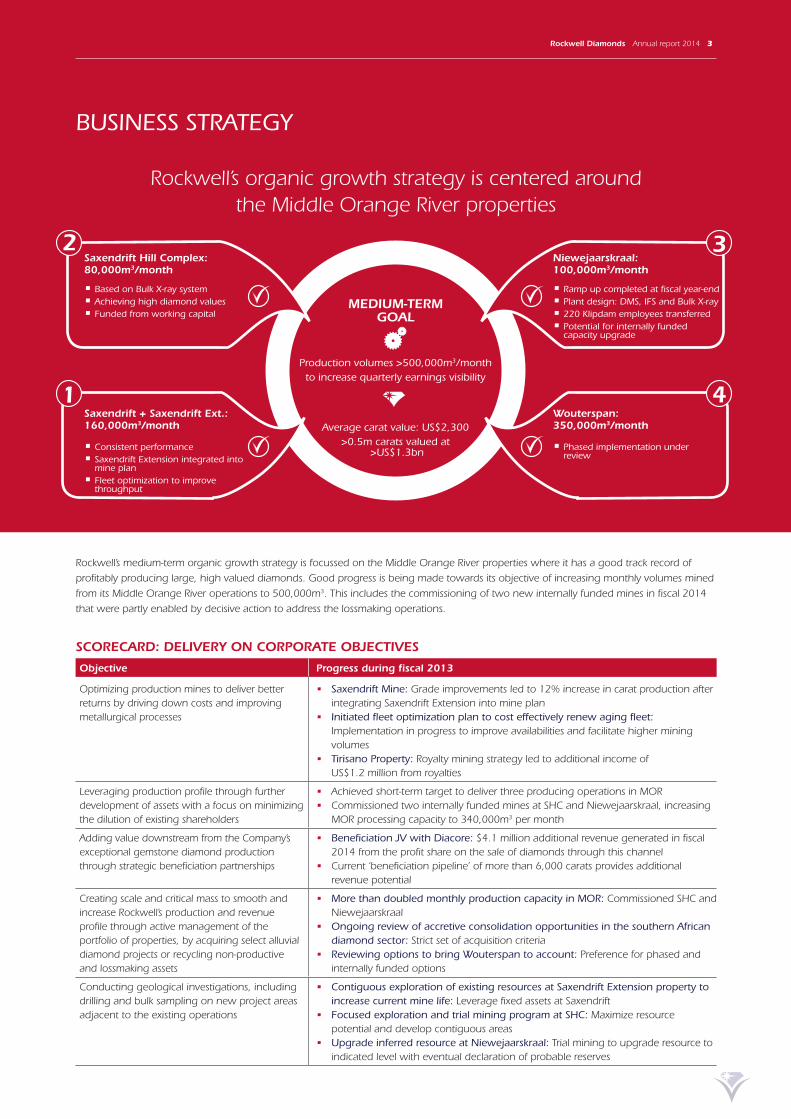
Rockwell’s organic growth strategy is centered around the Middle Orange River properties
Saxendrift + Saxendrift Ext.: 160,000m3/month
• Consistent performance• Saxendrift Extension integrated into
mine plan• Fleet optimization to improve
throughput
1 4Wouterspan: 350,000m3/month
• Phased implementation under review
MEDIUM-TERM GOAL
Production volumes >500,000m3/monthto increase quarterly earnings visibility
Average carat value: US$2,300>0.5m carats valued at
>US$1.3bn
Saxendrift Hill Complex: 80,000m3/month
• Based on Bulk X-ray system• Achieving high diamond values• Funded from working capital
2 3Niewejaarskraal: 100,000m3/month
• Ramp up completed at fiscal year-end• Plant design: DMS, IFS and Bulk X-ray• 220 Klipdam employees transferred• Potential for internally funded
capacity upgrade

HOW WE OPERATE
Our executive leadership team defined the guiding principles that encompass Rockwell’s ideal work ethic and culture, which has already started delivering significant benefits.
These guiding principles are:
Accountability Taking responsibility for our actions and their
impacts
Execution Giving of our best to make sure that we achieve the
expected outcomes
IntegrityActing to the highest ethical standards in
all that we do
PartnershipWorking as a team with
our colleagues, communities and other
stakeholders
ChallengeEncouraging debate to
improve our business and the way in which
we work
ComplianceGoing the extra mile to comply to the laws and
legislation
Fit for purpose Designing plants and
systems that are aligned to our business principles,
ore bodies and company
4 Rockwell Diamonds Annual report 2014

Rockwell Diamonds Annual report 2014 5
STRATEGIC BENEFICIATION PARTNERSHIPcontinues to add significant value from the sale of polished diamonds
ROU
GH
NO
TAB
LE
STO
NES
POLI
SHED
BEN
EFIC
IATI
ON
VA
LUE
AD
D
Mine 20 to 49 carats 50 to 99 carats Larger than 100 carats
Saxendrift 45 stones Nine stones Three stones weighing 116.33 carats; 138.22 carats and 287.35 carats
Saxendrift Hill Complex 16 stones Three stones Two stones weighing 126.51 carats and 169.64 carats
Niewejaarskraal Three stones
Diacore profit share agreement (>2.8 carat stones). Additional revenue channel: Market related prices for rough diamonds sold into joint venture + 50% profit share on sale of polished diamonds.
77ct makeableSaxendrift Ext
37ct J Colorbrilliant VS2
145ct makeableOld Saxendrift Tailings
30ct stone being polished. Additional pieces to be polished
105ct Type IIAMiddle Orange
35ct D color internally flawless
169ct YellowSaxendrift Hill Complex
109ct vivid yellow
128ct YellowMiddle Orange
81ct vivid yellow
2012 2012 2009 2013 2011
+34% on initial rough sale price
Currently being polished
+62% on initial rough sale price
+61% on initial rough sale price
+37% on initial rough sale price
Rockwell has a strategic beneficiation partnership with Diacore for its production of rough diamonds weighing more than 2.8 carats. These
stones are sold to Diacore at market price and Rockwell benefits from a 50% share in the profits on the ultimate sale of the polished stones.
The Company has realized revenue of $25.7 million in fiscal years from 2009 to 2014.
RECOVERED DURING THE 2014 FISCAL YEAR INCLUDED, AMONG OTHERS:

6 Rockwell Diamonds Annual report 2014
DR MARK BRISTOWChairman and Director PhD (Geology)
More than 20 years’ experience in exploration, development, project and corporate finance and management in the mining sector in Africa. CEO of Randgold Resources Limited since 1995. Acting CEO of Rockwell Diamonds from December 2010 to end of May 2011. A fellow of the Geological Society of South Africa.
STEPHEN DIETRICHDirector CA(SA)
A CA(SA) and stalwart of the diamond industry with more than 20 years of financial experience, gained in various positions at De Beers. Retired from De Beers in 2009 at which time he held the position of finance director.
DR WILLEM JACOBSDirectorBPL (Hons), DCom
Over 25 years’ experience in the engineering, mining and investment sectors, including 20 years at executive and board level positions of private and public companies. Experience in strategy, corporate finance, company turnarounds and mergers and acquisitions.
JAMES CAMPBELLPresident and Chief ExecutiveBSc (Hons) ARSM, MBA (Dunelm)
Seasoned diamond executive with career spanning almost 30 years at De Beers and four years as managing director of African Diamonds plc. FIMMM, FSAIMM, CEng, CSci and PrSciNat.
r n a
Rem
un
erat
ion
co
mm
ittee
No
min
atio
n c
om
mitt
ee
Au
dit
com
mitt
eeBOARD OF DIRECTORS
n a
RICHARD PETER MENELLDirectorMSc (Mineral Exploration and Management), MA (Cantab) – Natural Sciences (Geology)
A 35 year career in mining, heading Anglovaal Mining and Teal Exploration & Mining up to 2008. Served as President of the South African Chamber of Mines and other boards. A non-executive director of Gold Fields Limited, Sibanye Gold Limited, Weir Group plc, Senior Advisor to Credit Suisse investment bank and a Council Member of Business Leadership South Africa.
RICHARD J LINNELLDirector Geologist
Active in the resources and metals fields for over 40 years. Significant global experience in the development and marketing of resources and commodities. Originator of the Bakubang Initiative, a forum designed to revive the South African mining industry and which led to the establishment of the New Africa Mining Fund.
r n
JOHAN VAN’T HOFDirector CPA, CA, MBA
A qualified CA based in Canada holding an MBA with wide-ranging experience in the listed company environment, including regulatory affairs, financing, mergers and acquisitions and corporate finance.
r a
a

Rockwell Diamonds Annual report 2014 7
JAMES CAMPBELLPresident and Chief ExecutiveBSc (Hons) ARSM, MBA (Dunelm)
Seasoned diamond executive with career spanning almost 30 years at De Beers and four years as managing director of African Diamonds plc. FIMMM, FSAIMM, CEng, CSci and PrSciNat.
GERHARD JACOBSChief Financial Officer – outgoingRetired with effect from July 11, 2014BAcc, MBA
Mining and corporate experience with junior and senior mining companies with operations in South Africa, Australia and Canada. Knowledge of publicly listed mining companies.
JOHN SHELTONChief Financial Officer – incoming Effective July 21, 2014CA (Z)
Chartered Accountant with 25 years’ experience in the diamond sector with De Beers, culminating as Group Accountant. Served on various boards during his tenure with De Beers.
GLENN NORTONGroup Technical ManagerBSc (Hons)
Fourteen years of geological, mineral resource management, technical and production experience in alluvial diamond deposits, diamond and coal exploration. Qualified person and PrSciNat.
JEFFREY BRENNERDiamond Marketing and Sales Manager
A leading international diamantaire and specialist in valuation, marketing and sales of rough diamond production from alluvial deposits.
STÉPHANIE LECLERCQInvestor Relations and Corporate DevelopmentBSc, CFA
More than 12 years in investor relations and corporate development. Worked as a sell-side analyst and in-house investor relations practitioner across various industry sectors, including junior mining.
RICHARD MHLONTLOGroup HR/Industrial Relations ManagerNat Dip (HR Management and Development)
Extensive HR and industrial relations management experience, including organizational and structural design initiatives as well as strategy development and implementation.
DR KURT PETERSENConsulting Metallurgist PhD (Metallurgical Science)
More than 13 years’ experience in diamond metallurgy of both Kimberlites and alluvial. Expert in plant design, diamond liberation and process performance and simulation.
RICHARD REEDConsultant: Corporate FinanceBComm, BAcc
A career in corporate finance spanning several decades in advising companies on M&A, treasury and other corporate finance activities including resource companies listed on the JSE and AIM.
WIKUS DE WINNAARGeneral Manager: MOR Operations
Active in the mining industry for 17 years, serving as Mine Manager for several projects, including Wouterspan and Saxendrift during this time. Promoted to General Manager of Rockwell’s MOR Operations in December 2013.
SENIOR MANAGEMENT TEAM

8 Rockwell Diamonds Annual report 2014
CHAIRMAN’S LETTER
8 Rockwell Diamonds Annual report 2014
Looking back over the past year, it is
pleasing to note Rockwell’s steady,
successive quarterly improvements and
the achievement of numerous milestones
towards its strategic objective of delivering
value for all stakeholders. Rockwell’s CEO,
James Campbell, and his key executives
also made significant headway in
building a team that fairly represents the
demographics of our operating region
in South Africa, while maintaining a clear
focus on delivering on our stated plans
and adhering to best practice.
Also significant is that the 2014 successes
and progress towards our medium-
term target of being able to process
500,000m3 of quality gravel in the MOR
per month was funded internally without
diluting shareholder value. The Company
increased its monthly processing capacity
to 340,000m3 with the construction of
two mines at the Saxendrift Hill Complex
and Niewejaarskraal, both of which are
now in production. Although below the
360,000m3 target we set ourselves for
2014, this was offset by a very successful
contract mining agreement at Tirisano
and the recovery of overall higher value
diamonds in the period.
As part of our corporate turnaround
referred to in my last report, the executive
management team has really grown
into its role and has implemented the
diamond value management strategy
and disciplined implementation of fit-for-
purpose technologies in a very professional
and businesslike manner, the results of
which are clearly evident. As part of our
ongoing commitment to ensuring we
continue to build and encourage the
development of a world class management
team, during the past year we reviewed
Dr Mark Bristow Chairman
• Steady successive quarterly performance improvements during fiscal 2014.
• Progress against strategic milestones to deliver value for all stakeholders without diluting shareholder value.
• Ongoing development of demographically representative young professional team.
• Agreement concluded with new black economic empowerment partner.
103 carat fancy intense yellow diamond and other high quality stones recovered from MOR in May 2014.
Rockwell Diamonds Annual report 2014 9
and updated the executive management
incentive scheme and also extended it
to include operational and supervisory
employees. The scheme is based on
performance metrics including individual
key performance indicators, Company
financial profitability and cash flow as
well as safety, environment and corporate
governance compliance.
Our raison d’être is to build our assets
and create value for the benefit of all
stakeholders, including our employees,
the communities around our mines,
national government in addition to our
shareholders. Across the board, South
African companies have embraced
the needs of all stakeholders into their
operations, by virtue of the socio economic
issues facing all aspects of business, and
Rockwell ranks amongst the leaders,
in spite of its relatively small size. With
our operations in the Northern Cape, a
region of high unemployment, we offer
significant career opportunities to local
graduates in their chosen fields, close
to their homes and within a nurturing
professional environment. During the year,
we continued to develop and mentor
our young professionals, particularly in
the areas of geology and metallurgy,
who are increasingly contributing to our
business successes while also becoming
local role models for other members of
the Rockwell family, and entrenching our
culture that people are our most important
asset. The South African mining sector saw
unprecedented levels of labour unrest in
the last year. Rockwell was largely shielded
from these issues, testifying to the success
of our efforts to embrace our people and
local communities.
One of the final outstanding legacy issues
facing Rockwell, securing a new black
economic empowerment (“BEE”) partner
in terms of South African law, was resolved
during the year. Rockwell concluded
an agreement with African Renaissance
Holdings Limited (“ARH”) to acquire a
30% equity stake in the Company’s Middle
Orange operations. ARH, founded in
1994, has an established track record
in value creating BEE transactions and
championing active participation and
ownership by black South Africans in
strategic economic sectors. The purchase
consideration amounted to US$7.3 million,
with an initial subscription deposit of
$1.7 million, which is still outstanding.
The finalization of this strategic partnership
is an important milestone in Rockwell’s
journey to build a leading value-focused
African diamond business with a strong
social license to operate in partnership with
all our stakeholders.
As we continue to grow Rockwell, our
focus has started to look beyond delivering
on production and financial targets and
developing our own growth opportunities.
We have noted renewed investor interest
in the diamond sector and Rockwell’s
successes and so we have started to review
value accretive consolidation opportunities
in the southern Africa diamond sector that
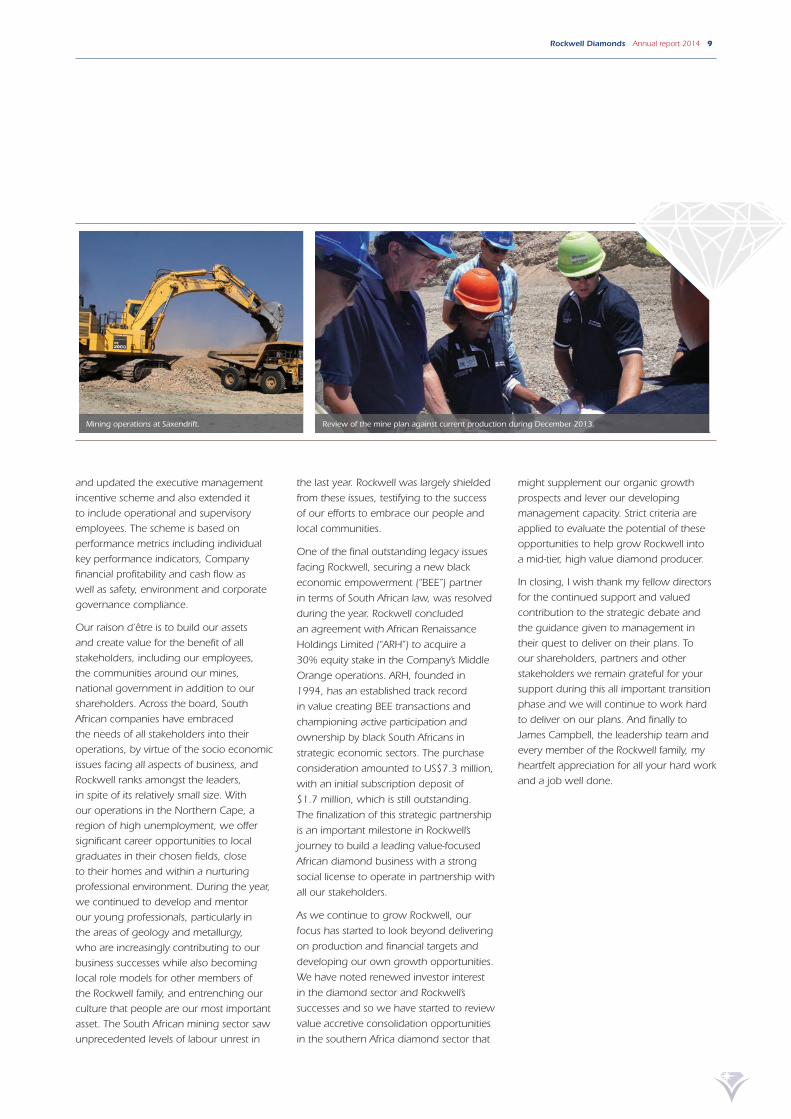
Mining operations at Saxendrift. Review of the mine plan against current production during December 2013.
might supplement our organic growth
prospects and lever our developing
management capacity. Strict criteria are
applied to evaluate the potential of these
opportunities to help grow Rockwell into
a mid-tier, high value diamond producer.
In closing, I wish thank my fellow directors
for the continued support and valued
contribution to the strategic debate and
the guidance given to management in
their quest to deliver on their plans. To
our shareholders, partners and other
stakeholders we remain grateful for your
support during this all important transition
phase and we will continue to work hard
to deliver on our plans. And finally to
James Campbell, the leadership team and
every member of the Rockwell family, my
heartfelt appreciation for all your hard work
and a job well done.

10 Rockwell Diamonds Annual report 2014
CHIEF EXECUTIVE OFFICER’S REPORT
• Strong delivery against focussed Middle Orange River strategy.
• Achieved short-term target of having three producing mines: Two new internally funded mines completed.
• Improved quality and consistency of production profile.
• Five rough diamonds exceeding 115 carats recovered in the Middle Orange River region.
INTRODUCTIONRockwell’s fiscal 2014 results are beginning
to reflect the operational turnaround of the
Company and its core focus on the Middle
Orange River (“MOR”) region of South
Africa. Revenue increased 39% year-on-
year, underpinned by a 52% increase in
diamond sales. These improvements have
been consistent each quarter over the last
two years, as Rockwell has now reported
seven consecutive quarters of dollar
denominated revenue growth.
Economies of scale as a result of operating
exclusively in the MOR also emerged, as
production costs for the year increased
25%, against the 52% improvement
in the value of diamond sales. The
implementation of an earthmoving vehicle
upgrade program is expected to unlock
further benefits by improving the fleet’s
overall utilization to match production
capacity and renew the equipment to
lower our maintenance expenses while
improving availabilities.
The MOR focus also gained traction
from an operational perspective with
two new mines delivered in fiscal 2014,
namely Saxendrift Hill Complex (“SHC”)
and Niewejaarskraal, both funded
internally from cash reserves, more than
doubling the MOR production capacity to
340,000m3 per month. Rockwell met its
short-term target to have three producing
mines in the MOR, and its production
profile is also more flexible and sustainable.
The diamond quality and the frequency
of larger stones improved as anticipated.
This included the recovery of 12 stones
between 50 carats and 100 carats and five
plus 100 carat rough diamonds.
James Campbell President and Chief Executive Officer
The Alana, a 169 carat MOR yellow diamond recovered from SHC in September 2013.

Rockwell Diamonds Annual report 2014 11
STRATEGY REVIEWRockwell’s fiscal 2014 results reflect the
benefits of the strategy to grow its MOR
production footprint with a mid-term
target to increase monthly production
volumes of quality gravel processed to
500,000m3. Higher diamond values, better
efficiencies and greater economies of scale
can be achieved in this region to deliver
more consistent quarterly earnings at a
predictable mining cost.
During the year, the Company
progressively refocussed its resources
to grow its production in the region,
facilitated by the sale of Klipdam and
transferring operations at the Tirisano
property to a royalty contract mining
model. At the same time, Rockwell
delivered two new mines in the MOR,
increasing its producing mines in the
region to three, from one at the end of the
prior year. The benefits of this strategy have
started to emerge and during fiscal 2014,
Rockwell made solid progress against a
number of strategic milestones:
• The short-term goal of delivering three
producing operations in the region
was met with the commissioning of
SHC and Niewejaarskraal, bringing the
total monthly processing capacity to
340,000m3*.
• Resources are mined from the
Saxendrift, Saxendrift Extension, SHC
and Niewejaarskraal mining rights
and all have multiple mining faces,
providing benefits from production
diversification and mining flexibility.
• Five rough diamonds exceeding
115 carats were recovered in the MOR in
fiscal 2014, the largest of which was
287 carats, the biggest diamond
recovered in the area in recorded history.
• Three mines in the MOR were in full
production by the fourth quarter.
The average stone size in the quarter
increased 139% to 4.6 carats, up
from 2.0 carats in the prior year when
Rockwell had only one MOR operation
in production. The anticipated rate
of recovery of large diamonds also
materialized, with four rough diamonds
in the plus 50 carat category being
produced in the fourth quarter,
compared to two in comparable period
of the previous year.
• Volumes processed from Rockwell’s
three MOR mines were up 46% year-on-
year, yielding a 12% increase in average
grade and carat production up 63% in
the region from a year ago.
• Carat production at the Saxendrift
processing plant increased 12% to
9,338 carats, despite a 10% decline
in volumes of gravel processed. Its
mine life has been extended, at higher
overall grades after integrating the
newly acquired Saxendrift Extension
property into the Saxendrift mine plan.
• The production ramp up at SHC,
the new internally funded Bulk X-ray
processing plant, was completed and
3,363 carats were recovered, of which
2,945 carats were sold at an average
value of US$2,781 per carat.
• The Bulk X-ray technology at Saxendrift
Hill Complex delivered a grade
improvement of more than 40%
compared to the traditional Saxendrift
pan plant, shown by processing
Saxendrift Extension gravels in parallel
though both plants.
• The lossmaking Klipdam Mine was
sold in April 2013 and the proceeds
reinvested in a new processing plant
to bring Niewejaarskraal back into
production.
• A 100,000m3 per month plant
was completed at Niewejaarskraal,
comprising a DMS (dense media
separation), an in field screen and
Bulk X-ray system and the throughput
reached nameplate capacity by fiscal
year end.
• A fleet renewal program to renew the
Company’s aging fleet is now approved
and underway. This will improve
earthmoving availabilities and thereby
facilitate higher mining volumes at
Saxendrift to better utilize the invested
processing capacity.
REVENUE
UP39%
SevenQUARTERS
OF US$ REVENUE GROWTH
AVERAGE CARAT VALUE FROM OWN
OPERATIONS
UP73%
US$2.6 mNET CASH FLOW
FROM OPERATING ACTIVITIES
Of the five polished diamonds exceeding 100 carats that were produced worldwide in 2013, two were cut from diamonds recovered by Rockwell.
* This comprises Saxendrift (160,000m3/month at a 5mm bottom cut-off size (“BCOS”)), SHC (80,000m3/month at a 5mm BCOS) and Niewejaarskraal (100,000m3/month at a 6mm BCOS).

12 Rockwell Diamonds Annual report 2014
CHIEF EXECUTIVE OFFICER’S REPORT continued
PRODUCTION AND SALES REVIEW PERFORMANCE The Company’s overall production and sales results for the year are:
Production
Year ended February 28, 2014 Year ended February 28, 2013 Change
Volume(cubic
meters) Carats
Production costs
($)
Volume(cubic
meters) Carats
Production costs
($) Volume CaratsProduction
costs
Total: Own operations 2,662,901 14,222 39,200,432* 2,882,152 18,705 31,338,217 (8%) (24%) 25%
Contractors’ mining* 1,098,161 13,554 – – 1,263 – – 973% –
Saxendrift tailings – – – 47,845 1,903 – – – –
Total 3,761,062 27,776 39,200,432 2,929,997 21,871 31,338,217 28% 27% 25%
Sales, revenue and inventory
Year ended February 28, 2014 Year ended February 28, 2013 Change
Sales(carats)
Valueof sales
(US$)
Averagevalue
(US$ per carat)
Inventory (carats)
Sales(carats)
Valueof sales
(US$)
Averagevalue
(US$ per carat)
Inventory (carats) Sales
Valueof sales
Averagevalue
Total: Own operations 13,782 29,530,594 2,143 1,571 17,861 22,082,654 1,236 1,115 (23%) 34% 73%
Contractors’ mining* 12,490 9,449,127 756 1,181 989 759,075 768 117 1,163% 1,145% (2%)
Saxendrift tailings – – – – 1,887 4,407,492 2,336 16
Total 26,272 38,979,721 1,484 2,752 20,737 27,249,221 1,314 1,248 27% 43% 13%
* Includes ramp up costs at Saxendrift Hill Complex and Niewejaarskraal as well as modifications and other improvements to these two new mines.
The first blast at Niewejaarskraal in August 2013. James Campbell, CEO, Rockwell Diamonds, with the 287 carat rough diamond recovered in November 2013.

Rockwell Diamonds Annual report 2014 13
• The royalty mining contractor strategy,
implemented in the prior year, enabled
the Company to generate positive
returns from properties that it does
not wish to mine itself. Value of sales
amounts to US$9.4 million, with
US$1.2 million in royalties accruing to
the Company.
• The Company reported a gross profit
(after amortization and depreciation) of
$6.0 million compared to a loss of
$1.1 million a year ago.
PRODUCTION AND SALES REVIEW FOR FISCAL 2014Processed gravel volumes from
Company properties increased 28% to
3,761,062m3 comprising 2,662,901m3
from Rockwell’s own operations, and
the remainder processed by the royalty
mining contractors. Rockwell achieved
a 6% grade improvement across the
Company’s properties to 0.74 carats/100m3,
resulting in a 27% increase in total carat
production, including 14,222 carats from
own operations and 13,554 carats from
contractors.
Diamond sales from own operations
declined 23% to 13,782 carats, reflecting
the transition of the production profile
into the MOR that included the sale of
Klipdam and termination of mining at the
Tirisano property. The five royalty mining
contractors who subsequently started
operating at Tirisano sold a total of
12,490 carats during the year, resulting
in a 27% increase in carat sales from
Company-owned properties. The value of
sales from own operations was up 34% to
US$29.5 million while the average carat
value rose 73% to US$2,143, demonstrating
immediate benefits of the strategy to focus
on the MOR as several large, high value
stones were sold into the beneficiation joint
venture with Diacore. The value of sales
from Company-owned properties improved
43% to US$39.0 million.
Average stone size in the fourth quarter up 139% to 4.6 carats (Q4 F2013: 2.0 carats).
Cash cost (including rehabilitation and royalty payments) per operation:
Revenue/m3
Mining cash cost/m3 Comments
Saxendrift US$12.4 US$10.9 Unit cost impacted by longer hauling
distance as a result of mining Saxendrift
Extension, higher EMV maintenance
costs and lower volumes processed.
Saxendrift Hill
Complex
US$11.7 US$10.0 Continued high quality diamond
recoveries supporting unit revenues.
Unit cost declined in line with increase
in volumes processed. Fiscal 2014
figures include ramp up costs.
Niewejaarskraal US$2.7 US$23.6 Unit revenues impacted by lower carat
values during commissioning phase.
First quarter of expensed costs impacted
by lower volumes during final ramp up
and completion of second commissioning
phase.
SAXENDRIFTThe performance of the Saxendrift
operation continued to improve and
it benefited from higher grades after
incorporating the Saxendrift Extension
property into Saxendrift’s mine plan.
However, overall volumes were impacted
by low earthmoving availabilities because
of the aging fleet and longer haulage
distances due to mining on the Saxendrift
Extension. Notwithstanding a 10%
reduction in volumes of gravel processed
to 1,597,989m3, carat production
increased 12% to 9,338 carats. Revenue
from diamond sales was up 32%,
amounting to US$19.9 million from the
sale of 9,059 carats at an average price
of US$2,194 per carat.
The mine achieved revenue of
US$12.4 per m3 (fiscal 2013:
US$8.41 per m3) with the increase
due to the sale of several exceptional
stones during the period.
The mine’s cash unit cost was
US$10.9 per m3 (fiscal 2013:
US$7.78 per m3). Unit costs were
impacted by the longer haulage
distances, higher EMV maintenance
costs and lower volumes processed.
SAXENDRIFT HILL COMPLEXSaxendrift Hill Complex, whose processing
plant comprises a Bulk X-ray system that
pioneered the implementation in South
Africa in both the concentrator and
recovery environment, was commissioned
in March 2013 and achieved full
production in August 2013. The plant
has a monthly throughput capacity
of 80,000m3 and was built for a total
capital budget of $2.5 million. Diamond
recoveries amounted to 3,363 carats
from 697,702 m3 of gravel processed
in line with the current status of ramp
up to full production. Gravels processed
included material mined from SHC and
the Saxendrift Extension project. The mine
generated US$8.2 million from the sale
of 2,945 carats at an average value of
US$2,781 per carat.

14 Rockwell Diamonds Annual report 2014
CHIEF EXECUTIVE OFFICER’S REPORT continued
The mine achieved revenue of
US$11.7 per m3 supported by high
quality diamond recoveries.
The mine’s cash unit cost was
US$10.0 per m3, having shown a
consistent decline during the year as
the production ramp up gained
momentum and the mine reached
nameplate capacity.
NIEWEJAARSKRAALThe proceeds from the sale of Klipdam
were used to build a new processing plant
at Niewejaarskraal and bring the mine,
which had been on care and maintenance
since 2007, back into production. The
construction of the first phase, based on
dense media separation, was completed
within 10 weeks of obtaining board
approval for the project. The second phase
of the new processing plant to double the
plant capacity to 100,000m3 per month
consisted of an in-field screen (“IFS”) and a
Bulk X-ray system, and was completed at
fiscal year end.
Initial grades and recoveries at the new
mine were disappointing, because mining
had to take place on an adjacent property
while renegotiating the surface rental
agreement on the main property. However,
once this was resolved, and a detailed
review of the existing geological data was
completed, mining commenced according
to the new 18-month mine plan in mid-
February 2014. Two mining faces have
been opened up, adjacent to the IFS, and
these should enable higher productivity
BENEFITS OF THE DIAMOND VALUE MANAGEMENT STRATEGY:Why the 500,000m3/month quality processed gravel target?
Past (Actual)
110,000m3 340,000m3 500,000m3
Saxendrift 110,000m3/
month
Saxendrift 160,000m3/
month
Niewe- jaarskraal 100,000m3/
month
SHC 80,000m3/
month
Saxendrift 160,000m3/
month
Niewe- jaarskraal 100,000m3/
month
Wouters- pan (phased)
starting at 150,000m3/
month
SHC 80,000m3/
month
Mines
Monthly throughput
Quarterly revenue*
Revenue Revenue Revenue
Number of +50 carat stones per year*
5 17 25
Current (Actual) Future (Plan)
Four rough diamonds exceeding 50 carats produced in fourth quarter (Q4 F2013: two +50 carat stones).
* Indicative quarterly revenue and +50 carat stone production based on technical reports.

Rockwell Diamonds Annual report 2014 15
and provide optionality in the mine plan. Early indications are that the grade and diamond values are now approaching budget.
Total volumes of gravel processed in fiscal 2014 amounted to 301,508 m3, from which 986 carats were recovered. This was in line with the current plan for ramp up of the second phase of the mine development.
Sales from Niewejaarskraal amounted to 747 carats with total revenue of $826,025 at an average price of US$1,107 per carat. Carat values are expected to improve and reflect the higher carat values that characterize the MOR region as the volumes processed at the mine increase.
TIRISANOHaving adopted the royalty contract mining strategy at Tirisano, late in fiscal 2013, five contracts were in operation at year end.
Consistent results were achieved by the mining contractors at Tirisano, with total volumes of gravel processed by mining contractors amounting to 1,098,161m3 during the year, from which 13,554 carats were recovered.
A total of 12,490 carats were sold with total proceeds of US$9.4 million. The Company’s 12.5% royalty amounted to US$1.2 million from gross diamond sales in fiscal 2014.
The consistency of results from the royalty mining contractor agreements at Tirisano is now enabling the Company to take a measured approach to assessing the future options of some of its remaining non-core assets.
GROWTH PROJECTSRockwell continues to make progress towards its strategy to increase production from and extend the mine life of its MOR properties:
• Contiguous exploration of existing resources at the Saxendrift Extension property is underway to increase the current life of mine and to enable the Company to leverage the fixed assets of Saxendrift.
• A focussed exploration and trial mining
program is underway at SHC to ensure
the resource potential is maximized and
to develop contiguous areas.
• Through trial mining1, the
Niewejaarskraal inferred resource will
be upgraded to the Indicated level with
the eventual declaration of probable
reserves.
• The Company continues to review
various options to bring the Wouterspan
property to account following the
completion of a preliminary economic
assessment in the first quarter of 2013
that reflected viable economics.
Rockwell is also working towards its
secondary strategy to leverage the value
of certain properties that it does not wish
to mine due to size or other reasons.
Five royalty contract miners operated at
Tirisano during the year with the projected
monthly mining volumes at Tirisano being
200,000m3.
The royalty mining contractor agreement
at Kwartelspan, which commenced
construction in the fourth quarter of fiscal
2014, was converted into a joint venture
mining arrangement early in fiscal 2015.
The Company continues to evaluate consolidation opportunities in the southern Africa diamond sector that are value accretive.
A strict set of criteria is applied to evaluate
the potential acquisitions in order to
leverage the Company’s production
expertise towards its goal to become a
mid-tier diamond producer.
OUTLOOKThe current focus areas for the business are
as follows:
• Rockwell continues to focus on
managing its operating costs.
• At Saxendrift, which is operating
consistently, the Company’s focus is
to complete the implementation of
the earthmoving vehicle (“EMV”) fleet
optimization exercise which will improve
equipment availabilities to enable the
mine to operate at nameplate capacity,
while an option to increase the plant
capacity is also being reviewed.
• At SHC, continuous exploration work
and trial mining is ongoing to increase
this resource. Although the Bulk X-ray
recovery system continues to perform
on plan, first quarter gravel throughput
at the processing plant was impacted
by mechanical failures associated
with the front end of second-hand
equipment and EMV availability, both
of which are being addressed as a high
priority.
• At Niewejaarskraal the focus is on
consolidating the operations now that
the second phase of the 100,000m3 per
month plant has been completed.
Rockwell carried over an inventory of
2,752 carats (including 1,181 contractor
owned carats) into the new fiscal year.
This, together with a beneficiation pipeline
comprising more than 6,000 carats,
provides further potential for value-
added downstream revenues. Rockwell
continues to beneficiate the vast majority
of its diamonds in South Africa. The sale
of the Alana, a 109 carat vivid yellow
polished diamond will be reflected in the
first quarter beneficiation income and
with the MOR focus, the outlook for the
beneficiation revenue trend is positive.
1 Because the Niewejaarskraal mine is currently extracting diamonds from an inferred resource, the Company is required, under the rule of the NI 43-101, to refer to the mining operations as trial mining.

16 Rockwell Diamonds Annual report 2014
CHIEF FINANCIAL OFFICER’S REPORT
Gerhard Jacobs Chief Financial Officer Retired with effect from July 11, 2014
• Revenue up 39% year-on-year to $45.2 million, underpinned by 52% in value of diamond sales.
• Operating profit before amortization and depreciation of $6.0 million, up from $1.1 million in prior year.
• General and administration expenses declined 24% to $4.4 million.
• Cash and cash equivalents of $1.3 million after capital investments of $8.7 million in new processing capacity.
• Positive cash flow from operating activities of $2.6 million.
• Returns from royalty mining contracts deliver net royalties of $1.2 million.
Rockwell’s typical run of mine production creates a firm foundation.

Rockwell Diamonds Annual report 2014 17
The performance of the Group for the
twelve months ended February 28, 2014
reflects the current status of its corporate
turnaround.
STATEMENT OF COMPREHENSIVE INCOMEDuring the year ended February 28, 2014,
Rockwell realized rough diamond sales of
$41.1 million compared to $27.1 million
for the comparable period in the prior
year. Sales were at an average price of
US$1,484 compared to US$1,314 per
carat for the comparative period as the
operations in the Middle Orange River
gained momentum and the average
stone size increased consistently during
the year.
Gross diamond revenues amounted to $45.2 million (fiscal 2013: $32.4 million) with the growth driven by the increase in carat sales.
Tender sales amounted to $41.1 million
with a further $4.1 million in income
earned from the beneficiation profit share
arrangements.
Production costs increased to $39.2 million
(fiscal 2013: $31.3 million), which includes
a period change in inventory credit of
$2.4 million (February 28, 2013: credit of
$1.2 million) and excludes amortization
and depreciation charges of $5.9 million
(year ended February 28, 2013:
$7.2 million). This was mainly as a result
of increased production volumes and
some commissioning costs as well as
expenses related to improvements at
the two new mines.
An operating profit before depreciation
and amortization of $6.0 million was
recorded for the year (fiscal 2013:
$1.1 million). General and administration
expenses continued to show a decline with
increased focus on overhead costs, the
delisting from the USA (“OTCBB”) and the
absorption of corporate activities in-house.
A foreign currency reserve was realized
during the year relating to the sale of
subsidiaries. This amounted to a
$6.6 million loss. This had no cash flow
effect on the Group and was effectively
a reallocation of a foreign currency
translation reserve that has moved through
the income statement.
The Group recorded a loss of $10.4 million
for the year ended February 28, 2014
(fiscal 2013: a loss of $13.8 million).
In line with the Company’s approach to
maximize available manpower and capital,
operations at Wouterspan and Tirisano
remain on care and maintenance although
contracted out to independent miners,
while new operations Saxendrift Hills
Complex and Niewejaarskraal replaced
the carat contribution of own operations
after the sale of Holpan/Klipdam and the
Tirisano operations being placed on care
and maintenance during the prior year.
FINANCIAL POSITIONAt February 28, 2013 the Group had
cash and cash equivalents of $1.3 million
(February 28, 2013: $5.6 million) and
bank indebtedness of $3.1 million
(February 28, 2013: $2.8 million), for net
cash holdings of $1.8 million overdrawn
(February 28, 2013: $2.8 million available).
The Group had negative working capital of
$(1.7) million compared to $1.2 million at
February 28, 2013. The major reason for
the reduction in net cash was the timing
of sales receipts and substantial capital
expenditure at Niewejaarskraal and SHC.
CONCLUSIONManagement considered the available
cash resources at year end, the value
realized through diamond tenders post
year end and estimated the cash flows
from operations for the 24 month period
post year end. Based on this information
management concluded that the Group
will have available cash resources to settle
its liabilities as they fall due.
The operations are now generating
sufficient cash to cover cash operating
costs and Group overheads and the
Company does not anticipate making
substantial capital expenditures without
concurrent financing in the coming twelve
months. The Group has adequate cash
holdings as well as access to short-term
debt facilities (bank overdraft facility) to
meet its working capital requirements
for the foreseeable future.

18 Rockwell Diamonds Annual report 2014
SUMMARY OF QUARTERLY RESULTS
The summarized results are expressed in thousands of Canadian dollars (000), except per-share amounts. Minor differences are due to
rounding.
Feb 28 2014
Nov 30 2013
Aug 31 2013
May 31 2013
Feb 28 2013
Nov 302012
Aug 31 2012
May 31 2012
CONSOLIDATED STATEMENTS OF FINANCIAL POSITIONCurrent assets 14,655 13,710 11,801 12,057 13,860 13,066 11,484 17,310
Mineral property interests 26,642 28,205 28,314 28,290 31,405 31,873 33,824 32,967
Other non-current assets 38,040 37,105 37,130 34,685 40,459 46,442 49,268 51,079
Total assets 79,337 79,020 77,245 75,005 85,724 91,381 94,576 101,356
Current liabilities 16,371 12,499 12,140 10,501 12,646 12,450 9,713 11,057
Non-current liabilities 15,736 18,460 17,419 15,533 17,706 21,789 20,521 21,877
Total equity 47,230 48,061 47,686 48,971 55,372 57,142 64,342 68,422
Total equity and liabilities 79,337 79,020 77,245 75,005 85,724 91,381 94,576 101,356
Working capital (1,716) 1,211 (339) 1,556 1,214 616 1,771 6,253
CONSOLIDATED STATEMENTS OF COMPREHENSIVE INCOMERevenue 14,407 11,854 9,869 9,040 9,146 8,757 7,404 7,098
Diamond sales 13,448 11,222 8,614 7,823 6,922 7,149 6,964 6,071
Beneficiation Income 959 632 1,255 1,217 2,224 1,608 440 1,027
Production cost (12,784) (11,730) (8,805) (8,313) (8,146) (9,630) (7,044) (7,705)
Inventory movement (2,040) 2,654 1,470 347 (1,279) 1,823 (160) 803
Operating (loss)/profit (417) 2,778 2,534 1,074 (279) 950 200 196
Amortization and depreciation (1,885) (1,500) (1,291) (1,260) (1,431) (1,906) (1,936) (1,897)
Gross (loss)/profit (2,302) 1,278 1,243 (186) (1,710) (956) (1,736) (1,701)
Expenses
Net reclamation obligation recognized
(utilized) 818 (331) (1,158) (72) 4,597 (567) 16 (496)
Other income/(expense) 677 210 153 109 357 104 53 85
General and admin costs (6,960) (1,320) (1,017) (1,253) (7,320) (1,336) (1,118) (1,443)
Profit/(loss) before net finance costs (7,767) (163) (779) (1,402) (4,076) (2,755) (2,785) (3,555)
Finance income 284 161 86 168 277 158 160 69
Finance lease obligation (7) (10) (12) (21) (34) (38) (38) (43)
Other finance cost (533) (189) (186) (179) (742) (216) (148) (148)
Profit/(loss) after net finance costs (8,023) (201) (891) (1,434) (4,625) (2,851) (2,811) (3,677)
Share of (loss)/profit from equity accounted
investment (24) 27 24 32 17 23 (8) 27
(Loss)/profit before taxation (8,047) (174) (867) (1,402) (4,608) (2,828) (2,819) (3,650)
Taxation 609 (205) (577) 236 947 (1,841) 408 616
(Loss)/profit for the period (7,438) (379) (1,444) (1,166) (3,661) (4,669) (2,411) (3,034)
Non-controlling interest (269) 22 67 (11) 623 950 394 909
(Loss)/profit for the period – Owners of the Group (7,707) (357) (1,377) (1,177) (3,038) (3,719) (2,017) (2,125)
Basic and diluted (loss)/profit per share (0.15) (0.01) (0.03) (0.02) (0.06) (0.08) (0.04) (0.04)
Weighted average number of common shares
outstanding (thousands) 52,511 49,596 48,888 48,833 48,349 48,409 48,409 48,174

OPERATIONAL REVIEW
20 Rockwell Diamonds Annual report 2014
MINERAL RESOURCE SUMMARY
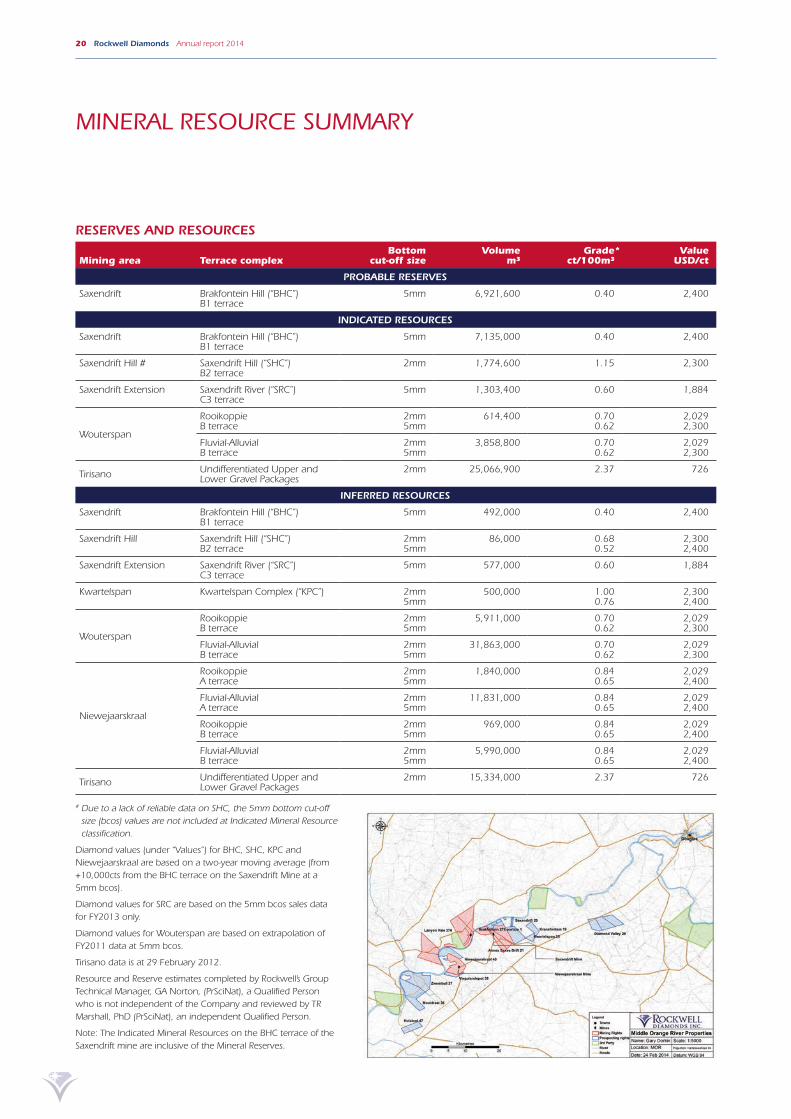
RESERVES AND RESOURCES
Mining area Terrace complexBottom
cut-off sizeVolume
m³Grade*
ct/100m³Value
USD/ct
PROBABLE RESERVES
Saxendrift Brakfontein Hill (“BHC”)B1 terrace
5mm 6,921,600 0.40 2,400
INDICATED RESOURCES
Saxendrift Brakfontein Hill (“BHC”)B1 terrace
5mm 7,135,000 0.40 2,400
Saxendrift Hill # Saxendrift Hill (“SHC”) B2 terrace
2mm 1,774,600 1.15 2,300
Saxendrift Extension Saxendrift River (“SRC”) C3 terrace
5mm 1,303,400 0.60 1,884
Wouterspan
Rooikoppie B terrace
2mm5mm
614,400 0.700.62
2,0292,300
Fluvial-AlluvialB terrace
2mm5mm
3,858,800 0.700.62
2,0292,300
Tirisano Undifferentiated Upper and Lower Gravel Packages
2mm 25,066,900 2.37 726
INFERRED RESOURCES
Saxendrift Brakfontein Hill (“BHC”)B1 terrace
5mm 492,000 0.40 2,400
Saxendrift Hill Saxendrift Hill (“SHC”) B2 terrace
2mm5mm
86,000 0.680.52
2,3002,400
Saxendrift Extension Saxendrift River (“SRC”) C3 terrace
5mm 577,000 0.60 1,884
Kwartelspan Kwartelspan Complex (“KPC”) 2mm5mm
500,000 1.000.76
2,3002,400
Wouterspan
Rooikoppie B terrace
2mm5mm
5,911,000 0.700.62
2,0292,300
Fluvial-AlluvialB terrace
2mm5mm
31,863,000 0.700.62
2,0292,300
Niewejaarskraal
Rooikoppie A terrace
2mm5mm
1,840,000 0.84 0.65
2,0292,400
Fluvial-AlluvialA terrace
2mm5mm
11,831,000 0.84 0.65
2,0292,400
Rooikoppie B terrace
2mm5mm
969,000 0.84 0.65
2,0292,400
Fluvial-AlluvialB terrace
2mm5mm
5,990,000 0.84 0.65
2,0292,400
Tirisano Undifferentiated Upper and Lower Gravel Packages
2mm 15,334,000 2.37 726
# Due to a lack of reliable data on SHC, the 5mm bottom cut-off size (bcos) values are not included at Indicated Mineral Resource classification.
Diamond values (under “Values”) for BHC, SHC, KPC and Niewejaarskraal are based on a two-year moving average (from +10,000cts from the BHC terrace on the Saxendrift Mine at a 5mm bcos).
Diamond values for SRC are based on the 5mm bcos sales data for FY2013 only.
Diamond values for Wouterspan are based on extrapolation of FY2011 data at 5mm bcos.
Tirisano data is at 29 February 2012.
Resource and Reserve estimates completed by Rockwell’s Group Technical Manager, GA Norton, (PrSciNat), a Qualified Person who is not independent of the Company and reviewed by TR Marshall, PhD (PrSciNat), an independent Qualified Person.
Note: The Indicated Mineral Resources on the BHC terrace of the Saxendrift mine are inclusive of the Mineral Reserves.
Rockwell Diamonds Annual report 2014 21
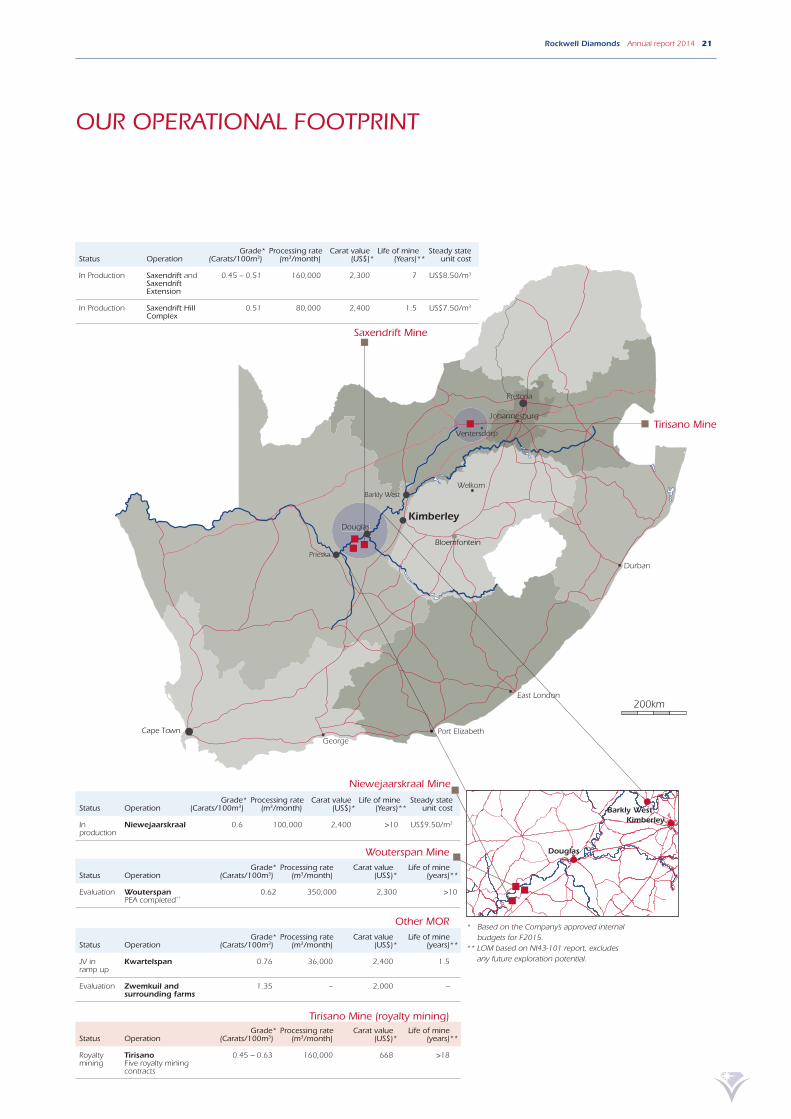
OUR OPERATIONAL FOOTPRINT
Pretoria
Bloemfontein
Douglas
Cape Town
Johannesburg
Durban
East London
Port Elizabeth
Kimberley
Welkom
George
Douglas
Ventersdorp
200km
®
Saxendrift Mine
Douglas
KimberleyBarkly West
Niewejaarskraal Mine
Wouterspan Mine
Status OperationGrade*
(Carats/100m3)Processing rate
(m3/month)Carat value
(US$)*Life of mine
(years)**
Evaluation Wouterspan PEA completed**
0.62 350,000 2,300 >10
Tirisano Mine (royalty mining)
Status OperationGrade*
(Carats/100m3)Processing rate
(m3/month)Carat value
(US$)*Life of mine
(years)**
Royalty mining
TirisanoFive royalty mining contracts
0.45 – 0.63 160,000 668 >18
Other MOR
Status OperationGrade*
(Carats/100m3)Processing rate
(m3/month)Carat value
(US$)*Life of mine
(years)**
JV in ramp up
Kwartelspan 0.76 36,000 2,400 1.5
Evaluation Zwemkuil and surrounding farms
1.35 – 2,000 –
Status OperationGrade*
(Carats/100m3)Processing rate
(m3/month)Carat value
(US$)*Life of mine
(Years)**Steady state
unit cost
In production
Niewejaarskraal 0.6 100,000 2,400 >10 US$9.50/m3
Status OperationGrade*
(Carats/100m3)Processing rate
(m3/month)Carat value
(US$)*Life of mine
(Years)**Steady state
unit cost
In Production Saxendrift and Saxendrift Extension
0.45 – 0.51 160,000 2,300 7 US$8.50/m3
In Production Saxendrift Hill Complex
0.51 80,000 2,400 1.5 US$7.50/m3
* Based on the Company’s approved internal budgets for F2015.
** LOM based on NI43-101 report, excludes any future exploration potential.
Tirisano Mine
Prieska
Barkly West

22 Rockwell Diamonds Annual report 2014
WALTER BOLD Group Engineer
CAROL RINGANE Data Analyst
ATTIE BENSONGroup Security Manager
GARY DORKIN Regional Geologist
RICHARD REEDConsultant: Corporate Finance
KEVIN VAN RENSBURG ICT Manager
DR KURT PETERSEN Consulting Metallurgist
PAUL HLASOA HR Officer: Industrial Relations
GEORGE STEVENS Geological Manager
STÉPHANIE LECLERCQ Investor Relations and Corporate Development Manager
JERRY MPISEKHAYA Training Officer
ROELIEN OOSTHUIZEN MLE Manager
EXCO
JEFFREY BRENNER Diamond Sales and Marketing Manager
LYNN FRYLINK HR Manager: Operations
BRENDA BARRETO Mine Accountant
JOHAN OOSTHUIZEN Financial Manager: Operations
PAUL MAY Group Financial Manager
JOHN SHELTONChief Financial Officer – incoming
GERHARD JACOBS Chief Financial Officer – outgoing
MELCHIOR VAN NIEKERK CEO, CML Operations
EXCO
EXCO
RICHARD MHLONTLO Group HR and IR Manager, safety and sustainability
EXCO
JAMES CAMPBELL Chief Executive Officer
EXCO
GLENN NORTON Group Technical Manager
EXCO
EXCO
OPERATIONAL ORGANOGRAM

Rockwell Diamonds Annual report 2014 23
DANIELLE DU TOIT HR Officer
MAHLODI MALOWA Mine Geologist
BRYN BRANDT Engineering Manager
SAREL KRIEL Fleet Maintenance Manager
PENELOPE MOHALE Mine Geologist
THEO GREEF Safety Officer
JOHAN SPAARWATER Plant Manager
DAWID KARELSE Pit Superintendent
KOGGIE MOSTERT Senior Production Manager
BEN NELL Tirisano Contracts Manager
BADENHORST DIAMANTE
VISKA DELWERY
GOTHOMA DELWERY
MULALO NDWAMMBI Mining Manager
PETRONELLA MOHALE Mine Geologist
COBUS BOTHAPlant Manager
SUSAN NIEMAND Safety Officer
NALEDI KAU HR Officer
RIAAN LUBBE Engineering Manager
CHARLIE HARTMAN Ore Manager (CML)
FRANS BEZUIDENHOUTSenior Production Manager
WIKUS DE WINNAAR General Manager: MOR
SAXENDRIFT SAXENDRIFT HILL COMPLEX
GUMP MINING KWARTELSPAN JOINT VENTURE
RICHARD HORNExploration Geologist

24 Rockwell Diamonds Annual report 2014
OPERATIONAL REVIEWMiddle Orange River: Saxendrift Mine
CARATS PRODUCED
UP12%
AVERAGE GRADE
UP23%
VALUE OF SALES
UP32%
SALIENT FEATURES
• Volumes processed through the
Saxendrift processing plant comprised
35% from traditional Saxendrift mining
area (Brakfontein) and remainder from
the higher grade Saxendrift Extension
property.
• Grade improved 23% to 0.58 carats/m3,
due to increased mining at Saxendrift
Extension, in line with the mine plan.
Eight months of mining at Saxendrift
Extension is planned in fiscal 2015.
• Consistent performance from Saxendrift
processing plant although OPU
(78%) was impacted by earthmoving
availability and ore availability.
• Plant optimization program
implemented to cost effectively update
the yellow fleet, including holistic
review to match equipment to mine
plan and processing capacity.
• Newly defined NI43-101 compliant
resource at Saxendrift Extension
integrated into Saxendrift mine plan.
• Volumes processed down 10%, due
primarily to longer haulage distances
on Saxendrift Extension gravels and
earthmoving availabilities.
• The reported cash unit cost of
US$10.9/m3 was negatively impacted
by higher maintenance on the aging
fleet. However, implementing the fleet
enhancement program is expected to
reduce the mine’s unit cost to a steady
level of approximately US$8.50/m3.
• Notable stones recovered during the
year included:
– 20 – 49 carats: 45 stones
– 50 – 99 carats: Nine stones
– +100 carats: Three stones
(116.33 carats, 138.22 carats
and 287.35 carats).
Koggie Mostert Senior Production Manager
MINE SPECIFICATIONS
The 5,142 hectare Saxendrift Mine
property is located on the south
bank of the Middle Orange River
and adjacent to the Wouterspan
property. Four kilometers from the
Saxendrift processing plant is the
616 hectare Saxendrift Extension
property that has extended
the mine life of Saxendrift to
seven years.
PRODUCTION AND SALES
2014 2013 Change
Volume (m3) 1,597,989 1,775,130 (10%)
Carats 9,338 8,373 12%
Average grade (carats per 100m3) 0.58 0.47 23%
Cash unit cost (US$ per m3) US$10.9 US$7.78 40%
Sales (carats) (excluding beneficiation) 9,059 7,821 16%
Value of sales (US$) 19,873,666 15,005,461 32%
Average value (US$ per carat) 2,194 1,918 14%
Inventory at end of period (carats) 914 635 44%
PLANT SPECIFICATIONS
Ore preparationTrommel screen: 4 x 450tph
De-sanding screen: 1 x 650tph
Scrubber: 4 x 50tph
Ore enrichmentPans: 4 x 50tph
Final recoveryFlow sort machine: 12 x (17tph total)
Saxendrift geology team inspect gravels in the mining area with first bulldozer rebuilt in the foreground.

Rockwell Diamonds Annual report 2014 25
51
180
16.6
49.8
18.7
37.1
10.9
12.6
11.1
59.5
29.7
29.7 34.6
25.4
21.2
23.8
22.7
36.9
42.5
16.53
94.7619.73
17.6611.08
17.01
16.74
14.99
10.68
15.85
13.8416.94
12.81
11.37
10.2528.83
15.1510.83
10.11
31.88
10.05
18.36
15.81
43.54
11.6416.7814.26
24.7935.49
11.3712.82
34.95
11.92
19.26
27.5316.88
14.87
12.48
10.61
12.23
12.01
10.37
12.8310.54
12.8918.19
15.7511.73
12.07
63.22
93.87
13.38
24.81
21.4611.4712.56
96.56
12.97
11.2316.15
13.5651.29
92.43
11.96
48.5414.1413.32
16.42
14.6312.36
56.95
12.76
66.82
11.86
11.95
25.78
12.24
15.2512.9418.94
13.42
10.92
13.4557.04
12.41
15.32
16.78
19.69
27.2756.86
10.17
10.36
15.87
47.77
31.41
25.5317.3310.4127.17
15.33
12.63
26.52
15.56
28.31
23.0126.68
29.1941.85
52.92
11.11
16.69
72.4113.25
11.05
12.69
35.02
48.37
35.14
23.87 20.79
39.76
43.97
24.87
11.2726.06
37.92
23.24
27.59
30.48
27.77
32.66
42.4224.57
32.92
22.46
37.66
33.8948.97
24.79
47.47
33.52
28.28
31.2825.84
47.69
28.28
24.09
25.75
21.53
25.36
22.84
21.4124.94
21.345
29.615
10.625
128.69 142.16
24.375
43.665
µ
0 200 400100Meters
LegendNew Road
Old Road
Mined Out AreasDate: May 2014 Datum: WGS 84
Saxendrift Large Stone PlotName: Mahlodi MLocation: Saxendrift
Scale: 1:4 450Projection: UTM
Legend+10
+20
+30
+40
+50
+100
Saxendrift Extension reconciliation of diamond recovery for fiscal 2014.
Saxendrift mining pit.
Processing plant: Ore preparation.287 carat rough diamond recovered from Saxendrift Extension mining area in November 2013.
Geology team explains the current mine plan to Dr Mark Bristow (Chairman) and his wife, Noeleen Bristow, during the Annual Chairman’s visit (December 2013).

26 Rockwell Diamonds Annual report 2014
OPERATIONAL REVIEW continued
Middle Orange River: Niewejaarskraal Mine
$3.7 mINTERNALLY
FUNDED
PHASE 1 COMMISSIONED IN
10WEEKS
SALIENT FEATURES
• Wet commissioning of dense media
separation (“DMS”) plant commenced
in July 2013, within ten weeks of
obtaining board approval for the
project.
• Phase I (50,000m3) processing
plant handed over to Operations in
September 2013 by projects team with
$2.5 million capital investment funded
internally.
• Phase II of the plant, taking the monthly
capacity to 100,000m3, was completed
on schedule at the end of January 2014
and comprised an in-field screen
($1.2 million) and a rental Bulk X-ray
system.
• On March 1, 2014 the mine was
transferred to full contract mining with
CML Operations taking responsibility for
moving the gravels from the pit to the
processing plant.
• Initial grades achieved at the mine
were impacted by mining an adjacent
property while renegotiating the
surface rental agreement on the main
property.
• The geological model was updated
and contributed to improved grade
recoveries towards fiscal year end.
• Lower throughput volumes at
Niewejaarskraal during its production
ramp up phase (from July 2013 until
fiscal year end), impacted the reported
cash unit cost ($23.6/m3). Having
completed the ramp up at the end of
February 2014, the mine is on track
to trend towards its steady state unit
cost of approximately US$9.50 in the
short term.
• Since early fiscal 2015, grades and
diamond values improved as mining
commenced according to the long-term
mine plan and volumes through the
plant ramped up to sustainable levels.
• Notable stones recovered during the
year included:
– 20 – 49 carats: Three stones.
Frans Bezuidenhout Senior Production Manager
MINE SPECIFICATIONS
The Niewejaarskraal Mine is located
on the south bank of the Orange
River in the Herbert district of the
Northern Cape province, some
57km southwest of Douglas. It is
a past producer that was acquired
by Rockwell in 2009 and held on
care and maintenance until 2013
when it was returned to productive
status.
PRODUCTION AND SALES
2014 2013 Change
Volume (m3) 301,508 – –
Carats 986 – –
Average grade (carats per 100m3) 0.38 – –
Cash unit cost (US$ per m3) 23.6 – –
Sales (carats) 747 – –
Value of sales (US$) 826,025 – –
Average value (US$ per carat) 1,107 – –
Inventory at end of period (carats) 239 – –Bulk X-ray system commissioned to process coarse gravels.
PLANT SPECIFICATIONS
Ore preparationGrizzly screen: 1 x 450tph
De-sanding screen: 1 x 300tph
Scrubber: 1 x 150tph
Ore enrichmentDMS: 1 x 50tph
BV bulk sorter: 1 x 70tph
Final recoveryFlow sort machine: 4 x (5tph total)
VE recovery machine: 1 x 500kg/h

Rockwell Diamonds Annual report 2014 27
Niewejaarskraal Palaeo channel interpretation depicting the change in depositional environment with change in the age of the rivers.
Front end product transfer from in-field screen ready for separation into coarse and fine materials to be processed through Bulk X-ray and DMS systems respectively.
The first large stones recovered from the Niewejaarskraal mine during initial commissioning in August 2013.
Monthly technical review of mine plan with Rockwell management team.
Geology team evaluates gravels in Niewejaarskraal pit against current mine plan.
The Niewejaarskraal production team monitor ramp up of operations at the DMS plant.

28 Rockwell Diamonds Annual report 2014
OPERATIONAL REVIEW continued
Middle Orange River: Saxendrift Hill Complex
INTERNALLY FUNDED
$2.5 mBULK X-RAY
PLANT
AVERAGE PRICE PER CARAT
US$2,781
TWO
+100CARAT STONES
RECOVERED
SALIENT FEATURES
• Internally funded mine commissioned
in March 2013 and achieved nameplate
throughput capacity of 80,000m3
(at 5mm bottom cut off size) per month
in August 2013.
• First implementation in South Africa
of Bulk X-ray technology in the full
production environment, being in a
concentration and recovery mode.
• Processing plant achieved a 40%
increase in grade when processing
Saxendrift Extension gravels in parallel
through Bulk X-ray and Saxendrift pan
plant during July 2013.
• The average price per carat for the
year equated to US$2,781 per carat,
resulting from the high quality of
diamonds produced at the mine since
commissioning.
• Due to the production ramp up being
completed in August 2013, and
accordingly the mine only operating
at nameplate capacity for the second
half of the year, the reported unit cost
(US$10.0/m3) was higher than SHC’s
steady state unit cost of approximately
US$7.50/m3. This is set to normalize in
fiscal 2015.
• Notable stones recovered during the
year included:
– 20 – 49 carats: 16 stones
– 50 – 99 carats: Three stones
– +100 carats: Two stones
(126.51 carats and 169.64 carats).
PRODUCTION AND SALES
2014 2013 Change
Volume (m3) 697,702 – –
Carats 3,363 – –
Average grade (carats per 100m3) 0.48 – –
Cash unit cost ($ per m3) 10.0 – –
Sales (carats) 2,945 – –
Value of sales (US$) 8,191,340 – –
Average value (US$ per carat) 2,781 – –
Inventory at end of period (carats) 418 – –
MINE SPECIFICATIONS
The SHC Mine, located on
the Saxendrift property, is four
kilometers from the main Saxendrift
plant and has an indicated resource
of 1,570,000m3 of diamond
bearing gravels with a 1.5 year
estimated life of mine based on
the current defined resource.
Contiguous exploration work is
ongoing to increase this resource.
Koggie Mostert Senior Production Manager
Bulk X-ray concentration and recovery system at SHC.
PLANT SPECIFICATIONS
Ore preparationTrommel screen: 1 x 450tph
De-sanding screen: 1 x 350tph
Scrubber: 1 x 50tph
Ore enrichmentBV bulk sorters:
1 x 70tph (course), 1 x 35tph (fine)
Final/recon recovery machinesBV single particle sorter:
1 x 750kg/h (course),
1 x 200kg/h (fine)

Rockwell Diamonds Annual report 2014 29
MINE SPECIFICATIONS
The 10,806 hectare Tirisano Mine
property is located some 35km due
north of Ventersdorp in the North
West province and approximately
150km west of Johannesburg. It
is hosted in a unique geological
environment, being karst derived
sinkholes where the dolomitic
bedrock contacts may be vertical.
The mode of gravel deposition,
which is not typical fluvial-alluvial,
has resulted in a very thick build-up
of gravel sequence.
North West operations: Tirisano Mine and Royalty Mining Contractors
NET ROYALTIES OF
$1.2 mACHIEVED GRADE OF
1.23CARATS/100M3
THIRTY-FOUR
+10CARAT STONES
RECOVERED
SALIENT FEATURES
• Tirisano property is mined by royalty
contract mining operators, in line with
Rockwell’s strategy to generate returns
(12.5% royalty on diamond sales) from
owned properties that it does not wish
to mine due to scale or other reasons.
• Operations ramped up from two private
operators on March 1, 2013 to five
agreements operating at Tirisano at the
end of fiscal 2014 with a total monthly
processing capacity of approximately
200,000m3.
• These contractors delivered consistent
results throughout the year with total
volumes of gravel moved amounting to
1.1 million cubic meters.
• A total of 13,554 carats were recovered,
translating into a grade of 1.23 carats
per 100m3.
• The consistency of results from these
agreements has enabled Rockwell to
take a measured approach to assessing
the future for this asset.
• Returns from royalty mining contracts
delivered net royalties of $1.2 million in
fiscal 2014.
• Notable stones recovered by contractors
during the year included
34 stones exceeding 10 carats.
Ben Nell Contracts Manager
PRODUCTION AND SALES
2014 2013 Change
Volume (m3) 1,098,161 – –
Carats 13,554 1,263 –
Average grade (carats per 100m3) 1.23 – –
Sales (carats) (excluding beneficiation) 12,490 989 –
Value of sales (US$) 9,449,127 759,075 –
Average value (US$ per carat) 756 768 (2%)
Inventory at end of period (carats) 1,181 117 –
The 42-strong workforce at one of five of the royalty mining contractors operating at Tirisano.

30 Rockwell Diamonds Annual report 2014
OPERATIONAL REVIEW continued
Development project: Wouterspan
PEA SHOWED
VIABLE ECONOMICS
IRR BETWEEN
45%
AND
70%
POTENTIAL TO CREATE
300JOBS
ASSESSMENT REVIEW A Preliminary Economic Assessment (“PEA”)
showing viable project economics was
completed on the Wouterspan property
post balance sheet date. The PEA was
carried out by a team led by Dr Kurt
Petersen, an expert diamond metallurgist,
and Walter Bold PrEng, Rockwell’s Group
Engineer, with significant input from
Paradigm Project Management (“PPM”),
a company with a strong track record
in the innovative development of new
diamond mines.
The study indicated positive economics,
sufficient to take the project to the detailed
design stage. The economic model yielded
an internal rate of return of between 45%
and 70% for a range of scenarios based
on the key inputs. The net present value
(“NPV”) for the base case is $91.71 million
at a 15% discount rate, yielding a project
payback period of 2.3 years from the start
of construction or approximately 1.3 years
from commencement of production.
The project is most sensitive to revenue.
A 5% variance in the total revenue over the
10 year life of mine impacts the NPV by
15%. The operation is expected to employ
300 people.
Key assumptions of the study were as
follows:
• A plant with a capacity of 1,200 tonnes
per hour (“tph”) (or 354,000m3 per
month), a rate that lowers the diamond
production risk associated with the
inherent variability of the resource
being mined;
• A plant design comprising three
processing streams: two Bourevestnik
Bulk X-ray systems to handle the coarse
and mid-sized gravels; and the third
stream being a dense media separation
(“DMS”) stream to process fine material;
• A reduced water consumption rate
that is suited to the environmental
conditions in the Middle Orange River
region; and
• The use of contract mining at a fixed
unit cost that reduces the capital
requirements.
GEOLOGICAL SETTING
The Wouterspan property is located
near Douglas, South Africa.
It comprises portions, totaling
2,579.8ha, of the Lanyon Vale
376 farm. Historically, mining
operations were carried out on
three portions of the property
called the Farhom, Okapi and
Stofdraai farms, exploiting the
Rooikoppie and Primary gravel.
The geological setting of
Wouterspan is an alluvial diamond
deposit preserved in fluvial-alluvial
palaeochannel and deflation
gravels (Rooikoppie) in Vaal
River terraces. The property has
extensive diamond deposits and
has historically produced diamonds
that are similar to Saxendrift in
terms of size, quality and value.
Recent site visit by the Geology team to one of the bulk sampling pits at Wouterspan.

Rockwell Diamonds Annual report 2014 31
Typical geological sequence of the upper gravels at Wouterspan.
Geology team explain the depositional environment to the Exco.

32 Rockwell Diamonds Annual report 2014
GOVERNANCE

Rockwell Diamonds Annual report 2014 33
SUSTAINABILITY REVIEW
HEALTH, SAFETY AND WELLNESS Rockwell has a multilateral approach
to safety whereby the Department of
Minerals and Resources, the relevant
trade unions and mine management
collaborate to ensure the safety of our
employees, contractors, visitors and, more
broadly, people who may be affected by
our operations. The Company also has a
corporate Health and Safety Policy that
is adapted to the specific needs of each
operation.
We regard our employees as our most
valuable asset and are wholly committed
to protecting them, as far as is reasonably
practical. It is our aim to create a culture
of health and safety where our people
themselves not only take control of their
own health and safety but also provide an
environment whereby our people look out
for the safety of their colleagues.
With four lost time injuries occurring in
2014 in the MOR region, the focus shifted
to behavior based safety. This bore fruit
as evidenced by the last lost time injury
in the MOR having been in August 2013.
Even during the period leading up to the
December summer holiday period including
the Christmas and New Year holidays, when
careless injuries are common, Rockwell was
pleased with the safety performance on its
operations, reporting no lost time injuries
during this time.
Daily inspections of all the mining activities
are conducted and unsafe practices are
immediately attended to. With assistance
from a specialist safety consulting
organization and the safety representatives,
Rockwell has raised the safety bar and
the safety culture in the MOR is gradually
improving. Additional safety representatives
will be trained in fiscal 2015 to further
strengthen the Company’s safety processes
and the implementation thereof.
The lost time injury-free hours (“LTIFH”)
for the MOR, including Saxendrift Mine,
SHC and Niewejaarskraal, exceeded three
million at the end of May 2014, bearing
testimony to the inputs and efforts of all
Rockwell employees and Management.
Voluntary HIV/Aids testing is conducted
quarterly at each operation, together
with tuberculosis testing. The Company
has a number of trained HIV/Aids peer
educators who carry out door-to-door
visitations. Topics such as the correct
usage of condoms are addressed. More
and more employees are undertaking the
testing willingly as the stigma of HIV/Aids
is gradually decreasing globally. Rockwell
has received extensive support from the
local health authorities in and around
the Pixley-ka-Seme district in combatting
the challenges of HIV/Aids on its mines.
Rockwell is working with the Department
of Health who will assist with the planning
of the commemoration of World Aids Day
on December 1, 2014.
Primary health care is conducted by
Sister Heyns, a qualified nurse who
provides these services in Douglas.
Positive feedback is frequently received
from employees for the manner in which
she takes care of them.
A survey was conducted by RESAF
International, providers of nutritional
supplements, to further assist in our fatigue
management system.
The employee wellness program that
was launched at the Saxendrift Mine
early in fiscal 2014 was met with support
among Rockwell employees. Based on this
support, the Company plans to expand this
wellness program, extending the successful
partnership of ICAS to all other operations
during 2014. The service currently offers
employees and their dependants access to
a qualified psychologist, legal and financial
telephonic guidance and an electronic
e-Care service that provides health and
wellness-related information. The expanded
program will also focus on specific problem
areas encountered by employees and
identified in the Annual Wellness Report
that was compiled after completion of the
pilot project. The report showed that the
program was effectively made available to
all targeted employees and led to use of
the facilities provided by the program with
a higher annual engagement rate than
that of the comparable industry. Ongoing
communication has been prioritized to
build on this success while managers
are being encouraged to refer distressed
employees to engage with the professional
services provided, especially for stress
management, relationship problem solving
and financial guidance.
TRAINING AND DEVELOPMENT During fiscal 2014 Rockwell’s training and
development activities were focused on
entrenching the Company’s diamond value
management principles by improving the
skill sets of supervisors and employees
working the equipment fleet as well as
the pan, scrubbers, screen operators and
sorters. Employees were also trained to
operate and maintain our recently installed
Bulk X-ray systems. During this period,
75 employees also attended our Diversity
Training program which will be rolled out
to all our employees in the next two years.
It was a proud achievement for Rockwell
that over 200 employees attended various
training programs during the year.
During this year, five employees and two
learners from the Douglas community
participated in our Learnership program
with training provided at the De Beers
College in Kimberley. This program forms
part of Rockwell’s formal Social Labour Plan.
Also in support of the diamond value
management principles that define
Rockwell’s business culture, the Company is
in the process of rolling out a performance
management system at all levels of
our organization as well as a business
performance improvement project, the
Rockwell Galaxy Business Performance
Improvement Actualization project for
the 2015 fiscal year. It will be used to
implement an integrated performance
management system applicable to all
employees. The implementation will
be phased and will be a coaching
and mentoring system that will be
complemented by an internal leadership
excellence program.

34 Rockwell Diamonds Annual report 2014
JOB CREATION At the end of fiscal 2014, Rockwell had
480 permanent employees in its service.
The total workforce comprised 13.96%
women, while the Company’s support of
Women in Mining is reflected in the 33%
and 22.8% representation of women in
senior and middle management levels,
respectively.
At the middle management level,
Rockwell’s employment equity has
improved significantly due to a focus
on recruiting young HDSA professionals
in the fields of geology, metallurgy and
engineering as plant supervisors. Middle
management HDSA representation at the
end of the fiscal year was 58%. Following
the success of this program in the
technical areas of the business, Rockwell
is planning to implement similar initiatives
in administrative areas of the business
including finance and human resources.
Rockwell has a Recognition Agreement
with the National Union of Mine Workers
(NUM) representing 66% of the workforce.
Summary total workforce
African male 50%
African female 6.25%
Colored male 26.46%
Colored female 4.79%
Caucasian male 9.58%
Indian female 0.21%
Caucasian female 2.71%
Total female 13.96%
Total male 86.04%
Occupational levels
Male Female%
EE%
women
% women
in mining Total
A C I W A C I W 22
Top management 1 0 0 3 0 0 0 0 25 0 0 4
Senior management 0 0 0 4 0 0 0 2 0 33.3 0 6
Professionally qualified and
experienced specialists and
mid-management 9 1 0 13 6 0 0 2 58 25.8 12.90 31
Skilled technical and
academically qualified
employees, junior
management supervisors,
supervisors, foremen 7 13 0 18 2 0 0 2 57 9.52 4.76 42
Semi-skilled and discretionary
decision making 188 82 0 08 8 13 1 7 97.39 9.45 5.21 307
Unskilled and defined
decision making 35 31 0 0 14 10 0 0 100 26.67 0 90
Total permanent employees including head office and North West and Northern Cape 240 127 0 46 30 23 1 13 90.41 13.96 4.58 480
A-African | C-Coloreds | I-Indians | W-Whites
CORPORATE SOCIAL INVESTMENT (“CSI”)Rockwell has devoted its investments to
supporting education of future generations
of South Africans. In fiscal 2014, its CSI
initiatives were as follows:
• Ongoing support at the Jannie Roux
Home in Barkly West which provides
a place of safety for more than
80 children. This includes a fixed
monthly stipend which assists with
overhead costs at the home and is
used to provide nutritional snacks for
the children to take to school. Rockwell
also covers the costs of internet access
to the home and provides ad hoc
assistance as required. Rockwell hosts
an annual Christmas party at its Barkly
West corporate office for these children.
• Provided computer centers to three
schools in Barkly West and continues to
sponsor the costs of internet access at
these schools.
• Rockwell, in partnership with Wildeklawer,
continues to pay a sports coordinator for
the Barkly West Schools which sponsors
several sport development projects at
three local schools as well as a rugby and
a soccer tournament.
SUSTAINABILITY REVIEW continued

Rockwell Diamonds Annual report 2014 35
Rockwell’s New Social and Labour Plan
Projects is aligned to the Municipal IDP for
our Middle Orange River Operations with
the Siyancuma Municipality. The projects
which Rockwell has started to roll out in
2014 are as follows:
Project description
• Recycling project
• Paving project
• Community Creche (Outreach School)
• Vaal Oranje Primary (Brypaal) School
food scheme for six months of the year
• Internet Café at Brypaal Library and
Bongani Library
• Soupkitchen Bongani
• Douglas Hoërskool garden project
• Vegetable tunnel project
• Grading of soccer fields
• Water channel in Bongani
• Confluence Vaal and Orange
• Upgrading of roads, signs and names
in Douglas
ENTERPRISE DEVELOPMENTRockwell initially invested R2 million to start
Bokamoso, a brick-making facility which is
managed and operated by women.
It manufactures and supplies bricks in
the Northern Cape. The company was
subsequently expanded to provide civil
construction to the mining industry. It
also carries out renovations to the local
communities at low cost. All Rockwell’s civil
construction on its Northern Cape mines
has been carried out by Bokamoso.
During the year, Rockwell procured goods
and services in excess of R2.1 million from
Bokamoso. Bokamoso also plays a critical
role in the acceleration of our Social and
Labour Plan as it serves as the primary
platform through which such initiatives
and programs are being channeled.
The Company is also in a process to
transfer the brickmaking company to the
Holpan Community.
ENVIRONMENTALRockwell’s environmental policy prescribes
the environmental procedures across all
operations and projects. The cornerstones
of its environmental practices are as
follows:
• Assessing and monitoring our
environmental impact, conserving
renewable and non-renewable
natural resources and reducing all
forms of environmental pollution and
degradation including, but not limited
to, air, water, chemical, energy and any
other general waste-related pollution;
• The recovery process of diamonds does
not include any chemicals and water
released back into the environment has
been shown to be cleaner than existing
river water;
Children from the Jannie Roux Home at the annual Christmas party.
Children from the Jannie Roux Home at the annual Christmas party.
Children from the Jannie Roux Home at the annual Christmas party. Rockwell sponsors schools in Barkly West.
Backfilling in progress.

36 Rockwell Diamonds Annual report 2014
• Reducing, reusing, recycling and
disposing of waste in a manner
reflecting responsible environmental
practices;
• Allocating the necessary resources to
comply with these commitments which
includes, but is not limited to, legal
compliance in terms of environmental
guarantees that must be provided to
the Department of Mineral Resources;
• Promoting a culture of environmental
awareness through induction,
information and training of our
employees and contractors;
• Raising awareness on environmental
responsibilities and actively promoting
good environmental practices by all our
staff;
• Preserving, where practical, significant
archaeological and historical sites
to minimize the impact on the
cultural heritage of the surrounding
environment;
• Optimizing the consumption of
renewable and non-renewable
resources, to ensure the sustainability
of our operations;
• Ensuring that all contractors/consultants
and service providers are familiar
with the Company’s environmental
management practices and that they
assist in the implementation and
maintenance of the said practices;
• Prioritizing the purchase of products
that are environmentally friendly and
energy efficient. Consideration is
given to buying fair trade and locally
grown and manufactured products
as these have positive impacts on the
environment and livelihoods; and
• Rockwell strives to comply with
all aspects of the South African
environmental legislation.
Rockwell has defined its top environmental
impacts as follows:
• The impact on geology due to
historical and current mining activities
is heightened during the operational
phase as mining progresses through
areas where previously only prospecting
was done and continues as mining
progresses over the approved life of
mine.
• The impact on soil during the
operational phase due to clearing of
topsoil and overburden for opencast
mining. Mining management is
conducted in such a manner as to
avoid contamination of topsoil and
no chemicals are used in mineral
processing. Concurrent rehabilitation to
rapidly re-vegetate mining areas lowers
the risk of soil losses due to erosion.
• The mining and excavation of the
diamond and sand minerals has a long-
term impact on the land capability and
alters the land use. Mine operations
lead to the temporary loss of grazing
capability but through concurrent
rehabilitation, parts become available
for agricultural use as re-vegetation is
completed.
• The impact on the topsoil and
vegetation layer during mining is high
due to clearing and can enhance the
establishment of exotic species and bare
ground, until rehabilitation commences.
Concurrent rehabilitation of cleared and
sloped areas mitigates this. These areas
are ripped, ameliorated and re-seeded
to encourage rapid re-establishment of
indigenous species.
• Animal life adapts quickly to mining
operations as they commence. Mining
is restricted to a maximum area of
50ha at any given time to mitigate the
impact on animal life. Rockwell has a
policy against illegal poaching. Vehicle
movement is restricted to existing roads
and disturbed areas.
• Rockwell’s alluvial diamond mining
has no impact on the catchment yield
or the water quality in the catchment
area. It contains no toxic or harmful
substances that could influence
the quality of the water. Rockwell
conducts no mining activities within
100m horizontally of any rivers and
has measures in place to manage the
handling and storage of petrochemicals
within the Company.
• Rockwell’s mining operations do not
significantly contaminate the air. Proper
maintenance of equipment mitigates
the impact of exhaust fumes. Dust on
the roads is managed by imposing a
maximum speed limit of 40km/hr for
loader moves. Dust is minimal in the
mineral processing activities.
• The noise impact of mining activities is
low due to the location of the mines in
rural areas and only affects employees
and neighbors who are generally
separated from the mines by long
distances.
• The required environmental impact
assessment studies are conducted to
measure these and other impacts,
incorporating a review of the current
status and the extent to which
the environment has already been
modified. In terms of the MPRDA,
bi-annual performance assessment
reports are completed.
Employee communications and newsletters
include discussions of environmental
matters to heighten their awareness of
environmental impacts.
A new awareness program has been
developed which is aligned with the World
Environmental Calendar, including the
following, among others:
• February 2 World Wetland Day: On this day, in 1971, the
Ramsar Convention on Wetlands of
International Importance was signed.
Wetlands are a very important part of
our biodiversity and it is essential to see
that they are well protected.
• February 28 National Science Day: It is necessary to highlight the
role of science in the protection of
the environment. This day should be
taken as a platform to put forward the
message.
• March Earth Hour (20:30 – 21:30): Earth Hour is a worldwide event
organized by the World Wide Fund
for Nature (WWF) encouraging
individuals, communities, households
and businesses to turn off their non-
essential lights for one hour on the last
SUSTAINABILITY REVIEW continued

Rockwell Diamonds Annual report 2014 37
Saturday in March, as a symbol of their
commitment to the planet.
• March 23 World Meteorological Day: Everyone has to be reminded
that weather is an integral part of the
environment.
• April 7 World Health Day: The
World Health Organization (“WHO”)
was constituted on this day in 1948. In
the changing environment around us
health is becoming an important issue.
• May 22 International Day for Biological Diversity: The United
Nations International Day for
Biological Diversity (“IDB”) to increase
understanding and awareness of
biodiversity issues.
• June 5 World Environment Day: On this day, in 1972, the Stockholm
Conference on Human Environment
was held in Sweden. There was a large
gathering from all over the world and
people expressed their concerns for the
increasing environmental problems.
• July 11 World Population Day: Population has to be given special
attention, as it is an ever-increasing
problem.
• September 16 World Ozone Day: The United Nations declared this
day as the International Day for the
Preservation of the Ozone Layer. It is the
day the Montreal Protocol was signed.
• September 28 Green Consumer Day: The problems of consumerism
and its impact on the environment is an
area of major concern in today’s world.
Awareness building on the importance
of recycling-reusing-reducing should be
taken up seriously.
• October 3 World Habitat Day: The earth is the habitat of not only
human beings but also all living
creatures. Increasing human activities is
threatening the habitat of other living
things.
• October 1 – 7 World Wildlife Week: Celebrate this week by building
awareness on the importance of
preservation of our wildlife.
• October 13 International Day for Natural Disaster Reduction: Due
to a change in the environment there
has been an increase in the number
of natural disasters. Efforts have to be
made to reduce these disasters.
• November 20 Universal Children’s Day: Children can work together for
a better tomorrow by improving the
environment around them.
Key materials used during the year were as follows:
Indicator Units
Energy use (KwH) 13,494,479.67 (Saxendrift, Niewejaarskraal, Wouterspan,
Holpan, Klipdam and Tirisano)
Waste oil 73,411.00 litres (Saxendrift, Niewejaarskraal and Klipdam)
Hydrocarbon oil
contaminated waste
4,950kg (skip bins removals) (Tirisano)
6,090 liters (210 L drums – Roro truck) (Holpan and Saxendrift)
Water consumption (m³) 1,463,400m³ (Saxendrift and Niewejaarskraal)
Rockwell puts its commitment to managing
the impact of its mining operations
on the environment into practice by
delivering against its goal of continuously
rehabilitating, concurrently with
mining whenever practically possible.
Re-vegetation of rehabilitated areas takes
at least two to three growth seasons
to reach the same predetermined land
use. During fiscal 2014, 69.6ha of land
was rehabilitated across the Company’s
properties. Rockwell also carries out
surveys every two weeks on outstanding
rehabilitation to maintain the concurrent
on-site rehabilitation, thereby minimizing
the impact as well as the financial provision
requirements while ensuring legal
compliance.
BACKFILLING IN PROGRESSRockwell only removes protected trees
once the necessary forestry tree licenses
have been issued to the Company. In
terms of license conditions, the Company
is committed to establishing at least two
indigenous trees for every protected tree
which was removed. The Boscia albitrunca
or Shepherd’s tree, which grows on
many of the Company’s mining blocks in
the Middle Orange River, is a protected
tree species in South Africa. This means
that approval from the Department of
Agriculture, Forestry and Fisheries must be
sought to remove the protected trees while
mining blocks of diamond bearing gravels.
Demonstrating Rockwell’s commitment
to preserving this protected tree and in
terms of environmental management, the
Company took a decision to leave trees
larger than two meters intact and to mine
around them.

38 Rockwell Diamonds Annual report 2014
CORPORATE GOVERNANCE
MANDATE OF THE BOARDThe board adopted a formal mandate
as outlined in Rockwell’s Corporate
Governance Policies and Procedures
Manual (the “Manual”) on February 28,
2008. The Manual mandates the board
to: (i) assume responsibility for the overall
stewardship and development of the
Company and monitoring of its business
decisions, (ii) identify the principal risks
and opportunities of the Company’s
business and ensure the implementation
of appropriate systems to manage these
risks, (iii) oversee ethical management
and succession planning, including
appointing, training and monitoring
of senior management and directors,
and (iv) oversee the integrity of the
Company’s internal financial controls
and management information systems.
In addition, the Manual includes written
charters for each committee. Further, the
Manual encourages but does not require
continuing education for its directors and it
contains a code of ethics, policies dealing
with issuance of news releases and disclosure documents, as well as share trading
black-out periods. A copy of the Manual is available for review at the Company’s website
www.rockwelldiamonds.com.
The attendance record of the directors for the 12 months ended February 28, 2014 is as
follows:
NameBoard meetings
attended% of board meetings
attended
Mark Bristow 5 100
James Campbell 5 100
Stephen Dietrich 5 100
Willem Jacobs 5 100
Richard Linnell 5 100
Johan van’t Hof 5 100
Rick Menell 4 80
COMPOSITION OF THE BOARD
Applicable governance policies require that a listed issuer’s board of directors determine
the status of each director as independent or not, based on each director’s interest in or
other relationship with, the corporation. Applicable governance policies recommend that a
board be constituted with a majority of directors who qualify as independent directors (as
defined below). A board should also examine its size with a view to determining the impact
Liberation of the diamond bearing gravels at Saxendrift Extension.
Geologists review gravels in Saxendrift mining pit. Bulk X-ray plant at SHC.Rough diamond contained in typical MOR calcrete boulder.

Rockwell Diamonds Annual report 2014 39
of the number of directors upon the
effectiveness of the board, and the board
should implement a system which enables
an individual director to engage an outside
advisor at the expense of the corporation
in appropriate circumstances. The Manual
allows for retention of independent
advisors for board members when they
consider it advisable.
Under applicable policies, an
“independent” director is one who has
no direct or indirect material relationship
with the Company. Generally speaking,
a director is independent if he or she is
free from any employment, business or
other relationship which could, or could
reasonably be expected to, materially
interfere with the exercise of the director’s
independent judgement. A material
relationship includes having been (or
having a family member who has been)
within the last three years an employee
or executive of the Company or having
been employed by the Company’s external
auditor. An individual who (or whose family
member) is or has been within the last
three years, an executive officer of an entity
is deemed to have a material relationship
as is any individual who (or whose family
members or partners) received directly
or indirectly, any consulting, advisory,
accounting or legal fee or investment
banking compensation from the Company
(other than compensation for acting as
a director or as a part time chairman or
vice-chairman).
The board proposes seven nominees
for the office of director of whom five
of the nominees can be considered
as “independent” directors. The
“independent” nominees are Willem
Jacobs, Richard Linnell, Johan van‘t Hof,
Stephen Dietrich and Rick Menell. These
nominees are considered independent
by virtue of not being executive officers
of the Company, not having a material
relationship with the Company and having
received no compensation other than
in their role as independent directors.
The non-independent directors (and the
reasons for that status) are Mark Bristow
(Chairman) and James Campbell (President
and CEO).
The board monitors the activities of the
senior management through regular
meetings and discussions amongst the
board and between the board and senior
management. The board is of the view that
its communication policy between senior
management, members of the board
and shareholders is good. The board is
satisfied with the integrity of the Company’s
internal control and financial management
information systems.
COMMITTEES OF THE BOARDThe Manual requires that (i) committees
of the board be composed of at least a
majority of independent directors, (ii) the
board expressly assume responsibility,
or assign to a committee of directors
responsibility, for the development of the
Company’s approach to governance issues,
(iii) the audit committee be composed
only of independent directors, and the
role of the audit committee be specifically
defined and include the responsibility
for overseeing management’s system of
internal controls, (iv) the audit committee
have direct access to the Company’s
external auditor, and (v) the board appoint
a nominating and governance committee,
composed of a majority of independent
directors, with the responsibility for
proposing new nominees to the board and
for assessing directors on an ongoing basis.
As well as an audit committee, the board
also has a compensation committee and a
nominating and governance committee.
Audit committee
The board has established an audit
committee which currently consists of
Willem Jacobs, Stephen Dietrich and
Johan van‘t Hof. The audit committee
carries out its responsibilities under
applicable laws, regulations and stock
exchange requirements with respect to
the employment, compensation and
oversight of the Company’s independent
auditors and other matters under the
authority of the committee. See further
disclosure in Item 20 of the Company’s
AIF filed on www.sedar.com on May 30,
2014 with respect to the audit committee
and its relationship with the Company’s
independent auditors. The Company
adopted an audit committee charter on
February 28, 2008 and it is included in the
Manual. The audit committee charter is
also available for viewing at the Company’s
website at www.rockwelldiamonds.com.
Compensation committee
The board has established a compensation
committee which currently consists of
Richard Linnell and Johan van’t Hof. The
compensation committee recommends
compensation for the directors and
executive officers of the Company. See
further disclosure under Statement of
executive compensation below. The
compensation committee charter was
adopted on February 28, 2008 and is
included in the Manual. This compensation
committee charter is available to
view at the Company’s website at
www.rockwelldiamonds.com.
The function of the compensation
committee is to review, on an annual basis,
the compensation paid to the Company’s
executive officers and directors, to review
the performance of the Company’s executive
officers and to make recommendations on
compensation to the board.
The compensation committee also
periodically considers the grant of stock
options. Options have been granted to the
executive officers and directors and certain
other service providers taking into account
competitive compensation factors and the
belief that options help align the interests
of executive officers, directors and service
providers with the interests of shareholders.
Nominating and governance committee
The board has established a nominating
and governance committee (the “NG committee”) which currently consists of
Richard Linnell and Willem Jacobs.
The NG committee has the responsibility
of developing and recommending to
the board the Company’s approach to
corporate governance and assists members
of the board in carrying out their duties.

40 Rockwell Diamonds Annual report 2014
CORPORATE GOVERNANCE continued
The NG committee also reviews all new
and modified rules and policies applicable
to governance of listed corporations to
assure that the Company remains in full
compliance with such requirements as are
applicable to the Company.
The nominating function of the
NG committee is to evaluate and
recommend to the board the size of the
board and persons as nominees for the
position of a director of the Company
and to formalize the process for ensuring
the nomination of high caliber directors
and proper director succession planning.
The Company has formal procedures
for assessing the effectiveness of board
committees as well as the board as a whole.
Under the Manual, this function is to be
carried out annually under the direction of
the NG committee and those assessments
are then provided to the board.
BOARD DECISIONSGood governance policies require the
board of a listed corporation, together
with its chief executive officer, to develop
position descriptions for the board and
for the chief executive officer, including
the definition of limits to management’s
responsibilities. Any responsibility which is
not delegated to senior management or
to a committee of the board remains with
the board.
RECRUITMENT OF NEW DIRECTORS AND ASSESSMENT OF BOARD PERFORMANCEGood governance policies require that
(i) every board of a listed corporation
implement a process for assessing
the effectiveness of the board and
the committees of the board and the
contribution of individual directors, (ii)
every corporation provide an orientation
and education program for new directors,
and (iii) every board review the adequacy
and form of compensation of directors and
ensure that the compensation realistically
reflects the responsibilities and risks
involved in being an effective director.
See the discussion under nominating and
governance committee above.
Orientation and continuing education
The Company has traditionally retained
experienced mining people as directors
and hence the orientation needed is
minimized. When new directors are
appointed, they are acquainted with
the Company’s mineral projects and the
expectations of directors. Board meetings
generally include presentations by the
Company’s senior management and
project staff in order to give the directors
full insight into the Company’s operations.
Ethical business conduct
The Board has adopted an ethics policy
(set out in the Manual) which is available
for download from the Company’s website
at www.rockwelldiamonds.com. The
board also believes that the fiduciary
duties placed on individual directors by the
Company’s governing corporate legislation
and the common law, and the restrictions
placed by applicable corporate legislation
on an individual directors’ participation
in decisions of the board in which the
director has an interest, have been
sufficient to ensure that the board operates
independently of management and in the
best interests of the Company.
Nomination of directors
The board considers its size each year when
it considers the number of directors to
recommend to the shareholders for election
at the annual meeting of shareholders,
taking into account the number required to
carry out the board’s duties effectively and to
maintain a diversity of views and experience.
See the discussion under nominating and
governance committee above.
Assessments
The board monitors the adequacy
of information given to directors,
communication between the board
and management and the strategic
direction and processes of the board
and committees. The NG committee is
mandated to oversee an annual formal
assessment of the board and its three
committees namely the audit committee,
compensation committee and the
NG committee.
STATEMENT OF EXECUTIVE COMPENSATIONGeneral provisions
“Named Executive Officer” (“NEO”) means
each of the following individuals:
• A Chief Executive Officer (“CEO”);
• A Chief Financial Officer (“CFO”);
• Each of the three most highly
compensated executive officers, or
the three most highly compensated
individuals acting in a similar capacity,
other than the CEO and CFO, at the
end of the most recently completed
financial year whose total compensation
was, individually, more than $150,000
for that financial year; and
• Each individual who would be an
NEO under paragraph (c) but for the
fact that the individual was neither an
executive officer of the Company,
nor acting in a similar capacity, at
February 28, 2014.
Compensation discussion and analysis
The Company’s compensation policies and
programs are designed to be competitive
with similar resource companies and
to recognize and reward executive
performance consistent with the success
of the Company’s business.
The board has established a compensation
committee consisting of Richard Linnell
and Johan van’t Hof. The function of
the compensation committee as set out
in the Manual is to assist the board in
fulfilling its responsibilities relating to
the compensation practices of the
executive officers of the Company. To
achieve this purpose, the compensation
committee has the duty, responsibility
and authority to:
• recommend to the board the form
and amount of compensation to be
paid by the Company to directors for
service on the board and on board
committees. The compensation
Rockwell Diamonds Annual report 2014 41
committee shall review director
compensation at least annually;
• annually review the Company’s base
compensation structure and the
Company’s incentive compensation,
stock option and other equity-
based compensation programs and
recommend changes in or additions in
such structure and plans to the board
as needed;
• recommend to the board the annual
base compensation of the Company’s
executive officers and senior managers
(collectively the “Officers”);
• recommend to the board the range of
increase or decrease in the annual base
compensation for non-Officer personnel
providing services to the Company;
• recommend to the board annual
corporate goals and objectives
under any incentive compensation
plan adopted by the Company for
Officers and non-Officer personnel
providing services to the Company, and
recommend incentive compensation
participation levels for Officers and non-
Officer personnel providing services to
the Company under any such incentive
compensation plan. In determining the
incentive component of compensation,
the committee will consider the
Company’s performance and relative
shareholder return, the values of similar
incentives at comparable companies
and the awards given in past years;
• evaluate the performance of Officers
generally, and in light of annual
corporate goals and objectives under
any incentive compensation plan;
• periodically review with the Chairman
and CEO their assessments of
corporate officers and senior managers
and succession plans, and make
recommendations to the board
regarding appointment of officers and
senior managers;
• provide oversight of the performance
evaluation and incentive compensation
of non-Officer personnel providing
services to the Company;
• administer the Company’s stock option
and other equity based compensation
plans and determine the annual grants
of stock options and other equity based
compensation; and
• recommend to the NG committee
the qualifications and criteria for
membership on the compensation
committee.
Report on executive compensation
The Valuation Report on executive
compensation has been authorized by
the compensation committee. The board
assumes responsibility for reviewing and
monitoring the long-range compensation
strategy for the senior management of
the Company although the compensation
committee guides it in this role. As part
of its mandate, the board determines the
type and amount of compensation for the
Company’s executive officers. In addition,
the board reviews the methodology
utilized by the Company for setting salaries
of employees throughout the organization.
The compensation committee receives
competitive market information on
compensation levels for executives.
Mr James Campbell, President and CEO
and Mr. Gerhard Jacobs, the CFO, serve
the Company on a full-time basis.
Philosophy and objectives
The compensation program for the senior
management of the Company is designed
to ensure that the level and form of
compensation achieves certain objectives,
including:
• attracting and retaining talented,
qualified and effective executives;
• motivating the short and long-term
performance of these executives; and
• better aligning their interests with those
of the Company’s shareholders.
In compensating its senior management,
the Company has employed a combination
of base salary, bonus compensation and
equity participation through its share
option plan.
The Company believes that encouraging its executives and employees to become shareholders is the best way of aligning their interests with those of its shareholders.

42 Rockwell Diamonds Annual report 2014
CORPORATE GOVERNANCE continued
Base salary
In the board’s view, paying base salaries
that are competitive in the markets in
which the Company operates is a first
step to attracting and retaining talented,
qualified and effective executives.
Competitive salary information on
comparable companies within the
industry is compiled from a variety of
sources, including surveys conducted by
independent consultants and national and
international publications.
Bonus compensation
The Company’s objective is to achieve
certain strategic objectives and milestones.
The board will consider executive bonus
compensation dependent
upon the Company meeting those
strategic objectives and milestones and
sufficient cash resources being available
for the granting of bonuses. Bonuses
are awarded at the discretion of the
board. The board approves executive
bonus compensation dependent
upon compensation levels based on
recommendations of the compensation
committee, and such recommendations
are generally based, if necessary, on
survey data provided by independent
consultants. Bonus compensation was
awarded as per the previous year’s
approval from shareholders in the form of
shares issued.
Equity participation
The Company believes that encouraging
its executives and employees to
become shareholders is the best way
of aligning their interests with those of
its shareholders. Equity participation is
accomplished through the Company’s
share option plan. Stock options are
granted to senior executives taking into
account a number of factors, including
the amount and term of options previously
granted, base salary and bonuses and
competitive factors. Options are generally
granted to senior executives and vest on
terms established by the compensation
committee.
Given the evolving nature of the
Company’s business, the board continues
to review and redesign the overall
compensation plan for senior management
so as to continue to address the objectives
identified above.
Compensation of the Chief Executive
Officer
Under the Manual, the compensation
of the CEO is to be approved by the
board. Base salary and bonus levels
are determined taking into account
independent market survey data.
The compensation committee reviews
the grants of stock options to directors,
management, employees and consultants.
Options have been granted in prior
years taking into account competitive
compensation factors and the belief that
options help align the interests of such
persons with the interests of shareholders.
As noted above under Bonus
compensation, incentive that may be
paid to the CEO and any other member
of the executive or senior management
team are determined in respect of the
individuals and management team
achieving strategic objectives and
milestones which are set at the beginning
of each year by the compensation
committee and approved by the board.
PERFORMANCE The graph below compares the cumulative
total return to a shareholder who invested
$100 in Common Shares of the Company
on February 28, 2009 until February 28,
2014 with the cumulative total return of
the TSX.
The Company’s compensation policies and
programs are designed to be competitive
with similar junior mining exploration
companies and to recognize and reward
executive performance consistent with the
success of the Company’s business.
As a result of the credit crisis, commodities
prices collapsed, with diamonds being
particularly hard hit. This, coupled with
uncertainty raised from an unsolicited take-
over attempt, resulted in a collapse in the
share price.
The performance of management cannot
be measured on the share price, but in
maintaining liquidity, increasing production
and reducing costs. The fact that the
Company is still in operation where many
250
0
50
100
150
200
February 28, 2009
February 28,2010
February 28,2011
February 29,2012
February 28,2013
February 28,2014
RDI
TSX
Performance graph
$

Rockwell Diamonds Annual report 2014 43
of its peers have failed completely is evidence of the commitment and creativity of management in ensuring that the Company is still operational.
Senior employees’ salaries were brought in line with the market albeit at the lower end of the percentile and the employees that were on par with the market were given inflation related increases. Union employees were granted band specific increases, as negotiated, to narrow disparities.
Actions, decisions or policies made after February 28, 2014
Given the evolving nature of the Company’s business, the board and its compensation committee continue to review and redesign the overall compensation plan for senior management so as to continue to address the objectives identified above. No actions, decisions or policies have been made since February 28, 2014 that would affect a reader’s understanding of NEO compensation.
OPTION BASED AWARDSThe Company has in place a rolling share option plan dated for reference September 9, 2011 (the “Plan”). Under TSX policies the Plan must be submitted to shareholders for renewal every three years. The Plan has been established to provide incentive to qualified parties to increase their proprietary interest in the Company and thereby encourage their continuing association with the Company.
Under the Plan, a maximum of 10% of the issued and outstanding Common Shares of the Company may be reserved for issuance. Options up to this limit may be granted at the discretion of the board, or the compensation committee, to eligible optionees (the “Optionees”). In addition, as the number of issued and outstanding Common Shares of the Company increases, the number of options available for granting to eligible Optionees will increase. As at the date hereof there are options outstanding to purchase an aggregate of 4,836,431 Common Shares representing approximately 7.9% of outstanding Common Shares.
The Plan is administered by the
compensation committee of the Company.
The Plan provides that options will be
issued pursuant to option agreements to
directors, officers, employees or consultants
of the Company or a subsidiary of the
Company. All options expire on a date not
later than ten years after the issuance of
such option. Previous grants of option-
based awards are taken into account when
considering new grants of options. Subject
to the requirements of the policies of the
TSX and the prior receipt of any necessary
regulatory approval, the board may, in its
absolute discretion, amend or modify the
Plan or any outstanding option granted
under the Plan, as to the provisions set out
in the Plan.
The following is a summary of the material
terms of the Plan:
• Currently all options granted under
the Plan are non-assignable and non-
transferable and are issuable for a
period of up to ten years.
• For stock options granted to employees
or service providers (inclusive of
management company employees),
the Company must ensure that the
proposed optionee is a bona fide
employee or service provider (inclusive
of management company employees),
as the case may be, of the Company or
any subsidiary.
• If an optionee ceases to be employed
by the Company (other than as a
result of termination with cause) or
ceases to act as a director or officer of
the Company or a subsidiary of the
Company, any option held by such
optionee may be exercised within
90 days after the date such optionee
ceases to be employed as an officer or
director or, as the case may be.
• If an optionee dies, any vested option
held by him at the date of death will
become exercisable by the optionee’s
lawful personal representatives, heirs or
executors until the earlier of one year
after the date of death of such optionee
and the date of expiration of the term
otherwise applicable to such option.
• In the case of an optionee being
dismissed from employment or service
for cause, such optionee’s options,
whether or not vested at the date of
dismissal, will immediately terminate
without right to exercise same.
• The minimum exercise price of an
option granted under the Plan must not
be less than the Market Price calculated
the day before the grant (as defined in
the Plan).
• Vesting of options shall be in
accordance with the option
commitment in the Plan or otherwise,
at the discretion of the board, and will
generally be subject to: (i) the service
provider remaining employed by or
continuing to provide services to the
Company or any of its affiliates as
well as, at the discretion of the board,
achieving certain milestones which
may be defined by the board from
time to time or receiving a satisfactory
performance review by the Company
or any of its affiliates during the vesting
period; or (ii) the service provider
remaining as a director of the Company
or any of its affiliates during the vesting
period.
• The maximum aggregate number of
shares issuable upon exercise of options
to non-employee directors must not
exceed 1% of the total Common Shares
of the Company outstanding at any
time and no more than $100,000 in
total award value per non-employee
director on an annual calendar basis.
• The board reserves the right in its
absolute discretion to terminate the
Plan with respect to all Plan shares in
respect of options which have not yet
been granted hereunder.
The Plan has the following restrictions,
which restrictions may only be superseded
by the Company obtaining approval of the
disinterested shareholders (defined below)
of the Company in each instance:
• Common Shares being issuable
to Insiders under the Plan, when
combined with all of the Company’s
other share compensation

44 Rockwell Diamonds Annual report 2014
CORPORATE GOVERNANCE continued
arrangements, exceeding 10% of the
outstanding Common Shares;
• Common Shares to be issued to Insiders
under the Plan, when combined
with all of the Company’s other
share compensation arrangements,
exceeding 10% of the outstanding
Common Shares in any 12 month
period;
• Common Shares being issuable to
independent directors under the
Plan, when combined with all of the
Company’s other share compensation
arrangements, exceeding 1% of the
outstanding Common Shares of the
Company; and
• A reduction in the exercise price of
an option granted hereunder to an
Insider or an extension of the term of
an option granted hereunder benefiting
an Insider.
Options are generally granted to corporate
executives in the first quarter of each year
as part of the annual compensation review.
Any special compensation is typically
granted in the form of options. Options
are granted at other times of the year to
individuals commencing employment with
the Company. The exercise price for the
options is based on the volume weighted
average of the closing price of the shares
of the Company on the TSX for the five
days prior to the date of grant.
SUMMARY COMPENSATION TABLEThe compensation paid to the NEOs during the Company’s three most recently completed financial years ended February 29, 2012,
February 28, 2013 and February 28, 2014 is as set out below:
Non-equity incentive plan compensation3
Name and principal position Year
Salary1
$
Share-based
awards$
Option-based
awards2
$
Annual incentive
plans3
Long-termincentive
plans$
Pension value
$
All other compen-
sation$
Total compen-
sation$
James Campbell
President and
CEO
2014 350,208 59,443 39,721 Nil Nil Nil Nil 449,372
2013 362,278 Nil Nil 50,190 Nil Nil Nil 412,468
2012 270,000 Nil 550,000 Nil Nil Nil Nil 820,000
Gerhard Jacobs
CFO
2014 283,379 44,583 35,749 Nil Nil Nil Nil 363,711
2013 297,536 Nil 17,135 47,806 Nil Nil Nil 362,477
2012 303,843 Nil 28,800 Nil Nil Nil Nil 332,643
Michael Hunt4
former COO
2014 Nil Nil Nil Nil Nil Nil Nil Nil
2013 Nil Nil Nil Nil Nil Nil Nil Nil
2012 137,886 Nil 141,176 Nil Nil Nil Nil 279,062
Graham
Chamberlain5
former COO 2012 168,375 Nil Nil Nil Nil Nil Nil 168,375
Notes:1. The Company’s South African executives are compensated in South African Rand (“ZAR”) and have been presented in Canadian dollars at an exchange rate
of 1 Canadian dollar = ZAR9.5329 (2013:ZAR8.3682 and 2012:ZAR7.4239) the average monthly rate in effect for the year ended February 28, 2014.2. These amounts represent the dollar amount based on the grant date fair value of the award for the year ended February 28, 2014. The options granted
in the Company’s financial year ended February 28, 2014 were granted pursuant to the share option plan. For compensation purposes, the Black-Scholes option valuation model has been used to determine the fair value on the date of grant. The Black-Scholes option valuation is determined using the expected life of the stock option, expected volatility of the Company’s Common Share Price, expected dividend yield, and risk-free interest rate. The Black-Scholes grant date fair value for awards granted on October 9, 2013 was 100% of the option exercise price.
3. These amounts include annual non-equity incentive plan compensation, such as bonuses and discretionary amounts for the year ended February 28, 2014.4. Mr Hunt commenced employment July 11, 2011 with the Company and was appointed Chief Operating Officer and resigned on October 28, 2012. 5. Mr Chamberlain commenced employment with the Company and was appointed Chief Operating Officer on November 1, 2009 and resigned on
December 31, 2011.

Rockwell Diamonds Annual report 2014 45
INCENTIVE PLAN AWARDSOutstanding option-based awards
The following table sets out all share-based awards and option-based awards outstanding as at February 28, 2014, for each NEO:
Option-based awards
Name
Number of securities
underlying unexercised
options#
Option exercise price
$ Option expiration date
Value of unexercised
in-the-money options
$1
James Campbell2
President and CEO
100,000 0.40 October 9, 2023 Nil
733,333 0.75 October 12, 2016 Nil
Gerhard Jacobs3
CFO
90,000 0.40 October 9, 2023 Nil
75,000 0.21 December 12, 2022 $2,250
60,000 0.48 October 12, 2016 Nil
53,333 0.975 October 8, 2015 Nil
Notes:1. The value at February 28, 2014 is calculated by determining the difference between the closing price of the Company’s Common Shares at February 28, 2014
($0.295 per Common Share) underlying the option on the TSX and the exercise price of the options.2. Mr Campbell was appointed as CEO effective June 1, 2011.3. Mr Jacobs was appointed as CFO effective July 19, 2010.
Incentive plan awards – value vested or earned during the year
The following table sets out all incentive plan awards (value vested or earned) during the year ended February 28, 2014, for each NEO:
Name
Option-based awards – value vested during the year1
$
Non-equity incentive plan compensation – value earned
during the year$
James Campbell
President and CEO Nil Nil
Gerhard Jacobs
CFO $2,250 Nil
Note:1. These amounts represent the aggregate dollar value that would have been realized if the options under the option-based award had been exercised on the
vesting date. The value of each amount has been determined by taking the difference between the market price of the option at date of exercise and the exercise or base price of the option under the option-based award on the vest date.
The Company has no pension plans for its directors, officers or employees.
TERMINATION AND CHANGE OF CONTROL BENEFITSAs at February 28, 2014 the following NEOs of the Company had written employment contracts between themselves and the Company:
• Gerhard Jacobs dated August 1, 2010; and
• James Campbell dated June 1, 2011.
Under these agreements Gerhard Jacobs and James Campbell are to work full time for the Company and are eligible to receive stock
options and a performance based bonus at the discretion of the compensation committee and the board, as well as other standard benefits
made available by the Company. Please see summary compensation table above.
There are no other compensatory plans or arrangements, with respect to the NEOs resulting from the resignation, retirement or any other
termination of employment of the NEOs or from a change of any NEO’s responsibilities following a change in control except Gerhard Jacobs.

46 Rockwell Diamonds Annual report 2014
CORPORATE GOVERNANCE continued
POTENTIAL PAYMENTS UPON TERMINATION The following table provides information concerning the value of payments and benefits following termination of employment of each NEO
under various circumstances. Payments vary based on the reason for termination and the timing of a departure. The amounts below are
calculated as if the NEO’s employment had been terminated on February 28, 2014. Receipt of payments on termination is contingent on
the NEO delivering a release to the Company.
NEO Termination without cause Change of control
James Campbell1 Salary $175,104 $700,414
Bonus Nil Nil
Options Nil Nil
Gerhard Jacobs2 Salary $141,689 $283,378
Bonus Nil Nil
Options Nil Nil
Notes:1. Mr Campbell was appointed as CEO on June 1, 2011.2. Mr Jacobs was appointed as CFO on July 19, 2010.
Compensation of the Company’s South African executives (including Mr Campbell) was paid to them in South African Rand (“ZAR”). In the
above table, an exchange rate of CDN$1 = ZAR9.5329 was used.
Except as outlined above, there are no contracts, agreements, plans or arrangements that provide for payments to an NEO at, following or
in connection with any termination (whether voluntary, involuntary or constructive), resignation, retirement or a change in control of the
Company.
DIRECTOR COMPENSATIONDirector compensation table
Each director of the Company, who is not an executive officer, is paid an annual director’s fee of $25,000. Each director who is a member of
the audit committee receives an additional $5,000. Each director receives a fee per meeting attended ($750 per board meeting, $1,000 per
other meeting) and 10,000 share options per annum. The share options are increased to 15,000 share options per annum should a director
opt not to receive meeting fees.
The compensation provided to the directors, excluding a director who is included in disclosure for an NEO for the Company’s most recently
completed financial year of February 28, 2014 is:
Name
Fees earned
$
Share-based
awards$
Option-based
awards$
Non-equity incentive
plan compen-
sation$
Pension value
$
All other compen-
sation$
Total$
Mark Bristow 28,750 Nil 3,972 Nil Nil Nil 32,722
Richard John Linnell 28,750 Nil 3,972 Nil Nil Nil 32,722
Willem Jacobus Jacobs 37,750 Nil 3,972 Nil Nil Nil 41,722
Johan van’t Hof1 40,750 Nil 3,972 Nil Nil Nil 44,722
Stephen Dietrich 38,750 Nil 3,972 Nil Nil Nil 42,722
Rick Menell1 28,750 Nil 3,972 Nil Nil Nil 32,722
Notes:1. Mr Menell was appointed a director from January 2013.

Rockwell Diamonds Annual report 2014 47
The following table sets out all share-based awards and option-based awards outstanding as at February 28, 2014, for each director,
excluding a director who is already set out in disclosure for a NEO for the Company:
Option-based awards Share-based awards
Name
Number of securities
underlying unexercised
options#
Option exercise price
$ Option expiration date
Value of unexercised
in-the-money options
$1
Number of shares or
units of shares that have not
vested#
Market or payout value
of share-based awards that
have not vested
$
Mark Bristow 33,333 0.90 Dec 7, 2014 Nil Nil Nil
50,000 0.975 Oct. 8, 2015 Nil Nil Nil
75,000 0.48 Oct 12, 2016 Nil Nil Nil
10,000 0.21 Dec 12, 2022 850 Nil Nil
10,000 0.40 Oct 9, 2023 Nil Nil Nil
Richard John Linnell 20,000 0.90 Dec 7, 2014 Nil Nil Nil
33,333 0.975 Oct. 8, 2015 Nil Nil Nil
10,000 0.21 Dec 12, 2022 850 Nil Nil
Willem Jacobus
Jacobs
33,333 0.90 Dec 7, 2014
33,333 0.975 Oct. 8, 2015 Nil Nil Nil
50,000 0.48 Oct 12, 2016 Nil Nil Nil
10,000 0.21 Dec 12, 2022 850 Nil Nil
10,000 0.40 Oct 9, 2023 Nil Nil Nil
Johan van’t Hof 10,000 0.21 Dec 12, 2022 850 Nil Nil
10,000 0.40 Oct 9, 2023 Nil Nil Nil
Stephen Dietrich 10,000 0.21 Dec 12, 2022 850 Nil Nil
10,000 0.40 Oct 9, 2023 Nil
Rick Menell 10,000 0.40 Oct 9, 2023 Nil Nil Nil
Note:1. The value at February 28, 2014 is calculated by determining the difference between the closing price of the Company’s Common Shares at February 28, 2014
($0.2950 per Common Share) underlying the option on the TSX and the exercise price of the options.
There was no value vested or earned under any incentive plan during the Company’s fiscal year ended February 28, 2014.

48 Rockwell Diamonds Annual report 2014
CORPORATE GOVERNANCE continued
SECURITIES AUTHORIZED FOR ISSUANCE UNDER EQUITY COMPENSATION PLANSThe following table sets out the equity compensation plan information for the fiscal year ended February 28, 2014.
Equity compensation plan information
Number of securities to be issued upon
exercise of outstanding options
Weighted-average exercise price of
outstanding options
Number of securities remaining available for
future issuance under equity compensation plans
(excluding securities reflected in column (a))
Plan category (a) (b) (c)
Equity compensation plans
approved by security holders –
(the Plan) 4,836,431 $0.54 515,893
Equity compensation plans not
approved by security holders Nil Nil Nil
Total 4,836,431 $0.54 515,893
INDEBTEDNESS OF DIRECTORS AND EXECUTIVE OFFICERSNo directors, proposed nominees for
election as directors, executive officers or
their respective associates or affiliates, or
other management of the Company were
indebted to the Company as of the end of
the most recently completed financial year
or as at the date hereof.
INTEREST OF INFORMED PERSONS IN MATERIAL TRANSACTIONSTo the knowledge of management of
the Company, no informed person
(a director, officer or holder of 10% or more
of the Shares) or nominee for election as a
director of the Company or any associate
or affiliate of any informed person or
proposed director had any interest in any
transaction which has materially affected or
would materially affect the Company
or any of its subsidiaries during the
12 months ended February 28, 2014, or
has any interest in any material transaction
in the current year other than in respect of
the share option plan and as set out herein
or in a document disclosed to the public.
Flawless Diamonds Trading House
Flawless Diamonds Trading House
(Proprietary) Limited (“Flawless Diamonds
Trading House” or “FDTH”) is a private
company where one director, DM Bristow,
and certain former directors and/or officers
of the Company, namely, Messrs J Brenner
and W van Wyk are shareholders. Rockwell
owns a 20% interest in FDTH which was
acquired with effect from May 5, 2010 for
consideration of approximately $100,000.
Flawless Diamonds Trading House is a
registered diamond broker which provides
specialist diamond valuation, marketing and
tender sales services to the Company for a
fixed fee of 1% of turnover which is below
the market rate charged by similar tender
houses. FDTH was established in 2006
to provide a professional marketing and
sales facility to market and sell Rockwell’s
diamond production. Rockwell had no
prior experience of marketing high quality
alluvial gemstone production and needed
to position itself in relation to new diamond
legislation which was being implemented
at the time that Rockwell was establishing
itself in the South African market. It was
strategically important for Rockwell to have
access to a strong and secure dedicated
marketing facility to maximize revenue from
the sale of its unique diamond production.
FDTH operates from South Africa’s
internationally recognized high security
diamond trading and manufacturing
hub known as Jewel City, Johannesburg.
FDTH was established and is still run by
experienced and internationally recognized
diamantaire. The facility is operated by a
small and highly experienced marketing
and valuation team which collectively
has over 100 years of rough diamond
valuation, marketing and sales experience.
FDTH follows rigorous diamond handling,
security, and Kimberley Process protocols,
and all marketing and sales procedures are
monitored and facilitated by a proprietary
computer based system. This system
provides independent and transparent
verification of results for sellers and
buyers, and is acknowledged in the
industry as a leading standard for
transacting diamond sales. Aside from
providing marketing and sales to Rockwell,
FDTH also conducts sales on behalf of
other small South African producers.
During fiscal 2014 FDTH was responsible
for selling 100% (or $41.1 million) of the
Company’s aggregate diamond sales.

Rockwell Diamonds Annual report 2014 49
Relationship with Diacore (previously Daboll Consulting Limited, an affiliate of the Steinmetz Diamond Group)
Diacore, an affiliate of the Steinmetz
Diamond Group, owns 19.4%
(10.2 million Rockwell Common Shares).
Rockwell Diamonds Inc. has a Marketing
and Beneficiation Agreement with Diacore
(previously Steinmetz Diamond Group)
which was initially signed in October
2007. Under the terms of the agreement
high valued rough diamonds produced
by Rockwell are sold to Diacore at the
market price. Rockwell receives 90% of
the price up front with the remaining 10%
payable on sale of the polished stone. The
diamonds are cut and polished by Diacore’
master cutters and on sale of the polished
diamonds, Rockwell participates equally in
the profits from the sale. The partnership
was originally set up for stones exceeding
$500,000 in value, but was extended to
include all stones exceeding 10 carats in
2009. In May 2011, the agreement was
broadened further to include all stones
larger than 2.8 carats.
The partnership has been successful for
both counterparties as Diacore has access
to Rockwell’s pipeline of high valued
stones, while Rockwell participates in
the upside potential on the final sale
of the stones where there is significant
value leverage. Rockwell is the only
diamond producer with a marketing and
beneficiation agreement of this nature.
Rockwell has generated total revenue of
$8.5 million from its profit shares in terms
of the joint venture in the last three years,
with the sale of 6,184 carats, while Diacore
has access to the large and exceptional
gemstones which are its specialty. As the
Removal of the oversize gravel at the Saxendrift in field screen.
stock of special stones in the joint venture
increases, so Rockwell’s potential for value
added revenues grows. With the recent
extension of the agreement to include
stones exceeding 2.8 carats, the benefits
for Rockwell will increase.
Diacore is also a creditor of the Company
having loaned it $2 million on June 2,
2011 under a convertible loan agreement.
Two addendums to the loan were signed
on June 19 and July 8, 2013 to allow
conversion of the $2 million loan into
maximum of 12,235,686 Common Shares,
only during the 21-day period prior to
June 26, 2015, and extending the loan
to June 26, 2015.

50 Rockwell Diamonds Annual report 2014
FINANCIAL STATEMENTS

Rockwell Diamonds Annual report 2014 51
DIRECTORS’ REPORT
NATURE OF BUSINESSRockwell is in the business of developing
and operating alluvial diamond mines. Its
medium-term goal is to become a mid-tier
diamond mining company processing
500,000 cubic meters per month of
quality gravels in the Middle Orange River
(“MOR”) region of South Africa. Rockwell’s
operations and development projects are
all located in the Republic of South Africa.
At February 28, 2014, the Group had
three existing mines in operation, namely
Saxendrift, Saxendrift Hills Complex
(“SHC”) and the recently commissioned
Niewejaarskraal Mine (“NJK”), which had
previously been on care and maintenance
since 2007. All three mines are located
in the MOR region of South Africa.
The Company has an economic interest
in a fourth operating property. Rockwell’s
operation at the Tirisano Mine has been
on care and maintenance since December
2012. However, royalty mining agreements
were subsequently put in place at Tirisano,
where independent contractors (or royalty
miners) mine for own risk and reward, with
the Company receiving a 12.5% royalty
income based on gross revenue from the
carats recovered and sold through the
Company’s tender process.
The Company is considering the
development of a fifth mining property
prospect. A Preliminary Economic
Assessment has been completed during
Q1 2014 on the Wouterspan project,
which could provide further expansion of
the Company’s Middle Orange operations
in future. The Group has a pipeline
of other projects with further future
development potential under consideration
and evaluation at present.
Rockwell continues to evaluate strategic
opportunities through merger and
acquisition as they arise, in order to expand
its mineral resources and provide new
opportunities to develop the additional
production.
Rockwell’s operations have a track record
of producing large gem quality diamonds,
which comprise a significant proportion of
its production profile. The larger diamonds
recovered from Rockwell’s mines are mostly
acquired for investment purposes. In order
to participate further in the diamond value
chain from production to retail sale, the
Company has a beneficiation agreement
in place. This arrangement enables it to
sell rough +2.8 carat sized diamonds, and
receive 90% of the fair value sales price
at sale and receive the remaining 10%
through, and participate equally in, the
retail profit on the sale of its stones after
polishing and finishing.
SUBSEQUENT EVENTSManagement is not aware of any matter or
circumstance arising since the end of the
financial year requiring amendment to the
amounts and disclosure included in these
financial statements.
FINANCIAL RESULTSThe financial statements on pages 56 to 99
set out fully the financial position, results of
operations and cash flows of the Company.
Financing
Rockwell management continues to
evaluate the potential of various projects
to ramp up further or improve its overall
pipeline of production properties. This
includes existing operations as well as
the new projects that the Company has
in its pipeline, with a particular focus on
properties located in the MOR region.
Construction of a processing plant at the
Niewejaarskraal project commenced in
mid-April 2013 and the first phase was
completed within ten weeks. The actual
cost of $2.5 million was funded in part from
the proceeds of the sale of the Klipdam
Mine at the end of March 2013. This first
phase of the project went into production
ramp up at the end of the second quarter
fiscal 2014 and was handed over to the
operations on September 1, 2013. The
second phase of the project entailed the
addition of a Bulk X-ray machine to treat
the coarse material and an in-field screen,
which was completed by the end of fiscal
2014, taking the monthly processing
capacity to 100,000m3.
Future developments include building
a new plant at Wouterspan and further
extensions at Saxendrift. A preliminary
economic assessment was completed
for Wouterspan during first quarter,
demonstrating viable project economics.
Both the Wouterspan and Niewejaarskraal
properties have extensive diamond
deposits, and have historically produced
diamonds that are similar to Saxendrift in
terms of size, quality and average price
per carat. The Company’s strategy is to
deploy high-volume processing plants
incorporating the latest technologies in
diamond recovery including a combination
of the fit for purpose in-field screen and
the Bulk X-ray technology that has been
implemented at Saxendrift Hill Complex.
The timing of Wouterspan and resource
extension projects will be predicated on
the availability of funds from external
capital sources and supplemented by
funds generated from internal cash flows.
With the exception of the Niewejaarskraal
project, no financing plans have been
assessed or determined to date in respect
of any of these projects.
LITIGATIONThe Company is not aware of any material
outstanding or threatened litigation.
INSURANCERockwell has adopted a policy that includes
insurance coverage for all equipment
that is purchased on an installment plan
(called hire purchase in South Africa) or
lease but it does not carry full coverage
for other equipment that is paid off. Cover
is obtained on a risk exposure and some
equipment is self insured. The Group also
has coverage on small vehicles, busses,
road trucks, Flow-sort X-ray equipment and
some of its fixed properties and assets.
LIQUIDITYAt February 28, 2014 the Group had
cash and cash equivalents of $1.3 million
(February 28, 2013: $5.6 million) and bank
indebtedness of $3.1 million (February 28,
2013: $2.8 million), for net cash holdings

52 Rockwell Diamonds Annual report 2014
DIRECTORS’ REPORT continued
of $1.8 million overdrawn (February
28, 2013: $2.8 million available). The
Group had negative working capital of
$(1.7) million compared to $1.2 million at
February 28, 2013. The major reason for
the reduction in net cash was the timing
of sales receipts and substantial capital
expenditure at NJK and SHC.
Management considered the available
cash resources at year end, the value
realized through diamond tenders post
year end and estimated the cash flows
from operations for the 24 month period
post year end. Based on this information
management concluded that the Group
will have available cash resources to settle
its liabilities as they fall due.
At February 28, 2014, the Group had asset
retirement obligations relating to its mines,
capital lease obligations at Saxendrift
relating to mining equipment with three
year lease agreements and a loan from
the Industrial Development Corporation of
South Africa Limited. The Group’s capital
lease obligations are shown in the table
above. Repayments are required in South
African rand, but reflected in Canadian
dollars in the table below.
The operations are now generating
sufficient cash to cover cash operating
costs and Group overheads and the
Company does not anticipate making
substantial capital expenditures without
concurrent financing in the coming twelve
months. The Group has adequate cash
holdings as well as access to short-term
debt facilities (bank overdraft facility) to
meet its working capital requirements for
the foreseeable future.
Contractual obligations and commitments
Rockwell has the following commitments
in respect of equipment lease payments to
various financial institutions for plant and
equipment. A minimum lease payment
of $0.2 million is payable in the next
12 months, with a further total $0.1 million
payable thereafter.
The following are the maturities of contractual obligations:
Payments due by period ($ millions)
Total
Less than one
year
One to three
years
Three to five years
More than five
years
Finance lease obligations 0.3 0.2 0.1 – –
Long-term debt obligations 5.2 2.0 3.2 – –
Operating lease obligations 4.3 1.2 1.7 1.4 –
Purchase obligations 1.1 1.1 – – –
Total 10.9 4.5 5.0 1.4 –
opportunities as they arise. The Group
considers the components of shareholders’
equity, as well as its cash and cash
equivalents, and bank indebtedness as
capital. The Group’s investment policy is
to invest its cash in highly liquid short-
term interest-bearing investments, having
maturity dates of three months or less from
the date of acquisition, that are readily
convertible to known amounts of cash.
The Group manages the capital structure
and makes adjustments to it in the light
of changes in economic conditions and
the risk characteristics of the underlying
assets. The Group may issue new shares
through private placements, issue debt,
or return capital to shareholders, in order
to maintain or adjust the capital structure.
In order to facilitate the management
of its capital requirements, the Group
prepares annual expenditure budgets
that are updated as necessary depending
on various factors, including successful
capital deployment and general industry
conditions.
There were no changes to the Group’s
approach to capital and working capital
management during the year ended
February 28, 2014 and the Group expects
it will be able to sufficiently fund its capital
development and operations for fiscal 2015.
FINANCIAL INSTRUMENT RISK EXPOSURE AND RISK MANAGEMENTThe Group is exposed in varying degrees
to a variety of financial instrument related
risks. The board approves and monitors
FINANCIAL INSTRUMENTS AND RISKS AND UNCERTAINTIESFinancial risk management
The board of directors has overall
responsibility for the establishment and
oversight of the Group’s risk management
framework. The Group’s risk management
policies are established to identify and
analyze the risks faced by the Group, to
set appropriate risk limits and controls, and
to monitor risks and adherence to limits.
Risk management policies and systems
are reviewed regularly to reflect changes
in market conditions and the Group’s
activities.
Capital management
As at February 28, 2014, the Group
is not subject to externally imposed
capital encumbrances other than through
the terms of its overdraft facility and
finance leases.
At February 28, 2014, of the $1,324,328
(February 28, 2013: $5,570,626)
cash and cash equivalents held by the
Group, $1,151,707 (February 28, 2013:
$5,293,016) were held in South African
rand (“ZAR”), $164,462 (February 28,
2013: $236,075) in Canadian dollars and
$8,159 (February 28, 2013: $41,535) in
United States dollars.
The Group’s primary objectives when
managing capital are to safeguard the
Group’s ability to continue as a going
concern, so that it can continue to provide
returns for shareholders, and to have
sufficient funds on hand for business

Rockwell Diamonds Annual report 2014 53
the risk management processes, including
treasury policies, counterparty limits,
controlling and reporting structures, credit
risk, liquidity risk, currency risk, interest risk
and diamond price risk.
Credit risk
Credit risk is the risk of potential loss to
the Group if counterparties to a financial
instrument fail to meet their contractual
obligations. The Group’s credit risk is
primarily attributable to its liquid financial
assets including cash and equivalents,
restricted cash, trade and other receivables
and loans to related parties. The carrying
values of the Group’s cash and cash
equivalents, trade and other receivables
and loans to related parties represents the
maximum exposure to credit risk.
The Group limits exposure to credit risk on
liquid financial assets through maintaining
its cash and equivalents with high-credit
quality financial institutions. The Group does
not have financial assets that are invested in
asset backed commercial paper. The Group
minimizes its credit risk by reducing credit
terms to 30 days on its sales.
Liquidity risk
Liquidity risk is the risk that the Group will
not be able to meet its financial obligations
as they fall due. After taking into account
cash flows from operations and the Group’s
holdings of cash and cash equivalents, the
Group believes that these sources will be
sufficient to cover the likely requirements
for the foreseeable future. The Group’s cash
and equivalents are invested in business
accounts which are available on demand
for the Group’s capital programs, and
which are not invested in any asset backed
deposits/investments.
The Group operates in South Africa. The
Group is subject to currency exchange
controls administered by the South African
Reserve Bank, that country’s central bank.
A significant portion of the Group’s funding
structure for its South African operations
consists of advancing loans to its South
Africa incorporated subsidiaries and it is
possible the Company may not be able
to acceptably repatriate such funds once
those subsidiaries are able to repay the
loans or repatriate other funds such as
operating profits should any develop. The
repatriation of cash held in South Africa is
permitted upon the approval of the South
African Reserve Bank.
Market risk
Market risk is the risk that changes in market
prices, such as foreign exchange rates and
interest rates will affect the Group’s income
or the value of its holdings of financial
instruments. The objective of market risk
management is to manage and control
market risk exposures within acceptable
parameters, while optimizing the return.
Foreign currency risk
In the normal course of business, the
Group enters into transactions for
the purchase of supplies and services
denominated in ZAR. In addition, the
Group has cash and certain liabilities
denominated in ZAR. As a result, the Group
is subject to currency risk from fluctuations
in foreign exchange rates. The Group
has not entered into any derivative or
other financial instruments to mitigate this
foreign exchange risk.
Interest rate risk
The Group is subject to interest rate risk
with respect to its investments in cash and
cash equivalents. The Group’s policy is to
invest cash at floating rates of interest and
cash reserves are to be maintained in cash
equivalents in order to maintain liquidity,
while achieving a satisfactory return for
shareholders. Fluctuations in interest rates
when the cash equivalents mature impact
interest income earned.
The Group has finance lease obligations
with several financial institutions as well
as a loan from the Industrial Development
Corporation of South Africa Limited. These
obligations bear interest at rates linked to
the prevailing prime rate, and are subject
to interest rate change risk.
Business risk – diamond price risk
The value of the Group’s mineral resource
properties is dependent on the price
and the outlook of diamonds. Diamond
demand and prices fluctuate and are
affected by numerous factors beyond the
control of the Group, including worldwide
economic trends, worldwide levels of
diamond discovery and production, and
the level of demand for and discretionary
spending on, luxury goods such as
diamonds and jewelry. Low or negative
growth in the worldwide economy,
prolonged credit market disruptions or
activities creating disruptions in economic
growth could result in decreased demand
for diamonds, thereby negatively
affecting the price of diamonds. Similarly,
a substantial increase in the worldwide
level of diamond production could also
negatively affect the price of diamonds.
In each case, such developments could
materially adversely affect the Group’s
results of operations.
The profitability of the Group’s operations
is highly correlated to the market price
of diamonds. If diamond prices decline
for a prolonged period below the cost of
production of the Group’s operating mines,
it may not be economically feasible to
continue production.

54 Rockwell Diamonds Annual report 2014
MANAGEMENT’S RESPONSIBILITIES AND APPROVAL
The consolidated financial statements,
the notes thereto and other financial
information contained in the annual report
have been prepared in accordance with
International Financial Reporting Standards
as issued by the International Accounting
Standards Board and are the responsibility
of the management of Rockwell Diamonds
Inc. (“Company”). The financial information
presented elsewhere in the annual report
is consistent with the data that is contained
in the consolidated financial statements.
The consolidated financial statements,
where necessary, include amounts which
are based on the best estimates and
judgment of management.
In order to discharge management’s
responsibility for the integrity of the
consolidated financial statements, the
Company maintains a system of internal
accounting controls. These controls
are designed to provide reasonable
assurance that the Company’s assets are
safeguarded, transactions are executed
and recorded in accordance with
management’s authorisation, proper
records are maintained and relevant and
reliable financial information is produced.
These controls include maintaining
quality standards in hiring and training
of employees, policies and procedures
manuals, a corporate code of conduct and
ensuring that there is proper accountability
for performance within appropriate
and well-defined areas of responsibility.
The system of internal controls is further
supported by a compliance function,
which is designed to ensure that we and
our employees comply with securities
legislation and conflict of interest rules.
The board of directors is responsible for
overseeing management’s performance
of its responsibilities for financial reporting
and internal control. The audit committee,
which is composed of non-executive
directors, meets with management as
well as the external auditors to ensure
that management is properly fulfilling its
financial reporting responsibilities to the
directors who approve the consolidated
financial statements. The external auditors
have full and unrestricted access to the
audit committee to discuss the scope of
their audits, the system of internal controls
and review financial reporting issues.
The consolidated financial statements
have been audited by KPMG Inc, the
independent registered public accounting
firm, in accordance with Canadian
Auditing Standards.
The consolidated financial statements set
out on pages 56 to 99 were approved
by the board on May 21, 2014 and were
signed on its behalf by:
James CampbellDirector
Dr Mark BristowDirector

Rockwell Diamonds Annual report 2014 55
INDEPENDENT AUDITORS’ REPORT
To the Shareholders of Rockwell Diamonds Inc.
We have audited the accompanying
consolidated financial statements of
Rockwell Diamonds Inc., which comprise
the consolidated statements of financial
position as at February 28, 2014 and
February 28, 2013 the consolidated
statements of profit or loss and other
comprehensive income, changes in equity
and cash flows for the years then ended,
and notes, comprising a summary of
significant accounting policies and other
explanatory information, as set out on
pages 56 to 99.
MANAGEMENT’S RESPONSIBILITY FOR THE CONSOLIDATED FINANCIAL STATEMENTSManagement is responsible for the
preparation and fair presentation of
these consolidated financial statements in
accordance with International Financial
Reporting Standards as issued by the
International Accounting Standards
Board, and for such internal control as
management determines is necessary to
enable the preparation of consolidated
financial statements that are free from
material misstatement, whether due to
fraud or error.
AUDITORS’ RESPONSIBILITYOur responsibility is to express an opinion
on these consolidated financial statements
based on our audits. We conducted
our audits in accordance with Canadian
generally accepted auditing standards.
Those standards require that we comply
with ethical requirements and plan and
perform the audit to obtain reasonable
assurance about whether the consolidated
financial statements are free from material
misstatement.
An audit involves performing procedures to
obtain audit evidence about the amounts
and disclosures in the consolidated
financial statements. The procedures
selected depend on our judgment,
including the assessment of the risks of
material misstatement of the consolidated
financial statements, whether due to fraud
or error. In making those risk assessments,
we consider internal control relevant to the
entity’s preparation and fair presentation
of the consolidated financial statements in
order to design audit procedures that are
appropriate in the circumstances, but not
for the purpose of expressing an opinion
on the effectiveness of the entity’s internal
control.
An audit also includes evaluating the
appropriateness of accounting policies
used and the reasonableness of accounting
estimates made by management, as well as
evaluating the overall presentation of the
consolidated financial statements.
We believe that the audit evidence we
have obtained in our audits is sufficient
and appropriate to provide a basis for our
audit opinion.
OPINIONIn our opinion, the consolidated financial
statements present fairly, in all material
respects, the consolidated financial
position of Rockwell Diamonds Inc. as at
February 28, 2014 and February 28, 2013
and its consolidated financial performance
and its consolidated cash flows for the
years then ended in accordance with
International Financial Reporting Standards
as issued by the International Accounting
Standards Board.
KPMG Inc.Registered Auditors
Johannesburg, South Africa
May 22, 2014

56 Rockwell Diamonds Annual report 2014
CONSOLIDATED
STATEMENTS OF FINANCIAL POSITION
Amounts in Canadian dollars Note(s)
As atFebruary 28
2014
As atFebruary 28
2013
ASSETSNon-current assets
Mineral property interests 2 26,641,671 31,405,358
Investment in associates 3 232,616 207,560
Property, plant and equipment 4 30,720,684 33,544,992
Investments and deposits 5 5,385,602 4,888,415
Rehabilitation deposits 14 1,701,493 1,818,291
Total non-current assets 64,682,066 71,864,616
Current assets
Inventories 6 4,607,953 2,304,782
Loans to related parties 15 185,706 94,183
Current tax receivable 35,649 39,587
Trade and other receivables 7 8,500,922 5,850,618
Cash and cash equivalents 8 1,324,328 5,570,626
Total current assets 14,654,558 13,859,796
Total assets 79,336,624 85,724,412
EQUITY AND LIABILITIESEquity
Share capital 9 147,072,948 146,862,257
Reserves (10,008,873) (11,874,763)
Retained loss (88,096,415) (77,478,322)
Total equity attributable to the equity holders of the Group 48,967,660 57,509,172
Non-controlling interest (1,737,222) (2,137,472)
Total equity 47,230,438 55,371,700
LIABILITIESNon-current liabilities
Loans and borrowings 11 3,240,461 3,889,684
Finance lease obligation 12 110,017 281,029
Deferred tax 13 5,925,500 6,543,184
Rehabilitation obligation 14 6,459,061 6,992,157
Total non-current liabilities 15,735,039 17,706,054
Current liabilities
Loans from related parties 15 4,258 48,925
Loans and borrowings 11 1,953,651 1,314,807
Finance lease obligation 12 165,069 321,083
Trade and other payables 16 11,162,756 8,121,922
Bank overdraft 8 3,085,413 2,839,921
Total current liabilities 16,371,147 12,646,658
Total liabilities 32,106,186 30,352,712
Total equity and liabilities 79,336,624 85,724,412

Rockwell Diamonds Annual report 2014 57
CONSOLIDATED
STATEMENTS OF PROFIT OR LOSS AND OTHER COMPREHENSIVE INCOME
Amounts in Canadian dollars Note(s)
For the year ended
February 282014
For theyear ended
February 282013
Sale of diamonds 21 41,106,550 27,105,988
Beneficiation income 21 4,062,860 5,299,275
Production cost 22 (39,200,432) (31,338,217)
Operating profit before amortization and depreciation 5,968,978 1,067,046
Amortization of mineral property interests 2 (927,709) (803,234)
Depreciation of property, plant and equipment 4 (5,008,643) (6,366,415)
Gross profit/(loss) 32,626 (6,102,603)
Other income 1,703,510 599,031
General and administration expenses (4,439,754) (5,806,816)
Rehabilitation obligation (recognized) revised (743,023) 3,549,572
Realized foreign exchange with sale of subsidiary 28 (6,609,464) –
Impairments (54,774) (5,411,603)
Loss before net finance costs 23 (10,110,879) (13,172,419)
Finance income 24 698,932 613,760
Finance costs 25 (1,137,131) (1,406,635)
Loss after net finance costs (10,549,078) (13,965,294)
Share of profit from equity accounted investment 3 58,962 58,761
Loss before taxation (10,490,116) (13,906,533)
Taxation 26 62,739 130,155
Loss for the year (10,427,377) (13,776,378)
Other comprehensive income net of taxation
Items that are or may be reclassified to profit or loss
Exchange differences on translating foreign operations (5,160,181) (8,733,171)
Reversal of realized foreign exchange with sale of subsidiary 28 6,609,464 –
Other comprehensive income for the year net of taxation 1,449,283 (8,733,171)
Total comprehensive income for the year (8,978,094) (22,509,549)
Loss attributable to:
Owners of the Group (10,618,093) (10,900,533)
Non-controlling interest 190,716 (2,875,845)
Loss for the year (10,427,377) (13,776,378)
Total comprehensive income attributable to:
Owners of the Group (9,378,344) (19,866,594)
Non-controlling interest 400,250 (2,642,955)
Total comprehensive income for the year (8,978,094) (22,509,549)
Loss per share
Basic and diluted loss per share (cents) 27 (21.30) (22.55)
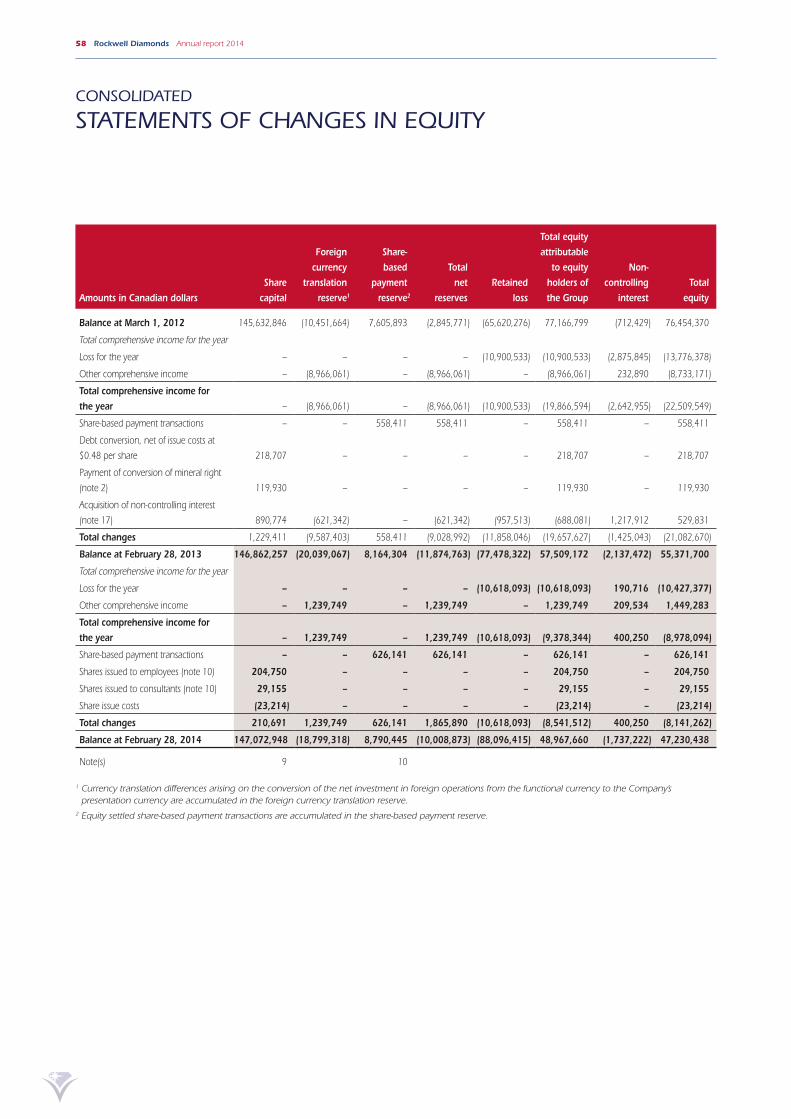
58 Rockwell Diamonds Annual report 2014
CONSOLIDATED
STATEMENTS OF CHANGES IN EQUITY
Amounts in Canadian dollarsShare
capital
Foreigncurrency
translationreserve1
Share-based
paymentreserve2
Total net
reservesRetained
loss
Total equity attributable
to equity holders of the Group
Non- controlling
interestTotal
equity
Balance at March 1, 2012 145,632,846 (10,451,664) 7,605,893 (2,845,771) (65,620,276) 77,166,799 (712,429) 76,454,370
Total comprehensive income for the year
Loss for the year – – – – (10,900,533) (10,900,533) (2,875,845) (13,776,378)
Other comprehensive income – (8,966,061) – (8,966,061) – (8,966,061) 232,890 (8,733,171)
Total comprehensive income for the year – (8,966,061) – (8,966,061) (10,900,533) (19,866,594) (2,642,955) (22,509,549)
Share-based payment transactions – – 558,411 558,411 – 558,411 – 558,411
Debt conversion, net of issue costs at
$0.48 per share 218,707 – – – – 218,707 – 218,707
Payment of conversion of mineral right
(note 2) 119,930 – – – – 119,930 – 119,930
Acquisition of non-controlling interest
(note 17) 890,774 (621,342) – (621,342) (957,513) (688,081) 1,217,912 529,831
Total changes 1,229,411 (9,587,403) 558,411 (9,028,992) (11,858,046) (19,657,627) (1,425,043) (21,082,670)
Balance at February 28, 2013 146,862,257 (20,039,067) 8,164,304 (11,874,763) (77,478,322) 57,509,172 (2,137,472) 55,371,700
Total comprehensive income for the year
Loss for the year – – – – (10,618,093) (10,618,093) 190,716 (10,427,377)
Other comprehensive income – 1,239,749 – 1,239,749 – 1,239,749 209,534 1,449,283
Total comprehensive income for the year – 1,239,749 – 1,239,749 (10,618,093) (9,378,344) 400,250 (8,978,094)
Share-based payment transactions – – 626,141 626,141 – 626,141 – 626,141
Shares issued to employees (note 10) 204,750 – – – – 204,750 – 204,750
Shares issued to consultants (note 10) 29,155 – – – – 29,155 – 29,155
Share issue costs (23,214) – – – – (23,214) – (23,214)
Total changes 210,691 1,239,749 626,141 1,865,890 (10,618,093) (8,541,512) 400,250 (8,141,262)
Balance at February 28, 2014 147,072,948 (18,799,318) 8,790,445 (10,008,873) (88,096,415) 48,967,660 (1,737,222) 47,230,438
Note(s) 9 10
1 Currency translation differences arising on the conversion of the net investment in foreign operations from the functional currency to the Company’s presentation currency are accumulated in the foreign currency translation reserve.
2 Equity settled share-based payment transactions are accumulated in the share-based payment reserve.

Rockwell Diamonds Annual report 2014 59
CONSOLIDATED
STATEMENTS OF CASH FLOWS
Amounts in Canadian dollars Note(s)
For the year ended
February 282014
For theyear ended
February 282013
Cash flows from operating activities
Cash receipts from customers 41,998,575 31,285,232
Cash paid to suppliers and employees (39,328,485) (36,093,313)
Cash generated (used) in operations 19 2,670,090 (4,808,081)
Finance income 372,603 406,835
Finance costs (483,844) (533,085)
Tax paid 20 – (39,587)
Net cash inflow (outflow) from operating activities 2,558,849 (4,973,918)
Cash flows from investing activities
Purchase of property, plant and equipment 4 (8,707,671) (4,750,650)
Proceeds from sale of property, plant and equipment 4 975,321 3,673,148
Purchase of mineral property interests 2 (199,515) –
Sale of mineral property interests 2 2,097,998 215,100
Asset and liability acquisition net of cash and cash equivalents acquired 17 – 2,659
Proceeds from sale of subsidiary 18 1,679,470 –
Net movement in related party loans (143,009) (91,684)
Net movement in investments and deposits (2,383,155) (2,075,420)
Decrease in rehabilitation deposits (65,131) 875,128
Net cash outflow from investing activities (6,745,692) (2,151,719)
Cash flows from financing activities
Share issue costs 9 (23,214) (5,293)
Repayment of loans and borrowings (10,202) –
Repayment of finance lease obligations (271,531) (50,226)
Net cash outflow from financing activities (304,947) (55,519)
Net movement in cash and cash equivalents for the year (4,491,790) (7,181,156)
Cash and cash equivalents at the beginning of the year 2,730,705 9,911,861
Total cash and cash equivalents at the end of the year 8 (1,761,085) 2,730,705
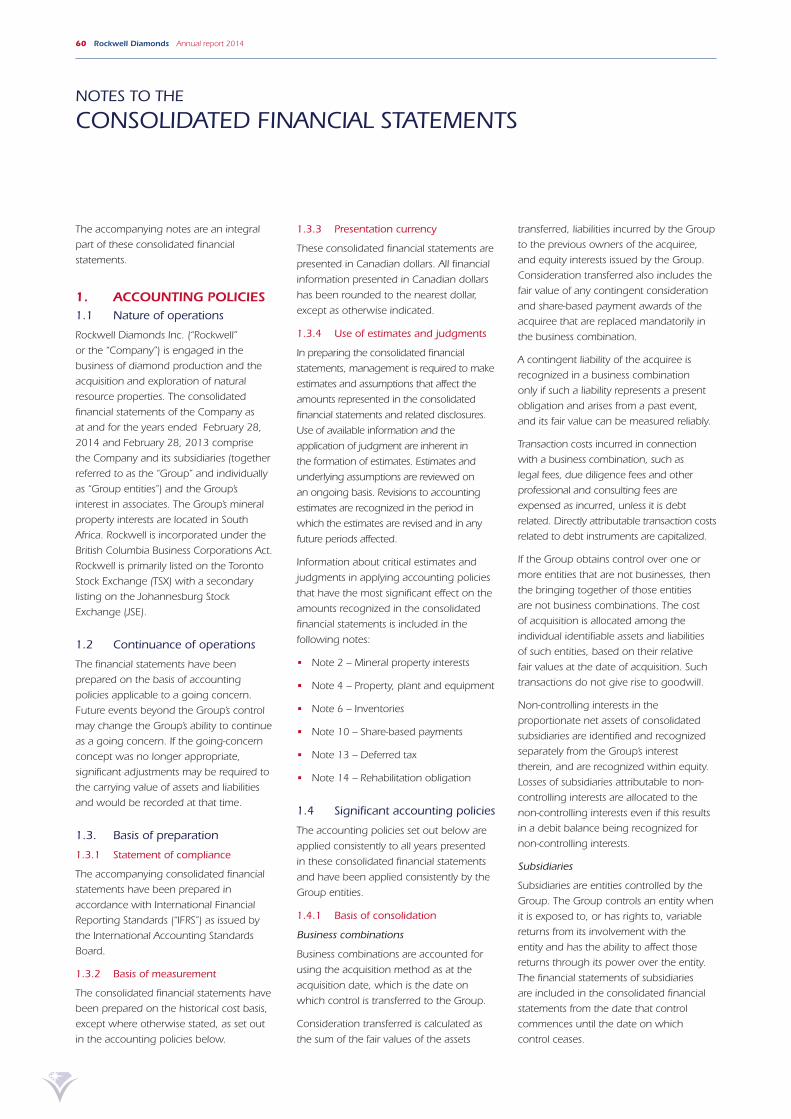
60 Rockwell Diamonds Annual report 2014
NOTES TO THE
CONSOLIDATED FINANCIAL STATEMENTS
The accompanying notes are an integral
part of these consolidated financial
statements.
1. ACCOUNTING POLICIES1.1 Nature of operations
Rockwell Diamonds Inc. (“Rockwell”
or the “Company”) is engaged in the
business of diamond production and the
acquisition and exploration of natural
resource properties. The consolidated
financial statements of the Company as
at and for the years ended February 28,
2014 and February 28, 2013 comprise
the Company and its subsidiaries (together
referred to as the “Group” and individually
as “Group entities”) and the Group’s
interest in associates. The Group’s mineral
property interests are located in South
Africa. Rockwell is incorporated under the
British Columbia Business Corporations Act.
Rockwell is primarily listed on the Toronto
Stock Exchange (TSX) with a secondary
listing on the Johannesburg Stock
Exchange (JSE).
1.2 Continuance of operations
The financial statements have been
prepared on the basis of accounting
policies applicable to a going concern.
Future events beyond the Group’s control
may change the Group’s ability to continue
as a going concern. If the going-concern
concept was no longer appropriate,
significant adjustments may be required to
the carrying value of assets and liabilities
and would be recorded at that time.
1.3. Basis of preparation
1.3.1 Statement of compliance
The accompanying consolidated financial
statements have been prepared in
accordance with International Financial
Reporting Standards (“IFRS”) as issued by
the International Accounting Standards
Board.
1.3.2 Basis of measurement
The consolidated financial statements have
been prepared on the historical cost basis,
except where otherwise stated, as set out
in the accounting policies below.
1.3.3 Presentation currency
These consolidated financial statements are
presented in Canadian dollars. All financial
information presented in Canadian dollars
has been rounded to the nearest dollar,
except as otherwise indicated.
1.3.4 Use of estimates and judgments
In preparing the consolidated financial
statements, management is required to make
estimates and assumptions that affect the
amounts represented in the consolidated
financial statements and related disclosures.
Use of available information and the
application of judgment are inherent in
the formation of estimates. Estimates and
underlying assumptions are reviewed on
an ongoing basis. Revisions to accounting
estimates are recognized in the period in
which the estimates are revised and in any
future periods affected.
Information about critical estimates and
judgments in applying accounting policies
that have the most significant effect on the
amounts recognized in the consolidated
financial statements is included in the
following notes:
• Note 2 – Mineral property interests
• Note 4 – Property, plant and equipment
• Note 6 – Inventories
• Note 10 – Share-based payments
• Note 13 – Deferred tax
• Note 14 – Rehabilitation obligation
1.4 Significant accounting policies
The accounting policies set out below are
applied consistently to all years presented
in these consolidated financial statements
and have been applied consistently by the
Group entities.
1.4.1 Basis of consolidation
Business combinations
Business combinations are accounted for
using the acquisition method as at the
acquisition date, which is the date on
which control is transferred to the Group.
Consideration transferred is calculated as
the sum of the fair values of the assets
transferred, liabilities incurred by the Group
to the previous owners of the acquiree,
and equity interests issued by the Group.
Consideration transferred also includes the
fair value of any contingent consideration
and share-based payment awards of the
acquiree that are replaced mandatorily in
the business combination.
A contingent liability of the acquiree is
recognized in a business combination
only if such a liability represents a present
obligation and arises from a past event,
and its fair value can be measured reliably.
Transaction costs incurred in connection
with a business combination, such as
legal fees, due diligence fees and other
professional and consulting fees are
expensed as incurred, unless it is debt
related. Directly attributable transaction costs
related to debt instruments are capitalized.
If the Group obtains control over one or
more entities that are not businesses, then
the bringing together of those entities
are not business combinations. The cost
of acquisition is allocated among the
individual identifiable assets and liabilities
of such entities, based on their relative
fair values at the date of acquisition. Such
transactions do not give rise to goodwill.
Non-controlling interests in the
proportionate net assets of consolidated
subsidiaries are identified and recognized
separately from the Group’s interest
therein, and are recognized within equity.
Losses of subsidiaries attributable to non-
controlling interests are allocated to the
non-controlling interests even if this results
in a debit balance being recognized for
non-controlling interests.
Subsidiaries
Subsidiaries are entities controlled by the
Group. The Group controls an entity when
it is exposed to, or has rights to, variable
returns from its involvement with the
entity and has the ability to affect those
returns through its power over the entity.
The financial statements of subsidiaries
are included in the consolidated financial
statements from the date that control
commences until the date on which
control ceases.

Rockwell Diamonds Annual report 2014 61
Loss of control
When the Group loses control over a
subsidiary, it derecognizes the assets and
liabilities of the subsidiary, and any related
NCI and other components of equity.
Any gain or loss is recognized in profit or
loss. Any interest retained in the former
subsidiary is measured at fair value when
control is lost.
Non-controlling interests (“NCI”)
NCI are measured at their proportionate
share of the carrying amounts of the
acquiree’s identifiable net assets at fair value
at the acquisition date. Changes in the
Group’s interest in a subsidiary that do not
result in a loss of control are accounted for
as equity transactions.
Transactions eliminated on consolidation
Intra-group balances and transactions,
and any unrealized income and expenses
arising from intra-group transactions, are
eliminated. Unrealized losses are eliminated
in the same way as unrealized gains, but
only to the extent that there is no evidence
of impairment.
Interests in equity-accounted investees
The Group’s interests in equity-accounted
investees comprise interests in associates.
Associates are those entities in which the
Group has significant influence, but not
control or joint control, over the financial
and operating policies.
Interests in associates are accounted
for using the equity method. They are
recognized initially at cost, which includes
transaction costs. Subsequent to initial
recognition, the consolidated financial
statements include the Group’s share of
the profit or loss and other comprehensive
income (“OCI”) of equity-accounted
investees, until the date on which
significant influence ceases.
1.4.2 Mineral property interests
The acquisitions of mineral property
interests are initially measured at the
fair value of the consideration paid.
Mineral property acquisition costs and
development expenditures incurred
subsequent to the determination of
the feasibility of mining operations and
approval of development by the Group are
capitalized until the property is placed into
production, sold, abandoned, or when
management has determined that there
has been an impairment in value. Such
acquisition costs are amortized over the
estimated life of the mine, based on the
unit of production method, or written off
to operations if the property is abandoned,
allowed to lapse, or if there is little prospect
of further work being carried out by the
Group. Under the unit of production
method, the yearly depreciation charge is
calculated by dividing the actual resources
mined by the estimated resources at the
beginning of the year and then multiplying
the resulting fraction by the net carrying
value of the related assets. The unit of
production method results in a systematic
and rational allocation of the cost of the
mineral property interests over the period
the resources are utilized.
Exploration expenditure incurred
subsequent to the mining operations
which do not increase production or
extend the life of operations are expensed
in the period incurred.
The amount presented for mineral
property interests represents costs incurred
to date less accumulated amortization
and impairment losses, and does not
necessarily reflect present or future values.
1.4.3 Exploration and evaluation costs
Exploration and evaluation expenditures
relate to cost incurred on the exploration
for and evaluation of potential mineral
resources and includes costs relating to the
following:
• Acquisition of exploration rights;
• Conducting geological studies;
• Exploratory drilling and sampling; and
• Evaluating the technical feasibility and
commercial viability of extracting a
mineral resource.
Expenditures incurred on activities that
precede exploration for and evaluation of
mineral resources, being all expenditures
incurred prior to securing the legal
rights to explore an area, are expensed
immediately.
Expenditures towards in-house exploration for and evaluation of potential mineral resources for each area of interest are expensed until it is considered probable that future economic benefit will arise through further exploration and subsequent development of the area of interest. Pre-feasibility studies involve the review of one or more potential development options with the aim of moving forward to the more detailed feasibility study stage. Expenditures related to such studies are expensed in full as there is insufficient certainty that future economic benefit will be generated at this stage of a project.
Expenditures relating to feasibility studies which support the technical feasibility and commercial viability of an area are capitalized at cost under mineral property interests. Where a feasibility study reaches a favourable conclusion, the costs are depleted over the unit of production method as described in 1.4.2. Where the feasibility study reaches an adverse conclusion, any previously costs capitalized are written off.
1.4.4 Property, plant and equipment
The cost of an item of property, plant and equipment is recognized as an asset when:
• it is probable that future economic benefits associated with the item will flow to the Group; and
• the cost of the item can be measured reliably.
Property, plant and equipment are measured at cost less accumulated depreciation and any impairment losses.
Cost includes costs incurred initially to acquire or construct an item of property, plant and equipment and costs incurred subsequently to add to and replace part of it. If a replacement cost is recognized in the carrying amount of an item of property, plant and equipment, the carrying amount of the replaced part is derecognized.
Subsequent costs are included in the asset’s carrying amount or recognized as a separate asset, as appropriate, only when it is probable that future economic benefits associated with the item will flow to the Company and the cost of them can be measured reliably.

62 Rockwell Diamonds Annual report 2014
NOTES TO THE CONSOLIDATED FINANCIAL STATEMENTS continued
1. ACCOUNTING POLICIES continued
1.4 Significant accounting policies continued
1.4.4 Property, plant and equipment
continued
The carrying amount of the replacement
part is derecognized. All other repairs and
maintenance are recognized in profit or
loss during the financial period in which
they are incurred.
Property, plant and equipment are
depreciated on the straight-line basis
over their expected useful lives to their
estimated residual value.
Consistent with the prior year, the useful
lives of items of property, plant and
equipment have been assessed as follows:
Average usefulItem life
Buildings 12 years
Plant and machinery 4 – 10 years
Motor vehicles 5 years
Office equipment 6 years
Assets under construction are not
depreciated until it is in the location and
condition necessary for it to be capable
of operating in the manner intended by
management.
Land is not depreciated.
The residual value, useful life and
depreciation method of each asset is
reviewed annually. If the expectations differ
from previous estimates, the change is
accounted for as a change in accounting
estimate.
The depreciation for each period is
recognized in profit or loss unless it is
included in the carrying amount of
another asset.
The gain or loss arising from the
derecognition of an item of property, plant
and equipment is included in profit or loss
when the item is derecognized. The gain
or loss arising from the derecognition of
an item of property, plant and equipment
is determined as the difference between
the net disposal proceeds, if any, and the
carrying amount of the item.
1.4.5 Impairment of non-financial
assets
The carrying amounts of the Group’s
non-financial assets, other than inventories
and deferred tax assets, are reviewed at
each reporting date to determine whether
there is any indication of impairment. If
any such indication exists, then the asset’s
recoverable amount is estimated.
The recoverable amount of an asset or cash
generating unit is the greater of its value
in use and its fair value less costs to sell. In
assessing value in use, the estimated future
cash flows are discounted to their present
value using a pre-tax discount rate that
reflects current market assessments of the
time value of money and the risks specific
to the asset. For the purpose of impairment
testing, assets are grouped together into
the smallest group of assets that generates
cash inflows from continuing use that are
largely independent of the cash inflows of
other assets or groups of assets (the “cash-
generating unit”).
An impairment loss is recognized if the
carrying amount of an asset or its cash-
generating units exceeds its estimated
recoverable amount. Impairment losses
are recognized in profit or loss. Impairment
losses recognized in respect of cash-
generating units are allocated to reduce the
carrying amounts of the other assets in the
unit (group of units) on a pro rata basis.
Impairment losses recognized in prior years
are assessed at each reporting date for
any indications that the loss has decreased
or no longer exists. An impairment loss
is reversed if there has been a change
in the estimates used to determine the
recoverable amount. An impairment loss
is reversed only to the extent that the
asset’s carrying amount does not exceed
the carrying amount that would have
been determined, net of depreciation or
amortization, if no impairment loss had
been recognized.
1.4.6 Financial instruments
Initial recognition and measurement
Financial instruments are recognized
initially when the Group becomes a
party to the contractual provisions of the
instruments. The Group classifies financial
instruments, or their component parts,
on initial recognition as a financial asset,
a financial liability or an equity instrument
in accordance with the substance of the
contractual arrangement.
Financial instruments are measured initially
at fair value, except for equity investments
for which a fair value is not determinable,
which are measured at cost and are
classified as available-for-sale financial assets.
For financial instruments which are
not at fair value through profit or loss,
transaction costs are included in the initial
measurement of the instrument.
Transaction costs on financial instruments
at fair value through profit or loss are
recognized in profit or loss.
Subsequent measurement
Financial instruments at fair value through
profit or loss are subsequently measured
at fair value, with gains and losses
arising from changes in fair value being
recognized in profit or loss for the period.
Loans and receivables are subsequently
measured at amortized cost, using the
effective interest method, less accumulated
impairment losses. Loans and receivables
include loans to related parties, trade and
other receivables, deposits and cash and
cash equivalents.
Available-for-sale financial assets are
subsequently measured at fair value.
Financial liabilities are subsequently
measured at amortized cost, using the
effective interest method. Financial liabilities
include loans from related parties, trade
and other payables, loans and borrowings
and bank overdraft.
Investments
The Group classified its investments
into the following categories: fair value
through profit or loss, held to maturity
and available- for-sale. The classification is
dependent on the purpose for which the
investments were required. Management
determines the classification of its
investments at the time of the purchase
and re-evaluates such designation on a
regular basis. Investments that are acquired

Rockwell Diamonds Annual report 2014 63
principally for the purpose of generating a
profit from short-term fluctuations in price
are classified as trading investments and
included in current assets. Investments
with a fixed maturity that management
has the intention and ability to hold to
maturity are classified as held-to-maturity
and are included in non-current assets,
except for maturities within 12 months
from the reporting date which are classified
as current assets. Investments intended to
be held for an indefinite period of time,
which may be sold in response to needs
for liquidity or changes in interest rates,
are classified as available-for-sale and are
included in non-current assets unless
management has the express intention
of holding the investment for less than
12 months from the reporting date or
unless they will need to be sold to raise
operating capital, in which case they are
included in current assets.
Purchases and sales of investments are
recognized on the trade date, which is the
date that the Group commits to purchase
or sell the asset. Cost of purchase includes
transaction costs. Fair value through profit
or loss and available-for-sale investments
are subsequently measured at fair value.
The fair value of investments is based on
cash value or amounts derived from cash
flow models. Equity securities for which
fair value cannot be measured reliably
are recognized at cost less impairment.
When securities classified as available-for-
sale are sold or impaired, the accumulated
fair value adjustments are included in
the statement of profit or loss and other
comprehensive income as gains or losses
from investment securities. Held-to-maturity
investments are measured at amortized
cost using the effective yield method.
Derecognition
The Group derecognizes a financial
asset when the contractual rights to cash
flows from the asset expire, or it transfers
the rights to receive the contractual cash
flows in a transaction in which substantially
all the risks and rewards of ownership of
the financial asset are transferred. Any
interest in such transferred financial assets
that is created or retained by the Group is
recognized as a separate asset or liability.
The Group derecognizes a financial liability
when its contractual obligations are discharged, cancelled or expire.
Offsetting
Financial assets and financial liabilities are
offset and the net amount presented in the
statement of financial position when, and
only when, the Group has a legal right to
offset the amounts and intends either to
settle on a net basis or to realize the asset
and settle the liability simultaneously.
Share capital and equity
An equity instrument is any contract that
evidences a residual interest in the assets of
an entity after deducting all of its liabilities.
Common shares are classified as equity. Incremental costs directly attributable to the
issue of common shares are recognized as a deduction of equity, net of any tax effects.
Cash and cash equivalents
Cash and cash equivalents comprise cash on hand and demand deposits, and other
short-term highly liquid investments that are readily convertible to a known amount
of cash and are subject to an insignificant
risk of changes in value. In the statements
of cash flows, cash and cash equivalents
includes bank overdrafts.
Impairment of financial assets
At each reporting date the Group assesses
all financial assets, to determine whether
there is objective evidence that a financial
asset or group of financial assets has
been impaired. Appropriate allowances
for estimated irrecoverable amounts are
recognized in profit or loss. Significant
financial difficulties of the debtor,
probability that the debtor will enter
bankruptcy or financial reorganization,
and default or delinquency in payments
are considered indicators that the financial
asset might be impaired. The allowance
recognized is measured as the difference
between the asset’s carrying amount and
the present value of estimated future cash
flows discounted at the effective interest
rate computed at initial recognition.
Reversals of impairment losses are
recognized in profit or loss except for
equity investments classified as available-for-sale.
Impairment losses are also not
subsequently reversed for available-for-sale equity investments which are held at cost
because fair value was not determinable.
1.4.7 Tax
Current tax assets and liabilities
Current tax for current and prior periods
is, to the extent unpaid, recognized as
a liability. If the amount already paid in respect of current and prior periods
exceeds the amount due for those
periods, the excess is recognized as a tax
receivable.
Current tax liabilities (assets) for the current
and prior periods are measured at the amount expected to be paid to (recovered
from) the tax authorities, using the tax rates
(and tax laws) that have been enacted or
substantively enacted by the end of the
reporting period.
Deferred tax assets and liabilities
Deferred tax is recognized in respect of all
taxable temporary differences between
the carrying values of assets and liabilities
for accounting purposes and the amounts
used for tax purposes and any tax losses.
No deferred tax is provided on temporary
differences relating to:
• the initial recognition of goodwill;
• the initial recognition (other than in
a business combination) of an asset or liability to the extent that neither
accounting nor taxable profit is affected on acquisition; and
• investments in subsidiaries and associates to the extent that the Group
is able to control the timing and reversal
and it is probable that they will not reverse in the foreseeable future.
Deferred tax is measured using enacted
or substantively enacted rates at the
reporting date that are expected to apply
when the asset is realized or the liability is
settled. A deferred tax asset is recognized to the extent that it is probable that future
taxable profits will be available against
which the deferred tax asset could be
realized.
64 Rockwell Diamonds Annual report 2014
NOTES TO THE CONSOLIDATED FINANCIAL STATEMENTS continued
1. ACCOUNTING POLICIES continued
1.4 Significant accounting policies continued
1.4.7 Tax continued
Tax expenses
Current and deferred taxes are recognized
as income or an expense and included in
profit or loss for the period, except to the
extent that the tax arises from:
• a transaction or event which is
recognized, in the same or a different
period, in other comprehensive income
which is then recognized in other
comprehensive income; or
• a business combination.
Current tax and deferred taxes are
recognized directly in equity if the tax relates
to items that are recognized, in the same or
a different period, directly in equity.
1.4.8 Inventories
Rough diamond inventories are valued
at the lower of average production cost
and net realizable value. Production costs
include the cost of consumable materials,
direct labour, mine-site overhead expenses
and amortization. Work-in-progress stock
piles consist of ground excavated, but
not yet fully processed at reporting date.
The value of these stock piles represents
management’s best estimate of the costs
incurred to excavate and screen the
ground as identified by an independent
surveyor at reporting date.
Mine supplies are valued at the lower of
cost, at the weighted average cost basis,
and net realizable value.
Cost of items that are not ordinarily
interchangeable, and goods and services
produced and segregated for specific
projects, are assigned by using a specific
identification of their individual costs.
Previous write-downs are reversed to the
lower of cost and net realizable value
when there is a subsequent increase in the
value of inventories.
1.4.9 Share-based payments
The fair value of share-based payment
awards granted to employees is
recognized on the grant date as an
employee cost, with a corresponding
increase in reserves, over the period that
the employees become unconditionally
entitled to the awards. The amount
recognized as an expense is adjusted to
reflect the number of awards for which
the related service and non-market
performance conditions are expected to
be met, such that the amount ultimately
recognized as an expense is based on the
number of awards that meet the related
service and non-market performance
conditions at the vesting date.
For share-based payment awards with non-
vesting conditions, the grant date fair value
of the share-based payment is measured to
reflect such conditions and there is no true
up for differences between expected and
actual outcomes.
The fair value of the employee share
options is measured using the Black-Scholes
option pricing model. Measurement
inputs include the share price on the
measurement date, the exercise price of
the instrument, expected volatility (based
on an evaluation of the Group’s historic
volatility, particularly over the historic
period commensurate with the expected
term), expected term of the instruments
(based on historical experience and
general option holder behavior), expected
dividends, and the risk-free interest rate
(based on Canadian government bonds).
Service and non-market performance
conditions attached to the transactions are
not taken into account in determining fair
value.
1.4.10 Rehabilitation obligation
Estimated rehabilitation costs, which are
based on the Group’s interpretation of
current environmental and regulatory
requirements, represent the present value
of the expected future costs to rehabilitate
the mine properties at termination of
mining operations. The estimated costs
of rehabilitation are reviewed annually
and adjusted as appropriate for changes
in legislation, technology or other
circumstances.
Provision is made for the Group’s legal
and constructive obligations to dismantle,
remove and restore items of property,
plant and equipment and remediation
of disturbed areas in the financial
period when the related environmental
disturbance occurs, based on the estimated
future costs using information available
at the reporting date. The provision is
discounted using a market-based
pre-tax discount rate and the unwinding of
the discount is included in finance cost.
Based on current environmental
regulations and known rehabilitation
requirements, management has included
its best estimate of these obligations in its
rehabilitation provision.
1.4.11 Leases
A lease is classified as a finance lease if
it transfers substantially all the risks and
rewards incidental to ownership to the
Group. A lease is classified as an operating
lease if it does not transfer substantially
all the risks and rewards incidental to
ownership to the Group.
Finance leases
Assets held by the Group under finance
leases are recognized in the consolidated
statements of financial position at
amounts equal to the fair value of the
leased property or, if lower, the present
value of the minimum lease payments.
The corresponding liability to the lessor is
included in the consolidated statements
of financial position as a finance lease
obligation.
The discount rate used in calculating
the present value of the minimum lease
payments is the interest rate implicit in the
lease.
The lease payments are apportioned
between the finance charge and reduction
of the outstanding liability. The finance
charge is allocated to each period during
the lease term so as to produce a constant
periodic rate on the remaining balance of
the liability.
Operating leases
Operating lease payments are recognized
as an expense on a straight-line basis over
the lease term. The difference between the
amounts recognized as an expense and
the contractual payments are recognized as

Rockwell Diamonds Annual report 2014 65
an operating lease asset. Assets held under
operating leases are not recognized in the
Group’s statement of financial position.
Any contingent rents are expensed in the
period they are incurred.
1.4.12 Revenue
Revenue arising from the sale of diamonds
is recognized when all the following
conditions have been satisfied:
• The Group has transferred to the buyer
the significant risks and rewards of
ownership of the goods;
• The Group retains neither continuing
managerial involvement to the degree
usually associated with ownership nor
effective control over the goods sold;
• The amount of revenue can be
measured reliably;
• It is probable that the economic benefits
associated with the sale transaction will
flow to the Group; and
• The costs incurred or to be incurred in
respect of the sale transaction can be
measured reliably.
Revenue is measured at the fair value of
the consideration received or receivable
and represents the amounts receivable for
goods and services provided in the normal
course of business, net of value added tax.
1.4.13 Finance income and finance cost
Finance income comprises interest on
funds invested and fair value gains on
financial assets at fair value through profit
or loss. Finance income is recognized, in
profit or loss, using the effective interest
method.
Finance cost comprises interest expense
on borrowings, unwinding of discount on
provisions and fair value losses on financial
assets at fair value through profit or loss.
Borrowing costs that are not directly
attributable to the acquisition, construction
or production of a qualifying asset are
recognized in profit or loss using the
effective interest method.
1.4.14 Earnings per share
The Group presents basic and diluted
earnings/loss per share (“EPS”) data for its
common shares. Basic EPS is calculated by
dividing the profit or loss attributable to
common shareholders of the Company
by the weighted average number of
common shares outstanding during the
year, adjusted for own shares held. Diluted
EPS is determined by adjusting the profit or
loss attributable to common shareholders
and the weighted average number of
common shares outstanding, adjusted
for own shares held and for the effects
of all dilutive potential common shares,
which comprise share options granted to
employees.
1.4.15 Translation of foreign currencies
Foreign currency transactions
A foreign currency transaction is recorded,
on initial recognition in the functional
currency, by applying to the foreign
currency amount the spot exchange rate
between the functional currency and
the foreign currency at the date of the
transaction.
At the end of the reporting period:
• Foreign currency monetary items are
translated using the closing rate;
• Non-monetary items that are measured
in terms of historical cost in a foreign
currency are translated using the
exchange rate at the date of the
transaction; and
• Non-monetary items that are measured
at fair value in a foreign currency are
translated using the exchange rates
at the date when the fair value was
determined.
Exchange differences arising on the
settlement of monetary items or on
translating monetary items at rates different
from those at which they were translated
on initial recognition during the period or
in previous financial periods are recognized
in profit or loss in the period in which
they arise.
Cash flows arising from transactions in a
foreign currency are recorded in Canadian
dollars by applying to the foreign currency
amount the exchange rate between the
Canadian dollars and the foreign currency
at the date of the cash flow.
Foreign operations
For consolidation purposes the results and
financial position of a foreign operation are
translated into the presentation currency
using the following procedures:
• Assets and liabilities are translated at
the closing rate at the date of that
consolidated statement of financial
position;
• Equity components are translated at
historical rates;
• Income and expenses are translated
at exchange rates at the dates of the
transactions; and
• All resulting exchange differences are
recognized in other comprehensive
income and accumulated as a separate
component of equity. When a foreign
investment is disposed, the cumulative
exchange differences previously
recognized in other comprehensive
income are transferred to profit or loss.
Exchange differences arising on a
monetary item that forms part of a net
investment in a foreign operation are
recognized initially in other comprehensive
income and accumulated in the foreign
translation reserve. They are recognized in
profit or loss as a reclassification adjustment
through to other comprehensive income
on disposal of net investment.
The cash flows of a foreign subsidiary are
translated at the exchange rates between
the functional currency and the foreign
currency at the dates of the cash flows.
1.4.16 Segmental reporting
Segmental results that are reported to the
chief operating decision-maker, or decision-
making group, include items directly
attributable to a segment as well as those
that can be allocated on a reasonable
basis. Unallocated items comprise mainly
corporate assets (primarily the Group’s
headquarters), head office expenses, and
tax assets and liabilities.

66 Rockwell Diamonds Annual report 2014
NOTES TO THE CONSOLIDATED FINANCIAL STATEMENTS continued
1. ACCOUNTING POLICIES continued
1.4 Significant accounting policies continued
1.4.17 Employee benefits
Short-term employee benefits
Short-term employee benefits are expensed as the related service is provided. A liability is recognized for the amount expected to be paid
if the Group has a present legal or constructive obligation to pay this amount as a result of past service provided by the employee and the
obligation can be estimated reliably.
The obligation for employee entitlements to wages, salaries and annual leave represents the amount which the Group has a present
obligation to pay as a result of employee services provided to the reporting date. Short-term benefits are undiscounted.
The expected cost of bonus payments is recognized as an expense when there is a legal or constructive obligation to make such payments
as a result of past performance.
1.5. Standards, interpretations and amendments to published standards effective for the year ended February 28, 2014
During the financial year, the following new and revised accounting standards, amendments to standards and new interpretations
were adopted by the Group:
Standard(s)
Amendment(s)
Interpretation(s) Salient features of changesImpact on financial position or performance
IAS 1 (Amendment)Presentation of Financial Statements:Presentation of Items of Other Comprehensive Income
•� Requires that an entity present separately the items of other comprehensive income that would be reclassified to profit or loss in the future, if certain conditions are met, from those that would never be reclassified to profit or loss;
•� It does not change the existing option to present profit or loss and other comprehensive income in two statements;
•� The amendment does not address which items are presented in other comprehensive income or which items need to be reclassified. The requirements of other IFRSs continue to apply in this regard.
No impact*
IAS 27 (Revision)Separate FinancialStatements (2011)
•� IAS 27 (2011) supersedes IAS 27 Consolidation and Separate Financial Statements (2008) and carries forward the existing accounting and disclosure requirements for separate financial statements, with some minor changes.
No impact
IAS 28 (Amendment)Investments in Associatesand Joint Ventures (2011)
•� IFRS 5 Non-current Assets Held for Sale and Discontinued Operations applies to an investment, or a portion of an investment, in an associate or a joint venture that meets the criteria to be classified as held for sale; and
•� On cessation of significant influence or joint control, even if an investment in an associate becomes an investment in a joint venture or vice versa, the entity does not re-measure the retained interest.
No impact
IFRS 7 (Amendment)Disclosures – Offsetting Financial Assets and Financial Liabilities
•� The amendments contain new disclosure requirements for financial liabilities that are offset in the statement of financial position, or are subject to enforceable master netting arrangements or similar agreements.
No impact

Rockwell Diamonds Annual report 2014 67
Standard(s)
Amendment(s)
Interpretation(s) Salient features of changesImpact on financial position or performance
IFRS 10 (Amendment)Consolidated FinancialStatements
•� IFRS 10 introduces a new approach to determining which investees should be consolidated and provides a single model to be applied in the control analysis for all investees;
•� Control is reassesed as facts and circumstances change; and
•� IFRS 10 supersedes IAS 27 (2008) and SIC 12 Consolidation Special Purpose Entities.
No impact
IFRS 12 (New Standard)Disclosure of Interests in Other Entities
•� IFRS 12 contains the disclosure requirements for entities that have interests in subsidiaries, joint arrangements (i.e. joint operations or joint ventures), associates and/or unconsolidated structured entities, aiming to provide information to enable users to evaluate:
– The nature of, and risks associated with, an entity’s interest in other entities; and
– The effects of those interests on the entity’s financial position, financial performance and cash flows.
No impact**
IFRS 13 (New Standard)Fair Value Measurement
•� IFRS 13 replaces the fair value measurement guidance contained in individual IFRSs with a single source of fair value measurement guidance; and
•� It does not introduce new requirements to measure assets or liabilities at fair value, nor does it eliminate the practicability exceptions to fair value measurements that currently exist in certain standards.
No impact
Consolidated Financial Statements, Joint Arrangements and Disclosure of Interests in Other Entities: Transaction Guidance (Amendment)
•� The amendment clarifies the transition guidance in IFRS 10 Consolidated Financial Statements.
No impact
Various IFRSs •� Annual improvements project is a collection of amendments to IFRS and are the result of conclusions reached by the Board on proposals made at its annual improvements project.
No impact
* This IAS 1 amendment has no impact on the amounts recognized in the statement of other comprehensive income. This standard however, requires additional disclosure which has been provided in the statement of other comprehensive income.
** IFRS 12 has no impact on the amounts recognized in the financial statements. This IFRS, however, requires additional disclosure.
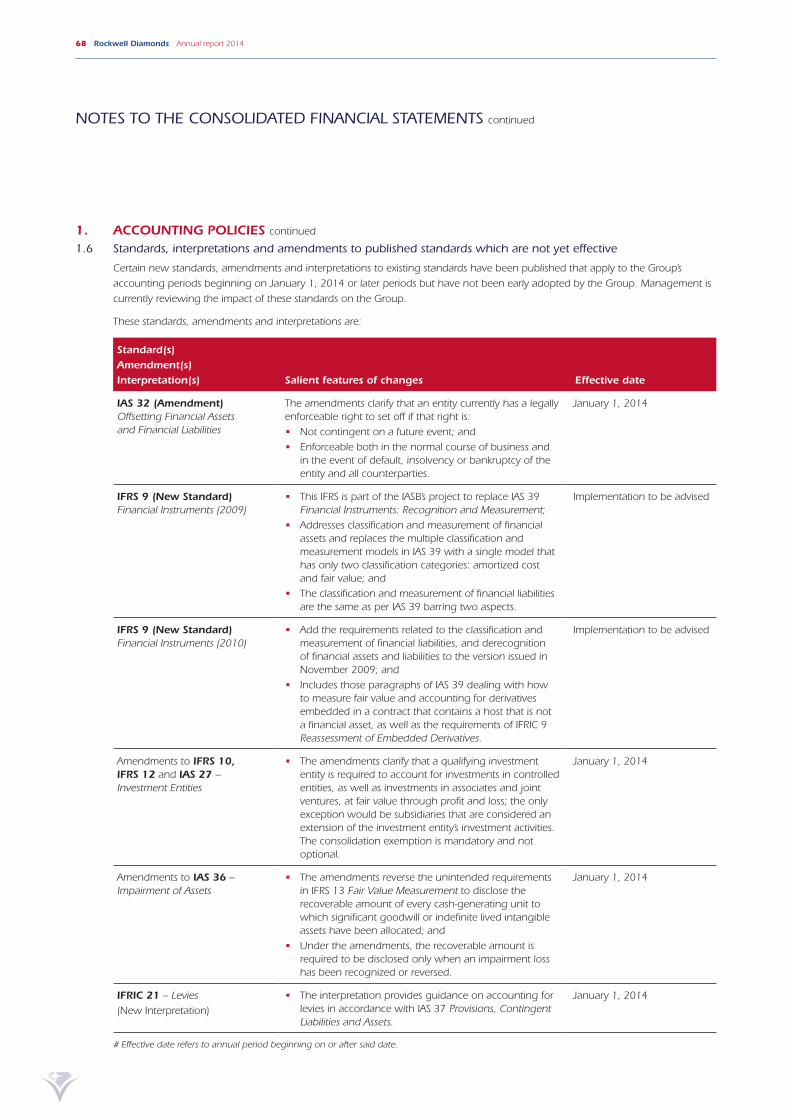
68 Rockwell Diamonds Annual report 2014
NOTES TO THE CONSOLIDATED FINANCIAL STATEMENTS continued
1. ACCOUNTING POLICIES continued
1.6 Standards, interpretations and amendments to published standards which are not yet effective
Certain new standards, amendments and interpretations to existing standards have been published that apply to the Group’s
accounting periods beginning on January 1, 2014 or later periods but have not been early adopted by the Group. Management is
currently reviewing the impact of these standards on the Group.
These standards, amendments and interpretations are:
Standard(s)Amendment(s) Interpretation(s) Salient features of changes Effective date
IAS 32 (Amendment)Offsetting Financial Assetsand Financial Liabilities
The amendments clarify that an entity currently has a legally enforceable right to set off if that right is:
•� Not contingent on a future event; and
•� Enforceable both in the normal course of business and in the event of default, insolvency or bankruptcy of the entity and all counterparties.
January 1, 2014
IFRS 9 (New Standard)Financial Instruments (2009)
•� This IFRS is part of the IASB’s project to replace IAS 39 Financial Instruments: Recognition and Measurement;
•� Addresses classification and measurement of financial assets and replaces the multiple classification and measurement models in IAS 39 with a single model that has only two classification categories: amortized cost and fair value; and
•� The classification and measurement of financial liabilities are the same as per IAS 39 barring two aspects.
Implementation to be advised
IFRS 9 (New Standard)Financial Instruments (2010)
• Add the requirements related to the classification and measurement of financial liabilities, and derecognition of financial assets and liabilities to the version issued in November 2009; and
•� Includes those paragraphs of IAS 39 dealing with how to measure fair value and accounting for derivatives embedded in a contract that contains a host that is not a financial asset, as well as the requirements of IFRIC 9 Reassessment of Embedded Derivatives.
Implementation to be advised
Amendments to IFRS 10,IFRS 12 and IAS 27 –Investment Entities
•� The amendments clarify that a qualifying investment entity is required to account for investments in controlled entities, as well as investments in associates and joint ventures, at fair value through profit and loss; the only exception would be subsidiaries that are considered an extension of the investment entity’s investment activities. The consolidation exemption is mandatory and not optional.
January 1, 2014
Amendments to IAS 36 –Impairment of Assets
•� The amendments reverse the unintended requirements in IFRS 13 Fair Value Measurement to disclose the recoverable amount of every cash-generating unit to which significant goodwill or indefinite lived intangible assets have been allocated; and
•�� Under the amendments, the recoverable amount is required to be disclosed only when an impairment loss has been recognized or reversed.
January 1, 2014
IFRIC 21 – Levies
(New Interpretation)
•� The interpretation provides guidance on accounting for levies in accordance with IAS 37 Provisions, Contingent Liabilities and Assets.
January 1, 2014
# Effective date refers to annual period beginning on or after said date.

Rockwell Diamonds Annual report 2014 69
Amounts in Canadian dollars
As at February 28, 2014 As at February 28, 2013
Cost
Accumu-lated
amorti-zation
and impairment
lossesCarrying
value Cost
Accumu-lated
amorti-zation
and impairment
lossesCarrying
value
2. MINERAL PROPERTY INTERESTSMineral property interests 30,170,562 (3,528,891) 26,641,671 41,892,378 (10,487,020) 31,405,358
Reconciliation of mineral property interests February 28, 2014
Amounts in Canadian dollars
Opening balance Additions Disposals
Foreign exchange
movementsAmorti-zation
Closing balance
Mineral property interests 31,405,358 199,515 (1,617,116) (2,418,377) (927,709) 26,641,671
Fiscal 2014 disposals
Klipdam (note 18) 1,178
Holsloot, Mooidraai, Farhom and Thorngrove 1,615,938
1,617,116
Reconciliation of mineral property interests February 28, 2013
Amounts in Canadian dollars
Opening balance
Assets and liabilities
acquisitions (note 17)
Conversion of mineral
right Disposals
Foreign exchange
movementsAmorti-zation
Impair-ments
Closing balance
Mineral property interests 35 949 211 1 165 529 119 930 (239 000) (3 827 954) (803 234) (959 124) 31 405 358
The Group’s mineral property interests consist of the following:
Wouterspan (including Farhom, Okapi and Kanonloop)
The Wouterspan property is located in the Herbert district of the Northern Cape province of South Africa approximately 145km
southwest of Kimberley. The operation is located on the farm Lanyonvale (various portions), Farhom, Okapi and Kanonloop, with an
aggregate area of 2,579.8 hectares.
The operation has not been operational since December 2008.
During fiscal 2011 management requested an independent expert to perform a valuation of the Wouterspan mineral properties.
The following significant judgments and estimates were used by the independent expert in determining the recoverable amount of
the Wouterspan mineral properties:
USD selling price 2 029
Grade (ct/100m3) 0.7
Inflation – Sales 4.40%
– Cost 7.00%
Volumes per year (m3) 4 320 000
Available resource (m3) 42 811 200
Discount rate 26%

70 Rockwell Diamonds Annual report 2014
NOTES TO THE CONSOLIDATED FINANCIAL STATEMENTS continued
2. MINERAL PROPERTY INTERESTS continued
Wouterspan (including Farhom, Okapi and Kanonloop) continued
Included in the discounted cash flow model was the estimated cost of construction and commissioning a high volume plant.
Management considered the adverse impact of any subsequent to 2011 changes in the expert’s assumptions used in the cash flow
model and considered these in their conclusion on the carrying value of $12,565,766 (2013: $13,100,929) relating to this mineral
property. Management concluded that no impairment is required.
During fiscal 2014 a preliminary economic assessment was performed.
Holpan/Klipdam
The Klipdam property is located 45km from Kimberley, South Africa and consists of the adjacent Holpan 161 and Klipdam
157 farms, covering an area of 4,019.9 hectares. Holpan property and mineral property was sold in fiscal 2014 and was fully
depleted at date of sale. The Klipdam mineral property was sold in Q1 of fiscal 2014, refer to note 18 for additional information.
Saxendrift
The 5,142 hectare Saxendrift mine property is located on the south bank of the Middle Orange River, and adjacent to the
Wouterspan property and is currently being mined. Carrying value of this mineral property at February 28, 2014 amounted to
$2,489,616 (2013: $4,986,345).
Niewejaarskraal
Niewejaarskraal is located in the Hay district of the Northern Cape province of South Africa approximately 124km southwest of
Kimberley. The operations are located on Niewejaarskraal 40 and Viegulands Put 39 (total of 3,085.695ha) and is actively being
mined. Carrying value of this mineral property at February 28, 2014 amounted to $389,627 (2013: $195,365).
Windsorton Erf 2004
This is a prospecting property covering an area of 1,146 hectares, and is adjacent to the Klipdam Mine. The Windsorton Erf 2004
mineral right was sold in Q1 of fiscal 2014 as part of the Klipdam sale.
Tirisano
The Tirisano Mine, totaling 10,805.57 hectares is located some 35km due north of Ventersdorp, in the North West province and
approximately 150km west of Johannesburg. Operations at Tirisano Mine were placed on care and maintenance in December
2012. Management saw this as an impairment indicator and a review of the fair value of property, plant and equipment and
mineral property was undertaken. This review resulted in an impairment relating to property, plant and equipment, after taking
into account moveable assets that can and have been relocated to the Northern Cape operations and remaining property, plant
and equipment that will be used at Tirisano. The recoverable amount of the mineral property interest was deemed to exceed the
carrying value. Management used the value in use method, based on the available gravel, annual production volumes effected
through contract royalty mining operators, projected grade, carat recoveries and product pricing to determine the recoverable
amount. In addition, management assessed the valuation report performed by an independent competent person prior to the
acquisition of Tirisano, and concluded that the assumptions used in the report have not significantly changed since the date of the
report. Therefore no impairment was recognized for the Tirisano mineral property. Management concluded that no impairment is
required.
The following significant judgments and estimates were used by the independent expert in determining the recoverable amount of
the Tirisano mineral property:
USD selling price 607
Grade (ct/100m3) 2.37
Inflation – Sales 4.40%
– Cost 7.00%
Volumes per year (m3) 2 160 000
Available resource (m3) 25 279 900
Discount rate 25.6% – 28.96%

Rockwell Diamonds Annual report 2014 71
2. MINERAL PROPERTY INTERESTS continued
Tirisano continued
Management considered the adverse impact of any subsequent changes in the expert assumptions used in the cash flow model
and considered these in their conclusion of the carrying value of $10,647,498 (2013: $11,522,445) relating to this mineral
property. Management concluded that no impairment is required.
Jasper
The Jasper Mining property, consisting of Portion 1 of the farm Brakfontein No. 276, is contiguous to Rockwell’s Saxendrift Mine
and is actively being mined at the Saxendrift operations. Carrying value of this mineral property at February 28, 2014 amounted to
$571,587 (2013: $1,031,358).
Holsloot, Mooidraai, Thorngrove and Farhom
Mineral property interest relating to Holsloot, Mooidraai, Thorngrove and Farhom was sold during fiscal 2014 through the transfer
of the mineral right at an amount of $2,097,998. A profit of $482,060 was realized on the disposal.
Estimations
Carats available at the mineral property interests (excluding Jasper) have been estimated by a qualified geologist employed by the
Group and were reviewed by an independent qualified geologist. These resource estimates include inferred resources which have
a great amount of uncertainty as to their existence, and economic and legal feasibility. The estimated carats have been published
as required by National Instrument 43-101. The carats included in the 43-101 are used in the calculation of the amortization for
the period (refer accounting policy). The carats available at Jasper have been assessed as management’s best estimates of expected
carats to be obtained. Currently samples are being evaluated to compile the 43-101 for Jasper.
3. INVESTMENT IN ASSOCIATES3.1 Flawless Diamonds Trading House Proprietary Limited (20% shareholding)
Amounts in Canadian dollars
As atFebruary 28
2014
As atFebruary 28
2013
Carrying amount
Opening balance 207,560 161,049
Share of profit from equity-accounted investment 58,962 58,761
Foreign exchange movements (33,906) (12,250)
Closing balance 232,616 207,560
The associate had no other comprehensive income (2013: Nil).
Summarized financial information of associate (100% interest)
Current assets 10,350,746 4,307,087
Non-current assets 61,784 91,228
Total assets 10,412,530 4,398,315
Current liabilities 9,321,651 3,460,173
Non-current liabilities – –
Total liabilities 9,321,651 3,460,173
Net assets 1,090,879 938,142
Revenue 83,642,357 58,084,171
Total comprehensive income for the year 294,808 293,803
Capital commitments and contingent liabilities of associate – –
On April 21, 2010 the Group acquired a 20% shareholding in Flawless Diamonds Trading House Proprietary Limited (“Flawless”)
incorporated in the Republic of South Africa for ZAR700,000 ($95,690) cash. Flawless is a registered diamond broker which provides
specialist diamond valuation, marketing and tender sales services to the Group.
As the Group has significant influence over Flawless’ operations it accounts for the investment using the equity method.

72 Rockwell Diamonds Annual report 2014
NOTES TO THE CONSOLIDATED FINANCIAL STATEMENTS continued
3. INVESTMENT IN ASSOCIATES continued
3.2. Banzi Trade 26 Proprietary Limited (49% shareholding)
Banzi Trade 26 Proprietary Limited (“Banzi Trade”) was incorporated in 2005 in the Republic of South Africa with nominal equity.
The Group acquired a 49% shareholding in the same year. Since the incorporation date the Group’s portion of the losses from Banzi
Trade exceeded its investment in the associate. The Group, in terms of its accounting policy, does not account for losses in excess of
its investment in associates. The Group’s carrying value of its investment in Banzi Trade is Nil.
4. PROPERTY, PLANT AND EQUIPMENT
As at February 28, 2014 As at February 28, 2013
Amounts in Canadian dollars Cost
Accumulated amortization
and impairment
lossesCarrying
value Cost
Accumulated amortization
and impairment
lossesCarrying
value
Land and buildings 3,386,311 (853,881) 2,532,430 5,749,231 (1,555,030) 4,194,201
Plant and machinery 48,175,476 (22,520,198) 25,655,278 48,792,043 (22,802,226) 25,989,817
Motor vehicles 1,356,307 (855,952) 500,355 1,427,366 (909,333) 518,033
Office equipment 905,232 (740,211) 165,021 987,471 (709,143) 278,328
Construction in progress 1,976,388 (108,788) 1,867,600 2,685,418 (120,805) 2,564,613
55,799,714 (25,079,030) 30,720,684 59,641,529 (26,096,537) 33,544,992
Reconciliation of property, plant and equipment – February 28, 2014
Amounts in Canadian dollars
Opening balance Additions Disposals Transfers
Foreign exchange
movements DepreciationImpairment
losssClosing
balance
Land and buildings 4,194,201 180,073 (1,361,386) – (376,626) (103,832) – 2,532,430
Plant and machinery 25,989,817 3,087,636 (1,890,041) 5,857,104 (2,633,650) (4,719,789) (35,799) 25,655,278
Motor vehicles 518,033 142,903 (27,833) – (52,089) (80,659) – 500,355
Office equipment 278,328 17,425 (91) – (26,278) (104,363) – 165,021
Construction in progress 2,564,613 5,444,486 (36,561) (5,857,104) (247,834) – – 1,867,600
33,544,992 8,872,523 (3,315,912) – (3,336,477) (5,008,643) (35,799) 30,720,684
Included in fiscal 2014 are disposals of property, plant and equipment relating to the Klipdam sale that amounted to:
Amounts in Canadian dollars
Land and buildings 1,217,809
Plant and machinery 1,194,891
2,412,700

Rockwell Diamonds Annual report 2014 73
4. PROPERTY, PLANT AND EQUIPMENT continued
Reconciliation of property, plant and equipment – February 28, 2013
Amounts in Canadian dollars
Openingbalance Additions Disposals Transfers
Foreignexchange
movementsDepre-ciation
Impair-ment
loss
Impair-ment
reversalClosingbalance
Land and buildings 5,809,735 79,401 (496,991) – (733,477) (196,894) (267,573) – 4,194,201
Plant and machinery 40,809,609 2,301,725 (3,305,607) 971,877 (5,019,539) (5,928,337) (4,425,834) 585,923 25,989,817
Motor vehicles 453,756 264,098 (26,612) (942) (65,430) (103,920) (2,917) – 518,033
Office equipment 353,463 107,185 – 942 (45,615) (137,264) (383) – 278,328
Construction in progress 1,965,268 1,998,241 – (971,877) (297,107) – (129,912) – 2,564,613
49,391,831 4,750,650 (3,829,210) – (6,161,168) (6,366,415) (4,826,619) 585,923 33,544,992
The impairment loss (reversal) represents
Amounts in Canadian dollars
As atFebruary 28
2014
As atFebruary 28
2013
Tirisano Mine plant and machinery – 4,415,450
Klipdam plant and machinery, land and capital projects – 411,169
Wouterspan plant and machinery 35,799 –
35,799 4,826,619
Niewejaarskraal reversal of 2012 impairment due to the planned repair and recommission of the plant in fiscal 2014 – (585,923)
35,799 4,240,696
Impairments for the year ended February 28, 2014 were done on the estimated market value less cost to sell on certain items of
equipment no longer in use.
Impairments for the year ended February 28, 2013 on the various operations were done based on the following judgments and
estimates:
Tirisano: The mine was placed on care and maintenance and subsequent to that contract miners were appointed. As a result the
processing and recovery plant was assessed by management for which components could be transferred to other operations
and/or sold. This resulted in a balance which was transferred to the Northern Cape operations and a balance relating to plant
which has been made available for use by the royalty miners. The remainder was fully impaired as it was considered that its value
was no longer recoverable.
Niewejaarskraal: As a result of the board decision to repair and recommission the plant at Niewejaarskraal the net carrying value
associated with the assets previously impaired was reversed.
The following assets are subject to finance lease obligations: plant and machinery with a net carrying value of $620,393
(2013: $743,058) and motor vehicles with a net carrying value of $159,558 (2013: $157,149) totaling $779,951
(2013: $900,207).
Estimates and judgments
Management performs an annual review of the Group’s property, plant and equipment to consider indicators for impairment and
where indicators for impairment were identified, the recoverable amount is estimated. Comparisons are made to similar assets
available in the market taking into consideration their economic life, residual value, current condition and application in the mining
and recovery processes. Impairment indicators were identified for certain items of property, plant and equipment and where no
future economic benefits (value in use) will flow from the identified assets, judgment was applied to consider fair value less costs to
sell. Assets identified, where the carrying value exceeds the recoverable amount, are impaired. Life of mine cash flow models form
the basis against which the value in use is measured.

74 Rockwell Diamonds Annual report 2014
NOTES TO THE CONSOLIDATED FINANCIAL STATEMENTS continued
Amounts in Canadian dollars
As atFebruary 28
2014
As atFebruary 28
2013
5. INVESTMENTS AND DEPOSITSAt fair value through profit or loss
Investments 5,318,661 4,813,657
The Group invests in investment policies with endowment benefits on maturity of the policies in order to provide funding for the rehabilitation obligations. Premiums are invested on an initial lump sum and/or monthly annuity premium basis with the insurers and invested in specific investment plans. Policy investment value at any one time represents the value of premiums and growth after deduction of administration and investment fees. Withdrawals could be made against the policies before endowment against the deduction of penalties, which is lower than the investment value. To surrender the policy prior to maturity date will similarly attract penalties at a lower rate, and represents the value accessible at any one stage. Fair value at any one stage represents the surrender value of the investments. These policies are encumbered by the guarantees issued by Standard Bank on behalf of the Group (refer notes 14 and 30).
At amortized cost
Deposits 66,941 74,758
This deposit relates to deposits paid to the South African electricity supplier.
Total investments and deposits 5,385,602 4,888,415
Non-current assets
At fair value through profit or loss 5,318,661 4,813,657
At amortized cost 66,941 74,758
5,385,602 4,888,415
6. INVENTORIESRough diamond inventories 3,353,013 1,268,784
Stockpile diamond inventory 122,949 38,251
Fuel, oil and grease 268,338 235,615
Mine supplies 863,653 762,132
4,607,953 2,304,782
The net realizable value of rough diamond inventories is estimated at the average price per carat achieved for the most recent
diamond tender taking into account the variable factors of clarity, carat, shape and colour. A write-down to net realizable value of
$1,470,784 (2013: $374,207) was recognized during the year.
Mine supplies were written down by $18,975 (2013: $125,970) during the year.
Estimates and judgments
Management performs an annual review of inventory in order to determine the net realizable value and to identify inventory that
requires a write-off. Obsolete, slow moving and damaged inventory are indicators that a write-off is required. Management’s best
judgment is applied in estimating the write-off should this be necessary.

Rockwell Diamonds Annual report 2014 75
Amounts in Canadian dollars
As atFebruary 28
2014
As atFebruary 28
2013
7. TRADE AND OTHER RECEIVABLESTrade receivables 3,325,467 1,994,267
Other receivables* 2,828,837 2,582,347
Prepayments 809,906 625,753
VAT 1,536,712 648,251
8,500,922 5,850,618
* Other receivables includes an amount of $1,231,713 (2013: $2,582,347) receivable from a mining contractor relating to the sale of earthmoving equipment.
8. CASH AND CASH EQUIVALENTSCash and cash equivalents consist of:
Cash on hand 694 916
Bank balances 887,728 1,863,480
Short-term cash deposits 435,906 3,706,230
1,324,328 5,570,626
Bank overdraft (3,085,413) (2,839,921)
(1,761,085) 2,730,705
Current assets 1,324,328 5,570,626
Current liabilities (3,085,413) (2,839,921)
(1,761,085) 2,730,705
The Group has an overdraft facility in the amount of ZAR31.0 million ($3.2 million) available for its operations of which
ZAR29,897,345 ($3.1 million) has been utilized. This facility has an interest cost of prime (currently 9.0% per annum) plus 0.6%.
The security for the ZAR31.0 million (2013: ZAR28.0 million) overdraft facility consists of joint suretyship limited to ZAR28.0 million
(2013: ZAR28.0 million), by Rockwell Resources RSA Proprietary Limited and HC van Wyk Diamonds Limited, and the cession of an
investment policy.

76 Rockwell Diamonds Annual report 2014
NOTES TO THE CONSOLIDATED FINANCIAL STATEMENTS continued
As atFebruary 28
2014
As at February 28
2013
Number of shares
Number of shares
9. SHARE CAPITALReconciliation of number of shares issued:
Beginning of year 48,409,413 47,942,746
Payment on conversion of mining right (note 2)* 533,332 –
AVR unbundling (note 17)# 3,466,667 –
Shares issued to employees (note 10)^ 1,113,832 –
Debt conversion at $0.48 per share – 466,667
End of year 53,523,244 48,409,413
The Company’s authorized share capital consists of an unlimited number of common shares, without par value, and an unlimited number of preference shares without par value, of which no preference shares have been issued. The directors have the authority to issue shares, up to 10% of shares currently in issue, without shareholders’ approval.
Share capital is shown net of share issuance cost. The issuance cost amounted to $23,214 (2013: $5,293).
The following shares are reserved for issue:
Employee share options 4,836,431
Daboll loan (note 11) 12,235,686
* These shares were issued on March 19, 2013. At February 28, 2013 they were included in share capital at $0.25 per share. The $0.25 per share represents the trading price of the shares at the effective date of this transaction.
# These shares were issued on December 27, 2013. At February 28, 2013 they were included in share capital at $0.25 per share. The $0.25 per share represents the trading price of the shares at the effective date of this transaction. These shares relate to the buy back of non-controlling interests in HC van Wyk Diamonds Limited and Klipdam Diamond Mining Company Limited (refer note 17).
^ Shares issued to consultants and employees amounted to:
Quantity
Share price at grant
date
Consultants 138,832 0.21
Employees 975,000 0.21
1,113,832
The number of shares issued was calculated as the bonus/consulting expense divided by the trading share price at grant date.

Rockwell Diamonds Annual report 2014 77
10. SHARE-BASED PAYMENTS Employee share-based payments
The Group has a share-based payment plan approved by the shareholders that allows the Group to grant options for up to 10% of the Company’s shares in issue at any point in time, typically vesting over two years, to its directors, employees, officers and consultants. The Company determines the exercise price using an historic volume weighted average which could differ from the closing price on the grant date. Share options have a maximum term of five years and typically terminate 90 days following the termination of the optionee’s employment, except in the case of retirement or death, which terminate one year thereafter.
The Group uses the Black-Scholes option pricing model to estimate a fair value for these options at grant date. This model require inputs such as expected volatility, expected life to exercise, and interest rates. Changes in any of these inputs could cause a significant change in the share-based payment expense charged in a period.
All options are to be settled by physical delivery of shares.
Included under share capital (note 9) are issues to employees and consultants.
Other share-based payments
The Group accounted for a share-based payment at February 28, 2013, relating to an option for a BEE partner to acquire a 26% interest in Jasper Mining Proprietary Limited.
The fair value of the 26% interest in Jasper Mining Proprietary Limited was determined by management using a discounted future cash flow model. This model requires inputs such as time value of money, a risk-based discount rate and expected dividends.
The fair value of the option represents the valuation of the 26% interest less the amount payable by the BEE partner at the grant date. The option expired on May 12, 2013, 90 days after vesting.

78 Rockwell Diamonds Annual report 2014
NOTES TO THE CONSOLIDATED FINANCIAL STATEMENTS continued
10. SHARE-BASED PAYMENTS continued
Other share-based payments continued
The terms and conditions of the grants of the share option plan are as follows:
Assumptions used to fair value option
Amounts in Canadian dollars
Number of instruments
granted – key
management
Number of instruments
granted – senior
employees
Number of instruments
granted – other Vesting conditions
Fair value grant date of option
Share price grant date
Exercise price
Risk free interest-rate
Expected life
Expected volatility
Expected dividend
December 7, 2009 166,666 86,666 42,966
1/3 vests immediately, 1/3 vests in 6 months and 1/3 vests in 12 months 0.80 0.90 0.90 2.4% 5 138.7% Nil
October 8, 2010 271,731 214,531 109,397
1/3 vests immediately, 1/3 vests April 8, 2011 and 1/3 vests October 8, 2011 0.83 0.98 0.98 1.9% 5 128.6% Nil
October 12, 2011 330,000 205,873 60,534
1/3 vests immediately, 1/3 vests March 30, 2012 and 1/3 vests September 30, 2012 0.40 0.55 0.48 1.9% 5 208.6% Nil
October 12, 2011 733,333 – –
1/3 vests June 1, 2013, 1/3 vests June 1, 2014 and 1/3 vests June 1, 2015 0.52 0.55 0.75 1.9% 5 208.6% Nil
October 12, 2011 – 66,667 –1/2 vests May 26, 2012 and 1/2 vests May 26, 2013 0.45 0.55 0.48 1.9% 5 208.6% Nil
October 22, 2012 – 20,000 300,000
1/3 vests October 22, 2012, 1/3 vests April 22, 2013 and 1/3 vests October 22, 2013 0.25 0.25 0.51 1.8% 10 171.9% Nil
December 12, 2012 300,000 220,000 238,267
1/3 vests immediately, 1/3 vests June 12, 2013 and 1/3 vests December 12, 2013 0.23 0.23 0.21 1.8% 10 168.7% Nil
October 9, 2013 415,000 620,000 434,800
1/3 vests immediately, 1/3 vests April 9, 2014 and 1/3 vests October 9, 2014 0.40 0.40 0.40 2.5% 10 167% Nil
Total share option 2,216,730 1,433,737 1,185,964
The following assumptions were used in the valuation of the Jasper Mining Proprietary Limited option:
Life of mine: 3 – 5 years
Discount rate: 16%
Exercise price: $60,000
This option expired on May 12, 2013.

Rockwell Diamonds Annual report 2014 79
10. SHARE-BASED PAYMENTS continued
Other share-based payments continued
The terms and conditions of the grants of the share option plan are as follows:
Assumptions used to fair value option
Amounts in Canadian dollars
Number of instruments
granted – key
management
Number of instruments
granted – senior
employees
Number of instruments
granted – other Vesting conditions
Fair value grant date of option
Share price grant date
Exercise price
Risk free interest-rate
Expected life
Expected volatility
Expected dividend
December 7, 2009 166,666 86,666 42,966
1/3 vests immediately, 1/3 vests in 6 months and 1/3 vests in 12 months 0.80 0.90 0.90 2.4% 5 138.7% Nil
October 8, 2010 271,731 214,531 109,397
1/3 vests immediately, 1/3 vests April 8, 2011 and 1/3 vests October 8, 2011 0.83 0.98 0.98 1.9% 5 128.6% Nil
October 12, 2011 330,000 205,873 60,534
1/3 vests immediately, 1/3 vests March 30, 2012 and 1/3 vests September 30, 2012 0.40 0.55 0.48 1.9% 5 208.6% Nil
October 12, 2011 733,333 – –
1/3 vests June 1, 2013, 1/3 vests June 1, 2014 and 1/3 vests June 1, 2015 0.52 0.55 0.75 1.9% 5 208.6% Nil
October 12, 2011 – 66,667 –1/2 vests May 26, 2012 and 1/2 vests May 26, 2013 0.45 0.55 0.48 1.9% 5 208.6% Nil
October 22, 2012 – 20,000 300,000
1/3 vests October 22, 2012, 1/3 vests April 22, 2013 and 1/3 vests October 22, 2013 0.25 0.25 0.51 1.8% 10 171.9% Nil
December 12, 2012 300,000 220,000 238,267
1/3 vests immediately, 1/3 vests June 12, 2013 and 1/3 vests December 12, 2013 0.23 0.23 0.21 1.8% 10 168.7% Nil
October 9, 2013 415,000 620,000 434,800
1/3 vests immediately, 1/3 vests April 9, 2014 and 1/3 vests October 9, 2014 0.40 0.40 0.40 2.5% 10 167% Nil
Total share option 2,216,730 1,433,737 1,185,964
The following assumptions were used in the valuation of the Jasper Mining Proprietary Limited option:
Life of mine: 3 – 5 years
Discount rate: 16%
Exercise price: $60,000
This option expired on May 12, 2013.
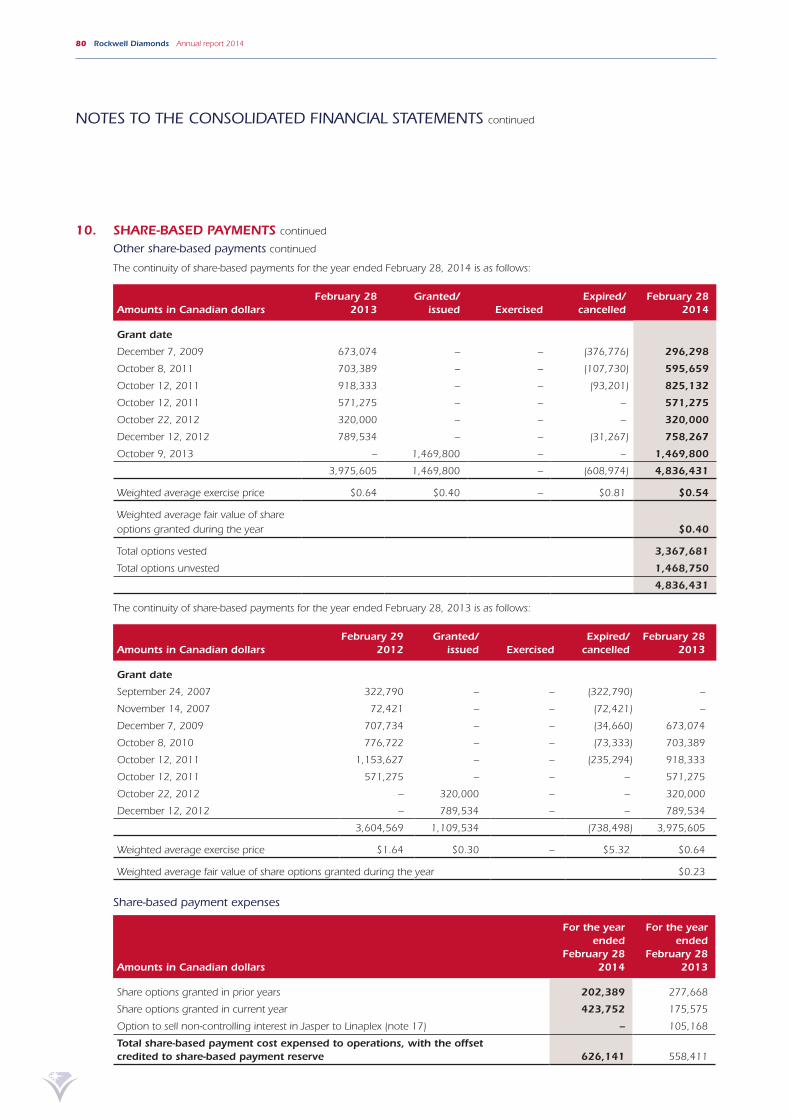
80 Rockwell Diamonds Annual report 2014
NOTES TO THE CONSOLIDATED FINANCIAL STATEMENTS continued
10. SHARE-BASED PAYMENTS continued
Other share-based payments continued
The continuity of share-based payments for the year ended February 28, 2014 is as follows:
Amounts in Canadian dollarsFebruary 28
2013Granted/
issued ExercisedExpired/
cancelledFebruary 28
2014
Grant date
December 7, 2009 673,074 – – (376,776) 296,298
October 8, 2011 703,389 – – (107,730) 595,659
October 12, 2011 918,333 – – (93,201) 825,132
October 12, 2011 571,275 – – – 571,275
October 22, 2012 320,000 – – – 320,000
December 12, 2012 789,534 – – (31,267) 758,267
October 9, 2013 – 1,469,800 – – 1,469,800
3,975,605 1,469,800 – (608,974) 4,836,431
Weighted average exercise price $0.64 $0.40 – $0.81 $0.54
Weighted average fair value of share options granted during the year $0.40
Total options vested 3,367,681
Total options unvested 1,468,750
4,836,431
The continuity of share-based payments for the year ended February 28, 2013 is as follows:
Amounts in Canadian dollarsFebruary 29
2012Granted/
issued ExercisedExpired/
cancelledFebruary 28
2013
Grant date
September 24, 2007 322,790 – – (322,790) –
November 14, 2007 72,421 – – (72,421) –
December 7, 2009 707,734 – – (34,660) 673,074
October 8, 2010 776,722 – – (73,333) 703,389
October 12, 2011 1,153,627 – – (235,294) 918,333
October 12, 2011 571,275 – – – 571,275
October 22, 2012 – 320,000 – – 320,000
December 12, 2012 – 789,534 – – 789,534
3,604,569 1,109,534 (738,498) 3,975,605
Weighted average exercise price $1.64 $0.30 – $5.32 $0.64
Weighted average fair value of share options granted during the year $0.23
Share-based payment expenses
Amounts in Canadian dollars
For the yearended
February 282014
For the yearended
February 282013
Share options granted in prior years 202,389 277,668
Share options granted in current year 423,752 175,575
Option to sell non-controlling interest in Jasper to Linaplex (note 17) – 105,168
Total share-based payment cost expensed to operations, with the offset credited to share-based payment reserve 626,141 558,411

Rockwell Diamonds Annual report 2014 81
Amounts in Canadian dollars
As atFebruary 28
2014
As atFebruary 28
2013
11. LOANS AND BORROWINGSHeld at amortized cost
Industrial Development Corporation of South Africa Limited 3,194,224 3,196,330
The loan was acquired by Rockwell Diamonds Inc. with the asset and liability acquisition of Etruscan Diamonds Proprietary Limited, and was entered into by Blue Gum Diamonds Proprietary Limited, a 74% owned subsidiary of Etruscan Diamonds Proprietary Limited.
The loan is repayable in 10 equal bi-annual installments, bears interest at 1.28% above the current prime rate (9.0% p.a.) and is denominated in South African rand.
Daboll loan 1,999,888 2,008,161
On June 2, 2011, the Group signed a Convertible Loan Agreement with Daboll Consultants Limited. It was agreed that Daboll Consultants Limited would lend Rockwell Diamonds Inc USD$2,000,000 within five days of the agreement being signed.
As the loan is repayable at the election of the borrower (except if converted after 12 months by the lender), it is disclosed as non-current.
The loan bears interest at 5% p.a. payable each calendar quarter, and any unpaid interest is compounded annually.
The loan is convertible into common shares of the Company after 12 months, if it is not repaid earlier, at the option of Daboll Consultants Limited. The conversion price is $0.0375 per common share and a maximum of 52 488 853 can be issued in relation to this conversion.
On July 11, 2011, the Company completed a consolidation of its outstanding common shares on the basis of 15 pre-consolidation shares for one post-consolidated common share. Therefore the maximum number of shares that can be issued is now 3 499 256 at $0.5625.
On June 19, 2013, the Group executed an addendum to the loan, extending the loan repayment date by two years to June 2, 2015, amending the conversion right so the loan is convertible at the prevailing market price of the Company’s shares over its two-year remaining term with a floor price of C$0.16 per share (maximum 12,235,686 shares).
On July 8, 2013, the Group executed a second addendum to the loan where it was agreed that the loan may only be converted during the 21 calendar day period prior to June 26, 2015, and extending the loan to June 26, 2015.
This loan is regarded as a related-party loan (refer note 15).
5,194,112 5,204,491
Non-current liabilities
At amortized cost 3,240,461 3,889,684
Current liabilities
At amortized cost 1,953,651 1,314,807
5,194,112 5,204,491
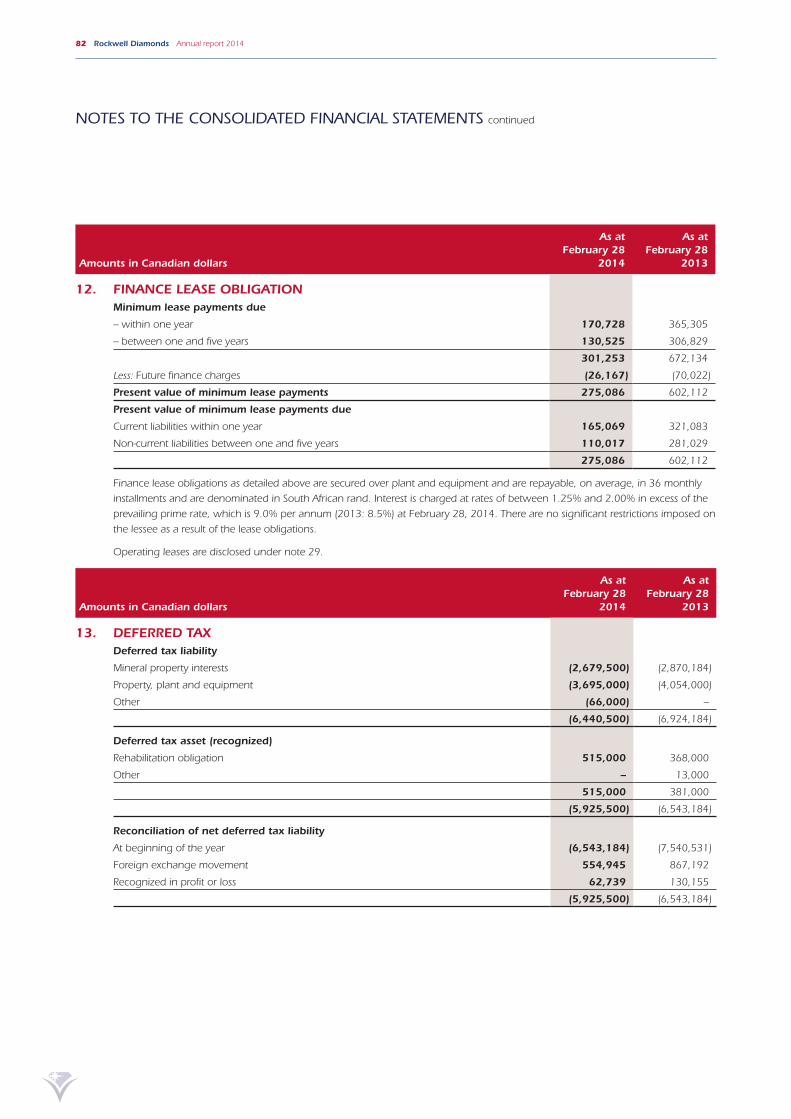
82 Rockwell Diamonds Annual report 2014
NOTES TO THE CONSOLIDATED FINANCIAL STATEMENTS continued
Amounts in Canadian dollars
As atFebruary 28
2014
As atFebruary 28
2013
12. FINANCE LEASE OBLIGATIONMinimum lease payments due
– within one year 170,728 365,305
– between one and five years 130,525 306,829
301,253 672,134
Less: Future finance charges (26,167) (70,022)
Present value of minimum lease payments 275,086 602,112
Present value of minimum lease payments due
Current liabilities within one year 165,069 321,083
Non-current liabilities between one and five years 110,017 281,029
275,086 602,112
Finance lease obligations as detailed above are secured over plant and equipment and are repayable, on average, in 36 monthly
installments and are denominated in South African rand. Interest is charged at rates of between 1.25% and 2.00% in excess of the
prevailing prime rate, which is 9.0% per annum (2013: 8.5%) at February 28, 2014. There are no significant restrictions imposed on
the lessee as a result of the lease obligations.
Operating leases are disclosed under note 29.
Amounts in Canadian dollars
As atFebruary 28
2014
As atFebruary 28
2013
13. DEFERRED TAXDeferred tax liability
Mineral property interests (2,679,500) (2,870,184)
Property, plant and equipment (3,695,000) (4,054,000)
Other (66,000) –
(6,440,500) (6,924,184)
Deferred tax asset (recognized)
Rehabilitation obligation 515,000 368,000
Other – 13,000
515,000 381,000
(5,925,500) (6,543,184)
Reconciliation of net deferred tax liability
At beginning of the year (6,543,184) (7,540,531)
Foreign exchange movement 554,945 867,192
Recognized in profit or loss 62,739 130,155
(5,925,500) (6,543,184)

Rockwell Diamonds Annual report 2014 83
13. DEFERRED TAX continued
Judgments and estimates used in recognition of deferred tax asset
Deferred tax assets are raised only to the extent that future taxable income will be available against which the deferred tax asset can
be set off. Management estimates future taxable income using forecasts based on the best available current information. Based on
current estimates there is not sufficient future taxable income in the Group entities to which the unrecognized deferred tax assets
relate against which to set off the deferred tax asset. Therefore no deferred tax asset has been recognized.
Unrecognized deferred tax asset
Deferred tax assets have not been recognized for temporary differences where it is not probable that the respective entities to which
they relate will generate future taxable income against which to utilize the temporary differences. Estimated unrecognized deferred
tax assets could be summarized as follows:
Amounts in Canadian dollars Canada South Africa
Balance as at February 29, 2012 22,031,276 9,801,235
Unrecognized deferred tax losses for the year 187,803 3,053,059
Balance as at February 28, 2013 22,219,079 12,854,294
Less: Sale of Klipdam – (775,225)
Unrecognized deferred tax losses for the year 205,984 235,156
Balance as at February 28, 2014 22,425,063 12,314,225
14. REHABILITATION OBLIGATION Reconciliation of obligation – February 28, 2014
Amounts in Canadian dollars
Opening balance
Rehabili-tation
obligation recognized/
(revised)
Foreign exchange
movements
Decommis- sioning
asset raised (note 4)
Sale of Klipdam
Mine (note 18)
Unwin-ding
Closing balance
Holpan, Wouterspan, and Klipdam Mines 2,154,700 (41,799) (198,969) – (984,324) 77,626 1,007,234
Saxendrift Mine 2,405,511 (663,369) (228,538) – – – 1,513,604
Tirisano Mine 2,238,824 283,401 (229,956) – – 163,946 2,456,215
Jasper Mining 193,122 184,539 (22,201) – – – 355,460
Niewejaarskraal – 980,251 (18,555) 164,852 – – 1,126,548
6,992,157 743,023 (698,219) 164,852 (984,324) 241,572 6,459,061
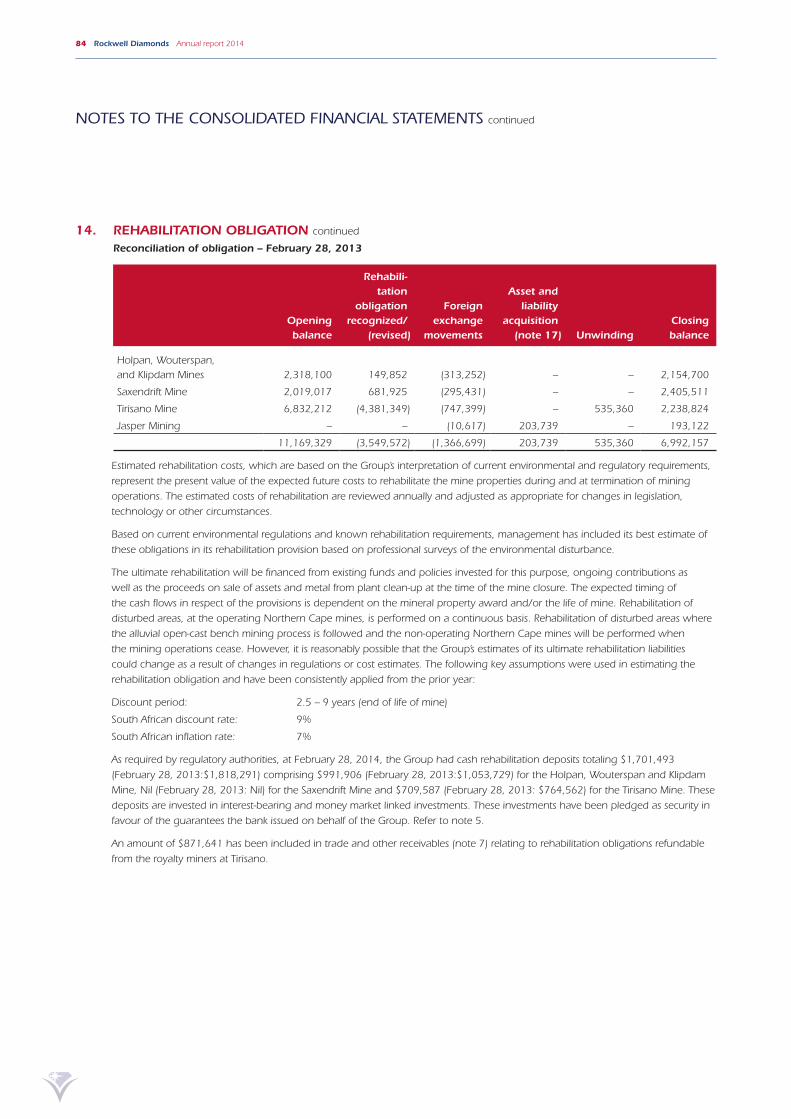
84 Rockwell Diamonds Annual report 2014
NOTES TO THE CONSOLIDATED FINANCIAL STATEMENTS continued
14. REHABILITATION OBLIGATION continued
Reconciliation of obligation – February 28, 2013
Opening balance
Rehabili-tation
obligation recognized/
(revised)
Foreign exchange
movements
Asset and liability
acquisition (note 17) Unwinding
Closing balance
Holpan, Wouterspan, and Klipdam Mines 2,318,100 149,852 (313,252) – – 2,154,700
Saxendrift Mine 2,019,017 681,925 (295,431) – – 2,405,511
Tirisano Mine 6,832,212 (4,381,349) (747,399) – 535,360 2,238,824
Jasper Mining – – (10,617) 203,739 – 193,122
11,169,329 (3,549,572) (1,366,699) 203,739 535,360 6,992,157
Estimated rehabilitation costs, which are based on the Group’s interpretation of current environmental and regulatory requirements,
represent the present value of the expected future costs to rehabilitate the mine properties during and at termination of mining
operations. The estimated costs of rehabilitation are reviewed annually and adjusted as appropriate for changes in legislation,
technology or other circumstances.
Based on current environmental regulations and known rehabilitation requirements, management has included its best estimate of
these obligations in its rehabilitation provision based on professional surveys of the environmental disturbance.
The ultimate rehabilitation will be financed from existing funds and policies invested for this purpose, ongoing contributions as
well as the proceeds on sale of assets and metal from plant clean-up at the time of the mine closure. The expected timing of
the cash flows in respect of the provisions is dependent on the mineral property award and/or the life of mine. Rehabilitation of
disturbed areas, at the operating Northern Cape mines, is performed on a continuous basis. Rehabilitation of disturbed areas where
the alluvial open-cast bench mining process is followed and the non-operating Northern Cape mines will be performed when
the mining operations cease. However, it is reasonably possible that the Group’s estimates of its ultimate rehabilitation liabilities
could change as a result of changes in regulations or cost estimates. The following key assumptions were used in estimating the
rehabilitation obligation and have been consistently applied from the prior year:
Discount period: 2.5 – 9 years (end of life of mine)
South African discount rate: 9%
South African inflation rate: 7%
As required by regulatory authorities, at February 28, 2014, the Group had cash rehabilitation deposits totaling $1,701,493
(February 28, 2013:$1,818,291) comprising $991,906 (February 28, 2013:$1,053,729) for the Holpan, Wouterspan and Klipdam
Mine, Nil (February 28, 2013: Nil) for the Saxendrift Mine and $709,587 (February 28, 2013: $764,562) for the Tirisano Mine. These
deposits are invested in interest-bearing and money market linked investments. These investments have been pledged as security in
favour of the guarantees the bank issued on behalf of the Group. Refer to note 5.
An amount of $871,641 has been included in trade and other receivables (note 7) relating to rehabilitation obligations refundable
from the royalty miners at Tirisano.

Rockwell Diamonds Annual report 2014 85
Amounts in Canadian dollars
As atFebruary 28
2014
As atFebruary 28
2013
15. RELATED PARTIESRelated party balances
Balances payable
Banzi Trade (e) – 44,248
Seven Bridges Trading (c) 4,258 4,677
Current balances payable 4,258 48,925
Loans from related parties 4,258 48,925
All the above named loans are unsecured, interest free and have no fixed terms of repayment and are therefore disclosed as current.
Balances receivable
Banzi Trade (e) 177,711 85,305
Mogopa Minerals (f) 7,995 8,878
Current balances receivable 185,706 94,183
Loans to related parties 185,706 94,183
These loans represent working capital loans and are therefore disclosed as current.
Related party transactions
Services rendered and expenses reimbursed:
Hunter Dickinson Services Inc. (a) – 74,144
CEC Engineering (b) – 10,788
Seven Bridges Trading (c) 45,233 54,241
Banzi Trade (e) 1,326 104,769
Mogopa Minerals (f) 101,782 26,606
Flawless Diamonds Trading House (d) 381,669 276,718
Sales rendered to:
Sale of diamonds – Diacore (h) 29,006,637 24,605,786
Beneficiation income – Diacore (h) 4,062,860 5,299,275
Loan from related party included under loans and borrowings Daboll Consultants Limited (g)
Loans and borrowings 1,999,888 2,008,161
Finance costs 99,171 71,430
Receivables from related party included under trade and other receivables
Diacore (h) 2,483,310 1,980,301
Compensation to key management personnel
Salaries and other short-term benefits 1,013,130 1,218,371
Bonus 170,900 137,855
Share-based payment (note 10) 164,841 68,540
1,348,871 1,424,766
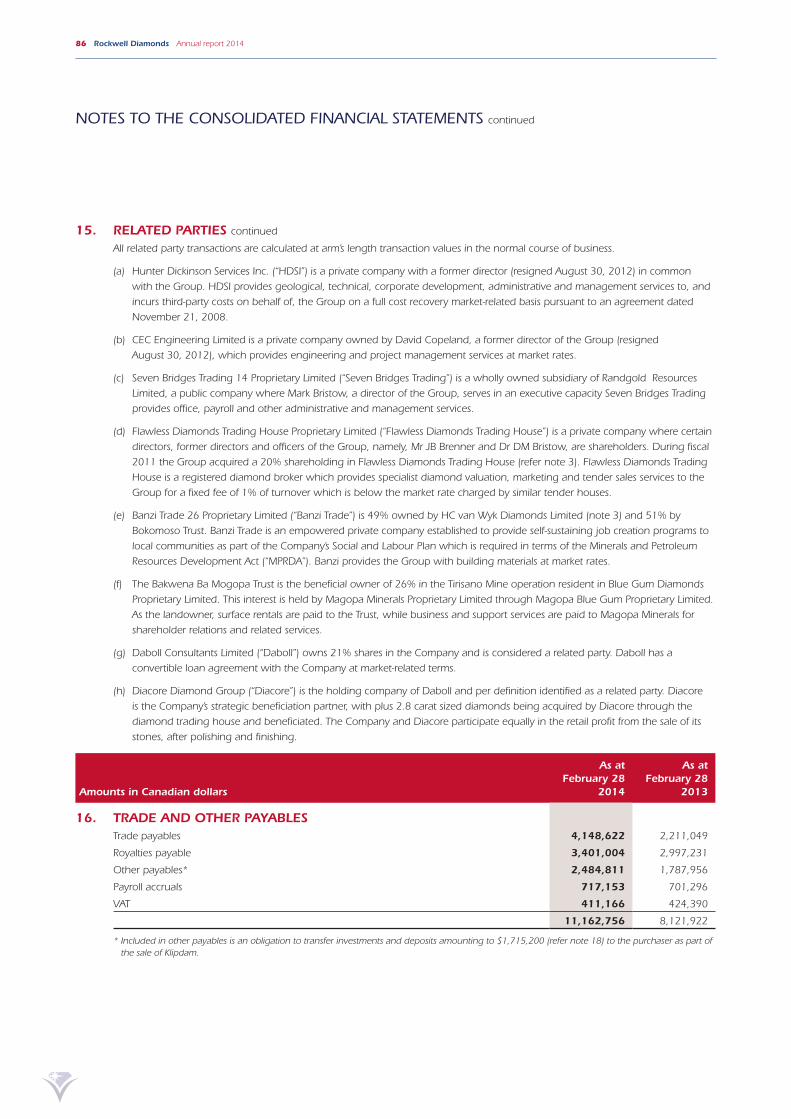
86 Rockwell Diamonds Annual report 2014
15. RELATED PARTIES continued
All related party transactions are calculated at arm’s length transaction values in the normal course of business.
(a) Hunter Dickinson Services Inc. (“HDSI”) is a private company with a former director (resigned August 30, 2012) in common
with the Group. HDSI provides geological, technical, corporate development, administrative and management services to, and
incurs third-party costs on behalf of, the Group on a full cost recovery market-related basis pursuant to an agreement dated
November 21, 2008.
(b) CEC Engineering Limited is a private company owned by David Copeland, a former director of the Group (resigned
August 30, 2012), which provides engineering and project management services at market rates.
(c) Seven Bridges Trading 14 Proprietary Limited (“Seven Bridges Trading”) is a wholly owned subsidiary of Randgold Resources
Limited, a public company where Mark Bristow, a director of the Group, serves in an executive capacity Seven Bridges Trading
provides office, payroll and other administrative and management services.
(d) Flawless Diamonds Trading House Proprietary Limited (“Flawless Diamonds Trading House”) is a private company where certain
directors, former directors and officers of the Group, namely, Mr JB Brenner and Dr DM Bristow, are shareholders. During fiscal
2011 the Group acquired a 20% shareholding in Flawless Diamonds Trading House (refer note 3). Flawless Diamonds Trading
House is a registered diamond broker which provides specialist diamond valuation, marketing and tender sales services to the
Group for a fixed fee of 1% of turnover which is below the market rate charged by similar tender houses.
(e) Banzi Trade 26 Proprietary Limited (“Banzi Trade”) is 49% owned by HC van Wyk Diamonds Limited (note 3) and 51% by
Bokomoso Trust. Banzi Trade is an empowered private company established to provide self-sustaining job creation programs to
local communities as part of the Company’s Social and Labour Plan which is required in terms of the Minerals and Petroleum
Resources Development Act (“MPRDA”). Banzi provides the Group with building materials at market rates.
(f) The Bakwena Ba Mogopa Trust is the beneficial owner of 26% in the Tirisano Mine operation resident in Blue Gum Diamonds
Proprietary Limited. This interest is held by Magopa Minerals Proprietary Limited through Magopa Blue Gum Proprietary Limited.
As the landowner, surface rentals are paid to the Trust, while business and support services are paid to Magopa Minerals for
shareholder relations and related services.
(g) Daboll Consultants Limited (“Daboll”) owns 21% shares in the Company and is considered a related party. Daboll has a
convertible loan agreement with the Company at market-related terms.
(h) Diacore Diamond Group (“Diacore”) is the holding company of Daboll and per definition identified as a related party. Diacore
is the Company’s strategic beneficiation partner, with plus 2.8 carat sized diamonds being acquired by Diacore through the
diamond trading house and beneficiated. The Company and Diacore participate equally in the retail profit from the sale of its
stones, after polishing and finishing.
Amounts in Canadian dollars
As atFebruary 28
2014
As atFebruary 28
2013
16. TRADE AND OTHER PAYABLESTrade payables 4,148,622 2,211,049
Royalties payable 3,401,004 2,997,231
Other payables* 2,484,811 1,787,956
Payroll accruals 717,153 701,296
VAT 411,166 424,390
11,162,756 8,121,922
* Included in other payables is an obligation to transfer investments and deposits amounting to $1,715,200 (refer note 18) to the purchaser as part of the sale of Klipdam.
NOTES TO THE CONSOLIDATED FINANCIAL STATEMENTS continued

Rockwell Diamonds Annual report 2014 87
17. ASSET AND LIABILITY ACQUISITION17.1. Jasper Mining Proprietary Limited
In June 2012, the Group completed the acquisition of 100% of the share capital in Jasper Mining Proprietary Limited. The total
consideration paid by the Group for the interest was $12 and additional Rockwell Diamonds Inc. shares to be issued upon
conversion of the old order mining right.
The acquisition was accounted as the acquisition of assets and liabilities based on the acquisition not meeting the criteria for an
acquired business in terms of IFRS 3 Business Combinations.
The Jasper Mine property is contiguous to Rockwell’s Saxendrift Mine and has the potential to extend the life of Saxendrift Mine
with limited new investment.
Amounts in Canadian dollars
As atFebruary 28
2013
The following summarizes the assets and liabilities acquired:
Allocated cost based on relative fair value
Mineral property interests 1,165,529
Cash and cash equivalents 2,671
Trade and other payables (964,449)
Rehabilitation obligation (203,739)
Total identifiable net assets 12
The Group financed the purchase consideration through
Cash 12
Purchase price* 12
Net cash outflow on acquisition
Cash consideration paid (12)
* In terms of the sale of shares and claims agreement (Jasper Mining) an additional purchase consideration is payable in the form of 533,532 Rockwell Diamonds Inc. shares payable on the notification from the DMR granting approval for conversion of the Jasper old order mining right to a new order mining right. Notification was received on February 11, 2013 from the DMR. Refer note 9 for additional information.
The Linaplex Proprietary Limited option to purchase 26% of Jasper Mining Proprietary Limited expired during fiscal 2014.
17.2. Acquisition of non-controlling interests
On February 11, 2013 the Group acquired the remaining 15% of the share capital in HC van Wyk Diamonds Proprietary Limited
and Klipdam Diamond Mining Limited. This effectively unwinds the deal concluded in fiscal 2009 to purchase 26% of the Group’s
Northern Cape operations by African Vanguard Resources Proprietary Limited. The settlement of the purchase price was completed
on December 27, 2013 in the form of 3,466,667 Rockwell Diamonds Inc. shares listed on the Johannesburg Stock Exchange.

88 Rockwell Diamonds Annual report 2014
18. SALE OF SUBSIDIARY On March 27, 2013 (“effective date”) the Rockwell Diamonds Inc. Group disposed of a 100% shareholding in Klipdam Diamond
Mining Company Proprietary Limited, which formed part of the Northern Cape operations. The entity was sold for an amount of $2,413,770 of which an amount of $734,300 is receivable only on transfer of the mineral right to the purchaser. The assets and liabilities sold amounted to:
Amounts in Canadian dollars
As atFebruary 28
2014
Carrying value of assets sold
Property, plant and equipment (2,412,700)
Mineral property interests (1,178)
Rehabilitation obligation 984,324
Obligation to transfer investments and deposits (1,715,200)
Trade and other payables 472,050
Total net assets sold (2,672,704)
Net assets sold (2,672,704)
Loss on disposal 258,934
(2,413,770)
Consideration received
Cash 1,679,470
Deferred consideration – included in other receivables (note 7) 734,300
2,413,770
Amounts in Canadian dollars
Year endedFebruary 28
2014
Year endedFebruary 28
2013
19. CASH GENERATED (USED) IN OPERATIONSLoss before taxation (10,490,116) (13,906,533)
Adjustments for:
Depreciation and amortization 5,936,352 7,169,649
Realized foreign exchange with sale of subsidiary 6,609,464 –
(Profit) loss on disposal of property, plant and equipment (72,109) 156,062
(Profit) loss on disposal of mineral properties (482,060) 23,900
Loss on sale of subsidiary 258,934 –
Share of profit from equity-accounted investment (58,962) (58,761)
Finance income (698,932) (613,760)
Finance costs 1,137,131 1,406,635
Rehabilitation obligation recognized (revised) 743,023 (3,549,572)
Share-based payment expense 626,141 558,411
Equity-settled employee cost 233,905 –
Impairment of mineral property interests – 959,124
Impairment of property, plant and equipment 35,799 4,826,619
Write-down to net realizable value of diamond inventories 1,470,784 374,207
Write-down of mine supplies 18,975 125,970
Impairment of sundry receivables – 85,813
Reversal of impairment on property, plant and equipment – (585,923)
Changes in working capital:
Inventories (4,948,363) (1,452,434)
Trade and other receivables (3,170,835) (1,120,031)
Trade and other payables 5,520,959 792,543
2,670,090 (4,808,081)
NOTES TO THE CONSOLIDATED FINANCIAL STATEMENTS continued

Rockwell Diamonds Annual report 2014 89
Amounts in Canadian dollars
Year endedFebruary 28
2014
Year endedFebruary 28
2013
20. TAX PAIDBalance at beginning of the year 39,587 –
Current tax for the period recognized in profit or loss – –
Exchange rate movements (3,938) –
Balance at end of the year (35,649) (39,587)
– (39,587)
21. REVENUESale of diamonds 41,106,550 27,105,988
Beneficiation income 4,062,860 5,299,275
45,169,410 32,405,263
Beneficiation income represents profit share on value add (cut and polish), arising through the Group’s beneficiation agreement
with Diacore. The Group is entitled to 50% of the profits from the sale of the polished diamonds produced by the Group and sold
through this channel. The beneficiation income is recognized on the date Diacore notifies the Group of the successful sale of the
diamonds to third parties.
Amounts in Canadian dollars
Year ended February 28
2014
Year ended February 28
2013
22. PRODUCTION COSTProduction cost 41,631,657 32,524,879
Inventory movement (2,431,225) (1,186,662)
39,200,432 31,338,217
23. LOSS BEFORE NET FINANCE COSTSLoss before net finance costs for the year is stated after accounting for the following:
(Profit) loss on sale of property, plant and equipment (72,109) 156,062
(Profit) loss on disposal of mineral property interests (482,060) 23,900
Loss on sale of subsidiary 258,934 –
Realized foreign exchange with sale of subsidiary 6,609,464 –
Depreciation on property, plant and equipment 5,008,643 6,366,415
Amortization on mineral property interests 927,709 803,234
Salaries and wages 1,760,572 1,901,079
Share-based payment expense 626,141 558,411
Operating lease expense 845,504 531,843
Impairment of mineral property interests – 959,124
Impairment of property, plant and equipment 35,799 4,826,619
Reversal of impairment on property, plant and equipment – (585,923)
Write-down to net realizable value of diamond inventories 1,470,784 374,207
Write-down of mine supplies 18,975 125,970
Impairment of sundry receivables – 85,813
Auditors’ remuneration
– Audit fee 323,823 477,213
– Other services 23,835 36,908

90 Rockwell Diamonds Annual report 2014
Amounts in Canadian dollars
Year ended February 28
2014
Year ended February 28
2013
24. FINANCE INCOMEBank 372,603 406,835
Fair value adjustments on other financial assets 326,329 206,925
698,932 613,760
25. FINANCE COSTSLoans and borrowings 430,424 338,190
Finance lease obligation 43,528 152,988
Bank 167,649 380,097
Unwinding of rehabilitation obligation 241,572 535,360
Other 253,958 –
1,137,131 1,406,635
26. TAXATIONMajor components of the tax income
Deferred tax
Movement in deferred tax balance recognized through profit or loss (62,739) (130,155)
Reconciliation of taxation
Reconciliation between accounting loss and taxation:
Loss before tax (10,490,116) (13,906,533)
Tax at the applicable tax rate of 26.5% (2013: 25.00%) (1,028,373) (3,476,634)
Tax effect of adjustments on taxable loss
Difference in foreign tax rates (29,252) (372,365)
Non-deductible expenses 553,746 477,982
Unrecognized deferred tax assets 441,140 3,240,862
(62,739) (130,155)
NOTES TO THE CONSOLIDATED FINANCIAL STATEMENTS continued

Rockwell Diamonds Annual report 2014 91
Amounts in Canadian dollars
Year ended February 28
2014
Year ended February 28
2013
27. LOSS PER SHAREBasic and diluted loss per share
Cents per share (21.30) (22.55)
Basic loss per share was calculated based on a weighted average number of common shares of 49 839 859 (2013: 48 349 322).
Reconciliation of loss for the year to basic loss
Loss for the year (10,427,377) (13,776,378)
Adjusted for:
(Profit) loss attributable to non-controlling interest (190,716) 2,875,845
Basic loss attributable to owners of the Group (10,618,093) (10,900,533)
At February 28, 2014 and February 28, 2013 the impact of share-based payment options was excluded from the weighted average number of shares, for the purpose of the diluted loss per share calculation, as the effect would have been anti-dilutive.
Basic and diluted headline loss per share
Cents per share* (8.68) (14.40)
Reconciliation between basic loss and headline loss
Basic loss attributable to owners of the Group (10,618,093) (10,900,533)
Adjusted for:
(Profit) loss on disposal of mineral properties (482,060) 23,900
(Profit) loss on disposal of property, plant and equipment (72,109) 156,062
Impairment of mineral property interests – 959,124
Impairment of property, plant and equipment 35,799 4,826,619
Reversal of impairment on property, plant and equipment – (585,923)
Share of profit from equity accounted investment* (58,962) (58,761)
Loss on sale of subsidiary 258,934 –
Realized foreign exchange with sale of subsidiary 6,609,464 –
Non-controlling interest portion of above adjustments – (1,380,556)
Headline loss attributable to owners of the Group* (4,327,027) (6,960,068)
The basic and diluted headline loss per share disclosure is provided based on the Listings Requirements of the Johannesburg Stock
Exchange (Group’s secondary listing). The disclosure of basic and diluted headline loss per share is provided in accordance with
Circular 2/2013 as issued by the South African Institute of Chartered Accountants. Headline loss represents the basic loss attributable
to the owners of the Group excluding certain re-measurements.
At February 28, 2014 and February 28, 2013 the impact of share-based payment options was excluded from the weighted average
number of shares, for the purpose of the diluted headline loss per share calculation, as the effect would have been anti-dilutive.
* February 28, 2013 restated due to Circular 2/2013 which is the new requirement applicable for financial statements issued after April 30, 2013.

92 Rockwell Diamonds Annual report 2014
28. REALIZED FOREIGN EXCHANGE WITH SALE OF SUBSIDIARY During the year ended February 28, 2014, the Group sold three subsidiaries, namely Klipdam Diamond Mining Company
Proprietary Limited (note 18), Durnpike Investments Proprietary Limited (dormant) and Rockwell Diamonds Explorations Proprietary
Limited (dormant). While operating these subsidiaries, the Group recorded foreign exchange losses on the subsidiaries’ assets to
reflect the change in relative exchange rates. Upon the sale, the prior foreign exchange reserve was thus released to income.
This is effectively a reversal of the foreign currency translation reserve to retained earnings, and has no cash flow effect.
Amounts in Canadian dollars
Year ended February 28
2014
Year ended February 28
2013
Breakdown of realized foreign exchange with sale of subsidiary:
Durnpike Investments Proprietary Limited 7,509,752 –
Klipdam Diamond Mining Company Proprietary Limited (900,288) –
Rockwell Diamonds Explorations Proprietary Limited – –
6,609,464 –
29. COMMITMENTS Authorized capital expenditure (not contracted for)
At February 28, 2014, the Company committed to spend $860,679 (2013: Nil) on capital projects during the following year to be
funded through cash flows from operating activities.
Amounts in Canadian dollars
Year ended February 28
2014
Year ended February 28
2013
Operating leases
Minimum lease payments due
– within one year 1,159,822 521,677
– in second to fifth year inclusive 3,177,712 1,623,161
4,337,534 2,144,838
Operating lease payments represent rentals payable by the Group for surface rentals and certain of its office properties.
Purchase orders 1,099,645 464,505
30. CONTINGENCIES HC van Wyk Diamonds Limited, Saxendrift Mine Proprietary Limited, Etruscan Diamonds Proprietary Limited and Blue Gum
Diamonds Proprietary Limited held guarantees with the bank in favour of Eskom (electricity provider) of ZAR5,302,500 ($547,219)
(2013: ZAR5,615,100; $643,491) and the Department of Minerals and Energy (DME) of ZAR53,692,314 ($5,541,060)
(2013: ZAR45,366,643; $5,199,019) for rehabilitation expenses.
NOTES TO THE CONSOLIDATED FINANCIAL STATEMENTS continued

Rockwell Diamonds Annual report 2014 93
31. SEGMENTAL INFORMATION The Group has three reportable operating segments, as described below, which are the Group’s operating divisions. These divisions
offer different diamond product characteristics, qualities, geological characteristics, processes and services, and are managed
separately because they require different technology and profit or cost strategies. For each of the divisions the Group executive
committee (chief operating decision-making body) reviews internally managed reports on at least a monthly basis. The following
describes the operations in each of the Group’s reportable segments:
• Northern Cape operation is associated with the mining of Paleo Channels and Rooikoppie gravels and the recovery of high
value and larger carat size diamonds;
• North West operation is associated with the mining of potholes and the recovery of lower value and smaller carat size diamonds;
and
• Corporate represents the corporate management and administrative function of the Group.
The reconciliation column represents the inter-group transactions eliminated on consolidation. All reportable segments are located in
the same geographical jurisdiction. Information regarding the results of each of the reportable segments is included below.
Amounts in Canadian dollarsNorthern
CapeNorth West Corporate Reconciling Total
For the year ended February 28, 2014
Property, plant and equipment 29,079,243 1,627,368 14,073 – 30,720,384
Mineral property interests 16,265,209 10,376,462 – – 26,641,671
Total assets 57,737,809 13,988,120 71,697,759 (64,087,064) 79,336,624
Total liabilities 72,155,110 21,589,291 2,448,849 (64,087,064) 32,106,186
External revenue 36,444,590 8,724,820 – – 45,169,410
Other material non-cash items
– Depreciation on property, plant and equipment 4,763,815 241,488 3,340 5,008,643
– Amortization on mineral property interests 784,774 142,935 – – 927,709
– Rehabilitation obligation (revised) recognized 1,167,318 (424,295) – – 743,023
– Impairment of mineral property interests – – – – –
– Impairment of property, plant and equipment 35,799 – – – 35,799
– Reversal of impairment on property, plant and equipment – – – – –
– Write-down of mine supplies 18,975 – – – 18,975
– Share of profit from equity accounted investment – – (58,962) – (58,962)
Finance income 514,170 92,669 92,093 – 698,932
Finance costs 532,919 505,030 99,182 – 1,137,131
Taxation 62,739 – – – 62,739
Loss for the year (2,293,652) 688,261 (8,821,986) – (10,427,377)

94 Rockwell Diamonds Annual report 2014
31. SEGMENTAL INFORMATION continued
Amounts in Canadian dollarsNorthern
CapeNorth West Corporate Reconciling Total
For the year ended February 28, 2013
Property, plant and equipment 29,105,278 4,431,591 8,123 – 33,544,992
Mineral property interests 19,821,470 11,583,888 – – 31,405,358
Total assets 55,769,553 17,251,694 80,189,009 (67,485,844) 85,724,412
Total liabilities 69,560,627 25,888,561 2,389,368 (67,485,844) 30,352,712
External revenue 30,600,628 1,804,635 – – 32,405,263
Other material non-cash items
Depreciation on property, plant and equipment 5,032,684 1,330,381 3,350 6,366,415
– Amortization on mineral property interests 760,635 42,599 – – 803,234
– Rehabilitation obligation (revised) recognized 831,778 (4,381,350) – – (3,549,572)
– Impairment of mineral property interests 959,124 – – – 959,124
– Impairment of property, plant and equipment 411,169 4,415,450 – – 4,826,619
– Reversal of impairment on property, plant and equipment (585,923) – – – (585,923)
– Write-down to net realizable value of diamond inventories 374,207 – – – 374,207
– Write-down of mine supplies 125,970 – – – 125,970
– Impairment of sundry receivables 55,938 29,875 – – 85,813
– Share of profit from equity accounted investment – – 58,761 – 58,761
Finance income 356,463 85,079 172,218 – 613,760
Finance cost 423,076 879,018 104,541 – 1,406,635
Taxation 130,155 – – – 130,155
Loss for the year (5,184,428) (7,217,461) (1,374,489) – (13,776,378)
32. FINANCIAL RISK MANAGEMENT The board of directors has overall responsibility for the establishment and oversight of the Group’s risk management framework. The
Group’s risk management policies are established to identify and analyze the risks faced by the Group, to set appropriate risk limits
and controls, and to monitor risks and adherence to limits. Risk management policies and systems are reviewed regularly to reflect
changes in market conditions and the Group’s activities.
Overview
This note presents information about the Group’s exposure to risks, the Group’s objectives, policies and processes for measuring and
managing risk and the Group’s management of capital. Further quantitative disclosures are included throughout these consolidated
financial statements.
NOTES TO THE CONSOLIDATED FINANCIAL STATEMENTS continued

Rockwell Diamonds Annual report 2014 95
32. FINANCIAL RISK MANAGEMENT continued
Capital management
As at February 28, 2014, the Group is not subject to externally imposed capital encumbrances other than its overdraft facility and
finance leases. Refer to note 8.
At February 28, 2014, of the $1,324,328 (February 28, 2013: $5,570,626) cash and cash equivalents held by the Group,
$1,151,707 (February 28, 2013: $5,293,016) were held in South African rand (“ZAR”), $164,462 (February 28, 2013: $236,075)
in Canadian dollars and $8,159 (February 28, 2013: $41,535) in United States dollars.
The Group’s primary objectives when managing capital are to safeguard the Group’s ability to continue as a going concern, so that
it can continue to provide returns for shareholders, and to have sufficient funds on hand for business opportunities as they arise.
The Group considers the components of shareholders’ equity, as well as its cash and cash equivalents, and bank indebtedness as
capital. The Group’s investment policy is to invest its cash in highly liquid short-term interest-bearing investments, having maturity
dates of three months or less from the date of acquisition, that are readily convertible to known amounts of cash.
The Group manages the capital structure and makes adjustments to it in the light of changes in economic conditions and the risk
characteristics of the underlying assets. The Group may issue new shares through private placements, issue debt, or return capital to
shareholders, in order to maintain or adjust the capital structure.
In order to facilitate the management of its capital requirements, the Group prepares annual expenditure budgets that are updated
as necessary depending on various factors, including successful capital deployment and general industry conditions.
There were no changes to the Group’s approach to capital and working capital management during the year ended February 28, 2014
and the Group expects it will be able to sufficiently fund its capital development and operations for fiscal 2015 as disclosed in note
1.2.
Carrying amount and fair values of financial instruments
The fair value of a financial instrument is the price that would be received to sell an asset or paid to transfer a liability in an orderly
transaction between market participants at the measurement date. Given the varying influencing factors, the reported fair values are
only indicators of the prices that may actually be realized for these financial instruments.
Financial instruments measured at fair value are classified into one of three levels in the fair value hierarchy according to the relative
reliability of the inputs used to estimate the fair values. The three levels of the fair value hierarchy are:
Level 1 – Unadjusted quoted prices in active markets for identical assets or liabilities;
Level 2 – Inputs other than quoted prices that are observable for the asset or liability either directly or indirectly; and
Level 3 – Inputs that are not based on observable market data.
It is not practicable to determine the fair value of amounts due to and from related parties as the loans do not have fixed repayment
terms and there is no secondary market for such instruments.

96 Rockwell Diamonds Annual report 2014
32. FINANCIAL RISK MANAGEMENT continued
Carrying amount and fair values of financial instruments continued
The following tables show the estimated fair values of the financial instruments:
Amounts in Canadian dollars
February 28 2014
Carrying amount
February 282014
Fairvalue
February 28 2013
Carrying amount
February 282013
Fairvalue
Assets carried at fair value through profit or loss
Investments 5,318,661 5,318,661 4,813,657 4,813,657
Assets carried at amortized cost
Deposits 66,941 66,941 74,758 74,758
Rehabilitation deposits 1,701,493 1,701,493 1,818,291 1,818,291
Trade and other receivables 6,154,304 6,154,304 4,576,614 4,576,614
Cash and cash equivalents 1,324,328 1,324,328 5,570,626 5,570,626
Liabilities carried at amortized cost
Loans and borrowings 5,194,112 5,194,112 5,204,491 5,204,491
Trade and other payables 6,633,433 6,633,433 3,999,005 3,999,005
Finance lease obligations 275,086 275,086 602,112 602,112
Loans from related parties 4,258 4,258 48,925 48,925
Bank overdraft 3,085,413 3,085,413 2,839,921 2,839,921
The following table illustrates the classification of the Group’s financial instruments recorded at fair value within the fair value
hierarchy:
Amounts in Canadian dollars Level 1 Level 2 Level 3 Total
Financial assets at fair value February 28, 2014
Investments 5,318,661 – – 5,318,661
Financial assets at fair value February 28, 2013
Investments 4,813,567 – – 4,813,657
The financial assets designated at fair value through profit or loss are investments that would otherwise be classified as available-for-
sale. The performance of these investments is managed on a fair value basis.
Financial instrument risk exposure and risk management
The Group is exposed in varying degrees to a variety of financial instrument-related risks. The board approves and monitors the risk
management processes, including treasury policies, counterparty limits, controlling and reporting structures, credit risk, liquidity risk,
currency risk, interest risk and diamond price risk. The types of risk exposure and the way in which such exposure is managed are
provided as follows:
Credit risk
Credit risk is the risk of potential loss to the Group if a counterparty to a financial instrument fails to meet its contractual obligations.
The Group’s credit risk is primarily attributable to its liquid financial assets including cash and equivalents, trade and other receivables
and loans to related parties. The carrying values of the Group’s cash and cash equivalents, trade and other receivables and loans to
related parties represent the maximum exposure to credit risk.
The Group limits exposure to credit risk on liquid financial assets through maintaining its cash and equivalents with high credit
quality financial institutions. The Group does not have financial assets that are invested in asset-backed commercial paper.
NOTES TO THE CONSOLIDATED FINANCIAL STATEMENTS continued
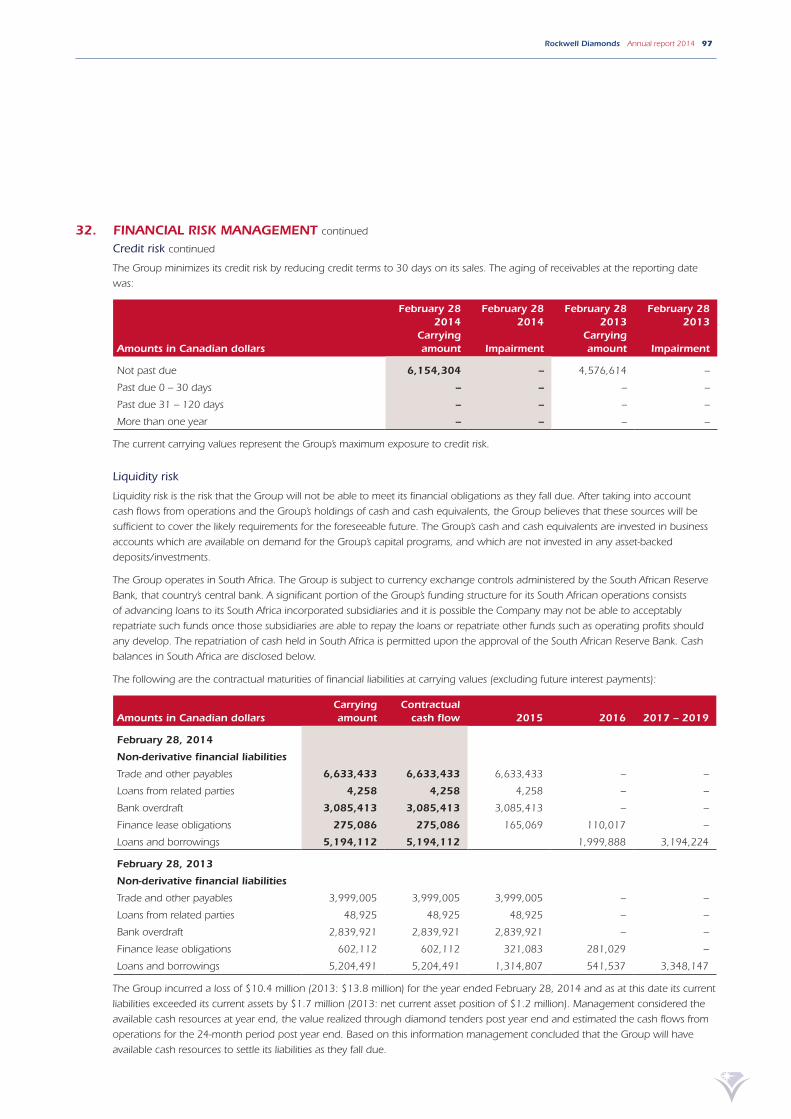
Rockwell Diamonds Annual report 2014 97
32. FINANCIAL RISK MANAGEMENT continued
Credit risk continued
The Group minimizes its credit risk by reducing credit terms to 30 days on its sales. The aging of receivables at the reporting date
was:
Amounts in Canadian dollars
February 28 2014
Carrying amount
February 282014
Impairment
February 28 2013
Carrying amount
February 282013
Impairment
Not past due 6,154,304 – 4,576,614 –
Past due 0 – 30 days – – – –
Past due 31 – 120 days – – – –
More than one year – – – –
The current carrying values represent the Group’s maximum exposure to credit risk.
Liquidity risk
Liquidity risk is the risk that the Group will not be able to meet its financial obligations as they fall due. After taking into account
cash flows from operations and the Group’s holdings of cash and cash equivalents, the Group believes that these sources will be
sufficient to cover the likely requirements for the foreseeable future. The Group’s cash and cash equivalents are invested in business
accounts which are available on demand for the Group’s capital programs, and which are not invested in any asset-backed
deposits/investments.
The Group operates in South Africa. The Group is subject to currency exchange controls administered by the South African Reserve
Bank, that country’s central bank. A significant portion of the Group’s funding structure for its South African operations consists
of advancing loans to its South Africa incorporated subsidiaries and it is possible the Company may not be able to acceptably
repatriate such funds once those subsidiaries are able to repay the loans or repatriate other funds such as operating profits should
any develop. The repatriation of cash held in South Africa is permitted upon the approval of the South African Reserve Bank. Cash
balances in South Africa are disclosed below.
The following are the contractual maturities of financial liabilities at carrying values (excluding future interest payments):
Amounts in Canadian dollarsCarrying amount
Contractual cash flow 2015 2016 2017 – 2019
February 28, 2014
Non-derivative financial liabilities
Trade and other payables 6,633,433 6,633,433 6,633,433 – –
Loans from related parties 4,258 4,258 4,258 – –
Bank overdraft 3,085,413 3,085,413 3,085,413 – –
Finance lease obligations 275,086 275,086 165,069 110,017 –
Loans and borrowings 5,194,112 5,194,112 1,999,888 3,194,224
February 28, 2013
Non-derivative financial liabilities
Trade and other payables 3,999,005 3,999,005 3,999,005 – –
Loans from related parties 48,925 48,925 48,925 – –
Bank overdraft 2,839,921 2,839,921 2,839,921 – –
Finance lease obligations 602,112 602,112 321,083 281,029 –
Loans and borrowings 5,204,491 5,204,491 1,314,807 541,537 3,348,147
The Group incurred a loss of $10.4 million (2013: $13.8 million) for the year ended February 28, 2014 and as at this date its current
liabilities exceeded its current assets by $1.7 million (2013: net current asset position of $1.2 million). Management considered the
available cash resources at year end, the value realized through diamond tenders post year end and estimated the cash flows from
operations for the 24-month period post year end. Based on this information management concluded that the Group will have
available cash resources to settle its liabilities as they fall due.

98 Rockwell Diamonds Annual report 2014
32. FINANCIAL RISK MANAGEMENT continued
Market risk
Market risk is the risk that changes in market prices, such as foreign exchange rates and interest rates will affect the Group’s income
or the value of its holdings of financial instruments. The objective of market risk management is to manage and control market risk
exposures within acceptable parameters, while optimizing the return.
Foreign currency risk
In the normal course of business, the Group enters into transactions for the purchase of supplies and services denominated in ZAR.
In addition, the Group has cash and certain liabilities denominated in ZAR. As a result, the Group is subject to currency risk from
fluctuations in foreign exchange rates. The Group has not entered into any derivative or other financial instruments to mitigate this
foreign exchange risk.
The exposure of the Group’s financial assets and liabilities to currency risk is as follows:
Foreign currency exposure at the end of the reporting period
Amounts in Canadian dollars
As atFebruary 28
2014
As atFebruary 28
2013
ASSETSUnited States dollar
Cash and cash equivalents 8,159 41,535
Total financial assets denominated in currency different to the functional currency of the respective Group entity 8,159 41,535
LIABILITIESUnited States dollar
Loans and borrowings 1,999,888 2,008,161
Total financial liabilities denominated in currency different to the functional currency of the respective Group entity 1,999,888 2,008,161
Exchange rates used for conversion of foreign operations were:
CDN vs. ZAR – Annual average rate 0.1049 0.1195
CDN vs. ZAR – Year end spot rate 0.1032 0.1146
CDN vs. USD – Annual average rate 1.0467 0.9987
CDN vs. USD – Year end spot rate 1.1074 1.0314
Sensitivity analysis
The Group does not have any significant financial instruments exposed to currencies different to the functional currency of the
respective Group entity. Therefore the Group is not significantly exposed to foreign currency movements through profit or loss.
Interest rate risk
The Group is subject to interest rate risk with respect to its investments in cash and cash equivalents. The Group’s policy is to invest
cash at floating rates of interest and cash reserves are to be maintained in cash equivalents in order to maintain liquidity, while
achieving a satisfactory return for shareholders. Fluctuations in interest rates when the cash equivalents mature impact interest
income earned.
The Group has finance lease obligations with several financial institutions (note 12) as well as a loan from the Industrial
Development Corporation of South Africa Limited (note 11). These obligations bear interest at rates linked to the prevailing prime
rate, and are subject to interest rate change risk.
Sensitivity analysis
A 100 basis point increase/decrease in the prime rate for the year ended February 28, 2014 would have a net loss/gain effect on
profit or loss before tax of $2,185 (28 February 2013: $7,929). This analysis assumes that all other variables, in particular foreign
exchange rates, remain constant.
NOTES TO THE CONSOLIDATED FINANCIAL STATEMENTS continued

Rockwell Diamonds Annual report 2014 99
32. FINANCIAL RISK MANAGEMENT continued
Business risk – diamond price risk
The value of the Group’s mineral resource properties is dependent on the price and the outlook of diamonds. Diamond demand
and prices fluctuate and are affected by numerous factors beyond the control of the Group, including worldwide economic trends,
worldwide levels of diamond discovery and production, and the level of demand for and discretionary spending on, luxury goods
such as diamonds and jewelry. Low or negative growth in the worldwide economy, prolonged credit market disruptions or activities
creating disruptions in economic growth could result in decreased demand for diamonds, thereby negatively affecting the price of
diamonds. Similarly, a substantial increase in the worldwide level of diamond production could also negatively affect the price of
diamonds. In each case, such developments could materially adversely affect the Group’s results of operations.
The profitability of the Group’s operations is highly correlated to the market price of diamonds. If diamond prices decline for a
prolonged period below the cost of production of the Group’s operating mines, it may not be economically feasible to continue
production.
33. LIST OF SUBSIDIARIES
Name of subsidiaryPrincipal place
of businessOwnership
interest 2014Ownership
interest 2013
HC v Wyk Diamonds Limited1 South Africa 100% 100%
Saxendrift Mine Proprietary Limited1 South Africa 100% 100%
Klipdam Diamond Mining Company Limited1 South Africa – 100%
Jasper Mining Proprietary Limited3 South Africa 100% 100%
Etruscan Diamonds Proprietary Limited 2 South Africa 100% 100%
Blue Gum Diamonds Proprietary Limited1 South Africa 74% 74%
N9C Resources Inc.2 Cayman Island 100% 100%
N10C Resources Inc.2 Cayman Island 100% 100%
N11C Resources Inc.2 Cayman Island 100% 100%
Rockwell Resources RSA Proprietary Limited1 South Africa 100% 100%
Rockwell Diamonds North West Proprietary Limited3 South Africa 100% 100%
Rockwell Diamonds Explorations Proprietary Limited3 South Africa – 100%
Linaplex Proprietary Limited3 South Africa 100% –
Durnpike Investments Proprietary Limited3 South Africa – 100%
1. Operating company.
2. Investment holding company.
3. Dormant.
34. SUBSEQUENT EVENTS Management is not aware of any matter or circumstance arising since the end of the financial year.

100 Rockwell Diamonds Annual report 2014
CORPORATE INFORMATION
REGISTERED OFFICE – SOUTH AFRICALevel 1, Wilds View, Isle of Houghton
Corner Carse O’Gowrie and Boundary Roads
Houghton Estate, Johannesburg 2198
PO Box 3011, Houghton 2041, South Africa
Telephone: +27 11 484 0830
Facsimile: +27 86 262 2838
CORPORATE ADDRESS – CANADA1020–800 West Pender Street, Vancouver
British Columbia, Canada V6C 2V6
Telephone: +1 604 684 636
Facsimile: +1 604 684 8092
Toll free: 1 800 667 2114
CORPORATE ADVISORPolo Capital Proprietary Limited
4 Fricker Road, Illovo
Sandton 2196, South Africa
JSE SPONSORPSG Capital
1st floor, Ou Kollege Building, 35 Kerk Street
Stellenbosch 7600, South Africa
INTERNATIONAL BROKERNorthland Capital Partners Limited
60 Gresham Street, London, EC2V 7BB
United Kingdom
AUDITORSKPMG Inc
Chartered Accountants
KPMG Crescent, 85 Empire Road
Parktown 2193, South Africa
TRANSFER AGENTSSouth Africa
Computershare Investor Services Proprietary Limited
(Registration number 2004/0036471/07)
Ground Floor, 70 Marshall Street
Johannesburg 2001, South Africa
Canada
Computershare Investor Services Inc.
3rd Floor, 510 Burrard Street, Vancouver
British Columbia, Canada V6C 3B9
LAWYERSSouth Africa
Brink Falcon Hume Inc Attorneys
Second Floor, 8 Melville Road, Illovo
Sandton 2196, South Africa
Canada
Mc Millan LLP
Royal Centre 1055 West Georgia Street
Suite 1500 Vancouver
British Columbia, Canada V6E 4N7


www.rockwelldiamonds.com