Embed Size (px)
Citation preview
CONTENTS
Corporate Information
Notice of Annual General Meeting
Directors' Report to the Shareholders
Statement of Compliance with the best Practices of Corporate Governance
Six Years' Review at a Glance
Performance Overview
Pattern of Shareholding
Auditors' Review Report on Corporate Governance
Auditors' Report to the Members
Balance Sheet
Profit and Loss Account
Statement of Comprehensive Income
Cash Flow Statement
Statement of Changes in Equity
Notes to the Financial Statements
Form of Proxy
Page #
2
5
6
8
10
12
14
16
19
20
22
23
24
26
27
55
ANNUAL REPORT 2014
Corporate Information
BOARD OF DIRECTORS Mr. Salman Hayat Noon Chairman / CEO (Executive Director)
Mr. Adnan Hayat Noon (Non-Executive Director)
Mr. K. Iqbal Talib (Non-Executive Director)
Mr. Zaheer Ahmad Khan (Non-Executive Director)
Mr. Asif H. Bukhari (Non-Executive Director)
Lt. Col. (R) Abdul Khaliq Khan (Executive Director)
Mirza Shoaib Baig (Executive Director)
COMPANY SECRETARY Syed Anwar Ali
AUDIT COMMITTEE Mr. Asif H. Bukhari Chairman
Mr. Adnan Hayat Noon Member
Mr. K. Iqbal Talib Member
HR & R COMMITTEE Mr. K. Iqbal Talib
Mr. Zaheer Ahmad Khan
Lt. Col. (R) Abdul Khaliq Khan
AUDITORS Hameed Chaudhri & Co.
Chartered Accountants
CHIEF FINANCIAL OFFICER Mr. Rizwan Ahmad
LEGAL ADVISERS Hamid Law Associates
BANKERS Habib Bank Limited
United Bank Limited
National Bank of Pakistan
Bank Alfalah Limited
Faysal Bank Limited
The Bank of Punjab
NIB Bank Limited
MCB Bank Limited
Askari Bank Limited
Allied Bank Limited
Bank Islami Pakistan Limited
REGISTERED OFFICE 66-Garden Block,
& New Garden Town,
SHARES DEPARTMENT Lahore.
/ REGISTRAR Tele : 35831462 - 35831463
E-mail: [email protected]
WEBSITE www.nurpurfoods.com
PLANT Bhalwal, District Sargodha.
02


NOTICE OF ANNUAL GENERAL MEETING
Notice is hereby given that the 47th Annual General Meeting of Noon Pakistan Limited will be held at 66 Garden Block, New Garden Town, Lahore on Thursday, 30 October, 2014 at 11:30 a.m. to transact the following business:-
ORDINARY BUSINESS
1. To confirm the minutes of the extraordinary general meeting held on 09 June, 2014.
2. To receive, consider and adopt the audited accounts for the year ended 30 June, 2014 and the reports of the directors and auditors thereon.
3. To appoint auditors for the financial year ending 30 June, 2015 and to fix their remuneration.
4. To elect seven directors in accordance with provisions of section 178 of the Companies Ordinance, 1984.
5. To transact any other business as may be placed before the meeting with the permission of the Chairman.
The Board of Directors has fixed the number of elected directors as seven for the purpose of elections at this meeting. The tenure of the elected directors will be three years from the date of election.
The names of the retiring directors are:1. Mr. Salman Hayat Noon 2. Malik Adnan Hayat Noon3. Mr. K. Iqbal Talib 4. Mr. Zaheer Ahmad Khan5. Mr. Asif Hussain Bukhari 6. Lt. Col. (R) Abdul Khaliq Khan7. Mirza Shoaib Baig
Any person who seeks to contest this election shall file with the Company at the Registered Office, not later than fourteen days before the date of the meeting, a notice of his/ her intention to offer himself/ herself for election as a director.
The Company has received nominations from all above mentioned retiring directors. The members will be notified in the event of any further nominations received.
CLOSURE OF SHARE TRANSFER BOOKS
The share transfer books of the Company will remain closed from 24 October, 2014 to 30 October, 2014 (both days inclusive) for the purpose of holding the AGM.
By Order of the Board
SYED ANWAR ALISeptember 30, 2014 Company Secretary
NOTES:
1. A member entitled to attend and vote at this meeting may appoint another member as his/her proxy to attend, speak and vote on his/her behalf. Proxies in order to be effective must be received by the Company at the registered office not less than 48 hours before the meeting. The shareholders through CDC are requested to bring original CNIC/Passport for the purpose of identification to attend the meeting. Representatives of corporate members should bring the usual documents required for such purpose. The members are requested to follow the guidelines contained in Circular No.1 of 2000 dated 26 January, 2000 issued by SECP reproduced on reverse of the Proxy Form.
2. Members, having physical shares, are advised to intimate any change in there registered address and the shareholders who have not yet submitted photocopies of their Computerized National Identity Cards (CNIC) are requested to send the same at the earliest.
ANNUAL REPORT 2014
05

DIRECTORS' REPORT TO THE SHARE HOLDERS
The Directors of the company are pleased to submit the Annual Report along with the audited financial statements for the year ended June 30, 2014.
1. Summarized Financial Performance
2. The Year Under review:-
During the year under review, the country witnessed major economic and political developments which negatively impacted the economy. All these developments had direct and indirect effects on fast moving consumer goods industry including dairy.
A number of economic factors resulted net increase in cost of inputs. The competitive scenario did not allow passing on the entire cost increase to stake holders by way of price increase. Such a situation had impacted the operating results of the year under review.
As part of overall corporate strategy, the management of company continued to pursue cost rationalization and human capital development measures. In changing FMCG scenario, we continued to bring changes in organizational structure in line with current trends.
On sales and marketing front, the management continued its focus on secondary sales at retail outlet level for which retail sales tracking system was installed in major metro cities including Karachi, Lahore, Rawalpindi / Islamabad. In addition to above, our drive for increased numeric distribution continued by adding retail outlets in priority channels.
3. Future Outlook
In spite of serious ongoing energy crisis, economy in general and FMCG sector in particular continued to exhibit resilience which is likely to stay in coming years as well. The consumption pattern of Pakistani consumers is a major reason of optimism as regard industry future growth.
Although we have seen many changes in government in last two decades, the overall framework for both monetary and fiscal policies remained more or less unchanged. Structural reforms in financial sector, tax regime rationalization and pro-business policies helped in overall economic growth despite other economic and political challenges.
We are confident that economic prospects of Pakistan will continue to improve in coming years which will have positive impact on our industry. The growing awareness regarding packaged dairy products will also help the industry to register future growth.
4. Dividend
Keeping in view prevailing depressed economic and financial scenario, the Board has not recommended any dividend for the year ending 30 June 2014.
5. Corporate and Financial Reporting Framework
•The financial statement, prepared by the management of the Company, present fairly its state of affairs, the result of its operations, cash flow and changes in equity.
•Proper books of account of the Company have been maintained.
•Appropriate accounting policies have been consistently applied in preparation of the financial statements and accounting estimates are based on reasonable and prudent judgment.
•International Accounting Standards, as applicable in Pakistan, have been followed in preparation of the financial statements.
•The system of internal controls is sound in design and has been effectively implemented and monitored.
Sale
Gross Profit
Operating Loss
Net Loss before tax
Loss per share (Rs.)
Change
-
-
-
-
-
2012-13
(144.68)
(9.18)
2013-14
(Million Rs.) (Million Rs.)
2,194.025 2,926.23
204.25 291.79
(60.60) (91.62)
(120.85)
(10.19)
(25.02%)
(30.00%)
33.85%
16.47%
11.00%
06

Names of Directors
5Mr. Salman Hayat Noon
7
Mirza Shoaib Baig
Mr. Adnan Hayat Noon
7
Mr. K. Iqbal Talib 5
7
Mr. Zaheer Ahmad Khan 6
Lt. Col. (R) Abdul Khaliq Khan
Mr. Asif H. Bukhari
7
No. of Meetings Attended
There are no doubts upon the Company's ability to continue as a 'going concern'.
•There has been no material departure from the best practices of corporate governance, as detailed in the listing regulations.
•Key operating and financial data for the last six years in summarized form is annexed.
•There are no statutory payments on account of taxes, duties, levies and charges which are outstanding as on 30th June 2014 except for those disclosed in the financial statements.
•The value of investments of staff provident fund, based on audited accounts, was Rs. 64.058 million as at 30th June, 2014.
•Till 30 June, 2014, one Director had acquired the compulsory training from the Institute of Cost and Management Accountants of Pakistan (ICMA) whereas one Director was exempt from obtaining the requisite training; however, two more directors have acquired the formal directors training from Executive Development Centre, Lahore after the close of current financial year but before authorization of this statement.
•During the year, seven meetings of the Board of Directors were held. Attendance by each director was as follow:
•The pattern of shareholding and additional information regarding pattern of shareholding is included in this annual report.
•No trade in the shares of the Company were carried-out by the Directors, CEO, CFO, Company Secretary and their spouse and minor children during the year ended 30th June 2014.
6. Auditors
The present auditors M/s Hameed Chaudhri & Co., Chartered Accountants retire and being eligible offer themselves for re-appointment. The board has received recommendations from its Audit Committee for re-appointment of M/s Hameed Chaudhri& Co., Chartered Accountants as auditors of the company for the ensuing year.
7. Compliance with the Code of Corporate Governance
The requirements of the Code of Corporate Governance set out by the Karachi and Lahore Stock Exchanges in their listing rules, relevant for the year ended 30th June 2014, have been duly complied with. A statement to this effect is annexed with the report.
8. Acknowledgment
The board is thankful to the valuable members and bankers for their trust and continued support to the Company. The Board would also like to place on record its appreciation to all employees of the Company for their dedication, diligence and hard work.
•
For and on behalf of the Board
SALMAN HAYAT NOONChairmanDated : September 30, 2014
ANNUAL REPORT 2014
07

Statement of Compliance with the Code of Corporate Governance
This statement is being presented to comply with the Code of Corporate Governance contained in Regulation No.35 of listing regulations of
Karachi and Lahore Stock Exchanges for the purpose of establishing a framework of good governance, whereby a listed company is
managed in compliance with the best practices of corporate governance.
The company has applied the principles contained in the CCG in the following manner:
1. The Company encourages representation of independent, non-executive directors and directors representing minority interests on its
Board of Directors. At present the Board includes:
Names Category
Mr. Salman Hayat Noon, CEO Executive Director
Mirza Shoaib Baig, COO Executive Director
Lt. Col. (R) Abdul Khaliq Khan Executive Director
Malik Adnan Hayat Noon Non-Executive Director
Mr. K. IqbalTalib Non-Executive Director
Mr. Zaheer Ahmad Khan Non-Executive Director
Mr. Asif Hussain Bukhari Non-Executive Director
At present there is no independent director on the Company's Board of Directors. The next election of directors is scheduled to be held
on 30 October, 2014 and the Company will seek compliance with the requirements of the CCG.
2. The directors have confirmed that none of them is serving as a director in more than seven listed companies, including this company.
3. All the resident directors of the Company are registered as taxpayers and none of them has defaulted in payment of any loan to a
banking company, a DFI or an NBFI or, being a member of a stock exchange, has been declared as a defaulter by that stock exchange.
4. No casual vacancy occurred on the Board during the year.
5. The Company has prepared a “Code of Conduct” and has ensured that appropriate steps have been taken to disseminate it
throughout the company along with its supporting policies and procedures.
6. The Board has developed a vision/mission statement, overall corporate strategy and significant policies of the company. A complete
record of particulars of significant policies along with the dates on which they were approved or amended has been maintained.
7. All the powers of the Board have been duly exercised and decisions on material transactions, including appointment and
determination of remuneration and terms and conditions of employment of the CEO, other executive and non-executive directors,
have been taken by the Board/shareholders.
8. The meetings of the Board were presided over by the Chairman and, in his absence, by a director elected by the Board for this purpose
and the Board met at least once in every quarter. Written notices of the Board meetings, along with agenda and working papers, were
circulated at least seven days before the meetings. The minutes of the Board meetings were appropriately recorded and circulated.
9. All the directors on the Board are fully conversant with their duties and responsibilities as directors. Till 30 June, 2014, one Director
had acquired the compulsory training from the Institute of Cost and Management Accountants of Pakistan (ICMA) whereas one
Director was exempt from obtaining the requisite training; however, two more directors have acquired the formal directors training
from Executive Development Centre, Lahore after the close of current financial year but before authorization of this statement.
10. There was no new appointment of CFO, Company Secretary and Head of Internal Audit during the year.
11. The Directors' Report for this year has been prepared in compliance with the requirements of the CCG and fully describes the salient
matters required to be disclosed.
12. The financial statements of the Company were duly endorsed by CEO and CFO before approval of the Board.
13. The directors, CEO and executives do not hold any interest in the shares of the Company other than that disclosed in the pattern of
shareholding.
08
14. The Company has complied with all the corporate and financial reporting requirements of the CCG.
15. The Board has formed an Audit Committee. It comprises 3 members and all of them are non-executive directors.
16. The meetings of the audit committee were held at least once every quarter prior to approval of interim and final results of the company
and as required by the CCG. The terms of reference of the committee have been formed and advised to the committee for compliance.
17. The Board has formed an HR and Remuneration Committee. It comprises 3 members, of whom two are non-executive directors.
18. The Board has set up an effective internal audit function.
19. The statutory auditors of the company have confirmed that they have been given a satisfactory rating under the quality control review
program of the ICAP, that they or any of the partners of the firm, their spouses and minor children do not hold shares of the Company
and that the firm and all its partners are in compliance with International Federation of Accountants (IFAC) guidelines on code of ethics
as adopted by the ICAP.
20. The statutory auditors or the persons associated with them have not been appointed to provide other services except in accordance
with the listing regulations and the auditors have confirmed that they have observed IFAC guidelines in this regard.
21. The 'closed period', prior to the announcement of interim/final results, and business decisions, which may materially affect the market
price of Company's securities, was determined and intimated to directors, employees and stock exchanges.
22. Material/price sensitive information has been disseminated among all market participants at once through stock exchanges.
23. All related parties transactions have been placed before the Audit Committee and Board of Directors and have been duly approved by
the Board of Directors to comply with the requirements of listing regulations of Karachi and Lahore Stock Exchanges.
24. We confirm that all other material principles enshrined in the CCG have been complied with.
On behalf of the Board
SALMAN HAYAT NOONLahore : 30 September, 2014. Chief Executive
ANNUAL REPORT 2014
09
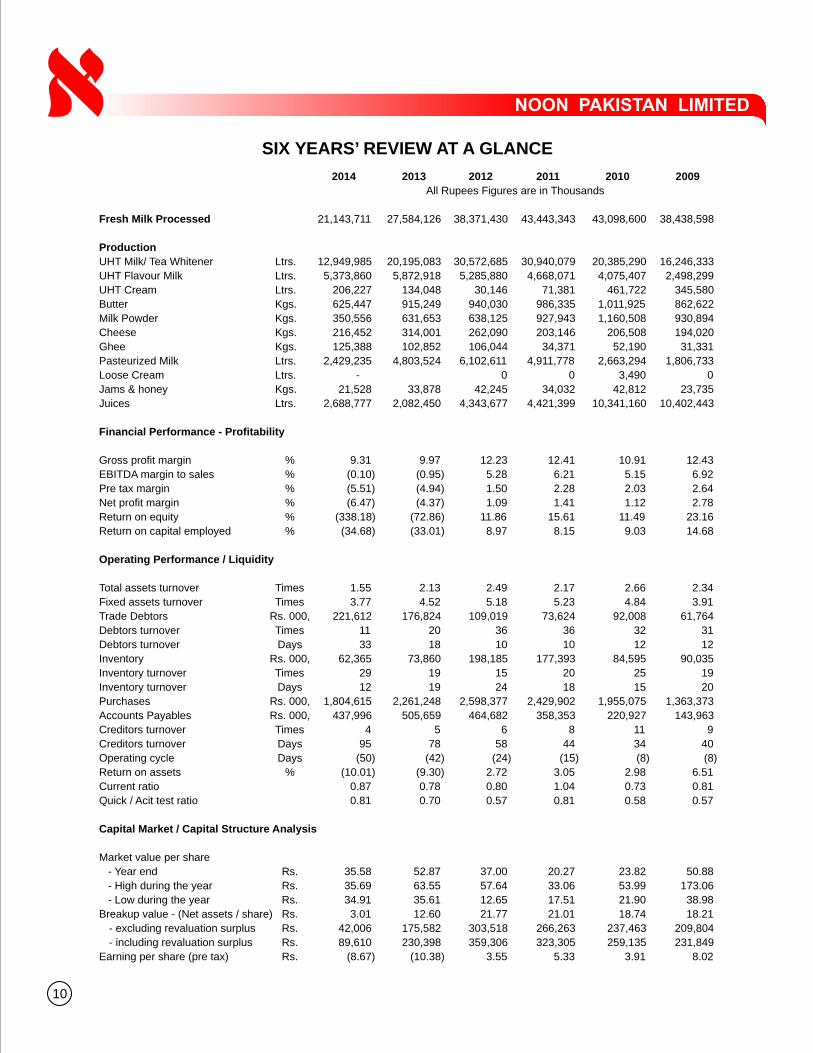
SIX YEARS’ REVIEW AT A GLANCE
2014 2013 2012 2011 2010 2009
Fresh Milk Processed 21,143,711 27,584,126 38,371,430 43,443,343 43,098,600 38,438,598
Production
UHT Milk/ Tea Whitener Ltrs. 12,949,985 20,195,083 30,572,685 30,940,079 20,385,290 16,246,333
UHT Flavour Milk Ltrs. 5,373,860 5,872,918 5,285,880 4,668,071 4,075,407 2,498,299
UHT Cream Ltrs. 206,227 134,048 30,146 71,381 461,722 345,580
Butter Kgs. 625,447 915,249 940,030 986,335 1,011,925 862,622
Milk Powder Kgs. 350,556 631,653 638,125 927,943 1,160,508 930,894
Cheese Kgs. 216,452 314,001 262,090 203,146 206,508 194,020
Ghee Kgs. 125,388 102,852 106,044 34,371 52,190 31,331
Pasteurized Milk Ltrs. 2,429,235 4,803,524 6,102,611 4,911,778 2,663,294 1,806,733
Loose Cream Ltrs. - 0 0 3,490 0
Jams & honey Kgs. 21,528 33,878 42,245 34,032 42,812 23,735
Juices Ltrs. 2,688,777 2,082,450 4,343,677 4,421,399 10,341,160 10,402,443
Financial Performance - Profitability
Gross profit margin % 9.31 9.97 12.23 12.41 10.91 12.43
EBITDA margin to sales % (0.10) (0.95) 5.28 6.21 5.15 6.92
Pre tax margin % (5.51) (4.94) 1.50 2.28 2.03 2.64
Net profit margin % (6.47) (4.37) 1.09 1.41 1.12 2.78
Return on equity % (338.18) (72.86) 11.86 15.61 11.49 23.16
Return on capital employed % (34.68) (33.01) 8.97 8.15 9.03 14.68
Operating Performance / Liquidity
Total assets turnover Times 1.55 2.13 2.49 2.17 2.66 2.34
Fixed assets turnover Times 3.77 4.52 5.18 5.23 4.84 3.91
Trade Debtors Rs. 000, 221,612 176,824 109,019 73,624 92,008 61,764
Debtors turnover Times 11 20 36 36 32 31
Debtors turnover Days 33 18 10 10 12 12
Inventory Rs. 000, 62,365 73,860 198,185 177,393 84,595 90,035
Inventory turnover Times 29 19 15 20 25 19
Inventory turnover Days 12 19 24 18 15 20
Purchases Rs. 000, 1,804,615 2,261,248 2,598,377 2,429,902 1,955,075 1,363,373
Accounts Payables Rs. 000, 437,996 505,659 464,682 358,353 220,927 143,963
Creditors turnover Times 4 5 6 8 11 9
Creditors turnover Days 95 78 58 44 34 40
Operating cycle Days (50) (42) (24) (15) (8) (8)
Return on assets % (10.01) (9.30) 2.72 3.05 2.98 6.51
Current ratio 0.87 0.78 0.80 1.04 0.73 0.81
Quick / Acit test ratio 0.81 0.70 0.57 0.81 0.58 0.57
Capital Market / Capital Structure Analysis
Market value per share
- Year end Rs. 35.58 52.87 37.00 20.27 23.82 50.88
- High during the year Rs. 35.69 63.55 57.64 33.06 53.99 173.06
- Low during the year Rs. 34.91 35.61 12.65 17.51 21.90 38.98
Breakup value - (Net assets / share) Rs. 3.01 12.60 21.77 21.01 18.74 18.21
- excluding revaluation surplus Rs. 42,006 175,582 303,518 266,263 237,463 209,804
- including revaluation surplus Rs. 89,610 230,398 359,306 323,305 259,135 231,849
Earning per share (pre tax) Rs. (8.67) (10.38) 3.55 5.33 3.91 8.02
All Rupees Figures are in Thousands
10

SIX YEARS’ REVIEW AT A GLANCE
Earning per share (after tax) Rs.
Earnings growth %
Price earning ratio
Market price to breakup value
Debt : Equity
Interest cover
Corporate Distribution & Retention
Dividend per share - cash Rs.
Bonus shares issued %
Dividend payout %
Dividend cover ratio %
Retention %
Summary of Balance Sheet
Share capital
Reserves
Share holder's fund / Equity
Revaluation surplus
Long term borrowings
Capital employed
Deferred liabilities
Property, plant & equipment
Long term assets
Net current assets / Working capital
Liquid funds - net
Summary of Profit & Loss
Sales - net
Gross profit
Operating Loss
Loss before tax
Loss after tax
EBITDA
Summary of Cash Flows
Net cash flow from operating activities
Net cash flow from investing activities
Net cash flow from financing activities
Changes in cash & cash equivalents
Cash & cash equivalents - Year end
(10.19)
11.01
(3.49)
11.81
18.15
(1.01)
-
-
-
-
-
139,392
(97,386)
42,006
47,604
367,648
409,654
-
576,928
581,217
(123,958)
218,123
2,194,025
204,246
(60,605)
(120,857)
(142,055)
(2,168)
(56,340)
15,750
178,322
137,733
218,124
2014
(9.18)
(455.81)
(5.76)
4.20
2.95
(1.73)
-
-
-
-
-
139,392
36,190
175,582
54,816
211,967
387,549
-
645,047
647,767
(204,217)
80,390
2,926,229
291,788
(91,624)
(144,684)
(127,936)
(27,918)
(14,753)
(71,655)
130,234
43,827
80,391
2013
2.58
(13.42)
14.34
1.70
1.12
1.79
-
-
-
-
-
139,392
164,126
303,518
55,788
97,786
401,304
9,752
636,753
638,088
(170,981)
36,564
3,305,489
404,225
112,042
49,519
36,001
174,607
180,767
(87,561)
(267,824)
(174,618)
36,564
2012
3.28
52.56
6.18
0.96
1.97
2.13
-
10.00
-
-
-
126,720
139,543
266,263
57,042
243,724
509,987
28,335
565,924
567,366
28,567
211,182
2,957,377
366,933
127,192
67,485
41,551
183,609
88,208
(8,512)
108,135
187,831
211,182
2011
2.15
(74.91)
11.08
1.27
1.21
2.24
1.20
-
55.81
179.17
44.19
126,720
110,743
237,463
21,672
64,822
302,285
28,096
503,510
504,825
(150,188)
23,351
2,436,416
265,918
89,452
49,568
27,286
125,558
170,106
(101,628)
(55,970)
12,508
23,351
2010
8.57
23.49
5.94
2.79
1.43
1.90
-
10.00
-
-
-
115,200
94,604
209,804
22,046
121,076
330,879
16,642
446,180
446,877
(70,525)
10,843
1,745,609
217,038
97,177
46,070
48,581
120,776
115,052
(40,778)
(92,724)
(18,450)
10,843
2009
All Rupees Figures are in Thousands
Rs. 000,
Rs. 000,
Rs. 000,
Rs. 000,
Rs. 000,
Rs. 000,
Rs. 000,
Rs. 000,
Rs. 000,
Rs. 000,
Rs. 000,
Rs. 000,
Rs. 000,
Rs. 000,
Rs. 000,
Rs. 000,
Rs. 000,
Rs. 000,
Rs. 000,
Rs. 000,
Rs. 000,
Rs. 000,
ANNUAL REPORT 2014
11

In m
illio
n o
f R
up
ee
s
GROSS PROFIT & RATIO TO SALES
In m
illio
n o
f R
up
ee
s
In M
illio
n o
f R
up
ee
s
SALES - NET
Year Ended Year Ended
In m
illio
n o
f R
up
ee
s
Year Ended
ADMINISTRATION & DISTRIBUTION EXPENSES & RATIO TO SALES
OPERATING LOSS & RATIO TO SALES
In m
illio
n o
f R
up
ee
s
Year Ended
Year Ended
FINANCIAL EXPENSES & RATIO TO SALES
In m
illio
n o
f R
up
ee
s
LOSS BEFORE TAX & RATIO TO SALES
Year Ended
PERFORMANCE OVERVIEW
1,745.61
2,436.42
2,957.38
3,305.49
2,926.23
2,194.03
-
500.00
1,000.00
1,500.00
2,000.00
2,500.00
3,000.00
3,500.00
Jun-09 Jun-10 Jun-11 Jun-12 Jun-13 Jun-14
217.04
265.92
366.93 404.23
291.79
204.25
12.43%
10.91%
12.41% 12.23%
9.97%9.31%
0.00%
2.00%
4.00%
6.00%
8.00%
10.00%
12.00%
14.00%
-
50.00
100.00
150.00
200.00
250.00
300.00
350.00
400.00
450.00
Jun-09 Jun-10 Jun-11 Jun-12 Jun-13 Jun-14
Gro
ss
Pro
fit
Ra
tio
139.36
189.55
259.68 313.07
389.46
265.98 7.98% 7.78%
8.78%9.47%
13.31%
12.12%
0.00%
2.00%
4.00%
6.00%
8.00%
10.00%
12.00%
14.00%
-
50.00
100.00
150.00
200.00
250.00
300.00
350.00
400.00
450.00
Jun-09 Jun-10 Jun-11 Jun-12 Jun-13 Jun-14
Gro
ss
Pro
fit
Ra
tio
77.68 89.45 127.19
112.04
(91.62)(60.61)
4.45%
3.67%4.30%
3.39%
-3.13%-2.76%
-4.00%
-3.00%
-2.00%
-1.00%
0.00%
1.00%
2.00%
3.00%
4.00%
5.00%
(150.00)
(100.00)
(50.00)
-
50.00
100.00
150.00
Jun-09 Jun-10 Jun-11 Jun-12 Jun-13 Jun-14
Op
era
tin
g P
rofi
t R
ati
o
51.11
39.88
59.71 62.52
53.06
60.25 2.93%
1.64%
2.02%1.89% 1.81%
2.75%
0.00%
0.50%
1.00%
1.50%
2.00%
2.50%
3.00%
3.50%
-
10.00
20.00
30.00
40.00
50.00
60.00
70.00
Jun-09 Jun-10 Jun-11 Jun-12 Jun-13 Jun-14
Gro
ss
Pro
fit
Ra
tio
46.07 49.57
67.49
49.52
(144.68)
(120.86)
2.64%
2.03%
2.28%
1.50%
-4.94% -5.51% -6.00%
-5.00%
-4.00%
-3.00%
-2.00%
-1.00%
0.00%
1.00%
2.00%
3.00%
4.00%
(200.00)
(150.00)
(100.00)
(50.00)
-
50.00
100.00
Jun-09 Jun-10 Jun-11 Jun-12 Jun-13 Jun-14
% o
f S
ale
s
12

In T
ho
us
an
d o
f R
up
ee
s
OPERATING FIXED ASSETS & TURNOVER
SHAREHOLDERS' EQUITY AND TOTAL DEBTS
In T
ho
us
an
d o
f R
up
ee
s
Year Ended
In T
ho
us
an
d o
f R
up
ee
s
PAID-UP SHARE CAPITAL
Year Ended
Year Ended
ORDINARY SHARE CAPITAL & BASIC EARNING / (LOSS) PER SHARE
In T
ho
us
an
d o
f R
up
ee
s
Year Ended
In m
illio
n o
f R
up
ee
s
LOSS AFTER TAX & NET LOSS MARGIN
Year Ended
APPLICATION OF REVENUE
0.00%
5.00%
10.00%
15.00%
20.00%
25.00%
30.00%
35.00%
40.00%
45.00%
Ra
w M
ate
rial
Pa
ckin
g M
ate
rial
Milk
Co
llectio
n e
xp
en
se
Sta
ff Co
sts
Sto
re c
on
su
mp
tion
Fa
cto
ry O
ve
rhe
ad
s
Insu
ran
ce
Ba
nks / F
Is
Ad
min
Exp
en
se
s
Dis
tribu
tion
exp
en
se
s
Oth
er o
pe
ratin
g
48.58
27.29 41.55 36.00
(127.94)
(142.05)
2.78%
1.12%1.41%
1.09%
-4.37%
-6.47%
-8.00%
-6.00%
-4.00%
-2.00%
0.00%
2.00%
4.00%
(200.00)
(150.00)
(100.00)
(50.00)
-
50.00
100.00
Jun-09 Jun-10 Jun-11 Jun-12 Jun-13 Jun-14
Ne
t P
rofi
t M
arg
in (
%)
43,200 43,200
126,720 126,720
139,392 139,392 139,392 6.94
8.57
2.15 3.28
2.58
(9.18)(10.19)
(15.00)
(10.00)
(5.00)
-
5.00
10.00
-
20,000
40,000
60,000
80,000
100,000
120,000
140,000
160,000
Jun-08 Jun-09 Jun-10 Jun-11 Jun-12 Jun-13 Jun-14
Ba
sic
Ea
rnin
g / (
Lo
ss
) p
er
Sh
are
(R
s)
115,200 115,200
126,720 126,720
139,392 139,392 139,392
-
20,000
40,000
60,000
80,000
100,000
120,000
140,000
160,000
Jun-08 Jun-09 Jun-10 Jun-11 Jun-12 Jun-13 Jun-14 -
100,000
200,000
300,000
400,000
500,000
600,000
700,000
800,000
900,000
2008 2009 2010 2011 2012 2013 2014
Series1
Series2
422,206 446,180
503,510
565,924
636,753 645,047
576,928
3.83 3.91
4.84
5.23 5.19
4.54
3.80
-
1.00
2.00
3.00
4.00
5.00
6.00
-
100,000
200,000
300,000
400,000
500,000
600,000
700,000
Jun-08 Jun-09 Jun-10 Jun-11 Jun-12 Jun-13 Jun-14
Fix
ed
As
se
ts T
urn
ov
er
(Tim
es
)
ANNUAL REPORT 2014
13

THE COMPANIES ORDINANCE, 1984 FORM 34
PATTERN OF SHAREHOLDING - ORDINARY SHARES
1. Incorporation No. : 0002355
2. Name of the Company : NOON PAKISTAN LIMITED
3. Pattern of holding of the shares
held by the shareholders as at : 30-06-2014
4.
5. SHARES HELD PERCENTAGE
5.1 Directors, Chief Executive, Officers and
their spouse and minor children 3,888,096 74.38
5.2 Associated Companies, undertakings
and related parties - -
5.3 NIT - -
IDBP (ICP UNIT) 10,249 0.20
5.4 Banks, Development Financial Inst.
Non Banking Financial Institutions. 218,119 4.17
5.5 Insurance Companies 72 0.00
5.6 Modarabas and Mutual Funds - -
5.7 Shareholders holding 5% and more
Malik Adnan Hayat Noon 2,556,200 48.90
Mr. Salman Hayat Noon 1,331,174 25.47
Amina Wadalawala 423,000 8.09
5.8 General Public
a. Local 847,839 16.22
b. Foreign 219,542 4.20
5.9 OTHERS (Joint stock / investment
Companies / Coop Societies etc.) 43,283 0.83
6. Signature of Secretary
7. Name of Signatory
8. Designation
9. CNIC Number
10. Date
Syed Anwar Ali
Company Secretary
35200-2711479-3
30 June, 2014
Number of Shareholding Total Shares Percentage
Shareholders From To
560 1 100 33,517 0.64
157 101 500 42,781 0.82
63 501 1,000 41,487 0.79
63 1,001 5,000 112,031 2.14
9 5,001 10,000 67,775 1.30
4 10,001 15,000 47,847 0.92
1 15,001 20,000 15,681 0.30
1 20,001 25,000 20,603 0.39
2 25,001 30,000 51,381 0.98
1 30,001 35,000 31,500 0.60
1 45,001 50,000 45,998 0.88
1 85,001 90,000 88,000 1.68
1 120,001 125,000 121,028 2.32
1 215,001 220,000 217,800 4.17
1 420,001 425,000 423,000 8.09
1 1,330,001 1,335,000 1,331,174 25.47
1 2,535,001 2,540,000 2,535,597 48.51
868 5,227,200 100.00
CATEGORIES OF SHAREHOLDERS
14

THE COMPANIES ORDINANCE 1984 FORM 34
PATTERN OF SHAREHOLDING - NON-VOTING ORDINARY SHARES
1. Incorporation No. : 0002355
2. Name of the Company : NOON PAKISTAN LIMITED
3. Pattern of holding of the shares
held by the shareholders as at : 30-06-2014
4.
6. Signature of Secretary
7. Name of Signatory
8. Designation
9. CNIC Number
10. Date
Syed Anwar Ali
Company Secretary
35200-2711479-3
30 June, 2014
Number of Shareholding Total Shares Percentage
Shareholders From To
22 1 100 467 0.01
22 101 500 6,712 0.08
49 501 1,000 42,588 0.49
41 1,001 5,000 111,048 1.27
3 5,001 10,000 25,470 0.29
6 10,001 15,000 75,042 0.86
3 15,001 20,000 53,723 0.62
1 20,001 25,000 23,705 0.27
1 25,001 30,000 27,500 0.32
1 30,001 35,000 34,339 0.39
1 40,001 45,000 43,560 0.50
1 90,001 95,000 90,616 1.04
1 95,001 100,000 98,704 1.13
1 145,001 150,000 146,410 1.68
1 385,001 390,000 388,000 4.45
1 475,001 480,000 477,950 5.49
1 525,001 530,000 528,500 6.07
1 725,001 730,000 729,666 8.38
1 1,205,001 1,210,000 1,210,000 13.89
1 2,175,001 2,180,000 2,178,000 25.00
1 2,415,001 2,420,000 2,420,000 27.78
160 8,712,000 100.00
5. SHARES HELDPERCENTAGE
5.1 Directors, Chief Executive, Officers and
their spouse and minor children 764,876 8.78
5.2 Associated Companies, undertakings
and related parties 4,107,950 47.15
5.3 NIT - -
ICP - -
5.4 Banks, Development Financial Inst.
Non Banking Financial Institutions. 2,178,000 25.00
5.5 Insurance Companies - -
5.6 Modarabas and Mutual Funds - -
5.7 Shareholders holding 5%
2,420,000 27.78
BHF-BANK (SWITZERLAND) LTD 2,178,000 25.00
Noon Pakistan Ltd. - Staff Provident Fund 1,210,000 13.89
Mr. Salman Hayat Noon 729,666 8.38
TUNDRA PAKISTAN FOND 528,500 6.07
NOON SUGAR MILLS EMPLOYEES' PROVIDENT FUND TRUST 477,950 5.49
5.8 General Public
a. Local 1,020,594 11.71
b. Foreign 2,706,500 31.07
5.9 OTHERS (Joint Stock / Investment
Companies, Coop. Societies, Trusts etc.) 640,580 7.35
CATEGORIES OF SHAREHOLDERS
Noon Sugar Mills Limited
ANNUAL REPORT 2014
15

AUDITORS' REVIEW REPORT TO THE MEMBERS ON STATEMENT OF COMPLIANCE WITH BEST PRACTICES OF THE CODE OF CORPORATE GOVERNANCE
We have reviewed the enclosed Statement of Compliance with the best practices contained in the Code of Corporate Governance (the
Code) prepared by the Board of Directors of NOON PAKISTAN LIMITED (the Company) for the year ended June 30, 2014 to comply with
the requirements of Listing Regulation No.35 of the Karachi Stock Exchange where the Company is listed.
The responsibility for compliance with the Code is that of the Board of Directors of the Company. Our responsibility is to review, to the extent
where such compliance can be objectively verified, whether the Statement of Compliance reflects the status of the Company's compliance
with the provisions of the Code and report if it does not and to highlight any non-compliance with the requirements of the Code. A review is
limited primarily to inquiries of the Company's personnel and review of various documents prepared by the Company to comply with the
Code.
As part of our audit of the financial statements we are required to obtain an understanding of the accounting and internal control systems
sufficient to plan the audit and develop an effective audit approach. We are not required to consider whether the Board of Directors'
statement on internal control covers all risks and controls or to form an opinion on the effectiveness of such internal controls, the
Company's corporate governance procedures and risks.
The Code requires the Company to place before the Audit Committee, and upon recommendation of the Audit Committee, place before the
Board of Directors for their review and approval its related party transactions distinguishing between transactions carried-out on terms
equivalent to those that prevail in arm's length transactions and transactions which are not executed at arm's length price and recording
proper justification for using such alternate pricing mechanism. We are only required and have ensured compliance of this requirement to
the extent of the approval of the related party transactions by the Board of Directors upon recommendation of the Audit Committee. We
have not carried-out any procedures to determine whether the related party transactions were undertaken at arm's length price or not.
Based on our review, except for the fact that paragraph 9 of the Statement of Compliance states that the two Directors of the Company have
not attended orientation course as required by clause (xi) of the Code, nothing has come to our attention which causes us to believe that the
Statement of Compliance does not appropriately reflect the Company's compliance, in all material respects, with the best practices
contained in the Code as applicable to the Company for the year ended June 30, 2014.
HAMEED CHAUDHRI & CO.,LAHORE: CHARTERED ACCOUNTANTS
Engagement Partner: Osman Hameed Chaudhri
October 03, 2014.
16


AUDITORS' REPORT TO THE MEMBERS
We have audited the annexed balance sheet of Noon Pakistan Limited (the Company) as at June 30, 2014 and the related profit and loss account, statement of comprehensive income, cash flow statement and statement of changes in equity together with the notes forming part thereof, for the year then ended and we state that we have obtained all the information and explanations which, to the best of our knowledge and belief, were necessary for the purposes of our audit.
It is the responsibility of the Company's management to establish and maintain a system of internal control, and prepare and present the above said statements in conformity with the approved accounting standards and the requirements of the Companies Ordinance, 1984. Our responsibility is to express an opinion on these statements based on our audit.
We conducted our audit in accordance with the auditing standards as applicable in Pakistan. These standards require that we plan and perform the audit to obtain reasonable assurance about whether the above said statements are free of any material misstatement. An audit includes examining, on a test basis, evidence supporting the amounts and disclosures in the above said statements. An audit also includes assessing the accounting policies and significant estimates made by management, as well as, evaluating the overall presentation of the above said statements. We believe that our audit provides a reasonable basis for our opinion and, after due verification, we report that:
(a) in our opinion, proper books of account have been kept by the Company as required by the Companies Ordinance, 1984;
(b) in our opinion:
(i) the balance sheet and profit and loss account together with the notes thereon have been drawn up in conformity with the Companies Ordinance, 1984, and are in agreement with the books of account and are further in accordance with accounting policies consistently applied;
(ii) the expenditure incurred during the year was for the purpose of the Company's business; and
(iii) the business conducted, investments made and the expenditure incurred during the year were in accordance with the objects of the Company;
(c) in our opinion and to the best of our information and according to the explanations given to us, the balance sheet, profit and loss account, statement of comprehensive income, cash flow statement and statement of changes in equity together with the notes forming part thereof conform with approved accounting standards as applicable in Pakistan, and, give the information required by the Companies Ordinance, 1984, in the manner so required and respectively give a true and fair view of the state of the Company's affairs as at June 30, 2014 and of the loss, its total comprehensive loss, its cash flows and changes in equity for the year then ended; and
(d) in our opinion, no zakat was deductible at source under the Zakat and Ushr Ordinance, 1980 (XVIII of 1980).
HAMEED CHAUDHRI & CO.,LAHORE CHARTERED ACCOUNTANTSEngagement Partner: Osman Hameed Chaudhri
: October 03, 2014.
ANNUAL REPORT 2014
19

BALANCE SHEET
20
Chief Executive
SALMAN HAYAT NOON
Director
MIRZA SHOAIB BAIG
2014 2013
Note
5.1 395,000,000 215,000,000
5.2 139,392,000 139,392,000
(97,386,012) 37,317,670
42,005,988 176,709,670
6 47,604,856 54,816,453
7 - 57,097
8 22,055,554 120,305,555
9 200,000,000 7,000,000
10 140,000,000 70,000,000
11 5,592,732 14,661,258
367,648,286 211,966,813
12 530,644,439 602,941,907
13 14,682,942 11,863,865
14 251,459,575 209,651,291
15 143,420,415 99,311,419
16 21,058,199 8,010,475
17 974,603 1,014,646
962,240,173 932,793,603
18
- - - - Rupees - - - -
1,419,499,303 1,376,343,636
Equity and Liabilities
Share Capital and Reserves
Authorised capital
Issued, subscribed and paid-up capital
(Accumulated loss) / unappropriated profit
Surplus on revaluation of property, plant
and equipment
Deferred income
Non-current Liabilities
Term finances
Islamic finances
Loans from chief executive and a director
Liabilities against assets subject to
finance lease
Current Liabilities
Trade and other payables
Accrued mark-up and interest
Short term finances
Current portion of non-current liabilities
Taxation
Dividends
Contingencies and commitments
The annexed notes form an integral part of these financial statements.
- -

Director
MIRZA SHOAIB BAIG
AS AT 30 JUNE, 2014
ANNUAL REPORT 2014
21
Chief Executive
SALMAN HAYAT NOON
2014 2013
Note
19 576,927,727 645,046,579
20 1,608,013 38,684
1,083,686 1,083,686
21 1,598,003 1,598,003
581,217,429 647,766,952
22 129,749,621 166,214,439
23 62,365,000 73,860,000
221,612,937 176,824,316
24 15,135,662 10,676,981
25 14,622,108 13,167,810
26 554,641 422,866
1,670,968 778,630
27 137,789 172,134
127,911,011 160,019,049
46,398,333 46,049,969
Assets
Non-current Assets
Property, plant and equipment
Intangible assets
Security deposits
Deferred taxation - net
Current Assets
Stores, spares and loose tools
Stock-in-trade
Trade debts - unsecured considered good
Loans and advances
Deposits and prepayments
Due from Associated Companies
Accrued profit on term deposit receipts
Other receivables
Sales tax refundable
Advance income tax, tax deducted
at source and income tax refundable
Cash and bank balances 28 218,123,804 80,390,490
838,281,874 728,576,684
- - - - Rupees - - - -
1,419,499,303 1,376,343,636

2014 2013
Sales
Cost of sales
Gross profit
Distribution cost
Administrative expenses
Other income
Other expenses
Loss from operations
Finance cost
Loss before taxation
Taxation
Loss after taxation
Loss per share - basic and diluted
Note
29
30
31
32
33
34
35
36
37
- - - - Rupees - - - -
2,194,025,058
(1,989,779,487)
204,245,571
(154,831,842)
(111,152,490)
17,926,884
(16,794,113)
(60,605,990)
(60,251,090)
(120,857,080)
(21,198,765)
(142,055,845)
(10.19)
2,926,229,224
(2,634,441,378)
291,787,846
(307,287,322)
(82,174,916)
10,560,233
(4,509,697)
(91,623,856)
(53,059,821)
(144,683,677)
16,747,377
(127,936,300)
(9.18)
The annexed notes form an integral part of these financial statements.
PROFIT AND LOSS ACCOUNTFOR THE YEAR ENDED 30 JUNE, 2014
Chief Executive
SALMAN HAYAT NOON
Director
MIRZA SHOAIB BAIG
22

STATEMENT OF COMPREHENSIVE INCOMEFOR THE YEAR ENDED 30 JUNE, 2014
2014
Rupees
(142,055,845)
-
(142,055,845)
2013
Rupees
(127,936,300)
-
(127,936,300)
Loss for the Year after Taxation
Other Comprehensive Income for the year
Total Comprehensive loss for the Year
The annexed notes form an integral part of these financial statements.
23
ANNUAL REPORT 2014
Chief Executive
SALMAN HAYAT NOON
Director
MIRZA SHOAIB BAIG

CASH FLOW STATEMENTFOR THE YEAR ENDED 30 JUNE, 2014
24
Cash flow from operating activities
Loss for the year - before taxation
Adjustments for non-cash charges and other items:
Depreciation
Amortisation of intangible assets
Gain on disposal of property, plant and equipment
Loss on sale and lease-back of vehicle
Finance cost
Prior years' sales tax
Trade debts written-off
Provision for obsolete store items
Deferred income recognised
Profit on PLS account and term deposit receipts
Exchange fluctuation loss
Profit / (loss) before working capital changes
Effect on cash flow due to working capital changes
(Increase) / decrease in current assets:
Stores, spares and loose tools
Stock-in-trade
Trade debts
Loans and advances
Deposits and prepayments
Due from Associated Companies
Other receivables
Sales tax refundable
(Decrease) / increase in trade and other payables
Cash (used in) / generated from operations
Income tax paid
Net cash used in operating activities
Cash flow from investing activities
Purchase of property, plant and equipment
Purchase of intangible assets
Sale proceeds from disposal of property, plant and equipment
Security deposits
Profit on PLS account and term deposit receipts received
Net cash generated from / (used in) investing activities
- - - - Rupees - - - -
(120,857,080)
62,774,440
414,531
(4,153,936)
299,152
60,251,090
1,491,625
10,395,385
4,600,951
(57,097)
(3,623,381)
-
11,535,680
31,863,867
11,495,000
(55,184,006)
(4,458,681)
(1,454,298)
(131,775)
34,345
30,616,413
(72,297,468)
(59,516,603)
(47,980,923)
(8,358,839)
(56,339,762)
(11,439,096)
(1,983,860)
26,442,512
-
2,731,043
15,750,599
2014 2013
(144,683,677)
63,706,346
77,340
(201,620)
-
53,059,821
-
-
-
(206,423)
(414,054)
4,252,697
(24,409,570)
41,544,629
124,325,000
(67,804,980)
(1,179,705)
2,728,854
145,605
(1,775)
(92,024,337)
26,397,520
34,130,811
9,721,241
(24,474,036)
(14,752,795)
(72,130,998)
-
333,173
135,000
8,054
(71,654,771)
Chief Executive
SALMAN HAYAT NOON
Director
MIRZA SHOAIB BAIG
25
ANNUAL REPORT 2014
- - - - Rupees - - - -
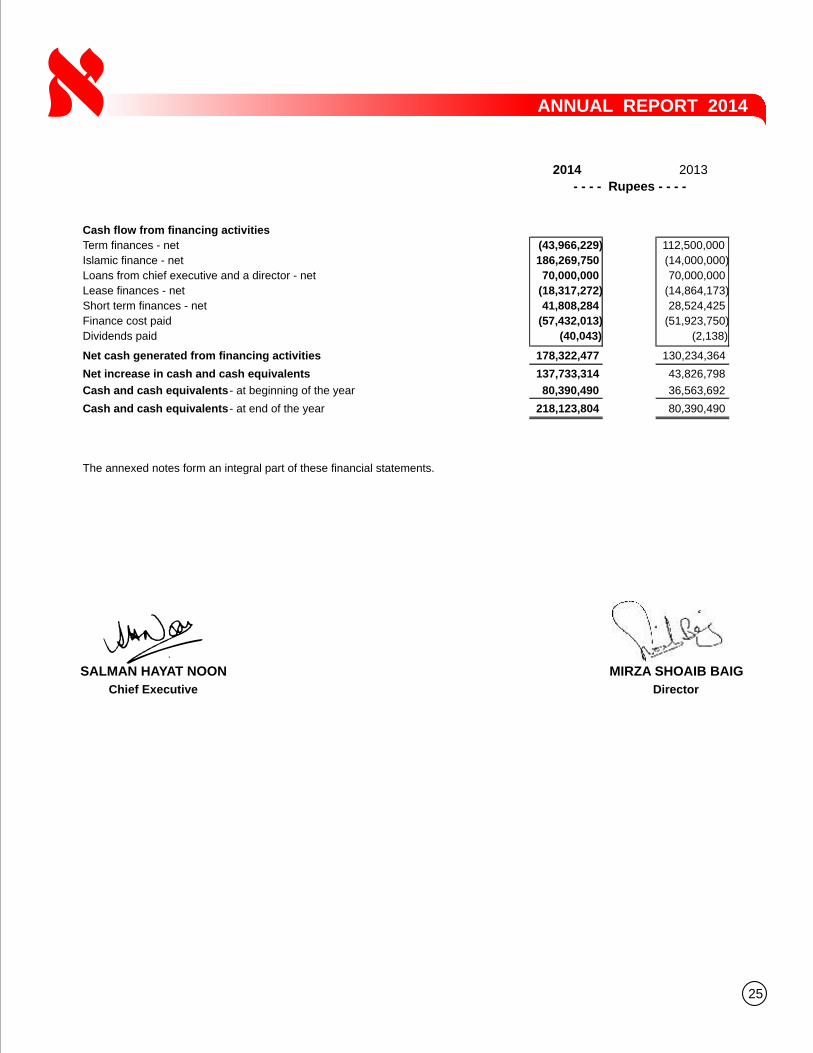
2014 2013
Cash flow from financing activities
Term finances - net
Islamic finance - net
Loans from chief executive and a director - net
Lease finances - net
Short term finances - net
Finance cost paid
Dividends paid
Net cash generated from financing activities
Net increase in cash and cash equivalents
Cash and cash equivalents - at beginning of the year
Cash and cash equivalents - at end of the year
The annexed notes form an integral part of these financial statements.
(43,966,229)
186,269,750
70,000,000
(18,317,272)
41,808,284
(57,432,013)
(40,043)
178,322,477
137,733,314
80,390,490
218,123,804
112,500,000
(14,000,000)
70,000,000
(14,864,173)
28,524,425
(51,923,750)
(2,138)
130,234,364
43,826,798
36,563,692
80,390,490
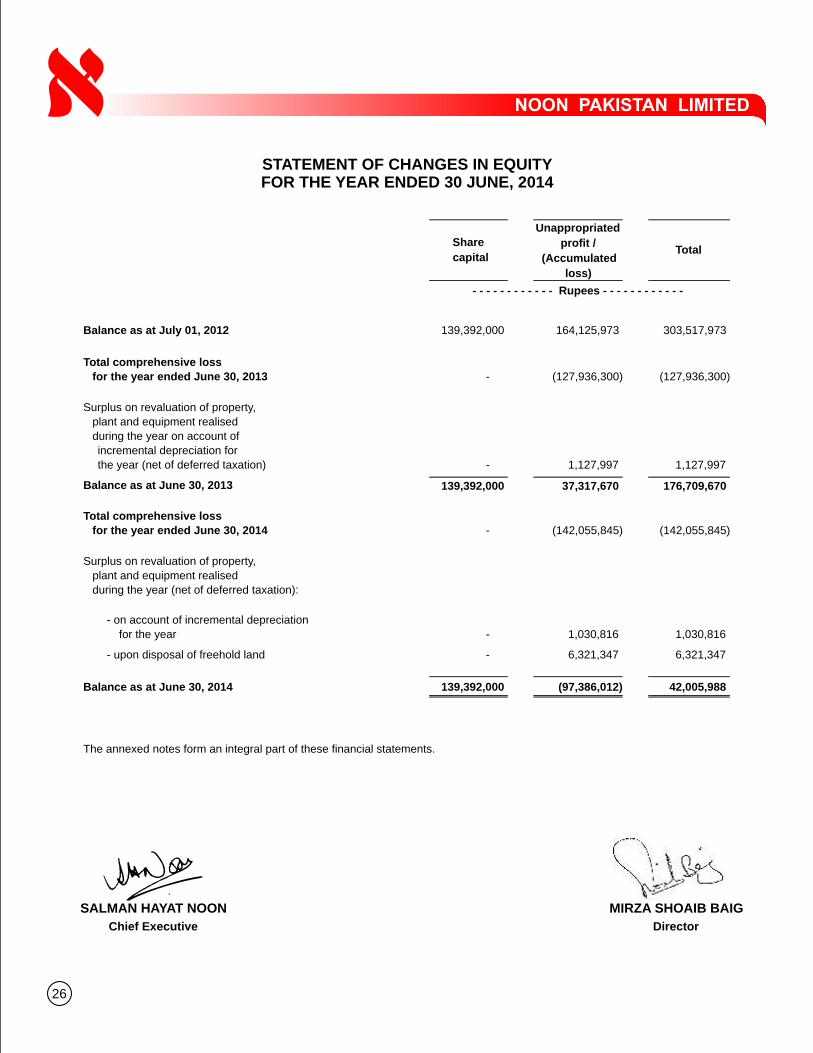
STATEMENT OF CHANGES IN EQUITYFOR THE YEAR ENDED 30 JUNE, 2014
26
Chief Executive
SALMAN HAYAT NOON
Director
MIRZA SHOAIB BAIG
Balance as at July 01, 2012
Total comprehensive loss
for the year ended June 30, 2013
Surplus on revaluation of property,
plant and equipment realised
during the year on account of
incremental depreciation for
the year (net of deferred taxation)
Balance as at June 30, 2013
Total comprehensive loss
for the year ended June 30, 2014
Surplus on revaluation of property,
plant and equipment realised
during the year (net of deferred taxation):
- on account of incremental depreciation
for the year
- upon disposal of freehold land
Balance as at June 30, 2014
The annexed notes form an integral part of these financial statements.
- - - - - - - - - - - - Rupees - - - - - - - - - - - -
139,392,000
-
-
139,392,000
-
-
-
139,392,000
Share
capital
164,125,973
(127,936,300)
1,127,997
37,317,670
(142,055,845)
1,030,816
6,321,347
(97,386,012)
Unappropriated
profit /
(Accumulated
loss)
303,517,973
(127,936,300)
1,127,997
176,709,670
(142,055,845)
1,030,816
6,321,347
42,005,988
Total

27
ANNUAL REPORT 2014
NOTES TO THE FINANCIAL STATEMENTSFOR THE YEAR ENDED 30 JUNE, 2014
1. LEGAL STATUS AND NATURE OF BUSINESS
Noon Pakistan Limited (the Company) was incorporated in Pakistan on September 26, 1966 as a Public Company and its shares are quoted on Karachi and Lahore Stock Exchanges. It is principally engaged in processing and sale of toned milk, milk powder, fruit juices, allied dairy and food products. The registered office of the Company is situated at 66 Garden Block, New Garden Town, Lahore and the plant is located at Bhalwal, District Sargodha.
2. BASIS OF PREPARATION
2.1 Statement of complianceThese financial statements have been prepared in accordance with the requirements of the Companies Ordinance, 1984 (the Ordinance), directives issued by the Securities and Exchange Commission of Pakistan (SECP) and the approved accounting standards as applicable in Pakistan. Approved accounting standards comprise of such International Financial Reporting Standards (IFRSs) issued by the International Accounting Standards Board as are notified under the provisions of the Ordinance. Wherever, the requirements of the Ordinance or directives issued by the SECP differ with the requirements of these standards, the requirements of the Ordinance or requirements of the said directives have been followed.
2.2 Basis of measurementThese financial statements have been prepared under the historical cost convention except for certain operating fixed assets which have been included at their revalued amounts.
2.3 Functional and presentation currencyThe financial statements are presented in Pakistan Rupees, which is the Company's functional and presentation currency.
2.4 Initial application of standards, amendments or an interpretation to existing standards
2.4.1 Standards, interpretations and amendments to published approved accounting standards that are effective and relevantThere are no amended standards and interpretations that are effective for the first time in the current financial year that would be expected to have a material impact on the Company's financial statements.
2.4.2 Standards, interpretations and amendments to published approved accounting standards that are effective but not relevantThe other new standards, amendments to approved accounting standards and interpretations that are mandatory for the accounting periods beginning on July 1, 2013 are considered not to be relevant or to have any significant effect on the Company's financial reporting and operations.
2.4.3 Standards, interpretations and amendments to published approved accounting standards that are not yet effective and have not been early adopted by the CompanyThe following new standards and amendments to published standards are not effective for the financial year beginning on or after July 01, 2013 and have not been early adopted by the Company:
(a) IFRS 9, ‘Financial instruments’ (effective for periods beginning on or after January 01, 2018). IFRS 9 replaces the parts of IAS 39, ‘Financial instruments: recognition and measurement’ that relate to classification and measurement of financial instruments. IFRS 9 requires financial assets to be classified into two measurement categories; those measured at fair value and those measured at amortised cost. The determination is made at initial recognition. For financial liabilities, the standard retains most of the requirements of IAS 39. The Company is yet to assess the full impact of IFRS 9; however, initial indications are that it may not significantly affect the Company's financial assets.
(b) IAS 32 (Amendment), ‘Financial instruments: Presentation’ (effective for periods beginning on or after January 01, 2014). This amendment updates the application guidance in IAS 32, ‘Financial instruments: Presentation’, to clarify some of the requirements for offsetting financial assets and financial liabilities on the balance sheet. The amendment does not have any significant impact on the Company’s financial statements.
(c) IAS 36 (Amendment) 'Impairment of Assets', is applicable on accounting periods beginning on or after January 01, 2014. This
28
amendment addresses the disclosure of information about the recoverable amount of impaired assets if that amount is based on fair value less costs of disposal. The Company shall apply this amendment from July 01, 2014 and this will only affect the disclosures in the Company's financial statements in the event of impairment.
There are number of other standards, amendments and interpretations to the published standards that are not yet effective and are also not relevant to the Company and therefore have not been presented here.
3. USE OF ESTIMATES AND JUDGMENTS
The preparation of financial statements in conformity with approved accounting standards requires management to make judgments, estimates and assumptions that affect the application of accounting policies and the reported amounts of assets, liabilities, income and expenses. Actual results may differ from these estimates.
Estimates and judgments are continually evaluated and are based on historical experience and other factors, including expectations of future events that are believed to be reasonable under the circumstances. The Company makes estimates and assumptions concerning the future. The resulting accounting estimates will, by definition, seldom equal the related actual results. However, such differences are estimated to be insignificant and hence will not affect the true and fair presentation of the financial statements. The assumptions are reviewed on an ongoing basis. Revisions to accounting estimates are recognised in the period in which the estimates are revised and in any future periods affected. Judgments made by management in application of the approved accounting standards that have significant effect on the financial statements and estimates with a significant risk of material adjustments in the next year are discussed in respective policy note. The areas where various assumptions and estimates are significant to the Company's financial statements or where judgments were exercised in application of accounting policies are as follows:
(a) Provision for taxation (note 4.4)
In making the estimate for income taxes payable by the Company, the management looks at the applicable law and decisions of appellate authorities on certain issues in the past.
(b) Property, plant and equipment (note 4.6)
The Company reviews appropriateness of the rates of depreciation, useful lives and residual values for calculation of depreciation on an on-going basis. Further, where applicable, an estimate of recoverable amount of asset is made if indicators of impairment are identified.
(c) Stores & spares and stock-in-trade (note 4.9 and 4.10)
he Company estimates the net realisable value of stores and spares and stock-in-trade to assess any diminution in the respective carrying values. Net realisable value is determined with reference to estimated selling price less estimated expenditure to make sale.
(d) Provision for impairment of trade debts (note 4.11)
The Company assesses the recoverability of its trade debts if there is objective evidence that the Company will not be able to collect all the amount due according to the original terms. Significant financial difficulties of the debtors, probability that the debtor will enter bankruptcy and default or delinquency in payments are considered indications that the trade debt is impaired.
4. SIGNIFICANT ACCOUNTING POLICIES
The principal accounting policies applied in the preparation of these financial statements are set out below. These policies have been consistently applied to all the years presented, unless otherwise stated.
4.1 Borrowings and borrowing cost
(a) Borrowings are recognised initially at fair value, net of transaction costs incurred and are subsequently measured at amortised cost using the effective interest rate method. Borrowings are classified as current liabilities unless the Company has an unconditional / contractual right to defer settlement of the liability for at least twelve months after the balance sheet date.
(b) Borrowing costs that are directly attributable to the acquisition, construction or production of an asset that necessarily takes a substantial period of time to get ready for its intended use or sale are capitalised as part of the cost of the respective assets. All other borrowing costs are expensed-out in the period they occur. Borrowing costs consist of interest and other costs that an entity incurs in connection with the borrowing of funds.
29
ANNUAL REPORT 2014
4.2 Staff retirement benefits (defined contribution plan)
The Company is operating a provident fund scheme for all its employees since May 01, 1986; contribution to the fund is made monthly at the rate of 10% of the basic salaries both by the employees and the Company.
4.3 Trade and other payables
Liabilities for trade and other payables are carried at cost, which is the fair value of consideration to be paid in the future for goods and services received, whether or not billed to the Company.
4.4 Taxation
(a) Current and prior year
Provision for current year's taxation is determined in accordance with the prevailing law of taxation on income enacted or substantively enacted by the end of the reporting period and is based on current rates of taxation being applied on the taxable income for the year, after taking into account tax credits and rebates available, if any, and taxes paid under the Final Tax Regime. The tax charge also includes adjustments, where necessary, relating to prior years which arise from assessments finalised during the year.
(b) Deferred
The Company accounts for deferred taxation using the balance sheet liability method on temporary differences arising between the tax base of assets and liabilities and their carrying amounts in the financial statements. Deferred tax liability is recognised for taxable temporary differences and deferred tax asset is recognised to the extent that it is probable that taxable profits will be available against which the deductible temporary differences, unused tax losses and tax credits can be utilised. Deferred tax is charged or credited to the profit and loss account except for deferred tax arising on surplus on revaluation of property, plant and equipment, which is charged to revaluation surplus.
Deferred tax is measured at the tax rates that are expected to be applied to the temporary differences when they reverse, based on the laws that have been enacted or substantively enacted by the reporting date.
Deferred tax assets are reviewed at each reporting date and are reduced to the extent that it is no longer probable that the related tax benefit will be realised.
4.5 Dividend and appropriation to reserves
Dividend distribution to the Company's shareholders and appropriation to reserves are recognised in the period in which these are approved.
4.6 Property, plant and equipment and depreciation
Operating fixed assets
Freehold land, buildings on freehold land, plant & machinery, electric & gas installations and other works equipment are shown at fair value, based on valuations carried-out with sufficient regularity by external independent Valuers less subsequent depreciation. Any accumulated depreciation at the date of revaluation is eliminated against the gross carrying amount of the asset, and the net amount is restated to the revalued amount of the asset. The remaining operating fixed assets are stated at historical cost less accumulated depreciation. Historical cost includes expenditure that is directly attributable to the acquisition of items. Cost of some items of plant and machinery consists of historical cost and exchange fluctuation effects on foreign currency loans capitalised during prior year. Borrowing cost are also capitalised for the period upto the date of commissioning of the respective assets, acquired out of proceeds of such borrowings.
Subsequent costs are included in the asset's carrying amount or recognised as a separate asset, as appropriate, only when it is probable that future economic benefits associated with the item will flow to the Company and the cost of the item can be measured reliably. All other repairs and maintenance are charged to income during the financial year in which these are incurred.
Depreciation on operating fixed assets, except freehold land, is charged to income applying reducing balance method so as to write-off the depreciable amount of an asset over its remaining useful life at the rates stated in note 19. The assets' residual values and useful lives are reviewed at each financial year-end and adjusted if impact on depreciation is significant.
Depreciation on additions to operating fixed assets is charged from the month in which an asset is acquired or capitalised while no depreciation is charged for the month in which the asset is disposed-off.

30
Gain / loss on disposal of operating fixed assets, if any, is taken to profit and loss account.
Capital work-in-progress
Capital work-in-progress is stated at cost less any identified impairment loss.
4.7 Intangible assets
Computer software is stated at cost less accumulated amortisation. Software cost is only capitalised when it is probable that future economic benefits attributable to the software will flow to the Company and the same is amortised applying the straight-line method at the rate stated in note 20.
4.8 Assets subject to finance lease
Leases where the Company has substantially all the risks and rewards of ownership are classified as finance leases. Assets subject to finance lease are initially recognised at the lower of present value of minimum lease payments under the lease agreements and the fair value of assets. Subsequently these assets are stated at cost less accumulated depreciation and any identified impairment loss.
The related rental obligations, net of finance charges, are included in liabilities against assets subject to finance lease. The liabilities are classified as current and long-term depending upon the timing of payment.
Each lease payment is allocated between the liability and finance charges so as to achieve a constant rate on the balance outstanding. The interest element of the rental is charged to profit over the lease term.
Depreciation on assets subject to finance lease is charged to income at the rate stated in note 19 applying reducing balance method to write-off the cost of the asset over its estimated remaining useful life in view of certainty of ownership of assets at the end of lease period.
Depreciation on additions to leased assets is charged from the month in which an asset is acquired while no depreciation is charged for the month in which the asset is disposed-off.
Finance cost and depreciation on leased assets are charged to income currently.
4.9 Stores, spares and loose tools
Stores, spares and loose tools are stated at the lower of cost and net realisable value. The cost of inventory is based on moving average cost. Items in transit are stated at cost accumulated upto the balance sheet date. The Company reviews the carrying amount of stores, spares and loose tools on a regular basis and provision is made for identified obsolete and slow moving items.
4.10 Stock-in-trade
Basis of valuation are as follows:
Particulars Mode of valuationWork-in-process -At cost.Finished products'A' grade -At lower of cost and net realisable value.'B' grade -At estimated realisable value.
- Cost in relation to work-in-process and finished goods represents annual average cost which consists of prime cost and appropriate manufacturing overheads.
- Net realisable value signifies the selling price in the ordinary course of business less cost of completion and cost necessary to be incurred to effect such sale.
4.11 Trade debts and other receivables
Trade debts are initially recognised at original invoice amount, which is the fair value of consideration to be received in future and subsequently measured at cost less provision for doubtful debts, if any. Carrying amounts of trade debts and other receivables are assessed at each reporting date and a provision is made for doubtful debts and receivables when collection of the amount is no longer probable. Debts and receivables considered irrecoverable are written-off.
31
ANNUAL REPORT 2014
4.12 Cash and cash equivalents
Cash and cash equivalents are carried in the balance sheet at cost. For the purpose of cash flow statement, cash and cash equivalents comprise of cash-in-hand and balances at banks.
4.13 Provisions
Provisions are recognised when the Company has a present legal or constructive obligation as a result of past events and it is probable that an outflow of resources embodying economic benefits will be required to settle the obligation and a reliable estimate of the obligation can be made. Provisions are reviewed at each balance sheet date and adjusted to reflect the current best estimate.
4.14 Impairment loss
The carrying amounts of the Company's assets are reviewed at each balance sheet date to identify circumstances indicating occurrence of impairment loss or reversal of provisions for impairment losses. If any indications exist, the recoverable amounts of such assets are estimated and impairment losses or reversals of impairment losses are recognised in the profit and loss account. Reversal of impairment loss is restricted to the original cost of the asset.
4.15 Foreign currency translation
Transactions in foreign currencies are translated in Pak Rupees using the exchange rates prevailing at the dates of transactions. Monetary assets and liabilities denominated in foreign currencies are translated in Pak Rupees at the exchange rates prevailing at the balance sheet date. Exchange gains and losses are taken to profit and loss account.
4.16 Financial instruments
Financial assets and financial liabilities are recognised at the time when the Company becomes a party to the contractual provisions of the instrument and derecognised when the Company loses control of contractual rights that comprise the financial assets and in the case of financial liabilities when the obligation specified in the contract is discharged, cancelled or expired. Any gain or loss on derecognition of financial assets and financial liabilities is included in the profit and loss account for the year.
Financial instruments carried on the balance sheet include deposits, trade debts, due from Associated Companies, accrued profit, other receivables, bank balances, term finances, musharakah finance, loans from chief executive and a director, liabilities against assets subject to finance lease, trade & other payables, accrued mark-up & interest and short term finances. All financial assets and liabilities are initially measured at cost, which is the fair value of consideration given and received respectively. These financial assets and liabilities are subsequently measured at fair value or cost as the case may be. The particular recognition methods adopted are disclosed in the individual policy statements associated with each item.
4.17 Off-setting of financial assets and liabilities
Financial assets and liabilities are off-set and the net amount is reported in the financial statements only when there is a legally enforceable right to set-off the recognised amounts and the Company intends either to settle on a net basis or to realise the assets and to settle the liabilities simultaneously.
4.18 Revenue recognition
Revenue is recognised to the extent that it is probable that the economic benefits will flow to the Company and the amount of revenue can be measured reliably. Revenue is measured at the fair value of consideration received or receivable on the following basis:
- sales are recognised on dispatch of goods to customers.- return on deposits / saving accounts is accounted for on `accrual basis'.
4.19 Segment reporting
Segment information is presented on the same basis as that used for internal reporting purposes by the Chief Operating Decision Maker, who is responsible for allocating resources and assessing performance of the operating segments. On the basis of its internal reporting structure, the Company considers itself to be a single reportable segment; however, certain information as required by the approved accounting standards, is presented in note 44 to these financial statements.

5. SHARE CAPITAL
32
6. SURPLUS ON REVALUATION OF PROPERTY, PLANT AND EQUIPMENT - Net
This represents surplus over book values resulting from revaluation of freehold land, buildings on freehold land, plant and machinery, electric and gas installations and other works equipment during the financial years 1999 and 2011 adjusted by surplus realised on disposal of revalued assets, incremental depreciation arising out of revaluation and deferred taxation. The year-end balance has been arrived at as follows:
5.1 Authorised Capital
2014 2013
395,000,000 215,000,000
5.2 Issued, subscribed and paid-up capital
ordinary shares of Rs.10 eachfully paid in cash 41,000,000 41,000,000
ordinary shares of Rs.10 eachissued as fully paid bonus shares 11,272,000 11,272,000
non-voting ordinary shares of
Rs.10 each issued on conversionof 12% cumulative convertible
preference shares 72,000,000 72,000,000
non-voting ordinary shares of Rs.10 each issued as fully paidbonus shares 15,120,000 15,120,000
139,392,000 139,392,000
- - - - Rupees - - - -
1,127,200 1,127,200
4,100,000 4,100,000
13,939,200
1,512,000
7,200,000
2014 2013- - - - Numbers - - - -
39,500,000 21,500,000
7,200,000
13,939,200
1,512,000
5.3 The Company's shareholders, in an Extra Ordinary General Meeting held on June 09, 2014, approved the increase in authorised capital by an amount of Rs.180 million through addition of 7,000,000 ordinary shares and 11,000,000 non-voting ordinary shares of Rs.10 each.
5.4 Noon Sugar Mills Ltd. (an Associated Company) held 2,420,000 non-voting ordinary shares as at June 30, 2014 and 2013.
5.5 During the year the Board of directors of the Company decided to increase the share capital of the company as disclosed in note 45.
Opening balance
Less: transferred to unappropriated profit / (accumulated loss)
- on account of incremental depreciation for the year
- upon disposal of freehold land
Less: deferred tax on:
- opening balance of surplus
- incremental depreciation for the year
adjustment resulting from reduction
in tax rate
Closing balance
- - - - Rupees - - - -
2014
60,126,714
(1,561,842)
(6,321,347)
52,243,525
5,310,261
(531,026)
4,779,235
(140,566)
4,638,669
47,604,856
2013
61,862,094
(1,735,380)
-
60,126,714
6,073,829
(607,383)
5,466,446
(156,185)
5,310,261
54,816,453

33
ANNUAL REPORT 2014
7. DEFERRED INCOME
This represents gain arisen on sale and lease-back of fixed assets and has been credited to profit and loss account over the lease terms. (note 11.2)
8. TERM FINANCES - Secured
Allied Bank Limited (ABL) 8.1 25,000,000 50,000,000
NIB Bank Limited (NIB) 8.2 118,533,771 137,500,000
143,533,771 187,500,000Less: Current portion grouped under current liabilities
- ABL {including an overdue instalment of Rs. 6.250 million (2013: Rs. 6.250 million)} 25,000,000 31,250,000 - NIB {including overdue instalments of Rs.16.978 million (2013: Rs. Nil)} 96,478,217 35,944,445
121,478,217 67,194,445
22,055,554 120,305,555
8.1 ABL, during the financial year ended June 30, 2012, had transferred a balance of Rs.75 million from the utilised short term running finance facility to a long term finance facility. The finance facility is repayable in 12 equal quarterly instalments commenced from June, 2012. Originally this finance facility carried mark-up at the rate of 3-months KIBOR+1.25%; however, ABL, during the current financial year, revised the make-up rate to 3-months KIBOR+1.50%. Effective mark-up rates charged, during the current financial year, ranged from 10.58% to 11.67% (2013: 10.56% to 13.24%). This finance facility is secured against first pari passu charge for Rs.495 million over fixed and current assets of the Company.
8.2 The Company, during September 2012, has availed a term finance facility of Rs.150 million from NIB. Originally this finance facility was repayable in 36 equal monthly instalments of Rs.4.166 million commencing September, 2012; however, NIB has revised the repayment terms and now this loan is repayable in 36 monthly instalments of different amounts commenced from October 2012. The finance facility carries mark-up at the rate of 3-months KIBOR+2%; effective mark-up rates charged, during the current financial year, ranged from 11.09% to 12.15% (2013: 11.36% to 13.98%). This finance facility is secured against first pari passu charge for Rs.200 million on present and future fixed assets of the Company.
9.1 The Company, during the financial year ended June 30, 2012, has entered into a Shirkat-ul-Milk agreement of Rs.35 million with Bank Islami Pakistan Limited (BIPL) for purchase of a new Tetra Pak filling machine and conveyors. The facility amount was disbursed by BIPL by making payments to Tetra Pak Export, Dubai. The principal balance of this finance facility is repayable in 10 quarterly instalments commenced from September, 2012. The finance facility carries profit at the rate of 3-months KIBOR + 1.50% per annum, with a floor of 13%; effective profit rates charged by BIPL, during the current financial year, was 13.00% (2013: 13.00% to 13.49%) per annum. This finance facility is secured against exclusive hypothecation charge to the extent of Rs.56 million over the above mentioned machinery of the Company.
9.2 The Company, during the current financial year, has availed a murabahah finance facility from Bank Islami Pakistan Limited (BIPL) for purchase of a raw material, stocks, stores and for processing of milk food products. The principal balance of this finance facility is repayable in lump sum in July 2015. The finance facility carries profit at the rate of deposit on corporate saving account + 1.25% per anum; effective profit rates charged by BIPL, during the current financial year was 4.75% per annum. This finance facility is secured by 100% cash security in shape of BIPL' lien on corporate saving account / TDR in the name of the Company or any of its directors, as disclosed in note 28.3.
9. ISLAMIC FINANCES - Secured
Murabahah finance
Musharakah finance
Less: current portion of musharakah finance grouped under current liabilities 14,000,000
200,000,000
7,269,750
7,269,750
-
21,000,000
7,000,000
Rupees Rupees
2014 2013
Note2014
Rupees2013
Rupees
Note
9.1
9.2
200,000,000
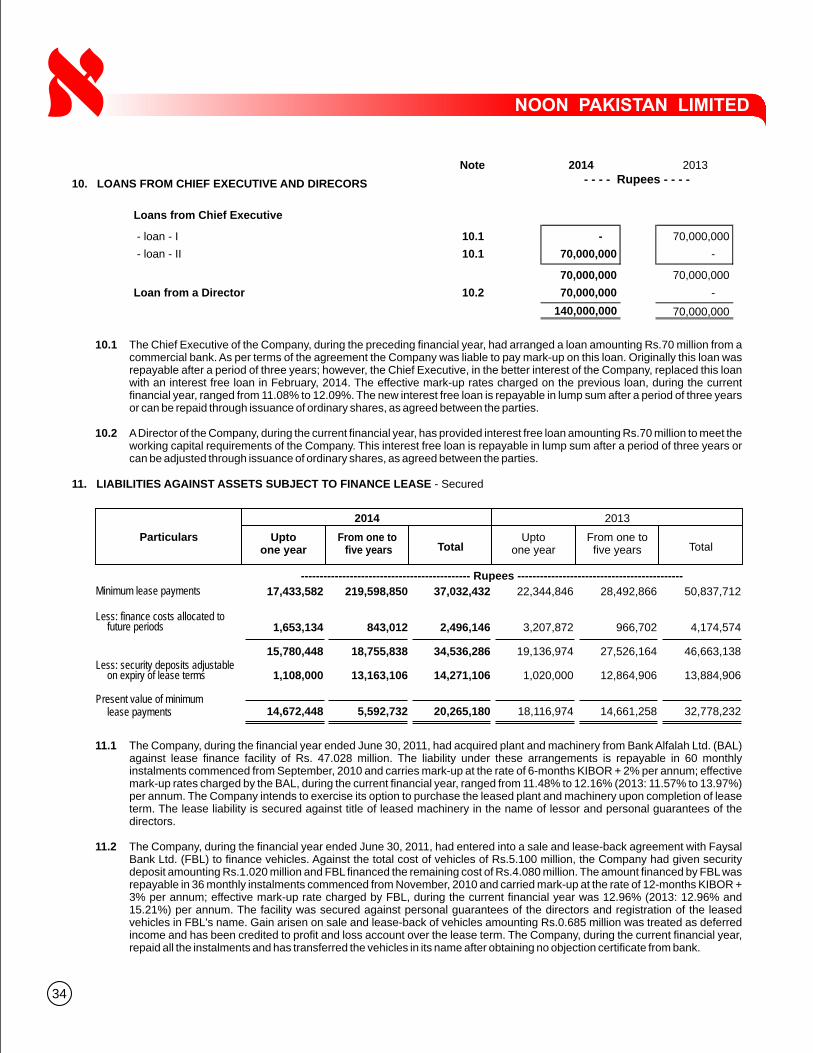
34
10. LOANS FROM CHIEF EXECUTIVE AND DIRECORS
--------------------------------------------- Rupees --------------------------------------------
Minimum lease payments
Less: finance costs allocated to future periods
Less: security deposits adjustable on expiry of lease terms
Present value of minimum lease payments
17,433,582
1,653,134
15,780,448
1,108,000
14,672,448
22,344,846
3,207,872
19,136,974
1,020,000
18,116,974
219,598,850
843,012
18,755,838
13,163,106
5,592,732
28,492,866
966,702
27,526,164
12,864,906
14,661,258
37,032,432
2,496,146
34,536,286
14,271,106
20,265,180
50,837,712
4,174,574
46,663,138
13,884,906
32,778,232
TotalFrom one to five years
Upto one year
Particulars Upto one year Total
From one to five years
2014 2013
11. LIABILITIES AGAINST ASSETS SUBJECT TO FINANCE LEASE - Secured
11.1 The Company, during the financial year ended June 30, 2011, had acquired plant and machinery from Bank Alfalah Ltd. (BAL) against lease finance facility of Rs. 47.028 million. The liability under these arrangements is repayable in 60 monthly instalments commenced from September, 2010 and carries mark-up at the rate of 6-months KIBOR + 2% per annum; effective mark-up rates charged by the BAL, during the current financial year, ranged from 11.48% to 12.16% (2013: 11.57% to 13.97%) per annum. The Company intends to exercise its option to purchase the leased plant and machinery upon completion of lease term. The lease liability is secured against title of leased machinery in the name of lessor and personal guarantees of the directors.
11.2 The Company, during the financial year ended June 30, 2011, had entered into a sale and lease-back agreement with Faysal Bank Ltd. (FBL) to finance vehicles. Against the total cost of vehicles of Rs.5.100 million, the Company had given security deposit amounting Rs.1.020 million and FBL financed the remaining cost of Rs.4.080 million. The amount financed by FBL was repayable in 36 monthly instalments commenced from November, 2010 and carried mark-up at the rate of 12-months KIBOR + 3% per annum; effective mark-up rate charged by FBL, during the current financial year was 12.96% (2013: 12.96% and 15.21%) per annum. The facility was secured against personal guarantees of the directors and registration of the leased vehicles in FBL's name. Gain arisen on sale and lease-back of vehicles amounting Rs.0.685 million was treated as deferred income and has been credited to profit and loss account over the lease term. The Company, during the current financial year, repaid all the instalments and has transferred the vehicles in its name after obtaining no objection certificate from bank.
Note 2014 2013
Loans from Chief Executive
- loan - I 10.1 - 70,000,000
- loan - II 10.1 70,000,000 -
70,000,000 70,000,000
Loan from a Director 10.2 70,000,000 -
140,000,000 70,000,000
- - - - Rupees - - - -
10.1 The Chief Executive of the Company, during the preceding financial year, had arranged a loan amounting Rs.70 million from a commercial bank. As per terms of the agreement the Company was liable to pay mark-up on this loan. Originally this loan was repayable after a period of three years; however, the Chief Executive, in the better interest of the Company, replaced this loan with an interest free loan in February, 2014. The effective mark-up rates charged on the previous loan, during the current financial year, ranged from 11.08% to 12.09%. The new interest free loan is repayable in lump sum after a period of three years or can be repaid through issuance of ordinary shares, as agreed between the parties.
10.2 A Director of the Company, during the current financial year, has provided interest free loan amounting Rs.70 million to meet the working capital requirements of the Company. This interest free loan is repayable in lump sum after a period of three years or can be adjusted through issuance of ordinary shares, as agreed between the parties.
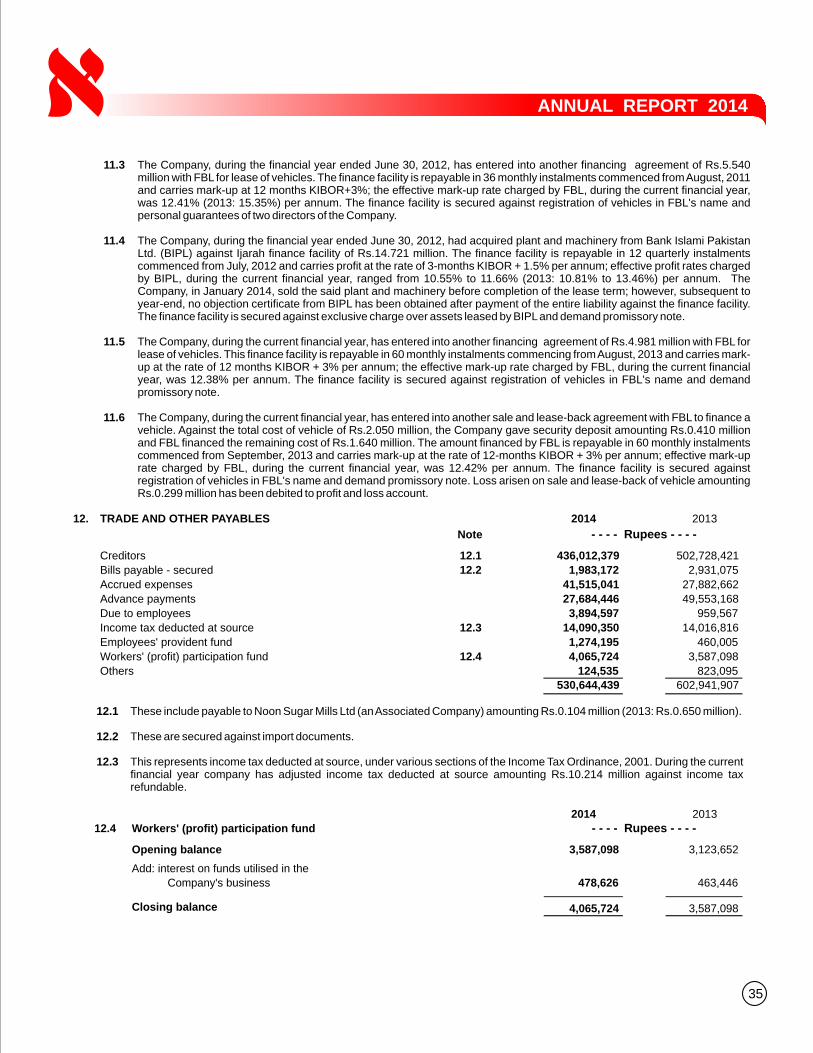
35
ANNUAL REPORT 2014
12.1 These include payable to Noon Sugar Mills Ltd (an Associated Company) amounting Rs.0.104 million (2013: Rs.0.650 million).
12.2 These are secured against import documents.
12.3 This represents income tax deducted at source, under various sections of the Income Tax Ordinance, 2001. During the current financial year company has adjusted income tax deducted at source amounting Rs.10.214 million against income tax refundable.
11.3 The Company, during the financial year ended June 30, 2012, has entered into another financing agreement of Rs.5.540 million with FBL for lease of vehicles. The finance facility is repayable in 36 monthly instalments commenced from August, 2011 and carries mark-up at 12 months KIBOR+3%; the effective mark-up rate charged by FBL, during the current financial year, was 12.41% (2013: 15.35%) per annum. The finance facility is secured against registration of vehicles in FBL's name and personal guarantees of two directors of the Company.
11.4 The Company, during the financial year ended June 30, 2012, had acquired plant and machinery from Bank Islami Pakistan Ltd. (BIPL) against Ijarah finance facility of Rs.14.721 million. The finance facility is repayable in 12 quarterly instalments commenced from July, 2012 and carries profit at the rate of 3-months KIBOR + 1.5% per annum; effective profit rates charged by BIPL, during the current financial year, ranged from 10.55% to 11.66% (2013: 10.81% to 13.46%) per annum. The Company, in January 2014, sold the said plant and machinery before completion of the lease term; however, subsequent to year-end, no objection certificate from BIPL has been obtained after payment of the entire liability against the finance facility. The finance facility is secured against exclusive charge over assets leased by BIPL and demand promissory note.
11.5 The Company, during the current financial year, has entered into another financing agreement of Rs.4.981 million with FBL for lease of vehicles. This finance facility is repayable in 60 monthly instalments commencing from August, 2013 and carries mark-up at the rate of 12 months KIBOR + 3% per annum; the effective mark-up rate charged by FBL, during the current financial year, was 12.38% per annum. The finance facility is secured against registration of vehicles in FBL's name and demand promissory note.
11.6 The Company, during the current financial year, has entered into another sale and lease-back agreement with FBL to finance a vehicle. Against the total cost of vehicle of Rs.2.050 million, the Company gave security deposit amounting Rs.0.410 million and FBL financed the remaining cost of Rs.1.640 million. The amount financed by FBL is repayable in 60 monthly instalments commenced from September, 2013 and carries mark-up at the rate of 12-months KIBOR + 3% per annum; effective mark-up rate charged by FBL, during the current financial year, was 12.42% per annum. The finance facility is secured against registration of vehicles in FBL's name and demand promissory note. Loss arisen on sale and lease-back of vehicle amounting Rs.0.299 million has been debited to profit and loss account.
Note
12.1
12.2
12.3
12.4
12. TRADE AND OTHER PAYABLES
Creditors
Bills payable - secured
Accrued expenses
Advance payments
Due to employees
Income tax deducted at source
Employees' provident fund
Workers' (profit) participation fund
Others
- - - - Rupees - - - -
436,012,379
1,983,172
41,515,041
27,684,446
3,894,597
14,090,350
1,274,195
4,065,724
124,535530,644,439
2014 2013
502,728,421
2,931,075
27,882,662
49,553,168
959,567
14,016,816
460,005
3,587,098
823,095602,941,907
2014 2013
12.4 Workers' (profit) participation fund
Opening balance
Add: interest on funds utilised in the
Company's business
Closing balance
- - - - Rupees - - - -
3,587,098
478,626
4,065,724
3,123,652
463,446
3,587,098
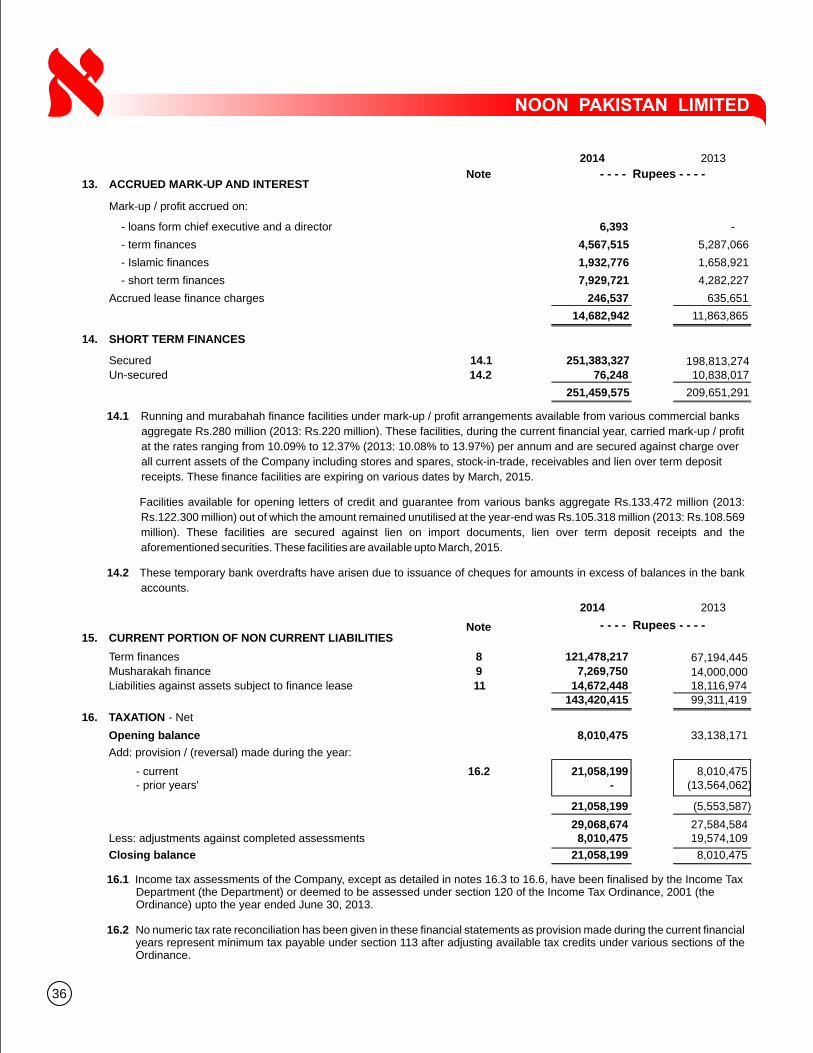
16.1 Income tax assessments of the Company, except as detailed in notes 16.3 to 16.6, have been finalised by the Income Tax Department (the Department) or deemed to be assessed under section 120 of the Income Tax Ordinance, 2001 (the Ordinance) upto the year ended June 30, 2013.
16.2 No numeric tax rate reconciliation has been given in these financial statements as provision made during the current financial years represent minimum tax payable under section 113 after adjusting available tax credits under various sections of the Ordinance.
14.1 Running and murabahah finance facilities under mark-up / profit arrangements available from various commercial banks
aggregate Rs.280 million (2013: Rs.220 million). These facilities, during the current financial year, carried mark-up / profit
at the rates ranging from 10.09% to 12.37% (2013: 10.08% to 13.97%) per annum and are secured against charge over
all current assets of the Company including stores and spares, stock-in-trade, receivables and lien over term deposit
receipts. These finance facilities are expiring on various dates by March, 2015.
Facilities available for opening letters of credit and guarantee from various banks aggregate Rs.133.472 million (2013:
Rs.122.300 million) out of which the amount remained unutilised at the year-end was Rs.105.318 million (2013: Rs.108.569
million). These facilities are secured against lien on import documents, lien over term deposit receipts and the
aforementioned securities. These facilities are available upto March, 2015.
14.2 These temporary bank overdrafts have arisen due to issuance of cheques for amounts in excess of balances in the bank
accounts.
36
2014 2013
Note
13. ACCRUED MARK-UP AND INTEREST
14. SHORT TERM FINANCES
14.1
Mark-up / profit accrued on:
- loans form chief executive and a director
- term finances
- Islamic finances
- short term finances
Accrued lease finance charges
Secured
Un-secured 14.2
6,393
4,567,515
1,932,776
7,929,721
246,537
14,682,942
251,383,327
76,248
251,459,575
-
5,287,066
1,658,921
4,282,227
635,651
11,863,865
198,813,27410,838,017
209,651,291
Note - - - - Rupees - - - -
2014 2013
- - - - Rupees - - - - 15.
8
9
11
16.
16.2
CURRENT PORTION OF NON CURRENT LIABILITIES
Term finances
Musharakah finance
Liabilities against assets subject to finance lease
TAXATION - Net
Opening balance
Add: provision / (reversal) made during the year:
- current- prior years'
Less: adjustments against completed assessments
Closing balance
121,478,217
7,269,750
14,672,448143,420,415
8,010,475
21,058,199-
21,058,199
29,068,6748,010,475
21,058,199
67,194,445
14,000,00018,116,97499,311,419
33,138,171
8,010,475(13,564,062)
(5,553,587)
27,584,58419,574,109
8,010,475

16.3 The Commissioner Inland Revenue-Appeals (CIRA), vide his order dated September 03, 2012, has allowed partial relief to the Company and reduced the amount of tax demand from Rs.34.985 million to Rs.18.282 million. Both the Company and the Department have filed appeals before the Appellate Tribunal Inland Revenue (the Tribunal) against the order of CIRA, which are pending adjudications. Earlier, the Taxation Officer, after conducting audit under section 177 of the Ordinance for Tax Year 2005, had passed an amended assessment order under section 122 of the Ordinance raising tax demands of Rs. 34.985 million alleging that the Company suppressed its sales. The CIRA had annulled his order whereas the Tribunal had set aside the order of CIRA and remanded the case back to CIRA for denovo proceedings.
The Company has also filed a rectification application under section 221 of the Ordinance against the order of CIRA, which is also pending adjudication.
16.4 The Company, during the financial year ended June 30, 2011, had received a notice under section 177 of the Ordinance for Tax Year 2009 for selection of its case for detailed scrutiny. The Company filed a petition before the Lahore High Court against its selection, which vide its order dated February 21, 2011 stopped the proceedings till its further order.
16.5 The Company, during the preceding financial year, had received a notice under section 214C of the Ordinance for the Tax Year 2011 for selection of its case by Federal Board of Revenue (FBR) for detailed scrutiny. The Company contested its selection before the review panel formed by FBR; however, FBR rejected the Company's plea of wrong selection of case for the tax audit. The Company filed a petition before the Lahore High Court against its selection, which vide its judgment dated July 02, 2013 set aside the order of FBR and directed it to pass a fresh order after providing an opportunity of being heard to the Company.
FBR vide its letter dated October 09, 2013 has closed the audit proceedings and accepted the proposal of review panel formed for hearing of the case. Earlier, the review panel concluded that the parameters applied to the Company were actually not applicable and proposed FBR to drop the Company's case from the list of cases selected for audit under section 214C of the Ordinance.
16.6 The Company, during the current financial year, has received a notice under section 177 of the Ordinance for the Tax Year 2012 for selection of its case for tax audit by the Commissioner Inland Revenue, Regional Tax Office, Sargodha (CIR). The Company has filed a writ petition before the Lahore High Court against the selection of case by CIR under the aforementioned section, which is pending adjudication.
17. DIVIDENDS
Unclaimed dividend on:-ordinary shares-Preference shares
18. CONTINGENCIES AND COMMITMENTS
Contingencies
18.1 Guarantees aggregating Rs. 11.972 million (2013: Rs. 10.800 million) has been issued by banks of the Company to Sui Northern Gas Pipeline Ltd., Unilever Pakistan Ltd. and Controller Naval Account.
18.2 The Company entered into two contracts for supply of skimmed milk powder which were not fulfiled by the Company. The other party may, at its sole discretion, rescind the order and claim damages for any loss incurered.
18.3 Refer contents of notes 16.3 to16.6.
Commitments
18.4 Commitments, other than capital expenditure, against irrevocable letters of credit outstanding at the year end were for Rs. 14.199 million (2013: Rs.Nil).
2014Rupees
859,113115,490
974,603
2013Rupees
899,156115,490
1,014,646
37
ANNUAL REPORT 2014

38
19
. O
pe
rati
ng
fix
ed
as
se
ts -
ta
ng
ible
CO
ST
/ R
EV
AL
UA
TIO
N
Bal
ance
as
at J
uly
01,
201
244
,955
,000
73,4
30,5
2670
5,19
1,63
114
3,74
017
,995
,047
7,44
0,12
122
,223
,040
12,6
56,6
1243
,610
,060
68,7
18,2
6214
,463
,230
1,01
0,82
7,26
9
Add
ition
s du
ring
the
year
-15
9,00
661
,869
,364
-20
7,35
76,
997
5,42
4,19
855
,000
4,40
9,07
6-
-72
,130
,998
Dis
posa
ls d
urin
g th
e ye
ar-
--
--
--
-(5
01,6
00)
--
(501
,600
)
Bal
ance
as
at J
un
e 30
, 201
344
,955
,000
73,5
89,5
3276
7,06
0,99
514
3,74
018
,202
,404
7,44
7,11
827
,647
,238
12,7
11,6
1247
,517
,536
68,7
18,2
6214
,463
,230
1,08
2,45
6,66
7
Bal
ance
as
at J
uly
01,
201
344
,955
,000
73,5
89,5
3276
7,06
0,99
514
3,74
018
,202
,404
7,44
7,11
827
,647
,238
12,7
11,6
1247
,517
,536
68,7
18,2
6214
,463
,230
1,08
2,45
6,66
7
Add
ition
s du
ring
the
year
-82
1,52
68,
758,
697
-51
,851
-99
7,02
2-
810,
000
-5,
804,
220
17,2
43,3
16
Tra
nsfe
rs d
urin
g th
e ye
ar fr
om:
- o
wne
d to
leas
ed-
--
--
--
-(2
,558
,060
)-
2,25
8,90
8(2
99,1
52)
- le
ased
to o
wne
d-
--
--
--
-8,
101,
630
-(8
,101
,630
)-
Dis
posa
ls d
urin
g th
e ye
ar(6
,352
,802
)-
--
--
--
(10,
069,
590)
(14,
721,
671)
-(3
1,14
4,06
3)
Bal
ance
as
at J
un
e 30
, 201
438
,602
,198
74,4
11,0
5877
5,81
9,69
214
3,74
018
,254
,255
7,44
7,11
828
,644
,260
12,7
11,6
1243
,801
,516
53,9
96,5
9114
,424
,728
1,06
8,25
6,76
8
DE
PR
EC
IAT
ION
Bal
ance
as
at J
uly
01,
201
2-
28,3
93,6
6427
5,08
1,10
114
3,32
07,
423,
971
3,84
0,75
56,
426,
855
7,70
2,52
326
,844
,515
13,4
89,8
554,
727,
230
374,
073,
789
Cha
rge
for
the
year
-4,
512,
019
44,2
81,2
7063
1,07
1,99
136
0,43
21,
913,
211
499,
409
3,59
7,91
05,
522,
841
1,94
7,20
063
,706
,346
On
disp
osal
s du
ring
the
year
--
--
--
--
(370
,047
)-
-(3
70,0
47)
Bal
ance
as
at J
un
e 30
, 201
3-
32,9
05,6
8331
9,36
2,37
114
3,38
38,
495,
962
4,20
1,18
78,
340,
066
8,20
1,93
230
,072
,378
19,0
12,6
966,
674,
430
437,
410,
088
Bal
ance
as
at J
uly
01,
201
3-
32,9
05,6
8331
9,36
2,37
114
3,38
38,
495,
962
4,20
1,18
78,
340,
066
8,20
1,93
230
,072
,378
19,0
12,6
966,
674,
430
437,
410,
088
On
tran
sfer
s du
ring
the
year
from
:
- o
wne
d to
leas
ed-
--
--
--
-(2
08,9
08)
-20
8,90
8-
- le
ased
to o
wne
d-
--
--
--
-4,
399,
764
-(4
,399
,764
)-
Cha
rge
for
the
year
-4,
121,
860
45,1
26,1
2753
971,
940
324,
593
1,97
3,05
445
0,96
83,
025,
322
4,40
9,10
92,
371,
414
62,7
74,4
40
On
disp
osal
s du
ring
the
year
--
--
--
--
(5,9
86,6
01)
(2,8
68,8
86)
-(8
,855
,487
)
Bal
ance
as
at J
un
e 30
, 201
4-
37,0
27,5
4336
4,48
8,49
814
3,43
69,
467,
902
4,52
5,78
010
,313
,120
8,65
2,90
031
,301
,955
20,5
52,9
194,
854,
988
491,
329,
041
BO
OK
VA
LU
E A
S A
T
JUN
E 3
0, 2
013
44,9
55,0
0040
,683
,849
447,
698,
624
357
9,70
6,44
23,
245,
931
19,3
07,1
724,
509,
680
17,4
45,1
5849
,705
,566
7,78
8,80
064
5,04
6,57
9
BO
OK
VA
LU
E A
S A
T
JUN
E 3
0, 2
014
38,6
02,1
9837
,383
,515
411,
331,
194
304
8,78
6,35
32,
921,
338
18,3
31,1
404,
058,
712
12,4
99,5
6133
,443
,672
9,56
9,74
057
6,92
7,72
7
Dep
reci
atio
n r
ate
(%)
1010
1510
1010
1020
1020
Oth
er
wo
rks
equ
ipm
ent
Off
ice
equ
ipm
ent
- -
- -
- -
- -
- -
- -
- -
- -
- -
- -
- -
- -
- -
- -
- -
- -
- -
- -
- -
- -
- -
- -
- -
- -
- -
- -
- -
- -
- -
Ru
pee
s -
- -
- -
- -
- -
- -
- -
- -
- -
- -
- -
- -
- -
- -
- -
- -
- -
- -
- -
- -
- -
- -
- -
- -
- -
- -
- -
Pla
nt
&
mac
hin
ery
Veh
icle
sTo
tal
Lea
sed
Ow
ned
Fre
eho
ld
lan
d
Bu
ildin
gs
on
free
ho
ld
Pla
nt
&
mac
hin
ery
Fu
rnit
ure
and
fixt
ure
s
Veh
icle
sM
ilk
Ch
urn
s
Ele
ctri
c &
gas
inst
alla
tio
n


19.1 Had the property, plant and equipment been recognised under the cost model, the carrying amounts of each revalued class of property, plant and equipment would have been as follows:
19.2 Disposal of property, plant and equipment
41
ANNUAL REPORT 2014
Freehold land
Buildings on freehold land
Plant & machinery
Electric & gas installations
Other works equipment
415,246
32,871,659
402,077,111
8,566,866
2,850,191
446,781,073
446,703
35,670,675
437,416,310
9,462,567
3,166,878
486,163,133
- - - - Rupees - - - -
2014 2013
Freehold Land
3,403,287 - 3,403,287 3,450,000 46,713 Negotiation Mr. Habib
Bhalwal, District Sargodha.
2,949,515 - 2,949,515 3,100,000 150,485 - - do - - Mr. Mukhtar Ahmad,
Bhalwal, District Sargodha.
6,352,802 - 6,352,802 6,550,000 197,198
Plant & machinery
TBA - 09 filling machine 14,721,671 2,868,886 11,852,785 13,000,000 1,147,215 - - do - - Tetra Pak Pakistan Ltd.
Vehicles
Honda Civic 1,752,840 992,332 760,508 1,500,000 739,492 - - do - - Mr. Iftikhar, Lahore.
Honda Civic 1,752,840 1,055,708 697,132 1,100,000 402,868 - - do - - Mr. Javaid Saeed, Lahore.
Suzuki Bolan 476,660 361,911 114,749 430,000 315,251 - - do - - Mr. Khalid Saeed Baig, Lahore.
Toyota Corolla - GLI 1,490,720 692,857 797,863 1,220,000 422,137 - - do - - Mr. Sheraz-ur-Rehman, Lahore.
Toyota Altis 1,404,530 1,019,859 384,671 950,000 565,329 - - do - - Mr. Malik Faisal Ahmad, Lahore.
Honda City 810,000 366,480 443,520 700,000 256,480 Insurance claim EFU General Insurance Ltd.
Toyota Hilux 2,150,000 1,356,201 793,799 810,000 16,201 Negotiation Mr. Abdul Majeed, Kasur.
Honda motorcycle 66,300 35,040 31,260 66,300 35,040 Company policy Mr. Amanat Ali (employee)
Honda motorcycle 91,000 48,214 42,786 91,000 48,214 - - do - - Mr. Gulbaz Khan (employee)
Honda motorcycle 74,700 57,999 16,701 25,212 8,511 - - do - - Mr. Muhammad Hanif (employee)
10,069,590 5,986,601 4,082,989 6,892,512 2,809,523
31,144,063 8,855,487 22,288,576 26,442,512 4,153,936
Particulars of buyerMode of
disposalAsset description
- - - - - - - - - - - - - - - - - Rupees - - - - - - - - - - - - - - - - -
Accumulated
depreciation
Net Book
value
Sale
proceedsGain
Cost /
revaluation
19.3 Depreciation for the year has been apportioned as under:2014 2013
Milk collection centers
Cost of sales
Distribution cost
Administrative expenses
- - - - Rupees - - - -
6,264,045
49,687,427
907,597
5,915,371
62,774,440
6,583,648
50,344,223
1,079,373
5,699,102
63,706,346

42
- - - - Rupees - - - -
2014 2013
21.1
20. INTANGIBLE ASSETS - Computer softwares
Cost
- at beginning of the year
- additions made during the year
- at end of the year
Less: amortisation
- at beginning of the year
- charge for the year
- at end of the year
Book value as at June 30, 2014
Amortisation rate - % per annum
21. DEFERRED TAXATION - net
The deferred tax asset
comprises of temporary differences relating to:
Deductible temporary differences:
- unused tax losses
- minimum tax recoverable against normal tax charge in future years
Taxable temporary differences:
- accelerated tax depreciation allowances
- surplus on revaluation of property, plant and equipment
- lease finances
432,032
1,983,860
2,415,892
393,348
414,531
807,879
1,608,013
33.33
57,462,081
51,547,159
109,009,240
99,975,116
4,638,669
2,797,452
107,411,237
1,598,003
432,032
-
432,032
316,008
77,340
393,348
38,684
33.33
62,161,548
56,933,595
119,095,143
108,504,261
5,310,261
3,682,618
117,497,140
1,598,003
Note
21.1 Deferred tax asset as at June 30, 2014 has been restricted to Rs.1.598 million, i.e. deferred tax asset recognised as at June 30, 2013. No further deferred tax asset on available unused tax losses aggregating Rs.108.897 million has been recognised in these financial statements in view of persisting losses.
22. STORES, SPARES AND LOOSE TOOLS 2014 2013
Stores - at mills including in transit inventory valuing Rs.27.588 million (2013: Rs.25.806 million)
Spares
Loose tools
Less: provision for obsolete store items
- - - - Rupees - - - -
116,460,728
17,804,486
85,358
134,350,572
4,600,951
129,749,621
147,399,075
18,114,653
700,711
166,214,439
-
166,214,439
22.1 Stores and spares inventory includes slow moving items valuing Rs. 4.974 million (2013: Rs.4.883 million).
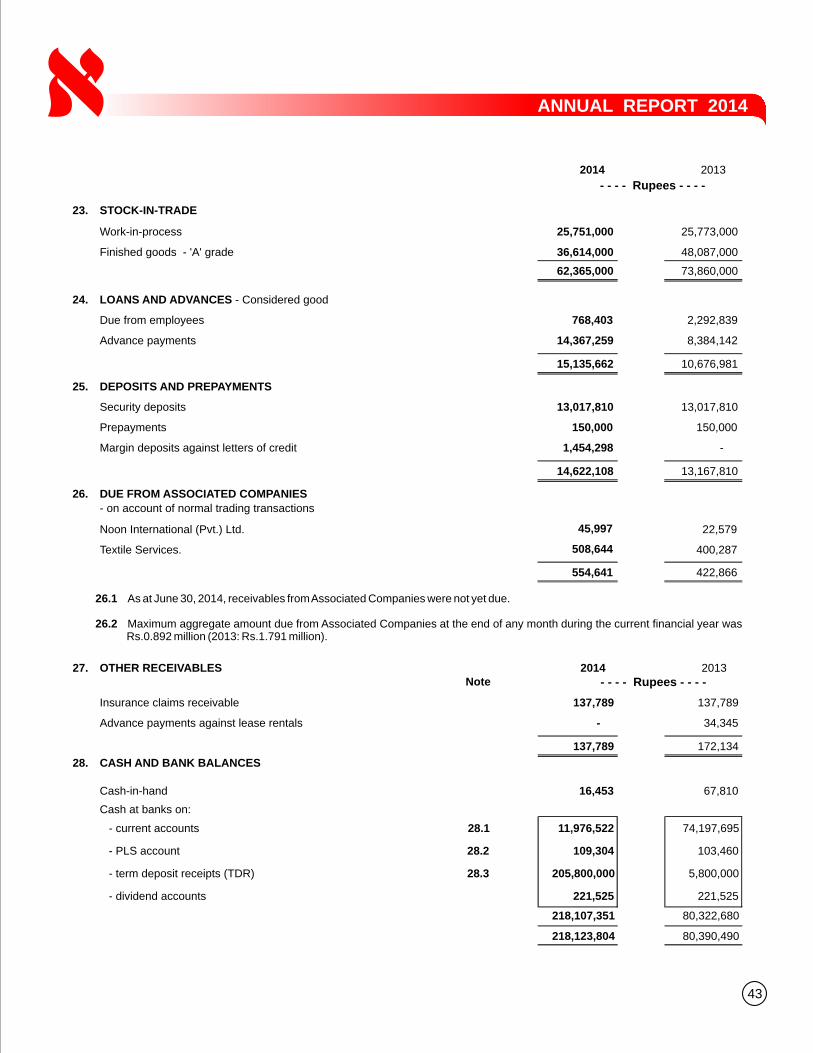
43
ANNUAL REPORT 2014
- - - - Rupees - - - -
2014 2013
23. STOCK-IN-TRADE
Work-in-process
Finished goods - 'A' grade
24. LOANS AND ADVANCES - Considered good
Due from employees
Advance payments
25. DEPOSITS AND PREPAYMENTS
Security deposits
Prepayments
Margin deposits against letters of credit
26. DUE FROM ASSOCIATED COMPANIES
- on account of normal trading transactions
Noon International (Pvt.) Ltd.
Textile Services.
25,751,000
36,614,000
62,365,000
768,403
14,367,259
15,135,662
13,017,810
150,000
1,454,298
14,622,108
45,997
508,644
554,641
25,773,000
48,087,000
73,860,000
2,292,839
8,384,142
10,676,981
13,017,810
150,000
-
13,167,810
22,579
400,287
422,866
26.1 As at June 30, 2014, receivables from Associated Companies were not yet due.
26.2 Maximum aggregate amount due from Associated Companies at the end of any month during the current financial year was Rs.0.892 million (2013: Rs.1.791 million).
27. OTHER RECEIVABLES 2014 2013
Insurance claims receivable
Advance payments against lease rentals
28. CASH AND BANK BALANCES
Note
Cash-in-hand
Cash at banks on:
- current accounts 28.1
- PLS account 28.2
- term deposit receipts (TDR) 28.3
- dividend accounts
- - - - Rupees - - - -
137,789
-
137,789
16,453
11,976,522
109,304
205,800,000
221,525
218,107,351
218,123,804
137,789
34,345
172,134
67,810
74,197,695
103,460
5,800,000
221,525
80,322,680
80,390,490

44
28.1 These include following balances:
- Rs.1.500 million (2013: Rs.1.500 million) which are under lien of NIB Bank Ltd. (NIB) against guarantees issued by it in favour of Sui Northern Gas Pipelines Ltd. (SNGPL) and Unilever Pakistan Ltd. on behalf of the Company.
- Rs.0.350 million (2013: Rs.0.350 million), which are under lien of Allied Bank Ltd. against a guarantee issued by it in favour of SNGPL.
- Rs.1.172 million (2013: Rs.Nil), which are under lien of United Bank Ltd. against a guarantee issued by it in favour of Controller Naval Account, Karachi.
28.2 This carries profit at the rates ranging from 6% to 7% (2013:6%) per annum.
28.3 These include the following:
- TDRs amounting Rs.5.800 million (2013: Rs.5.800 million) which are under lien of NIB Bank Ltd. (NIB) against guarantees issued by it in favour of SNGPL and carry profit at the rate of 7% (2013: 7%) per annum.
- TDRs amounting Rs.200 million (2013: Rs.Nil) which are under lien of Bank Islami Pakistan Ltd. against murabahah finance facilty of same amount availed by the Company, as disclosed in note 9.2, and carry profit at the rate of 3.50% (2013: Nil) per annum.
29. SALES - Net 2014 2013
Gross sales
Less:
Sales tax
Shortages / leakages allowed
Discounts
30. COST OF SALES
Raw materials consumed 30.1
Milk collection expenses
Salaries, wages and benefits 30.2
Power and fuel
Packing materials consumed
Stores and spares consumed
Repair and maintenance
Rent, rates and taxes
Depreciation 19.3
Insurance
- - - - Rupees - - - -
2,240,933,418
9,923,809
21,466,063
15,518,488
46,908,360
2,194,025,058
1,018,179,251
52,408,310
62,390,082
156,816,651
428,298,353
201,320,622
1,791,837
4,748,305
49,687,427
2,643,649
1,978,284,487
3,017,333,986
14,450,469
32,162,077
44,492,216
91,104,762
2,926,229,224
1,249,393,906
123,575,836
65,427,339
176,154,984
565,423,024
270,275,902
1,919,005
4,412,731
50,344,223
3,189,428
2,510,116,378
Note

31.1 These include contributions aggregating Rs.1.024 million (2013: Rs.1.013 million) to employees' provident fund trust.
45
ANNUAL REPORT 2014
Adjustment of work-in-process
Opening stock
Closing stock
Cost of goods manufactured
Adjustment of finished goods
Opening stock
Closing stock
30.1 Raw materials consumed:
Fresh milk
Milk powder
Jams
Juice concentrates
Fats
Butter oil
25,773,000
(25,751,000)
22,000
1,978,306,487
48,087,000
(36,614,000)
11,473,000
1,989,779,487
878,148,460
34,202,354
3,310,688
4,742,525
90,194,012
7,581,212
1,018,179,251
49,391,000
(25,773,000)
23,618,000
2,533,734,378
148,794,000
(48,087,000)
100,707,000
2,634,441,378
944,977,896
112,821,823
6,851,548
5,831,721
145,596,129
33,314,789
1,249,393,906
- - - - Rupees - - - -
2014 2013
30.2 These include contributions aggregating Rs.3.064 million (2013: Rs.2.782 million) to employees' provident fund trust.
31. DISTRIBUTION COST 2014 2013
Note
Freight and forwarding - net-off recoveries from distributors aggregating Rs.34.807 million
(2013:Rs.16.705 million)
Salaries and benefits 31.1
Rent
Entertainment
Communication
Travelling and conveyance
Vehicles' running and maintenance
Advertisement and sales promotion
Insurance
Depreciation 19.3
Samples
Others
- - - - Rupees - - - -
43,921,954
36,888,886
1,314,933
140,423
382,629
703,560
101,337
69,185,145
580,372
907,597
705,006
-
154,831,842
87,073,688
28,120,931
1,333,222
76,947
662,328
475,788
710,660
186,289,351
556,647
1,079,373
784,890
123,497
307,287,322
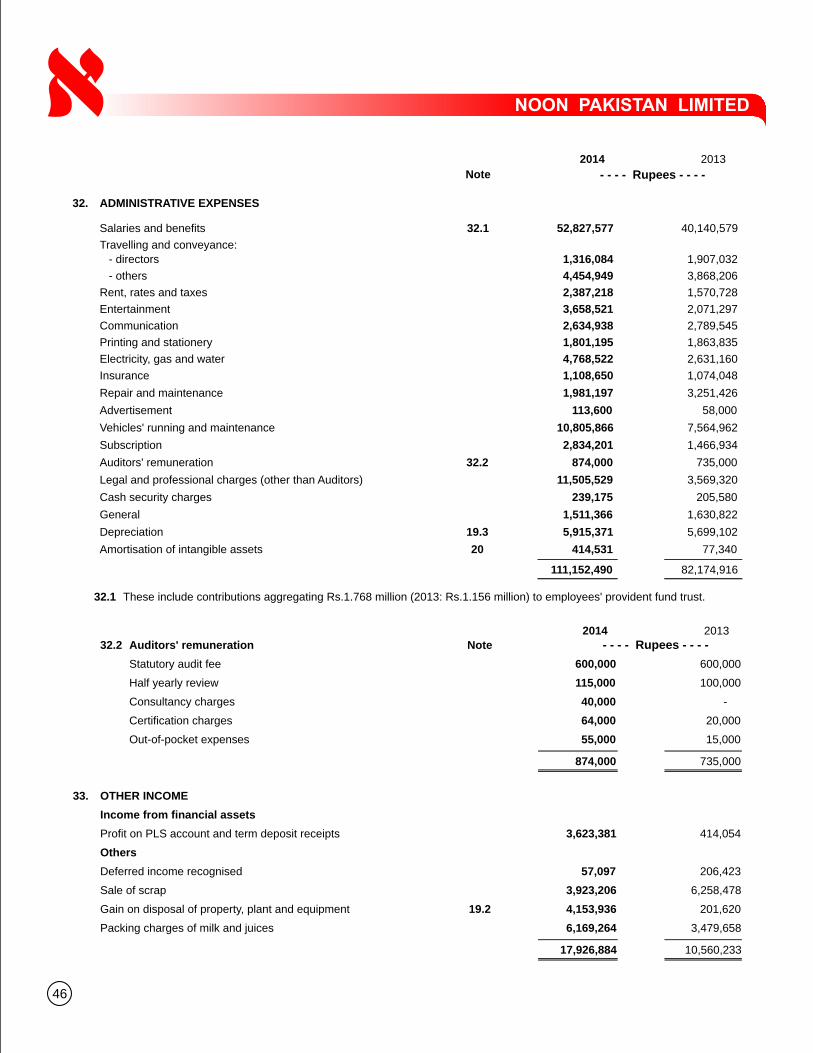
46
32. ADMINISTRATIVE EXPENSES
Salaries and benefits 32.1
Travelling and conveyance:
- directors
- others
Rent, rates and taxes
Entertainment
Communication
Printing and stationery
Electricity, gas and water
Insurance
Repair and maintenance
Advertisement
Vehicles' running and maintenance
Subscription
Auditors' remuneration 32.2
Legal and professional charges (other than Auditors)
Cash security charges
General
Depreciation 19.3
Amortisation of intangible assets 20
52,827,577
1,316,084
4,454,949
2,387,218
3,658,521
2,634,938
1,801,195
4,768,522
1,108,650
1,981,197
113,600
10,805,866
2,834,201
874,000
11,505,529
239,175
1,511,366
5,915,371
414,531
111,152,490
40,140,579
1,907,032
3,868,206
1,570,728
2,071,297
2,789,545
1,863,835
2,631,160
1,074,048
3,251,426
58,000
7,564,962
1,466,934
735,000
3,569,320
205,580
1,630,822
5,699,102
77,340
82,174,916
- - - - Rupees - - - -
2014 2013
Note
32.1 These include contributions aggregating Rs.1.768 million (2013: Rs.1.156 million) to employees' provident fund trust.
2014 2013
32.2 Auditors' remuneration Note
Statutory audit fee
Half yearly review
Consultancy charges
Certification charges
Out-of-pocket expenses
33. OTHER INCOME
Income from financial assets
Profit on PLS account and term deposit receipts
Others
Deferred income recognised
Sale of scrap
Gain on disposal of property, plant and equipment 19.2
Packing charges of milk and juices
- - - - Rupees - - - -
600,000
115,000
40,000
64,000
55,000
874,000
3,623,381
57,097
3,923,206
4,153,936
6,169,264
17,926,884
600,000
100,000
-
20,000
15,000
735,000
414,054
206,423
6,258,478
201,620
3,479,658
10,560,233
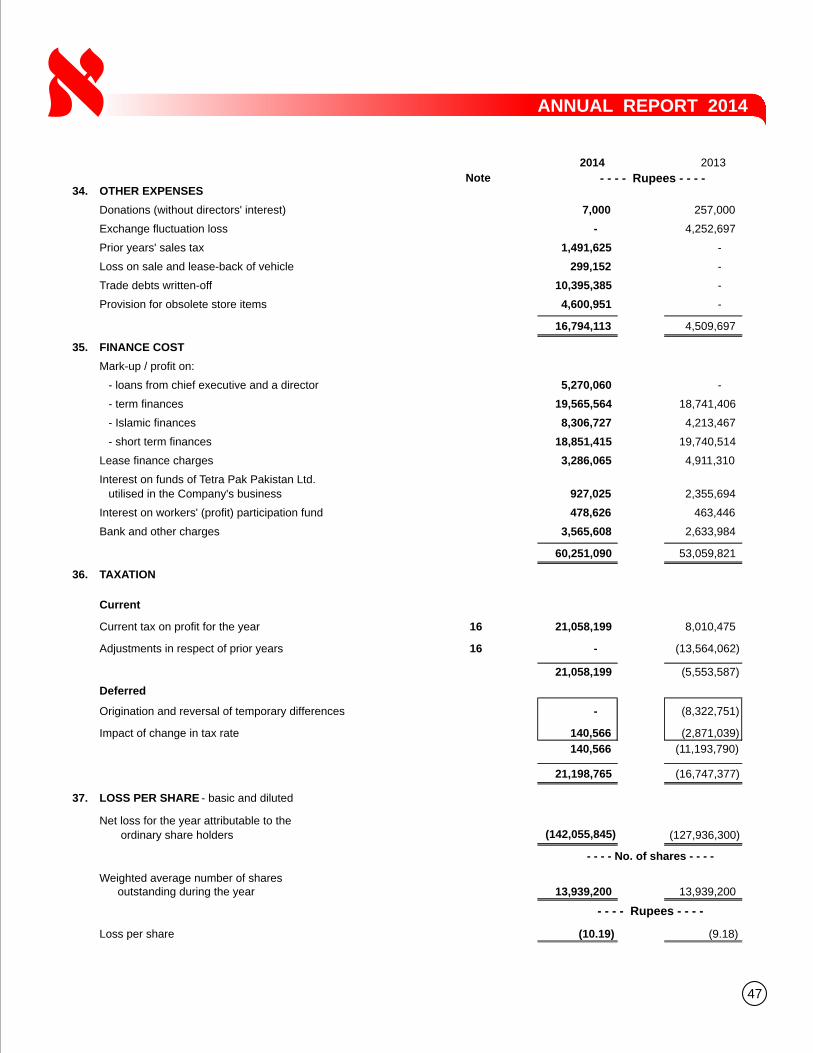
47
ANNUAL REPORT 2014
34. OTHER EXPENSES
Donations (without directors' interest)
Exchange fluctuation loss
Prior years' sales tax
Loss on sale and lease-back of vehicle
Trade debts written-off
Provision for obsolete store items
35. FINANCE COST
Mark-up / profit on:
- loans from chief executive and a director
- term finances
- Islamic finances
- short term finances
Lease finance charges
Interest on funds of Tetra Pak Pakistan Ltd.
utilised in the Company's business
Interest on workers' (profit) participation fund
Bank and other charges
36. TAXATION
Current
Current tax on profit for the year 16
Adjustments in respect of prior years 16
Deferred
Origination and reversal of temporary differences
Impact of change in tax rate
37. LOSS PER SHARE - basic and diluted
Net loss for the year attributable to the
ordinary share holders
Weighted average number of shares outstanding during the year
Loss per share
- - - - Rupees - - - -
- - - - No. of shares - - - -
7,000
-
1,491,625
299,152
10,395,385
4,600,951
16,794,113
5,270,060
19,565,564
8,306,727
18,851,415
3,286,065
927,025
478,626
3,565,608
60,251,090
21,058,199
-
21,058,199
-
140,566
140,566
21,198,765
(142,055,845)
13,939,200
(10.19)
257,000
4,252,697
-
-
-
-
4,509,697
-
18,741,406
4,213,467
19,740,514
4,911,310
2,355,694
463,446
2,633,984
53,059,821
8,010,475
(13,564,062)
(5,553,587)
(8,322,751)
(2,871,039)
(11,193,790)
(16,747,377)
(127,936,300)
13,939,200
(9.18)
- - - - Rupees - - - -
2014 2013
Note
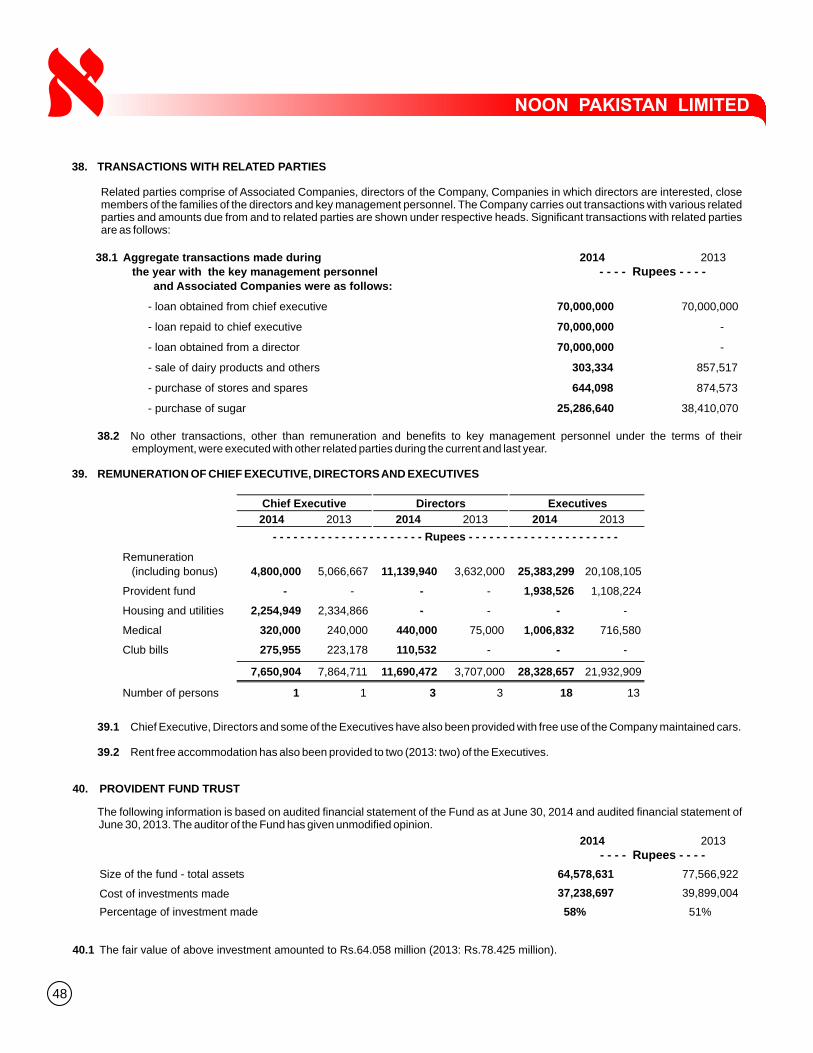
48
38. TRANSACTIONS WITH RELATED PARTIES
Related parties comprise of Associated Companies, directors of the Company, Companies in which directors are interested, close members of the families of the directors and key management personnel. The Company carries out transactions with various related parties and amounts due from and to related parties are shown under respective heads. Significant transactions with related parties are as follows:
38.2 No other transactions, other than remuneration and benefits to key management personnel under the terms of their employment, were executed with other related parties during the current and last year.
39. REMUNERATION OF CHIEF EXECUTIVE, DIRECTORS AND EXECUTIVES
38.1 Aggregate transactions made during 2014 2013
the year with the key management personnel
and Associated Companies were as follows:
- loan obtained from chief executive
- loan repaid to chief executive
- loan obtained from a director
- sale of dairy products and others
- purchase of stores and spares
- purchase of sugar
70,000,000
70,000,000
70,000,000
303,334
644,098
25,286,640
70,000,000
-
-
857,517
874,573
38,410,070
- - - - Rupees - - - -
2014 2013 2014 2013 2014 2013
Remuneration
(including bonus) 4,800,000 5,066,667 11,139,940 3,632,000 25,383,299 20,108,105
Provident fund - - - - 1,938,526 1,108,224
Housing and utilities 2,254,949 2,334,866 - - - -
Medical 320,000 240,000 440,000 75,000 1,006,832 716,580
Club bills 275,955 223,178 110,532 - - -
7,650,904 7,864,711 11,690,472 3,707,000 28,328,657 21,932,909
Number of persons 1 1 3 3 18 13
- - - - - - - - - - - - - - - - - - - - - - Rupees - - - - - - - - - - - - - - - - - - - - - -
Chief Executive Directors Executives
39.1 Chief Executive, Directors and some of the Executives have also been provided with free use of the Company maintained cars.
39.2 Rent free accommodation has also been provided to two (2013: two) of the Executives.
40. PROVIDENT FUND TRUST
2014 2013
Size of the fund - total assets
Cost of investments made
Percentage of investment made
64,578,631
37,238,697
58%
77,566,922
39,899,004
51%
40.1 The fair value of above investment amounted to Rs.64.058 million (2013: Rs.78.425 million).
- - - - Rupees - - - -
The following information is based on audited financial statement of the Fund as at June 30, 2014 and audited financial statement of June 30, 2013. The auditor of the Fund has given unmodified opinion.

49
ANNUAL REPORT 2014
40.2 The break-up value of investment is as follows:
2014 2013 2014 2013
Defence saving certificate 59% 56% 22,155,000 22,155,000
Equity securities 32% 30% 12,100,000 12,100,000
Government securities 7% 6% 2,500,000 2,500,000
Bank deposits 1% 8% 483,697 3,144,004
37,238,697 39,899,004
Percentage Rupees
40.3 Investments out of Provident Fund (the fund) and payment of contribution / subscription to the fund have not been made in accordance with the provisions of section 227 of the Companies Ordinance, 1984 and the rules formulated for this purpose, investment in listed equity securities exceeds the limit prescribed by the rules. The Trustees of the fund, being vigilant to the situation, have resolved to divest adequate funds to other investments by selling equity investment at an appropriate time and to keep the same within prescribed limits.
41. CAPACITY AND PRODUCTION
Milk Powder and Butter Plant
Annual rated capacity of milk processing based on three shifts
Fresh milk processed during the year
Cheese Plant
Annual rated capacity of milk processing
based on 24 hours per day
Fresh milk processed during the year
Pasteurised Milk Plant
Annual rated capacity of milk
pasteurisation based on three shifts
Milk pasteurised during the year
Yogurt Plant
Annual rated capacity of milk processing
based on three shifts
Fresh milk processed during the year
UHT Milk Plant
Annual rated capacity of milk processing
based on three shifts
Milk processed during the year
Dairy rozana
UHT cream
Flavoured milk
Drinking yogurt
Chai mix
Co-packing
Juice Plant
Annual rated capacity of juices
based on three shifts
Juices processed during the year
Nectars
Co-packing
Unit of measurement
Kgs.
Kgs.
Kgs.
Kgs.
Ltrs.
Ltrs.
Kgs.
Ltrs.
Ltrs.
Ltrs.
Ltrs.
Ltrs.
Ltrs.
Ltrs.
Ltrs.
Ltrs.
Ltrs.
Ltrs.
Ltrs.
2014
44,416,000
2,270,577
3,275,000
2,986,265
5,840,000
2,496,282
2,920,000
-
87,488,000
1,651,548
3,426,890
591,873
3,804,081
157
1,852,545
33,006
43,800,000
2,583,165
104,468
-
2013
44,416,000
3,009,135
3,275,000
2,774,664
5,840,000
4,288,861
2,920,000
-
87,488,000
2,604,553
3,236,632
440,443
3,976,593
5,755
3,186,674
96,806
43,800,000
1,579,982
497,221
26,320

50
Sensitivity analysis
At June 30, 2014, if Rupee had strengthened by 10% against U.S.$ with all other variables held constant, loss after taxation for the year would have been lower by the amount shown below mainly as a result of net foreign exchange gains on translation of foreign currency financial liabilities.
2014 2013Effect on loss for the year: Rupees Rupees
U.S. $ to Rupee 198,317 293,110
The weakening of Rupee against U.S. $ would have had an equal but opposite impact on loss after taxation.
The sensitivity analysis prepared is not necessarily indicative of the effects on loss for the year and liabilities of the Company.
42.2 Market risk
Market risk is the risk that the fair value or future cash flows of a financial instrument will fluctuate because of changes in market prices. Market risk comprises of three types of risks: currency risk, interest rate risk and price risk.
(a) Currency risk
Foreign currency risk arises mainly where receivables and payables exist due to transactions in foreign currencies. The Company is exposed to currency risk on import of packing materials, plant and machinery and stores and spares denominated in U.S. $. The Company's exposure to foreign currency risk for U.S. $ is as follows:
- Processing and pasteurisation were restricted to the availability of raw milk to the Company.
- Processing of UHT and Juice plants were restricted to the extent of filling capacity of the Company.
42. FINANCIAL RISK MANAGEMENT OBJECTIVES AND POLICIES
42.1 Financial Risk Factors
The Company's activities expose it to a variety of financial risks: market risk, credit risk and liquidity risk. The Company's overall risk management focuses on the unpredictability of financial markets and seeks to minimise potential adverse effects on the Company's financial performance.
Risk management is carried-out by the Company's finance department under policies approved by the board of directors. The Company's finance department evaluates financial risks based on principles for overall risk management as well as policies covering specific areas, such as foreign exchange risk, interest rate risk, credit risk and investment of excess liquidity, provided by the board of directors.
Rupees U.S.$ Rupees U.S.$
Bills payable 1,983,172 20,083 2,931,075 29,667
The following significant exchange rates have been applied:
2014 2013 2014 2013
U.S.$ to Rupee 102.91 94.41 98.75 98.80
Average rate
2014 2013
Reporting date rate

51
ANNUAL REPORT 2014
(c) Price risk
Price risk is the risk that the fair value or future cash flows of a financial instrument will fluctuate as a result of changes in market prices (other than those arising from interest rate risk or currency risk) whether those changes are caused by factors specific to the individual financial instruments or its issuer or factors affecting all similar financial instruments traded in the market. The Company is not exposed to any significant price risk.
42.3 Credit risk exposure and concentration of credit risk
Credit risk represents the risk of a loss if the counter party fails to discharge its obligation and cause the other party to incur a financial loss. The Company attempts to control credit risk by monitoring credit exposures, limiting transactions with specific counterparties and continually assessing the credit worthiness of counterparties.
Concentration of credit risk arise when a number of counterparties are engaged in similar business activities or have similar economic features that would cause their abilities to meet contractual obligations to be similarly affected by changes in economic, political or other conditions. Concentration of credit risk indicate the relative sensitivity of the Company's performance to developments affecting a particular industry.
Credit risk primarily arises from trade debts and balances with banks. To manage exposure to credit risk in respect of trade debts, management performs credit reviews taking into account the customer's financial position, past experience and other relevant factors. Where considered necessary, advance payments are obtained from certain parties. The management has set a maximum credit period of 45 days to reduce the credit risk. Credit risk on bank balances is limited as the counter parties are banks with reasonably high crediting ratings.
Cash flow sensitivity analysis for fix rate instruments
At June, 2014, if interest rate on fixed rate financial assets has been 1% higher / lower with all other variables held constant, loss after taxation for the year would have been Rs. 2.059 million (2013: Rs.0.060 million) lower / higher, mainly as a result of higher / lower interest income on fixed rate financial assets.
Cash flow sensitivity analysis for variable rate instruments
At June 30, 2014, if interest rate on variable rate financial liabilities has been 1% higher / lower with all other variables held constant, loss after taxation for the year would have been Rs.7.625 million (2013: Rs.5.101 million) higher / lower, mainly as a result of higher / lower interest expense on variable rate financial liabilities.
(b) Interest rate risk
Interest rate risk is the risk that the fair value or future cash flows of a financial instrument will fluctuate because of change in market interest rates. At the reporting date, the interest rate profile of the Company's interest bearing financial instruments is as follows:
2014 2013 2014 2013
Effective rate Carrying amount
- - - - Rupees - - - -
Fixed rate instruments
Financial assets
Bank balance at PLS account 6% to 7% 6% 109,304 103,460
Term deposit receipts 3.50% & 7% 7% 205,800,000 5,800,000
Variable rate instruments
Financial liabilities
Term finances 10.58% to 12.15% 10.56% to 13.24% 143,533,771 187,500,000
Islamic finances 4.75% to 13% 13.00% to 13.49% 207,269,750 21,000,000
Loans from chief executive
and a director 11.08% to 12.09% 140,000,000 70,000,000
Liabilities against assets
subject to finance lease 10.55% to 12.96% 10.81% to 15.35% 20,265,180 32,778,232
Short term finances 10.09% to 12.37% 10.08% to 13.97% 251,383,327 198,813,274
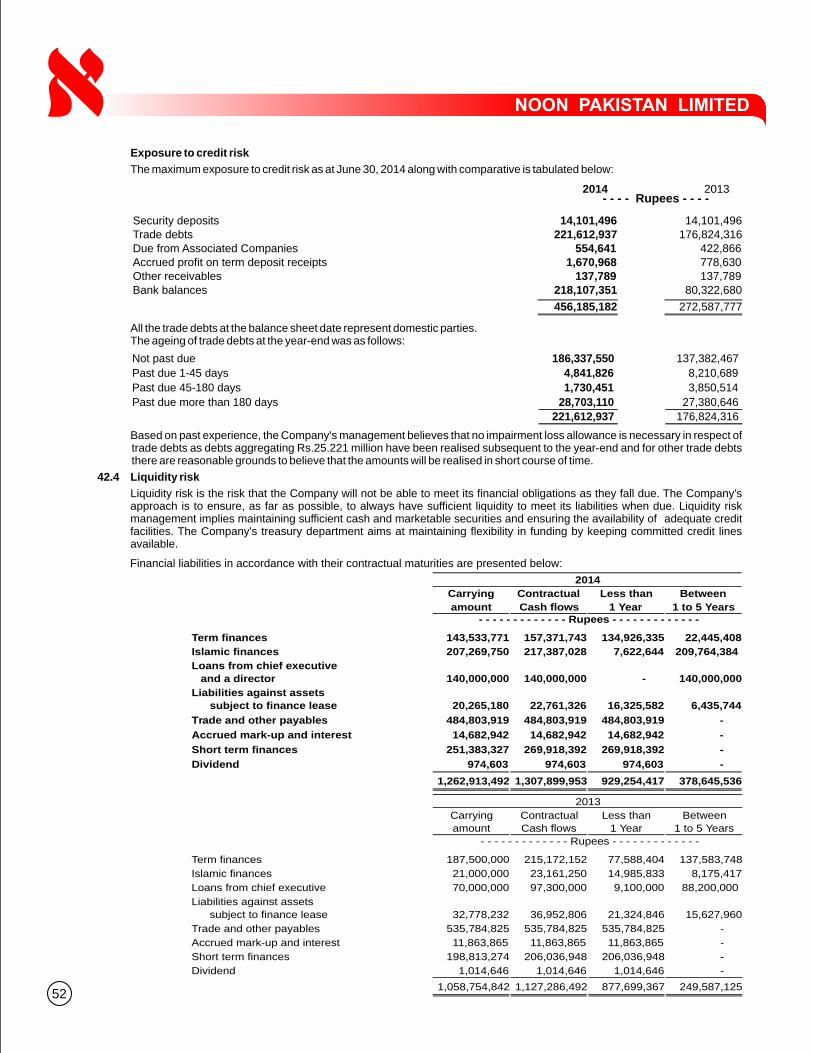
52
Financial liabilities in accordance with their contractual maturities are presented below:
All the trade debts at the balance sheet date represent domestic parties.The ageing of trade debts at the year-end was as follows:
Based on past experience, the Company's management believes that no impairment loss allowance is necessary in respect of trade debts as debts aggregating Rs.25.221 million have been realised subsequent to the year-end and for other trade debts there are reasonable grounds to believe that the amounts will be realised in short course of time.
42.4 Liquidity risk
Liquidity risk is the risk that the Company will not be able to meet its financial obligations as they fall due. The Company's approach is to ensure, as far as possible, to always have sufficient liquidity to meet its liabilities when due. Liquidity risk management implies maintaining sufficient cash and marketable securities and ensuring the availability of adequate credit facilities. The Company's treasury department aims at maintaining flexibility in funding by keeping committed credit lines available.
Exposure to credit risk
The maximum exposure to credit risk as at June 30, 2014 along with comparative is tabulated below:
2014 2013
Security depositsTrade debtsDue from Associated CompaniesAccrued profit on term deposit receiptsOther receivablesBank balances
- - - - Rupees - - - -
14,101,496221,612,937
554,6411,670,968
137,789218,107,351
456,185,182
14,101,496176,824,316
422,866778,630137,789
80,322,680
272,587,777
Not past due
Past due 1-45 days
Past due 45-180 days
Past due more than 180 days
186,337,550
4,841,826
1,730,451
28,703,110
221,612,937
137,382,467
8,210,689
3,850,514
27,380,646
176,824,316
Term finances
Islamic finances
Loans from chief executive
and a director
Liabilities against assets
subject to finance lease
Trade and other payables
Accrued mark-up and interest
Short term finances
Dividend
2014
Carrying
amount
Contractual
Cash flows
Less than
1 Year
Between
1 to 5 Years - - - - - - - - - - - - - Rupees - - - - - - - - - - - - -
143,533,771 157,371,743 134,926,335 22,445,408
207,269,750 217,387,028 7,622,644 209,764,384
140,000,000 140,000,000 - 140,000,000
20,265,180 22,761,326 16,325,582 6,435,744
484,803,919 484,803,919 484,803,919 -
14,682,942 14,682,942 14,682,942 -
251,383,327 269,918,392 269,918,392 -
974,603 974,603 974,603 -
1,262,913,492 1,307,899,953 929,254,417 378,645,536
Term finances
Islamic finances
Loans from chief executive
Liabilities against assets
subject to finance lease
Trade and other payables
Accrued mark-up and interest
Short term finances
Dividend
2013
Carrying
amount
Contractual
Cash flows
Less than
1 Year
Between
1 to 5 Years
- - - - - - - - - - - - - Rupees - - - - - - - - - - - - -
187,500,000 215,172,152 77,588,404 137,583,748
21,000,000 23,161,250 14,985,833 8,175,417
70,000,000 97,300,000 9,100,000 88,200,000
32,778,232 36,952,806 21,324,846 15,627,960
535,784,825 535,784,825 535,784,825 -
11,863,865 11,863,865 11,863,865 -
198,813,274 206,036,948 206,036,948 -
1,014,646 1,014,646 1,014,646 -
1,058,754,842 1,127,286,492 877,699,367 249,587,125

53
ANNUAL REPORT 2011ANNUAL REPORT 2014
The contractual cash flows relating to the above financial liabilities have been determined on the basis of interest / mark-up rates effective at the respective year-ends. The rates of interest / mark-up have been disclosed in the respective notes to these financial statements.
42.5 Fair value of financial instruments
Fair value is the amount for which an asset could be exchanged, or liability settled, between knowledgeable willing parties in an arm’s length transaction. Consequently, differences may arise between carrying values and the fair value estimates.
At June 30, 2014, the carrying values of all financial assets and liabilities reflected in the financial statements approximate to their fair values except for loans to employees and loans from chief executive and a director which are valued at their original costs less repayments.
43. CAPITAL RISK MANAGEMENT
The Company's prime objective when managing capital is to safeguard its ability to continue as a going concern so that it can continue to provide returns for shareholders, benefits for other stakeholders and to maintain a strong capital base to support the sustained development of its business.
The Company manages its capital structure by monitoring return on net assets and makes adjustments to it in the light of changes in economic conditions. In order to maintain or adjust the capital structure, the Company may adjust the amount of dividend paid to shareholders and / or issue new shares.
There was no change to the Company’s approach to capital management during the year and the Company is not subject to externally imposed capital requirements except for the maintenance of debt to equity ratio under the financing agreements.
44. INFORMATION ABOUT OPERATING SEGMENTS
For management purposes, the activities of the Company have been organised in one operating segment consisting of toned milk, milk powder, fruit juices, allied dairy and food products. The Company operates in the said reportable operating segment based on nature of products, risks and return, organisational and management structure and internal financial reporting systems. Accordingly, the figures reported in these financial statements relate to the Company's only reportable segment.
The operating interests of the Company are confined to Pakistan in terms of production areas and customers. Accordingly, the figures reported in these financial statements relate to the Company's only reportable segment relating to Pakistan.
The Company does not have any customer having sales of 10% or more during the years ended June 30, 2014 and June 30, 2013.45. EVENT AFTER THE REPORTING PERIOD
The Board of directors of the Company in their meeting held on May 14, 2014 decided to increase share capital of the company by issuance of 5 shares for every 4 shares held (voting and non-voting). These shares were issued to subscribers' after June 30, 2014. However, this event has been considered as non-adjusting event under IAS 10 "Events after the reporting period" and has not been recogised in these financial statements.
46. NUMBER OF EMPLOYEES
Number of employees as at June 30,
Average number of employees during the year,
47. GENERAL
These financial statements were authorised for issue on September 30, 2014 by the Board of Directors of the Company.
Corresponding figures have been re-arranged and reclassified, wherever necessary, for the purpose of comparison. However, no significant re-arrangement has been made in these financial statements
2014 2013
599 605
638 667
Chief Executive
SALMAN HAYAT NOON
Director
MIRZA SHOAIB BAIG


FORM OF PROXY
Registered Folio No./ CDC Account No.
I/We
of
of
or failing him
of
Proxies, in order to be effective must reach the Company's Registered office not less than 48 hours before the time for holding the meeting and must be duly stamped, signed and witnessed. Proxies of the Members through CDC shall be accompanied with attested copies of their CNIC.
SECP's circular no. 1 dated January 26th, 2000 is on the reverse side of the form.
Note:
Witness 1 Witness 2
Signature Signature
Name Name
Address Address
CNIC CNIC
Signature of Shareholder
As witness my hand this. Day of 2014.
(NAME)
(NAME)
(Address)
(NAME)
(Address)
being a member of NOON PAKISTAN LIMITED, hereby appoint
RevenueStamp
(also being a member of the Company) as my/our proxy to attend, act and vote for me / us and on my/our behalf at the
and at any adjournment thereof.
th47 Annual General Meeting of the Company to be held at 66 Garden Block, New Garden Town, Lahore on Thursday, 30 October, 2014 at 11:30 a.m.
ANNUAL REPORT 2014

SECURITIES AND EXCHANGE COMMISSION OF PAKISTAN
State Life Building 7, Blue Area, Islamabad
January 26, 2000
Circular No. 1 of 2000
Sub: GUIDELINES FOR ATTENDING GENERAL MEETINGS AND APPOINTMENT OF
PROXIES
The shares of a number of listed companies are now being maintained as "book entry Security” on the
Central Depository System (CDS) of the Central Depository Company of Pakistan Limited (CDC). It has
come to the notice of the Commission that there is some confusion about the authenticity of relevant
documents in the matter of beneficial owners of the shares registered in the name of CDC for purposes of
attending the general meetings and for verification of instruments of proxies. The issue has been
examined and pending the further instruction to be issued in this regard, the following guideline for the
convenience of the listed companies and the beneficial owners are laid down:
A. Attending of meeting in person by account holders and / or sub-account holders and persons whose
securities are in group account and their registration details are uploaded to CDS:
(1) The Company shall obtain list of beneficial owners from the CDC as per Regulation # 12.3.5 of the CDC
Regulations.
(2) In case of individuals, the account holder or sub-account holder and / or the person whose securities are in group account and their registration details are up-loaded as per the Regulations, shall authenticate his identity by showing his original Computerized National Identity Card (CNIC) or original passport at the time of attending the meeting.
(3) In case of corporate entity, the Board of Directors' resolution / power of attorney with specimen signature of the nominee shall be produced at the time of the meeting.
B. Appointment of Proxies
(1) In case of individual, the account holder or sub-account holder and / or the person whose securities are in group account and their registration details are uploaded as per the Regulations, shall submit the proxy form as per requirement notified by the Company.
(2) The proxy form shall be witnessed by the two persons whose names, addresses and CNIC numbers shall be mentioned on the form.
(3) Attested copies of CNIC or the passport of the beneficial owners and the proxy shall be furnished with the proxy form.
(4) The proxy shall produce his original CNIC or original passport at the time of the meeting.
(5) In case of corporate entity, the Board of Directors' resolution / power of attorney with specimen signature
shall be submitted alongwith proxy form to the Company.