Embed Size (px)
Citation preview

Land Development Agency
Annual Report 2013-14

Annual Report 2013-14

1ANNUAL REPORT 2013-14
Land Development Agency
Annual Report 2013-14

ISBN 978-0-642-60616-7
© Australian Capital Territory, Canberra 2014
This publication is subject to copyright. Except as permitted under the Copyright Act 2003, no part of it may in any form or by any means (electronic, mechanical, microcopying, photocopying, recording or otherwise) be reproduced, stored in a retrieval system or transmitted without prior written permission. Enquiries should be addressed to the Territory Records Office, ACT Government, GPO Box 158 Canberra City ACT 2601.
First published September 2014
Website – www.act.gov.au Produced by: ACT Government Publishing Services Publication No 14/0720 Printed on recycled paper
Front cover image: aerial shot of the Lawson development Back cover image: aerial shot of 'Southquay Greenway'
2 LAND DEVELOPMENT AGENCY
ContentsSection ATransmittal Certificate 7
Section BB.1. Organisational Overview 10
B.2. Performance Analysis 24
B.3. Community Engagement and Support 29
B.4. Ecologically Sustainable Development 36
Section CC.1. Internal Accountability 60
C.2. Risk Management and Internal Audit 69
C.3. Fraud Prevention 71
C.4. Legislative Assembly Inquiries and Reports 72
C.5. Auditor-General and Ombudsman Reports 73
Section DD.1. Public Interest Disclosure 76
D.2. Freedom of Information 77
D.3. Human Rights Act 81
D.4. Territory Records Act 82
D.5. Legal Services Directions 85
D.7. Bushfire Risk Management 86
D.8. Commissioner for the Environment 87
Section EE.1. Human Resources Management 90
E.2. Learning and Development 93
E.3. Work Health and Safety 95
E.4. Workplace Relations 97
E.5. Staffing Profile 99
3ANNUAL REPORT 2013-14
4 LAND DEVELOPMENT AGENCY
Section FF.1. Financial Management Analysis 104
F.2. Financial Statements 115
F.3. Capital Works 234
F.4. Asset Management 236
F.5. Government Contracting 237
F.6. Statement of Performance 240
Omissions Index 248
Glossary of Abreviations and Acronyms 249
Definition of Technical Terms 251
Compliance Index 252
Alphabetical Index 254


6 LAND DEVELOPMENT AGENCY

Transmittal Certificate
7ANNUAL REPORT 2013-14

8 LAND DEVELOPMENT AGENCY


B.1. Organisational Overview
OUR VISIONThe Land Development Agency (LDA) contributes positively to the economic and social development of the ACT by building vibrant and sustainable communities through greenfield and urban renewal projects for the development of residential, commercial, industrial, community and non-urban land.
MISSION AND VALUES The LDA strives to be an organisation of excellence that:
• recognises it is a key instrument for the delivery of ACT Government policies;
• acts commercially;
• promotes and rewards innovation;
• is adaptable;
• behaves ethically and professionally in all that it does; and
• appropriately values its people and its customers.
The LDA is committed to the core values of professionalism, honesty, integrity, innovation and cooperation, and pursues these values in all its business dealings.
The LDA is dedicated to achieving new standards of innovation, excellence and value in urban design and sustainable development. Its commitment has been recognised with multiple industry awards.
OUR ROLEThe LDA releases and develops government owned land for residential, commercial, industrial and community purposes. In doing so, the LDA seeks to balance potentially competing public sector and commercial priorities and provide opportunities for private sector development to optimise the community benefit from the ACT’s land assets.
ESTABLISHMENTThe LDA is a Territory authority established by section 31 of the Planning and Development Act 2007 (PDA). The LDA does not administer any enactments, but is bound by chapter 4 of the PDA. The PDA provides for planning (ACT Planning and Land Authority as custodian of the Territory Plan) and development (the LDA as land developer in compliance with the Territory Plan) in implementing a land system that contributes to the orderly and sustainable development of the ACT.
The LDA Governing Board is established by section 42 of the PDA and Board members are appointed under that section. The role of the Board is to govern the LDA in accordance with the Financial Management Act 1996 (FMA) and the PDA. The Board has appointed a LDA Board Audit and Risk Committee that meets at least quarterly.
10 LAND DEVELOPMENT AGENCY

Sec
tion
AS
ectio
n B
Sec
tion
CS
ectio
n D
Sec
tion
ES
ectio
n F
As part of the annual budget process, the Government approves a Statement of Intent for the LDA that sets out the objectives and deliverables for the LDA, including land release and revenue targets. An explanation of the LDA’s performance against these Statement of Intent estimates is provided at Section B.2 of this report, Performance Analysis.
The LDA must also comply with any directions given to it by the relevant Minister under section 37 of the PDA, and is staffed under the Public Sector Management Act 1994 (PSMA).
The Chief Executive Officer (CEO) of the LDA holds all the powers of a CEO of a Territory instrumentality under the PSMA. The CEO is a statutory office holder appointed under the FMA and is a member of the LDA Board. The role of the CEO is combined with the role of the Director-General, Economic Development, to manage the LDA in accordance with governance arrangements determined by the LDA Board.
FUNCTIONS AND SERVICESThe key objectives of the LDA, as set out in its 2013-14 Statement of Intent (SOI), were to:
• ensure that an adequate supply of greenfield and brownfield land will be maintained to meet market demand for residential, commercial, industrial and community use;
• contribute to the delivery of the Government’s policies and priorities related to affordable housing, sustainability, climate change and urban intensification;
• adopt a ‘One Government’ approach during the land development process through the cultivation and maintenance of productive relationships across the ACT Government;
• operate efficiently in the markets in which it operates and provide agreed returns to the Territory on its investment in the Agency;
• ensure that key commercial decisions on land in the ACT are made with due consideration to the sustainability of the Territory (that is, balancing economic, social and environmental factors); and
• engage the community in a timely manner in the land development process and continue to improve community engagement processes for redevelopments.
In attaining these objectives, the LDA’s core deliverables for 2013-14 were to:
• deliver the Government’s agreed Indicative Land Release Programs for residential, commercial, industrial and community land uses;
• provide timely support for direct sales of land by the Government;
• contribute to the delivery of the Capital Metro project;
• deliver quality and sustainable developments, including public realm and community development;
• provide a variety of land and housing options that set benchmarks for quality and timeliness in affordable housing, sustainable building and design;
• contribute to diversity in the supply of new housing in the Territory, reflective of current and anticipated demographic change;
• provide a safe working environment for LDA staff; and
• promote a safe and healthy workplace by the appropriate monitoring of contractors engaged by the LDA to ensure their work is conducted safely.
11ANNUAL REPORT 2013-14

CLIENTS AND STAKEHOLDERSOur primary client is the ACT community. The LDA engages with the community in relation to all facets of land release and development. The LDA actively seeks out, considers and acts on the views of the community to deliver appropriate and high quality land development outcomes which provide a social and financial return on the land asset.
Our primary stakeholder is the ACT Government. Other stakeholders include (in no particular order):
• the ACT community;
• industry and business groups;
• builders, suppliers and contractors;
• Community Councils and groups;
• National Capital Authority; and
• ACT Government directorates.
ORGANISATIONAL STRUCTURE The LDA is an agency within the Economic Development portfolio. Under a Memorandum of Understanding (MoU) between LDA and Economic Development, the two organisations share the provision of a range of management and support functions in the interests of efficiency. For example the LDA provides financial management services to Economic Development, while Economic Development provides community engagement and workforce and governance services to LDA. In addition, the CEO of LDA is also the Director-General of Economic Development, while the Deputy Director-General Land Development and Corporate of Economic Development is also the Deputy CEO of LDA.
Office of the Chief Executive Officer
The LDA functional responsibilities of the Office of the Chief Executive Officer include:
• preparation and monitoring implementation of the LDA SOI;
• provision of policy, secretariat and administrative support to the LDA Board and Audit and Risk Committee;
• facilitation of the LDA’s responses to issues raised by the community, industry and other Government agencies; and
• leading community engagement activities associated with land development in the Territory.
Land Development
The LDA functional responsibilities of Land Development (Greenfield and Urban Renewal):
• development of Government-owned land for release for residential, commercial, industrial, community and non-urban purposes as indicated in the ACT Government’s Indicative Land Release Programs (ILRP);
• obtaining relevant approvals, including environmental, development and detail design;
• providing due diligence to inform the ILRP and resolving strategic environmental and planning issues for projects that are to be released in the ILRP out years;
12 LAND DEVELOPMENT AGENCY
Sec
tion
AS
ectio
n B
Sec
tion
CS
ectio
n D
Sec
tion
ES
ectio
n F
• assessing sites for potential future release and development, including Master Plan delivery in line with the ACT Government’s ILRP;
• procurement and project management of consultant, civil and landscape construction works;
• working with the Economic Development Infrastructure and Capital Works branch to maximise the efficient and timely delivery of LDA estate works with interfacing capital works;
• management of the Civil Engineering Services Panel;
• supporting the Government’s direct sales by undertaking investigations and minor civil works;
• undertaking the LDA’s Minor Works Program;
• being at the forefront of sustainable design through the review of projects by the LDA Design Review Panel (DRP); and
• supporting the delivery of environmentally and socially sustainable land developments and construction through the LDA estates projects.
Operational support:
• maintaining the LDA Risk Register;
• monitoring project master program and Key Performance Indicators;
• management of legal and compliance matters for the LDA; and
• development and maintenance of Work Health and Safety systems to meet obligations under the Work Health and Safety Act 2011.
Sales, Marketing and Land Management
The responsibilities of the Sales, Marketing and Land Management section include:
• management of the marketing and sale of residential, commercial, industrial and community land;
• management of all valuation services, requests, briefs and approval;
• undertaking land management services, including land custodian and licence arrangements;
• manage LDA corporate branding;
• providing strategic advice to LDA executive on the land release program;
• providing initial and ongoing advice to all project teams on new suburbs, precincts and development sites on product mix, type and affordable housing options;
• management of the LDA Panel of Commercial and Residential Property Agents;
• maintaining and building associations with external stakeholders; and
• management of the Mingle Community Development Program.
13ANNUAL REPORT 2013-14

Strategic Finance
The LDA’s Strategic Finance Branch is accountable for delivery of value-added tactical and strategic financial services, support, analysis and advice to the LDA Board and other key stakeholders. The Branch is also responsible for a range financial compliance activities including, statutory financial reporting, taxation administration and financial framework development and implementation.
14 LAND DEVELOPMENT AGENCY

Sec
tion
AS
ectio
n B
Sec
tion
CS
ectio
n D
Sec
tion
ES
ectio
n F
OUR STRUCTURE – AS AT 30 JUNE 2014
Director-General, Economic Development DirectorateChief Executive Officer, Land Development Agency
Coordinator-GeneralDavid Dawes
Minister for Economic Development Minister for Sport and Recreation Minister for Tourism and Events
Minister Barr
Minister for Racing and GamingMinister Burch
Land Development Agency
Governing Board
Executive DirectorCorporate
Vacant
Director Strategic FinanceDermot Walsh
A/g Director Workforce and Governance
Joanne Rosewarne
Executive DirectorPolicy, Projects and Legislation
Louise Gilding
DirectorInfrastructure and Capital Works
Glenn Lacey
Deputy Director-General, Land Development and CorporateDeputy Chief Executive Officer, Land Development Agency
Dan Stewart
Executive DirectorLand Development
Chris Reynolds
DirectorUrban Renewal
Paul Lewis
Sales, Marketing and Land Management
Director Clint Peters
DirectorChange Management
Anita Hargreaves
ACT Gambling and Racing CommissionGoverning Board
Chief Executive Officer ACT Gambling and Racing Commission
Greg Jones
DirectorOffice of the Director-General/
Chief Executive OfficerChris Wilson
Communications DirectorAlison Abernethy
Deputy Director-GeneralBusiness, Tourism, Events and Sport
Gary Rake
Executive DirectorInnovation, Trade and Investment
Ian Cox
General ManagerVenue and Event Services
Neale Guthrie
DirectorVisitCanberra
Ian Hill
DirectorSport and Recreation Services
Jenny Priest
Exhibition Park CorporationGoverning Board
General Manager Exhibition Park Corporation
Liz Clarke
Represents the Land Development Agency.
Represents the other areas of the Economic Development Portfolio (the Economic Development Directorate, the ACT Gambling and Racing Commission and Exhibition Park Corporation) that produce separate Annual Reports.
15ANNUAL REPORT 2013-14

REPORT BY THE CHAIROn behalf of the Land Development Agency Board, management and staff, I am pleased to present the Agency’s 2013-14 Annual Report.
Despite some challenging market conditions the Land Development Agency has been able to achieve substantial outcomes over the last year.
Land for 3,299 dwellings has been released. While short of our ambitious target of 4,800, these releases have provided the Canberra community with a wide range of future housing options.
Highlights have included the initial release of single residential and medium density sites in Lawson in the heart of Belconnen. This release of sites for 674 dwellings met with a very enthusiastic response. Located just three kilometres from the Belconnen town centre and directly across from a major university. Lawson will eventually accommodate around 1,850 dwellings in a mix of low, medium and higher density development.
Equally successful was the market response to the release of five medium sites, totalling 528 dwellings, at the intersection of Anzac Parade and Constitution Avenue in Campbell. The sale of these sites will realise $65 million in revenue.
Another major urban infill project underway is the ‘Southquay Greenway’ in the Tuggeranong Lake area. This development represents a boost for the Tuggeranong region and the land sales to date reflect the positivity in the local market. Land for 306 dwellings was released this year.
In terms of greenfield development, the suburb of Moncrieff in Gungahlin is under development with an initial release of land for 500 dwellings being offered to small builders through a ‘Put and Call Options’ process to stimulate the local market. Moncrieff will eventually comprise a mixture of around 2,000 single residential, medium and high density multi-unit developments, along with the usual commercial and community amenities. We expect that Moncrieff will provide some great opportunities for affordable first home purchases.
As part of the stimulus package that the Government announced in March 2014, the Land Development Agency is facilitating the accelerated development of Moncrieff. This work is providing a welcome stimulus to the Canberra capital works sector.
In addition to these major new developments, the Land Development Agency is continuing to deliver residential, commercial and community land in a range of new and established suburbs across Canberra. At present demand for large scale industrial land has been met and the Land Development Agency has a inventory of available industrial land.
As we look forward, major developments at Denman Prospect in Molonglo and at West Belconnen will continue to contribute to meeting the housing needs of the Canberra community. In the slightly longer term, the City to the Lake project and plans for the redeveloping of the Northbourne Avenue corridor will provide some new precincts that will transform major areas of inner Canberra. The Land Development Agency will continue to pursue opportunities for the future development of other infill and greenfield developments to provide Canberrans with a range of housing options.
16 LAND DEVELOPMENT AGENCY

Sec
tion
AS
ectio
n B
Sec
tion
CS
ectio
n D
Sec
tion
ES
ectio
n F
The Land Development Agency is aware that it makes an important financial contribution to the ACT budget. The Agency’s total return to the Government in 2013-14 was some $150 million. A similar return is expected in 2014-15.
The Land Development Agency is proud of its continuing contribution to environmental protection and to the quality of the design of LDA estates. This focus will continue into the future. Similarly, the Land Development Agency will continue with its active and successful program of community engagement on proposed new projects and in supporting the development of communities in new estates.
Following the success of the Franklin Charity House project in 2013 the Land Development Agency is working closely with the ACT Government and the Master Builders Association to plan another Charity House project. I look forward to building further on the very positive outcomes that have been achieved through these projects.
I was very pleased to see Land Development Agency projects nominated in a range of local and national Awards. In particular the Crace Joint Venture was recognised in several awards, including being named Property Development of the Year at the ACT Property Council awards. The project also received national recognition at the 2014 Property Council of Australia/Rider Levett Bucknall Innovation and Excellence Awards for the Best Master Planned Community. Crace was awarded for offering the highest levels of community, sustainability and amenity. Other developments nominated for awards during the year included Kingston Foreshore and Bonner Residential Estate.
My very sincere thanks to my fellow Board Members, namely Deputy Chair Rob Tonkin, Sandra Lambert, Susan Proctor and Jim Shonk for their wise and practical input.
Finally, on behalf of the Board, I would like to thank the Land Development Agency CEO David Dawes, his executives and staff, and the wide range of companies that contribute to the delivery of our projects. They can be very pleased with their contributions and achievements during 2013-14.
Ross Barrett OAM LDA Board Chair
17ANNUAL REPORT 2013-14

CHIEF EXECUTIVE OFFICER REPORTIn 2013-14 the LDA has progressed a number of transformational projects that will further contribute to the vibrancy and liveability of Canberra.
As a priority project for the ACT Government, City to the Lake is one of Australia’s largest urban renewal projects. At its core City to the Lake is about connecting Canberrans and Australians to Canberra, creating a city that is vibrant, modern and dynamic.
The core elements of the project include:
• increasing residents in the city (about 15,000-20,000);
• attracting more tourists and increasing their length of stay;
• creating a great new public waterfront;
• improving lake water quality; and
• delivering key infrastructure (in partnership with the private sector where relevant), including:
the Australia Forum (a convention and exhibition centre);
a multi-use, potentially indoor, stadium;
an aquatic centre with an urban beach; and
realignment of Parkes Way to allow easy access to West Basin.
This is just one of over a dozen LDA development projects being progressed across the Territory, from Greenway in the south to West Belconnen and Bonner in the north, as well as significant development activity in Molonglo and Lawson.
With the LDA now in its 11th year, I am mindful that, as a quasi-commercial entity, the Agency must keep pace with and be responsive to industry.
To this end, in May 2014 I engaged KPMG to undertake a functional review of the LDA. This review is considering whether the LDA’s current business model is the optimum arrangement to position the LDA for the medium term (five to ten years) and whether there are different delivery models that could be utilised to better achieve the LDA’s business objectives. This review will also compare the LDA to other government land development agencies in terms of cost and output.
We have also continued to build on the close working relationship we have with other Australian and New Zealand Government Land Organisations (GLO), including participating in a GLO conference held in New Zealand during May 2014. Through these relationships, we are able to learn from the experiences of other jurisdictions to help guide best practice in our own work.
Residential Land Releases
Land release for residential development remains a key focus for the LDA. In 2013-14, residential land releases totalled sites for 3,299 dwellings, compared with the target of 4,800. The total number released includes sites for single residential or detached dwellings and multi-unit developments in LDA estates, LDA joint ventures, and a range of direct sales in locations across Canberra.
18 LAND DEVELOPMENT AGENCY

Sec
tion
AS
ectio
n B
Sec
tion
CS
ectio
n D
Sec
tion
ES
ectio
n F
A number of scheduled releases did not occur due to a combination of delays or deferrals in provision of infrastructure, Commonwealth environmental clearances, high levels of existing supply in town centres and regulatory processes. These factors caused delays to the following key sites:
• 1,200 dwelling sites in Belconnen;
• 300 dwellings in Downer;
• 300 dwelling sites in Throsby;
• 294 dwelling sites in Kingston; and
• 100 dwelling sites on Northbourne Avenue.
To counter these delays, a number of alternative residential sites programmed for release in future years were accelerated into 2013-14. The major additional releases came from the LDA estates on Flemington Road, and at Campbell, Kingston and Coombs.
The LDA delivered sites across Canberra with releases in new estates in Lawson, Campbell, Greenway, Amaroo and Moncrieff, along with the existing estates of Flemington Road and Coombs, the LDA joint venture at Crace and various infill sites. The joint venture estate at Crace released the final 25 dwelling sites.
The proposed release of land for aged care at the Village Creek school site at Kambah was not delivered due to delays in the demolition of existing buildings on the site.
Despite some contamination issues at Kingston Foreshore, the project released 151 dwelling sites just short of its target of 194 in addition to the release and sale of 303 dwelling sites that has been withdrawn from sale due to environmental delays in 2011.
Commercial and industrial land releases
The LDA released 74,585 sqm of commercial land in 2013-14, compared with the target of 122,438 sqm. The shortfall was mainly due to high levels of existing supply and corresponding lack of demand in town centres.
The results of the various auction and ballot processes show that confidence in the local market remains strong, with particularly strong results in Lawson and Campbell which attached strong bidding both from local, interstate and international buyers.
A similar sentiment is not being seen with respect to industrial land, where no releases were made in 2013-14 due to a significant inventory of serviced land being available.
Inventory levels
The LDA is working to grow its inventory of serviced residential land to provide maximum choice and flexibility for potential purchasers. As at 30 June 2014, six single residential blocks were held in inventory.
As noted above, an inventory of serviced industrial land has been established with over 67,629 sqm available for sale in the New West Estate at Hume.
19ANNUAL REPORT 2013-14

Work Health and Safety
With a goal of achieving best practice work health and safety outcomes on all sites that the LDA commissions, work health and safety continues to be an important component of the workplace culture.
The Interim Guidelines for Managing Work Health and Safety in the Construction Industry developed in 2012-13 have been embedded into the work that we do and guide how our LDA project directors and managers involved in construction projects deliver all stages of a construction project.
Internally, the LDA continues to implement the actions identified in the Work Health and Safety Strategic Plan.
Housing affordability initiatives
Since the release of the Affordable Housing Action Plan in 2007 (AHAP), the Government has made concerted efforts to improve housing affordability in the Territory. Now in its third phase, the AHAP includes a total of 98 separate actions that aim to address a wide range of issues impacting affordability.
The most fundamental issue driving housing affordability is housing supply. To this end, the LDA is working to improve and accelerate the Land Release Program. Significant increases in housing supply have been achieved over the last several years. However, the strength of the ACT economy and our attractiveness as a place to live has seen our population grow at record levels in recent years, underpinning high levels of demand for housing in both homeowner and rental markets.
Due to a combination of increased supply and more recent economic conditions and concerns about the local implications of the recent Federal election, housing prices have stabilised compared to the rapid growth seen at the end of the last decade. In addition, our rental markets, which tend to house our low and moderate income households, have eased their vacancy rates and in many cases have had price reductions.
This approach, of addressing supply constraints, coupled with a suite of other policies and concessions, such as a requirement for 20 per cent of housing in greenfield estates to meet affordability criteria, have been and will continue to increase the supply of affordable housing in Canberra.
The LDA also provides the option for eligible purchasers of land in LDA residential estates to take up a Land Rent Lease. LDA blocks were part of the Land Rent Scheme for releases in Dunlop, Franklin, Bonner, Harrison 4, Jacka, Wright and Coombs.
Sustainability and Climate Change
The LDA has continued to incorporate the principles of ecologically sustainable development into its activities. Sustainability data from all LDA projects is reported under eight key themes:
• energy and emissions;
• water;
• landscape and biodiversity;
• waste and materials;
20 LAND DEVELOPMENT AGENCY

Sec
tion
AS
ectio
n B
Sec
tion
CS
ectio
n D
Sec
tion
ES
ectio
n F
• influencing design;
• community;
• transport; and
• affordability.
This reporting gives an indication of sustainability measures undertaken by the LDA, including the introduction of some innovative water sensitive urban design technologies and use of the Design Review Panel.
Wright and Coombs achieved EnviroDevelopment reaccreditation from the Urban Development Institute of Australia (UDIA). Accreditation was also achieved for ‘Scope’, the demonstration precinct at Coombs, which is the first to achieve all six EnviroDevelopment ‘leaves’ in the ACT.
The LDA has also been a sponsor of the Green Star – Communities rating tool being developed by the Green Building Council of Australia. This is a national scheme to assess the sustainability of community-level projects and the LDA is piloting the tool in Lawson and West Belconnen.
Financial outcome
The LDA’s total income and profits in 2013-14 while lower than the levels achieved in the previous financial year continue to be significant. Total income was $269.2 million ($322.4 million in 2012-13) and profit before tax of $95.2 million ($155.0 million in 2012-13). The change from 2012-13 was primarily due to a decrease in land sales revenue. The LDA achieved $235.9 million in land sales revenue in 2013-14, which was $26.9 million lower than 2012-13. There were decreased sales in LDA estates, including Bonner, Harrison 4, Jacka and Wright estates and lower demand in the commercial sector, partially offset by increased sales in Coombs, Amaroo and Kingston Foreshore.
This decrease was primarily due to lower than anticipated land sales settlements, partially offset by a higher share of operating profit from joint ventures.
As at 30 June 2014, the LDA had exchanged sales contracts totalling $331.6 million, the majority of which are scheduled to settle in 2014-15. This level of carry forward of exchanged contracts demonstrates the scale of the LDA’s activities and achievements during 2013-14. As a consequence, the LDA remains in a strong position to continue to make a significant contribution to the Territory’s finances in 2014-15.
Community engagement
As part of our commitment to building a better Canberra with the community, the Directorate has improved upon and increased its focus on community engagement activities to keep Canberrans informed. This has been done by using both online and traditional tools to communicate and ensure that information is provided in a timely manner, as well as providing on-going advice where required, on matters of interest. Advertising and information dissemination, as well as the usual engagement activities, were undertaken in relation to future land releases, road works and other development associated activities were also undertaken.
The LDA’s community engagement activities play a vital role in producing a range of high quality opportunities for residential, commercial and industrial, community and non-urban development across the ACT.
21ANNUAL REPORT 2013-14

Greater engagement with LDA project teams and community councils across the ACT has lead to improved outcomes for the both LDA and the community. Consistent with the ACT Government’s commitment to the principles of ‘open government’, all community engagement is evaluated against the key performance indicators of engaging with the community in a meaningful, accountable, responsive and equitable way. Evaluation identifies improvements to engagement practises and allows best practice models to be developed.
Community engagement activities included:
• Campbell 5 works/remediation;
• Canberra Brickworks + Environs Planning and Development Strategy;
• Blocks 40 and 41 Section 6 Dickson redevelopment;
• Southquay Greenway development;
• Block 19 Section 10 and Block 2 Section 11 Higgins release and redevelopment options;
• Block 21 Section 45 Holder Proposed Territory Plan Variation;
• Block 1 Section 443 Kambah (former Village Creek Primary School) preparation of site for release;
• Section 239 Kambah (former Urambi Primary School) preparation of site for release;
• Kingston Former Transport Depot remediation;
• Lawson remediation works;
• Section 3 Parkes development;
• Block 16 Section 3 Phillip redevelopment;
• Throsby Master plan;
• Block 1 Section 115 and Block 8 Section 1 Symonston Proposed Territory Plan Variation; and
• Block 9 Section 64 Watson Environment Protection Biodiversity Conservation (EPBC) Process.
The LDA again hosted the Canberra International Music Festival event at Kingston Foreshore, with strong positive feedback from Kingston residents and the broader Canberra Community. The Mingle program also has proved its success in building vibrant communities in Gungahlin and the program was rolled out in the Molonglo suburbs of Wright and Coombs in 2013-14. The program is tailored for each suburb to suit demographics, resident feedback and proximity to surrounding services.
I would like to finish by acknowledging the contribution of the LDA Board Chair and all Board Members.
I would also like to acknowledge the hard working staff within the LDA for their enthusiastic and positive contribution throughout 2013-14.
David Dawes Chief Executive Officer
22 LAND DEVELOPMENT AGENCY
Sec
tion
AS
ectio
n B
Sec
tion
CS
ectio
n D
Sec
tion
ES
ectio
n F
FUTURE PRIORITIESIn June 2014, the ACT Government published its 2014-15 to 2017-18 Indicative Land Release Program, which sets out the Government’s intended program of residential, commercial, industrial and community land releases over the next four years.
The program includes a four year-residential target of 13,500 dwelling sites – 4,500 fewer dwellings sites than the previous four year program. This reduction, achieved predominately by delaying the release of sites for apartments, reflects anticipated easing in the Territory’s population growth rate and easing housing demand as a result of Commonwealth Government spending cuts.
However, the Government, through the LDA, remains committed to achieving an inventory of serviced land and will make every effort to ensure land is made available to meet demand as it arises.
Recent sales results in areas such as Campbell and Lawson indicate there is still confidence in Canberra’s property markets.
The LDA’s key deliverables for 2014-15 are to:
• deliver the Government’s Indicative Land Release Program (ILRP) for residential, commercial, industrial and community land uses;
• provide timely support for direct sales of land by the Government;
• support the delivery of urban intensification along the Capital Metro corridor;
• deliver high quality, sustainable developments, including public realm and community development;
• provide a variety of land and housing options that set benchmarks for quality and timeliness in sustainable building and design;
• contribute to diversity in the supply of new housing in the Territory, reflective of current and anticipated demographic change; and
• pursue development opportunities where such opportunities would be consistent with the Government’s policy framework for land acquisitions.
23ANNUAL REPORT 2013-14

B.2. Performance Analysis
2013-14 Objective 1
Ensure that an adequate supply of greenfield and brownfield land will be maintained to meet market demand for residential, commercial, industrial and community uses.
The four-year Residential Indicative Land Release Program is intended to satisfy underlying housing demand as well as meeting the additional demand for detached housing in greenfield estates. In addition, the release program is intended to allow the Land Development Agency to establish an inventory of serviced land and meet additional demand generated by the Government’s affordable housing initiatives, including the Land Rent Scheme.
In 2013-14, the Land Development Agency released 3,299 dwelling sites to the market. This compared with a target of 4,800 in the Indicative Land Release Program. The main reasons for this shortfall were:
• delay in achieving necessary planning clearances for 600 dwelling sites in Throsby and Downer; and
• the deferral of the release of sites for 1,050 apartments on Sections 21, 22, 23 and 152 Belconnen due to the existing supply of available apartments in the Belconnen Town Centre.
Major residential land releases in 2013-14 included:
• Moncrieff – 500 dwelling.
• Campbell – 528 dwellings.
• Lawson – 674 dwellings.
• Greenway – 306 dwellings.
• Coombs – 392 dwellings.
Residential land releases were also made in Harrison, Franklin, Amaroo, Bonner, Ngunnawal, Crace, Watson and Kingston.
The Commercial Indicative Land Release Program includes a supply of mixed use commercial land predominately to support the demand for infill housing and related commercial properties. The LDA released 74,585 sqm of commercial land in 2013-14, against a target of 122,438 sqm. The main reasons for this shortfall were:
• the delay of large apartment sites in the Belconnen Town Centre as mentioned earlier, which included 28,581 sqm for commercial development;
• the delay of 8,550 sqm on Section 19 Kingston due to the ongoing negotiation to consolidate the site with the adjoining service station;
• the delay of 10,391 sqm on part Section 24 Stirling to allow for a Territory Plan variation to be finalised; and
• the delay of site 10 at Kingston Foreshore, 10,309 sqm due to decontamination issues.
24 LAND DEVELOPMENT AGENCY

Sec
tion
AS
ectio
n B
Sec
tion
CS
ectio
n D
Sec
tion
ES
ectio
n F
Major Commercial Land Releases in 2013-14 included:
• Amaroo 6,107 sqm.
• Franklin 21,348 sqm.
• Greenway 17,948 sqm.
• Kingston 15,114 sqm.
• Campbell 21,473 sqm.
The Industrial Indicative Land Release Program in recent years has resulted in the demand for industrial land being met and an inventory of serviced land established. As at 30 June 2014, the LDA held an inventory of 15 industrial blocks totalling 80,487 sqm of industrial land. No industrial land was released in 2013-14.
The Community Facility and Non-Urban land release program continues to supply a large volume of land required to support community needs arising from Canberra’s urban growth. 161,697 sqm was released in 2013-14 against a target of 98,929 sqm. The actual volume of land released by direct sale can vary significantly, as the release of many sites is subject to acceptance of an offer by the proponent or a development application approval. The principal community land release in 2013-14 was 146,553 sqm for a tourist facility in Gungahlin.
2013-14 Objective 2
Contribute to the delivery of the Government’s policies and priorities related to affordable housing, sustainability, climate change and urban intensification.
Affordable Housing
All Land Development Agency greenfield estates met the Government’s policy of delivering 20 per cent affordable housing in 2013-14. This was achieved in the Flemington Road and Coombs developments via Performance Delivery Agreements that required no less than 20 per cent of dwellings constructed to be sold at or below the affordable housing thresholds provided in the Affordable Housing Action Plan.
Land Rent – In accordance with the Government’s Affordable Housing Action Plan, the Land Development Agency also provides the option for eligible purchasers of land in residential estates to take up a Land Rent Lease.
As part of the 2013-14 Budget, the Government announced that, from 1 October 2013, the Land Rent Scheme would be retargeted to moderate income households. This means that land released by the LDA since October 2013 can only be leased under the Land Rent Scheme by lessees who meet the eligibility criteria for the Land Rent Scheme discount rate. That is, the household’s income, where there are no dependent children, must not exceed $160,000; the lessee must reside in the property; and the lessee cannot own other real estate. This also effectively means that businesses are no longer able to obtain new land under the Land Rent Scheme.
Under these changes, once a lessee exceeds the eligibility criteria for two consecutive years, they are now required to either convert their Land Rent Scheme lease to a standard crown lease, or transfer the property to another eligible lessee. These changes
25ANNUAL REPORT 2013-14

to the Land Rent Scheme do not apply retroactively, and Land Rent Scheme leases for blocks released prior to October 2013 continue to operate under the same terms and conditions as they did originally.
Housing Affordability Fund – Building on the success of the Land Development Agency’s previous Commonwealth Housing Affordability Fund agreements, the agency invested in further affordable housing at Crace and Harrison. The total $13.9 million allocated, has now been spent.
Sustainability and Climate Change
The Land Development Agency has continued to incorporate the principles of ecologically sustainable development into its activities. Sustainability data is collated from all Land Development Agency projects covering eight key themes:
• energy and emissions;
• water;
• landscape and biodiversity;
• waste and materials;
• influencing design;
• community;
• transport; and
• affordability.
This reporting gives an indication of sustainability measures undertaken by the Land Development Agency, including the introduction of innovative water sensitive urban design technologies and use of the Design Review Panel.
A detailed report on sustainability measures is available at B.4.
Wright and Coombs achieved EnviroDevelopment reaccreditation from the Urban Development Institute of Australia (UDIA). Accreditation was also achieved for ‘Scope’, the demonstration precinct at Coombs, which is the first to achieve all six EnviroDevelopment ‘leaves’ in the ACT.
The Land Development Agency has also been a sponsor of the Green Star – Communities rating tool being developed by the Green Building Council of Australia. This is a national scheme to assess the sustainability of community-level projects and the Land Development Agency is piloting the tool in Lawson and West Belconnen.
26 LAND DEVELOPMENT AGENCY

Sec
tion
AS
ectio
n B
Sec
tion
CS
ectio
n D
Sec
tion
ES
ectio
n F
2013-14 Objective 3
Adopt a ‘One Government’ approach during the land development process through the cultivation and maintenance of productive relationships across the ACT Government.
The Land Development Agency worked closely with the Economic Development Directorate and other relevant directorates to provide technical input to several inter-directorate working groups and committees that assist in coordinating land delivery. This includes: the Infrastructure and Capital Works Working Group to improve the integration of design management and delivery of capital works with estate works; the Pipeline Constraints and Supply Working Group to identify and resolve blockages and constraints to timely land release; the Demand Analysis and Monitoring Working Group; and the Land Supply Committee.
The Land Development Agency also provided detailed technical advice to assist in resolving land development issues with the Commonwealth, on sites such as Ngunnawal 2C, Bonner 4, Campbell Section 5 and Watson, especially in relation to obtaining environmental clearances under the Commonwealth’s Environment Protection and Biodiversity Conservation Act 1999.
2013-14 Objective 4
Operate efficiently in the markets in which it operates and provide agreed returns to the Territory on its investment in the agency.
Land Development Agency land sales revenue for 2013-14 totalled $235.9 million.
As at 30 June 2014, the value of exchanged contracts held by the LDA was $331.6 million (ex GST), of which $233.3 million are scheduled to settle in 2014-15.
The Land Development Agency's overall Return to Government for 2013-14 (including Dividend and returns on land sales) totalled $153 million.
2013-14 Objective 5
Ensure that key commercial decisions on land in the ACT are made with due consideration to the sustainability of the Territory (that is by balancing economic, social and environmental factors).
The Land Development Agency ensures its key commercial decisions on land are made with due consideration to the sustainability of the Territory by identifying and integrating economic, social and environmental factors into decision-making. These elements are set out in the project business plans that are reviewed by the Design Review Panel, and approved by the Land Development Agency Board for all major developments.
27ANNUAL REPORT 2013-14

2013-14 Objective 6
Engage the community in a timely manner in the land development process and continue to improve community engagement processes for redevelopments.
Greater engagement between project teams and community councils across the ACT has led to improved outcomes for the both the Land Development Agency and the community. Consistent with the ACT Government’s commitment to the principles of ‘open government’, all community engagement is evaluated against the key performance indicators of engaging with the community in a meaningful, accountable, responsive and equitable way. Evaluation identifies improvements to engagement practices and allows best practice models to be developed.
See also section B.3 for more information on community engagement.
Further information may be obtained from:
Director, Office of the Chief Executive Phone: (02) 6205 2697
28 LAND DEVELOPMENT AGENCY

Sec
tion
AS
ectio
n B
Sec
tion
CS
ectio
n D
Sec
tion
ES
ectio
n F
B.3. Community Engagement and Support
Mingle Program Overview 2013-14The Land Development Agency (LDA) approach to community engagement is based on the ACT Government Guideline, Engaging Canberrans: A Guide to Community Engagement. Community engagement is a function delivered by the Economic Development Directorate, through the Memorandum of Understanding between the two agencies.
The LDA continues to implement its community development program Mingle, which is designed to build vibrant local communities within new LDA estates. The program aims to achieve a number of social objectives based around the notion of encouraging new residents to feel part of the community and become involved in community life and activities. Mingle ultimately assists residents to create networks, groups and programs that will become self-sustaining.
The program is tailored for each suburb to suit demographics, resident feedback and proximity to surrounding services. The LDA continues to work closely with other ACT Government Directorates to help meet program objectives and to deliver events.
In 2013-14 the Mingle program was launched in Molonglo Valley (Wright and Coombs) with six community events conducted including the Launch Workshop, Brunch in the Park, Fitness Classes, Skills and Drills day with the ACT Brumbies and a tree planting day with Greening Australia. The participation of residents was considerable given the relatively low number of occupied houses in these suburbs. The LDA has engaged a Community Development Officer through Communities@Work to assist with planning and delivery of the Mingle program in Wright and Coombs. The level of community development activities will increase in line with the number of residents moving into the Molonglo Valley.
The program was continued in Bonner with five community events organised in 2013-14. Events included a photography competition, Trivia Night, Emergency Services Day, Party at the Shops and support for the Neville Bonner Primary School’s Car Boot Sale. The Mingle program supported activities of local community organisations including Communities@Work and My Gungahlin.
The Mingle program was concluded in Franklin in 2013-14 with the last community event, the Bike Safety Brunch, held in November 2013. Mingle continues to support community initiatives in Franklin including sponsorship of the Neighbourhood Watch Newsletter.
Activities across Franklin, Bonner, Wright and Coombs were supported by quarterly newsletters, online communications, letterbox delivery and social media.
In May 2014 the LDA hosted the third annual Canberra International Music Festival at Kingston Foreshore. The LDA delivered this event with support from the Canberra International Music Festival. The Festival has helped to foster community development for local residents as well as showcasing Kingston Foreshore to the wider Canberra
29ANNUAL REPORT 2013-14
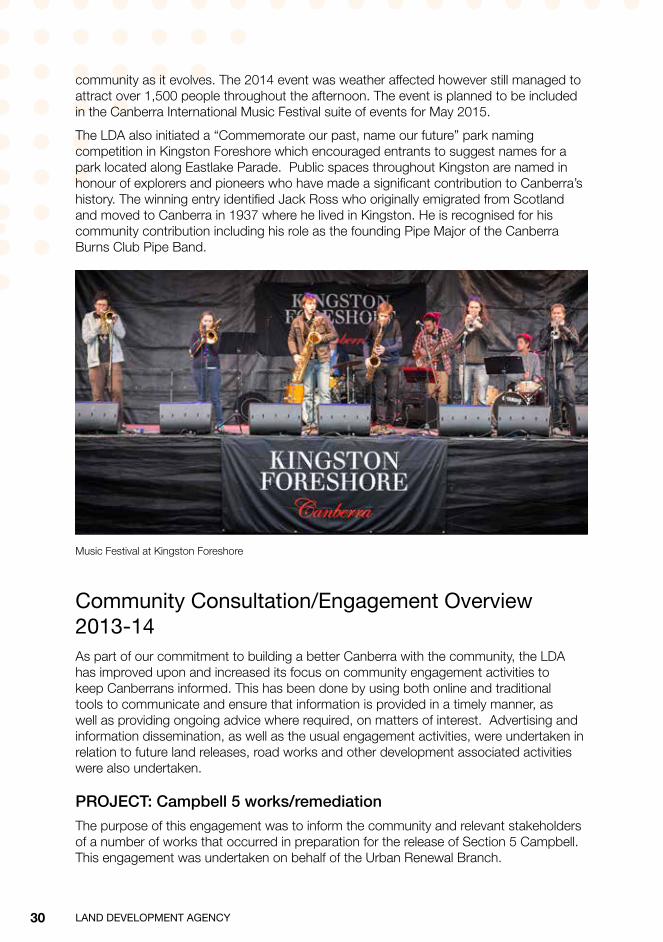
community as it evolves. The 2014 event was weather affected however still managed to attract over 1,500 people throughout the afternoon. The event is planned to be included in the Canberra International Music Festival suite of events for May 2015.
The LDA also initiated a “Commemorate our past, name our future” park naming competition in Kingston Foreshore which encouraged entrants to suggest names for a park located along Eastlake Parade. Public spaces throughout Kingston are named in honour of explorers and pioneers who have made a significant contribution to Canberra’s history. The winning entry identified Jack Ross who originally emigrated from Scotland and moved to Canberra in 1937 where he lived in Kingston. He is recognised for his community contribution including his role as the founding Pipe Major of the Canberra Burns Club Pipe Band.
Music Festival at Kingston Foreshore
Community Consultation/Engagement Overview 2013-14As part of our commitment to building a better Canberra with the community, the LDA has improved upon and increased its focus on community engagement activities to keep Canberrans informed. This has been done by using both online and traditional tools to communicate and ensure that information is provided in a timely manner, as well as providing ongoing advice where required, on matters of interest. Advertising and information dissemination, as well as the usual engagement activities, were undertaken in relation to future land releases, road works and other development associated activities were also undertaken.
PROJECT: Campbell 5 works/remediation
The purpose of this engagement was to inform the community and relevant stakeholders of a number of works that occurred in preparation for the release of Section 5 Campbell. This engagement was undertaken on behalf of the Urban Renewal Branch.
30 LAND DEVELOPMENT AGENCY

Sec
tion
AS
ectio
n B
Sec
tion
CS
ectio
n D
Sec
tion
ES
ectio
n F
Tools used to engage the community included letters and project update newsletters to the North Canberra Community Council (NCCC) and residents and businesses in Campbell and a portion of Reid; LDA web updates; LDA and EDD social media; ACT Government Community Noticeboard press; ACT Government Time to Talk website; and signage.
Outcome: Residential and Commercial development in June 2014.
PROJECT: Canberra Brickworks + Environs Planning and Development Strategy
The purpose of this engagement was to inform and consult with the community and relevant stakeholders regarding the Canberra Brickworks + Environs Planning and Development Strategy. This engagement was undertaken on behalf of the Urban Renewal Branch.
Tools used to engage the community included letters and project update newsletters to the Inner South Canberra Community Council (ISCCC), Yarralumla and Deakin Residents’ Association and residents and businesses in Yarralumla, Deakin and Curtin; LDA and EDD web updates; LDA and EDD social media; ACT Government Community Noticeboard press; ACT Government Time to Talk website; Project Reference Group; information sessions; Open day and guided tours; and signage.
Outcome: Community consultation is ongoing for this project.
PROJECT: Blocks 40 and 41 Section 6 Dickson Redevelopment
The purpose of this engagement was to inform the community and relevant stakeholders of the proposed redevelopment of Blocks 40 and 41 Section 6 Dickson and the lodgement of a Development Application. This engagement was undertaken on behalf of the Urban Renewal Branch.
Tools used to engage the community included letters to the NCCC, Dickson Resident’s Association and residents and businesses in close proximity to the site; presentations to key stakeholders including ACT Heritage Council; LDA and EDD web updates; LDA and EDD social media; ACT Government Community Noticeboard press; ACT Government Time to Talk website; and signage.
Outcome: Community engagement is ongoing for this project.
PROJECT: Block 4 Section 61 Downer Redevelopment
The purpose of this engagement was to inform and consult with the community and relevant stakeholders on the proposed redevelopment of Block 4 Section 61 Downer. This engagement was undertaken on behalf of the Urban Renewal Branch.
Tools used to engage the community included letters to the NCCC, Downer Residents’ Association and residents and businesses in Downer and in close proximity to the site; presentations to key stakeholders; meetings with Downer Reference Group; LDA and EDD web updates; LDA and EDD social media; ACT Government Community Noticeboard press; ACT Government Time to Talk website; signage.
Outcome: This site has been an ongoing joint venture between ACT Government and the Downer community. The site is currently under negotiation by direct sale to an
31ANNUAL REPORT 2013-14

organisation which is also a part of the Downer Reference Group work group.
Outcome: Community engagement is ongoing for this project.
PROJECT: Southquay Greenway Development
The purpose of this engagement was to inform the community and relevant stakeholders of the development of Southquay in Greenway. This engagement was undertaken on behalf of the Urban Renewal Branch.
Tools used to engage the community included letters to the Tuggeranong Community Council (TCC), residents and businesses in close proximity to the site and patrons and employees of the Tuggeranong Hyperdome; presentations to key stakeholders; LDA and EDD web updates; LDA and EDD social media; ACT Government Community Noticeboard press; ACT Government Time to Talk website; and signage.
Outcome: Two sites sold in March 2014 and community engagement will be ongoing for this project.
PROJECT: Block 19 Section 10 and Block 2 Section 11 Higgins Release and Redevelopment Options
The purpose of this engagement was to inform and consult with the community and relevant stakeholders regarding the former Higgins school site and decommissioned oval and options for redevelopment and release. This engagement was undertaken on behalf of the Urban Renewal Branch.
Tools used to engage the community included letters to the Belconnen Community Council (BCC), residents and businesses in Higgins and within close proximity to the site, and Ginninderra MLAs; presentations to key stakeholders; drop-in information sessions; facilitated workshop; LDA and EDD web updates; LDA and EDD social media; ACT Government Community Noticeboard press; ACT Government Time to Talk website; and signage.
Outcome: Community engagement report pending.
PROJECT: Block 21 Section 45 Holder Proposed Territory Plan Variation
The purpose of this engagement was to inform and consult with the community and relevant stakeholders regarding Block 21 Section 45 Holder and options for redevelopment and release. This engagement was undertaken on behalf of the Direct Sales team.
Tools used to engage the community included letters to the Weston Creek Community Council (WCCC), residents and businesses in Holder and within close proximity to the site; drop-in information sessions; LDA and EDD web updates; LDA and EDD social media; engagement with Montessori School; ACT Government Community Noticeboard press; ACT Government Time to Talk website; and signage.
Outcome: Community engagement report pending.
32 LAND DEVELOPMENT AGENCY
Sec
tion
AS
ectio
n B
Sec
tion
CS
ectio
n D
Sec
tion
ES
ectio
n F
PROJECT: Block 1 Section 443 Kambah (former Village Creek Primary School) preparation of site for release
The purpose of this engagement was to inform the community and relevant stakeholders of the intention to lodge a Development Application with the Environment and Sustainable Development Directorate for the demolition of Section 443 Kambah in preparation for the release of the site. This engagement was undertaken on behalf of the Urban Renewal Branch.
Tools used to engage the community included letters to the Tuggeranong Community Council (TCC) and residents and businesses in close proximity to the site; EDD web updates; EDD social media; ACT Government Community Noticeboard press; ACT Government Time to Talk website; and signage.
Outcome: These activities were for information purposes and further engagement will be undertaken as the project progresses.
PROJECT: Section 239 Kambah (former Urambi Primary School) preparation of site for release
The purpose of this engagement was to inform the community and relevant stakeholders of the intention to lodge a Development Application with the Environment and Sustainable Development Directorate for the demolition of Section 239 Kambah in preparation for the release of the site. This engagement was undertaken on behalf of the Urban Renewal Branch.
Tools used to engage the community included letters to the TCC and residents and businesses in close proximity to the site; EDD web updates; EDD social media; ACT Government Community Noticeboard press; ACT Government Time to Talk website; and signage.
Outcome: These activities were for information purposes and further engagement will be undertaken as the project progresses.
PROJECT: Kingston Former Transport Depot Remediation
The purpose of this engagement was to inform the community and relevant stakeholders of the remediation works that were being undertaken on the Former Transport Depot in Kingston. This engagement was undertaken on behalf of the Estate Development Branch, Kingston Foreshore team.
Tools used to engage the community included letters to the ISCCC, Old Bus Depot Market stall holders, Kingston and Barton Resident’s Group (KBRG) and residents and businesses in close proximity to the site; briefings to key stakeholders including the Old Bus Depot Market stall holders; EDD and LDA web updates; EDD and LDA social media; ACT Government Community Noticeboard press; ACT Government Time to Talk website; and signage.
Outcome: These activities were for information purposes and further engagement will be undertaken as the project progresses. The roof replacement works were completed successfully and the second stage of works are now underway.
33ANNUAL REPORT 2013-14
PROJECT: Lawson Remediation works
The purpose of this engagement was to inform the community and relevant stakeholders of a number of works that were occurring in preparation for the release of Lawson. This engagement was undertaken on behalf of the Estate Development Branch.
Tools used to engage the community included letters to the BCC and residents, schools and businesses in close proximity to the site; LDA and EDD web updates; LDA and EDD social media; ACT Government Community Noticeboard press; ACT Government Time to Talk website; and signage.
Outcome: Remediation works occurred successfully and all blocks offered for sale were sold during 2013-14.
PROJECT: Section 3 Parkes Development
The purpose of this engagement was to inform and consult with the community and relevant stakeholders regarding the future development of Section 3 Parkes. This engagement was undertaken on behalf of the Urban Renewal Branch.
Tools used to engage the community included letters to the NCCC, residents and businesses in Reid and Campbell, Canberra Institute of Technology Reid students and car park users; stakeholder briefing; drop-in information sessions; LDA and EDD web updates; LDA and EDD social media; ACT Government Community Noticeboard press; ACT Government Time to Talk website; and signage.
Outcome: This project is ongoing.
PROJECT: Block 16 Section 3 Phillip Redevelopment
The purpose of this engagement was to inform the community and relevant stakeholders of the closure of the car park and redevelopment of Block 16 Section 3 Phillip. This engagement was undertaken on behalf of the Urban Renewal Branch.
Tools used to engage the community included letters to the Woden Valley Community Council (WVCC), surrounding business owners and tenants and car park users; LDA and EDD web updates; LDA and EDD social media; ACT Government Community Noticeboard press; ACT Government Time to Talk website; and signage.
Outcome: This site was sold as Mixed Use in April 2013 and engagement activities continued until the site was closed.
PROJECT: Throsby Master plan
The purpose of this engagement was to inform the community and relevant stakeholders of the Master Plan and planned release of Throsby. This engagement was undertaken on behalf of the Estate Development Branch.
Tools used to engage the community included a letter to the Gungahlin Community Council (GCC); presentations to the GCC, The Bush on the Boundary Reference Group and Mulligans Flat Nature Reserve Board; LDA and EDD web updates; LDA and EDD social media; ACT Government Community Noticeboard press; ACT Government Time to Talk website; and signage.
Outcome: These activities were for information purposes and further engagement may be undertaken as the project progresses.
34 LAND DEVELOPMENT AGENCY

Sec
tion
AS
ectio
n B
Sec
tion
CS
ectio
n D
Sec
tion
ES
ectio
n F
PROJECT: Block 1 Section 115 and Block 8 Section 1 Symonston Proposed Territory Plan Variation
The purpose of this engagement was to inform and consult with the community and relevant stakeholders regarding a proposed Territory Plan Variation for Block 1 Section 115 and Block 8 Section 1 Symonston. This engagement was undertaken on behalf of the Estate Development Branch.
Tools used to engage the community included letters to the ISCCC, TCC and residents, businesses and tenants within close proximity to the site; drop-in information sessions; LDA and EDD web updates; LDA and EDD social media; ACT Government Community Noticeboard press; ACT Government Time to Talk website; and signage.
Outcome: Non-contentious site that has been added to the Omnibus Territory Plan Variation Process for late 2014.
PROJECT: Block 9 Section 64 Watson Environment Protection Biodiversity Conservation (EPBC) Act Process
The purpose of this engagement was to notify the community and relevant stakeholders of the EPBC Act process for Block 9 Section 64 Watson in preparation for the release of the site. This engagement was undertaken on behalf of the Urban Renewal Branch.
Tools used to engage the community included letters to the NCCC, Watson Residents Association, Friends of Mount Majura and residents and businesses in close proximity to the site; presentation to the NCCC; EDD web updates; EDD social media; ACT Government Community Noticeboard press; Public Notices; ACT Government Time to Talk website; and signage.
Outcome: The EPBC Act process was completed and the site was sold for Residential purposes in February 2014.
GRANTS/ASSISTANCE/SPONSORSHIPRecipient Project Project Purpose Amount
University of Canberra Construction Research Project
Co-funded construction and waste minimisation research project.
$5,000
Australian National University
PhD scholarship funding. Maintenance of hollow bearing trees in urban developments including assessing the effectiveness of nesting boxes replacing hollow bearing trees.
$16,500
Further information may be obtained from:
Director, Office of the Chief Executive Phone: (02) 6205 2697
35ANNUAL REPORT 2013-14

B.4. Ecologically Sustainable Development
BackgroundEach year the LDA comprehensively reports on sustainability in its core business – land development. This approach covers environmental, social and economic considerations in LDA operations, thus helping to address the principles of Ecologically Sustainable Development.
The 2013-14 LDA SOI outlined a commitment by the LDA to ‘contribute to the delivery of the Government’s policies and priorities related to affordable housing, sustainability, climate change and urban intensification’ and to ‘ensure that key commercial decisions on land in the ACT are made with due consideration to the sustainability of the Territory (that is by balancing economic, social and environmental factors)’. The SOI also included six non-financial Key Performance Indicators (KPIs). In this section of the Annual Report, the LDA is addressing the KPIs covering urban water cycle management, biodiversity and landscape and design excellence. The KPIs regarding housing affordability and sustainable community programs are also partially addressed in this section.
In 2013-14 the LDA has continued to focus on delivering urban intensification in a sustainable way in line with ACT Government targets. Of the projects reported on in this section, more than half are located in existing urban areas. These sites help to increase density in town centres and along transport corridors, and provide a diversity of housing options for Canberra. In many of these sites the LDA needs to balance complex requirements such as decontamination and the creation of quality urban open spaces.
The LDA also has a number of achievements that have received industry recognition. Wright and Coombs have received recertification under the ecosystems, energy, waste and community categories of the Urban Development Institute of Australia (UDIA) EnviroDevelopment program. The design and planning for the Molonglo Demonstration Precinct, located in Coombs, achieved all six EnviroDevelopment categories including materials and water. This was the first project in the ACT to achieve all six categories.
Lawson and West Belconnen are registered pilot projects for the Green Star – Communities rating tool developed by the Green Building Council of Australia (GBCA). This is a national scheme to assess the sustainability of community-level projects. The LDA, with other Government land organisations, has been a sponsor of the tool.
36 LAND DEVELOPMENT AGENCY

Sec
tion
AS
ectio
n B
Sec
tion
CS
ectio
n D
Sec
tion
ES
ectio
n F
Sustainability ThemesThe LDA has identified the following key sustainability themes for reporting in its projects:
• energy and emissions;
• water;
• landscape and biodiversity;
• waste and materials;
• influencing design;
• community;
• transport; and
• affordability.
A swale in Bonner. When it rains this helps to slow the flow of water and improve water quality.
37ANNUAL REPORT 2013-14

Reporting PhasesLDA projects progress through a process of development. Different stages of this process have been targeted as Reporting Phases. The four Phases cover the major steps that are necessary for an area of land to be developed and sold, and are divided by key Milestones.
38 LAND DEVELOPMENT AGENCY

Sec
tion
AS
ectio
n B
Sec
tion
CS
ectio
n D
Sec
tion
ES
ectio
n F
Due Diligence Phase Reporting
The Due Diligence Phase refers to projects where due diligence procedures are being undertaken to ensure the land is ready for development (for example ecological, contamination and other studies). These processes influence ‘where, what and how’ development will occur on each site. This Phase includes LDA projects that have yet to reach sale or Business Plan Approval for 2013-14.
In 2013-14, 36 sites were reported within the Due Diligence Phase. This includes three sites for which the LDA undertook assessments on behalf of the Economic Development Directorate.
Planning Phase Reporting
The Planning Phase includes LDA projects where more detailed planning is underway. This Phase includes projects that are between Business Plan Approval and Estate Development Plan Approval for 2013-14.
In 2013-14, seven LDA projects were reported within the Planning Phase.
Civil Works Phase Reporting
The Civil Works Phase refers to projects where planning is complete but civil works and landscaping activities are underway. This Phase includes LDA projects that are between Estate Development Plan Approval and handover of assets for 2013-14.
In 2013–14, seven LDA projects were reported within the Civil Works Phase.
Post Occupancy Phase Reporting
The Post Occupancy Phase refers to projects where civil works have been completed, assets have been handed over, and people are living or working in the area. LDA projects are reported in this Phase until the end of LDA involvement.
In 2013-14, six LDA projects were reported within the Post Occupancy Phase.
39ANNUAL REPORT 2013-14

Projects Reported in 2013–14The following table indicates each project and its reporting Phase/s for 2013–14.
Project Name Type of Development
Approx Total Site Area (ha)
Due Diligence
Planning Civil Works Post Occupancy
Amaroo Group Centre
Mixed Use 4.3 X
Belconnen Lathlain St Precinct
Residential, Commercial, Community
2.5 X
Belconnen Section 48
Mixed Use 1.9 X
Belconnen Section 149
Mixed Use 1.6 X
Belconnen Section 152
Mixed Use, Residential
0.6 X
Bonner Residential suburb 230.9 X
Campbell 5 Mixed Use, Residential
6.4 X
Canberra Brickworks + Environs
Mixed Use, Residential
42 X
Coombs Residential suburb 79 X
Denman Prospect Stage 1A
Residential suburb 53 X
Denman Prospect Stage 1B, 2 and 3
Residential suburb 328 X
Dickson Section 72 Community, Residential
3.5 X
Franklin Residential suburb 200.7 X
Fyshwick Section 45 Industrial 98 X
Fyshwick Section 47 Industrial 36 X
Gungahlin Town Centre East
Mixed Use 38 X
Hume New West Industrial 56 X
Jacka 1 Residential suburb 19 X
Jacka North Residential suburb 173 X
40 LAND DEVELOPMENT AGENCY

Sec
tion
AS
ectio
n B
Sec
tion
CS
ectio
n D
Sec
tion
ES
ectio
n F
Project Name Type of Development
Approx Total Site Area (ha)
Due Diligence
Planning Civil Works Post Occupancy
Kenny Residential suburb 352 X
Kingston Foreshore High density residential, Commercial
44.5 X X X X
Lawson Stage 1 Residential suburb 50 X
Lawson Stage 2 Mixed Use, Residential
30 X
Molonglo Residential suburb 116 X
Molonglo Demonstration Precinct
Residential 1.6 X
Molonglo 3 Residential suburb TBC X
Moncrieff Residential suburb 191 X
Northbourne Avenue Corridor
Mixed Use, Residential
6.55 X
Parkes Section 3 Mixed Use 3.4 X
Pialligo Industrial TBC X
SouthQuay Greenway
Mixed Use, Residential
24 X
Symonston Industrial 37 X
Taylor Residential suburb 302 X
Throsby Residential suburb 106 X
West Belconnen Mixed Use, Residential
1600 X
Woden Furzer St Precinct
Mixed Use 2.35 X
Wright Residential suburb 80 X X
Urban Releases Various single block or section releases
15 sites
Total LDA Projects Reported in 2013–14 36 7 7 6
41ANNUAL REPORT 2013-14

Notes:
It is important to note that the planning and land development process often occurs over several years. Accordingly, many projects will report on the same Phase for two or more consecutive years.
The number of projects reported within any given year can vary significantly in response to the ILRP. This must be considered when undertaking any comparisons between reporting periods.
A project may be divided into different stages for reporting if some areas are at a different Phase to other areas. For example a project may have some areas where civil works are still being conducted while residents have moved into other areas. This is the case with Jacka, where Stage 1 has progressed to the Post Occupancy Phase, while Jacka North is still in the Due Diligence Phase.
Equivalents to key milestones may be used as alternatives in some cases. For example, approval by the National Capital Authority may be used as an alternative to Estate Development Plan approval for projects in designated areas.
A number of projects crossed key Milestones during 2013–14. If the Milestone (such as Estate Development Plan approval) occurred during the financial year the project was required to report on whichever Phase applied for the majority of the given financial year. If the Milestone occurred close to halfway through the financial year then the project was required to report on both applicable Phases.
Work on a number of new projects also commenced during 2013–14. These projects have now been included for sustainability reporting.
Some LDA sites are sold as englobo sites after the Due Diligence Phase. Therefore, not all projects will proceed from the Due Diligence Phase to the Planning Phase. In these cases, once the project has progressed through the Due Diligence Phase, this is regarded as the end of LDA involvement.
The LDA also engages in Joint Venture projects that are largely managed by the Joint Venture Partner. LDA involvement is reduced following Business Plan approval, with Business Plans being approved by the Joint Venture Management Committee rather than the LDA Board. For these reasons, Joint Venture Projects have not been reported against in 2013–14.
42 LAND DEVELOPMENT AGENCY

Sec
tion
AS
ectio
n B
Sec
tion
CS
ectio
n D
Sec
tion
ES
ectio
n F
Sustainability IndicatorsThe LDA has developed a selection of indicators to be used for reporting on environmental, social and economic sustainability during the land development process. Indicators reflect on non-financial operations that the LDA controls and influences directly. The indicators are grouped by theme and separated by Reporting Phases. Projects within an individual Phase will only report on the indicators directly related to that Phase.
2011–12 was the first time that this approach to sustainability reporting had been used by the LDA in the Annual Report. Evaluation of the indicators has taken place each year, resulting in some amendments and additions.
Due Diligence (DD) Planning (PL) Civil Works (CW) Post Occupancy (PO)
Energy and emissions
Solar access Public lighting
Rebate schemes or mandates
Water Catchment management analysis and/or flooding studies
Water Sensitive Urban Design (WSUD)
Sediment and erosion control
WSUD monitoring
Landscape and biodiversity
Ecological assessments
Tree assessments
Contamination studies
Geotechnical assessments
Bushfire risk assessments
Public open space
Protection of threatened species, populations and ecological communities
Protection or management of identified areas of ecological importance
Tree protection
Weed and pest control
Waste and materials
Cut and fill minimisation
Recycled or reused materials
Influencing design Design Review Panel
Project evaluation
Community Community engagement
Heritage assessments
Noise assessments
Community engagement
Protection or management of identified areas of heritage importance
Residential community programs
43ANNUAL REPORT 2013-14

Due Diligence (DD) Planning (PL) Civil Works (CW) Post Occupancy (PO)
Transport Traffic and parking assessments
Public transport proximity
Pedestrian and cycle networks and facilities
Area of roads
Affordability Planning for affordability
Affordable dwellings
Land Rent blocks
Energy and EmissionsReporting Phase Indicators 2011–12 2012–13 2013–14
PL Percentage of LDA projects that comply with or exceed solar access requirements
100% 100% 100%
CW Percentage of LDA projects that comply with or exceed public lighting energy efficiency standards
100% 100% 100%
CW LDA projects that used rebate schemes or mandates to encourage use of efficient appliances and hot water
5 projects 4 projects 4 projects
Solar Access
Solar access requirements are outlined in the Territory Plan. In all LDA estates, the layout and orientation of streets and blocks are designed to facilitate good solar access once dwellings have been built.
Public Lighting
Public lighting in LDA projects must meet energy efficient design standards. Several LDA projects have promoted or trialled energy efficient lighting above usual standards.
In Stage 1 of Lawson, street lights are being installed to allow for LED luminaires.
Rebate Schemes or Mandates
Rebate schemes or mandates have been used in some LDA residential estates to encourage the use of efficient appliances and hot water systems.
Rebates for the installation of energy efficient heating and cooling systems have continued to be offered to residents in Wright and Coombs. In Stage 1 of Lawson, a rebate will apply to energy meters for single residential dwellings. The LDA has also continued to offer a rebate scheme for the industrial estate at Hume New West.
44 LAND DEVELOPMENT AGENCY

Sec
tion
AS
ectio
n B
Sec
tion
CS
ectio
n D
Sec
tion
ES
ectio
n F
WaterReporting Phase Indicators 2011–12 2012–13 2013–14
DD Number of catchment management analysis and/or flooding studies conducted for LDA projects
4 (catchment management only)
10 8
PL Percentage of LDA projects with WSUD strategies appropriate to the size and location of the projects
100% 100% 100%
CW Percentage of LDA projects that have met or exceeded sediment and erosion control requirements
100% 100% 100%
PO LDA projects that have post occupancy water monitoring
1 1 0
Catchment Management Analysis and Flooding Studies
Catchment management analysis studies assess a development’s impact on drainage, existing water bodies or water courses and ground water. In 2012–13 this indicator was amended to include flooding studies. Flooding studies are conducted for smaller development sites to assess potential flooding risks and the impact that development may have on flooding.
Water Sensitive Urban Design
Water sensitive urban design (WSUD) is included in all new developments under the Territory Plan, as part of the ACT Government’s broader strategy of responsible water resource management. WSUD seeks to use a more sustainable approach by integrating water management into urban development.
In the 2013–14 LDA SOI, a non-financial KPI required all LDA projects to have a specific WSUD strategy appropriate to the size and location of the project. This target has been achieved with all LDA projects reported during the Planning Phase having WSUD strategies in place.
In Parkes Section 3, on street rain gardens are proposed to deliver WSUD targets. Other initiatives are currently being explored through the development of the Preliminary Sketch Plan design.
The LDA has installed a range of different innovative WSUD technologies to assist in filtering stormwater runoff and improving water quality. This includes Stratacell™ at the Amaroo Group Centre and Hydrocon™ in Wright and Coombs.
Sediment and Erosion Controls
Sediment and erosion controls help to ensure that no pollutants run off from a site. Pollutants can contribute to environmental degradation and the devastation of terrestrial and aquatic ecosystems.
45ANNUAL REPORT 2013-14

Sediment ponds, silt fences and stormwater diversions are examples of sediment and erosion control methods used in LDA projects. For example in Kingston Foreshore, stormwater upstream of work sites has been diverted and earth has been compacted to avoid run off.
Post Occupancy Water Monitoring
None of the projects in the Post Occupancy Phase had water monitoring actively undertaken by the LDA in 2013–14. One of the projects, Kingston Foreshore, has had water monitoring undertaken previously and on average met or exceeded the modelled water quality targets. However this monitoring was not continued for 2013–14. The LDA is investigating options for other water monitoring in the future, including linkages with other ACT Government agencies.
Landscape and biodiversityReporting Phase Indicators 2011–12 2012–13 2013–14
DD Number of ecological assessments conducted for LDA projects
26 42 30
DD Number of tree assessments conducted for LDA projects
33 37 21
DD Number of contamination studies undertaken (and remediation conducted as required) for LDA projects
26 41 36
DD Number of geotechnical assessments conducted for LDA projects
No historical data – indicator introduced in 2012–13
39 22
DD Number of bushfire risk assessments conducted for LDA projects
4 7 7
PL Area of public open space included in LDA projects
74ha of 242ha total site area
149ha of 339ha total site area
104ha of 269ha total site area
PL Amount of land set aside or created for the protection of threatened species, populations and ecological communities
83ha 112ha Nil
(NB: No projects in this Phase had threatened species, populations or ecological communities identified)
46 LAND DEVELOPMENT AGENCY
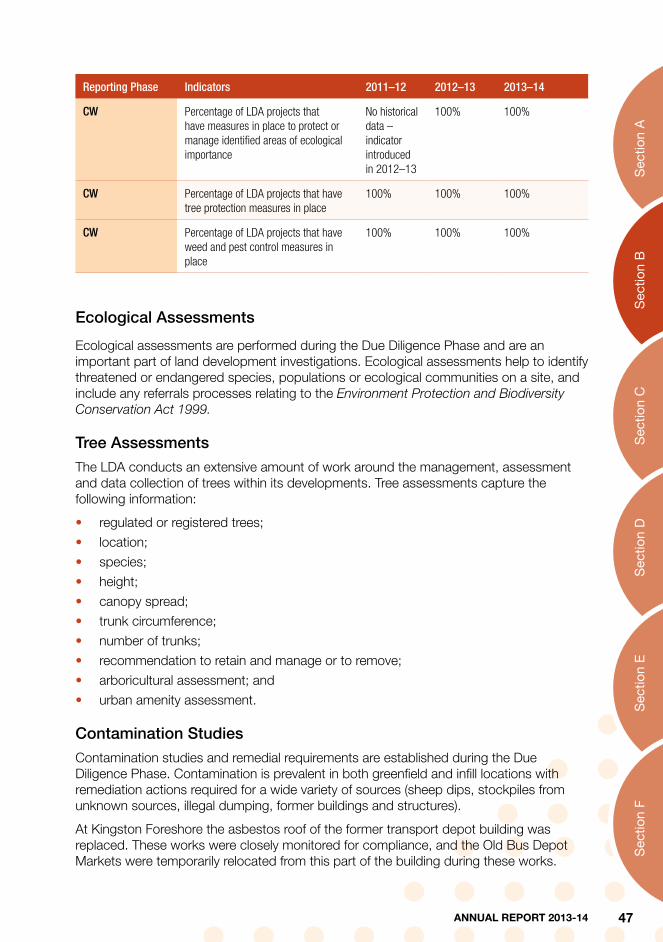
Sec
tion
AS
ectio
n B
Sec
tion
CS
ectio
n D
Sec
tion
ES
ectio
n F
Reporting Phase Indicators 2011–12 2012–13 2013–14
CW Percentage of LDA projects that have measures in place to protect or manage identified areas of ecological importance
No historical data – indicator introduced in 2012–13
100% 100%
CW Percentage of LDA projects that have tree protection measures in place
100% 100% 100%
CW Percentage of LDA projects that have weed and pest control measures in place
100% 100% 100%
Ecological Assessments
Ecological assessments are performed during the Due Diligence Phase and are an important part of land development investigations. Ecological assessments help to identify threatened or endangered species, populations or ecological communities on a site, and include any referrals processes relating to the Environment Protection and Biodiversity Conservation Act 1999.
Tree Assessments
The LDA conducts an extensive amount of work around the management, assessment and data collection of trees within its developments. Tree assessments capture the following information:
• regulated or registered trees;
• location;
• species;
• height;
• canopy spread;
• trunk circumference;
• number of trunks;
• recommendation to retain and manage or to remove;
• arboricultural assessment; and
• urban amenity assessment.
Contamination Studies
Contamination studies and remedial requirements are established during the Due Diligence Phase. Contamination is prevalent in both greenfield and infill locations with remediation actions required for a wide variety of sources (sheep dips, stockpiles from unknown sources, illegal dumping, former buildings and structures).
At Kingston Foreshore the asbestos roof of the former transport depot building was replaced. These works were closely monitored for compliance, and the Old Bus Depot Markets were temporarily relocated from this part of the building during these works.
47ANNUAL REPORT 2013-14

In Campbell 5, extensive remediation works were required to remove asbestos that was illegally dumped at the site some time ago prior to LDA involvement. This has required the safe removal of a large quantity of contaminated soil from the site.
The LDA has also facilitated a number of assessments to check for and remove any Unexploded Ordnance, particularly in Molonglo 3, Molonglo and Denman Prospect. This is necessary to make sure the Molonglo Valley is made safe for future land development and recreational uses.
Geotechnical Assessments
Geotechnical assessments are conducted to assess whether areas are suitable for future construction and development.
Bushfire Risk Assessments
Developments adjoining potentially fire prone areas require bushfire risk assessments to be conducted.
Public Open Space
The area of public open space refers to all areas that are zoned as Parks and Recreation and Non-Urban in the Territory Plan.
For developments in the Planning Phase, the LDA has contributed around 39 per cent of the total land area to open space in 2013–14.
Protection of Threatened Species, Population and Ecological Communities
The LDA is responsible for reserving and managing areas of land in order to protect threatened species, populations or ecological communities. These sites can include land reserved onsite (within the development) or off-site (including offset areas). Once construction commences the LDA implements measures to protect threatened species, populations or ecological communities located onsite.
Tree Protection
Tree Management Plans are required for LDA projects where trees are identified for retention and management through tree assessments, undertaken during the Due Diligence Phase. Tree Management Plans describe how trees within a development will be protected and managed through the Civil Works Phase when earthworks and construction take place.
Over 1,800 trees were planted (including street trees and trees in landscaped areas) and over 700 trees retained within LDA developments during 2013–14. This is approximately five times more trees planted or retained than were removed in the process of land development.
48 LAND DEVELOPMENT AGENCY

Sec
tion
AS
ectio
n B
Sec
tion
CS
ectio
n D
Sec
tion
ES
ectio
n F
Weed and Pest Control Methods
Weed and pest control methods are specific to each site.
Through the Mingle Program, the LDA has partnered with Greening Australia and the Territory and Municipal Services Directorate for a tree planting day at Barrer Hill near the Molonglo River. Residents of Wright and purchasers in Coombs helped Greening Australia to revegetate the area with native species. The LDA and Greening Australia have also developed the Molonglo Valley Local Native Plant Guide to educate residents about suitable endemic native plant species for their gardens. This has now been made available online.
Waste and materialsReporting Phase Indicators 2011–12 2012–13 2013–14
CW Percentage of LDA projects that minimised cut and fill through design and landscaping
100% 100% 100%
CW LDA projects that have used recycled or reused materials in civil works and landscaping
4 4 4
Cut and Fill Minimisation
By balancing the amount of cut and fill required on site, LDA projects reduce earthworks and associated impacts on the site.
Wright and Coombs have limited the amount of cut and fill to a maximum of 1.5 metres as part of the requirement for UDIA EnviroDevelopment accreditation.
Recycled or Reduced Materials
Where possible, LDA projects have recycled or reused materials in construction.
At Southquay Greenway, the asphalt and base gravel from the roads and shared paths that were removed has been reused for erosion control and site compound stabilisation. Natural rock material from the onsite excavations has also been reused in the construction of retaining walls.
At Campbell 5, some of the trees removed from the site are to be used for an informal play area.
49ANNUAL REPORT 2013-14

Influencing designReporting Phase Indicators 2011–12 2012–13 2013–14
PL Number of LDA projects that use the Design Review Panel at the Planning Phase
8 3 4
PO Number of LDA projects that conducted a form of evaluation
No historical data – indicator introduced in 2013–14
No historical data – indicator introduced in 2013–14
3
Design Review Panel (DRP)
The LDA DRP consists of respected academics, planners, architects and landscape architects who meet to review LDA and EDD projects. Projects are presented to the Panel for comments and advice regarding design outcomes. Four projects within the Planning Phase were presented to the DRP in 2013–14.
Thirteen other projects were also presented to the DRP in 2013–14. This includes LDA projects in other reporting Phases such as West Belconnen. It also includes a number of projects from other agencies including EDD and the Environment and Sustainable Development Directorate.
In the 2013–14 LDA SOI, a non-financial KPI required key LDA projects to be presented to the DRP prior to the Board’s consideration of the Project Business Plan. This target was achieved for 2013–14 as Parkes Section 3 was presented to the DRP in July 2013.
West Belconnen is a registered pilot project for the Green Star-Communities rating tool developed by the Green Building Council of Australia. As part of the process for achieving a Green Star-Communities rating, West Belconnen was presented to the DRP for review a number of times. Feedback from the design review process needs to be incorporated into the future design of the project.
Evaluation
Evaluating projects once they reach the Post Occupancy Phase is one way the LDA can assess whether the projects met their original objectives, ecological requirements and sustainability goals. Although no projects in the Post Occupancy Phase had separate evaluation processes commissioned, three projects were assessed internally against their original Business Plan objectives. This indicator has been introduced for 2013–14 to allow the LDA to collect data about this for the future.
50 LAND DEVELOPMENT AGENCY

Sec
tion
AS
ectio
n B
Sec
tion
CS
ectio
n D
Sec
tion
ES
ectio
n F
CommunityReporting Phase Indicators 2011–12 2012–13 2013–14
DD Number of projects that conducted community engagement
No historical data – indicator introduced in 2012–13
30 15
DD Number of heritage assessments conducted for LDA projects
26 40 11
DD Number of noise assessments conducted for LDA projects
2 4 3
PL Percentage of LDA projects that conducted community engagement
100% 100% 100%
CW Percentage of LDA projects that have measures in place to protect or manage identified areas of heritage importance
No historical data – indicator introduced in 2012–13
100% 100%
PO Residential LDA estates using community programs
3 4 4
Community Engagement
Community engagement has been conducted on all LDA projects reported in the Due Diligence Phase and the Planning Phase where applicable. Community engagement was not required for some projects as it had already occurred in previous financial years, been undertaken by other agencies or is scheduled to take place in the upcoming financial year.
As part of the community engagement process, the LDA (in conjunction with EDD) conducts consultation sessions with stakeholders, community groups, adjacent land lessees, and the broader ACT community. Community engagement is used not only to inform but to consult, involve and collaborate with the community.
At Kingston Foreshore there have been meetings with key stakeholders, developers and residents about development of the area, with Pedal Power regarding cycle routes, commercial boat operators and the Lake User Group about the location and installation of a slipway, and with the Capital Lakes Rowing Club about the proposed future development of a Rowing Shed at Grevillea Park.
Community engagement took place in 2010 and 2011 for the Canberra Brickworks + Environs Draft Strategy. The current Canberra Brickworks + Environs Planning and Development Strategy was launched in May 2014. The LDA facilitated eight weeks of initial project update and overview briefings and community comment period including guided tours of the site. The LDA is currently preparing to respond to issues raised during consultation, which is to be followed by a second phase of community engagement.
Community engagement for West Belconnen has been ongoing since the ACT Government agreed to the project in mid-2013. A Planning and Design Forum was
51ANNUAL REPORT 2013-14
held for stakeholders to contribute to master planning in November 2013. A newsletter, website and social media have been established for the project, and a shopfront at the Kippax Group Centre has been open since February 2014 for the community to visit and discuss the proposed development.
For further information on community engagement see B.3.
Heritage Assessments and Protection
Heritage assessments were conducted on many LDA projects in 2013-14. Where areas of heritage importance were identified, protection measures were in place in all LDA developments in the Civil Works Phase. This includes heritage areas which have community value but are not formally listed on the Heritage Register.
The Canberra Brickworks + Environs project has included a number of important heritage considerations. In November 2013 the heritage registration of the Canberra Brickworks Railway Remnants was finalised and in early 2014 the Planning and Development Strategy was released for consultation with the community. The strategy facilitates making the historic Canberra Brickworks safe and the development of new high quality public open spaces. The ‘make safe’ works in the future will make the heritage value of this area accessible to all Canberrans.
Noise Assessment
Noise assessments are conducted where required to assess the potential impacts of proposed developments on existing surrounds.
Community Programs
The LDA has engaged with the community through the Mingle Community Development Program. Mingle is well established in Bonner and Franklin and it is estimated that hundreds of residents from these estates participated in Mingle events during 2013–14. Some of the events held included a photography competition, trivia night and an Emergency Services Day. Residents were also invited to attend the Gungahlin Christmas Carols.
Mingle for Molonglo commenced in October 2013, and the LDA has partnered with Communities@Work to deliver the Community Development initiative. A number of events have already been held including Brunch in the Park and Skills and Drills training with the Brumbies. A tree planting day was also held in conjunction with Greening Australia at Barrer Hill next to the Molonglo River to help revegetate the area.
The third annual Canberra International Music Festival was held on 10 May 2014 in Kingston Foreshore. The festival is an opportunity to engage with and develop the local Kingston Foreshore community and inform the broader Canberra community about the Kingston Foreshore development.
Websites, social media and newsletters were also used in many estates for ongoing engagement with the community.
52 LAND DEVELOPMENT AGENCY

Sec
tion
AS
ectio
n B
Sec
tion
CS
ectio
n D
Sec
tion
ES
ectio
n F
Transport
Reporting Phase Indicators 2011–12 2012–13 2013–14
DD Number of traffic and parking assessments conducted for LDA projects
24 32 25
PL Percentage of projects in which all dwellings are located within required proximity to public transport
100% 100% 100%
PL Percentage of projects that comply with or exceeds standards for pedestrian and cycle networks and facilities
100% 100% 100%
PL Area of roads No historical data – indicator introduced in 2013–14
No historical data – indicator introduced in 2013–14
28ha of 269ha total site area
Traffic and Parking Assessments
Traffic and parking assessments review the existing road networks and traffic conditions around a site, and assess the required onsite parking demand and traffic impact of new developments.
Public Transport Proximity
All projects within the Planning Phase met the requirements for proximity to public transport according to the Territory Plan.
Pedestrian and Cycle Networks and Facilities
All projects within the Planning Phase complied with the standards for pedestrian and cycle networks and facilities.
53ANNUAL REPORT 2013-14

AffordabilityReporting Phase Indicators 2011–12 2012–13 2013–14
PL Percentage of projects that comply with affordability requirements
No historical data – indicator introduced in 2012–13
100% 67%
(NB: Affordability requirements will be met in later stages of relevant projects once the stages proceed to the Planning Phase)
PO Number of blocks settled under Land Rent
837 730 289
Affordable Housing
Housing affordability is a key issue in the ACT. The 2013–14 LDA SOI includes non-financial KPIs to ensure both englobo and LDA greenfield developments have 20 per cent of dwelling sites released for the purpose of providing affordable housing. 67 per cent of LDA projects in the Planning Phase complied with these affordability requirements, however all affordability requirements will be met once later stages of relevant projects proceed to the Planning Phase. Most projects in the Post Occupancy Phase have delivered affordable dwellings in previous years. For 2013–14 in Wright the LDA has required Multi Unit sites to include affordable dwellings.
Land Rent
In accordance with the ACT Government’s Affordable Housing Action Plan, the LDA provides the option for purchasers of land in LDA residential estates to participate in the Land Rent scheme, which commenced on 1 July 2008.
In 2013–14, 403 blocks were settled under Land Rent across all LDA projects, including projects not yet in the Post Occupancy Phase.
54 LAND DEVELOPMENT AGENCY
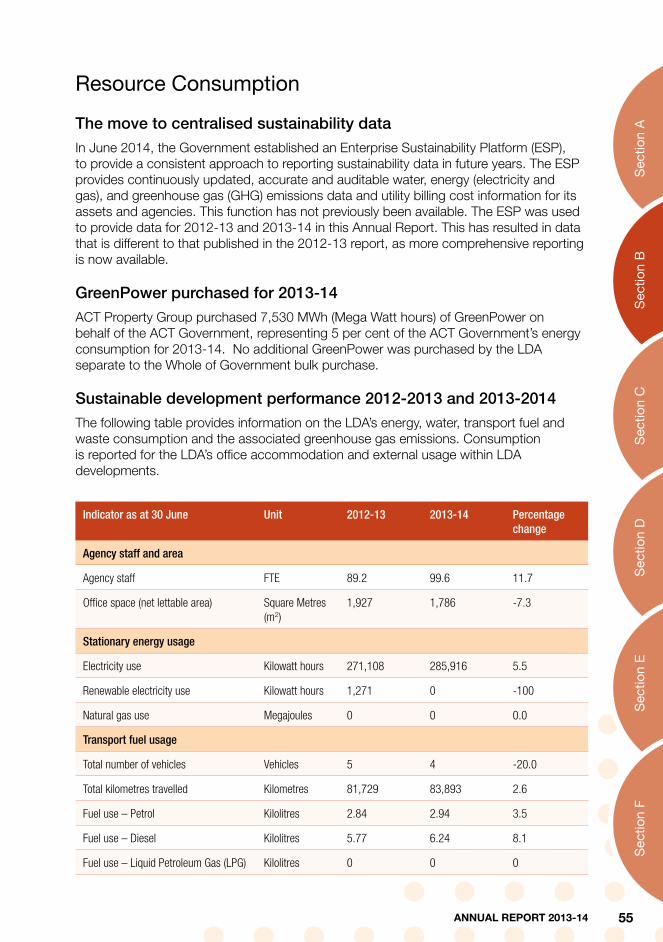
Sec
tion
AS
ectio
n B
Sec
tion
CS
ectio
n D
Sec
tion
ES
ectio
n F
Resource Consumption
The move to centralised sustainability data
In June 2014, the Government established an Enterprise Sustainability Platform (ESP), to provide a consistent approach to reporting sustainability data in future years. The ESP provides continuously updated, accurate and auditable water, energy (electricity and gas), and greenhouse gas (GHG) emissions data and utility billing cost information for its assets and agencies. This function has not previously been available. The ESP was used to provide data for 2012-13 and 2013-14 in this Annual Report. This has resulted in data that is different to that published in the 2012-13 report, as more comprehensive reporting is now available.
GreenPower purchased for 2013-14
ACT Property Group purchased 7,530 MWh (Mega Watt hours) of GreenPower on behalf of the ACT Government, representing 5 per cent of the ACT Government’s energy consumption for 2013-14. No additional GreenPower was purchased by the LDA separate to the Whole of Government bulk purchase.
Sustainable development performance 2012-2013 and 2013-2014
The following table provides information on the LDA’s energy, water, transport fuel and waste consumption and the associated greenhouse gas emissions. Consumption is reported for the LDA’s office accommodation and external usage within LDA developments.
Indicator as at 30 June Unit 2012-13 2013-14 Percentage change
Agency staff and area
Agency staff FTE 89.2 99.6 11.7
Office space (net lettable area) Square Metres (m2)
1,927 1,786 -7.3
Stationary energy usage
Electricity use Kilowatt hours 271,108 285,916 5.5
Renewable electricity use Kilowatt hours 1,271 0 -100
Natural gas use Megajoules 0 0 0.0
Transport fuel usage
Total number of vehicles Vehicles 5 4 -20.0
Total kilometres travelled Kilometres 81,729 83,893 2.6
Fuel use – Petrol Kilolitres 2.84 2.94 3.5
Fuel use – Diesel Kilolitres 5.77 6.24 8.1
Fuel use – Liquid Petroleum Gas (LPG) Kilolitres 0 0 0
55ANNUAL REPORT 2013-14

Indicator as at 30 June Unit 2012-13 2013-14 Percentage change
Fuel use – Compressed Natural Gas (CNG)
Kilolitres 0 0 0.0
Water usage
Water use Kilolitres 6,064 3,147 -48.1
Resource efficiency and waste
Reams of paper purchased Reams 1,829 1,628 -11.0
Recycled content of paper purchased Percentage 63.2 49.12 -22.3
Waste to landfill Litres see notes see notes
Co-mingled material recycled Litres 47,142 46,402 -1.6
Paper and Cardboard recycled (incl. secure paper)
Litres 104,267 93,544 -10.3
Organic material recycled Litres 2,673 2,465 -7.8
Greenhouse gas emissions
Emissions from stationary energy use Tonnes CO2-e 286.26 303.08 5.9
Emissions from transport Tonnes CO2-e 24.03 24.87 3.5
Total emissions Tonnes CO2-e 310.29 327.95 5.7
Supporting notes to table
General
Full-time equivalent (FTE) figures include all LDA staff members.
All LDA staff members occupy the office space located at TransACT House, Dickson on the ground floor, level 6 and level 7. The TransACT House office accommodation is shared with staff from the Economic Development Directorate (EDD). The net lettable area (NLA) of office space has been apportioned based on the number of FTE staff within EDD and LDA at TransACT House.
Stationary Energy
Stationary Energy is the combined energy consumption of the LDA’s internal business operations and LDA managed estates and properties throughout the ACT.
Internal business operations includes the office tenant light and power generated at TransACT House ground floor, level 6 and level 7.
It should be noted that the electricity use provided by the energy provider for ground floor of TransACT House is assumed to be the consumption of the total ground floor electricity use and not just LDA’s proportion of the space. Without better data, this consumption has been included for 2012-13 and 2013-14 and is currently being investigated by ACT Government Property Group.
Internal business operations does not include the LDA’s proportion of central services
56 LAND DEVELOPMENT AGENCY
Sec
tion
AS
ectio
n B
Sec
tion
CS
ectio
n D
Sec
tion
ES
ectio
n F
consumption (from heating, cooling or water systems) of TransACT House consumption data.
Other energy consumption is generated at LDA managed estates and properties throughout the ACT. These estates change over time as land is developed and sold. This consumption includes irrigation pumps, sewer valves, gross pollutant traps, offsite storage sheds.
Transport
The LDA vehicle fleet is managed by SG Fleet (whole-of-government provider), who provide accurate data on the kilometres travelled and fuel consumption of all LDA vehicles.
While there is an EDD car available to LDA staff, only LDA managed vehicles were included in the transport analysis of TransACT House. While EDD staff are also able to use LDA cars, the percentage of EDD staff use for 2013-14 was not available and hence total use of LDA cars was attributed to the LDA.
Water
Water consumption in TransACT House is managed through the building owner and hence not included in 2012-13 and 2013-14. Therefore all water reported is from LDA managed estates and properties throughout the ACT. These sites change over time as land is developed and sold. Water uses include irrigation water, public buildings and bubblers.
Resource Efficiency and Waste
Paper for LDA and EDD staff is purchased together for TransACT House. Paper consumption has been apportioned based on the FTE numbers of EDD and LDA staff. Similarly, waste is collected for both LDA and EDD staff at TransACT House and has been apportioned based on the FTE numbers of EDD and LDA staff.
Waste is reported based on the number of bins collected for a particular waste/recycling stream. Unless all bins are full, the reported figures may not be the actual amount of waste produced but are the best estimate available at this point in time. Bins were calculated at 240 litres per bin.
General waste from the LDA offices is not separately sorted from other waste generated by other tenants in TransACT House and is therefore not available for inclusion in this report.
Further information may be obtained from:
Director, Office of the Chief Executive Phone: (02) 6205 2697
57ANNUAL REPORT 2013-14

58 LAND DEVELOPMENT AGENCY

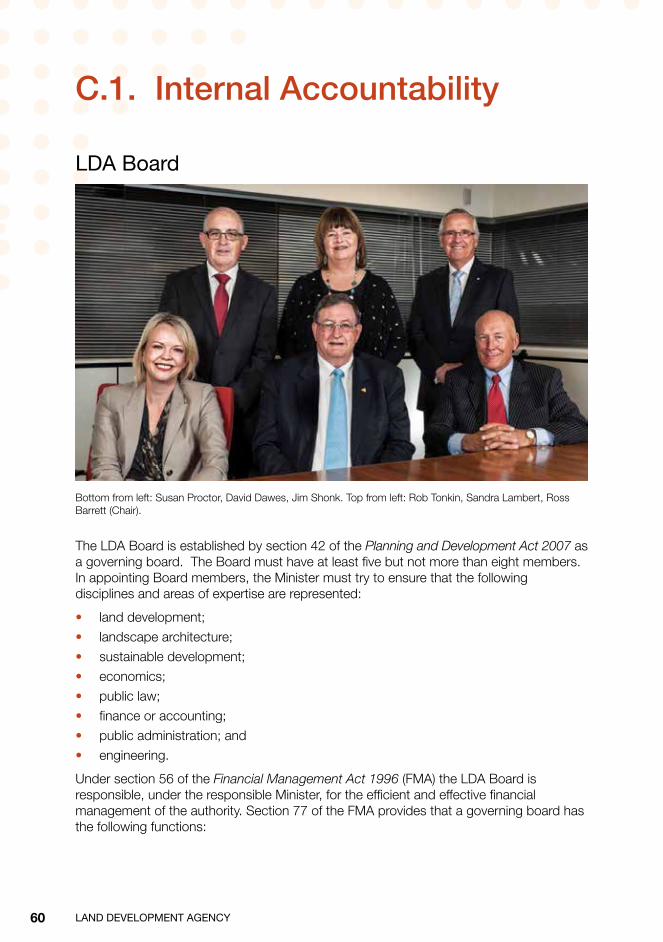
C.1. Internal Accountability
LDA Board
Bottom from left: Susan Proctor, David Dawes, Jim Shonk. Top from left: Rob Tonkin, Sandra Lambert, Ross Barrett (Chair).
The LDA Board is established by section 42 of the Planning and Development Act 2007 as a governing board. The Board must have at least five but not more than eight members. In appointing Board members, the Minister must try to ensure that the following disciplines and areas of expertise are represented:
• land development;
• landscape architecture;
• sustainable development;
• economics;
• public law;
• finance or accounting;
• public administration; and
• engineering.
Under section 56 of the Financial Management Act 1996 (FMA) the LDA Board is responsible, under the responsible Minister, for the efficient and effective financial management of the authority. Section 77 of the FMA provides that a governing board has the following functions:
60 LAND DEVELOPMENT AGENCY
Sec
tion
AS
ectio
n B
Sec
tion
CS
ectio
n D
Sec
tion
ES
ectio
n F
a. setting the authority’s policies and strategies;
b. governing the authority consistently with the authority’s establishing Act and other relevant legislation;
c. ensuring, as far as practicable, that the authority operates in a proper, effective and efficient way; and
d. ensuring, as far as practicable, that the authority complies with applicable governmental policies (if any).
From July 2013 to June 2014 the LDA Board consisted of six members. There were a total of 11 meetings during that period.
Board attendance 2013-14
Name Position Meetings attended of total of 11
Ross Barrett Chair 10*
Robert Tonkin Deputy Chair 10*
Susan Proctor Member 11
Sandra Lambert Member 6**
Jim Shonk Member 9*
David Dawes CEO and Member 11
* Apologies accepted
** Ms Lambert took an approved leave of absence for the period December 2013 to August 2014.
Ross Barrett (Chair)
Ross Barrett is a civil engineer with a Bachelor of Engineering degree from the University of NSW and a Local Government Engineers Certificate (NSW). Mr Barrett has been a Fellow of the Institution of Engineers Australia since 1986 and in 2011 and again in 2012 was recognised by Engineers Australia as one of Australia’s top 100 most influential engineers.
Mr Barrett has a long history of membership and leadership of professional bodies. He is a former President of the Master Builders ACT branch and is a Life Member of the Association. He is also a Life Member of Master Builders Australia and was a National Board member for 11 years.
Mr Barrett was a National Board member of the Civil Contractors Federation for 18 years and is a former National President of the Federation. He has been a Fellow of the Australian Institute of Company Directors since 1990.
Mr Barrett has served on a number of regional advisory and professional organisations. He was Chair of Community Housing Canberra Ltd (2007-11) and Chair of Regional Development Australia ACT in 2009-10. Both of these positions are ACT Government appointments. He was a member of the Residential Advisory Committee to the ACT from 1998 until his appointment to the LDA.
61ANNUAL REPORT 2013-14

Mr Barrett’s other previous positions include:
• Board Member, MBA Group Training (ACT) Inc.
• Chair (2007-08) and Deputy Chair (2008-09), Capital Region Development Board.
• Patron, ACT Region, Wordskills 2007-08.
• Deputy Chair, Australian Technical College Queanbeyan and Region Steering Committee, 2006-08.
• Member of Executive, Queanbeyan Business Council, 2005-08.
• Member, Canberra Central Task Force, 2005-07.
• Board Member, Business Canberra, 2003-05.
• Board Member, Australian Construction Industry Form Ltd, 2003-05.
Robert Tonkin (Deputy Chair)
Robert Tonkin is a former senior Commonwealth and ACT public servant and has been a resident of Canberra since 1973. Mr Tonkin is a former Chief Executive of the ACT Chief Minister’s Department, Associate Secretary in the Department of the Prime Minister and Cabinet, and Deputy Secretary in the Department of Defence.
Mr Tonkin has extensive high-level experience in public sector governance, strategic policy and resource management, and in national security and risk management.
Within the Department of the Prime Minister and Cabinet, Mr Tonkin led the Australian Government’s Taskforce on Offshore Maritime Security, and headed the Secretariat of the COAG National Enquiry on Bushfire Mitigation and Management. In the ACT he led the Service’s response to the 2003 bushfires and served on the Bushfire Recovery Taskforce.
As a Deputy Secretary in the Department of Defence Mr Tonkin was concurrently Chief Finance Officer and Chief Information Officer, oversighted a number of divisions including resource management, corporate planning, government relations, estate management, corporate support and audit and led the Department’s successful implementation of major reform and efficiency initiatives.
Mr Tonkin has chaired a number of Commonwealth department audit committees and has been a board member of the Defence Housing Authority.
He has previously been a member of the Council of the Order of Australia and of the Australian Bravery Decorations Council, was Deputy Chair of the Defence Reserves Support Council of the ACT, and National Secretary and ACT Chair of the Australian Industry and Defence Network.
Currently, Mr Tonkin is the Independent Chair of the Audit and Risk Committee of the Attorney-General’s Department.
Mr Tonkin has an Honours degree in urban geography and is a Fellow of the Australian Institute of Management and a Member of the Institute of Company Directors.
62 LAND DEVELOPMENT AGENCY
Sec
tion
AS
ectio
n B
Sec
tion
CS
ectio
n D
Sec
tion
ES
ectio
n F
Susan Proctor (Member)
Susan Proctor is a Legal Director of Commercial/Property at Bradley Allen Love, (the amalgamated firm of Bradley Allen Lawyers (of which she was the Managing Partner) and Williams Love & Nicol Lawyers, both local Canberra law firms). She has been practising in all aspects of property law and commercial law for the past 15 years. Her client base consists largely of Canberra based businesses, property owners/developers, clubs and listed companies involved in commercial property development.
Ms Proctor is a former director and Chair of the Audit Committee of ACTTAB. She was also a Councillor of the ACT Property Council and member of the Council’s Planning Committee. Ms Proctor was also a Director of Tuggeranong Valley Financial Services (Bendigo Bank).
Ms Proctor has a Bachelor of Laws Degree from the Australian National University, a Bachelor of Arts Degree and a Graduate Diploma in Legal Practice. Ms Proctor is a member of the Law Society and is a graduate of the Australian Institute of Company Directors.
Sandra Lambert (Member)
Sandra Lambert has worked for the public sector for all of her career spanning over 30 years. She has worked as a teacher and held a number of school based leadership positions including as a College Principal. She has also worked for the Australian Government and has held several senior executive and leadership positions in the ACT Government. Her most recent was as the inaugural Chief Executive of the then Department of Disability, Housing and Community Services (DHCS) (2002-10), a position in which she exercised the statutory role of the Commissioner for Housing, responsible for the Public Trading Enterprise known as Housing ACT.
During this period, in 2009, she also undertook the role of ACT Coordinator-General of the Stimulus Taskforce responsible for delivering the Australian Government’s National Building Package in the ACT. As Chief Executive, Ms Lambert was also actively engaged in national committees including as Chair of the Community, Disability Services Ministers’ Advisory Committee for three years. She was also a Board member of the Australian Housing and Urban Research Institute and of the Australian Institute of Health and Welfare. Before becoming a Chief Executive of DHCS Ms Lambert’s roles included driving and implementing whole of government policy development, implementation and evaluation and being responsible for leading significant, often high profile projects. Leading the project team that established Canberra Connect is one example.
Ms Lambert has a Bachelor of Arts degree from Canterbury University (NZ) and a Diploma of Teaching, Distinction Award. She is a Fellow of the Australian Institute of Management and a member of the Australian Institute of Company Directors.
Ms Lambert’s current activities include consulting roles. She is also a member of the Hands Across Canberra Board, which is a philanthropic organisation in the ACT.
63ANNUAL REPORT 2013-14

Jim Shonk (Member)
Jim Shonk is well known and highly regarded in the ACT for his achievements and expertise in property valuation, commercial real estate and board operations.
He was the founding Director of the Vikings Club in Tuggeranong, past President of Clubs ACT, and is also the Director of Argus Property Investments, which he co-founded in 2012.
Mr Shonk was the Director of Commercial Sales at Colliers International’s Canberra office and as Managing Director (1992 to 2002), became the most successful sales agent in Colliers International’s global history, and consistently finished in the top four commercial agents in Australia.
Mr Shonk has also been President of the Vikings Club in Tuggeranong between 1991 and 1996, then in 1998, and again from 2001 to 2003. He was a founding Director of the Club between 1978 and 1980. During his years with the Club, Mr Shonk initiated and oversaw a review of all aspects of company performance and standards, resulting in best practice audit procedures and vastly improved governance and administration, and the expansion of the Club in Lanyon and Tuggeranong Town Centre.
He is a Fellow of the Australian Property Institute and a licensed Real Estate Agent and licensed Valuer in the ACT and NSW.
David Dawes (Chief Executive Officer and Member)
David Dawes commenced his roles as Chief Executive Officer of the Land Development Agency and Director-General of the Economic Development Directorate in May 2011. Prior to that, he was Chief Executive of the ACT Government’s Department of Land and Property Services (created in December 2009) responsible for implementing major government initiatives, such as the land release program and aspects of the nationally recognised Affordable Housing Action Plan.
During this time, Mr Dawes also oversaw the ACT Property Group, responsible for managing and preparing long-term plans for office accommodation for ACT public servants. In addition, he led the Strategic Project Facilitation group, which facilitated numerous private sector and government projects including development of the National Arboretum Canberra.
Mr Dawes joined the ACT Public Service in April 2007 as Deputy Chief Executive, Business and Projects, Chief Minister’s Department.
Prior to joining the ACT Public Service he was the Executive Director of the Master Builders Association of the ACT for nine years. In that role he represented the Association with industry, government and business groups including the Canberra Business Council, Local Area Planning and Advisory Committees and was a member of the Occupational Health and Safety Council.
During his time at the Association, he was a founding member of OzHelp – an organisation which has now been launched nationally to prevent youth suicide. He commenced the ‘Housing for Life’ advisory service in the ACT and built the first ‘Housing for Life’ display house in conjunction with ACT Housing.
In 2003 he instigated a single demolition package to assist the victims of the 2003 Canberra bushfires and was the Chairman on the Planning and Infrastructure Task Force and the Community Expert Reference Group established following the fires.
64 LAND DEVELOPMENT AGENCY

Sec
tion
AS
ectio
n B
Sec
tion
CS
ectio
n D
Sec
tion
ES
ectio
n F
As Chief Executive Officer of the LDA, Mr Dawes’ primary responsibility is to facilitate the development and release of Government-owned land for residential, community, commercial and industrial uses.
As Director-General of EDD Mr Dawes is responsible for:
• programs, initiatives and policy advice aimed at supporting economic and business development in the Territory;
• preparation and delivery of the ACT Government’s land release program, including the delivery of a diverse range of capital projects;
• managing the ACT Government’s tourism marketing and development programs, along with managing the Territory’s major sporting and recreation venues and events; and
• leading the Government’s sport and recreation programs and policies.
In the role of Coordinator-General, Mr Dawes is responsible for coordinating government response to high value/high complexity investment/development inquiries and proposals identified by the Minister or from the private sector.
Remuneration for Chief Executive Officer and the LDA Board Members
Under the Remuneration Tribunal Act 1995 the Remuneration Tribunal determines remuneration for the CEO and Board Members.
Senior Executives
Name Position
David Dawes Chief Executive Officer, Land Development Agency
Director-General, Economic Development Directorate
Dan Stewart Deputy Chief Executive Officer, Land Development Agency
Deputy Director-General, Land Development and Corporate (EDD)
Chris Reynolds Executive Director, Land Development
Management Committees
Senior Executive Committee
The Senior Executive Committee is EDD’s principal decision making body and considers key matters affecting or relevant to, the LDA and the Directorate, including those related to:
• Finance/Budget;
• Workforce (including HR) and Governance (including audit and compliance);
• Information and Communications technology;
• Government and Directorate priorities; and
• Emerging issues.
65ANNUAL REPORT 2013-14

Name Position
David Dawes Chief Executive Officer, Land Development Agency;
Director-General, Economic Development Directorate
Dan Stewart Deputy Chief Executive Officer, Land Development Agency
Deputy Director-General, Land Development and Corporate (EDD)
Gary Rake Deputy Director-General, Business, Tourism, Events and Sport (EDD)
Land Executive Committee*
The Land Executive Committee manages ongoing operational issues, oversees project delivery, LDA Risk Register review and addresses organisational management issues.
Name Position
David Dawes Chief Executive Officer, Land Development Agency
Director-General, Economic Development Directorate
Dan Stewart Deputy Chief Executive Officer, Land Development Agency
Deputy Director-General, Land Development and Corporate (EDD)
Chris Reynolds Executive Director, Land Development
Glenn Lacey Director, Infrastructure and Capital Works (EDD)
Dermot Walsh Chief Finance Officer, Strategic Finance
Paul Lewis Director, Urban Renewal
Clint Peters Sales, Marketing and Land Management Director
* This meeting is also attended by Senior Project Managers.
Land Development and Corporate WHS Committee
LDA staff are represented on the Land Development and Corporate (WHS) Committee. The Committee facilitates consultation and communication between employees, represented unions and management regarding work health and safety matters. The Committee monitors the implementation of the actions outlined in the work health and safety strategic plan which aims to achieve improved outcomes in health and safety.
At the commencement of the reporting period, the Directorate had in place three divisional Work Health and Safety Committees: Economic Development, Policy and Governance Division; Tourism Events and Sport Division; and the Land Development, Strategy and Finance Division (also comprising LDA staff from the same workgroup). As of 1 April 2014, the Directorate moved to a two divisional structure comprising two Work Health and Safety Committees: Land Development and Corporate Division; and Business, Tourism, Events and Sport Division. The Chief Minister and Treasury Directorate, Safety Support Team attends Committee meetings to provide advice.
66 LAND DEVELOPMENT AGENCY

Sec
tion
AS
ectio
n B
Sec
tion
CS
ectio
n D
Sec
tion
ES
ectio
n F
The Economic Development Directorate Portfolio has twenty-one (21) Health and Safety Representatives for designated workgroups. This includes four LDA staff. The Committee structure is outlined below:
Name WHS Committee Role General Title
Dan Stewart Co-Chair Deputy Director-General, Land Development and Corporate
Chris Reynolds Co-Chair Executive Director, Land Development
Joanne Rosewarne Human Resources representative Senior Manager, Human Resources
Leanne Martens Secretariat Manager, Human Resources
Julie Mylchreest WHS Advisor Senior Human Resources Advisor
Daniel Santosuosso Health and Safety Representative Land Development (LDA)
Mark Overton Health and Safety Representative Land Development (LDA)
Edward Senti Health and Safety Representative Strategic Finance (LDA)
Lynette Marsh Health and Safety Representative Infrastructure and Capital Works (EDD)
Simon Tennent Health and Safety Representative Land Release/Sustainable Land Strategy (EDD)
Stephen Terracini Health and Safety Representative Sales, Marketing and Land Management (LDA)
Adam Nugent Admin/Facilities Estate Management Officer (LDA)
Steve Polsen Admin/Facilities Estate Management Officer (LDA)
Chief Minister and Treasury Directorate (CMTD)
CMTD Safety Support Team advisor CMTD Safety Support team
Union Representative Union Representative CPSU, APESMA are invited to attend
Joint Venture Management Committees
The joint ventures in Crace, Forde and Woden Green are each managed by a Joint Venture Management Committee. Separate project control groups manage the operational aspects of each respective site.
Crace
Crace in Gunghalin is a joint venture between the LDA and Crace Developments Pty Ltd. Crace Developments is a consortium with CIC as project manager and lead partner. The other consortium partners are Defence Housing Australia, CHC Affordable Housing and investment company, Tatebrook Pty Ltd.
67ANNUAL REPORT 2013-14

Forde
Forde in Gungahlin is a joint venture development between the LDA and Forde Development Pty Ltd. Forde Development is a consortium between CIC and Lend Lease.
Woden Green
The Woden Green Joint Venture was concluded on 31 December 2012 with the Balance Holding Lease sold to Woden East Pty Ltd. The final sale transactions were completed in November 2013.
Details of the financial statements for 2013-14 for all joint ventures are provided in F.2 of this report.
Further information may be obtained from:
Director, Office of the Chief Executive Phone: (02) 6205 2697
68 LAND DEVELOPMENT AGENCY

Sec
tion
AS
ectio
n B
Sec
tion
CS
ectio
n D
Sec
tion
ES
ectio
n F
C.2. Risk Management and Internal Audit
Risk ManagementRisk management in the LDA is monitored and regularly reviewed by the LDA Board, its Board Audit and Risk Committee and the Land Executive Committee with recommendations provided by these bodies and the Auditor-General’s Office as appropriate. The LDA Executive is committed to, and places a high priority on, effective risk management across the full range of organisational functions. The overarching approach to managing risk at strategic and operational levels includes incorporation of appropriate fraud prevention and control processes and practices, to ensure the early identification and treatment of emerging risks.
All planning processes within the LDA, including strategic and business planning, and organisational project management, incorporate risk management.
The LDA’s approach to risk management is built on the Australian and New Zealand Standard, AS/NZS ISO 31000:2009 - Risk Management - Principles and Guidelines. The LDA’s Risk Register was developed in accordance with the Standard to include organisational risks, sources, impacts, responsibilities, treatments and monitoring/review processes. The LDA contributed to workshops held in late 2012-13 to assist Executives and management to identify significant strategic and operational risks and determine appropriate management strategies. The results have been incorporated into a new, compliant LDA Risk Register for approval by the LDA Board in early 2014-15. The identified risks will continue to be reviewed regularly by the Land Executive and the Board Audit and Risk Committee to ensure risk management strategies are included in business plans and regularly reported against.
A significant strategic and operational risk for the LDA is that of WHS. An important measure in monitoring and managing WHS risks has been the implementation of strategies to meet obligations under the Work Health and Safety Act 2011 (the WHS Act) and the Public Sector Management Act 1994, through this, the LDA continues its commitment to leadership in work health and safety. The Work Health and Safety Strategic Plan, which was developed in consultation with the LDA Board, EDD Senior Executive Committee and staff, outlines the LDA’s commitment to the provision of a safe and healthy work environment for all workers, visitors and clients. It assists the LDA in meeting WHS Act obligations where there are requirements for employers to provide and maintain a safe workplace.
Monitoring of WHS issues at all stages of construction projects is being undertaken by a dedicated WHS manager and any issues/incidents are reviewed monthly by the LDA Board to ensure strategies are in place to address identified emerging safety risks or trends.
69ANNUAL REPORT 2013-14

LDA Board Audit and Risk Committee
The LDA Board Audit and Risk Committee and internal auditors provide independent assurance and assistance to the Board on LDA risk management, financial controls and legal compliance as well as external accountability responsibilities.
The LDA Board Audit and Risk Committee Charter 2013-14 provides the framework for the conduct of the internal audit function in the LDA. Annual and forward audit programs are guided by governance, risk and compliance programs and supported by an audit recommendations register.
Two internal (compliance) audits were finalised during the year, on compliance with provisions of the Freedom of Information Act 1989 and Compliance as a Statutory Authority.
The Board Audit and Risk Committee met six times during 2013-14.
Name of Member Position Duration Meetings attended (of the total of 6)
Robert Tonkin Chair 2013-14 6
Sandra Lambert Member 2013-14 3*
Dan Stewart Member 2013-14 4**
Dermot Walsh Observer (LDA) 2013-14 6
Anita Hargreaves Observer (EDD) 2013-14 2
David O’Toole Observer (ACT Audit Office) 2013-14 3
Laura Marcantonio Observer (LDA) 2013-14 6
Joanne Rosewarne Observer (EDD) 2013-14 3
Chris Wilson Observer (EDD) 2013-14 1
Pamela Roncon Secretariat 2013-14 3
* Ms Lambert was granted a leave of absence from December 2013 to August 2014.
** Mr Stewart was appointed to the Committee in November 2013.
Senior Executive Responsible for Business Integrity Risk
The Director Workforce and Governance, Economic Development Directorate, undertook the role of the LDA’s Senior Executive Responsible for Business Integrity Risk (SERBIR) in 2013-14.
Further information may be obtained from:
Director, Office of the Chief Executive Phone: (02) 6205 2697
70 LAND DEVELOPMENT AGENCY

Sec
tion
AS
ectio
n B
Sec
tion
CS
ectio
n D
Sec
tion
ES
ectio
n F
C.3. Fraud Prevention
Fraud Prevention
The LDA does not tolerate fraudulent behaviour or corruption in any form or to any degree and is fully committed to its detection and elimination. The LDA Fraud and Corruption Control Plan 2012–14, prepared as required under the ACTPS Integrity Policy, provides the basis of the LDA’s actions to control fraud. The Plan identifies the key activities that require the implementation of additional controls to reduce the likelihood of fraud occurring, and assists staff in the management of fraud risks. Additionally, the Chief Executive Financial Instruction No 9 Managing Risk and Accountability, details the primary responsibilities and accountabilities in relation to fraud, integrity and related reporting.
The LDA has a strong culture of probity and adherence to public sector management values. The Land Executive Committee discusses LDA fraud risks at each meeting and members demonstrate, promote, and foster high standards of professionalism, integrity and work ethics in all staff. The Fraud Risk Register is updated as relevant by Executives and business units, and endorsed by the LDA Board Audit and Risk Committee and the LDA Board. The LDA Fraud and Corruption Control Plan and Fraud Risk Register are to be reviewed early in 2014-15.
In accordance with the governance arrangements in place under the Memorandum of Understanding between the EDD and the LDA, fraud and ethics training opportunities are available to staff through the training and development program. This includes general awareness training for staff as a component of EDD’s induction program. Topics covered in the induction program also include the ACTPS Code of Conduct, values and signature behaviours. Additionally, ethical behaviour is delivered as a component of the Respect, Equity and Diversity training that all staff are required to complete.
The policy dealing with the Purchase of Land from LDA Joint Venture and LDA Estates and associated Fast Facts is available via the EDD intranet. This policy outlines expectations for staff and members of their immediate family taking part in purchases of land from the LDA, to ensure there is no actual or perceived conflict of interest in the process.
Senior Executive Responsible for Business Integrity Risk
During 2013-14 the Director, Workforce and Governance, EDD, was the LDA’s SERBIR and managed information pertaining to actual, alleged or suspected cases of fraud. The LDA Board and LDA Board Audit and Risk Committee receive regular reports from the SERBIR.
During 2013-14 there were no incidents of suspected fraudulent behaviour.
Further information may be obtained from:
Director, Office of the Chief Executive Phone: (02) 6205 2697
71ANNUAL REPORT 2013-14

C.4. Legislative Assembly Inquiries and Reports
The LDA formally responded within the EDD to the Select Committee on Estimates 2013-2014 inquiry into the Appropriation Bill 2013-2014 and Appropriation (Office of the Legislative Assembly) Bill 2013-2014. The Committee’s report was tabled on 6 August 2013 and the government response was tabled on 13 August 2013.
LDA Executive attended the following Committee hearings:
• Planning, Environment and Territory and Municipal Services Committee Inquiry into Annual and Financial Reports 2011-12; and
• Select Committee on Estimates 2013-14 Inquiry into the Appropriation Bill 2013-14 and Appropriation (Office of Legislative Assembly) Bill 2013-14.
Further information may be obtained from:
Director, Office of the Chief Executive Phone: (02) 6205 2697
72 LAND DEVELOPMENT AGENCY
Sec
tion
AS
ectio
n B
Sec
tion
CS
ectio
n D
Sec
tion
ES
ectio
n F
C.5. Auditor-General and Ombudsman Reports
The LDA Board and senior management ensure the accountability of program delivery through a strong governance approach. This approach is maintained through regular monitoring and scrutiny of key activities by the LDA Board, the LDA Board Audit and Risk Committee and the LDA Executive.
Internal policies and procedures are regularly reviewed to ensure they are current and reflect the business structure and objectives of the LDA.
The LDA has not had any inquiries and reports by the ACT Auditor-General or the ACT Ombudsman.
The internal audit function is reported separately in section C.2 (risk management and internal audit).
Further information may be obtained from:
Director, Office of the Chief Executive Phone: (02) 6205 2697
73ANNUAL REPORT 2013-14

74 LAND DEVELOPMENT AGENCY


D.1. Public Interest Disclosure
PUBLIC INTEREST DISCLOSURE (PID) PROCEDURES
Under the Memorandum of Understanding (MoU) between the LDA and EDD, EDD provides governance services to the LDA. The services provided include developing and implementing policy in relation to public interest disclosures (PIDs). The Director, Workforce and Governance (EDD), is the SERBIR and Disclosure Officer for the LDA.
During 2013-14, in line with the MoU, the LDA operated under EDD’s draft Public Interest Disclosure Procedures addressing the requirements of the Public Interest Disclosure Act 2012 (PID Act). The Directorate’s draft procedures are based on the Commissioner for Public Administration Public Interest Disclosure Guidelines 2013 (notifiable instrument number NI2013-40) and provide additional support for disclosers (if they wish), reflecting the recommendations from the Whistling While They Work report.
The Public Sector Management Group within the Chief Minister and Treasury Directorate (CMTD) has reviewed the Directorate’s draft procedures and advised that the additional support for disclosers provided in the procedures was innovative and could be used as a model for other directorates.
The Commissioner’s Guidelines have been under review during the second half of the financial year, which has delayed the finalisation of the Directorate’s Public Interest Disclosure Procedures.
PID STATISTICS
The LDA did not receive any PIDs during 2013-14.
Towards the end of the reporting year, CMTD implemented the Public Interest Disclosure Tracking System, to assist with future annual reporting on disclosures, as well as assist Disclosure Officers to meet the obligations and timeframes stipulated in the PID Act.
Further information may be obtained from:
Director, Office of the Chief Executive Phone: (02) 6205 2697
76 LAND DEVELOPMENT AGENCY

Sec
tion
AS
ectio
n B
Sec
tion
CS
ectio
n D
Sec
tion
ES
ectio
n F
D.2. Freedom of Information
The ACT Freedom of Information Act 1989 (FOI Act):
• provides for general access to documents of agencies and official documents of ministers, subject to certain exemptions;
• provides for the amendment of records about personal affairs of an applicant that the applicant believes to be incorrect, incomplete, out of date or misleading;
• establishes a system to review certain decisions at various levels; and
• requires the publication of information on the functions and official documents of an agency, and that particular documents be available for inspection and sale.
The 2013-14 Internal Audit Plan included an audit of the administration of the FOI Act within the LDA, and was subsequently broadened to include EDD. The objective was to provide assurance to the LDA Board Audit and Risk Committee and the EDD Audit Committee that their statutory obligations under the FOI Act were being met. The audit awarded the highest internal control effectives rating of ‘Adequate’, finding that the Freedom of Information (FOI) function was operating effectively, that all statutory timeframes were being met and the public and stakeholders were being well advised of their review rights. The audit identified opportunities for improvement in relation to information for staff, and documentation of processes.
SECTION 7 STATEMENT
Section 7 of the FOI Act requires the LDA to prepare and publish a statement outlining the organisation’s functions and powers, the categories of documents available and facilities provided for access to documents.
ORGANISATION FUNCTION AND POWERS
The LDA is a Territory authority established by section 31 of the Planning and Development Act 2007 to develop land, carry out works to enhance land, and carry out strategic or complex urban development projects. The LDA does not administer any legislation.
A MoU between the LDA and EDD outlines a provision of governance arrangements provided by EDD. This includes the function of an FOI Coordinator.
PUBLIC PARTICIPATION IN DECISION MAKING
Arrangements for public participation in decision making include public submissions to inquiries, discussion at public meetings, consultative committees for specific purposes, access to records through FOI requests, comments on draft documents, comments on Bills before the Assembly and contact with the relevant minister.
CATEGORIES OF DOCUMENTS
The LDA holds the following categories of documents:
• those that are freely available on request or via the website and without charge;
• those that are exempt under the FOI Act; and
• all other kinds of documents that may be made available under the FOI Act.
77ANNUAL REPORT 2013-14

Documents available on request and without change
Documents within this category include publications by LDA on various aspects of its activities. These documents are usually distributed at events, from the offices of the LDA, and are generally available on LDA’s website. Other documents include discussion papers, information pamphlets and annual reports.
Documents available under the Freedom of Information Act (FOI Act)
Documents of other kinds that may be available under the FOI Act include:
• general records, including internal, interdepartmental and public documents such as minutes of meetings, agendas and background papers, policy statements, correspondence and administrative records;
• personnel records;
• records held on microfilm, computer or paper in connection with directorate functions;
• photographs, videos and film;
• maps, plans and brochures;
• technical and scientific reports and discussion papers;
• financial records;
• details of contracts and tenders;
• files on applicants and clients; and
• leases and deeds of agreement.
FACILITIES FOR ACCESS
In line with the MoU between the LDA and EDD, responsibility for the coordination of FOI requests lies with EDD. Those seeking information are encouraged to first contact the FOI Coordinator before using the more formal FOI process.
The LDA’s contact for FOI is: The FOI Coordinator Chief Minister, Treasury and Economic Development Directorate GPO Box 158 Canberra ACT 2601 Telephone: (02) 6205 0238 Email: [email protected]
The FOI Coordinator is located in the Canberra Nara Centre, corner of Constitution Avenue and London Circuit. Several bus stops are close to the Nara Centre on London Circuit. Short-term parking is located opposite the Centre and a disabled car park space is available on Nangari Street. Information regarding bus routes and timetables can be obtained from ACTION (www.action.act.gov.au/timetables and maps), or by telephone 131 710.
78 LAND DEVELOPMENT AGENCY

Sec
tion
AS
ectio
n B
Sec
tion
CS
ectio
n D
Sec
tion
ES
ectio
n F
SECTION 8 STATEMENT
Section 8 of the FOI Act requires the principal officer to prepare and make available a statement listing all publicly accessible documents that are used by the LDA in making decisions under a legislative scheme. A copy of the Section 8 statement is available online at www.economicdevelopment.act.gov.au
FREEDOM OF INFORMATION GUIDELINES
The ‘FOI Guidelines for Applicants’ are available on the LDA website to assist prospective applicants to make an FOI request. EDD has also prepared internal ‘Guidelines for Managers and Staff’, utilised by officers of the LDA to inform decision makers and action officers about the FOI Act and their roles and responsibilities in managing responses to applications in accordance with the FOI Act.
EDD is currently finalising Freedom of Information Guidelines 2014 and revising the Guidelines for Action Officers and Managers and creating an accompanying procedures for the FOI Coordinator, decision makers and action officers.
SECTION 79 STATEMENT
Section 79 of the FOI Act requires the LDA to include in its annual report details of applications made to the LDA during the year. Access decisions in relation to FOI requests are categorised in terms of: full access granted; partial access granted; entirely exempt; access refused to all documents (technical refusal); decision still pending; transferred; and withdrawn.
During the 2013-14 financial year, the LDA received eight applications under the FOI Act for access to documents.
TIME TAKEN TO FINALISE FOI REQUESTS
Number of FOI Requests Received
30 Days or less
31 to 45 Days
46 to 60 Days
61 to 90 Days
91 Days or more
Not yet finalised as of 30 June 2014
8 5 0 21 0 0 1
ACCESS DECISIONS
Full Access Partial Access
Entirely Exempt
Technical Refusal
Withdrawn Transferred to another Directorate
Not yet provided
0 2 0 0 5 0 1
DECISIONS APPEALED
Requests for Internal Review
Decision Affirmed Partial Access Overturned
2 0 22 0
79ANNUAL REPORT 2013-14

REFERRALS TO THE ACT CIVIL AND ADMINISTRATIVE TRIBUNAL (ACAT)
Request to ACAT Affirmed Overturned Not yet finalised
0 0 0 0
FEES AND CHARGES (FOR REQUESTS WITH >10 HOURS PROCESSING TIME
Fees Charged 3 Total Amount Collected
$3,842.00 nil
APPLICANT TYPE4
Member of the Public
Solicitor Association/Organisation
MLA Company
2 1 3 2 0
1 These requests involved third party consultation, which allows for completion within 60 days.2 This figure includes one decision where partial remission of charges was provided (request later withdrawn);
the other original decision was partially overturned in relation to access to some of the documents.3 These charges relate to two requests; one request was withdrawn following the decision to charge. The letter
of charges for the other request was sent on 30 June 2014, so no money had been collected as at the end of June 2014.
4 Activities of LDA that were of interest under freedom of information include Draft Variation 306; the Land Rent Scheme; and the Canberra Brickworks.
REQUESTS TO AMEND PERSONAL RECORDS
Section 48 of the FOI Act provides for a person, under specified circumstances, to ask for personal information in documents to be amended if he or she believes they are incomplete, incorrect, out of date, or misleading — providing the person establishes one of these grounds. No requests to amend personal records were received during 2013-14.
Further information may be obtained from:
Director, Office of the Chief Executive Phone: (02) 6205 2697
80 LAND DEVELOPMENT AGENCY

Sec
tion
AS
ectio
n B
Sec
tion
CS
ectio
n D
Sec
tion
ES
ectio
n F
D.3. Human Rights Act
The Human Rights Act 2004 (HRA) is part of the ACT Government’s commitment to build a human rights culture in the ACT and to ensure that Territory managers are working within a human rights framework. All public officials have a duty to interpret the legislation under which they operate consistently with human rights, unless the Territory law clearly authorises otherwise.
Under section 40 of the HRA the LDA is a public authority. The majority of the LDA’s functions involve commercial relationships with business entities. The LDA discharges those functions in accordance with its obligations under section 40B of the HRA, whereby it is unlawful to act in a way that is incompatible with a human right or, in making a decision, to fail to give proper consideration to a relevant human right.
In its interactions with individuals, primarily through land sales, the LDA applies clear and transparent sale processes to protect the rights of all parties. It also provides comprehensive pre-sale material to intending purchasers that fully informs them of all relevant issues.
In all its dealings with staff, members of the public and the business community, the LDA acts in a way that takes its responsibilities into account and is respectful of human rights.
The LDA continued to actively work towards creating a positive work culture with ongoing promotion of the Respect, Equity and Diversity (RED) framework. RED training continues to be compulsory for all staff. During the reporting period 15 staff from the LDA participated in RED training.
The Human Rights Commission is referred to in the EDD Induction Manual, which is supplied to all new staff, and also in various human resource policies and fast facts, available to all staff via the Intranet.
The Directorate is committed to making information available on our various websites accessible to individuals with disabilities. Training on creating accessible documents was provided to staff on an as needs basis. The EDD Online Working Group (chaired by the head of the Communications Branch) was established to implement the Web Content Accessibility Guidelines (WCAG) and is continuing to work to bring the Directorate’s and the LDA’s websites into compliance with the requirements of WCAG.
The LDA has no matters before courts or tribunals that relate to human rights, nor has the LDA any involvement with developing legislation.
Further information may be obtained from:
Director, Office of the Chief Executive Phone: (02) 6205 2697
81ANNUAL REPORT 2013-14

D.4. Territory Records Act
The ACT Government plays an important role in ensuring records documenting ACT Government decisions and/or the heritage of the ACT are available to Canberra residents and government officials when required. Records provide evidence and proof of a particular action and provide support and transparency around the business conducted by the Territory.
Records management emphasises the value of knowledge and information as a resource. Ensuring that records are created, stored and retained in a structured manner enables information to be retrieved and accessed quickly as needed. This allows staff to fully dedicate their energies to their work tasks knowing that their information can be easily retrieved. The record life cycle extends from the time records are received or created, through processing and use, to placement in storage and retrieval systems until eventual destruction or permanent archival retention.
Records management policy and procedures
The records created by the LDA come in many formats: documents, maps, plans, drawings, negatives, slides, costumes, artworks, models, crown leases and investigation reports. Regardless of the format, these records tell a story about the work of the agency and give context to each task. The recording of this history is invaluable in painting a picture of what has occurred in Canberra over the years.
Under the MoU between the LDA and EDD, all records management services, including training, materials and the administration of the TRIM system, are provided by EDD.
A major achievement of the LDA in 2013-14 was the redevelopment of the Records Management Program (RMP), which complies with section 16 of the Territory Records Act 2002. The RMP outlines how the LDA will manage, retain and dispose of its records, in accordance with Whole-of-Government Thesaurus and Disposal schedules, and local policies, procedures and instructions. The RMP and supporting documentation is available to staff via the LDA intranet, and the RMP is available to the public via the LDA website.
Training
An ongoing in-house training program run by the EDD Governance Section is in place to train all staff in basic records management policy and procedures, including ongoing individual support as required. This financial year saw eight LDA staff undertake an in-house course in Information and Records Management, bringing the total number of staff trained to 97 since December 2011.
The LDA uses the TRIM database for the management and storage of records, primarily hard copy files. To support the records management area, a Power User Network has been established in the LDA to manage the creation and tracking of the physical files in TRIM. In addition to tracking hard copy files, TRIM is used by the Action Tracking Team to manage LDA Ministerial matters and approval processes electronically in TRIM. A separate training session and ongoing support is also provided to these staff members; this year four staff were trained in TRIM Power User and Ministerial Action Tracking.
82 LAND DEVELOPMENT AGENCY

Sec
tion
AS
ectio
n B
Sec
tion
CS
ectio
n D
Sec
tion
ES
ectio
n F
Training sessions 2012-13 attendees 2013-14 attendees
Information and Records Management 18 8
TRIM Power User and Ministerial Action Tracking 5 4
Access to records
In accordance with the Act, the LDA has an arrangement in place to preserve records containing information that allow people to establish links with their Aboriginal or Torres Strait Islander heritage. The LDA does not expect that any of its records will contain information that may allow people to establish links with their Aboriginal or Torres Strait Islander heritage, however if such a record is created, received or identified, the Directorate will endorse the record with the notation “File contains records with Aboriginal or Torres Strait Islander heritage information – Do Not Destroy”.
Public Access provisions of the Act allow access to records that are more than 20 years old. In 2013-14 the LDA received five separate public access requests for records and information.
Members of the public can seek access to the LDA’s records by contacting: ArchivesACT GPO Box 158, Canberra City ACT 2601 Email to: [email protected] Fax Number +61 2 6207 5835
Phone Numbers: Reference Archivist (Government records) +61 2 6207 5726 Access Support Officer +61 2 6205 3510
Under section 28 of the Territory Records Act, the LDA may apply to the Director of Territory Records to make a declaration to exempt certain records or classes of records from public access under prescribed provisions of the Act. Access to a record to which a declaration applies is prohibited under the Act.
In compliance with section 30 of the Act, the LDA maintains an approved register of section 28 declarations which is incorporated into the Territory Records Office consolidated version (available for government use on their intranet site).
Disposal of records
In addition to the Whole-of-Government Thesaurus and Disposal Schedules, which are used to manage retention length and disposal of administrative records, agency specific records are managed in accordance with the below notifiable instruments.
Records Disposal Schedule Name Effective Year and No.
Government Coordination Records 14 September 2007 NI2007—280
Land Development 21 April 2006 NI2006—136
83ANNUAL REPORT 2013-14

At present there are two disposal freezes that are relevant to the LDA. The aim of a disposal freeze on records is to minimise the risk of losing crucial evidence at, or around the time when an issue has been identified. They are:
• The Federal Post Cornwell Superannuation Case Litigation - Processing of Additional Claims; Instruction 23 – TRO Records Advice No. 59. Records Disposal Freeze – Superannuation Records 2010-2015; and
• Royal Commission into Institutional Responses to Child Sexual Abuse - Territory Records (Records Disposal Schedule - Protection of records relevant to the Royal Commission into Institutional Responses to Child Sexual Abuse) Approval 2013 (No 1).
The LDA will continue to retain records identified under the disposal freezes until the litigation and commission come to an end and the disposal freezes are lifted.
Further information may be obtained from:
Director, Office of the Chief Executive Phone: (02) 6205 2697
84 LAND DEVELOPMENT AGENCY

Sec
tion
AS
ectio
n B
Sec
tion
CS
ectio
n D
Sec
tion
ES
ectio
n F
D.5. Legal Services Directions
The LDA had the following measures in place to ensure awareness and compliance with the legal services directions:
• The Chief Executive Officer regularly reports to the Board on the status of all current litigation and legal proceedings.
• All of LDA’s legal services are provided by the ACT Government Solicitor, except where the Chief Solicitor has provided approval to outsource legal work.
• Policies and procedures will continue to be developed and reviewed to ensure compliance with the legal services directions.
There were no breaches of the legal services directions by the LDA in 2013-14.
Further information may be obtained from:
Chief Finance Officer Phone: (02) 6205 3585
85ANNUAL REPORT 2013-14

D.7. Bushfire Risk Management
The LDA complies with the requirements of the ACT Government’s Strategic Bushfire Management Plan (SBMP) for the ACT.
The Emergencies Act 2004 requires the Emergency Services Agency (ESA) to develop a SBMP. The SBMP establishes the basis and framework for efficient, effective and comprehensive management of fire and fire-related activities to protect human life, property, assets and the environment. One of the requirements of the plan is that land managers inside the Bushfire Abatement Zone produce a Bushfire Operational Plan (BOP).
The LDA prepares a Bushfire Management Plan to cover areas under its land management control and sets out individual requirements and commitments in a BOP.
The LDA’s BOP comprises a variety of methods to reduce or remove fire fuels such as dead and damaged trees, long dry grass and fallen branches, some shrub and lower branches, bark and leaves. In 2013-14 these methods included physical removal, slashing, mowing, grazing, general maintenance and creation of fire suppression trails.
All areas in which these methods are applied are monitored for regrowth and any further risks or hazards.
In 2013-14 slashing was carried out on over 124.8 hectares at Block 766 Bonner (Horse Park Homestead), Moncrieff, Jacka, Lawson South, Gungahlin Town Centre, Hume and Wright.
Grazing of livestock is used in areas not considered environmentally sensitive. In 2013-14, 285.6 hectares of land in Moncrieff and Glenloch were grazed.
In addition, the LDA undertakes individual bushfire risk assessments for estates as directed by ESA’s SBMP and using the Environment and Sustainable Development Directorate’s (formerly ACTPLA) guidelines ‘Planning for Bushfire Risk Mitigation General Code 2008’.
Bushfire mitigation strategies identified as a result of these assessments are implemented in development of the estates or are included in individual sale conditions as well as in englobo sale of land to the private sector for its development.
Further information may be obtained from:
Director, Office of the Chief Executive Phone: (02) 6205 2697
86 LAND DEVELOPMENT AGENCY

Sec
tion
AS
ectio
n B
Sec
tion
CS
ectio
n D
Sec
tion
ES
ectio
n F
D.8. Commissioner for the Environment
The LDA has continued to provide information on progress towards implementing relevant recommendations in Commissioner for the Environment reports and has provided other information as requested by the Commissioner.
This has included contributing a response and evidence to a review of the implementation of water related recommendations for the Office of the Commissioner for Sustainability and the Environment’s 2013-14 Annual Report.
The LDA is also currently preparing to compile responses and evidence for the 2015 State of the Environment Report to address the Commissioner’s request for information.
Further information may be obtained from:
Project Director Sustainability and Innovation Phone: (02) 6207 5602
87ANNUAL REPORT 2013-14

88 LAND DEVELOPMENT AGENCY


E.1. Human Resources Management
Under a MoU arrangement between the LDA and EDD, the EDD Human Resource (HR) Unit continued to provide strategic, operational and technical advice and HR support to executives, managers and staff of the LDA. The unit performs a number of HR functions for the LDA and facilitates the provision of support directly from the Shared Services Centre. The human resource priorities are guided by the EDD Strategic Plan 2013-2016. These priorities are delivered by: providing learning and development opportunities to attract, build and retain a resilient workforce, ensuring a safe and productive work environment and by offering effective performance feedback to build a collaborative workforce.
DELIVERING FOR THE FUTURE
The ACT Public Service Economic Development Portfolio Enterprise Agreement 2011-13 (the EDP Agreement) reached its expiry date on 30 June 2013. Negotiations commenced for three new agreements with the ACT Public Service Administrative and Related Classification Enterprise Agreement 2013-2017 (Administrative Agreement) taking effect from 30 May 2014.
Negotiations continue on the other two agreements, being the Technical and other Professional Staff Agreement and the Infrastructure Services Agreement, and these are expected to take effect during the 2014-15 reporting period.
Attraction and retention of key staff remains a principal objective for the LDA to ensure that operational priorities are achieved. The LDA facilitated access for staff to attend training programs to build skills, knowledge and enhance professional development. Training programs and courses were communicated regularly to staff and promoted via the intranet and the Shared Services Training Calendar.
The LDA supported staff in attending whole-of-government leadership and development programs to nurture the talent of emerging leaders and strengthen leadership in the LDA. Learning and development requirements for the LDA are identified through personal development plans as well as evolving technology and maintenance of qualifications.
STRENGTHENING ORGANISATIONAL RESILIENCE
The LDA continued to promote workplace health and safety to maintain a workplace culture that provides a healthy and safe working environment. This involved improving staff awareness and understanding of the health and safety roles and responsibilities.
During the reporting period, an important achievement was the implementation of the Health and Wellbeing program, which incorporated activities for staff to participate in, and development of policies and fact sheets to encourage a healthy active workplace.
The LDA has a number of strategies in place to ensure organisational resilience is achieved. This includes the introduction of the performance and development framework, training and development opportunities to build and enhance knowledge and skills, and a number of health and wellbeing initiatives (refer to section E.3).
90 LAND DEVELOPMENT AGENCY
Sec
tion
AS
ectio
n B
Sec
tion
CS
ectio
n D
Sec
tion
ES
ectio
n F
To ensure workplaces throughout the LDA are respectful, courteous, fair and value individual differences, the Respect, Equity and Diversity (RED) Framework was promoted throughout the year with Induction sessions incorporating RED for all new employees and compulsory RED training for staff at all levels. The RED Contact Officer Network met quarterly to discuss topics including information sharing, problem solving/debriefing, and peer support opportunities.
The LDA also implemented and actively promoted the ACTPS Values and Signature behaviours and the ACTPS Code of Conduct, which are available to staff through information sessions, training and on the intranet.
EDD continues to run the Staff Awards program each year which rewards EDD and LDA staff for excelling in categories based around the ACTPS values of Respect, Integrity, Collaboration and Innovation.
SUSTAINING COMMUNITY CONFIDENCE
The LDA is committed to promoting a positive culture of integrity, respect and participation that is supported by various policies. It seeks to achieve a workplace that is respectful, welcomes diversity and is free of discrimination, harassment and bullying, and where staff are aware of their obligations.
Induction programs are conducted for all new staff, with training on the RED Framework compulsory for all staff to ensure they are aware of their rights and responsibilities as an employee of the LDA and the ACTPS. The RED Framework and the Code of Conduct assist to deliver the LDA’s and EDD’s commitment to a culture of integrity, respect and participation on a range of matters of community concern. These include such issues as conflict of interest, fraud, corruption, integrity, respect and inclusiveness.
The LDA’s Performance Management program continues to be an important factor in ensuring individual development and enhancing skills and capabilities required to achieve the LDA’s strategic goals. The program encourages employee performance through ongoing feedback and performance reviews that lead to growth and innovation.
The HR Unit facilitated a number of learning and development opportunities, by conducting inhouse training and providing information regarding the courses on the Shared Services training calendar as well as participating in the service-wide programs.
WORKING COLLABORATIVELY
LDA representatives actively participated and engaged in various cross-agency forums including the People and Performance Council, HR Directors, various security and emergency forums and a range of work health and safety meetings.
During the reporting period, LDA participated in the EDD Consultative Committee and Workplace Consultative Committees (WCC) which continued to meet regularly to consolidate consultation and communication between managers, staff and unions. In addition, the WHS Committees, Health and Safety Representative Network and a RED Contact Officer Network met regularly throughout the financial year.
A bi-monthly Senior Managers Forum, which involves all Senior Managers and Executives, ensures a regular update of information from the Chief Executive Officer and provides an opportunity for sharing information and networking.
91ANNUAL REPORT 2013-14

The HR Unit continued to support managers and supervisors on HR issues and accountabilities by initiating informal meetings with individual managers on an ongoing basis. This level of engagement allowed managers and HR to work together to address potential issues of concern.
EDD’s and LDA’s Social Club is strongly supported by staff and management and actively promotes positive staff morale, networking opportunities and work life balance.
Further information may be obtained from:
Director, Office of the Chief Executive Phone: (02) 6205 2697
92 LAND DEVELOPMENT AGENCY
Sec
tion
AS
ectio
n B
Sec
tion
CS
ectio
n D
Sec
tion
ES
ectio
n F
E.2. Learning and Development
The LDA continued to provide learning and development opportunities to strengthen its workforce, build organisational capability, encourage retention and enhance ongoing performance. This has been achieved by providing a range of in-house learning and development opportunities provided as part of the EDD Learning and Development Program as well as utilising the ACT Public Service training calendar, attending conferences and various specialist programs.
Learning and Development activities included, but were not limited to, the programs outlined below.
Corporate Compliance
Staff induction: The induction program is divided into two half day sessions, with the first providing current and new employees with an overview of the functions of EDD (including LDA) and an opportunity to network and learn about the EDD portfolio. The second session is specifically aimed at new employees and is designed to provide them with an understanding of expectations in the workplace, conditions of service and workplace health and safety. LDA Executive participated in the delivery of this program.
Respect, Equity and Diversity: There are three training programs presented by CIT Solutions. These include general staff training, managerial training and Contact Officer training. The training is focused on increasing awareness and understanding of the ACT Public Service Respect, Equity and Diversity Framework.
Information and Records Management: All new staff are required to attend an in-house training on Information and Records Management.
Work Health and Safety: A diverse range of WHS training is provided. This includes First Aid Officer training; OHS Construction Induction; Asbestos Awareness; WHS for Health and Safety Officers; Executive WHS refresher; Mental Health and Wellbeing; Quit Smoking; and Managing Psychological Illness in the Workplace.
Freedom of Information: Executive staff participated in FOI training and staff attended courses facilitated by Justice and Community Safety Directorate.
Risk Management: All Executive Staff were invited to attend Risk Management training delivered by ACTIA.
Job specific
Writing for Government: This program builds on existing writing skills, providing participants with the ability to write clear and concise briefs and correspondence.
Project Management: Staff were able to participate in a variety of Project Management courses including Diploma of Project Management, Microsoft Project Management and general Project Management course.
Other courses included: Communicating with Influence, CPA Congress conference; Indigenous Cultural Awareness; and Project and Policy Evaluation.
93ANNUAL REPORT 2013-14

Management
Coaching Skills for Leaders and Managers: This program consisted of a two day course and a recall session. It exposed Managers to key coaching skills and methodologies to foster improved engagement and performance.
HR Masterclass: This program is designed to provide experienced managers with access to training in high level management skills, enabling them to effectively manage complex people management issues.
In-house learning and development opportunities were promoted to staff with 93 staff attending training at an estimated cost of $122,129.
Other Whole-of-Government Learning and Development Opportunities
Initiative No. Of Participants
ACTPS Graduate Program 2
Future Leaders Program 0
Executive Development Program 1
Shared Services Training
Learning and Development opportunities offered through the Shared Services Training Calendar were promoted to staff with approximately 22 staff attending training with an estimated cost of $8,276.
Studies Assistance
LDA supported three staff members through the Studies Assistance Program by providing paid and unpaid leave payment or course costs during the reporting period with an investment by the LDA of $1,654.
Further information may be obtained from:
Director, Office of the Chief Executive Phone: (02) 6205 2697
94 LAND DEVELOPMENT AGENCY

Sec
tion
AS
ectio
n B
Sec
tion
CS
ectio
n D
Sec
tion
ES
ectio
n F
E.3. Work Health and Safety
Work Health and Safety is a priority for the LDA and it is managed in accordance with the statutory provisions of the Workplace Health and Safety Act 2011 (WHS Act) and supported by the ACTPS Workers Compensation and Safety Improvement Plan. The CMTD Safety Support team provided guidance and support to the LDA in implementing the requirements under the WHS Act. The LDA continued to implement the actions identified in its Work Health and Safety Strategic Plan.
During the reporting period the LDA was not issued (under Part 10 of the WHS Act) with any improvement, prohibition or non-disturbance notices, nor did the Agency fail to comply with any enforceable undertakings under Part 11 or Part 2 (Divisions 2.2, 2.3 and 2.4) of the WHS Act.
Health and safety structures and consultation arrangements
The LDA was represented on the Land Development, Strategy and Finance Health and Safety Committee, which became the Land Development and Corporate Health and Safety Committee as of 1 April 2014. The Committee meets on a quarterly basis to provide a mechanism for consultation, coordination and communication between employees, represented unions and management. The Committee monitors the effectiveness of the safety management system, considers injury prevention initiatives and programs, and promotes the achievement of improved health and safety outcomes.
Copies of minutes of the WHS Committee meetings are uploaded to the intranet and provided to the LDA Board. The LDA Board receives monthly WHS updates. The LDA has four elected Health and Safety Representatives who are members of the broader Land Development and Corporate Health and Safety Committee. The CMTD Safety Support Team attend Committee meetings to provide safety advice.
During the reporting period, a network meeting for Health and Safety representatives across the Directorate’s Portfolio was established. LDA Health and Safety Representatives are members of the network. The aim of the network is to share information amongst health and safety representatives, assist in determining and implementing health and safety initiatives and providing health safety representatives with advice on health and safety matters affecting the Directorate Portfolio. The CMTD Safety Support Team attend and present at the network meetings.
Injury prevention and health and wellbeing
The LDA implemented a range of injury prevention and health and wellbeing initiatives and continued to promote a culture where health, safety and wellbeing are a part of everyday business. Initiatives implemented include:
• monthly Health and Wellbeing updates for staff;
• monthly HR newsletter that includes health and wellbeing information;
• ‘Health and Wellbeing’ reimbursement initiative (not exceeding $100 per annum) to financially support employees to participate in health and wellbeing activities;
• ongoing provision of workstation assessments;
95ANNUAL REPORT 2013-14

• induction sessions that includes work health and safety information;
• engagement of rehabilitation providers for both compensable and non-compensable injuries/illnesses to support employees to an early, safe and supported return to the workplace;
• participation in events such as Lifeline’s Stress Down Day;
• representation on the whole of government Health and Wellbeing Network and Work Health and Safety Working group;
• a carer’s room, located within the workplace, is provided for staff to utilise;
• ‘Breastfeeding Friendly Workplace’ reaccreditation;
• provision and promotion of professional and confidential counseling services available to staff and their families through the Employee Assistance Program (EAP) provided by OPTUM;
• provision and promotion of the EAP Manager Assist Program;
• influenza vaccinations offered onsite to staff;
• yoga classes (paid by staff);
• coordination of blood donation courtesy bus travel (workplace absence is without loss of pay);
• mental health awareness promotion activities;
• quit smoking program;
• walking groups and walking meetings;
• weight loss program available for staff;
• review of WHS policies;
• management of workplace psychological illness in the workplace program for supervisors;
• mandatory respect, equity and diversity training;
• continued implementation of construction white card training and asbestos awareness training;
• First Aid Officer training;
• HR Masterclass for experienced managers;
• work health and safety refresher training for Executives;
• coaching skills for leaders and managers:
• managing Return to work – Toolbox sessions; and
• leadership – identifying psychopaths and psychopathic behaviour in the workplace seminar.
Notifiable Incidents
The LDA did not report any ‘notifiable incidents’ to the regulator in accordance with Part 3, Section 38 of the WHS Act.
Further information may be obtained from:
Director, Office of the Chief Executive Phone: (02) 6205 2697
96 LAND DEVELOPMENT AGENCY
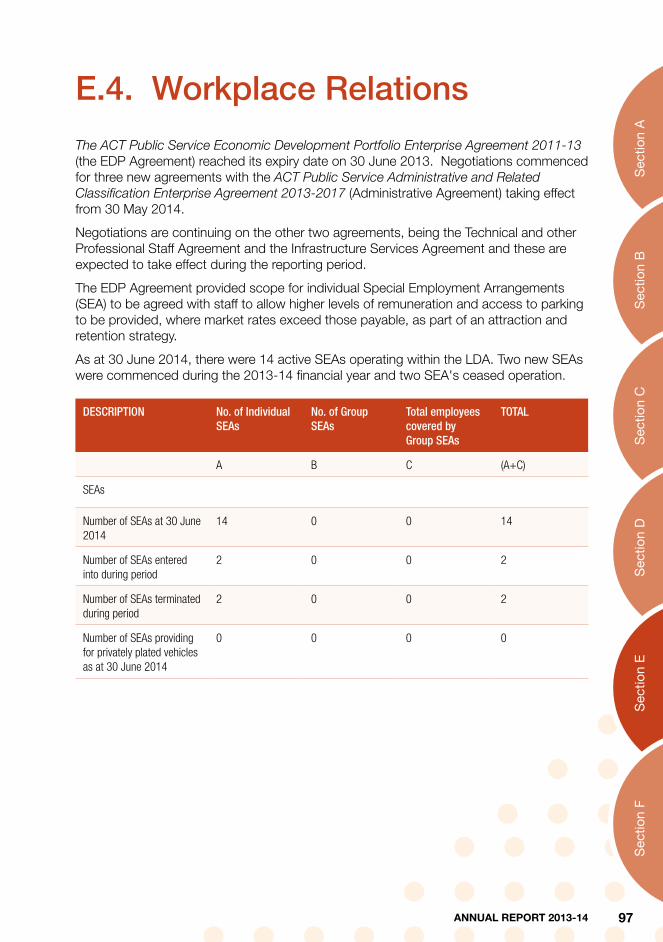
Sec
tion
AS
ectio
n B
Sec
tion
CS
ectio
n D
Sec
tion
ES
ectio
n F
E.4. Workplace Relations
The ACT Public Service Economic Development Portfolio Enterprise Agreement 2011-13 (the EDP Agreement) reached its expiry date on 30 June 2013. Negotiations commenced for three new agreements with the ACT Public Service Administrative and Related Classification Enterprise Agreement 2013-2017 (Administrative Agreement) taking effect from 30 May 2014.
Negotiations are continuing on the other two agreements, being the Technical and other Professional Staff Agreement and the Infrastructure Services Agreement and these are expected to take effect during the reporting period.
The EDP Agreement provided scope for individual Special Employment Arrangements (SEA) to be agreed with staff to allow higher levels of remuneration and access to parking to be provided, where market rates exceed those payable, as part of an attraction and retention strategy.
As at 30 June 2014, there were 14 active SEAs operating within the LDA. Two new SEAs were commenced during the 2013-14 financial year and two SEA's ceased operation.
DESCRIPTION No. of Individual SEAs
No. of Group SEAs
Total employees covered by Group SEAs
TOTAL
A B C (A+C)
SEAs
Number of SEAs at 30 June 2014
14 0 0 14
Number of SEAs entered into during period
2 0 0 2
Number of SEAs terminated during period
2 0 0 2
Number of SEAs providing for privately plated vehicles as at 30 June 2014
0 0 0 0
97ANNUAL REPORT 2013-14

Classification Range Remuneration as at 30 June 2014
Individual and Group SEAs SPOC - SOGA $130,847 - $184,111
Further information may be obtained from:
Director, Office of the Chief Executive Phone: (02) 6205 2697
Staff attending the LDA 10th Birthday function
98 LAND DEVELOPMENT AGENCY

Sec
tion
AS
ectio
n B
Sec
tion
CS
ectio
n D
Sec
tion
ES
ectio
n F
E.5. Staffing Profile
As at 30 June 2014, the LDA comprises a workforce of 104 people with the majority 93 (89.42 per cent) employed on a permanent basis. There are 14 (13.5 per cent) permanent part-time employees with the majority being female. There has been an increase in this reporting period across all equity and diversity groups with 19.2 per cent of employees identifying as being an Aboriginal or Torres Strait Islander, from a culturally and linguistically diverse background or having a disability.
FTE AND HEADCOUNT BY GENDER
Female Male Total
Full Time Equivalent 47.8 51.8 99.6
Headcount 52 52 104
Percentage of workforce (based on headcount) 50.0 50.0 100.0
Note: numbers may not add due to rounding.
HEADCOUNT BY CLASSIFICATION AND GENDER
Classification Groups Female Male Total
Administrative Officers 25 8 33
Executive Officers 0 4 4
General Service Officers and Equivalent 0 0 0
Professional Officer 0 0 0
Rangers 0 0 0
Senior Officers 27 40 67
Technical Officers 0 0 0
TOTAL 52 52 104
HEADCOUNT BY EMPLOYMENT CATEGORY AND GENDER
Employment Category Female Male Total
Casual 0 0 0
Permanent Full-time 35 44 79
Permanent Part-time 13 1 14
Temporary Full-time 3 7 10
Temporary Part-time 1 0 1
TOTAL 52 52 104
99ANNUAL REPORT 2013-14

FTE AND HEADCOUNT BY DIVISION/BRANCH
Division/Branch FTE Headcount
Office of the Deputy Director-General 3.0 3
Corporate 17.5 19
Estate Development 61.2 64
Urban Renewal 17.9 18
Total 99.6 104
HEADCOUNT BY BRANCH AND EMPLOYMENT TYPE
Division/Branch Permanent Temporary Casual Total
Office of the Deputy Director-General
2 1 0 3
Corporate 16 3 0 19
Estate Development Branch
59 5 0 64
Urban Renewal 16 2 0 18
Total 93 11 0 104
HEADCOUNT BY AGE GROUP AND GENDER
Age Group Female Male Total
Under 25 4 1 5
25-34 15 7 22
35-44 19 20 39
45-54 9 14 23
55 and over 5 10 15
Total 52 52 104
100 LAND DEVELOPMENT AGENCY

Sec
tion
AS
ectio
n B
Sec
tion
CS
ectio
n D
Sec
tion
ES
ectio
n F
HEADCOUNT BY LENGTH OF SERVICE, GENERATION AND GENDER
Average Length of Service
Pre-Baby Boomers
Baby Boomers Generation X Generation Y Total
F M F M F M F M F M
0-2 0 0 0 1 5 4 2 2 7 7
2-4 0 0 0 2 4 5 5 1 9 8
4-6 0 1 1 0 3 3 3 2 7 6
6-8 0 0 4 2 6 4 5 0 15 6
8-10 0 0 0 2 3 4 2 0 5 6
10-12 0 0 0 1 0 2 0 0 0 3
12-14 0 0 0 3 2 2 0 0 2 5
14+ years 0 0 3 7 4 4 0 0 7 11
Total 0 1 8 18 27 28 17 5 52 52
Generation Birth years covered Generation Birth years covered
Pre-Baby Boomers prior to 1946 Generation X 1965 to 1979 inclusive
Baby Boomers 1946 to 1964 inclusive Generation Y from 1980 and onwards
HEADCOUNT BY LENGTH OF SERVICE AND GENDER
Female Male Total
Average years of service 7.4 9.7 8.5
HEADCOUNT BY DIVERSITY GROUP
Category Diversity Group Headcount Percentage of agency workforce
A Aboriginal and Torres Strait Islander 3 2.9
B Culturally and Linguistically Diverse 13 12.5
C People with a disability 4 3.8
NB: Employees may identify with more than one of the diversity groups.
Further information may be obtained from:
Director, Office of the Chief Executive Phone: (02) 6205 2697
101ANNUAL REPORT 2013-14

102 LAND DEVELOPMENT AGENCY

F.1. Financial Management Analysis
Management Discussion and Analysis Report Land Development Agency Financial Year Ended 30 June 2014
Objectives
The key objectives of the LDA are to: • ensure that an adequate supply of greenfield and brownfield land will be maintained
to meet market demand for residential, commercial, industrial and community uses;
• contribute to the delivery of the Government’s policies and priorities related to affordable housing, sustainability, climate change and urban intensification;
• adopt a ‘One Government’ approach during the land development process through the cultivation and maintenance of productive relationships across the ACT Government;
• operate efficiently in the markets in which it operates and provide agreed returns to the Territory on its investment in the Agency;
• ensure that key commercial decisions on land in the ACT are made with due consideration to the sustainability of the Territory (that is by balancing economic, social and environmental factors); and
• engage the community in a timely manner in the land development process and continue to improve community engagement processes for redevelopments.
Public Trading Enterprise
The LDA is classified as a Public Trading Enterprise within the ACT Government. Consistent with the ACT Government’s policy statement on competitive neutrality (Competitive Neutrality in the ACT, October 2010), the LDA applies similar costing and pricing principles, taxation and debt guarantee requirements and appropriate regulations as a fully corporatised business, including:
• the acquisition of unleased land for development from the Territory on a commercial basis;
• payment of land holding costs and stamp duty equivalents;
• application of the National Taxation Equivalents Regime; and
• providing a commercial return to Government through the development and sale of the land.
104 LAND DEVELOPMENT AGENCY

Sec
tion
AS
ectio
n B
Sec
tion
CS
ectio
n D
Sec
tion
ES
ectio
n F
The total return to the ACT Government from the LDA’s activities consists of:
• land acquisitions at market value;
• the payment of income tax equivalents;
• the payment of dividends;
• the payment of land holding and stamp duty equivalents; and
• payroll tax.
Table 1 below compares the total returns to the Territory in 2013-14, with the 2013-14 Budget (Statement of Intent) and the actual returns in 2012-13. These results are based on accrual accounting.
Table 1: Comparison of Returns to the Territory
Actual 2014 $’m
Budget 2014 $’m
Actual 2013 $’m
Dividends paid 67 79 109
Income tax equivalent payments 29 34 47
Payments for land acquisitions 52 203 52
Payroll tax 1 1 1
Stamp duty 4 12 6
Total Returns to the Territory 153 329 215
Total returns to the Territory are lower than the previous year primarily due to a decrease in land sales revenue. Detailed variances between the 2013-14 result, the 2012-13 result and the 2013-14 Budget are provided below.
Risk Management
The residential, commercial and industrial markets are highly cyclical, when market conditions change the land sales revenue and profit is impacted. Consequently, this may adversely impact on the LDA’s ability to deliver forecast returns to the ACT Government if market conditions deteriorate. It could also lead to higher than forecast returns if market conditions are more favourable than forecast. Specific risks include regulatory risk, industry capacity and performance risks, market risks and stakeholder risks as detailed below.
Regulatory Risks
• The availability of an adequate supply of appropriately zoned residential, commercial, industrial and community land, together with concept plans and timely approvals to enable development activity to take place within planned timeframes.
• Unforseen delays in approvals and clearances from relevant Government directorates and Commonwealth agencies that would result in slippage in the achievement of planned land release programs and revenue.
• Changes in Commonwealth or other regulatory requirements may add uncertainty or increase costs for LDA activities impacting on delivery timeframes.
105ANNUAL REPORT 2013-14

Industry Capacity and Performance Risks
• Inability of the LDA to attract, recruit and retain a sufficient number of skilled staff.
• Delays in the planning and timely delivery by other Directorates and utilities providers of the necessary budget funded capital works infrastructure in order to support the land release program.
• Increases in costs due to contract performance or extension of time (eg from sustained wet weather) impacting on development schedules and financial performance projects, resulting in lower or delayed forecast returns to the Government.
• Contractors’ failure to meet the requirements of the Work Health and Safety Act 2011.
• The adequacy or otherwise of industry capacity and skills availability to provide necessary services to deliver land servicing and broader capital works activities.
Market Risks
• Volatility in market demand for land as a result of the economic environment.
• Whether the Government’s Indicative Land Release Programs can be absorbed by the market.
• Possible increases in land servicing and construction costs.
Stakeholder Risks
• Whether the sales revenue and land release targets can be achieved.
• Addressing diverse and/or conflicting community views on development.
Strategies for 2013-14
The key strategies for 2013-14 that the LDA employed to achieve its objectives and effectively manage risks included:
• collaborating with government agencies towards developing an inventory of environmentally cleared, planned, release ready and serviced land to provide flexibility and alternative release options to cover any unanticipated delays on sites otherwise identified for release in the relevant period;
• using appropriate contract types, mechanisms and active management including Work Health and Safety, of the full range of contractors and consultants providing services to the LDA;
• providing detailed technical advice to the Economic Development Directorate (EDD) to assist it in resolving land development issues with the Commonwealth;
• working with government agencies and the community to develop urban renewal and development strategies for the city centre, town centres, major transport corridors and group centres;
• effectively engaging with local communities, industry associations, relevant special interest groups and the broader ACT community to ensure relevant interests are identified and considered in LDA developments and land release activities;
• maintaining a detailed understanding of relevant regulatory requirements and monitoring approval processes and liaising with relevant agencies to manage any issues that could otherwise delay projects;
• effectively engaging with the private sector to capture market knowledge and encourage innovation and the transfer of skills;
106 LAND DEVELOPMENT AGENCY

Sec
tion
AS
ectio
n B
Sec
tion
CS
ectio
n D
Sec
tion
ES
ectio
n F
• pursuing initiatives to deliver affordable housing, consistent with the Affordable Housing Action Plan;
• consulting with the community regularly regarding the release of land in accordance with the Indicative Land Release Programs;
• improving integration of design management and delivery of capital works with estate works;
• encouraging viable and liveable communities by providing a variety of block and dwelling types and public spaces to suit the needs of residents and surrounding communities;
• delivering programs for community consultation and community development to encourage involvement and support for community building and collaborating with the Community Services Directorate in this process;
• positioning the LDA within the market as a place of preferred employment by utilising transparent succession planning frameworks and career paths, rewarding performance and investing in staff development through training; and
• contributing to the redevelopment of the transit corridor between Gungahlin, Civic and Lake Burley Griffin, through the Capital Metro, and City to the Lake Projects.
Financial Performance
The following financial information is based on the audited 2013-14 Financial Statements and the forward estimates contained in the 2014-15 Budget Papers.
Total Income
Components of Income
As shown in Figure 1 below, the LDA derived 87.7% of its total income for the year ended 30 June 2014 from Land Sales, 7.4% from Share of Joint Venture Profit, 3.5% from Other Income and 1.4% from Interest.
Figure 1: Components of Income 2013-14
Land Sales87.7%
Share of Joint Venture Profit
7.4%
Interest1.4%
Other Income3.5%
107ANNUAL REPORT 2013-14

Components of Land Revenue
As shown in figure 2 below, 77.6% of the LDA land revenue was derived from residential land sales for the year ended 30 June 2014, 11.4% from commercial and industrial land sales, 7.6% from Community land sales and infrastructure revenue delivered by third parties, 3.1% from Englobo sales to other developers, and 0.3% from recovery of overpaid GST.
Figure 2: Components of Land Revenue 2013-14
Residential Sales
77.6%
Commercial and Industrial
Land Sales11.4%
Community Land
Sales/Other7.6%
Recovery of Overpaid GST
0.3%
Englobo Sales to Other
Developers3.1%
Components of Gross Profit
As shown in figure 3 below, 83.4% of the LDA gross profit was derived from residential land sales for the year ended 30 June 2014, 7.2% from commercial and industrial land sales, 6.2% from community land sales, 2.5% from Englobo sales to other developers and 0.7% from recovery of overpaid GST.
Figure 3: Components of Gross Profit 2013-14
Residential Sales
83.4%
Recovery of Overpaid GST
0.7%
Commercial and Industrial
Land Sales7.2%
Community Land
Sales/Other6.2%
Englobo Sales to Other
Developers2.5%
108 LAND DEVELOPMENT AGENCY

Sec
tion
AS
ectio
n B
Sec
tion
CS
ectio
n D
Sec
tion
ES
ectio
n F
Comparison to Budget
Actual income of $269.2 million was $232.8 million lower than the budget. Actual land sales revenue of $235.9 million was $248.6 million lower than budget. The lower than budgeted land revenue related to the unsuccessful negotiations to sell the Denman Prospect englobo parcel of land, delays in construction due to delayed regulatory clearances and inclement weather, negotiation of deferred settlements and decreased demand in certain parts of the residential, commercial and industrial markets.
Comparison to 2012-13 Actual
Actual income of $269.2 million was $53.2 million lower than the 2012-13 actual result. Actual land sales revenue of $235.9 million was $27.0 million lower than the revenue achieved in 2012-13 due to:
• a decrease in sales of land in the LDA estates primarily due to the finalisation of sales in Bonner, Harrison 4, Jacka and Wright during 2012-13; partially offset by increased sales in Coombs, Amaroo, Flemington Road and the Kingston Foreshore; and
• the reduction in the recovery of overpaid GST from the Australian Taxation Office for prior year land sales. The majority of this was claimed in the 2012-13 financial year.
partially offset by:
• the Englobo sale of Watson Section 64;
• an increase in sales in Commercial and Industrial land in Dickson, Greenway and the Gungahlin Town Centre;
• an increase in Community sales due to the sale of Ngunnawal Section 23 and Watson Section 111; and
• an increase in infrastructure delivered by third parties due to an increased number of contracts settled that required infrastructure to be delivered by third parties.
Future Trend - Income
Figure 4 below shows the actual Total Income (inclusive of net investments in Joint Ventures), Total Expenses and Operating Profit before Tax for 2012-13, 2013-14, the 2013-14 Budget and the forward estimates for the upcoming four years. The future trend in Total Revenue reflects the Government’s currently published land release program in future years (2014-15: 3,600 dwellings; 2015-16: 3,300 dwellings; 2016-17: 3,300 and 2017-18: 3,300 dwellings).
Figure 4: Future Trends
0100200300400500600
2012-13 Actual
2013-14 Budget
2013-14 Actual
2014-15 Budget
2015-16 Estimate
2016-17 Estimate
2017-18 Estimate
$m
Total Income Total Expenses
Operating Profit before Tax
109ANNUAL REPORT 2013-14

Total Expenditure
Components of Expenditure
Total expenses for the year ended 30 June 2014 (as shown in Figure 5 below) were predominantly for Cost of Land Sold, which was 73.0% of the total. The two components of Cost of Land Sold are land acquisitions 30.2% and development costs 42.8%. The balance of Total expenses was for Supplies and Services 9.9%, Employee Expenses 8.0% and Other Expenses 9.1%.
Figure 5: Components of Expenditure 2013-14
Cost of Land Sold - land
acquisitions30.2%
Cost of Land Sold -
development costs
42.8%
Employee Expenses
8.0%
Supplies and Services
9.9%
Other Expenses9.1%
Comparison to Budget
Actual expenses of $173.9 million were $215.7 million lower than the budget due to:
• Costs of Land Sold were $214.4 million lower than budget primarily due to lower than budgeted land sales as detailed above. The estimated cost of inventories sold are expensed in the Statement of Comprehensive Income at the point the developed land is sold; and
• Interest expenses were $3.7 million lower than budget mainly due to lower than estimated land holding costs.
partially offset by:
• Grants and Purchased Services were $2.9 million higher than budget mainly due to the payment to EDD for services received under the Memorandum of Understanding between EDD and the LDA; and
• Other Expenses were $3.3 million higher than budget mainly due to the inventory write-off of the Hume West Estate.
110 LAND DEVELOPMENT AGENCY

Sec
tion
AS
ectio
n B
Sec
tion
CS
ectio
n D
Sec
tion
ES
ectio
n F
Comparison to 2012-13 Actual
Total expenditure was $6.5 million higher than in 2012-13 due to:
• an increase in employee expenses of $1.2 million mainly due to the salary increases from the ACT Public Service Administrative and Related Classifications Enterprise Agreement 2013-2017 and termination payments for a number of staff.
• an increase in Supplies and Services of $1.2 million mainly due to an increase in sales commissions;
• an increase in Cost of Land Sold of $5.5 million mainly due to the increase in Transfer of Infrastructure Assets expenses; and
• an increase in Other Expenses of $3.0 million mainly due to the inventory write-off of the Hume West Estate.
partially offset by:
• a decrease in Grants and Purchased Services of $3.1 million due to the cessation of the Housing Affordability Funding; and
• a decrease in Interest Expenses of $1.1 million due to lower than estimated land holding costs.
Future Trends- Expenses
As shown in Figure 4 above, Total Expenses are budgeted to vary in line with the Government’s land release program, which directly impacts both the level of construction activity and subsequent land sales.
Dividends
Actual dividends paid and provided for during the 2013-14 year were $66.7 million compared to the budgeted amount of $78.7 million, a decrease of $12.0 million as a consequence lower than anticipated land sales settlements.
Actual dividends paid and provided for during the 2013-14 year were $41.8 million lower than 2012-13, as a consequence of the decreased operating surplus due to a decrease in land sales.
Financial Position
Key indicators of the health of the LDA’s financial position are the ability to sustain its asset base, to pay debts as they fall due and to maintain long-term liabilities at prudent levels.
111ANNUAL REPORT 2013-14

Total Assets
Components of Total Assets
In 2013-14 the LDA maintained a strong net asset position due to its significant cash, receivables and inventory holdings in comparison with its liabilities.
Total Assets as at 30 June 2014 (as shown in Figure 6 below) comprise current and non-current Inventories 53.6%, Cash and Cash Equivalents 23.2%, Receivables 21.9%, and Other Asset 1.3%.
Figure 6: Components of Total Assets 2013-14
Cash and Cash Equivalents
23.2%
Receivables21.9%
Inventories53.6%
Other Asset1.3%
C omponents of T otal As s ets 2013-14
Comparison to Budget
The LDA’s total asset position as at 30 June 2014 of $400.0 million was $5.1 million lower than budget. This is largely due to decreases in:
• Inventories ($14.3 million) mainly due to lower than budgeted development activity and expenditure; and
• Receivables ($25.9 million) mainly due to the write-off of the Right to Receive Infrastructure after the associated works have been completed and transferred to TAMSD and ACTEW.
partially offset by an increases in Cash and Cash Equivalents ($35.7 million) primarily due to lower than budgeted payments for development and land costs.
112 LAND DEVELOPMENT AGENCY

Sec
tion
AS
ectio
n B
Sec
tion
CS
ectio
n D
Sec
tion
ES
ectio
n F
Liquidity
Liquidity refers to the ability of the LDA to satisfy its short-term debts as they fall due. This ability is demonstrated by the LDA’s “current ratio” (set out Table 2 below), which compares the ability to fund short-term liabilities from short-term assets. The ratio shows that the LDA is in a healthy liquidity position (1.54 to 1) at 30 June 2014
Table 2: Current Assets to Current Liabilities
Prior Year Actual
Current Year
Budget
Current Year
Budget
Forward Year
Budget
Forward Year
Budget
Forward Year
Budget
Forward Year
Budget
2012-13 2013-14 2013-14 2014-15 2015-16 2016-17 2016-17
$'000 $'000 $'000 $'000 $'000 $'000 $'000
Total Current Assets
306,585 282,805 308,972 236,370 245,063 248,712 258,195
Total Current Liabilities
210,425 217,287 201,101 168,274 180,498 190,255 204,874
Current Ratio
1.46 to 1 1.30 to 1 1.54 to 1 1.40 to 1 1.36 to 1 1.31 to 1 1.26 to 1
Total Liabilities
Figure 7 below illustrates the LDA’s Total Liabilities comprising Other Liabilities 26.1%, Provision for Project Completions 23.3%, Payables 22.4%, Deferred Tax Liability 14.1%, Liability to Transfer Infrastructure 11.5%, Employee Benefits 2.0%, and Income Tax Liability 0.6%.
Figure 7: Components of Total Liabilities 2013-14
Payables22.4%
Provision for Project Completions
23.3%
Liability to Transfer Infrastructure
11.5%
Other Liabilities26.1%
Income Tax Liability0.6%
Deferred Tax Liability14.1%
Employee Benefits2.0%
113ANNUAL REPORT 2013-14

Other Liabilities reflect revenue received in advance for blocks exchanged, the balance of the dividend to be paid to the ACT Government and the value of developed land ready for sale but yet to be sold; The Provision for Project Completions reflects expected costs required to finish developed parcels of land; the Liability to Transfer Infrastructure reflects the value of infrastructure assets that are to be transferred to the relevant ACT Government agency when construction is completed; Payables reflect the value of land accrued for sold blocks together with accrued development costs and administration expenses; the LDA’s Income Tax Liability and deferred Income Tax Liability reflect the balance of income tax payable to the ACT Government in 2014-15 and future period.
Comparison to Budget
The LDA’s total liability position as at 30 June 2014 of $274.2 million was $4.4 million lower than budget mainly due to the decreases in:
• other provisions ($9.4 million) mainly due to a decrease in provision for project completion and liability to transfer infrastructure reflecting a decrease in the value of infrastructure assets to be transferred to other Government entities; and
• income tax liability ($6.8 million) due to the deferral of payment to future periods.
offset by an increase in deferred tax liability ($9.6 million) due to the deferral of income tax payment to future periods.
Comparison to 2012-13 Actual
The LDA’s total liability position as at 30 June 2014 of $274.2 million is $2.9 million lower than the 30 June 2013 liability position of $277.1 million. This was mainly due to the decreases in:
• other provisions ($13.5 million) mainly due to a decrease in provision for project completion and liability to transfer infrastructure reflecting a decrease se in the value of infrastructure assets to be transferred to other Government entities;
• Income Tax Payable ($17.2 million) due to the deferral of income tax payment to future periods due to the temporary differences between the calculation of account and taxation profit and lower income tax expense due to the lower operating surplus.
offset by an increase in:
• payables ($17.7 million) mainly due to increased GST Payable to the Australian Taxation Office, and an increase in the Payable to TAMS for land sold which was the result of a high volume of land sales late in the financial year;
• other liabilities ($3.5 million) due to an increased balance in Revenue Received in Advance for deposits for land sales and an increase in the balance of developed land ready for sale but yet to be sold; and
• deferred tax liability ($5.4 million) which was increased income taxes payable in future period mainly due to the taxable temporary difference in inventory.
114 LAND DEVELOPMENT AGENCY

Sec
tion
AS
ectio
n B
Sec
tion
CS
ectio
n D
Sec
tion
ES
ectio
n F
F.2. Financial Statements
1
Financial Statements
For the Year Ended
30 June 2014
Land Development Agency
115ANNUAL REPORT 2013-14
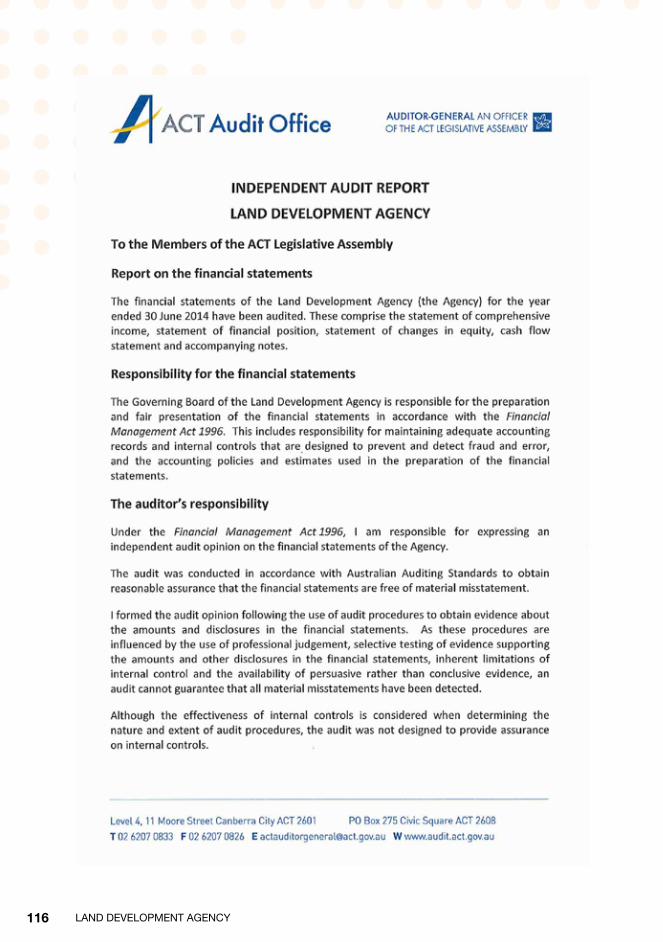
116 LAND DEVELOPMENT AGENCY

Sec
tion
AS
ectio
n B
Sec
tion
CS
ectio
n D
Sec
tion
ES
ectio
n F
117ANNUAL REPORT 2013-14

118 LAND DEVELOPMENT AGENCY
Sec
tion
AS
ectio
n B
Sec
tion
CS
ectio
n D
Sec
tion
ES
ectio
n F
119ANNUAL REPORT 2013-14
These are hidden on purpose
4
Land Development Agency
FINANCIAL STATEMENTS
FOR THE YEAR ENDED 30 JUNE 2014
120 LAND DEVELOPMENT AGENCY

Sec
tion
AS
ectio
n B
Sec
tion
CS
ectio
n D
Sec
tion
ES
ectio
n F
Land Development Agency Statement of Comprehensive Income
For the Year Ended 30 June 2014 Hidden word
5
Original Actual Budget Actual Note 2014 2014 2013 No. $’000 $’000 $’000 Income Revenue Land Sales 5 235,886 484,499 262,839 User Charges – ACT Government 6 889 - 684 User Charges – Non-ACT Government 7 118 144 135 Interest 8 3,960 400 4,375 Distribution from Investments with the Territory Banking Account 8 - 2,500 - Resources Received Free of Charge 9 7,996 - 10,418 Other Revenue 10 516 829 4,320 Total Revenue 249,365 488,372 282,771 Total Income 249,365 488,372 282,771 Expenses Employee Expenses 11 12,295 12,380 11,066 Superannuation Expenses 12 1,640 1,634 1,477 Supplies and Services 13 17,299 21,179 16,127 Depreciation and Amortisation 14 570 422 918 Grants and Purchased Services 15 3,789 919 6,903 Cost of Land Sold 16 126,883 341,278 121,354 Interest Expense 17 2,135 5,792 3,214 Other Expenses 18 9,328 6,006 6,332 Total Expenses 173,939 389,610 167,391 Share of Operating Profit from Joint Ventures accounted for using the Equity Method 39 19,807 13,609 39,630 Operating Surplus before Income Tax Equivalents 95,233 112,371 155,010 Income Tax Equivalents 21 28,570 33,710 46,503 Operating Surplus 66,663 78,661 108,507 Items that will not be reclassified subsequently to profit or loss Other Comprehensive Income (Decrease) in the Asset Revaluation Surplus 35 - - (722) Total Other Comprehensive Income - - (722) Total Comprehensive Income 66,663 78,661 107,785 The above Operating Statement should be read in conjunction with the accompanying notes.
121ANNUAL REPORT 2013-14

Land Development Agency Statement of Financial Position
As at 30 June 2014 Hidden words
6
Original
Actual Budget Actual Note 2014 2014 2013 No. $’000 $’000 $’000 Current Assets Cash and Cash Equivalents 22 92,711 57,057 101,969 Receivables 23 79,819 107,362 116,300 Inventories 24 134,926 117,065 80,050 Investments - Joint Ventures 39 1,422 1,321 8,266 Other Assets 27 94 - - Total Current Assets 308,972 282,805 306,585 Non-Current Assets Receivables 23 7,919 6,321 7,206 Inventories 24 79,329 111,531 84,804 Property, Plant and Equipment 25 3,780 4,433 4,293 Intangible Assets 26 10 9 36 Total Non-Current Assets 91,038 122,294 96,339 Total Assets 400,010 405,099 402,924 Current Liabilities Payables 28 61,025 58,631 43,281 Finance Leases 29 53 51 94 Employee Benefits 30 5,248 3,329 4,047 Other Provisions 31 61,455 73,049 75,962 Income Tax Payable 32 1,613 8,397 18,840 Other Liabilities 33 71,707 73,830 68,201 Total Current Liabilities 201,101 217,287 210,425 Non-Current Liabilities Finance Leases 29 77 81 35 Employee Benefits 30 216 262 229 Other Provisions 31 34,103 31,861 33,092 Deferred Tax Liability 34 38,733 29,105 33,363 Total Non-Current Liabilities 73,129 61,309 66,719 Total Liabilities 274,230 278,596 277,144 Net Assets 125,780 126,503 125,780 Equity Contributed Equity (a) 77,634 77,634 77,634 Retained Profits (a) 45,267 45,268 45,267 Asset Revaluation Surplus 35 2,879 3,601 2,879 Total Equity 125,780 126,503 125,780 The above Balance Sheet should be read in conjunction with the accompanying notes. (a) The original budget included an amount of $122,902,000 as Accumulated Funds. This amount was the aggregate of Contributed Equity and Retained Profits.
122 LAND DEVELOPMENT AGENCY

Sec
tion
AS
ectio
n B
Sec
tion
CS
ectio
n D
Sec
tion
ES
ectio
n F
Land Development Agency Statement of Changes in Equity
For the Year Ended 30 June 2014 Hidden words
7
Asset Contributed Retained Revaluation Total Equity Profits Surplus Equity Original Actual Actual Actual Actual Budget 2014 2014 2014 2014 2014 $’000 $’000 $’000 $’000 $’000 Balance at 1 July 2013 77,634 45,267 2,879 125,780 126,503 Comprehensive Income Operating Surplus - 66,663 - 66,663 78,661 Total Comprehensive Income/(Deficit) - 66,663 - 66,663 78,661 Dividends Approved - (66,663) - (66,663) (78,661) Total Transactions Involving Owners Affecting Retained Profits - (66,663) - (66,663) (78,661) Balance at 30 June 2014 77,634 45,267 2,879 125,780 126,503 The above Statement of Changes in Equity should be read in conjunction with the accompanying notes.
123ANNUAL REPORT 2013-14

Land Development Agency Statement of Changes in Equity - Continued
For the Year Ended 30 June 2014 Hidden words
8
Asset Contributed Retained Revaluation Total Equity Profits Surplus Equity Actual Actual Actual Actual Note 2013 2013 2013 2013 No. $’000 $’000 $’000 $’000 Balance at 1 July 2012 77,634 45,267 3,601 126,502 Comprehensive Income Operating Surplus - 108,507 - 108,507 (Decrease) in the Asset Revaluation Surplus 35 - - (722) (722) Total Comprehensive Income/(Deficit) - 108,507 (722) 107,785 Dividends Approved - (108,507) - (108,507) Total Transactions Involving Owners Affecting Retained Profits - (108,507) - (108,507) Balance at 30 June 2013 77,634 45,267 2,879 125,780 The above Statement of Changes in Equity should be read in conjunction with the accompanying notes.
124 LAND DEVELOPMENT AGENCY

Sec
tion
AS
ectio
n B
Sec
tion
CS
ectio
n D
Sec
tion
ES
ectio
n F
Land Development Agency Cash Flow Statement
For the Year Ended 30 June 2014 Hidden words
9
Original Actual Budget Actual Note 2014 2014 2013 No. $’000 $’000 $’000 Cash Flows from Operating Activities Receipts Land Sales 243,289 455,785 291,735 User Charges 118 144 825 Interest Received 4,562 400 4,374 Distribution from Investments with the Territory Banking Account - 2,625 - Goods and Services Tax (GST) Collected from Customers and GST Input Tax Credits from the Australian Taxation Office 26,977 19,540 39,375 Other - 829 3,099 Total Receipts from Operating Activities 274,946 479,323 339,408 Payments Employee 11,089 12,380 10,363 Superannuation 1,631 1,632 1,472 Supplies and Services 25,745 21,226 19,491 Development Costs 106,207 192,151 86,820 Land Acquisitions 35,820 164,675 57,612 Borrowing Costs 5,340 5,783 9 Grants and Purchased Services 2,478 1,011 3,455 Goods and Services Tax Paid to Suppliers and Remitted to the Australian Taxation Office 20,154 24,936 27,769 Income Tax Equivalents 40,425 42,789 42,880 Other 199 6,183 19 Total Payments from Operating Activities 249,088 472,766 249,890 Net Cash Inflows from Operating Activities 40 25,858 6,557 89,518 Cash Flows from Investing Activities Receipts Proceeds from Sale of Property, Plant and Equipment 80 - 60 Proceeds from Sale of Investment 14,000 13,037 - Cash Distributions from Joint Ventures 29,500 24,750 49,548 Total Receipts from Investing Activities 43,580 37,787 49,608 Payments Purchase of Property, Plant and Equipment 94 - - Purchase of Investment in Joint Venture - - 163 Total Payment from Investing Activities 94 - 163 Net Cash Inflows from Investing Activities 43,486 37,787 49,445
125ANNUAL REPORT 2013-14

Land Development Agency Cash Flow Statement - Continued For the Year Ended 30 June 2014
Hidden words
10
Original Actual Budget Actual Note 2014 2014 2013 No. $’000 $’000 $’000 Cash Flows from Financing Activities Payments Repayment of Finance Leases 96 - 60 Dividends Paid 78,506 70,680 122,348 Total Payment from Financing Activities 78,602 70,680 122,408 Net Cash (Outflows) from Financing Activities (78,602) (70,680) (122,408) Net (Decrease)/Increase in Cash and Cash Equivalents (9,258) (26,336) 16,556 Cash and Cash Equivalents at the Beginning of the Reporting Period 101,969 83,393 85,413 Cash and Cash Equivalents at the End of the Reporting Period 40 92,711 57,057 101,969 The above Cash Flow Statement should be read in conjunction with the accompanying notes.
126 LAND DEVELOPMENT AGENCY

Sec
tion
AS
ectio
n B
Sec
tion
CS
ectio
n D
Sec
tion
ES
ectio
n F
Hidden words
11
LAND DEVELOPMENT AGENCY NOTE INDEX
Note 1 Objectives of the Land Development Agency Note 2 Summary of Significant Accounting Policies Note 3 Change in Accounting Estimates Note 4 Significant Accounting Judgements and Estimates Income Notes Note 5 Land Sales Note 6 User Charges - ACT Government Note 7 User Charges - Non-ACT Government Note 8 Interest Note 9 Resources Received Free of Charge Note 10 Other Revenue Expense Notes Note 11 Employee Expenses Note 12 Superannuation Expenses Note 13 Supplies and Services Note 14 Depreciation and Amortisation Note 15 Grants and Purchased Services Note 16 Cost of Land Sold Note 17 Interest Expense Note 18 Other Expenses Note 19 Waivers, Impairment Losses and Write-Offs Note 20 Auditor's Remuneration Note 21 Income Tax Equivalents Asset Notes Note 22 Cash and Cash Equivalents Note 23 Receivables Note 24 Inventories Note 25 Property, Plant and Equipment Note 26 Intangible Assets Note 27 Other Assets Liability Notes Note 28 Payables Note 29 Finance Leases Note 30 Employee Benefits Note 31 Other Provisions Note 32 Income Tax Payable Note 33 Other Liabilities Note 34 Deferred Tax Liability Equity Notes Note 35 Equity Other Notes Note 36 Financial Instruments Note 37 Commitments Note 38 Contingent Liabilities and Contingent Assets Note 39 Interest in Jointly Controlled Entities Note 40 Cash Flow Reconciliation Note 41 Events Occurring after Balance Date Note 42 Related Party Disclosures
127ANNUAL REPORT 2013-14
Hidden words
12
Land Development Agency Notes to and Forming Part of the Financial Statements
For the Year Ended 30 June 2014
NOTE 1. OBJECTIVES OF THE LAND DEVELOPMENT AGENCY
(a) Operations and Principal Activities The Land Development Agency (LDA) operates under the Planning and Development Act 2007 and was created by the ACT Government to maintain stability in the supply of land, to deliver high quality urban development and to realise a better return on the Territory's land holdings. The key objectives of the LDA are to: - ensure that an adequate supply of greenfield and brownfield land will be maintained to meet market
demand for residential, commercial, industrial and community uses; - contribute to the delivery of the ACT Government’s policies and priorities related to affordable housing,
sustainability, climate change and urban intensification; - adopt a ‘One Government’ approach during the land development process through the cultivation and
maintenance of productive relationships across the ACT Government; - operate efficiently in the markets in which it operates and provide agreed returns to the Territory on its
Investment in the Agency; - ensure that key commercial decisions on land in the ACT are made with due consideration to the
sustainability of the Territory (that is by balancing economic, social and environmental factors); and - engage the community in a timely manner in the land development process and continue to improve
community engagement processes for redevelopments. (b) Public Trading Enterprise The LDA is a Public Trading Enterprise. Consistent with the ACT Government’s policy statement on competitive neutrality (Competitive Neutrality in the ACT, October 2010), the LDA applies similar costing and pricing principles, taxation and debt guarantee requirements and appropriate regulations as a fully corporatised business, including: - the acquisition of unleased land for development from the Territory on a commercial basis; - land holding cost payments; - stamp duty equivalency payments; - application of the National Tax Equivalents Regime; and - providing a commercial return to Government through the development and sale of the land. The total return to the ACT Government from the LDA's activities consist of:
- land acquisitions at market value; - the payment of income tax equivalents; - the payment of dividends based on operating profit after tax; - the payment of land holding costs and stamp duty equivalents; and - payroll tax.
128 LAND DEVELOPMENT AGENCY

Sec
tion
AS
ectio
n B
Sec
tion
CS
ectio
n D
Sec
tion
ES
ectio
n F
Hidden words
13
Land Development Agency Notes to and Forming Part of the Financial Statements
For the Year Ended 30 June 2014
NOTE 2. SUMMARY OF SIGNIFICANT ACCOUNTING POLICIES
(a) Basis of Accounting
The Financial Management Act 1996 requires the preparation of annual financial statements for Territory authorities. The Financial Management Act 1996 and the Financial Management Guidelines issued under the Act, requires the LDA's financial statements to include: (i) a Statement of Comprehensive Income for the year; (ii) a Statement of Financial Position at the end of the year; (iii) a Statement of Changes in Equity for the year; (iv) a Cash Flow Statement for the year; (v) a summary of the significant accounting policies adopted for the year; and (vi) such other statements as are necessary to fairly reflect the financial operations of LDA during the year
and its financial position at the end of the year.
These general-purpose financial statements have been prepared in accordance with 'Generally Accepted Accounting Principles' (GAAP) as required by the Financial Management Act 1996. The financial statements have been prepared in accordance with: (i) Australian Accounting Standards; and (ii) ACT Accounting and Disclosure Policies.
The financial statements have been prepared using the accrual basis of accounting, which recognises the effects of transactions and events when they occur. The financial statements have also been prepared according to the historical cost convention, except for assets such as those included in property, plant and equipment valued at fair value in accordance with the valuation policies applicable to the LDA during the reporting period.
Fair value is the price that would be received to sell an asset or paid to transfer a liability in an orderly transaction between market participants at the measurement date. Fair value is measured using the market approach, the cost approach or the income approach valuation techniques as appropriate. In estimating the fair value of an asset or liability, the LDA takes into account the characteristics of the asset or liability if market participants would take those characteristics into account when pricing the asset or liability at measurement date. The above approach to fair value measurement does not apply to leasing transactions within the scope of AASB 117 ‘Leases’ or measurements that have some similarities to fair value but are not fair value, such as net realisable value in AASB 102 ‘Inventories’ or value in use in AASB 136 ‘Impairment of Asset’s. For disclosure purposes fair value measurements are categorised into Level 1, 2 or 3 based on the extent to which the inputs to the valuation techniques are observable and the significance of the inputs to the fair value measurement in its entirety. The Fair Value Hierarchy is made up of the following three levels:
Level 1 - quoted prices (unadjusted) in active markets for identical assets or liabilities that the LDA can access at the measurement date;
Level 2 - inputs other than quoted prices included within Level 1 that are observable for the asset or liability, either directly or indirectly; and
Level 3 - inputs for the asset or liability that are not based on observable market data (unobservable inputs) that are unobservable for particular assets or liabilities.
129ANNUAL REPORT 2013-14

Hidden words
14
Land Development Agency
Notes to and Forming Part of the Financial Statements For the Year Ended 30 June 2014
NOTE 2. SUMMARY OF SIGNIFICANT ACCOUNTING POLICIES - CONTINUED
(a) Basis of Accounting - Continued
These financial statements are presented in Australian dollars, which is the LDA's functional currency.
The LDA is an individual reporting entity.
(b) The Reporting Period
These financial statements state the financial performance, changes in equity and cash flows of the LDA for the year ended 30 June 2014 together with the financial position of the LDA as at 30 June 2014.
(c) Comparative Figures
Budget Figures The Financial Management Act 1996 requires the financial statements to facilitate a comparison with the LDA's Statement of Intent. Budget information provided for 2013-14 is the budget information in the LDA's 2013-14 Statement of Intent. Prior Year Comparatives Comparative information has been disclosed in respect of the previous period for all amounts reported in the financial statements, except where an Australian Accounting Standard does not require comparative information to be disclosed.
Where the presentation or classification of items in the financial statements is amended, the comparative amounts have been reclassified where practical. Where a reclassification has occurred, the nature, amount and reason for the reclassification is provided.
(d) Rounding All amounts in the financial statements have been rounded to the nearest thousand dollars ($’000). Use of "-" represents amounts equal to or rounded down to zero.
(e) Revenue Recognition
Land Sales Land sales revenue is recognised when the significant risks and rewards of the sale of land are transferred to the purchaser. Whilst the point of recognition for one sale may differ from another depending on the individual terms of each contract of sale, in the majority of cases sales completed via auction, direct grant, ballot or over the counter will be recognised on settlement. Revenue from the provision of development rights to a joint venture is recognised in accordance with the substance of the transaction. When a legally enforceable agreement to contribute undeveloped parcels of land to the joint venture entity for development exists, the LDA recognises the gains attributable to the interest: (i) of other ventures on the provision of development rights to the joint venture; and (ii) progressively as the land is sold to a third party by the joint venture.
130 LAND DEVELOPMENT AGENCY

Sec
tion
AS
ectio
n B
Sec
tion
CS
ectio
n D
Sec
tion
ES
ectio
n F
Hidden words
15
Land Development Agency
Notes to and Forming Part of the Financial Statements For the Year Ended 30 June 2014
NOTE 2. SUMMARY OF SIGNIFICANT ACCOUNTING POLICIES - CONTINUED
(e) Revenue Recognition - Continued Sales under the Land Rent Scheme are recognised on settlement, at which point the LDA raises an invoice to the Commerce and Works Directorate (CWD) to facilitate a payment for compensation for foregone land revenue. The compensation paid to the LDA reflects the amount the LDA would have received if the sale had been a capital sale rather than a rent lease (not for capital) sale to the land owner. Should sale proceeds be received by instalments over more than 12 months, the initial amount to be recorded as revenue is the fair value of the consideration, calculated by discounting the contracted value (nominal value) using a prevailing rate for a similar instrument of an issuer with a similar credit rating to the LDA. The difference which arises between the fair value of the consideration to be received over the deferral period and the contracted (nominal) value of the land is recognised as interest income over the deferral period.
Proceeds from land sales may comprise both cash related transactions and the value of infrastructure required to be provided by the purchaser as part of the Deed of Agreement associated with the sale of land. The Right to Receive Infrastructure from the purchaser is recognised as revenue and a receivable at the time of settlement. User Charges User charges are revenue directly related to the sale of goods or provision of services. They are generated by consumer demand and are non-regulatory in nature. User charges revenue is recognised when the goods are provided or when the fee in respect of services provided is receivable. Interest Income Interest income is recognised as it accrues using the effective interest method. (f) Resources Received and Provided Free of Charge Resources received free of charge are recorded as a revenue and as either an expense in the Statement of Comprehensive Income at fair value or an asset in the Statement of Financial Position. The revenue is separately disclosed under resources received free of charge, with the expense or asset being recorded in the line item to which it relates. Goods and services received free of charge from ACT Government agencies are recorded as resources received free of charge, whereas goods and services received free of charge from entities external to the ACT Government are recorded as donations. Services that are received free of charge are only recorded in the Statement of Comprehensive Income if they can be reliably measured and would have been purchased if not provided to the LDA free of charge. Resources provided free of charge are recorded at their fair value in the expense line items to which they relate.
131ANNUAL REPORT 2013-14

Hidden words
16
Land Development Agency Notes to and Forming Part of the Financial Statements
For the Year Ended 30 June 2014
NOTE 2. SUMMARY OF SIGNIFICANT ACCOUNTING POLICIES - CONTINUED
(g) Repairs and Maintenance The LDA undertakes cyclical maintenance as required on its buildings and plant and equipment. Where the maintenance leads to an upgrade of the asset, and increases the service potential of the existing buildings or plant and equipment, the cost is capitalised. Maintenance expenses which do not increase the service potential of the asset are expensed. (h) Waivers of Debt Debts that are waived under Section 131 of the Financial Management Act 1996 are expensed during the year in which the right to payment was waived. Further details of waivers are disclosed at Note 19 'Waivers, Impairment Losses and Write-offs’. (i) Taxation The LDA is registered with the National Tax Equivalent Regime, and is required to calculate income tax in accordance with the Income Tax Assessment Act 1997 and to account for the resulting amounts under the requirements of AASB 112 ‘Income Taxes’. The charge for the current income tax equivalent expense is based on the surplus/(deficit) for the year adjusted for any non-assessable or non-deductible items. It is calculated using the tax rates that have been enacted or are substantially enacted by the balance date. Deferred tax is accounted for using the balance sheet liability method in respect of temporary differences arising between the tax bases of assets and liabilities and their carrying amounts in the financial statements. No deferred income tax will be recognised from the initial recognition of an asset or liability, excluding a business combination, where there is no effect on accounting or taxable surplus or deficit. Deferred tax is calculated at the tax rates that are expected to apply to the period when the asset is realised or the liability settled. Deferred tax is credited in the Statement of Comprehensive Income except where it relates to items that may be credited directly to equity, in which case the deferred tax is adjusted directly against equity. Deferred income tax assets are recognised to the extent that it is probable that future tax profits will be available against which deductible temporary differences can be utilised. Deferred tax assets are reviewed at each reporting date and are reduced to the extent that it is no longer probable that the related tax benefit will be realised. The LDA applies the margin scheme for land which is improved at the date of sale, which allows the sellers of real property to pay Goods and Services Tax (GST) equal to one-eleventh of the 'margin' rather than one-eleventh of the sale price. The 'margin' is generally the difference between the sale price and a valuation of the property at the relevant date. Where permitted, LDA sells unimproved land ‘GST-Free’ consistent with the GST-free supply provisions of A New Tax System (Goods and Services Tax) Act 1999. (j) Current and Non-Current Items Assets and liabilities are classified as current or non-current in the Statement of Financial Position and in the relevant notes. Assets are classified as current where they are expected to be realised within 12 months after the reporting date. Liabilities are classified as current when they are due to be settled within 12 months after the reporting date or the LDA does not have an unconditional right to defer settlement of the liability for at least 12 months after the reporting date. Assets or liabilities which do not fall within the current classification are classified as non-current.
132 LAND DEVELOPMENT AGENCY

Sec
tion
AS
ectio
n B
Sec
tion
CS
ectio
n D
Sec
tion
ES
ectio
n F
Hidden words
17
Land Development Agency Notes to and Forming Part of the Financial Statements
For the Year Ended 30 June 2014
NOTE 2. SUMMARY OF SIGNIFICANT ACCOUNTING POLICIES - CONTINUED (k) Impairment of Assets The LDA assesses, at each reporting date, whether there is any indication that an asset may be impaired. Assets are also reviewed for impairment whenever events or changes in circumstances indicate that the carrying amount may not be recoverable. Any resulting impairment losses, for land and buildings, are recognised as a decrease in the available Asset Revaluation Surplus relating to these assets. Where the impairment loss is greater than the available balance in the Asset Revaluation Surplus for the asset, the difference is expensed in the Statement of Comprehensive Income. Impairment losses for plant and equipment and leasehold improvements are recognised in the Statement of Comprehensive Income. Also, in all cases the carrying amount of the asset is reduced to its recoverable amount. Impairment of receivables is discussed at Note 2(n): Receivables.
(l) Cash and Cash Equivalents For the purposes of the Cash Flow Statement and the Statement of Financial Position, cash includes cash at bank, cash on hand and cash equivalents. Cash equivalents are short-term, highly liquid investments that are readily convertible to known amounts of cash and are not subject to price risk. Cash equivalents include short-term investments held in the Cash Facility with the Territory Banking Account. Units within the Cash Facility are not subject to price risk as Territory Banking Account maintains the unit price at $1.
(m) Investments All short-term investment funds are held in the Cash Facility of the Territory Banking Account (see Note 22: ‘Receivables’). The cash facility is not subject to price risk (see Note 36: ‘Financial Instruments’).
(n) Receivables Receivables include the Right to Receive Infrastructure, Trade Receivables, Deferred Payment Receivables, Accrued Revenue and Goods and Services Tax Refunds Due. Right to Receive Infrastructure The sale of land by LDA can involve the receipt of cash as well as the value of infrastructure assets (such as roads, services and landscaping) required to be constructed by the purchaser as part of the sale conditions. Upon its completion and handover to LDA by the purchaser, the infrastructure works are transferred to Territory and Municipal Services Directorate (TAMSD) and ACTEW Corporation (ACTEW). At contract settlement, the LDA recognises the value of the infrastructure to be developed as a receivable. Trade Receivables Trade Receivables arise in the normal course of providing goods and services to other agencies and the public. Trade Receivables are payable within 30 days after the issue of an invoice or after the goods or services have been provided under a contractual arrangement and in accordance with the terms and conditions of that contract.
The collectability of receivables is reviewed on an on-going basis. Receivables which are known to be uncollectable are written-off.
133ANNUAL REPORT 2013-14

Hidden words
18
Land Development Agency Notes to and Forming Part of the Financial Statements
For the Year Ended 30 June 2014
NOTE 2. SUMMARY OF SIGNIFICANT ACCOUNTING POLICIES - CONTINUED
(n) Receivables - Continued Deferred Payment Receivables Should sale proceeds be received by instalments over more than 12 months, the initial amount to be recorded as a receivable is the fair value calculated by discounting the future instalments using a prevailing rate for a similar instrument of an issuer with a similar credit rating to the LDA. The deferred payment receivable is increased by the amount recognised as interest revenue during the reporting period so that the carrying amount of the receivable at the end of the discount period equals the final cash payment to be received. Refer Note 2(e): Revenue Recognition. Accrued Revenue Accrued Revenue is recognised for goods and services provided to other agencies and the public prior to the end of the financial year and for which an invoice had not been raised. Goods and Services Tax Refunds Due Goods and Services Tax refunds due reflect the amounts of Goods and Services Tax input credits claimed or available to be claimed from the Australian Taxation Office, net of any Goods and Services Tax collected but not remitted to the Australian Taxation Office. GST receivable is classified in Note 23: ‘Receivables’ as a trade receivable. Impairment of Receivables Any allowance for impairment of receivables represents the amount of trade and other receivables the LDA estimates will not be repaid. The allowance for impairment losses is based on objective evidence and a review of overdue balances. LDA considers the following is objective evidence of impairment: (a) becoming aware of financial difficulties of debtors; (b) default payments; or (c) debts being more than 90 days overdue. The amount of any allowance for impairment losses is the difference between the asset’s carrying amount and the present value of the estimated future cash flows, discounted at the current effective interest rate. Cash flows relating to short-term receivables are not discounted if the effect of discounting is immaterial. The amount of the allowance is recognised in the Statement of Comprehensive Income. The allowance for impairment losses is written off against the allowance account when the LDA ceases action to collect the debt as it considers that it will cost more to recover the debt than the debt is worth. Receivables that have been renegotiated because they are past due or impaired are accounted for based on the renegotiated terms.
134 LAND DEVELOPMENT AGENCY

Sec
tion
AS
ectio
n B
Sec
tion
CS
ectio
n D
Sec
tion
ES
ectio
n F
Hidden words
19
Land Development Agency Notes to and Forming Part of the Financial Statements
For the Year Ended 30 June 2014
NOTE 2. SUMMARY OF SIGNIFICANT ACCOUNTING POLICIES - CONTINUED (o) Property, Plant and Equipment Acquisition and Recognition of Property, Plant and Equipment Property, plant and equipment are initially recorded at cost. Cost includes the purchase price, directly attributable costs and the estimated cost of dismantling and removing the item (where, upon acquisition, there is a present obligation to remove the item). Where property, plant and equipment is acquired at no cost, or minimal cost, cost is its fair value as at the date of acquisition. The LDA capitalises all property, plant and equipment with a value of $5,000 or more. Measurement of Property, Plant and Equipment After Initial Recognition Property, plant and equipment is valued using the cost or revaluation model of valuation. Land and buildings are measured at fair value. Plant and equipment and leasehold improvements are measured at cost. Fair value is the price that would be received to sell an asset or paid to transfer a liability in an orderly transaction between market participants at the measurement date. Fair value for land and non-specialised buildings is measured using the market approach valuation technique. This approach uses prices and other relevant information generated by market transactions involving identical or similar assets. Fair value for specialised buildings is measured by reference to the cost of replacing the remaining future economic benefits embodied in the asset (i.e. depreciated replacement cost). This is the cost approach valuation technique. Depreciated replacement cost is the current replacement cost of an asset less accumulated depreciation calculated on the basis of such cost to reflect the already consumed economic benefits, expired economic benefits or obsolescence of the asset. Current replacement cost is determined by reference to the cost of a substitute asset of comparable utility, the gross project size specifications or the historical cost, adjusted by relevant indices. The LDA obtains an independent valuation for its land and buildings every three years. The latest valuation was as at 30 June 2013. If at any time management considers the carrying amount of an asset materially differs from its fair value, then the asset will be revalued regardless of when the last valuation took place. Land and buildings that are acquired between revaluations are held at cost until the next valuation, where they are re-valued to fair value. Intangible Assets
The LDA's intangible assets are composed of externally acquired software for internal use.
Externally acquired software is recognised and capitalised when: (i) it is probable that the expected future economic benefits that are attributable to the software will flow to the LDA; (ii) the cost of the software can be measured reliably; and (iii) the acquisition cost is equal to or exceeds $50,000. Capitalised software has a finite useful life. Software is amortised on a straight-line basis over its useful life. Intangible assets are measured at cost.
135ANNUAL REPORT 2013-14

Hidden words
20
Land Development Agency Notes to and Forming Part of the Financial Statements
For the Year Ended 30 June 2014
NOTE 2. SUMMARY OF SIGNIFICANT ACCOUNTING POLICIES - CONTINUED (o) Property, Plant and Equipment - Continued
Depreciation and Amortisation of Non-Current Assets Buildings, leasehold improvements, plant and equipment and intangibles assets are systematically depreciated or amortised over their useful lives in a manner that reflects the consumption of their service potential. The useful lives of all assets held by the LDA are reassessed on an annual basis.
Land has an unlimited useful life and is therefore not depreciated.
Leasehold improvements and motor vehicles under a finance lease are depreciated over the estimated useful life of each asset, or the unexpired period of the relevant lease, whichever is shorter. All depreciation and amortisation is calculated after first deducting any residual values which remain for each asset.
Depreciation for non-current assets is determined as follows:
Class of Asset Depreciation/Amortisation Useful Life* (Years) Buildings Straight Line 10-50 Leasehold Improvements Straight Line 5 Plant and Equipment Straight Line 3-5 Motor Vehicles under a Finance Lease Straight Line 2-3 Intangibles Straight Line 2-5 * Useful life commences when an asset is first acquired. When an asset is re-valued, it is depreciated or amortised over the remaining useful life of that asset.
136 LAND DEVELOPMENT AGENCY

Sec
tion
AS
ectio
n B
Sec
tion
CS
ectio
n D
Sec
tion
ES
ectio
n F
Hidden words
21
Land Development Agency Notes to and Forming Part of the Financial Statements
For the Year Ended 30 June 2014
NOTE 2. SUMMARY OF SIGNIFICANT ACCOUNTING POLICIES - CONTINUED
(p) Inventories
Inventories held for sale include Developed Land and Work in Progress and are valued at the lower of cost and net realisable value. Work in Progress costs are transferred to Developed Land when a specific development stage receives operational acceptance and therefore becomes available for sale. The cost of Developed Land includes the acquisition cost as well as any development costs incurred in development of the land. Land Acquisitions Unleased Territory land is acquired at market value and the LDA makes payment to TAMSD when the land is sold. The LDA also purchases land from third parties at market value as required and receives land through transfers from other ACT Government agencies. Capitalised Development Costs Costs of development are costs that directly relate to preparing sites for sale as serviced land. These include expenditure associated with the implementation of estate planning, demolition, remediation activities, and relocation or construction of infrastructure services. Costs associated with marketing and selling activities are not considered to be directly related to the preparation of the sites for sale as serviced land, and are expensed as incurred. Land sites held for development and sale are classified as current assets when they are expected to be sold within one year. (q) Payables Payables are a financial liability and are initially recognised at fair value based on the transaction cost and subsequent to initial recognition at amortised cost, with any adjustments to the carrying amount being recorded in the Statement of Comprehensive Income. All amounts are normally settled within 30 days after the invoice date. Payables include Trade Payables, Accrued Expenses, Payable to TAMSD for Land Sold and Other Payables. Trade Payables represent the amounts owing for goods and services received prior to the end of the reporting period and unpaid at the end of the reporting period and relating to the normal operations of the LDA. Accrued expenses represent goods and services provided by other parties during the period, where an invoice has not been received and a payment has not been made by the end of the reporting period. The payable to TAMSD for land sold represents the amount that remains unpaid to TAMSD at the end of the reporting period for blocks of land sold to third parties. Other payables include retention monies, land rent security payments and joint venture creditors. Retention monies reflect amounts provided as security by purchasers that are held by the LDA, pending satisfactory completion of works under the terms of contracts, deeds or project delivery agreements. Land rent security payments are amounts held by the LDA in respect of land rent blocks sold after 18 February 2013. Following settlement, the security amount is transferred to the ACT Revenue Office and credited against future land rent payment. The security payment is retained by the LDA to offset the costs of holding and re-selling the land in the event that a person enters into a contract for the purchase of land and, in breach of the contract, refuses to complete the purchase.
137ANNUAL REPORT 2013-14

Hidden words
22
Land Development Agency Notes to and Forming Part of the Financial Statements
For the Year Ended 30 June 2014
NOTE 2. SUMMARY OF SIGNIFICANT ACCOUNTING POLICIES - CONTINUED
(r) Other Provisions Provision for Project Completions For any parcel of Developed Land, an estimate is made of the amount of work still to be completed by the LDA. This estimate takes the form of a ‘Project Completion percentage’ and is calculated on a monthly basis. The Provision for Project Completions is a calculation combining the total anticipated costs of each finished parcel of Developed Land together with the project completion percentage. Accordingly, the proportions of costs anticipated but not yet incurred are accounted for in this provision. Provision to Transfer Infrastructure The sale of land by the LDA can involve the receipt of cash as well as the value of infrastructure assets (such as roads, services and landscaping) required to be constructed by the purchaser as part of the sale conditions. Upon completion, the infrastructure works are transferred to TAMSD and ACTEW Corporation. At contract settlement, LDA recognises the value of the future infrastructure as a liability. (s) Joint Ventures Jointly Controlled Entities The LDA uses the equity method to account for its interest in two unincorporated jointly controlled entities (Forde Joint Venture and Crace Joint Venture). Under the equity method, the interest in a jointly controlled entity is initially recognised at cost. After initial recognition, this interest is adjusted for any post-acquisition change in the share of the jointly controlled entity’s net assets and is reflected in the Statement of Financial Position. The Statement of Comprehensive Income includes the share of the profit or loss of the jointly controlled entity. Unrealised profits and losses associated with the contribution of development rights to the jointly controlled entity have been eliminated.
138 LAND DEVELOPMENT AGENCY
Sec
tion
AS
ectio
n B
Sec
tion
CS
ectio
n D
Sec
tion
ES
ectio
n F
Hidden words
23
Land Development Agency Notes to and Forming Part of the Financial Statements
For the Year Ended 30 June 2014
NOTE 2. SUMMARY OF SIGNIFICANT ACCOUNTING POLICIES - CONTINUED
(t) Employee Benefits and On-Costs Employee benefits include:
short-term employee benefits such as accrued salaries and superannuation, annual leave loading and other applicable on-costs (on-costs include payroll tax and fringe benefit tax), if expected to be settled wholly before twelve months after the end of the annual reporting period in which the employees render the related services;
other long-term benefits such as long service leave and annual leave; and termination benefits.
Accrued Salaries and Superannuation Accrued salaries and superannuation are measured at the amount that remains unpaid to employees at the end of the reporting period. Accrued Annual and Long Service Leave Annual and long service leave including applicable on-costs that are not expected to be wholly settled before twelve months after the end of the reporting period when the employees render the related service are measured at the present value of estimated future payments to be made in respect of services provided by employees up to the end of the reporting period. Consideration is given to the future wage and salary levels, experience of employee departures and periods of service. At the end of each reporting period end, the present value of future annual leave and long service leave payments is estimated using market yields on Commonwealth Government bonds with terms to maturity that match, as closely as possible, the estimated future cash flows. Annual leave liabilities have been estimated on the assumption that they will be wholly settled within three years. In 2013-14, the rate used to estimate the present value of future payments is 100.9%. In 2013-14, the rate used to estimate the present value of future payments for long service leave is 103.5% (101.3% in 2012-13). This change is due to a change in the Commonwealth Government bond rate. The long service leave liability is estimated with reference to the minimum period of qualifying service. For employees with less than the required minimum period of 7 years of qualifying service, the probability that employees will reach the required minimum period has been taken into account in estimating the provision for long service leave and applicable on-costs. The provision for annual leave and long service leave includes estimated on-costs. As these on-costs only become payable if the employee takes annual and long service leave while in-service, the probability that employees will take annual and long service leave while in service has been taken into account in estimating the liability for on-costs. The significant judgements and assumptions included in the estimation of annual and long service leave liabilities are determined by an actuary. The Australian Government Actuary performed this assessment in May 2014. The assessment by an actuary is performed every 5 years. However it may be performed more frequently if there is a significant contextual change in the parameters underlying the 2014 report. The next actuarial review is expected to be undertaken by May 2019. Further information about this estimate is provided in Note 4(ii) Significant Accounting Judgements and Estimates. Annual leave and long service leave liabilities are classified as current liabilities in the Statement of Financial Position where there is no unconditional right to defer the settlement of the liability for at least 12 months. Conditional long service liabilities are classified as non-current because the agency has an unconditional right to defer the settlement of the liability until the employee has completed the requisite years of service.
139ANNUAL REPORT 2013-14

Hidden words
24
Land Development Agency Notes to and Forming Part of the Financial Statements
For the Year Ended 30 June 2014
NOTE 2. SUMMARY OF SIGNIFICANT ACCOUNTING POLICIES - CONTINUED (u) Superannuation Superannuation payments are made to the Territory Banking Account each fortnight to cover the LDA's superannuation liability for the Commonwealth Superannuation Scheme (CSS) and the Public Sector Superannuation (PSS). This payment covers the CSS/PSS employer contribution but does not include the productivity component. The productivity component is paid directly to ComSuper by the LDA. The CSS and PSS are defined benefit superannuation plans meaning that the defined benefits received by employees are based on the employee's years of service and average final average salary. Superannuation payments have also been made directly to superannuation funds for those members of the Public Sector who are part of superannuation accumulation schemes. This includes the Public Sector Superannuation Scheme Accumulation Plan (PSSAP) and schemes of employee choice. Superannuation employer contribution payments, for the CSS and PSS, are calculated by taking the salary level at an employee's anniversary date and multiplying it by the actuarially assessed nominal CSS or PSS employer contribution rate for each employee. The productivity component payments are calculated by taking the salary level, at an employee's anniversary date, and multiplying it by the employer contribution rate (approximately 3%) for each employee. Superannuation payments for the PSSAP are calculated by taking the salary level, at an employee's anniversary date, and multiplying it by the appropriate employer contribution rate. Superannuation payments for fund of choice arrangements are calculated by taking an employee's salary each pay and multiplying it by the appropriate employer contribution rate. The Superannuation Provision Account recognises the total Territory superannuation liability for the CSS and PSS, and ComSuper and the external schemes recognise the superannuation liability for the PSSAP and other schemes respectively. The ACT Government is liable for the reimbursement of the emerging costs of benefits paid each year to members of the CSS and PSS in respect of the ACT Government service provided after 1 July 1989. These reimbursement payments are made from the Superannuation Provision Account. (v) Equity Contributed by the ACT Government Contributions made by the ACT Government through its role as owner of the LDA are treated as contributions of equity. (w) Insurance Major risks are insured through the ACT Insurance Authority. The excess payable, under this arrangement, varies depending on each class of insurance held.
140 LAND DEVELOPMENT AGENCY

Sec
tion
AS
ectio
n B
Sec
tion
CS
ectio
n D
Sec
tion
ES
ectio
n F
Hidden words
25
Land Development Agency Notes to and Forming Part of the Financial Statements
For the Year Ended 30 June 2014
NOTE 2. SUMMARY OF SIGNIFICANT ACCOUNTING POLICIES - CONTINUED (x) Leases The LDA has entered into operating leases and finance leases. Operating Leases In respect of operating leases, the lessor effectively retains substantially all of the risks and benefits incidental to ownership of the assets under an operating lease. Operating lease payments are recorded as an expense in the Statement of Comprehensive Income on a straight line basis over the term of the lease. Finance Leases Finance leases effectively transfer, to the lessee, substantially the risk and benefits incidental to ownership of the assets under a finance lease and are initially recognised as assets and liabilities at the lower of fair value and the present value of the minimum lease payments. Where there is reasonable assurance that the LDA will obtain ownership of the asset at the end of the lease term, the asset is depreciated over its useful life, otherwise it is depreciated over the lease term. Assets under a finance lease are depreciated on a straight-line basis. The depreciation is calculated after first deducting any residual values which remain for each leased asset. Minimum lease payments are allocated between interest expense and reduction of the lease liability, according to the interest rate implicit in the lease. (y) Finished Inventory - Land Value The land value of finished inventory represents the land portion of inventory ready for sale but yet to be sold. This is recorded as a liability as the LDA is obligated to pay TAMSD for the value of land once it is sold.
(z) Impact of Accounting Standards Issued but yet to be Applied The following new and revised accounting standards and interpretations have been issued by the Australian Accounting Standards Board but do not apply to the current reporting period. The application date applies to the first reporting beginning on or after this date. LDA does not intend to adopt these standards and interpretations early. Where applicable, these Australian Accounting Standards will be adopted from their application date. It is expected that the effect of adopting the below pronouncements, when applicable, will have no material financial impact on the LDA in future reporting periods: AASB 9 Financial Instruments (application date 1 January 2017);
AASB 1031 Materiality (application date 1 January 2014);
AASB 1055 Budgetary Reporting (application date 1 July 2014);
AASB 2010-7 Amendments to Australian Accounting Standards arising from AASB 9 (December 2010) [AASB 1, 3, 4, 5, 7, 101, 102, 108, 112, 118, 120, 121, 127, 128, 131, 132, 136, 137, 139, 1023, 1038 and Interpretations 2, 5, 10, 12, 19 and 127] (application date 1 January 2018);
AASB 2012-3 Amendments to Australian Accounting Standards – Offsetting Financial Assets and
Financial Liabilities [AASB 132] (application date 1 January 2014);
AASB 2013-3 Amendments to Australian Accounting Standards 136 - Recoverable Amount Disclosure for Non-Financial Assets (application date 1 January 2014); and
AASB 2013-9 Amendments to Australian Accounting Standards – Conceptual Framework, Materiality and Financial Instruments (Part B Materiality application date 1 January 2014 and Part C Financial Instruments application date 1 January 2015).
141ANNUAL REPORT 2013-14

Hidden words
26
Land Development Agency Notes to and Forming Part of the Financial Statements
For the Year Ended 30 June 2014
NOTE 3. CHANGE IN ACCOUNTING ESTIMATES
Bi-annual review of project costing The Bi-Annual Reviews for 2013-14 resulted in adjustments to the total estimated costs of various projects including the reduction of the total estimated costs for Bonner by $2.5 million, Harrison 4 by $1.1 million, Wright by $2.5 million, Phillip Furzer Street $0.8 million and Jacka $0.1 million, partially offset by an increase in the total estimated costs for Franklin by $0.2 million and Flemington Road Corridor by $0.4 million. The overall impact of the adjustment was to decrease Cost of Land Sold and increase inventory by $6.4 million and therefore increase the Operating Surplus before Income Tax Equivalents by $6.4 million.
142 LAND DEVELOPMENT AGENCY

Sec
tion
AS
ectio
n B
Sec
tion
CS
ectio
n D
Sec
tion
ES
ectio
n F
Hidden words
27
Land Development Agency Notes to and Forming Part of the Financial Statements
For the Year Ended 30 June 2014
NOTE 4. SIGNIFICANT ACCOUNTING JUDGEMENTS AND ESTIMATES In the process of applying the accounting policies listed in this note, the LDA has made the following judgements and estimates that have the most significant impact on the amounts recorded in the financial statements: (i) Fair Value of Assets: The LDA has made a significant estimate regarding the fair value of its assets. Land
and buildings have been recorded at fair value as determined by an independent valuer. In some circumstances, buildings that are purpose built may in fact realise more or less than their carrying values.
The depreciated replacement cost is used to estimate fair value due to a lack of market-based evidence of similar sales where the assets are heritage listed and do not have a Crown lease.
(ii) Employee Benefits: Significant judgements have been applied in estimating the liability for employee
benefits. The estimated liability for annual and long service leave requires a consideration of the future wage and salary levels, experience of employee departures, probability that leave will be take in service and periods of service. The estimate also includes an assessment of the probability that employees will meet the minimum service period required to qualify for long service leave and that on-costs will become payable. Further information on this estimate is provided in Note 2 (t) Employee Benefits.
(iii) Inventories: The cost of unleased Territory land acquired from Government by the LDA is recorded at
the lower of cost and net realisable value. Significant judgement has been made using management experience to determine net realisable value of the land. The cost of land held for resale includes the acquisition cost as well as any development costs incurred in developing the land.
(iv) Project Costing: As detailed at Note 2(r) Other Provisions, the LDA has made a significant estimate of its Provision for Project Completions based on the difference between the actual expenditure incurred to date, the estimated percentage of the project that is complete and total forecast expenditure. The methodology is a consultative process involving both financial and operational executive staff. The calculations are based on invoices paid to date, accrued expenditure and an estimation of costs still to be incurred to ensure satisfactory completion of the project. Furthermore, an appropriate contingency is calculated based on management experience and expertise together with accepted industry norms.
(v) Allocation of Costs to Blocks Sold: Significant estimates have been made to calculate the cost of each block of land sold. The methodology applied allocates a percentage of the estimated total forecast expenditure (including capitalised development costs and land costs) to each individual block based on the square metres of each individual block as a proportion of the overall size of the land being developed.
(vi) Depreciation: The LDA has made a significant estimate in the lengths of useful lives over which its assets are depreciated. This estimation is the period in which utility will be gained from the use of assets, based on estimates of officers of the LDA.
(vii) Interest Rate Applicable to Deferred Payment Receivables: The LDA has made an estimate of the rate of interest required to discount the contracted value (nominal value) of consideration to the fair value of consideration for those sales where payment has been deferred for more than 12 months. This occurs when proceeds are received by instalments. The rate of interest is calculated on a case by case basis and involves estimating the prevailing rate for a similar instrument that would be offered by an issuer with a similar credit rating to the LDA.
143ANNUAL REPORT 2013-14

Hidden words
28
Land Development Agency Notes to and Forming Part of the Financial Statements
For the Year Ended 30 June 2014
NOTE 4. SIGNIFICANT ACCOUNTING JUDGEMENTS AND ESTIMATES- CONTINUED
(viii) Receivable for GST Refunds: As at 30 June 2014, the LDA recorded a GST receivable of $12.4 million for over payments of GST on prior year land sales, pending refund claims being submitted to the Australian Taxation Office (ATO). This amount is disclosed in Note 23: ‘Receivables’ of the financial statements. The LDA has undertaken an assessment of whether there is evidence that the GST receivable for GST refunds is impaired.
The ATO is currently undertaking a review of the GST refund claims for overpaid GST on land sales that were lodged and received in prior years by the LDA. The ATO review had not been completed at the date of these financial statements. However, the ATO’s assessment dated 2 July 2014 is that the LDA is not entitled to all of the GST refunds that were claimed in lodgements to the ATO and received by the LDA. The entitlement to GST refunds depends on the application of the Government Margin Scheme to land sales and specifically the interpretation of the meaning of ‘land on which there are no improvements’. If the ATO’s view in the ATO’s initial assessment prevails, then it could result in a reduction in the amount of the receivable for GST refund claims of $12.4 million recognised at 30 June 2014.
Following a detailed review by the LDA of the facts relating to the recoverability of the receivable for GST refunds, including the application of the Government Margin Scheme to land sales and the interpretation of the meaning of ‘land on which there are no improvements’, the LDA has assessed that there is sufficient evidence that the receivable is recoverable and there was no impairment of the receivable at the date of the financial statements, despite the 2 July 2014 assessment by the ATO. The assessment by the LDA that the receivable is not impaired has been informed by external taxation and legal advice.
(ix) Contingent Liabilities and Assets: Given the ATO’s 2 July 2014 assessment, it is possible that the LDA may have to refund a portion of the GST refunds received, and potentially remit additional GST on current land sales. However, at the date of these financial statements, the matter had not been resolved, so it is not possible to quantify the possible future liability to refund GST refunds received or the possible future liability to remit additional GST on current land sales that were not reviewed by the ATO in its initial assessment.
In the event that LDA is required to repay GST refunds previously received, does not receive the amount of $12.4 million recorded as receivable and pay additional GST on current land sales, the LDA will have a corresponding asset for the refund of the overpayment of income tax, dividends to Government and payments for development services to the Forde Joint Venture.
144 LAND DEVELOPMENT AGENCY

Sec
tion
AS
ectio
n B
Sec
tion
CS
ectio
n D
Sec
tion
ES
ectio
n F
Land Development Agency
Notes to and Forming Part of the Financial Statements For the Year Ended 30 June 2014ords
29
NOTE 5. LAND SALES
2014 2013 $’000 $’000
Residential (a) 183,091 200,032 Englobo Sales (b) 7,227 - Commercial and Industrial (c) 26,930 18,904 Community (d) 11,265 4,506 Additional Yield (e) - 650 Infrastructure Delivered by Third Parties (f) 6,613 1,192 Recovery of Overpaid GST (g) 760 37,555 Total Land Sales 235,886 262,839 (a) The decrease in 2013-14 was primarily due to the finalisation of land sales in the Bonner, Harrison 4, Jacka
and Wright estates; partially offset by increased sales in Coombs, Amaroo and Kingston Foreshore.
(b) The 2013-14 Englobo sale was Watson section 64.
(c) The increase in 2013-14 was mainly due to sales of land in Dickson, Greenway and the Gungahlin Town Centre.
(d) The increase in community land sales was mainly due to the sales of Ngunnawal section 23 and Watson section 111.
(e) The LDA did not receive additional revenue during 2013-14 from variations to holding leases which increases dwelling yields after contract settlements.
(f) The increase in infrastructure sales delivered by third parties was due to an increased number of contracts settled that required infrastructure to be delivered by third parties.
(g) The LDA identified an entitlement to GST refunds as a result of changes in the Australian Taxation Office’s interpretations of eligibility to apply the Government Margin Scheme. The meaning of ‘land on which there are no improvements’ is now considered by the LDA to be broader than it once was, allowing the LDA to apply the scheme to a broader range of circumstances, which led to a significant entitlement to GST refunds for prior year land sales. The decrease was due to LDA claiming the majority of GST refunds for prior years land sales in 2012-13.
145ANNUAL REPORT 2013-14

Land Development Agency
Notes to and Forming Part of the Financial Statements For the Year Ended 30 June 2014ords
30
NOTE 6. USER CHARGES – ACT GOVERNMENT
2014 2013 $’000 $’000
User Charges - ACT Government
Service Charges (a) 889 684 Total User Charges - ACT Government 889 684
(a) The LDA provided executive and financial management services to the Economic Development Directorate
(EDD) under the Memorandum of Understanding between EDD and the LDA.
NOTE 7. USER CHARGES – NON-ACT GOVERNMENT
User Charges - Non-ACT Government
Rental Income (a) 118 135 Total User Charges - Non-ACT Government 118 135
(a) The LDA derived rental income from sites in Civic, Kingston and Gungahlin. NOTE 8. INTEREST Revenue from ACT Government Entities
Interest Revenue from the Territory Banking Account (a) 2,695 3,517 Total Interest Revenue from ACT Government Entities 2,695 3,517
Revenue from Non-ACT Government Entities
Interest from Banks 266 221 Other Interest Revenue - Late Settlements and Deferred Payments (b) 999 637
Total Interest Revenue from Non-ACT Government Entities 1,265 858 Total Interest Revenue 3,960 4,375
(a) Interest revenue decreased in 2013-14 due to the lower cash reserves invested in the Territory Banking
Account.
(b) Other interest revenue increased due to higher volume of late settlement penalty interest received in 2013-14.
146 LAND DEVELOPMENT AGENCY

Sec
tion
AS
ectio
n B
Sec
tion
CS
ectio
n D
Sec
tion
ES
ectio
n F
Land Development Agency
Notes to and Forming Part of the Financial Statements For the Year Ended 30 June 2014ords
31
NOTE 9. RESOURCES RECEIVED FREE OF CHARGE
Resources received free of charge relate to goods and/or services being provided free of charge from other entities within the ACT Government.
2014 2013 $’000 $’000
Resources Received from ACT Government Entities (a) 7,996 10,418 Total Resources Received Free of Charge 7,996 10,418
(a) The resources received free of charge relate to transfers of land from ACT Government agencies to the
LDA at no cost. In 2013-14, they included the Downer Business Park, Dickson block 4 section 16 and Aranda block 23 and 24 section 1.
NOTE 10. OTHER REVENUE
Commonwealth Grants (a) - 3,413 Miscellaneous Revenue (b) 352 865 Application Fees 150 35 Other Revenue 14 7 Total Other Revenue 516 4,320
(a) The decrease was due to the cessation of Housing Affordability Funding received from the
Commonwealth.
(b) Miscellaneous revenue included Put and Call Option Fees, land rent fees and termination payments for exchanged contracts. The decrease in miscellaneous revenue is primarily due to a decrease in the number of retained deposits for sales terminated by the purchaser.
147ANNUAL REPORT 2013-14

Land Development Agency Notes to and Forming Part of the Financial Statements
For the Year Ended 30 June 2014 Hidden words
32
NOTE 11. EMPLOYEE EXPENSES
2014
2013 $’000 $’000
Wages and Salaries (a) 11,447 9,724 Payroll Tax 849 665 Long Service Leave - Movement in Provision (b) (37) 442 Annual Leave - Movement in Provision (c) (24) 181 Workers' Compensation Insurance Premium 51 46 Fringe Benefit Tax 9 8 Total Employee Expenses (d) 12,295 11,066
(a) The increase in wages and salaries reflects the salary increases from the ACT Public Service Administrative
and Related Classifications Enterprise Agreement 2013-2017 and termination payments for a number of staff.
(b) The decrease is due to the payment of unused long services leave entitlement to employees at the end of employment.
(c) The decrease is due to the payment of unused annual leave entitlement to employees at the end of employment.
(d) The LDA also incurred expenses relating to termination payments of $0.8million which were recovered from the Restructure Fund.
NOTE 12. SUPERANNUATION EXPENSES
Superannuation Contributions to the Territory Banking Account 962 892 Superannuation to External Providers 441 365 Superannuation Payment to ComSuper (for the PSSAP) 123 114 Productivity Benefit 114 106 Total Superannuation Expenses 1,640 1,477
148 LAND DEVELOPMENT AGENCY

Sec
tion
AS
ectio
n B
Sec
tion
CS
ectio
n D
Sec
tion
ES
ectio
n F
Land Development Agency Notes to and Forming Part of the Financial Statements
For the Year Ended 30 June 2014 Hidden words
33
NOTE 13. SUPPLIES AND SERVICES 2014 2013 $’000 $’000
Contractors and Consultants 4,131 4,911 Selling Costs (a) 7,744 4,563 Asset Management 1,560 2,273 Advertising and Marketing Costs (b) 1,771 1,587 Operating Lease Rental Payments (c) 895 1,071 Insurance (d) 112 549 Office Services 284 184 Staff Development 259 231 Office Equipment and Consumables 141 207 Other (e) 402 551 Total Suppliers and Services 17,299 16,127
(a) The increase in selling expenses is largely due to sales commission for land sales in Coombs, Campbell,
Kingston Foreshore and Lawson.
(b) The increase in advertising and marketing costs reflects the increased marketing activities for a number of estates including Kingston Foreshore, Greenway, Coombs and Lawson.
(c) The decrease in operating lease rental payments is due to a contribution from EDD for a share of Dickson office rental.
(d) The decrease in insurance costs was due to the premium adjustment for the 2012-13 contractor works insurance processed in 2013-14.
(e) Other supplies and services comprise other operating expenses including travel expenses, vehicle expenses and the construction industry training levy.
NOTE 14. DEPRECIATION AND AMORTISATION Depreciation
Buildings (a) 134 47 Leasehold Improvements (a) 367 800 Plant and Equipment 12 13 Motor Vehicles under a Finance Lease 30 31 Total Depreciation 543 891
Amortisation
Intangible Assets 27 27 Total Amortisation 27 27
Total Depreciation and Amortisation 570 918
(a) The decrease is due to the leasehold fit-out at Dickson office being fully depreciated in November 2013.
149ANNUAL REPORT 2013-14

Land Development Agency Notes to and Forming Part of the Financial Statements
For the Year Ended 30 June 2014 Hidden words
34
NOTE 15. GRANTS AND PURCHASED SERVICES
Grants are amounts provided to ACT Government agencies and non-ACT Government agencies for general assistance or for a particular purpose. Grants may be for capital, current or recurrent purposes and the name or category reflects the use of the grant. The grants given are usually subject to terms and conditions set out in the contract, correspondence, or by legislation.
Purchased services are amounts paid to obtain services from other ACT Government agencies and external parties.
2014 2013 $’000 $’000
Housing Affordability Funding (a) - 3,413 Purchased Services (b) 3,789 3,490 Total Grants and Purchased Services 3,789 6,903
(a) The decrease was due to the cessation of Housing Affordability Funding received from the Commonwealth and subsequent reduced distributions to Joint Venture partners and third party developers. (b) Purchased services comprise: 2014 2013
$’000 $’000
Economic Development Directorate Memorandum of Understanding (MOU) 2,259 2,038 Economic Development Directorate Work Health and Safety Framework - 133 Shared Services Finance 123 120 Shared Services ICT 598 502 Shared Services Payroll 50 64 Shared Services Procurement 219 213 Government Solicitor's Office 540 420
Total Purchased Services 3,789 3,490
150 LAND DEVELOPMENT AGENCY

Sec
tion
AS
ectio
n B
Sec
tion
CS
ectio
n D
Sec
tion
ES
ectio
n F
Land Development Agency Notes to and Forming Part of the Financial Statements
For the Year Ended 30 June 2014 Hidden words
35
NOTE 16. COST OF LAND SOLD 2014 2013 $’000 $’000
Land Transfers and Acquisitions (a) 52,475 52,071 Capitalised Development Costs (a) 67,795 68,091 Transfer of Infrastructure Assets (b) 6,613 1,192 Total Costs of Land Sold 126,883 121,354
Cost of Land Sold is the current estimate of the cost of inventories sold during the reporting period, which includes the acquisition of land, direct costs relating to the development of land and the value of infrastructure constructed by land purchasers and transferred to the TAMSD, ACTEW Corporation Limited and ActewAGL.
In addition to the above, estimates of the Cost of Land Sold are reviewed on a bi-annual basis and the result of the 2013-14 bi-annual reviews was to decrease Cost of Land Sold by $6.358 million, refer Note 3: Change in Accounting Estimates.
(a) The estimated cost of inventories sold, as detailed above, are expensed in the Statement of Comprehensive Income at the point the developed land is sold. The decrease in the cost of land sold was primarily due to the decrease in the overall land sales.
(b) The increase in Transfer of Infrastructure Assets was due to increased number of contracts settled that required infrastructure to be delivered by third parties. NOTE 17. INTEREST EXPENSE
Land Holding Costs Equivalents (a) 2,128 3,205 Finance Charges on Finance Leases 7 9 Total Borrowing Costs 2,135 3,214
(a) Consistent with the ACT Government’s policy on competitive neutrality, the LDA applies similar costing
and pricing principles, taxation and debt guarantee requirements and appropriate regulations as a fully corporatised business (see Note 1b: ‘Public Trading Enterprise’). The decrease in land holding costs equivalents (interest) on land purchased from the Territory was due to the value of the land purchased being lower than the previous financial year.
151ANNUAL REPORT 2013-14

Land Development Agency Notes to and Forming Part of the Financial Statements
For the Year Ended 30 June 2014 Hidden words
36
NOTE 18. OTHER EXPENSES
2014 2013 $’000 $’000
Stamp Duty Equivalents (a) 2,187 3,328 Direct Sales Inventory Write-off (b) 36 77 Joint Venture Expenses 11 19 Inventory Loss (c) 5,307 1,729 Donation (d) 5 583 Contribution to Projects (e) 1,782 596 Total Other Expenses 9,328 6,332
(a) Consistent with the ACT Government’s policy on competitive neutrality, the LDA applies similar costing
and pricing principles, taxation and debt guarantee requirements and appropriate regulations as a fully corporatised business (see Note 1b: ‘Public Trading Enterprise’). The reduction in stamp duty equivalents was due to the lower value of land purchased from the Territory in 2013-14.
(b) The LDA incurs costs during the processing of direct grant applications. In the event a direct sale is terminated with no revenue received, costs are categorised as inventory write-off rather than a cost of land sold.
(c) Inventories held for sale are valued at the lower of cost and net realisable value. The difference between the cost and net realisable value is recorded as an Inventory Loss. In 2013-14, this included the revaluation of Hume West and the revaluation of Downer Business Park and Dickson Block 4 Section 16, following the transfer from other ACT Government agencies.
(d) The LDA made a payment to University of Canberra for Construction and Engineering Material Reduce Recycle research in 2013-14. The donation in 2012-13 related to the donation of the sale proceeds from the Franklin Charity House.
(e) The LDA made a payment, in accordance with the sales contract, for the National Rental Affordability Scheme (NRAS). The LDA also made contributions to the Invest Canberra project, the Australian National University for a tenancy fit out, and the Capital Metro and City to the Lake projects.
152 LAND DEVELOPMENT AGENCY

Sec
tion
AS
ectio
n B
Sec
tion
CS
ectio
n D
Sec
tion
ES
ectio
n F
Land Development Agency Notes to and Forming Part of the Financial Statements
For the Year Ended 30 June 2014 Hidden words
37
NOTE 19. WAIVERS, IMPAIRMENT LOSSES AND WRITE-OFFS
During the reporting period, there were no Impairment Losses or Write-offs. There were no Waivers pursuant to Section 131 of the Financial Management Act 1996. (2012-13: Nil)
NOTE 20. AUDITOR’S REMUNERATION
Auditor’s remuneration consists of financial audit services provided to LDA by the ACT Auditor-General’s Office. No other services were provided by the ACT Auditor-General’s Office. 2014 2013 $’000 $’000
Audit Services
Audit Fees Paid or Payable to the ACT Auditor-General's Office 97 102 Total Audit Fees 97 102
NOTE 21. INCOME TAX EQUIVALENTS Income Tax Equivalents
The major components of income tax equivalents are:
Provision for Current Year Income Tax 14,532 43,119 Current Year Movement in the Net Deferred Tax Liability, refer Note 34: Deferred Tax Liabilities 14,038 3,384 Income Tax Equivalents 28,570 46,503
Numeric Reconciliation of Income Tax Equivalents to Prima Facie Tax Payable
Operating Surplus before Income Tax Equivalents 95,233 155,010
Income Tax calculated at 30% 28,570 46,503 Income Tax Equivalents 28,570 46,503
153ANNUAL REPORT 2013-14

Land Development Agency Notes to and Forming Part of the Financial Statements
For the Year Ended 30 June 2014
Hidden words
38
NOTE 22. CASH AND CASH EQUIVALENTS 2014 2013 $’000 $’000
Cash on Hand 2 2 Cash at Bank 32,209 13,967 Investments with the Territory Banking Account - Cash Facility 60,500 88,000 Total Cash and Cash Equivalents (a) 92,711 101,969
(a) The decrease is primarily due to higher payments made for development costs. NOTE 23. RECEIVABLES
Current Receivables
Trade Receivables (a) 41,568 50,053 Receivable for GST Refunds (b) 12,383 23,550 Deferred Payment Receivables 1,638 1,536 Accrued Revenue (c) 494 1,167 Right to Receive Infrastructure (d) 23,736 39,994 Total Current Receivables 79,819 116,300
Non-Current Receivables
Deferred Payment Receivables 35 1,673 Right to Receive Infrastructure (d) 7,884 5,533 Total Non-Current Receivables 7,919 7,206 Total Receivables 87,738 123,506
(a) The decrease in Trade Receivables is primarily due to a one-off receivable from Woden East Pty Ltd
following the wind up of the Woden East Joint Venture in 2012-13; partially offset by an increased receivable from CWD for land rent sales.
(b) The decrease is due to the receipt of GST refunds from the ATO during 2013-14. Further information is included in Note 4: ‘Significant Accounting Judgements and Estimates’ at Note 4(viii) ‘Receivable for GST Refunds’.
(c) The decrease in Accrued Revenue is due to lower interest from cash reserves invested in the Territory Banking Account at the end of reporting period.
(d) The Right to Receive Infrastructure decreased after the associated works were completed and transferred to TAMSD and ACTEW.
154 LAND DEVELOPMENT AGENCY

Sec
tion
AS
ectio
n B
Sec
tion
CS
ectio
n D
Sec
tion
ES
ectio
n F
Land Development Agency Notes to and Forming Part of the Financial Statements
For the Year Ended 30 June 2014
Hidden words
39
NOTE 23. RECEIVABLES - CONTINUED
Ageing of Receivables
Not Overdue Overdue Total Greater than 30 to 60 Days 60 to 90 Days 90 Days $'000 $'000 $'000 $'000 $'000
2014
Not Impaired Receivables 87,732 6 - - 87,738
Impaired Receivables - - - - -
2013
Not Impaired Receivables 123,501 5 - - 123,506
Impaired Receivables - - - - -
(1) 'Not Impaired' refers to Net Receivables (that is Gross Receivables less Impaired Receivables). The majority
of receivables represent the right to receive infrastructure and sales proceeds receivable from the CWD for land rent sales which are considered to be low risk. No allowance has been made for impairment of receivables. Further information on the assessment of impairment of the Receivable for GST Refunds is included in Note 4: ‘Significant Accounting Judgements and Estimates’ at Note 4(viii) ‘Receivable for GST Refunds’.
.
155ANNUAL REPORT 2013-14

Land Development Agency Notes to and Forming Part of the Financial Statements
For the Year Ended 30 June 2014
Hidden words
40
NOTE 23. RECEIVABLES - CONTINUED
2014 2013 $’000 $’000 Classification of ACT Government/Non-ACT Government Receivables
Receivables with ACT Government Entities
Trade Receivables (a) 38,872 33,279 Accrued Revenue (b) 494 1,145 Total Receivables with ACT Government Entities 39,366 34,424
Receivables with Non-ACT Government Entities
Right to Receive Infrastructure (c ) 31,620 45,527 Trade Receivables (d) 15,079 40,324 Deferred Payment Receivables 1,673 3,209 Accrued Revenue - 22 Total Receivables with Non-ACT Government Entities 48,372 89,082 Total Receivables 87,738 123,506 (a) The increase is primarily due to increased receivables from the CWD for land rent sales.
(b) The decrease is due to lower interest from cash reserves invested in the Territory Banking Account at the end of reporting period.
(c) The decrease is due to the reduction of the right to receive infrastructure after the associated works have been completed and transferred to TAMSD and ACTEW.
(d) The decrease is primarily due to a one-off receivable from Woden East Pty Ltd following the wind up of Woden East Joint Venture in 2012-13 and decreased GST receivable from Australian Taxation Office associated with GST review on land sales.
156 LAND DEVELOPMENT AGENCY

Sec
tion
AS
ectio
n B
Sec
tion
CS
ectio
n D
Sec
tion
ES
ectio
n F
Land Development Agency Notes to and Forming Part of the Financial Statements
For the Year Ended 30 June 2014
Hidden words
41
NOTE 24. INVENTORIES
2014 2013 $’000 $’000
Current Inventories
Developed Land, Construction Completed and Available for Sale, at Cost (a) 73,143 36,856
Land Being Developed - Work in Progress
Land Acquisition Costs (b) 6,404 2,623 Development Costs (c) 55,379 40,571 Total Land Being Developed - Work in Progress 61,783 43,194 Total Current Inventories 134,926 80,050
Non-Current Inventories
Land Being Developed - Work in Progress
Land Acquisition Costs (b) 13,028 12,410 Development Costs (c) 66,301 72,394 Total Land Being Developed - Work in Progress 79,329 84,804 Total Non-Current Inventories 79,329 84,804 Total Inventories 214,255 164,854
(a) The increase in land available for sale is due to an increase in unsold finished land in the Coombs, Hume
West, Greenway and Flemington Road estates.
(b) Land acquisitions include costs incurred in acquiring land from the Territory in accordance with the LDA's status as a Public Trading Enterprise (see Note 1(b) Public Trading Enterprise). Acquisitions include land purchased from other parties at market value and the fair value of land transferred from other ACT Government agencies to the LDA. The increase is mainly due to land transferred from other ACT Government agencies to the LDA for sale.
(c) The overall increase is due to the increased scale of development activity by the LDA including its development activities in Lawson, Coombs, Kingston Foreshore, Amaroo, Campbell, Moncrieff and Greenway.
157ANNUAL REPORT 2013-14

Land Development Agency Notes to and Forming Part of the Financial Statements
For the Year Ended 30 June 2014
Hidden words
42
NOTE 25. PROPERTY, PLANT AND EQUIPMENT Property, plant and equipment includes the following classes of assets – land and buildings, leasehold improvements, plant and equipment. Land and Buildings held includes property held for use as office buildings, storage facilities, and commercial display space. Land which is used for trading is classified as inventory (See Note 24: Inventories). Leasehold Improvements represent capital expenditure incurred in relation to leased assets. LDA has fit-outs in its leased buildings. Plant and Equipment includes motor vehicles under a finance lease, furniture, fittings and electronic office equipment. 2014 2013 $’000 $’000 Land and Buildings
Land at Fair Value 1,100 1,100 Total Land Assets 1,100 1,100
Buildings at Fair Value 2,675 2,675 Less: Accumulated Depreciation (134) - Total Written-Down Value of Buildings 2,541 2,675 Total Land and Written-Down Value of Buildings 3,641 3,775
Leasehold Improvements at Cost
Leasehold Improvements at Cost 2,333 2,333 Less: Accumulated Depreciation (2,325) (1,958) Total Written-Down Value of Leasehold Improvement Assets 8 375
Plant and Equipment at Cost
Plant and Equipment at Cost 221 230 Less: Accumulated Depreciation (90) (87) Total Written-Down Value of Plant and Equipment 131 143 Total Written-Down Value of Property, Plant and Equipment 3,780 4,293
Plant and Equipment under a Finance Lease Assets under finance lease are included in the plant and equipment asset class in the above disclosure. However, assets under a finance lease are also required to be separately disclosed as outlined below. Carrying Amount of Assets under a Finance Lease
Motor Vehicles under a Finance Lease 155 164 Less: Accumulated Depreciation (26) (36) Total Written-Down Value of Assets under a Finance Lease 129 128
158 LAND DEVELOPMENT AGENCY

Sec
tion
AS
ectio
n B
Sec
tion
CS
ectio
n D
Sec
tion
ES
ectio
n F
Land Development Agency Notes to and Forming Part of the Financial Statements
For the Year Ended 30 June 2014
Hidden words
43
NOTE 25. PROPERTY, PLANT AND EQUIPMENT – CONTINUED Valuation of Property, Plant and Equipment The Australian Valuation Office, an independent valuer, performed a valuation of LDA’s Land and Buildings as at 30 June 2013. Reconciliation of Property, Plant and Equipment at 30 June 2014 The following table shows the movement of Property, Plant and Equipment in 2013-14. Leasehold Plant and Land Buildings Improvements Equipment Total $’000 $’000 $’000 $’000 $’000 Carrying Amount at the Beginning of the Reporting Period 1,100 2,675 375 143 4,293 Additions - - - 97 97 Disposals - - - (106) (106) Disposal Depreciation Written Back - - - 39 39 Depreciation - (134) (367) (42) (543) Carrying Amount at the End of the Reporting Period 1,100 2,541 8 131 3,780 Reconciliation of Property, Plant and Equipment at 30 June 2013
The following table shows the movement of Property, Plant and Equipment in 2012-13.
Leasehold Plant and Land Buildings Improvements Equipment Total $’000 $’000 $’000 $’000 $’000 Carrying Amount at the Beginning of the Reporting Period 1,800 2,743 641 158 5,342 Additions - - 534 58 592 Disposals - - - (37) (37) Disposal Depreciation Written Back - - - 8 8 Depreciation - (46) (800) (44) (890) Revaluation (Decrement) (700) (22) - - (722) Carrying Amount at the End of the Reporting Period 1,100 2,675 375 143 4,293
159ANNUAL REPORT 2013-14

Land Development Agency Notes to and Forming Part of the Financial Statements
For the Year Ended 30 June 2014
Hidden words
44
NOTE 25. PROPERTY, PLANT AND EQUIPMENT – CONTINUED Carrying Value of Assets Measured at Fair Valued under the Cost Model The following classes of Property, Plant and Equipment, which are carried at fair value (as indicated above), would have had carrying values, if measured using the cost model, as follows: 2014 2013 $’000 $’000 Carrying value if measured using Cost Model
Land
Cost 670 670 Net Carrying Amount of Land at Cost 670 670 Buildings
Cost 1,761 1,761 Accumulated Depreciation and Impairment (1,761) (1,761)
Net Carrying Amount of Buildings at Cost - -
160 LAND DEVELOPMENT AGENCY

Sec
tion
AS
ectio
n B
Sec
tion
CS
ectio
n D
Sec
tion
ES
ectio
n F
Land Development Agency Notes to and Forming Part of the Financial Statements
For the Year Ended 30 June 2014
Hidden words
45
NOTE 25. PROPERTY, PLANT AND EQUIPMENT – CONTINUED
Fair Value Hierarchy The LDA is required to classify property, plant and equipment into a Fair Value Hierarchy that reflects the significance of the inputs used in determining their fair value. The Fair Value Hierarchy is made up of the following three levels:
Level 1 - quoted prices (unadjusted) in active markets for identical assets or liabilities that the LDA can access at the measurement date;
Level 2 - inputs other than quoted prices included within Level 1 that are observable for the asset or liability, either directly or indirectly; and
Level 3 - inputs that are unobservable for particular assets or liabilities.
Details of the LDA’s property, plant and equipment at fair value and information about the Fair Value Hierarchy as at 30 June 2014 are as follows: 2014
Classification According to Fair Value
Hierarchy Level 1 Level 2 Level 3 Total $’000 $’000 $’000 $’000 Property, Plant and Equipment at Fair Value
Land - 1,100 - 1,100 Buildings - 2,541 - 2,541 - 3,641 - 3,641
The LDA has used the exemption under AASB 13.C3: Fair Value Measurement that comparative information for periods before initial application of the standard need not be applied.
Transfers Between Categories
There have been no transfers between Levels 1, 2 and 3 during the reporting period.
Valuation Techniques, inputs and processes
Level 2 Valuation Techniques and Inputs
Valuation Technique: The valuation technique used to value land and buildings is the market approach that reflects recent transaction prices for similar properties and buildings (comparable in location and size).
Inputs: Prices and other relevant information generated by market transactions involving comparable land and buildings were considered. Regard was taken of the Crown Lease terms and tenure, Australian Capital Territory Plan and National Capital Plan, where applicable, as well as current zoning.
There has been no change to the above valuation techniques during the year. Transfers in and out of a fair value level are recognised on the date of the event or change in circumstances that caused the transfer. Land Buildings 2014 $’000 $’000
Fair Value at the Beginning of the Reporting Period 1,100 2,675 Depreciation - (134) Fair Value at the End of the Reporting Period 1,100 2,541
161ANNUAL REPORT 2013-14

Land Development Agency Notes to and Forming Part of the Financial Statements
For the Year Ended 30 June 2014
Hidden words
46
NOTE 26. INTANGIBLE ASSETS
2014 2013 $’000 $’000 Computer Software
Externally Purchased Software
Balance at the Beginning of the Reporting Period 81 81 Additions - - Subtotal 81 81 Less: Accumulated Amortisation (71) (45) Total Externally Purchased Software 10 36 Total Computer Software 10 36
NOTE 27. OTHER ASSETS Work in Progress - Software Development (a) 94 - Total Other Assets 94 -
Reconciliation of the Work in Progress - Software Development
Balance at the Beginning of the Reporting Period - - Additions 94 - Balance at the End of the Reporting Period 94 -
(a) The LDA is implementing Customer Relationship Management software to enhance customer service and improve inventory management.
162 LAND DEVELOPMENT AGENCY

Sec
tion
AS
ectio
n B
Sec
tion
CS
ectio
n D
Sec
tion
ES
ectio
n F
Land Development Agency Notes to and Forming Part of the Financial Statements
For the Year Ended 30 June 2014 Hidden words
47
NOTE 28. PAYABLES
2014 2013 $’000 $’000
Current Payables
Other Payables (a) 24,864 19,251 Payable to TAMSD for Land Sold (b) 20,764 6,632 Accrued Expenses (c) 15,397 17,398
Total Current Payables 61,025 43,281
Total Payables 61,025 43,281
Payables are aged as follows:
Not Overdue 61,025 43,281 Overdue for Less than 30 Days - - Total Payables 61,025 43,281
Classification of ACT Government/Non-ACT Government Payables
Payables with ACT Government Entities
Other Payables - 18 Payable to TAMSD for Land Sold 20,764 6,632 Accrued Expenses 1,893 8,098 Total Payables with ACT Government Entities 22,657 14,748
Payables with Non-ACT Government Entities
Other Payables 24,864 19,233 Accrued Expenses 13,504 9,300 Total Payables with Non-ACT Government Entities 38,368 28,533 Total Payables 61,025 43,281
(a) The increase in Other Payables is due to increased GST payable to the Australian Taxation Office.
(b) The increase in Payable to TAMS for Land Sold is related to higher volume of land sales late in the financial year.
(c) The decrease in Accrued Expenses is mainly due to reduced accrual of land holding costs and stamp duty equivalents, which were paid in 2013-14; partially offset by an increase in the accrual of development costs.
163ANNUAL REPORT 2013-14

Land Development Agency Notes to and Forming Part of the Financial Statements
For the Year Ended 30 June 2014 Hidden words
48
NOTE 29. FINANCE LEASES Finance Leases The LDA holds a number of finance leases for motor vehicles. The interest rates implicit in these leases vary from 5.20% to 5.65% and the terms are two to three years. These leases allow for extensions, but have no terms of renewal or purchase options, nor escalation clauses. 2014 2013 $’000 $’000
Current Finance Leases
Secured
Finance Leases 53 94 Total Current Secured Finance Leases 53 94
Non-Current Finance Leases
Secured
Finance Leases 77 35 Total Non-Current Secured Finance Leases 77 35 Total Finance Leases 130 129
Secured Liability The LDA's finance lease liability is effectively secured because if LDA defaults, the assets under a finance lease revert to the lessor. Finance Leases
Finance lease commitments are payable as follows:
Within One Year 58 100 Later than One Year but not later than Five Years 80 35 Minimum Lease Payments 138 135
Less: Future Finance Lease Charges (8) (6)
Amount Recognised as a Liability 130 129
Total Present Value of Minimum Lease Payments 130 129
The present value of the minimum lease payments are as follows:
Within One Year 53 94 Later than One Year but not later than Five Years 77 35
Total Present Value of Minimum Lease Payments 130 129
164 LAND DEVELOPMENT AGENCY
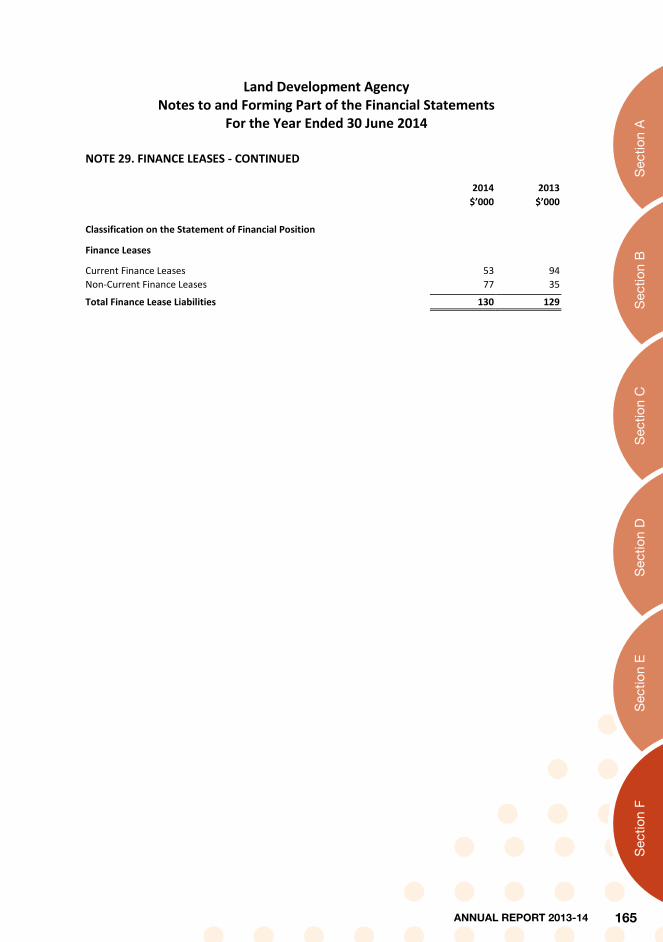
Sec
tion
AS
ectio
n B
Sec
tion
CS
ectio
n D
Sec
tion
ES
ectio
n F
Land Development Agency Notes to and Forming Part of the Financial Statements
For the Year Ended 30 June 2014 Hidden words
49
NOTE 29. FINANCE LEASES - CONTINUED 2014 2013 $’000 $’000
Classification on the Statement of Financial Position
Finance Leases
Current Finance Leases 53 94 Non-Current Finance Leases 77 35 Total Finance Lease Liabilities 130 129
165ANNUAL REPORT 2013-14

Land Development Agency Notes to and Forming Part of the Financial Statements
For the Year Ended 30 June 2014 Hidden words
50
NOTE 30. EMPLOYEE BENEFITS
2014 2013 $’000 $’000
Current Employee Benefits and On-Costs
Long Service Leave 2,279 2,305 Annual Leave 1,363 1,356 Accrued Salaries and Superannuation (a) 1,442 312 Accrued Payroll Tax 161 70 Accrued Fringe Benefit Tax 3 4 Total Current Employee Benefits and On-Costs 5,248 4,047
Non-Current Employee Benefits
Long Service Leave 216 229 Total Non-Current Employee Benefits 216 229 Total Employee Benefits 5,464 4,276
The classification of current employee provisions includes amounts for which there is not an unconditional right to defer settlement by one year. This classification does not represent the amount expected to be settled within one year of the reporting date. The average annual leave and long service leave paid over the past three years is used to estimate the expected amounts of these benefits to be paid during the next 12 months and is detailed below.
Estimate of when Leave is Payable
Estimated Amount Payable within 12 months 2014 2013 $’000 $’000 Long Service Leave 193 130 Annual leave 783 740 Accrued Salaries 1,442 312 Accrued Payroll Tax 161 70 Accrued Fringe Benefit Tax 3 4 Total Employee Benefits Payable within 12 months 2,582 1,256
Estimated Amount Payable after 12 months
Long Service Leave 2,302 2,404 Annual Leave 580 616 Total Employee Benefits Payable after 12 months 2,882 3,020 Total Employee Benefits 5,464 4,276
(a) The increase in accrued salaries and superannuation was due to the provision for the back pay of salary
increases under ACT Public Service Administrative and Related Classifications Enterprise Agreement 2013-2017 and termination payments.
As at 30 June 2014, the LDA employed 100 full time equivalent (FTE) staff. There were 89 FTE staff as at 30 June 2013.
166 LAND DEVELOPMENT AGENCY

Sec
tion
AS
ectio
n B
Sec
tion
CS
ectio
n D
Sec
tion
ES
ectio
n F
Land Development Agency Notes to and Forming Part of the Financial Statements
For the Year Ended 30 June 2014 Hidden words
51
NOTE 31. OTHER PROVISIONS 2014 2013 $’000 $’000 Current Other Provisions
Provision for Project Completion 37,719 35,968 Provision to Transfer Infrastructure 23,736 39,994 Total Current Other Provisions 61,455 75,962
Non-Current Other Provisions
Provision for Project Completion 26,219 27,559 Provision to Transfer Infrastructure 7,884 5,533 Total Non-Current Other Provisions 34,103 33,092 Total Other Provisions 95,558 109,054 Reconciliation of the Provision for Project Completions
Provision for Project Completion at the Beginning of the Reporting Period 63,527 60,442 Increase in Provision due to blocks becoming Settlement Ready (a) 105,735 55,183 Decrease in Provision due to Payments (b) (105,324) (52,098) Provision for Project Completion at the End of the Reporting Period 63,938 63,527
Reconciliation of the Provision to Transfer Infrastructure
Provision to Transfer Infrastructure at the Beginning of the Reporting Period 45,527 44,470 New Infrastructure to be Developed by Other Developers 6,613 1,192 Transfer of Infrastructure to ACT Government Entities (20,520) (135) Provision to Transfer Infrastructure at the End of the Reporting Period (c) 31,620 45,527
(a) In 2013-14, the increase in the value of Provision for Project Completions related to settlement ready
blocks in LDA estates. The major contributors were $9.6 million for Amaroo Group Centre; $47.3 million for Coombs; $3.3 million from Gungahlin Town Centre; $6.6 million for Greenway; $23.8 million for Hume West; $5.9 million for Kingston Foreshore and $7.9 million for Flemington Road Corridor.
(b) The decrease in the Provision for Project Completions in 2013-14 was mainly due to payments made for estate development costs. As the LDA estates became settlement ready, the reduction was aligned with the increase in the Provision for Project Completions.
(c) The decrease in total Right to Receive Infrastructures is due to a reduction of the Right to Receive Infrastructure after the associated works were completed and transferred to TAMSD and ACTEW.
167ANNUAL REPORT 2013-14

Land Development Agency Notes to and Forming Part of the Financial Statements
For the Year Ended 30 June 2014 Hidden words
52
NOTE 32. INCOME TAX PAYABLE 2014 2013 $’000 $’000
Opening Balance 18,840 19,475 Adjustment Made during the Reporting Period for the Previous Year - (874) Payment of Previous Year's Income Tax (18,840) (18,601) Deferral of Income Tax Payment to Future Periods (a) (14,038) (3,384) Income Tax Expense for Current Year (b) 28,570 46,503 Instalments Paid for Current Year's Income Tax (12,919) (24,279) Total Income Tax Payable 1,613 18,840 (a) The increase is mainly due to the deferral of income tax payments to future periods as a result of
increased inventories balances being claimed as a tax deduction. This will be assessed as income when the inventories are sold.
(b) The decrease is mainly due to the lower operating surplus resulting in the lower income tax expense.
NOTE 33. OTHER LIABILITIES Current Other Liabilities
Dividend Payable (a) 36,663 48,507 Revenue Received in Advance (b) 13,970 5,353 Finished Inventory - Land Value (c) 21,074 14,341 Total Current Other Liabilities 71,707 68,201
Reconciliation of Dividends Payable
Dividends Payable at the Beginning of the Reporting Period 48,507 62,347 Dividends Declared during the Reporting Period 66,663 108,507 Dividends Paid during the Reporting Period for Previous Year (48,507) (62,347) Dividends Paid during the Reporting Period for Current Year (30,000) (60,000) Dividend Payable at the End of the Reporting Period 36,663 48,507
(a) The decrease in dividend payable is due to the lower operating surplus and the corresponding dividend declared.
(b) Revenue Received in Advance relates to deposits received for land sales. The increase is directly related to an increase in the value of sales contracts that have been exchanged but are yet to settle in Lawson, Campbell, Coombs and the Kingston Foreshore.
(c) The increase in land available for sale was due to increase in the number of blocks of finished land in Coombs, Franklin, Flemington Road Corridor, Greenway, Hume West and Wright.
168 LAND DEVELOPMENT AGENCY

Sec
tion
AS
ectio
n B
Sec
tion
CS
ectio
n D
Sec
tion
ES
ectio
n F
Land Development Agency Notes to and Forming Part of the Financial Statements
For the Year Ended 30 June 2014 Hidden words
53
NOTE 34. DEFERRED TAX LIABILITY Deferred tax liabilities are the amounts of income taxes payable in future periods relating to temporary differences between the calculation of accounting and taxation profit. 2014 2013 $’000 $’000 The balance comprises temporary differences attributable to:
Opening Balance 33,363 29,104
Increase in Inventories 15,544 6,708 Increase/(Decrease) in Provision for Project Completion 19 (925) (Decrease) in Employee Benefits (10) (192) Accelerated Depreciation (103) (213) Other (1,412) (1,993) Current year movements 14,038 3,385
Adjustments for previous period share to Joint Venture Profit (a) (8,668) 874 Net Deferred Tax Liability (b) 38,733 33,363 (a) The adjustments relate to Joint Venture profits for taxation purposes for the previous financial year, which are not available until after the financial statements are completed for the relevant financial year.
(b) The increase in the deferred tax liability is mainly due to the deferral of income tax payments to future periods as a result of increased inventories balances being claimed as a tax deduction. This will be assessed as income when the inventories are sold.
.
169ANNUAL REPORT 2013-14

Land Development Agency Notes to and Forming Part of the Financial Statements
For the Year Ended 30 June 2014 Hidden words
54
NOTE 35. EQUITY
2014 2013 $’000 $’000
Asset Revaluation Surplus
Balance at the Beginning of the Reporting Period 2,879 3,601
Decrement in Land due to Revaluation - (700) Decrement in Buildings due to Revaluation - (22) - (722) Balance at the End of the Reporting Period 2,879 2,879
The Asset Revaluation Surplus is used to record the increments and decrements in the value of land and buildings.
170 LAND DEVELOPMENT AGENCY

Sec
tion
AS
ectio
n B
Sec
tion
CS
ectio
n D
Sec
tion
ES
ectio
n F
Land Development Agency Notes to and Forming Part of the Financial Statements
For the Year Ended 30 June 2014 Hidden words
55
NOTE 36. FINANCIAL INSTRUMENTS Outlined below are the terms and conditions of financial assets and liabilities held by the LDA as at 30 June 2014. Details of significant policies and methods adopted, including the criteria for recognition, the basis of measurement, and the basis on which income and expenses are recognised, with respect to each class of financial asset and financial liability, are disclosed at Note 2 Summary of Significant Accounting Policies. Interest Rate Risk Interest rate risk is the risk that the fair value or future cash flows of a financial instrument will fluctuate because of changes in market interest rates. The LDA only holds financial assets in floating interest rate arrangements and is not exposed to movements in interest payable. However, it is exposed to movements in interest receivable. Financial assets subject to floating interest rates include investments held in commercial banking accounts and the Territory Banking account together with receivables in respect to sales completed via instalments. The LDA manages the interest rate risk on investments held in a commercial banking account and Territory Banking Account by only investing in floating interest rate investments that are low risk. The receivables with instalment payments are not actively managed due to the associated interest payments being immaterial. Interest rate risk for financial liabilities is not actively managed by the LDA as the majority of financial liabilities are non-interest bearing. A sensitivity analysis of the interest rate risk has not been performed, because as disclosed above, the LDA's exposure to interest rate risk is immaterial. Credit Risk Credit risk is the risk that one party to a financial instrument will fail to discharge an obligation and cause the other party to incur a financial loss. The LDA’s credit risk is limited to the amount of the financial assets it holds net of any allowance for impairment. The LDA expects to collect all financial assets that are not past due or impaired. The LDA's credit risk mainly includes the investment of excess cash and exposure to deferred payment receivables. Credit risk is managed by the LDA by only investing surplus funds with the Territory Banking Account, which has appropriate investment criteria for the external fund manager engaged to manage the Territory’s surplus funds. Credit risk for deferred payment receivables relates to sales in which proceeds are received via instalments. All contracts of this nature are effectively secured by the Deed of Agreement for each sale. Credit risk for trade receivables mainly relates to sales proceeds receivable from the CWD for land rent sales which is considered to be low risk. Therefore, the exposure to credit risk from the investment of excess cash and from trades receivables is low.
171ANNUAL REPORT 2013-14

Land Development Agency Notes to and Forming Part of the Financial Statements
For the Year Ended 30 June 2014 Hidden words
56
NOTE 36. FINANCIAL INSTRUMENTS – CONTINUED Liquidity Risk Liquidity risk is the risk that the LDA will encounter difficulties in meeting obligations associated with financial liabilities that are settled by delivering cash or another financial asset. To limit its exposure to liquidity risk, the LDA ensures that it does not have a large portion of its financial liabilities maturing in any one reporting period and that, at any particular point in time, it has a sufficient amount of current financial assets to meet its current financial liabilities. LDA's exposure to liquidity risk and the management of this risk has not changed since the previous reporting period. Price Risk Price risk is the risk that the fair value or future cash flows of a financial instrument will fluctuate because of changes in market prices (other than those arising from interest rate risk or currency risk), whether these changes are caused by factors specific to the individual financial instrument or its issuer, or by factors affecting all similar financial instruments traded in the market. The LDA is not subject to price risk for its investment in the Cash Facility as the price for each unit is fixed at $1 by the Territory Banking Account. A sensitivity analysis of the price risk has not been performed as the LDA is not exposed to price risk.
172 LAND DEVELOPMENT AGENCY
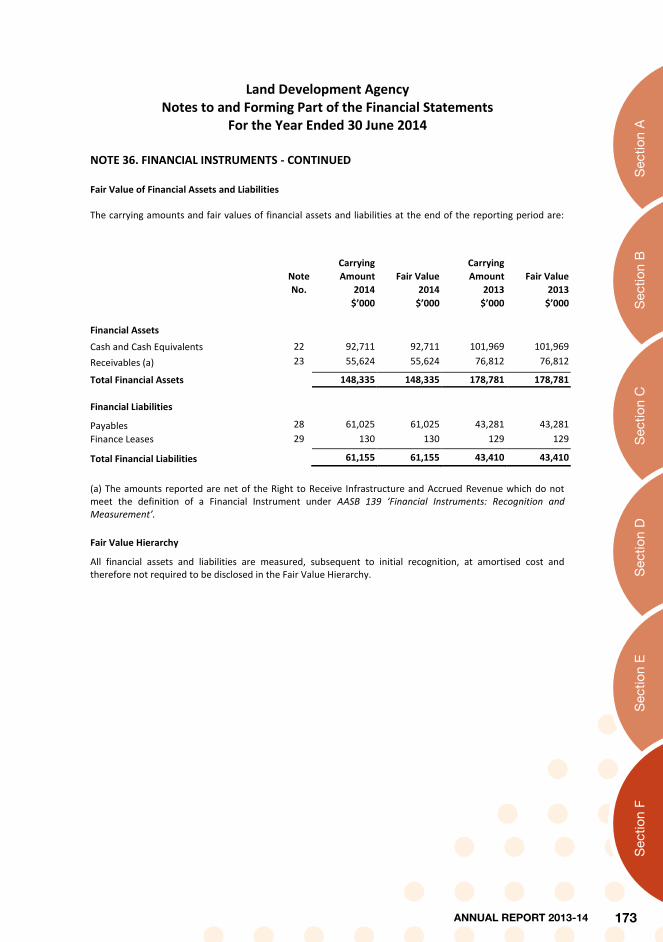
Sec
tion
AS
ectio
n B
Sec
tion
CS
ectio
n D
Sec
tion
ES
ectio
n F
Land Development Agency Notes to and Forming Part of the Financial Statements
For the Year Ended 30 June 2014 Hidden words
57
NOTE 36. FINANCIAL INSTRUMENTS - CONTINUED Fair Value of Financial Assets and Liabilities The carrying amounts and fair values of financial assets and liabilities at the end of the reporting period are: Carrying Carrying Note Amount Fair Value Amount Fair Value No. 2014 2014 2013 2013 $’000 $’000 $’000 $’000
Financial Assets
Cash and Cash Equivalents 22 92,711 92,711 101,969 101,969 Receivables (a) 23 55,624 55,624 76,812 76,812 Total Financial Assets 148,335 148,335 178,781 178,781
Financial Liabilities
Payables 28 61,025 61,025 43,281 43,281 Finance Leases 29 130 130 129 129
Total Financial Liabilities 61,155 61,155 43,410 43,410
(a) The amounts reported are net of the Right to Receive Infrastructure and Accrued Revenue which do not meet the definition of a Financial Instrument under AASB 139 ‘Financial Instruments: Recognition and Measurement’. Fair Value Hierarchy
All financial assets and liabilities are measured, subsequent to initial recognition, at amortised cost and therefore not required to be disclosed in the Fair Value Hierarchy.
173ANNUAL REPORT 2013-14

Land Development Agency Notes to and Forming Part of the Financial Statements
For the Year Ended 30 June 2014 Hidden words
58
NOTE 36. FINANCIAL INSTRUMENTS - CONTINUED Maturity Analysis
The following table sets out LDA's maturity analysis for financial assets and liabilities as well as the exposure to interest rates, including the weighted average interest rates by maturity period as at 30 June 2014. Except for non-current payables, financial assets and liabilities which have a floating interest rate or are non-interest bearing will mature in one year or less. All amounts appearing in the following maturity analysis are shown on an undiscounted cash flow basis.
Fixed Interest Maturing In: Note Weighted Floating 1 Year Over 1 to More Non- Total No. Average Interest or Less 5 Years than 5 Interest Rate Rate Years Bearing $’000 $’000 $’000 $’000 $’000 $’000 $’000 Financial Instruments Financial Assets Cash and Cash Equivalents 22 3.01% 92,709 - - - 2 92,711 Receivables (a) 23 7.17% 1,673 - - - 53,951 55,624 Total Financial Assets 94,382 - - - 53,953 148,335 Financial Liabilities Payables 28 - - - - 61,025 61,025 Finance Leases 29 5.31% - 58 80 - - 138 Total Financial Liabilities - 58 80 - 61,025 61,163 Net Financial Assets/(Liabilities) 94,382 (58) (80) - (7,072) 87,172
(a) The amounts reported are net of the Right to Receive Infrastructure and Accrued Revenue which do not meet the definition of a Financial Instrument under AASB 139 ‘Financial Instruments: Recognition and Measurement’.
174 LAND DEVELOPMENT AGENCY

Sec
tion
AS
ectio
n B
Sec
tion
CS
ectio
n D
Sec
tion
ES
ectio
n F
Land Development Agency Notes to and Forming Part of the Financial Statements
For the Year Ended 30 June 2014 Hidden words
59
NOTE 36. FINANCIAL INSTRUMENTS - CONTINUED The following table sets out LDA's maturity analysis for financial assets and liabilities as well as the exposure to interest rates, including the weighted average interest rates by maturity period as at 30 June 2013. Except for non-current payables, financial assets and liabilities which have a floating interest rate or are non-interest bearing will mature in one year or less. All amounts appearing in the following maturity analysis are shown on an undiscounted cash flow basis. Fixed Interest Maturing In: Note Weighted Floating 1 Year Over 1 to More Non- Total No. Average Interest or Less 5 Years than 5 Interest Interest Rate Years Bearing Rate $’000 $’000 $’000 $’000 $’000 $’000 Financial Instruments Financial Assets Cash and Cash Equivalents 22 3.32% 101,967 - - - 2 101,969 Receivables 23 7.17% 3,209 - - - 73,602 76,811 Total Financial Assets 105,176 - - - 73,604 178,780 Financial Liabilities Payables 28 - - - - 43,281 43,281 Finance Leases 29 5.81% - 100 35 - - 135 Total Financial Liabilities - 100 35 - 43,281 43,416 Net Financial Assets/(Liabilities) 105,176 (100) (35) - 30,323 135,364
Carrying Amount of Each Category of Financial Asset and Financial Liability
2014 2013 $’000 $’000 Financial Assets
Loans and Receivables Measured at Amortised Cost (a) 55,624 76,811
Financial Liabilities
Financial Liabilities Measured at Amortised Cost 61,155 43,410 (a) The amounts reported are net of the Right to Receive Infrastructure which does not meet the definition of a Financial Instrument under AASB 139: ‘Financial Instruments: Recognition and Measurement’.
The LDA does not have any financial assets in the 'Available for Sale' category or the 'Held to Maturity' category and as such these categories are not included above. Also, the LDA does not have any financial liabilities in the 'Financial Liabilities at Fair Value through Profit and Loss' category and as such this category is not included above.
175ANNUAL REPORT 2013-14

Land Development Agency Notes to and Forming Part of the Financial Statements
For the Year Ended 30 June 2014 Hidden words
60
NOTE 37. COMMITMENTS 2014 2013 $’000 $’000 Operating Leases
Non-cancellable operating lease commitments are payable as follows:
Within One Year 1,249 405 Later than One Year but not later than Five Years (a) 4,278 36 Total Operating Lease Commitments 5,527 441
The operating leases relate to the lease of the Dickson Office from the TAMSD and IT plant and equipment and mobile phones provided by Shared Services ICT. (a) The increase is due to LDA extending the Dickson office lease for five years with lease expiring in
October 2018.
176 LAND DEVELOPMENT AGENCY

Sec
tion
AS
ectio
n B
Sec
tion
CS
ectio
n D
Sec
tion
ES
ectio
n F
Land Development Agency Notes to and Forming Part of the Financial Statements
For the Year Ended 30 June 2014 Hidden words
61
NOTE 38. CONTINGENT LIABILITIES AND CONTINGENT ASSETS
Contingent Liabilities
Legal Claims
The ACT Government Solicitor’s Office is acting for the Land Development Agency in matters involving legal claims. At 30 June 2014, the current estimate of potential claims is $410,000 (2012-13: Nil).
GST Refunds – GST-Free land sales
The LDA has a contingent asset for GST refunds of $7,777,273 as a result of overpayment of GST on land sales in previous financial years. These refunds relate to prior year land sales that the LDA now classifies as ‘GST-free’ land sales. However, the ATO had not yet indicated that it agrees with the position. As such, until these refunds are received or the ATO indicates its acceptance, they represent a contingent asset to the LDA.
In the event that LDA receives the $7,777,273 in GST refunds, it will have a corresponding liability for income tax and dividend payments to Government.
GST Refunds – Government Margin Scheme
Further information on the contingent liabilities and assets relating to GST Refunds Government Margin Scheme are included in Note 4: ‘Significant Accounting Judgements and Estimates’ at Note 4(viii) ‘Receivable for GST Refunds’ and Note 4(ix) ‘Contingent Liabilities and Assets’.
Contingent Assets
Legal Claims
The LDA holds insurance policies with the ACT Insurance Authority that covers the above legal claims. The estimated receipts if the above claims were successful are $390,000 (2012-13: NIL).
GST Refunds – GST-Free land sales The LDA has a contingent asset for GST refunds of $7,777,273 as a result of overpayment of GST on land sales in previous financial years. These refunds relate to prior year land sales that the LDA now classifies as ‘GST-free’ land sales. However, the ATO had not yet indicated that it agrees with the position. As such, until these refunds are received or the ATO indicates its acceptance, they represent a contingent asset to the LDA.
GST Refunds – Government Margin Scheme The LDA has an unquantifiable contingent asset for overpayment of income tax and dividends to Government as a result of the unquantifiable contingent liability to the ATO for GST remitted on land sales outlined above.
177ANNUAL REPORT 2013-14

Land Development Agency Notes to and Forming Part of the Financial Statements
For the Year Ended 30 June 2014 Hidden words
62
NOTE 39. INTEREST IN JOINTLY CONTROLLED ENTITIES
The LDA was involved in two unincorporated joint venture entities during the reporting period for the residential development of Forde and Crace. A summary of the LDA's total interest in its Joint Ventures is detailed below. The carrying amount of the LDA's Investment in any of its Joint Ventures will differ from the carrying amount recorded in the Financial Statements of that Joint Venture due to recognition requirements detailed in AASB 131 'Interests in Joint Ventures'. Under AASB 131.48, when a venturer contributes assets to a Joint Venture, only that portion of the gain that is attributable to other venturers can be recognised. The balance of the LDA's investment in any of its Joint Ventures is recognised progressively in line with the sale of developed land by that Joint Venture to third parties. 2014 2013 $’000 $’000 Share of Joint Venture Profit are as follows:
Revenue 40,086 103,780 Expenses 28,669 80,012 Operating Profit before Income Tax Per Joint Ventures Statement 11,417 23,768 Write-back Impairment Expenses 2,956 - Previous Years Adjustment 124 (371) Operating Profit before Income Tax 14,497 23,397
Revenue Progressively Recognised for Sale of
Development Rights (AASB 131: Interests in Joint Ventures) 5,310 16,233 Total Net Income (a) 19,807 39,630
Share of Joint Venture Assets and Liabilities are as follows:
Assets 2,694 30,079 Liabilities 1,272 10,679 Net Assets (b) 1,422 19,400
(a) The decrease in net income was due to decreased land sales for Joint Ventures as the projects are nearing completion.
(b) The decrease in net assets was due to the receipts of capital distributions from the Joint Ventures.
178 LAND DEVELOPMENT AGENCY

Sec
tion
AS
ectio
n B
Sec
tion
CS
ectio
n D
Sec
tion
ES
ectio
n F
Land Development Agency Notes to and Forming Part of the Financial Statements
For the Year Ended 30 June 2014 Hidden words
63
NOTE 39. INTEREST IN JOINTLY CONTROLLED ENTITIES - CONTINUED
2014 2013 $’000 $’000 The Carrying Amount of the Investments in the Joint Ventures
Balance of Investments in Joint Ventures at the Beginning of the Reporting
Period 8,266 36,645 Previous year's Adjustment 124 (371) Share of Operating Profit from Joint Ventures 14,373 23,768 Capital Injection - 163 Revenue Progressively Recognised for Sale of
Development Rights (AASB 131: Interests in Joint Ventures) 5,310 16,233 Distribution from Joint Ventures (29,500) (63,258) Elimination of Net Receivable/(Payable) at Year-end 2,849 (4,914) Balance of Investment in Joint Ventures at the End of the Reporting Period 1,422 8,266
Classification in the Statement of Financial Position
Future Joint Venture Distributions
Current 1,422 8,266 Non-Current - - 1,422 8,266
179ANNUAL REPORT 2013-14

Land Development Agency Notes to and Forming Part of the Financial Statements
For the Year Ended 30 June 2014 Hidden words
64
NOTE 39. INTEREST IN JOINTLY CONTROLLED ENTITIES - CONTINUED
Joint Venture Name Estate Name Forde Joint Venture Forde The LDA was involved in an unincorporated joint venture entity during the reporting period, for the residential development of Forde. There are two venturers in the Forde Joint Venture. The LDA and Forde Developments Pty Ltd with each party having a 50% ownership interest and voting power in the Joint Venture. The reporting date of the LDA and Forde Joint Venture is 30 June each year. 2014 2013 $’000 $’000
Share of Joint Venture Profit is as follows:
Revenue 489 11,602 Expenses 2,941 1,797 Operating Profit before Income Tax Per Forde Joint Venture Statement (2,452) 9,805 Write-back Impairment Expenses 2,956 - Previous Years Adjustment 227 - Total Net Income (a) 731 9,805
Share of Joint Venture Assets and Liabilities is as follows:
Assets 891 6,846 Liabilities 397 2,358 Net Assets as per Forde Joint Venture Financial Statements 494 4,488
(a) The decrease in net income was due to decreased land sales for Forde as the project is nearing completion.
The Carrying Amount of the Investments in the Joint Venture
Balance of Investments in Joint Venture at the Beginning of the Reporting
Period (635) 1,106 Share of Operating Profit from Joint Venture 504 9,805 Previous Years Adjustment 227 - Distribution from Joint Venture (1,750) (6,750) Elimination of Net Receivable/(Payable) at Year-end 2,148 (4,796) Balance of Investment in Joint Venture at the End of the Reporting Period 494 (635)
180 LAND DEVELOPMENT AGENCY

Sec
tion
AS
ectio
n B
Sec
tion
CS
ectio
n D
Sec
tion
ES
ectio
n F
Land Development Agency Notes to and Forming Part of the Financial Statements
For the Year Ended 30 June 2014 Hidden words
65
NOTE 39. INTEREST IN JOINTLY CONTROLLED ENTITIES - CONTINUED
Joint Venture Name Estate Name Forde Joint Venture Forde
Classification in the Statement of Financial Position
2014 2013 Future Joint Venture Distributions $’000 $’000
Current 494 (635) 494 (635)
Contingent Liabilities and Assets
The Forde Joint Venture has a contingent liability and asset of $14,282,432 at the date of these financial statements. This relates to GST refunds for prior year land sales received by the LDA from the ATO and passed on to the Forde Joint Venture. Further information on the contingent liabilities and assets relating to GST Refunds under the Government Margin Scheme are included in Note 4: ‘Significant Accounting Judgements and Estimates’ at Note 4(viii) ‘Receivable for GST Refunds’ and Note 4(ix) ‘Contingent Liabilities and Assets’.
181ANNUAL REPORT 2013-14

Land Development Agency Notes to and Forming Part of the Financial Statements
For the Year Ended 30 June 2014 Hidden words
66
NOTE 39. INTEREST IN JOINTLY CONTROLLED ENTITIES - CONTINUED
Joint Venture Name Estate Name Crace Joint Venture Crace The LDA was involved in an unincorporated joint venture entity during the reporting period for the residential development of Crace. There are two venturers in the Crace Joint Venture. The LDA and Crace Developments Pty Ltd each have a 50% ownership interest and voting power in the Joint Venture. The reporting date of the LDA and Crace Joint Venture is 30 June each year.
2014 2013 $’000 $’000
Share of Joint Venture Profit is as follows:
Revenue 39,597 65,326 Expenses 25,728 50,629 Operating Profit before Income Tax 13,869 14,697
Previous Years Adjustment (103) (371) Revenue Progressively Recognised for Sale of
Development Rights (AASB 131: Interests in Joint Ventures) 5,310 8,613 Total Net Income (a) 19,076 22,939
Share of Joint Venture Assets and Liabilities is as follows:
Assets 1,803 23,233 Liabilities 875 8,321 Net Assets per Crace Joint Venture Financial Statements (b) 928 14,912
(a) The decrease in net income was due to decreased revenue progressively recognised for sale of development rights.
(b) The decrease is due to the receipt of capital distributions from the Joint Venture.
The Carrying Amount of the Investment in the Joint Venture
Balance of Investment in Joint Venture at the Beginning of the Reporting
Period 8,901 26,413 Previous Years Adjustment (103) (371) Share of Operating Profit from Joint Venture 13,869 14,697 Revenue Progressively Recognised for Sale of
Development Rights (AASB 131: Interests in Joint Ventures) 5,310 8,613 Distribution from Joint Venture (27,750) (39,750) Elimination of Net Receivable/(Payable) at Year-end 701 (701) Balance of Investment in Joint Venture at the End of the Reporting Period 928 8,901
182 LAND DEVELOPMENT AGENCY

Sec
tion
AS
ectio
n B
Sec
tion
CS
ectio
n D
Sec
tion
ES
ectio
n F
Land Development Agency Notes to and Forming Part of the Financial Statements
For the Year Ended 30 June 2014 Hidden words
67
NOTE 39. INTEREST IN JOINTLY CONTROLLED ENTITIES - CONTINUED
Joint Venture Name Estate Name Crace Joint Venture Crace
Classification in the Statement of Financial Position
2014 2013 Future Joint Venture Distributions $’000 $’000
Current 928 8,901 928 8,901
Contingent Liabilities
The Joint Venture has no contingent liabilities.
183ANNUAL REPORT 2013-14

Land Development Agency Notes to and Forming Part of the Financial Statements
For the Year Ended 30 June 2014 Hidden words
68
NOTE 39. INTEREST IN JOINTLY CONTROLLED ENTITIES - CONTINUED
Joint Venture Name Estate Name Woden East Joint Venture Woden East
2014 2013 $’000 $’000 Share of the Joint Venture Profit is as follows:
Revenue - 26,852 Expenses - 27,586 Operating (Loss) before Income Tax - (734)
Revenue Progressively Recognised for Sale of
Development Rights (AASB 131.48) - 7,620 Total Net Income - 6,886
Share of the Joint Venture Assets and Liabilities is as follows:
Assets - - Liabilities - - Net Assets - -
The Carrying Amount of the Investment in the Joint Venture
Balance of Investments in Joint Venture at the Beginning of the Reporting - Period 9,126
Share of Operating (Loss) from Joint Venture - (734) Revenue Progressively Recognised for Sale of
Development Rights (AASB 131.48) - 7,620 Capital Injection 163
Distribution from Joint Venture - (16,758) Elimination of Net Receivable at Year-end - 583 Balance of Investment in Joint Ventures at the End of the Reporting Period - -
184 LAND DEVELOPMENT AGENCY

Sec
tion
AS
ectio
n B
Sec
tion
CS
ectio
n D
Sec
tion
ES
ectio
n F
Land Development Agency Notes to and Forming Part of the Financial Statements
For the Year Ended 30 June 2014 Hidden words
69
NOTE 40. CASH FLOW RECONCILIATION
2014 2013 $’000 $’000 (a) Reconciliation of Cash and Cash Equivalents at the End of the Reporting
Period in the Cash Flow Statement to the Equivalent Items in the Statement of Financial Position.
Total Cash and Cash Equivalents Recorded in the Statement of Financial Position 92,711 101,969 Cash and Cash Equivalents at the End of the Reporting Period as Recorded
in the Cash Flow Statement 92,711 101,969
(b) Reconciliation of Net Cash Inflows from Operating Activities to the
Operating Surplus
Operating Surplus 66,663 108,507
Add/(Less) Non-Cash Items
Depreciation 570 918 Resources Received Free of Charge (7,996) (10,418) Land Transferred in Free of Charge 5,685 8,080 Inventory Loss (Related to Land Transferred in Free of Charge) 2,311 1,729
(Less) Items Classified as Investing or Financing
Profit on Sale of Asset (14) (7) Share of Joint Venture Profit (19,807) (39,630) Cash Before Changes in Operating Assets and Liabilities 47,412 69,179
Changes in Operating Assets and Liabilities
Decrease in Receivables 15,940 31,728 (Increase) in Inventories (49,401) (20,267) Increase in Deferred Tax Asset/Liability 5,370 4,259 Decrease in Other Assets - 24 Increase in Employee Entitlements 1,188 728 Increase in Payables 20,719 9,224 (Decrease)/Increase in Provisions (13,496) 4,142 (Decrease) in Income Tax Payable (17,227) (635) Increase/(Decrease) in Other Liabilities 15,353 (8,864) Net Changes in Operating Assets and Liabilities (21,554) 20,339
Net Cash Inflows from Operating Activities 25,858 89,518
(c) Non-Cash Financing and Investing Activities
Acquisition of Motor Vehicles by means of Finance Lease 97 58
185ANNUAL REPORT 2013-14

Land Development Agency Notes to and Forming Part of the Financial Statements
For the Year Ended 30 June 2014 Hidden words
70
NOTE 41. EVENTS OCCURING AFTER BALANCE DATE There were no events occurring after balance date that had a material effect on the financial statements of the LDA. NOTE 42. RELATED PARTY DISCLOSURES The directors of the LDA during the year were:
Mr Ross Barrett: Chair Mr Robert Tonkin: Deputy Chair Mr David Dawes: Chief Executive Officer and Member Ms Sandra Lambert: Member Ms Susan Proctor: Member Mr Jim Shonk: Member 2014 2013 $’000 $’000
Total remuneration paid or due and payable to the directors of the LDA 261 248
Number Number $20,000 - $30,000 - 1 $30,000 - $40,000 1 - $40,000 - $50,000 2 2 $50,000 - $60,000 - 1 $60,000 - $70,000 1 - $70,000 - $80,000 1 1 5 5
The Chief Executive Officer did not receive any remuneration as a member of the Board.
Transactions with related parties during the reporting period: 2014 2013 $’000 $’000 Payments to Economic Development Directorate for services:
Executive Management 746 619 Workforce and Human Resources Services 324 297 Governance 195 276 Ministerial and Cabinet (coordination role) 159 200 Policy 76 245 Communication and Media 406 227 Community Consultation 353 174 2,259 2,038
Payments received from Economic Development Directorate for services:
Executive Management (funded by the LDA) 98 98 Financial Management 791 586 889 684 Net Payment to the Economic Development Directorate 1,370 1,354
186 LAND DEVELOPMENT AGENCY

Sec
tion
AS
ectio
n B
Sec
tion
CS
ectio
n D
Sec
tion
ES
ectio
n F
187ANNUAL REPORT 2013-14

188 LAND DEVELOPMENT AGENCY

Sec
tion
AS
ectio
n B
Sec
tion
CS
ectio
n D
Sec
tion
ES
ectio
n F
Crace Joint Venture ABN: 62 124 931 161
Financial Statements
for the year ended 30 June 2014
189ANNUAL REPORT 2013-14

Contents
Page
Financial report
Statement of profit or loss and other comprehensive income 1
Statement of changes in equity 1
Statement of financial position 2
Statement of cash flows 3
Notes to the financial statements 4
Declaration by the Joint Venture Partners 20
Independent auditor’s report 21
190 LAND DEVELOPMENT AGENCY

Sec
tion
AS
ectio
n B
Sec
tion
CS
ectio
n D
Sec
tion
ES
ectio
n F
CRACE JOINT VENTURE
(ABN 62 124 931 161)
1
Statement of profit or loss and other comprehensive income
For the year ended 30 June 2014
Note 2014 2013
$ $
Revenue 77,969,072 126,227,427
Cost of development services (44,754,288) (91,411,437)
Gross profit 33,214,784 34,815,990
Other income 5 952,609 3,950,761
Selling and holding expenses (6,316,093) (9,380,744)
Administrative expenses (299,960) (229,378)
Results from operating activities 27,551,340 29,156,629
Finance income 6 271,679 262,612
Finance expense 6 (87,498) (230,456)
Net finance income 184,181 32,156
Total comprehensive income for the period available for
distribution to Joint Venture Partners
27,735,521
29,188,785
Statement of changes in equity For the year ended 30 June 2014
Note 2014 2013
$ $
Total equity at the beginning of the reporting period 13 29,618,427 79,929,642
Repayment of capital to Joint Venture Partners 13 - (53,148,630)
Distribution of profit to Joint Venture Partners 13 (55,500,000) (26,351,370)
Net profit for the period 13 27,735,521 29,188,785
Total equity at the end of the reporting period 1,853,948 29,618,427
The above statement of profit or loss and other comprehensive income and statement of changes in equity
should be read in conjunction with the accompanying notes
191ANNUAL REPORT 2013-14

CRACE JOINT VENTURE
(ABN 62 124 931 161)
2
Statement of financial position
As at 30 June 2014
Note 2014 2013
$ $
Assets
Cash and cash equivalents 7 3,606,066 2,860,291
Trade and other receivables 8 11,180 2,494,332
Inventories 9 - 40,864,903
Prepayments 705 -
Total current assets 3,617,951 46,219,526
Property, plant and equipment 10 - 247,192
Total non-current assets - 247,192
Total assets 3,617,951 46,466,718
Liabilities
Trade and other payables 11 1,764,003 6,882,417
Borrowings 12 - 9,965,875
Total current liabilities 1,764,003 16,848,291
Total liabilities 1,764,003 16,848,291
Net assets 1,853,948 29,618,427
Joint Venture equity
Accumulated profits 13 1,853,948 29,618,427
Total Joint Venture equity 1,853,948 29,618,427
The above statement of financial position should be read in conjunction with the accompanying notes.
192 LAND DEVELOPMENT AGENCY

Sec
tion
AS
ectio
n B
Sec
tion
CS
ectio
n D
Sec
tion
ES
ectio
n F
CRACE JOINT VENTURE
(ABN 62 124 931 161)
3
Statement of cash flows
For the year ended 30 June 2014
Note 2014 2013
$ $
Cash flows from operating activities Cash receipts in the course of operations 87,747,964 138,779,448
Cash payments in the course of operations (21,720,495) (50,739,918)
Net cash from operating activities 15 66,027,469 88,039,530
Cash flows from investing activities Interest received 271,679 262,612 Payments for property, plant and equipment - (198,723) Net cash from investing activities 271,679 63,889
Cash flows from financing activities Proceeds from borrowings 3,731,634 27,712,144
Interest paid (87,498) (230,456)
Repayment of borrowings (13,697,509) (38,458,646)
Distributions to Joint Venture Parties (55,500,000) (79,500,000)
Net cash (used in) financing activities (65,553,373) (90,476,958)
Net increase / (decrease) in cash and cash equivalents 745,775 (2,373,539)
Cash and cash equivalents at beginning of the reporting period 2,860,291 5,233,830
Cash and cash equivalents at the end of the reporting period 7 3,606,066 2,860,291
The above statement of cash flows should be read in conjunction with the accompanying notes.
193ANNUAL REPORT 2013-14

CRACE JOINT VENTURE
(ABN 62 124 931 161)
NOTES TO THE FINANCIAL STATEMENTS
FOR THE YEAR ENDED 30 JUNE 2014
4
1. Significant accounting policies
Crace Joint Venture (the “Joint Venture”) is a joint venture domiciled in Australia. The Joint Venture was
formed to develop the land in the suburb known as Crace in the Australian Capital Territory.
(a) Statement of compliance
The financial statements are general purpose financial statements which have been prepared in
accordance with Australian Accounting Standards (“AASBs”) (including Australian Accounting
Interpretations) issued by the Australian Accounting Standards Board (AASB). The financial
statements of the Joint Venture comply with the International Financial Reporting Standards
(IFRSs) and interpretations issued by the International Accounting Standards Board (IASB).
The financial statements were approved by the Joint Venture Management Committee on 15
September 2014.
(b) Basis of preparation
The financial statements of the Joint Venture are general purpose financial statements prepared to
comply with the requirements of the “Crace Estate Joint Venture Agreement” (the “Joint Venture
Agreement”) and for distribution to Joint Venture Partners.
The financial statements are presented in Australian dollars. The financial statements are prepared
on the historical cost basis.
The preparation of financial statements in conformity with Australian Accounting Standards requires
management to make judgements, estimates and assumptions that affect the application of policies
and reported amounts of assets and liabilities, income and expenses. The estimates and associated
assumptions are based on historical experience and various other factors that are believed to be
reasonable under the circumstances, the results of which form the basis of making the judgements
about carrying values of assets and liabilities that are not readily apparent from other sources.
Actual results may differ from these estimates.
These accounting policies have been consistently applied by the Joint Venture.
The estimates and underlying assumptions are reviewed on an ongoing basis. Revisions to
accounting estimates are recognised in the period in which the estimate is revised if the revision
affects only that period or in the period of the revision and future periods if the revision affects both
current and future periods.
In particular, information about assumptions and estimation uncertainties have a significant risk of
resulting in a material adjustment within the next financial year is included in Note 11 – Trade and
other payables.
194 LAND DEVELOPMENT AGENCY

Sec
tion
AS
ectio
n B
Sec
tion
CS
ectio
n D
Sec
tion
ES
ectio
n F
CRACE JOINT VENTURE
(ABN 62 124 931 161)
NOTES TO THE FINANCIAL STATEMENTS
FOR THE YEAR ENDED 30 JUNE 2014
5
1. Significant accounting policies (continued) (c) Revenue/Expenses
(i) Revenue recognition
Revenue from the provision of services for the development of land is recognised when the
Land Development Agency settles the land and title is transferred to the end purchaser.
(ii) Finance income/expenses
Finance income comprises interest receivable on funds invested. Interest income is recognised
in the statement of comprehensive income as it accrues, using the effective interest method.
Interest payable on borrowings is calculated using the effective interest method. Interest is
expensed as incurred unless it relates to a qualifying asset. In these circumstances, borrowing
costs are capitalised to the cost of the asset, using a weighted average capitalisation rate.
(d) Income tax
The Joint Venture is a non-taxable entity.
(e) Goods and services tax
Revenue, expenses and assets are recognised net of the amount of goods and services tax (GST),
except where the amount of GST incurred is not recoverable from the Australian Taxation Office
(ATO). In these circumstances, the GST is recognised as part of the cost of acquisition of the asset
or as part of the expense.
Receivables and payables are stated with the amount of GST included. The net amount of GST
recoverable from, or payable to, the Australian Taxation Office is included as a current asset or
liability in the statement.
Cash flows are included in the statement of cash flows on a gross basis. The GST components of
cash flows arising from investing and financing activities which are recoverable from, or payable to,
the Australian Taxation Office are classified as operating cash flows.
(f) Cash and cash equivalents
Cash and cash equivalents in the statement of financial position comprise cash at bank and
short-term deposits with an original maturity of three months or less held as security for guarantees.
(g) Trade and other receivables
Trade and other receivables are stated at their cost less any allowance for impairment losses (see
Note 1(i)).
(h) Inventories
Inventories are stated at the lower of cost and net realisable value. Net realisable value is the
estimated selling price in the ordinary course of business, less the estimated costs of completion
and selling expenses.
195ANNUAL REPORT 2013-14

CRACE JOINT VENTURE
(ABN 62 124 931 161)
NOTES TO THE FINANCIAL STATEMENTS
FOR THE YEAR ENDED 30 JUNE 2014
6
1. Significant accounting policies (continued) (h) Inventories (continued)
Inventories, being development costs incurred to develop land, are initially recognised at cost. Cost
includes the cost of the right to develop land, development and holding costs such as rates and
taxes and any other expenditure incurred in acquiring and bringing the inventories to their existing
location and condition. Holding costs incurred for each stage after completion are expensed.
Current inventories are defined as development work on land registered and available for sale by
the Land Development Agency, or intended to be available for sale, within the next twelve months.
Non-current inventories are all other inventory not classified as current.
When services for development costs are invoiced, the value of inventories is reduced by the
development cost of the blocks sold which include costs incurred to date plus future costs to bring
the blocks sold to physical completion.
Inventories include the cost of the right to develop land owned by one of the Joint Venture parties.
Whilst legal title has not passed to the Joint Venture, this asset has been classified as inventories,
pursuant to the Joint Venture Agreement.
(i) Impairment
The carrying amounts of the Joint Venture’s assets, other than inventories (see Note 1(h)), are
reviewed at each balance sheet date to determine whether there is any indication of impairment. If
any such indication exists, the asset’s recoverable amount is estimated (see Note 1(i)(i)).
An impairment loss is recognised whenever the carrying amount of an asset or its cash-generating
unit exceeds its recoverable amount. Impairment losses are recognised in the statement of
comprehensive income.
(i) Calculation of recoverable amount
Impairment of receivables is not recognised until objective evidence is available that a loss
event has occurred. Receivables are individually assessed for impairment. Receivables with a
short duration are not discounted.
Impairment of non-financial assets is not recognised until evidence is available that an assets
value is greater than its recoverable amount. The recoverable amount of an asset is the
greater of its value in use and its fair value less costs to sell.
(ii) Reversals of impairment
In respect of receivables, an impairment loss is reversed if there has been a change in the
estimates used to determine the recoverable amount. An impairment loss is reversed only to
the extent that the receivable’s carrying amount does not exceed the carrying amount that
would have been determined, net of depreciation or amortisation, if no impairment loss had
been recognised.
196 LAND DEVELOPMENT AGENCY

Sec
tion
AS
ectio
n B
Sec
tion
CS
ectio
n D
Sec
tion
ES
ectio
n F
CRACE JOINT VENTURE
(ABN 62 124 931 161)
NOTES TO THE FINANCIAL STATEMENTS
FOR THE YEAR ENDED 30 JUNE 2014
7
1. Significant accounting policies (continued)
(j) Property, plant and equipment
(i) Recognition and measurement
Items of plant and equipment are measured at cost less accumulated depreciation and
impairment losses. Cost includes expenditures that are directly attributable to the acquisition of
the asset.
Where parts of an item of plant and equipment have different useful lives, they are accounted
for as separate items of plant and equipment.
Gains and losses on disposal of an item of plant and equipment are determined by comparing
the proceeds from disposal with the carrying amount of the plant and equipment and are
recognised net within “other income” in profit or loss.
(ii) Subsequent costs
The cost of replacing part of an item of plant and equipment is recognised in the carrying
amount of the item if it is probable that the future economic benefits embodied within the part
will flow to the Joint Venture and its cost can be measured reliably. The costs of day-to-day
servicing of plant and equipment are recognised in the statement of comprehensive income as
an expense when incurred.
(iii) Depreciation
Depreciation is recorded in the statement of comprehensive income on a straight-line basis
over the estimated useful life of each part of an item of plant and equipment. The estimated
useful lives in the current period is as follows:
Buildings 1 - 5 years
Office fitout 1 - 5 years
Depreciation methods, useful lives and residual values are reassessed annually at each
reporting date.
(k) Borrowings
Interest-bearing borrowings are recognised initially at fair value less attributable transaction costs.
Subsequent to initial recognition, interest-bearing borrowings are stated at amortised cost with any
difference between cost and redemption value being recognised in the statement of comprehensive
income over the period of the borrowings on an effective interest basis. Interest on the loans is
accrued at the contracted rate.
197ANNUAL REPORT 2013-14

CRACE JOINT VENTURE
(ABN 62 124 931 161)
NOTES TO THE FINANCIAL STATEMENTS
FOR THE YEAR ENDED 30 JUNE 2014
8
1. Significant accounting policies (continued)
(l) Trade and other payables
Trade and other payables are stated at cost. Liabilities are recognised for amounts to be paid in the
future for goods and services received. Trade accounts are normally settled within 30 days.
Revenue received in advance of services performed is recorded as unearned revenue.
(m) Bonds from purchasers
On settlement, purchasers of land at Crace are required to provide a cash bond or bank guarantee
in the amount of $5,000 or $7,500 as security for the performance of the purchaser’s obligations
under the contract for sale (“Compliance bond”). Upon the purchaser completing construction of a
dwelling in accordance with the terms of the contract for sale, the compliance bond will be refunded
to the purchaser. Compliance bond monies received are banked into a separate bank account
maintained by the Joint Venture. As the monies are held in trust for the purchasers, they have not
been brought to account as an asset of the Joint Venture. As at 30 June 2014 the balance of
compliance bond monies was $2,445,000 (2013: $2,206,500).
(n) Financial instruments
Non-derivative financial instruments
Non-derivative financial instruments comprise trade and other receivables, cash and cash
equivalents, borrowings and trade and other payables. Non-derivative financial instruments are
recognised initially at fair value plus any directly attributable transaction costs. Subsequent to initial
recognition non-derivative financial instruments are measured as described below.
A financial instrument is recognised if the Joint Venture becomes a party to the contractual
provisions of the instrument. Financial assets are derecognised if the Joint Venture’s contractual
rights to the cash flows from the financial assets expire, or if the Joint Venture transfers the financial
asset to another party without retaining control or substantially all risks and rewards of the asset.
Regular way purchases and sales of financial assets are accounted for at trade date, which is the
date the Joint Venture commits itself to purchase or sell the asset. Financial liabilities are
derecognised if the Joint Venture’s obligations specified in the contract expire or are discharged or
cancelled.
Financial assets and liabilities are offset and the net amount presented in the statement of financial
position when, and only when, the Joint Venture has a legal right to offset the amounts and intends
either to settle on a net basis or to realise the asset and settle the liability simultaneously.
Cash and cash equivalents comprise cash balances and term deposits. Accounting for finance
income and expenses is discussed in Note 1(c)(ii).
Non-derivative financial instruments are measured at amortised cost using the effective interest
method, less any impairment losses.
198 LAND DEVELOPMENT AGENCY
Sec
tion
AS
ectio
n B
Sec
tion
CS
ectio
n D
Sec
tion
ES
ectio
n F
CRACE JOINT VENTURE
(ABN 62 124 931 161)
NOTES TO THE FINANCIAL STATEMENTS
FOR THE YEAR ENDED 30 JUNE 2014
9
1. Significant accounting policies (continued)
(o) Government grants
Government grants that compensate the Joint Venture for expenses incurred are recognised in
profit or loss as other income on a systematic basis in the same periods in which the expenses are
recognised.
(p) New standards and interpretations not yet adopted
There are no standards, amendments to standards and interpretations that may impact the Joint
Venture in the period of initial application available for early adoption at 30 June 2014, that have
been applied in preparing these financial statements.
2. Financial risk management
Overview
The Joint Venture has exposure to the following risks from its use of financial instruments:
• Credit risk
• Liquidity risk
• Interest rate risk
This note discloses information about the Joint Venture’s exposure to each of the above risks, their
objectives, policies and processes for measuring and managing risk and the management of capital.
Further quantitative disclosures are included throughout these financial statements.
The Joint Venture Management Committee has overall responsibility for the establishment and
oversight of the risk management framework.
Risk management policies are established to identify and analyse the risk faced by the Joint Venture, to
set appropriate risk limits and controls and to monitor these risks. Risk management policies and
systems are reviewed regularly to reflect changes in market conditions and the Joint Venture’s
activities. The Joint Venture aims to develop a disciplined and constructive control environment in
which all parties understand their roles and obligations.
199ANNUAL REPORT 2013-14

CRACE JOINT VENTURE
(ABN 62 124 931 161)
NOTES TO THE FINANCIAL STATEMENTS
FOR THE YEAR ENDED 30 JUNE 2014
10
2. Financial risk management (continued)
Credit risk
Credit risk arises from the financial assets of the Joint Venture, which comprise cash and cash
equivalents and trade and other receivables. The Joint Venture’s exposure to credit risk is the risk of
financial loss if a customer fails to meet its contractual obligations, and arises principally from the Joint
Venture’s receivables from customers. The Joint Venture does not hold any credit derivatives to offset
its credit exposure.
The Joint Venture only trades with recognised, creditworthy third parties, and as such collateral is not
required, nor is it the Joint Venture’s policy to securitise its trade and other receivables.
In addition, receivable balances are monitored on an ongoing basis with the result that the Joint
Venture’s exposure to bad debts is not significant.
With the exception of the following, the Joint Venture does not have any material credit risk exposure to
any single receivable or group of receivables:
• Receivable from the Land Development Agency $nil (30 June 2013: $2,494,332).
Receivables owing by the Land Development Agency are bound by the terms of the Joint Venture
Agreement which requires that proceeds from development services provided are remitted to the Joint
Venture within 5 working days, thus resulting in an insignificant exposure to bad debts.
Liquidity risk
Liquidity risk is the risk that the Joint Venture will not be able to meet its financial obligations as they fall
due. The Joint Venture’s approach to managing liquidity risk is to ensure, as far as possible, that it will
always have sufficient liquidity to meet its liabilities when due, without incurring unacceptable losses or
risking damage to the Joint Venture’s reputation.
Typically, the Joint Venture ensures that it has sufficient cash on demand to meet expected operational
expenses, including the servicing of financial obligations through completion of cash flow forecasts on a
regular basis. This excludes the potential impact of extreme circumstances that cannot reasonably be
predicted.
The Joint Venture’s objective is to maintain a balance between the continuity of funding and flexibility
through the use of borrowings.
200 LAND DEVELOPMENT AGENCY

Sec
tion
AS
ectio
n B
Sec
tion
CS
ectio
n D
Sec
tion
ES
ectio
n F
CRACE JOINT VENTURE
(ABN 62 124 931 161)
NOTES TO THE FINANCIAL STATEMENTS
FOR THE YEAR ENDED 30 JUNE 2014
11
2. Financial risk management (continued)
Interest rate risk
Interest rate risk is the risk that the fair value of future cash flows of a financial instrument will fluctuate
because of changes in market interest rates.
The Joint Venture’s exposure to market interest rates relates primarily to the Joint Venture’s debt
obligations. The composition of the borrowings in line with market interest rates is reviewed on a regular
basis by the Joint Venture to reduce exposure to risk.
At balance date the Joint Venture had cash and cash equivalents of $3,606,066 and borrowings of $nil
exposed to Australian variable interest rates risk that are not designated in cash flow hedges.
3. Segment reporting
The Joint Venture operates in one business segment being the provision of development services. The
Joint Venture’s operations are located in Canberra, Australia only.
4. Auditor’s remuneration
2014 2013
Audit services $ $
Auditor of the Joint Venture
ACT Auditor-General:
Audit of the financial statements 13,573 23,240
13,573 23,240
No other services were provided by the ACT Auditor-General.
5. Other income
Housing Affordability Funding grant 914,025 3,849,307
Forfeited deposits/bonds 33,946 101,454
Other 4,638 -
952,609 3,950,761
201ANNUAL REPORT 2013-14
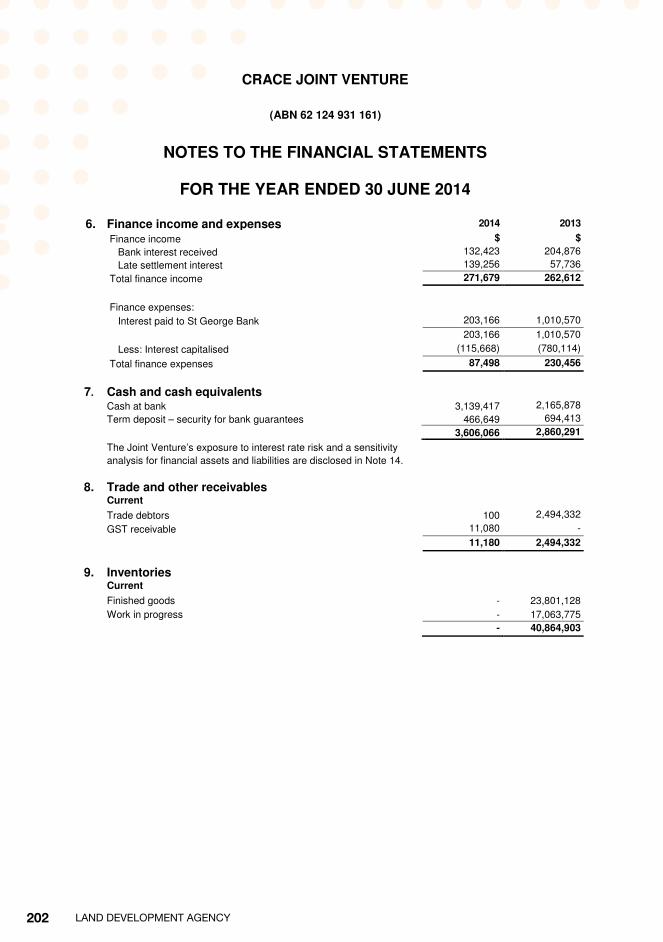
CRACE JOINT VENTURE
(ABN 62 124 931 161)
NOTES TO THE FINANCIAL STATEMENTS
FOR THE YEAR ENDED 30 JUNE 2014
12
6. Finance income and expenses 2014 2013
Finance income $ $
Bank interest received 132,423 204,876
Late settlement interest 139,256 57,736
Total finance income 271,679 262,612
Finance expenses:
Interest paid to St George Bank 203,166 1,010,570
203,166 1,010,570
Less: Interest capitalised (115,668) (780,114)
Total finance expenses 87,498 230,456
7. Cash and cash equivalents
Cash at bank 3,139,417 2,165,878
Term deposit – security for bank guarantees 466,649 694,413
3,606,066 2,860,291
The Joint Venture’s exposure to interest rate risk and a sensitivity
analysis for financial assets and liabilities are disclosed in Note 14.
8. Trade and other receivables Current
Trade debtors 100 2,494,332
GST receivable 11,080 -
11,180 2,494,332
9. Inventories
Current
Finished goods - 23,801,128
Work in progress - 17,063,775
- 40,864,903
202 LAND DEVELOPMENT AGENCY

Sec
tion
AS
ectio
n B
Sec
tion
CS
ectio
n D
Sec
tion
ES
ectio
n F
CRACE JOINT VENTURE
(ABN 62 124 931 161)
NOTES TO THE FINANCIAL STATEMENTS
FOR THE YEAR ENDED 30 JUNE 2014
13
10. Property, plant and equipment
Buildings Office Fitout Total
Cost $ $ $
Balance 1 July 2012 463,921 174,632 638,553
Additions 198,723 - 198,723
Balance 30 June 2013 662,644 174,632 837,276
Balance 1 July 2013 662,644 174,632 837,276
Disposals (662,644) (174,632) (837,276)
Balance 30 June 2014 - - -
Depreciation
Balance 1 July 2012 301,316 111,512 412,828
Depreciation for the period 142,328 34,928 177,256
Balance 30 June 2013 443,644 146,439 590,084
Balance 1 July 2013 443,644 146,439 590,084
Depreciation for the period 219,000 28,193 247,192
Write back on disposal (662,644) (174,632) (837,276)
Balance 30 June 2014 - - -
Carrying amounts
At 1 July 2012 162,605 63,120 225,725
At 30 June 2013 218,999 28,193 247,192
At 1 July 2013 218,999 28,193 247,192
At 30 June 2014 - - -
203ANNUAL REPORT 2013-14

CRACE JOINT VENTURE
(ABN 62 124 931 161)
NOTES TO THE FINANCIAL STATEMENTS
FOR THE YEAR ENDED 30 JUNE 2014
14
11. Trade and other payables 2014 2013
Current liabilities $ $
Trade payables 9,903 29,642
GST payable - 983,803
Unearned revenue - 900,389
Accrued expenses 39,846 1,179,665
Accrued development expenses 1,714,254 3,788,918
1,764,003 6,882,417
The Joint Venture’s exposure to liquidity risk related to trade and other payables is disclosed in Note 14.
Accrued development expenses relate to development expenses for stages that have registered but the
development works have not yet been completed or invoiced. The accrual is calculated with reference to
the cost to complete development activities based on the budget for each stage.
12. Borrowings
This note provides information about the contractual terms of the Joint Venture’s interest-bearing loans
and borrowings. Current liabilities Construction loan (secured) - 9,965,875
Total - 9,965,875
Financing arrangements The Joint Venture established a construction loan facility of $35.4 million with St George Bank to fund its
staged works. This facility was secured by a first registered real property mortgage by the Land Development Agency over the leasehold interest in the land at Crace and by a floating charge over the assets and undertakings of Crace Developments Pty Limited. The facility was repaid in full during the period. The amount of the facility used at 30 June 2013 was $9,965,875. A guarantee facility for $2.8 million was established with St George Bank which expired on 30 April 2014. This facility was secured by a first registered real property mortgage by Land Development Agency over the leasehold interest in the land at Crace and by a fixed and floating charge over the assets and undertaking of Crace Developments Pty Limited. The amount of the facilities used at 30 June 2013 was $2 million.
An insurance bond facility for $6.0 million has been established with Asset Insure expiring 31 August 2014. The facility is secured by a Deed of Indemnity and Guarantee in favour of the Surety by Crace JV, Crace Developments Pty Ltd, CIC Australia Limited, Community Housing Canberra Limited and Tatebrook Pty Ltd. The amount of the facility used at 30 June 2014 was $1,654,571 (30 June 2013: $1,900,890).
204 LAND DEVELOPMENT AGENCY
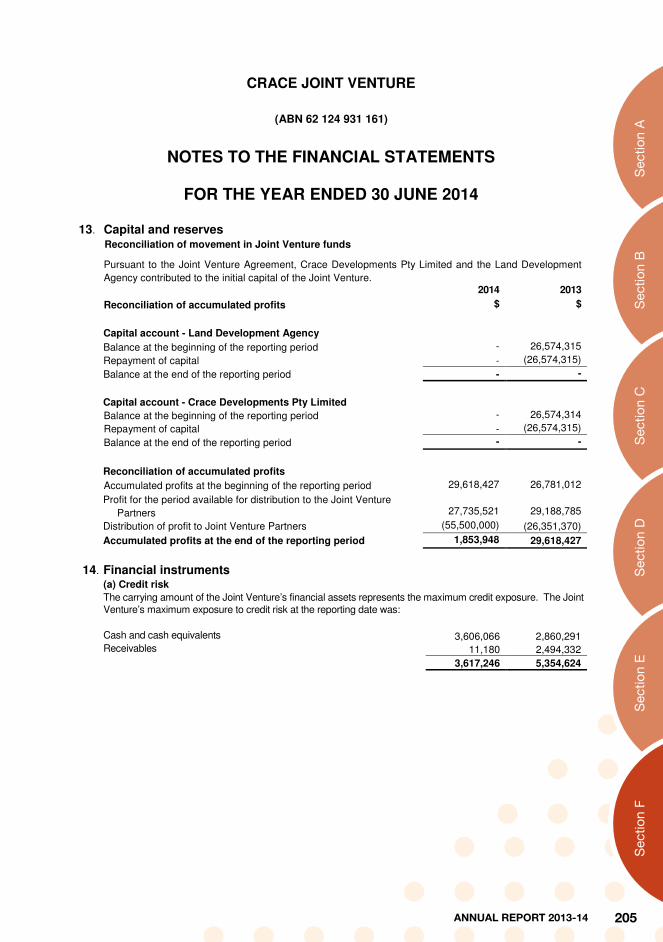
Sec
tion
AS
ectio
n B
Sec
tion
CS
ectio
n D
Sec
tion
ES
ectio
n F
CRACE JOINT VENTURE
(ABN 62 124 931 161)
NOTES TO THE FINANCIAL STATEMENTS
FOR THE YEAR ENDED 30 JUNE 2014
15
13. Capital and reserves Reconciliation of movement in Joint Venture funds
Pursuant to the Joint Venture Agreement, Crace Developments Pty Limited and the Land Development
Agency contributed to the initial capital of the Joint Venture.
2014 2013
Reconciliation of accumulated profits $ $
Capital account - Land Development Agency Balance at the beginning of the reporting period - 26,574,315
Repayment of capital - (26,574,315)
Balance at the end of the reporting period - -
Capital account - Crace Developments Pty Limited
Balance at the beginning of the reporting period - 26,574,314
Repayment of capital - (26,574,315)
Balance at the end of the reporting period - -
Reconciliation of accumulated profits
Accumulated profits at the beginning of the reporting period 29,618,427 26,781,012
Profit for the period available for distribution to the Joint Venture
Partners
27,735,521
29,188,785
Distribution of profit to Joint Venture Partners (55,500,000) (26,351,370)
Accumulated profits at the end of the reporting period 1,853,948 29,618,427
14. Financial instruments (a) Credit risk
The carrying amount of the Joint Venture’s financial assets represents the maximum credit exposure. The Joint Venture’s maximum exposure to credit risk at the reporting date was: Cash and cash equivalents 3,606,066 2,860,291 Receivables 11,180 2,494,332
3,617,246 5,354,624
205ANNUAL REPORT 2013-14

CRACE JOINT VENTURE
(ABN 62 124 931 161)
NOTES TO THE FINANCIAL STATEMENTS
FOR THE YEAR ENDED 30 JUNE 2014
16
14. Financial instruments (continued) (a) Credit risk (continued)
The Joint Venture’s maximum exposure to credit risk for trade receivables at reporting date were all located
within Australia. Based on historic default rates, the Joint Venture believes no impairment allowance is
necessary in respect of trade receivables not past due date. The aging of the Joint Venture’s trade receivables
at the reporting date was:
2014 2013
$ $
Not past due 11,180 2,494,332
11,180 2,494,332
(b) Liquidity risk
The followings are the contractual maturities of financial liabilities, including estimated interest payments.
Carrying amount Contractual cash flows
6 months or less
$ $ $
30 June 2014
Trade and other payables 1,764,003 (1,764,003) (1,764,003)
1,764,003 (1,764,003) (1,764,003)
Carrying amount Contractual cash flows
6 months or less
$ $ $
30 June 2013
Secured loan: Construction loan 9,965,875 (10,224,496) 10,224,496
Trade and other payables 6,882,417 (6,882,417) (6,882,417)
16,848,291 (17,106,913) 3,342,079
206 LAND DEVELOPMENT AGENCY

Sec
tion
AS
ectio
n B
Sec
tion
CS
ectio
n D
Sec
tion
ES
ectio
n F
CRACE JOINT VENTURE
(ABN 62 124 931 161)
NOTES TO THE FINANCIAL STATEMENTS
FOR THE YEAR ENDED 30 JUNE 2014
17
14. Financial instruments (continued) (c) Interest rate risk
Profile
At the reporting date the interest rate profile of the Joint Venture’s interest-bearing financial instruments
was: 2014 2013
$ $ Variable rate instruments Cash and cash equivalents 3,606,066 2,860,291 Construction loans (secured) - (9,965,875)
3,606,066 (7,105,583)
Fair value sensitivity analysis for fixed rate instruments
The Joint Venture does not account for any fixed rate financial liabilities at fair value through profit or
loss. Therefore a change in interest rates at the reporting date would not affect profit or loss.
Cash flow sensitivity analysis for variable rate instruments
A change of 100 basis points in interest rates at the reporting date would have increased/(decreased)
equity and profit or loss by the amounts shown below. This analysis assumes that all other variables
remain constant.
Profit or loss Equity 100bp
Increase
100bp
Decrease
100bp
Increase
100bp
Decrease $ $ $ $ 30 June 2014 Variable rate instruments – cash flow sensitivity 30,460 (30,460) 30,460 (30,460) 30 June 2013 Variable rate instruments – cash flow sensitivity (63,773) 63,773 (63,773) 63,773
Fair values
Fair values versus carrying amounts
The fair value of cash at bank, receivables, trade and other payables and borrowings approximates
the values shown in the statement of financial position and notes thereto.
207ANNUAL REPORT 2013-14

CRACE JOINT VENTURE
(ABN 62 124 931 161)
NOTES TO THE FINANCIAL STATEMENTS
FOR THE YEAR ENDED 30 JUNE 2014
18
15. Reconciliation of net cash from operating activities 2014 2013
$ $
Net profit from ordinary activities 27,735,521 29,188,785
Depreciation 247,192 177,254
Net interest (68,513) 747,959
Changes in assets and liabilities:
Decrease/(increase) in trade and other receivables 2,493,527 (2,328,007)
Decrease in inventories 40,749,235 62,232,296
Decrease in prepayments - 2,000
(Decrease) in trade and other payables (4,229,104) (1,168,176)
(Decrease) in unearned revenue (900,389) (812,583)
Net cash from operating activities 66,027,469 88,039,530
16. Commitments There are no commitments that do not relate to the purchase or development of inventory.
17. Related parties Joint Venture Partners
The names of the partners who formed the Joint Venture are:
Land Development Agency (50%)
Crace Developments Pty Limited (50%)
Crace Developments Pty Limited is owned 80% by CIC Australia Limited, 10% by Defence Housing
Australia, 5% by Community Housing Canberra Limited and 5% by Tatebrook Pty Limited.
CIC Crace Pty Limited is the project manager of Crace Joint Venture and is 100% owned by CIC Australia
Limited. Crace Realty Pty Limited is the sales agent for Crace Joint Venture an is 100% owned by CIC
Crace Pty Ltd.
The members of the Joint Venture Management Committee are:
John Graham (Independent Chairman) - Resigned 13 December 2013
Chris Reynolds (Land Development Agency)
Tom Gordon (Land Development Agency)
Melanie Andrews (Crace Developments)
Colin Alexander (Crace Developments)
No remuneration was paid to any members of the Joint Venture Management Committee by the Joint
Venture other than Chairman’s fees totalling $10,000 (2013: $20,000) paid or payable to John Graham.
208 LAND DEVELOPMENT AGENCY

Sec
tion
AS
ectio
n B
Sec
tion
CS
ectio
n D
Sec
tion
ES
ectio
n F
CRACE JOINT VENTURE
(ABN 62 124 931 161)
NOTES TO THE FINANCIAL STATEMENTS
FOR THE YEAR ENDED 30 JUNE 2014
19
17. Related parties (continued) 2014 2013
Transactions with related parties during the financial year: $ $
Management fees paid or payable to CIC Crace Pty Limited 700,481 1,470,000
Services provided to Land Development Agency 44,754,288 91,411,437
Commissions paid or payable to Crace Realty Pty Limited 1,871,258 2,819,330
Housing affordability funding from Land Development Agency 914,025 3,849,307
Consultant time paid or payable to CIC Crace Pty Limited 91,858 156,162
Payable owing to CIC Crace Pty Limited at period end 7,090 19,576
Payable owing to CIC Australia Limited at period end 2,029 2,554
Payable owing to Crace Developments Pty Limited at period end - 7,510
Receivable owing from Land Development Agency at period end 100 2,494,332
Maintenance services provided by CIC Australia Limited 1,258 -
All transactions with related parties are at arm’s length. 18. Subsequent events
Since the end of the financial year, there has not arisen any event, item or transaction of a material and
unusual nature likely, in the opinion of the Management Committee, to affect significantly the operations of
the Joint Venture.
19. Contingent liabilities
As at 30 June 2014 the Joint Venture has no known contingent liabilities.
209ANNUAL REPORT 2013-14

210 LAND DEVELOPMENT AGENCY

Sec
tion
AS
ectio
n B
Sec
tion
CS
ectio
n D
Sec
tion
ES
ectio
n F
211ANNUAL REPORT 2013-14

212 LAND DEVELOPMENT AGENCY

Sec
tion
AS
ectio
n B
Sec
tion
CS
ectio
n D
Sec
tion
ES
ectio
n F
Forde Joint Venture ABN: 78 474 859 392
Financial Statements
for the year ended 30 June 2014
213ANNUAL REPORT 2013-14

Contents
Page
Financial statements
Statement of profit or loss and other comprehensive income 1
Statement of changes in equity 1
Statement of financial position 2
Statement of cash flows 3
Notes to the financial statements 4
Declaration by the Joint Venture Partners 21
Independent auditor’s report 22
214 LAND DEVELOPMENT AGENCY

Sec
tion
AS
ectio
n B
Sec
tion
CS
ectio
n D
Sec
tion
ES
ectio
n F
FORDE JOINT VENTURE
(ABN 78 474 859 392)
1
Statement of profit or loss and other comprehensive income For the year ended 30 June 2014
Note 2014 2013
No. $ $
Revenue - 22,323,460
Cost of development services 927,069 (1,910,799)
Gross profit 927,069 20,412,661
Other income 5 195,863 540,295
Other expenses 5 (213,325) (1,199,202)
Administrative expenses (14,796) (26,609)
Impairment expenses (5,849,575) -
(Loss) / profit from operating activities (4,954,764) 19,727,145
Finance income 6 50,021 338,993
Net finance income 50,021 338,993
(Loss) / profit for the reporting period (4,904,743) 20,066,138
Total comprehensive (loss) / income for the period
available for distribution to Joint Venture Partners
(4,904,743)
20,066,138
Statement of changes in equity For the year ended 30 June 2014
Note 2014 2013
No. $ $
Total equity at the beginning of the reporting period 9,432,032 2,865,894
(Loss) / profit for the reporting period 12 (4,904,743) 20,066,138
Distribution of profit to Joint Venture Partners 12 (3,500,000) (13,500,000)
Total equity at the end of the reporting period 1,027,289 9,432,032
The above statement of profit or loss and other comprehensive income and statement of changes in equity
should be read in conjunction with the accompanying notes.
215ANNUAL REPORT 2013-14

FORDE JOINT VENTURE
(ABN 78 474 859 392)
2
Statement of financial position
As at 30 June 2014
Note 2014 2013
No. $ $
Assets
Cash and cash equivalents 7 1,235,676 3,375,383
Trade and other receivables 8 585,745 10,762,500
Other assets 9 - 9,989
Total current assets 1,821,421 14,147,872
Plant and equipment 10 - 610
Total non-current assets - 610
Total assets 1,821,421 14,148,482
Liabilities
Trade and other payables 11 794,132 4,716,450
Total current liabilities 794,132 4,716,450
Total liabilities 794,132 4,716,450
Net assets 1,027,289 9,432,032
Joint Venture equity
Capital account – Land Development Agency 12 - -
Capital account – Forde Developments Pty Limited 12 - -
Accumulated funds 12 1,027,289 9,432,032
Total Joint Venture equity 1,027,289 9,432,032
The above statement of financial position should be read in conjunction with the accompanying notes.
216 LAND DEVELOPMENT AGENCY

Sec
tion
AS
ectio
n B
Sec
tion
CS
ectio
n D
Sec
tion
ES
ectio
n F
FORDE JOINT VENTURE
(ABN 78 474 859 392)
3
Statement of cash flows
For the year ended 30 June 2014
Note 2014 2013 No. $ $ Cash flows from operating activities Cash receipts in the course of operations 4,921,966 13,961,049
Cash payments in the course of operations (3,616,239) (9,469,611)
Net cash provided by operating activities 14 1,305,727 4,491,438
Cash flows from investing activities Proceeds from sales of plant and equipment 5,452 - Interest received 60,010 346,185
Net cash provided by investing activities 65,462 346,185
Cash flows from financing activities Distributions to Joint Venture Partners (3,500,000) (13,500,000)
Net cash (used in) financing activities (3,500,000) (13,500,000)
Net (decrease) in cash and cash equivalents (2,139,707) (8,662,377)
Cash and cash equivalents at beginning of reporting period 3,375,383 12,037,760
Cash and cash equivalents at end of reporting period 1,235,676 3,375,383
Reconciliation of cash and cash equivalents:
Cash at bank 7 14,412 1,354,201 Term deposits – security for bank guarantees 7 1,221,264 2,021,182
1,235,676 3,375,383
The above statement of cash flows should be read in conjunction with the accompanying notes.
217ANNUAL REPORT 2013-14

FORDE JOINT VENTURE
(ABN 78 474 859 392)
NOTES TO THE FINANCIAL STATEMENTS
FOR THE YEAR ENDED 30 JUNE 2014
4
1. Significant accounting policies
The Forde Joint Venture (the “Joint Venture”) is a joint venture domiciled in Australia. The Joint Venture
was formed to develop the land in the suburb known as Forde in the Australian Capital Territory.
During the year ended 30 June 2010 the Joint Venture agreement was extended to include the
development of land in Forde North in the Australian Capital Territory.
(a) Going concern
In the period ending 30 June 2014, the Joint Venture provided development services to the last
stage of the project.
It is currently the intention of the Joint Venture Management Committee that, in the absence of any
other joint venture opportunities, the Joint Venture be dissolved following the completion of the
project. This is expected to occur within 12 months from the date of signing the financial
statements. Accordingly all assets and liabilities have been presented as current.
(b) Statement of compliance
The financial statements are general purpose financial statements which have been prepared in
accordance with Australian Accounting Standards (“AASBs”) (including Australian Accounting
Interpretations) adopted by the Australian Accounting Standards Board (AASB). The financial
statements of the Joint Venture comply with the International Financial Reporting Standards
(IFRSs) and interpretations adopted by the International Accounting Standards Board.
The financial statements were approved by the Joint Venture Management Committee on 17
September 2014.
(c) Basis of preparation
The financial statements of the Joint Venture are general purpose financial statements to comply
with the requirements of the “Joint Venture Agreement Forde Estate” (the “Joint Venture
Agreement”) and for distribution to Joint Venture Partners.
The financial statements are presented in Australian dollars. The financial statements are prepared
on the historical cost basis.
The preparation of financial statements in conformity with Australian Accounting Standards requires
management to make judgements, estimates and assumptions that affect the application of policies
and reported amounts of assets and liabilities, income and expenses. The estimates and associated
assumptions are based on historical experience and various other factors that are believed to be
reasonable under the circumstances, the results of which form the basis of making judgements
about carrying values of assets and liabilities that are not readily apparent from other sources.
Actual results may differ from these estimates.
These accounting policies have been consistently applied by the Joint Venture.
218 LAND DEVELOPMENT AGENCY

Sec
tion
AS
ectio
n B
Sec
tion
CS
ectio
n D
Sec
tion
ES
ectio
n F
FORDE JOINT VENTURE
(ABN 78 474 859 392)
NOTES TO THE FINANCIAL STATEMENTS
FOR THE YEAR ENDED 30 JUNE 2014
5
1. Significant accounting policies (continued)
(d) Significant accounting judgments and estimates
The estimates and underlying assumptions are reviewed on an ongoing basis. Revisions to
accounting estimates are recognised in the period in which the estimate is revised if the revision
affects only that period or in the period of the revision and future periods if the revision affects both
current and future periods.
Allowance for impairment losses
Under the Joint Venture Development Agreement, all revenue from Forde land sales must be paid
to the Joint Venture. As a result, any refund of Goods and Services Tax (GST) received by the
Land Development Agency (LDA) from the Australia Taxation Office (ATO) is paid to the Joint
Venture. LDA has claimed refund from the ATO related to overpaid GST on Forde land sales. As
per the Development Agreement these funds are owed to the Joint Venture.
Note 8: ‘Trade and other receivables’ discloses a receivable of $5,849,575 from the Land
Development Agency relating to the refund of overpaid GST on land sales claimed. The ATO
investigation into this matter is yet to be completed at the date of this report. However, the initial
assessment by the ATO is that the LDA is not entitled to claim the refunds for overpaid GST for
Forde land sales and these refunds will therefore be disallowed.
The joint Venture considers that this initial assessment, by the ATO, provides objective evidence of
impairment of amounts receivable from the LDA. As disclosed in Note 8: Trade and other
receivables, the Joint Venture has therefore recognised an allowance for impairment loss of
$5,849,575.
Contingent liabilities and contingent assets
The Joint Venture recorded a receivable of $10,702,095 relating to GST refunds claimed by the
Land Development Agency on land sales in 2010-11 and 2011-12 that were passed on the Joint
Venture. In 2013-14, the Joint Venture received $4,035,177 from the Land Development Agency
as refunds from the Australian Taxation Office.
The Australian Taxation Office has not indicated, in its initial assessment referred to in “Allowance
for impairment losses” above, whether GST refunds already paid by the ATO to the LDA are also
to be refunded.
As disclosed in Note 19: ‘Contingent assets and liabilities’, the Joint Venture may be required to
return up to a maximum of $14,282,432 to the LDA if GST refunds already paid by the ATO to the
LDA and passed on to the Joint Venture are also to be refunded.
If the Joint Venture were to be required to refund these amounts, then the Joint Venture would
need to receive contributions from the Joint Venture partners to pay for the refunds. Therefore, the
Joint Venture has disclosed a contingent asset in Note 19.
219ANNUAL REPORT 2013-14

FORDE JOINT VENTURE
(ABN 78 474 859 392)
NOTES TO THE FINANCIAL STATEMENTS
FOR THE YEAR ENDED 30 JUNE 2014
6
1. Significant accounting policies (continued)
(d) Significant accounting judgments and estimates (continued)
Accrued development costs
The most significant estimate used in the preparation of the financial statements relates to accrued
development costs. Further information on the basis of this estimate is included in Note 11 –
Trade and other payables.
(e) Revenue/expenses
(i) Revenue recognition
Revenue from the provision of services for the development of land is recognised when the
Land Development Agency settles the land and title is transferred to the end purchaser.
(ii) Finance income/expenses
Financial income comprises interest receivable on funds invested. Interest income is
recognised in the statement of comprehensive income as it accrues, using the effective interest
method.
Interest payable on borrowings is calculated using the effective interest method. Interest is
expensed as incurred unless it relates to a qualifying asset. In these circumstances, borrowing
costs are capitalised to the cost of the asset, using a weighted average capitalisation rate.
(f) Income tax
The Joint Venture is a non-taxable entity.
(g) Goods and services tax
Revenue, expenses and assets are recognised net of the amount of goods and services tax (GST),
except where the amount of GST incurred is not recoverable from the Australian Taxation Office
(ATO). In these circumstances, the GST is recognised as part of the cost of acquisition of the asset
or as part of the expense.
Receivables and payables are stated inclusive of GST. The net amount of GST recoverable from,
or payable to, the ATO is included as a current asset or liability in the statement of financial position.
Cash flows are included in the statement of cash flows GST inclusive. The GST components of
cash flows arising from investing and financing activities which are recoverable from, or payable to,
the ATO are classified as operating cash flows.
(h) Cash and cash equivalents
Cash and cash equivalents in the statement of financial position comprise cash at bank and term
deposits. For the purposes of the statement of cash flows, cash and cash equivalents consist of
cash at bank and short-term deposits with an original maturity of three months or less held as
security for guarantees.
220 LAND DEVELOPMENT AGENCY

Sec
tion
AS
ectio
n B
Sec
tion
CS
ectio
n D
Sec
tion
ES
ectio
n F
FORDE JOINT VENTURE
(ABN 78 474 859 392)
NOTES TO THE FINANCIAL STATEMENTS
FOR THE YEAR ENDED 30 JUNE 2014
7
1. Significant accounting policies (continued)
(i) Trade and other receivables
Trade and other receivables are stated at their cost less any allowance for impairment losses (see
Note 1(k).
(j) Plant and equipment
(i) Recognition and measurement
Items of plant and equipment are measured at cost less accumulated depreciation and any
impairment losses. Cost includes expenditures that are directly attributable to the acquisition
of the asset.
Where parts of an item of plant and equipment have different useful lives, they are accounted
for as separate items of plant and equipment.
Gains and losses on disposal of an item of plant and equipment are determined by comparing
the proceeds from disposal with the carrying amount of the plant and equipment and are
recognised net within “other income” in the statement of comprehensive income.
(ii) Subsequent costs
The cost of replacing part of an item of plant and equipment is recognised in the carrying
amount of the item if it is probable that the future economic benefits embodied within the part
will flow to the Joint Venture and its cost can be measured reliably. The costs of day-to-day
servicing of property, plant and equipment are recognised as an expense in the Statement of
Comprehensive Income as incurred.
(iii) Depreciation
Items for depreciation are plant and equipment and the construction and fit out of the Forde
sales and project office.
Depreciation is recorded as an expense in the statement of comprehensive income on a
straight-line basis over the estimated useful life of each part of an item of plant and equipment.
The estimated useful lives in the current and comparative periods are as follows:
Plant and equipment 2-5 years
Office fitout 2-5 years
Depreciation methods, useful lives and residual values are reassessed annually at each
reporting date.
221ANNUAL REPORT 2013-14

FORDE JOINT VENTURE
(ABN 78 474 859 392)
NOTES TO THE FINANCIAL STATEMENTS
FOR THE YEAR ENDED 30 JUNE 2014
8
1. Significant accounting policies (continued)
(k) Impairment
The carrying amounts of the Joint Venture’s assets, are reviewed at each balance sheet date to
determine whether there is any indication of impairment. If any such indication exists, the asset’s
recoverable amount is estimated (see Note 1(j)(i)).
An impairment loss is recognised whenever the carrying amount of an asset or its cash-generating
unit exceeds its recoverable amount. Impairment losses are recognised in the statement of
comprehensive income.
(i) Calculation of recoverable amount
Impairment of receivables is recognised when there is objective evidence that a loss event has
occurred. Receivables are individually assessed for impairment. The recoverable amount of
receivables is calculated as the difference between the carrying amount and the present value
of estimated future cash flows discounted at the asset’s effective interest rate. Receivables
with a short duration are not discounted.
(ii) Reversals of impairment
In respect of receivables and plant and equipment, an impairment loss is reversed if there has
been a change in the estimates used to determine the recoverable amount. An impairment loss
is reversed only to the extent that the asset’s carrying amount does not exceed the carrying
amount that would have been determined, net of depreciation or amortisation, if no impairment
loss had been recognised.
(l) Trade and other payables
Trade and other payables are stated at cost. Liabilities are recognised for amounts to be paid in the
future for goods and services received. Trade accounts are normally settled within 30 days.
(m) Bonds from purchasers
On settlement, purchasers of land at Forde are required to provide a cash bond or bank guarantee
in the amount of $2,500 as security for the performance of the purchaser’s obligations under the
contract for sale (“Compliance bond”). Upon the purchaser completing construction of a dwelling in
accordance with the terms of the contract for sale, the compliance bond will be refunded to the
purchaser. Compliance bond monies received are banked into a separate bank account maintained
by the Joint Venture. As the monies are held in trust for the purchasers, they have not been brought
to account as an asset of the Joint Venture. As at 30 June 2014 the balance of compliance bond
monies was $665,000 (2013: $832,500).
222 LAND DEVELOPMENT AGENCY

Sec
tion
AS
ectio
n B
Sec
tion
CS
ectio
n D
Sec
tion
ES
ectio
n F
FORDE JOINT VENTURE
(ABN 78 474 859 392)
NOTES TO THE FINANCIAL STATEMENTS
FOR THE YEAR ENDED 30 JUNE 2014
9
1. Significant accounting policies (continued)
(n) Financial instruments
Non-derivative financial instruments
Non-derivative financial instruments comprise trade and other receivables, cash and cash
equivalents and trade and other payables. Non-derivative financial instruments are recognised
initially at fair value plus any directly attributable transaction costs. Subsequent to initial recognition
non-derivative financial instruments are measured as described below.
A financial instrument is recognised if the Joint Venture becomes a party to the contractual
provisions of the instrument. Financial assets are derecognised if the Joint Venture’s contractual
rights to the cash flows from the financial assets expire, or if the Joint Venture transfers the financial
asset to another party without retaining control or substantially all risks and rewards of the asset.
Financial liabilities are derecognised if the Joint Venture’s obligations specified in the contract expire
or are discharged or cancelled.
Cash and cash equivalents comprise cash balances and term deposits. Accounting for finance
income and expenses is discussed in Note 1(e)(ii).
Non-derivative financial instruments are measured at amortised cost using the effective interest
method, less any impairment losses.
(o) New standards and interpretations not yet adopted
There are no standards, amendments to standards and interpretations that may impact the Joint
Venture in the period of initial application available for early adoption at 30 June 2014, that have
been applied in preparing these financial statements.
223ANNUAL REPORT 2013-14

FORDE JOINT VENTURE
(ABN 78 474 859 392)
NOTES TO THE FINANCIAL STATEMENTS
FOR THE YEAR ENDED 30 JUNE 2014
10
2. Financial risk management
Overview
The Joint Venture has exposure to the following risks from its use of financial instruments:
• Credit risk
• Liquidity risk
• Interest rate risk
This note represents information about the Joint Venture’s exposure to each of the above risks, the Joint
Venture’s objectives, policies and processes for measuring and managing risk and the management of
capital. Further quantitative disclosures are included throughout these financial statements.
The Joint Venture Management Committee has overall responsibility for the establishment and oversight
of the risk management framework.
Risk management policies are established to identify and analyse the risk faced by the Joint Venture, to
set appropriate risk limits and controls and to monitor these risks. Risk management policies and systems
are reviewed regularly to reflect changes in market conditions and the Joint Venture’s activities. The Joint
Venture aims to develop a disciplined and constructive control environment in which all parties understand
their roles and obligations.
Credit risk
Credit risk arises from the financial assets of the Joint Venture, which comprise cash and cash
equivalents, short-term deposits and trade and other receivables. As cash and cash equivalents and
short-term deposits are held with a financial institution, the Joint Ventures main exposure to credit risk is
the risk of financial loss if a customer fails to meet its contractual obligations, and arises principally from
the Joint Venture’s receivables from customers. The Joint Venture does not hold any credit derivatives to
offset its credit exposure.
The Joint Venture only trades with recognised, creditworthy third parties, and as such collateral is not
required nor is it the Joint Venture’s policy to securitise its trade and other receivables.
In addition, receivable balances are monitored on an ongoing basis with the result that the Joint Venture’s
exposure to bad debts is not significant.
The Joint Venture does not have any material credit risk exposure to any single receivable or group of
receivables.
224 LAND DEVELOPMENT AGENCY

Sec
tion
AS
ectio
n B
Sec
tion
CS
ectio
n D
Sec
tion
ES
ectio
n F
FORDE JOINT VENTURE
(ABN 78 474 859 392)
NOTES TO THE FINANCIAL STATEMENTS
FOR THE YEAR ENDED 30 JUNE 2014
11
2. Financial risk management (continued)
Liquidity risk
Liquidity risk is the risk that the Joint Venture will not be able to meet its financial obligations as they fall
due. The Joint Venture’s approach to managing liquidity risk is to ensure, as far as possible, that it will
always have sufficient liquidity to meet its liabilities when due, without incurring unacceptable losses or
risking damage to the Joint Venture’s reputation.
The Joint Venture ensures that it has sufficient cash on demand to meet expected operational expenses,
including the servicing of financial obligations through completion of cash flow forecasts on a regular
basis. This excludes the potential impact of extreme circumstances that cannot reasonably be predicted.
Interest rate risk
Interest rate risk is the risk that the fair value of future cash flows of a financial instrument will fluctuate
because of changes in market interest rates.
The Joint Venture’s exposure to market interest rates relates primarily to the Joint Venture’s cash at bank.
In order to maximise interest revenue, the Joint Venture deposits funds into high interest earning accounts
until it is needed for working capital requirements.
At balance date the Joint Venture had cash and cash equivalents and short-term deposits of $1,235,676
(including the security deposit for bank guarantees).
3. Segment reporting
The Joint Venture operates in the one business segment being the provision of development services.
The Joint Venture’s operations are located in Canberra, Australia only.
225ANNUAL REPORT 2013-14

FORDE JOINT VENTURE
(ABN 78 474 859 392)
NOTES TO THE FINANCIAL STATEMENTS
FOR THE YEAR ENDED 30 JUNE 2014
12
4. Auditor’s remuneration 2014 2013
Audit services
$ $
Auditor of the Joint Venture
ACT Auditor-General:
Audit of the financial statements 10,483 19,214
10,483 19,214
No other services were provided by the ACT Auditor-General.
5. Other income and expenses Other income
Forfeited deposits - 85,455
Profit on sale of assets 4,545 -
Revenue from Land Development Agency (362,503) 454,840
Adjustment to commission expense 143,931 -
Other income 409,890 -
Total other income 195,863 540,295
Other expenses
Guarantee fees (21,014) (51,811)
Legal fees for GST advice (190,826) (361,979)
Commissions - (715,021)
Selling and holding other (1,485) (70,391)
Total other expenses (213,325) (1,199,202)
6. Finance income and expenses
Finance income
Bank interest received 50,021 302,805
Late settlement interest received - 36,188
Total finance income 50,021 338,993
7. Cash and cash equivalents
Cash at bank 14,412 1,354,201
Term deposits 1,221,264 2,021,182
1,235,676 3,375,383
The Joint Venture’s exposure to interest rate risk and a sensitivity analysis for financial assets and liabilities
is disclosed in Note 13 Financial Instruments.
At 30 June 2014 the Joint Venture had guarantees in place which are secured by cash to the value of
$1,221,264 (2013: $2,009,821).
226 LAND DEVELOPMENT AGENCY

Sec
tion
AS
ectio
n B
Sec
tion
CS
ectio
n D
Sec
tion
ES
ectio
n F
FORDE JOINT VENTURE
(ABN 78 474 859 392)
NOTES TO THE FINANCIAL STATEMENTS
FOR THE YEAR ENDED 30 JUNE 2014
13
2014 2013
8. Trade and other receivables
$ $
Current
GST receivable from the Australian Taxation Office 585,745 60,405
Receivable from Land Development Agency 5,849,575 10,702,095
Less: Allowance for impairment losses (5,849,575) -
585,745 10,762,500
As at 30 June 2014, other receivables with an initial value of $5,849,575
were impaired and fully provided for. See below for the movements in the
allowance for impairment of receivables.
Individually impaired
Total
$ $
Allowance for impairment losses at 1 July 2013 - -
Additional allowance recognised 5,849,575 5,849,575
Allowance for impairment losses at 30 June 2014 5,849,575 5,849,575
Note 2(a) Significant Accounting judgments and Estimates provides further information on the allowance for impairment losses of $5,849,575.
9. Other assets
Accrued interest - 9,989
- 9,989
10. Plant and equipment
Plant and
equipment
Office building
and fitout
Total
Cost $ $ $
Balance 1 July 2012 42,405 358,788 401,193
Additions - - -
Disposals - - -
Balance 30 June 2013 42,405 358,788 401,193
Balance 1 July 2013 42,405 358,788 401,193
Additions - - -
Disposals (42,405) (358,788) (401,193)
Balance 30 June 2014 - - -
Depreciation
Balance 1 July 2012 41,363 355,963 397,326
Depreciation for the period 432 2,825 3,257
Balance 30 June 2013 41,795 358,788 400,583
227ANNUAL REPORT 2013-14

FORDE JOINT VENTURE
(ABN 78 474 859 392)
NOTES TO THE FINANCIAL STATEMENTS
FOR THE YEAR ENDED 30 JUNE 2014
14
10. Plant and equipment (continued)
Plant and
equipment
Office building
and fitout
Total
$ $ $
Balance 1 July 2013 41,795 358,788 400,583
Depreciation for the period 610 - 610
Write back on disposals (42,405) (358,788) (401,193)
Balance 30 June 2014 - - -
Carrying value
At 1 July 2012 1,042 2,826 3,868
At 30 June 2013 610 - 610
At 1 July 2013 610 - 610
At 30 June 2014 - - -
11. Trade and other payables 2014 2013
Current liabilities $ $
Trade payables 27,319 321,358
Accrued expenses 11,083 676,557
Accrued development expenses 755,730 3,718,535
794,132 4,716,450
The Joint Venture’s exposure to liquidity risk related to trade and other payables is disclosed in Note 13
Financial Instruments.
Accrued development expenses relate to development expenses for stages that have registered but the
development works have not yet been completed or invoiced. The accrual is calculated with reference to the
cost to complete development activities based on the budget for the stage.
12. Capital and reserves
Reconciliation of movement in Joint Venture funds
Pursuant to the Joint Venture Agreement, Forde Developments Pty Limited and Land Development Agency
contributed to the initial capital of the Joint Venture. Forde Developments Pty Limited is responsible for the
project management of the development of the site.
2014 2013
$ $
Capital account - Land Development Agency
Balance at the beginning of the reporting period - -
Repayment of capital - -
Balance at the end of the reporting period - -
228 LAND DEVELOPMENT AGENCY
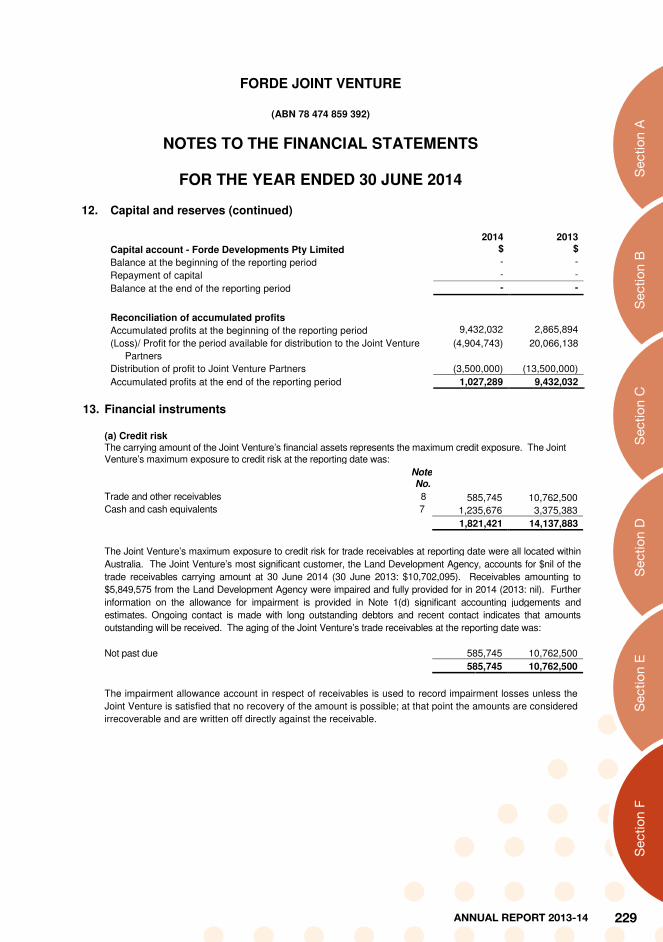
Sec
tion
AS
ectio
n B
Sec
tion
CS
ectio
n D
Sec
tion
ES
ectio
n F
FORDE JOINT VENTURE
(ABN 78 474 859 392)
NOTES TO THE FINANCIAL STATEMENTS
FOR THE YEAR ENDED 30 JUNE 2014
15
12. Capital and reserves (continued)
2014 2013
Capital account - Forde Developments Pty Limited $ $
Balance at the beginning of the reporting period - -
Repayment of capital - -
Balance at the end of the reporting period - -
Reconciliation of accumulated profits
Accumulated profits at the beginning of the reporting period 9,432,032 2,865,894
(Loss)/ Profit for the period available for distribution to the Joint Venture
Partners
(4,904,743) 20,066,138
Distribution of profit to Joint Venture Partners (3,500,000) (13,500,000)
Accumulated profits at the end of the reporting period 1,027,289 9,432,032
13. Financial instruments
(a) Credit risk
The carrying amount of the Joint Venture’s financial assets represents the maximum credit exposure. The Joint Venture’s maximum exposure to credit risk at the reporting date was:
Note
No. Trade and other receivables 8 585,745 10,762,500 Cash and cash equivalents 7 1,235,676 3,375,383
1,821,421 14,137,883
The Joint Venture’s maximum exposure to credit risk for trade receivables at reporting date were all located within
Australia. The Joint Venture’s most significant customer, the Land Development Agency, accounts for $nil of the
trade receivables carrying amount at 30 June 2014 (30 June 2013: $10,702,095). Receivables amounting to
$5,849,575 from the Land Development Agency were impaired and fully provided for in 2014 (2013: nil). Further
information on the allowance for impairment is provided in Note 1(d) significant accounting judgements and
estimates. Ongoing contact is made with long outstanding debtors and recent contact indicates that amounts
outstanding will be received. The aging of the Joint Venture’s trade receivables at the reporting date was:
Not past due 585,745 10,762,500
585,745 10,762,500
The impairment allowance account in respect of receivables is used to record impairment losses unless the
Joint Venture is satisfied that no recovery of the amount is possible; at that point the amounts are considered
irrecoverable and are written off directly against the receivable.
229ANNUAL REPORT 2013-14

FORDE JOINT VENTURE
(ABN 78 474 859 392)
NOTES TO THE FINANCIAL STATEMENTS
FOR THE YEAR ENDED 30 JUNE 2014
16
13. Financial instruments (continued)
(b) Liquidity risk
The following are the contractual maturities of financial liabilities, including estimated interest payments.
Carrying amount Contractual cash
flows
6 months or less
$ $ $
30 June 2014
Trade and other payables 794,132 794,132 794,132
794,132 794,132 794,132
30 June 2013
Trade and other payables 4,716,450 4,716,450 4,716,450
4,716,450 4,716,450 4,716,450
(c) Interest rate risk
Profile
At the reporting date the interest rate profile of the Joint Venture’s interest-bearing financial instruments
was: 2014 2013 $ $ Variable rate instruments Cash and cash equivalents 1,235,676 3,375,383
1,235,676 3,375,383
Fair value sensitivity analysis for fixed rate instruments
The Joint Venture does not hold any fixed rate financial liabilities or assets at fair value through
profit or loss. Therefore, a change in interest rates at the reporting date would not affect profit or
loss.
230 LAND DEVELOPMENT AGENCY

Sec
tion
AS
ectio
n B
Sec
tion
CS
ectio
n D
Sec
tion
ES
ectio
n F
FORDE JOINT VENTURE
(ABN 78 474 859 392)
NOTES TO THE FINANCIAL STATEMENTS
FOR THE YEAR ENDED 30 JUNE 2014
17
13. Financial instruments (continued)
(c) Interest rate risk (continued)
Cash flow sensitivity analysis for variable rate instruments
A change of 100 basis points in interest rates at the reporting date would have increased/(decreased)
equity and profit or loss by the amounts shown below. This analysis assumes that all other variables
remain constant.
Profit or loss Equity
100bp 100bp Increase
$
Decrease
$
Increase
$
Decrease
$30 June 2014 Variable rate instruments – cash flow sensitivity 4,083 (4,083) 4,083 (4,083) 30 June 2013 Variable rate instruments – cash flow sensitivity 52,707 (52,707) 52,707 (52,707)
Fair values
Fair values versus carrying amounts The fair value of cash and cash equivalents, trade and other receivables, trade and other payables, approximates the values shown in the statement of financial position and the notes thereto.
14. Reconciliation of net cash from operating activities 2014 2013
$ $
Net (loss) / profit for the reporting period (4,904,743) 20,066,138
Adjustments for:
Depreciation 610 3,257
Interest received (50,021) (346,186)
Profit on sale of assets (4,545)
Changes in assets and liabilities:
Decrease/(increase) in trade and other receivables 10,176,755 (10,202,718)
Decrease in inventories - 1,634,813
Decrease in accrued interest 9,989 7,193
(Decrease) in trade and other payables (3,922,318) (6,671,059)
Net cash provided by operating activities 1,305,727 4,491,438
231ANNUAL REPORT 2013-14
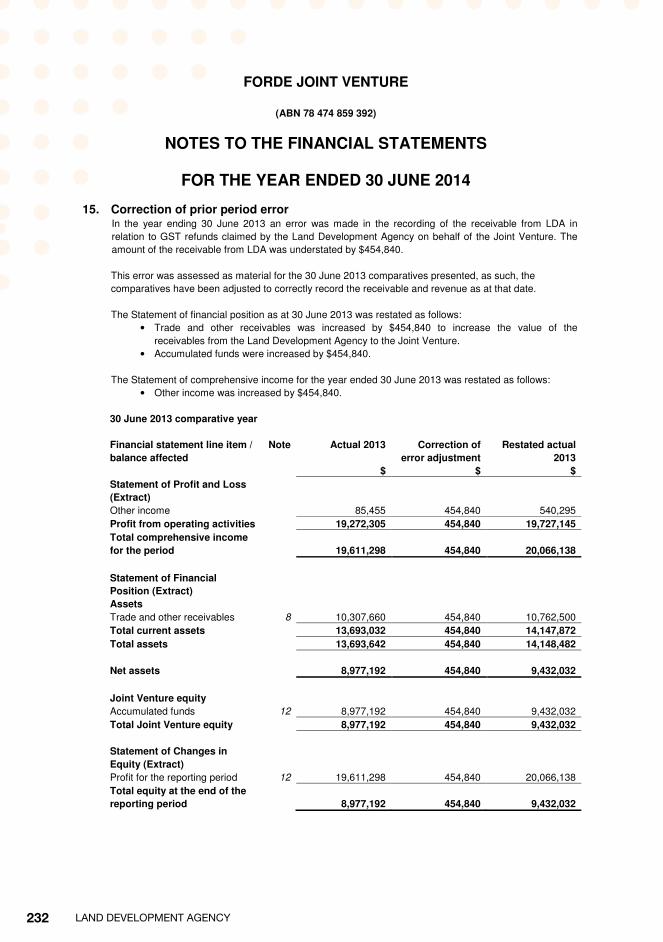
FORDE JOINT VENTURE
(ABN 78 474 859 392)
NOTES TO THE FINANCIAL STATEMENTS
FOR THE YEAR ENDED 30 JUNE 2014
18
15. Correction of prior period error In the year ending 30 June 2013 an error was made in the recording of the receivable from LDA in
relation to GST refunds claimed by the Land Development Agency on behalf of the Joint Venture. The
amount of the receivable from LDA was understated by $454,840.
This error was assessed as material for the 30 June 2013 comparatives presented, as such, the
comparatives have been adjusted to correctly record the receivable and revenue as at that date.
The Statement of financial position as at 30 June 2013 was restated as follows:
• Trade and other receivables was increased by $454,840 to increase the value of the
receivables from the Land Development Agency to the Joint Venture.
• Accumulated funds were increased by $454,840.
The Statement of comprehensive income for the year ended 30 June 2013 was restated as follows:
• Other income was increased by $454,840.
30 June 2013 comparative year
Financial statement line item /
balance affected
Note
Actual 2013
$
Correction of
error adjustment
$
Restated actual
2013
$
Statement of Profit and Loss
(Extract)
Other income 85,455 454,840 540,295
Profit from operating activities 19,272,305 454,840 19,727,145
Total comprehensive income
for the period
19,611,298
454,840
20,066,138
Statement of Financial
Position (Extract)
Assets
Trade and other receivables 8 10,307,660 454,840 10,762,500
Total current assets 13,693,032 454,840 14,147,872
Total assets 13,693,642 454,840 14,148,482
Net assets
8,977,192
454,840
9,432,032
Joint Venture equity
Accumulated funds 12 8,977,192 454,840 9,432,032
Total Joint Venture equity 8,977,192 454,840 9,432,032
Statement of Changes in
Equity (Extract)
Profit for the reporting period 12 19,611,298 454,840 20,066,138
Total equity at the end of the
reporting period
8,977,192
454,840
9,432,032
232 LAND DEVELOPMENT AGENCY

Sec
tion
AS
ectio
n B
Sec
tion
CS
ectio
n D
Sec
tion
ES
ectio
n F
FORDE JOINT VENTURE
(ABN 78 474 859 392)
NOTES TO THE FINANCIAL STATEMENTS
FOR THE YEAR ENDED 30 JUNE 2014
19
16. Commitments
The Joint Venture has no commitments.
17. Related parties
Joint Venture Partners
The names of the partners who formed the Joint Venture are:
Land Development Agency (50%)
Forde Developments Pty Limited (50%)
Forde Developments Pty Limited is owned 50% by Lend Lease Limited and 50% by CIC
Australia Limited. Forde Realty Pty Limited is a subsidiary of Forde Developments Pty Limited.
The members of the Joint Venture Management Committee are:
Mr C Reynolds (Land Development Agency)
Mr S Basheer (Lend Lease Limited)
Mr M Leslie (CIC Australia Limited)
Mr T Gordon (Land Development Agency)
No remuneration was paid to members of the Joint Venture Management Committee.
2014 2013
$ $
Management fees paid or payable to Forde Developments Pty
Limited
36,000 1,396,317
Consultant fees paid or payable to Forde Developments Pty
Limited
15,943 227,448
Development services provided to Land Development Agency (927,069) 1,910,800
-- Commissions paid or payable to Forde Realty Pty Limited 9,069 715,021
Maintenance services provided by CIC Australia Limited 55 18,196
Receivable owing from Land Development Agency at period end - 10,702,095
Payable to Forde Developments Pty Limited at period end 13,200 413,636
Payable to Forde Realty Pty Limited at period end - 226,181
All transactions with related parties are at arm’s length.
233ANNUAL REPORT 2013-14

FORDE JOINT VENTURE
(ABN 78 474 859 392)
NOTES TO THE FINANCIAL STATEMENTS
FOR THE YEAR ENDED 30 JUNE 2014
20
18. Subsequent events
There has not arisen any event, item or transaction of a material and unusual nature likely, in the opinion
of the Joint Venture Management Committee, to affect significantly the operations of the Joint Venture.
19. Contingent liabilities and assets
As at 30 June 2014 the Joint Venture has the following contingent liabilities and assets:
2014 2013
$ $
Contingent liabilities (14,282,432) -
Contingent assets 14,282,432 -
Information on the contingent liabilities and assets is provided at Note 1(d): Significant accounting
judgements and estimates.
234 LAND DEVELOPMENT AGENCY

Sec
tion
AS
ectio
n B
Sec
tion
CS
ectio
n D
Sec
tion
ES
ectio
n F
235ANNUAL REPORT 2013-14

F.3. Capital Works
The LDA carries out a significant number of civil infrastructure and landscape construction programs in conducting its land development activities. Most expenditure is incurred in constructing major infrastructure items and servicing estates.
Civil Infrastructure Construction – work in progress
Project Original estimates$
Year of approval
Original estimated completion
Revised completion date
Revised total project value$
Kingston Boat Harbour
4,000,000 2011 May 2012 June 2015 4,000,000
Coombs Stage 3 Civil Construction
14,502,149 2013 July 2014 August 2014 14,812,658
Coombs Stage 1 Civil Construction
20,664,114 2013 August 2014 October 2014 21,060,844
Lawson South Stage 1C
21,269,929 2013 December 2014 March 2015 22,136,216
Campbell Section 5 and Constitution Ave
12,711,888 2013 March 2014 January 2015 14,325,898
Greenway Lakeside West Stages 1 and 2 Civil Construction and Streetscaping
10,000,000 2013 August 2014 September 2014
7,800,000
Lawson South Stage 1A & 1B
8,847,907 2013 March 2015 March 2015 8,847,907
Downer School Site Demolition
940,000 2013 July 2014 August 2014 1,000,000
236 LAND DEVELOPMENT AGENCY

Sec
tion
AS
ectio
n B
Sec
tion
CS
ectio
n D
Sec
tion
ES
ectio
n F
Civil Infrastructure – completed
Project Original estimates $
Final costs $
Estimated completion
Practical completion
Financially complete
Coombs Stage 2 22,134,505 26,325,506 November 2013
February 2014
No
Flemington Road Stage 2B 1,791,534 2,011,418 April 2014 April 2014 No
Amaroo Group Centre 7,310,000 7,500,000 June 2013 April 2014 No
Landscape construction – work in progress
Project Original estimates$
Year of approval
Original estimated completion
Revised completion date
Revised total project value$
Kingston Public Realm Landscaping
9,019,331 2012 December 2014
April 2014* 9,006,499
Kingston Public Realm Boardwalk
3,474,366 2012 June 2012 May 2013** 3,933,064
Wright Stage 1B 4,600,000 2013 March 2016 April 2016 5,500,000
Bonner 4 Open Space 1,307,360 2013 May 2015 May 2015 1,874,515
Greenway Lakeside West Stages 1 and 2 Open Space Landscaping
3,501,147 2013 March 2014 March 2015 3,501,147
Wright Stage 2 3,100,000 2013 March 2016 May 2016 3,628,056
Landscape construction – completed
Project Original estimates $
Final costs $
Estimated completion
Practical completion
Financially complete
Bonner 3 Open Space 2,312,481 2,404,957 February 2014
April 2014 No
Wright 1A 1,500,000 1,841,160 March 2013 July 2013 No
* Contactor went into liquidation. ** Contract complete. However, works not at practical completion due to dependencies on adjacent site works.
Further information may be obtained from:
Chief Finance Officer Phone: (02) 6205 3585
237ANNUAL REPORT 2013-14

F.4. Asset Management
ASSETS MANAGED
As at 30 June 2014, the LDA managed assets valued at $3.651 million comprising one building at Kingston Foreshore, leasehold improvements and office equipment. This does not include leased motor vehicles or leased office equipment.
These assets are held at independent valuation (building) and cost (leasehold improvements and office equipment), net of accumulated depreciation.
It should be noted that land purchased from the Commonwealth and ACT Government and land development works in progress are treated as inventory by the LDA and valued at the lower of cost or net realisable value in accordance with Australian Accounting Standards and do not form part of the LDA’s fixed asset register.
Assets managed include:
Asset Properties
Land & Buildings Former Kingston Transport depot (occupied by the Old Bus Depot Markets and Megalo Arts)
Leasehold improvements Ground floor, level 6 and level 7, Transact House
Plant and Equipment Office Equipment
ASSET ADDITIONS AND DISPOSALS
There were no asset disposal or additions in 2013-14.
ASSET MAINTENANCE AND UPGRADE
In 2013-14 the LDA operational assets valued at $3.651 million were subject to general repairs and maintenance only. No upgrades were undertaken.
OFFICE ACCOMODATION
The LDA has provision to accommodate 117 employees and contractors occupying approximately 1,719 sqm of office accommodation on the ground floor, level 6 and level 7 of Transact House, 470 Northbourne Avenue Dickson. The average area occupied by each employee is approximately 14.7 sqm.
Further information may be obtained from:
Chief Finance Officer Phone: (02) 6205 3585
238 LAND DEVELOPMENT AGENCY

Sec
tion
AS
ectio
n B
Sec
tion
CS
ectio
n D
Sec
tion
ES
ectio
n F
F.5. Government Contracting
The LDA uses external sources of labour and services to meet its objectives. The LDA engaged a range of consultants and contractors to provide specialist resource need in relation to specific functions. In 2013-14 this included planning and design, civil engineering, geotechnical, environmental, urban design, project management, valuation, legal and financial services and advice.
The LDA’s procurement selection and management process for all contractors, including consultants, was completed in accordance with the Government Procurement Act 2001 and Government Procurement Regulation 2007, and subordinate guidelines and circulars. The LDA has submitted all relevant contracts for review by the Government Procurement Board consistent with the provisions of the Government Procurement Regulation. The LDA has complied with quotation and tender thresholds and ensured all contractors have complied with their employee and industrial relations obligations.
CONTRACTS AND CONSULTANTS
The following table lists the contract entities used to provide professional services to the LDA where the procurement was exempt from quotation and tender threshold requirements. It includes single select tenders (or group of contracts) with a value over $25,000 and select tenders (or group of contracts) with a value over $200,000.
CONTRACTING ENTITY DESCRIPTION MONTH CONTRACT LET
COST ($ EX-GST)
REASON(S) FOR EXEMPTION
BLAK PLAN PTY LTD Site Investigation - Block 4 Section 61 Downer
Nov-13 45,492 Supplier’s specialist knowledge and timeframe
BROWN CONSULTING (ACT) PTY LTD
Detail design and Documentation Services - Molonglo Demonstration Precinct
Nov-13 126,825 Timeframe
COFFEY GEOTECHNICS PTY LTD
Contamination Study - Hume New West
May-14 71,510 Supplier’s specialist knowledge
DELTA GROUP PTY LTD School Demolition - Block 4 Section 61 Downer
May-14 186,487 Timeframe
DFP DESIGN AND CONSTRUCTION
Urban Project Management Consultancy Services
May-12 7,740 Supplier’s specialist knowledge
DIGITAL DISTRIBUTION AUSTRALIA PTY LTD
Relocation of fibre optic cable Block 6 Section 64 Watson
Dec-13 71,481 Supplier’s specialist knowledge
DRUMMOND DEVELOPMENTS Project Consultancy Services
Jun-12 153,500 Supplier’s specialist knowledge
239ANNUAL REPORT 2013-14

CONTRACTING ENTITY DESCRIPTION MONTH CONTRACT LET
COST ($ EX-GST)
REASON(S) FOR EXEMPTION
ELLEVEN CONSULTING PTY LTD
Project Advice, Co-ordination and Management - City to Lake Project
Jan-13 316,695 Supplier’s specialist knowledge
ELLEVEN CONSULTING PTY LTD
Financial and Taxation Advice
Jul-12 406,898 Supplier’s specialist knowledge
GOLDER ASSOCIATES PTY LTD Environmental Site Auditor Services - Campbell Section 5
Sep-13 26,844 Supplier’s specialist knowledge and timeframe
GOLDER ASSOCIATES PTY LTD Site Auditor - Kingston Foreshore
Nov-09 255,698 Supplier’s specialist knowledge
GRIFFITH CONSULTING Project Management Jan-10 101,961 Supplier’s specialist knowledge
INDESCO PTY LIMITED Verge Remediation Design and Superintendency - Gungahlin Metros
Dec-13 44,653 Supplier’s specialist knowledge and timeframe
INFRASTRUCTURE SERVICES GROUP PTY LTD
Preliminary Business Case - City to the Lake
Apr-14 217,790 Supplier’s specialist knowledge and timeframe
LINK CORPORATE SERVICES PTY LTD
Financial Services Jul-12 98,868 Supplier’s specialist knowledge
MACROPLAN AUSTRALIA PTY LTD
Cost Benefit Analysis - Canberra Brickworks
Oct-12 31,300 Supplier’s specialist knowledge and timeframe
MILSEARCH PTY LTD Unexploded Ordinance Assessment - Majura
Jan-14 54,385 Supplier’s specialist knowledge and timeframe
MILSEARCH PTY LTD Unexploded Ordinance Assessment - Molonglo
Aug-13 85,791 Supplier’s specialist knowledge and timeframe
MILSEARCH PTY LTD Unexploded Ordinance Assessment - Molonglo
Jan-14 41,430 Supplier’s specialist knowledge and timeframe
OXIGEN PTY LTD Detailed Design and Construction Superintendence - Kingston Foreshore
Aug-10 112,913 Supplier’s specialist knowledge
PG INTERNATIONAL CONSULTING
Functional Brief and Operational Requirements - City to the Lake
Apr-14 42,209 Supplier’s specialist knowledge and timeframe
240 LAND DEVELOPMENT AGENCY

Sec
tion
AS
ectio
n B
Sec
tion
CS
ectio
n D
Sec
tion
ES
ectio
n F
CONTRACTING ENTITY DESCRIPTION MONTH CONTRACT LET
COST ($ EX-GST)
REASON(S) FOR EXEMPTION
PRICEWATERHOUSECOOPERS AVANTIS INFORMATION SYSTEMS PTY LTD
Specialist GST Advice Jul-12 1,593,226 Supplier’s specialist knowledge
TANIA PARKES CONSULTANCY Strategic Communications - City to the Lake
Jan-14 198,471 Supplier’s specialist knowledge and timeframe
CONSTRUCTION RELATED WORKS PROJECTS
The LDA use Contractors for construction related activities. In 2014-15 this included Civil Works Construction, Landscape Construction, Electrical Infrastructure and Telecommunications Infrastructure. The LDA did not procure any construction related works which were with non-prequalified contractors in excess of the relevant pre-qualification thresholds.
Further information may be obtained from:
Chief Finance Officer Phone: (02) 6205 3585
241ANNUAL REPORT 2013-14

F.6. Statement of Performance
Statement of Performance For the Year Ended
30 June 2014
Land Development Agency
242 LAND DEVELOPMENT AGENCY

Sec
tion
AS
ectio
n B
Sec
tion
CS
ectio
n D
Sec
tion
ES
ectio
n F
243ANNUAL REPORT 2013-14
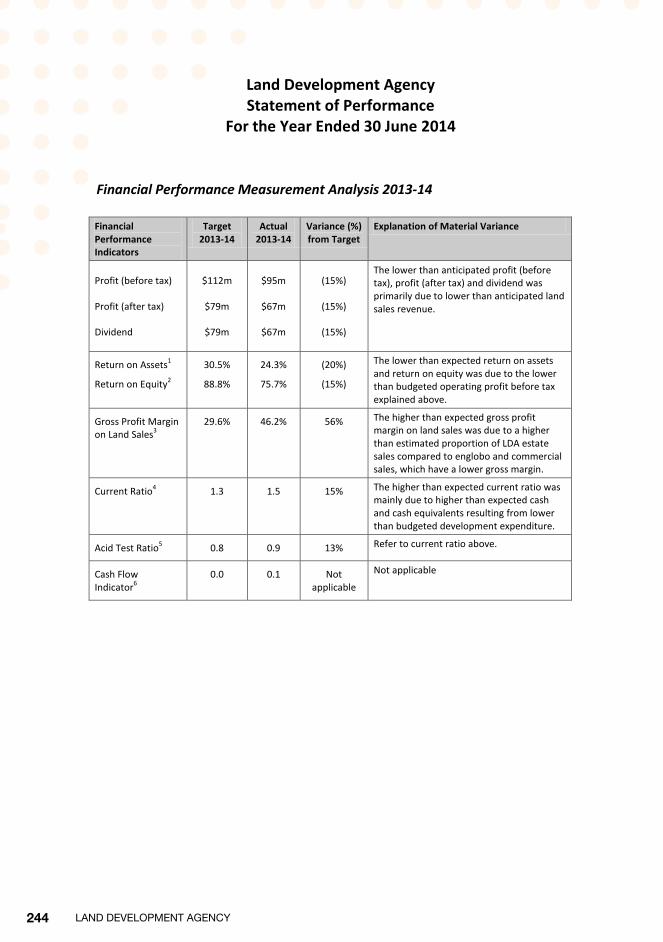
Land Development Agency Statement of Performance
For the Year Ended 30 June 2014
Financial Performance Measurement Analysis 2013-14
Financial Performance Indicators
Target 2013-14
Actual 2013-14
Variance (%) from Target
Explanation of Material Variance
Profit (before tax)
Profit (after tax)
Dividend
$112m
$79m
$79m
$95m
$67m
$67m
(15%)
(15%)
(15%)
The lower than anticipated profit (before tax), profit (after tax) and dividend was primarily due to lower than anticipated land sales revenue.
Return on Assets1
Return on Equity2
30.5%
88.8%
24.3%
75.7%
(20%)
(15%)
The lower than expected return on assets and return on equity was due to the lower than budgeted operating profit before tax explained above.
Gross Profit Margin on Land Sales3
29.6% 46.2% 56% The higher than expected gross profit margin on land sales was due to a higher than estimated proportion of LDA estate sales compared to englobo and commercial sales, which have a lower gross margin.
Current Ratio4 1.3 1.5 15% The higher than expected current ratio was mainly due to higher than expected cash and cash equivalents resulting from lower than budgeted development expenditure.
Acid Test Ratio5 0.8 0.9 13% Refer to current ratio above.
Cash Flow Indicator6
0.0 0.1 Not applicable
Not applicable
244 LAND DEVELOPMENT AGENCY

Sec
tion
AS
ectio
n B
Sec
tion
CS
ectio
n D
Sec
tion
ES
ectio
n F
Land Development Agency Statement of Performance
For the Year Ended 30 June 2014
Financial Performance Indicators
Target 2013-14
Actual 2013-14
Variance (%) from
Target*
Explanation of Material Variance
Debt to Equity Ratio8
0.0 0.0 - Not applicable
Equity Ratio7 31.2% 31.4% 1% Not applicable
Interest Coverage9 20.4 45.6 124% The interest coverage was higher than the target due to lower than budgeted interest payments related to a reduction in land held for development.
The above Statement of Performance should be read in conjunction with the accompanying notes. * Negative figures in brackets. NOTES 1. Return on Assets = (operating result before tax+interest expense) / average total assets for period 2. Return on Equity = operating result before tax / equity 3. Gross Profit Margin = (lease sales – cost of goods sold) / lease sales 4. Current Ratio = current assets / current liabilities 5. Acid Test Ratio = (current assets –current inventory) / current liabilities 6. Cash Flow Indicator = cash flow from operating activities / current liabilities 7. Equity Ratio = total funds employed / total assets 8. Debt to Equity Ratio = total borrowing / total funds employed 9. Interest Coverage = (operating result before tax + interest expense) / interest expense
245ANNUAL REPORT 2013-14

Land
Dev
elop
men
t Age
ncy
Stat
emen
t of P
erfo
rman
ce
For t
he Y
ear E
nded
30
June
201
4
Non
-Fin
anci
al P
erfo
rman
ce In
dica
tors
201
3-14
Ke
y Pe
rfor
man
ce In
dica
tors
(Non
-Fin
anci
al)
Indi
cato
r De
scrip
tor
Indi
cato
r Ta
rget
20
13-1
4 Ac
tual
Res
ult
2013
-14
Varia
nce
(%) f
rom
Ta
rget
Expl
anat
ion
of M
ater
ial V
aria
nce
Urb
an W
ater
Cy
cle
Man
agem
ent
Perc
enta
ge o
f LDA
est
ates
with
spec
ific
Wat
er
Sens
itive
Urb
an D
esig
n St
rate
gies
, ens
urin
g th
at th
e st
rate
gies
are
app
ropr
iate
to th
e siz
e an
d lo
catio
n of
the
proj
ect.
100%
10
0%
- N
ot a
pplic
able
Sust
aina
ble
Com
mun
ity
Prog
ram
s
Perc
enta
ge o
f LDA
est
ates
with
ove
r 500
dw
ellin
gs th
at h
ave
a co
mm
unity
de
velo
pmen
t pro
gram
– M
ingl
e.
100%
10
0%
- N
ot a
pplic
able
Hous
ing
Affo
rdab
ility
Pe
rcen
tage
of e
nglo
bo (g
reen
field
)# es
tate
s to
have
20
per c
ent o
f dw
ellin
g sit
es re
leas
ed fo
r th
e pu
rpos
e of
pro
vidi
ng a
fford
able
hou
sing.
100%
N
ot
appl
icab
le
Not
ap
plic
able
N
o en
glob
o es
tate
s wer
e re
leas
ed in
201
3-14
Perc
enta
ge o
f LDA
Gre
enfie
ld# e
stat
es to
hav
e 20
per
cen
t of d
wel
ling
sites
rele
ased
for t
he
purp
ose
of p
rovi
ding
affo
rdab
le h
ousin
g.
100%
10
0%
- N
ot a
pplic
able
Biod
iver
sity
and
Land
scap
e Ar
ea p
rote
cted
for c
onse
rvat
ion
in
com
plia
nce
with
Com
mon
wea
lth a
nd A
CT
legi
slativ
e re
quire
men
ts.
100%
10
0%
- N
ot a
pplic
able
Desig
n Ex
celle
nce
Key
proj
ects
to b
e re
view
ed b
y De
sign
Revi
ew
Pane
l prio
r to
Boar
d’s c
onsid
erat
ion
of
Proj
ect B
usin
ess P
lan.
100%
10
0%
- N
ot a
pplic
able
Wor
k He
alth
an
d Sa
fety
W
ork
Heal
th a
nd S
afet
y ac
tive
assu
ranc
e sy
stem
s.
Impl
emen
t an
d m
onito
r sy
stem
s
Syst
ems
impl
emen
ted
and
mon
itore
d
- N
ot a
pplic
able
246 LAND DEVELOPMENT AGENCY

Sec
tion
AS
ectio
n B
Sec
tion
CS
ectio
n D
Sec
tion
ES
ectio
n F
Land
Dev
elop
men
t Age
ncy
Stat
emen
t of P
erfo
rman
ce
For t
he Y
ear E
nded
30
June
201
4
Non
-Fin
anci
al P
erfo
rman
ce In
dica
tors
201
3-14
Ke
y Pe
rfor
man
ce In
dica
tors
(Non
-Fin
anci
al)
In
dica
tor
Desc
ripto
r In
dica
tor
Targ
et
2013
-14
Actu
al
Resu
lt
2013
-14
Varia
nce
(%)
from
Tar
get
Expl
anat
ion
of M
ater
ial V
aria
nce
Indi
cativ
e La
nd R
elea
se
Prog
ram
Resid
entia
l Si
tes f
or
4,80
0 Dw
ellin
gs
Site
s for
3,
299
Dwel
lings
(31%
) Th
e va
rianc
e w
as m
ainl
y du
e to
the
defe
rral
of t
he re
leas
e of
1,2
00 d
wel
ling
sites
in B
elco
nnen
(S
ectio
n 15
2, S
ectio
n 48
and
Sec
tions
21,
22
and
23) d
ue to
hig
h le
vels
of e
xist
ing
supp
ly o
f ap
artm
ents
in th
e To
wn
Cent
re.
Com
mer
cial
12
2,43
8m2
74,5
85m
2 (3
9%)
The
varia
nce
was
mai
nly
due
to th
e:
•de
ferr
al o
f the
rele
ase
of B
elco
nnen
site
s not
ed a
bove
; •
dela
y in
the
rele
ase
of B
lock
48
Sect
ion
19 K
ings
ton
and
Sect
ion
24 S
tirlin
g du
e to
Ter
ritor
y Pl
an V
aria
tions
; and
•de
lay
in th
e re
leas
e of
Sec
tion
60 K
ings
ton
due
to o
ngoi
ng c
onta
min
atio
n re
med
iatio
n.
Indu
stria
l 45
,642
m2
0m2
(100
%)
Ther
e w
as n
o in
dust
rial l
and
rele
ases
in 2
013-
14 a
s the
re w
as a
sign
ifica
nt su
pply
of i
ndus
tria
l la
nd o
n th
e m
arke
t, in
clud
ing
stag
e on
e of
the
LDA’
s Hum
e W
est E
stat
e w
here
the
Gove
rnm
ent
mai
ntai
ns a
n in
vent
ory
of in
dust
rial b
lock
s.
Com
mun
ity
98,9
29m
2 16
1,69
7m2
63%
Th
e va
rianc
e w
as m
ainl
y du
e to
the
rele
ase
of S
ectio
n 79
9 G
unga
hlin
whi
ch w
as n
ot in
the
publ
ished
land
rele
ase
prog
ram
.
The
abov
e St
atem
ent o
f Per
form
ance
shou
ld b
e re
ad in
con
junc
tion
with
the
acco
mpa
nyin
g no
tes.
**
Neg
ativ
e fig
ures
in b
rack
ets.
#
Gree
nfie
ld la
nd re
fers
to la
nd th
at is
loca
ted
outs
ide
of th
e ex
istin
g ur
ban
boun
dary
of t
he A
CT. T
he la
nd is
gen
eral
ly lo
cate
d on
the
oute
r edg
e of
the
exist
ing
urba
n ar
ea a
nd re
quire
s sub
divi
sion,
road
co
nstr
uctio
n, c
onne
ctio
n to
serv
ices
and
new
reta
il, e
duca
tiona
l and
com
mun
ity fa
cilit
ies.
Eng
lobo
(Gre
enfie
ld) i
s und
evel
oped
land
sold
to p
rivat
e de
velo
pers
that
is zo
ned
to a
llow
for,
and
capa
ble
of si
gnifi
cant
su
bdiv
ision
into
smal
ler p
arce
ls un
der e
xist
ing
land
use
pro
visio
ns.
LDA
Gree
nfie
ld a
re la
nd d
evel
opm
ent p
roje
cts d
eliv
ered
by
the
LDA.
247ANNUAL REPORT 2013-14

248 LAND DEVELOPMENT AGENCY

Sec
tion
AS
ectio
n B
Sec
tion
CS
ectio
n D
Sec
tion
ES
ectio
n F
249ANNUAL REPORT 2013-14

Omissions Index
D.6 Notices of non-compliance
There were no notices of non-compliance served on the LDA in 2013-14.
Further information may be obtained from:
Director, Office of the Chief Executive (02) 6205 2697
250 LAND DEVELOPMENT AGENCY

Sec
tion
AS
ectio
n B
Sec
tion
CS
ectio
n D
Sec
tion
ES
ectio
n F
Glossary of Abbreviations and Acronyms
AAS Australian Accounting Standards
ACAT ACT Civil and Administrative Tribunal
ACTPLA ACT Planning and Land Authority
ACTPS ACT Public Service
AHAP Affordable Housing Action Plan
BCC Belconnen Community Council
BOP Bushfire Operational Plan
CEO Chief Executive Officer
CFO Chief Finance Officer
CIC Canberra Investment Corporation
CMTD Chief Minister and Treasury Directorate
CNG Compressed natural gas
CO2-e Carbon dioxide equivalent
COAG Council of Australian Government
CW Capital Works
CSD Community Services Directorate
DD Due Diligence
DHCS Department of Housing and Community Services
DRP Design Review Panel
EAP Employee Assistance Program
EDD Economic Development Directorate
EPBC Environment Protection and Biodiversity Conservation
ESA Emergency Services Agency
ESP Enterprise Sustainability Platform
FMA Financial Management Act
FOI Freedom of Information
FTE Full-time equivalent
GBCA Green Building Council of Australia
GCC Gungahlin Community Council
251ANNUAL REPORT 2013-14
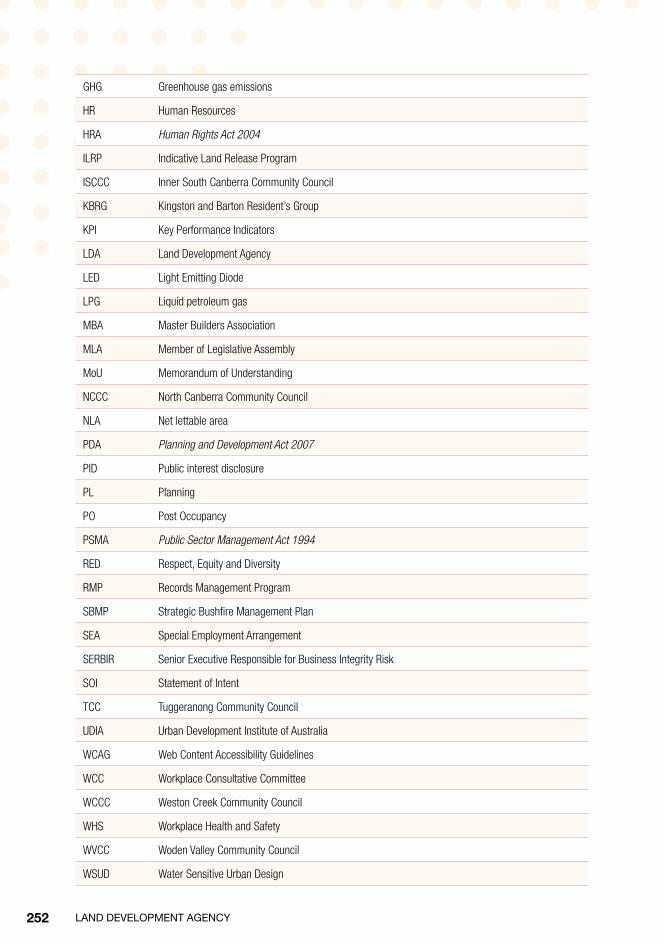
GHG Greenhouse gas emissions
HR Human Resources
HRA Human Rights Act 2004
ILRP Indicative Land Release Program
ISCCC Inner South Canberra Community Council
KBRG Kingston and Barton Resident’s Group
KPI Key Performance Indicators
LDA Land Development Agency
LED Light Emitting Diode
LPG Liquid petroleum gas
MBA Master Builders Association
MLA Member of Legislative Assembly
MoU Memorandum of Understanding
NCCC North Canberra Community Council
NLA Net lettable area
PDA Planning and Development Act 2007
PID Public interest disclosure
PL Planning
PO Post Occupancy
PSMA Public Sector Management Act 1994
RED Respect, Equity and Diversity
RMP Records Management Program
SBMP Strategic Bushfire Management Plan
SEA Special Employment Arrangement
SERBIR Senior Executive Responsible for Business Integrity Risk
SOI Statement of Intent
TCC Tuggeranong Community Council
UDIA Urban Development Institute of Australia
WCAG Web Content Accessibility Guidelines
WCC Workplace Consultative Committee
WCCC Weston Creek Community Council
WHS Workplace Health and Safety
WVCC Woden Valley Community Council
WSUD Water Sensitive Urban Design
252 LAND DEVELOPMENT AGENCY

Sec
tion
AS
ectio
n B
Sec
tion
CS
ectio
n D
Sec
tion
ES
ectio
n F
Definition of Technical Terms
Term Definition
greenfield New residential area
englobo Unserviced land released to the private sector for serving and sale – individual serviced dwelling sites released by englobo release become available for purchase over subsequent years
joint venture Partnership between the LDA and the joint venture partner to release serviced dwelling or multi-unit sites for dwellings.
253ANNUAL REPORT 2013-14

Compliance Index
A. Transmittal Certificate
B. PERFORMANCE REPORTING
B.1 Organisational Overview
B.2 Performance Analysis
B.3 Community Engagement and Support
B.4 Ecologically Sustainable Development
C. GOVERNANCE AND ACCOUNTABILITY REPORTING
C.1 Internal Accountability
C.2 Risk Management and Internal Audit
C.3 Fraud Prevention
C.4 Legislative Assembly Inquiries and Reports
C.5 Auditor-General and Ombudsman Reports
D. LEGISLATION BASED REPORTING
D.1 Public Interest Disclosure
D.2 Freedom of Information
D.3 Human Rights Act
D.4 Territory Records Act
D.5 Legal Services Directions
D.6 Notices of Non Compliance
D.7 Bushfire Risk Management
D.8 Commissioner for the Environment
E. HUMAN RESOURCES MANAGEMENT REPORTING
E.1 Human Resources Management
E.2 Learning and Development
E.3 Work Health and Safety
E.4 Workplace Relations
E.5 Staffing Profile
254 LAND DEVELOPMENT AGENCY

Sec
tion
AS
ectio
n B
Sec
tion
CS
ectio
n D
Sec
tion
ES
ectio
n F
F. FINANCIAL MANAGEMENT REPORTING
F.1 Financial Management Analysis
F.2 Financial Statements
F.3 Capital Works
F.4 Asset Management
F.5 Government Contracting
F.6 Statement of Performance
255ANNUAL REPORT 2013-14
Alphabetical Index
Aabbreviations and acronyms, 249–250
Aboriginal or Torres Strait Islander heritage information, 83
access to records, 82–83
accountability, internal, 60–68, 73
ACT Auditor-General, 73
independent audit reports, 116–117, 186–187, 209–210, 246–247
ACT Government Solicitor, 85
ACT Ombudsman, 73
ACT Property Council awards, 17
ACTPS Workers Compensation and Safety Improvement Plan, 95
affordability sustainability indicators, 54
affordable housing
Housing Affordability Fund, 26
initiatives, 20
performance analysis, 25–26
sustainability indicator, 54
Affordable Housing Action Plan, 20
apartment sites, 23, 24
asbestos, 47–48
asset management, 236
assets, 112–113, 236
Audit and Risk Committee, 10, 69, 70
audits
FOI Act, 70, 77
independent audit reports, 116–117, 186–187, 209–210, 246–247
internal audit, 70
awards
ACT Property Council awards, 17
Property Council of Australia awards, 17
Staff Awards, 91
BBarrett, Ross, 61–62
bicycle networks and facilities, 53
biodiversity see Environment Protection and Biodiversity Conservation Act 1999; landscape and biodiversity sustainability indicators
Bonner, 17, 29, 52
brownfield land, 11, 24, 104
bushfire risk management, 48, 86
CCampbell, 16, 19, 23, 30, 48
Canberra Brickworks + Environs Planning and Development Strategy, 31, 51, 52
Canberra International Music Festival, 22, 29–30, 52
capital works, 234–235
catchment management analysis, 45
Chair, LDA Board, 61–62
report, 16–17
Charity House projects, 17
Chief Executive Officer, 64–65
remuneration, 65
report, 18–22
role and powers, 11, 12
Chief Minister and Treasury Directorate, 66, 76
City to the Lake project, 16, 18
clients, 12
climate change see sustainability and climate change
code of conduct, 91
Commercial Indicative Land Release Program, 24
commercial land releases, 19, 23
performance analysis, 24–25
Commissioner for Public Administration, 76
Commissioner for the Environment, 87
committees
Audit and Risk Committee, LDA Board, 10, 69, 70
EDD Consultative Committee, 91
EDD Workplace Consultative Committees, 91
Joint Venture Management Committees, 67
Land Executive Committee, 66, 69
Land Supply Committee, 27
Legislative Assembly committees, 72
management committees, 65–67
Senior Executive Committee, 65–66
work health and safety, 66–67, 91, 95
Commonwealth Government
land development issues with, 27, 106
spending cuts impact, 23
community engagement
Mingle program, 22, 29–30
overview, 21–22, 30
performance analysis, 28
projects, 30–35
public participation in decision making, 77
sustainability indicator, 51–52
Community Facility and Non-Urban land release program, 25
community land, 23, 25
256 LAND DEVELOPMENT AGENCY

Sec
tion
AS
ectio
n B
Sec
tion
CS
ectio
n D
Sec
tion
ES
ectio
n F
community programs, 52 see also Canberra International Music Festival; Mingle program
community sustainability indicators, 51–52
Compliance as a Statutory Authority audit, 70
conflict of interest, 71
construction use of recycled or reused materials, 49
construction industry
work health and safety, 20, 69
Consultative Committee, 91
contamination studies, 47–48
contracts and consultants, 237–239
Coombs, 21, 22, 26, 29, 36, 44, 45, 49
corporate governance (internal accountability), 60–68, 73
Crace Joint Venture, 19
awards, 17
financial statements, 188–208
independent audit report, 186–187
management committee, 67
cross-agency forums, 91
cut and fill minimisation, 49
cycle networks and facilities, 53
DDawes, David, 64–65
definitions of technical terms, 251
deliverables for 2013–14, 11
Demand Analysis and Monitoring Working Group, 27
Denman Prospect, 16, 48, 109
Deputy Chief Executive Officer, 12
Design Review Panel, 27, 50
Dickson redevelopment, 31
Director-General of Economic Development, 12, 64–65
disability access, 81
dividends, 111 see also financial statements
Downer redevelopment, 31–32
Eecological assessments, 47
ecologically sustainable development see sustainability and climate change
Economic Development Directorate
community engagement services, 29
Consultative Committee, 91
Health and Safety Representatives, 67
human resources management services, 90–92
LDA relationship with, 12, 27, 67, 76, 91
records management services, 82–84
Strategic Plan, 90
Workplace Consultative Committees, 91
economic stimulus package, 16
electricity use, 55, 56
energy and emissions sustainability indicators, 44
englobo sites, 42, 54, 86, 108, 109, 251
enterprise agreements, 90, 97–98
Enterprise Sustainability Platform, 55 see also sustainability indicators; sustainability reporting
EnviroDevelopment reaccreditation, 21, 26
Environment Protection and Biodiversity Conservation Act 1999
clearances, 27
ecological assessments, 47
Watson community engagement, 35
environmental protection, 17, 27, 35, 47, 87
erosion controls, 45–46, 49
establishment, 10–11
ethical behaviour, 71, 91
evaluation of projects, 50
expenditure, 110–111 see also financial statements
Ffinancial management, 104–114
financial performance, 21, 27, 107–111
financial position, 111–114
return to ACT Government, 17, 27, 105
financial statements
Crace Joint Venture, 186–208
Forde Joint Venture, 209–233
LDA, 115–185
flooding studies, 45
Forde Joint Venture
financial statements, 211–233
independent audit report, 209–210
management committee, 67, 68
Franklin, 29, 52
Fraud and Corruption Control Plan 2012–14, 71
fraud prevention, 71 see also risk management
freedom of information, 77–80
access facilities, 78
applications statistics, 79–80
categories of documents held, 77–78
public participation in decision making, 77
training, 93
Freedom of Information Act 1989, 77
audit, 70, 77
Section 7 statement, 77–78
Section 8 statement, 79
Section 79 statement, 79–80
fuel use, 55–56
functional review of LDA, 18
functions and powers of LDA, 10–14, 77, 104
future priorities, 23
257ANNUAL REPORT 2013-14

future trends
expenses, 111
income, 109
Ggeotechnical assessments, 48
glossary
abbreviations and acronyms, 249–250
technical terms, 251
governance (internal accountability), 60–68, 73
Government Land Organisations, 18
grants, 35
Green Building Council of Australia, 21, 36
Green Star – Communities rating tool, 21, 26, 36, 50
greenfield estates, 11, 12–13, 16, 24–25, 47, 251
greenhouse gas emissions, 56
Greening Australia, 49
GreenPower purchased, 55
HHealth and Safety Representatives, 67, 91, 95
health and wellbeing programs, 95–96 see also work health and safety
heritage assessments and protection, 52
Higgins release and redevelopment, 32
Holder, 32
housing affordability
Housing Affordability Fund, 26
initiatives, 20
performance analysis, 25–26
sustainability indicator, 54
housing demand, 20, 23
human resources management, 90–92
human rights, 81
Iincome, 16, 17, 21, 27, 105, 107–109
see also financial statements
independent audit reports
Crace Joint Venture, 186–187
Forde Joint Venture, 209–210
LDA, 116–117
Statement of Performance, 246–247
Indicative Land Release Program, 23
Industrial Indicative Land Release Program, 25
industrial land, 19, 23, 25, 44
influencing design sustainability indicators, 50
Infrastructure and Capital Works Working Group, 27
infrastructure construction, 234–235
injury prevention and management, 95–96 see also work health and safety
Integrity Policy, 71
internal accountability, 60–68, 73
internal audits, 70
inventory levels
industrial land, 25
residential land, 19
Jjoint venture definition, 251
Joint Venture Management Committees, 67
joint ventures see Crace Joint Venture; Forde Joint Venture; Woden Green Joint Venture
K
Kambah release and redevelopment, 19, 33
Kingston Foreshore, 17, 19, 22, 29–30, 51
Kingston Former Transport Depot remediation, 32, 47–48
LLambert, Sandra, 63
Land Development Agency
functional review of, 18
functions and services, 11–14, 77
future priorities, 23
relationship with EDD, 12, 27, 67, 76, 82, 90, 91
role and objectives, 10, 104
strategies employed in 2013–14, 106–107
values, 10, 71, 91
vision and mission, 10
Land Development Agency Board, 10, 27
Audit and Risk Committee, 10, 69, 70
Chair's report, 16–17
expertise, 60
meetings, 61
members, 60–65
remuneration, 65
role, 60–61
Land Development and Corporate WHS Committee, 66–67
Land Development (Greenfield and Urban Renewal), 12–13
land development issues with the Commonwealth, 27, 106
Land Executive Committee, 66, 69
Land Release Program, 20, 23
Land Rent Scheme, 25–26, 54
Land Supply Committee, 27
landscape and biodiversity sustainability indicators, 46–49
landscape construction, 235
Lawson, 16, 19, 21, 23, 26, 36
258 LAND DEVELOPMENT AGENCY

Sec
tion
AS
ectio
n B
Sec
tion
CS
ectio
n D
Sec
tion
ES
ectio
n F
community engagement, 34
learning and development, 93–94
corporate compliance program, 93
FOI training, 93
fraud and ethics training, 71
job specific training, 93
leadership development, 90
management program, 94
records management training, 82–83, 93
RED training, 81, 91
risk management training, 93
whole-of-government initiatives, 90, 91, 93, 94
WHS, 93
legal services directions, 85
Legislative Assembly committees
LDA response and attendance, 72
liabilities, 113–114
Mmanagement committees, 65–67
Mingle program, 22, 29–30, 52
Ministerial directions, 11
mission, 10
Molonglo, 16, 22, 29, 48
Molonglo Valley Local Native Plant Guide, 49
Moncrieff, 16
Nnatural gas use, 55
noise assessments, 52
Northbourne Avenue corridor, 16
notices of non-compliance, 248
OObjective 1: performance analysis, 24–25
Objective 2: performance analysis, 25–26
Objective 3: performance analysis, 27
Objective 4: performance analysis, 27
Objective 5: performance analysis, 27
Objective 6: performance analysis, 28
objectives and services of LDA, 11, 104–105
office accommodation, 55, 56, 236
Office of the Chief Executive Officer, 12
Office of the Commissioner for Sustainability and the Environment, 87
‘One Government’ approach, 27
organisational overview, 10–23
organisational resilience, 90–91
organisational structure, 12–15
Ppaper consumption, 56, 57
park naming competition, 30
Parkes, 34, 45, 50
parking assessments, 53
pedestrian networks and facilities, 53
performance analysis
Objective 1, 24–25
Objective 2, 25–26
Objective 3, 27
Objective 4, 27
Objective 5, 27
Objective 6, 28
statement of performance, 240–245
see also sustainability and climate change; sustainability indicators
performance management, 91
personal records, requests to amend, 80
pest control, 49
Phillip redevelopment, 34
Pipeline Constraints and Supply Working Group, 27
Planning and Development Act 2007, 10, 77
plans and planning
affordable housing, 20
Canberra Brickworks development strategy, 31, 51, 52
EDD Strategic Plan, 90
fraud prevention plan, 71
Territory Plan proposed variations, 32, 35
WHS Strategic Plan, 20, 66, 69, 95
workers compensation and safety improvement, 52
pollution control, 45–46
portfolio membership, 12
Proctor, Susan, 63
profits, 21
projects evaluated, 50
Property Council of Australia/Rider Levett Bucknall Innovation and Excellence Awards, 17
Property Development of the Year award, 17
public interest disclosure, 76
public lighting, 44
public open space, 48
public participation in decision making, 77 see also community engagement
Public Sector Management Act 1994, 11
Public Trading Enterprise classification, 104–105
public transport proximity, 53
purchase of land conflict of interest, 71
259ANNUAL REPORT 2013-14

Rrebate schemes or mandates (energy-efficiency), 44
records, personal, 80
records management, 82–84, 93
recycled material (LDA), 56, 57
recycled or reused materials in construction, 49
remediation works, 47–48
remuneration
CEO and Board members, 65
senior executives, 97, 98
renewable electricity use, 55
rental market, 20
research funding, 35
Residential Indicative Land Release Program, 24–25
residential land releases, 16, 18–19, 23
performance analysis, 24–25
resource consumption sustainability indicators, 55–57
Respect, Equity and Diversity framework, 81, 91
training, 81, 93
return to ACT Government, 17, 27, 105
revenue, 16, 17, 21, 27, 105, 107–109
risk management, 69–70, 93, 105–107 see also fraud prevention
role of LDA, 10–14, 77, 104
SSales, Marketing and Land Management section, 13
scholarship funding, 35
sediment and erosion controls, 45–46
Senior Executive Committee, 65–66
Senior Executive Responsible for Business Integrity Risk, 70, 71
senior executives, 65
remuneration, 97, 98
Senior Managers Forum, 91
shared services, 12
Shonk, Jim, 64
Social Club, 92
solar access, 44
Southquay Greenway development, 16, 32
Special Employment Arrangements, 97
staff
attraction and retention, 90
classifications, 90
diversity groups, 101
enterprise agreements, 90, 97–98
induction program, 71, 91, 93
number of, 55, 56, 99
office accommodation, 55, 56, 236
performance management, 91
profile, 99–101
training see learning and development
Staff Awards program, 91
stakeholders, 12
Statement of Intent, 11
Statement of Performance, 240–247
stationary energy consumption, 55, 56–57
Strategic Finance, 14
Strategic Plans
EDD, 90
work health and safety, 20, 66, 69, 95
strategies employed in 2013–14, 106–107
studies assistance, 94
sustainability and climate change, 20–21
achievements, 21, 26, 36
community-level projects rating tool, 21, 26, 36
performance analysis, 25–26
sustainability indicators, 43–44
affordability, 54
community, 51–52
energy and emissions, 44
influencing design, 50
landscape and biodiversity, 46–49
resource consumption, 55–57
transport, 53
waste and materials, 49
water, 45–46
sustainability of the Territory
performance analysis, 27
sustainability reporting
centralised sustainability data, 55
indicators see sustainability indicators
phases, 38–39
phases, for each project, 40–42
themes and principles, 20–21, 26, 37
Symonston, 35
Ttechnical terms definitions, 251
Territory Plan proposed variations, 32, 35
Territory Records Act 2002, 82–84
threatened species, populations or ecological communities, 48
Throsby Master plan, 34
Tonkin, Rob, 62
traffic and parking assessments, 53
training and development see learning and development
260 LAND DEVELOPMENT AGENCY

Sec
tion
AS
ectio
n B
Sec
tion
CS
ectio
n D
Sec
tion
ES
ectio
n F
transmittal certificate, 7
transport fuel usage, 55, 57
transport sustainability indicators, 53
tree assessments, 47, 48
tree protection, 48
trees planted or retained, 48
Uunexploded ordnance, 48
Urban Development Institute of Australia
EnviroDevelopment reaccreditation, 21, 26
urban infill and renewal projects, 16, 18
Vvalues, 10, 71, 91
vehicles/vehicle usage, 55, 57
vision, 10
Wwaste and materials sustainability indicators, 49
waste management, 56, 57
water sustainability indicators, 45–46
water consumption, 56, 57
water monitoring, 46
water sensitive urban design, 21, 45
Watson, 35, 109
websites, 81
weed and pest control, 49
West Belconnen, 16, 21, 26, 36, 50, 51–52
whistle-blowing, 76
whole-of-government initiatives
GreenPower purchases, 55
learning and development, 90, 91, 93, 94
vehicle fleet management, 55
Woden Green Joint Venture, 67, 68
work health and safety, 95–96
committees, 66–67, 91, 95
compliance with WHS Act, 95
construction industry, 20, 69
risk management, 69
Strategic Plan, 20, 66, 69, 95
training, 93
Workplace Consultative Committees, 91
workplace relations, 97–98
Wright, 21, 22, 26, 29, 36, 44, 45, 54
261ANNUAL REPORT 2013-14