Embed Size (px)
Citation preview

2012
Fin
anci
al R
epo
rt 2
012
www.eib.org
© EIB – 03/2013 – QH-AB-13-001-EN-C – ISBN 978-92-861-1734-3 – ISSN 1725-3446 – doi:10.2867/18621 – EIB GraphicTeam
European Investment Bank98 -100, boulevard Konrad AdenauerL-2950 Luxembourg3 (+352) 43 79 – 15 (+352) 43 77 04 www.eib.org – U [email protected]
The EIB Group consists of the
European Investment Bank and the
European Investment Fund.
European Investment Fund15, avenue John Fitzgerald KennedyL-2968 Luxembourg3 (+352) 24 85 – 15 (+352) 24 85 – 81301www.eif.org – U [email protected]
2 012 Fi n a n ci a l R e p o r t
Financial Report


3 EIB Group: key statutory figures
4 Preface
12 EIB Statutory Bodies
15 Borrowing Activities
19 EIB Treasury Activities
21 Audit and Control
25 EIB 25 Financial Statements 85 Independent Auditor’s Report 86 Statement by the Audit Committee
87 EIB Group (EU Directives) 87 Financial Statements 150 Independent Auditor’s Report 151 Statement by the Audit Committee
153 EIB Group (IFRS) 153 Financial Statements 236 Independent Auditor’s Report 237 Statement by the Audit Committee
Contents


32012 Financial Report
EIB Group Financial Report
EIB Group: key statutory figures
European Investment BankActivity in 2012 (EUR million)
Projects approved 62 079European Union 53 822Partner countries 8 257
Signatures 52 159European Union 44 749Partner countries 7 410
Disbursements 51 055European Union 44 482Partner countries 6 573
Resources raised (before swaps) 71 309Core currencies (EUR, GBP, USD) 66 442Other currencies 4 867
Situation as at 31.12.2012
OutstandingsLoans disbursed 413 374
Loans to be disbursed 81 916
Financing from budgetary resources 14 018
Borrowings 424 674
Own funds 55 218Balance sheet total 508 127Net profit for year 2 740Subscribed capital 242 393
of which called up 21 620
European Investment FundSignatures in 2012 2 570
Equity signatures 1 350Guarantee signatures* 1 180
Microfinance signatures 40
Portfolio as at 31.12.2012 11 949Private equity assets under management 6 953Guarantee exposure* 4 879
Microfinance 117
Situation as at 31.12.2012
Own funds 1 062Balance sheet total 1 392Net profit for year 31Subscribed capital 3 000
of which called up 600
(*) maximum liability

4 Financial Report 2012
Preface
Overview
The strategy in the Corporate Operational Plan (COP) for 2012-2014, approved in December 2011, was to stabilise fi-nancial ratios by reducing activity from the extraordinary levels undertaken since 2009 back to historical levels and strengthening revenue generation and hence the capital base. Subsequently, in view of the deterioration of the economic environment, shareholders explored ways to enable the EIB to do more to contribute to economic re-covery in Europe, without compromising the EIB’s finan-cial strength. Consequently, shareholders unanimously decided on a EUR 10 billion fully paid-in capital increase. This will enable the EIB to provide up to EUR 60 billion in additional long-term lending for economically viable pro-jects within the European Union over the next few years, while also supporting certain key financial ratios, includ-ing capital adequacy and leverage.
This decision was first recommended by the Heads of State and Government in June 2012 and was approved with effect from 31 December 2012. A total of 91.6% of the capital is expected to be paid by 31 March 2013, with the remainder to be paid in two equal tranches on 31 March 2014 and 31 March 2015. The paid-in portion of
Shareholders unanimously approved capital increase
of EUR 10 billion, to be fully paid-in
Highlights of financial developments at the EIB in 2012

52012 Financial Report
Preface
the capital is thus due to increase from EUR 11.6 billion to EUR 21.6 billion, nearly doubling the paid-in amount and representing a sizeable increase in own funds (of about a quarter). This paid-in contribution of capital is a strong demonstration of shareholder support for the EIB, especially given the challenging economic environ-ment experienced in many parts of Europe.
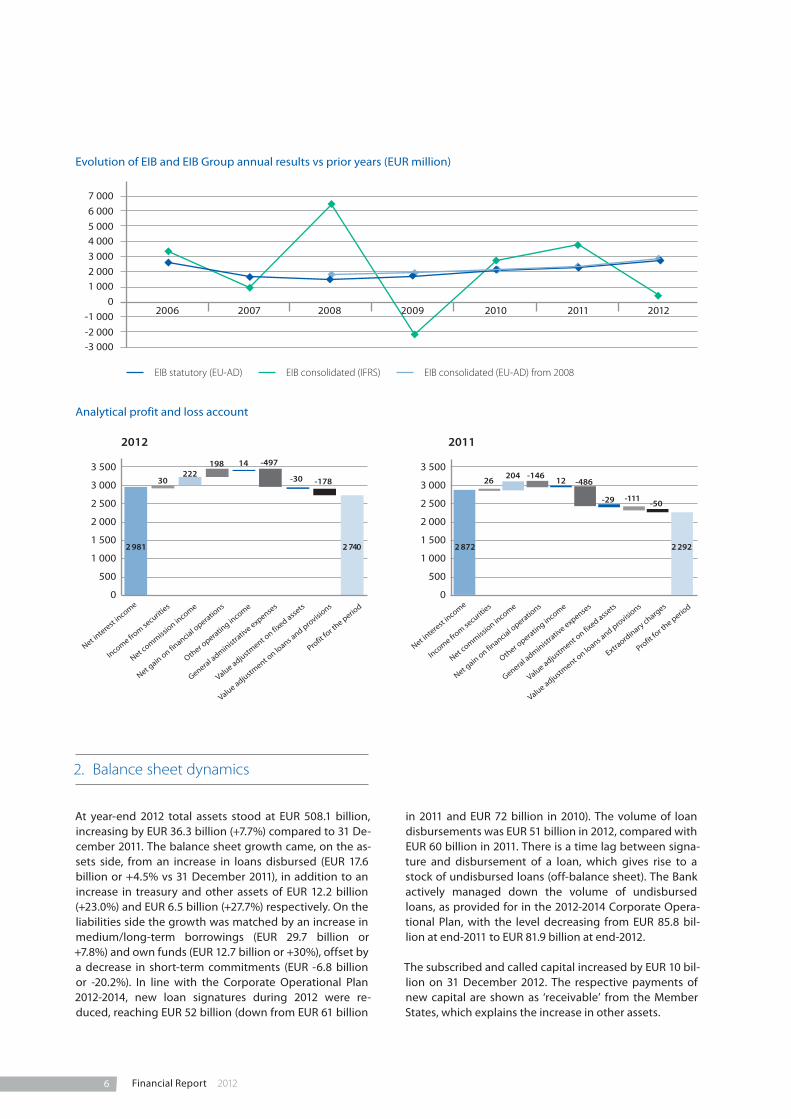
In 2012, the Bank’s profitability remained on an ascending path, with net profit for the year at EUR 2.74 billion (EUR 2.29 billion in 2011 – an increase of 19.6%), or EUR 2.53 billion before exceptional items1. Own funds reached EUR 55.2 billion (after allowing for the EUR 10 billion capital increase, booked as a receivable at year end). There was an increase in specific provisioning of EUR 149 million (to EUR 342 million) relating to impaired operations. The share of impaired operations remained low at 0.3% of the portfolio (2011: 0.1%). These results point to the enduring high quality of the loan portfolio, and reflect well on the Bank’s prudent risk policy guidelines and due dilligence practice.
The capital adequacy (CAD) ratio computed by the Bank in accordance with Basel II principles, excluding the capi tal increase (Basel rules require capital to be re-ceived), declined to 23.1% (24.9% at the end of 2011). This shift was driven by continuing negative ratings mo-mentum in Europe during 2012.
Liquidity increased, representing 65% of the following year’s projected net cash outflows (compared with 58% at end-2011). This, together with the access to the Euro-system refinancing facility, offers a liquidity cushion in line with both the greater scale of lending scheduled for 2013 and also in order to prudentially account for the challenging economic environment. Treasury assets reached EUR 65.4 billion at the end of 2012 (end-2011: EUR 53.2 billion).
The EIB continued to benefit from good access to the capital markets, even in periods of pronounced market uncertainty. It completed its 2012 funding programme of EUR 60 billion in September and continued to fund during the remainder of the year, raising EUR 71.3 bil-lion in total. This result provided an element of pre-funding of 2013 requirements, taking into account expectations for increased lending and thus also great-er liquidity needs in 2013.
1 The Bank has implemented a change in accounting policies applied to early re-payment indemnities (refer to Note A.23.2 to the Bank’s financial statements). The impact of this change on the Bank’s profit amounts to EUR 210 million (refer to Note N.2).
1. EIB financial results – growing capital generation
The Bank has been profitable from the very beginning in 1958. Profits are generally retained for accumulated reserves, as there are no dividend distributions and the Bank is not subject to income taxation.
The Group results reported under IFRS are affected by the fair valuation of financial instruments, including de-rivatives, which under EU Accounting Directives are mostly accounted for on an accruals basis2. The IFRS re-sults therefore reflect the spread fluctuations in the market and are subject to a sustained level of volatility. The Bank does not expect to realise these gains and losses, since the relevant instruments are typically held until maturity.
Under EU-AD, the Bank has historically shown a steady improvement in its results, mainly driven by increased outstanding loan volumes and enhanced margins. The Bank’s total profit for the 2012 financial year continued on a similar trend and stood at EUR 2.74 billion, com-pared to a total profit of EUR 2.29 billion for 2011. This represents an improvement of 19.6%, mainly explained by an increase in net banking income of EUR 300 million (primarily generated by the increase in the net income on loans and borrowings of EUR 227 million and in the net treasury income of EUR 87 million) and by the effect of a change in the accounting policy applied to early repay-ment indemnities, leading to recognition of EUR 210 mil-lion as extraordinary income (refer to Note N.2).
Growing profit supports internal capital generation:
net profit for 2012: EUR 2.74 billion (2011: EUR 2.29 billion)
2 The statutory (unconsolidated) financial statements of the Bank were prepared in accordance with the general principles of the EU banking accounting direc-tives (EU-AD). These principles remained unchanged in 2012. The consolidated financial statements for the Group (the Bank and the European Investment Fund (EIF)) are presented in two forms, under IFRS and under the EU banking accounting directives. Data provided in the Preface are in line with the statuto-ry financial statements (unconsolidated under EU-AD), unless otherwise stated.
6 Financial Report 2012
Evolution of EIB and EIB Group annual results vs prior years (EUR million)
EIB statutory (EU-AD) EIB consolidated (IFRS) EIB consolidated (EU-AD) from 2008
-3 000-2 000
-1 000
0
1 0002 000
3 000
4 0005 000
6 000
7 000
2006 2007 2008 2009 2010 2011 2012
Analytical profit and loss account
2012
0 0
500 500
1 000 1 000
1 500 1 500
2 000 2 000
2 500 2 500
3 000 3 000
3 500 3 500
2 7402 981
30
Net interest
income
Income from se
curities
Net commiss
ion income
Net gain on fin
ancial operatio
ns
Other o
perating in
come
General administ
rative expense
s
Value adjustment o
n fixed asse
ts
Value adjustment o
n loans a
nd provisi
ons
Profit
for t
he period
222198 14 -497
-30 -178
2011
Net interest
income
Income from se
curities
Net commiss
ion income
Net gain on fin
ancial operatio
ns
Other o
perating in
come
General administ
rative expense
s
Value adjustment o
n fixed asse
ts
Value adjustment o
n loans a
nd provisi
ons
Extraord
inary charges
Profit
for t
he period
26
2 872 2 292
-486204 -146 12
-29 -50-111
2. Balance sheet dynamics
At year-end 2012 total assets stood at EUR 508.1 billion, increasing by EUR 36.3 billion (+7.7%) compared to 31 De-cember 2011. The balance sheet growth came, on the as-sets side, from an increase in loans disbursed (EUR 17.6 billion or +4.5% vs 31 December 2011), in addition to an increase in treasury and other assets of EUR 12.2 billion (+23.0%) and EUR 6.5 billion (+27.7%) respectively. On the liabilities side the growth was matched by an increase in medium/long-term borrowings (EUR 29.7 billion or +7.8%) and own funds (EUR 12.7 billion or +30%), offset by a decrease in short-term commitments (EUR -6.8 billion or -20.2%). In line with the Corporate Operational Plan 2012-2014, new loan signatures during 2012 were re-duced, reaching EUR 52 billion (down from EUR 61 billion
in 2011 and EUR 72 billion in 2010). The volume of loan disbursements was EUR 51 billion in 2012, compared with EUR 60 billion in 2011. There is a time lag between signa-ture and disbursement of a loan, which gives rise to a stock of undisbursed loans (off-balance sheet). The Bank actively managed down the volume of undisbursed loans, as provided for in the 2012-2014 Corporate Opera-tional Plan, with the level decreasing from EUR 85.8 bil-lion at end-2011 to EUR 81.9 billion at end-2012.
The subscribed and called capital increased by EUR 10 bil-lion on 31 December 2012. The respective payments of new capital are shown as ‘receivable’ from the Member States, which explains the increase in other assets.

72012 Financial Report
Preface
Own funds, representing entirely Tier 1 capital, stood at EUR 55 billion, more than 10% of the balance sheet total.
Simplified balance sheet as at 31 December 2012
ASSETS EUR m 31-Dec-12 31-Dec-11
Cash 157 427Treasury assets (incl. asset-backed securities) 26 772 24 378Loans and advances to credit institutions and customers 451 511 423 816Other assets1 29 687 23 227
TOTAL ASSETS 508 127 471 848
LIABILITIES EUR m 31-Dec-12 31-Dec-11
Amounts owed to credit institutions and customers 14 391 14 751Debts evidenced by certificates 424 674 401 436Other liabilities 2 13 844 13 183Own funds 55 218 42 478
TOTAL LIABILITIES 508 127 471 848
1 “Other assets” comprise tangible and intangible assets, prepayments and accrued income, shares and other variable-yield securities, other assets and subscribed capital called but not paid.
2 “Other liabilities” comprise accruals and deferred income, provisions and other liabilities.
3. Strong capitalisation
3.1. The capital increase – a unanimous decision by shareholders
The Board of Governors unanimously decided, on a pro-posal from the Board of Directors, to increase the paid-in capital of the Bank by EUR 10 bil-lion, with effect from 31 December 2012. The capital is raised on a pro rata basis from the Member States.
3.2. High level of own funds – fuelling organic growth
Consistent profitability has enabled the Bank to build up a high level of reserves. The Bank’s own funds in-creased from EUR 42.5 billion at the end of 2011 to EUR 55.2 billion at the end of 2012. Out of this increase, EUR 10 billion is attributable to the capital increase.
It is proposed that the profit for the year be appropriat-ed as follows:i) general loan reserve EUR 686 millionii) special activities reserve EUR 950 millioniii) reserve fund EUR 1 104 million
Own funds composition as at 31 December 2012
Own funds EUR ‘000 31-Dec-12 31-Dec-11
Subscribed capital
- Subscribed 242 392 989 232 392 989
- Uncalled -220 773 340 -220 773 340
21 619 649 11 619 649
Reserves
a) reserve fund 21 596 628 20 972 343
b) additional reserves 1 144 024 1 144 024
c) special activities reserve 5 140 386 4 108 940
d) general loan reserve 2 976 909 2 340 863
30 857 947 28 566 170
Profit for the period 2 740 304 2 291 777
Total own funds 55 217 900 42 477 596

8 Financial Report 2012
3.3. Capital adequacy – evolution of the capital adequacy ratio
The Bank’s standalone Basel II Capital Adequacy Ratio (CAD ratio, before accounting for the cash capital in-crease) stood at 23.1 % (24.9% at the end of 2011). The decline in the CAD ratio was due to the negative rating migration observed during 2012, while the incremental capital requirements resulting from the new operations of the Bank in 2012 were covered by the capital gener-ated by the annual profit.
3.4. Capital structure – callable capital
The EIB’s capital is owned by the 27 EU Member States. In addition to the subscribed paid-in capital, the EIB has subscribed uncalled capital, the so-called callable capi-tal. A special feature of the EIB is that the Member States have a high-level legal obligation to pay their share of the callable capital on demand at the request of the EIB’s Board of Directors, as set out in the EIB’s Statute3 (an irrevocable, unconditional obligation). This legal obligation derives from an EU Treaty, which super-sedes national law. The callable capital (which is not considered in the own funds, nor for Basel II capital ad-equacy purposes) amounts to EUR 221 billion.
3 EIB Statute, Article 5(3): “The Board of Directors may require payment of the bal-ance of the subscribed capital, to such extent as may be required for the Bank to meet its obligations.”
4. Lending – stable mission and focus on core competencies
The Bank’s unchanged mission is to finance sound pro-jects, as stipulated in Article 309 of the Treaty on the Functioning of the European Union (“the Bank shall facili tate the financing of investment programmes”). The main activity of the Bank consists of lending directly to large projects (over EUR 25 million), as well as lending via financial intermediaries to SMEs, mid-caps and smaller projects, with a less material part consisting of guaran-tees, equity investments and microfinance.
The volume of signed loans as of the end of 2012 amounted to EUR 495.3 billion (EUR 481.4 billion as of 31 December 2011), of which 89.1% was for projects within the EU (89.6% at the end of 2011). The volume of loans disbursed as of the end of the year amounted to EUR 413.4 billion (EUR 395.6 billion at the end of 2011). The EIB has no pre-set country limits, but the EIB’s lend-ing distribution broadly reflects the economic weight of various countries within the EU, as well as the competi-tiveness of the EIB’s lending and the availability of other sources of financing.
As far as new signatures are concerned, there was a re-duction in volume in the vast majority of countries, in line with the decline in total flows, as shown in the ta-ble below (in EUR million):
Signatures 2012 2011
Spain 8 083 9 079
Italy 6 820 8 436
Germany 5 158 6 112
France 4 337 4 954
Poland 4 441 5 278
United Kingdom 3 665 4 783
Hungary 1 594 1 399
Netherlands 1 245 860
Belgium 1 161 1 333
Other EU Member States 8 245 11 387Candidate and potential candidate countries 3 106 3 451
EFTA (without Iceland) 236 130
Rest of the world 4 068 3 678
52 159 60 880
The distribution of loans by economic sector reflects the operational priorities of the Bank’s lending. By sector, the majority of the Bank’s disbursed loans outstanding were for infrastructure projects, with the largest share taken by transport projects, which accounted for 28.6%. The distribution by economic sector also remained very stable compared to the distribution at the end of 2011. This illustrates that the EIB has remained focused on business that fits with its core competencies.
Outstanding loans disbursed – EUR 413 billion
(EUR 395 billion at end-2011)

92012 Financial Report
Preface
The conservative lending policies that the Bank follows have shaped a high-quality loan portfolio. Data on the loan portfolio provided below apply (unless otherwise stated) to what is termed the “risk portfolio” in the Fi-nancial Report, which excludes the portion of the port-folio outside the EU that benefits from a guarantee from the EU or Member States (7.1% of the portfolio). During 2012 the risk portfolio experienced some negative rat-ing migration, mainly as a result of counterparty down-grades triggered by country rating downgrades. As of end-2012 around 81.2% of the risk portfolio was backed by a borrower or obligor of a rating equivalent to invest-ment grade (end of 2011: 86.9%).
Operations which carry higher risk than the EIB’s usual activities are termed “special activities” and benefit from a dedicated special activities reserve. The volume of new special activities signed in 2012 was EUR 1.7 billion, compared to the EUR 2.9 billion in 2011. The new signa-tures, together with the operations which migrated to this category during 2012, contributed to the increase in the stock of special activities to EUR 27.5 billion (EUR 22.5 billion as of end-2011). This represented 6.0% of the risk portfolio, and the corresponding special ac-tivities reserve (SAR) stood at EUR 3.75 billion. In addi-tion, EUR 2.34 billion of the SAR is allocated to the equity fund activities managed by the EIF on behalf of the Bank. After inclusion of the proposed appropriation of the 2012 result, the SAR will amount to EUR 6.09 billion.
4.1. High quality of the loan portfolio
The high credit quality of the loan portfolio is reflected in the EIB’s extremely low rate of loan impairments and the marginal historical level of defaults. The resilience of the loan portfolio, even after more than four years of fi-
nancial and economic crisis, is in particular founded on the nature and quality of the projects financed. Rooted in the real economy, these projects address the EU’s long-term needs and objectives and are subject to strict due diligence and prudential risk management scrutiny.
As of the end of 2012:
• There were 13 impaired loans for a total disbursed exposure of EUR 1 224 million (representing 0.3% of the total portfolio), for which the Bank raised specific provisions of EUR 341.5 million. It did not identify a need to provide a provision for collective impair-ment. The Bank also provisioned two equity invest-ments for a total amount of EUR 17.3 million.
• Arrears above 90 days on loans granted outside the Euro pean Union secured by the European Union budg-et or the Member States amounted to EUR 164.9 mil-lion as at 31 December 2012, out of which EUR 147.2 mil- lion was called and paid under the guarantee of a Member State or the European Union.
• As regards loans granted within the European Un-ion, or outside the European Union and not se-cured by guarantees of the European Union budget or the Member States, the arrears over 90 days amounted to EUR 41.6 million as at 31 December 2012. More than 90% of this amount related to a single counterparty and is covered by a provision for impairment.
• Following downgrades of counterparty ratings, of-ten driven by country rating downgrades, the Bank put EUR 12.4 billion of existing loans on the internal Watch List for heightened monitoring, equivalent to 2.7% of the risk portfolio. This represents an increase
Geographical distribution of the stock of loans at the end of 2012 (%)
Austria 2.4 Belgium 2.0 EU other 1.7 EU Scandinavia 3.5 EU-CEE 8.8 France 9.0 Germany 11.7 Greece 3.3 Italy 12.4 Netherlands 1.7 Poland 6.1 Portugal 4.6 Spain 15.1 United Kingdom 6.8 Non-EU 10.9
Distribution by sector of the stock of loans at the end of 2012 (%)
Water, sewerage 5.5 Transport 28.6 Telecoms 2.9 Services 4.3 Miscellaneous
infrastructure 4.6 Industry 9.0 Agriculture, fisheries,
forestry 0.3 Health,
education 8.7 Energy 13.1 Global loans 23.0 1
1 Loans through financial intermediaries

10 Financial Report 2012
of EUR 5.3 billion vs end-2011. Growth in the Watch List was somewhat curtailed by remedial action. The Watch List loans were mostly unimpaired.
• The disbursed sovereign exposures of the Bank through its lending activities amounted to EUR 32 bil - lion (EUR 29 billion at the end of 2011), and the sov-ereign guaranteed exposure was EUR 67 billion (EUR 62 billion at the end of 2011) – see also Note U of the statutory financial statements. In addition, the Spanish sovereign announced liquidity support for exposures of Spanish regions to European supra-national institutions, including the EIB. In 2012 and 2011, the Bank did not record any impairment in re-spect of its holding of EU sovereign and sovereign-guaranteed exposures, as the Bank’s preferred creditor status (PCS) and the protection given by the Bank’s Statute are deemed to guarantee a full recov-ery of the Bank’s assets on maturity.
5. Risk management activities – following best banking practice
The Bank aligns its risk management systems with best market practice. The methodology used to determine operational targets and orientations takes into account the Bank’s objective of maintaining a robust credit standing, the long-term nature of its lending business and the granularity of its portfolio. With these aims in mind, the Bank utilises a set of credit risk indicators that monitor among other things minimum capital require-ments and stress tests, the credit quality distribution of its portfolio and new loans (stock and flow), and risk concentration measures. The Bank applies a conserva-tive financial framework.
The Bank does not view its treasury or funding activities as profit-maximising centres, even though perfor-mance objectives are attached to those activities. In-vestment activities were conducted with the primary objective of protecting the capital invested. With re-spect to exposures arising from the Bank’s lending and borrowing operations, the main principle of the Bank’s financial risk policy was therefore that all material fi-nancial risks should be hedged. For details on financial risk management refer to Note U of the statutory finan-cial statements.
5.1. ALM: Sustainability of growth and stability of earnings
The Bank pursued stability of earnings, preservation of the economic value of own funds and sustainable growth in the long term. The ALM policy employs me-
dium to long-term indexation for the investment of own funds to promote stability of revenues and en-hance overall returns. This is accomplished by targeting a duration for the Bank’s own funds of 4.5 to 5.5 years.
The Bank uses derivative instruments exclusively to manage exposures to interest rate and foreign currency risks, as part of its ALM activities (and not for trading purposes).
The EIB minimises its exposure to foreign exchange fluctuations. It actively uses hedging to protect itself against such financial risk. The net residual positions that arise from outstanding operations are managed within pre-set limits to constrain foreign exchange rate risk to minimum levels (see Note U.4 of the statutory fi-nancial statements).
The Risk Management department quantifies the value at risk (VaR) of own funds for both interest rates and foreign exchange risk factors. It is measured on the Bank’s posi-tions using a 99% confidence level and a one-day time horizon. As at 31 December 2012, the VaR of the EIB’s own funds amounted to EUR 170 million (EUR 316 million in 2011).
VaR does not purport to measure the worst loss that could be experienced. For this reason, it is comple-mented by regular stress testing.
5.2. Credit risk
Credit risk concerns mainly the Bank’s lending activity and, to a lesser extent, treasury instruments held for li-quidity purposes, as well as derivatives used to hedge mainly funding but also lending, treasury and ALM market risk exposures.
The Bank’s lending policies set out minimum credit quality levels for both borrowers and guarantors in lending operations and identify the types of security that are deemed acceptable. They also detail the mini-mum requirements which loan contracts must meet in terms of key legal clauses and other contractual stipu-lations to ensure that the Bank’s position ranks at least equal to that of other senior lenders, with prompt ac-cess to security when required. In addition, via a coun-terparty and sector limit system (for the top 10 sectors, guided by stressed capital consumption as per Basel II), the credit policies ensure an acceptable degree of di-versification in the Bank’s loan portfolio.
Credit risk associated with derivatives is also rigorously managed by selecting well-rated counterparties, trad-ing with bank counterparties only under collateral agreements and setting limits for current and potential

112012 Financial Report
Preface
Strong liquidity – total treasury assets stood at EUR 65 billion at end-December
(EUR 53 billion at the end of 2011) or 65% coverage of 2013 projected net cash outflows
(58% cover at end-2011).
future unsecured exposure. The majority of the deriva-tives portfolio is concentrated on highly rated counter-parties. In terms of notional per internal rating, the composition of the derivatives portfolio was: 1.1% Aaa, 0.1% Aa1, 3.3% Aa2, 21.2% Aa3, 46.5% A1, 17.9% A2, 4.4% A3, 5.4% Baa1 and 0.1% Baa3.
6. Treasury and liquidity management
6.1. Liquidity planning
The main objective of liquidity policy is to ensure that the Bank can always meet its payment obligations on time and in full. Liquidity was consistently maintained at appropriate levels to cater for the operating environ-ment. As of end-2012, liquidity represented 64.6% of projected 2013 net cash outflows, an increase vs end-2011 (58.2%), even though it allows for projected growth in loan disbursements according to the Corporate Op-erational Plan 2013-2015.
The Bank continued during 2012 to monitor its liquidity in line with best practice. Its liquidity framework con-tinued to be regularly enhanced, providing a quantita-tive and qualitative basis to define its liquidity risk tolerance and consequently the optimal size of its required liquidity buffer. In addition, the EIB actively managed down its stock of undisbursed loans, benefit-ing its liquidity ratios.
A Contingency Liquidity Plan (CLP) defines the respec-tive responsibilities and the decision-making process in the theoretical case of an approaching liquidity crisis. The CLP has been benchmarked against the “Principles for Sound Liquidity Risk Management and Supervision” of the Basel Committee on Banking Supervision (Sep-tember 2008). The CLP is subject to ad hoc updates and is presented to the Management Committee annually for approval.
The EIB is an eligible counterparty in the Euro system’s monetary policy operations and therefore has access to the monetary policy operations of the European Cen-tral Bank. This access has been activated, albeit at low levels, in a continuous manner to ensure its permanent operational maintenance. The Bank conducts the opera tions via the Central Bank of Luxembourg, where it maintains a deposit to cover the minimum reserve re-quirements. The ability to repo ECB-eligible collateral adds substantially to the EIB’s liquidity buffer.
6.2. Conservative and profitable investments
Limits governing the structure of the securities port-folio and outstanding treasury instruments have been laid down by Management, in particular on the basis of internal and external ratings.
The management of the treasury assets includes several portfolios with different investments, benchmarks and maturities. The bulk of these assets (more than 90% at the end of 2012) were held in an operational portfolio invested in short-term instruments with a maturity of up to 3 months.
The other portfolios form the buffer to be used excep-tionally and are invested in a variety of securities. They also include some medium-term debt issued by finan-cial institutions (up to 5 years) and EU public sector or government bonds (maximum maturity up to 30 years).Excluding the investment portfolio (which is held to maturity), the long-term holdings amounted to EUR 3.6 billion as of 31 December 2012.
The total EU sovereign exposure in the long-term bond portfolios as of 31 December 2012 was EUR 3 billion or 5% of the total portfolio (EUR 4 billion or 8% at the end of 2011). As with the sovereign lending exposure, the Bank’s preferred creditor status (PCS) and the protection given by the Bank’s Statute are deemed to guarantee a full recovery of the Bank’s sovereign treasury exposure on maturity. For further information please see Note B.
The income from treasury operations amounted to EUR 530 million in 2012 (compared to EUR 443 million in 2011), supported by the high levels of liquidity, meas-ures to reduce exposure on the most volatile assets, as well as the strong performance of certain, notably sov-ereign, holdings.

12 Financial Report 2012
Chairman György MATOLCSY (Hungary)Belgium Koen GEENS Minister for Finance Bulgaria Kalin HRISTOV Minister for Finance Czech Republic Miroslav KALOUSEK Minister of FinanceDenmark Annette VILHELMSEN Minister for Business and GrowthGermany Wolfgang SCHÄUBLE Federal Minister for FinanceEstonia Jürgen LIGI Minister for FinanceIreland Michael NOONAN, T.D. Minister for FinanceGreece Yannis STOURNARAS Minister for FinanceSpain Luis de GUINDOS Minister for Economic Affairs and CompetitivenessFrance Pierre MOSCOVICI Minister for Economic Affairs and FinanceItaly Vittorio GRILLI Minister of Economy and FinanceCyprus Michalis SARRIS Minister for FinanceLatvia Andris VILKS Minister for FinanceLithuania Rimantas ŠADŽIUS Minister for FinanceLuxembourg Jean-Claude JUNCKER Prime Minister, Minister of State, Minister for the TreasuryHungary György MATOLCSY Minister for National EconomyMalta Tonio FENECH Minister of Finance, the Economy and InvestmentNetherlands Jeroen DIJSSELBLOEM Minister for FinanceAustria Maria FEKTER Federal Minister for FinancePoland Jan VINCENT-ROSTOWSKI Minister for FinancePortugal Vitor GASPAR Minister of State and Minister of FinanceRomania Daniel CHITOIU Vice Prime Minister and Minister of Public FinanceSlovenia Janez ŠUŠTERŠIČ Minister for FinanceSlovakia Peter KAŽIMĺR Deputy Prime Minister and Minister of FinanceFinland Jan VAPAAVUORI Minister of Economic AffairsSweden Anders BORG Minister for FinanceUnited Kingdom George OSBORNE Chancellor of the Exchequer
EIB Statutory Bodies
Situation at 14 March 2013
The composition of the Bank’s statutory bodies, the curricula vitae of their members and additional information on the remuneration arrangements are regularly updated and posted on the EIB’s website: www.eib.org.
Board of Governors
132012 Financial Report
EIB Statutory bodies
Board of Directors
The Board of Directors consists of 28 Directors, with one Director nominated by each Member State and one by the European Commission. There are 18 Alternates, meaning that some of these positions will be shared by groupings of States.
Furthermore, in order to broaden the Board of Directors’ professional expertise in certain fields, the Board is able to co-opt a maximum of six experts (three Directors and three Alternates), who participate in the Board meetings in an advisory capacity, without voting rights.
Directors
Olivier HENIN Executive Director, Head of Policy Unit, Ministry of Finance, BrusselsDorothea PANDOVA Chair of the Supervisory Board of the Bulgarian Development Bank, SofiaZdenĕk HRUBÝ Member of the Board of Directors of the EIB and Alternate Member of the Board of
Directors of the EIF, PragueJulie SONNE Director, Ministry for Business and Growth, CopenhagenDietrich JAHN Deputy Director General and Head of Directorate, European Policy Directorate-General,
Federal Ministry of Finance, BerlinIvar SIKK Deputy Secretary General, State Budget and Governance Policy, Ministry of Finance, TallinnMichael SOMERS Director, Allied Irish Banks and other companies, National Treasury Management Agency, DublinStilpon NESTOR Managing Director, Nestor Advisors Ltd, LondonClara CRESPO Deputy Director for Economic and Financial Affairs of the European Union, Ministry for
Economic Affairs and Competitiveness, MadridSandrine GAUDIN Deputy Director, European Affairs, Treasury Directorate General, Ministry for Economic
Affairs and Finance, Paris Carlo MONTICELLI Director General, International Financial Relations, Treasury Department, Ministry of
Economic Affairs and Finance, RomeKyriacos KAKOURIS Senior Economic Officer, Ministry of Finance, NicosiaSanita BAJĀRE State Secretary, Ministry of Finance, RigaJurgita UZIELIENĖ Deputy Director/Acting Director, EU and International Affairs Department, Ministry of
Finance, VilniusArsène JACOBY Head International Financial Institutions Department, Ministry of Finance, LuxembourgZoltán URBÁN Member of the Board of Directors and Deputy CEO, Hungarian Development Bank
Private limited company, BudapestVincent GRECH Consultant to the Government of Malta, Ministry of Finance, the Economy and
Investment, Valletta
Chairman José RODRIGUES DE JESUS Chartered Auditor, OportoMembers Danièle NOUY Secretary General of Prudential Control Authority, Banque de
France, ParisMadis ÜÜRIKE Advisor, Ministry of Finance, TallinnBettina JAKOBSEN Assistant Auditor General in the National Audit Office of
Denmark, CopenhagenJean-Nicolas SCHAUS Former Director General, Luxembourg Banking Supervisory
Authority (CSSF), LuxembourgMiroslav MATEJ Deputy Minister of Finance of the Czech Republic, Prague
Observer Jukka VESALA Deputy Director General, Finnish Financial Supervisory Authority (FSA), Helsinki
Management Committee
President Werner HOYERVice-Presidents Philippe de FONTAINE VIVE CURTAZ Wilhelm MOLTERER
Dario SCANNAPIECO Pim van BALLEKOMMagdalena ÁLVAREZ ARZA Mihai TANASESCUAnton ROP Jonathan TAYLOR
Audit Committee

14 Financial Report 2012
Jan Willem van den WALL BAKE Senior Advisor, Foreign Financial Relations Directorate, Ministry of Finance, The HagueWolfgang NITSCHE Deputy Head of Division for Coordination of European Integration Matters and Trade
Policy, Federal Ministry of Finance, ViennaJacek DOMINIK Undersecretary of State, Ministry of Finance, WarsawPedro MACHADO Head of Cabinet of the Minister of State and Finance, Ministry of Finance, LisbonClaudiu DOLTU Secretary of State, Ministry of Public Finance, BucharestDejan KRUŠEC State Secretary, Ministry of Finance, LjubljanaKatarina KASZASOVÁ Director General of the State Reporting Section, Ministry of Finance, BratislavaTytti NORAS Legal Counsellor, Ministry of Finance, HelsinkiKurt Arne HALL Director General (retired), International Department, Ministry of Finance, StockholmPeter CURWEN Director Europe, International and Finance Directorate, HM Treasury, LondonGerassimos THOMAS Director, Directorate-General for Economic and Financial Affairs, European Commission,
Luxembourg
ObserverVladimira IVANDIĆ Head of Sector for EU and International Financial Relations, Zagreb
ExpertsPierre RICHARD Expert on the Board of Directors of the EIB, ParisRainer MASERA Dean of the Economics Faculty, University Guglielmo Marconi, RomeTimothy STONE Senior Advisor to the Secretary of State for Energy and Climate Change and Expert
Chair of the Office for Nuclear Development, London
AlternatesFranciscus GODTS Head of Department, International and European Financial Affairs, Treasury, Ministry
of Finance, BrusselsJenya DINKOVA Director, International Financial Institutions and Cooperation Directorate, Ministry
of Finance, Sofia(…) …Alf THERKILDSEN Special Advisor, Ministry for Business and Growth, CopenhagenRalph MÜLLER Head of European Policies Department, Federal Ministry of Finance, BerlinRudolf LEPERS Head of Division, Federal Ministry of Economic Affairs and Technology, BerlinLucinio MUÑOZ Chief of Staff of the Spanish Treasury’s General Secretariat, Ministry for Economic Affairs
and Competitiveness, MadridDov ZERAH Chief Executive Officer of the Agence Française de Développement, Paris Christophe BORIES Head of Bilateral Affairs and European Financial Instruments Office, Europe Depart-
ment, Treasury Directorate General, Ministry for Economic Affairs and Finance, Paris(…) …Francesca MERCUSA Director, International Financial Relations Division, Department of the Treasury, Ministry
of Economic Affairs and Finance, Rome(…) …Dovilė JASAITIENĖ Head of the International Affairs Division, EU and International Affairs Department,
Ministry of Finance, VilniusMichal BAJ Director of the International Department, Ministry of Finance, WarsawAngela CARABAŞ General Director, General Department of Treasury and Public Debt, Ministry of Public
Finance, BucharestLars ÖSTLING Senior Adviser, Ministry of Finance, StockholmMike GLYCOPANTIS Deputy Director, European Union Budget, HM Treasury, LondonMelinda SIMMONS Head of Europe Department, Department for International Development, LondonWalter DEFFAA Director-General, Directorate-General for Regional Policy, European Commission,
Brussels
Alternate expertsAntoni SALA Advisor to the CEO, Bank Gospodarstwa Krajowego, WarsawAxel NAWRATH Member of the Executive Board of KfW, Frankfurt am MainEdward BANNERMAN Economic Advisor, Cabinet of the High Representative of the Union for Foreign Affairs
and Security Policy and Vice-President, European Commission, Brussels

152012 Financial Report
Borrowing Activities in 2012
Resilient funding strategy
The funding operations provide long-term funds and support liquidity via bond issuance in the international capital markets. Their objectives are to achieve ade-quate volume and to optimise the funding cost on a sustainable basis. They combine issuance of large and liquid bonds (“benchmarks”) in the core currencies of EUR, USD and GBP, with targeted and tailor-made issu-ance across currencies. Aided by this strategy, the Bank was able to achieve its funding objectives in 2012.
Results in 2012
The EIB raised a total amount of EUR 71.3 billion. After the early completion of the EIB’s funding programme (the EUR 60 billion target had been achieved by the end of September), the Bank continued to issue on a selec-tive basis.
Overall, the EIB’s benchmarks in core currencies (EUR, USD and GBP) showed improving spreads in the course of the year. The Bank was able to extend the average maximum maturity of its funding programme to 8.4 years (2011: 6.8 years). The long average maturity of funding reflects the Bank’s perennial role as the long-term lending institution of the European Union.

16 Financial Report 2012
Changing market conditions
The EIB first tested the benchmark market in January with a 3-year EUR benchmark (EARN) sized at EUR 5 bil-lion, which attracted strong demand. This issue created positive momentum, and the Bank seized opportunities to make strong progress in the first quarter, raising around EUR 37 billion, more than half the annual target. The solid demand for EIB bonds first supported a tight-ening of shorter-dated spreads, notably in EUR. Longer-dated EUR issues and issues in other currencies also benefited from periods of spread tightening in the course of the year, though typically to a lesser degree. The positive momentum was further supported by news of shareholder plans for a EUR 10 billion capital increase.
2012
Europe 57% Asia 34% Middle East and
Africa 5% Americas 4%
2011
Europe 54% Asia 29% Middle East and
Africa 4% Americas 13%
Main investor demand from Europe and Asia
Distribution highlights by region:
• Europe remained with 57% (2011: 54%) the largest source of investor demand, dominating issuance in EUR and GBP in particular.
• The European market and Germany in particular of-fered the highest degree of granularity.
• Within the European Union, the largest markets were the UK, Germany and France.
Liquid benchmark bonds preferred
Investor demand for large and liquid benchmark prod-ucts in the EIB’s three core currencies remained robust and such issues accounted for 57% of funding. Issuance of targeted EUR bonds labelled ‘Euro-cooperative’ bonds (or ‘ECoops’) increased substantially, achieving a 28% share of funding (2011: 10%). ECoops may be con-sidered to have ‘mini-benchmark’ status, as such issues are commonly gradually built up to liquid size. Issuance in non-core currencies (7%) and structured format (2%) was less in demand.
Benchmark EUR 25% Benchmark GBP 9% Other plain vanilla
(all currencies) 13% Other EUR public
deals (ECoops) 28% Structured 2% Benchmark USD 23%
Note: Although the data cover the bulk of placements, not all placement infor-mation was made available to the EIB. Consequently, comments and graphs on placements by geography or investor type in this section are of an indicative nature only. Numbers and percentages may not sum due to rounding.

172012 Financial Report
Borrowing Activities
2011
Bank Treasury 37% Fund Managers/ Insur-
ance/ Pension 21% Central Bank/
Gov’t Institution 36% Corporate/ Retail/
Other 6%
2011
EUR 46% GBP 10% USD 32% Other 12%
2012
Bank Treasury 40% Fund Managers/Insur-
ance/ Pension 33% Central Bank/
Gov’t Institution 24% Corporate/Retail/
Other 3%
2012
EUR 56% GBP 9% USD 28% Other 7%
Bank treasuries remained leading source of demand
Distribution highlights by investor type:
• Bank treasuries remained the leading investor type, typically influenced by regulatory liquidity require-ments for highly rated credits.
• A search for higher yields and the need for longer-dated assets were among the drivers stimulating in-creased longer-dated purchases by fund managers, pension funds and insurers, facilitating longer-dated issues.
• Central banks have traditionally shown more inter-est in shorter-dated issues, reflected in a reduced share as the Bank extended the maturity of funding.
Currency mix of EIB funding
Distribution highlights by currency:
• In terms of currency, funding was concentrated on EUR, GBP and USD.
• The EIB issued in 16 currencies, of which 4 in synthetic format (2011: 19, of which 6 in synthetic format).
• EUR remained the key source of duration and volume. • An average maturity comparable to EUR was achieved
in GBP, but for lesser volume. • USD issues were attractive at a relatively shorter du-
ration. • Other currencies offered valuable diversification and
duration.
2012 2011
Currency No. of Issues
EUR in billions
Currency in billions
Average Maturity
% EUR in billions
%
EUR 79 40.0 40.0 9.6 56 35.2 46
USD 28 20.0 25.7 5.3 28 23.8 32
GBP 22 6.4 5.2 9.7 9 7.8 10
Other currencies 81 4.9 – 9.4 7 9.2 12
Total 210 71.3 8.4 100 76.0 100

18 Financial Report 2012
Currency No. of Issues
EUR in millions
Currency in millions
Average Maturity
%
AUD 5 1 289 1 560 10.2 2
SEK 16 1 156 10 150 11.2 2
CHF 10 848 1 025 10.6 1
NOK 16 564 4 255 5.2 1
RUB 13 412 16 500 4.8 1
JPY 5 337 33 850 13.9 0
TRY 13 195 451 3.8 0
ZAR 2 41 450 5.8 0
PLN 1 24 100 10.0 0
Total 81 4 867 9.4 7
Other currencies and products:
• Issuance included four Climate Awareness Bond (CAB) transactions (SEK 3.05 billion), of which the proceeds are used exclusively to finance projects supporting climate action, specifically within the fields of renewable energy and energy efficiency.
• Synthetic markets: The Bank also issued in synthetic format in Argentine peso (ARS), Brazilian real (BRL), Ghanaian cedi (GHS) and Indian rupee (INR). These issues are booked under the corresponding pay-ment and settlement currencies EUR and USD.
Maturity mix of EIB funding
Maturity profile highlights:
• EUR cost and demand levels were generally more fa-vourable in longer tenors compared with other core currencies, while attractive funding opportunities in USD and GBP were more concentrated in shorter tenors.
EUR GBP USD Other
0-2.5 2.5-3.5 3.5-6 6-8 8-12 12-22 22-32 >32
24
22
20
18
16
14
12
10
8
6
4
2
0
AUD 27% SEK 24% CHF 17% NOK 12% RUB 8% JPY 7% TRY 4% Other 1%
Other currencies: Diversification for EIB funding
Other currencies:
• The share of non-core currencies decreased to 7% (2011: 12%) as investors were more focused on liquid products in the Bank’s core currencies.
• The largest volume in non-core currencies was in AUD, followed by SEK, CHF and NOK.
Volu
me
(EU
R eq
uiv
. bn
)
years

192012 Financial Report
EIB Treasury Activities in 2012
The liquidity situation of the Bank remained strong all year long and the prudential limits and indicators were complied
with at all times in the course of 2012. In spite of an unfavourable
decreasing yield environment, continued asset price volatility
and market uncertainty, the overall economic contribution of
treasury activities improved substantially in 2012.
Liquidity and portfolio management
The 2012 average monthly total net liquidity amounted to EUR 51.2 billion4, i.e. 14.8% more than the 2011 level of EUR 44.6 billion. The EIB was therefore able to achieve an average liquidity ratio of 76.6%, which was well above the minimum liquidity requirement of 25% of the forecast net cash outflows for the following cal-endar year. At 31 December 2012, the Bank’s total net li-quidity amounted to EUR 48.0 billion (EUR 33.5 billion at year-end 2011), corresponding to a liquidity ratio of 64.6%. As in the previous year, treasury net liquidity was more concentrated on the short-term money mar-ket portfolio, totalling 90.3% as of year-end, compared to 82.8% in 2011. As a result, the liquidity invested in the operational portfolios with duration above three months decreased from 17.2% to 9.7%.
The component portfolios of the operational treasury can be described as follows: • A short-term money market portfolio (A1), designed
for daily liquidity management in 14 different cur-rencies.
• A short-term bond portfolio (A2), with maturities of up to 18 months and designed to diversify the cred-it risk profile and enhance money market invest-ments in the core currencies (EUR, GBP and USD).
• A credit spread portfolio (B1), designed to enhance overall treasury performance by investing in float-ing-rate or asset-swapped securities with a maturity of up to five years.
• A fixed-rate portfolio (B3), with a benchmark based on the iBoxx Eurozone 1 to 3-year Government Bond Index.
• An inflation-linked bond portfolio (B4), invested in EUR denominated government bonds indexed to national or euro area consumer inflation (HICP).
• A legacy investment bond portfolio, which is being phased out and whose duration was five years as of year end.
Short-term gross liquidity held in the money market portfolio (A1) as of 31 December 2012 was higher at

20 Financial Report 2012
EUR 60.7 billion (EUR 47.4 billion in 2011). The short-term liabilities5 of EUR 24.4 billion (EUR 31.5 billion in 2011) consisted principally of the outstandings of the EIB’s commercial paper issuance (EUR 13.0 billion) and cash collateral (EUR 10.8 billion). The five other port-folios, including the investment portfolio, amounted to EUR 4.7 billion (EUR 5.8 billion in 2011).
Market developments and treasury financial result
2012 was a year which, despite a steady start due to the European Central Bank’s (ECB) new 3-year Long Term Refinancing Operations (LTRO), saw continued asset price volatility as a result of escalation of concerns about certain EU sovereigns. As in the previous year, market confidence deteriorated on the back of the weaker growth outlook, notably for the Eurozone. The result was a marked increase in government bond yields in certain European markets, whereas speculation about exits from the Eurozone further fuelled the asset price volatility. The financial sector was again under the spot-light amid talks related to regulation, along with capital concerns regarding certain parts of the banking sector. These fears were substantially alleviated by the confir-mation of aid from the European Financial Stability Fa-cility (EFSF) that would be used to improve the capital stock in the banking sector and by the subsequent crea-tion of the European Stability Mechanism (ESM). As the
year progressed, there were increasing calls for the ECB to provide a credible backstop in order to limit the esca-lation of the sovereign crisis. The ECB announced the Outright Monetary Transaction (OMT) programme in the third quarter, enabling unlimited ECB purchases of sovereign bonds in the secondary market, with a focus on the shorter end of the yield curve. The programme was very well received by the market as a credible back-stop, and facilitated a significant reduction in sovereign yields by year-end and thus helped the year to close on an optimistic note.
In this context, the total average rate of return on the Bank’s liquidity increased from 1.37% in 2011 to 1.46% at year-end 2012. The financial income from treasury opera tional portfolios (including the investment bond portfolio) amounted to EUR 530.4 million against EUR 443.2 million in 2011 (up 20%). Whereas the A1 portfolio saw its accounting income decrease from EUR 401.6 million in 2011 to EUR 320.1 million for the year 2012, the combined bond portfolios (A2 + Bs + in-vestment bond portfolio) generated a positive accounting result of EUR 209.7 million compared to EUR 41.4 million in 2011.
4 Net liquidity is calculated as total treasury assets less treasury liabilities with ini-tial maturities of less than 90 days.
5 Excluding principal adjustment on IRS and third party vostro accounts.

212012 Financial Report
Audit and Control
Audit Committee – The Audit Committee is an inde-pendent statutory body, appointed by and reporting di-rectly to the Board of Governors, in compliance with the formalities and procedures defined in the Bank’s Statute and Rules of Procedure. The role of the Audit Commit-tee is to verify that the Bank’s operations have been conducted and its books kept in a proper manner and that the activities of the Bank conform to best banking practice. The Audit Committee has overall responsibility for the auditing of the Bank’s accounts.
The Audit Committee is composed of six members, who are appointed by the Board of Governors for a non-re-newable term of six years. Members are chosen from among persons having independence, competence and integrity and who possess financial, auditing or banking supervisory expertise in the private or public sector. In addition, a maximum of three observers may be ap-pointed to the Audit Committee on the basis of their particular qualifications, especially with regard to bank-ing supervision. In July 2011, the Board of Governors ap-pointed one observer to the Audit Committee for a non-renewable term of six years.
The Audit Committee provides Statements each year on whether the financial statements, as well as any other fi-nancial information contained in the financial report drawn up by the Board of Directors, give a true and fair view of the financial position of the Bank, the EIB Group, and certain Trust Funds administered by the Bank. The Audit Committee reports on the EIB’s compliance with best banking practice through its Annual Report to the Board of Governors.
In fulfilling its role, the Audit Committee meets with rep-resentatives of the other statutory bodies, reviews the fi-nancial statements, oversees the verification procedures and practical modalities for implementing and maintain-ing the framework of best banking practices applicable to the Bank’s services, takes note of the work performed by the internal auditors, monitors the work of the exter-nal auditors, safeguards the independence of the exter-nal audit function, and coordinates audit work in general. Regular meetings with Bank staff and reviews of internal and external reports enable the Audit Committee to un-

22 Financial Report 2012
derstand and monitor how Management is providing for adequate and effective internal control systems, risk management and internal administration. The Inspector General, the Chief Compliance Officer and the Financial Controller have direct access to the Audit Committee and may request private meetings if necessary.
External Auditors – The EIB’s external auditors, KPMG, report directly to the Audit Committee, which is em-powered to delegate the day-to-day work of auditing the financial statements to them. The external auditors are not allowed to carry out any work of an advisory na-ture or act in any other capacity that might compromise their independence when performing their audit tasks. A summary of services provided by the external audi-tors and the associated fees is published each year by the Bank on its website.
Financial Control – Financial Control (FC) was trans-formed into a Directorate in September 2012 and hence now reports directly to the Bank’s Management Commit-tee. FC’s main responsibilities relate to the Bank’s books and records and its various financial statements. Togeth-er with the Secretary General, the Financial Controller manages the relationship with the external auditors, the Audit Committee and the European Court of Auditors.
Inspectorate General – The Inspectorate General for the EIB Group comprises four independent control functions.
Internal Audit. Catering for audit needs at all levels of management of the EIB Group and acting with the guarantees of independence and of professional stand-ards conferred upon it by its Charter, Internal Audit ex-amines and evaluates the relevance and effectiveness of the internal control systems and the procedures in-volved in managing risk within the Group. An internal control framework covering all key operational activities of the Group and any newly identified processes contin-ues to be maintained. Action Plans agreed with the Bank’s departments are a catalyst for improving proce-dures and strengthening controls. In support of the Audit Committee’s mandate on best banking practice, Inter-nal Audit includes such assessments in all elements of its work. Internal Audit therefore reviews and tests con-trols in critical banking, information technology and ad-ministrative areas on a rotational basis using a risk- based approach.
Operations Evaluation. Operations Evaluation (EV) inde-pendently carries out evaluations (mainly ex post) of the EIB Group’s operations. The objective is to assess EIB activities with a view to identifying aspects that could improve operational performance, accountability and transparency. EV focuses on how the institution (EIB/EIF) conducts its operations within the framework of rele-vant EU policies and the decisions of the EIB’s Governors.
EV’s work also includes analysis of the related policies and strategies to identify those aspects that may need to be reviewed by the appropriate bodies. Evaluation re-ports are published in a dedicated section of the EIB’s website (www.eib.org/evaluation).
Fraud Investigation. Under the anti-fraud policy ap-proved by the Board, the Inspector General, through the Fraud Investigation Division (IG/IN), has the author-ity to conduct independent inquiries into allegations of possible fraud, corruption, collusion or coercion involv-ing EIB operations or activities. The Bank may also call upon external assistance or experts in accordance with the requirements of the inquiry, and works closely with the services of the European Anti-Fraud Office (OLAF). The scope of activities also encompasses a proactive an-ti-fraud approach – the Proactive Integrity Reviews (PIRs). Through PIRs the Inspectorate General supports the Bank’s efforts to monitor projects, identify red flags and search for possible indicators of fraud and/or cor-ruption. Projects are selected for PIRs independently by IG on the basis of an extensive risk assessment process. Moreover, IG/IN is working to implement Exclusion Pro-cedures, which will permit the Management Committee, following an adversary procedure resulting in a recom-mendation from an Exclusion Committee, to sanction (i.e. exclude from future operations and activities for a certain length of time) entities found to have engaged in fraud or corruption.
Complaints Mechanism. The EIB Complaints Mechanism, as defined by its published Principles, Terms of Refer-ence and Rules of Procedure, is a tool of horizontal ac-countability of the EIB Group vis-à-vis its stakeholders as regards the handling of complaints concerning its activi - ties. It ensures that stakeholders have appropriate means available to voice their concerns and aims to pro-vide the public with procedures to enable the pre-emp-tive settlement of disputes between the public and the EIB Group. Any member of the public has access to a two-tier sequential mechanism: an internal part – under the responsibility of the Complaints Mechanism Divi-sion (EIB-CM) – and, if a complainant is not satisfied with the outcome of the internal mechanism, an external one – the European Ombudsman. To that end, the EIB and the European Ombudsman have signed a Memo-randum of Understanding.
Office of the Group Chief Compliance Officer (OCCO) – In accordance with the principles set out by the Basel Committee, OCCO’s remit is: “to identify, assess, advise on, monitor and report on the compliance risk of the EIB Group, that is, the risk of legal or regulatory sanctions, financial loss, or loss to reputation a member of the EIB Group may suffer as a result of its failure to comply with all applicable laws, regulations, staff codes of conduct and standards of good practice.” In particular, OCCO “acts as a first line detec-
232012 Financial Report
Audit and Control
tor of potential incidents of non-observance or breaches by the staff of the rules on ethics and integrity, monitors com-pliance therewith by the staff of the EIB Group and recom-mends the adoption of such protective or redressing measures as are appropriate.”
OCCO is a group function headed by the Group Chief Compliance Officer (GCCO), supported by a dedicated compliance unit at the EIF. It is an independent function
“reporting directly to the President of the EIB under the functional authority of a Vice-President” pursuant to the EIB Integrity Policy and Compliance Charter.
OCCO is entrusted with a control mission and acts in close cooperation with EIB operational services, the Le-gal Directorate and other control services such as IG/In-vestigations.
Regular contacts are held by GCCO with peer interna-tional financial institutions (such as the World Bank, the EBRD and the IFC), EU bodies, standard-setting interna-tional organisations (e.g. FATF) and local authorities (e.g. FIU Luxembourg) in order to enable ongoing alignment of OCCO activities with relevant international standards and best banking practice.
OCCO activities are currently focused on the following main areas: 1. the assessment of integrity, money laundering and
financing of terrorism risks in EIB operations for EIB lending, borrowing and treasury activities;
2. the establishment and updating of policies and guide-lines, with particular reference to (i) money launder-ing/financing of terrorism (AML-CFT); (ii) specific transparency/integrity risks (e.g. for operations linked to weakly regulated jurisdictions); and (iii) primary
ethics and regulatory issues (e.g. insider dealing, con-flicts of interest, etc.);
3. administration of (i) the Staff Code of Conduct and (ii) the Management Committee Code of Conduct, except for matters within the remit of the Ethics and Compliance Committee; and
4. controls on procedures related to procurement for the Bank’s own account.
The above activities are complemented by regular train-ing and awareness-building initiatives (AML-CFT train-ing; presentations of OCCO activities to newcomers and members of EIB governing bodies; presentations and workshops on main OCCO policies and general compli-ance issues), in order to ensure staff awareness and, whenever possible, involvement in OCCO control activi-ties for the timely detection and management of com-pliance risks within the EIB Group.
Management Control – Within the Secretariat General, the Planning, Budget and Analytics Division brings to-gether the functions responsible for management con-trol – namely operational planning, budget/cost accounting and associated analyses as well as partner-ship coordination. This structure ensures that the over-all planning and management reporting processes are coordinated and support the achievement of the Bank-wide objectives and ultimately that the results achieved are monitored. Key tools include the Corporate Opera-tional Plan, the budget and independent opinions and analysis on proposals affecting them, plus the associat-ed management accounting and control systems. A suite of integrated reports facilitates ongoing evalua-tion of the situation in relation to strategy, institutional and operational (including financial) objectives and business plans.


NP 25Financial Report 2011 2012 Financial Report
EIB Statutory Financial Statements of the Bank
EIBStatutory Financial Statements of the Bankas at 31 December 2012

26 Financial Report 2012
Balance sheetas at 31 December 2012 (in EUR ’000)
Assets 31.12.2012 31.12.2011
1. Cash in hand, balances with central banks and post office banks (Note B.1)
157 362
427 463
2. Treasury bills and other bills eligible for refinancing with central banks (Note B.2)
17 462 708
14 029 737
3. Loans and advances to credit institutions
a) repayable on demand 1 015 430 908 250
b) other loans and advances (Note C) 50 175 653 39 512 753
c) loans (Note D.1) 124 500 426 133 861 282
d) value adjustments (Note D.2) -35 900 0
175 655 609 174 282 285
4. Loans and advances to customers
a) other loans and advances 5 120 0
b) loans (Note D.1) 276 155 907 249 726 477
c) value adjustments (Note D.2) -305 649 -192 790
275 855 378 249 533 687
5. Debt securities including fixed-income securities (Note B.2)
a) issued by public bodies 3 692 079 1 302 779
b) issued by other borrowers 5 617 234 9 045 447
9 309 313 10 348 226
6. Shares and other variable-yield securities (Note E.1) 2 273 743 1 913 201
7. Shares in affiliated undertakings (Note E.2) 493 532 491 588
8. Intangible assets (Note F) 9 801 10 402
9. Tangible assets (Note F) 293 716 304 476
10. Other assets (Note G) 203 514 113 538
11. Subscribed capital, called but not paid (Note H.3) 9 992 427 0 12. Prepayments and accrued income (Note I) 16 420 281 20 393 251
Total assets 508 127 384 471 847 854
The accompanying notes form an integral part of these financial statements.
272012 Financial Report
EIB Statutory Financial Statements of the Bank
Liabilities 31.12.2012 31.12.2011
1. Amounts owed to credit institutions (Note J)a) repayable on demand 10 708 287 10 969 469
b) with agreed maturity dates or periods of notice 952 306 1 190 595
11 660 593 12 160 064 2. Amounts owed to customers (Note J)
a) repayable on demand 2 071 558 1 630 588
b) with agreed maturity or periods of notice 658 637 960 037
2 730 195 2 590 625 3. Debts evidenced by certificates (Note K)
a) debt securities in issue 400 349 871 376 154 543
b) others 24 323 888 25 281 246
424 673 759 401 435 789 4. Other liabilities (Note G) 623 164 520 678 5. Accruals and deferred income (Note I) 11 499 540 11 077 013 6. Provisions
a) pension plans and health insurance scheme (Note L) 1 714 954 1 578 063
b) provision for commitment on investment funds 7 279 8 026
1 722 233 1 586 089 7. Subscribed capital (Note H)
a) subscribed 242 392 989 232 392 989
b) uncalled -220 773 340 -220 773 340
21 619 649 11 619 649 8. Reserves (Note H)
a) reserve fund 21 596 628 20 972 343
b) additional reserves 1 144 024 1 144 024
c) special activities reserve 5 140 386 4 108 940
d) general loan reserve 2 976 909 2 340 863
30 857 947 28 566 170 9. Profit for the financial year 2 740 304 2 291 777
Total liabilities 508 127 384 471 847 854
The accompanying notes form an integral part of these financial statements.

28 Financial Report 2012
Off balance sheetas at 31 December 2012 (in EUR ’000)
31.12.2012 31.12.2011
Commitments:- EBRD capital uncalled (Note E.1) 712 630 442 500
- EIF capital uncalled (Notes E.2, X) 1 491 200 1 486 400
- Undisbursed loans (Note D.1)
- credit institutions 19 786 999 20 022 455
- customers 62 129 484 65 784 468
81 916 483 85 806 923
- Undisbursed venture capital operations (Note E.1) 1 904 034 1 782 524
- Undisbursed investment funds (Note E.1) 539 385 547 148
Contingent liabilities and guarantees:
- In respect of loans granted by third parties 839 002 844 063
- In respect of venture capital operations 40 866 60 524
Assets held on behalf of third parties (Note Z):
- NER300 2 270 706 2 078 869
- Investment Facility – Cotonou 2 132 527 1 825 259
- Guarantee Fund 2 021 325 1 756 205
- JESSICA (Contribution and Holding Funds) 1 758 775 1 549 100
- FP7 Guarantee Fund 1 432 835 1 149 231
- RSFF 1 070 588 789 554
- EIF 1 005 068 889 808
- Special Section 781 550 943 954
- EU-Africa Infrastructure Trust Fund 503 242 294 630
- GF Greece 300 000 0
- ENPI 168 489 161 228
- LGTT 163 275 154 831
- ECHA 121 614 148 616
- AECID 100 155 100 002
- NIF Trust Fund 55 301 55 019
- PBI 50 000 0
- HIPC 39 878 59 722
- FEMIP Trust Fund 29 868 30 395
- EPTA Trust Fund 9 086 7 348
- JASPERS 3 221 1 637
- EPEC 415 0
14 017 918 11 995 408
Other items:
- Nominal value of interest-rate swap and deferred rate-setting contracts (Note V.1)
432 817 455
401 211 736
- Nominal value of currency swap contracts receivable (Note V.1) 190 231 826 185 661 830
- Nominal value of currency swap contracts payable (Note V.1) 183 578 841 174 707 592
- Forward rate agreements (Note V.2) 4 946 600 6 606 400
- Nominal value of put option granted to EIF minority shareholders (Note E.2)
424 376
385 841
- Currency forwards (Note V.2) 363 762 321 547
- Swaps launched but not yet settled 16 475 60 394
- Special deposits for service of borrowings (Note S) 16 311 29 685
- Securities lending (Note B.2) 0 608 174
- Future contracts (Note V.2) 0 386 190
The accompanying notes form an integral part of these financial statements.
292012 Financial Report
EIB Statutory Financial Statements of the Bank
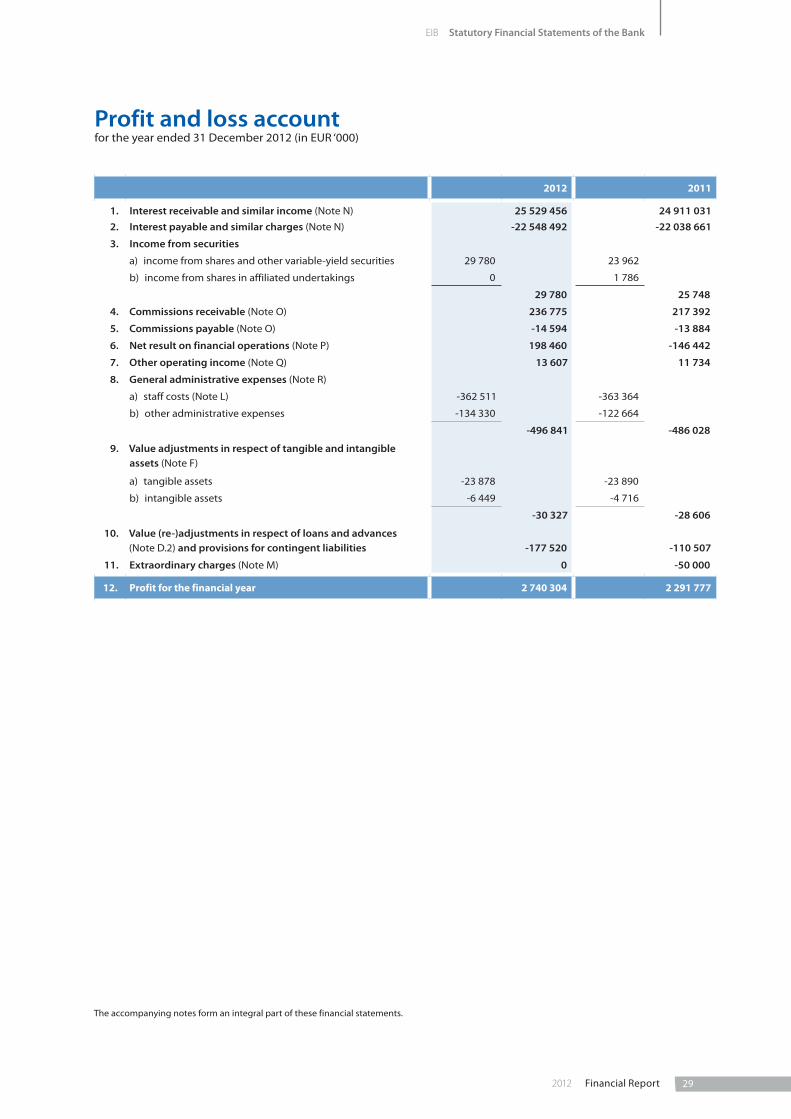
Profit and loss accountfor the year ended 31 December 2012 (in EUR ‘000)
2012 2011
1. Interest receivable and similar income (Note N) 25 529 456 24 911 031 2. Interest payable and similar charges (Note N) -22 548 492 -22 038 661
3. Income from securities
a) income from shares and other variable-yield securities 29 780 23 962
b) income from shares in affiliated undertakings 0 1 786
29 780 25 748
4. Commissions receivable (Note O) 236 775 217 392
5. Commissions payable (Note O) -14 594 -13 884
6. Net result on financial operations (Note P) 198 460 -146 442
7. Other operating income (Note Q) 13 607 11 734
8. General administrative expenses (Note R)
a) staff costs (Note L) -362 511 -363 364
b) other administrative expenses -134 330 -122 664
-496 841 -486 028
9. Value adjustments in respect of tangible and intangible assets (Note F)
a) tangible assets -23 878 -23 890
b) intangible assets -6 449 -4 716
-30 327 -28 606
10. Value (re-)adjustments in respect of loans and advances (Note D.2) and provisions for contingent liabilities
-177 520
-110 507
11. Extraordinary charges (Note M) 0 -50 000
12. Profit for the financial year 2 740 304 2 291 777
The accompanying notes form an integral part of these financial statements.
30 Financial Report 2012
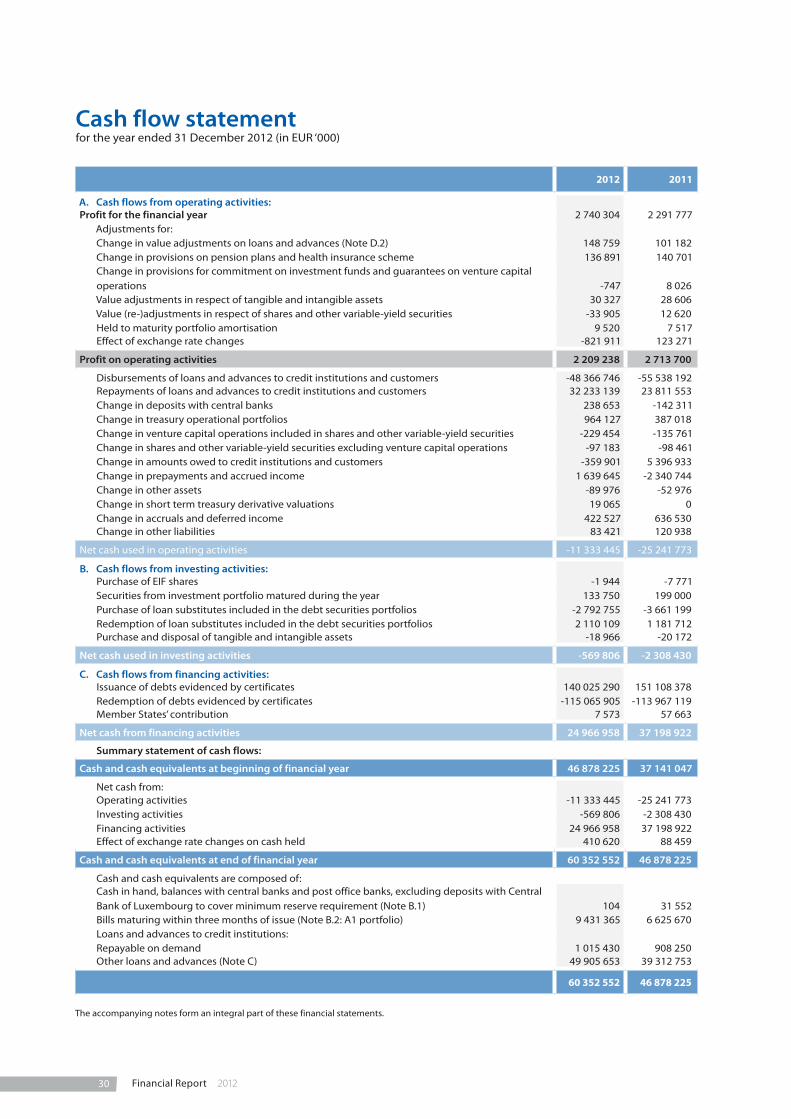
Cash flow statementfor the year ended 31 December 2012 (in EUR ‘000)
2012 2011
A. Cash flows from operating activities:Profit for the financial year 2 740 304 2 291 777
Adjustments for:Change in value adjustments on loans and advances (Note D.2) 148 759 101 182 Change in provisions on pension plans and health insurance scheme 136 891 140 701 Change in provisions for commitment on investment funds and guarantees on venture capital operations
-747
8 026
Value adjustments in respect of tangible and intangible assets 30 327 28 606 Value (re-)adjustments in respect of shares and other variable-yield securities -33 905 12 620 Held to maturity portfolio amortisation 9 520 7 517 Effect of exchange rate changes -821 911 123 271
Profit on operating activities 2 209 238 2 713 700
Disbursements of loans and advances to credit institutions and customers -48 366 746 -55 538 192 Repayments of loans and advances to credit institutions and customers 32 233 139 23 811 553 Change in deposits with central banks 238 653 -142 311 Change in treasury operational portfolios 964 127 387 018 Change in venture capital operations included in shares and other variable-yield securities -229 454 -135 761 Change in shares and other variable-yield securities excluding venture capital operations -97 183 -98 461 Change in amounts owed to credit institutions and customers -359 901 5 396 933 Change in prepayments and accrued income 1 639 645 -2 340 744 Change in other assets -89 976 -52 976 Change in short term treasury derivative valuations 19 065 0 Change in accruals and deferred income 422 527 636 530 Change in other liabilities 83 421 120 938
Net cash used in operating activities -11 333 445 -25 241 773
B. Cash flows from investing activities:Purchase of EIF shares -1 944 -7 771 Securities from investment portfolio matured during the year 133 750 199 000 Purchase of loan substitutes included in the debt securities portfolios -2 792 755 -3 661 199 Redemption of loan substitutes included in the debt securities portfolios 2 110 109 1 181 712 Purchase and disposal of tangible and intangible assets -18 966 -20 172
Net cash used in investing activities -569 806 -2 308 430
C. Cash flows from financing activities:Issuance of debts evidenced by certificates 140 025 290 151 108 378 Redemption of debts evidenced by certificates -115 065 905 -113 967 119 Member States’ contribution 7 573 57 663
Net cash from financing activities 24 966 958 37 198 922
Summary statement of cash flows:
Cash and cash equivalents at beginning of financial year 46 878 225 37 141 047
Net cash from:Operating activities -11 333 445 -25 241 773 Investing activities -569 806 -2 308 430 Financing activities 24 966 958 37 198 922 Effect of exchange rate changes on cash held 410 620 88 459
Cash and cash equivalents at end of financial year 60 352 552 46 878 225
Cash and cash equivalents are composed of:Cash in hand, balances with central banks and post office banks, excluding deposits with Central Bank of Luxembourg to cover minimum reserve requirement (Note B.1)
104
31 552
Bills maturing within three months of issue (Note B.2: A1 portfolio) 9 431 365 6 625 670 Loans and advances to credit institutions:Repayable on demand 1 015 430 908 250 Other loans and advances (Note C) 49 905 653 39 312 753
60 352 552 46 878 225
The accompanying notes form an integral part of these financial statements.

312012 Financial Report
EIB Statutory Financial Statements of the Bank
European Investment Bank
Notes to the financial statementsas at 31 December 2012
The European Investment Bank (the ‘Bank’ or ‘EIB’) was created by the Treaty of Rome in 1958 as the long-term lending bank of the European Union (‘EU’). The task of the Bank is to contribute towards the integration, bal-anced development and economic and social cohesion of the EU Member States. The EIB raises substantial vol-umes of funds on the capital markets and lends these funds on favourable terms to projects furthering EU policy objectives. The EIB continuously adapts its activi-ties to developments in EU policies.
The Bank has its registered office at 98-100, boulevard Konrad Adenauer, Luxembourg.
Note A – Significant accounting policies
A.1. Accounting standards
The unconsolidated financial statements (the ‘Financial Statements’) of the European Investment Bank have been prepared in accordance with the general princi-ples of the Directive 86/635/EEC of the Council of the European Communities of 8 December 1986 on the annual accounts and consolidated accounts of banks and other financial institutions, as amended by Direc-tive 2001/65/EC of 27 September 2001, by Directive 2003/51/EC of 18 June 2003 and by Directive 2006/46/EC of 14 June 2006 on the annual and consolidated accounts of certain types of companies, banks and other financial institutions (the ‘Directives’). However, the Financial Statements do not include any manage-ment report. The Bank prepares an Activity Report which is presented separately from the Financial State-ments and its consistency with the Financial State-ments is not audited.
On a proposal from the Management Committee, the Board of Directors adopted the Financial Statements on 14 March 2013 and authorised their submission to the Board of Governors for approval by 30 April 2013.
In preparing the Financial Statements, the Management Committee is required to make estimates and assump-tions that affect reported income, expenses, assets, lia-bilities and disclosure of contingent assets and liabilities. Use of available information and application of judge-ment are inherent in the formation of estimates. Actual results in the future could differ from such estimates
and the resulting differences may be material to the Financial Statements.
The Bank also publishes consolidated financial state-ments as at the same date as the annual Financial Statements.
A.2. Foreign currency translation
The EIB uses the euro (EUR), the single currency of the Member States participating in the third stage of Eco-nomic and Monetary Union, as the unit of measure for the capital accounts of Member States and for present-ing its Financial Statements.
The Bank conducts its operations in the currencies of its Member States, in euro and in non-EU currencies.
Its resources are derived from its capital, borrowings and accumulated earnings in various currencies.
Foreign currency transactions are translated at the exchange rate prevailing on the date of the transaction. The Bank’s monetary assets and liabilities denominated in currencies other than euro are translated into euro at closing exchange rates prevailing at the balance sheet date. The gain or loss arising from such translation is recorded in the profit and loss account.
A.3. Derivatives
The Bank uses derivative instruments, mainly currency and interest rate swaps, as part of its asset and liability management (“ALM”) activities to manage exposures to interest rate and foreign currency risks, including expo-sures arising from forecast transactions. All derivatives transactions are booked at nominal as off-balance sheet items at the date of the transaction.
The majority of the Bank’s swaps are concluded with a view to hedging specific bond issues. The Bank enters into currency swaps, whereby the proceeds of a borrowing are initially converted into a different currency and on maturity the Bank will obtain the amounts needed to service the borrowing in the orig-inal currency.
The Bank also enters into currency, interest rate and overnight index swaps as part of its hedging

32 Financial Report 2012
operations on loans or for the global ALM position. The corresponding interest is accounted for on a pro rata temporis basis.
The Bank also uses derivative instruments as part of its treasury operations.
A.3.1. Trading and available for sale portfolio derivatives
The Bank changed its accounting policy from 1 January 2012 in respect of the application of market values to derivatives hedging certain transferable securities which are not held as financial fixed assets.
Accounting policy applicable until 31 December 2011:
Currency swaps
Currency swap contracts are entered into in order to adjust currency positions. The revaluation of the spot leg of a currency swap is neutralised in Accruals and deferred income or Prepayments and accrued income. The forward leg of the currency swap is recorded off-balance sheet at settlement amount and is not reval-ued. The premium/discount between the spot and forward settlement amounts is amortised pro rata temporis through the profit and loss account in Inter-est receivable and similar income or Interest payable and similar charges.
Interest rate swaps
The hedging interest rate swaps are not revalued. The interest received and paid under interest rate swaps is accrued pro rata temporis and reported in the profit and loss account under Interest receivable and similar income or Interest payable and similar charges.
Futures
Long term futures are used by the Bank to adjust the interest rate exposure of its treasury bond portfolios. Futures are valued by reference to the previous day’s closing price on the relevant market.
Accounting policy applicable from 1 January 2012:
Trading and available for sale portfolio derivatives are recorded at market value in the balance sheet as Other assets when their market value is positive or Other lia-bilities when their market value is negative. Changes in the market value are included in Net result on financial operations. Market values are obtained from quoted market prices, discounted cash flow models and option pricing models, which consider current market and contractual prices for the underlying instrument, as well as time value of money, yield curve and volatil-ity of the underlying.
Interest on derivative instruments is accrued pro-rata temporis under Prepayments and accrued income or Accruals and deferred income.
Currency swaps
Currency swap contracts are entered into in order to adjust currency positions. The revaluation of the spot leg of a currency swap is neutralised in Accruals and deferred income or Prepayments and accrued income. The premium/discount between the spot and forward settlement amounts is amortised pro rata temporis through the profit and loss account in Interest receiva-ble and similar income or Interest payable and similar charges. The market value is recorded under Other assets when their market value is positive or Other lia-bilities when their market value is negative. Changes in the market value are included in Net result on financial operations.
Interest rate swaps
The interest received and paid under interest rate swaps is accrued pro rata temporis and reported in the profit and loss account under Interest receivable and similar income or Interest payable and similar charges. The market value is recorded under Other assets when their market value is positive or Other liabilities when their market value is negative. Changes in the market value are included in Net result on financial operations.
Futures
Long term futures are used by the Bank to adjust the interest rate exposure of its treasury bond portfolios. Futures are valued by reference to the previous day’s closing price on the relevant market.
A.3.2. All other derivatives
Currency swaps
Currency swap contracts are entered into in order to adjust currency positions. The revaluation of the spot leg of a currency swap is neutralised in Accruals and deferred income or Prepayments and accrued income. The forward leg of the currency swap is recorded off-balance sheet at settlement amount and is not reval-ued. The premium/discount between the spot and forward settlement amounts is amortised pro rata temporis through the profit and loss account in Inter-est receivable and similar income or Interest payable and similar charges.
Interest rate swaps
The hedging interest rate swaps are not revalued. The interest received and paid under interest rate swaps is accrued pro rata temporis and reported in the profit

332012 Financial Report
EIB Statutory Financial Statements of the Bank
and loss account under Interest receivable and similar income or Interest payable and similar charges.
Forward rate agreements
Forward rate agreements are concluded for hedging purposes and are recorded off balance sheet on trade date. The difference between the contractual forward rates and the year end rates are reported in the profit and loss account under Interest receivable and similar income or Interest payable and similar charges.
Currency forwards
Currency forwards are entered into in order to adjust future currency positions. The forward leg is recorded off-balance sheet at settlement amount and is not reval-ued. The difference between the spot amounts and the forward settlement amounts is amortised pro rata tem-poris through the profit and loss account in Interest receivable and similar income or Interest payable and sim-ilar charges.
Interest on derivative instruments is accrued pro-rata temporis under Prepayments and accrued income or Accruals and deferred income.
A.4. Financial assets
Financial assets are accounted for using the settlement date basis.
A.5. Cash and cash equivalents
The Bank defines cash and cash equivalents as short term, highly liquid securities and interest-earning deposits with maturities of 90 days or less.
A.6. Treasury bills and other bills eligible for refinancing with central banks and debt securities including fixed-income securities
With a view to clarifying management of its liquid assets, the Bank has established the following portfolio catego-ries:
A.6.1. Investment portfolio
The investment portfolio consists of securities pur-chased with the intention of holding them to maturity. These securities are issued or guaranteed by:
• Governments of the European Union Member States, G10 countries and their agencies;
• Supranational public institutions, including multina-tional development banks.
These securities are initially recorded at purchase price or more exceptionally at transfer price. Value adjust-ments are accounted for, if these are other than tempo-rary. The difference between entry price and redemption value is accounted for pro-rata temporis over the life of the securities.
In 2006, the Bank decided to phase out the investment portfolio. Since then, the Bank has not made any new additions to the investment portfolio and will keep the existing portfolio lines until final maturity, upon which the redemption proceeds of such matured securities will be invested in the operational portfolios described in paragraph A.6.2.
A.6.2. Operational portfolios
The Bank changed its accounting policy from 1 January 2012 in respect of the application of market values to certain transferable securities which are not held as financial fixed assets.
• Operational money market portfolios A1 and A2
In order to maintain an adequate level of liquidity, the Bank purchases money market products with a maxi-mum maturity of 18 months, in particular Treasury bills and negotiable debt securities issued by public bodies and credit institutions. The securities in the A1 portfo-lio are held until their final maturity and presented in the Financial Statements at amortised cost. Value adjustments are accounted for, if these are other than temporary.
The A2 portfolio includes securities with maturities of up to 18 months which are available for sale.
Accounting policy applicable until 31 December 2011:
Bonds were initially recorded at acquisition cost and presented in the Financial Statements at the lower of amortised cost or market value. Value adjustments were recorded under Net result on financial operations in the profit and loss account.
Accounting policy applicable from 1 January 2012:
Bonds are initially recorded at acquisition cost and pre-sented in the Financial Statements at market value. Changes in market value are recorded under Net result on financial operations in the profit and loss account. The difference between acquisition cost and redemp-tion amount is amortised pro rata temporis as Interest receivable and similar income.
• Operational bond portfolios B1, B3 and B4
The B1 ‘Credit Spread’ portfolio comprises of floating-rate and fixed-rate bonds issued or guaranteed by national governments, supranational institutions,
34 Financial Report 2012
financial institutions and corporations. These securities are available for sale.
Accounting policy for the B1 portfolio applicable until 31 December 2011:
Bonds were initially recorded at acquisition cost and presented in the Financial Statements at the lower of cost or market value. Value adjustments were recorded under Net result on financial operations in the profit and loss account.
Accounting policy for the B1 portfolio applicable from 1 January 2012:
Bonds are initially recorded at acquisition cost and pre-sented in the Financial Statements at market value. Changes in market value are recorded under Net result on financial operations in the profit and loss account. The difference between the acquisition cost and redemption amount is amortised pro rata temporis as Interest receivable and similar income.
The B3 ‘Global Fixed Income’ portfolio comprises listed securities with a maximum residual maturity of 10 years, issued and/or guaranteed by sovereigns, their agencies or by financial institutions. Securities held in this portfo-lio are marked to market value in the balance sheet; the corresponding changes in market value are recorded under Net result on financial operations in the profit and loss account.
The B4 ‘Inflation Linked Investment’ portfolio comprises listed securities with a maximum residual maturity of 30 years, issued by EU Governments. Securities held in this portfolio are marked to market value in the balance sheet; the corresponding changes in market value are recorded under Net result on financial operations in the profit and loss account.
The market value of treasury portfolios is based on pub-lished price quotations in an active market as the first source. For instruments without available published price quotations, the market values are determined by obtaining quotes from market participants and/or by using valuation techniques or models, based whenever possible on observable market data prevailing at the balance sheet date.
A.6.3. Loan substitutes
This portfolio mainly consists of obligations in the form of bonds, notes or certificates issued by Special Purpose Vehicles (SPV) or trust vehicles. These securities are clas-sified as held to maturity and initially recorded at pur-chase price and valued at amortised cost. The difference between purchase price and redemption value is accounted for pro-rata temporis over the life of the securities. Value adjustments are accounted for, if these are other than temporary.
A.7. Securities lending
In April 2003, the Bank signed an agreement for securi-ties lending with Northern Trust Global Investment act-ing as an agent to lend securities from the Investment portfolio, the B1 ‘Credit Spread’ portfolio, the B3 ‘Global Fixed Income’ portfolio and the B4 “Inflation Linked Investment” portfolio.
Securities received as collateral under securities lending transactions are not recognised in the balance sheet unless control of the contractual rights that are comprised in these received securities is gained. Securities lent are not derecognised from the balance sheet unless control of the contractual rights that are comprised in these trans-ferred securities is relinquished. Securities lent are recorded at the book value as an off balance-sheet item.
Fees and interest received or paid are recorded as inter-est income or interest expense on an accruals basis.
The agreement with Northern Trust Global Investment was terminated in November 2012.
A.8. Loans and advances to credit institutions and customers
A.8.1. Loans and advances
Loans and advances are included in the assets of the Bank at their net disbursed amounts. Value adjustments have been made for loans and advances outstanding at the end of the financial year and presenting risks of non-recovery of all or part of their amounts. Such value adjustments are held in the same currency as the assets to which they relate. Value adjustments are accounted for in the profit and loss account as ‘Value adjustments in respect of loans and advances’ and are deducted from the appropriate asset items on the balance sheet.
A.8.2. Interest on loans
Interest on loans is recorded in the profit and loss account on an accruals basis, i.e. over the life of the loans. On the balance sheet, accrued interest is included in ‘Prepayments and accrued income’ under assets. Value adjustments to interest amounts on these loans are determined on a case-by-case basis by the Bank’s Man-agement and deducted from the appropriate asset item on the balance sheet.
A.8.3. Reverse repurchase operations (reverse repos)
Under a tripartite reverse repo, a custodian/clearing agency arranges for custody, clearing and settlement of the transactions between the Bank and a third party.

352012 Financial Report
EIB Statutory Financial Statements of the Bank
The custodians/clearing agencies operate under stand-ardised global master purchase agreements and pro-vide for delivery against payment systems, substitution of securities, automatic marking to market, reporting and daily transaction administration.
Reverse repos are carried at the amounts of cash advanced and are entered on the balance sheet under Loans and advances to credit institutions – b) other loans and advances. Interest on reverse repos is accrued pro-rata temporis.
A.8.4. Interest subsidies
Interest subsidies received in advance (see Note I) are deferred and recognised in the profit and loss account over the period from disbursement to repayment of the subsidised loan.
A.9. Shares, other variable-yield securities and shares in affiliated undertakings
A.9.1. Shares and other variable-yield securities
The Bank acquires shares and other variable-yield secu-rities when it enters into venture capital operations, infrastructure funds or investment funds under the structured finance facility. Shares and other variable-yield securities are initially recorded at acquisition cost. Their carrying value is adjusted to the lower of cost or market value at subsequent measurement at the bal-ance sheet date.
Investments in venture capital enterprises, infrastruc-ture funds and investment funds represent shares and other variable-yield securities acquired for the longer term in the normal course of the Bank’s activities. They are initially recorded at their original purchase cost. Based on the reports received from fund managers up to the balance sheet date, the portfolios of investments are valued on a line-by-line basis at the lower of cost or attributable net asset value (‘NAV’), thus excluding any attributable unrealised gain that may be prevailing in the portfolio. The attributable NAV is determined through applying either the Bank’s percentage owner-ship in the underlying vehicle to the NAV reflected in the most recent report or, to the extent available, the value per share at the same date, submitted by the respective Fund Manager. The attributable NAV is adjusted for events having occurred between the date of the latest available NAV and the balance sheet date to the extent that such adjustment is considered to be material. Unrealised losses due solely to administrative expenses and management fees of venture capital, infrastructure funds and investment funds in existence for less than two years at the balance sheet date are not taken into consideration in determining the attributa-ble NAV.
A.9.2. Shares in affiliated undertakings
Shares in affiliated undertakings represent medium and long-term investments and are accounted for at cost. Value adjustments are accounted for, if these are other than temporary.
A.10. Tangible assets
Tangible assets include land, Bank-occupied properties, other machines and equipment.
Land is stated at acquisition cost and buildings are stated at acquisition cost less accumulated depreciation. The value of the Bank’s headquarters building in Luxem-bourg-Kirchberg and its buildings in Luxembourg-Hamm and Luxembourg-Weimershof are depreciated on a straight-line basis as set out below.
Permanent equipment, fixtures and fittings, furniture, office equipment and vehicles have been recorded in the balance sheet at their acquisition cost, less accumu-lated depreciation.
Depreciation is calculated on a straight-line basis over the estimated life of each item purchased, as set out below:
• Buildings in Kirchberg, Hamm and Weimershof: 30 years
• Permanent equipment, fixtures and fittings: 10 years
• Furniture: 5 years
• Office equipment and vehicles: 3 years
A.11. Intangible assets
Intangible assets comprise internally developed com-puter software. Software development costs are capital-ised if they meet certain criteria relating to identifiability, to the probability that future economic benefits will flow to the enterprise and to the reliability of cost meas-urement.
Internally developed software meeting these criteria is carried at cost less accumulated amortisation calcu-lated on a straight-line basis over three years from completion.
A.12. Pension plans and health insurance scheme
A.12.1. Pension plan for staff
The Bank operates defined benefit pension plans to pro-vide retirement benefits to substantially its entire staff.
36 Financial Report 2012
The Bank’s main pension scheme is a defined benefit pension scheme funded by contributions from staff and from the Bank which covers all employees. All contribu-tions of the Bank and its staff are invested in the assets of the Bank.
Commitments for retirement benefits are valued at least every year using the projected unit credit method, in order to ensure that the provision entered in the accounts is adequate. The latest valuation was carried out as at 30 September 2012 and was updated as at 31 December 2012 with an extrapolation (roll forward method) for the last three months of 2012. The main assumptions used by the actuary are set out in Note L.
Cumulative prior year actuarial deficits and surpluses in excess of 10% of the commitments for retirement bene-fits are recognised over the expected average remain-ing service lives of the plan’s participants on a straight line basis.
A.12.2. Health insurance scheme
The Bank has set up its own health insurance scheme for the benefit of staff, financed by contributions from the Bank and its employees. The health insurance scheme is managed and accounted for under the same principles as the pension plan for staff described in Note A.12.1. The latest valuation was carried out as at 30 September 2012 and was updated as at 31 December 2012 with an extrapolation (roll forward method) for the last three months of 2012.
A.12.3. The Management Committee pension plan
The Management Committee pension plan is a defined benefit pension scheme funded by contributions from the Bank only which covers all Management Committee members. All contributions of the Bank are invested in the assets of the Bank. The Management Committee pension plan is managed and accounted for under the same principles as the pension plan for staff described in Note A.12.1.
A.12.4. Optional Supplementary provident scheme
The optional supplementary provident scheme is a defined contribution pension scheme, funded by volun-tary staff’s contributions and employer’s contributions. The corresponding liability is recorded in Other liabilities.
A.13. Amounts owed to credit institutions and customers
Amounts owed to credit institutions and customers are presented in the financial statements at their redemp-tion amounts. Interest on amounts owed to credit
institutions and customers is recorded in the profit and loss account on an accruals basis as Interest payable and similar charges. Accrued interest is included in Accruals and deferred income under liabilities.
A.14. Debts evidenced by certificates
Debts evidenced by certificates are presented at their redemption amounts, except for zero coupon bonds which are presented at their amortised cost. Transaction costs and premiums/ discounts are amortised in the profit and loss account on a straight line basis over the life of the debt through Accruals and deferred income or Prepayments and accrued income. Interest expense on debt instruments is included in Interest payable and sim-ilar charges in the profit and loss account.
A.15. Provision for commitment on investment funds
This provision is intended to cover risks inherent in the Bank’s commitment on investment funds signed but not yet disbursed.
A.16. Reserves
A.16.1. Reserve fund
As foreseen by Article 22.1 of the Statute, “a reserve fund of up to 10% of the subscribed capital shall be built up progressively” from the retained profit of the Bank.
A.16.2. Additional reserves
Additional reserves contain the remaining retained earnings of the Bank.
A.16.3. Special activities reserve
As foreseen by Article 16.5 of the Statute, “the special activities of the Bank will have a specific allocation of reserve”. The reserve is based on the capital allocation of each operation.
A.16.4. General loan reserve
In 2009 a “general loan reserve” was introduced for the expected loss of the Bank’s loan and guarantee portfo-lio, modelled upon the Bank’s policy guidelines.
A.17. Taxation
The Protocol on the privileges and Immunities of the European Union appended to the treaty on European
372012 Financial Report
EIB Statutory Financial Statements of the Bank
Union and the treaty on the functioning of the Euro-pean Union, stipulates that the assets, revenues, and other property of the Institutions of the Union are exempt from all direct taxes.
A.18. Prepayments and accrued income
Expenditure incurred during the financial year but relating to a subsequent financial year, together with any income for which payment is not due until the expiry of the underlying instrument (principally inter-est on loans).
A.19. Accruals and deferred income
Income received before the balance sheet date but relating to a subsequent financial year, together with any charges which, though relating to the financial year in question, will be paid only in the course of a subse-quent financial year (principally interest on borrowings).
A.20. Interest receivable and similar income
In addition to interest and commission income on loans and deposits and other revenue from the securities portfolio, the ‘Interest receivable and similar income’ includes the indemnities received by the Bank for pre-payments made by its borrowers. The Bank changed its accounting policy from 1 January 2012 in respect of the treatment of these indemnities.
Accounting policy applicable until 31 December 2011:
In order to maintain equivalent accounting treatment between income on loans and the cost of borrowings, the Bank amortised prepayment indemnities received over the remaining life of the loans concerned.
Accounting policy applicable from 1 January 2012:
Prepayment indemnities are recognised in the profit and loss when received, as the revenue is earned.
A.21. Dividend income
Dividends are recognised in the profit and loss account when the entity’s right to receive payment is established.
A.22. Reclassification of prior year figures
Certain prior year figures have been reclassified to con-form with the current year’s presentation. The reclassifi-cations principally relate to:
• Redemption premiums on swaps receivable: - From: Loans and advances to credit institutions b) other loans and advances - To: Prepayments and accrued income
• Redemption premiums on swaps payable: - From: Amounts owed to credit institutions b) with agreed maturity dates or periods of notice - To: Accruals and deferred income
• Prepaid management fees: - From: Other liabilities - To: Accruals and deferred income
• Provision for commitment on investment funds: - From: Net result on financial operations - To: Value (re-)adjustments in respect of loans and advances and provisions for contingent liabilities
A.23. Changes in accounting policies
A.23.1. Transferable securities not held as financial fixed assets
The Bank changed its accounting policies from 1 Janu-ary 2012 in respect of the application of market values to certain transferable securities which are not held as financial fixed assets and to the related hedging deriva-tives. This change in accounting policy gave rise to a reduction in profit for the year of EUR 3.3 million as compared to the application of the previous accounting policy. See note A.3 and A.6.
A.23.2. Prepayment indemnities
The Bank changed its accounting policies from 1 Janu-ary 2012 in respect of the full recognition as income of indemnities received by the Bank for prepayments made by its borrowers. This change in accounting policy gave rise to an additional profit for the year of EUR 210.4 million as compared to the application of the previous accounting policy. See note A.20.

38 Financial Report 2012
Note B – Cash in hand, balances with central banks and post office banks and debt securities portfolio (in EUR ‘000)
B.1. Cash in hand, balances with central banks and post office banks
The cash in hand and balances with central banks and post office banks equal to EUR ’000 157 362 at 31 December 2012 (2011: EUR ‘000 427 463).
EIB is an eligible counterparty in the Eurosystem’s monetary policy operations, and therefore has been given access to the monetary policy operations of the European Central Bank. The Bank conducts the operations via the Central Bank of Luxembourg, where the Bank maintains a deposit to cover the minimum reserve requirement. The balance of this deposit amounts to EUR ‘000 157 258 as at 31 December 2012 (2011: EUR ‘000 395 911).
B.2. Debt securities portfolio
The debt securities portfolio is composed of the investment portfolio, the operational money market portfolios A1 and A2, the operational bond portfolios B1 ‘Credit Spread’, B3 ‘Global Fixed Income’ and B4 ‘Inflation Linked Investment’ and the loan substitutes, which represent acquisitions of interests in pools of loans or receivables in connection with securitisation transactions. The detail of these portfolios and their classification as at 31 December 2012 and 2011 are as follows:
31.12.2012 31.12.2011
Treasury bills and other bills eligible for refinancing with central banks 17 462 708 14 029 737
Debt securities including fixed-income securities 9 309 313 10 348 226
Total debt securities (*) 26 772 021 24 377 963
(*) of which EUR ‘000 9 307 750 unlisted in 2012 and EUR ‘000 9 766 326 in 2011.
At 31.12.2012 Purchase price Book value Premiums/ discounts to be
amortised
Value at final maturity
Market value
Investment portfolio 1 080 431 1 036 946 -8 764 1 028 182 1 155 566
Operational money market portfolios:
- A1: Money market securities with a max. 3-month maturity 9 425 707 9 431 365 5 765 9 437 130 9 432 208
- A2: Money market securities with a max. 18-month maturity (**) 1 523 395 1 514 279 -2 185 1 508 374 1 514 279
Operational bond portfolios:
- B1: Credit Spread (**) 613 131 622 568 -6 401 605 350 622 568
- B3: Global Fixed Income 556 548 559 000 0 532 000 559 000
- B4: Inflation Linked Investment 854 887 889 731 0 783 000 889 731
Loan substitutes (Note D) 12 726 729 12 718 132 -59 231 12 658 901 11 435 041
26 780 828 26 772 021 -70 816 26 552 937 25 608 393
(**) Accounting policy changed from 1 January 2012 (see Note A.6.2)

392012 Financial Report
EIB Statutory Financial Statements of the Bank
At 31.12.2011 Purchase price Book value Premiums/ discounts to be
amortised
Value at final maturity
Market value
Investment portfolio 1 222 398 1 174 839 -12 906 1 161 933 1 112 854
Operational money market portfolios:
- A1: Money market securities with a max. 3-month maturity 6 617 946 6 625 670 10 406 6 636 076 6 630 279
- A2: Money market securities with a max. 18-month maturity 2 225 993 2 223 162 4 011 2 229 726 2 227 853
Operational bond portfolios:
- B1: Credit Spread 737 431 678 257 0 735 502 683 956
- B3: Global Fixed Income 663 682 627 500 0 646 000 627 500
- B4: Inflation Linked Investment 1 050 023 1 039 474 0 940 000 1 039 474
Loan substitutes (Note D) 12 012 280 12 009 061 -42 877 11 966 184 10 351 964
24 529 753 24 377 963 -41 366 24 315 421 22 673 880
The Bank’s securities lending agreement with Northern Trust Global Investment was terminated in November 2012. The nominal value of securities lending activity amounted to EUR ‘000 608 174 at 31 December 2011.
Loan substitutes are considered as part of the aggregate loans (Note D). Some of these transactions have been struc-tured by adding credit or project related remedies, thus offering additional recourse. Per detailed review no value adjustment is required and has thus been accounted for as at 31 December 2012 and 2011.

40 Financial Report 2012
EU sovereign exposure in bond holdings
The Bank did not record value adjustments in 2011 and 2012 in respect of its held to maturity EU sovereign and sover-eign guaranteed exposure as at the year end as the Bank’s preferred creditor status and the protection given by the Bank’s Statute are deemed to guarantee a full recovery of the Bank’s assets on maturity.
The following tables show the exposure to debt issued or guaranteed by EU sovereigns in the Bank’s debt securities portfolios as at 31 December 2012 and 2011:
At 31.12.2012 Purchase price Book value Value at final maturity
Market value
EU sovereignsAustria 116 403 118 219 113 800 122 143
Belgium 847 416 836 263 831 500 845 471
Czech Republic 759 223 750 681 694 796 863 273
Denmark 10 000 10 375 10 000 10 375
Finland 52 365 53 242 50 000 53 242
France 799 827 820 689 737 600 841 890
Germany 565 988 570 592 528 400 630 159
Greece 156 842 149 332 154 000 145 626
Hungary 17 472 18 197 19 000 17 599
Ireland 36 773 37 186 37 000 37 285
Italy 4 689 667 4 695 873 4 698 448 4 700 801
Luxembourg 46 395 45 474 44 000 45 474
Netherlands 81 100 79 242 78 000 91 631
Poland 67 672 66 622 67 000 71 819
Portugal 46 612 45 024 45 000 44 985
Slovakia 31 862 31 874 30 000 32 605
Spain 910 284 896 056 897 600 898 029
9 235 901 9 224 941 9 036 144 9 452 407 Non-EU sovereign and other bonds 17 544 927 17 547 080 17 516 793 16 155 986
Total 26 780 828 26 772 021 26 552 937 25 608 393
In 2011, the Bank did not participate in any private sector initiative for Greece and therefore no value adjustments were recorded on its held to maturity Greek sovereign and sovereign guaranteed exposure.
At 31.12.2011 Purchase price Book value Value at final maturity
Market value
EU sovereignsAustria 218 600 218 386 213 800 224 814
Belgium 116 384 103 472 99 500 108 358
Czech Republic 596 336 593 160 550 453 612 107
Denmark 10 000 10 000 10 000 10 455
France 673 885 683 860 616 921 699 337
Germany 645 157 655 029 599 400 704 764
Greece 274 300 191 229 268 350 76 354
Hungary 17 472 18 085 19 000 13 656
Ireland 116 117 100 138 117 000 99 797
Italy 2 546 562 2 515 108 2 520 800 2 497 338
Luxembourg 31 761 31 536 30 000 31 536
Netherlands 123 567 122 067 120 000 132 476
Poland 67 672 66 745 67 000 65 911
Portugal 71 682 68 689 68 400 57 300
Slovakia 4 867 4 916 5 000 4 698
Spain 2 904 713 2 892 983 2 897 913 2 899 847
8 419 075 8 275 403 8 203 537 8 238 748 Non-EU sovereign and other bonds 16 110 678 16 102 560 16 111 884 14 435 132
Total 24 529 753 24 377 963 24 315 421 22 673 880

412012 Financial Report
EIB Statutory Financial Statements of the Bank
Note C – Loans and advances to credit institutions – other loans and advances (in EUR ‘000)
The Bank enters into collateralised reverse repurchase and repurchase agreement transactions that may result in credit exposure in the event that the counterparty to the transaction is unable to fulfil its contractual obligations. The Bank controls credit risk associated with these activities by monitoring counterparty credit exposure and collateral values on a daily basis and requiring additional collateral to be deposited with the Bank when deemed necessary.
31.12.2012 31.12.2011
Term deposits 9 054 416 13 869 281
Overnight deposits 406 757 250 000
Tripartite reverse repos (*) 40 714 480 25 393 472
Total other loans and advances to credit institutions 50 175 653 39 512 753
of which cash and cash equivalents 49 905 653 39 312 753
(*) These operations are carried out with a third-party custodian who undertakes, on the basis of a framework contract, to guarantee compliance with the contractual terms and conditions, notably with respect to:
- delivery against payment; - verification of collateral; - the collateral margin required by the lender which must always be available and adequate, with the market value of the securities being verified daily
by the said custodian; and - organisation of substitute collateral provided that this meets all the contractual requirements.
Note D – Summary statement of loans
D.1. Aggregate loans granted (in EUR ‘000)
Aggregate loans granted comprise both the disbursed and undisbursed portions of loans. The analysis is as follows:
To intermediary credit institutions
Directly to final beneficiaries
Total 2012 Total 2011
Disbursed portion 124 500 426 276 155 907 400 656 333 383 587 759
Undisbursed loans 19 786 999 62 129 484 81 916 483 85 806 923
Aggregate loans granted 144 287 425 338 285 391 482 572 816 469 394 682
Loan substitutes portfolio (Note B.2) 12 718 132 12 009 061
Aggregate loans including loan substitutes portfolio (Note D.3) 495 290 948 481 403 743
D.2. Value adjustments for loans (in EUR ‘000)
Movements in the value adjustments are detailed below:
2012 2011
Provision at 1 January 192 790 91 608
Release during the year -16 826 -60 705
Use during the year -34 588 0
Allowance during the year 199 593 161 887
Foreign exchange adjustment 580 0
At 31 December 341 549 192 790
In 2012, an amount of EUR ‘000 4 500 was paid by the European Commission to the Bank in the context of a Risk Sharing operation which had been provided. This amount has been accounted for in the profit and loss account as Value (re-)adjustments in respect of loans and advances and provisions for contingent liabilities.

42 Financial Report 2012
D.3. Geographical breakdown of lending by country in which projects are located (in EUR ’000)
D.3.1. Loans for projects within the European Union
Countries and territories in which projects are located
Number of loans
Aggregate loans granted
Disbursed portion
Undisbursed portion
% of total 2012 % of total 2011
Spain 737 75 069 313 71 873 109 3 196 204 15.16% 14.95%
Italy 614 61 465 203 51 641 709 9 823 494 12.41% 12.45%
Germany 636 57 919 557 51 598 993 6 320 564 11.69% 12.30%
France 445 44 390 922 37 492 207 6 898 715 8.96% 9.03%
United Kingdom 265 33 630 470 28 673 391 4 957 079 6.79% 6.85%
Poland 241 30 292 729 22 749 769 7 542 960 6.12% 5.53%
Portugal 295 22 873 209 20 261 700 2 611 509 4.61% 5.15%
Greece 147 16 692 532 15 122 585 1 569 947 3.36% 3.49%
Hungary 140 12 226 945 9 900 069 2 326 876 2.47% 2.37%
Austria 202 11 716 602 10 366 970 1 349 632 2.37% 2.37%
Czech Republic 131 10 595 358 9 473 541 1 121 817 2.14% 2.10%
Belgium 116 9 805 251 8 324 881 1 480 370 1.98% 2.00%
Netherlands 76 8 773 321 7 173 621 1 599 700 1.77% 1.65%
Sweden 71 7 916 773 6 013 848 1 902 925 1.60% 1.62%
Romania 84 7 195 170 4 491 525 2 703 645 1.45% 1.50%
Finland 119 7 084 860 5 730 820 1 354 040 1.43% 1.60%
Ireland 58 4 972 384 4 389 123 583 261 1.00% 0.96%
Slovenia 63 3 811 849 2 349 477 1 462 372 0.77% 0.69%
Slovakia 52 2 808 786 2 314 566 494 220 0.57% 0.56%
Bulgaria 44 2 442 843 1 448 747 994 096 0.49% 0.52%
Cyprus 30 2 176 363 1 620 063 556 300 0.44% 0.38%
Denmark 41 2 149 595 1 950 395 199 200 0.43% 0.46%
Latvia 25 1 612 899 853 019 759 880 0.33% 0.33%
Estonia 20 1 326 643 998 183 328 460 0.27% 0.26%
Lithuania 16 1 268 104 1 266 544 1 560 0.26% 0.27%
Luxembourg 20 810 200 573 200 237 000 0.16% 0.14%
Malta 7 336 983 276 983 60 000 0.07% 0.06%
Sub-total 4 695 441 364 864 378 929 038 62 435 826 89.10% 89.59%
D.3.2. Loans for projects outside the European Union
D.3.2.1. Candidate Countries
Countries and territories in which projects are located
Number of loans
Aggregate loans granted
Disbursed portion
Undisbursed portion
% of total 2012 % of total 2011
Turkey 153 16 252 254 12 531 391 3 720 863
Serbia 63 3 741 531 2 114 521 1 627 010
Croatia 40 2 770 363 2 029 522 740 841
Iceland 10 531 015 461 015 70 000
Macedonia (FYROM) 13 454 119 249 253 204 866
Montenegro 32 289 951 169 451 120 500
Sub-total 311 24 039 233 17 555 153 6 484 080 4.85% 3.75%

432012 Financial Report
EIB Statutory Financial Statements of the Bank
D.3.2.2. ACP States
Countries and territories in which projects are located
Number of loans
Aggregate loans granted
Disbursed portion
Undisbursed portion
% of total 2012 % of total 2011
Kenya 4 262 712 71 414 191 298
Madagascar 1 227 376 227 376 0
Regional - West Africa 6 174 811 44 811 130 000
Lesotho 4 162 179 46 960 115 219
Namibia 8 158 526 158 526 0
Zambia 3 152 000 0 152 000
Tanzania, United republic of 2 150 652 0 150 652
Mozambique 7 132 495 80 409 52 086
Mauritius 11 132 111 65 734 66 377
Uganda 2 130 000 0 130 000
Nigeria 2 106 675 12 907 93 768
Cameroon 2 70 000 5 000 65 000
Senegal 3 69 898 38 898 31 000
Ghana 2 64 130 64 130 0
Cape Verde 2 58 724 34 244 24 480
Congo (Democratic Republic) 1 55 000 28 644 26 356
Liberia 1 50 000 0 50 000
Benin 2 45 000 0 45 000
Burkina Faso 2 41 500 15 500 26 000
Regional - Caribbean 2 39 487 39 487 0
Seychelles 2 34 737 6 562 28 175
Swaziland 2 34 127 20 627 13 500
Congo 1 29 000 22 476 6 524
Dominican Republic 1 26 800 0 26 800
Jamaica 3 19 319 19 319 0
Malawi 2 16 730 15 551 1 179
Botswana 3 16 476 16 476 0
Mauritania 2 15 656 14 959 697
Dominica 2 7 914 1 701 6 213
Barbados 3 7 454 7 454 0
Saint Kitts and Nevis 2 5 987 0 5 987
Saint Vincent and Grenadines 2 5 268 5 268 0
Togo 1 3 000 0 3 000
Bahamas 1 2 689 2 689 0
Saint Lucia 1 2 119 2 119 0
Sub-total 95 2 510 552 1 069 241 1 441 311 0.51% 0.50%

44 Financial Report 2012
D.3.2.3. Asia
Countries and territories in which projects are located
Number of loans
Aggregate loans granted
Disbursed portion
Undisbursed portion
% of total 2012 % of total 2011
China 7 1 799 727 722 193 1 077 534
Vietnam 8 572 596 199 596 373 000
India 4 444 384 230 081 214 303
Pakistan 5 136 203 36 203 100 000
Sri Lanka 4 135 864 135 864 0
Philippines 3 75 155 75 155 0
Indonesia 3 60 436 60 436 0
Laos 1 40 985 40 985 0
Maldives 1 34 472 34 472 0
Thailand 1 10 583 10 583 0
Bangladesh 1 7 956 7 956 0
Tajikistan 1 7 000 0 7 000
Sub-total 39 3 325 361 1 553 524 1 771 837 0.67% 0.65%
D.3.2.4. Balkans
Countries and territories in which projects are located
Number of loans
Aggregate loans granted
Disbursed portion
Undisbursed portion
% of total 2012 % of total 2011
Bosnia-Herzegovina 35 1 375 504 746 807 628 697
Albania 13 308 429 217 996 90 433
Sub-total 48 1 683 933 964 803 719 130 0.34% 1.11%
D.3.2.5. Central and Latin America
Countries and territories in which projects are located
Number of loans
Aggregate loans granted
Disbursed portion
Undisbursed portion
% of total 2012 % of year 2011
Brazil 13 1 488 923 888 923 600 000
Panama 4 581 288 278 120 303 168
Argentina 5 278 245 278 245 0
Ecuador 2 228 007 28 007 200 000
Mexico 4 183 919 183 919 0
Colombia 2 152 273 152 273 0
Regional - Central America 3 133 205 63 205 70 000
Peru 3 79 130 79 130 0
Nicaragua 2 69 357 11 264 58 093
Paraguay 1 64 423 64 423 0
Chile 1 62 203 62 203 0
Uruguay 3 19 559 19 559 0
Costa Rica 1 3 699 3 699 0
Regional - Andean Countries 1 967 967 0
Sub-total 45 3 345 198 2 113 937 1 231 261 0.68% 0.72%

452012 Financial Report
EIB Statutory Financial Statements of the Bank
D.3.2.6. European Free Trade Association (EFTA) Countries
Countries and territories in which projects are located
Number of loans
Aggregate loans granted
Disbursed portion
Undisbursed portion
% of total 2012 % of total 2011
Norway 7 673 800 569 600 104 200
Switzerland 2 61 500 61 500 0
Sub-total 9 735 300 631 100 104 200 0.15% 0.26%
D.3.2.7. Mediterranean Countries
Countries and territories in which projects are located
Number of loans
Aggregate loans granted
Disbursed portion
Undisbursed portion
% of total 2012 % of total 2011
Morocco 59 4 018 050 2 060 370 1 957 680
Tunisia 57 3 344 501 2 107 316 1 237 185
Egypt 35 3 157 107 2 229 741 927 366
Syrian Arab Republic 15 1 135 865 583 864 552 001
Israel 12 796 690 587 944 208 746
Lebanon 23 768 767 453 767 315 000
Algeria 1 480 050 480 050 0
Jordan 17 408 459 346 748 61 711
Gaza - West Bank 6 58 616 19 576 39 040
Sub-total 225 14 168 105 8 869 376 5 298 729 2.86% 2.75%
D.3.2.8. Overseas Countries and Territories (OCT)
Countries and territories in which projects are located
Number of loans
Aggregate loans granted
Disbursed portion
Undisbursed portion
% of total 2012 % of total 2011
French Polynesia 2 17 500 0 17 500
New Caledonia 1 368 368 0
Sub-total 3 17 868 368 17 500 0.01% 0.00%
D.3.2.9. Eastern Europe, Southern Caucasus, Russia
Countries and territories in which projects are located
Number of loans
Aggregate loans granted
Disbursed portion
Undisbursed portion
% of total 2012 % of total 2011
Ukraine 11 1 730 540 304 000 1 426 540
Russian Federation 6 427 525 205 525 222 000
Georgia 9 418 483 120 020 298 463
Moldova 10 280 810 85 539 195 271
Armenia 4 56 666 7 850 48 816
Sub-total 40 2 914 024 722 934 2 191 090 0.59% 0.41%

46 Financial Report 2012
D.3.2.10. South Africa
Countries and territories in which projects are located
Number of loans
Aggregate loans granted
Disbursed portion
Undisbursed portion
% of total 2012 % of total 2011
South Africa 32 1 186 510 964 991 221 519
Sub-total 32 1 186 510 964 991 221 519 0.24% 0.26%
Total loans for projects outside the Union 847 53 926 084 34 445 427 19 480 657 10.90% 10.41%
Total loans 2012(1) 5 542 495 290 948 413 374 465 81 916 483 100.00%
Total loans 2011(1) 5 453 481 403 743 395 596 820 85 806 923 100.00%
(1) including loan substitutes (Note B.2 and D.1)
Note E – Shares and other variable-yield securities
E.1. Shares and other variable-yield securities
This balance comprises (in EUR ‘000):
Venture capital operations(1)
EBRD shares(2) Investment funds(1)
Total
Cost:
At 1 January 2012 1 985 951 157 500 421 945 2 565 396
Net additions 229 454 0 97 183 326 637
At 31 December 2012 2 215 405 157 500 519 128 2 892 033
Value adjustments:
At 1 January 2012 -635 414 0 -16 781 -652 195
Net releases/additions 35 300 0 -1 395 33 905
At 31 December 2012 -600 114 0 -18 176 -618 290
Net book value:
At 31 December 2012 1 615 291 157 500 500 952 2 273 743
At 31 December 2011 1 350 537 157 500 405 164 1 913 201
(1) The amounts signed but not yet disbursed disclosed off-balance sheet are respectively:
• for venture capital operations EUR ‘000 1 904 034 (2011: EUR ‘000 1 782 524)
• for investment funds EUR ‘000 539 385 (2011: EUR ‘000 547 148)(2) The amount of EUR ‘000 157 500 (2011: EUR ‘000 157 500) corresponds to the capital paid in by the Bank as at 31 December 2012 with respect to its
subscription of EUR ‘000 900 440 to the capital of the EBRD (European Bank for Reconstruction and Development).
As at 31 December 2012, the Bank holds 3.04% of the subscribed capital of the EBRD. The share of underlying net equity of the Bank in EBRD amounts to EUR 400.5 million (2011: EUR 392.7 million). This is based on the audited 2011 financial statements prepared in accordance with International Financial Reporting Standards.
In EUR million % held Total own funds Total net result Total assets
EBRD (31.12.2010) 3.03 12 977 1 227 39 327
EBRD (31.12.2011) 3.17 13 173 173 47 036
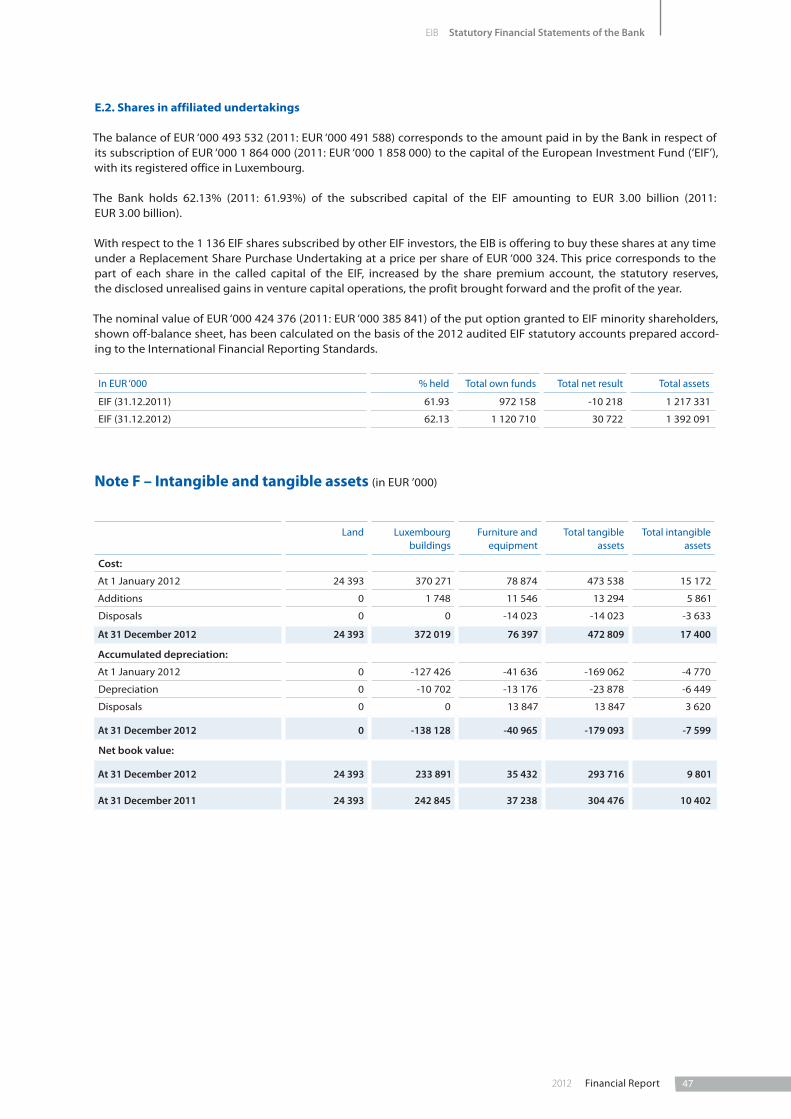
472012 Financial Report
EIB Statutory Financial Statements of the Bank
E.2. Shares in affiliated undertakings
The balance of EUR ‘000 493 532 (2011: EUR ‘000 491 588) corresponds to the amount paid in by the Bank in respect of its subscription of EUR ‘000 1 864 000 (2011: EUR ‘000 1 858 000) to the capital of the European Investment Fund (‘EIF’), with its registered office in Luxembourg.
The Bank holds 62.13% (2011: 61.93%) of the subscribed capital of the EIF amounting to EUR 3.00 billion (2011: EUR 3.00 billion).
With respect to the 1 136 EIF shares subscribed by other EIF investors, the EIB is offering to buy these shares at any time under a Replacement Share Purchase Undertaking at a price per share of EUR ‘000 324. This price corresponds to the part of each share in the called capital of the EIF, increased by the share premium account, the statutory reserves, the disclosed unrealised gains in venture capital operations, the profit brought forward and the profit of the year.
The nominal value of EUR ‘000 424 376 (2011: EUR ‘000 385 841) of the put option granted to EIF minority shareholders, shown off-balance sheet, has been calculated on the basis of the 2012 audited EIF statutory accounts prepared accord-ing to the International Financial Reporting Standards.
In EUR ‘000 % held Total own funds Total net result Total assets
EIF (31.12.2011) 61.93 972 158 -10 218 1 217 331
EIF (31.12.2012) 62.13 1 120 710 30 722 1 392 091
Note F – Intangible and tangible assets (in EUR ’000)
Land Luxembourg buildings
Furniture and equipment
Total tangible assets
Total intangible assets
Cost:
At 1 January 2012 24 393 370 271 78 874 473 538 15 172
Additions 0 1 748 11 546 13 294 5 861
Disposals 0 0 -14 023 -14 023 -3 633
At 31 December 2012 24 393 372 019 76 397 472 809 17 400
Accumulated depreciation:
At 1 January 2012 0 -127 426 -41 636 -169 062 -4 770
Depreciation 0 -10 702 -13 176 -23 878 -6 449
Disposals 0 0 13 847 13 847 3 620
At 31 December 2012 0 -138 128 -40 965 -179 093 -7 599
Net book value:
At 31 December 2012 24 393 233 891 35 432 293 716 9 801
At 31 December 2011 24 393 242 845 37 238 304 476 10 402

48 Financial Report 2012
Note G – Other assets and other liabilities (in EUR ’000)
Other assets 31.12.2012 31.12.2011
Loan instalments receivable 139 160 63 497
Guarantee calls from Member States & Guarantee fund 18 079 0
Guarantees disbursed 10 965 11 156
Staff housing loans and advances (*) 8 808 10 931
Commission receivable on guarantees 1 962 2 544
Advances on salaries and allowances 428 240
Other 24 112 25 170
203 514 113 538
(*) The balance relates to staff housing loans disbursed previously to the employees by the Bank. Since 1999 these housing loans have been substituted by an arrangement with an external financial institution, whereby permanently employed staff members of the Bank may be granted staff housing loans in accordance with the Bank’s staff regulations. The same interest rates, terms and conditions are applicable to all said employees.
Other liabilities 31.12.2012 31.12.2011
Optional Supplementary Provident Scheme (Note L) 286 490 251 779
Payable on HIPC initiative 93 395 93 395
EIF Pension Plan 53 490 43 933
Transitory account on loans 51 442 51 469
Personnel costs payable 44 963 37 151
Guarantee fees 29 372 4 820
Fair value of derivatives 19 065 0
Western Balkans infrastructure fund 8 025 9 600
Other 36 922 28 531
623 164 520 678

492012 Financial Report
EIB Statutory Financial Statements of the Bank
Note H – Subscription to the capital of the Bank, own funds and appropriation of profit
H.1. Statement of Subscriptions to the Capital of the Bank
as at 31 December 2012 (in EUR)
Member States Subscribed capital Uncalled capital (*) Called up capital at 31.12.2012
Germany 39 195 022 000 35 699 118 050 3 495 903 950
France 39 195 022 000 35 699 118 050 3 495 903 950
Italy 39 195 022 000 35 699 118 050 3 495 903 950
United Kingdom 39 195 022 000 35 699 118 050 3 495 903 950
Spain 23 517 013 500 21 419 470 925 2 097 542 575
Netherlands 10 864 587 500 9 895 547 225 969 040 275
Belgium 10 864 587 500 9 895 547 225 969 040 275
Sweden 7 207 577 000 6 564 714 700 642 862 300
Denmark 5 501 052 500 5 010 399 750 490 652 750
Austria 5 393 232 000 4 912 195 875 481 036 125
Poland 5 017 144 500 4 569 652 475 447 492 025
Finland 3 098 617 500 2 822 243 850 276 373 650
Greece 2 946 995 500 2 684 145 675 262 849 825
Portugal 1 899 171 000 1 729 779 000 169 392 000
Czech Republic 1 851 369 500 1 686 240 975 165 128 525
Hungary 1 751 480 000 1 595 260 900 156 219 100
Ireland 1 375 262 000 1 252 598 750 122 663 250
Romania 1 270 021 000 1 156 744 700 113 276 300
Slovakia 630 206 000 573 996 175 56 209 825
Slovenia 585 089 500 532 903 925 52 185 575
Bulgaria 427 869 500 389 706 625 38 162 875
Lithuania 367 127 000 334 381 950 32 745 050
Luxembourg 275 054 500 250 521 650 24 532 850
Cyprus 269 710 500 245 654 325 24 056 175
Latvia 224 048 000 204 064 750 19 983 250
Estonia 173 020 000 157 587 900 15 432 100
Malta 102 665 000 93 508 025 9 156 975
Total 242 392 989 000 220 773 339 550 21 619 649 450
(*) Can be called by decision of the Board of Directors to such extent as may be required for the Bank to meet its obligations.
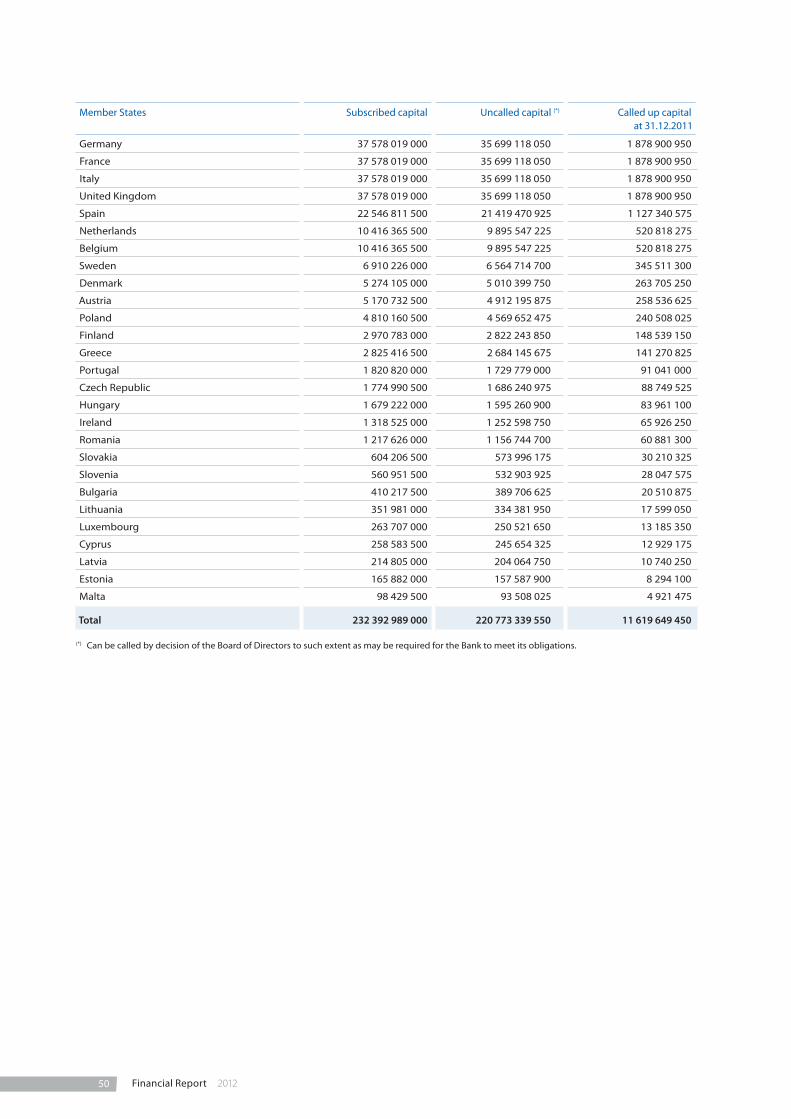
50 Financial Report 2012
Member States Subscribed capital Uncalled capital (*) Called up capital at 31.12.2011
Germany 37 578 019 000 35 699 118 050 1 878 900 950
France 37 578 019 000 35 699 118 050 1 878 900 950
Italy 37 578 019 000 35 699 118 050 1 878 900 950
United Kingdom 37 578 019 000 35 699 118 050 1 878 900 950
Spain 22 546 811 500 21 419 470 925 1 127 340 575
Netherlands 10 416 365 500 9 895 547 225 520 818 275
Belgium 10 416 365 500 9 895 547 225 520 818 275
Sweden 6 910 226 000 6 564 714 700 345 511 300
Denmark 5 274 105 000 5 010 399 750 263 705 250
Austria 5 170 732 500 4 912 195 875 258 536 625
Poland 4 810 160 500 4 569 652 475 240 508 025
Finland 2 970 783 000 2 822 243 850 148 539 150
Greece 2 825 416 500 2 684 145 675 141 270 825
Portugal 1 820 820 000 1 729 779 000 91 041 000
Czech Republic 1 774 990 500 1 686 240 975 88 749 525
Hungary 1 679 222 000 1 595 260 900 83 961 100
Ireland 1 318 525 000 1 252 598 750 65 926 250
Romania 1 217 626 000 1 156 744 700 60 881 300
Slovakia 604 206 500 573 996 175 30 210 325
Slovenia 560 951 500 532 903 925 28 047 575
Bulgaria 410 217 500 389 706 625 20 510 875
Lithuania 351 981 000 334 381 950 17 599 050
Luxembourg 263 707 000 250 521 650 13 185 350
Cyprus 258 583 500 245 654 325 12 929 175
Latvia 214 805 000 204 064 750 10 740 250
Estonia 165 882 000 157 587 900 8 294 100
Malta 98 429 500 93 508 025 4 921 475
Total 232 392 989 000 220 773 339 550 11 619 649 450
(*) Can be called by decision of the Board of Directors to such extent as may be required for the Bank to meet its obligations.

512012 Financial Report
EIB Statutory Financial Statements of the Bank
H.2. Own funds and appropriation of profit
Statement of movements in own funds (in EUR ‘000) 2012 2011
Share Capital:- Subscribed capital 242 392 989 232 392 989
- Uncalled capital -220 773 340 -220 773 340
- Called capital 21 619 649 11 619 649
- Capital called but not paid -9 992 427 0
- Paid in capital 11 627 222 11 619 649
Reserves and profit for the year:
Reserve Fund:
- Balance at beginning of the year 20 972 343 20 082 400
- Appropriation of prior year’s profit (1) 624 285 889 943
- Balance at end of the year 21 596 628 20 972 343
Additional reserves:
- Balance at beginning of the year 1 144 024 1 144 024
- Balance at end of the year 1 144 024 1 144 024
Special activities reserve:
- Balance at beginning of the year 4 108 940 3 299 370
- Appropriation of prior year’s profit (1) 1 031 446 809 570
- Balance at end of the year 5 140 386 4 108 940
General loan reserve:
- Balance at beginning of the year 2 340 863 1 923 734
- Appropriation of prior year’s profit (1) 636 046 417 129
- Balance at end of the year 2 976 909 2 340 863
Profit for the year 2 740 304 2 291 777
Total own funds 45 225 473 42 477 596
(1) On 25 April 2012, the Board of Governors decided to appropriate the profit for the year ended 31 December 2011, which amounted to EUR ‘000 2 291 777, to the Reserve Fund, the Special activities reserve and the General loan reserve.
H.3. Subscribed capital, called but not paid
As a result of the decision by the Member States, the subscribed and called capital of the Bank increased by EUR 10 bil-lion on 31 December 2012. The Member States are due to pay in their respective shares of this EUR 10 billion capital increase over no more than three instalments, with 91.6% of the capital increase due no later than 31 March 2013 and the remainder in two equal instalments no later than 31 March 2014 and 31 March 2015 respectively.
The amount of EUR ‘000 9 992 427 shown in the balance sheet under the caption Subscribed capital called but not paid represents the amount receivable from the Member States in respect of their share of the capital increase.

52 Financial Report 2012
Note I – ‘Prepayments and accrued income’ and ‘Accruals and deferred income’ (in EUR ’000)
Prepayments and accrued income 31.12.2012 31.12.2011
Interest and commission receivable 9 176 977 8 852 559
Foreign exchange on currency swap contracts 6 603 887 10 940 322
Redemption premiums on swaps receivable (*) 472 985 495 446
Deferred borrowing charges 103 415 56 230
Investment Facility’s commission receivable 36 202 38 011
Other 26 815 10 683
16 420 281 20 393 251
Accruals and deferred income 31.12.2012 31.12.2011
Interest and commission payable 10 515 700 9 865 998
Redemption premiums on swaps payable (*) 568 278 534 287
Deferred early repayment indemnities on loans 0 232 184
Deferred borrowing proceeds 279 098 278 560
Interest subsidies received in advance (**) 133 527 155 670
Prepaid management fees 2 937 10 314
11 499 540 11 077 013
(*) Redemption premiums on swaps receivable and payable represent end payments of the underlying swap agreements for those agreements which in-clude such features.
(**) Part of the amounts received from the European Commission has been made available as a long-term advance which is entered on the liabilities side under item Accruals and deferred income and comprises:
• amounts in respect of interest subsidies for loans granted for projects outside the European Union, under Conventions signed with the ACP States and Proto-cols concluded with the Mediterranean Countries; and
• interest subsidies, concerning certain lending operations put in place within the EU from the Bank’s own resources, made available in conjunction with the EMS under Council Regulation (EEC) No 1736/79 of 3 August 1979 and in conjunction with the financial mechanism established by the EFTA Countries under the EFTA Agreement signed on 2 May 1992.
Note J – Amounts owed to credit institutions and customers with agreed maturity dates or periods of notice (in EUR ’000)
J.1. Amounts owed to credit institutions
31.12.2012 31.12.2011
Repayable on demand 10 708 287 10 969 469
Short term deposits 24 081 53 459
Repo with central banks 0 100 000
Cash deposited on swaps payable 928 225 1 037 136
11 660 593 12 160 064
J.2. Amounts owed to customers
31.12.2012 31.12.2011
Overnight deposits 44 671 46 323
European Union and Member States' accounts:
- For Special Section operations and related unsettled amounts 379 405 343 617
- Deposit accounts 1 647 482 1 240 648
Short-term deposits 658 637 960 037
2 730 195 2 590 625

532012 Financial Report
EIB Statutory Financial Statements of the Bank
Note K – Debts evidenced by certificates
In its financing activity, one of the Bank’s objectives is to align its funding strategy with the funds required for the loans granted, notably in terms of currencies. The caption ‘Debts evidenced by certificates’ includes ’Debt securities in issue’ (securities offered to the general investing public) and ‘Others’ (private placements). The table below dis-closes the details per currency of debts outstanding at 31 December 2012 and 2011, together with the average rates and due dates.
Debts evidenced by certificates (in EUR ‘000)
Payable in Outstanding at 31.12.2012
Average rate2012(*)
Due dates Outstanding at 31.12.2011
Average rate2011(*)
EUR 196 023 682 3.09 2013/2057 174 488 830 3.35
USD 108 809 061 2.36 2013/2058 107 454 811 2.56
GBP 59 693 677 3.77 2013/2054 58 101 423 4.03
AUD 19 055 453 5.27 2013/2042 18 996 605 5.37
JPY 10 650 948 0.85 2014/2047 13 660 198 0.86
CHF 7 990 828 2.37 2014/2036 7 146 966 2.47
NOK 6 974 498 3.37 2013/2025 6 498 323 3.74
SEK 5 507 027 3.61 2013/2039 4 301 840 3.71
TRY 2 932 450 8.86 2013/2022 2 776 232 9.33
ZAR 1 710 305 8.02 2013/2021 1 926 787 8.16
NZD 1 614 026 5.49 2013/2021 2 449 662 6.41
RUB 1 087 293 6.50 2013/2019 719 741 6.69
CAD 753 409 4.53 2037/2045 744 612 4.56
DKK 549 524 2.55 2024/2026 551 505 2.55
CZK 527 035 3.51 2013/2030 541 280 3.89
PLN 313 500 5.91 2013/2026 290 920 6.00
HUF 239 743 6.51 2013/2016 273 625 6.37
RON 101 249 8.88 2014/2016 104 087 8.88
BGN 43 460 1.21 2013/2013 117 599 5.18
MXN 37 297 4.70 2015/2015 32 419 5.06
HKD 33 252 5.10 2013/2019 232 816 0.98
TWD 26 042 4.76 2013/2013 25 508 5.10
Total 424 673 759 401 435 789
(*) Weighted average interest rates at the balance sheet date
The principal and interest of certain structured borrowings are index linked to stock exchange indexes (historical value: EUR 243 million in 2012 and EUR 615 million in 2011). All such borrowings are fully hedged through structured swap operations.
The table below provides the movements in 2012 and 2011 for debts evidenced by certificates (including the short term commercial papers):
(In EUR million) 2012 2011
Balance at 1 January 401 436 358 009
Issuance during the year 140 025 151 108
Contractual redemptions -112 617 -111 187
Early redemptions -2 449 -2 780
Exchange adjustments -1 721 6 286
Balance at 31 December 424 674 401 436

54 Financial Report 2012
Note L – Provisions – pension plans and health insurance scheme (in EUR ’000)
The Bank’s main pension scheme is a defined benefit pension scheme funded by contributions from staff and from the Bank covering all employees. All contributions of the Bank and its staff are invested in the assets of the Bank.
The pension plans and health insurance scheme provisions are as follows (in EUR ‘000):
2012 2011
Staff pension plan:
Provision at 1 January 1 397 613 1 271 727
Payments made during the year -54 054 -51 503
Recognition of actuarial losses 675 12 916
Annual contributions and interest 172 161 164 473
Sub-total 1 516 395 1 397 613
Management Committee Pension Plan 35 302 34 924
Provision at 31 December 1 551 697 1 432 537
Health insurance scheme:
Provision at 1 January 145 526 131 325
Payments made during the year -9 197 -10 065
Recognition of actuarial losses 0 51
Annual contributions and interest 26 928 24 215
Provision at 31 December 163 257 145 526
Total provisions at 31 December 1 714 954 1 578 063
The above figures do not include the liability towards members of staff in respect of the Optional Supplementary Provi-dent Scheme (a defined contribution pension scheme). The corresponding amount of EUR 286 million (2011: EUR 252 million) is classified under ‘Other liabilities’ (Note G).
The provision in respect of future retirement and health insurance benefits was valued as at 30 September 2012 by an independent actuary using the projected unit credit method. The actuarial valuation was updated as at 31 December 2012 with an extrapolation (‘roll forward’ method) for the last 3 months of 2012, using the prevailing market rates of 31 December 2012 and the following assumptions (for the staff pension and medical plans):
• a discount rate of 4.23% (2011: 5.58%) for determining the actuarial present value of benefits accrued in the pension and health insurance schemes, corresponding to 18.17 year duration (2011: 18.85 year duration);
• in the light of past experience, the Bank estimates that the overall expected remuneration of post-employment reserves is set at a rate of 1.5% (2011: 1.5%) above the discount rate mentioned above;
• a progressive retirement between the age of 55-65 (same as 2011);
• a combined average impact of the increase in the cost of living and career progression of 4.5% (same as 2011);
• probable resignation of 3% up to age 55 (same as 2011);
• a rate of adjustment of pensions of 2% per annum (same as 2011);
• use of the ISCLT longevity table (same as 2011); and
• a medical cost inflation rate of 4% per annum (same as 2011).

552012 Financial Report
EIB Statutory Financial Statements of the Bank
The provisions for these schemes are adjusted when needed (Note A.12.1) according to the actuarial valuation, as per the tables above. Cumulative prior year actuarial deficits or surpluses in excess of 10% of the commitments for retirement benefits are recognised over the expected average remaining service lives of the participants on a straight line basis.
In 2011, the actuarial valuation on the pension plans and the healthcare scheme displayed an unrecognised loss of EUR ’000 168 477. EUR ’000 10 839 was reported in excess of the 10% corridor, and recognised over the expected aver-age remaining service lives of the participants on a straight line basis from 1 January 2012. Thereby, the net loss recog-nised in 2012 is EUR ’000 877.
In 2012, the actuarial valuation on the pension plans and the healthcare scheme displayed an unrecognised loss of EUR ’000 713 872. EUR ’000 471 509 was reported in excess of the 10% corridor, and the net loss which will be recog-nised in 2013 will be EUR ’000 33 071.
Note M – Extraordinary charges
There are no extraordinary charges for the year ended 31 December 2012. The extraordinary charges accounted for in 2011 for the amount of EUR 50 million related to the Bank’s participation in the HIPC Debt Relief Initiative, which proves debt relief to highly indebted poor countries.
Note N – ‘Interest receivable and similar income’ and ‘Interest payable and similar charges’
N.1. Net interest income (in EUR ’000)
2012 2011
Interest receivable and similar income:
Cash in hand, balance with central banks and post office banks 2 218 3 720
Treasury bills and other bills eligible for refinancing with central banks and debt securities including fixed income securities 447 200 499 084
Loans and advances to credit institutions and customers 10 113 177 10 086 813
Derivatives 14 966 861 14 321 414
Total 25 529 456 24 911 031
Interest payable and similar charges:
Amounts owed to credit institutions and customers -29 238 -58 678
Debts evidenced by certificates -14 015 370 -13 456 131
Derivatives -8 361 599 -8 393 553
Other -142 285 -130 299
Total -22 548 492 -22 038 661
Net interest income 2 980 964 2 872 370

56 Financial Report 2012
N.2. Geographical analysis of ‘Interest receivable and similar income’ (in EUR ’000)
EU countries 2012 2011
Spain 1 412 302 1 465 252
Italy 1 023 346 1 025 946
Germany 871 667 909 430
Poland 790 945 668 147
United Kingdom 771 182 677 605
France 743 572 824 510
Greece 574 647 586 574
Portugal 536 974 589 511
Hungary 280 308 268 347
Austria 241 851 228 817
Belgium 213 840 211 648
Netherlands 185 311 181 596
Sweden 158 566 151 013
Czech Republic 144 723 157 527
Finland 134 140 153 581
Romania 133 947 126 440
Ireland 99 604 91 490
Slovakia 57 968 43 736
Slovenia 55 156 60 273
Lithuania 45 838 43 974
Bulgaria 44 058 37 068
Denmark 29 292 33 742
Cyprus 23 788 29 078
Latvia 21 787 22 735
Estonia 14 871 11 128
Luxembourg 14 777 17 747
Malta 7 666 6 852
Total EU countries 8 632 126 8 623 767
Outside the European Union 1 031 868 958 275
Total 9 663 994 9 582 042
Income not analysed per country(1) 15 865 462 15 328 989
Total interest receivable and similar income 25 529 456 24 911 031 (1) Income not analysed per country:
•RevenuefromInvestmentportfolioandloansubstitutesportfolios 252 814 264 090
•RevenuefromOperationalbondportfolios 80 508 83 884
•RevenuefromOperationalmoney-marketportfolios 113 877 151 110
•Revenuefrommoney-marketoperations 240 978 508 491
•Incomefromderivatives 14 966 861 14 321 414
•Changeofaccountingpolicyonprepaymentindemnities(NoteA.23.2) 210 424 0
15 865 462 15 328 989

572012 Financial Report
EIB Statutory Financial Statements of the Bank
Note O – ‘Commission receivable’ and ‘Commission payable’ (in EUR ’000)
2012 2011
Commission receivable:
Commission income from advisory activities 60 773 65 853
Commission income on loans 52 072 43 722
Commission on Investment Facility - Cotonou (Note Z) 36 188 38 011
Commission on Jaspers (Note Z) 23 247 24 913
Commission on Jessica (Note Z) 17 959 16 664
Commission on NER 300 (Note Z) 13 677 7 003
Commission on Yaoundé/Lomé conventions (Note Z) 5 247 6 035
Commission from other EU institutions (Note Z) 27 612 15 191
Total commission receivable 236 775 217 392
Commission payable -14 594 -13 884
Note P – Net result on financial operations (in EUR ’000)
2012 2011
Unrealised result on operational treasury portfolio 165 249 -26 762
Net amortisation on foreign exchange derivatives 127 721 -56 995
Value (re-)adjustment on venture capital operations 35 300 -12 378
Net result on unwind of ALM swaps 32 501 36 805
Net realised result on operational treasury portfolio 15 103 -53 696
Net result on repurchase of debts evidenced by certificates 5 199 12 639
Result on long-term futures -1 047 -12 992
Value (re-)adjustment on shares and other variable yield securities other than venture capital -1 395 -242
Net unrealised result on derivatives -10 018 0
Net result on translation of balance sheet positions -14 175 1 435
Net result on unwind of asset swaps -76 076 -28 385
Realised result on sale of shares and other variable yield securities -79 902 -5 871
198 460 -146 442
Note Q – Other operating income (in EUR ’000)
2012 2011
Reversal of previous year’s unutilised accruals on general administrative expenses 1 847 5 275
Rental income 3 803 2 035
Amendment fees 4 063 3 004
Other 3 894 1 420
13 607 11 734

58 Financial Report 2012
Note R – General administrative expenses (in EUR ’000)
2012 2011
Salaries and allowances(*) -230 371 -219 660
Welfare contributions and other staff costs -132 140 -143 704
Staff costs -362 511 -363 364
Other general administrative expenses -134 330 -122 664
Total general administrative expenses -496 841 -486 028
(*) of which the amount for members of the Management Committee is EUR ‘000 3 225 at 31 December 2012 and EUR ‘000 3 022 at 31 December 2011. The number of persons employed by the Bank was 1 964 at 31 December 2012 (1 948 at 31 December 2011).
Note S – Off-balance sheet special deposits for service of borrowings
This item represents the amount of coupons and bonds due, paid by the Bank to the paying agents, but not yet pre-sented for payment by the holders of bonds issued by the Bank.
Note T – Fair value of financial instruments
The Bank records balance sheet financial instruments on the basis of their historical cost in foreign currency (apart from the operational portfolios) representing the amount received in the case of a liability or the amount paid to acquire an asset. The fair value of the financial instruments (mainly loans, treasury, securities and borrowings) entered under assets or liabilities compared with their accounting value is shown in the table below:
At 31 December 2012 (in EUR million) Accounting value Fair value
Financial assets:
Cash in hand, balances with central banks and post office banks 157 157
Loans and advances to credit institutions and customers, excluding loan substitutes 451 511 472 818
Treasury bills and debt securities portfolios including loan substitutes (Note B.2) 26 772 25 608
Shares and other variable yield securities (Note E) 2 274 2 887
Total financial assets 480 714 501 470
Financial liabilities:
Amounts owed to credit institutions and customers (Note J) 14 390 14 390
Debts evidenced by certificates (Note K) 424 674 469 572
Total financial liabilities 439 064 483 962
At 31 December 2011 (in EUR million) Accounting value Fair value
Financial assets:
Cash in hand, balances with central banks and post office banks 427 427
Loans and advances to credit institutions and customers, excluding loan substitutes 423 816 425 903
Treasury bills and debt securities portfolios including loan substitutes (Note B.2) 24 378 22 674
Shares and other variable yield securities (Note E) 1 913 2 404
Total financial assets 450 534 451 408
Financial liabilities:
Amounts owed to credit institutions and customers (Note J) 14 751 14 751
Debts evidenced by certificates (Note K) 401 436 431 770
Total financial liabilities 416 187 446 521
592012 Financial Report
EIB Statutory Financial Statements of the Bank
Note U – Risk management
This note presents information about the Bank’s exposure to and its management and control of risks, in particular the primary risks associated with its use of financial instruments. These are:
• credit risk;
• interest rate risk;
• liquidity risk;
• foreign exchange rate risk; and
• market risk.
U.1. Credit risk
Credit risk concerns mainly the Bank’s lending activities and, to a lesser extent, treasury instruments such as fixed-income securities held in the investment and operational portfolios, certificates of deposit and interbank term deposits as well as the derivative transactions of the Bank. No credit risk is attached to the Bank’s venture capital operations, which are performed entirely through equity participations and are, hence, only exposed to market risk.
The credit risk associated with the use of derivatives is analysed in the ‘Derivatives’ section (Note V).
The Bank’s policies on credit risk are approved by the governing bodies. They set out minimum credit quality levels for both borrowers and guarantors in lending operations and identify the types of security that are deemed acceptable. They also detail the minimum requirements which loan contracts must meet in terms of key legal clauses and other contractual stipulations to ensure that the Bank’s position ranks at least equal to that of other senior lenders, with prompt access to security when required. In addition, via a counterparty and sector limit system, the credit policies ensure an acceptable degree of diversification in the Bank’s loan portfolio. The Bank’s limit system draws its inspiration from the traditional prudential regulations on concentration and large exposure management contained in the EU banking directives, though the Bank generally adopts a more restrictive approach to risk-taking than commercial banks. They also set out the minimum credit quality of counterparties of derivatives and treasury transactions as well as the contractual framework for each type of transaction.
Following the approval of the capital increase by the heads of state and government of the EU member states, the Bank has expanded the CRPG by a dedicated chapter on the remedy of non-compliance events with bank intermediaries, and a dedicated chapter for incremental new lending in connection with the additional capital.
As regards lending, treasury and derivatives operations, credit risk is managed by an independent Risk Management Directorate under the direct responsibility of the Management Committee of the Bank. The Bank has thus established an operationally independent structure for determining and monitoring credit risk.
Credit policies undergo periodic adaptations to incorporate evolving operational circumstances and respond to new mandates that the Bank may receive.
Management of credit risk is based, firstly, on the level of credit risk vis-à-vis counterparties and, secondly, on an analy-sis of the solvency of counterparties.
U.1.1. Loans
In order to limit the credit risk on its loan portfolio, the Bank lends only to counterparties with demonstrated long term creditworthiness and with sound guarantees.
In order to efficiently measure and manage credit risk on loans, the Bank has graded its lending operations according to generally accepted criteria, based on the quality of the borrower, the guarantee and, where appropriate, the guarantor.

60 Financial Report 2012
Loan renegotiation and forbearance - The EIB considers loans that are unsecured or have weak security to be forborn if in response to adverse changes in the financial position of a borrower the EIB renegotiates the original terms of the con-tractual arrangements with this borrower affecting directly the future cash flows of the financial instrument, which may result in a loss to the Bank.
In the normal course of business, the Loan Grading (LG) of the loans in question would have deteriorated and the loan would have been included in the Watch List before renegotiation. Once renegotiated, EIB will continue to closely moni-tor these loans. If the renegotiated payment terms will not recover the original carrying amount of the asset, the Bank will consider to account for value adjustments in the profit and loss account. The corresponding value adjustment will be calculated based on the forecasted cash flows discounted at the original effective interest rate. The need for a value adjustment for all loans whose LG deteriorated to E- is assessed regularly; all loans with a LG of F require a value adjust-ment. Once the Loan Grading of a loan has improved sufficiently, it will be removed from the Watch List.
Exposures subject to changes in contractual terms which do not affect future cash flows, such as collateral or other security arrangements or the waiver of contractual rights under covenants, are not considered as forborn and hence those events are not considered as sufficient to indicate the requirement of a value adjustment on their own.
In 2012, 11 loans have undergone renegotiations. The disbursed exposures to these loans amounted to EUR 1 152 mil-lion as of 31 December 2012. Of these, one loan with a disbursed exposure of EUR 88 million has been successfully restructured. Of the renegotiated loans, seven loans have been subject to value adjustments for a total amount of EUR 213 million. The disbursed exposures of these loans amounted to EUR 632 million as at 31 December 2012. During the year, the Bank also wrote off EUR 34.6 million on one renegotiated operation against a value adjustment previously rec-ognised on this operation. Two loans with a disbursed exposure of EUR 432 million were under restructuring without a value adjustment.
The structure of guarantors and borrowers relating to the loan portfolio as at 31 December 2012 is analysed below, including undisbursed portions.
Loans outside the European Union (apart from those under the Facilities(*)) are, in the last resort, secured by guarantees of the European Union budget or the Member States (loans in the ACP Countries and the OCT). The agreements decided by the Council of the European Union on 14 April 1997 (Decision 97/256/EC) introduced the concept of risk sharing whereby certain Bank loans are secured by third-party guarantees with respect to the commercial risk, the budgetary guarantee applying in the case of political risks solely arising from currency non-transferability, expropriation, war and civil disturbance.
The table below shows (in EUR million) the loans for projects inside the European Union and outside the European Union granted under the Facilities and under the risk-sharing operations:
GuarantorBorrower
States Public institutions
Banks Corporates Not guaranteed(1)
Total 2012 Total 2011
States 0 0 0 0 42 461 42 461 39 233
Public institutions 26 578 13 946 560 3 388 55 259 99 731 92 549
Banks 19 629 36 830 34 253 25 039 24 918 140 669 141 575
Corporates 20 602 9 400 30 382 41 439 63 634 165 457 163 366
Total 2012 (1) (2) (3) (4) (5) 66 809 60 176 65 195 69 866 186 272 448 318
Total 2011 (1) (2) (3) (4) (5) 61 956 64 300 69 340 64 855 176 272 436 723
(1) These amounts include loans for which no formal guarantee independent from the borrower and the loan itself was required, the borrower’s level of solvency itself representing adequate security. In the event of certain occurrences, appropriate contractual clauses ensure the Bank’s right to access in-dependent security.
(2) The loans in risk-sharing operations amount to EUR 6 665 million as of 31 December 2012 (2011: EUR 6 372 million).(3) This amount includes loans granted under Facilities.(4) This amount does not include loan substitutes (2012: EUR 12 718 million; 2011: EUR 12 009 million).(5) These amounts exclude loans to current European Union Member States but granted before their accession to the European Union and guaranteed by
the European Union budget or the Member States.
(*) Loans granted under Article 16 (previously Article 18) of the Bank’s Statute and loans granted under the Pre Accession Facility, the Mediterranean Part-nership Facility, the Energy Sustainability Facility and the EFTA Facility. These loans, granted under the Facilities, are not secured by guarantees of the European Union budget or the Member States. Therefore, lending under the Facilities is from the Bank’s own resources and at the Bank’s own risk.
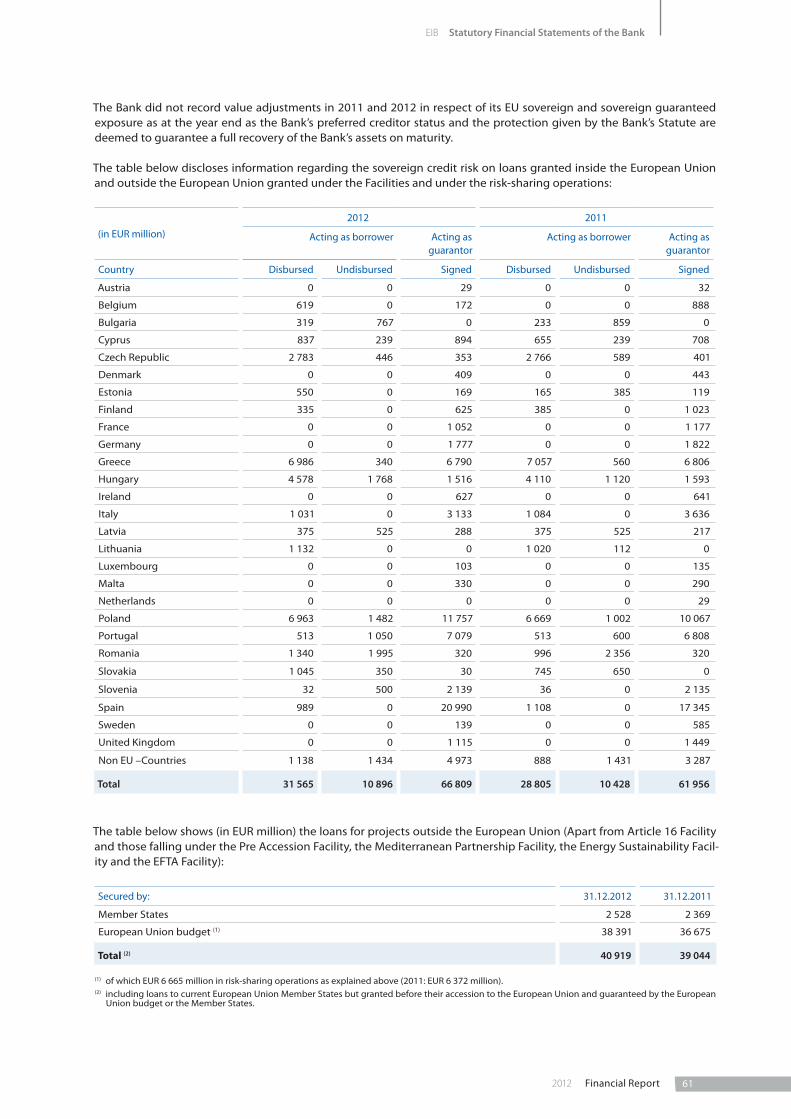
612012 Financial Report
EIB Statutory Financial Statements of the Bank
The Bank did not record value adjustments in 2011 and 2012 in respect of its EU sovereign and sovereign guaranteed exposure as at the year end as the Bank’s preferred creditor status and the protection given by the Bank’s Statute are deemed to guarantee a full recovery of the Bank’s assets on maturity.
The table below discloses information regarding the sovereign credit risk on loans granted inside the European Union and outside the European Union granted under the Facilities and under the risk-sharing operations:
(in EUR million)
2012 2011
Acting as borrower Acting as guarantor
Acting as borrower Acting as guarantor
Country Disbursed Undisbursed Signed Disbursed Undisbursed Signed
Austria 0 0 29 0 0 32
Belgium 619 0 172 0 0 888
Bulgaria 319 767 0 233 859 0
Cyprus 837 239 894 655 239 708
Czech Republic 2 783 446 353 2 766 589 401
Denmark 0 0 409 0 0 443
Estonia 550 0 169 165 385 119
Finland 335 0 625 385 0 1 023
France 0 0 1 052 0 0 1 177
Germany 0 0 1 777 0 0 1 822
Greece 6 986 340 6 790 7 057 560 6 806
Hungary 4 578 1 768 1 516 4 110 1 120 1 593
Ireland 0 0 627 0 0 641
Italy 1 031 0 3 133 1 084 0 3 636
Latvia 375 525 288 375 525 217
Lithuania 1 132 0 0 1 020 112 0
Luxembourg 0 0 103 0 0 135
Malta 0 0 330 0 0 290
Netherlands 0 0 0 0 0 29
Poland 6 963 1 482 11 757 6 669 1 002 10 067
Portugal 513 1 050 7 079 513 600 6 808
Romania 1 340 1 995 320 996 2 356 320
Slovakia 1 045 350 30 745 650 0
Slovenia 32 500 2 139 36 0 2 135
Spain 989 0 20 990 1 108 0 17 345
Sweden 0 0 139 0 0 585
United Kingdom 0 0 1 115 0 0 1 449
Non EU –Countries 1 138 1 434 4 973 888 1 431 3 287
Total 31 565 10 896 66 809 28 805 10 428 61 956
The table below shows (in EUR million) the loans for projects outside the European Union (Apart from Article 16 Facility and those falling under the Pre Accession Facility, the Mediterranean Partnership Facility, the Energy Sustainability Facil-ity and the EFTA Facility):
Secured by: 31.12.2012 31.12.2011
Member States 2 528 2 369
European Union budget (1) 38 391 36 675
Total (2) 40 919 39 044
(1) of which EUR 6 665 million in risk-sharing operations as explained above (2011: EUR 6 372 million).(2) including loans to current European Union Member States but granted before their accession to the European Union and guaranteed by the European
Union budget or the Member States.

62 Financial Report 2012
LOANS FOR PROJECTS OUTSIDE THE EUROPEAN UNION (in EUR million)
(including loans in the new Member States before accession)
BREAKDOWN OF LOANS OUTSTANDING BY GUARANTEE
AGREEMENT 31.12.2012 31.12.2011
75% Member States global guarantee- ACP/OCT Group 4th Lomé Convention 33 51 - ACP/OCT Group 4th Lomé Convention/2nd Financial Protocol 278 328
Total 75% Member States global guarantee 311 379
75% Member States guarantee- Cotonou partnership agreement 561 604 - Cotonou partnership 2nd agreement 1 656 1 386
Total 75% Member States guarantee 2 217 1 990
Total Member States guarantee 2 528 2 369
100% European Union budget guarantee- South Africa – 300m – BG Decision 19.06.95 2 2 - ALA I – 750m 60 84 - ALA interim (100% guarantee) –153m 3 4 - CEEC – 1bn - BG Decision 29.11.89 21 51 - CEEC –3bn - BG Decision 02.05.94 214 290 - Russia – 100 m - 2001-2005 60 68 - Russia – 500 m - 2004-2007 230 230
Total 100% European Union budget guarantee 590 729
75% European Union budget guarantee- Mediterranean Protocols 349 490 - Slovenia – 1st Protocol 22 32
Total 75% European Union budget guarantee 371 522
70% European Union budget guarantee- South Africa – 375m – Decision 29.01.97 55 65 - ALA II – 900m 76 99 - ALA interim (70% guarantee: risk sharing) – 122m 1 3 - Bosnia–Herzegovina – 100m 99/2001 70 76 - Euromed (EIB) –2 310m – Decision 29.01.97 411 528 - FYROM (Former Yugoslav Republic of Macedonia) – 150m – 1998/2000 75 86 - CEEC–3,520m–Decision 29.01.97 966 1 130
Total 70% European Union budget guarantee 1 654 1 987
65% European Union budget guarantee- South Africa – 825m – 7/2000-7/2007 432 547 - South Africa – Decision 2/2007–12/2013 649 574 - ALA III – 2,480m –- 2/2000 – 7/2007 713 878 - ALA Decision – 2/2007–12/2013 2 870 2 857 - Euromed II – 6,520m – 2/2000 –- 1/2007 4 281 4 611 - South Eastern Neighbours – 9,185m – 2/2000 – 7/2007 6 801 7 259 - Turkey special action – 450m – 2001-2006 225 251 - Turkey TERRA – 600m – 11/1999 – 11/2002 437 464 - PEV EE/CAS/RUS 1/2/2007 – 31/12/2013 2 524 1 593 - PEV MED 1/2/2007 – 31/12/2013 7 803 6 593 - Pre-Accession – 8,700m – 2007 – 2013 8 291 7 660 - Climate Change Mandate 2011 - 2013 750 150
Total 65% European Union budget guarantee 35 776 33 437
Total European Union budget guarantee 38 391 36 675
Total 40 919 39 044

632012 Financial Report
EIB Statutory Financial Statements of the Bank
Collateral on loans (in EUR million)
Among other credit mitigant instruments, the Bank uses pledges of financial securities. These pledges are formalised through a Pledge Agreement, enforceable in the relevant jurisdiction. The portfolio of collateral received in pledge con-tracts amounts to EUR 27 223 million (2011: EUR 20 642 million), with the following composition:
As at 31 December 2012 Loan Financial Collateral (in EUR million) (1)
Moody’s or equivalent rating
Bonds Equities & Funds
Cash Total
Govern-ment
Supra-national
Agency Secured Bonds (covered bonds)
Bank and Corporate
Bonds ABS
Aaa 799 322 13 714 1 189 0 0 0 3 037
Aa1 to Aa3 923 142 98 527 1 140 8 0 0 2 838
A1 384 0 9 0 802 0 0 0 1 195
Below A1 10 609 0 819 1 544 4 881 147 0 0 18 000
Non-Rated 0 0 0 0 0 0 318 1 835 2 153
Total 12 715 464 939 2 785 8 012 155 318 1 835 27 223
As at 31 December 2011 Loan Financial Collateral (in EUR million) (1)
Moody’s or equivalent rating
Bonds Equities & Funds
Cash Total
Govern-ment
Supra-national
Agency Secured Bonds (covered bonds)
Bank and Corporate
Bonds ABS
Aaa 943 180 6 498 1 800 219 0 0 3 646
Aa1 to Aa3 1 059 0 127 722 1 162 95 0 0 3 165
A1 898 0 0 345 793 62 0 0 2 098
Below A1 8 447 0 327 184 1 626 38 0 0 10 622
Non-Rated 0 0 0 0 0 0 168 943 1 111
Total 11 347 180 460 1 749 5 381 414 168 943 20 642
(1) Bonds, equities and funds are valued at their market value.
A breakdown of disbursed loans outstanding including loan substitutes (in EUR million) at 31 December according to the sectors in which borrowers are engaged is set out below:
Maturity
Sector : not more than 1 year
1 year to 5 years
more than 5 years
Total 2012 Total 2011
Transports 5 265 28 563 84 283 118 111 112 215
Global Loans(2) 9 621 51 076 34 564 95 261 95 721
Energy 3 510 15 907 34 833 54 250 50 891
Industry 4 528 23 776 8 828 37 132 32 820
Health, education 1 379 9 130 25 511 36 020 33 399
Water, sewerage 1 185 6 795 14 752 22 732 20 948
Miscellaneous infrastructure 916 4 770 13 326 19 012 18 955
Services 1 401 8 288 7 973 17 662 17 436
Telecommunications 1 165 8 654 2 219 12 038 12 400
Agriculture, fisheries, forestry 10 149 997 1 156 812
Total 2012 28 980 157 108 227 286 413 374
Total 2011 26 629 148 101 220 867 395 597
(2) A global loan is a line of credit to an intermediary financing institution or a bank which then on-lends the proceeds, at its own risk, to finance small and medium-sized projects being undertaken by private or public sector promoters.

64 Financial Report 2012
Arrears on loans
Amounts in arrears are identified, monitored and reported according to a set of procedures called the “Guidelines for the Monitoring of late payments”.
Loans granted inside the European Union or outside the European Union not secured by guarantees of the European Union budget or the Member States:
Loans for projects located inside the European Union or outside the European Union not secured by guarantees of the European Union budget or the Member States are mainly secured by guarantees from public institutions, banks and corporate entities. Unsecured part of these loans amounts to EUR 186 272 million as at 31 December 2012 (2011: EUR 176 272 million).
As at 31 December 2012, the arrears above 30 days on loans granted inside the European Union or outside the Euro-pean Union not secured by guarantees of the European Union budget or the Member States amount to EUR 41.6 mil-lion (2011: EUR 1.3 million). These arrears on loans are covered by a value adjustment of EUR 35.4 million which has been recognised and accounted for under Loans and advances to customers – value adjustments (2011: EUR nil).
Loans granted for projects outside the European Union secured by the European Union budget or the Member States:
Loans for projects located outside the European Union and carried out on the basis of mandates given by the Council are guaranteed by the European Union, the Member States or on a risk-sharing basis. If an instalment remains unpaid for over 90 days, the primary guarantee is called (if any available). If the due amount is still unpaid within 150 days after the instalment date (and in any case before the next instalment becomes due), the guarantee of the Member States or the European Union is officially invoked. Each unpaid instalment is called individually.
The arrears of payments on the loan portfolio (including interest revenue and penalty fee) of the Bank outside the European Union can be analysed as follows (in EUR 000):
31.12.2012 31.12.2011
Instalments overdue 30 to 90 days 4 917 4 714
Instalments overdue more than 90 days 17 684 2 726
Instalments overdue more than 150 days which have been called and paid under the guarantee of a Member State or the EU 147 193 108 665
Total 169 794 116 105
U.1.2. Treasury
The credit risk associated with treasury (securities, commercial paper, term accounts, etc.) is managed through selecting sound counterparties and issuers.
Limits governing the structure of the securities portfolio and outstanding treasury instruments have been laid down by the Management. These limits are reviewed regularly by the Risk Management Directorate.
The table below provides a percentage breakdown of the credit risk associated with the securities portfolio (i.e. opera-tional money market and bond portfolios) and treasury instruments (money markets products) in terms of the credit rating of counterparties and issuers:
Moody’s or equivalent rating Securities portfolio % Treasury instruments %
31.12.2012 31.12.2011 31.12.2012 31.12.2011
Aaa 10 33 4 4
Aa1 to Aa3 40 29 36 26
A1 to A3 8 28 52 54
Below A3 42 10 8 16
Total 100 100 100 100

652012 Financial Report
EIB Statutory Financial Statements of the Bank
Collateral on Treasury transactions
Collateral received
The Treasury transactions include EUR 40 714 million (2011: EUR 25 393 million) of tripartite reverse repurchase agree-ments. These transactions are governed by Tripartite Agreements, for which the exposure is fully collateralised, with daily margin calls. The market value of the collateral portfolio at 31 December 2012 is EUR 42 049 million (2011: EUR 25 551 million), with the following classification:
Tripartite Agreements Collateral (in EUR million)
At 31 December 2012 Bonds Total
Moody’s or equivalent rating Govern-ment
Supra-national
Agency Secured Bonds (covered bonds)
Bank and Corporate Bonds
ABS
Aaa 4 661 1 065 1 694 5 013 1 539 272 14 244
Aa1 to Aa3 1 092 557 229 595 1 350 0 3 823
A1 176 0 0 221 1 134 0 1 531
Below A1 13 737 0 0 3 209 5 505 0 22 451
Total 19 666 1 622 1 923 9 038 9 528 272 42 049
Tripartite Agreements Collateral (in EUR million)
At 31 December 2011 Bonds Total
Moody’s or equivalent rating Govern-ment
Supra-national
Agency Secured Bonds (covered bonds)
Bank and Corporate Bonds
ABS
Aaa 2 033 511 90 1 724 1 049 1 811 7 218
Aa1 to Aa3 4 962 0 506 749 1 827 0 8 044
A1 1 147 0 0 222 1 507 0 2 876
Below A1 4 709 0 0 353 2 351 0 7 413
Total 12 851 511 596 3 048 6 734 1 811 25 551
Securities deposited
In the context of the Eurosystem’s monetary policy operations, the EIB deposited securities with the Central Bank of Luxembourg with a market value of EUR 3.3 billion as at 31 December 2012 (2011: EUR 2.2 billion).
U.1.3. Securities lending
The securities lending agreement, signed with Northern Trust Global Investment in 2003, was terminated in November 2012. The Bank engaged in no securities lending as at the year end.
The market value of the bonds lent in the securities lending activities amounted to EUR 646 million at 31 December 2011. The market value of the collateral portfolio at 31 December 2011 was EUR 680 million, with the following classifi-cation:
Securities Lending Collateral (in EUR million)
At 31 December 2011 Bonds Time deposit Total
Moody’s or equivalent rating Government Certificate of Deposits
Aaa 21 0 0 21
Aa1 to Aa3 553 0 33 586
A1 to A3 0 0 73 73
Total 574 0 106 680
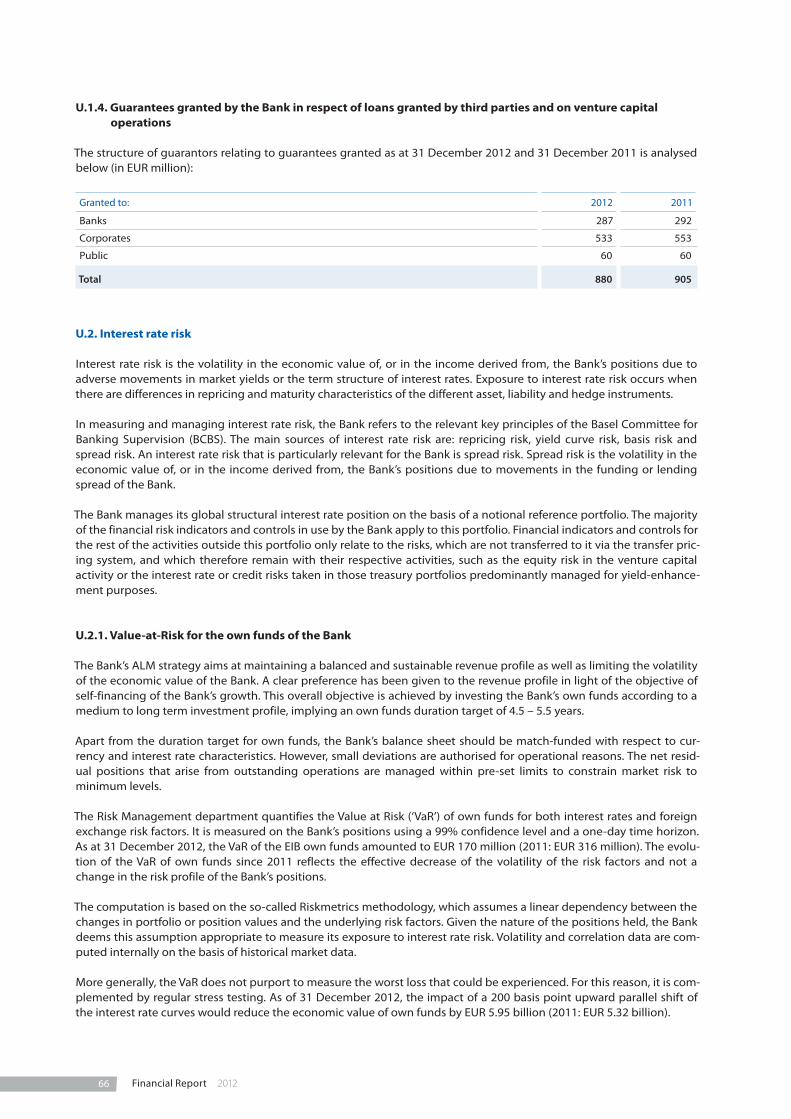
66 Financial Report 2012
U.1.4. Guarantees granted by the Bank in respect of loans granted by third parties and on venture capital operations
The structure of guarantors relating to guarantees granted as at 31 December 2012 and 31 December 2011 is analysed below (in EUR million):
Granted to: 2012 2011
Banks 287 292
Corporates 533 553
Public 60 60
Total 880 905
U.2. Interest rate risk
Interest rate risk is the volatility in the economic value of, or in the income derived from, the Bank’s positions due to adverse movements in market yields or the term structure of interest rates. Exposure to interest rate risk occurs when there are differences in repricing and maturity characteristics of the different asset, liability and hedge instruments.
In measuring and managing interest rate risk, the Bank refers to the relevant key principles of the Basel Committee for Banking Supervision (BCBS). The main sources of interest rate risk are: repricing risk, yield curve risk, basis risk and spread risk. An interest rate risk that is particularly relevant for the Bank is spread risk. Spread risk is the volatility in the economic value of, or in the income derived from, the Bank’s positions due to movements in the funding or lending spread of the Bank.
The Bank manages its global structural interest rate position on the basis of a notional reference portfolio. The majority of the financial risk indicators and controls in use by the Bank apply to this portfolio. Financial indicators and controls for the rest of the activities outside this portfolio only relate to the risks, which are not transferred to it via the transfer pric-ing system, and which therefore remain with their respective activities, such as the equity risk in the venture capital activity or the interest rate or credit risks taken in those treasury portfolios predominantly managed for yield-enhance-ment purposes.
U.2.1. Value-at-Risk for the own funds of the Bank
The Bank’s ALM strategy aims at maintaining a balanced and sustainable revenue profile as well as limiting the volatility of the economic value of the Bank. A clear preference has been given to the revenue profile in light of the objective of self-financing of the Bank’s growth. This overall objective is achieved by investing the Bank’s own funds according to a medium to long term investment profile, implying an own funds duration target of 4.5 – 5.5 years.
Apart from the duration target for own funds, the Bank’s balance sheet should be match-funded with respect to cur-rency and interest rate characteristics. However, small deviations are authorised for operational reasons. The net resid-ual positions that arise from outstanding operations are managed within pre-set limits to constrain market risk to minimum levels.
The Risk Management department quantifies the Value at Risk (‘VaR’) of own funds for both interest rates and foreign exchange risk factors. It is measured on the Bank’s positions using a 99% confidence level and a one-day time horizon. As at 31 December 2012, the VaR of the EIB own funds amounted to EUR 170 million (2011: EUR 316 million). The evolu-tion of the VaR of own funds since 2011 reflects the effective decrease of the volatility of the risk factors and not a change in the risk profile of the Bank’s positions.
The computation is based on the so-called Riskmetrics methodology, which assumes a linear dependency between the changes in portfolio or position values and the underlying risk factors. Given the nature of the positions held, the Bank deems this assumption appropriate to measure its exposure to interest rate risk. Volatility and correlation data are com-puted internally on the basis of historical market data.
More generally, the VaR does not purport to measure the worst loss that could be experienced. For this reason, it is com-plemented by regular stress testing. As of 31 December 2012, the impact of a 200 basis point upward parallel shift of the interest rate curves would reduce the economic value of own funds by EUR 5.95 billion (2011: EUR 5.32 billion).

672012 Financial Report
EIB Statutory Financial Statements of the Bank
Among the financial instruments in the Bank’s portfolio, some deals (borrowings and associated swaps) may be redeemed before their final maturity.
At cash flow level all such borrowings are fully hedged by swaps so that they can be considered synthetic floating rate notes. Uncertainty arises from the maturity of such positions indexed to Libor/Euribor as they may be called before their final maturity.
Below is a summary of the features of the Bank’s callable portfolio as of 31 December 2012 and 31 December 2011, where the total nominal amount, the average natural maturity and the average expected maturity (both weighted by the nominal amount of the concerned transactions) are shown per funding currency and per main risk factor involved:
By funding currency (after swap):
31.12.2012 Pay Currency Total
(in EUR million) CZK EUR JPY PLN USD
EUR Pay Notional 0 -2 707 -292 -25 -4 984 -8 008
Average maturity date 02.02.2037 08.10.2031 05.05.2026 22.10.2035 24.01.2036
Average expected maturity 16.05.2029 10.07.2028 17.05.2013 18.02.2026 11.04.2027
31.12.2011 Pay Currency Total
(in EUR million) CZK EUR JPY PLN USD
EUR Pay Notional -29 -3 064 -85 -22 -5 484 -8 684
Average maturity date 17.06.2013 25.11.2032 04.04.2031 05.05.2026 10.06.2035 28.05.2034
Average expected maturity 15.03.2012 02.06.2023 29.03.2028 01.01.2018 08.01.2026 21.01.2025
By risk factor involved:
31.12.2012 Risk factor Total
(in EUR million) FX level IR curve level IR curve shape
EUR Pay Notional -3 953 -3 866 -189 -8 008
Average maturity date 25.11.2033 05.05.2038 07.09.2034 24.01.2036
Average expected maturity 19.07.2027 14.11.2026 18.12.2029 11.04.2027
31.12.2011 Risk factor Total
(in EUR million) FX level IR curve level IR curve shape
EUR Pay Notional -4 073 -3 730 -881 -8 684
Average maturity date 16.01.2034 14.06.2036 04.06.2027 28.05.2034
Average expected maturity 05.09.2028 24.02.2022 11.08.2020 21.01.2025

68 Financial Report 2012
U.2.2. Interest rate risk management
The sensitivity of earnings quantifies the amount of net interest income that would change during the next 12 months if all interest rate curves rose by one percentage point or decreased by one percentage point. Such exposure stems from the mismatch between interest rate repricing periods, volumes and rates of assets and liabilities that the Bank accepts within the approved limits.
With the positions in place as of 31 December 2012, the earnings would increase by EUR 150.01 million (2011: EUR 113.51 million) if interest rates increased by 100 basis points and decrease by EUR 127.68 million (2011: EUR 124.25 million) if interest rates decreased by 100 basis points.
The Bank computes the sensitivity measure with dedicated software that simulates earnings on a deal by deal basis. The sensitivity of earnings is measured on an accruals basis and is calculated under the ‘’ongoing’’ assumption that, over the time horizon analysed, the Bank realises the new loan business forecast in the Corporate Operational Plan, main-tains exposures within approved limits and executes monetary trades to refinance funding shortages or invest cash excesses. Earnings are simulated on monthly time steps, assuming that all the fixed rate items carry their contractual rate and that all floating rate items are subject to interest rate repricing according to the interest rate scenario applied in the simulation. The monetary trades to refinance funding shortages or invest cash excesses carry rates equal to the money market rates prevailing according to the interest rate scenario applied in the simulation. In line with the current practice of the Bank, the model uses the hypothesis that simulated earnings are not distributed to the shareholders, but are used to refinance the Bank’s business. The administrative costs are projected according to the forecasts of the Corporate Operational Plan.
U.3. Liquidity risk
The main objective of liquidity policy is to ensure that the Bank can always meet its payment obligations punctually and in full. The Bank manages the calendar of its new issues so as to maintain the global level of liquidity within the chosen range. Liquidity planning takes into account the Bank’s needs to service its debt, disbursements on loans and cash flows from the loan portfolio. It also takes into account the sizeable amount of signed but un-disbursed loans, whose dis-bursement typically takes place at the borrower’s request.
Liquidity risk is managed prudently as, in contrast to commercial banks, EIB does not have the natural sources of liquid-ity from the deposits of clients. The Bank pre-finances its commitments to avoid being forced to borrow, or to sell assets, when it does not have access to resources at a desirable cost level.
The Bank further assures sound management of liquidity risk by maintaining a sufficient level of short term liquid assets and by spreading the maturity dates of its placements according to the forecasts of liquidity needs. Liquidity risk policy also incorporates a floor on treasury levels. The Bank’s total liquidity ratio (defined as a target percentage of annual pro-jected net cash flows) must at all times exceed 25% of the average forecast net annual cash flows for the following year.
The Bank has in place a Contingency Liquidity Plan (CLP) that specifies decision making procedures and corresponding responsibilities. The CLP has been benchmarked against the “Principles for Sound Liquidity Risk Management and Supervision” by the Basel Committee on Banking Supervision (September 2008). The CLP is subject to ad-hoc updates and is presented to the Management Committee annually for approval.
On 8 July 2009, the Bank became an eligible counterparty in the Eurosystem’s monetary policy operations, and there-fore has been given access to the monetary policy operations of the European Central Bank. The Bank conducts the operations via the Central Bank of Luxembourg, where the Bank maintains deposits to cover the minimum reserve requirement.
The table hereafter analyses the assets and liabilities of the Bank by maturity on the basis of the period remaining between the balance sheet date and the contractual maturity date. Assets and liabilities for which there is no contrac-tual maturity date are classified under “Maturity undefined”.
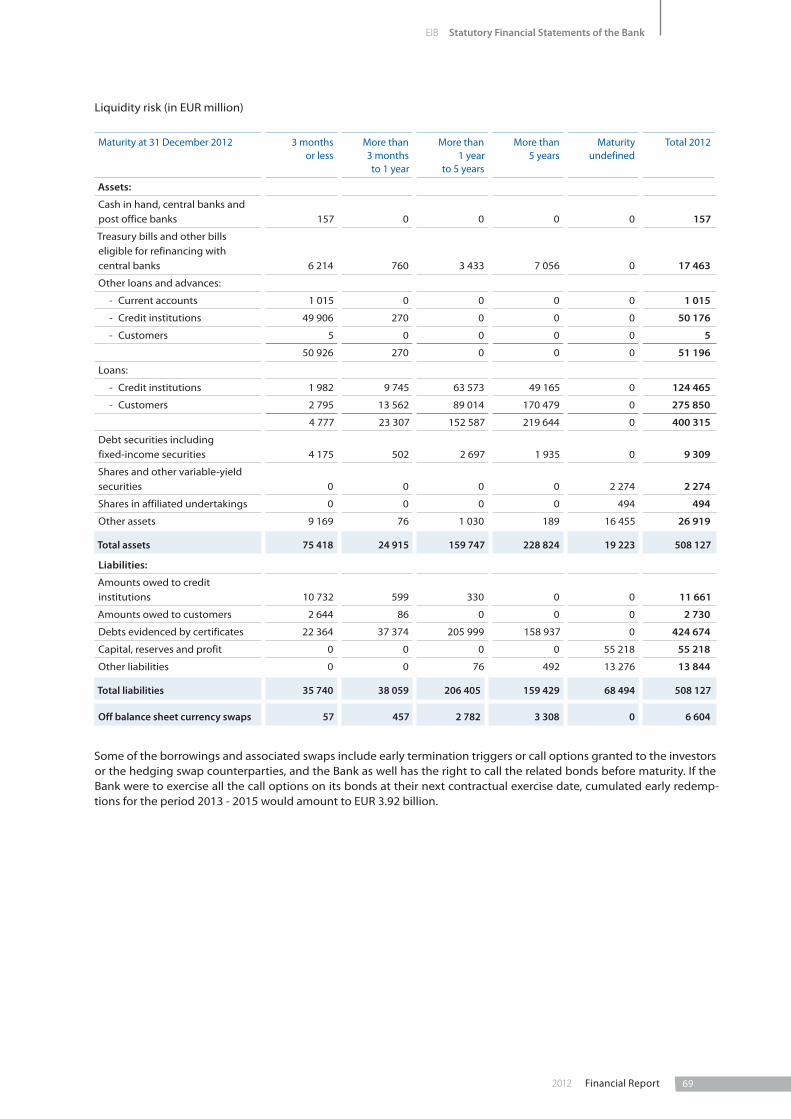
692012 Financial Report
EIB Statutory Financial Statements of the Bank
Liquidity risk (in EUR million)
Maturity at 31 December 2012 3 months or less
More than 3 months to 1 year
More than 1 year
to 5 years
More than 5 years
Maturity undefined
Total 2012
Assets:
Cash in hand, central banks and post office banks 157 0 0 0 0 157
Treasury bills and other bills eligible for refinancing with central banks 6 214 760 3 433 7 056 0 17 463
Other loans and advances:
- Current accounts 1 015 0 0 0 0 1 015
- Credit institutions 49 906 270 0 0 0 50 176
- Customers 5 0 0 0 0 5
50 926 270 0 0 0 51 196
Loans:
- Credit institutions 1 982 9 745 63 573 49 165 0 124 465
- Customers 2 795 13 562 89 014 170 479 0 275 850
4 777 23 307 152 587 219 644 0 400 315
Debt securities including fixed-income securities 4 175 502 2 697 1 935 0 9 309
Shares and other variable-yield securities 0 0 0 0 2 274 2 274
Shares in affiliated undertakings 0 0 0 0 494 494
Other assets 9 169 76 1 030 189 16 455 26 919
Total assets 75 418 24 915 159 747 228 824 19 223 508 127
Liabilities:
Amounts owed to credit institutions 10 732 599 330 0 0 11 661
Amounts owed to customers 2 644 86 0 0 0 2 730
Debts evidenced by certificates 22 364 37 374 205 999 158 937 0 424 674
Capital, reserves and profit 0 0 0 0 55 218 55 218
Other liabilities 0 0 76 492 13 276 13 844
Total liabilities 35 740 38 059 206 405 159 429 68 494 508 127
Off balance sheet currency swaps 57 457 2 782 3 308 0 6 604
Some of the borrowings and associated swaps include early termination triggers or call options granted to the investors or the hedging swap counterparties, and the Bank as well has the right to call the related bonds before maturity. If the Bank were to exercise all the call options on its bonds at their next contractual exercise date, cumulated early redemp-tions for the period 2013 - 2015 would amount to EUR 3.92 billion.

70 Financial Report 2012
Maturity at 31 December 2011 3 months or less
More than 3 months to 1 year
More than 1 year
to 5 years
More than 5 years
Maturity undefined
Total 2011
Assets:
Cash in hand, central banks and post office banks 427 0 0 0 0 427
Treasury bills and other bills eligible for refinancing with central banks 3 583 956 2 563 6 928 0 14 030
Other loans and advances:
- Current accounts 908 0 0 0 0 908
- Credit institutions 39 313 200 0 0 0 39 513
- Customers 0 0 0 0 0 0
40 221 200 0 0 0 40 421
Loans:
- Credit institutions 2 229 9 296 69 562 52 774 0 133 861
- Customers 2 134 12 346 75 678 159 376 0 249 534
4 363 21 642 145 240 212 150 0 383 395
Debt securities including fixed-income securities 3 832 1 327 1 898 3 291 0 10 348
Shares and other variable-yield securities 0 0 0 0 1 913 1 913
Shares in affiliated undertakings 0 0 0 0 492 492
Other assets 0 13 212 270 20 327 20 822
Total assets 52 426 24 138 149 913 222 639 22 732 471 848
Liabilities:
Amounts owed to credit institutions 11 065 159 801 135 0 12 160
Amounts owed to customers 2 416 175 0 0 0 2 591
Debts evidenced by certificates 18 277 36 725 195 794 150 640 0 401 436
Capital, reserves and profit 0 0 0 0 42 478 42 478
Other liabilities 0 1 54 479 12 649 13 183
Total liabilities 31 758 37 060 196 649 151 254 55 127 471 848
Off balance sheet currency swaps 649 684 3 558 6 049 0 10 940
U.4. Foreign exchange rate risk
The sources of foreign exchange rate risk are to be found in the margins on operations and in general expenses incurred in non-euro currencies. The Bank’s objective is to eliminate exchange risk by reducing net positions per currency through operations on the international foreign exchange markets.
A foreign exchange hedging programme exists in order to protect the known loan margins in USD and in GBP for the next 3 years.
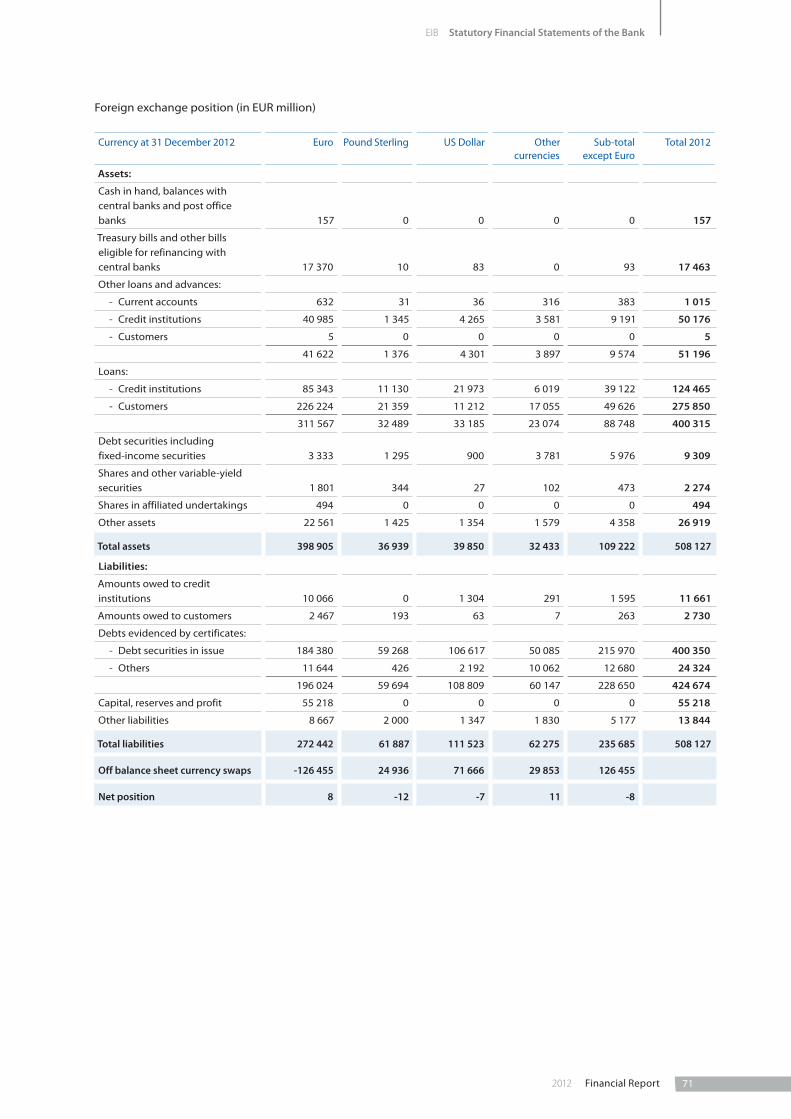
712012 Financial Report
EIB Statutory Financial Statements of the Bank
Foreign exchange position (in EUR million)
Currency at 31 December 2012 Euro Pound Sterling US Dollar Other currencies
Sub-total except Euro
Total 2012
Assets:
Cash in hand, balances with central banks and post office banks 157 0 0 0 0 157
Treasury bills and other bills eligible for refinancing with central banks 17 370 10 83 0 93 17 463
Other loans and advances:
- Current accounts 632 31 36 316 383 1 015
- Credit institutions 40 985 1 345 4 265 3 581 9 191 50 176
- Customers 5 0 0 0 0 5
41 622 1 376 4 301 3 897 9 574 51 196
Loans:
- Credit institutions 85 343 11 130 21 973 6 019 39 122 124 465
- Customers 226 224 21 359 11 212 17 055 49 626 275 850
311 567 32 489 33 185 23 074 88 748 400 315
Debt securities including fixed-income securities 3 333 1 295 900 3 781 5 976 9 309
Shares and other variable-yield securities 1 801 344 27 102 473 2 274
Shares in affiliated undertakings 494 0 0 0 0 494
Other assets 22 561 1 425 1 354 1 579 4 358 26 919
Total assets 398 905 36 939 39 850 32 433 109 222 508 127
Liabilities:
Amounts owed to credit institutions 10 066 0 1 304 291 1 595 11 661
Amounts owed to customers 2 467 193 63 7 263 2 730
Debts evidenced by certificates:
- Debt securities in issue 184 380 59 268 106 617 50 085 215 970 400 350
- Others 11 644 426 2 192 10 062 12 680 24 324
196 024 59 694 108 809 60 147 228 650 424 674
Capital, reserves and profit 55 218 0 0 0 0 55 218
Other liabilities 8 667 2 000 1 347 1 830 5 177 13 844
Total liabilities 272 442 61 887 111 523 62 275 235 685 508 127
Off balance sheet currency swaps -126 455 24 936 71 666 29 853 126 455
Net position 8 -12 -7 11 -8

72 Financial Report 2012
Currency at 31 December 2011 Euro Pound Sterling US Dollar Other currencies
Sub-total except Euro
Total 2011
Assets:
Cash in hand, balances with central banks and post office banks 396 0 0 31 31 427
Treasury bills and other bills eligible for refinancing with central banks 14 030 0 0 0 0 14 030
Other loans and advances:
- Current accounts 539 33 9 327 369 908
- Credit institutions 37 070 873 255 1 315 2 443 39 513
- Customers 0 0 0 0 0 0
37 609 906 264 1 642 2 812 40 421
Loans:
- Credit institutions 89 409 13 452 24 530 6 470 44 452 133 861
- Customers 204 799 20 072 10 398 14 265 44 735 249 534
294 208 33 524 34 928 20 735 89 187 383 395
Debt securities including fixed-income securities 6 402 1 526 982 1 438 3 946 10 348
Shares and other variable-yield securities 1 502 305 30 76 411 1 913
Shares in affiliated undertakings 492 0 0 0 0 492
Other assets 16 436 1 421 1 406 1 559 4 386 20 822
Total assets 371 075 37 682 37 610 25 481 100 773 471 848
Liabilities:
Amounts owed to credit institutions 11 287 0 585 288 873 12 160
Amounts owed to customers 2 329 204 51 7 262 2 591
Debts evidenced by certificates:
- Debt securities in issue 164 644 57 685 104 047 49 779 211 511 376 155
- Others 9 845 416 3 408 11 612 15 436 25 281
174 489 58 101 107 455 61 391 226 947 401 436
Capital, reserves and profit 42 478 0 0 0 0 42 478
Other liabilities 7 955 2 016 1 390 1 822 5 228 13 183
Total liabilities 238 538 60 321 109 481 63 508 233 310 471 848
Off balance sheet currency swaps -132 535 22 623 71 875 38 037 132 535
Net position 2 -16 4 10 -2
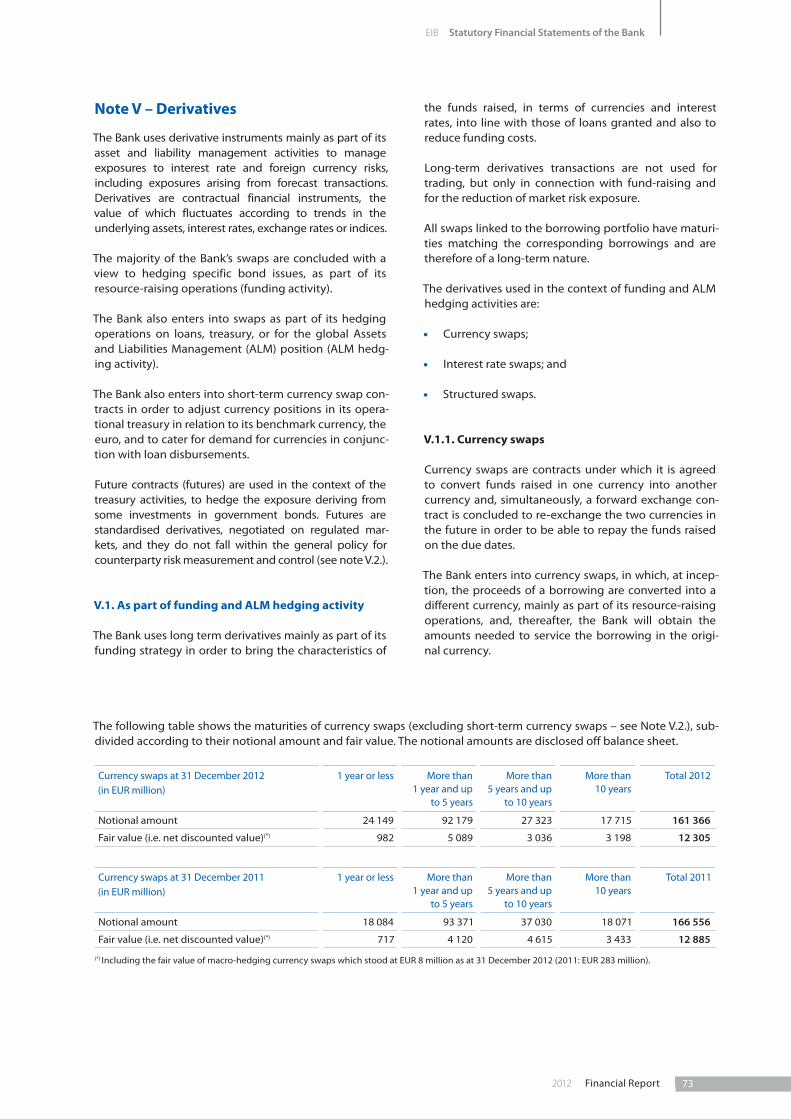
732012 Financial Report
EIB Statutory Financial Statements of the Bank
Note V – Derivatives
The Bank uses derivative instruments mainly as part of its asset and liability management activities to manage exposures to interest rate and foreign currency risks, including exposures arising from forecast transactions. Derivatives are contractual financial instruments, the value of which fluctuates according to trends in the underlying assets, interest rates, exchange rates or indices.
The majority of the Bank’s swaps are concluded with a view to hedging specific bond issues, as part of its resource-raising operations (funding activity).
The Bank also enters into swaps as part of its hedging operations on loans, treasury, or for the global Assets and Liabilities Management (ALM) position (ALM hedg-ing activity).
The Bank also enters into short-term currency swap con-tracts in order to adjust currency positions in its opera-tional treasury in relation to its benchmark currency, the euro, and to cater for demand for currencies in conjunc-tion with loan disbursements.
Future contracts (futures) are used in the context of the treasury activities, to hedge the exposure deriving from some investments in government bonds. Futures are standardised derivatives, negotiated on regulated mar-kets, and they do not fall within the general policy for counterparty risk measurement and control (see note V.2.).
V.1. As part of funding and ALM hedging activity
The Bank uses long term derivatives mainly as part of its funding strategy in order to bring the characteristics of
the funds raised, in terms of currencies and interest rates, into line with those of loans granted and also to reduce funding costs.
Long-term derivatives transactions are not used for trading, but only in connection with fund-raising and for the reduction of market risk exposure.
All swaps linked to the borrowing portfolio have maturi-ties matching the corresponding borrowings and are therefore of a long-term nature.
The derivatives used in the context of funding and ALM hedging activities are:
• Currency swaps;
• Interest rate swaps; and
• Structured swaps.
V.1.1. Currency swaps
Currency swaps are contracts under which it is agreed to convert funds raised in one currency into another currency and, simultaneously, a forward exchange con-tract is concluded to re-exchange the two currencies in the future in order to be able to repay the funds raised on the due dates.
The Bank enters into currency swaps, in which, at incep-tion, the proceeds of a borrowing are converted into a different currency, mainly as part of its resource-raising operations, and, thereafter, the Bank will obtain the amounts needed to service the borrowing in the origi-nal currency.
The following table shows the maturities of currency swaps (excluding short-term currency swaps – see Note V.2.), sub-divided according to their notional amount and fair value. The notional amounts are disclosed off balance sheet.
Currency swaps at 31 December 2012 (in EUR million)
1 year or less More than 1 year and up
to 5 years
More than 5 years and up
to 10 years
More than 10 years
Total 2012
Notional amount 24 149 92 179 27 323 17 715 161 366
Fair value (i.e. net discounted value)(*) 982 5 089 3 036 3 198 12 305
Currency swaps at 31 December 2011 (in EUR million)
1 year or less More than 1 year and up
to 5 years
More than 5 years and up
to 10 years
More than 10 years
Total 2011
Notional amount 18 084 93 371 37 030 18 071 166 556
Fair value (i.e. net discounted value)(*) 717 4 120 4 615 3 433 12 885
(*) Including the fair value of macro-hedging currency swaps which stood at EUR 8 million as at 31 December 2012 (2011: EUR 283 million).

74 Financial Report 2012
V.1.2. Interest rate swaps
Interest rate swaps are contracts under which, generally, it is agreed to exchange floating-rate interest for fixed-rate interest or vice versa.
Interest rate swaps enable the Bank to modify the interest rate structure of its borrowing portfolio and other portfolios in order to accommodate requests from its clients and also to reduce funding costs by exchanging its advantageous access conditions to certain capital markets with its counterparties.
The following table shows the maturities of interest rate swaps (including the credit default swap – see Note V.3. and synthetic swaps, whereby interest computed in a foreign currency is synthetically converted to EUR), sub-divided according to their notional amount and fair value. The notional amounts are disclosed off balance sheet.
Interest rate swaps at 31 December 2012 (in EUR million)
1 year or less More than 1 year and up
to 5 years
More than 5 years and up
to 10 years
More than 10 years
Total 2012
Notional amount 44 560 187 029 78 536 122 692 432 817
Fair value (i.e. net discounted value)(*) 317 8 916 5 634 4 110 18 977
Interest rate swaps at 31 December 2011 (in EUR million)
1 year or less More than 1 year and up
to 5 years
More than 5 years and up
to 10 years
More than 10 years
Total 2011
Notional amount 36 656 179 678 74 866 110 012 401 212
Fair value (i.e. net discounted value)(*) 321 6 951 5 257 3 937 16 466
(*) Including the fair value of macro-hedging interest rate swaps which stood at EUR -648 million as at 31 December 2012 (2011: EUR -664 million).
V.1.3. Structured swaps
The Bank does not generally enter into any options contracts in conjunction with its risk hedging policy. However, as part of its strategy of raising funds on the financial markets at a lesser cost, the Bank enters into borrowing contracts and loans encompassing notably interest rate or stock exchange index options. Such structured borrowings and loans are entirely covered by swap contracts to hedge the corresponding market risk.
The table below further details the number, value and notional amounts of structured swaps:
Early termination embedded Stock exchange index Special structure coupon or similar
2012 2011 2012 2011 2012 2011
Number of transactions 330 337 3 4 346 339
Notional amount (in EUR million) 8 821 11 302 243 615 21 332 21 285
Net discounted value (in EUR million) 1 015 1 114 4 27 142 381
The fair value of swap transactions is computed using the income approach, applying valuation techniques to convert future amounts to a single present amount (discounted). The estimate of fair value is based on the value indicated by marketplace expectations about those future amounts. Valuation techniques can range from simple discounted known cash flows to complex option models. The valuation models applied are consistent with accepted economic methodol-ogies for pricing financial instruments, and incorporate the factors that market participants consider when setting a price. For a portion of derivative transactions, internal estimates and assumptions might be used in the valuation tech-niques when the market inputs are not directly available.
All option contracts embedded in, or linked with, borrowings are negotiated over the counter. The structured deals include a variety of transactions dependent on interest rates, FX rates, inflation rates, stock indexes and IR volatilities.

752012 Financial Report
EIB Statutory Financial Statements of the Bank
V.1.4. Derivatives credit risk mitigation policy
The credit risk with respect to derivatives lies in the loss which the Bank would incur where the counterparty would be unable to honour its contractual obligations.
In view of the special nature and complexity of the derivatives transactions, a series of procedures has been put in place to safeguard the Bank against losses arising from the use of such instruments.
• Contractual framework:
All of the Bank’s derivative transactions are concluded in the contractual framework of Master Swap Agreements and Credit Support Annexes, which specify the conditions of exposure collateralisation. These are generally accepted and practised contract types.
• Counterparty selection:
The minimum rating at the outset is set at A1, but certain counterparties rated A2/A3 have also been authorised. The EIB has the right of early termination if the rating drops below a certain level.
• Collateralisation:
- Exposures (exceeding limited thresholds) are collateralised by cash and bonds.
- Complex and illiquid transactions could require collateralisation over and above the current market value.
- Both the derivatives portfolio with individual counterparties and the collateral received are regularly monitored and valued, with a subsequent call for additional collateral or release.
The market value of collateral received for swaps amounts to EUR 35 205 million as at 31 December 2012 (2011: EUR 31 372 million), with the following composition:
Swap collateral (in EUR million)
Moody’s or equivalent rating Bonds Cash Total 2012
Government Agency, supranational, covered bonds
Aaa 1 913 1 358 0 3 271
Aa1 to Aa3 8 370 185 0 8 555
A1 to A3 11 0 0 11
Baa1 to Baa3 12 145 0 0 12 145
Below Baa3 843 0 0 843
Non-Rated 0 0 10 380 10 380
Total 2012 23 282 1 543 10 380 35 205
Swap collateral (in EUR million)
Moody’s or equivalent rating Bonds Cash Total 2011
Government Agency, supranational, covered bonds
Aaa 2 385 0 0 2 385
Aa1 to Aa3 2 224 0 0 2 224
A1 to A3 15 117 0 0 15 117
Baa1 to Baa3 6 0 0 6
Below Baa3 713 0 0 713
Non-Rated 0 0 10 927 10 927
Total 2011 20 445 0 10 927 31 372

76 Financial Report 2012
• Credit risk measurement for derivatives:
The credit risk associated with derivatives varies according to a number of factors (such as interest and exchange rates) and generally corresponds to only a small portion of their notional value.
The Bank measures the credit risk exposure related to swaps and derivatives transactions using the Net Market Exposure (NME) and Potential Future Exposure (PFE) for reporting and limit monitoring, and the Credit Risk Equivalent for capital allocation according to the recommendations of the Basel Committee on Banking Supervision (BCBS) sponsored by the BIS.
The Bank computes the Net Market Exposure, which is the larger of zero and the market value or “fair value” of the port-folio of transactions within the netting set with a counterparty, less the collateral. It is the amount that would be lost upon the default of the counterparty, using the received collateral and assuming no recovery on the value of those transactions in bankruptcy as well as immediate replacement of the swap counterparty for all the transactions. As of 31 December 2012 the Net Market Exposure stood at EUR 3 457 million (EUR 3 670 million as of 31 December 2011).
In addition, the Bank computes the Potential Future Exposure (PFE), which is the possible increase in the netting set’s exposure over the margin period of risk, which ranges between 10 and 20 days, depending on the portfolio of transac-tions. The EIB computes PFE at 90% confidence level using stressed market parameters to arrive at conservative estima-tions of the Potential Future Exposure. This is in line with the recommendations issued by regulators in order to take into consideration the conditions that will prevail in case of default of an important market participant. As of 31 Decem-ber 2012 the total Potential Future Exposure (PFE) stood at EUR 16 494 million (EUR 15 565 million as of 31 December 2011).
• Limits:
The limit system for banks covers both exposure, Net Market Exposure and Potential Future Exposure.
The Net Market Exposure is measured by the NPV of the swap portfolio minus the amount of collateral received. It is lim-ited by the Threshold applicable to the banks as defined in the Credit Support Annex and is dependent on the rating of the counterparty. For any exposure exceeding this Threshold, the Bank receives collateral posted by the counterparty.
The Potential Future Exposure limit determines the maximum potential future exposure, measured as explained above and reduced by overcollateralisation, accepted for each counterparty.
The derivatives portfolio is valued and compared against limits on a daily basis.
The following table provides a breakdown of counterparties by rating.
Grouped ratings Percentage of nominal Net Market Exposure(in EUR million)
Potential Future Exposure(in EUR million)
Moody’s or equivalent rating 2012 2011 2012 2011 2012 2011
Aaa 1.10% 1.20% 42 156 219 301
Aa1 to Aa3 24.60% 36.80% 1 173 1 245 4 476 9 919
A1 46.50% 35.90% 1 894 1 414 8 701 4 460
A2 to A3 22.30% 25.60% 348 841 2 863 822
Below A3 5.50% 0.50% 0 14 235 63
Total 100.00% 100.00% 3 457 3 670 16 494 15 565
V.2. As part of liquidity management
The Bank enters into short-term currency swap contracts in order to adjust currency positions in its operational treasury portfolios in relation to its benchmark currency, the euro, and to cater for demand for currencies in conjunction with loan disbursements.

772012 Financial Report
EIB Statutory Financial Statements of the Bank
The notional amount of short-term currency swaps stood at EUR 29 392 million at 31 December 2012 against EUR 19 631 million at 31 December 2011. The notional amount of short term currency forwards was EUR 364 million at 31 December 2012 (2011: EUR 322 million). The fair value of these contracts was EUR -145 million at 31 December 2012 (2011: EUR 767 million).
Long-term futures are also used by the Bank to adjust the medium term (2-year) interest rate exposure of its treasury bond portfolios. The notional amount of long-term futures stood at EUR nil at 31 December 2012 (2011: EUR 386 mil-lion), with a nil fair value (2011: EUR -1 million).
Forward rate agreements are used by the Bank to hedge the interest rate risk of its short term funding. The notional amount of forward rate agreements stood at EUR 4 947 million at 31 December 2012 (2011: EUR 6 606 million) and their fair value at EUR 4 million (2011: EUR 2 million).
Note W – Conversion rates
The following conversion rates were used for establishing the balance sheets at 31 December 2012 and 2011:
31.12.2012 31.12.2011
Non-euro currencies of EU member states
Bulgarian leva (BGN) 1.9558 1.9558
Czech koruna (CZK) 25.151 25.787
Danish kroner (DKK) 7.4610 7.4342
Pound sterling (GBP) 0.8161 0.8353
Hungarian forint (HUF) 292.30 314.58
Polish zloty (PLN) 4.0740 4.4580
Romanian lei (RON) 4.4445 4.3233
Swedish kronor (SEK) 8.5820 8.9120
Non-EU currencies
Australian dollar (AUD) 1.2712 1.2723
Canadian dollar (CAD) 1.3137 1.3215
Swiss franc (CHF) 1.2072 1.2156
Egyptian pound (EGP) 8.4007 7.8058
Hong Kong dollar (HKD) 10.226 10.051
Iceland Krona (ISK) 236.35 257.30
Japanese yen (JPY) 113.61 100.20
Kenyan shilling (KES) 113.68 109.53
Moroccan dirham (MAD) 11.112 11.107
Mexican peso (MXN) 17.185 18.051
Norwegian krone (NOK) 7.3483 7.7540
New Zealand dollar (NZD) 1.6045 1.6737
Russian ruble (RUB) 40.330 41.765
Serbia dinars (RSD) 112.300 106.920
Tunisia dinars (TND) 2.0472 1.9364
Turkish lira (TRY) 2.3551 2.4432
Taiwan dollars (TWD) 38.399 39.203
Ukraine Hryvnia (UAH) 10.631 10.351
United States dollar (USD) 1.3194 1.2939
Franc CFA (XOF) 655.96 655.96
South African rand (ZAR) 11.173 10.483

78 Financial Report 2012
Note X – Related party transactions
X.1. European Investment Fund
Related party transactions with the European Investment Fund (‘EIF’) are mainly related to the management by the Bank of the EIF treasury, the IT, the pension fund and other services on behalf of the EIF. In addition, the EIF manages the venture capital activity of the Bank. The amounts included in the Financial Statements and relating to the EIF are disclosed as follows:
(in EUR´ 000) 31.12.2012 31.12.2011
Assets:
Shares in affiliated undertakings 493 532 491 588
Prepayments and accrued income 482 1 482
Other assets 1 975 1 378
Total assets 495 989 494 448
Liabilities:
Amounts owed to customers 0 -19
Other liabilities -54 562 -47 228
Total liabilities -54 562 -47 247
Profit and loss account:
Income from shares in affiliated undertakings 0 1 786
Commission income 3 566 3 747
Commission expenses -17 411 -13 608
Other operating income 3 569 2 564
General administrative expenses 2 836 2 180
Total profit and loss account -7 440 -3 331
Off balance sheet:
EIF capital – uncalled 1 491 200 1 486 400
EIF treasury management 1 005 068 889 808
Nominal value of put option granted to EIF minority shareholders 424 376 385 841
Total off balance sheet 2 920 644 2 762 049
X.2. Key Management Personnel
The Bank has identified members of the Board of Directors, the Audit Committee, the Management Committee, the Directors General heading the different EIB organisational directorates as key management personnel.
Key management personnel compensation for the relevant reporting periods, included within General administrative expenses (Note R), is disclosed in the following table:
(in EUR ’000) 2012 2011
Short-term benefits(1) 7 248 8 332
Post employment benefits(2) 613 545
Termination benefits 504 504
8 365 9 381
(1) Short-term employee benefits comprise salaries and allowances, bonuses and social security contributions of the Management Committee, the Direc-tors General and other Directors, and benefits paid to the members of the Board of Directors and the Audit Committee.
(2) Post employment benefits comprise pensions and expenses for post employment health insurance paid to members of the Management Committee and Directors General and other Directors.

792012 Financial Report
EIB Statutory Financial Statements of the Bank
Open balances with key management personnel as at 31 December 2012 comprise the compulsory and optional sup-plementary pension plan and health insurance scheme liabilities, and payments outstanding as at the year end:
(in EUR ’000) 31.12.2012 31.12.2011
Pension plans and health insurance (Note L) -38 223 -31 964
Other liabilities (Note G) -9 443 -7 012
Other assets (Note G) 0 6
Note Y – Post balance sheet events
There have been no material events after the balance sheet date that would require adjustment of, or disclo-sure in, the Financial Statements as at 31 December 2012.
Note Z – Management of third party funds
Z.1. NER300
The EIB supports the EC as an agent in the implementa-tion of the NER 300 initiative - a funding programme for carbon capture and storage demonstration projects and innovative renewable energy technologies. The EIB prepares separate financial statements for NER300.
Z.2. Investment Facility – Cotonou
The Investment Facility, which is managed by the EIB, has been established within the framework of the Coto-nou Agreement on cooperation and development of the African, Caribbean and Pacific Group of States and the European Union and its Member States on 23 June 2000 and subsequently revised. The EIB prepares sepa-rate financial statements for the Investment Facility.
Z.3. Guarantee Fund
The Guarantee Fund for External Actions was set up in 1994 to cover defaults on loans and loan guarantees granted to non-Member States or for projects in non-Member States. The European Commission (‘EC’) entrusted financial management of the Guarantee Fund to the EIB under an agreement signed between the two parties in November 1994. The EIB prepares separate financial statements for the Guarantee Fund.
Z.4. JESSICA (Contribution and Holding Funds)
JESSICA (The Joint European Support for Sustainable Investment in City Area) is an initiative developed by
the EC and the EIB, in collaboration with the Council of Europe Development Bank.
Under new procedures, Managing Authorities are being given the option of using some of their EU grant fund-ing to make repayable investments in projects forming part of an integrated plan for sustainable urban devel-opment. These investments are delivered to projects via Urban Development Funds or if required Holding Funds (JESSICA Holding Funds).
JESSICA Holding Funds are used in the context of the JESSICA initiative. As manager, EIB gathers the funding received from the Managing Authorities and invests it in Urban Development Funds, according to investment guidelines agreed with the donors. The EIB prepares separate financial statements for JESSICA.
Z.5. FP7 Guarantee Fund
The 7th Framework Programme (‘FP7’) is designed to support research, technological development and dem-onstration projects all over Europe. The rules and princi-ples for the management of the FP7 are laid out in the Agreement between the EC on behalf of the European Atomic Energy Community and the EIB. The EC entrusted financial management of the FP7 Guarantee Fund to the EIB under an agreement signed between the two parties in December 2007. The EIB prepares separate financial statements for FP7 Guarantee Fund.
Z.6. Risk-Sharing Finance Facility (‘RSFF’)
The RSFF has been established within the framework of the Co-operation Agreement, entered into force on 5 June 2007 between the EC on behalf of the European Union and the EIB. The RSFF aims at fostering invest-ment in research, technological development and dem-onstration, and innovation. As part of the RSFF, the EIF set up the Risk Sharing Instrument for Innovative and Research oriented SMEs and small Mid-Caps (‘RSI’). The RSI provides guarantees to banks and leasing compa-nies for loans and financial leases to research-based small and medium-sized enterprises (SMEs) and small Mid-Caps. The EIB prepares separate financial state-ments for the RSFF.

80 Financial Report 2012
Z.7. EIF treasury
The EIF treasury is managed by the Bank in accordance with the treasury management agreement signed between the two parties in December 2000.
Z.8. Special Section
The Special Section was set up by the Board of Gover-nors on 27 May 1963. Under a decision taken on 4 August 1977, its purpose was redefined as being that of recording financing operations carried out by the EIB for the account of and under mandate from third parties. It includes the FED, MED/FEMIP and Turkey mandates.
Z.9. EU-Africa Infrastructure Trust Fund (the ‘Trust Fund’)
The Trust Fund has been created within the framework of the Trust Fund Agreement between the EC on behalf of the European Union as the Founding Donor and the EIB as Manager, also open to Member States of the European Union which subsequently accede to this agreement as Donors. On 9 February 2006, the EC and the EIB signed a Memorandum of Understanding to promote jointly the EU-Africa Infrastructure Partnership and, in particular, to establish a supporting EU-Africa Infrastructure Trust Fund. The EIB prepares separate financial statements for the Trust Fund.
Z.10. GF Greece
The Fund is a joint initiative between the Hellenic Republic, the EC and the EIB and was set up to support the lending to SMEs in Greece. Established by using unabsorbed Structural Funds for Greece, the Fund will guarantee EIB loans to SMEs via partner banks in Greece.
Z.11. European Neighbourhood and Partnership Instrument (‘ENPI’)
The Framework Agreement between the European Union and the EIB on the implementation of operations financed from the general budget of the European Union in the countries covered by the European Neigh-bourhood Policy is channelled through the ENPI. The EIB prepares separate financial statements for ENPI.
Z.12. Loan Guarantee Instrument for Ten-T Projects (’LGTT’)
The LGTT has been established within the framework of the Co-operation Agreement, entered into force on 11 January 2008 between the EC on behalf of the Euro-pean Union and the EIB. The LGTT aims at facilitating a greater private sector involvement in the financing of
Trans-European transport networks infrastructure. The EIB prepares separate financial statements for the LGTT.
Z.13. ECHA
On 1 April 2012 the EIB entered into an asset manage-ment agreement with the European Chemicals Agency (ECHA). Under this agreement the EIB manages the investment portfolio of ECHA in accordance with the pre-agreed Asset Management Guidelines.
Z.14. AEICD
This partnership agreement signed between the King-dom of Spain (the Spanish Agency for International Development Cooperation (AECID)) and the EIB was set up to invest in operations in the countries covered by the FEMIP together with Mauritania (the “Southern Mediterranean region”), targeting mainly risk capital activities for micro and small/medium enterprises as well as engaging in the wider development of the pri-vate sector in the region.
Z.15. Neighbourhood Investment Facility (‘NIF’) Trust Fund
The NIF Trust Fund managed by the EIB was set up to achieve the strategic objective of the European Neigh-bourhood Partnership Instrument through targeted funding aimed at strengthening infrastructure intercon-nection between the EU and its neighbours in the areas of Transport and Energy, at addressing common envi-ronmental concerns and at supporting other relevant activities. The EIB prepares separate financial state-ments for the NIF Trust Fund.
Z.16. Project Bond Initiative (‘PBI’)
A Cooperation Agreement between the EC and the EIB in respect of the Project Bond Instrument: Pilot Phase was signed in November 2012. The PBI is designed to stimulate capital market financing for infrastructure delivered under ‘project finance’ struc-tures, including Public Private Partnerships (PPPs). The initiative will seek to enhance the credit rating of bonds issued by project companies to a rating level that is attractive for investors and to lower the pro-ject’s overall financing costs.
Z.17. Heavily Indebted Poor Countries (‘HIPC’) Initiative
The HIPC Initiative (the ‘Initiative’) is an international debt relief mechanism that provides special assistance to the world’s poorest countries. It was launched in 1996 following a proposal from the World Bank and the

812012 Financial Report
EIB Statutory Financial Statements of the Bank
International Monetary Fund. The principal objective of the Initiative is to reduce the debt burden of poor coun-tries to sustainable levels. The EIB prepares separate financial statements for the Initiative.
Z.18. FEMIP Trust Fund
The FEMIP (Facility for Euro-Mediterranean Investment and Partnership)Trust Fund, which is also managed by the EIB, was set up to enhance the existing activities of the EIB in the Mediterranean Partner Countries, with the support of a number of donor countries and with a view of directing resources to operations in certain priority sectors through the provision of technical assistance and risk capital. The EIB prepares separate financial statements for the FEMIP Trust Fund.
Z.19. EPTA Trust Fund
EPTA (The Eastern Partnership Technical Assistance) Trust Fund is focused on increasing the quality and development impact of EIB Eastern Partnership oper-ations by offering a multi-purpose, multi-sector funding facility for technical assistance. It will be
complementary to the Neighbourhood Investment Facility. The EIB prepares separate financial state-ments for EPTA Trust Fund.
Z.20. JASPERS
JASPERS (The Joint Assistance to Support Projects in European Regions) is a major joint policy initiative of the EIB, EC (Regional Policy Directorate-General - DG Regio) and the European Bank for Reconstruction and Development. It provides advice to the 12 Central and Eastern EU Member States and Croatia during pro-ject preparation to help improve the quality of the major projects to be submitted for grant financing under the Structural and Cohesion Funds.
Z.21. EPEC
The European PPP Expertise Centre (‘EPEC’) is a joint ini-tiative of the EIB, the EC and European Union Member States and Candidate Countries. EPEC’s mission is to strengthen the ability of the public sector to engage in Public Private Partnership (PPP) transactions. The EIB prepares separate financial statements for EPEC.

82 Financial Report 2012
Statement of Special Section (1) as at 31 December 2012 and 2011 (in EUR ‘000)
Amounts disbursed and to be disbursed 31.12.2012 31.12.2011
Turkey
From resources of Member States
Disbursed loans outstanding 6 492 7 811
Total (2) 6 492 7 811
Mediterranean Countries
From resources of the European Union
Disbursed loans outstanding 95 312 106 260
Risk capital operations
- amounts to be disbursed 58 828 64 926
- amounts disbursed 123 912 151 260
182 740 216 186
Total (3) 278 052 322 446
African, Caribbean and Pacific State and Overseas Countries and Territories
From resources of the European Union
• Yaoundé Conventions
Loans disbursed 4 555 5 797
Contributions to the formation of risk capital
- amounts disbursed 419 419
Total (4) 4 974 6 216
• Lomé Conventions
Operations from risk capital resources
- amounts to be disbursed 16 117 16 218
- amounts disbursed 475 915 591 263
492 032 607 481
Total (5) 492 032 607 481
Total 781 550 943 954
Funds received and to be received 31.12.2012 31.12.2011
Funds under trust management
Under mandate from the European Union
- Financial Protocols with the Mediterranean Countries 219 224 257 520
- Yaoundé Conventions 4 974 6 216
- Lomé Conventions 475 915 591 263
700 113 854 999
Under mandate from Member States 6 492 7 811
Total funds under trust management 706 605 862 810
Funds to be disbursed
On loans and risk capital operations in the Mediterranean countries 58 828 64 926
On operations from risk capital resources under the Lomé Conventions 16 117 16 218
Total funds to be disbursed 74 945 81 144
Total 781 550 943 954

832012 Financial Report
EIB Statutory Financial Statements of the Bank
For information:
Total amounts disbursed and not yet repaid on loans on special conditions made available by the Commission in respect of which the Bank has accepted an EU mandate for recovering principal and interest:
a) Under the First, Second and Third Lomé Conventions as at 31 December: 2012: EUR ‘000 417 129 (2011: EUR ‘000 472 103)
b) Under Financial Protocols signed with the Mediterranean Countries as at 31 December: 2012: EUR ‘000 85 017 (2011: EUR ‘000 90 991)
Note (1): The Special Section was set up by the Board of Governors on 27 May 1963. Under a decision taken on 4 August 1977, its purpose was redefined as being that of recording financing operations carried out by the European Investment Bank for the account of and under mandate from third parties. However, for the Investment Facility under the Cotonou Agreement, the EU-Africa Infrastructure Trust Fund, the Neighbourhood Investment Facility (NIF) Trust Fund and the FEMIP Trust Fund, separate financial statements are presented. In addition, since 2005, the EIB also prepares financial statements of different types for other mandates.
The Statement of Special Section reflects amounts disbursed or to be disbursed, less cancellations and repayments, under mandate from the European Union and the Member States. Amounts disbursed and to be disbursed and funds received and to be received are carried at nominal value. No account is taken in the Statement of Special Section of pro-visions or value adjustments, which may be required to cover risks associated with such operations. Amounts in foreign currency are translated at exchange rates prevailing on 31 December.
Note (2): Initial amount of contracts signed for financing projects in Turkey under mandate, for the account and at the risk of Member States.
Initial amount: 405 899
add: exchange adjustments 20 412
less: cancellations 215
repayments 419 604
-419 819
6 492
Note (3): Initial amount of contracts signed for financing projects in the Maghreb and Mashreq countries, Malta, Cyprus, Turkey and Greece (EUR 10 million lent prior to accession to the EC on 1 January 1981) under mandate, for the account and at the risk of the European Union.
Initial amount: 840 457 (*)
less: exchange adjustments 48 508
cancellations 119 859
repayments 394 038
-562 405
278 052
(*) Change in initial amount relates to ENPI (Note Z.11) which is no longer reported as part of Special Section.

84 Financial Report 2012
Note (4): Initial amount of contracts signed for financing projects in the Associated African States, Madagascar and Mauritius and the Overseas Countries, Territories and Departments (AASMM-OCTD) under mandate, for the account and at the risk of the European Union:
Loans on special conditions 139 483
Contributions to the formation of risk capital 2 503
Initial amount: 141 986
add: capitalised interests 1 178
exchange adjustments 9 831
11 009
less: cancellations 3 310
repayments 144 711
-148 021
4 974
Note (5): Initial amount of contracts signed for financing projects in the African, Caribbean and Pacific States and the Overseas Countries and Territories (ACP-OCT) under mandate, for the account and at the risk of the European Union:
Loans from risk capital resources:
Conditional and subordinated loans 3 116 097
Equity participations 121 002
Initial amount: 3 237 099
add: capitalised interests 9 548
less: cancellations 684 845
repayments 2 011 777
exchange adjustments 57 993
-2 754 615
492 032
Loans from other resources:
Initial amount: 16 500
add: exchange adjustments 58
less: cancellations 8 414
repayments 8 144
-16 558
0
492 032

852012 Financial Report
EIB Statutory Financial Statements of the Bank
Independent Auditor’s Report
To the Chairman of the Audit Committee of EUROPEAN INVESTMENT BANK 98-100, Boulevard Konrad Adenauer L-2950 LUXEMBOURG
REPORT OF THE REVISEUR D’ENTREPRISES AGREE
We have audited the accompanying financial state-ments of EUROPEAN INVESTMENT BANK, which com-prise the balance sheet as at 31 December 2012, the profit and loss account and the cash flow statement for the year then ended, and a summary of significant accounting policies and other explanatory information.
Management’s responsibility for the financial statements
The Management is responsible for the preparation and fair presentation of these financial statements in accord-ance with the general principles of the Directive 86/635/EEC of the Council of the European Communities of 8 December 1986 on the annual accounts and consoli-dated accounts of banks and other financial institutions, as amended by Directive 2001/65/EC of 27 September 2001, by Directive 2003/51/EC of 18 June 2003 and by Directive 2006/46/EC of 14 June 2006 (the ‘Directives’), and for such internal control as the Management deter-mines is necessary to enable the preparation of financial statements that are free from material misstatement, whether due to fraud or error.
Responsibility of the Réviseur d’Entreprises agréé
Our responsibility is to express an opinion on these financial statements based on our audit. We conducted our audit in accordance with International Standards on Auditing as adopted for Luxembourg by the Commis-sion de Surveillance du Secteur Financier. Those stand-ards require that we comply with ethical requirements and plan and perform the audit to obtain reasonable
assurance about whether the financial statements are free from material misstatement.
An audit involves performing procedures to obtain audit evidence about the amounts and disclosures in the finan-cial statements. The procedures selected depend on the judgement of the Réviseur d’Entreprises agréé, including the assessment of the risks of material misstatement of the financial statements, whether due to fraud or error. In making those risk assessments, the Réviseur d’Entreprises agréé considers internal control relevant to the entity’s preparation and fair presentation of the financial state-ments in order to design audit procedures that are appro-priate in the circumstances, but not for the purpose of expressing an opinion on the effectiveness of the entity’s internal control. An audit also includes evaluating the appropriateness of accounting policies used and the rea-sonableness of accounting estimates made by the Man-agement, as well as evaluating the overall presentation of the financial statements.
We believe that the audit evidence we have obtained is sufficient and appropriate to provide a basis for our audit opinion.
Opinion
In our opinion, the financial statements give a true and fair view of the financial position of EUROPEAN INVESTMENT BANK as of 31 December 2012, and of the results of its operations and its cash flows for the year then ended in accordance with the general principles of the Directives.
Luxembourg, 14 March 2013 KPMG Luxembourg S.à r.l. Cabinet de révision agréé
E. DolléKPMG Luxembourg S.à r.l. 9, Allée SchefferL-2520 LuxembourgSociété à responsabilité limitéeR.C.S. Luxembourg B 149133Capital € 12 502

86 Financial Report 2012
Statement by the Audit Committee
The Audit Committee reports to the Board of Governors, the following statement being communicated to the Governors prior to their approval of the Annual Report and the financial statements for the past financial year.
Statement by the Audit Committee on the Bank’s unconsolidated financial statements prepared in accordance with the general principles of the EU Directives
The Committee, instituted in pursuance of Article 12 of the Statute and Chapter V of the Rules of Procedure of the European Investment Bank for the purpose of verify-ing that the operations of the Bank are conducted and its books kept in a proper manner, having
- designated KPMG as external auditors, reviewed their audit planning process, examined and dis-cussed their reports,
- noted that the opinion of KPMG on the unconsoli-dated financial statements of the European Invest-ment Bank for the year ended 31 December 2012 prepared in accordance with the general principles of the EU Directives is unqualified,
- convened on a regular basis with the Heads of Di-rectorates and relevant services including,
• the Financial Controller;
• the Directors General of Risk Management and Transaction Monitoring and Restructuring.
- met regularly the Head of Internal Audit and dis-cussed the relevant internal audit reports, and stud-ied the documents which it deemed necessary to examine in the discharge of its duties,
- received assurance from the Management Commit-tee concerning the effectiveness of the internal con-trol structure and internal administration,
and considering
- the financial statements for the financial year ended 31 December 2012 as drawn up by the Board of Di-rectors at its meeting on 14 March 2013,
- that the foregoing provides a reasonable basis for its statement and,
- Articles 24, 25 & 26 of the Rules of Procedure,
to the best of its knowledge and judgement:
- confirms that the activities of the Bank are conduct-ed in a proper manner, in particular with regard to risk management and monitoring;
- has verified that the operations of the Bank have been conducted and its books kept in a proper manner and that, to this end, it has verified that the Bank’s operations have been carried out in compli-ance with the formalities and procedures laid down by the Statute and Rules of Procedure;
- confirms that the financial statements, comprising the balance sheet, the profit and loss account and the cash flow statement and a summary of signifi-cant accounting policies and other explanatory information give a true and fair view of the finan-cial position of the Bank as at 31 December 2012 in respect of its assets and liabilities, and of the re-sults of its operations and cash flows for the year then ended, in accordance with the general prin-ciples of EU Directives.
Luxembourg, 14 March 2013
The Audit Committee
J. RODRIGUES DE JESUS D. NOUY M. MATEJ
M. ÜÜRIKE B. JAKOBSEN J.N. SCHAUS

NP 87Financial Report 2012 2012 Financial Report
EIB Group Consolidated Financial Statements under EU Directives
EIB GroupConsolidated Financial Statements under eu Directivesas at 31 December 2012
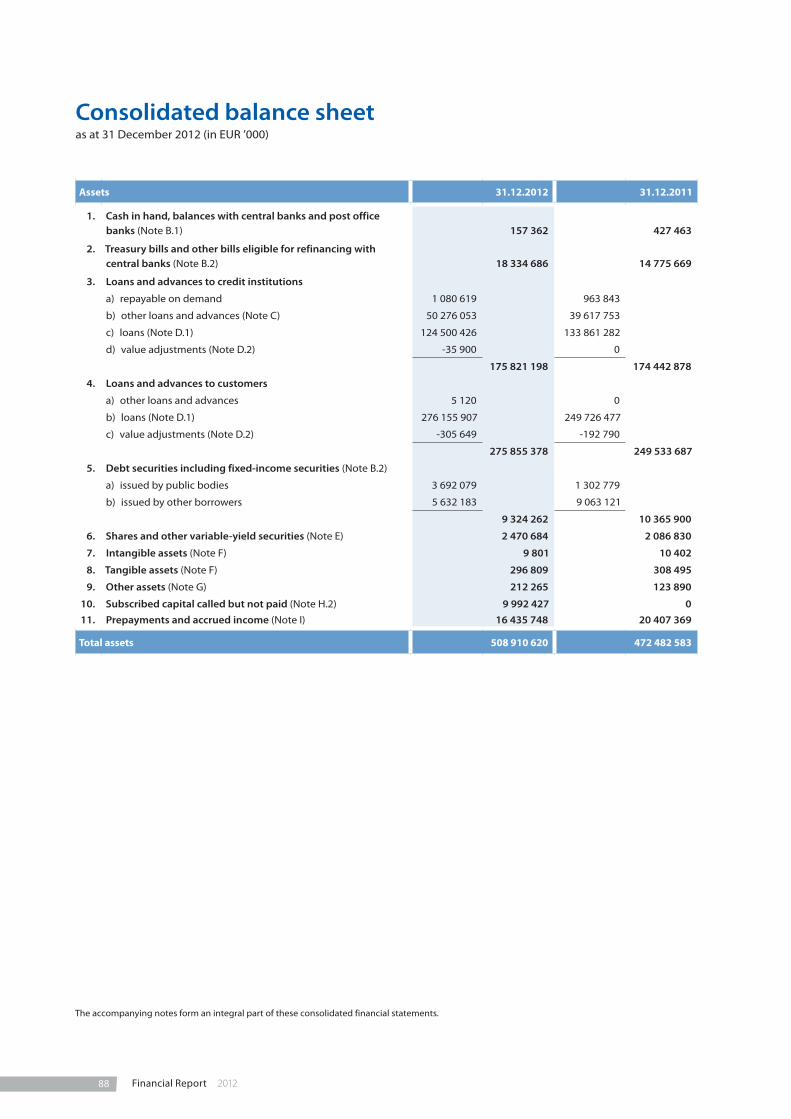
88 Financial Report 2012
Consolidated balance sheetas at 31 December 2012 (in EUR ’000)
Assets 31.12.2012 31.12.2011
1. Cash in hand, balances with central banks and post office banks (Note B.1)
157 362
427 463
2. Treasury bills and other bills eligible for refinancing with central banks (Note B.2)
18 334 686
14 775 669
3. Loans and advances to credit institutions
a) repayable on demand 1 080 619 963 843
b) other loans and advances (Note C) 50 276 053 39 617 753
c) loans (Note D.1) 124 500 426 133 861 282
d) value adjustments (Note D.2) -35 900 0
175 821 198 174 442 878
4. Loans and advances to customers
a) other loans and advances 5 120 0
b) loans (Note D.1) 276 155 907 249 726 477
c) value adjustments (Note D.2) -305 649 -192 790
275 855 378 249 533 687
5. Debt securities including fixed-income securities (Note B.2)
a) issued by public bodies 3 692 079 1 302 779
b) issued by other borrowers 5 632 183 9 063 121
9 324 262 10 365 900
6. Shares and other variable-yield securities (Note E) 2 470 684 2 086 830
7. Intangible assets (Note F) 9 801 10 402
8. Tangible assets (Note F) 296 809 308 495
9. Other assets (Note G) 212 265 123 890
10. Subscribed capital called but not paid (Note H.2) 9 992 427 0 11. Prepayments and accrued income (Note I) 16 435 748 20 407 369
Total assets 508 910 620 472 482 583
The accompanying notes form an integral part of these consolidated financial statements.

892012 Financial Report
EIB Group Consolidated Financial Statements under EU Directives
Liabilities 31.12.2012 31.12.2011
1. Amounts owed to credit institutions (Note J)
a) repayable on demand 10 708 287 10 969 469
b) with agreed maturity dates or periods of notice 952 306 1 190 595
11 660 593 12 160 064
2. Amounts owed to customers (Note J)
a) repayable on demand 2 071 645 1 630 569
b) with agreed maturity or periods of notice 658 637 960 037
2 730 282 2 590 606
3. Debts evidenced by certificates (Note K)
a) debt securities in issue 400 349 871 376 154 543
b) others 24 323 888 25 281 246
424 673 759 401 435 789
4. Other liabilities (Note G) 614 688 518 441
5. Accruals and deferred income (Note I) 11 499 540 11 077 023
6. Provisions
a) pension plans and health insurance scheme (Note L) 1 762 993 1 617 456
b) provision for guarantees issued (Note D.4) 174 993 161 867
c) provision for commitment on investment funds 7 279 8 026
1 945 265 1 787 349
7. Subscribed capital (Note H)
a) subscribed 242 392 989 232 392 989
b) uncalled - 220 773 340 - 220 773 340
21 619 649 11 619 649
8. Reserves (Note H)
a) reserve fund 21 596 628 20 972 343
b) additional reserves 1 255 639 1 278 874
c) special activities reserve 5 140 386 4 108 940
d) general loan reserve 2 976 909 2 340 863
30 969 562 28 701 020
9. Profit for the financial year 2 796 768 2 267 878 10. Equity attributable to minority interest (Note H) 400 514 324 764
Total liabilities 508 910 620 472 482 583
The accompanying notes form an integral part of these consolidated financial statements.

90 Financial Report 2012
Consolidated off - balance sheetas at 31 December 2012 (in EUR ’000)
Off-balance sheet items 31.12.2012 31.12.2011
Commitments:- EBRD capital uncalled (Note E) 712 630 442 500
- Undisbursed loans (Note D.1)
• creditinstitutions 19 786 999 20 022 455
• customers 62 129 484 65 784 468
81 916 483 85 806 923
- Undisbursed venture capital operations (Note E) 2 087 888 1 955 898
- Undisbursed investment funds (Note E) 539 385 547 148
Contingent liabilities and guarantees:
- In respect of loans granted by third parties 3 633 454 3 683 408
- In respect of venture capital operations 40 866 60 524
Assets held on behalf of third parties (Note Z):
- NER300 2 270 706 2 078 869
- Investment Facility - Cotonou 2 132 527 1 825 259
- Guarantee Fund 2 021 325 1 756 205
- JESSICA (Contribution and Holding Funds) 1 758 775 1 549 100
- FP7 Guarantee Fund 1 432 835 1 149 231
- RSFF 1 070 588 789 554
- Special Section 781 550 943 954
- JEREMIE 708 656 827 908
- EU-Africa Infrastructure Trust Fund 503 242 294 630
- GF Greece 300 000 0
- ENPI 168 489 161 228
- LGTT 163 275 154 831
- RSI 131 481 0
- SMEG 2007 124 104 107 605
- ECHA 121 614 148 616
- GIF 2007 102 621 97 726
- AECID 100 155 100 002
- SME Guarantee Facility 59 604 59 954
- NIF Trust Fund 55 301 55 019
- GAGF 50 067 31 400
- PBI 50 000 0
- HIPC 39 878 59 722
- FEMIP Trust Fund 29 868 30 395
- MAP guarantee 24 940 33 139
- MAP Equity 20 591 32 777
- G43 Trust Fund 15 895 16 202
- EPMF 10 508 9 155
- EPTA Trust Fund 9 086 7 348
- European Technology Facility 5 224 8 165
- GEEREF 4 120 1 569
- JASPERS 3 221 1 637
- Bundesministerium fur Wirtschaft und Technologie 2 528 2 635
- GEEREF Technical Support Facility 1 923 2 484
- TTP 1 605 1 687
- EPPA 706 1 468
The accompanying notes form an integral part of these consolidated financial statements.

912012 Financial Report
EIB Group Consolidated Financial Statements under EU Directives
Off-balance sheet items 31.12.2012 31.12.2011
- LfA-EIF Facility 519 166
- EPEC 415 0
- MDD 6 0
- GGF 5 5
14 277 953 12 339 645
Other items:
Nominal value of interest-rate swap and deferred rate-setting contracts (Note V.1)
432 817 455
401 211 736
Nominal value of currency swap contracts receivable (Note V.1) 190 231 826 185 661 830
Nominal value of currency swap contracts payable (Note V.1) 183 578 841 174 707 592
Forward rate agreements (Note V.2) 4 946 600 6 606 400
Value of put option granted to EIF minority shareholders 424 376 385 841
Currency forwards (Note V.2) 363 762 321 547
Swaps launched but not yet settled 16 475 60 394
Special deposits for service of borrowings (Note S) 16 311 29 685
Securities lending (Note B.2) 0 778 872
Future contracts (Note V.2) 0 386 190
The accompanying notes form an integral part of these consolidated financial statements.

92 Financial Report 2012
Consolidated profit and loss accountfor the year ended 31 December 2012 (in EUR ‘000)
2012 2011
1. Interest receivable and similar income (Note N) 25 560 312 24 946 788 2. Interest payable and similar charges (Note N) - 22 545 727 - 22 038 846
3. Income from securities 33 789 27 721
4. Commissions receivable (Note O) 293 395 268 208
5. Commissions payable - 146 - 276
6. Net result on financial operations (Note P) 264 162 - 181 149
7. Other operating income (Note Q) 10 097 9 189
8. General administrative expenses (Note R)
a) staff costs (Note L) - 403 244 - 399 260
b) other administrative expenses - 142 626 - 134 392
- 545 870 - 533 652
9. Value adjustments in respect of intangible and tangible assets (Note F)
a) tangible assets - 24 804 - 24 882
b) intangible assets - 6 449 - 4 716
- 31 253 - 29 598
10. Value (re-)adjustments in respect of loans and advances (Note D.2) and provisions for contingent liabilities
- 192 377
- 167 240
11. Extraordinary charges (Note M) 0 - 50 000
12. Profit for the financial year 2 846 382 2 251 145 13. Profit/loss attributable to minority interest (Note H) - 49 614 16 733
14. Profit attributable to equity holders of the Bank 2 796 768 2 267 878
Consolidated profit and loss accountfor the year ended 31 December 2012 (in EUR ‘000)
The accompanying notes form an integral part of these consolidated financial statements.

932012 Financial Report
EIB Group Consolidated Financial Statements under EU Directives
Consolidated cash flow statementfor the year ended 31 December 2012 (in EUR ‘000)
2012 2011
A. Cash flows from operating activities:Profit for the financial year 2 846 382 2 251 145 Adjustments for:Change in value adjustments on loans and advances (Note D.2) 148 759 101 182 Change in provisions on pension plans and health insurance scheme 145 537 150 276 Change in provisions for commitment on investment funds and guarantees on venture capital operations
14 110 66 058
Value adjustments in respect of tangible and intangible assets 31 253 29 598 Value (re-)adjustments in respect of shares and other variable-yield securities - 34 523 9 016 Held to maturity portfolio amortisation 9 703 7 339 Effect of exchange rate changes - 794 898 117 880
Profit on operating activities 2 366 323 2 732 494
Disbursements of loans and advances to credit institutions and customers - 48 366 746 - 55 538 192 Repayments of loans and advances to credit institutions and customers 32 233 139 23 811 553 Change in deposits with central banks 238 653 - 142 311 Change in treasury operational portfolios 786 624 429 123 Change in venture capital operations included in shares and other variable-yield securities - 252 148 - 147 882 Change in shares and other variable-yield securities excluding venture capital operations - 97 183 - 98 461 Change in amounts owed to credit institutions and customers - 359 795 5 396 914 Change in prepayments and accrued income 1 638 296 - 2 359 249 Change in other assets - 88 375 - 23 745 Change in short term treasury derivative valuations 19 065 0 Change in accruals and deferred income 422 517 636 540
Change in other liabilities 77 182 111 059
Net cash used in operating activities - 11 382 448 - 25 192 157
B. Cash flows from investing activities: Securities from investment portfolio matured during the year 187 749 243 022 Purchase of loan substitutes included in the debt securities portfolios - 2 792 755 - 3 661 199 Redemption of loan substitutes included in the debt securities portfolios 2 110 109 1 181 712 Purchase and disposal of tangible and intangible assets - 18 966 - 20 692
Net cash used in investing activities - 513 863 - 2 257 157
C. Cash flows from financing activities: Issuance of debts evidenced by certificates 140 025 290 151 108 378 Redemption of debts evidenced by certificates - 115 065 905 - 113 967 119 Member States’ contribution 7 573 57 663 Net cash flow from change in stake in subsidiary undertakings - 1 944 - 7 771 Dividend paid to minority interest 0 - 1 108
Net cash from financing activities 24 965 014 37 190 043
Summary statement of cash flows:
Cash and cash equivalents at beginning of financial year 47 038 818 37 209 630
Net cash from:Operating activities - 11 382 448 - 25 192 157 Investing activities - 513 863 -2 257 157 Financing activities 24 965 014 37 190 043 Effect of exchange rate changes on cash held 410 620 88 459
Cash and cash equivalents at end of financial year 60 518 141 47 038 818
Cash and cash equivalents are composed of:Cash in hand, balances with central banks and post office banks, excluding deposits with Central Bank of Luxembourg to cover minimum reserve requirement (Note B.1)
104
31 552
Bills maturing within three months of issue (Note B.2: A1 portfolio) 9 431 365 6 625 670 Loans and advances to credit institutions:Repayable on demand 1 080 619 963 843 Other loans and advances (Note C) 50 006 053 39 417 753
60 518 141 47 038 818
The accompanying notes form an integral part of these consolidated financial statements.

94 Financial Report 2012
The European Investment Bank (the ‘Bank’ or ‘EIB’) was created by the Treaty of Rome in 1958 as the long term lending bank of the European Union (‘EU’). The task of the Bank is to contribute towards the integration, bal-anced development and economic and social cohesion of the EU Member States. The EIB raises substantial vol-umes of funds on the capital markets and lends these funds on favourable terms to projects furthering EU policy objectives. The EIB continuously adapts its activi-ties to developments in EU policies.
The Bank has its registered office at 98-100, boulevard Konrad Adenauer, Luxembourg.
The European Investment Fund (the ‘Fund’ or ‘EIF’) was incorporated on 14 June 1994, in Luxembourg, as an in-ternational financial institution. The address of its regis-tered office is 96, boulevard Konrad Adenauer, L-2968 Luxembourg.
The primary task of the Fund, while providing adequate return on equity, is to contribute to the pursuit of Euro-pean Union objectives through:
• the provision of guarantees to financial institutions that cover credits to small and medium sized enti-ties (‘SME’);
• the acquisition, holding, managing and disposal of equity participations;
• the administration of special resources entrusted by third parties; and
• related activities.
The Bank holds 62.13% (2011: 61.93%) of the subscribed capital of the EIF. The Bank and the Fund together are defined as the ‘Group’.
Note A – Significant accounting policies
A.1. Accounting standards
The consolidated financial statements (the ‘Financial Statements’) of the European Investment Bank have been prepared in accordance with the general princi-ples of the Directive 86/635/EEC of the Council of the European Communities of 8 December 1986 on
the annual accounts and consolidated accounts of banks and other financial institutions, as amended by Directive 2001/65/EC of 27 September 2001, by Direc-tive 2003/51/EC of 18 June 2003 and by Directive 2006/46/EC of 14 June 2006 on the annual and consoli-dated accounts of certain types of companies, banks and other financial institutions (the ‘Directives’). How-ever, the Financial Statements do not include any man-agement report. The Group prepares an Activity Report which is presented separately from the Finan-cial Statements and its consistency with the Financial Statements is not audited.
On a proposal from the Management Committee, the Board of Directors adopted the Financial Statements on 14 March 2013 and authorised their submission to the Board of Governors for approval by 30 April 2013.
In preparing the Financial Statements, the Management Committee is required to make estimates and assump-tions that affect reported income, expenses, assets, lia-bilities and disclosure of contingent assets and liabilities. Use of available information and application of judge-ment are inherent in the formation of estimates. Actual results in the future could differ from such estimates and the resulting differences may be material to the Fi-nancial Statements.
The Group also publishes consolidated financial state-ments, which have been prepared in accordance with International Financial Reporting Standards (IFRS), as endorsed by the European Union.
A.2. Foreign currency translation
The Group uses the euro (EUR), the single currency of the Member States participating in the third stage of Economic and Monetary Union, as the unit of measure for the capital accounts of Member States and for pre-senting its Financial Statements.
The Group conducts its operations in the currencies of its Member States, in euro and in non-EU currencies. Its resources are derived from its capital, borrowings and accumulated earnings in various currencies.
Foreign currency transactions are translated at the exchange rate prevailing on the date of the transac-tion. The Group’s monetary assets and liabilities denominated in currencies other than euro are trans-lated into euro at closing exchange rates prevailing at the balance sheet date. The gain or loss arising from
European Investment Bank Group
Notes to the consolidated financial statementsas at 31 December 2012

952012 Financial Report
EIB Group Consolidated Financial Statements under EU Directives
such translation is recorded in the profit and loss account.
A.3. Basis of consolidation
The Financial Statements comprise those of the Europe-an Investment Bank (the “Bank” or the “EIB”) and those of its subsidiary, the European Investment Fund (the
“Fund” or the “EIF”). The financial statements of the Fund are prepared for the same reporting year as the Bank, using consistent accounting policies.
The Bank consolidates the financial statements of the EIF.
After aggregation of the balance sheets and the profit and loss accounts, all intra-group balances, transactions, income and expenses resulting from intra-group trans-actions are eliminated.
Minority interest represents the portion of profit or loss and net assets not owned, directly or indirectly, by the Bank.
Assets held in an agency or fiduciary capacity are not as-sets of the Group and are reported in Note Z.
A.4. Derivatives
The Group uses derivative instruments, mainly currency and interest rate swaps, as part of its asset and liability management (‘ALM’) activities to manage exposures to interest rate and foreign currency risks, including expo-sures arising from forecast transactions. All derivatives transactions are booked at nominal as off-balance sheet items at the date of the transaction.
The majority of the Group’s swaps are concluded with a view to hedging specific bond issues. The Group enters into currency swaps, whereby the proceeds of a borrow-ing are initially converted into a different currency and on maturity the Group will obtain the amounts needed to service the borrowing in the original currency.
The Group also enters into currency, interest rate and overnight index swaps as part of its hedging operations on loans or for the global ALM position. The corre-sponding interest is accounted for on a pro rata tempo-ris basis.
The Group also uses derivative instruments as part of its treasury operations.
A.4.1. Trading and available for sale portfolio derivatives
The Group changed its accounting policy from 1 Janu-ary 2012 in respect of the application of market values
to derivatives hedging certain transferable securities which are not held as financial fixed assets
Accounting policy applicable until 31 December 2011:
Currency swaps
Currency swap contracts are entered into in order to adjust currency positions. The revaluation of the spot leg of a currency swap is neutralised in Accruals and deferred income or Prepayments and accrued income. The forward leg of the currency swap is recorded off-balance sheet at settlement amount and is not re-valued. The premium/discount between the spot and forward settlement amounts is amortised pro rata temporis through the profit and loss account in Inter‑est receivable and similar income or Interest payable and similar charges.
Interest rate swaps
The hedging interest rate swaps are not revalued. The interest received and paid under interest rate swaps is accrued pro rata temporis and reported in the profit and loss account under Interest receivable and similar in‑come or Interest payable and similar charges.
Futures
Long term futures are used by the Bank to adjust the interest rate exposure of its treasury bond portfolios. Futures are valued by reference to the previous day’s closing price on the relevant market.
Accounting policy applicable from 1 January 2012:
Trading and available for sale portfolio derivatives are recorded at market value in the balance sheet as Other assets when their market value is positive or Other lia-bilities when their market value is negative. Changes in the market value are included in Net result on finan‑cial operations. Market values are obtained from quot-ed market prices, discounted cash flow models and option pricing models, which consider current market and contractual prices for the underlying instrument, as well as time value of money, yield curve and volatili-ty of the underlying.
Interest on derivative instruments is accrued pro rata temporis under Prepayments and accrued income or Ac‑cruals and deferred income.
Currency swaps
Currency swap contracts are entered into in order to ad-just currency positions. The revaluation of the spot leg of a currency swap is neutralised in Accruals and deferred income or Prepayments and accrued income. The premi-um/discount between the spot and forward settlement amounts is amortised pro rata temporis through the profit and loss account in Interest receivable and similar

96 Financial Report 2012
income or Interest payable and similar charges. The market value is recorded under Other assets when their market value is positive or Other liabilities when their market value is negative. Changes in the market value are included in Net result on financial operations.
Interest rate swaps
The interest received and paid under interest rate swaps is accrued pro rata temporis and reported in the profit and loss account under Interest receivable and similar in‑come or Interest payable and similar charges. The market value is recorded under Other assets when their market value is positive or Other liabilities when their market value is negative. Changes in the market value are in-cluded in Net result on financial operations.
Futures
Long term futures are used by the Bank to adjust the in-terest rate exposure of its treasury bond portfolios. Futures are valued by reference to the previous day’s closing price on the relevant market.
A.4.2 All other derivatives
Currency swaps
Currency swap contracts are entered into in order to adjust currency positions. The revaluation of the spot leg of a currency swap is neutralised in Accruals and deferred income or Prepayments and accrued income. The forward leg of the currency swap is recorded off-balance sheet at settlement amount and is not revalued. The premium/discount between the spot and forward settlement amounts is amortised pro rata temporis through the profit and loss account in Interest receivable and similar income or Interest payable and similar charges.
Interest rate swaps
The hedging interest rate swaps are not revalued. The interest received and paid under interest rate swaps is accrued pro rata temporis and reported in the profit and loss account under Interest receivable and similar in‑come or Interest payable and similar charges.
Forward rate agreements
Forward rate agreements are concluded for hedging purposes and are recorded off balance sheet on trade date. The difference between the contractual forward rates and the year end rates are reported in the profit and loss account under Interest receivable and similar in‑come or Interest payable and similar charges.
Currency forwards
Currency forwards are entered into in order to adjust fu-ture currency positions. The forward leg is recorded
off-balance sheet at settlement amount and is not reval-ued. The difference between the spot amounts and the forward settlement amounts is amortised pro rata tem-poris through the profit and loss account in Interest re‑ceivable and similar income or Interest payable and similar charges.
Interest on derivative instruments is accrued pro rata temporis under Prepayments and accrued income or Ac‑cruals and deferred income.
A.5. Financial assets
Financial assets are accounted for using the settlement date basis.
A.6. Cash and cash equivalents
The Group defines cash and cash equivalents as short term, highly liquid securities and interest-earning de-posits with maturities of 90 days or less.
A.7. Treasury bills and other bills eligible for refinancing with central banks and debt securities including fixed-income securities
With a view to clarifying management of its liquid as-sets, the Group has established the following portfolio categories:
A.7.1. Group investment portfolio
The investment portfolio consists of securities pur-chased with the intention of holding them to maturity. These securities are issued or guaranteed by:
• Governments of the European Union Member States, G10 countries and their agencies;
• Supranational public institutions, including multina-tional development banks.
These securities are initially recorded at purchase price or more exceptionally at transfer price. Value adjust-ments are accounted for, if these are other than tempo-rary. The difference between entry price and redemption value is accounted for pro rata temporis over the life of the securities.
In 2006, the Group decided to phase out the investment portfolio. Since then, the Group has not made any new additions to the investment portfolio and will keep the existing portfolio lines until final maturity, upon which the redemption proceeds of such matured securities will be invested in the operational portfolios described in paragraph A.7.2.
972012 Financial Report
EIB Group Consolidated Financial Statements under EU Directives
A.7.2. Operational portfolios
The Group changed its accounting policy from 1 January 2012 in respect of the application of market values to certain transferable securities which are not held as fi-nancial fixed assets.
• Operational money market portfolios A1 and A2
In order to maintain an adequate level of liquidity, the Group purchases money market products with a maxi-mum maturity of 18 months, in particular Treasury bills and negotiable debt securities issued by public bodies and credit institutions. The securities in the A1 portfolio are held until their final maturity and presented in the Financial Statements at amortised cost. Value adjustments are accounted for, if these are other than temporary.
The A2 portfolio includes securities with maturities of up to 18 months which are available for sale.
Accounting policy applicable until 31 December 2011:
Bonds were initially recorded at acquisition cost and presented in the Financial Statements at the lower of amortised cost or market value. Value adjustments were recorded under Net result on financial operations in the profit and loss account.
Accounting policy applicable from 1 January 2012:
Bonds are initially recorded at acquisition cost and pre-sented in the Financial Statements at market value. Changes in market value are recorded under Net result on financial operations in the profit and loss account. The difference between acquisition cost and redemp-tion amount is amortised pro rata temporis as Interest receivable and similar income.
• Operational bond portfolios B1, B3 and B4 and Operational portfolio EIF
The B1 ‘Credit Spread’ portfolio comprises of float-ing-rate and fixed-rate bonds issued or guaranteed by national governments, supranational institutions, finan-cial institutions and corporations. These securities are available for sale.
Accounting policy for the B1 portfolio applicable until 31 December 2011:
Bonds were initially recorded at acquisition cost and pre-sented in the Financial Statements at the lower of cost or market value. Value adjustments were recorded under Net result on financial operations in the profit and loss account.
Accounting policy for the B1 portfolio applicable from 1 January 2012:
Bonds are initially recorded at acquisition cost and pre-sented in the Financial Statements at market value.
Changes in market value are recorded under Net result on financial operations in the profit and loss account. The difference between the acquisition cost and re-demption amount is amortised pro rata temporis as In‑terest receivable and similar income.
The B3 ‘Global Fixed Income’ portfolio comprises listed securities with a maximum residual maturity of 10 years, issued and/or guaranteed by sovereigns, their agencies or by financial institutions. Securities held in this portfo-lio are marked to market value in the balance sheet; the corresponding changes in market value are recorded under Net result on financial operations in the profit and loss account.
The B4 ‘Inflation Linked Investment’ portfolio comprises listed securities with a maximum residual maturity of 30 years, issued by EU Governments. Securities held in this portfolio are marked to market value in the balance sheet; the corresponding changes in market value are recorded under Net result on financial operations in the profit and loss account.
The Operational portfolio EIF comprises listed securities with a maximum residual maturity of 10 years.
Accounting policy for the Operational portfolio EIF applicable until 31 December 2011:
These securities are classified in the available for sale category and are presented in the Financial Statements at the lower of cost or market value. Value adjustments are recorded under Net result on financial operations in the profit and loss account.
Accounting policy for the Operational portfolio EIF applicable from 1 January 2012:
These securities are classified in the available for sale category and are presented in the Financial Statements at market value. Changes in market value are recorded under Net result on financial operations in the profit and loss account.
The market value of treasury portfolios is based on pub-lished price quotations in an active market as the first source. For instruments without available published price quotations, the market values are determined by obtaining quotes from market participants and/or by using valuation techniques or models, based whenever possible on observable market data prevailing at the balance sheet date.
A.7.3. Loan substitutes
This portfolio mainly consists of obligations in the form of bonds, notes or certificates issued by Special Purpose Vehicles (SPV) or trust vehicles. These securities are clas-sified as held to maturity and initially recorded at pur-chase price and valued at amortised cost. The difference

98 Financial Report 2012
between purchase price and redemption value is ac-counted for pro rata temporis over the life of the securi-ties. Value adjustments are accounted for, if these are other than temporary.
A.8. Securities lending
In April 2003, the Bank signed an agreement for securi-ties lending with Northern Trust Global Investment act-ing as an agent to lend securities from the Group investment portfolio, the B1 ‘Credit Spread’ portfolio, the B3 ‘Global Fixed Income’ portfolio, the B4 ‘Inflation Linked Investment’ portfolio and the Operational port-folio EIF.
Securities received as collateral under securities lend-ing transactions are not recognised in the balance sheet unless control of the contractual rights that are comprised in these received securities is gained. Secu-rities lent are not derecognised from the balance sheet unless control of the contractual rights that are com-prised in these transferred securities is relinquished. Securities lent are recorded at the book value as an off balance-sheet item.
Fees and interest received or paid are recorded as interest income or interest expense on an accruals basis.
The agreement with Northern Trust Global Investment was terminated in November 2012.
A.9. Loans and advances to credit institutions and customers
A.9.1. Loans and advances
Loans and advances are included in the assets of the Group at their net disbursed amounts. Value adjust-ments have been made for loans and advances out-standing at the end of the financial year and presenting risks of non-recovery of all or part of their amounts. Such value adjustments are held in the same currency as the assets to which they relate. Value adjustments are accounted for in the profit and loss account as ‘Value adjustments in respect of loans and advances’ and are de-ducted from the appropriate asset items on the bal - ance sheet.
A.9.2. Interest on loans
Interest on loans is recorded in the profit and loss ac-count on an accruals basis, i.e. over the life of the loans. On the balance sheet, accrued interest is included in
‘Prepayments and accrued income’ under assets. Value adjustments to interest amounts on these loans are de-termined on a case-by-case basis by the Group’s
Management and deducted from the appropriate asset item on the balance sheet.
A.9.3. Reverse repurchase operations (reverse repos)
Under a tripartite reverse repo, a custodian/clearing agency arranges for custody, clearing and settlement of the transactions between the Bank and a third party. The custodians/clearing agencies operate under stand-ardised global master purchase agreements and pro-vide for delivery against payment systems, substitution of securities, automatic marking to market, reporting and daily transaction administration.
Reverse repos are carried at the amounts of cash ad-vanced and are entered on the balance sheet under Loans and advances to credit institutions – b) other loans and advances. Interest on reverse repos is accrued pro rata temporis.
A.9.4. Interest subsidies
Interest subsidies received in advance (see Note I) are deferred and recognised in the profit and loss account over the period from disbursement to repayment of the subsidised loan.
A.10. Shares and other variable-yield securities
The Group acquires shares and other variable-yield secu-rities when it enters into venture capital operations, infra-structure funds or investment funds under the structured finance facility. Shares and other variable-yield securities are initially recorded at acquisition cost. Their carrying value is adjusted to the lower of cost or market value at subsequent measurement at the balance sheet date.
Investments in venture capital enterprises, infrastructure funds and investment funds represent shares and other variable-yield securities acquired for the longer term in the normal course of the Group’s activities. They are ini-tially recorded at their original purchase cost. Based on the reports received from fund managers up to the bal-ance sheet date, the portfolios of investments are valued on a line-by-line basis at the lower of cost or attributable net asset value (‘NAV’), thus excluding any attributable unrealised gain that may be prevailing in the portfolio. The attributable NAV is determined through applying ei-ther the Group’s percentage ownership in the underly-ing vehicle to the NAV reflected in the most recent report or, to the extent available, the value per share at the same date, submitted by the respective Fund Man-ager. The attributable NAV is adjusted for events having occurred between the date of the latest available NAV and the balance sheet date to the extent that such ad-justment is considered to be material. Unrealised losses due solely to administrative expenses and management

992012 Financial Report
EIB Group Consolidated Financial Statements under EU Directives
fees of venture capital, infrastructure funds and invest-ment funds in existence for less than two years at the balance sheet date are not taken into consideration in determining the attributable NAV.
A.11. Tangible assets
Tangible assets include land, Group-occupied proper-ties, other machines and equipment.
Land is stated at acquisition cost and buildings are stat-ed at acquisition cost less accumulated depreciation. The value of the Group’s headquarters building in Lux-embourg-Kirchberg and its buildings in Luxem-bourg-Hamm and Luxembourg-Weimershof are depreciated on a straight-line basis as set out below.
Permanent equipment, fixtures and fittings, furniture, office equipment and vehicles have been recorded in the balance sheet at their acquisition cost, less accumu-lated depreciation.
Depreciation is calculated on a straight-line basis over the estimated life of each item purchased, as set out below:
• Buildings in Kirchberg, Hamm and Weimershof: 30 years
• Permanent equipment, fixtures and fittings: 10 years
• Furniture: 5 years
• Office equipment and vehicles: 3 years
A.12. Intangible assets
Intangible assets comprise internally developed com-puter software. Software development costs are capital-ised if they meet certain criteria relating to identifiability, to the probability that future economic benefits will flow to the enterprise and to the reliability of cost meas-urement.
Internally developed software meeting these criteria is carried at cost less accumulated amortisation cal-culated on a straight-line basis over three years from completion.
A.13. Pension plans and health insurance scheme
A.13.1. Pension plans for staff
The Group operates defined benefit pension plans to provide retirement benefits to substantially its entire staff.
The Bank’s main pension scheme is a defined benefit pension scheme funded by contributions from staff and from the Bank which covers all employees. All contribu-tions of the Bank and its staff are invested in the assets of the Bank.
Commitments for retirement benefits are valued at least every year using the projected unit credit method, in or-der to ensure that the provision entered in the accounts is adequate. The latest valuation was carried out as at 30 September 2012 and was updated as at 31 December 2012 with an extrapolation (roll forward method) for the last three months of 2012. The main assumptions used by the actuary are set out in Note L.
The main pension scheme of the EIF is a defined benefit scheme funded by contributions from staff and from the EIF which covers all employees. The scheme entered into force in March 2003, replacing the previous defined contribution scheme.
Cumulative prior year actuarial deficits and surpluses in excess of 10% of the commitments for retirement bene-fits are recognised over the expected average remain-ing service lives of the plan’s participants on a straight line basis.
A.13.2. Health insurance scheme
The Group has set up its own health insurance scheme for the benefit of staff, financed by contributions from the Group and its employees. The health insurance scheme is managed and accounted for under the same principles as the pension plan for staff described in Note A.13.1. The latest valuation was carried out as at 30 September 2012 and was updated as at 31 Decem-ber 2012 with an extrapolation (roll forward method) for the last three months of 2012.
A.13.3. The Management Committee pension plan
The Management Committee pension plan is a defined benefit pension scheme funded by contributions from the Group only which covers all Management Commit-tee members. All contributions of the Group are invest-ed in the assets of the Group. The Management Committee pension plan is managed and accounted for under the same principles as the pension plan for staff described in Note A.13.1.
A.13.4. Optional Supplementary provident scheme
The optional supplementary provident scheme is a defined contribution pension scheme, funded by vol-untary staff ’s contributions and employer’s contribu-tions. The corresponding liability is recorded in Other liabilities.

100 Financial Report 2012
A.14. Amounts owed to credit institutions and customers
Amounts owed to credit institutions and customers are presented in the financial statements at their redemp-tion amounts. Interest on amounts owed to credit insti-tutions and customers is recorded in the profit and loss account on an accruals basis as Interest payable and sim‑ilar charges. Accrued interest is included in Accruals and deferred income under liabilities.
A.15. Debts evidenced by certificates
Debts evidenced by certificates are presented at their re-demption amounts, except for zero coupon bonds which are presented at their amortised cost. Transaction costs and premiums/ discounts are amortised in the profit and loss account on a straight line basis over the life of the debt through Accruals and deferred income or Prepayments and accrued income. Interest expense on debt instruments is included in Interest payable and similar charges in the consolidated profit and loss account.
A.16. Provision for guarantees issued and for commitment on investment funds
A.16.1. Provision for guarantees issued
This provision is intended to cover risks inherent in the Group’s activity of issuing guarantees in favour of financial intermediaries or issued in respect of loans granted by third parties. A provision for guarantees issued is estab-lished if there is objective evidence that the Group will have to incur a loss in respect of a given guarantee granted.
A.16.2. Provision for commitment on investment funds
This provision is intended to cover risks inherent in the Group’s commitment on investment funds signed but not yet disbursed.
A.17. Reserves
A.17.1. Reserve fund
As foreseen by Article 22.1 of the Statute, “a reserve fund of up to 10% of the subscribed capital shall be built up progressively” from the retained profit of the Bank.
A.17.2. Additional reserves
Additional reserves contain the remaining retained earnings of the Group.
A.17.3. Special activities reserve
As foreseen by Article 16.5 of the Statute, “the special activities of the Bank will have a specific allocation of reserve”. The reserve is based on the capital allocation of each operation.
A.17.4. General loan reserve
In 2009 a “general loan reserve” was introduced for the expected loss of the Bank’s loan and guarantee portfo-lio, modelled upon the Group’s policy guidelines.
A.18. Taxation
The Protocol on the privileges and Immunities of the European Union appended to the treaty on European Union and the treaty on the functioning of the Europe-an Union, stipulates that the assets, revenues, and other property of the Institutions of the Union are exempt from all direct taxes.
A.19. Prepayments and accrued income
Expenditure incurred during the financial year but re-lating to a subsequent financial year, together with any income for which payment is not due until the ex-piry of the underlying instrument (principally interest on loans).
A.20. Accruals and deferred income
Income received before the balance sheet date but relating to a subsequent financial year, together with any charges which, though relating to the financial year in question, will be paid only in the course of a subsequent financial year (principally interest on bor-rowings).
A.21. Interest receivable and similar income
In addition to interest and commission income on loans and deposits and other revenue from the securities portfolio, the ‘Interest receivable and similar income’ in-cludes the indemnities received by the Group for pre-payments made by its borrowers. The Group changed its accounting policy from 1 January 2012 in respect of the treatment of these indemnities
Accounting policy applicable until 31 December 2011:
In order to maintain equivalent accounting treatment between income on loans and the cost of borrowings, the Group amortised prepayment indemnities received over the remaining life of the loans concerned.

1012012 Financial Report
EIB Group Consolidated Financial Statements under EU Directives
Accounting policy applicable from 1 January 2012:
Prepayment indemnities are recognised in the profit and loss when received, as the revenue is earned.
A.22. Dividend income
Dividends are recognised in the profit and loss account when the entity’s right to receive payment is established.
A.23. Reclassification of prior year figures
Certain prior year figures have been reclassified to con-form with the current year’s presentation. The reclassifi-cations principally relate to:
• Redemption premiums on swaps receivable: - From: Loans and advances to credit institutions b) other loans and advances - To: Prepayments and accrued income
• Redemption premiums on swaps payable: - From: Amounts owed to credit institutions b) with agreed maturity dates or periods of notice - To: Accruals and deferred income
• Prepaid management fees: - From: Other liabilities - To: Accruals and deferred income
• Provision for commitment on investment funds: - From: Net result on financial operations - To: Value (re‑)adjustments in respect of loans and advances and provisions for contingent liabilities
A.24. Changes in accounting policies
A.24.1 Transferable securities not held as financial fixed assets
The Group changed its accounting policies from 1 Janu-ary 2012 in respect of the application of market values to certain transferable securities which are not held as financial fixed assets and to the related hedging deriva-tives. This change in accounting policy gave rise to an increase in profit for the year of EUR 9.9 million as com-pared to the application of the previous accounting policy. See note A.4 and A.7.
A.24.2 Prepayment indemnities
The Group changed its accounting policies from 1 Janu-ary 2012 in respect of the full recognition as income of indemnities received by the Group for prepayments made by its borrowers. This change in accounting policy gave rise to an additional profit for the year of EUR 210.4 million as compared to the application of the previous accounting policy. See note A.21.
Note B – Cash in hand, balances with central banks and post office banks and debt securities portfolio (in EUR ’000)
B.1. Cash in hand, balances with central banks and post office banks
The cash in hand and balances with central banks and post office banks equal to EUR ’000 157 362 at 31 December 2012 (2011: EUR ‘000 427 463).
EIB is an eligible counterparty in the Eurosystem’s monetary policy operations, and therefore has been given access to the monetary policy operations of the European Central Bank. The Bank conducts the operations via the Central Bank of Luxembourg, where the Bank maintains a deposit to cover the minimum reserve requirement. The balance of this de-posit amounts to EUR ‘000 157 258 as at 31 December 2012 (2011: EUR ‘000 395 911).
B.2. Debt securities portfolio
The debt securities portfolio is composed of the Group investment portfolio, the operational money market portfoli-os A1 and A2, the operational bond portfolios B1 ‘Credit Spread’, B3 ‘Global Fixed Income’, B4 ‘Inflation Linked Invest-ment’, the Operational EIF portfolio and the loan substitutes, which represent acquisitions of interests in pools of

102 Financial Report 2012
loans or receivables in connection with securitisation transactions. The detail of these portfolios and their classifica-tion as at 31 December 2012 and 2011 are as follows:
31.12.2012 31.12.2011
Treasury bills and other bills eligible for refinancing with central banks 18 334 686 14 775 669
Debt securities including fixed-income securities 9 324 262 10 365 900
Total debt securities (*) 27 658 948 25 141 569 (*) of which EUR ‘000 9 309 467 unlisted in 2012 and EUR ‘000 9 780 508 in 2011.
At 31.12.2012 Purchase price
Book value Premiums/ discounts to
be amortised
Value at final maturity
Market value
Group investment portfolio 1 229 565 1 184 560 - 8 778 1 175 782 1 306 742
Operational money market portfolios:
- A1: money market securities with a max. 3 month maturity 9 425 707 9 431 365 5 765 9 437 130 9 432 208
- A2: money market securities with a max. 18 month maturity (*) 1 523 395 1 514 279 - 2 185 1 508 374 1 514 279
Operational bond portfolios:
- B1: Credit Spread (*) 613 131 622 568 - 6 401 605 350 622 568
- B3: Global Fixed Income 556 548 559 000 0 532 000 559 000
- B4: Inflation Linked Investment 854 887 889 731 0 783 000 889 731
Operational portfolio - EIF 722 514 739 313 - 9 593 712 976 739 313
Loan substitutes (Note D) 12 726 729 12 718 132 - 59 231 12 658 901 11 435 041
27 652 476 27 658 948 - 80 423 27 413 513 26 498 882
(*) Accounting policy changed from 1 January 2012 (see Note A.7.2)
At 31.12.2011 Purchase price
Book value Premiums/ discounts to
be amortised
Value at final maturity
Market value
Group investment portfolio 1 425 948 1 376 635 - 13 103 1 363 532 1 309 665
Operational money market portfolios:
- A1: money market securities with a max. 3 month maturity 6 617 946 6 625 670 10 406 6 636 076 6 630 279
- A2: money market securities with a max. 18 month maturity 2 225 993 2 223 162 4 011 2 229 726 2 227 853
Operational bond portfolios:
- B1: Credit Spread 737 431 678 257 0 735 502 683 956
- B3: Global Fixed Income 663 682 627 500 0 646 000 627 500
- B4: Inflation Linked Investment 1 050 023 1 039 474 0 940 000 1 039 474
Operational portfolio - EIF 645 921 561 810 195 644 111 566 006
Loan substitutes (Note D) 12 012 280 12 009 061 - 42 877 11 966 184 10 351 964
25 379 224 25 141 569 - 41 368 25 161 131 23 436 697
The Group’s securities lending agreement with Northern Trust Global Investment was terminated in November 2012. The nominal value of securities lending activity amounted to EUR ‘000 778 872 at 31 December 2011.
Loan substitutes are considered as part of the aggregate loans (Note D). Some of these transactions have been struc-tured by adding credit or project related remedies, thus offering additional recourse. Per detailed review no value adjustment is required and has thus been accounted for as at 31 December 2012 and 2011.

1032012 Financial Report
EIB Group Consolidated Financial Statements under EU Directives
EU sovereign exposure in bond holdings
The Group did not record value adjustments in 2011 and 2012 in respect of its held to maturity EU sovereign and sover-eign guaranteed exposure as at the year end as the preferred creditor status of the Bank as well as of the EIF and the protection given by the Bank’s Statute are deemed to guarantee a full recovery of the Group’s assets on maturity.
The following tables show the exposure to debt issued or guaranteed by EU sovereigns in the Group’s debt securities portfolios as at 31 December 2012 and 2011:
At 31.12.2012 Purchase price Book value Value at final maturity
Market value
EU sovereignsAustria 126 861 130 168 123 800 134 091 Belgium 847 416 836 263 831 500 845 471 Czech Republic 764 544 755 733 699 796 868 581 Denmark 10 000 10 375 10 000 10 375 Finland 52 365 53 242 50 000 53 242 France 799 827 820 689 737 600 841 890 Germany 565 988 570 592 528 400 630 159 Greece 203 866 193 608 201 000 189 890 Hungary 17 472 18 197 19 000 17 599 Ireland 61 379 62 916 62 000 63 014 Italy 4 802 293 4 809 735 4 810 348 4 814 664 Luxembourg 61 524 61 966 59 000 61 966 Netherlands 81 100 79 242 78 000 91 631 Poland 67 672 66 622 67 000 71 819 Portugal 77 609 74 396 75 500 74 357 Slovakia 47 476 48 797 45 000 49 527 Slovenia 10 098 9 756 10 008 9 756 Spain 920 267 905 953 907 600 907 925
9 517 757 9 508 250 9 315 552 9 735 957 Non-EU sovereign and other bonds 18 134 719 18 150 698 18 097 961 16 762 925
Total 27 652 476 27 658 948 27 413 513 26 498 882
In 2011, the Bank and the EIF did not participate in any private sector initiative for Greece and therefore no value adjust-ments were recorded on its held to maturity Greek sovereign and sovereign guaranteed exposure.
At 31.12.2011 Purchase price Book value Value at final maturity
Market value
EU sovereignsAustria 247 902 247 207 241 700 254 603
Belgium 116 384 103 472 99 500 108 358
Czech Republic 601 657 598 247 555 453 617 331
Denmark 10 000 10 000 10 000 10 455
France 695 916 705 845 638 921 721 592
Germany 675 969 685 521 629 400 736 432
Greece 313 893 199 983 308 350 85 108
Hungary 17 472 18 085 19 000 13 656
Ireland 232 198 194 530 235 480 194 189
Italy 2 710 795 2 666 594 2 683 700 2 648 768
Luxembourg 36 922 36 697 35 000 37 002
Netherlands 130 549 129 050 127 000 139 820
Poland 67 672 66 745 67 000 65 911
Portugal 102 678 87 233 98 900 75 843
Slovakia 9 627 9 397 10 000 9 179
Slovenia 4 994 4 229 5 000 4 229
Spain 2 989 717 2 976 936 2 982 913 2 983 597
8 964 345 8 739 771 8 747 317 8 706 073 Non-EU sovereign and other bonds 16 414 879 16 401 798 16 413 814 14 730 624
Total 25 379 224 25 141 569 25 161 131 23 436 697

104 Financial Report 2012
Note C – Loans and advances to credit institutions – other loans and advances (in EUR ’000)
The Group enters into collateralised reverse repurchase and repurchase agreement transactions that may result in credit exposure in the event that the counterparty to the transaction is unable to fulfil its contractual obligations. The Group controls credit risk associated with these activities by monitoring counterparty credit exposure and collateral values on a daily basis and requiring additional collateral to be deposited with the Group when deemed necessary.
31.12.2012 31.12.2011
Term deposits 9 154 816 13 974 281
Overnight deposits 406 757 250 000
Tripartite reverse repos(*) 40 714 480 25 393 472
Total other loans and advances to credit institutions 50 276 053 39 617 753
of which cash and cash equivalents 50 006 053 39 417 753
(*) These operations are carried out with a third-party custodian who undertakes, on the basis of a framework contract, to guarantee compliance with the contractual terms and conditions, notably with respect to:
- delivery against payment; - verification of collateral; - the collateral margin required by the lender which must always be available and adequate, with the market value of the securities being verified daily
by the said custodian; and - organisation of substitute collateral provided that this meets all the contractual requirements.
Note D – Summary statement of loans
D.1. Aggregate loans granted (in EUR ‘000)
Aggregate loans granted comprise both the disbursed and undisbursed portions of loans. The analysis is as follows:
To intermediary credit institutions
Directly to final beneficiaries
Total 2012 Total 2011
Disbursed portion 124 500 426 276 155 907 400 656 333 383 587 759
Undisbursed loans 19 786 999 62 129 484 81 916 483 85 806 923
Aggregate loans granted 144 287 425 338 285 391 482 572 816 469 394 682
Loan substitutes portfolio (Note B.2) 12 718 132 12 009 061
Aggregate loans including loan substitutes portfolio (Note D.3) 495 290 948 481 403 743
D.2. Value adjustments for loans (in EUR ‘000)
Movements in the value adjustments are detailed below:
2012 2011
Provision at 1 January 192 790 91 608
Release during the year -16 826 -60 705
Use during the year -34 588 0
Allowance during the year 199 593 161 887
Foreign exchange adjustment 580 0
At 31 December 341 549 192 790
In 2012, an amount of EUR ‘000 4 500 was paid by the European Commission to the Bank in the context of a Risk Sharing operation which had been provided. This amount has been accounted for in the profit and loss account as Value (re‑)adjustments in respect of loans and advances and provisions for contingent liabilities.

1052012 Financial Report
EIB Group Consolidated Financial Statements under EU Directives
D.3. Geographical breakdown of lending by country in which projects are located (in EUR ’000)
D.3.1. Loans for projects within the European Union
Countries and territories in which projects are located
Number of loans
Aggregate loans granted
Disbursed portion
Undisbursed portion
% of total 2012 % of total 2011
Spain 737 75 069 313 71 873 109 3 196 204 15.16% 14.95%
Italy 614 61 465 203 51 641 709 9 823 494 12.41% 12.45%
Germany 636 57 919 557 51 598 993 6 320 564 11.69% 12.30%
France 445 44 390 922 37 492 207 6 898 715 8.96% 9.03%
United Kingdom 265 33 630 470 28 673 391 4 957 079 6.79% 6.85%
Poland 241 30 292 729 22 749 769 7 542 960 6.12% 5.53%
Portugal 295 22 873 209 20 261 700 2 611 509 4.61% 5.15%
Greece 147 16 692 532 15 122 585 1 569 947 3.36% 3.49%
Hungary 140 12 226 945 9 900 069 2 326 876 2.47% 2.37%
Austria 202 11 716 602 10 366 970 1 349 632 2.37% 2.37%
Czech Republic 131 10 595 358 9 473 541 1 121 817 2.14% 2.10%
Belgium 116 9 805 251 8 324 881 1 480 370 1.98% 2.00%
Netherlands 76 8 773 321 7 173 621 1 599 700 1.77% 1.65%
Sweden 71 7 916 773 6 013 848 1 902 925 1.60% 1.62%
Romania 84 7 195 170 4 491 525 2 703 645 1.45% 1.50%
Finland 119 7 084 860 5 730 820 1 354 040 1.43% 1.60%
Ireland 58 4 972 384 4 389 123 583 261 1.00% 0.96%
Slovenia 63 3 811 849 2 349 477 1 462 372 0.77% 0.69%
Slovakia 52 2 808 786 2 314 566 494 220 0.57% 0.56%
Bulgaria 44 2 442 843 1 448 747 994 096 0.49% 0.52%
Cyprus 30 2 176 363 1 620 063 556 300 0.44% 0.38%
Denmark 41 2 149 595 1 950 395 199 200 0.43% 0.46%
Latvia 25 1 612 899 853 019 759 880 0.33% 0.33%
Estonia 20 1 326 643 998 183 328 460 0.27% 0.26%
Lithuania 16 1 268 104 1 266 544 1 560 0.26% 0.27%
Luxembourg 20 810 200 573 200 237 000 0.16% 0.14%
Malta 7 336 983 276 983 60 000 0.07% 0.06%
Sub-total 4 695 441 364 864 378 929 038 62 435 826 89.10% 89.59%
D.3.2. Loans for projects outside the European Union
D.3.2.1. Candidate Countries
Countries and territories in which projects are located
Number of loans
Aggregate loans granted
Disbursed portion
Undisbursed portion
% of total 2012 % of total 2011
Turkey 153 16 252 254 12 531 391 3 720 863
Serbia 63 3 741 531 2 114 521 1 627 010
Croatia 40 2 770 363 2 029 522 740 841
Iceland 10 531 015 461 015 70 000
Macedonia (FYROM) 13 454 119 249 253 204 866
Montenegro 32 289 951 169 451 120 500
Sub-total 311 24 039 233 17 555 153 6 484 080 4.85% 3.75%

106 Financial Report 2012
D.3.2.2. ACP States
Countries and territories in which projects are located
Number of loans
Aggregate loans granted
Disbursed portion
Undisbursed portion
% of total 2012 % of total 2011
Kenya 4 262 712 71 414 191 298
Madagascar 1 227 376 227 376 0
Regional - West Africa 6 174 811 44 811 130 000
Lesotho 4 162 179 46 960 115 219
Namibia 8 158 526 158 526 0
Zambia 3 152 000 0 152 000
Tanzania, United republic of 2 150 652 0 150 652
Mozambique 7 132 495 80 409 52 086
Mauritius 11 132 111 65 734 66 377
Uganda 2 130 000 0 130 000
Nigeria 2 106 675 12 907 93 768
Cameroon 2 70 000 5 000 65 000
Senegal 3 69 898 38 898 31 000
Ghana 2 64 130 64 130 0
Cape Verde 2 58 724 34 244 24 480
Congo (Democratic Republic) 1 55 000 28 644 26 356
Liberia 1 50 000 0 50 000
Benin 2 45 000 0 45 000
Burkina Faso 2 41 500 15 500 26 000
Regional - Caribbean 2 39 487 39 487 0
Seychelles 2 34 737 6 562 28 175
Swaziland 2 34 127 20 627 13 500
Congo 1 29 000 22 476 6 524
Dominican Republic 1 26 800 0 26 800
Jamaica 3 19 319 19 319 0
Malawi 2 16 730 15 551 1 179
Botswana 3 16 476 16 476 0
Mauritania 2 15 656 14 959 697
Dominica 2 7 914 1 701 6 213
Barbados 3 7 454 7 454 0
Saint Kitts and Nevis 2 5 987 0 5 987
Saint Vincent and Grenadines 2 5 268 5 268 0
Togo 1 3 000 0 3 000
Bahamas 1 2 689 2 689 0
Saint Lucia 1 2 119 2 119 0
Sub-total 95 2 510 552 1 069 241 1 441 311 0.51% 0.50%

1072012 Financial Report
EIB Group Consolidated Financial Statements under EU Directives
D.3.2.3. Asia
Countries and territories in which projects are located
Number of loans
Aggregate loans granted
Disbursed portion
Undisbursed portion
% of total 2012 % of total 2011
China 7 1 799 727 722 193 1 077 534
Vietnam 8 572 596 199 596 373 000
India 4 444 384 230 081 214 303
Pakistan 5 136 203 36 203 100 000
Sri Lanka 4 135 864 135 864 0
Philippines 3 75 155 75 155 0
Indonesia 3 60 436 60 436 0
Laos 1 40 985 40 985 0
Maldives 1 34 472 34 472 0
Thailand 1 10 583 10 583 0
Bangladesh 1 7 956 7 956 0
Tajikistan 1 7 000 0 7 000
Sub-total 39 3 325 361 1 553 524 1 771 837 0.67% 0.65%
D.3.2.4. Balkans
Countries and territories in which projects are located
Number of loans
Aggregate loans granted
Disbursed portion
Undisbursed portion
% of total 2012 % of total 2011
Bosnia-Herzegovina 35 1 375 504 746 807 628 697
Albania 13 308 429 217 996 90 433
Sub-total 48 1 683 933 964 803 719 130 0.34% 1.11%
D.3.2.5. Central and Latin America
Countries and territories in which projects are located
Number of loans
Aggregate loans granted
Disbursed portion
Undisbursed portion
% of total 2012 % of year 2011
Brazil 13 1 488 923 888 923 600 000
Panama 4 581 288 278 120 303 168
Argentina 5 278 245 278 245 0
Ecuador 2 228 007 28 007 200 000
Mexico 4 183 919 183 919 0
Colombia 2 152 273 152 273 0
Regional - Central America 3 133 205 63 205 70 000
Peru 3 79 130 79 130 0
Nicaragua 2 69 357 11 264 58 093
Paraguay 1 64 423 64 423 0
Chile 1 62 203 62 203 0
Uruguay 3 19 559 19 559 0
Costa Rica 1 3 699 3 699 0
Regional - Andean Countries 1 967 967 0
Sub-total 45 3 345 198 2 113 937 1 231 261 0.68% 0.72%

108 Financial Report 2012
D.3.2.6. European Free Trade Association (EFTA) Countries
Countries and territories in which projects are located
Number of loans
Aggregate loans granted
Disbursed portion
Undisbursed portion
% of total 2012 % of total 2011
Norway 7 673 800 569 600 104 200
Switzerland 2 61 500 61 500 0
Sub-total 9 735 300 631 100 104 200 0.15% 0.26%
D.3.2.7. Mediterranean Countries
Countries and territories in which projects are located
Number of loans
Aggregate loans granted
Disbursed portion
Undisbursed portion
% of total 2012 % of total 2011
Morocco 59 4 018 050 2 060 370 1 957 680
Tunisia 57 3 344 501 2 107 316 1 237 185
Egypt 35 3 157 107 2 229 741 927 366
Syrian Arab Republic 15 1 135 865 583 864 552 001
Israel 12 796 690 587 944 208 746
Lebanon 23 768 767 453 767 315 000
Algeria 1 480 050 480 050 0
Jordan 17 408 459 346 748 61 711
Gaza - West Bank 6 58 616 19 576 39 040
Sub-total 225 14 168 105 8 869 376 5 298 729 2.86% 2.75%
D.3.2.8. Overseas Countries and Territories (OCT)
Countries and territories in which projects are located
Number of loans
Aggregate loans granted
Disbursed portion
Undisbursed portion
% of total 2012 % of total 2011
French Polynesia 2 17 500 0 17 500
New Caledonia 1 368 368 0
Sub-total 3 17 868 368 17 500 0.01% 0.00%
D.3.2.9. Eastern Europe, Southern Caucasus, Russia
Countries and territories in which projects are located
Number of loans
Aggregate loans granted
Disbursed portion
Undisbursed portion
% of total 2012 % of total 2011
Ukraine 11 1 730 540 304 000 1 426 540
Russian Federation 6 427 525 205 525 222 000
Georgia 9 418 483 120 020 298 463
Moldova 10 280 810 85 539 195 271
Armenia 4 56 666 7 850 48 816
Sub-total 40 2 914 024 722 934 2 191 090 0.59% 0.41%

1092012 Financial Report
EIB Group Consolidated Financial Statements under EU Directives
D.3.2.10. South Africa
Countries and territories in which projects are located
Number of loans
Aggregate loans granted
Disbursed portion
Undisbursed portion
% of total 2012 % of total 2011
South Africa 32 1 186 510 964 991 221 519
Sub-total 32 1 186 510 964 991 221 519 0.24% 0.26%
Total loans for projects outside the Union 847 53 926 084 34 445 427 19 480 657 10.90% 10.41%
Total loans 2012(1) 5 542 495 290 948 413 374 465 81 916 483 100.00%
Total loans 2011(1) 5 453 481 403 743 395 596 820 85 806 923 100.00%
(1) including loan substitutes (Notes B.2 and D.1)
D.4.Provisions in respect of guarantee operations
A provision for guarantees issued has been established as there is objective evidence that the Group will have to incur a loss in respect of guarantees granted. This provision amounts to EUR ‘000 174 993 as at 31 December 2012 (2011: EUR ‘000 161 867).
The additional provision in respect of guarantees issued totalled EUR ‘000 14 857 in 2012 (2011: EUR ‘000 58 032). In ad-dition, a foreign exchange adjustment of EUR ‘000 1 731 was recognised for the year ended 31 December 2012 (2011: EUR ‘000 3 634).
Note E – Shares and other variable-yield securities
This balance comprises (in EUR ‘000):
Venture capital operations
EBRD shares(1) Investment funds
Total
Cost:
At 1 January 2012 2 225 908 157 500 421 945 2 805 353
Net additions 252 148 0 97 183 349 331
At 31 December 2012 2 478 056 157 500 519 128 3 154 684
Value adjustments:
At 1 January 2012 -701 742 0 -16 781 -718 523
Net releases/additions 35 918 0 -1 395 34 523
At 31 December 2012 -665 824 0 -18 176 -684 000
Net book value:
At 31 December 2012 1 812 232 157 500 500 952 2 470 684
At 31 December 2011 1 524 166 157 500 405 164 2 086 830
(1) The amount of EUR ‘000 157 500 (2011: EUR ‘000 157 500) corresponds to the capital paid in by the Group as at 31 December 2012 with respect to its subscription of EUR ‘000 900 440 to the capital of the EBRD (European Bank for Reconstruction and Development).
As at 31 December 2012, the Group holds 3.04% of the subscribed capital of the EBRD. The share of underlying net equity of the Group in EBRD amounts to EUR 400.5 million (2011: EUR 392.7 million). This is based on the audited 2011
financial statements prepared in accordance with International Financial Reporting Standards.
In EUR million % held Total own funds Total net result Total assets
EBRD (31.12.2010) 3.03 12 977 1 227 39 327
EBRD (31.12.2011) 3.17 13 173 173 47 036
The amounts signed but not yet disbursed disclosed off-balance sheet are respectively: •forventurecapitaloperationsEUR‘0002087888(2011:EUR‘0001955898) •forinvestmentfundsEUR‘000539385(2011:EUR‘000547148)
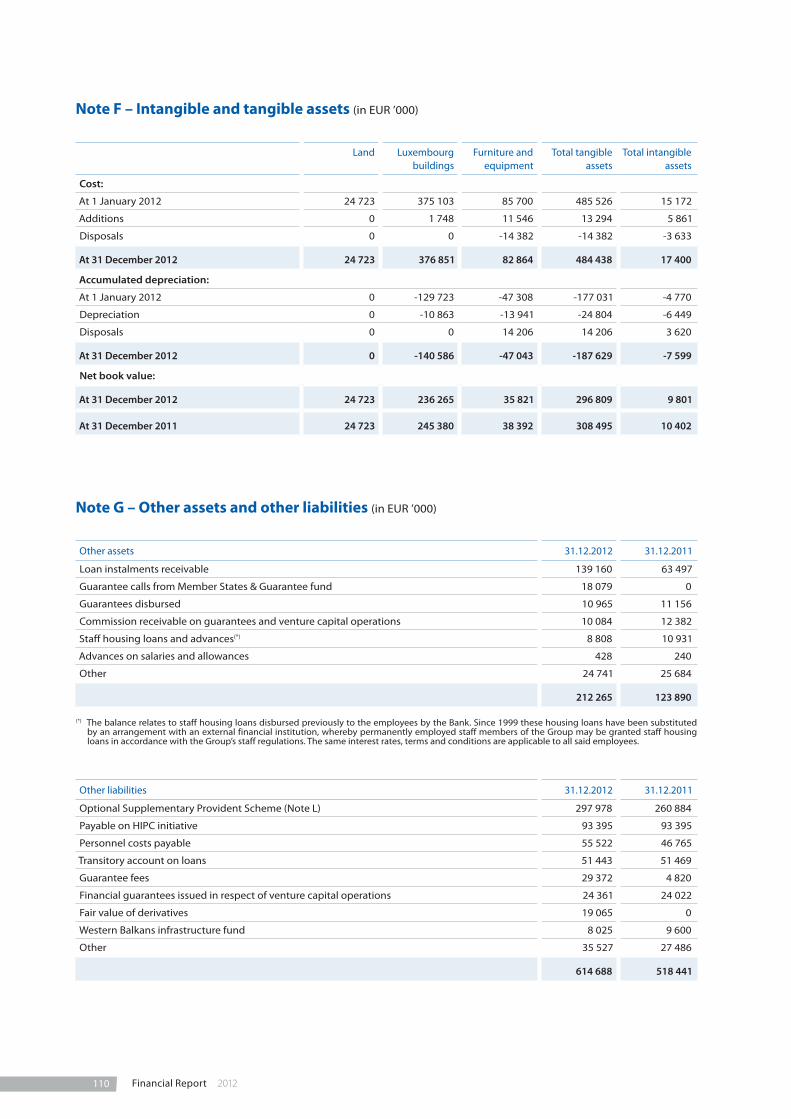
110 Financial Report 2012
Note F – Intangible and tangible assets (in EUR ’000)
Land Luxembourg buildings
Furniture and equipment
Total tangible assets
Total intangible assets
Cost:
At 1 January 2012 24 723 375 103 85 700 485 526 15 172
Additions 0 1 748 11 546 13 294 5 861
Disposals 0 0 -14 382 -14 382 -3 633
At 31 December 2012 24 723 376 851 82 864 484 438 17 400
Accumulated depreciation:
At 1 January 2012 0 -129 723 -47 308 -177 031 -4 770
Depreciation 0 -10 863 -13 941 -24 804 -6 449
Disposals 0 0 14 206 14 206 3 620
At 31 December 2012 0 -140 586 -47 043 -187 629 -7 599
Net book value:
At 31 December 2012 24 723 236 265 35 821 296 809 9 801
At 31 December 2011 24 723 245 380 38 392 308 495 10 402
Note G – Other assets and other liabilities (in EUR ’000)
Other assets 31.12.2012 31.12.2011
Loan instalments receivable 139 160 63 497
Guarantee calls from Member States & Guarantee fund 18 079 0
Guarantees disbursed 10 965 11 156
Commission receivable on guarantees and venture capital operations 10 084 12 382
Staff housing loans and advances(*) 8 808 10 931
Advances on salaries and allowances 428 240
Other 24 741 25 684
212 265 123 890
(*) The balance relates to staff housing loans disbursed previously to the employees by the Bank. Since 1999 these housing loans have been substituted by an arrangement with an external financial institution, whereby permanently employed staff members of the Group may be granted staff housing loans in accordance with the Group’s staff regulations. The same interest rates, terms and conditions are applicable to all said employees.
Other liabilities 31.12.2012 31.12.2011
Optional Supplementary Provident Scheme (Note L) 297 978 260 884
Payable on HIPC initiative 93 395 93 395
Personnel costs payable 55 522 46 765
Transitory account on loans 51 443 51 469
Guarantee fees 29 372 4 820
Financial guarantees issued in respect of venture capital operations 24 361 24 022
Fair value of derivatives 19 065 0
Western Balkans infrastructure fund 8 025 9 600
Other 35 527 27 486
614 688 518 441

1112012 Financial Report
EIB Group Consolidated Financial Statements under EU Directives
Note H – Subscribed capital, Group own funds and appropriation of profit
H.1. Consolidated own funds and appropriation of profit
Statement of movements in consolidated own funds (in EUR ‘000) 2012 2011
Share Capital:- Subscribed capital 242 392 989 232 392 989
- Uncalled capital -220 773 340 -220 773 340
- Called capital 21 619 649 11 619 649
- Capital called but not paid -9 992 427 0
- Paid in capital 11 627 222 11 619 649
Reserves and profit for the year:
Reserve Fund:
- Balance at beginning of the year 20 972 343 20 082 400
- Appropriation of prior year’s profit (1) 624 285 889 943
- Paid-in balance at end of the year 21 596 628 20 972 343
Additional reserves:
- Balance at beginning of the year 1 278 874 1 297 986
- Appropriation of prior year’s profit (2) -23 899 -18 925
- Changes in ownership interests 664 -187
- Balance at end of the year 1 255 639 1 278 874
Special activities reserve:
- Balance at beginning of the year 4 108 940 3 299 370
- Appropriation of prior year’s profit (1) 1 031 446 809 570
- Balance at end of the year 5 140 386 4 108 940
General loan reserve:
- Balance at beginning of the year 2 340 863 1 923 734
- Appropriation of prior year’s profit (1) 636 046 417 129
- Balance at end of the year 2 976 909 2 340 863 Profit for the financial year attributable to the equity holders of the Bank 2 796 768 2 267 878
Total consolidated own funds attributable to equity holders of the Bank 45 393 552 42 588 547
Equity attributable to minority interest (in EUR ‘000) 2012 2011
- Balance at 1 January 324 764 351 944 - Change in minority interest due to change in ownership (3) 26 136 -9 339
- Dividend paid 0 -1 108
- Appropriation of the result of the financial year 49 614 -16 733
Total equity attributable to minority interest at 31 December 400 514 324 764
(1) On 25 April 2012, the Board of Governors decided to appropriate the profit of the Bank for the year ended 31 December 2011, which amounted to EUR ‘000 2 291 777, to the Reserve Fund, the Special activities reserve and the General loan reserve.
(2) The difference between the statutory profit of the Bank and the consolidated profit of the Group amounting to EUR ‘000 - 23 899 was allocated to the Additional reserves attributable to the equity holders of the Bank.
(3) This balance comprises EUR ‘000 -664 resulting from new share acquisitions by the equity holders of the Bank and EUR ‘000 26 800 of adjustments of cumulative timing differences on past acquisitions of shares.

112 Financial Report 2012
H.2. Subscribed capital, called but not paid
As a result of the decision by the Member States, the subscribed and called capital of the Bank increased by EUR 10 bil-lion on 31 December 2012. The Member States are due to pay in their respective shares of this EUR 10 billion capital increase over no more than three instalments, with 91.6% of the capital increase due no later than 31 March 2013 and the remainder in two equal instalments no later than 31 March 2014 and 31 March 2015 respectively.
The amount of EUR ‘000 9 992 427 shown in the balance sheet under the caption Subscribed capital called but not paid represents the amount receivable from the Member States in respect of their share of the capital increase.
Note I – ‘Prepayments and accrued income’ and ‘Accruals and deferred income’ (in EUR ’000)
31.12.2012 31.12.2011
Prepayments and accrued income :
Interest and commission receivable 9 176 290 8 851 942
Foreign exchange on currency swap contracts 6 603 887 10 940 322
Redemption premiums on swaps receivable(*) 472 985 495 446
Deferred borrowing charges 103 415 56 230
Investment Facility’s commission receivable 36 202 38 011
Other 42 969 25 418
16 435 748 20 407 369
Accruals and deferred income :
Interest and commission payable 10 515 700 9 866 008
Redemption premiums on swaps payable(*) 568 278 534 287
Deferred early repayment indemnities on loans 0 232 184
Deferred borrowing proceeds 279 098 278 560
Interest subsidies received in advance(**) 133 527 155 670
Prepaid management fees 2 937 10 314
11 499 540 11 077 023
(*) Redemption premiums on swaps receivable and payable represent end payments of the underlying swap agreements for those agreements which include such features.
(**) Part of the amounts received from the European Commission has been made available as a long-term advance which is entered on the liabilities side under item Accruals and deferred income and comprises:
• amountsinrespectofinterestsubsidiesforloansgrantedforprojectsoutsidetheEuropeanUnion,underConventionssignedwiththeACPStatesand Protocols concluded with the Mediterranean Countries; and
• interestsubsidies,concerningcertainlendingoperationsputinplacewithintheEUfromtheBank’sownresources,madeavailableinconjunctionwith the EMS under Council Regulation (EEC) No 1736/79 of 3 August 1979 and in conjunction with the financial mechanism established by the EFTA Countries under the EFTA Agreement signed on 2 May 1992.

1132012 Financial Report
EIB Group Consolidated Financial Statements under EU Directives
Note J – Amounts owed to credit institutions and customers with agreed maturity dates or periods of notice (in EUR ’000)
J.1. Amounts owed to credit institutions
31.12.2012 31.12.2011
Repayable on demand 10 708 287 10 969 469
Short term deposits 24 081 53 459
Repo with central banks 0 100 000
Cash deposited on swaps payable 928 225 1 037 136
11 660 593 12 160 064
J.2. Amounts owed to customers
31.12.2012 31.12.2011
Overnight deposits 44 758 46 304
European Union and Member States' accounts:
- For Special Section operations and related unsettled amounts 379 405 343 617
- Deposit accounts 1 647 482 1 240 648
Short-term deposits 658 637 960 037
2 730 282 2 590 606

114 Financial Report 2012
Note K – Debts evidenced by certificates
In its financing activity, one of the Group’s objectives is to align its funding strategy with the funds required for the loans granted, notably in terms of currencies. The caption ‘Debts evidenced by certificates’ includes ’Debt securities in issue’ (securities offered to the general investing public) and ‘Others’ (private placements). The table below discloses the de-tails per currency of debts outstanding at 31 December 2012 and 2011, together with the average rates and due dates.
Debts evidenced by certificates (in EUR ‘000)
Payable inOutstanding at
31.12.2012Average rate
2012 (*) Due datesOutstanding at
31.12.2011Average rate
2011 (*)
EUR 196 023 682 3.09 2013/2057 174 488 830 3.35
USD 108 809 061 2.36 2013/2058 107 454 811 2.56
GBP 59 693 677 3.77 2013/2054 58 101 423 4.03
AUD 19 055 453 5.27 2013/2042 18 996 605 5.37
JPY 10 650 948 0.85 2014/2047 13 660 198 0.86
CHF 7 990 828 2.37 2014/2036 7 146 966 2.47
NOK 6 974 498 3.37 2013/2025 6 498 323 3.74
SEK 5 507 027 3.61 2013/2039 4 301 840 3.71
TRY 2 932 450 8.86 2013/2022 2 776 232 9.33
ZAR 1 710 305 8.02 2013/2021 1 926 787 8.16
NZD 1 614 026 5.49 2013/2021 2 449 662 6.41
RUB 1 087 293 6.50 2013/2019 719 741 6.69
CAD 753 409 4.53 2037/2045 744 612 4.56
DKK 549 524 2.55 2024/2026 551 505 2.55
CZK 527 035 3.51 2013/2030 541 280 3.89
PLN 313 500 5.91 2013/2026 290 920 6.00
HUF 239 743 6.51 2013/2016 273 625 6.37
RON 101 249 8.88 2014/2016 104 087 8.88
BGN 43 460 1.21 2013/2013 117 599 5.18
MXN 37 297 4.70 2015/2015 32 419 5.06
HKD 33 252 5.10 2013/2019 232 816 0.98
TWD 26 042 4.76 2013/2013 25 508 5.10
Total 424 673 759 401 435 789
(*) Weighted average interest rates at the balance sheet date
The principal and interest of certain structured borrowings are index linked to stock exchange indexes (historical value: EUR 243 million in 2012 and EUR 615 million in 2011). All such borrowings are fully hedged through structured swap operations.
The table below provides the movements in 2012 and 2011 for debts evidenced by certificates (including the short term commercial papers):
(In EUR million) 2012 2011
Balance at 1 January 401 436 358 009
Issuance during the year 140 025 151 108
Contractual redemptions -112 617 -111 187
Early redemptions -2 449 -2 780
Exchange adjustments -1 721 6 286
Balance at 31 December 424 674 401 436

1152012 Financial Report
EIB Group Consolidated Financial Statements under EU Directives
Note L – Provisions – pension plans and health insurance scheme (in EUR ’000)
The Group’s main pension scheme is a defined benefit pension scheme funded by contributions from staff and from the Group covering all employees. All contributions of the Group and its staff are invested in the assets of the Group.
The pension plans and health insurance scheme provisions are as follows (in EUR ‘000):
2012 2011
Staff pension plan:
Provision at 1 January 1 433 746 1 299 180
Payments made during the year -54 054 -51 503
Recognition of actuarial losses 746 13 263
Annual contributions and interest 180 132 172 806
Sub-total 1 560 570 1 433 746
Management Committee Pension Plan 35 302 34 924
Provision at 31 December 1 595 872 1 468 670
Health insurance scheme:
Provision at 1 January 148 786 133 690
Payments made during the year -9 197 -10 065
Recognition of actuarial losses 0 94
Annual contributions and interest 27 532 25 067
Provision at 31 December 167 121 148 786
Total provisions at 31 December 1 762 993 1 617 456
The above figures do not include the liability towards members of staff in respect of the Optional Supplementary Provi-dent Scheme (a defined contribution pension scheme). The corresponding amount of EUR 298 million (2011: EUR 261 million) is classified under ‘Other liabilities’ (Note G).
The provision in respect of future retirement and health insurance benefits was valued as at 30 September 2012 by an independent actuary using the projected unit credit method. The actuarial valuation was updated as at 31 December 2012 with an extrapolation (‘roll forward’ method) for the last 3 months of 2012, using the prevailing market rates of 31 December 2012 and the following assumptions (for the staff pension and medical plans):
• a discount rate of 4.23% (2011: 5.58%) for determining the actuarial present value of benefits accrued in the pension and health insurance schemes, corresponding to 18.17 year duration (2011: 18.85 year duration);
• in the light of past experience, the Group estimates that the overall expected remuneration of post-employment reserves is set at a rate of 1.5% (2011: 1.5%) above the discount rate mentioned above;
• a progressive retirement between the age of 55-65 (same as 2011);
• a combined average impact of the increase in the cost of living and career progression of 4.5% (same as 2011);
• probable resignation of 3% up to age 55 (same as 2011);
• a rate of adjustment of pensions of 2% per annum (same as 2011);
• use of the ISCLT longevity table (same as 2011); and
• a medical cost inflation rate of 4% per annum (same as 2011).
The provisions for these schemes are adjusted when needed (Note A.13.1) according to the actuarial valuation, as per the tables above. Cumulative prior year actuarial deficits or surpluses in excess of 10% of the commitments for retire-ment benefits are recognised over the expected average remaining service lives of the participants on a straight line basis.

116 Financial Report 2012
In 2011, the actuarial valuation on the pension plans and the healthcare scheme displayed an unrecognised loss of EUR ’000 173 488. EUR ’000 11 742 was reported in excess of the 10% corridor, and recognised over the expected aver-age remaining service lives of the participants on a straight line basis from 1 January 2012. Thereby, the net loss recog-nised in 2012 is EUR ’000 948.
In 2012, the actuarial valuation on the pension plans and the healthcare scheme displayed an unrecognised loss of EUR ’000 741 597. EUR ’000 491 666 was reported in excess of the 10% corridor, and the net loss which will be recog-nised in 2013 will be EUR ’000 34 663.
Note M – Extraordinary charges
There are no extraordinary charges for the year ended 31 December 2012. The extraordinary charges accounted for in 2011 for the amount of EUR 50 million related to the Bank’s participation in the HIPC Debt Relief Initiative, which pro-vides debt relief to highly indebted poor countries.
Note N – ‘Interest receivable and similar income’ and ‘Interest payable and similar charges’
N.1.Net interest income (in EUR ’000)
2012 2011
Interest receivable and similar income:
Cash in hand, balance with central banks and post office banks 2 218 3 720
Treasury bills and other bills eligible for refinancing with central banks and debt securities including fixed income securities 477 305 531 574
Loans and advances to credit institutions and customers 10 113 928 10 090 080
Derivatives 14 966 861 14 321 414
Total 25 560 312 24 946 788
Interest payable and similar charges:
Amounts owed to credit institutions and customers -29 238 -58 678
Debts evidenced by certificates -14 015 370 -13 456 131
Derivatives -8 361 599 -8 393 553
Other -139 520 -130 484
Total -22 545 727 -22 038 846
Net interest income 3 014 585 2 907 942

1172012 Financial Report
EIB Group Consolidated Financial Statements under EU Directives
N.2. Geographical analysis of ‘Interest receivable and similar income’ (in EUR ’000)
2012 2011
EU countries
Spain 1 412 302 1 465 252
Italy 1 023 346 1 025 946
Germany 871 667 909 430
Poland 790 945 668 147
United Kingdom 771 182 677 605
France 743 572 824 510
Greece 574 647 586 574
Portugal 536 974 589 511
Hungary 280 308 268 347
Austria 241 851 228 817
Belgium 213 840 211 648
Netherlands 185 311 181 596
Sweden 158 566 151 013
Czech Republic 144 723 157 527
Finland 134 140 153 581
Romania 133 947 126 440
Ireland 99 604 91 490
Slovakia 57 968 43 736
Slovenia 55 156 60 273
Lithuania 45 838 43 974
Bulgaria 44 058 37 068
Denmark 29 292 33 742
Cyprus 23 788 29 078
Latvia 21 787 22 735
Estonia 14 871 11 128
Luxembourg 14 777 17 747
Malta 7 666 6 852
Total EU countries 8 632 126 8 623 767
Outside the European Union 1 031 868 958 275
Total 9 663 994 9 582 042
Income not analysed per country(1) 15 896 318 15 364 746
Total interest receivable and similar income 25 560 312 24 946 788
(1) Income not analysed per country:
•RevenuefromInvestmentportfolioandloansubstitutesportfolios 252 814 273 312
•RevenuefromOperationalbondportfolios 110 614 107 152
•RevenuefromOperationalmoney-marketportfolios 113 877 151 110
•Revenuefrommoney-marketoperations 241 728 511 758
•Incomefromderivatives 14 966 861 14 321 414
•Changeofaccountingpolicyonprepaymentindemnities(NoteA.24.2) 210 424 0
15 896 318 15 364 746
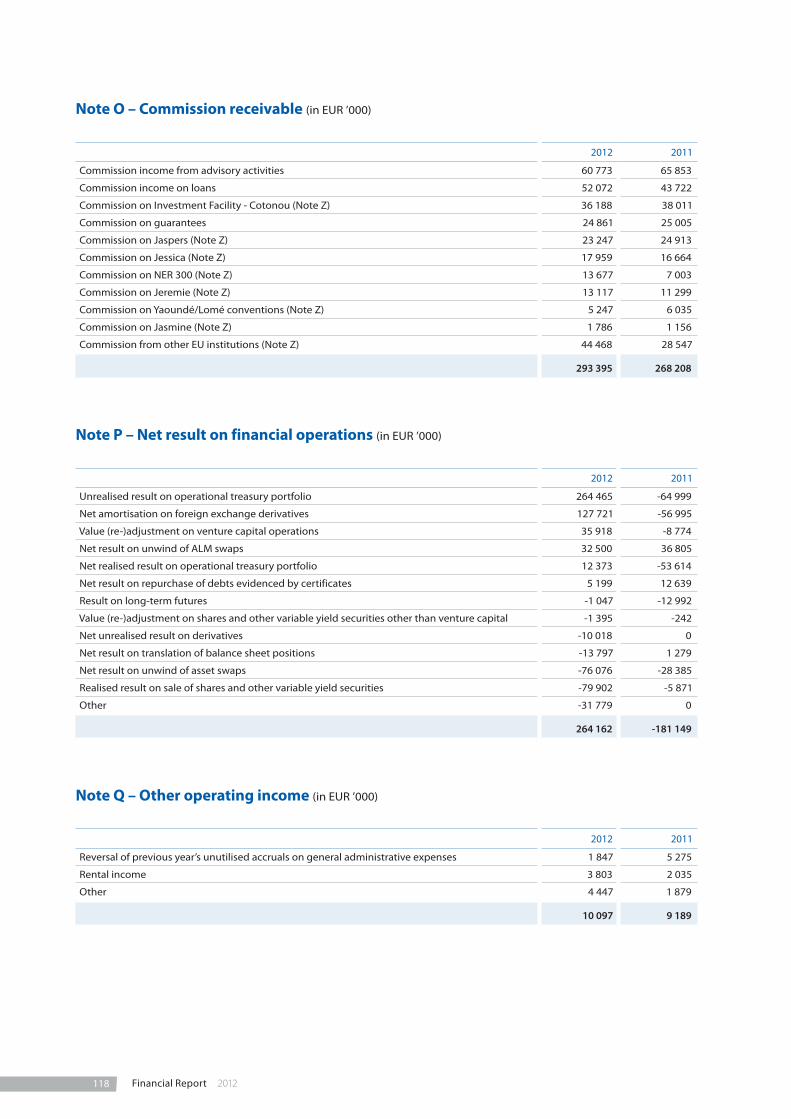
118 Financial Report 2012
Note O – Commission receivable (in EUR ’000)
2012 2011
Commission income from advisory activities 60 773 65 853
Commission income on loans 52 072 43 722
Commission on Investment Facility - Cotonou (Note Z) 36 188 38 011
Commission on guarantees 24 861 25 005
Commission on Jaspers (Note Z) 23 247 24 913
Commission on Jessica (Note Z) 17 959 16 664
Commission on NER 300 (Note Z) 13 677 7 003
Commission on Jeremie (Note Z) 13 117 11 299
Commission on Yaoundé/Lomé conventions (Note Z) 5 247 6 035
Commission on Jasmine (Note Z) 1 786 1 156
Commission from other EU institutions (Note Z) 44 468 28 547
293 395 268 208
Note P – Net result on financial operations (in EUR ’000)
2012 2011
Unrealised result on operational treasury portfolio 264 465 -64 999
Net amortisation on foreign exchange derivatives 127 721 -56 995
Value (re-)adjustment on venture capital operations 35 918 -8 774
Net result on unwind of ALM swaps 32 500 36 805
Net realised result on operational treasury portfolio 12 373 -53 614
Net result on repurchase of debts evidenced by certificates 5 199 12 639
Result on long-term futures -1 047 -12 992
Value (re-)adjustment on shares and other variable yield securities other than venture capital -1 395 -242
Net unrealised result on derivatives -10 018 0
Net result on translation of balance sheet positions -13 797 1 279
Net result on unwind of asset swaps -76 076 -28 385
Realised result on sale of shares and other variable yield securities -79 902 -5 871
Other -31 779 0
264 162 -181 149
Note Q – Other operating income (in EUR ’000)
2012 2011
Reversal of previous year’s unutilised accruals on general administrative expenses 1 847 5 275
Rental income 3 803 2 035
Other 4 447 1 879
10 097 9 189

1192012 Financial Report
EIB Group Consolidated Financial Statements under EU Directives
Note R – General administrative expenses (in EUR ’000)
2012 2011
Salaries and allowances(*) -258 446 -247 661
Welfare contributions and other staff costs -144 798 -151 599
Staff costs -403 244 -399 260
Other general administrative expenses -142 626 -134 392
Total general administrative expenses -545 870 -533 652
(*) of which the amount for members of the Management Committee is EUR ‘000 3 225 at 31 December 2012 and EUR ‘000 3 022 at 31 December 2011. The number of persons employed by the Group was 2 188 at 31 December 2012 (2 173 at 31 December 2011).
Note S – Off-balance sheet special deposits for service of borrowings
This item represents the amount of coupons and bonds due, paid by the Bank to the paying agents, but not yet pre-sented for payment by the holders of bonds issued by the Bank.
Note T – Fair value of financial instruments
The Group records balance sheet financial instruments on the basis of their historical cost in foreign currency (apart from the operational portfolios) representing the amount received in the case of a liability or the amount paid to ac-quire an asset. The fair value of the financial instruments (mainly loans, treasury, securities and borrowings) entered un-der assets or liabilities compared with their accounting value is shown in the table below:
At 31 December 2012 (in EUR million) Accounting value
Fair value
Financial assets:
Cash in hand, balances with central banks and post office banks 157 157
Loans and advances to credit institutions and customers, excluding loan substitutes 451 677 472 983
Treasury bills and debt securities portfolios including loan substitutes (Note B.2) 27 659 26 499
Shares and other variable yield securities (Note E) 2 471 3 129
Total financial assets 481 964 502 768
Financial liabilities:
Amounts owed to credit institutions and customers (Note J) 14 391 14 391
Debts evidenced by certificates (Note K) 424 674 469 572
Total financial liabilities 439 065 483 963

120 Financial Report 2012
At 31 December 2011 (in EUR million) Accounting value
Fair value
Financial assets:
Cash in hand, balances with central banks and post office banks 427 427
Loans and advances to credit institutions and customers, excluding loan substitutes 423 977 426 064
Treasury bills and debt securities portfolios including loan substitutes (Note B.2) 25 142 23 437
Shares and other variable yield securities (Note E) 2 087 2 617
Total financial assets 451 633 452 545
Financial liabilities:
Amounts owed to credit institutions and customers (Note J) 14 751 14 751
Debts evidenced by certificates (Note K) 401 436 431 770
Total financial liabilities 416 187 446 521
Note U – Risk management
This note presents information about the Group’s expo-sure to and its management and control of risks, in par-ticular the primary risks associated with its use of financial instruments. These are:
• credit risk;
• interest rate risk;
• liquidity risk;
• foreign exchange rate risk; and
• market risk.
Within the Group, the management and control of risks is handled separately by each entity. As a consequence, risk management information presented in this note will distinguish between the Bank and the Fund.
U.1. Risk Management Organisation
U.1.1. Risk Management Organisation of the Bank
The Bank aligns its risk management systems to chang-ing economic conditions and evolving regulatory stand-ards. It adapts them on an on-going basis as best market practice develops. Systems are in place to con-trol and report on the main risks inherent in its opera-tions, i.e. credit, market and operational risks.
The Bank analyses and manages risks so as to obtain protection for its assets, its financial result, and conse-quently its capital. While the Bank is not subject to full regulation, it aims to comply in substance with the rele-vant EU banking directives and the recommendations of the banking supervisors of the EU Member States, EU
legislation and the competent supranational bodies, such as the Basel Committee on Banking Supervision (BCBS).
The following sections disclose the credit, market and liquidity risks to which the Bank is exposed on its activi-ties performed on own resources.
The Risk Management Directorate (RM) was created in November 2003.
RM independently identifies, assesses, monitors and re-ports the credit, market and operational risks to which the Bank is exposed in a comprehensive and consistent way and under a consistent approach. Within a common-ly defined framework, whereby the segregation of duties is preserved, RM is independent of the Front Offices and provides second opinion on all proposals made which have risk implications. The Director General of RM reports, for credit, market and operational risks, to the designated Vice-President. The designated Vice-President meets reg-ularly with the Audit Committee to discuss topics relating to credit, market and operational risks. He is also respon-sible for overseeing risk reporting to the Management Committee and the Board of Directors.
To support the implementation of the Bank’s risk poli-cies, two risk-oriented committees have been created.
The Credit Risk Assessment Group (CRAG) is a high-level forum for discussing relevant credit risk issues arising in the course of the Bank’s activities and for advising the Management Committee on these. Its members are the Directors General of the Operations, Projects, Risk Management, Transaction Monitoring & Restructuring, Finance and Legal Affairs Directorates. The CRAG is inten ded to complement, and does not replace, the ex-isting case-by-case review of lending operations, which remains central to the loan approval process.

1212012 Financial Report
EIB Group Consolidated Financial Statements under EU Directives
An ALM Committee (ALCO), made up of the Directors General of the Operations, Finance and Risk Manage-ment Directorates, provides a high-level forum for deba ting the Bank’s ALM policy and for making propos-als in this field to the Management Committee. It pro-motes and facilitates the dialogue among the Directorates represented in it, while providing a wider perspective on, and enhancing their understanding of, the main financial risks.
The Bank continued to develop its capacity to manage loans post signature in line with the Bank’s overall high-er lending volume and the economic environment. For significant parts of the portfolio this is the responsibility of Transaction Management & Restructuring (TMR) a Di-rectorate, reporting to a separate Vice-President. TMR is focusing on monitoring the higher risk counterparts and certain forms of security and it also manages trans-actions requiring particular attention. All of its propos-als which have credit risk implications are subject to an independent second opinion by the Risk Management Directorate.
U.1.1.1. Risk measurement and reporting system
The Bank’s risks are measured using a method which reflects both expected losses likely to arise in normal circumstances and unexpected losses, which are an estimate of the ultimate actual loss based on a portfolio model. The models make use of probabilities derived from statistics based on historical experiences observed in financial markets. The Bank also runs worst case sce-narios that would arise in the event that extreme events which are unlikely to occur do, in fact, occur.
Information on the risk measures described above are presented and explained to the Management Commit-tee on a quarterly basis and to the Board of Directors twice a year. The reports include aggregate credit expo-sures, credit concentration analyses, VaR, liquidity ratios and risk profile changes. In addition, key risk indicators of the loan portfolio and liquidity mismatch risks are presented to the Management Committee on a month-ly basis.
U.1.1.2. The Bank’s financial risk tolerance
As a public institution, the Bank does not aim to make profits from speculative exposures to financial risks, set-ting its financial risk tolerance to a minimum level as de-fined by approved limits, and applying a conservative financial framework.
As a consequence, the Bank does not view its treasury or funding activities as profit-maximising centres, even though performance objectives are attached to those activities. Investment activities are conducted within the primary objective of protection of the capital invest-ed. With respect to exposures arising from the Bank’s lending and borrowing operations, the main principle of the Bank’s financial risk policy is therefore to ensure
that all material financial risks are hedged.
All new types of transactions introducing operational or financial risks must be authorised by the Management Committee, after the approval of the New Products Committee, and are managed within approved limits.
U.1.1.3. Sustainability of revenue and self‑financing capacity
The Bank’s ALM policy forms an integral part of the Bank’s overall financial risk management. It reflects the expectations of the main stakeholders of the Bank in terms of stability of earnings, preservation of the eco-nomic value of own funds, and the self-financing of the Bank’s growth in the long term.
To achieve these aims, the ALM policy employs medium to long term indexation for the investment of own funds to promote stability of revenues and enhance overall returns. This indexation policy implies an expo-sure to medium to long term yields and is not influ-enced by any short term views on trends in interest rates.
This is accomplished by targeting a duration for the Bank’s own funds of between 4.5 and 5.5 years.
U.1.2. Risk Management Organisation of the Fund (EIF)
Most of the Private Equity (PE) Venture Capital and Guarantees & Securitisation (GS) operations for both entities of the Group are managed by the Fund. The mandate of the Fund is to support small and mid-size enterprise (SME) finance for start-up, growth and devel-opment within European Union objectives for SME.
The Fund aligns its risk management systems to chang-ing economic conditions and evolving regulatory stand-ards. It therefore adapts them on an on-going basis as best market practices develop. Credit, market and oper-ational systems are in place to control and report on the main risks inherent to its operations.
An independent Risk Management and Monitoring (RMM) division reports directly to the Deputy Chief Executive. This segregation of duties and the “four-eyes” principle ensure an unbiased review of EIF’s business activities. Moreover, within the EIB Group context, RMM operates in close contact with the Bank’s Risk Manage-ment Directorate, particularly with regard to Group risk exposure relating to guarantee operations, the venture capital operations under the Bank’s Risk Capital Man-date (RCM) and general EIF policy matters.
RMM is divided into three teams: a PE Risk Management team, a Portfolio GS Risk Management team and a Mon-itoring & Administration (MA) team covering both busi-ness lines.

122 Financial Report 2012
The Fund’s treasury management has been outsourced to the Bank under a treasury management agreement signed by both parties and it is carried out according to EIF treasury guidelines.
U.1.2.1. Risk assessment private equity
Under its private equity operations, the Fund has a fund of funds approach, taking minority equity participations in venture capital, private equity and mezzanine funds managed by mostly independent teams in order to lev-erage further commitments from a wide range of inves-tors. The Fund’s PE operations include investments in funds focussed on seed- and early-stage capital, but also investment in well-established funds targeting mid-, later-stage and mezzanine investments, which, generally speaking, have a lower risk profile.
Over the last years, the Fund has developed a tool-set to design, manage and monitor portfolios of PE funds tai-lored to the dynamics of this market place, going beyond investing in top quartile funds. This tool-set is based on an internal model, the Grading-based Eco-nomic Model (GEM), which allows the Fund to better as-sess and verify each funds’ but also each portfolio of funds’ valuations, risks and expected future cash flows and performances. Before committing to a PE fund, the Fund assigns a grading which is based on the outcome of an extensive due diligence performed by the Fund’s transaction team and reviewed by its risk management team. During the funds’ lifetimes, gradings are periodi-cally reviewed with a frequency and intensity depend-ing on the level of risk.
These efforts, supported by the development of a pro-prietary IT system and an integrated software (front to back), improve the investment decision-making process and the management of the portfolio’s financial risks and of liquidity.
In the context of the economic and financial crisis, the Fund continues to closely monitor the valuations re-ported by PE fund managers, and also other specific risks linked to the crisis. The Fund has macroeconomic and financial environment. Throughout the year, the Fund has also run more stringent stress test scenarios on its PE funds portfolios to assess the impact of a wors-ening in and/or a continuation of the financial crisis.
U.1.2.2. Risk assessment guarantees
The Fund extends portfolio guarantees to financial in-termediaries involved in SME financing and provides credit enhancement to SME securitisation transactions. By taking on the risk faced by those institutions, it facili-tates access to funding, and, in turn, it helps to finance SMEs.
For its guarantee & securitisation business, over the last years, the Fund has developed a tool-set to analyse port-folio guarantees and structured finance transactions
in line with best market practices. Before the Fund en-ters legally into a guarantee transaction, an internal rat-ing is assigned to each new own risk guarantee transaction in accordance with the Fund’s Credit Risk Policy and Model Review Guidelines. The rating is based on internal models, which analyse and summarise the transaction’s credit quality (expected loss concept), con-sidering not only quantitative parameters but also qual-itative aspects. Guarantee transactions are monitored regularly, at least quarterly; their statuses are regularly reviewed by EIF investment and risk committee which, depending on their performances, may review their in-ternal ratings. A four-eye principle applies throughout the process, with actions initiated by the front office and reviewed by RMM.
The guarantees portfolio is valued according to a mark-to -model approach. The main impact on the valuation of the transactions in the portfolio stems from the as-signed rating and the possible subsequent rating changes.
In the context of the financial crisis, the Fund has in-creased its monitoring efforts to follow a potential neg-ative rating migration closely. Furthermore, the Fund has strengthened the stress testing methodology, i.e. its scenario analysis with regard to portfolio downgrades and related impacts on capital allocation and expected losses.
U.2. Credit risk
Credit risk concerns mainly the Group’s lending activi-ties and, to a lesser extent, treasury instruments such as fixed-income securities held in the investment and op-erational portfolios, certificates of deposit and inter-bank term deposits as well as the derivative transactions of the Group and the Fund’s guarantee transactions funded by own resources. No credit risk is attached to the Group’s venture capital operations, which are per-formed entirely through equity participations and are, hence, only exposed to market risk.
The credit risk associated with the use of derivatives is analysed in the ‘Derivatives’ section (Note V).
The Group’s policies on credit risk are approved by the respective governing bodies. They set out minimum credit quality levels for both borrowers and guarantors in lending operations and identify the types of security that are deemed acceptable. They also detail the mini-mum requirements which loan contracts must meet in terms of key legal clauses and other contractual stipula-tions to ensure that the Bank’s position ranks at least equal to that of other senior lenders, with prompt access to security when required. In addition, via a counterparty and sector limit system, the credit policies ensure an acceptable degree of diversification in the Group’s loan portfolio. The Group’s limit system draws its inspira-tion from the traditional prudential regulations

1232012 Financial Report
EIB Group Consolidated Financial Statements under EU Directives
on concentration and large exposure management con-tained in the EU banking directives, though the Group generally adopts a more restrictive approach to risk-tak-ing than commercial banks. They also set out the mini-mum credit quality of counterparties of derivatives and treasury transactions as well as the contractual frame-work for each type of transaction. Following approval of the cash capital increase by the heads of state and gov-ernment of the EU member states, the Bank has ex-panded the CRPG by a dedicated chapter on the remedy of non-compliance events with bank intermedi-aries, and a dedicated chapter for incremental new lending in connection with the additional capital.
As regards lending, treasury and derivatives operations, credit risk is managed by an independent Risk Manage-ment Directorate under the direct responsibility of the Management Committee of the Bank. The Group has thus established an operationally independent struc-ture for determining and monitoring credit risk.
The Fund manages exposures and risks in the frame of conservative policies deriving from statutory provisions and Credit Risk Policy Guidelines approved by the Fund’s Board of Directors or guidelines as set out under mandates.
Credit policies undergo periodic adaptations to incor-porate evolving operational circumstances and respond to new mandates that the Group may receive.
Management of credit risk is based, firstly, on the level of credit risk vis-à-vis counterparties and, secondly, on an analysis of the solvency of counterparties.
U.2.1. Loans
In order to limit the credit risk on its loan portfolio, the Group lends only to counterparties with demonstrated long term creditworthiness and with sound guarantees.
In order to efficiently measure and manage credit risk on loans, the Group has graded its lending operations according to generally accepted criteria, based on the quality of the borrower, the guarantee and, where ap-propriate, the guarantor.
Loan renegotiation and forbearance - The EIB consid-ers loans that are unsecured or have weak security to be forborn if in response to adverse changes in the financial position of a borrower the EIB renegotiates the original terms of the contractual arrangements with this borrower affecting directly the future cash flows of the financial instrument, which may result in a loss to the Bank.
In the normal course of business, the Loan Grading (LG) of the loans in question would have deteriorated and the loan would have been included in the Watch List be-fore renegotiation. Once renegotiated, EIB will continue to closely monitor these loans. If the renegotiated pay-ment terms will not recover the original carrying amount of the asset, the Bank will consider to account for value adjustments in the profit and loss account. The corresponding value adjustment will be calculated based on the forecasted cash flows discounted at the original effective interest rate. The need for a value adjustment for all loans whose LG deteriorated to E- is assessed regularly; all loans with a LG of F require a value adjustment. Once the Loan Grading of a loan has improved sufficiently, it will be removed from the Watch List.
Exposures subject to changes in contractual terms which do not affect future cash flows, such as collateral or other security arrangements or the waiver of con-tractual rights under covenants, are not considered as forborn and hence those events are not considered as sufficient to indicate the requirement of a value adjust-ment on their own.
In 2012, 11 loans have undergone renegotiations. The disbursed exposures to these loans amounted to EUR 1 152 million as of 31 December 2012. Of these, one loan with a disbursed exposure of EUR 88 million has been successfully restructured. Of the renegotiated loans, seven loans have been subject to value adjust-ments for a total amount of EUR 213 million. The dis-bursed exposures of these loans amounted to EUR 632 million as at 31 December 2012. During the year, the Bank also wrote off EUR 34.6 million on one re-negotiated operation against a value adjustment previ-ously recognised on this operation. Two loans with a disbursed exposure of EUR 432 million were under re-structuring without a value adjustment.
The structure of guarantors and borrowers relating to the loan portfolio as at 31 December 2012 is analysed below, including undisbursed portions.
Loans outside the European Union (apart from those under the Facilities(*)) are, in the last resort, secured by guarantees of the European Union budget or the Member States (loans in the ACP Countries and the OCT). The agreements decided by the Council of the European Union on 14 April 1997 (Decision 97/256/EC) introduced the concept of risk sharing whereby cer-tain Group loans are secured by third-party guarantees with respect to the commercial risk, the budgetary guarantee applying in the case of political risks solely arising from currency non-transferability, expropria-tion, war and civil disturbance.
(*) Loans granted under Article 16 (previously Article 18) of the Bank’s Statute and loans granted under the Pre Accession Facility, the Mediterranean Part-nership Facility, the Energy Sustainability Facility and the EFTA Facility. These loans, granted under the Facilities, are not secured by guarantees of the European Union budget or the Member States. Therefore, lending under the Facilities is from the Group’s own resources and at the Group’s own risk.

124 Financial Report 2012
The table below shows (in EUR million) the loans for projects inside the European Union and outside the European Union granted under the Facilities and under the risk-sharing operations:
GuarantorBorrower
States Public institutions
Banks Corporates Not guaranteed(1)
Total 2012 Total 2011
States 0 0 0 0 42 461 42 461 39 233
Public institutions 26 578 13 946 560 3 388 55 259 99 731 92 549
Banks 19 629 36 830 34 253 25 039 24 918 140 669 141 575
Corporates 20 602 9 400 30 382 41 439 63 634 165 457 163 366
Total 2012 (1) (2) (3) (4) (5) 66 809 60 176 65 195 69 866 186 272 448 318
Total 2011 (1) (2) (3) (4) (5) 61 956 64 300 69 340 64 855 176 272 436 723
(1) These amounts include loans for which no formal guarantee independent from the borrower and the loan itself was required, the borrower’s level of solvency itself representing adequate security. In the event of certain occurrences, appropriate contractual clauses ensure the Bank’s right to access independent security.
(2) The loans in risk-sharing operations amount to EUR 6 665 million as of 31 December 2012 (2011: EUR 6 372 million).(3) This amount includes loans granted under Facilities.(4) This amount does not include loan substitutes (2012: EUR 12 718 million; 2011: EUR 12 009 million).(5) These amounts exclude loans to current European Union Member States but granted before their accession to the European Union and guaranteed by
the European Union budget or the Member States.
The Group did not record value adjustments in 2011 and 2012 in respect of its EU sovereign and sovereign guaranteed exposure as at the year end as the preferred creditor status of the Bank as well as of the EIF and the protection given by the Bank’s Statute are deemed to guarantee a full recovery of the Group’s assets on maturity.
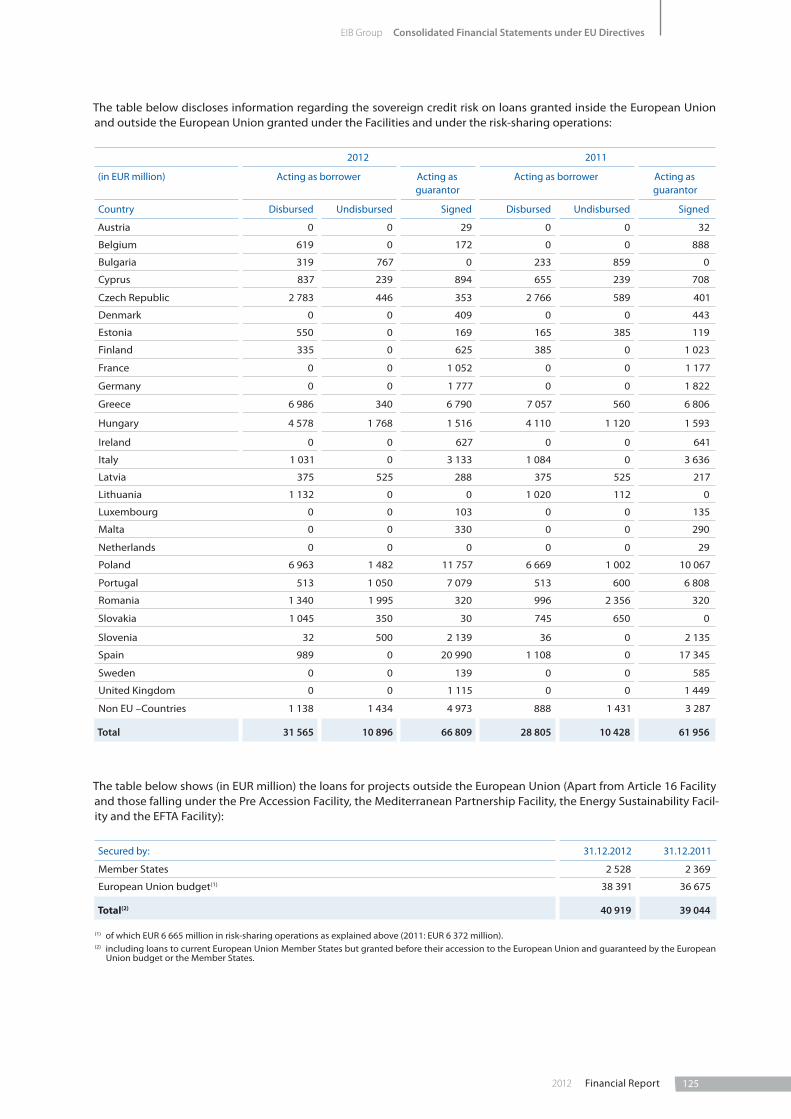
1252012 Financial Report
EIB Group Consolidated Financial Statements under EU Directives
The table below discloses information regarding the sovereign credit risk on loans granted inside the European Union and outside the European Union granted under the Facilities and under the risk-sharing operations:
2012 2011
(in EUR million) Acting as borrower Acting as guarantor
Acting as borrower Acting as guarantor
Country Disbursed Undisbursed Signed Disbursed Undisbursed Signed
Austria 0 0 29 0 0 32
Belgium 619 0 172 0 0 888
Bulgaria 319 767 0 233 859 0
Cyprus 837 239 894 655 239 708
Czech Republic 2 783 446 353 2 766 589 401
Denmark 0 0 409 0 0 443
Estonia 550 0 169 165 385 119
Finland 335 0 625 385 0 1 023
France 0 0 1 052 0 0 1 177
Germany 0 0 1 777 0 0 1 822
Greece 6 986 340 6 790 7 057 560 6 806
Hungary 4 578 1 768 1 516 4 110 1 120 1 593
Ireland 0 0 627 0 0 641
Italy 1 031 0 3 133 1 084 0 3 636
Latvia 375 525 288 375 525 217
Lithuania 1 132 0 0 1 020 112 0
Luxembourg 0 0 103 0 0 135
Malta 0 0 330 0 0 290
Netherlands 0 0 0 0 0 29
Poland 6 963 1 482 11 757 6 669 1 002 10 067
Portugal 513 1 050 7 079 513 600 6 808
Romania 1 340 1 995 320 996 2 356 320
Slovakia 1 045 350 30 745 650 0
Slovenia 32 500 2 139 36 0 2 135
Spain 989 0 20 990 1 108 0 17 345
Sweden 0 0 139 0 0 585
United Kingdom 0 0 1 115 0 0 1 449
Non EU –Countries 1 138 1 434 4 973 888 1 431 3 287
Total 31 565 10 896 66 809 28 805 10 428 61 956
The table below shows (in EUR million) the loans for projects outside the European Union (Apart from Article 16 Facility and those falling under the Pre Accession Facility, the Mediterranean Partnership Facility, the Energy Sustainability Facil-ity and the EFTA Facility):
Secured by: 31.12.2012 31.12.2011
Member States 2 528 2 369
European Union budget(1) 38 391 36 675
Total(2) 40 919 39 044
(1) of which EUR 6 665 million in risk-sharing operations as explained above (2011: EUR 6 372 million).(2) including loans to current European Union Member States but granted before their accession to the European Union and guaranteed by the European
Union budget or the Member States.

126 Financial Report 2012
LOANS FOR PROJECTS OUTSIDE THE EUROPEAN UNION (in EUR million)
(including loans in the new Member States before accession)
BREAKDOWN OF LOANS OUTSTANDING BY GUARANTEE
AGREEMENT 31.12.2012 31.12.2011
75% Member States global guarantee- ACP/OCT Group 4th Lomé Convention 33 51 - ACP/OCT Group 4th Lomé Convention/2nd Financial Protocol 278 328
Total 75% Member States global guarantee 311 379
75% Member States guarantee- Cotonou partnership agreement 561 604 - Cotonou partnership 2nd agreement 1 656 1 386
Total 75% Member States guarantee 2 217 1 990
Total Member States guarantee 2 528 2 369
100% European Union budget guarantee- South Africa – 300m – BG Decision 19.06.95 2 2 - ALA I – 750m 60 84 - ALA interim (100% guarantee) – 153m 3 4 - CEEC – 1bn - BG Decision 29.11.89 21 51 - CEEC – 3bn - BG Decision 02.05.94 214 290 - Russia – 100 m - 2001-2005 60 68 - Russia – 500 m - 2004-2007 230 230
Total 100% European Union budget guarantee 590 729
75% European Union budget guarantee- Mediterranean Protocols 349 490 - Slovenia – 1st Protocol 22 32
Total 75% European Union budget guarantee 371 522
70% European Union budget guarantee- South Africa – 375m – Decision 29.01.97 55 65 - ALA II – 900m 76 99 - ALA interim (70% guarantee: risk sharing) – 122m 1 3 - Bosnia–Herzegovina – 100m 99/2001 70 76 - Euromed (EIB) – 2 310m – Decision 29.01.97 411 528 - FYROM (Former Yugoslav Republic of Macedonia) – 150m – 1998/2000 75 86 - CEEC – 3 520m – Decision 29.01.97 966 1 130
Total 70% European Union budget guarantee 1 654 1 987
65% European Union budget guarantee- South Africa – 825m – 7/2000-7/2007 432 547 - South Africa – Decision 2/2007-12/2013 649 574 - ALA III – 2 480m – 2/2000-7/2007 713 878 - ALA Decision – 2/2007-12/2013 2 870 2 857 - Euromed II – 6 520m – 2/2000-1/2007 4 281 4 611 - South Eastern Neighbours – 9 185m – 2/2000-7/2007 6 801 7 259 - Turkey special action – 450m – 2001-2006 225 251 - Turkey TERRA – 600m – 11/1999-11/2002 437 464 - PEV EE/CAS/RUS 1/2/2007-31/12/2013 2 524 1 593 - PEV MED 1/2/2007-31/12/2013 7 803 6 593 - Pre-Accession – 8 700m – 2007-2013 8 291 7 660 - Climate Change Mandate 2011-2013 750 150
Total 65% European Union budget guarantee 35 776 33 437
Total European Union budget guarantee 38 391 36 675
Total 40 919 39 044
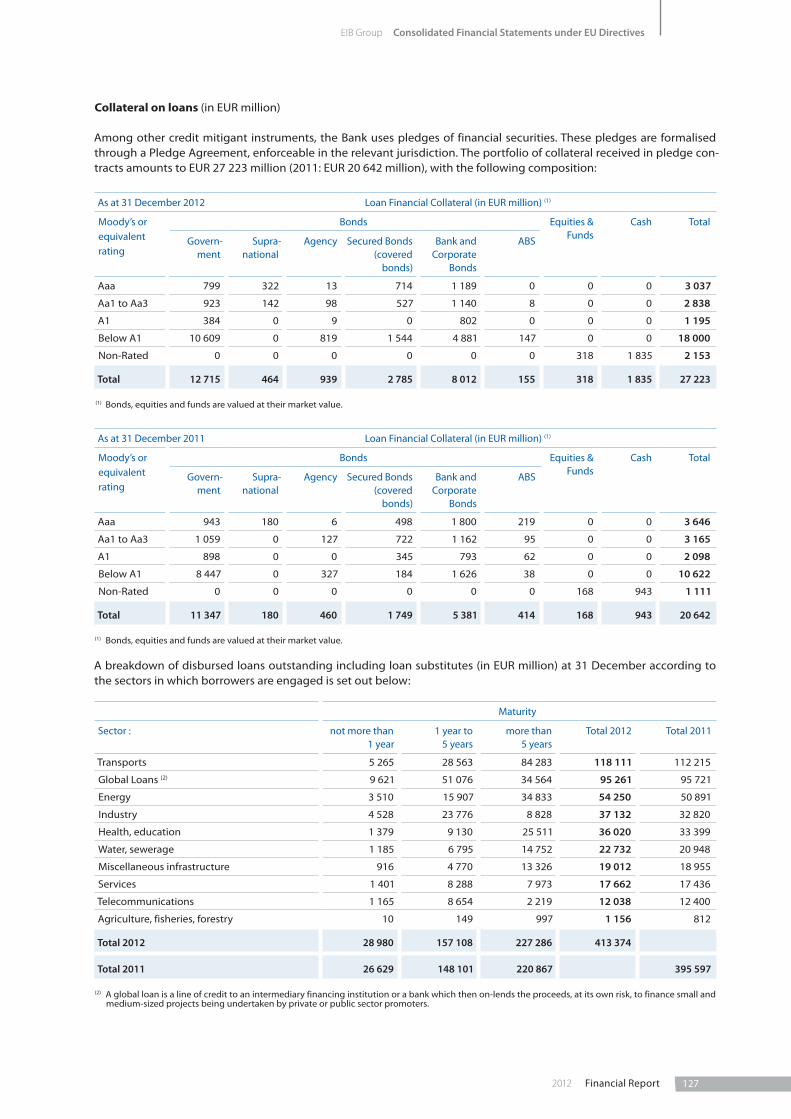
1272012 Financial Report
EIB Group Consolidated Financial Statements under EU Directives
Collateral on loans (in EUR million)
Among other credit mitigant instruments, the Bank uses pledges of financial securities. These pledges are formalised through a Pledge Agreement, enforceable in the relevant jurisdiction. The portfolio of collateral received in pledge con-tracts amounts to EUR 27 223 million (2011: EUR 20 642 million), with the following composition:
As at 31 December 2012 Loan Financial Collateral (in EUR million) (1)
Moody’s or equivalent rating
Bonds Equities & Funds
Cash Total
Govern-ment
Supra-national
Agency Secured Bonds (covered
bonds)
Bank and Corporate
Bonds
ABS
Aaa 799 322 13 714 1 189 0 0 0 3 037
Aa1 to Aa3 923 142 98 527 1 140 8 0 0 2 838
A1 384 0 9 0 802 0 0 0 1 195
Below A1 10 609 0 819 1 544 4 881 147 0 0 18 000
Non-Rated 0 0 0 0 0 0 318 1 835 2 153
Total 12 715 464 939 2 785 8 012 155 318 1 835 27 223
(1) Bonds, equities and funds are valued at their market value.
As at 31 December 2011 Loan Financial Collateral (in EUR million) (1)
Moody’s or equivalent rating
Bonds Equities & Funds
Cash Total
Govern-ment
Supra-national
Agency Secured Bonds (covered
bonds)
Bank and Corporate
Bonds
ABS
Aaa 943 180 6 498 1 800 219 0 0 3 646
Aa1 to Aa3 1 059 0 127 722 1 162 95 0 0 3 165
A1 898 0 0 345 793 62 0 0 2 098
Below A1 8 447 0 327 184 1 626 38 0 0 10 622
Non-Rated 0 0 0 0 0 0 168 943 1 111
Total 11 347 180 460 1 749 5 381 414 168 943 20 642
(1) Bonds, equities and funds are valued at their market value.
A breakdown of disbursed loans outstanding including loan substitutes (in EUR million) at 31 December according to the sectors in which borrowers are engaged is set out below:
Maturity
Sector : not more than 1 year
1 year to 5 years
more than 5 years
Total 2012 Total 2011
Transports 5 265 28 563 84 283 118 111 112 215
Global Loans (2) 9 621 51 076 34 564 95 261 95 721
Energy 3 510 15 907 34 833 54 250 50 891
Industry 4 528 23 776 8 828 37 132 32 820
Health, education 1 379 9 130 25 511 36 020 33 399
Water, sewerage 1 185 6 795 14 752 22 732 20 948
Miscellaneous infrastructure 916 4 770 13 326 19 012 18 955
Services 1 401 8 288 7 973 17 662 17 436
Telecommunications 1 165 8 654 2 219 12 038 12 400
Agriculture, fisheries, forestry 10 149 997 1 156 812
Total 2012 28 980 157 108 227 286 413 374
Total 2011 26 629 148 101 220 867 395 597
(2) A global loan is a line of credit to an intermediary financing institution or a bank which then on-lends the proceeds, at its own risk, to finance small and medium-sized projects being undertaken by private or public sector promoters.

128 Financial Report 2012
Arrears on loans
Amounts in arrears are identified, monitored and reported according to a set of procedures called the “Guidelines for the Monitoring of late payments”.
Loans granted inside the European Union or outside the European Union not secured by guarantees of the European Union budget or the Member States:
Loans for projects located inside the European Union or outside the European Union not secured by guarantees of the European Union budget or the Member States are mainly secured by guarantees from public institutions, banks and corporate entities. Unsecured part of these loans amounts to EUR 186 272 million as at 31 December 2012 (2011: EUR 176 272 million).
As at 31 December 2012, the arrears above 30 days on loans granted inside the European Union or outside the Europe-an Union not secured by guarantees of the European Union budget or the Member States amount to EUR 41.6 million (2011: EUR 1.3 million). These arrears on loans are covered by a value adjustment of EUR 35.4 million which has been recognised and accounted for under Loans and advances to customers – value adjustments (2011: EUR nil).
Loans granted for projects outside the European Union secured by the European Union budget or the Member States:
Loans for projects located outside the European Union and carried out on the basis of mandates given by the Council are guaranteed by the European Union, the Member States or on a risk-sharing basis. If an instalment remains unpaid for over 90 days, the primary guarantee is called (if any available). If the due amount is still unpaid within 150 days after the instalment date (and in any case before the next instalment becomes due), the guarantee of the Member States or the European Union is officially invoked. Each unpaid instalment is called individually.
The arrears of payments on the loan portfolio (including interest revenue and penalty fee) of the Group outside the European Union can be analysed as follows (in EUR 000):
31.12.2012 31.12.2011
Instalments overdue 30 to 90 days 4 917 4 714
Instalments overdue more than 90 days 17 684 2 726
Instalments overdue more than 150 days which have been called and paid under the guarantee of a Member State or the EU 147 193 108 665
Total 169 794 116 105
U.2.2.Treasury
The credit risk associated with treasury (securities, commercial paper, term accounts, etc.) is managed through selecting sound counterparties and issuers.
Limits governing the structure of the securities portfolio and outstanding treasury instruments have been laid down by the Management. These limits are reviewed regularly by the Risk Management Directorate.

1292012 Financial Report
EIB Group Consolidated Financial Statements under EU Directives
The table below provides a percentage breakdown of the credit risk associated with the securities portfolio (i.e. opera-tional money market and bond portfolios) and treasury instruments (money markets products) in terms of the credit rating of counterparties and issuers:
Moody’s or equivalent rating Securities portfolio % Treasury instruments %
31.12.2012 31.12.2011 31.12.2012 31.12.2011
Aaa 11 33 4 4
Aa1 to Aa3 39 29 36 26
A1 to A3 8 28 52 54
Below A3 42 10 8 16
Total 100 100 100 100
Collateral on Treasury transactions
Collateral received
The Treasury transactions include EUR 40 714 million (2011: EUR 25 393 million) of tripartite reverse repurchase agree-ments. These transactions are governed by Tripartite Agreements, for which the exposure is fully collateralised, with daily margin calls. The market value of the collateral portfolio at 31 December 2012 is EUR 42 049 million (2011: EUR 25 551 million), with the following classification:
Tripartite Agreements Collateral (in EUR million)
At 31 December 2012
Bonds Total
Moody’s or equivalent rating
Government Supranational Agency Secured Bonds (covered bonds)
Bank and Corporate
Bonds
ABS
Aaa 4 661 1 065 1 694 5 013 1 539 272 14 244
Aa1 to Aa3 1 092 557 229 595 1 350 0 3 823
A1 176 0 0 221 1 134 0 1 531
Below A1 13 737 0 0 3 209 5 505 0 22 451
Total 19 666 1 622 1 923 9 038 9 528 272 42 049
Tripartite Agreement Collateral (in EUR million)
At 31 December 2011
Bonds Total
Moody’s or equivalent rating
Government Supranational Agency Secured Bonds (covered bonds)
Bank and Corporate
Bonds
ABS
Aaa 2 033 511 90 1 724 1 049 1 811 7 218
Aa1 to Aa3 4 962 0 506 749 1 827 0 8 044
A1 1 147 0 0 222 1 507 0 2 876
Below A1 4 709 0 0 353 2 351 0 7 413
Total 12 851 511 596 3 048 6 734 1 811 25 551
Securities deposited
In the context of the Eurosystem’s monetary policy operations, the EIB deposited securities with the Central Bank of Luxembourg with a market value of EUR 3.3 billion as at 31 December 2012 (2011: EUR 2.2 billion).

130 Financial Report 2012
U.2.3. Securities lending
The securities lending agreement, signed with Northern Trust Global Investment in 2003, was terminated in November 2012. The Group engaged in no securities lending as at the year end.
The market value of the bonds lent in the securities lending activities amounted to EUR 813 million at 31 December 2011. The market value of the collateral portfolio at 31 December 2011 was EUR 853 million, with the following classifi-cation:
Securities Lending Collateral (in EUR million)
At 31 December 2011 Bonds Time Deposit Total
Moody’s or equivalent rating Government Certificate of Deposits
Aaa 26 0 0 26
Aa1 to Aa3 694 0 42 736
A1 to A3 0 0 91 91
Total 720 0 133 853
U.2.4. Guarantees granted by the Group in respect of loans granted by third parties
Credit risk arising from the Group’s guarantees and securitisations transactions funded by own resources is managed by risk management policies covered by the Statutes and the Credit Risk Policy Guidelines. The Statutes limits own-risk guarantees to approximately EUR 9.0 billion. The EUR 3.6 billion exposure at risk at the end of 2012 (2011: 3.7 billion) was well below the statutory limit of EUR 9.0 billion.
The Credit Risk Policy Guidelines ensure that the Group continues to develop a diversified guarantee portfolio in terms of product range, geographic coverage, counterparty exposure, obligor exposure, industry concentration and also set out the capital allocation rules based on the ratings of the exposures.
Concentration risk is limited because of the granular nature of the Group’s transactions; typically the underlying portfo-lios are highly diversified in terms of single obligor concentration, sectors, and also with regard to regional diversifica-tion. To cover concentration risk, the Group has strict limits (based on capital allocation) for individual transactions and on originator level (maximum aggregate exposures for originators and originator groups).
In the context of the Group’s own risk guarantee operations, the credit risk is tracked from the very beginning on a deal-by-deal basis whilst adopting a different model analysis approach depending on the granularity and homogeneity of the underlying portfolios. The industry sector exposures are analysed on a deal-by-deal basis through their impact on the ratings assigned by the Group to each transaction or tranche. For instance, dependent on the financial model to an-alyse the transaction, industry exposures can be reflected in implicit correlation or can be indirectly captured through the assumption on default rate volatility, as a key model input variable.
Furthermore, concentration exposures are analysed in the context of each deal using qualitative measures such as cur-rent status and forecast for sectors with high concentrations in the portfolio. Exceptionally, some deals have a concen-trated exposure in the same (broad) sector. This is typically captured through increased credit enhancement (e.g. subordination) to the benefit of the Group. Typically, deals with replenishing features have portfolio criteria, such as maximum single obligor, maximum top five obligors, and maximum industry concentration levels. Furthermore, the consideration of sector exposures is part of the Group’s overall portfolio analysis.
Counterparty risk is mitigated by the quality of the Group’s counterparties which are usually major market players. The Group performs additional on-site monitoring visits to ensure compliance with procedures and processes during the transaction life. Stress-test scenarios for the portfolio of guarantees, including extreme case assumptions, are regu-larly carried out to determine the ability of the capital base to sustain adverse shocks.
The exposure on guarantees granted by the Group in respect of venture capital operations amounts to EUR ‘000 40 866 as at 31 December 2012 (2011: EUR ‘000 60 524).

1312012 Financial Report
EIB Group Consolidated Financial Statements under EU Directives
U.3. Interest rate risk
Interest rate risk is the volatility in the economic value of, or in the income derived from, the Group’s positions due to adverse movements in market yields or the term structure of interest rates. Exposure to interest rate risk occurs when there are differences in repricing and maturity characteristics of the different asset, liability and hedge instruments.
In measuring and managing interest rate risk, the Group refers to the relevant key principles of the Basel Committee for Banking Supervision (BCBS). The main sources of interest rate risk are: repricing risk, yield curve risk, basis risk and spread risk. An interest rate risk that is particularly relevant for the Group is spread risk. Spread risk is the volatility in the economic value of, or in the income derived from, the Group’s positions due to movements in the funding or lending spread of the Group.
The Group manages its global structural interest rate position on the basis of a notional reference portfolio. The majority of the financial risk indicators and controls in use by the Group apply to this portfolio. Financial indicators and controls for the rest of the activities outside this portfolio only relate to the risks, which are not transferred to it via the transfer pricing system, and which therefore remain with their respective activities, such as the equity risk in the venture capital activity or the interest rate or credit risks taken in those treasury portfolios predominantly managed for yield-enhance-ment purposes.
U.3.1. Value-at-Risk for the own funds of the Group
Group’s ALM strategy aims at maintaining a balanced and sustainable revenue profile as well as limiting the volatility of the economic value of the Group. A clear preference has been given to the revenue profile in light of the objective of self-financing of the Group’s growth. This overall objective is achieved by investing the Group’s own funds according to a medium to long term investment profile, implying an own funds duration target of 4.5 – 5.5 years.
Apart from the duration target for own funds, the Group’s balance sheet should be match-funded with respect to cur-rency and interest rate characteristics. However, small deviations are authorised for operational reasons. The net residu-al positions that arise from outstanding operations are managed within pre-set limits to constrain market risk to minimum levels.
The Risk Management department quantifies the Value at Risk (‘VaR’) of own funds for both interest rates and foreign exchange risk factors. It is measured on the Group’s positions using a 99% confidence level and a one-day time horizon. As at 31 December 2012, the VaR of the Group amounted to EUR 171 million (2011: EUR 318 million). The evolution of the VaR of own funds since 2011 reflects the effective decrease of the volatility of the risk factors and not a change in the risk profile of the Group’s positions.
The computation is based on the so-called Riskmetrics methodology, which assumes a linear dependency between the changes in portfolio or position values and the underlying risk factors. Given the nature of the positions held, the Group deems this assumption appropriate to measure its exposure to interest rate risk. Volatility and correlation data are com-puted internally on the basis of historical market data.
More generally, the VaR does not purport to measure the worst loss that could be experienced. For this reason, it is com-plemented by regular stress testing. As of 31 December 2012, the impact of a 200 basis point upward parallel shift of the interest rate curves would reduce the economic value of own funds by EUR 6.02 billion (2011: EUR 5.37 billion).
Among the financial instruments in the Group’s portfolio, some deals (borrowings and associated swaps) may be redeemed before their final maturity.
At cash flows level all such borrowings are fully hedged by swaps so that they can be considered synthetic floating rate notes. Uncertainty arises from the maturity of such positions indexed to Libor/Euribor as they may be called before their final maturity.
Below is a summary of the features of the Group’s callable portfolio as of 31 December 2012 and 31 December 2011, where the total nominal amount, the average natural maturity and the average expected maturity (both weighted by the nominal amount of the concerned transactions) are shown per funding currency and per main risk factor involved:

132 Financial Report 2012
By funding currency (after swap):
31.12.2012 Pay Currency Total
(in EUR million) CZK EUR JPY PLN USD
EUR Pay Notional 0 -2 707 -292 -25 -4 984 -8 008
Average maturity date 02.02.2037 08.10.2031 05.05.2026 22.10.2035 24.01.2036
Average expected maturity 16.05.2029 10.07.2028 17.05.2013 18.02.2026 11.04.2027
31.12.2011 Pay Currency Total
(in EUR million) CZK EUR JPY PLN USD
EUR Pay Notional -29 -3 064 -85 -22 -5 484 -8 684
Average maturity date 17.06.2013 25.11.2032 04.04.2031 05.05.2026 10.06.2035 28.05.2034
Average expected maturity 15.03.2012 02.06.2023 29.03.2028 01.01.2018 08.01.2026 21.01.2025
By risk factor involved:
31.12.2012 Risk factor Total
(in EUR million) FX level IR curve level IR curve shape
EUR Pay Notional -3 953 -3 866 -189 -8 008
Average maturity date 25.11.2033 05.05.2038 07.09.2034 24.01.2036
Average expected maturity 19.07.2027 14.11.2026 18.12.2029 11.04.2027
31.12.2011 Risk factor Total
(in EUR million) FX level IR curve level IR curve shape
EUR Pay Notional -4 073 -3 730 -881 -8 684
Average maturity date 16.01.2034 14.06.2036 04.06.2027 28.05.2034
Average expected maturity 05.09.2028 24.02.2022 11.08.2020 21.01.2025
U.3.2. Interest rate risk management for the Group
The sensitivity of the earnings quantifies the amount of net interest income that would change during the next 12 months if all interest rate curves rose by one percentage point or decreased by one percentage point. Such exposure stems from the mismatch between interest rate repricing periods, volumes and rates of assets and liabilities that the Group accepts within the approved limits.
With the positions in place as of 31 December 2012, the earnings would increase by EUR 151.6 million (2011: EUR 115.4 million) if interest rates increased by 100 basis points and decrease by EUR 129.3 million (2011: EUR 126.2 mil-lion) if interest rates decreased by 100 basis points.
The Group computes the sensitivity measure with dedicated software that simulates earnings on a deal by deal basis. The sensitivity of the earnings is measured on an accruals basis and is calculated under the ‘’ongoing’’ assumption that, over the time horizon analysed, the Group realises the new loan business forecast in the Corporate Operational Plan, maintains exposures within approved limits and executes monetary trades to refinance funding shortages or invest cash excesses. Earnings are simulated on monthly time steps, assuming that all the fixed rate items carry their contrac-tual rate and that all floating rate items are subject to interest rate repricing according to the interest rate scenario applied in the simulation. The monetary trades to refinance funding shortages or invest cash excesses carry rates equal to the money market rates prevailing according to the interest rate scenario applied in the simulation. In line with the current practice of the Group, the model uses the hypothesis that simulated earnings are not distributed to the share-holders, but are used to refinance the Group’s business. The administrative costs are projected according to the fore-casts of the Corporate Operational Plan.
1332012 Financial Report
EIB Group Consolidated Financial Statements under EU Directives
The sensitivity of the EIF is computed by taking into consideration the coupon repricing of all the positions present in the EIF treasury portfolio managed by the Group on a deal by deal basis. Each fixed rate asset is assumed to be reinvest-ed at maturity in a new asset with the same residual life of the previous one as of end of year’s date. Positions in floating rate assets are assumed to have quarterly repricing.
U.4. Liquidity risk
The main objective of liquidity policy is to ensure that the Group can always meet its payment obligations punctually and in full. The Group manages the calendar of its new issues so as to maintain the global level of liquidity within the chosen range. Liquidity planning takes into account the Group’s needs to service its debt, disbursements on loans and cash flows from the loan portfolio. It also takes into account the sizeable amount of signed but un-disbursed loans, whose disbursement typically takes place at the borrower’s request.
Liquidity risk is managed prudently as, in contrast to commercial banks, EIB does not have the natural sources of liquid-ity from the deposits of clients. The Group pre-finances its commitments to avoid being forced to borrow, or to sell as-sets, when it does not have access to resources at a desirable cost level.
The Group further assures sound management of liquidity risk by maintaining a sufficient level of short term liquid as-sets and by spreading the maturity dates of its placements according to the forecasts of liquidity needs. Liquidity risk policy also incorporates a floor on treasury levels. The Group’s total liquidity ratio (defined as a target percentage of annual projected net cash flows) must at all times exceed 25% of the average forecast net annual cash flows for the fol-lowing year.
The Group has in place a Contingency Liquidity Plan (CLP) that specifies decision making procedures and correspond-ing responsibilities. The CLP has been benchmarked against the “Principles for Sound Liquidity Risk Management and Supervision” by the Basel Committee on Banking Supervision (September 2008). The CLP is subject to ad-hoc updates and is presented to the Management Committee annually for approval.
On 8 July 2009, the Bank became an eligible counterparty in the Eurosystem’s monetary policy operations, and there-fore has been given access to the monetary policy operations of the European Central Bank. The Bank conducts the operations via the Central Bank of Luxembourg, where the Group maintains deposits to cover the minimum reserve requirement.
The table hereafter analyses the assets and liabilities of the Group by maturity on the basis of the period remaining between the balance sheet date and the contractual maturity date. Assets and liabilities for which there is no contrac-tual maturity date are classified under “Maturity undefined”.

134 Financial Report 2012
Liquidity risk (in EUR million)
Maturity at 31 December 2012 3 months or less
More than 3 months to 1 year
More than 1 year
to 5 years
More than 5 years
Maturity undefined
Total 2012
Assets:
Cash in hand, central banks and post office banks 157 0 0 0 0 157
Treasury bills and other bills eligible for refinancing with central banks 6 273 872 3 844 7 346 0 18 335
Other loans and advances:
- Current accounts 1 081 0 0 0 0 1 081
- Credit institutions 50 006 270 0 0 0 50 276
- Customers 5 0 0 0 0 5
51 092 270 0 0 0 51 362
Loans:
- Credit institutions 1 982 9 745 63 573 49 165 0 124 465
- Customers 2 795 13 562 89 014 170 479 0 275 850
4 777 23 307 152 587 219 644 0 400 315
Debt securities including fixed-income securities 4 175 517 2 697 1 935 0 9 324
Shares and other variable-yield securities 0 0 0 0 2 471 2 471
Other assets 9 169 76 1 030 189 16 483 26 947
Total assets 75 643 25 042 160 158 229 114 18 954 508 911
Liabilities:
Amounts owed to credit institutions 10 732 599 330 0 0 11 661
Amounts owed to customers 2 644 86 0 0 0 2 730
Debts evidenced by certificates 22 364 37 374 205 999 158 937 0 424 674
Capital, reserves, profit and minority interest 0 0 0 0 55 786 55 786
Other liabilities 0 0 76 492 13 492 14 060
Total liabilities 35 740 38 059 206 405 159 429 69 278 508 911
Off balance sheet currency swaps 57 457 2 782 3 308 0 6 604
Some of the borrowings and associated swaps include early termination triggers or call options granted to the investors or the hedging swap counterparties, and the Bank as well has the right to call the related bonds before maturity. If the Group were to exercise all the call options on its bonds at their next contractual exercise date, cumulated early redemp-tions for the period 2013 - 2015 would amount to EUR 3.92 billion.

1352012 Financial Report
EIB Group Consolidated Financial Statements under EU Directives
Maturity at 31 December 2011 3 months or less
More than 3 months to 1 year
More than 1 year
to 5 years
More than 5 years
Maturity undefined
Total 2011
Assets:
Cash in hand, central banks and post office banks 427 0 0 0 0 427
Treasury bills and other bills eligible for refinancing with central banks 3 649 1 099 2 944 7 084 0 14 776
Other loans and advances:
- Current accounts 964 0 0 0 0 964
- Credit institutions 39 418 200 0 0 0 39 618
- Customers 0 0 0 0 0 0
40 382 200 0 0 0 40 582
Loans:
- Credit institutions 2 229 9 296 69 562 52 774 0 133 861
- Customers 2 134 12 346 75 678 159 376 0 249 534
4 363 21 642 145 240 212 150 0 383 395
Debt securities including fixed-income securities 3 832 1 327 1 916 3 291 0 10 366
Shares and other variable-yield securities 0 0 0 0 2 087 2 087
Other assets 0 13 212 270 20 355 20 850
Total assets 52 653 24 281 150 312 222 795 22 442 472 483
Liabilities:
Amounts owed to credit institutions 11 065 159 801 135 0 12 160
Amounts owed to customers 2 416 175 0 0 0 2 591
Debts evidenced by certificates 18 277 36 725 195 794 150 640 0 401 436
Capital, reserves, profit and minority interest 0 0 0 0 42 913 42 913
Other liabilities 0 1 54 479 12 849 13 383
Total liabilities 31 758 37 060 196 649 151 254 55 762 472 483
Off balance sheet currency swaps 649 684 3 558 6 049 0 10 940

136 Financial Report 2012
U.5. Foreign exchange rate risk
The sources of foreign exchange rate risk are to be found in the margins on operations and in general expenses incurred in non-euro currencies. The Group’s objective is to eliminate exchange risk by reducing net positions per currency through operations on the international foreign exchange markets.
A foreign exchange hedging programme exists in order to protect the known loan margins in USD and in GBP for the next 3 years.
Foreign exchange position (in EUR million)
Currency at 31 December 2012 Euro Pound Sterling US Dollar Other currencies
Sub-total except Euro
Total 2012
Assets:
Cash in hand, balances with central banks and post office banks 157 0 0 0 0 157
Treasury bills and other bills eligible for refinancing with central banks 18 242 10 83 0 93 18 335
Other loans and advances:
- Current accounts 697 32 36 316 384 1 081
- Credit institutions 41 085 1 345 4 265 3 581 9 191 50 276
- Customers 5 0 0 0 0 5
41 787 1 377 4 301 3 897 9 575 51 362
Loans:
- Credit institutions 85 343 11 130 21 973 6 019 39 122 124 465
- Customers 226 224 21 359 11 212 17 055 49 626 275 850
311 567 32 489 33 185 23 074 88 748 400 315
Debt securities including fixed-income securities 3 348 1 295 900 3 781 5 976 9 324
Shares and other variable-yield securities 1 998 344 27 102 473 2 471
Other assets 22 587 1 425 1 354 1 581 4 360 26 947
Total assets 399 686 36 940 39 850 32 435 109 225 508 911
Liabilities:
Amounts owed to credit institutions 10 066 0 1 304 291 1 595 11 661
Amounts owed to customers 2 467 193 63 7 263 2 730
Debts evidenced by certificates:
- Debt securities in issue 184 380 59 268 106 617 50 085 215 970 400 350
- Others 11 644 426 2 192 10 062 12 680 24 324
196 024 59 694 108 809 60 147 228 650 424 674
Capital, reserves, profit and minority interest 55 786 0 0 0 0 55 786
Other liabilities 8 881 2 001 1 347 1 831 5 179 14 060
Total liabilities 273 224 61 888 111 523 62 276 235 687 508 911
Off balance sheet currency swaps -126 455 24 936 71 666 29 853 126 455
Net position 7 -12 -7 12 -7

1372012 Financial Report
EIB Group Consolidated Financial Statements under EU Directives
Currency at 31 December 2011 Euro Pound Sterling US Dollar Other currencies
Sub-total except Euro
Total 2011
Assets:
Cash in hand, balances with central banks and post office banks 396 0 0 31 31 427
Treasury bills and other bills eligible for refinancing with central banks 14 776 0 0 0 0 14 776
Other loans and advances:
- Current accounts 589 36 10 329 375 964
- Credit institutions 37 175 873 255 1 315 2 443 39 618
- Customers 0 0 0 0 0 0
37 764 909 265 1 644 2 818 40 582
Loans:
- Credit institutions 89 409 13 452 24 530 6 470 44 452 133 861
- Customers 204 799 20 072 10 398 14 265 44 735 249 534
294 208 33 524 34 928 20 735 89 187 383 395
Debt securities including fixed-income securities 6 420 1 526 982 1 438 3 946 10 366
Shares and other variable-yield securities 1 676 305 30 76 411 2 087
Other assets 16 464 1 421 1 406 1 559 4 386 20 850
Total assets 371 704 37 685 37 611 25 483 100 779 472 483
Liabilities:
Amounts owed to credit institutions 11 287 0 585 288 873 12 160
Amounts owed to customers 2 329 204 51 7 262 2 591
Debts evidenced by certificates:
- Debt securities in issue 164 644 57 685 104 047 49 779 211 511 376 155
- Others 9 845 416 3 408 11 612 15 436 25 281
174 489 58 101 107 455 61 391 226 947 401 436
Capital, reserves, profit and minority interest 42 913 0 0 0 0 42 913
Other liabilities 8 155 2 016 1 390 1 822 5 228 13 383
Total liabilities 239 173 60 321 109 481 63 508 233 310 472 483
Off balance sheet currency swaps -132 535 22 623 71 875 38 037 132 535
Net position -4 -13 5 12 4

138 Financial Report 2012
Note V – Derivatives
The Group uses derivative instruments mainly as part of its asset and liability management activities to manage exposures to interest rate and foreign currency risks, in-cluding exposures arising from forecast transactions. Derivatives are contractual financial instruments, the value of which fluctuates according to trends in the un-derlying assets, interest rates, exchange rates or indices.
The majority of the Group’s swaps are concluded with a view to hedging specific bond issues, as part of its resource-raising operations (funding activity).
The Group also enters into swaps as part of its hedging operations on loans, treasury, or for the global Assets and Liabilities Management (ALM) position (ALM hedg-ing activity).
The Group also enters into short-term currency swap contracts in order to adjust currency positions in its op-erational treasury in relation to its benchmark currency, the euro, and to cater for demand for currencies in con-junction with loan disbursements.
Future contracts (futures) are used in the context of the treasury activities, to hedge the exposure deriving from some investments in government bonds. Futures are standardised derivatives, negotiated on regulated mar-kets, and they do not fall within the general policy for counterparty risk measurement and control (see note V.2.).
V.1. As part of funding and ALM hedging activity
The Group uses long term derivatives mainly as part of its funding strategy in order to bring the characteristics
of the funds raised, in terms of currencies and interest rates, into line with those of loans granted and also to reduce funding costs.
Long-term derivatives transactions are not used for trading, but only in connection with fund-raising and for the reduction of market risk exposure.
All swaps linked to the borrowing portfolio have maturi-ties matching the corresponding borrowings and are therefore of a long-term nature.
The derivatives used in the context of funding and ALM hedging activities are:
• Currency swaps;
• Interest rate swaps; and
• Structured swaps.
V.1.1. Currency swaps
Currency swaps are contracts under which it is agreed to convert funds raised in one currency into another currency and, simultaneously, a forward exchange con-tract is concluded to re-exchange the two currencies in the future in order to be able to repay the funds raised on the due dates.
The Group enters into currency swaps, in which, at in-ception, the proceeds of a borrowing are converted into a different currency, mainly as part of its resource-rais-ing operations, and, thereafter, the Group will obtain the amounts needed to service the borrowing in the original currency.
The following table shows the maturities of currency swaps (excluding short-term currency swaps – see Note V.2.), sub-divided according to their notional amount and fair value. The notional amounts are disclosed off balance sheet.
Currency swaps at 31 December 2012 (in EUR million)
1 year or less More than 1 year and up
to 5 years
More than 5 years and up
to 10 years
More than 10 years
Total 2012
Notional amount 24 149 92 179 27 323 17 715 161 366
Fair value (i.e. net discounted value)(*) 982 5 089 3 036 3 198 12 305
Currency swaps at 31 December 2011 (in EUR million)
1 year or less More than 1 year and up
to 5 years
More than 5 years and up
to 10 years
More than 10 years
Total 2011
Notional amount 18 084 93 371 37 030 18 071 166 556
Fair value (i.e. net discounted value)(*) 717 4 120 4 615 3 433 12 885
(*) Including the fair value of macro-hedging currency swaps which stood at EUR 8 million as at 31 December 2012 (2011: EUR 283 million).

1392012 Financial Report
EIB Group Consolidated Financial Statements under EU Directives
V.1.2. Interest rate swaps
Interest rate swaps are contracts under which, generally, it is agreed to exchange floating-rate interest for fixed-rate in-terest or vice versa.
Interest rate swaps enable the Group to modify the interest rate structure of its borrowing portfolio and other portfolios in order to accommodate requests from its clients and also to reduce funding costs by exchanging its advantageous access conditions to certain capital markets with its counterparties.
The following table shows the maturities of interest rate swaps (including synthetic swaps, whereby interest computed in a foreign currency is synthetically converted to EUR), sub-divided according to their notional amount and fair value. The notional amounts are disclosed off balance sheet.
Interest rate swaps at 31 December 2012 (in EUR million)
1 year or less More than 1 year and up
to 5 years
More than 5 years and up
to 10 years
More than 10 years
Total 2012
Notional amount 44 560 187 029 78 536 122 692 432 817
Fair value (i.e. net discounted value)(*) 317 8 916 5 634 4 110 18 977
Interest rate swaps at 31 December 2011 (in EUR million)
1 year or less More than 1 year and up
to 5 years
More than 5 years and up
to 10 years
More than 10 years
Total 2011
Notional amount 36 656 179 678 74 866 110 012 401 212
Fair value (i.e. net discounted value)(*) 321 6 951 5 257 3 937 16 466
(*) Including the fair value of macro-hedging interest rate swaps which stood at EUR -648 million as at 31 December 2012 (2011: EUR -664 million).
V.1.3. Structured swaps
The Group does not generally enter into any options contracts in conjunction with its risk hedging policy. However, as part of its strategy of raising funds on the financial markets at a lesser cost, the Group enters into borrowing contracts and loans encompassing notably interest rate or stock exchange index options. Such structured borrowings and loans are entirely covered by swap contracts to hedge the corresponding market risk.
The table below further details the number, value and notional amounts of structured swaps:
Early termination embedded Stock exchange index Special structure coupon or similar
2012 2011 2012 2011 2012 2011
Number of transactions 330 337 3 4 346 339
Notional amount (in EUR million) 8 821 11 302 243 615 21 332 21 285
Net discounted value (in EUR million) 1 015 1 114 4 27 142 381
The fair value of swap transactions is computed using the income approach, applying valuation techniques to convert future amounts to a single present amount (discounted). The estimate of fair value is based on the value indicated by marketplace expectations about those future amounts. Valuation techniques can range from simple discounted known cash flows to complex option models. The valuation models applied are consistent with accepted economic methodol-ogies for pricing financial instruments, and incorporate the factors that market participants consider when setting a price. For a portion of derivative transactions, internal estimates and assumptions might be used in the valuation tech-niques when the market inputs are not directly available.
All option contracts embedded in, or linked with, borrowings are negotiated over the counter. The structured deals include a variety of transactions dependent on interest rates, FX rates, inflation rates, stock indexes and IR volatilities.
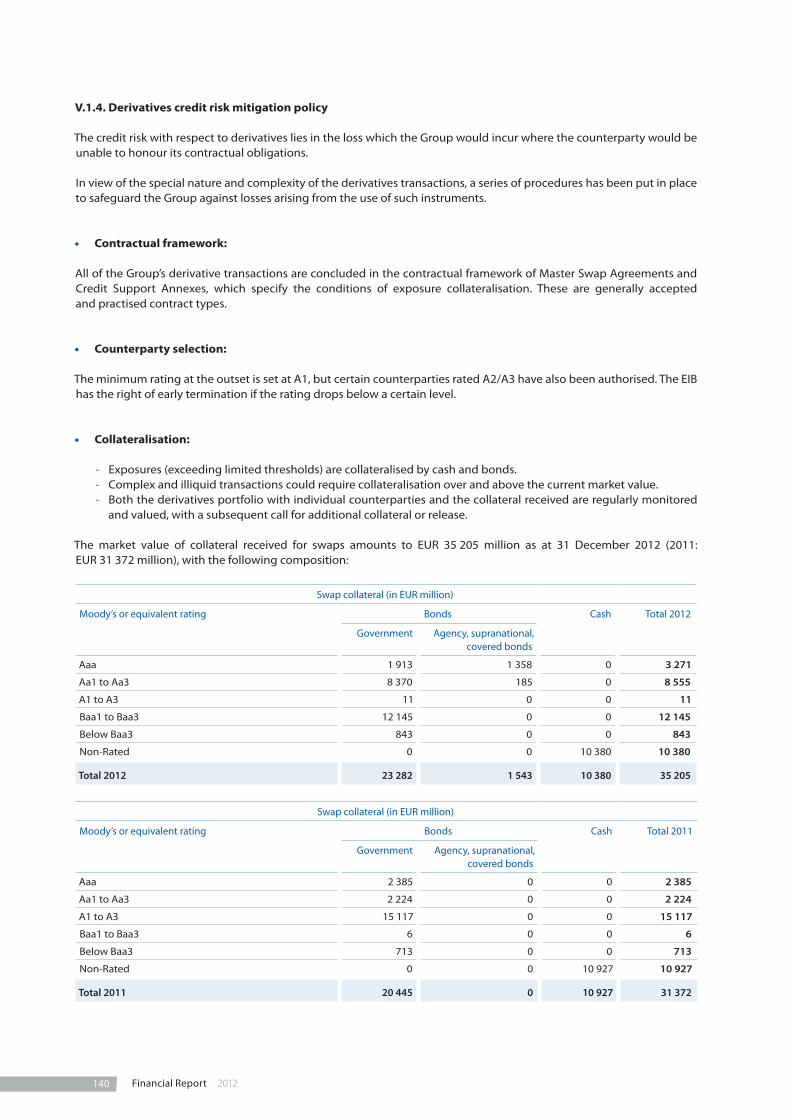
140 Financial Report 2012
V.1.4. Derivatives credit risk mitigation policy
The credit risk with respect to derivatives lies in the loss which the Group would incur where the counterparty would be unable to honour its contractual obligations.
In view of the special nature and complexity of the derivatives transactions, a series of procedures has been put in place to safeguard the Group against losses arising from the use of such instruments.
• Contractual framework:
All of the Group’s derivative transactions are concluded in the contractual framework of Master Swap Agreements and Credit Support Annexes, which specify the conditions of exposure collateralisation. These are generally accepted and practised contract types.
• Counterparty selection:
The minimum rating at the outset is set at A1, but certain counterparties rated A2/A3 have also been authorised. The EIB has the right of early termination if the rating drops below a certain level.
• Collateralisation:
- Exposures (exceeding limited thresholds) are collateralised by cash and bonds. - Complex and illiquid transactions could require collateralisation over and above the current market value. - Both the derivatives portfolio with individual counterparties and the collateral received are regularly monitored
and valued, with a subsequent call for additional collateral or release.
The market value of collateral received for swaps amounts to EUR 35 205 million as at 31 December 2012 (2011: EUR 31 372 million), with the following composition:
Swap collateral (in EUR million)
Moody’s or equivalent rating Bonds Cash Total 2012
Government Agency, supranational, covered bonds
Aaa 1 913 1 358 0 3 271
Aa1 to Aa3 8 370 185 0 8 555
A1 to A3 11 0 0 11
Baa1 to Baa3 12 145 0 0 12 145
Below Baa3 843 0 0 843
Non-Rated 0 0 10 380 10 380
Total 2012 23 282 1 543 10 380 35 205
Swap collateral (in EUR million)
Moody’s or equivalent rating Bonds Cash Total 2011
Government Agency, supranational, covered bonds
Aaa 2 385 0 0 2 385
Aa1 to Aa3 2 224 0 0 2 224
A1 to A3 15 117 0 0 15 117
Baa1 to Baa3 6 0 0 6
Below Baa3 713 0 0 713
Non-Rated 0 0 10 927 10 927
Total 2011 20 445 0 10 927 31 372

1412012 Financial Report
EIB Group Consolidated Financial Statements under EU Directives
• Credit risk measurement for derivatives:
The credit risk associated with derivatives varies according to a number of factors (such as interest and exchange rates) and generally corresponds to only a small portion of their notional value.
The Group measures the credit risk exposure related to swaps and derivatives transactions using the Net Market Expo-sure (NME) and Potential Future Exposure (PFE) for reporting and limit monitoring, and the Credit Risk Equivalent for capital allocation according to the recommendations of the Basel Committee on Banking Supervision (BCBS) sponsored by the BIS.
The Group computes the Net Market Exposure, which is the larger of zero and the market value or “fair value” of the portfolio of transactions within the netting set with a counterparty, less the collateral. It is the amount that would be lost upon the default of the counterparty, using the received collateral and assuming no recovery on the value of those transactions in bankruptcy as well as immediate replacement of the swap counterparty for all the transactions. As of 31 December 2012 the Net Market Exposure stood at EUR 3 457 million (EUR 3 670 million as of 31 December 2011).
In addition, the Group computes the Potential Future Exposure (PFE), which is the possible increase in the netting set’s exposure over the margin period of risk, which ranges between 10 and 20 days, depending on the portfolio of transac-tions. The EIB computes PFE at 90% confidence level using stressed market parameters to arrive at conservative estima-tions of the Potential Future Exposure. This is in line with the recommendations issued by regulators in order to take into consideration the conditions that will prevail in case of default of an important market participant. As of 31 Decem-ber 2012 the total Potential Future Exposure (PFE) stood at EUR 16 494 million (EUR 15 565 million as of 31 December 2011).
• Limits:
The limit system for banks covers both exposure, Net Market Exposure and Potential Future Exposure.
The Net Market Exposure is measured by the NPV of the swap portfolio minus the amount of collateral received. It is lim-ited by the Threshold applicable to the banks as defined in the Credit Support Annex and is dependent on the rating of the counterparty. For any exposure exceeding this Threshold, the Group receives collateral posted by the counterparty.
The Potential Future Exposure limit determines the maximum potential future exposure, measured as explained above and reduced by overcollateralisation, accepted for each counterparty.
The derivatives portfolio is valued and compared against limits on a daily basis.
The following table provides a breakdown of counterparties by rating.
Grouped ratings Percentage of nominal Net Market Exposure(in EUR million)
Potential Future Exposure(in EUR million)
Moody’s or equivalent rating 2012 2011 2012 2011 2012 2011
Aaa 1.10% 1.20% 42 156 219 301
Aa1 to Aa3 24.60% 36.80% 1 173 1 245 4 476 9 919
A1 46.50% 35.90% 1 894 1 414 8 701 4 460
A2 to A3 22.30% 25.60% 348 841 2 863 822
Below A3 5.50% 0.50% 0 14 235 63
Total 100.00% 100.00% 3 457 3 670 16 494 15 565
V.2. As part of liquidity management
The Group enters into short-term currency swap contracts in order to adjust currency positions in its operational treas-ury portfolios in relation to its benchmark currency, the euro, and to cater for demand for currencies in conjunction with loan disbursements.

142 Financial Report 2012
The notional amount of short-term currency swaps stood at EUR 29 392 million at 31 December 2012 against EUR 19 631 million at 31 December 2011. The notional amount of short term currency forwards was EUR 364 million at 31 December 2012 (2011: EUR 322 million). The fair value of these contracts was EUR -145 million at 31 December 2012 (2011: EUR 767 million).
Long-term futures are also used by the Group to adjust the medium term (2-year) interest rate exposure of its treasury bond portfolios. The notional amount of long-term futures stood at EUR nil at 31 December 2012 (2011: EUR 386 mil-lion), with a nil fair value (2011: EUR -1 million).
Forward rate agreements are used by the Group to hedge the interest rate risk of its short term funding. The notional amount of forward rate agreements stood at EUR 4 947 million at 31 December 2012 (2011: EUR 6 606 million) and their fair value at EUR 4 million (2011: EUR 2 million).
Note W – Conversion rates
The following conversion rates were used for establishing the balance sheets at 31 December 2012 and 2011:
31.12.2012 31.12.2011
Non-euro currencies of EU member states
Bulgarian leva (BGN) 1.9558 1.9558
Czech koruna (CZK) 25.151 25.787
Danish kroner (DKK) 7.4610 7.4342
Pound sterling (GBP) 0.8161 0.8353
Hungarian forint (HUF) 292.30 314.58
Polish zloty (PLN) 4.0740 4.4580
Romanian lei (RON) 4.4445 4.3233
Swedish kronor (SEK) 8.5820 8.9120
Non-EU currencies
Australian dollar (AUD) 1.2712 1.2723
Canadian dollar (CAD) 1.3137 1.3215
Swiss franc (CHF) 1.2072 1.2156
Egyptian pound (EGP) 8.4007 7.8058
Hong Kong dollar (HKD) 10.226 10.051
Iceland Krona (ISK) 236.35 257.30
Japanese yen (JPY) 113.61 100.20
Kenyan shilling (KES) 113.68 109.53
Moroccan dirham (MAD) 11.112 11.107
Mexican peso (MXN) 17.185 18.051
Norwegian krone (NOK) 7.3483 7.7540
New Zealand dollar (NZD) 1.6045 1.6737
Russian ruble (RUB) 40.330 41.765
Serbia dinars (RSD) 112.300 106.920
Tunisia dinars (TND) 2.0472 1.9364
Turkish lira (TRY) 2.3551 2.4432
Taiwan dollars (TWD) 38.399 39.203
Ukraine Hryvnia (UAH) 10.631 10.351
United States dollar (USD) 1.3194 1.2939
Franc CFA (XOF) 655.96 655.96
South African rand (ZAR) 11.173 10.483

1432012 Financial Report
EIB Group Consolidated Financial Statements under EU Directives
Note X – Related party transactions – Key Management Personnel
The Group has identified members of the Board of Directors, the Audit Committee, the Management Committee, the Directors General heading the different EIB organisational directorates as key management personnel.
Key management personnel compensation for the relevant reporting periods, included within General administrative expenses (Note R), is disclosed in the following table:
(in EUR ’000) 2012 2011
Short-term benefits(1) 7 248 8 332
Post employment benefits(2) 613 545
Termination benefits 504 504
8 365 9 381
(1) Short-term employee benefits comprise salaries and allowances, bonuses and social security contributions of the Management Committee, the Direc-tors General and other Directors, and benefits paid to the members of the Board of Directors and the Audit Committee.
(2) Post employment benefits comprise pensions and expenses for post employment health insurance paid to members of the Management Committee and Directors General and other Directors.
Open balances with key management personnel as at 31 December 2012 comprise the compulsory and optional sup-plementary pension plan and health insurance scheme liabilities, and payments outstanding as at the year end:
(in EUR ’000) 31.12.2012 31.12.2011
Pension plans and health insurance (Note L) -38 223 -31 964
Other liabilities (Note G) -9 443 -7 012
Other assets (Note G) 0 6
Note Y – Post balance sheet events
There have been no material events after the balance sheet date that would require adjustment of, or disclo-sure in, the Financial Statements as at 31 December 2012.
Note Z – Management of third party funds
Z.1. Investment Facility – Cotonou
The Investment Facility, which is managed by the EIB, has been established within the framework of the Coto-nou Agreement on cooperation and development of the African, Caribbean and Pacific Group of States and the European Union and its Member States on 23 June 2000 and subsequently revised. The EIB prepares sepa-rate financial statements for the Investment Facility.
Z.2. Guarantee Fund
The Guarantee Fund for External Actions was set up in 1994 to cover defaults on loans and loan guarantees granted to non-Member States or for projects in
non-Member States. The European Commission (‘EC’) entrusted financial management of the Guarantee Fund to the EIB under an agreement signed between the two parties in November 1994. The EIB prepares separate financial statements for the Guarantee Fund.
Z.3. JESSICA (Contribution and Holding Funds)
JESSICA (The Joint European Support for Sustainable In-vestment in City Area) is an initiative developed by the EC and the EIB, in collaboration with the Council of Eu-rope Development Bank.
Under new procedures, Managing Authorities are being given the option of using some of their EU grant fund-ing to make repayable investments in projects forming part of an integrated plan for sustainable urban devel-opment. These investments are delivered to projects via Urban Development Funds or if required Holding Funds (JESSICA Holding Funds).
JESSICA Holding Funds are used in the context of the JESSICA initiative. As Manager, EIB gathers the funding received from the Managing Authorities and invests it in Urban Development Funds, according to investment

144 Financial Report 2012
guidelines agreed with the donors. The EIB prepares separate financial statements for JESSICA.
Z.4. FP7 Guarantee Fund
The 7th Framework Programme (‘FP7’) is designed to support research, technological development and dem-onstration projects all over Europe. The rules and princi-ples for the management of the FP7 are laid out in the Agreement between the EC on behalf of the European Atomic Energy Community and the EIB. The EC entrust-ed financial management of the FP7 Guarantee Fund to the EIB under an agreement signed between the two parties in December 2007. The EIB prepares separate financial statements for FP7 Guarantee Fund.
Z.5. Special Section
The Special Section was set up by the Board of Gover-nors on 27 May 1963. Under a decision taken on 4 Au-gust 1977, its purpose was redefined as being that of recording financing operations carried out by the EIB for the account of and under mandate from third parties. It includes the FED, MED/FEMIP and Turkey mandates.
Z.6. JEREMIE
JEREMIE (The Joint European Resources for Micro to Me-dium Enterprises) is an initiative of the European Com-mission’s Directorate General for Regional Policy (DG Regio) and the EIB Group.
Z.7. Risk-Sharing Finance Facility (‘RSFF’)
The RSFF has been established within the framework of the Co-operation Agreement, entered into force on 5 June 2007 between the EC on behalf of the European Union and the EIB. The RSFF aims at fostering invest-ment in research, technological development and dem-onstration, and innovation. As part of the RSFF, the EIF set up the Risk Sharing Instrument for Innovative and Research oriented SMEs and small Mid-Caps (‘RSI’). The RSI provides guarantees to banks and leasing compa-nies for loans and financial leases to research-based small and medium-sized enterprises (SMEs) and small Mid-Caps. The EIB prepares separate financial state-ments for the RSFF.
Z.8. EU-Africa Infrastructure Trust Fund (the ‘Trust Fund’)
The Trust Fund has been created within the framework of the Trust Fund Agreement between the EC on behalf of the European Union as the Founding Donor and the EIB as Manager, also open to Member States of the Eu-ropean Union which subsequently accede to this agree-
ment as Donors. On 9 February 2006, the EC and the EIB Group signed a Memorandum of Understanding to pro-mote jointly the EU-Africa Infrastructure Partnership and, in particular, to establish a supporting EU-Africa Infrastructure Trust Fund. The EIB prepares separate fi-nancial statements for the Trust Fund.
Z.9. European Neighbourhood and Partnership Instrument (‘ENPI’)
The Framework Agreement between the European Union and the EIB on the implementation of operations financed from the general budget of the European Union in the countries covered by the European Neigh-bourhood Policy is channelled through the ENPI. The EIB prepares separate financial statements for ENPI.
Z.10. Loan Guarantee Instrument for Ten-T Projects (’LGTT’)
The LGTT has been established within the framework of the Co-operation Agreement, entered into force on 11 January 2008 between the EC on behalf of the Euro-pean Union and the EIB. The LGTT aims at facilitating a greater private sector involvement in the financing of Trans-European transport networks infrastructure. The EIB prepares separate financial statements for the LGTT.
Z.11. ECHA
On 1 April 2011 the EIB entered into an asset manage-ment agreement with the European Chemicals Agency (ECHA). Under this agreement the EIB manages the in-vestment portfolio of ECHA in accordance with the pre-agreed Asset Management Guidelines.
Z.12. SMEG 2007
In the SMEG 2007 under the Competitiveness and Inno-vation Framework Programme (CIP/SMEG 2007), the EIF is empowered to issue guarantees in its own name but on behalf and at the risk of the Commission.
Z.13. GIF 2007
In the GIF 2007 under the Competitiveness and Innova-tion Framework Programme and the Technology Trans-fer Pilot Project (CIP/GIF 2007), the EIF is empowered to acquire, manage and dispose of investments, in its own name but on behalf and at the risk of the Commission.
Z.14. SME Guarantee Facility
The EIF is empowered to issue guarantees in its own name but on behalf and at the risk of the European

1452012 Financial Report
EIB Group Consolidated Financial Statements under EU Directives
Union according to the Fiduciary and Management Agreement concluded with the European Union.
Z.15. Heavily Indebted Poor Countries (‘HIPC’) Initiative
The HIPC Initiative (the ’Initiative’) is an international debt relief mechanism that provides special assistance to the world’s poorest countries. It was launched in 1996 following a proposal from the World Bank and the Inter-national Monetary Fund. The principal objective of the Initiative is to reduce the debt burden of poor countries to sustainable levels. The EIB prepares separate financial statements for the Initiative.
Z.16. Neighbourhood Investment Facility (‘NIF’) Trust Fund
The NIF Trust Fund managed by the EIB was set up to achieve the strategic objective of the European Neigh-bourhood Partnership Instrument through targeted funding aimed at strengthening infrastructure intercon-nection between the EU and its neighbours in the areas of Transport and Energy, at addressing common envi-ronmental concerns and at supporting other relevant activities. The EIB prepares separate financial state-ments for the NIF Trust Fund.
Z.17. MAP Equity
Under the Multi-Annual Programme (MAP) for enter-prises and entrepreneurship, the EIF manages resources on behalf and at the risk of the EC.
Z.18. Greater Anatolia Guarantee Facility (‘GAGF’)
Under the GAGF signed in May 2010, the EIF manages the Instrument for Pre-Accession Assistance (IPA) funds allocated for the Regional Competitiveness Operational Programme by the European Union and Turkey. The fa-cility provides tailor-made financial help to SMEs and micro-enterprises in Turkey’s least developed provinces in partnership with major Turkish banks.
Z.19. FEMIP Trust Fund
The FEMIP (Facility for Euro-Mediterranean Investment and Partnership) Trust Fund, which is also managed by the EIB, was set up to enhance the existing activities of the EIB in the Mediterranean Partner Countries, with the support of a number of donor countries and with a view of directing resources to operations in certain priority sectors through the provision of technical assistance
and risk capital. The EIB prepares separate financial statements for the FEMIP Trust Fund.
Z.20. G43 Trust Fund
Under G43 Anatolian Venture Capital Fund, signed in August 2011, the EIF is entrusted with a mandate by Central Finance Unit of Turkey (CFCU). It is dedicated to make investments in SMEs in South-Eastern Anatolia region of Turkey.
Z.21. European Progress Microfinance Facility (‘EPMF’)
The EPMF aims to increase access to finance for individ-uals who have difficulties entering the labour market and to promote the start-up and growth of micro-enter-prises with a particular view to providing jobs for the unemployed or the disadvantaged.
Z.22. European Technology Facility (‘ETF’)
Under the ETF Start-Up Facility, the EIF is empowered to acquire, manage and dispose of ETF start-up investments, in its own name but on behalf of and at the risk of the EC.
Z.23. EPTA Trust Fund
EPTA (The Eastern Partnership Technical Assistance) Trust Fund is focused on increasing the quality and de-velopment impact of EIB Eastern Partnership operations by offering a multi-purpose, multi-sector funding facili-ty for technical assistance. It will be complementary to the Neighbourhood Investment Facility. The EIB pre-pares separate financial statements for EPTA Trust Fund.
Z.24. Bundesministerium für Wirtschaft und Technologie
The EIF manages funds on behalf of the German Bun-desministerium für Wirtschaft und Technologie (Federal Ministry of Economics and Technology) and the Europe-an Recovery Programme.
Z.25. GEEREF (Fund and Technical Support Facility)
GEEREF (Global Energy Efficiency and Renewable Ener-gy Fund) is a fund of funds set-up at the initiative of the EC. Its objective is to make investments in private equity funds that focus on the fields of renewable energy and energy efficiency in emerging markets (ACP, ALA and European Neighbour countries). The EIF also holds a technical assistance mandate for which related activi-ties are implemented by the GEEREF front office.

146 Financial Report 2012
Z.26. Technology Transfer Pilot Project (‘TTP’)
Under the TTP, financed by the EC and signed in Novem-ber 2008, the EIF has supported a technology transfer structure through pre-seed funding and seed funding.
Z.27. JASPERS
JASPERS (The Joint Assistance to Support Projects in Eu-ropean Regions) is a major joint policy initiative of the EIB, EC (Regional Policy Directorate-General - DG Regio) and the European Bank for Reconstruction and Devel-opment. It provides advice to the 12 Central and East-ern EU Member States and Croatia during project preparation to help improve the quality of the major projects to be submitted for grant financing under the Structural and Cohesion Funds.
Z.28. European Parliament Preparatory Action (‘EPPA’)
In 2010, the EIF signed the EPPA with DG REGIO. The EIF is providing risk capital and financial support for capaci-ty building purposes in order to help a select number of microfinance institutions to reach a meaningful size and improve their prospects for sustainability.
Z.29. LfA-EIF Facility
LfA-EIF Facility, signed in 2009, is a joint EIF and LfA Förderbank Bayern venture providing investments to support technology-oriented early and expansion stage companies in the region of Bavaria, Germany.
Z.30. Green for Growth Fund (‘GGF’)
The Green for Growth Fund was set up by the EIF in December 2009 and focuses on energy efficiency financings in South East Europe including Turkey.
Z.31. AEICD
This partnership agreement signed between the King-dom of Spain (the Spanish Agency for International De-velopment Cooperation (AECID)) and the EIB was set up to invest in operations in the countries covered by the FEMIP together with Mauritania (the “Southern Mediter-ranean region”), targeting mainly risk capital activities
for micro and small/medium enterprises as well as en-gaging in the wider development of the private sector in the region.
Z.32. GF Greece
The Fund is a joint initiative between the Hellenic Republic, the EC and the EIB and was set up to support the lending to SMEs in Greece. Established by using un-absorbed Structural Funds for Greece, the Fund will guarantee EIB loans to SMEs via partner banks in Greece.
Z.33. EPEC
The European PPP Expertise Centre (‘EPEC’) is a joint ini-tiative of the EIB, the EC and European Union Member States and Candidate Countries. EPEC’s mission is to strengthen the ability of the public sector to engage in Public Private Partnership (PPP) transactions. The EIB prepares separate financial statements for EPEC.
Z.34. Project Bond Initiative (‘PBI’)
A Cooperation Agreement between the EC and the EIB in respect of the Project Bond Instrument: Pilot Phase was signed in November 2012. The PBI is designed to stimulate capital market financing for infrastructure de-livered under ‘project finance’ structures, including Pub-lic Private Partnerships (PPPs). The initiative will seek to enhance the credit rating of bonds issued by project companies to a rating level that is attractive for inves-tors and to lower the project’s overall financing costs.
Z.35. NER300
The EIB supports the EC as an agent in the implementa-tion of the NER 300 initiative - a funding programme for carbon capture and storage demonstration projects and innovative renewable energy technologies. The EIB prepares separate financial statements for NER300.
Z.36. Mezzanine Dachfonds für Deutschland (‘MDD’)
The MDD in an investment programme signed in June 2012 and funded by the German Federal Ministry of Economics and Technology (BMWi) and various institu-tions of the Federal states to subscribe into hybrid debt and equity funds investing in German MidCaps.

1472012 Financial Report
EIB Group Consolidated Financial Statements under EU Directives
Statement of Special Section (1) as at 31 December 2012 and 2011 (in EUR ‘000)
Amounts disbursed and to be disbursed 31.12.2012 31.12.2011
TurkeyFrom resources of Member States
Disbursed loans outstanding 6 492 7 811
Total (2) 6 492 7 811
Mediterranean CountriesFrom resources of the European Union
Disbursed loans outstanding 95 312 106 260
Risk capital operations
- amounts to be disbursed 58 828 64 926
- amounts disbursed 123 912 151 260
182 740 216 186
Total (3) 278 052 322 446
African, Caribbean and Pacific State and Overseas Countries and TerritoriesFrom resources of the European Union
• Yaoundé Conventions
Loans disbursed 4 555 5 797
Contributions to the formation of risk capital
• amounts disbursed 419 419
Total (4) 4 974 6 216
• Lomé Conventions
Operations from risk capital resources:
- amounts to be disbursed 16 117 16 218
- amounts disbursed 475 915 591 263
492 032 607 481
Total (5) 492 032 607 481
Total 781 550 943 954
Funds received and to be received 31.12.2012 31.12.2011
Funds under trust management
Under mandate from the European Union
- Financial Protocols with the Mediterranean Countries 219 224 257 520
- Yaoundé Conventions 4 974 6 216
- Lomé Conventions 475 915 591 263
700 113 854 999
Under mandate from Member States 6 492 7 811
Total funds under trust management 706 605 862 810
Funds to be disbursed
On loans and risk capital operations in the Mediterranean countries 58 828 64 926
On operations from risk capital resources under the Lomé Conventions 16 117 16 218
Total funds to be disbursed 74 945 81 144
Total 781 550 943 954

148 Financial Report 2012
For information:
Total amounts disbursed and not yet repaid on loans on special conditions made available by the Commission in re-spect of which the Bank has accepted an EU mandate for recovering principal and interest:
a) Under the First, Second and Third Lomé Conventions as at 31 December 2012: EUR ‘000 417 129 (2011: EUR ‘000 472 103)
b) Under Financial Protocols signed with the Mediterranean Countries as at 31 December 2012: EUR ‘000 85 017 (2011: EUR ‘000 90 991)
Note (1): The Special Section was set up by the Board of Governors on 27 May 1963. Under a decision taken on 4 August 1977, its purpose was redefined as being that of recording financing operations carried out by the European Investment Bank for the account of and under mandate from third parties. However, for the Investment Facility under the Cotonou Agreement, the EU-Africa Infrastructure Trust Fund, the Neighbourhood Investment Facility (NIF) Trust Fund and the FEMIP Trust Fund, separate financial statements are presented. In addition, since 2005, the EIB also prepares financial statements of different types for other mandates.
The Statement of Special Section reflects amounts disbursed or to be disbursed, less cancellations and repayments, under mandate from the European Union and the Member States. Amounts disbursed and to be disbursed and funds received and to be received are carried at nominal value. No account is taken in the Statement of Special Section of pro-visions or value adjustments, which may be required to cover risks associated with such operations. Amounts in foreign currency are translated at exchange rates prevailing on 31 December.
Note (2): Initial amount of contracts signed for financing projects in Turkey under mandate, for the account and at the risk of Member States.
Initial amount: 405 899
add: exchange adjustments 20 412
less: cancellations 215
repayments 419 604
-419 819
6 492
Note (3): Initial amount of contracts signed for financing projects in the Maghreb and Mashreq countries, Malta, Cyprus, Turkey and Greece (EUR 10 million lent prior to accession to the EC on 1 January 1981) under mandate, for the account and at the risk of the European Union.
Initial amount: 840 457 (*)
less: exchange adjustments 48 508
cancellations 119 859
repayments 394 038
-562 405
278 052
(*) Change in initial amount relates to ENPI (Note Z.9) which is no longer reported as part of Special Section.

1492012 Financial Report
EIB Group Consolidated Financial Statements under EU Directives
Note (4): Initial amount of contracts signed for financing projects in the Associated African States, Madagascar and Mauritius and the Overseas Countries, Territories and Departments (AASMM-OCTD) under mandate, for the account and at the risk of the European Union:
Loans on special conditions 139 483
Contributions to the formation of risk capital 2 503
Initial amount: 141 986
add: capitalised interests 1 178
exchange adjustments 9 831
11 009
less: cancellations 3 310
repayments 144 711
-148 021
4 974
Note (5): Initial amount of contracts signed for financing projects in the African, Caribbean and Pacific States and the Overseas Countries and Territories (ACP-OCT) under mandate, for the account and at the risk of the European Union:
Loans from risk capital resources:
Conditional and subordinated loans 3 116 097
Equity participations 121 002
Initial amount: 3 237 099
add: capitalised interests 9 548
less: cancellations 684 845
repayments 2 011 777
exchange adjustments 57 993
-2 754 615
492 032
Loans from other resources:
Initial amount: 16 500
add: exchange adjustments 58
less: cancellations 8 414
repayments 8 144
-16 558
0
492 032

150 Financial Report 2012
To the Chairman of the Audit Committee of EUROPEAN INVESTMENT BANK98-100, Boulevard Konrad AdenauerL-2950 LUXEMBOURG
Independent Auditor’s Report
REPORT OF THE REVISEUR D’ENTREPRISES AGREE
We have audited the accompanying consolidated finan-cial statements of EUROPEAN INVESTMENT BANK, which comprise the consolidated balance sheet as at 31 December 2012, the consolidated profit and loss account and the consolidated cash flow statement for the year then ended, and a summary of significant accounting policies and other explanatory information.
Management’s responsibility for the consolidated financial statements
The Management is responsible for the preparation and fair presentation of these consolidated financial statements in accordance with the general principles of the Directive 86/635/EEC of the Council of the Euro-pean Communities of 8 December 1986 on the annual accounts and consolidated accounts of banks and other financial institutions, as amended by Directive 2001/65/EC of 27 September 2001, by Directive 2003/51/EC of 18 June 2003 and by Directive 2006/46/EC of 14 June 2006 (the ‘Directives’), and for such internal control as the Management determines is necessary to enable the preparation of consolidated financial state-ments that are free from material misstatement, whether due to fraud or error.
Responsibility of the Réviseur d’Entreprises agréé
Our responsibility is to express an opinion on these consolidated financial statements based on our audit. We conducted our audit in accordance with Interna-tional Standards on Auditing as adopted for Luxem-bourg by the Commission de Surveillance du Secteur Financier. Those standards require that we comply with ethical requirements and plan and perform the audit to
obtain reasonable assurance about whether the con-solidated financial statements are free from material misstatement.
An audit involves performing procedures to obtain audit evidence about the amounts and disclosures in the con-solidated financial statements. The procedures selected depend on the judgement of the Réviseur d’Entreprises agréé, including the assessment of the risks of material misstatement of the consolidated financial statements, whether due to fraud or error. In making those risk assessments, the Réviseur d’Entreprises agréé considers internal control relevant to the entity’s preparation and fair presentation of the consolidated financial state-ments in order to design audit procedures that are appropriate in the circumstances, but not for the pur-pose of expressing an opinion on the effectiveness of the entity’s internal control. An audit also includes evalu-ating the appropriateness of accounting policies used and the reasonableness of accounting estimates made by the Management, as well as evaluating the overall presentation of the consolidated financial statements.
We believe that the audit evidence we have obtained is sufficient and appropriate to provide a basis for our audit opinion.
Opinion
In our opinion, the consolidated financial statements give a true and fair view of the consolidated financial position of EUROPEAN INVESTMENT BANK as of 31 December 2012, and of the consolidated results of its operations and its consolidated cash flows for the year then ended in accordance with the general principles of the Directives.
Luxembourg, 14 March 2013 KPMG Luxembourg S.à r.l. Cabinet de révision agréé
Emmanuel DolléKPMG Luxembourg S.à r.l. 9, Allée SchefferL-2520 LuxembourgSociété à responsabilité limitéeR.C.S. Luxembourg B 149133Capital € 12 502

1512012 Financial Report
EIB Group Consolidated Financial Statements under EU Directives
Statement by the Audit Committee
The Audit Committee reports to the Board of Gover-nors, the following statement being communicated to the Governors prior to their approval of the Annual Re-port and the financial statements for the past financial year.
Statement by the Audit Committee on the EIB’s consolidated financial statements prepared in accordance with the general principles of the EU Directives
The Committee, instituted in pursuance of Article 12 of the Statute and Chapter V of the Rules of Procedure of the European Investment Bank for the purpose of verify-ing that the operations of the Bank are conducted and its books kept in a proper manner, having
- designated KPMG as external auditors, reviewed their audit planning process, examined and dis-cussed their reports, - noted that the opinion of KPMG on the consoli-
dated financial statements of the European Invest-ment Bank, prepared in accordance with the general principles of the EU Directives, for the year ended 31 December 2012 is unqualified, - convened on a regular basis with the Heads of Di-
rectorates and relevant services including,
• the Financial Controller;
• the Directors General of Risk Management and Transaction Monitoring and Restructuring.
- met regularly the Head of Internal Audit and dis-cussed the relevant internal audit reports, and stud-ied the documents which it deemed necessary to examine in the discharge of its duties, - received assurance from the Management Com-
mittee concerning the effectiveness of the internal control structure and internal administration,
and considering
- the consolidated financial statements for the finan-cial year ended 31 December 2012 as drawn up by the Board of Directors at its meeting on 14 March 2013; - that the foregoing provides a reasonable basis for
its statement and, - Articles 24, 25 & 26 of the Rules of Procedure,
to the best of its knowledge and judgement:
confirms that the consolidated financial statements, comprising the consolidated balance sheet, the consoli-dated profit and loss account and the consolidated cash flow statement and a summary of significant account-ing policies and other explanatory information give a true and fair view of the consolidated financial position of the Bank as at 31 December 2012 in respect of its as-sets and liabilities, and of the consolidated results of its operations and its consolidated cash flows for the year then ended, in accordance with the general principles of the EU Directives.
Luxembourg, 14 March 2013
The Audit Committee
J. RODRIGUES DE JESUS D. NOUY M. MATEJ
M. ÜÜRIKE B. JAKOBSEN J.N. SCHAUS


NP 153Financial Report 2012 2012 Financial Report
EIB Group Consolidated Financial Statements under IFRS
EIB GroupConsolidated Financial Statements under IFRSas at 31 December 2012
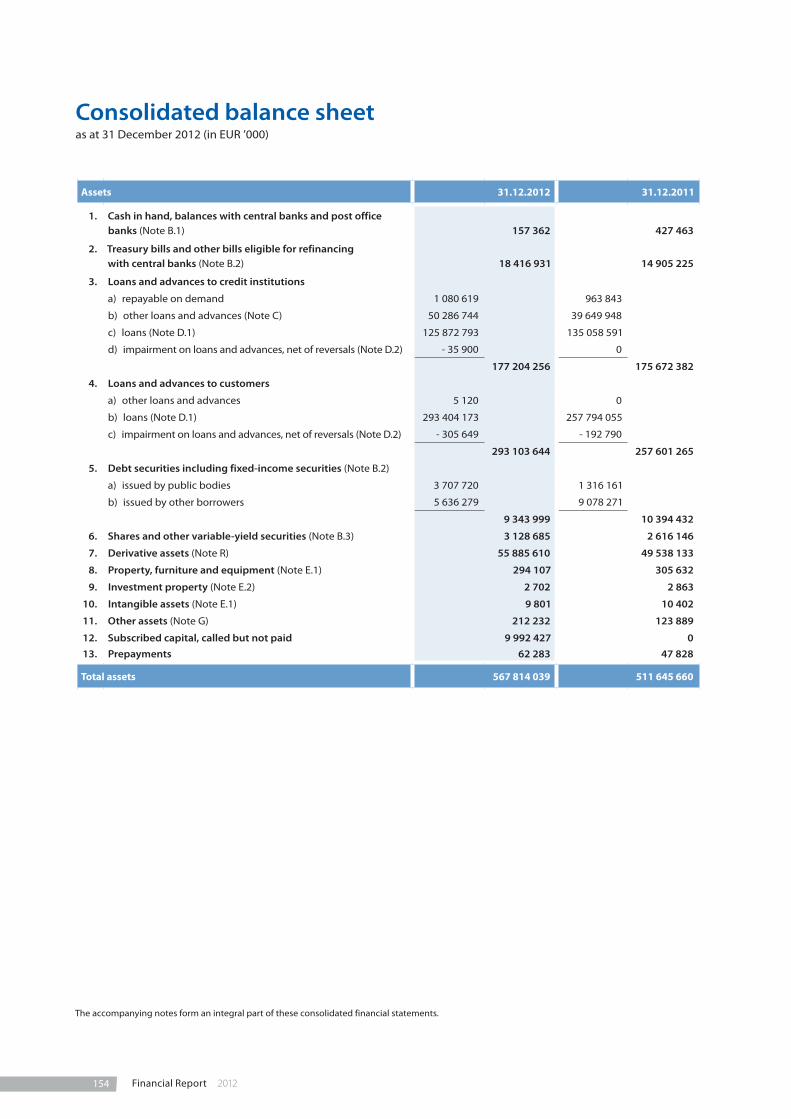
154 Financial Report 2012
Consolidated balance sheetas at 31 December 2012 (in EUR ’000)
Assets 31.12.2012 31.12.2011
1. Cash in hand, balances with central banks and post office banks (Note B.1)
157 362
427 463
2. Treasury bills and other bills eligible for refinancing with central banks (Note B.2)
18 416 931
14 905 225
3. Loans and advances to credit institutions
a) repayable on demand 1 080 619 963 843
b) other loans and advances (Note C) 50 286 744 39 649 948
c) loans (Note D.1) 125 872 793 135 058 591
d) impairment on loans and advances, net of reversals (Note D.2) - 35 900 0
177 204 256 175 672 382
4. Loans and advances to customers
a) other loans and advances 5 120 0
b) loans (Note D.1) 293 404 173 257 794 055
c) impairment on loans and advances, net of reversals (Note D.2) - 305 649 - 192 790
293 103 644 257 601 265
5. Debt securities including fixed-income securities (Note B.2)
a) issued by public bodies 3 707 720 1 316 161
b) issued by other borrowers 5 636 279 9 078 271
9 343 999 10 394 432
6. Shares and other variable-yield securities (Note B.3) 3 128 685 2 616 146
7. Derivative assets (Note R) 55 885 610 49 538 133
8. Property, furniture and equipment (Note E.1) 294 107 305 632
9. Investment property (Note E.2) 2 702 2 863
10. Intangible assets (Note E.1) 9 801 10 402
11. Other assets (Note G) 212 232 123 889
12. Subscribed capital, called but not paid 9 992 427 013. Prepayments 62 283 47 828
Total assets 567 814 039 511 645 660
The accompanying notes form an integral part of these consolidated financial statements.

1552012 Financial Report
EIB Group Consolidated Financial Statements under IFRS
Liabilities and equity 31.12.2012 31.12.2011
Liabilities
1. Amounts owed to credit institutions (Note H.1)
a) repayable on demand 10 708 490 10 974 028
b) with agreed maturity dates or periods of notice 952 308 1 190 872
11 660 798 12 164 900
2. Amounts owed to customers (Note H.2)
a) repayable on demand 2 071 645 1 630 570
b) with agreed maturity or periods of notice 658 850 960 618
2 730 495 2 591 188
3. Debts evidenced by certificates (Note I)
a) debt securities in issue 444 312 894 403 858 955
b) others 25 872 663 26 000 741
470 185 557 429 859 696
4. Derivative liabilities (Note R) 24 744 891 19 419 314
5. Other liabilities (Note G) 978 971 808 844
6. Deferred income (Note F) 136 464 165 994
7. Provisions
a) pension plans and health insurance scheme (Note J) 1 599 384 1 461 833
b) provisions for guarantees issued (Note D.4) 174 993 161 867
c) provision for commitment on investment funds 7 279 8 026
1 781 656 1 631 726
Total liabilities 512 218 832 466 641 662
Equity
8. Capital (Note W)
a) subscribed 242 392 989 232 392 989
b) uncalled - 220 773 340 - 220 773 340
21 619 649 11 619 649
9. Consolidated reserves
a) reserve fund 21 596 628 20 972 343
b) additional reserves 3 054 808 1 605 420
c) fair value reserve 927 942 613 918
d) special activities reserve 5 140 386 4 108 940
e) general loan reserve 2 976 909 2 340 863
33 696 673 29 641 48410. Profit for the financial year (Note K) 278 885 3 742 865
Total equity 55 595 207 45 003 998
Total liabilities and equity 567 814 039 511 645 660
The accompanying notes form an integral part of these consolidated financial statements.

156 Financial Report 2012
Consolidated income statement for the year ended 31 December 2012 (in EUR ‘000)
2012 2011
1. Interest and similar income (Note L) 25 328 977 24 904 6922. Interest expense and similar charges (Note L) - 22 590 861 - 22 144 321
3. Income from shares and other variable-yield securities 33 789 27 721
4. Fee and commission income (Note O) 293 395 268 208
5. Fee and commission expense - 146 - 276
6. Result on financial operations (Note M) - 1 983 217 1 494 492
7. Other operating income (Note N) 10 097 9 189
8. Other operating expense 0 - 50 000
9. Change in impairment on loans and advances and provisions for guarantees, net of reversals (Notes D.2, D.4)
- 192 377
- 163 714
10. Change in impairment on shares and other variable-yield securities, net of reversals (Note B.3)
- 31 259
- 57 576
11. General administrative expenses (Notes J, P)
a) staff costs (Note J) - 416 569 - 381 743
b) other administrative costs - 141 691 - 134 209
- 558 260 - 515 952
12. Depreciation and amortisation: property, furniture and equipment, investment property and intangible assets (Note E)
a) property, furniture and equipment - 24 643 - 24 721
b) investment property - 161 - 161
c) intangible assets - 6 449 - 4 716
- 31 253 - 29 598
13. Profit for the financial year 278 885 3 742 865
Attributable to:
Equity holders of the Bank 278 885 3 742 865
Consolidated statement of comprehensive incomefor the year ended 31 December 2012 (in EUR ‘000)
2012 2011
Profit for the financial year 278 885 3 742 865Other comprehensive income/loss
Available for sale financial assets – fair value reserve
1. Net unrealised gains and losses on financial assets available for sale 241 419 42 429
2. Impairment charges transferred to the consolidated income statement 8 004 11 916
3. Realised gains and losses transferred to the consolidated income statement
64 601
33 823
Total available for sale financial assets 314 024 88 168Total other comprehensive income/loss 314 024 88 168
Total comprehensive income for the financial year 592 909 3 831 033
Attributable to:
Equity holders of the Bank 592 909 3 831 033
The accompanying notes form an integral part of these consolidated financial statements.

1572012 Financial Report
EIB Group Consolidated Financial Statements under IFRS
Cons
olid
ated
sta
tem
ent o
f cha
nges
in e
quit
yfo
r th
e ye
ar e
nd
ed 3
1 D
ecem
ber
201
2 (in
EU
R ‘0
00)
Sub
scri
bed
ca
pit
alC
alla
ble
ca
pit
alR
eser
ve F
un
dA
dd
itio
nal
re
serv
esFa
ir v
alu
e re
serv
eSp
ecia
l ac
tivi
ties
re
serv
e
Gen
eral
loan
re
serv
ePr
ofi
t fo
r th
e ye
ar b
efo
re
app
rop
riat
ion
Tota
l co
nso
lidat
ed
equ
ity
At 3
1 D
ecem
ber
201
023
2 39
2 98
9- 2
20 7
73 3
4020
082
400
1 07
5 52
4 52
5 75
0 3
299
370
1 92
3 73
4 2
644
962
41 1
71 3
89
Ap
pro
pri
atio
n o
f pri
or
year
’s p
rofit
00
889
943
528
320
080
9 57
0 41
7 12
9 - 2
644
962
0
Tota
l co
mp
reh
ensi
ve in
com
e fo
r th
e ye
ar0
00
088
168
0
0 3
742
865
3 83
1 03
3
Ch
ang
es in
ow
ner
ship
inte
rest
s in
su
bsi
dia
ries
th
at d
o n
ot
resu
lt in
a lo
ss o
f co
ntr
ol
00
01
576
00
00
1 57
6
At 3
1 D
ecem
ber
201
123
2 39
2 98
9- 2
20 7
73 3
4020
972
343
1
605
420
613
918
4 10
8 94
0 2
340
863
3 74
2 86
5 45
003
998
Ap
pro
pri
atio
n o
f pri
or
year
’s p
rofit
00
624
285
1 45
1 08
8 0
1 03
1 44
6 63
6 04
6 - 3
742
865
0
Tota
l co
mp
reh
ensi
ve in
com
e fo
r th
e ye
ar0
00
031
4 02
4 0
027
8 88
5 59
2 90
9
Sub
scri
bed
cap
ital
incr
ease
10 0
00 0
000
00
00
00
10 0
00 0
00
Ch
ang
es in
ow
ner
ship
inte
rest
s in
su
bsi
dia
ries
th
at d
o n
ot
resu
lt in
a lo
ss o
f co
ntr
ol
00
0- 1
700
0
00
0- 1
700
At 3
1 D
ecem
ber
201
224
2 39
2 98
9- 2
20 7
73 3
4021
596
628
3
054
808
927
942
5 14
0 38
6 2
976
909
278
885
55 5
95 2
07
The
acco
mp
anyi
ng
no
tes
form
an
inte
gra
l par
t o
f th
ese
con
solid
ated
fin
anci
al s
tate
men
ts.
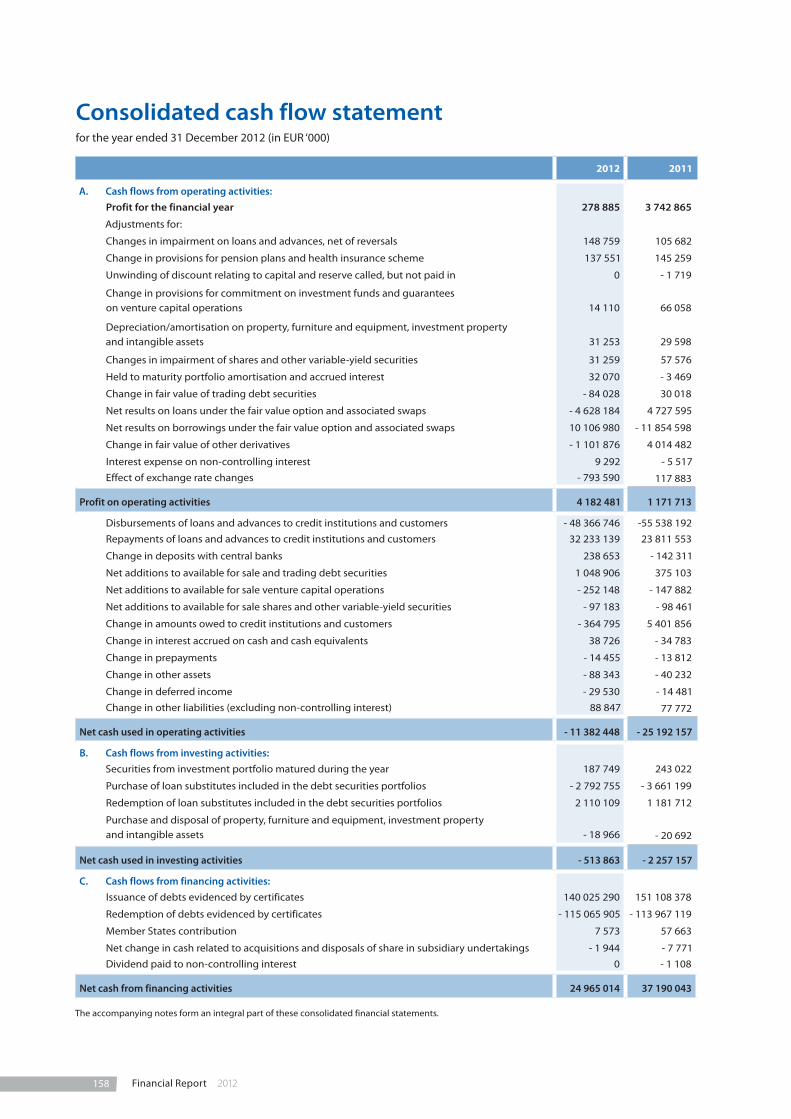
158 Financial Report 2012
Consolidated cash flow statement for the year ended 31 December 2012 (in EUR ‘000)
2012 2011
A. Cash flows from operating activities:Profit for the financial year 278 885 3 742 865
Adjustments for:
Changes in impairment on loans and advances, net of reversals 148 759 105 682
Change in provisions for pension plans and health insurance scheme 137 551 145 259
Unwinding of discount relating to capital and reserve called, but not paid in 0 - 1 719
Change in provisions for commitment on investment funds and guarantees on venture capital operations
14 110
66 058
Depreciation/amortisation on property, furniture and equipment, investment property and intangible assets
31 253
29 598
Changes in impairment of shares and other variable-yield securities 31 259 57 576
Held to maturity portfolio amortisation and accrued interest 32 070 - 3 469
Change in fair value of trading debt securities - 84 028 30 018
Net results on loans under the fair value option and associated swaps - 4 628 184 4 727 595
Net results on borrowings under the fair value option and associated swaps 10 106 980 - 11 854 598
Change in fair value of other derivatives - 1 101 876 4 014 482
Interest expense on non-controlling interest 9 292 - 5 517
Effect of exchange rate changes - 793 590 117 883
Profit on operating activities 4 182 481 1 171 713
Disbursements of loans and advances to credit institutions and customers - 48 366 746 -55 538 192
Repayments of loans and advances to credit institutions and customers 32 233 139 23 811 553
Change in deposits with central banks 238 653 - 142 311
Net additions to available for sale and trading debt securities 1 048 906 375 103
Net additions to available for sale venture capital operations - 252 148 - 147 882
Net additions to available for sale shares and other variable-yield securities - 97 183 - 98 461
Change in amounts owed to credit institutions and customers - 364 795 5 401 856
Change in interest accrued on cash and cash equivalents 38 726 - 34 783
Change in prepayments - 14 455 - 13 812
Change in other assets - 88 343 - 40 232
Change in deferred income - 29 530 - 14 481
Change in other liabilities (excluding non-controlling interest) 88 847 77 772
Net cash used in operating activities - 11 382 448 - 25 192 157
B. Cash flows from investing activities:Securities from investment portfolio matured during the year 187 749 243 022
Purchase of loan substitutes included in the debt securities portfolios - 2 792 755 - 3 661 199
Redemption of loan substitutes included in the debt securities portfolios 2 110 109 1 181 712
Purchase and disposal of property, furniture and equipment, investment property and intangible assets
- 18 966
- 20 692
Net cash used in investing activities - 513 863 - 2 257 157
C. Cash flows from financing activities:Issuance of debts evidenced by certificates 140 025 290 151 108 378
Redemption of debts evidenced by certificates - 115 065 905 - 113 967 119
Member States contribution 7 573 57 663
Net change in cash related to acquisitions and disposals of share in subsidiary undertakings - 1 944 - 7 771
Dividend paid to non-controlling interest 0 - 1 108
Net cash from financing activities 24 965 014 37 190 043
The accompanying notes form an integral part of these consolidated financial statements.

1592012 Financial Report
EIB Group Consolidated Financial Statements under IFRS
2012 2011
Summary statement of cash flows:
Cash and cash equivalents at beginning of financial year 47 038 818 37 209 630
Net cash from:
Operating activities - 11 382 448 - 25 192 157
Investing activities - 513 863 - 2 257 157
Financing activities 24 965 014 37 190 043
Effect of exchange rate changes on cash held 410 620 88 459
Cash and cash equivalents at end of financial year 60 518 141 47 038 818
Cash and cash equivalents are composed of:
Cash in hand, balances with central banks and post office banks, excluding deposits with Central Bank of Luxembourg to cover minimum reserve requirement (Note B.1)
104
31 552
Bills maturing within three months of issue (Note B.2: A1 portfolio excluding accrued interest) 9 431 365 6 625 670
Loans and advances to credit institutions:
Repayable on demand 1 080 619 963 843
Other loans and advances (Note C) 50 006 053 39 417 753
60 518 141 47 038 818
Supplementary disclosures of operating cash flows 2012 2011
Interest received 24 955 007 24 805 936
Dividends received 32 758 27 127
Interest paid - 8 509 588 - 8 595 399
The accompanying notes form an integral part of these consolidated financial statements.

160 Financial Report 2012
European Investment Bank Group
Notes to the consolidated financial statements as at 31 December 2012
The European Investment Bank (the ‘Bank’ or ‘EIB’) was created by the Treaty of Rome in 1958 as the long term lending bank of the European Union (‘EU’). The task of the Bank is to contribute towards the integration, bal-anced development and economic and social cohesion of the EU Member States. The EIB raises substantial vol-umes of funds on the capital markets and lends these funds on favourable terms to projects furthering EU policy objectives. The EIB continuously adapts its activi-ties to developments in EU policies.
The Bank has its registered office at 98-100, boulevard Konrad Adenauer, Luxembourg.
The European Investment Fund (the ‘Fund’ or ‘EIF’) was incorporated on 14 June 1994, in Luxembourg, as an international financial institution. The address of its reg-istered office is 96, boulevard Konrad Adenauer, Luxem-bourg.
The primary task of the Fund, while providing adequate return on equity, is to contribute to the pursuit of EU objectives through:
• the provision of guarantees to financial institutions that cover credits to small and medium sized enti-ties (‘SME’);
• the acquisition, holding, managing and disposal of equity participations;
• the administration of special resources entrusted by third parties; and
• related activities.
The Bank holds 62.13% (2011: 61.93%) of the subscribed capital of the EIF. The Bank and the Fund together are defined as the ‘Group’.
Note A – Significant accounting policies
A.1. Basis of preparation
A.1.1. Statement of compliance
The European Investment Bank consolidated financial statements (the ’Financial Statements’) have been pre-pared in accordance with International Financial
Reporting Standards (‘IFRS’), as adopted by the Euro-pean Union.
On a proposal from the Management Committee, the Board of Directors adopted the Financial Statements on 14 March 2013 and authorised their submission to the Board of Governors for approval by 30 April 2013.
A.1.2. Basis of measurement
The Financial Statements have been prepared on an historical cost basis, except for derivative financial instruments, available-for-sale financial assets and assets and liabilities designated at fair value through profit or loss that have been measured at fair value. The liability for defined benefit obligation is recog-nised as the present value of the defined benefit obli-gation, plus any unrecognised actuarial gains, less any unrecognised past service cost or unrecognised actu-arial losses. The Financial Statements are presented in euro rounded to the nearest thousand, unless other-wise indicated.
A.2. Significant accounting judgements and estimates
In preparing the Financial Statements, the Management Committee is required to make estimates and assump-tions that affect reported income, expenses, assets, lia-bilities and disclosure of contingent assets and liabilities. Use of available information and application of judge-ment are inherent in the formation of estimates. Actual results in the future could differ from such estimates and the differences may be material to the Financial Statements.
The most significant use of judgements and estimates are as follows:
Fair value of financial instruments
Where the fair values of financial assets and financial liabilities recorded on the balance sheet cannot be derived from active markets, they are determined using a variety of valuation techniques that include the use of mathematical models. The input to these models is taken from observable markets where possi-ble, but where this is not feasible, a degree of judge-ment is required in establishing fair values. The judgements include considerations of liquidity and

1612012 Financial Report
EIB Group Consolidated Financial Statements under IFRS
model inputs such as correlation and volatility for longer dated derivatives.
Impairment losses on loans and advances
The Group reviews its loans and advances at each reporting date to assess whether an allowance for impairment should be recorded. In particular, judge-ment by management is required in the estimation of the amount and timing of future cash flows when determining the level of allowance required. Such estimates are based on assumptions about a number of factors and actual results may differ, resulting in future changes to the allowance. In addition to spe-cific allowance against individually significant loans and advances, the Group also makes a collective impairment test on exposures which, although not specifically identified as requiring a specific allowance, have a greater risk of default than when originally granted.
Valuation of unquoted equity investments
Valuation of unquoted equity investments is normally based on one of the following:
• recent arm’s length market transactions;
• current fair value of another instrument that is sub-stantially the same;
• the expected cash flows discounted at current rates applicable for items with similar terms and risk char-acteristics; or
• other valuation models.
The determination of the cash flows and discount fac-tors for unquoted equity investments requires signifi-cant estimation. The Group calibrates the valuation techniques periodically and tests them for validity using either prices from observable current market transac-tions in the same instrument or from other available observable market data.
Impairment of equity investments
The Group treats available-for-sale equity investments as impaired when there has been a significant or pro-longed decline in the fair value below its cost or where other objective evidence of impairment exists. The determination of what is “significant” or “prolonged” requires judgement. The Group treats “significant” gen-erally as 30% or more and “prolonged” greater than 9 months. In addition, the Group evaluates other factors, including normal volatility in share price for quoted equities and the future cash flows and the discount fac-tors for unquoted equities.
Pension and other post-employment benefits
The cost of defined benefit pension plans and other post-employment medical benefits is determined using actuarial valuations. The actuarial valuation involves making assumptions about discount rates, mortality rates and future salary and pension increases. Due to the long term nature of these plans, such estimates are subject to significant uncertainty.
A.3. Changes in accounting policies
The accounting policies adopted are consistent with those of the previous financial year. The Group has not adopted any new or amended IFRS standard during the year, except IFRS 7 amended, “Transfers of financial assets”.
Standards issued but not yet effective
A number of new standards, amendments to standards and interpretations are effective for annual periods beginning after 1 January 2012, and have not been applied in preparing these financial statements.
IAS 1 Presentation of items of Other comprehensive income
The amendments to IAS 1 change the grouping of items presented in Other comprehensive income. Items that would be reclassified to profit and loss at a future point in time would be presented separately from items that will never be reclassified. The Standard is effective for periods beginning on or after 1 July 2012 with early adoption permitted.
IAS 19 Employee benefits
The revision introduces certain amendments to the accounting for employee pensions, including recogni-tion of defined benefit liability remeasurements in other comprehensive income and enhanced disclosure requirements for defined benefit pension plans. It also modifies accounting for termination benefits. The effec-tive date of this standard is 1 January 2013 with early adoption permitted. The Group does not intend to early adopt this standard. The impact of the adoption of this amendment on the financial position of the Group has been assessed for 2013, and based on the current dis-count rate of 4.23%, the Group will be recording unrec-ognised actuarial losses of EUR’000 899 926 in other comprehensive income (refer to Note J).
IFRS 9 Financial instruments
The first step in a three part project by the IASB to replace IAS 39 Financial instruments, this standard

162 Financial Report 2012
redefines the categories of financial assets and liabilities and their accounting treatment. The standard remains a ‘work in progress’ and it will eventually replace IAS39 in its entirety. The current effective date of the standard is 1 January 2015. IFRS 9 has not yet been endorsed by the European Union. The Group does not plan to adopt this standard early and the extent of the impact has not yet been determined.
The following four standards were issued in 2011, all with an effective date of 1 January 2013 with early adoption permitted. The impact of the adoption of these standards on the Group’s financial statements has not yet been determined.
IFRS 10 Consolidated financial statements
This standard establishes the principles for the presenta-tion and preparation of consolidated financial state-ments when an entity controls one or more other entities.
IFRS 11 Joint arrangements
This standard sets up a framework for determining the type of joint arrangements that an entity has with another entity.
IFRS 12 Disclosure of interests in other entities
The objective of this standard is to require the disclo-sure of information that enables users of financial state-ments to evaluate the nature of, and risks associated with, its interests in other entities and the effects of those interests on its financial position, financial perfor-mance and cash flows.
IFRS 13 Fair value measurement
This standard defines fair value, sets out a framework for measuring fair value and requires disclosures about fair value measurements.
A.4. Summary of significant accounting policies
A.4.1. Basis of consolidation
The Financial Statements comprise those of the Euro-pean Investment Bank and those of its subsidiary, the European Investment Fund. The financial statements of the Fund are prepared for the same reporting year as the Bank, using consistent accounting policies.
The Bank holds 62.13% (2011: 61.93%) of the subscribed capital of the EIF and therefore has applied the principles
pronounced by IAS 27 in preparing consolidated finan-cial statements. Hence, the Group consolidates the financial statements of the EIB and the EIF line by line by adding together like items of assets, liabilities, equity, income and expenses.
After aggregation of the balance sheets and income statements, all intra-group balances, transactions, income and expenses resulting from intra-group trans-actions are eliminated.
Non-controlling interest represents the portion of profit or loss and net assets not owned, directly or indirectly, by the Bank and is presented under “Interest expense and similar charges” in the consolidated income state-ment and under “Other liabilities” in the consolidated balance sheet (see Note A.4.22).
Assets held in an agency or fiduciary capacity are not assets of the Group. They are reported in Note V. The Group does not control any Special Purpose Entities.
A.4.2. Foreign currency translation
The Financial Statements are presented in euro (EUR), as the functional currency of the Bank and the unit of measure for the capital accounts of the Member States.
The Group conducts its operations in euro, in other cur-rencies of the Member States and in non-EU currencies. Its resources are derived from its capital, borrowings and accumulated earnings in various currencies.
Foreign currency transactions are translated at the exchange rate prevailing on the date of the transaction.
Monetary assets and liabilities denominated in curren-cies other than euro are translated into euro at the exchange rate prevailing at the balance sheet date. The gain or loss arising from such translation is recorded in the consolidated income statement.
Non-monetary items that are measured in terms of his-torical cost in a foreign currency are translated using the exchange rates at the dates of the initial transactions. Non-monetary items measured at fair value in a foreign currency are translated using the exchange rates at the date when the fair value was determined.
Exchange differences on non-monetary financial assets are a component of the change in their fair value. Depending on the classification of a non-monetary financial asset, exchange differences are either recog-nised in the income statement or within the equity reserves.
Exchange differences arising on the settlement of trans-actions at rates different from those at the date of the transaction and unrealised foreign exchange differ-ences on unsettled foreign currency monetary assets
1632012 Financial Report
EIB Group Consolidated Financial Statements under IFRS
and liabilities are recognised in the consolidated income statement.
A.4.3. Derivatives
All derivative instruments of the Group are measured at fair value through profit or loss and are reported as derivative assets or liabilities. Fair values are obtained from quoted market prices, discounted cash flow mod-els and option pricing models, which consider current market and contractual prices for the underlying instru-ment, as well as time value of money, yield curve and volatility of the underlying.
The Group uses derivative instruments mainly for hedg-ing market exposure on borrowings and lending trans-actions, and also as part of its asset and liability management activities to manage exposures to interest rate and foreign currency risk, including exposures aris-ing from forecast transactions. The Group applies the amended Fair Value Option of IAS 39 when balance sheet items together with one or more derivative trans-actions meet the eligibility criteria of the amended Fair Value Option and a significant reduction of the account-ing mismatch is thus obtained.
The Group currently does not use any of the hedge accounting possibilities available under IAS 39.
Derivatives are recorded at fair value and carried as assets when their fair value is positive and as liabilities when their fair value is negative. Changes in the fair value of derivatives are included in “Result on financial operations”.
The majority of the Group’s swaps are concluded with a view to hedging specific bond issues. The Group enters into currency swaps, whereby the proceeds of a borrowing are initially converted into a different cur-rency and on maturity the Bank will obtain the amounts needed to service the borrowing in the origi-nal currency.
Macro-hedging swaps used as part of asset/liability management are marked to market (fair value) using internal valuation models. Realised and unrealised gains and losses are recognised in “Result on financial opera-tions”. Accrued interest on derivatives is part of the fair value recorded.
A derivative may be embedded in a “host contract”. Such combinations are known as hybrid instruments and arise predominantly from the issuance of certain structured debt instruments. If the host contract is not carried at fair value with changes in fair value reported in the consolidated income statement, the embedded derivative is separated from the host contract and accounted for as a stand-alone derivative instrument at fair value if, and only if, the economic characteristics and risks of the embedded derivative are not closely
related to the economic characteristics and risks of the host contract and the embedded derivative actually meets the definition of a derivative.
A.4.4. Financial instruments
Derivative financial instruments are initially recognised using the trade date basis. Non-derivative financial instruments are initially recognised using the settle-ment date basis.
Financial instruments that are measured in the balance sheet at fair value require disclosure of fair value meas-urements by level of the following fair value measure-ment hierarchy:
• Level 1 – Quoted prices (unadjusted) in active mar-kets for identical assets or liabilities.
• Level 2 – Input other than quoted prices included within Level 1 that are observable for the asset or liability, either directly (i.e. as prices) or indirectly (i.e. derived from prices).
• Level 3 – Inputs for the asset or liability that are not based on observable market data (unobservable in-puts).
A.4.5. Cash and cash equivalents
The Group defines cash and cash equivalents as short term, highly liquid securities and interest-earning deposits with maturities of 90 days or less.
A.4.6. Fee income
The Group earns fee income from a diverse range of ser-vices it provides to its customers. Fee income can be divided into two broad categories:
• income earned from services that are provided over a certain period of time, for which customers are generally billed on an annual or semi-annual basis; and
• income earned from providing transaction-type services.
Fees earned from services that are provided over a cer-tain period of time are recognised on an accruals basis over the service period. Fees earned from providing transaction-type services are recognised when the ser-vice has been completed. Fees or components of fees that are performance linked are recognised when the performance criteria are fulfilled. Issuance fees and redemption premiums or discounts are amortised over the period to maturity of the related borrowings, unless those borrowings are measured at fair value, in which

164 Financial Report 2012
case the recognition in the consolidated income state-ment is immediate.
A.4.7. Securities lending
In April 2003, the Bank signed an agreement for securi-ties lending with Northern Trust Global Investment act-ing as an agent to lend securities from the Investment, B1 ‘Credit Spread’, B3 ‘Global Fixed Income’, B4 “Inflation Linked Investment” and the EIF operational portfolios. The agreement with Northern Trust Global Investment was terminated in November 2012.
Securities received as collateral under securities lending transactions were not recognised in the consolidated balance sheet unless control of the contractual rights that were comprised in these received securities was gained. Securities lent under securities lending transac-tions were not derecognised from the consolidated bal-ance sheet unless control of the contractual rights that were comprised in these transferred securities was relin-quished.
Fees and interest received or paid were recorded as interest income or interest expense on an accrual basis.
A.4.8. Treasury bills and other bills eligible for refinancing with central banks and debt securities including fixed-income securities and shares and other variable-yield securities
With a view to clarifying management of its liquid assets, the Group has established the following portfolio cate-gories:
A.4.8.1. Held for trading portfolio
The held for trading portfolio (see Operational portfo-lios B3 and B4 in Note B.2) comprises listed debt securities issued and guaranteed by financial institu-tions. The debt securities are owned by the Group. Securities held in this portfolio are marked to market in the consolidated balance sheet, any gain or loss arising from a change in fair value being included in the consolidated income statement in the period in which it arises.
Gains and losses realised on disposal or redemption and unrealised gains and losses from changes in the fair value of trading portfolio assets are reported as Net trading income in the account “Result on financial opera-tions”. Interest income on trading portfolio assets is included in “Interest and similar income”.
The determination of fair values of trading portfolio assets is based on quoted market prices in active mar-kets or dealer price quotations, pricing models (using
assumptions based on market and economic condi-tions), or management estimates, as applicable.
A.4.8.2. Held-to-maturity portfolio
The held-to-maturity portfolio comprises the Group’s investment portfolio, the operational money market portfolio A1 of the EIB and the Loan substitutes portfo-lio (see Note B.2).
The Group investment portfolio consists of securities purchased with the intention of holding them to matu-rity. These securities are issued or guaranteed by:
• Governments of the European Union Member States, G10 countries and their agencies; or
• Supranational public institutions, including multina-tional development banks.
These securities are initially recorded at fair value plus any directly attributable transaction costs. The differ-ence between entry price and redemption value is amortised in accordance with the effective interest method over the remaining life of the securities.
The Group has decided to phase out the investment portfolio, by ceasing to reinvest the redemption pro-ceeds of matured securities in the portfolio.
The Operational portfolio A1 of the Group is held for the purpose of maintaining an adequate level of liquidity in the Group and comprises money market products with a maximum maturity of three months, including treas-ury bills and negotiable debt securities issued by public bodies or credit institutions. The securities are held until their final maturity and presented in the Financial State-ments at their amortised cost.
The Loan substitutes portfolio mainly consists of obliga-tions in the form of bonds, notes or certificates issued by Special Purpose Vehicles (SPV) or trust vehicles. These securities are classified as held-to-maturity and recorded at amortised cost.
The Group assesses at each balance sheet date whether there is any objective evidence that a financial asset or a group of financial assets is impaired. A financial asset or a group of financial assets is deemed to be impaired if, and only if, there is objective evidence of impairment as a result of one or more events that has occurred after the initial recognition of the asset (an incurred “loss event”) and that loss event (or events) has an impact on the estimated future cash flows of the financial asset or the group of financial assets that can be reliably esti-mated. Impairment loss is recognised in profit and loss and the amount of the loss is measured as the differ-ence between the carrying value and the present value of estimated future cash flows discounted at the instru-ment’s original effective interest rate.

1652012 Financial Report
EIB Group Consolidated Financial Statements under IFRS
A.4.8.3. Available-for-sale portfolio
The available-for-sale portfolio comprises the securi-ties of the operational money market portfolio A2, of the operational bond portfolio B1 (see Note B.2) and of the operational portfolio of the Fund and shares and other variable-yield securities (see Note B.3). Securities are classified as available-for-sale where they do not appropriately belong to one of the other categories of financial instruments recognised under IAS 39, i.e.
“held for trading” or “held-to-maturity”. The Manage-ment Committee determines the appropriate classifi-cation of its investments at the time of the constitution of a portfolio. Financial instruments within one portfo-lio always have the same classification. Available-for-sale financial investments may be sold in response to or in anticipation of needs for liquidity or changes in interest rates, credit quality, foreign exchange rates or equity prices.
Available-for-sale financial investments are carried at fair value. They are initially recorded at fair value plus transaction costs. Unrealised gains or losses, excluding foreign currency translation gains and losses, are reported in comprehensive income and accumulated in the fair value reserve until such investment is sold, col-lected or otherwise disposed of, or until such invest-ment is determined to be impaired. Foreign currency translation gains and losses are reported in the consoli-dated income statement. If an available-for-sale invest-ment is determined to be impaired, the cumulative unrealised gain or loss previously recognised in the fair value reserve is included in consolidated income state-ment for the period. A financial investment is consid-ered impaired if its carrying value exceeds the recoverable amount. Quoted financial investments are considered impaired if the decline in market price below cost is of such a magnitude that recovery of the cost value cannot be reasonably expected within the foreseeable future. For non-quoted equity invest-ments, the recoverable amount is determined by apply-ing recognised valuation techniques.
Financial assets are derecognised when the right to receive cash flows from the financial assets has expired or where the Group has transferred substantially all risks and rewards of ownership. On disposal of an available-for-sale investment, the accumulated unrealised gain or loss included in the fair value reserve is transferred to consolidated income statement for the period. Gains and losses on disposal are determined using the weighted average cost method. Interest and dividend income on available-for-sale financial investments are included in “Interest and similar income” and “Income from shares and other variable-yield securities”. Interest on available-for-sale debt securities and other fixed income securities is recognised in the income statement using the effective interest method. Dividends on equity investments are recognised in the income state-ment when the Group’s right to receive payment is established.
The determination of fair values of available-for-sale financial investments is based on quoted market rates in active markets, dealer price quotations, discounted expected cash flows using market rates that commen-surate with the credit quality and maturity of the invest-ment or based upon review of the investee’s financial results, condition and prospects including comparisons to similar companies for which quoted market prices are available.
Venture capital operations held represent medium and long term investments. They are measured at fair value, which is determined by applying the aggre-gated Net Asset Value (NAV) method. This valuation method implicitly assumes that if the NAVs of under-lying funds can be considered as equivalent to the fair value as determined under IAS 39, then the aggrega-tion of the NAVs of all funds will itself be equivalent to the fair value as determined under IAS 39. For specific investments where NAV cannot readily be determined, other guidelines (for example the international pri-vate equity and venture capital valuation guidelines, IPEV Guidelines, as published by the EVCA) might be used and more detailed monitoring and review will be required. In accordance with this method, the ven-ture capital funds are internally classified into three categories:
• Category I – funds that have adopted the fair value requirements of IAS 39 or IPEV Guidelines for which a specific review is performed to ensure that the NAV is a reliable estimate of fair value.
• Category II – funds that have adopted other valua-tion guidelines (such as the former 2001 EVCA) or standards that can be considered as in line with IAS 39, for which a specific review is performed to ensure that the NAV is a reliable estimate of fair val-ue.
• Category III – funds that have not adopted the fair value requirements of IAS 39 or any other valuation guidelines in line with IAS 39.
The Group assesses at each balance sheet date whether there is any objective evidence that a finan-cial asset or a group of financial assets is impaired. A financial asset or a group of financial assets is deemed to be impaired if, and only if, there is objec-tive evidence of impairment as a result of one or more events that have occurred after the initial recognition of the asset (an incurred “loss event”) and that loss event (or events) has an impact on the estimated future cash flows of the financial asset or the group of financial assets that can be reliably estimated.
In the case of equity investments classified as availa-ble-for-sale, this would include a significant or pro-longed decline in the fair value of the investments below its cost. Where there is evidence of impairment, the cumulative loss measured as the difference

166 Financial Report 2012
between the acquisition cost and the current fair value, less any impairment loss on that financial asset previ-ously recognised in the consolidated income state-ment, is removed from equity and recognised in the income statement. Impairment losses on equity invest-ments are not reversed through the consolidated income statement; increases in their fair value after impairment are recognised directly in equity. In con-trast, if in a subsequent period, the fair value of a debt instrument classified as available-for-sale increases and the increase can be objectively related to an event occurring after the impairment loss was recognised, the impairment loss is reversed through the income statement.
The Group complies with conditions to use the private equity and similar entities exemption in IAS 28 and IAS 31 and does not use equity accounting on, or propor-tionately consolidate investments in joint ventures, if any. Upon initial recognition, any holdings in joint ven-tures or associates are designated at fair value through profit or loss, and measured subsequently at fair value in accordance with IAS 39, with changes in fair value recognised in profit or loss during the period of the change.
Joint ventures are contractual agreements whereby the Group and other parties undertake an economic activity that is subject to joint control. A joint control is the contractually agreed sharing of control over an economic activity, and exists only when the strategic financial and operating decisions relating to the activ-ity require the unanimous consent of the parties shar-ing the control (the venturers). The participations acquired by the Group for its own account or on behalf of its mandate providers typically represent investments in private equity or venture capital funds. According to industry practice, such investments are generally investments jointly subscribed by a number of investors, none of whom is in a position to individu-ally influence the daily operations and the investment activity of such fund. As a consequence, any member-ship by an investor in a governing body of such fund does not in principle entitle such investor to influence the day-to-day operations of the fund. In addition, individual investors in a private equity or a venture capital fund do not determine policies of a fund such as distribution policies on dividends or other distribu-tions. Such decisions are typically taken by the man-agement of a fund on the basis of the shareholders agreement governing the rights and obligations of the management and all shareholders of the fund. The shareholders’ agreement also generally prevents individual investors from bilaterally executing mate-rial transactions with the fund, interchanging mana-gerial personnel or obtaining privileged access to essential technical information. The Group’s invest-ments, made for its own account or on behalf of its mandate providers, are executed in line with the above stated industry practice, ensuring that the Group neither controls nor exercises any form of
significant influence within the meaning of IAS 27 and IAS 28 over any of these investments, including those investments in which the Group holds over 20 % of the voting rights either on its own account or on behalf of any of its mandates.
A.4.9. Loans and advances to credit institutions and customers
Loans and advances to credit institutions and custom-ers (or “Loans and receivables”) include loans where money is provided directly to the borrower.
Loans and receivables are recognised when cash is advanced to borrowers. They are initially recorded at cost (their net disbursed amounts), which is the fair value of the cash given to originate the loan, including any transaction costs, and are subsequently measured at amortised cost using the effective interest rate method. Undisbursed parts of loans are recorded in the memorandum items at their nominal value.
Where loans meet the eligibility criteria of the amended Fair Value Option and have been designated on initial recognition as at fair value through profit or loss, they are measured at their fair value. The fair value measurement technique used is based on a dis-counted cash flow technique. Loans designated at fair value are recorded at fair value in the balance sheet. Changes in fair value are recorded in “Result on finan-cial operations”.
A.4.9.1. Interest on loans
Interest on loans originated by the Group is recorded in the consolidated income statement under “Interest and similar income” using the effective interest rate method and on the consolidated balance sheet under “Loans and advances”.
A.4.9.2. Reverse repurchase operations (reverse repos)
A reverse repurchase operation is one under which the Group lends liquid funds to a credit institution which provides collateral in the form of securities. The two parties enter into an irrevocable commitment to com-plete the operation on a date and at a price fixed at the outset.
The operation is based on the principle of delivery against payment: the borrower of the liquid funds trans-fers the securities to the Group’s custodian in exchange for settlement at the agreed price, which generates a return for the Group linked to the money market.
This type of operation is considered for the purposes of the Group to be a loan at a guaranteed rate of interest. Generally treated as collateralised financing transactions,

1672012 Financial Report
EIB Group Consolidated Financial Statements under IFRS
they are carried at the amounts of cash advanced or received, plus accrued interest. Reverse repos are entered on the assets side of the consolidated balance sheet under “Loans and advances to credit institutions - b) other loans and advances”.
Securities received under reverse repurchase agree-ments are not recognised in the consolidated balance sheet, unless control of the contractual rights com-prised in these securities is assumed. The Group moni-tors the market value of the securities received on a daily basis and requests additional collateral in accord-ance with the underlying agreements.
Interest earned on reverse repurchase agreements is recognised as interest income over the life of each agreement.
A.4.9.3. Fees on loans
Front-end fees and commitment fees are deferred, together with the related direct costs of originating and maintaining the commitment, and are recognised as an adjustment to the effective yield, being recorded in the consolidated income statement over the period from disbursement to repayment of the related loan. If the commitment expires without the loan being drawn down, the fee is recognised as income on expiry.
A.4.9.4. Interest subsidies
Interest subsidies received in advance (see Note F) are deferred in accordance with IAS 18, and are rec-ognised as an adjustment to the effective yield, being recorded in the consolidated income statement over the period from disbursement to repayment of the subsidised loan.
A.4.10. Impairment on loans and advances and provisions on guarantees
Impairment on loans and advances or provisions on commitments are recorded if there is objective evi-dence that the Group will be unable to collect all amounts due on a claim according to the original con-tractual terms or an equivalent value. A “claim” means a loan, a commitment such as a letter of credit, a guar-antee, a commitment to extend credit, or other credit product.
Impairment is reported as a reduction of the carrying amount of a claim on the consolidated balance sheet, whereas for an off-balance sheet item such as a com-mitment a provision for credit loss is reported in “Provi-sions”. Additional impairment or provisions for credit losses are made through “Change in impairment on loans and advances and provisions on guarantees, net of reversals”.
A.4.10.1. Impairment allowances related to individual loans and advances
Impairment losses have been made for individual loans and advances outstanding at the end of the financial year where objective evidence exists of risks of non-recovery of all or part of the amounts outstanding according to the original contractual terms or the equiv-alent value. Changes to these provisions are recorded in the consolidated income statement as “Change in impairment on loans and advances and provisions on guarantees, net of reversals”. Allowances and provisions for credit losses are evaluated on the following counter-party-specific principles.
A claim is considered impaired when the Bank deter-mines that it is probable that the Group will not be able to collect all amounts due according to the origi-nal contractual terms or an equivalent value. Individ-ual credit exposures are evaluated based upon the borrower’s character, overall financial condition, resources and payment record, the prospects for sup-port from any financially responsible guarantors and, where applicable, the realisable value of any collat-eral. The estimated recoverable amount is the present value of expected future cash flows, which may result from restructuring or liquidation. Impairment is measured and allowances for credit losses are estab-lished for the difference between the carrying amount and the estimated recoverable amount of any claim considered as impaired. The amount of the loss is the difference between the asset’s carrying amount and the present value of expected future cash flows discounted at the financial instrument’s original effective interest rate.
All impaired claims are reviewed and analysed at least semi-annually. Any subsequent changes to the amounts and timing of the expected future cash flows compared to the prior estimates will result in a change in the pro-vision for credit losses and be charged or credited to credit loss expense. An allowance for impairment is reversed only when the credit quality has improved such that there is reasonable assurance of timely collec-tion of principal and interest in accordance with the original contractual terms of the claim agreement. A write-off is made when all or part of a claim is deemed uncollectible or forgiven. Write-offs are charged against previously established provisions for credit losses or directly to credit loss expense and reduce the principal amount of a claim. Recoveries in part or in full of amounts previously written off are credited to credit loss expense.
For non-performing loans, upon impairment the accrual of interest income based on the original terms of the claim is discontinued, and is replaced by an accrual based upon the impaired value, using the original effec-tive interest rate; in addition, the increase of the present value of impaired claims due to the passage of time is reported as interest income.

168 Financial Report 2012
A.4.10.2. Guarantees
In the normal course of business, the Group issues vari-ous forms of guarantees.
Under the existing rules, these guarantees do not meet the definition of an insurance contract (IFRS 4 Insurance Contracts) and are accounted for under IAS 39 Financial Instruments: Recognition and Measurement, either as
“Derivatives” or as “Financial Guarantees”, depending on their features and characteristics as defined by IAS 39.
The accounting policy for Derivatives is disclosed under Note A.4.3.
When a guarantee operation measured under IAS 39 is derecognised and treated under IAS 37, its value previ-ously recorded under Financial guarantees is trans-ferred to the caption “Provisions for guarantees” on the balance sheet.
Financial guarantees are initially recognised at fair value, being the premium received, in the consolidated bal-ance sheet under “Other liabilities”.
Subsequent to initial recognition, the Group’s liabilities under each financial guarantee are measured at the higher of 1) the amount initially recognised less, when appropriate, cumulative amortisation recognised in accordance with IAS 18 and 2) the best estimate of expenditure required to settle any present financial obligation arising as a result of the guarantee in accord-ance with IAS 37.
Any increase in the liability relating to financial guaran-tee is taken to the consolidated income statement in
“Change in impairment on loans and advances and provi-sions for guarantees, net of reversals”. The premium received is recognised in the consolidated income state-ment in “Fee and commission income” on the basis of an amortisation schedule in accordance with IAS 18 over the life of the financial guarantee.
A.4.11. Property, furniture and equipment
Property, furniture and equipment include land, Group-occupied properties and other machines and equipment.
Property, furniture and equipment are reviewed period-ically for impairment.
Land is stated at acquisition cost and buildings are stated at acquisition cost less accumulated depreciation. The value of the Group’s headquarters building in Lux-embourg-Kirchberg and its buildings in Luxembourg-Hamm and Luxembourg-Weimershof are depreciated on a straight-line basis as set out below.
Permanent equipment, fixtures and fittings, furniture, office equipment and vehicles are recorded in the
consolidated balance sheet at their acquisition cost, less accumulated depreciation.
Depreciation is calculated on a straight-line basis over the estimated life of each item purchased, as set out below:
• Buildings in Kirchberg, Hamm and Weimershof: 30 years
• Permanent equipment, fixtures and fittings: 10 years
• Furniture: 5 years
• Office equipment and vehicles: 3 years
A.4.12. Investment property
Investment property is property held to earn rentals or for capital appreciation or both. Investment property is stated at cost less accumulated depreciation and impairment losses and is reviewed for signs of impair-ment at the balance sheet date.
Depreciation is calculated on a straight-line basis using the same estimated useful lives as property, furniture and equipment.
A.4.13. Intangible assets
Intangible assets comprise internally developed com-puter software. Software development costs are capital-ised if they meet certain criteria relating to identifiability, to the probability that future economic benefits will flow to the enterprise, and to the reliability of cost measurement.
Intangible assets are recognised as assets and are amor-tised on a straight-line basis over their estimated useful economic lives. At each consolidated balance sheet date, intangible assets are reviewed for indications of impairment or changes in estimated future benefits. If such indications exist, an analysis is performed to assess whether the carrying amounts are fully recovera-ble. A write-down is made if the carrying amount exceeds the recoverable amount.
Internally developed software meeting these criteria is carried at cost less accumulated amortisation calcu-lated on a straight-line basis over three years from completion.
A.4.14. Pension plans and health insurance scheme
The Group operates defined benefit pension plans to provide retirement benefits to its entire staff. The Group also provides certain additional post-employment healthcare benefits to former employees of the EIB. These benefits are unfunded, as defined by IAS 19.

1692012 Financial Report
EIB Group Consolidated Financial Statements under IFRS
The cost of providing benefits under the plans is deter-mined separately for each plan using the projected unit credit actuarial valuation method. The charge to the consolidated income statement in respect of the defined benefit pension plan is based on the current service cost and other actuarial adjustments as deter-mined by qualified external actuaries.
A.4.14.1. Pension plan for staff
The Bank’s main pension plan is a defined benefit pen-sion plan funded by contributions from staff and from the Bank, covering all Bank employees.
Commitments for retirement benefits are valued at least every year using the projected unit credit method, in order to ensure that the liability entered in the accounts is adequate. The latest valuation was performed as at 30 September 2012, with an extrapolation to 31 Decem-ber 2012. The main actuarial assumptions used by the actuary are set out in Note J.
Cumulative actuarial surpluses and deficits in excess of 10% of the obligations of the plan (“the corridor”) are recognised in the income statement over the expected average remaining service lives of the plan active participants, on a straight-line basis. Interest cost on the defined benefit obligation is recognised in the income statement under “Interest expense and similar charges”.
The main pension plan of the EIF is a defined benefit plan funded by contributions from staff and from the EIF, covering all EIF employees. The scheme entered into force in March 2003, replacing the previous defined contribution scheme.
A.4.14.2. Health insurance plan
The Bank has set up its own health insurance plan for the benefit of staff, financed by contributions from the Bank and its employees. The plan is an unfunded plan treated as a defined benefit plan. A specific pro-vision is set aside on the liability side of the consoli-dated balance sheet for staff at retirement age. The Fund has subscribed to a health insurance scheme with an insurance company for the benefit of staff at retirement age, financed by contribution from the Fund and its employees.
The entitlement to these benefits is based on the employees remaining in service up to retirement age and the completion of a minimum service period. The expected costs of these benefits are accrued over the period of employment, using a methodology sim-ilar to that for defined benefit pension plans. The health insurance liabilities are determined based on actuarial calculations as per the same dates as the pension plans.
A.4.14.3. Pension plan for members of the Management Committee
The related provision shown on the liability side of the Group’s balance sheet is determined, as for all plans, in conformity with IAS 19. Benefits are based on years of service and a percentage of final gross base salary as defined under the plan. The Pension plan for members of the Management Committee is managed and accounted for under the same principles as the pension plan for staff (Note A.4.14.1).
A.4.14.4. Optional Supplementary provident scheme
The optional supplementary provident scheme is a defined contribution pension scheme, funded by volun-tary staff contributions and employer contributions. It is accounted for on the basis of the contributions from staff and employer and the corresponding liability is recorded in “Other liabilities”.
A.4.15. Amounts owed to credit institutions and customers
Amounts owed to credit institutions and customers are initially recorded at cost and are presented in the finan-cial statements at amortised cost. Interest on amounts owed to credit institutions and customers is recorded in the income statement as Interest expense and similar charges using the effective interest method.
A.4.16. Debts evidenced by certificates
Debts evidenced by certificates are initially meas-ured at cost, which is the fair value of the considera-tion received. Transaction costs and net premiums (discounts) are included in the initial measurement. Subsequent measurement is at amortised cost, and any difference between net proceeds and the redemption value is recognised in the consolidated income statement over the period of the borrow-ings using the effective interest method. Where bor-rowings meet the eligibility criteria of the amended Fair Value Option and have been designated on ini-tial recognition as at fair value through profit or loss, they are measured at their fair value and are recorded in the balance sheet at fair value. Changes in fair value are recorded in “Result on financial oper-ations”. The fair value measurement technique used, in the case of absence of liquid market prices, is a discounted cash flow technique, using current yield curves.
Combined debt instruments that are related to foreign exchange rates or indices are considered structured instruments. For all the debt instruments including embedded derivatives, the Group has concluded a swap agreement to fully hedge the exposure.

170 Financial Report 2012
It is the Group policy to hedge the fixed interest rate risk on debt issues and to apply the amended Fair Value Option when this results in a significant reduction of an accounting mismatch. The effect is such that the carry-ing value of the thus elected debt instruments is adjusted for changes in fair value rather than carried and accrued at cost (see Note Q – Derivative financial instruments).
Interest expense on debt instruments is included in the account “Interest expense and similar charges” in the con-solidated income statement and in the liabilities cap-tion including the underlying debt instruments in the consolidated balance sheet.
A.4.17. Prepayments – Deferred income
These accounts comprise:
• Prepayments: expenditure incurred during the financial year but relating to a subsequent financial year.
• Deferred income: income received before the bal-ance sheet date but relating to a subsequent finan-cial year.
A.4.18. Reserves
A.4.18.1. Reserve fund
As foreseen by Article 22.1 of the Statute, “a reserve fund of up to 10% of the subscribed capital shall be built up progressively” from the retained profit of the Bank.
A.4.18.2. Additional reserves
Additional reserves contain the remaining retained earnings of the Group.
A.4.18.3. Fair value reserve
The fair value reserve includes the change in fair value of available for sale financial assets (other than impair-ments).
A.4.18.4. Special activities reserve
As foreseen by Article 16.5 of the Statute, “the special activities of the Bank will have a specific allocation of reserve”. The reserve will be based on the capital alloca-tion of each operation.
A.4.18.5. General loan reserve
In 2009 a “general loan reserve” was introduced for the expected loss of the Bank’s loan and guarantees portfo-lio, modelled upon the Group’s policy guidelines.
A.4.19. Taxation
The Protocol on the privileges and Immunities of the European Union appended to the treaty on European Union and the treaty on the functioning of the Euro-pean Union, stipulates that the assets, revenues, and other property of the Institutions of the Union are exempt from all direct taxes.
A.4.20. Interest income and expense
Interest income and interest expense are recognised in the income statement for all interest bearing instru-ments on an accruals basis using the effective interest method based on the actual purchase price including direct transaction costs. This is a method of calculating the amortised cost of a financial asset and allocating the interest income over the relevant period. The effective interest rate is the rate that exactly discounts estimated future cash receipts through the expected life of the financial instrument to the net carrying amount of the financial asset.
In addition to interest and commission on loans, depos-its and other revenue from the securities portfolio, this heading includes the indemnities received by the Group in respect of early loan reimbursement payments made by its borrowers.
In accordance with the provisions of IAS 39 – Financial Instruments: Recognition and Measurement - the Group records the indemnities received for early repayment of loans immediately in the consolidated income state-ment at the time of derecognition of the related loans.
In accordance with IAS 32 – Financial Instruments: Presentation, as a result of the replacement share pur-chase undertaking (Note A.4.22), non-controlling interests are presented under “Interest expense and similar charges”, in conformity with the anticipated acquisition method.
A.4.21. Dividend income
Dividends are recognised in the income statement when the entity’s right to receive payment is estab-lished.
A.4.22. Commitment to purchase EIF shares
Under the terms of a replacement share purchase undertaking in respect of the 1 136 shares held by EIF’s non-controlling shareholders (2011: 1 142 shares), the EIB is offering to buy these on an annual basis. The exercise price is determined on the basis of the audited annual accounts of EIF and corresponds to the part of each share in the called capital of EIF, increased by the share premium account, the

1712012 Financial Report
EIB Group Consolidated Financial Statements under IFRS
statutory reserves, the fair value reserve, the retained earnings and profit of the year, net of the dividend decided by the EIF’s General Meeting. The commit-ment to purchase is shown in the consolidated bal-ance sheet as a debt item under “Other liabilities” (see also Note G).
IAS 27 requires that the acquisition of non-controlling interest be accounted for as an equity transaction. The carrying amounts of the controlling and non-control-ling interests are adjusted to reflect the change in their relative interests in EIF net assets. Any difference between the amount by which the non-controlling interest is adjusted and the fair value of the financial liability is recognised directly in equity under “Changes in ownership interests in subsidiaries that do not result in a loss of control” and attributed to owners of the par-ent. Any changes in fair value of the financial liability subsequent to the acquisition date are recognised in
the income statement under “Interest expense and simi-lar charges”.
A.4.23. Reclassification of prior year figures
Certain prior year figures have been reclassified to con-form with the current year’s presentation. The reclassifi-cations principally relate to:
• Redemption premiums on swaps payable: - From: Debts evidenced by certificates a) debt securi-
ties in issue and b) others - To: Amounts owed to credit institutions b) with
agreed maturity dates or periods of notice
• Prepaid management fees: - From: Other liabilities - To: Deferred income
Note B – Cash in hand, balances with central banks and post office banks, debt securities portfolio and shares and other variable-yield securities (in EUR ’000)
B.1. Cash in hand, balances with central banks and post office banks
The cash in hand and balances with central banks and post office banks equal to EUR ’000 157 362 at 31 December 2012 (2011: EUR ‘000 427 463).
EIB is an eligible counterparty in the Eurosystem’s monetary policy operations, and therefore has been given access to the monetary policy operations of the European Central Bank. The Bank conducts the operations via the Central Bank of Luxembourg, where the Bank maintains a deposit to cover the minimum reserve requirement. The balance of this deposit amounts to EUR ‘000 157 258 as at 31 December 2012 (2011: EUR ‘000 395 911).
B.2. Debt securities portfolio
The debt securities portfolio is composed of trading financial assets (portfolios B3 and B4), available-for-sale financial assets (portfolios A2, B1 and operational portfolio EIF), financial assets held-to-maturity (portfolio A1, Group investment portfolio and the Loan substitutes, which represent acquisitions of interests in pools of loans or receivables in connec-tion with securitisation transactions). The detail of each portfolio as at 31 December 2012 and 2011 is as follows:
31.12.2012 31.12.2011
Treasury bills and other bills eligible for refinancing with central banks 18 416 931 14 905 225
Debt securities including fixed-income securities 9 343 999 10 394 432
Total debt securities (*) 27 760 930 25 299 657 (*) of which EUR ‘000 9 314 376 unlisted at 31 December 2012 (2011: EUR ‘000 9 792 669).

172 Financial Report 2012
At 31.12.2012 Classification Book value Fair value (1)
Group investment portfolio Held-to-maturity 1 219 007 1 341 189
Operational money market portfolios:
- A1 money market securities with a max. 3 month maturity Held-to-maturity 9 432 346 9 433 189
- A2 money market securities with a max. 18 month maturity Available for sale 1 524 056 (2) 1 524 056
Operational bond portfolios:
- B1 – Credit Spread Available for sale 630 458 (3) 630 458
- B3 – Global Fixed Income Trading 568 514 568 514
- B4 – Inflation Linked Investment Trading 896 200 896 200
Operational portfolio – EIF Available for sale 752 504 (4) 752 504
Loan substitutes portfolio (Note D) Held-to-maturity 12 737 845 11 454 755
27 760 930 26 600 865
(1) Fair value including accrued interest
(2) Including unrealised gain of EUR ’000 3 720
(3) Including unrealised gain of EUR ’000 10 816(4) Including unrealised gain of EUR ’000 16 743
At 31.12.2011 Classification Book value Fair value (1)
Group investment portfolio Held-to-maturity 1 415 029 1 348 058
Operational money market portfolios:
- A1 money market securities with a max. 3 month maturity Held-to-maturity 6 643 873 6 648 482
- A2 money market securities with a max. 18 month maturity Available for sale 2 234 927 (2) 2 234 927
Operational bond portfolios:
- B1 – Credit Spread Available for sale 694 269 (3) 694 267
- B3 – Global Fixed Income Trading 638 514 638 514
- B4 – Inflation Linked Investment Trading 1 048 702 1 048 702
Operational portfolio – EIF Available for sale 577 149 (4) 577 149
Loan substitutes portfolio (Note D) Held-to-maturity 12 047 194 10 410 029
25 299 657 23 600 128
(1) Fair value including accrued interest (2) Including unrealised gain of EUR ’000 959 (3) Including unrealised loss of EUR ’000 -52 956 (4) Including unrealised loss of EUR ’000 -78 459
The Loan substitutes portfolio is considered as part of the aggregate loans (Note D). Some of these transactions have been structured by adding credit or project related remedies, thus offering additional recourse. Per detailed review no impairment has occurred on any asset in this portfolio and hence no impairment has been accounted for as at 31 December 2012 and 2011.
The Group’s securities lending agreement with Northern Trust Global Investment was terminated in November 2012. The nominal value of securities lending activity amounted to EUR ‘000 778 872 at 31 December 2011.

1732012 Financial Report
EIB Group Consolidated Financial Statements under IFRS
EU sovereign exposure
The Group did not record impairment in respect of its held to maturity and available for sale EU sovereign and sovereign guaranteed exposure as at the year end as the preferred creditor status of the Bank as well as of the EIF and the protec-tion given by the Bank’s Statute are deemed to guarantee a full recovery of the Group’s assets on maturity.
The following tables show the exposure to debt issued or guaranteed by EU sovereigns in the Group’s debt securities portfolios as at 31 December 2012 and 2011:
At 31.12.2012 Book value Fair value (1)
EU sovereignsAustria 132 031 135 954 Belgium 839 496 848 704 Czech Republic 771 749 884 598 Denmark 10 623 10 622 Finland 53 909 53 910 France 827 531 848 732 Germany 581 122 640 689 Greece 199 833 196 114 Hungary 18 823 18 225 Ireland 64 739 64 837 Italy 4 815 120 4 820 049 Luxembourg 62 369 62 369 Netherlands 80 891 93 281 Poland 68 957 74 153 Portugal 75 312 75 273 Slovakia 50 268 50 998 Slovenia 10 122 10 122 Spain 913 526 915 498
9 576 421 9 804 128 Non-EU sovereign and other bonds 18 184 509 16 796 737
Total 27 760 930 26 600 865
(1) Fair value including accrued interest
In 2011, the Bank and the EIF did not participate in any private sector initiative for Greece and therefore no impairment was recorded on their Greek sovereign or sovereign guaranteed exposure.
At 31.12.2011 Book value Fair value (1)
EU sovereignsAustria 253 031 256 994 Belgium 106 620 111 506 Czech Republic 612 282 632 177 Denmark 10 702 10 702 France 714 122 728 160 Germany 700 062 749 505 Greece 208 201 93 326 Hungary 18 710 14 282 Ireland 198 394 198 054 Italy 2 692 619 2 674 825 Luxembourg 37 085 37 085 Netherlands 132 517 142 917 Poland 69 077 68 243 Portugal 88 371 76 981 Slovakia 9 550 9 332 Slovenia 4 229 4 229 Spain 2 986 864 2 993 362
8 842 436 8 801 680 Non-EU sovereign and other bonds 16 457 221 14 798 448
Total 25 299 657 23 600 128
(1) Fair value including accrued interest

174 Financial Report 2012
B.3. Shares and other variable-yield securities
The balance comprises:
Venture capital operations
EBRD shares Investment funds Total
Cost:
At 1 January 2012 2 225 908 157 500 421 945 2 805 353
Net additions 252 148 0 97 183 349 331
At 31 December 2012 2 478 056 157 500 (1) 519 128 3 154 684
Unrealised gains/losses
At 1 January 2012 478 309 205 219 38 939 722 467
Unrealised gains 145 786 35 969 20 144 201 899
Unrealised losses -6 783 0 -649 -7 432
At 31 December 2012 617 312 241 188 58 434 916 934
Impairment
At 1 January 2012 -902 415 0 -9 259 -911 674
Net additions -30 512 0 -747 -31 259
At 31 December 2012 -932 927 0 -10 006 -942 933
Net book value:
At 31 December 2012 2 162 441 398 688 567 556 3 128 685
At 31 December 2011 1 801 802 362 719 451 625 2 616 146
(1) The amount of EUR ‘000 157 500 (2011: EUR ‘000 157 500) corresponds to the capital paid in by the Group as at 31 December 2012 with respect to its subscription of EUR ‘000 900 440 to the capital of the European Bank for Reconstruction and Development (‘EBRD’). The Group holds 3.04% of the sub-scribed capital of the EBRD (2011: 3.17%).
Note C – Loans and advances to credit institutions – other loans and advances (in EUR ’000)
The Group enters into collateralised reverse repurchase and repurchase agreement transactions that may result in credit exposure in the event that the counterparty to the transaction is unable to fulfil its contractual obligations. The Group controls credit risk associated with these activities by monitoring counterparty credit exposure and collateral values on a daily basis and requiring additional collateral to be deposited with the Group when deemed necessary.
31.12.2012 31.12.2011
Term deposits 9 158 410 13 985 518
Overnight deposits 406 772 250 139
Tripartite reverse repos(*) 40 721 562 25 414 291
50 286 744 39 649 948
of which cash and cash equivalents 50 006 053 39 417 753
(*) These operations are carried out with a third-party custodian who undertakes, on the basis of a framework contract, to guarantee compliance with the contractual terms and conditions, notably with respect to:
- delivery against payment; - verification of collateral; - the collateral margin required by the lender which must always be available and adequate, with the market value of the securities being verified daily
by the said custodian; and - organisation of substitute collateral provided that this meets all the contractual requirements.

1752012 Financial Report
EIB Group Consolidated Financial Statements under IFRS
Note D – Summary statement of loans (in EUR ’000)
D.1. Aggregate loans granted
Aggregate loans granted comprise both the disbursed and undisbursed portions of loans. The analysis is as follows:
To intermediary credit institutions
Directly to final beneficiaries
Total 2012 Total 2011
Disbursed portion (book value) 125 872 793 293 404 173 419 276 966 392 852 646
Undisbursed loans (nominal value) 19 786 999 62 129 484 81 916 483 85 806 923
Aggregate loans granted 145 659 792 355 533 657 501 193 449 478 659 569
Loan substitutes portfolio (Note B.2) 12 737 845 12 047 194
Aggregate loans including loan substitutes portfolio 513 931 294 490 706 763
D.2. Impairment on loans and advances, net of reversals
Specific impairment is created when there is an objective evidence of impairment. The amount of such provisioning reflects the difference between the loan’s nominal value and the present value of all the expected future cash flows generated by the impaired asset.
Movements in the specific impairment are detailed below:
2012 2011
Provision at 1 January 192 790 91 608
Release during the year -16 826 -60 705
Use during the year -34 588 0
Allowance during the year 199 593 161 887
Foreign exchange adjustment 580 0
At 31 December 341 549 192 790
In 2012, an amount of EUR ‘000 4 500 was paid by the European Commission to the Bank in the context of a Risk Sharing operation which had been provided. This amount has been accounted for in the income statement as Change in impair-ment on loans and advances and provisions for guarantees, net of reversals.
The accrued interest on impaired loans as at 31 December 2012 amounts to EUR ‘000 9 216 (2011: EUR ‘000 1 485). The financial collateral held for impaired loans is disclosed in Note S.2.3.4.

176 Financial Report 2012
D.3. Geographical breakdown of lending by country in which projects are located
Loans for projects within the European Union:
Countries and territories in which projects are located
Number of loans
Aggregate loans granted(*)
Disbursed portion(*)
Undisbursed portion
% of total 2012 % of total 2011
Spain 737 75 069 313 71 873 109 3 196 204 15.16% 14.95%
Italy 614 61 465 203 51 641 709 9 823 494 12.41% 12.45%
Germany 636 57 919 557 51 598 993 6 320 564 11.69% 12.30%
France 445 44 390 922 37 492 207 6 898 715 8.96% 9.03%
United Kingdom 265 33 630 470 28 673 391 4 957 079 6.79% 6.85%
Poland 241 30 292 729 22 749 769 7 542 960 6.12% 5.53%
Portugal 295 22 873 209 20 261 700 2 611 509 4.61% 5.15%
Greece 147 16 692 532 15 122 585 1 569 947 3.36% 3.49%
Hungary 140 12 226 945 9 900 069 2 326 876 2.47% 2.37%
Austria 202 11 716 602 10 366 970 1 349 632 2.37% 2.37%
Czech Republic 131 10 595 358 9 473 541 1 121 817 2.14% 2.10%
Belgium 116 9 805 251 8 324 881 1 480 370 1.98% 2.00%
Netherlands 76 8 773 321 7 173 621 1 599 700 1.77% 1.65%
Sweden 71 7 916 773 6 013 848 1 902 925 1.60% 1.62%
Romania 84 7 195 170 4 491 525 2 703 645 1.45% 1.50%
Finland 119 7 084 860 5 730 820 1 354 040 1.43% 1.60%
Ireland 58 4 972 384 4 389 123 583 261 1.00% 0.96%
Slovenia 63 3 811 849 2 349 477 1 462 372 0.77% 0.69%
Slovakia 52 2 808 786 2 314 566 494 220 0.57% 0.56%
Bulgaria 44 2 442 843 1 448 747 994 096 0.49% 0.52%
Cyprus 30 2 176 363 1 620 063 556 300 0.44% 0.38%
Denmark 41 2 149 595 1 950 395 199 200 0.43% 0.46%
Latvia 25 1 612 899 853 019 759 880 0.33% 0.33%
Estonia 20 1 326 643 998 183 328 460 0.27% 0.26%
Lithuania 16 1 268 104 1 266 544 1 560 0.26% 0.27%
Luxembourg 20 810 200 573 200 237 000 0.16% 0.14%
Malta 7 336 983 276 983 60 000 0.07% 0.06%
Sub-total (nominal value) 4 695 441 364 864 378 929 038 62 435 826 89.10% 89.59%
Loans for projects outside the European Union:
Countries and territories in which projects are located
Number of loans
Aggregate loans granted(*)
Disbursed portion(*)
Undisbursed portion
% of total 2012 % of total 2011
Candidate Countries 311 24 039 233 17 555 153 6 484 080 4.85% 3.75%
Mediterranean Countries 225 14 168 105 8 869 376 5 298 729 2.86% 2.75%
Balkans 48 1 683 933 964 803 719 130 0.34% 1.11%
Central and Latin America 45 3 345 198 2 113 937 1 231 261 0.68% 0.72%
Asia 39 3 325 361 1 553 524 1 771 837 0.67% 0.65%
ACP States 95 2 510 552 1 069 241 1 441 311 0.51% 0.50%
Eastern Europe, Southern Caucasus and Russia 40 2 914 024 722 934 2 191 090 0.59% 0.41%
EFTA Countries 9 735 300 631 100 104 200 0.15% 0.26%
South Africa 32 1 186 510 964 991 221 519 0.24% 0.26%
Overseas Countries and Territories 3 17 868 368 17 500 0.01% 0.00%
Sub-total (nominal value) 847 53 926 084 34 445 427 19 480 657 10.90% 10.41%
Total 2012 (nominal value) 5 542 495 290 948 413 374 465 81 916 483 100.00%
Total 2011 (nominal value) 5 453 481 403 743 395 596 820 85 806 923 100.00%
(*) Aggregate loans including loan substitutes
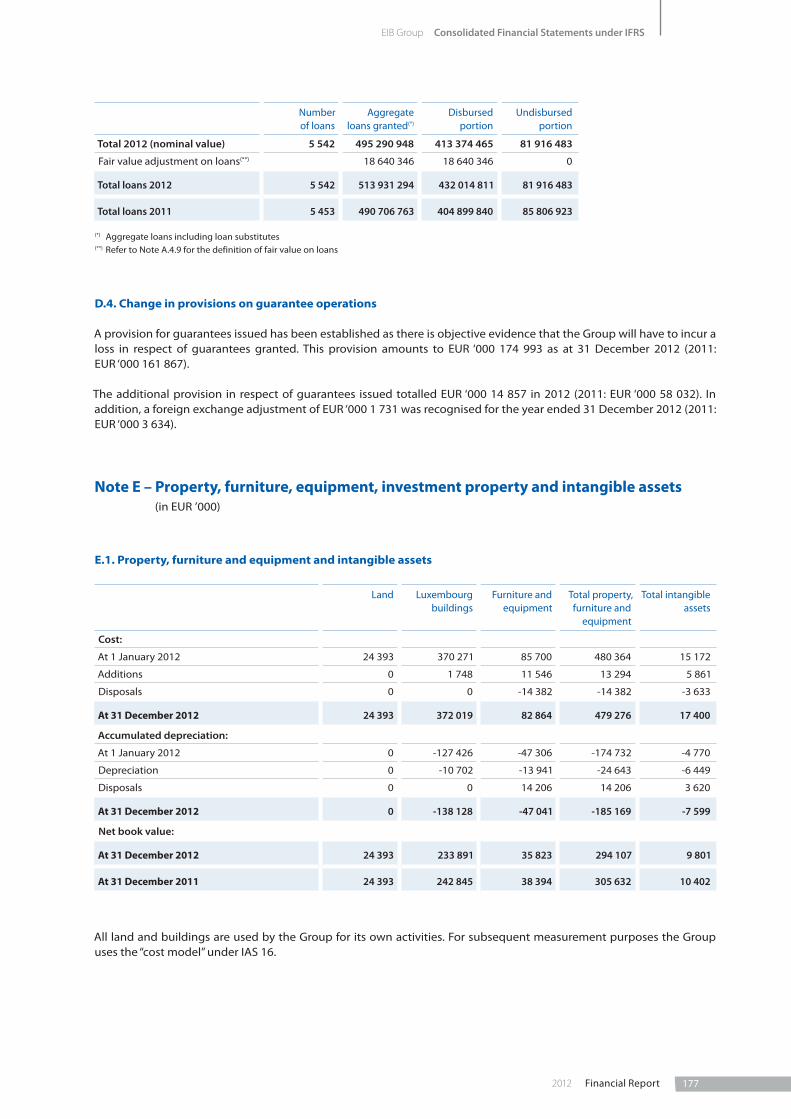
1772012 Financial Report
EIB Group Consolidated Financial Statements under IFRS
Number of loans
Aggregate loans granted(*)
Disbursed portion
Undisbursed portion
Total 2012 (nominal value) 5 542 495 290 948 413 374 465 81 916 483
Fair value adjustment on loans(**) 18 640 346 18 640 346 0
Total loans 2012 5 542 513 931 294 432 014 811 81 916 483
Total loans 2011 5 453 490 706 763 404 899 840 85 806 923
(*) Aggregate loans including loan substitutes(**) Refer to Note A.4.9 for the definition of fair value on loans
D.4. Change in provisions on guarantee operations
A provision for guarantees issued has been established as there is objective evidence that the Group will have to incur a loss in respect of guarantees granted. This provision amounts to EUR ‘000 174 993 as at 31 December 2012 (2011: EUR ‘000 161 867).
The additional provision in respect of guarantees issued totalled EUR ‘000 14 857 in 2012 (2011: EUR ‘000 58 032). In addition, a foreign exchange adjustment of EUR ‘000 1 731 was recognised for the year ended 31 December 2012 (2011: EUR ‘000 3 634).
Note E – Property, furniture, equipment, investment property and intangible assets (in EUR ’000)
E.1. Property, furniture and equipment and intangible assets
Land Luxembourg buildings
Furniture and equipment
Total property, furniture and
equipment
Total intangible assets
Cost:
At 1 January 2012 24 393 370 271 85 700 480 364 15 172
Additions 0 1 748 11 546 13 294 5 861
Disposals 0 0 -14 382 -14 382 -3 633
At 31 December 2012 24 393 372 019 82 864 479 276 17 400
Accumulated depreciation:
At 1 January 2012 0 -127 426 -47 306 -174 732 -4 770
Depreciation 0 -10 702 -13 941 -24 643 -6 449
Disposals 0 0 14 206 14 206 3 620
At 31 December 2012 0 -138 128 -47 041 -185 169 -7 599
Net book value:
At 31 December 2012 24 393 233 891 35 823 294 107 9 801
At 31 December 2011 24 393 242 845 38 394 305 632 10 402
All land and buildings are used by the Group for its own activities. For subsequent measurement purposes the Group uses the “cost model” under IAS 16.

178 Financial Report 2012
E.2. Investment property
Land Building Total investment property
Cost:
At 1 January 2012 330 4 832 5 162
At 31 December 2012 330 4 832 5 162
Accumulated depreciation:
At 1 January 2012 0 -2 299 -2 299
Depreciation 0 -161 -161
At 31 December 2012 0 -2 460 -2 460
Net book value:
At 31 December 2012 330 2 372 2 702
At 31 December 2011 330 2 533 2 863
There were no indications of impairment of investment property in either 2012 or 2011. The fair value of the investment property is EUR 8.1 million as measured by an external expert in 2012.
Other operating income includes income from leased office space amounting to EUR ’000 643 (2011: EUR ’000 270).
Note F – Deferred income (in EUR ’000)
31.12.2012 31.12.2011
Interest subsidies received in advance(1) 133 527 155 680
Prepaid management fees 2 937 10 314
136 464 165 994
(1) Part of the amounts received from the European Commission has been made available as a long term advance which is entered on the liabilities side under item deferred income, and comprises:
• amountsinrespectofinterestsubsidiesforloansgrantedforprojectsoutsidetheUnion,underConventionssignedwiththeACPStatesandProto-cols concluded with the Mediterranean Countries; and
• interestsubsidies,concerningcertainlendingoperationsputinplacewithintheUnionfromtheGroup’sownresources,madeavailableinconjunc-tion with the EMS under Council Regulation (EEC) No 1736/79 of 3 August 1979 and in conjunction with the financial mechanism established by the EFTA Countries under the EFTA Agreement signed on 2 May 1992.
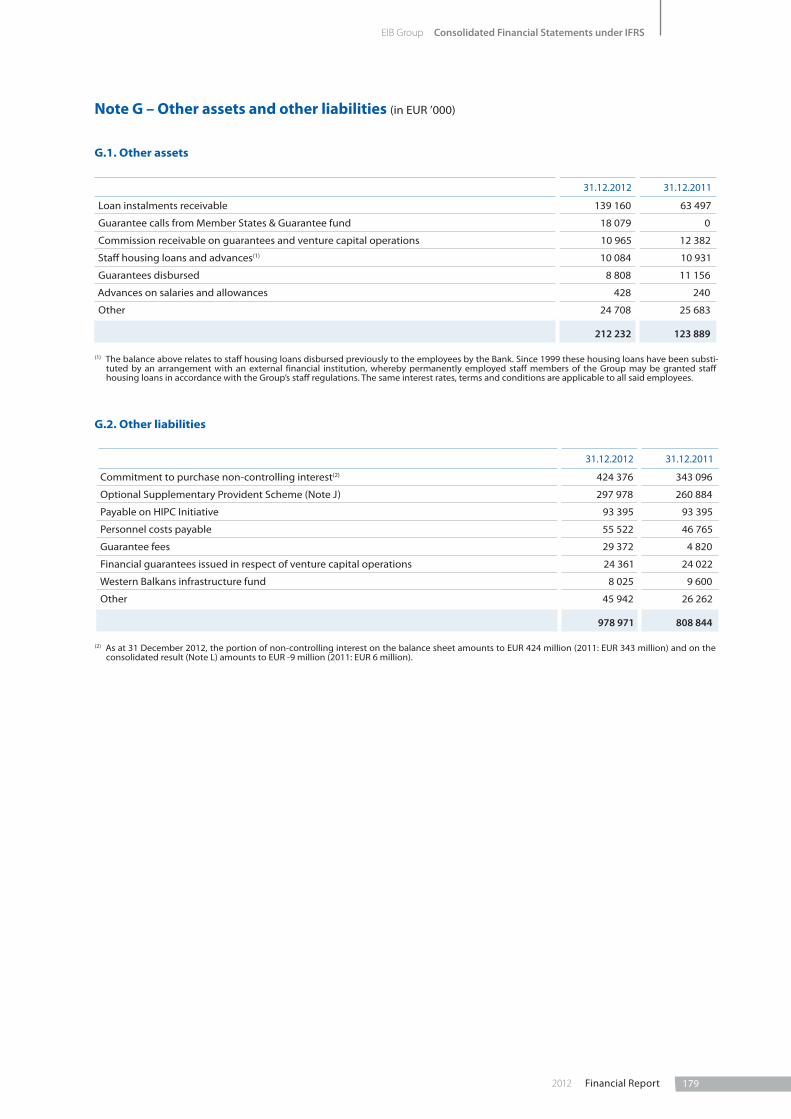
1792012 Financial Report
EIB Group Consolidated Financial Statements under IFRS
Note G – Other assets and other liabilities (in EUR ’000)
G.1. Other assets
31.12.2012 31.12.2011
Loan instalments receivable 139 160 63 497
Guarantee calls from Member States & Guarantee fund 18 079 0
Commission receivable on guarantees and venture capital operations 10 965 12 382
Staff housing loans and advances(1) 10 084 10 931
Guarantees disbursed 8 808 11 156
Advances on salaries and allowances 428 240
Other 24 708 25 683
212 232 123 889
(1) The balance above relates to staff housing loans disbursed previously to the employees by the Bank. Since 1999 these housing loans have been substi-tuted by an arrangement with an external financial institution, whereby permanently employed staff members of the Group may be granted staff housing loans in accordance with the Group’s staff regulations. The same interest rates, terms and conditions are applicable to all said employees.
G.2. Other liabilities
31.12.2012 31.12.2011
Commitment to purchase non-controlling interest(2) 424 376 343 096
Optional Supplementary Provident Scheme (Note J) 297 978 260 884
Payable on HIPC Initiative 93 395 93 395
Personnel costs payable 55 522 46 765
Guarantee fees 29 372 4 820
Financial guarantees issued in respect of venture capital operations 24 361 24 022
Western Balkans infrastructure fund 8 025 9 600
Other 45 942 26 262
978 971 808 844
(2) As at 31 December 2012, the portion of non-controlling interest on the balance sheet amounts to EUR 424 million (2011: EUR 343 million) and on the consolidated result (Note L) amounts to EUR -9 million (2011: EUR 6 million).

180 Financial Report 2012
Note H – Amounts owed to credit institutions and customers with agreed maturity dates or periods of notice (in EUR ’000)
H.1. Amounts owed to credit institutions
31.12.2012 31.12.2011
Repayable on demand 10 708 490 10 974 028
Short term deposits 24 083 53 465
Repo with central banks 0 100 271
Cash deposited on swaps payable 928 225 1 037 136
11 660 798 12 164 900
H.2. Amounts owed to customers
31.12.2012 31.12.2011
Overnight deposits 44 758 46 305
European Union and Member States' accounts:
- For Special Section operations and related unsettled amounts 379 405 343 617
- Deposit accounts 1 647 482 1 240 648
Short term deposits 658 850 960 618
2 730 495 2 591 188

1812012 Financial Report
EIB Group Consolidated Financial Statements under IFRS
Note I – Debts evidenced by certificates (in EUR ’000)
In its financing activity, one of the Group’s objectives is to align its funding strategy with the funds required for the loans granted. The caption ‘Debts evidenced by certificates’ includes ’Debt securities in issue’ (securities offered to the general investing public) and ‘Others’ (private placements). The table below discloses the details per currency of debts outstand-ing at 31 December 2012 and 2011, together with the average rates and due dates.
Debts evidenced by certificates
Payable in Outstanding at 31.12.2012
Average rate2012 (1)
Due dates Outstanding at 31.12.2011
Average rate2011 (1)
EUR 196 023 682 3.09 2013/2057 174 488 830 3.35
USD 108 809 061 2.36 2013/2058 107 454 811 2.56
GBP 59 693 677 3.77 2013/2054 58 101 423 4.03
AUD 19 055 453 5.27 2013/2042 18 996 605 5.37
JPY 10 650 948 0.85 2014/2047 13 660 198 0.86
CHF 7 990 828 2.37 2014/2036 7 146 966 2.47
NOK 6 974 498 3.37 2013/2025 6 498 323 3.74
SEK 5 507 027 3.61 2013/2039 4 301 840 3.71
TRY 2 932 450 8.86 2013/2022 2 776 232 9.33
ZAR 1 710 305 8.02 2013/2021 1 926 787 8.16
NZD 1 614 026 5.49 2013/2021 2 449 662 6.41
RUB 1 087 293 6.50 2013/2019 719 741 6.69
CAD 753 409 4.53 2037/2045 744 612 4.56
DKK 549 524 2.55 2024/2026 551 505 2.55
CZK 527 035 3.51 2013/2030 541 280 3.89
PLN 313 500 5.91 2013/2026 290 920 6.00
HUF 239 743 6.51 2013/2016 273 625 6.37
RON 101 249 8.88 2014/2016 104 087 8.88
BGN 43 460 1.21 2013/2013 117 599 5.18
MXN 37 297 4.70 2015/2015 32 419 5.06
HKD 33 252 5.10 2013/2019 232 816 0.98
TWD 26 042 4.76 2013/2013 25 508 5.10
Total 424 673 759 401 435 789
(1) Weighted average interest rates at the balance sheet date
Outstanding at31.12.2012
Outstanding at31.12.2011
Total (notional value)(2) 424 673 759 401 435 789
Fair value adjustment on borrowings 45 511 798 28 423 907
Total debts evidenced by certificates 470 185 557 429 859 696
(2) The notional value of debts evidenced by certificates held at fair value through profit or loss as at 31 December 2012 amounts to EUR 378 billion (2011: EUR 357 billion). The notional value of debts evidenced by certificates held at amortised cost as at 31 December 2012 amounts to EUR 47 billion (2011: EUR 44 billion). Refer to Note A.4.15 for the definition of Fair value on borrowings.

182 Financial Report 2012
Note J – Pension plans and health insurance scheme (in EUR ’000)
The Group operates 3 defined benefit pension plans. The Group also provides certain post-employment healthcare ben-efits to former employees of EIB. These benefits are unfunded as defined by IAS19. The cost of providing benefits under the plans is determined separately for each plan using the projected unit credit actuarial valuation method. Actuarial valuation took place at 30 September 2012 and was rolled forward to 31 December 2012.
An additional plan is not included in the figures below: the Optional Supplementary Provident Scheme (a defined con-tribution pension scheme). The corresponding amount of EUR 298 million (2011: EUR 261 million) is classified under
“Other liabilities” (Note G).
Net benefit expense (recognised in consolidated income statement) in 2012:
EIB Pension Management Committee
Pension
EIF Pension Health Insurance
Total 2012
Current service cost(1) 38 999 1 354 3 078 8 707 52 138
Interest cost on benefit obligation(2) 85 820 1 915 2 296 7 607 97 638
Recognition of actuarial gains/losses(1) 9 664 0 755 300 10 719
Net benefit expense 134 483 3 269 6 129 16 614 160 495
Net benefit expense (recognised in consolidated income statement) in 2011:
EIB Pension Management Committee
Pension
EIF Pension Health Insurance
Total 2011
Current service cost(1) 46 101 1 475 3 182 9 420 60 178
Interest cost on benefit obligation(2) 79 734 1 792 1 794 7 015 90 335
Recognition of actuarial losses(1) 22 186 130 936 1 312 24 564
Net benefit expense 148 021 3 397 5 912 17 747 175 077
(1) Recognised in General administrative expenses(2) Recognised in Interest expense and similar charges
Benefit liabilities as at 31 December 2012:
EIB Pension Management Committee
Pension
EIF Pension Health Insurance
Total 2012
Benefit obligation 2 167 445 42 197 68 640 221 028 2 499 310
Unrecognised net actuarial losses -774 594 -8 228 -29 665 -87 439 -899 926
Net liability 1 392 851 33 969 38 975 133 589 1 599 384
Benefit liabilities as at 31 December 2011:
EIB Pension Management Committee
Pension
EIF Pension Health Insurance
Total 2011
Benefit obligation 1 562 985 35 413 41 152 138 183 1 777 733
Unrecognised net actuarial losses -286 187 -2 574 -9 607 -17 532 -315 900
Net liability 1 276 798 32 839 31 545 120 651 1 461 833

1832012 Financial Report
EIB Group Consolidated Financial Statements under IFRS
As of 31 December 2012, the actuarial valuation of the pension plans and the healthcare scheme displayed an unrecog-nised loss of EUR ’000 899 926. EUR ’000 649 995 was reported in excess of the 10% corridor. The unrecognised loss will be recorded in other comprehensive income in 2013 with the adoption of IAS19 revised (Refer to Note A.3.).
Movements in the benefit liability during the year ended 31 December 2012 are as follows:
EIB Pension Management Committee
Pension
EIF Pension Health Insurance
Total
At 1 January 2012 1 276 798 32 839 31 545 120 651 1 461 833
Net benefit expense 134 483 3 269 6 129 16 614 160 495
Other restructuring events 6 192 0 0 0 6 192
Benefit payments net of employee contributions -24 622 -2 139 1 301 -3 676 -29 136
At 31 December 2012 1 392 851 33 969 38 975 133 589 1 599 384
The principal assumptions used in determining pension and post-employment benefit obligations for the Group’s plans are shown below:
in % 2012 2011
Discount rate for pension plans 4.23 5.58
Discount rate for health insurance plan 4.23 5.58
Future salary increase (including inflation) 4.50 4.50
Future pension increases 2.00 2.00
Healthcare cost increase rate 4.00 4.00
Actuarial tables ISCLT ISCLT
The table below shows the sensitivity of both benefit expenses for 2012 and defined benefit obligation as at 31 Decem-ber 2012 of the Health Insurance Plan to a 1% increase and decrease in the healthcare cost increase rate:
1% increase 1% decrease
Aggregate of current service and interest costs 8 675 -6 261
Defined benefit obligation 61 483 -46 149
The table below shows the actuarial experience (gain)/loss for the different Plans and the total defined benefit obliga-tion:
EIB Pension Management Committee
Pension
EIF Pension Health Insurance
Total Total defined benefit
obligation
2012 30 216 -176 -769 814 30 085 2 499 310
2011 11 255 -199 4 997 1 025 17 078 1 777 733
2010 63 767 -408 1 137 1 833 66 329 1 812 981
2009 12 016 -495 1 452 41 13 014 1 293 414

184 Financial Report 2012
The table below shows the evolution of the Defined Benefit Obligation during the year under review:
EIB Pension Management Committee
Pension
EIF Pension Health Insurance
Total 2012
Obligation at the beginning of the year 1 562 985 35 413 41 152 138 183 1 777 733
Current service cost 38 999 1 354 3 078 8 707 52 138
Employee contributions 21 902 0 2 120 0 24 022
Interest cost 85 820 1 915 2 296 7 607 97 638
Benefit payments -46 525 -2 139 -818 -3 676 -53 158
Experience (gain)/loss 30 216 -176 -769 814 30 085
Change in assumptions 467 855 5 830 21 581 69 393 564 659
Other restructuring events 6 193 0 0 0 6 193
Benefit obligation as at 31 December 2012 2 167 445 42 197 68 640 221 028 2 499 310
Note K – Result for the financial year
The appropriation of the profit of the stand-alone financial statements of the Bank for the year ended 31 December 2012, prepared under EU Accounting Directives, which amounts to EUR ’000 2 740 304 will be submitted for approval by the Board of Governors by 30 April 2013.
Note L – Interest and similar income and Interest expense and similar charges (in EUR ’000)
L.1. Net interest income
2012 2011
Interest and similar income:
Derivatives 14 966 861 14 321 414
Loans and advances to credit institutions and customers 9 859 975 10 011 297
Treasury bills and other bills eligible for refinancing with central banks and debt securities including fixed-income securities 478 154 534 774
Interest subsidy from the EU 21 769 31 768
Cash in hand, balances with central banks and post office banks 2 218 3 720
Other 0 1 719
Total 25 328 977 24 904 692
Interest expense and similar charges:
Debts evidenced by certificates -14 071 981 -13 551 751
Derivatives -8 361 598 -8 396 241
Interest cost on benefit obligation (Note J) -97 638 -90 335
Amounts owed to credit institutions and to customers -29 069 -58 494
Non-controlling interest (Note A.4.22) -9 292 5 517
Interest on third party mandates -8 666 -17 899
Other -12 617 -35 118
Total -22 590 861 -22 144 321
Net interest income 2 738 116 2 760 371

1852012 Financial Report
EIB Group Consolidated Financial Statements under IFRS
The table below sets out the net interest income relating to each class of financial assets and liabilities:
2012 2011
Interest and similar income:
Derivatives 14 966 861 14 321 414
Loans and receivables(1) 7 273 314 9 698 284
Designated at fair value through profit and loss 2 610 648 348 501
Held-to-maturity 373 970 376 225
Available-for-sale 66 119 98 756
Trading debt securities 38 065 59 793
Other 0 1 719
Total 25 328 977 24 904 692
Interest expense and similar charges:
Designated at fair value through profit and loss -13 371 684 -13 013 043
Derivatives -8 361 598 -8 396 241
Financial liabilities measured at amortised cost -738 032 -597 202
Non-financial liabilities -119 547 -137 835
Total -22 590 861 -22 144 321
Net interest income 2 738 116 2 760 371
(1) Included in this class of financial assets is accrued interest on impaired loans as at 31 December 2012 amounting to EUR ‘000 9 216 (2011: EUR ‘000 1 485).

186 Financial Report 2012
L.2. Geographical analysis of Interest and similar income
2012 2011
EU Countries
Spain 1 412 302 1 465 252
Italy 1 023 346 1 025 946
Germany 871 667 909 430
Poland 790 945 668 147
United Kingdom 771 182 677 605
France 743 572 824 510
Greece 574 647 586 574
Portugal 536 974 589 511
Hungary 280 308 268 347
Austria 241 851 228 817
Belgium 213 840 211 648
Netherlands 185 311 181 596
Sweden 158 566 151 013
Czech Republic 144 723 157 527
Finland 134 140 153 581
Romania 133 947 126 440
Ireland 99 604 91 490
Slovakia 57 968 43 736
Slovenia 55 156 60 273
Lithuania 45 838 43 974
Bulgaria 44 058 37 068
Denmark 29 292 33 742
Cyprus 23 788 29 078
Latvia 21 787 22 735
Estonia 14 871 11 128
Luxembourg 14 777 17 747
Malta 7 666 6 852
Total EU countries 8 632 126 8 623 767
Outside the European Union 1 031 868 958 275
Total 9 663 994 9 582 042
Income not analysed per country(1) 15 664 983 15 322 650
Total interest and similar income 25 328 977 24 904 692
(1)Income not analysed per country:
1. Revenue from Group investment and loan substitutes portfolios 252 814 273 313
2. Revenue from Operational bond portfolios 111 463 107 084
3. Revenue from Operational money-market portfolios 113 877 151 110
4. Revenue from money-market operations 241 728 511 759
5. Income from derivatives 14 966 861 14 321 414
6. Unwinding of interest income from the present value adjustment of paid-in capital and reserve receivable 0 1 719
7. Adjustment on early repayments of loans -21 760 -43 749
15 664 983 15 322 650

1872012 Financial Report
EIB Group Consolidated Financial Statements under IFRS
Note M – Result on financial operations (in EUR ’000)
M.1. Per nature of result
2012 2011
Net result on derivatives(1) 88 424 -329 104
Net result on loans under the fair value option and associated swaps(2) 5 221 991 -5 543 964
Net result on borrowings under the fair value option and associated swaps(3) -7 355 464 7 499 534
-2 045 049 1 626 466
Foreign exchange gain and loss 113 924 -55 717
Fair value gains and losses on operational treasury portfolio 84 746 -29 723
Gain and loss on unwind of ALM swaps 32 501 36 805
Realised gains and losses on operational treasury portfolio 15 103 -53 696
Gain and loss on buy back of debts evidenced by certificates 5 199 12 639
Result on release of guarantees -2 544 0
Gain and loss on unwind of asset swaps -76 076 -28 385
Realised gain/loss on sale of shares -79 902 -13 897
Other -31 119 0
-1 983 217 1 494 492
(1) The net result on derivatives includes for the majority the fair value of Macro-hedging swaps and Treasury Asset swaps. On 31 December 2012 these swaps evidence a positive impact of EUR ‘000 88 424 compared to a negative impact of EUR ‘000 329 104 in 2011.
(2) The Fair Value Option is applied on loans hedged by derivatives. As at 31 December 2012, the carrying value of loans designated at fair value stands at EUR 127 billion (2011: EUR 104.7 billion). The use of Fair Value Option on loans generates an increase of EUR ‘000 5 221 991 on the income statement at 31 December 2012 (2011: EUR ‘000 -5 543 964). The positive variation in the combined fair value of the EIB loans and their associated swaps is essential-ly due to the combined effect of the increases of the lending spreads, partially compensated by the decreases of the swap rates. The lending spreads are used to discount the prospective contractual cash flows of the designated loans under the Fair Value Option. The associated swaps are however valued using the swap curves and as such the lending spreads are not considered.
(3) The Fair Value Option is applied on borrowings hedged by derivatives. The majority of the borrowings are systematically hedged, and the carrying val-ue of borrowings designated at fair value amounts to EUR 422 billion as at 31 December 2012 (2011: EUR 386 billion). The net impact on the income statement at 31 December 2012 on borrowings and associated swaps is a decrease of the profit for the year by EUR ’000 7 355 464 (2011: profit of EUR ’000 7 499 534). The changes in Fair Value of the EIB borrowings tend to be only partially compensated by those of the related hedging swaps as the value of the swaps – being calculated on a model basis – is not directly affected by credit-related factors.
M.2. Per category of assets and liabilities
2012 2011
Financial assets available-for-sale -79 827 -42 311
Financial assets designated at fair value through profit or loss 9 449 247 1 788 856
Financial liabilities designated at fair value through profit or loss -16 839 263 -6 691 263
Financial instruments held for trading 99 774 -55 005
Derivatives held for risk management 5 344 968 6 528 872
Other 41 884 -34 657
-1 983 217 1 494 492
Note N – Other operating income (in EUR ’000)
2012 2011
Reversal of previous year’s unutilised accruals of general administrative expenses 1 847 5 275
Rental income 3 803 2 035
Other 4 447 1 879
10 097 9 189

188 Financial Report 2012
Note O – Fee and commission income (in EUR ’000)
2012 2011
Commission income from advisory activities 60 773 65 853
Commission income on loans 52 072 43 722
Commission on Investment Facility - Cotonou (Note V) 36 188 38 011
Commission income on guarantees 24 861 25 005
Commission on Jaspers (Note V) 23 247 24 913
Commission on Jessica (Note V) 17 959 16 664
Commission on NER 300 (Note V) 13 677 7 003
Commission on Jeremie (Note V) 13 117 11 299
Commission on Yaoundé/Lomé conventions (Note V) 5 247 6 035
Commission on Jasmine (Note V) 1 786 1 156
Commission from other EU institutions and EU countries 44 468 28 547
293 395 268 208
Note P – General administrative expenses (in EUR ’000)
2012 2011
Salaries and allowances(*) -258 446 -247 661
Welfare contributions and other staff costs -158 123 -134 082
Staff costs -416 569 -381 743
Other general administrative expenses -141 691 -134 209
Total general administrative expenses -558 260 -515 952
(*) of which the amount for members of the Management Committee is EUR ‘000 3 225 at 31 December 2012 and EUR ‘000 3 022 at 31 December 2011.
The number of persons employed by the Group was 2 188 at 31 December 2012 (2 173 at 31 December 2011).
Note Q – Derivative financial instruments
Q.1. Usage of derivative financial instruments
In the funding activity of the Group
The Group uses derivatives mainly as part of its funding strategy in order to bring the characteristics, in terms of currencies and interest rates, of the funds raised in line with those of loans granted and also to reduce funding costs. It uses also long term swaps to hedge certain treasury transactions and for ALM purposes.
Long term derivatives transactions are not used for trading, but only in connection with fund-raising, hedg-
ing loans and treasury transactions, and for the reduc-tion of market risk exposure.
All interest rate and currency swaps linked to the bor-rowing portfolio have maturities matching the corre-sponding borrowings and are therefore of a long term nature.
The derivatives most commonly used are:
Currency swaps
Currency swaps are contracts under which it is agreed to convert funds in one currency into another currency and, simultaneously, a forward exchange contract is

1892012 Financial Report
EIB Group Consolidated Financial Statements under IFRS
concluded to re-exchange the two currencies in the future in order to be able to repay the funds raised on the due dates.
Interest rate swaps
Interest rate swaps are contracts under which, generally, it is agreed to exchange floating-rate interest for fixed-rate interest or vice versa.
Interest rate and currency swaps allow the Group to modify the interest rates and currencies of its borrowing portfolio and other portfolios in order to accommodate requests from its clients and also to reduce funding costs by exchanging its advantageous access conditions to certain capital markets with its swap counterparties.
In the liquidity management of the Group
The Group enters into short term currency swap con-tracts in order to adjust currency positions in its opera-tional treasury in relation to its benchmark currency, the euro, and to cater for demand for currencies in conjunc-tion with loan disbursements.
The notional amount of short term currency swaps stood at EUR 29 392 million at 31 December 2012 against EUR 19 631 million at 31 December 2011. The notional amount of short term currency forwards was EUR 364 million at 31 December 2012 (2011: EUR 322 million).
Long term futures are also used by the Group to adjust the medium-term (2 years) interest rate exposure of its treasury bond portfolios. The notional amount of long term futures stood at EUR nil at 31 December 2012 (2011: EUR 386 million).
Forward rate agreements are used by the Group to hedge the interest rate risk of its short term funding. The notional amount of forward rate agreements stood at EUR 4 947 million at 31 December 2012 (2011: EUR 6 606 million) and their fair value at EUR 4 million (2011: EUR 2 million).
In the Asset Liability Management of the Group
The Group’s policy aims to maintain a high and stable level of income as well as to safeguard the economic value of the Group.
Accordingly, the Group:
• has adopted an own funds investment profile ensur-ing a stable and high flow of income; and
• manages residual interest rate risks in relation to this investment profile.
With a view of managing residual interest rate risks, the Group operates natural hedges in respect of loans and borrowings or concludes global hedging operations (interest rate swaps).
Macro hedging swaps used as part of asset/liability management are fair valued in accordance with IAS 39.
Q.2. Fair value of derivative financial instruments
Financial instruments measured at fair value require dis-closure of fair value measurements by level of the fol-lowing hierarchy:
• Level 1 – Quoted (unadjusted) prices in active mar-kets for identical assets or liabilities.
• Level 2 – Valuation techniques with inputs other than quoted prices included within Level 1 that are observable for the asset or liability, either directly (i.e. as prices) or indirectly (i.e. derived from prices).
• Level 3 – Valuation techniques which use inputs for the asset or liability that are not based on observa-ble market data (unobservable inputs). Internal val-uation models are used to determine the fair values of these instruments.
Valuation techniques include net present value and discounted cash flow models, Hull-White and Libor Market Model interest rate models and Black-Scholes option model. Assumptions and inputs used in valua-tion techniques include risk-free interest rates, basis swap spreads and currency basis swaps spreads, for-eign currency exchange rates and forward exchange rates, equity and equity index prices and expected price volatilities and correlations, Consumer Price Indices values and expected volatilities and correla-tions. The objective of valuation techniques is to arrive at a fair value determination that reflects the price of the financial instrument at the reporting date that would have been determined by market partici-pants acting at arm’s length. The valuation models applied are consistent with accepted economic methodologies for pricing financial instruments and incorporate the factors that market participants con-sider when setting a price. For a portion of derivative transactions, internal estimates and assumptions might be used in the valuation techniques when the market inputs are not directly available, typically in the estimation of correlations in some interest rate and cross currency models and in the estimation of volatilities for some long dated equity linked and inflation linked transactions.

190 Financial Report 2012
The table below shows the net fair value of derivative financial instruments, recorded as assets or liabilities (between those whose fair value is based on quoted market prices, those whose valuation technique where all the model inputs are observable in the market and those where the valuation techniques involve the use of non-market observable inputs) together with their nominal amounts. The nominal amounts indicate the volume of transactions outstanding at the year end and are indicative of neither the market risk nor the credit risk.
Derivatives by valuation method as at 31 December 2012 (in EUR million)
Level 1 Level 2 Level 3 Total 2012
Quoted market price
Valuation techniques – market observable
inputs
Valuation techniques – non market
observable inputs
Notional amount
Net fair value
Notional amount
Net fair value
Notional amount
Net fair value
Notional amount
Net fair value
Interest Rate Swaps 0 0 428 148 18 625 4 669 352 432 817 18 977
Cross Currency Swaps 0 0 155 390 11 566 5 976 739 161 366 12 305
Short term foreign exchange contracts 0 0 29 756 -145 0 0 29 756 -145
Forward Rate agreements 0 0 4 947 4 0 0 4 947 4
Total 0 0 618 241 30 050 10 645 1 091 628 886 31 141
Derivatives by valuation method as at 31 December 2011 (in EUR million)
Level 1 Level 2 Level 3 Total 2011
Quoted market price Valuation techniques – market observable
inputs
Valuation techniques – non market
observable inputs
Notional amount
Net fair value
Notional amount
Net fair value
Notional amount
Net fair value
Notional amount
Net fair value
Interest Rate Swaps 0 0 387 719 17 186 13 492 -720 401 211 16 466
Cross Currency Swaps 0 0 159 746 11 944 6 810 941 166 556 12 885
Short term foreign exchange contracts 0 0 19 954 768 0 0 19 954 768
Futures contracts 386 -1 0 0 0 0 386 -1
Forward Rate agreements 0 0 6 606 2 0 0 6 606 2
Total 386 -1 574 025 29 900 20 302 221 594 713 30 120
Quoted prices for the majority of the Bank’s derivative transactions are not available in the market. For such instruments the fair values are estimated using valuation techniques or models, based whenever possible on observable market data prevailing at the balance sheet date.
The fair value of swap transactions is computed using the income approach, applying valuation techniques to convert future amounts to a single present amount (discounted). The estimate of fair value is based on the value indicated by marketplace expectations about those future amounts. Valuation techniques can range from simple discounted known cash flows to complex option models. The valuation models applied are consistent with accepted economic methodol-ogies for pricing financial instruments, and incorporate the factors that market participants consider when setting a price.
For a portion of derivative transactions, internal estimates and assumptions might be used in the valuation techniques when the market inputs are not directly available.

1912012 Financial Report
EIB Group Consolidated Financial Statements under IFRS
Note R – Fair value of financial assets and liabilities (in EUR million)
The tables below set out a comparison by category of the carrying amounts and fair values of the Group’s financial assets and financial liabilities that are carried in the financial statements. The tables do not include the fair values of non-financial assets and non-financial liabilities.
Carrying value31.12.2012
Fair value31.12.2012
Carrying value31.12.2011
Fair value31.12.2011
Assets carried at fair value:
Available-for-sale financial assets 6 036 6 036 6 122 6 122
Financial assets designated at fair value through profit or loss 127 031 127 031 104 652 104 652
Financial assets held for trading 1 465 1 465 1 687 1 687
Derivative assets held for risk management 55 886 55 886 49 538 49 538
Total 190 418 190 418 161 999 161 999
Assets carried at amortised cost:
Held-to-maturity investments 23 389 22 229 20 106 18 407
Loans and receivables 343 434 346 936 329 049 324 824
Total 366 823 369 165 349 155 343 231
Total financial assets 557 241 559 583 511 154 505 230
Liabilities carried at fair value:
Derivative liabilities held for risk management 24 745 24 745 19 419 19 419
Financial liabilities designated at fair value through profit or loss 422 040 422 040 386 062 386 062
Total 446 785 446 785 405 481 405 481
Liabilities carried at amortised cost:
Liabilities measured at amortised cost 62 537 61 989 58 554 59 427
Total 62 537 61 989 58 554 59 427
Total financial liabilities 509 322 508 774 464 035 464 908
The following describes the methodologies and assumptions used to determine the fair value of the financial assets and the financial liabilities.
Assets for which fair value approximates carrying value
For financial assets and financial liabilities that are liquid or having a short term maturity (less than three months), it is assumed that the carrying amounts approximate to their fair value.
Assets and liabilities recorded at fair value
Published price quotations in an active market are the first source for determining the fair value of a financial instru-ment. For instruments without available market price, fair values are estimated using valuation techniques or models based whenever possible on observable market data prevailing at the balance sheet date.
Fair value of such instruments is determined by using valuation techniques to convert future amounts to a single dis-counted present amount. The estimate of fair value is based on the value indicated by marketplace expectations about those future amounts. Valuation techniques can range from simple discounted known cash flows to complex option models. The valuation models applied are consistent with accepted economic methodologies for pricing financial instruments, and incorporate the factors that market participants consider when setting a price. Internal estimates and assumptions might be used in the valuation techniques when the market inputs are not directly available.

192 Financial Report 2012
The following tables show an analysis of financial assets and financial liabilities recorded at fair value, between those whose fair value is based on quoted market prices, those whose valuation technique where all the model inputs are observable in the market and those where the valuation techniques involve the use of non-market observable inputs.
2012 Level 1 Level 2 Level 3 Total 2012
Quoted market price
Valuation techniques
– market observable input
Valuation techniques – non market
observable input
Financial assets:
Financial assets held for trading 1 314 151 0 1 465
Derivative assets held for risk management 0 54 634 1 252 55 886
Financial assets designated at fair value through profit or loss 0 76 483 50 548 127 031
Financial investments – available-for-sale 1 921 638 3 477 6 036
Total 3 235 131 906 55 277 190 418
Financial liabilities:
Derivative liabilities held for risk management 0 24 584 161 24 745
Financial liabilities designated at fair value through profit or loss 374 843 40 224 6 973 422 040
Total 374 843 64 808 7 134 446 785
2011 Level 1 Level 2 Level 3 Total 2011
Quoted market price
Valuation techniques
– market observable input
Valuation techniques – non market
observable input
Financial assets:
Financial assets held for trading 1 687 0 0 1 687
Derivative assets held for risk management 0 47 167 2 371 49 538
Financial assets designated at fair value through profit or loss 0 65 996 38 656 104 652
Financial investments – available-for-sale 2 677 289 3 156 6 122
Total 4 364 113 452 44 183 161 999
Financial liabilities:
Derivative liabilities held for risk management 1 17 268 2 150 19 419
Financial liabilities designated at fair value through profit or loss 346 729 26 796 12 537 386 062
Total 346 730 44 064 14 687 405 481
In 2012, the Group made transfers from level 1 to 2 of the fair value hierarchy:
- Financial assets available for sale of EUR 58 million (2011: EUR nil)
- Financial assets held for trading of EUR 5 million (2011: EUR nil)
- Financial liabilities designated at fair value through profit or loss of EUR 14 734 million (2011: EUR 4 067 million)
The Group made also the following transfer from level 2 to 1 of the fair value hierarchy:
- Financial liabilities designated at fair value through profit or loss of EUR 6 884 million (2011: EUR 15 166 million).

1932012 Financial Report
EIB Group Consolidated Financial Statements under IFRS
The following table presents the changes in Level 3 instruments for the year ended 31 December 2012:
Financial assets held for trading(*)
Financial assets designated at fair value through P/L
Financial investments –
available for Sale
Financial liabilities held for trading (*)
Financial liabilities designated at fair value through P/L
Balance at 1 January 2012 2 371 38 656 3 156 2 150 12 537
Total gains or losses:
- in profit or loss 75 3 150 -39 -44 -49
- in other comprehensive income 0 0 202 0 0
Purchases 3 6 713 697 73 0
Issues 0 0 0 0 -208
Settlement -174 -647 -423 -54 -1 129
Aggregate transfers into Level 3 3 2 676 0 0 424
Aggregate transfers out of Level 3 -1 026 0 -116 -1 964 -4 602
Balance at 31 December 2012 1 252 50 548 3 477 161 6 973
(*) Derivative balances are included within Financial assets or liabilities held for trading.
Change in fair value of financial instruments designated at fair value through profit or loss using a valuation technique based on non-market observable input, due to alternative assumptions
The potential effect of using reasonable possible alter-native non market observable assumptions as input to valuation techniques from which the fair values of finan-cial instruments designated at fair value through profit or loss (FVTPL) are determined has been quantified as a reduction of approximately EUR 0.1 million using less favourable assumptions and an increase of approxi-mately EUR 0.1 million using more favourable assump-tions for 31 December 2012 and a reduction of approximately EUR 11.5 million using less favourable assumptions and an increase of approximately EUR 1.2 million using more favourable assumptions for 31 December 2011.
The alternative assumptions are used to calculate the fair value of derivatives, borrowings and loans belong-ing to the level 3 valuation category. Fair value of bor-rowings and loans in Level 3 is derived from the value of derivatives which hedge these borrowings and loans. Hence the alternative assumptions are first applied to valuation of Level 3 derivatives and then the impact is applied to Level 3 borrowings and loans. Level 3 deriva-tives can be grouped in four swap types according to underlying asset and valuation model:
a. Single currency, multiple-rate swaps
b. Cross currency and FX-linked swaps
c. Inflation-linked swaps
d. Equity-linked swaps
For single currency, multiple rate swaps, alternative assumptions are applied to forward rate correlations used in calibration of BGM models. For cross currency and FX-linked swaps alternative assumptions are applied to correlations between interest and FX rates used in the calibration of hybrid Black Scholes / Hull & White models. For inflation-linked swaps alternative assumptions are applied to inflation index and real rate volatilities used in the calibration of hybrid Black Scholes / Hull & White models. For equity-linked swaps alternative assumptions are applied to equity or index volatilities and dividend yields (forwards) used in the calibration of hybrid Black Scholes / Hull & White models.
Financial assets designated at fair value through profit or loss
Included in financial assets designated at fair value through profit or loss is a portfolio of loans hedged by Interest Rates Swaps and Currency Swaps.
The maximum credit exposure of the disbursed loans and advances to customers and to credit institutions designated at fair value through profit or loss amounts to EUR 112 717 million (2011: EUR 96 420 million). The cumulative change in fair value of the loans attributable to change in credit risk of Group’s counterparts amounts to a loss of EUR 303 million (2011: loss of EUR 50 million).

194 Financial Report 2012
The changes in fair value of financial assets designated at fair value through profit or loss attributable to changes in credit risk have been calculated by deter-mining the change in the Expected Credit Loss on these loans.
No credit derivatives have been concluded to hedge the credit risk of the financial assets designated at fair value through profit or loss.
Financial liabilities designated at fair value through profit or loss
The financial liabilities designated at fair value through profit or loss comprise debts evidenced by certificates issued by the Group and hedged by Interest Rate Swaps and Currency Swaps.
The cumulative change in fair value of quoted financial liabilities designated at fair value through profit or loss attributable to change in credit risk of the Group amounts to a profit of EUR 2 626 million. It is based upon the cumulative change until the prior year 2011 with a profit of EUR 9 999 million and the change during the current year 2012, where a loss of EUR 7 373 million is stated (2011: gain of EUR 7 761 million). The changes in fair value of financial liabilities designated at fair value through profit or loss attributable to the change in credit risk have been calculated by determining the difference between the changes in the quoted fair value and the changes in fair value due to market risk based on valuation techniques.
The amount that the Group would contractually be requested to pay at maturity of financial instruments designated at fair value through profit or loss is EUR 41 160 million (2011: EUR 28 795 million) less than the carrying amount as at 31 December 2012.
Note S – Risk management
This note presents information about the Group’s expo-sure to and its management and control of risks, in par-ticular the primary risks associated with its use of financial instruments. These are:
• Credit risk - the risk of loss resulting from client or counterparty default and arising on credit exposure in all forms, including settlement risk;
• Market risk - exposure to observable market varia-bles such as interest rates, exchange rates and equi-ty market prices;
• Liquidity and funding risk - the risk that the Group is unable to fund assets or meet obligations at a rea-sonable price or, in extreme situations, at any price; and
• Operational risk - the potential loss resulting from inadequate or failed internal processes, people and systems or from external events.
Risk management information presented in this note will distinguish between the Bank and the Fund.
S.1. Risk Management Organisation
S.1.1. Risk Management Organisation of the Bank
The Bank aligns its risk management systems to chang-ing economic conditions and evolving regulatory stand-ards. It adapts them on an on-going basis as best market practice develops. Systems are in place to con-trol and report on the main risks inherent in its opera-tions, i.e. credit, market and operational risks.
The Bank’s objective is to analyse and manage risks so as to obtain the strongest protection for its assets, its financial result, and consequently its capital. While the Bank is not subject to full regulation, it aims to comply in substance with the relevant EU banking directives and the recommendations of the banking supervisors of the EU Member States, EU legislation and the compe-tent supranational bodies, such as the Basel Committee on Banking Supervision (BCBS).
The following sections disclose the credit, market and liquidity risks to which the Bank is exposed on its activi-ties performed on own resources.
The Risk Management Directorate (RM) was created in November 2003. RM independently identifies, assesses, monitors and reports the credit, market and operational risks to which the Bank is exposed in a comprehensive and consistent way and under a con-sistent approach. Within a commonly defined frame-work, whereby the segregation of duties is preserved, RM is independent of the Front Offices and provides second opinion on all proposals made which have risk implications. The Director General of RM reports, for credit, market and operational risks, to the desig-nated Vice-President. The designated Vice-President meets regularly with the Audit Committee to discuss topics relating to credit, market and operational risks. He is also responsible for overseeing risk reporting to the Management Committee and the Board of Directors.
To support the implementation of the Bank’s risk poli-cies, two risk-oriented committees have been created.
The Credit Risk Assessment Group (CRAG) is a high-level forum for discussing relevant credit risk issues arising in the course of the Bank’s activities and for advising the Management Committee on these. Its members are the Directors General of the Operations, Projects, Risk Management, Transaction Monitoring &

1952012 Financial Report
EIB Group Consolidated Financial Statements under IFRS
Restructuring, Finance and Legal Affairs Directorates. The CRAG is intended to complement, and does not replace, the existing case-by-case review of lending operations, which remains central to the loan approval process.
An ALM Committee (ALCO), made up of the Directors General of the Operations, Finance and Risk Manage-ment Directorates, provides a high-level forum for debating the Bank’s ALM policy and for making propos-als in this field to the Management Committee. It pro-motes and facilitates the dialogue among the Directorates represented in it, while providing a wider perspective on, and enhancing their understanding of, the main financial risks.
The Bank continued to develop its capacity to manage loans post signature. For significant parts of the portfo-lio this is the responsibility of Transaction Management & Restructuring (TMR), a Directorate, reporting to a sep-arate Vice-President. TMR is focusing on monitoring the higher risk counterparts and certain forms of security and it also manages transactions requiring particular attention.
S.1.1.1. Risk measurement and reporting system
The Bank’s risks are measured using a method which reflects both expected losses likely to arise in normal circumstances and unexpected losses, which are an estimate of the ultimate actual loss based on a portfolio model. The models make use of probabilities derived from statistics based on historical experiences observed in financial markets. The Bank also runs worst case sce-narios that would arise in the event that extreme events which are unlikely to occur do in fact occur.
Information on the risk measures described above are presented and explained to the Management Commit-tee and to the Board of Directors on a quarterly basis. The reports include aggregate credit exposures, credit concentration analyses and other key portfolio risk indi-cators as well as Value at Risk (‘VaR’), liquidity ratios and liquidity mismatch risks.
The Bank maintains two reserves for the expected and unexpected losses – the General Loan Reserve (GLR) and the Special Activities Reserve (SAR), respec-tively. The General Loan Reserve is a dedicated reserve for the expected loss of the Bank’s loan port-folio. It is calculated quarterly according to the evolu-tion of the underlying assets and reported to the Bank’s senior management. The Special Activities Reserve is a dedicated reserve for the capital alloca-tion covering the unexpected loss of those activities which have a risk profile higher than what is gener-ally accepted by the Bank, including venture capital activities undertaken by the EIF on the Bank’s behalf. It is calculated quarterly according to the evolution of the underlying assets.
S.1.1.2. The Bank’s financial risk tolerance
As a public institution, the Bank does not aim to make profits from speculative exposures to financial risks, set-ting its financial risk tolerance to a minimum level as defined by approved limits, and applying a conservative financial framework.
As a consequence, the Bank does not view its treasury or funding activities as profit- maximising centres, even though performance objectives are attached to those activities. Investment activities are conducted within the primary objective of protection of the capital invested. With respect to exposures arising from the Bank’s lending and borrowing operations, the main principle of the Bank’s financial risk policy is therefore to ensure that all material financial risks are hedged.
All new types of transactions introducing operational or financial risks must be authorised by the Management Committee, after the approval of the New Products Committee, and are managed within approved limits.
S.1.1.3. Sustainability of revenue and self-financing capacity
The Bank’s ALM policy forms an integral part of the Bank’s overall financial risk management. It reflects the expectations of the main stakeholders of the Bank in terms of stability of earnings, preservation of the eco-nomic value of own funds, and the self-financing of the Bank’s growth in the long term.
To achieve these aims, the ALM policy employs medium to long term indexation for the investment of own funds to promote stability of revenues and enhance overall returns. This indexation policy implies an exposure to medium to long term yields and is not influenced by any short term views on trends in interest rates.
This is accomplished by targeting a duration for the Bank’s own funds of between 4.5 and 5.5 years.
S.1.2. Risk Management Organisation of the Fund (EIF)
Most of the Private Equity (PE), Venture Capital and Port-folio Guarantees, Securitisation & Microfinance (GSM) operations for both entities of the Group are managed by the Fund. The mandate of the Fund is to support small and mid-size enterprise (SME) finance for start-up, growth and development within European Union objectives for SME.
The Fund aligns its risk management systems to chang-ing economic conditions and evolving regulatory stand-ards. It therefore adapts them on an on-going basis as best market practices develop. Credit, market and oper-ational systems are in place to control and report on the main risks inherent to its operations.

196 Financial Report 2012
An independent Risk Management and Operations Department reports directly to a Board appointed Deputy Chief Executive. This segregation of duties and the “four-eye” principle ensures an unbiased review of the Fund’s business activities. Moreover, within the EIB Group context, RMM operates in close contact with the European Investment Bank’s Risk Management Directo-rate, particularly with regard to Group risk exposure relating to guarantee operations, the PE operations under the Bank’s Risk Capital Mandate (RCM) and gen-eral EIF policy matters.
RM&O is organised into three divisions: Private Equity (PE) Risk Management, Portfolio Guarantees & Securiti-sation (G&S) Risk Management and Operations covering both business lines.
The Fund’s treasury management has been fully out-sourced to the Bank under a treasury management agreement signed by both parties and mandating the responsible EIB services to perform selection, execution, settlement and monitoring of transactions. Manage-ment follows treasury guidelines annexed to the agree-ment, which mirror closely the relevant sections of the EIB’s own treasury guidelines.
S.1.2.1. Risk assessment private equity
Under its private equity operations, the Fund has a fund-of-funds approach, taking minority equity partic-ipations in venture capital, private equity and mezza-nine funds managed by mostly independent teams in order to leverage further commitments from a wide range of investors. The Fund’s PE operations include investments in funds focussed on seed- and early-stage companies capital, but also investments in well-established funds targeting mid- and later-stage or mezzanine investments, which, generally speaking, have a lower risk profile.
Over the last years, the Fund has developed a tool-set to design, manage and monitor portfolios of PE funds tailored to the dynamics of this market place, going beyond investing in top quartile funds. This tool-set is based on an internal model, the Grading-based Economic Model (GEM), which allows the Fund to better assess and verify each funds’ but also each portfolio of funds’ valuations, risks and expected future cash flows and performances. Before commit-ting to a PE fund, the Fund assigns a grading which is based on the outcome of an extensive due diligence performed by the Fund’s transaction team and reviewed by its risk management team. During the funds’ lifetimes, gradings are periodically reviewed with a frequency and intensity depending on the level of risk.
These efforts, supported by the development of a pro-prietary IT system and an integrated software (front to
back), improve the investment decision-making process and the management of the portfolio’s financial risks and of liquidity.
In the context of a still volatile situation stemming from the economic and financial crisis, the Fund continues to closely monitor the valuations reported by PE fund managers, and also other specific risks linked to the macroeconomic and financial environment. Throughout the year, the Fund also runs stringent stress test scenar-ios on its PE funds portfolios and regularly updates the EIF Board of Directors on the results.
S.1.2.2. Risk assessment guarantees
The Fund extends portfolio guarantees to financial inter-mediaries involved in SME financing and provides credit enhancement to SME securitisation transactions. By tak-ing on these risks, it facilitates access to funding, and, in turn, it helps to finance SMEs.
For its guarantee & securitisation business, over the last years, the Fund has developed a tool-set to analyse portfolio guarantees and structured finance transac-tions in line with best market practices. Before the Fund enters legally into a guarantee transaction, an internal rating is assigned to each new own risk guarantee trans-action in accordance with the Fund’s Credit Risk Policy and Model Review Guidelines. The rating is based on internal models, which analyse and summarise the transaction’s credit quality (expected loss concept), con-sidering not only quantitative parameters but also qual-itative aspects. Guarantee transactions are monitored regularly, at least quarterly; their statuses are regularly reviewed by EIF investment and risk committee which, depending on their performances, may review their internal ratings. A four-eye principle applies throughout the process, with actions initiated by the front office and reviewed by RMM.
The guarantees portfolio is valued according to a mark-to model approach under the IFRS principles. The main impact on the valuation of the transactions in the port-folio stems from the assigned ratings (internal and external as the case may be) and the possible subse-quent rating changes.
In particular following the economic and financial crisis, the Fund has increased its monitoring efforts to follow potential negative rating migrations closely. The improvement of the monitoring is not only based on the reaction to the crisis but is a continuous process. Furthermore, the Fund has strengthened the stress test-ing methodology, i.e. its scenario analysis with regard to downgrades and defaults in the portfolio and related impacts on capital allocation, expected losses, as well as on the profit and loss. As is the case for PE, stress tests on the guarantee portfolio are presented regularly to the EIF Board of Directors.

1972012 Financial Report
EIB Group Consolidated Financial Statements under IFRS
S.2. Credit risk
S.2.1. Credit risk policies
Credit risk concerns mainly the Group’s lending activi-ties and, to a lesser extent, treasury instruments such as fixed-income securities held in the investment and operational portfolios, certificates of deposit and inter-bank term deposits as well as the derivative transac-tions of the Group and the Fund’s guarantee transactions funded by own resources. No credit risk is attached to the Group’s venture capital operations, which are performed entirely through equity participa-tions and are, hence, only exposed to market risk.
The Group’s policies on credit risk are approved by the respective governing bodies. They set out minimum credit quality levels for both borrowers and guarantors in lending operations and identify the types of security that are deemed acceptable. They also detail the mini-mum requirements which loan contracts must meet in terms of key legal clauses and other contractual stipu-lations to ensure that the Bank’s position ranks at least equal to that of other senior lenders, with prompt access to security when required. In addition, via a counterparty and sector limit system, the credit poli-cies ensure an acceptable degree of diversification in the Group’s loan portfolio. The Group’s limit system draws its inspiration from the traditional prudential
regulations on concentration and large exposure man-agement contained in the EU banking directives, though the Group generally adopts a more restrictive approach to risk-taking than commercial banks. They also set out the minimum credit quality of counterpar-ties of derivatives and treasury transactions as well as the contractual framework for each type of transaction. Following approval of the cash capital increase by the heads of state and government of the EU member states, the Bank has expanded the CRPG by a dedi-cated chapter on the remedy of non-compliance events with bank intermediaries, and a dedicated chapter for incremental new lending in connection with the additional capital.
As regards lending, treasury and derivatives operations, credit risk is managed by an independent Risk Manage-ment Directorate (RM) under the direct responsibility of the Management Committee of the Bank. The Group has thus established an operationally independent structure for determining and monitoring credit risk.
The Fund manages exposures and risks in the frame of conservative policies deriving from statutory provisions and Credit Risk Policy Guidelines approved by the Fund’s Board of Directors or guidelines as set out under mandates. Credit policies undergo periodic adaptations to incorporate evolving operational circumstances and respond to new mandates that the Group may receive from its shareholders.
S.2.2. Maximum exposure to credit risk without taking into account any collateral and other credit enhancements
The table below shows the maximum exposure to credit risk for the components of the balance sheet, including deriva-tives. The maximum exposure is shown gross, before the effect of mitigation through the use of collateral agreements (Note S.2.3.4).
Maximum exposure (in EUR million) 31.12.2012 31.12.2011
Financial assets:
Loans and receivables 343 434 329 049
Financial assets held for trading 1 465 1 687
Derivative assets held for risk management 55 886 49 538
Financial assets designated at fair value through profit or loss 127 031 104 652
Financial assets – Available-for-sale 6 036 6 122
Financial assets – Held-to-maturity 23 389 20 106
Other receivables 9 992 0
Total 567 233 511 154
Off-balance-sheet:
Contingent liabilities 3 633 3 683
Commitments
– Undisbursed loans 81 916 85 807
– Undisbursed Venture Capital operations 2 088 1 956
– Other 1 252 990
Total 88 889 92 436
Total credit risk exposure 656 122 603 590

198 Financial Report 2012
S.2.3. Credit risk on loans
S.2.3.1. Credit risk measurement for loans and advances to customers and credit institutions
An internal loan grading system (based on the expected loss methodology) is implemented for lending opera-tions. This is an important part of the loan appraisal pro-cess and of credit risk monitoring, as well as providing a reference point for pricing credit risk when appropriate.
The loan grading (LG) system comprises the methodolo-gies, processes, databases and IT systems supporting the assessment of credit risk in lending operations and the quantification of expected loss estimates. It summa-rises a large amount of information with the purpose of offering a relative ranking of loans’ credit risks. LGs reflect the present value of the estimated level of the lifetime “expected loss”, this being the product of the probability of default, the exposure at risk and the loss severity in the case of default. LGs are used for the following purposes:
• as an aid to a finer and more quantitative assess-ment of lending risks;
• as help in distributing monitoring efforts;
• as a description of the loan’s portfolio quality at any given date;
• as a benchmark for calculating the annual additions to the General loan reserve; and
• as an input in risk-pricing decisions.
The following factors enter into the determination of an LG:
i) The borrower’s creditworthiness: RM independently reviews borrowers and assesses their creditworthi-ness based on internal methodologies and external data. In line with the Basel II Internal Ratings Based Approach chosen, the Bank has developed an inter-nal rating methodology (IRM) to determine the in-ternal ratings of borrowers and guarantors. This is based on a set of scoring sheets specific to defined counterparty types.
ii) The default correlation: it quantifies the chances of simultaneous financial difficulties arising for both the borrower and the guarantor. The higher the cor-relation between the borrower and the guarantor’s default, the lower the value of the guarantee and therefore the lower (worse) the LG.
iii) The value of guarantee instruments and of securi-ties: this value is assessed on the basis of the combi-nation of the issuer’s creditworthiness and the type of instrument used.
iv) The contractual framework: a sound contractual framework will add to the loan’s quality and enhance its internal grading.
v) The loan’s duration or, more generally, the cash-flows of the loan: all else being equal, the longer the loan, the higher the risk of incurring difficulties in the servicing of the loan.
A loan’s expected loss is computed by combining the five elements discussed above and is used as a compo-nent of the fair value measurement technique used for loans which meet the eligibility criteria of the amended fair value option and which have been designated on initial recognition at fair value through profit or loss. Depending on the level of this expected loss, a loan is assigned to one of the following LG classes listed below.
A Prime quality loans: there are three sub-categories. A° comprises all EU sovereign risks, i.e. loans granted to or fully, explicitly and unconditionally guaranteed by Member States, where no repayment difficulties are expected and for which an unexpected loss of 0% is allocated (based on the Bank’s preferred credi-tor status and statutory protection). A+ denotes loans granted to (or guaranteed by) entities other than Member States, with no expectation of deterio-ration over their duration. A- includes those lending operations where there is some doubt about the maintenance of their current status (for instance be-cause of a long maturity, or for the high volatility of the future price of an otherwise excellent collateral), but where any downside is expected to be quite limited.
B High quality loans: these represent an asset class with which the EIB feels comfortable, although a minor deterioration is not ruled out in the future. B+ and B- are used to denote the relative likelihood of the possibility of such deterioration occurring.
C Good quality loans: an example could be unsecured loans to solid banks and corporates with a 7-year bullet, or equivalent amortising, maturity at dis-bursement, with adequate protective clauses.
D This rating class represents the borderline between “acceptable quality” loans (D+) and those that have a risk profile greater than generally accepted by the Bank (D-) and are classified as Special Activities. These are undertaken under specific policies, includ-ing size restrictions, the allocation of Special Activity Reserve (SAR) and dedicated risk pricing rules. Loans in the D- category, which have experienced a deteri-oration from their original better classification, are subject to heightened monitoring.
E This LG category includes loans that have explicitly been approved as Special Activities with a risk pro-file greater than generally accepted, and loans which in the course of their lives have experienced

1992012 Financial Report
EIB Group Consolidated Financial Statements under IFRS
severe problems and their sliding into a situation of loss cannot be excluded. A corresponding allocation to the Special Activities Reserve is being made and the loans are subject to close monitoring. The sub-classes E+ and E- further differentiate the risk profile of the loans, with those operations graded E- being in a position where there is a possibility that debt service cannot be maintained on a timely basis and therefore some form of debt restructuring may be required, possibly leading to an impairment loss.
F F (fail) denotes loans representing unacceptable risks. F- graded loans can only arise out of outstanding transactions that have experienced, after signature, unforeseen, exceptional and dramatic adverse cir-cumstances. All operations where there is a loss of principal are graded F and a specific provision is applied.
Generally, loans internally graded D- or below are placed on the Watch List. However, if a loan was origi-nally approved with a risk profile of D- or weaker, it will only be placed on the Watch List as a result of a material credit event causing a deterioration of its LG classifica-tion below the one at approval.
In addition to the deal-by-deal analysis of each loan, the EIB, using an external credit risk software package, also develops a portfolio view of credit exposures via its Economic Capital framework, integrating the concen-tration and correlation effects created by the depend-ence of various obligors on common risk factors. By adding a portfolio dimension of credit risks and by focussing on unexpected losses (i.e. losses which may occur on top of the expected ones up to a certain level of confidence), it is possible to complement the LG’s deal-by-deal approach and thus provide a finer and more comprehensive risk assessment of the credit risks in the EIB’s loan book.
Loan renegotiation and forbearance - The EIB considers loans that are unsecured or have weak security to be for-born if in response to adverse changes in the financial position of a borrower the EIB renegotiates the original terms of the contractual arrangements with this borrower affecting directly the future cash flows of the financial instrument, which may result in a loss to the Bank.
In the normal course of business, the Loan Grading (LG) of the loans in question would have deteriorated and the loan would have been included in the Watch List before renegotiation. Once renegotiated, EIB will con-tinue to closely monitor these loans. If the renegotiated payment terms will not recover the original carrying amount of the asset, it will be considered as impaired.
The corresponding impairment will be calculated based on the forecasted cash flows discounted at the original effective interest rate. The need for an impairment for all loans whose LG deteriorated to E- is assessed regularly; all loans with a LG of F require an impairment. Once the Loan Grading of a loan has improved sufficiently, it will be removed from the Watch List.
Exposures subject to changes in contractual terms which do not affect future cash flows, such as collateral or other security arrangements or the waiver of contrac-tual rights under covenants, are not considered as for-born and hence those events are not considered as sufficient to indicate impairment on their own.
In 2012, 11 loans have undergone renegotiations. The disbursed exposures to these loans amounted to EUR 1 152 million as of 31 December 2012. Of these, one loan with a disbursed exposure of EUR 88 million has been successfully restructured. Of the renegotiated loans, seven with a total exposures of EUR 632 million were considered as impaired as at 31 December 2012 and impairments have been recognised for a total amount of EUR 213 million. During the year, the Bank also wrote off EUR 34.6 million on one renegotiated operation against an impairment previously recognised on this operation. Two loans with a disbursed exposure of EUR 432 million were under restructuring without impairment.
S.2.3.2. Loans secured by Guarantees of the European Union budget or the Member States
Loans outside the European Union (apart from those under the Facilities(1)) are, in the last resort, secured by guarantees of the European Union budget or the Mem-ber States (loans in the ACP Countries and the OCT). The agreements decided by the Council of the European Union on 14 April 1997 (Decision 97/256/EC) introduced the concept of risk sharing whereby certain loans of the Bank, including some which are secured by third-party guarantees with respect to the commercial risk, are cov-ered by the budgetary guarantee applying in the case of political risks solely arising from currency non- transferability, expropriation, war and civil disturbance.
In accordance with the terms of the Guarantees, the European Union and the Member States secure up to 65%, 70%, 75% and 100% of pool of signed(2) operations in each portfolio. This results in an effectively full cover-age of the Group’s exposure. For this reason, the Group deems the credit risk associated to each individual loan as fully covered and therefore excludes them from the section S.2.3 (Group’s lending activities).
(1) Loans granted under Article 16 (previously Article 18) of the Bank’s statute and loans granted under the Pre Accession Facility, the Mediterranean Part-nership Facility, the Energy Sustainability Facility and the EFTA Facility. These loans, granted under the Facilities, are not secured by guarantees of the European Union budget or the Member States. Therefore, lending under the Facilities is from the Bank’s own resources and at the Bank’s own risk.
(2) Under the Guarantee Agreement with the Commission signed on 1 and 29 August 2007, all European Union guaranteed operations signed on and after 17 April 2007 shall be covered up to 65% of “the aggregate amount of credits disbursed”. The residual risk borne by the Group in connection with opera-tions is managed in accordance with the Group’s fundamental credit rules and procedures.
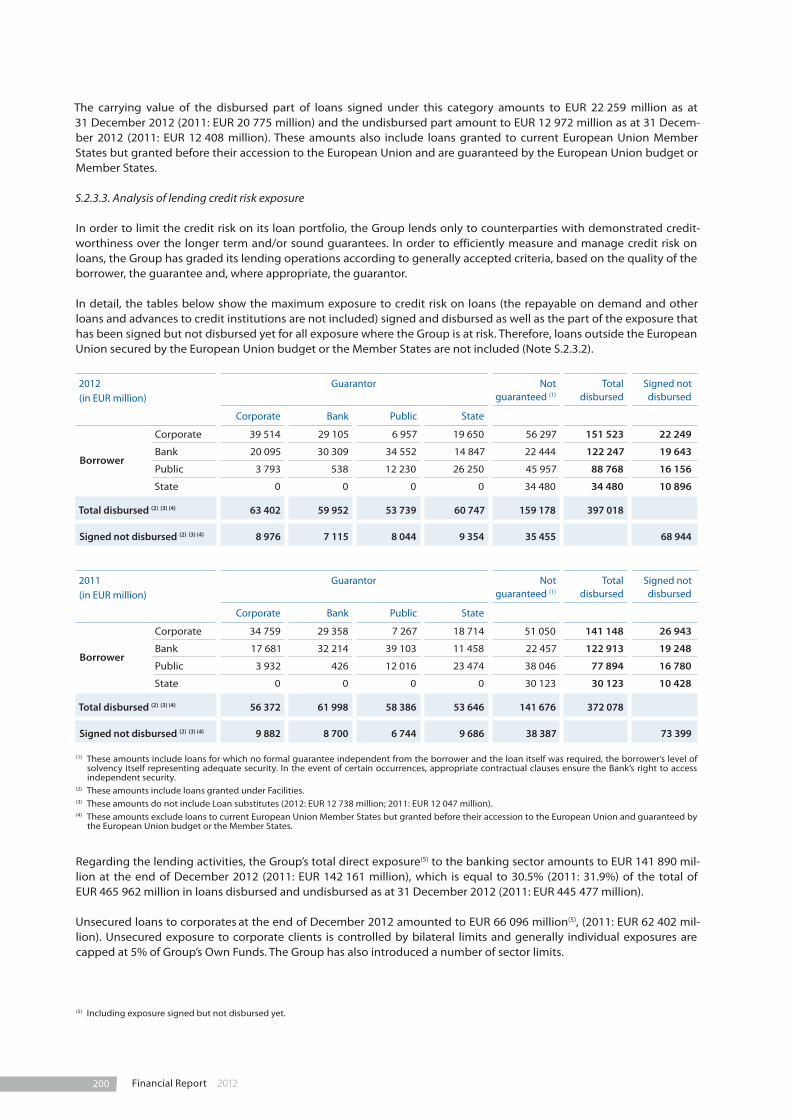
200 Financial Report 2012
The carrying value of the disbursed part of loans signed under this category amounts to EUR 22 259 million as at 31 December 2012 (2011: EUR 20 775 million) and the undisbursed part amount to EUR 12 972 million as at 31 Decem-ber 2012 (2011: EUR 12 408 million). These amounts also include loans granted to current European Union Member States but granted before their accession to the European Union and are guaranteed by the European Union budget or Member States.
S.2.3.3. Analysis of lending credit risk exposure
In order to limit the credit risk on its loan portfolio, the Group lends only to counterparties with demonstrated credit-worthiness over the longer term and/or sound guarantees. In order to efficiently measure and manage credit risk on loans, the Group has graded its lending operations according to generally accepted criteria, based on the quality of the borrower, the guarantee and, where appropriate, the guarantor.
In detail, the tables below show the maximum exposure to credit risk on loans (the repayable on demand and other loans and advances to credit institutions are not included) signed and disbursed as well as the part of the exposure that has been signed but not disbursed yet for all exposure where the Group is at risk. Therefore, loans outside the European Union secured by the European Union budget or the Member States are not included (Note S.2.3.2).
2012(in EUR million)
Guarantor Notguaranteed (1)
Total disbursed
Signed not disbursed
Corporate Bank Public State
Borrower
Corporate 39 514 29 105 6 957 19 650 56 297 151 523 22 249
Bank 20 095 30 309 34 552 14 847 22 444 122 247 19 643
Public 3 793 538 12 230 26 250 45 957 88 768 16 156
State 0 0 0 0 34 480 34 480 10 896
Total disbursed (2) (3) (4) 63 402 59 952 53 739 60 747 159 178 397 018
Signed not disbursed (2) (3) (4) 8 976 7 115 8 044 9 354 35 455 68 944
2011(in EUR million)
Guarantor Notguaranteed (1)
Total disbursed
Signed not disbursed
Corporate Bank Public State
Borrower
Corporate 34 759 29 358 7 267 18 714 51 050 141 148 26 943
Bank 17 681 32 214 39 103 11 458 22 457 122 913 19 248
Public 3 932 426 12 016 23 474 38 046 77 894 16 780
State 0 0 0 0 30 123 30 123 10 428
Total disbursed (2) (3) (4) 56 372 61 998 58 386 53 646 141 676 372 078
Signed not disbursed (2) (3) (4) 9 882 8 700 6 744 9 686 38 387 73 399
(1) These amounts include loans for which no formal guarantee independent from the borrower and the loan itself was required, the borrower’s level of solvency itself representing adequate security. In the event of certain occurrences, appropriate contractual clauses ensure the Bank’s right to access independent security.
(2) These amounts include loans granted under Facilities.(3) These amounts do not include Loan substitutes (2012: EUR 12 738 million; 2011: EUR 12 047 million).(4) These amounts exclude loans to current European Union Member States but granted before their accession to the European Union and guaranteed by
the European Union budget or the Member States.
Regarding the lending activities, the Group’s total direct exposure(5) to the banking sector amounts to EUR 141 890 mil-lion at the end of December 2012 (2011: EUR 142 161 million), which is equal to 30.5% (2011: 31.9%) of the total of EUR 465 962 million in loans disbursed and undisbursed as at 31 December 2012 (2011: EUR 445 477 million).
Unsecured loans to corporates at the end of December 2012 amounted to EUR 66 096 million(5), (2011: EUR 62 402 mil-lion). Unsecured exposure to corporate clients is controlled by bilateral limits and generally individual exposures are capped at 5% of Group’s Own Funds. The Group has also introduced a number of sector limits.
(5) Including exposure signed but not disbursed yet.

2012012 Financial Report
EIB Group Consolidated Financial Statements under IFRS
S.2.3.3.1. Credit quality on loans
Loans internally graded A to D+ represent 93.8% of the loan portfolios as at 31 December 2012, compared with 95.0% at 31 December 2011. The share of loans internally graded D- and below (for which allocations to the Special Activities Reserve are being made), was 6.2% (2011: 5.0%) of the risk portfolio, corresponding to EUR 28.7 billion (2011: EUR 22.2 billion).
The evolution of the LG breakdown was influenced by both the share of new Special Activities signatures (SFF/LGTT/RSFF) as part of the overall new business volume in 2012, and a significant number of counterparty ratings downgrades, often sovereign induced. Such downgrades of borrowers and/or guarantors have led to a negative migration of the Loan Grading of affected loans over the year. In turn, these movements in the internal Loan Grading have resulted in a growth of the internal Watch List of loans which are subject to heightened monitoring (all loans with an internal grad-ing of D- to F, other than SFF/LGTT/RSFF transactions unless downgraded post signature), which increased to EUR 12 418 million (2011: EUR 7 073 million).
To mitigate credit risk, the Group uses, amongst others, the following instruments:
• Guarantees issued by third parties of acceptable credit quality;
• Financial collaterals;
• Mortgages, claims on revenues etc.
All credit risk mitigation instruments accepted by the Group have been defined in the Credit Risk Policy Guidelines.
Credit quality analysis per type of borrower
The tables below show the credit quality analysis of the Group’s loans portfolio as at 31 December 2012 and 31 Decem-ber 2011 by the Loan Grading application, based on the exposures signed (disbursed and undisbursed).
2012(in EUR million)
Sovereign High Grade Standard Grade
Min. Accept. Risk
High Risk Total
A0, P A to B- C D+ D- and below
Borrower
Corporate 19 472 62 363 36 589 31 644 23 704 173 772
Bank 13 076 99 762 15 582 9 536 3 934 141 890
Public 26 550 58 253 14 243 5 055 823 104 924
State 42 935 0 1 900 341 200 45 376
Total 102 033 220 378 68 314 46 576 28 661 465 962
2011(in EUR million)
Sovereign High Grade Standard Grade
Min. Accept. Risk
High Risk Total
A0, P A to B- C D+ D- and below
Borrower
Corporate 19 058 60 350 40 590 29 733 18 359 168 090
Bank 11 373 109 873 14 735 3 671 2 510 142 162
Public 23 419 65 083 3 790 1 032 1 350 94 674
State 38 375 0 1 747 429 0 40 551
Total 92 225 235 306 60 862 34 865 22 219 445 477
With the decision in favour of the Internal ratings based approach of Basel II, the Group has introduced an internal rat-ing methodology in 2006. The majority of the Group’s counterparties have been assigned an internal rating according to this methodology. The table below shows a breakdown of the Group’s loan portfolio by the higher of the ratings of the borrower or guarantor (where applicable), based on the internal rating, where available. In cases where an internal rating is not available yet, the external rating has been used for this analysis.
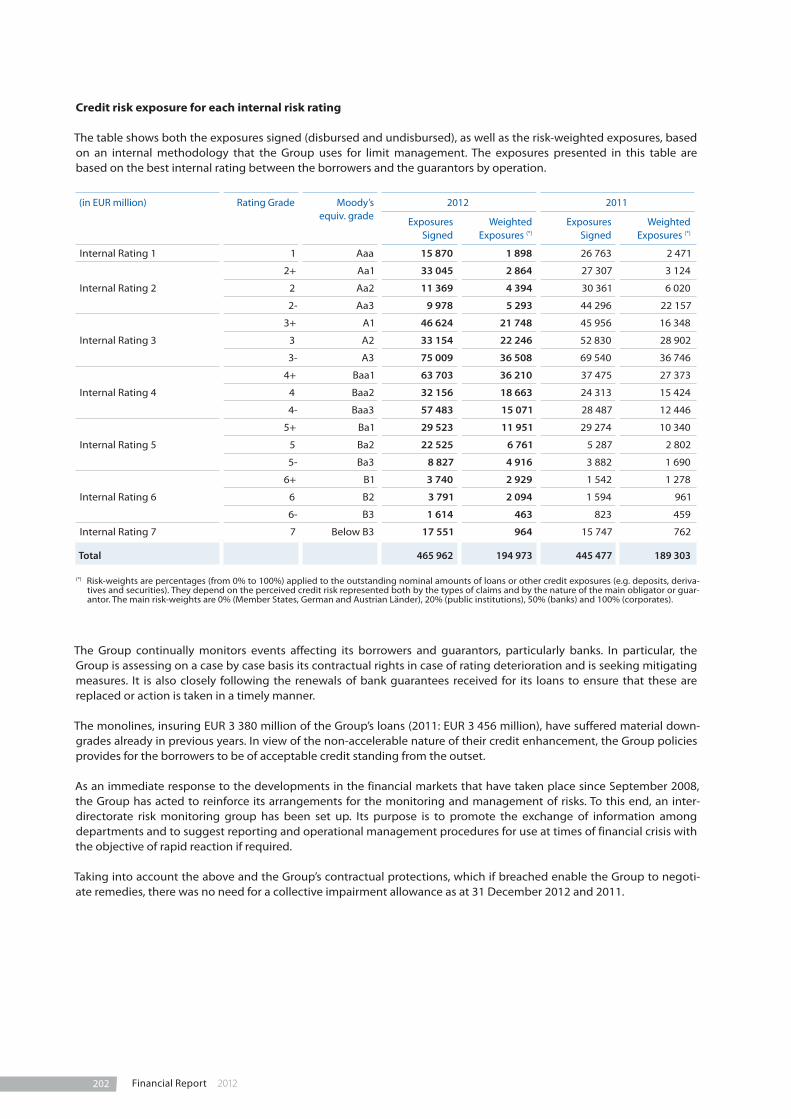
202 Financial Report 2012
Credit risk exposure for each internal risk rating
The table shows both the exposures signed (disbursed and undisbursed), as well as the risk-weighted exposures, based on an internal methodology that the Group uses for limit management. The exposures presented in this table are based on the best internal rating between the borrowers and the guarantors by operation.
(in EUR million) Rating Grade Moody’s equiv. grade
2012 2011
Exposures Signed
Weighted Exposures (*)
Exposures Signed
Weighted Exposures (*)
Internal Rating 1 1 Aaa 15 870 1 898 26 763 2 471
Internal Rating 2
2+ Aa1 33 045 2 864 27 307 3 124
2 Aa2 11 369 4 394 30 361 6 020
2- Aa3 9 978 5 293 44 296 22 157
Internal Rating 3
3+ A1 46 624 21 748 45 956 16 348
3 A2 33 154 22 246 52 830 28 902
3- A3 75 009 36 508 69 540 36 746
Internal Rating 4
4+ Baa1 63 703 36 210 37 475 27 373
4 Baa2 32 156 18 663 24 313 15 424
4- Baa3 57 483 15 071 28 487 12 446
Internal Rating 5
5+ Ba1 29 523 11 951 29 274 10 340
5 Ba2 22 525 6 761 5 287 2 802
5- Ba3 8 827 4 916 3 882 1 690
Internal Rating 6
6+ B1 3 740 2 929 1 542 1 278
6 B2 3 791 2 094 1 594 961
6- B3 1 614 463 823 459
Internal Rating 7 7 Below B3 17 551 964 15 747 762
Total 465 962 194 973 445 477 189 303
(*) Risk-weights are percentages (from 0% to 100%) applied to the outstanding nominal amounts of loans or other credit exposures (e.g. deposits, deriva-tives and securities). They depend on the perceived credit risk represented both by the types of claims and by the nature of the main obligator or guar-antor. The main risk-weights are 0% (Member States, German and Austrian Länder), 20% (public institutions), 50% (banks) and 100% (corporates).
The Group continually monitors events affecting its borrowers and guarantors, particularly banks. In particular, the Group is assessing on a case by case basis its contractual rights in case of rating deterioration and is seeking mitigating measures. It is also closely following the renewals of bank guarantees received for its loans to ensure that these are replaced or action is taken in a timely manner.
The monolines, insuring EUR 3 380 million of the Group’s loans (2011: EUR 3 456 million), have suffered material down-grades already in previous years. In view of the non-accelerable nature of their credit enhancement, the Group policies provides for the borrowers to be of acceptable credit standing from the outset.
As an immediate response to the developments in the financial markets that have taken place since September 2008, the Group has acted to reinforce its arrangements for the monitoring and management of risks. To this end, an inter-directorate risk monitoring group has been set up. Its purpose is to promote the exchange of information among departments and to suggest reporting and operational management procedures for use at times of financial crisis with the objective of rapid reaction if required.
Taking into account the above and the Group’s contractual protections, which if breached enable the Group to negoti-ate remedies, there was no need for a collective impairment allowance as at 31 December 2012 and 2011.

2032012 Financial Report
EIB Group Consolidated Financial Statements under IFRS
The Group did not record impairments in respect of its EU sovereign and sovereign guaranteed exposure as at the year end as the preferred creditor status of the Bank as well as of the EIF and the protection given by the Bank’s Statute are deemed to guarantee a full recovery of the Group’s assets on maturity.
The table below discloses information regarding the sovereign credit risk on loans granted inside the European Union and outside the European Union granted under the Facilities and under the risk-sharing operations:
(in EUR million) 2012 2011
Acting as borrower Acting as guarantor
Acting as borrower Acting as guarantor
Country Disbursed Undisbursed Signed Disbursed Undisbursed Signed
Austria 0 0 30 0 0 32
Belgium 627 0 183 0 0 902
Bulgaria 356 767 0 242 859 0
Cyprus 844 239 895 659 239 709
Czech Republic 2 786 446 356 2 731 589 404
Denmark 0 0 409 0 0 443
Estonia 551 0 169 165 385 118
Finland 338 0 625 389 0 1 033
France 0 0 1 056 0 0 1 192
Germany 0 0 1 780 0 0 1 829
Greece 8 396 340 7 343 7 796 560 7 058
Hungary 4 759 1 768 1 531 4 172 1 120 1 596
Ireland 0 0 697 0 0 682
Italy 1 342 0 3 240 1 247 0 3 705
Latvia 455 525 289 411 525 218
Lithuania 1 195 0 0 1 039 112 0
Luxembourg 0 0 114 0 0 140
Malta 0 0 338 0 0 292
Netherlands 0 0 0 0 0 30
Poland 7 409 1 482 12 763 6 905 1 002 10 444
Portugal 604 1 050 7 272 526 600 6 882
Romania 1 409 1 995 334 1 012 2 356 325
Slovakia 1 225 350 30 784 650 0
Slovenia 35 500 2 163 39 0 2 152
Spain 990 0 21 960 1 109 0 17 602
Sweden 0 0 139 0 0 580
United Kingdom 0 0 1 372 0 0 1 655
Non EU-countries 1 159 1 434 5 013 897 1 431 3 309
Total 34 480 10 896 70 101 30 123 10 428 63 332
In addition, as stated in the note S.2.3.2, loans outside the European Union (apart from those under the Facilities) are in the last resort secured by guarantees of the European Union budget or the Member States (loans in the ACP Countries and the OCT). The nominal amount of loans signed under this category as at 31 December 2012 amounts to EUR 40 919 million (2011: EUR 39 044 million). Out of this EUR 40 919 million, EUR 38 391 million (2011: EUR 36 675 mil-lion) were guaranteed by the European Union and EUR 2 528 million by the Member States (2011: EUR 2 369 million).

204 Financial Report 2012
S.2.3.3.2. Risk concentrations of maximum exposure to credit risk on loans
The Group’s loans portfolio can be analysed by the following geographical regions (based on the country of the borrower):
(in EUR million) 2012 2011
Exposures signed Weighted exposures (4) Exposures signed Weighted exposures (4)
EU (1) 445 864 187 293 427 629 182 279
Thereof :
- Germany 55 130 21 290 56 040 19 892
- Spain 73 049 20 662 69 477 20 395
- Italy 59 138 35 235 56 489 33 078
- France 44 318 21 435 43 227 21 506
- United Kingdom 33 502 25 948 33 259 25 072
Enlargement countries (2) 10 531 2 481 8 990 2 226
Partner countries (3) 9 567 5 199 8 858 4 798
Total 465 962 194 973 445 477 189 303
(1) Including loans outside the EU, approved by the Board of Governors according to Article 16 (previously Article 18) of the Bank’s Statute, as well as loans in EFTA countries.
(2) Enlargement Countries as per end 2012 include Albania, Bosnia and Herzegovina, Croatia, Serbia, Montenegro, Turkey, and FYROM.(3) Loans in Partner Countries include loans under the Mediterranean Partnership Facility, the Pre-Accession Facility, and Risk Sharing loans.(4) Risk-weights are percentages (from 0% to 100%) applied to the outstanding nominal amounts of loans or other credit exposures (e.g. deposits, deriva-
tives and securities). They depend on the perceived credit risk represented both by the types of claims and by the nature of the main obligator or guar-antor. The main risk-weights are 0% (Member States, German and Austrian Länder), 20% (public institutions), 50% (banks) and 100% (corporates).
A critical element of risk management is to ensure adequate diversification of credit exposures. The Group tracks its global exposure by industry (shown in the following table), paying particular attention to industries that might be cycli-cal, volatile or undergoing substantial changes.
An industry sector analysis of the Group’s loan portfolio (based on the industry sector of the borrower) is as follows:
(in EUR million) 2012 2011
Exposures signed Weighted exposures (1) Exposures signed Weighted exposures (1)
Energy 45 549 32 982 43 043 32 003
Transport 46 272 17 810 45 668 17 919
Telecommunications 8 273 6 042 8 784 6 731
Water and sewerage 16 327 8 875 14 251 7 960
Miscellaneous Infrastructure 3 406 1 611 4 368 1 768
Agriculture, forestry and fisheries 113 26 119 29
Industry 29 256 23 113 29 498 22 982
Services(2) 310 877 103 028 294 223 98 459
Health and education 5 889 1 486 5 523 1 452
Total 465 962 194 973 445 477 189 303
(1) Risk-weights are percentages (from 0% to 100%) applied to the outstanding nominal amounts of loans or other credit exposures (e.g. deposits, deriva-tives and securities). They depend on the perceived credit risk represented both by the types of claims and by the nature of the main obligator or guar-antor. The main risk-weights are 0% (Member States, German and Austrian Länder), 20% (public institutions), 50% (banks) and 100% (corporates).
(2) The category “Services” includes the credit exposure of the banking sector. At the end of 2012, the total amount of loans directly exposed to counter-parts of the banking sector amounted to EUR 141 890 million (EUR 142 161 million at the end of 2011), or EUR 57 154 million in risk-weighted terms (EUR 56 047 million at the end of 2011). Exposure to bank counterparts is subject to limits approved by the Management Committee. In specific cases, available limits have been temporarily suspended, restricted or withdrawn. The Group systematically follows on daily basis publicly available news and, in particular, external rating movements. On top of the traditional loan exposures to the banking sector there is an amount of EUR 59 952 million (2011: EUR 61 998 million) in the form of guarantees received from financial institutions at the end of December 2012, of which EUR 3 380 million (2011: EUR 3 456 million) represents exposure to monoline insurers.
The Group places limits on the maximum amount that can be lent to a single borrower, group of debtors or sectors. In addition, it follows the evolution of credit risk concentration using the concept of Credit Value at Risk (CVaR). This is done using a tool for assessing portfolio risk due to changes in debt value caused by changes in obligor credit qual-ity. Importantly, this methodology assesses risk within the full context of a portfolio and addresses the correlation of credit quality moves across obligors. This allows the Group to directly calculate the diversification benefits or potential over-concentrations across the portfolio.

2052012 Financial Report
EIB Group Consolidated Financial Statements under IFRS
The table below shows the concentration indexes the Group follows as at 31 December 2012 and 31 December 2011:
Largest nominal and risk-weighted Group exposures(1) 31.12.2012 31.12.2011
Nominal exposures (% of Group Loan Portfolio):
– Top 3 4.7% 5.4%
– Top 5 7.2% 8.4%
– Top 10 12.2% 14.0%
N° of exposures (% of Group Own Funds):
– over 10% 10 9
– over 15% 3 5
– over 20% 1 2
N° of SSSR exposures over 5% of Group Own Funds(2) 2 2
Sum of all large risk-weighted exposures (% of Group Own Funds)(3) 111.0% 115.0%
(1) Including also the net market exposure of treasury operations.(2) The term “single signature and single risk” (or for brevity, “unsecured” or “SSSR”) is used to indicate those lending operations where the Group, irrespec-
tive of the number of signatures provided, has no genuine recourse to an independent third party, or to other forms of autonomous security.(3) The Group defines a Large Individual Exposure as a consolidated group exposure that, when computed in risk-weighted terms, is at or above 5% of the
Group’s own funds. This definition applies to borrowers or guarantors, excluding loans to Member States and loans fully covered by an explicit guaran-tee from, or secured by bonds issued by Member States.
S.2.3.4. Collateral on loans
In addition to the guarantees received by the Group on its lending exposures as disclosed in the note S.2.3.3, the Group also uses pledges of financial securities. These pledges are formalised through a Pledge Agreement, enforceable in the relevant jurisdiction. The portfolio of collateral received in pledge contracts amounts to EUR 27 223 million at the end of 2012 (2011: EUR 20 642 million).
The fair value of the portfolio of collateral received by the Group under pledge contracts that the Group is allowed to sell or repledge amounts to EUR 6 753 million (2011: EUR 6 190 million). None of these collaterals has been sold or re-pledged to third parties.
Fair value of collateral held against disbursed loans is shown below:
(in EUR million) Gross exposure
Collateral held Net exposure
Bonds Equities Cash Total
1. Against individually impaired 1 161 710 0 28 738 423 (1)
2. Against collectively impaired 0 0 0 0 0 0
3. Against past due but not impaired 518 0 0 0 0 518
4. Against neither past due nor impaired 266 637 20 880 318 1 524 22 722 243 915
5. Against fair value through profit and loss 150 961 3 480 0 283 3 763 147 198
Total 2012 419 277 25 070 318 1 835 27 223 392 054
Total 2011 392 853 19 531 168 943 20 642 372 211
(1) The carrying value of loans individually impaired amounts to EUR 1 161 million as at 31 December 2012 (2011: EUR 353 million). Impairments on these loans have been accounted for and amount to EUR 341.5 million as of 31 December 2012 (2011: EUR 192.8 million). The Group has also received addi-tional security from the counterparties of these loans in the form of debts acknowledgement which covers the remaining exposure.

206 Financial Report 2012
S.2.3.5 Arrears on loans
Amounts in arrears are identified, monitored and reported according to a set of procedures called the
“Guidelines for the Monitoring of late payments”.
Loans granted inside the European Union or outside the European Union not secured by guarantees of the Euro-pean Union budget or the Member States:
Loans for projects located inside the European Union or outside the European Union not secured by guarantees of the European Union budget or the Member States are mainly secured by guarantees from public institu-tions, banks and corporate entities. Unsecured part of these loans amounts to EUR 194 633 million as at 31 December 2012 (2011: EUR 180 063 million).
As at 31 December 2012, the arrears above 30 days on loans granted inside the European Union or outside the
European Union not secured by guarantees of the Euro-pean Union budget or the Member States amount to EUR 41.6 million (2011: 1.3 million).
Loans granted for projects outside the European Union secured by the European Union budget or the Member States
Loans for projects located outside the European Union and carried out on the basis of mandates given by the Council are guaranteed by the European Union, the Member States or on a risk-sharing basis. If an instal-ment remains unpaid for over 90 days, the primary guarantee is called (if any available). If the due amount is still unpaid within 150 days after the instalment date (and in any case before the next instalment becomes due), the guarantee of the Member States or the Euro-pean Union is officially invoked. Each unpaid instalment is called individually.
The arrears of payments on these loans can be analysed as follows (in EUR 000):
31.12.2012 31.12.2011
Instalments overdue 30 to 90 days 4 917 4 714
Instalments overdue more than 90 days 17 684 2 726
Instalments overdue more than 150 days which have been called and paid under the guarantee of a Member State or the EU 147 193 108 665
Total 169 794 116 105
S.2.3.6. Securitised loans and loan substitutes
Regarding the Group’s exposure to securitised loans and loan substitutes, this portfolio comprises Covered Bonds and Asset Backed Securities (ABS). Covered Bonds offer full recourse to the issuer, while ABS are issued by Special Purpose Vehicles backing the underly-ing issues. Some of these transactions have been struc-tured by adding a credit or project related remedies, thus offering additional recourse.
As of 31 December 2012, the securitised loans and loan substitutes amount to EUR 19 693 million (2011: EUR 19 914 million). This amount is composed of EUR 12 738 million (2011: EUR 12 047 million) of loan substi-tutes included in debt securities portfolio (Note B.2) and of EUR 6 955 million (2011: EUR 7 867 million) of securi-tised loans included in loans and advances to credit institutions and to customers (Note D).

2072012 Financial Report
EIB Group Consolidated Financial Statements under IFRS
While for Covered Bonds, the majority of covered assets are based on residential mortgages, most of the ABS structures are based on SME.
Aside from six Diversified Payments Rights (DPR) trans-actions with Turkish promoters and two Turkish Cov-ered Bonds (amounting to EUR 124 million (2011: EUR 723 million)), all the promoters of the Bank’s Loan Substitutes portfolio are domiciled in the European Union, with the majority being located in Spain (68%), in Italy (15%) and in Portugal (5%).
EUR 1 650 million (8%) of the outstanding securitised loans have one external AAA rating, EUR 4 860 million (25%) have at least one AA rating, EUR 10 673 million (54%) at least one single A rating, EUR 1 950 million (10%) a BBB rating and EUR 560 million (3%) a BB rating.
During 2012, 50 issuance programmes with a total vol-ume of EUR 15 770 million experienced external rating downgrades. Despite these downgrades, the Group’s securitised loan and loan substitute portfolio continues to perform as scheduled.
Embedded credit mitigants and requirements imposed by the regulation and rating agencies are the
initial remedies which are triggered in case of credit event on the issuer. As mentioned above, in some ABS transactions credit or project remedies are available and represent a second way out. Overall, no securi-tised loan or loan substitute transaction is on the Bank’s Watch List.
S.2.4. Credit risk on treasury transactions
S.2.4.1. Credit risk measurement on treasury transactions
Treasury investments are divided into three categories: (i) monetary treasury assets, with the primary objective of maintaining liquidity, (ii) operational bond portfolios, as a second liquidity line, and (iii) an investment portfo-lio composed of EU sovereign bonds. In September 2006, the Management Committee decided to gradually phase out the investment portfolio (see Note A.4.8.2.).
Credit risk policy for treasury transactions is monitored through the attribution of credit limits to the counter-parts for monetary and bond transactions. The weighted exposure for each counterpart must not exceed the authorised limits.
The following table summarises the breakdown of the securitised loans and loan substitutes portfolio by asset class (Mortgages exposure in ABS is primarily residential):
Securitised loans (in EUR million) Asset class 31.12.2012 31.12.2011
Asset Backed Securities Diversified Payment Rights 695 674
Asset Backed Securities Mortgage Backed Securities 1 715 2 229
Asset Backed Securities Small and Medium Entities 2 343 2 617
Covered Bonds Mortgage Backed Securities 11 619 12 326
Covered Bonds Public Sector 2 375 2 059
Covered Bonds Small and Medium Entities 219 0
Structured Public Sector Bonds Public Sector 7 9
Government Bonds Sovereign bonds 720 0
Total 19 693 19 914

208 Financial Report 2012
The tables below provide an illustration of the credit exposure of the Group on various treasury portfolios as at 31 December 2012 and 31 December 2011:
Credit Risk Exposures as at 31 December 2012(based on book values in EUR million)
< A or NR A AA AAA Total
A1 Portfolio max maturity 3 months 8 827 26 061 22 098 2 326 59 312
Deposits 150 5 904 2 538 566 9 158
Tripartite reverse repos 3 695 19 702 15 615 1 710 40 722
Discount paper, bonds 4 982 455 3 945 50 9 432
A2 Portfolio max maturity 18 months 210 469 589 256 1 524
Total monetary treasury assets 9 037 26 530 22 687 2 582 60 836
B1 Portfolio 133 21 266 210 630
B3 Portfolio 0 28 175 366 569
B4 Portfolio 127 0 492 277 896
BH Portfolio (futures) 0 0 0 0 0
EIF - AFS 357 66 179 151 753
Total operational bond portfolios 617 115 1 112 1 004 2 848
Group investment portfolio 587 159 202 271 1 219
Loan substitutes 1 935 5 707 4 065 1 031 12 738
Total treasury funds 12 176 32 511 28 066 4 888 77 641
Of which EU sovereign exposures 6 037 186 2 444 909 9 576
Credit Risk Exposures as at 31 December 2011(based on book values in EUR million)
< A or NR A AA AAA Total
A1 Portfolio max maturity 3 months 7 562 24 528 12 013 1 941 46 044
Deposits 112 7 177 6 697 0 13 986
Tripartite reverse repos 7 195 14 405 1 873 1 941 25 414
Discount paper, bonds 255 2 946 3 443 0 6 644
A2 Portfolio max maturity 18 months 231 781 951 272 2 235
Total monetary treasury assets 7 793 25 309 12 964 2 213 48 279
B1 Portfolio 104 151 121 318 694
B3 Portfolio 35 75 71 458 639
B4 Portfolio 1 293 0 755 1 049
BH Portfolio (futures) 0 0 1 0 1
EIF - AFS 135 247 31 164 577
Total operational bond portfolios 275 766 224 1 695 2 960
Group investment portfolio 270 293 343 509 1 415
Loan substitutes 1 660 1 519 1 745 7 123 12 047
Total treasury funds 9 998 27 887 15 276 11 540 64 701
Of which EU sovereign exposures 514 2 936 3 557 1 836 8 843

2092012 Financial Report
EIB Group Consolidated Financial Statements under IFRS
The credit risk associated with treasury (securities, com-mercial paper, term accounts, etc.) is rigorously managed through selecting sound counterparties and issuers.
Limits governing the structure of the securities portfolio and outstanding treasury instruments have been laid down by Management, in particular on the basis of internal ratings as well as ratings awarded to counter-parties by rating agencies (these limits are reviewed regularly by the Risk Management Directorate).
The total Treasury investments are distributed over dif-ferent portfolios and diversified products (deposits, securities and derivative/structured products).
S.2.4.2. Collateral on treasury transactions
Collateral received
Part of treasury transactions are tripartite reverse repur-chase agreements with a balance of EUR 40 721 million (2011: EUR 25 414 million). These transactions are gov-erned by Tripartite Agreement Guidelines and are implemented depending on the acceptability of collat-eral. The exposure is fully collateralised, with daily mar-gin calls. The market value of the collateral portfolio is monitored and additional collateral is requested when needed in accordance with the underlying agreement.
As part of the Tripartite Agreements, the Group has received securities that it is allowed to sell or re-pledge. The market value of the securities accepted under these terms as at 31 December 2012 amounts to EUR 42 049 million (2011: EUR 25 551 million). None of these securities has been sold or re-pledged to third parties in 2012 and 2011. During the 2012 and 2011 years, the Group did not take possession of any of the above mentioned collaterals.
Collateral deposited
As at 31 December 2012, the Group has deposited with the Central Bank of Luxembourg securities with a mar-ket value of EUR 3.3 billion (2011: EUR 2.2 billion).
S.2.4.3. Securities lending activity
The securities lending agreement, signed with Northern Trust Global Investment in 2003, was terminated in November 2012. The Bank engaged in no securities lending as at the year end. The market value of the bonds lent in the securities lending activities was EUR 813 million at the end of 2011.
S.2.4.4 Transferred assets that are not derecognised at the balance sheet date
No assets of the Group were transferred but not derecognised at the balance sheet date.
S.2.5. Credit risk on derivatives
S.2.5.1. Credit risk policies for derivatives
The risk policy for derivative transactions is based on the definition of eligibility conditions and rating-related limits for swap counterparts. In order to reduce credit exposures, the Group has signed Credit Support Annexes with all its active swap counterparts and receives collaterals when the exposure exceeds certain contractually defined thresholds.
The credit risk with respect to derivatives lies in the loss which the Group would incur were a counterparty una-ble to honour its contractual obligations.
In view of the special nature and complexity of the derivatives transactions, a series of procedures has been put in place to safeguard the Bank against losses arising out of the use of such instruments.
Contractual framework:
All the Group’s derivative transactions are concluded in the contractual framework of Master Swap Agreements and Credit Support Annexes, which specify the condi-tions of exposure collateralisation. These are generally accepted and practised contract types.
Counterparty selection:
The minimum rating at the outset is set at A1, but cer-tain counterparties rated A2/A3 have also been author-ised. The EIB has the right of early termination if the rating drops below a certain level.
Collateralisation:
- Generally, there is a reduced credit risk on swaps, because exposures (exceeding limited thresholds for unsecured exposure) are collateralised by cash and bonds.
- Very complex and illiquid transactions could require collateralisation over and above the current market value.
- Both the derivatives portfolio with individual coun-terparties and the collateral received are monitored and valued on a daily basis, with a subsequent call for additional collateral or release.
The amount of collateral required depends on an assess-ment of the credit risk of the counterparty. Guidelines are implemented regarding the acceptability of collater-als and valuations parameters.

210 Financial Report 2012
As part of the ISDA agreements, the Group has received securities and cash that it is allowed to sell or repledge. The fair value of the securities accepted under these terms as at 31 December amounts to EUR 35 205 million (2011: EUR 31 372 million) with the following composition:
Swap collateral (in EUR million)
Moody’s or equivalent rating Bonds Cash Total 2012
Government Agency, supranational, Pfandbriefe
Aaa 1 913 1 358 0 3 271
Aa1 to Aa3 8 370 185 0 8 555
A1 to A3 11 0 0 11
Baa1 to Baa3 12 145 0 0 12 145
Below Baa3 843 0 0 843
Non-Rated 0 0 10 380 10 380
Total 2012 23 282 1 543 10 380 35 205
Swap collateral (in EUR million)
Moody’s or equivalent rating Bonds Cash Total 2011
Government Agency, supranational, Pfandbriefe
Aaa 2 385 0 0 2 385
Aa1 to Aa3 2 224 0 0 2 224
A1 to A3 15 117 0 0 15 117
Baa1 to Baa3 6 0 0 6
Below Baa3 713 0 0 713
Non-Rated 0 0 10 927 10 927
Total 2011 20 445 0 10 927 31 372
S.2.5.2. Credit risk measurement for derivatives
The credit risk associated with derivatives varies accord-ing to a number of factors (such as interest and exchange rates) and generally corresponds to only a small portion of their notional value.
The EIB measures the credit risk exposure related to swaps and derivatives transactions using the Net Mar-ket Exposure (NME) and Potential Future Exposure (PFE) for reporting and limit monitoring, and the Credit Risk Equivalent for capital allocation according to the recom-mendations of the Basel Committee on Banking Super-vision (BCBS) sponsored by the BIS.
The EIB computes the Net Market Exposure, which is the larger of zero and the market value or “fair value” of the portfolio of transactions within the netting set with a counterparty, less the collaterals. It is the amount that would be lost upon the default of the counterparty, using the received collateral and assuming no recovery on the value of those transactions as well as immediate replacement of the swap counterparty for all the
transactions. As of 31 December 2012 the Net Market Exposure stood at EUR 3 457 million (EUR 3 670 million as of 31 December 2011).
In addition, the EIB computes the Potential Future Expo-sure (PFE), which is the possible increase in the netting set’s exposure over the margin period of risk, which ranges between 10 and 20 days, depending on the portfolio of transactions. The EIB computes PFE at 90% confidence level using stressed market parameters to arrive at conservative estimations of the Potential Future Exposure. This is in line with the recommenda-tions issued by regulators in order to take into consider-ation the conditions that will prevail in case of default of an important market participant. As of 31 December 2012 the total Potential Future Exposure (PFE) stood at EUR 16 494 million (EUR 15 565 million as of 31 Decem-ber 2011).
Limits:
The limit system for banks covers two types of exposure: Net Market Exposure and Potential Future Exposure.

2112012 Financial Report
EIB Group Consolidated Financial Statements under IFRS
The Net Market Exposure is measured by the NPV of the swap portfolio minus the amount of collaterals received. It is lim-ited by the Threshold applicable to the bank as defined in the Credit Support Annex and is dependent on the rating of the counterparty. For any exposure exceeding this Threshold, the Bank receives collaterals posted by the counterparty.
The Potential Future Exposure limit determines the maximum Potential Future Exposure, measured as explained above and reduced by overcollateralization, accepted for each counterparty.
The derivatives portfolio is valued and compared against limits on a daily basis.
As from the following table, the majority of the derivative portfolio is concentrated on counterparties rated A1 or above:
Grouped ratings Percentage of nominal Net Market Exposure(in EUR million)
Potential Future Exposure(in EUR million)
Moody’s or equivalent rating 2012 2011 2012 2011 2012 2011
Aaa 1.1% 1.2% 42 156 219 301
Aa1 to Aa3 24.6% 36.8% 1 173 1 245 4 476 9 919
A1 46.5% 35.9% 1 894 1 414 8 701 4 460
A2 to A3 22.3% 25.6% 348 841 2 863 822
Below A3 5.5% 0.5% 0 14 236 63
Total 100.0% 100.0% 3 457 3 670 16 495 15 565
The table below shows the concentration on main derivative counterparts as at 31 December 2012 and 2011:
2012 2011
Nominal Exposure (% of Group derivative portfolio):
– Top 3 23.4% 26.4%
– Top 10 56.9% 61.1%
– Top 25 91.6% 92.4%
Net Market Exposure:
– Top 3 56.9% 34.3%
– Top 10 84.4% 71.5%
– Top 25 98.2% 97.5%
Potential Future Exposure:
– Top 3 31.4% 26.8%
– Top 10 63.2% 59.7%
– Top 25 92.4% 92.1%
The following table shows the maturities of currency swaps (excluding short term currency swaps), sub-divided accord-ing to their notional amount and fair value:
Currency swaps at 31 December 2012 (in EUR million)
1 year or less More than 1 year and up
to 5 years
More than 5 years and up
to 10 years
More than 10 years
Total 2012
Notional amount 24 149 92 179 27 323 17 715 161 366
Fair value (i.e. net discounted value)(*) 982 5 089 3 036 3 198 12 305
Currency swaps at 31 December 2011 (in EUR million)
1 year or less More than 1 year and up
to 5 years
More than 5 years and up
to 10 years
More than 10 years
Total 2011
Notional amount 18 084 93 371 37 030 18 071 166 556
Fair value (i.e. net discounted value)(*) 717 4 120 4 615 3 433 12 885
(*) Including the fair value of macro-hedging currency swaps which stood at EUR 8.3 million as at 31 December 2012 (2011: EUR 282.5 million)

212 Financial Report 2012
The following table shows the maturities of interest rate swaps sub-divided according to their notional amount and fair value:
Interest rate swaps at 31 December 2012 (in EUR million)
1 year or less More than 1 year and up
to 5 years
More than 5 years and up
to 10 years
More than 10 years
Total 2012
Notional amount 44 560 187 029 78 536 122 692 432 817
Fair value (i.e. net discounted value)(*) 317 8 916 5 634 4 110 18 977
Interest rate swaps at 31 December 2011 (in EUR million)
1 year or less More than 1 year and up
to 5 years
More than 5 years and up
to 10 years
More than 10 years
Total 2011
Notional amount 36 656 179 678 74 866 110 012 401 212
Fair value (i.e. net discounted value)(*) 321 6 951 5 257 3 937 16 466
(*) Including the fair value of macro-hedging interest rate swaps which stood at EUR -648 million as at 31 December 2012 (2011: EUR -664 million)
The Group does not generally enter into any options contracts in conjunction with its risk hedging policy. However, as part of its strategy of raising funds on the financial markets at a lesser cost, the Bank enters into borrowing contracts and loans whose value depends on a variety of interest rates, FX rates, inflation rates, stock indexes and IR volatilities. Such structured borrowings and loans are entirely covered by swap contracts to hedge the corresponding market risk. All embedded option contracts are negotiated over the counter.
The Notional amount and fair value of structured swaps is included in the tables above, depending whether or not they incorporate a cross currency element. The table below further details the number, value and notional amounts of struc-tured swaps:
Early termination embedded Stock exchange index Special structure coupon or similar
2012 2011 2012 2011 2012 2011
Number of transactions 330 337 3 4 346 339
Notional amount (in EUR million) 8 821 11 302 243 615 21 332 21 285
Net discounted value (in EUR million) 1 015 1 114 4 27 142 381
The fair value of swap transactions is computed using the income approach, applying valuation techniques to convert future amounts to a single present amount (discounted). The estimate of fair value is based on the value indicated by marketplace expectations about those future amounts. Valuation techniques can range from simple discounted known cash flows to complex option models. The valuation models applied are consistent with accepted economic methodol-ogies for pricing financial instruments, and incorporate the factors that market participants consider when setting a price. For a portion of derivative transactions, internal estimates and assumptions might be used in the valuation tech-niques when the market inputs are not directly available. Generally, there is a reduced credit risk on these swaps, because security exists in the form of regularly monitored collateral.
All option contracts embedded in, or linked with, borrowings are negotiated over the counter. The structured deals include a variety of transactions dependent on interest rates, FX rates, inflation rates, stock indexes and IR volatilities.
As at 31 December 2012, no futures contracts are outstanding (2011: notional amount of EUR 386 million with a fair value of EUR - 1million).

2132012 Financial Report
EIB Group Consolidated Financial Statements under IFRS
S.2.5.3. Credit risk on guarantees and securitisations (GS)
Credit risk arising from the Group’s guarantees and securitisations transactions funded by own resources is managed by risk management policies covered by the Statutes and the Credit Risk Policy Guidelines. The Stat-utes limit own-risk guarantees to approximately EUR 9.0 billion. The EUR 3.6 billion exposure at risk at the end of 2012 (2011: 3.7 billion) was well below the statutory limit of EUR 9.0 billion.
The Credit Risk Policy Guidelines ensure that the Group continues to develop a diversified guarantee portfolio in terms of product range, geographic coverage, coun-terparty exposure, obligor exposure, industry concen-tration and also set out the capital allocation rules based on the ratings of the exposures.
Concentration risk is limited because of the granular nature of the Group’s transactions; typically the underly-ing portfolios are highly diversified in terms of single obligor concentration, sectors, and also with regard to regional diversification. To cover concentration risk, the Group has strict limits (based on capital allocation) for individual transactions and on originator level (maxi-mum aggregate exposures for originators and origina-tor groups).
In the context of the Group’s own risk guarantee opera-tions, the credit risk is tracked from the very beginning on a deal-by-deal basis whilst adopting a different model analysis approach depending on the granularity and homogeneity of the underlying portfolios. The industry sector exposures are analysed on a deal-by-deal basis through their impact on the ratings assigned by the Group to each transaction or tranche. For instance, dependent on the financial model to analyse the transaction, industry exposures can be reflected in implicit correlation or can be indirectly captured through the assumption on default rate volatility, as a key model input variable.
Furthermore, concentration exposures are analysed in the context of each deal using qualitative measures such as current status and forecast for sectors with high concentrations in the portfolio. Exceptionally, some deals have a concentrated exposure in the same (broad) sector. This is typically captured through increased credit enhancement (e.g. subordination) to the benefit of the Group. Typically, deals with replenishing features have portfolio criteria, such as maximum single obligor, maximum top five obligors, and maximum industry concentration levels. Furthermore, the consideration of sector exposures is part of the Group’s overall portfolio analysis.
Counterparty risk is mitigated by the quality of the Group’s counterparties which are usually major market players. The Group performs additional on-site monitor-ing visits to ensure compliance with procedures and processes during the transaction life. Stress-test
scenarios for the portfolio of guarantees, including extreme case assumptions, are regularly carried out to determine the ability of the capital base to sustain adverse shocks.
The exposure on guarantees granted by the Group in respect of venture capital operations amounts to EUR ‘000 40 866 as at 31 December 2012 (2011: EUR ‘000 60 524).
S.3. Liquidity risk
Liquidity risk refers to the ability of the Bank to fund increases in assets and meet obligations as they come due, without incurring unacceptable losses. It can be further split into funding liquidity risk and market liquidity risk.
Funding liquidity risk is connected to the risk for the Bank to be unable to refinance the asset side of its bal-ance sheet and to meet payment obligations punctually and in full out of readily available liquid resources. Fund-ing liquidity risk may have an impact on the volatility in the economic value of, or in the income derived from Bank’s positions, due to potentially increasing immedi-ate risks to meet payment obligations and the conse-quent need to borrow at unattractive conditions.
Market liquidity risk is the volatility in the economic value of, or in the income derived from, the Bank’s posi-tions due to potential inability to execute a transaction to offset, eliminate or reduce outstanding positions at reasonable market prices. Such an inability may force early liquidation of assets at unattractive prices when it would be better to avoid such liquidation. This risk is tied to the size of the position compared to the liquidity of the instrument being transacted, as well as to poten-tial deterioration of market availability and efficiency.
S.3.1. Liquidity risk management
Liquidity risk management of the Bank
Liquidity risk is managed prudently in order to ensure the regular functioning of the Bank’s core activities at reasonable cost. The main objective of liquidity policy is to ensure that the Bank can always meet its payment obligations punctually and in full. In contrast to com-mercial banks, the EIB does not have retail deposits but relies on its access to capital markets to raise the funds it on-lends to its clients.
The Bank manages the calendar of its new issues so as to maintain a prudential liquidity buffer. Liquidity plan-ning takes into account the Bank’s needs to service its debt, disbursements on loans and cash flows from the loan portfolio. It also takes into account the sizeable amount of signed but un-disbursed loans, whose dis-bursements typically take place at the borrowers’ request.

214 Financial Report 2012
The Bank further assures sound management of liquid-ity risk by maintaining a sufficient level of short term liq-uid assets, and by spreading the maturity dates of its placements according to the forecasts of liquidity needs. Liquidity risk policy also incorporates a floor on treasury levels. The Bank’s total liquidity ratio (defined as a target percentage of annual projected net cash flows) must at all times exceed 25% of the average forecast net annual cash flows for the following year.
The Bank has in place a Contingency Liquidity Plan (CLP), which specifies appropriate decision making proce-dures and corresponding responsibilities. The CLP has been benchmarked against the “Principles for Sound Liquidity Risk Management and Supervision” by the Basel Committee on Banking Supervision (September 2008). The CLP is subject to ad-hoc updates and is pre-sented to the Management Committee annually for approval.
Regular stress-testing analyses tailored to the specific business model of the EIB are executed as a part of the liquidity risk monitoring.
On 8 July 2009, the Bank became an eligible counter-party in the Eurosystem’s monetary policy operations, and therefore has been given access to the monetary policy operations of the European Central Bank. The Bank conducts the operations via the Central Bank of Luxembourg, where the Bank maintains deposits to cover the minimum reserve requirement.
Liquidity risk management of the Fund
Liquidity risk is managed in such a way as to protect the value of the paid–in capital, ensure an adequate level of liquidity to meet possible guarantee calls, private equity commitments and administrative expenditure and earn a reasonable return on assets invested with due regard to minimisation of risk.
S.3.2. Liquidity risk measurement
The table hereafter analyses the financial liabilities of the Group by maturity on the basis of the period remaining between the consolidated balance sheet date and the contractual maturity date (based on contractual undis-counted cash flows). Liabilities for which there is no con-tractual maturity date are classified under “Maturity undefined”. The numbers represent undiscounted cash flows inclusive of interest coupons and therefore do not generally reconcile with the Balance Sheet figures.
Principal cash flows and interests are slotted in the bucket corresponding to their first potential contractual payment date. This therefore does not represent an expected scenario, but rather a theoretical scenario.
Some of the borrowings and associated swaps include early termination triggers or call options granted to the hedging swap counterparties, and the Group also has the right to call the related bonds before maturity. In these cases, the cash flow is represented in the bucket corre-sponding to the first possible termination date. However, this is a conservative measure, as the Group is contractu-ally not obliged to redeem early the related callable bonds and under realistic scenarios there would be no reason to call all such bonds at first possible occasions.
Outflows for committed but undisbursed loans are rep-resented in line with the internal methodology for liquidity stress-testing. In particular, the maximum amount of loans that under severe conditions of stress could possibly be subject to early disbursement is rep-resented in the first maturity bucket.
Net cash flows are represented for interest rate swaps and forward rate agreements. Gross cash flows are rep-resented in the maturity analysis for interest rate deriva-tives where settlement is gross (essentially Cross Currency Interest Rate Swaps) and foreign exchange derivatives such as FX-forwards and FX-swaps.

2152012 Financial Report
EIB Group Consolidated Financial Statements under IFRS
Maturity profile of non-derivative financial liabilities (in EUR million as at 31.12.2012)
3 months or less
More than 3 months to 1 year
More than 1 year
to 5 years
More than 5 years
Maturity undefined
Gross nominal outflow
Carrying amount
Amounts owed to customers and credit institutions 12 997 86 0 0 0 13 083 14 391
Commercial paper 7 960 5 020 0 0 0 12 980 12 962
Debts evidenced by certificates – first call date scenario 19 708 44 934 243 107 201 815 0 509 564 457 224
Others (issued guarantees, share subscription commitments etc.) 0 424 0 0 4 988 5 412
Outflows for committed but un-disbursed loans, investment funds and loan substitutes 10 813 0 0 0 71 104 81 917
Total 51 478 50 464 243 107 201 815 76 092 622 956 484 577
Maturity profile of non-derivative financial liabilities (in EUR million as at 31.12.2011)
3 months or less
More than 3 months to 1 year
More than 1 year
to 5 years
More than 5 years
Maturity undefined
Gross nominal outflow
Carrying amount
Amounts owed to customers and credit institutions 13 614 100 0 0 0 13 714 14 756
Commercial paper 8 717 10 674 0 0 0 19 391 19 316
Debts evidenced by certificates – first call date scenario 15 528 40 134 233 979 189 968 0 479 609 410 544
Others (issued guarantees, share subscription commitments etc.) 0 386 0 0 4 616 5 002
Outflows for committed but un-disbursed loans, investment funds and loan substitutes 9 026 0 0 0 76 781 85 807
Total 46 885 51 294 233 979 189 968 81 397 603 523 444 616
Maturity profile of derivative financial liabilities (in EUR million as at 31.12.2012)
3 months or less
More than 3 months to 1 year
More than 1 year
to 5 years
More than 5 years
Gross nominal inflow/
outflow
Net settling interest rate derivatives 1 027 3 573 10 834 3 597 19 031
Gross settling interest rate derivatives – inflows 10 163 21 488 101 243 48 247 181 141
Gross settling interest rate derivatives – outflows -8 907 -18 581 -92 857 -43 623 -163 968
Foreign exchange derivatives – inflows 26 690 2 863 174 0 29 727
Foreign exchange derivatives – outflows -26 724 -2 988 -176 0 -29 888
Total 2 249 6 355 19 218 8 221 36 043
Maturity profile of derivative financial liabilities (in EUR million as at 31.12.2011)
3 months or less
More than 3 months to 1 year
More than 1 year
to 5 years
More than 5 years
Gross nominal inflow/
outflow
Net settling interest rate derivatives 428 3 597 9 876 5 140 19 041
Gross settling interest rate derivatives – inflows 13 555 13 070 104 623 57 988 189 236
Gross settling interest rate derivatives – outflows -12 228 -10 660 -96 259 -51 063 -170 210
Foreign exchange derivatives – inflows 12 408 7 390 155 0 19 953
Foreign exchange derivatives – outflows -12 037 -6 958 -161 0 -19 156
Total 2 126 6 439 18 234 12 065 38 864
216 Financial Report 2012
S.4. Market risk
Market risk is the risk that the net present value of future cash flows of financial instruments will fluctuate due to changes in market variables such as interest rates, foreign exchange rates and equity prices.
S.4.1. Market risk management
Market risk for the Bank:
As is the case with the “four-eyes principle” applied in lending activities via the Bank’s credit policies, so the market risk policy of the Bank establishes that the Risk management Directorate shall provide an opinion with respect to all financial activities of the Group that intro-duce material market risks, and with respect to financial transactions that may create credit risk, such as treasury hedging or derivatives operations.
Market risks are identified, measured, managed and reported according to a set of policies and procedures updated on a regular basis called the “Financial Risk and ALM Policy Guidelines” (FRPG). The general principles underpinning these policies are described below.
Stress testing is a widely used method to analyse the impact of possible scenarios on the Bank’s earnings and economic value of own funds, especially when analysis of historical market movements are viewed to be insuf-ficient to assess future risks. Scenarios applied may relate to changes in market rates (interest rates, FX rates, spreads, equity prices etc.), liquidity conditions, or to worst-case events that may impact the former, such as sudden and adverse macroeconomic changes, simulta-neous default of sizeable obligors, widespread system failures and the like.
Stress testing is performed on a regular basis and the results of the change in the economic value of the Bank and of the change of the earnings profile is reported within the Bank’s market risk measurement process.
Market risk for the Fund:
The Fund’s market risk exposure arises mainly in the form of interest rate risk attached to cash and cash equivalent positions as well as investments in debt securities. Approximately 80% of these assets held have an average duration of up to 5 years, thereby safeguard-ing the Fund against the substantial fluctuations in its long term revenues.
S.4.2. Interest rate risk
Interest rate risk is the volatility in the economic value of, or in the income derived from, the Group’s positions due to adverse movements in market yields or the term
structure of interest rates. Exposure to interest rate risk occurs when there are differences in repricing and maturity characteristics of the different asset, liability and hedge instruments.
Interest rate risk management of the Group:
In measuring and managing interest rate risk, the Group refers to the relevant key principles of the Basel Commit-tee for Banking Supervision (BCBS). The main sources of interest rate risk are: repricing risk, yield curve risk, basis risk and spread risk. An interest rate risk that is particu-larly relevant for the Group is spread risk. Spread risk is the volatility in the economic value of, or in the income derived from, the Group’s positions due to movements in the funding or lending spread of the Group.
The Group manages its global structural interest rate position via a dedicated portfolio. The majority of the financial risk indicators and controls in use at the Group apply to this portfolio. Financial indicators and controls for the rest of the activities outside this portfolio only relate to the risks, which are not transferred to it via the transfer pricing system, and which therefore remain with their respective activities, such as the equity risk in the venture capital activity or the interest rate or credit risks taken in those treasury portfolios predominantly managed for yield-enhancement purposes.
S.4.2.1. Value-at-Risk for the own funds of the Group (economic perspective)
Group’s ALM strategy aims at maintaining a balanced and sustainable revenue profile as well as limiting the volatil-ity of the economic value of the Bank. A clear preference has been given to the revenue profile in light of the objective of self-financing of the Bank’s growth. This over-all objective is achieved by investing Group’s own funds according to a medium to long term investment profile, implying an own funds duration target of 4.5 – 5.5 years.
Apart from the duration target for own funds, the Bank’s balance sheet should be match-funded with respect to currency and interest rate characteristics. However, small deviations are authorised for operational reasons. The net residual positions that arise from outstanding operations are managed within pre-set limits to con-strain market risk to minimum levels.
The Risk Management Directorate quantifies the VaR of own funds for both interest rates and foreign exchange risk factors. It is measured on the Group’s positions using a 99% confidence level and a one-day time hori-zon. As at 31 December 2012, the VaR of the Group’s own funds amounted to EUR 171 million (2011: EUR 318 million). The evolution of the VaR of own funds since 2011 reflects the effective decrease of the volatil-ity of the risk factors and not a change in the risk profile of the Group’s positions.

2172012 Financial Report
EIB Group Consolidated Financial Statements under IFRS
The computation is based on the so-called Riskmetrics methodology, which assumes a linear dependency between the changes in portfolio or position values and the underlying risk factors. Given the nature of the positions held by the Group, the Bank deems this assumption appropriate to measure its exposure to interest rate risk. Volatility and correlation data are computed internally on the basis of historical market data.
More generally, the VaR does not purport to measure the worst loss that could be experienced. For this rea-son, it is complemented by regular stress testing. As of 31 December 2012, the impact of a 200 basis point upward parallel shift of the interest rate curves would reduce the economic value of own funds by EUR 6.02 billion (2011: EUR 5.37 billion).
Among the financial instruments in the Group’s portfo-lio, some deals (borrowings and associated swaps) may be redeemed before they get to maturity.
At cash flow level all such borrowings are fully hedged by swaps so that they can be considered synthetic float-ing rate notes. Uncertainty arises from the maturity of such positions indexed to Libor/Euribor as they may be called before their final maturity.
Below is a summary of the features of the Group’s calla-ble portfolio as of 31 December 2012 and 31 December 2011, where the total nominal amount, the average nat-ural maturity and the average expected maturity (both weighted by the nominal amount of the concerned transactions) are shown per funding currency and per main risk factor involved:
By funding currency (after swaps):
31.12.2012(in EUR million)
Pay currency Total
CZK EUR JPY PLN USD
EUR pay notional 0 -2 707 -292 -25 -4 984 -8 008
Average maturity date 02.02.2037 08.10.2031 05.05.2026 22.10.2035 24.01.2036
Average expected maturity 16.05.2029 10.07.2028 17.05.2013 18.02.2026 11.04.2027
31.12.2011(in EUR million)
Pay currency Total
CZK EUR JPY PLN USD
EUR pay notional -29 -3 064 -85 -22 -5 484 -8 684
Average maturity date 17.06.2013 25.11.2032 04.04.2031 05.05.2026 10.06.2035 28.05.2034
Average expected maturity 15.03.2012 02.06.2023 29.03.2028 01.01.2018 08.01.2026 21.01.2025
By risk factor involved:
31.12.2012(in EUR million)
Risk factor Total
FX level IR curve level IR curve shape
EUR pay notional -3 953 -3 866 -189 -8 008
Average maturity date 25.11.2033 05.05.2038 07.09.2034 24.01.2036
Average expected maturity 19.07.2027 14.11.2026 18.12.2029 11.04.2027
31.12.2011(in EUR million)
Risk factor Total
FX level IR curve level IR curve shape
EUR pay notional -4 073 -3 730 -881 -8 684
Average maturity date 16.01.2034 14.06.2036 04.06.2027 28.05.2034
Average expected maturity 05.09.2028 24.02.2022 11.08.2020 21.01.2025
218 Financial Report 2012
S.4.2.2. Interest rate risk management for the Group (Earnings perspective)
The sensitivity of earnings quantifies the amount of net interest income that would change during the next 12 months if all interest rate curves rose by one percent-age point or decreased by one percentage point. Such exposure stems from the mismatch between interest rate repricing periods, volumes and rates of assets and liabilities that the Group accepts within the approved limits.
With the positions in place as of 31 December 2012, the earnings would increase by EUR 151.6 million (2011: EUR 115.4 million) if interest rates increased by 100 basis points and decrease by EUR 129.3 million (2011: EUR 126.2 million) if interest rates decreased by 100 basis points.
The Group computes the sensitivity measure with ded-icated software that simulates earnings on a deal by deal basis. The sensitivity of earnings is measured on an accruals basis and is calculated under the ‘’ongoing’’ assumption that, over the time horizon analysed, the Group realises the new loan business forecast in the Corporate Operational Plan, maintains exposures within approved limits and executes monetary trades to refinance funding shortages or invest cash excesses. Accounting earnings are simulated on monthly time steps, assuming that all the fixed rate items carry their contractual rate and that all floating rate items are subject to interest rate repricings according to the interest rate scenario applied in the simulation. The monetary trades to refinance funding shortages or invest cash excesses carry rates equal to the money market rates prevailing according to the interest rate scenario applied in the simulation. In line with the
current practice of the Group, the model uses the hypothesis that simulated earnings are not distributed to the shareholders, but are used to refinance the Group’s business. The administrative costs are pro-jected according to the forecasts of the Corporate Operational Plan.
The sensitivity of the EIF is computed by taking into con-sideration the coupon repricings of all the positions pre-sent in the EIF treasury portfolio managed by the Group on a deal by deal basis. Each fixed rate asset is assumed to be reinvested at maturity in a new asset with the same residual life of the previous one as of end of year’s date. Positions in floating rate assets are assumed to have quarterly repricings.
S.4.3. Foreign exchange risk (in EUR million)
The FX risk is the volatility in the economic value of, or in the income derived from, the Group’s positions due to adverse movements of FX rates.
The Group’s is exposed to FX risk whenever there is a currency mismatch between its assets and liabilities. FX risk also comprises the effect of unexpected and unfavourable changes in the value of future cash flows caused by currency movements, such as the impact of FX rate changes on the Group’s future lending interme-diation revenue.
The Group’s objective is to eliminate exchange risk by reducing net positions per currency through operations on the international foreign exchange markets. A FX hedging program was set up in 2004 in order to system-atically protect the known future loan margins in USD and in GBP on a 3-year horizon.
S.4.3.1. Foreign exchange position
Net position 2012 2011
Euro (EUR) 7 -4
Pound Sterling (GBP) -12 -13
US Dollar (USD) -7 5
Other currencies 12 12
Subtotal except Euro -7 4
Total foreign exchange position 0 0

2192012 Financial Report
EIB Group Consolidated Financial Statements under IFRS
S.4.3.2. Foreign exchange risk management
In compliance with its statutes, the Bank actively hedges its FX risk exposures.
The main objective of the Bank’s FX risk management policy is to minimise the impact of a variation of FX rates on the income statement by keeping FX positions within the limits approved by the Management Committee.
Related to the quantification of the VaR of own funds for both interest rates and foreign exchange risk factors, refer to Note S.4.2.1.
S.4.4. Equity price risk
Equity price risk is the risk that the fair values of equities decrease as the result of changes in the levels of equity indices and the value of individual equity investments.
As of 31 December 2012, equity price risk was limited to those strategic activities approved by the Board of Directors (venture capital investments made by the Fund on behalf of the Bank and on its own resources; infrastructure funds; equity-like investments as Special Activity; participation in the EBRD). These activities are subject to special forms of monitoring and the resulting exposures are supported by sound capitalisation.
The value of privately held equity positions is not readily available for the purposes of monitoring and control on a con-tinuous basis. For such positions, the best indications available include prices for similar assets and the results of any relevant valuation techniques.
The effect on Own Funds for the Group (as a result of a change in the fair value of equity investments at 31 December 2012 and 31 December 2011) due to a reasonable possible change in equity indices, with all other variables held con-stant is as follows:
Change in equityprice 2012
%
Effect on Own Funds2012
in EUR ’000
Change in equityprice 2011
%
Effect on Own Funds2011
in EUR ’000
Venture Capital Operations (1) -10 -183 298 -10 -192 780
EBRD shares -10 -40 050 -10 -39 272
Investment funds -10 -50 095 -10 -40 516
(1) The sensitivity of Venture Capital operations is calculated by the EIF based on the market risk of the positions on the public market.
S.5. Operational risk
The management of operational risk is performed at all levels within the organisation and is a responsibility of all the various departments of the Group. The Risk Management Directorate is responsible for defining the operational risk framework and related policies while the responsibility for implementing the framework as well as day-to-day opera-tional risk management lies with the Group’s operational departments.
The Bank employs an assessment methodology that takes into account all available information including loss history, results of risk self-assessment and the business and control environment through a set of Key Risk Indicators (KRIs) organised in an Operational Risk Scorecard. A statistical model and a Value at Risk calculation engine complete the operational risk environment.
Information concerning operational risk events, losses and KRIs, and updates on the activities of the New Products Committee, are regularly forwarded to the Bank’s senior management and to the Management Committee.

220 Financial Report 2012
Note T – Accounting classifications and fair values of assets and liabilities (in EUR million)
The table below sets out the Group’s classification of each class and category of assets and liabilities:
31 December 2012 Note Trading Designated at fair value through P/L
Held-to-maturity
Loans and receiv-ables
Available-for-sale
Financial liabilities
measured at amortised
cost
Non financial
assets/ liabilities
Total carrying amount
Cash in hand, balances with central banks and post office banks B.1 0 0 0 157 0 0 0 157
Treasury bills and debt securities portfolios B.2 1 465 0 23 389 0 2 907 0 0 27 761
Loans and advances to credit institutions and customers C/D 0 127 031 0 343 277 0 0 0 470 308
Shares and other variable-yield securities B.3 0 0 0 0 3 129 0 0 3 129
Derivative assets held for risk management R 55 886 0 0 0 0 0 0 55 886
Property, furniture and equipment E.1 0 0 0 0 0 0 294 294
Investment property E.2 0 0 0 0 0 0 3 3
Intangible assets E.1 0 0 0 0 0 0 10 10
Other assets G 0 0 0 9 992 0 0 212 10 204
Prepayments 0 0 0 0 0 0 62 62
57 351 127 031 23 389 353 426 6 036 0 581 567 814
Amounts owed to credit institutions and customers H 0 0 0 0 0 14 391 0 14 391
Debts evidenced by certificates I 0 422 040 0 0 0 48 146 0 470 186
Derivative liabilities held for risk management R 24 745 0 0 0 0 0 0 24 745
Other liabilities G 0 0 0 0 0 0 979 979
Deferred income F 0 0 0 0 0 0 136 136
Provisions J 0 0 0 0 0 0 1 782 1 782
24 745 422 040 0 0 0 62 537 2 897 512 219

2212012 Financial Report
EIB Group Consolidated Financial Statements under IFRS
31 December 2011 Note Trading Designated at fair value through P/L
Held-to-maturity
Loans and receiv-ables
Available-for-sale
Financial liabilities
measured at amortised
cost
Non financial
assets/ liabilities
Total carrying amount
Cash in hand, balances with central banks and post office banks B.1 0 0 0 427 0 0 0 427
Treasury bills and debt securities portfolios B.2 1 687 0 20 106 0 3 507 0 0 25 300
Loans and advances to credit institutions and customers C/D 0 104 652 0 328 622 0 0 0 433 274
Shares and other variable-yield securities B.3 0 0 0 0 2 616 0 0 2 616
Derivative assets held for risk management R 49 538 0 0 0 0 0 0 49 538
Property, furniture and equipment E.1 0 0 0 0 0 0 306 306
Investment property E.2 0 0 0 0 0 0 3 3
Intangible assets E.1 0 0 0 0 0 0 10 10
Other assets G 0 0 0 0 0 0 124 124
Prepayments 0 0 0 0 0 0 48 48
51 225 104 652 20 106 329 049 6 123 0 491 511 646
Amounts owed to credit institutions and customers H 0 0 0 0 0 14 756 0 14 756
Debts evidenced by certificates I 0 385 025 0 0 0 44 835 0 429 860
Derivative liabilities held for risk management R 19 419 0 0 0 0 0 0 19 419
Other liabilities G 0 0 0 0 0 0 809 809
Deferred income F 0 0 0 0 0 0 166 166
Provisions J 0 0 0 0 0 0 1 632 1 632
19 419 385 025 0 0 0 59 591 2 607 466 642
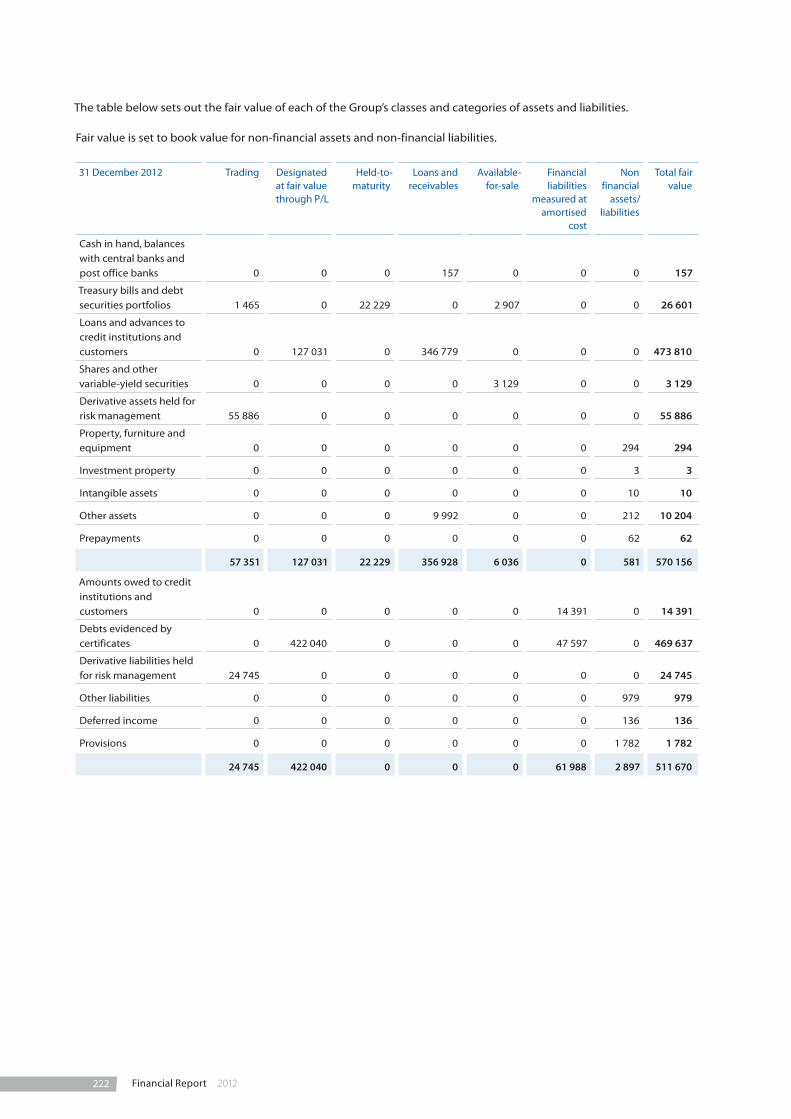
222 Financial Report 2012
The table below sets out the fair value of each of the Group’s classes and categories of assets and liabilities.
Fair value is set to book value for non-financial assets and non-financial liabilities.
31 December 2012 Trading Designated at fair value through P/L
Held-to-maturity
Loans and receivables
Available-for-sale
Financial liabilities
measured at amortised
cost
Non financial
assets/ liabilities
Total fair value
Cash in hand, balances with central banks and post office banks 0 0 0 157 0 0 0 157
Treasury bills and debt securities portfolios 1 465 0 22 229 0 2 907 0 0 26 601
Loans and advances to credit institutions and customers 0 127 031 0 346 779 0 0 0 473 810
Shares and other variable-yield securities 0 0 0 0 3 129 0 0 3 129
Derivative assets held for risk management 55 886 0 0 0 0 0 0 55 886
Property, furniture and equipment 0 0 0 0 0 0 294 294
Investment property 0 0 0 0 0 0 3 3
Intangible assets 0 0 0 0 0 0 10 10
Other assets 0 0 0 9 992 0 0 212 10 204
Prepayments 0 0 0 0 0 0 62 62
57 351 127 031 22 229 356 928 6 036 0 581 570 156
Amounts owed to credit institutions and customers 0 0 0 0 0 14 391 0 14 391
Debts evidenced by certificates 0 422 040 0 0 0 47 597 0 469 637
Derivative liabilities held for risk management 24 745 0 0 0 0 0 0 24 745
Other liabilities 0 0 0 0 0 0 979 979
Deferred income 0 0 0 0 0 0 136 136
Provisions 0 0 0 0 0 0 1 782 1 782
24 745 422 040 0 0 0 61 988 2 897 511 670

2232012 Financial Report
EIB Group Consolidated Financial Statements under IFRS
31 December 2011 Trading Designated at fair value through P/L
Held-to-maturity
Loans and receivables
Available-for-sale
Financial liabilities
measured at amortised
cost
Non financial
assets/ liabilities
Total fair value
Cash in hand, balances with central banks and post office banks 0 0 0 427 0 0 0 427
Treasury bills and debt securities portfolios 1 687 0 18 407 0 3 507 0 0 23 601
Loans and advances to credit institutions and customers 0 104 652 0 324 397 0 0 0 429 049
Shares and other variable-yield securities 0 0 0 0 2 616 0 0 2 616
Derivative assets held for risk management 49 538 0 0 0 0 0 0 49 538
Property, furniture and equipment 0 0 0 0 0 0 306 306
Investment property 0 0 0 0 0 0 3 3
Intangible assets 0 0 0 0 0 0 10 10
Other assets 0 0 0 0 0 0 124 124
Prepayments 0 0 0 0 0 0 48 48
51 225 104 652 18 407 324 824 6 123 0 491 505 722
Amounts owed to credit institutions and customers 0 0 0 0 0 14 756 0 14 756
Debts evidenced by certificates 0 385 025 0 0 0 45 708 0 430 733
Derivative liabilities held for risk management 19 419 0 0 0 0 0 0 19 419
Other liabilities 0 0 0 0 0 0 817 817
Deferred income 0 0 0 0 0 0 166 166
Provisions 0 0 0 0 0 0 1 632 1 632
19 419 385 025 0 0 0 60 464 2 615 467 523

224 Financial Report 2012
Note U – Segment reporting (in EUR million)
The segment information disclosed in this note has been prepared in accordance with the “management approach” applied by IFRS 8 meaning that the definition of segments as well as the preparation of information used for segment reporting are both based on information prepared for internal management decisions.
The EIB Group has one single reportable segment which is the EIB long term finance activity comprising EIB lending operations inside and outside Europe, borrowing and treasury operations. The Management Committee as the Group’s chief operating decision maker reviews internal management reports on the performance of the Bank’s long term finance activity on at least a quarterly basis.
The second EIB Group operating segment, the financial support of SME’s carried out by the European Investment Fund through venture capital investments and the provision of guarantees does not meet any of the quantitative thresholds for determining a reportable segment in 2012 or 2011.
Information about reportable segment Long term lending finance activity
2012 2011
External revenues:
Net interest income 2 717 2 720
Net income from shares 30 24
Net fee and commission income 233 213
Result on financial operations -1 981 1 495
Other operating expenses 0 -50
Other operating income 10 9
Total segment revenue 1 009 4 411
Other material non-cash items:
Impairment losses on loans and shares -178 -159
-178 -159
Reportable segment profit 264 3 752
Reportable segment assets 566 485 510 474
Reportable segment liabilities 511 528 466 057
Reconciliation of reportable segment revenues, profit and loss and assets and liabilities
2012 2011
Revenues:
Total revenues for reportable segment 1 009 4 411
Other revenues 84 99
Consolidated revenue 1 093 4 510
Profit or loss:
Total profit for reportable segment 264 3 752
Other profit or loss 15 -9
Consolidated profit 279 3 743
Assets:
Total assets for reportable segment 566 485 510 474
Other assets 1 329 1 172
Consolidated total assets 567 814 511 646
Liabilities:
Total liabilities for reportable segment 511 528 466 057
Other liabilities 691 585
Consolidated total liabilities 512 219 466 642

2252012 Financial Report
EIB Group Consolidated Financial Statements under IFRS
Note V – Commitments, contingent liabilities, pledged assets and other memorandum items (in EUR ’000)
The Group utilises various lending-related financial instruments in order to meet the financial needs of its customers. The Group issues commitments to extend credit, standby and other letters of credit, guarantees, commitments to enter into repurchase agreements, note issuance facilities and revolving underwriting facilities. Guarantees represent irrevo-cable assurances, subject to the satisfaction of certain conditions, that the Group will make payment in the event that the customer fails to fulfil its obligation to third parties.
The contractual amount of these instruments is the maximum amount at risk for the Group if the customer fails to meet its obligations. The risk is similar to the risk involved in extending loan facilities and is monitored with the same risk con-trol processes and specific credit risk policies.
As at 31 December 2012 and 2011, commitments, contingent liabilities and other memorandum items were as follows (in nominal amounts and in EUR ‘000):
31.12.2012 31.12.2011
Commitments
- EBRD capital uncalled (Note B.3) 712 630 442 500
- Undisbursed loans (Note D.1)
• creditinstitutions 19 786 999 20 022 455
• customers 62 129 484 65 784 468
81 916 483 85 806 923
- Undisbursed venture capital operations (Note B.3) 2 087 888 1 955 898
- Undisbursed investment funds 539 385 547 148
Contingent liabilities and guarantees
- In respect of loans granted by third parties 3 633 454 3 683 408
- In respect of venture capital operations 40 866 60 524
Assets held on behalf of third parties (**)
- NER300 2 270 706 2 078 869
- Investment Facility - Cotonou 2 132 527 1 825 259
- Guarantee Fund 2 021 325 1 756 205
- JESSICA (Contribution and Holding Funds) 1 758 775 1 549 100
- FP7 Guarantee Fund 1 432 835 1 149 231
- RSFF 1 070 588 789 554
- Special Section 781 550 943 954
- JEREMIE 708 656 827 908
- EU-Africa Infrastructure Trust Fund 503 242 294 630
- GF Greece 300 000 0
- ENPI 168 489 161 228
- LGTT 163 275 154 831
- RSI 131 481 0
- SMEG 2007 124 104 107 605
- ECHA 121 614 148 616
- GIF 2007 102 621 97 726
- AECID 100 155 100 002
- SME Guarantee Facility 59 604 59 954
- NIF Trust Fund 55 301 55 019
- GAGF 50 067 31 400
- PBI 50 000 0
- HIPC 39 878 59 722
- FEMIP Trust Fund 29 868 30 395
- MAP guarantee 24 940 33 139

226 Financial Report 2012
31.12.2012 31.12.2011
- MAP Equity 20 591 32 777
- G43 Trust Fund 15 895 16 202
- EPMF 10 508 9 155
- EPTA Trust Fund 9 086 7 348
- European Technology Facility 5 224 8 165
- GEEREF 4 120 1 569
- JASPERS 3 221 1 637
- Bundesministerium für Wirtschaft und Technologie 2 528 2 635
- GEEREF Technical Support Facility 1 923 2 484
- TTP 1 605 1 687
- EPPA 706 1 468
- LfA-EIF Facility 519 166
- EPEC 415 0
- MDD 6 0
- GGF 5 5
14 277 953 12 339 645
Nominal value of interest-rate swap and deferred rate-setting contracts (Notes Q, S) 432 817 455 401 211 736
Nominal value of currency swap contracts receivable (Notes Q, S) 190 231 826 185 661 830
Nominal value of currency swap contracts payable (Notes Q, S) 183 578 841 174 707 592
Forward rate agreements (Note Q) 4 946 600 6 606 400
Value of put option granted to EIF minority shareholders (Note A.4.22) 424 376 385 841
Currency forwards (Notes Q, S) 363 762 321 547
Swaps launched but not yet settled 16 475 60 394
Special deposits for service of borrowings (*) 16 311 29 685
Securities lending (Note B.2) 0 778 872
Future contracts (Notes Q, S) 0 386 190
(*) This item represents the amount of coupons and bonds due, paid by the Group to the paying agents, but not yet presented for payment by the holders of bonds issued by the Group.
V.1. Investment Facility – Cotonou
The Investment Facility, which is managed by the EIB, has been established within the framework of the Cotonou Agreement on cooperation and develop-ment of the African, Caribbean and Pacific Group of States and the European Union and its Member States on 23 June 2000 and subsequently revised. The EIB prepares separate financial statements for the Investment Facility.
V.2. Guarantee Fund
The Guarantee Fund for External Actions was set up in 1994 to cover defaults on loans and loan guarantees granted to non-Member States or for projects in
non-Member States. The European Commission (‘EC’) entrusted financial management of the Guarantee Fund to the EIB under an agreement signed between the two parties in November 1994. The EIB prepares separate financial statements for the Guarantee Fund.
V.3. JESSICA (Contribution and Holding Funds)
JESSICA (The Joint European Support for Sustainable Investment in City Area) is an initiative developed by the EC and the EIB, in collaboration with the Council of Europe Development Bank.
Under new procedures, Managing Authorities are being given the option of using some of their EU grant fund-ing to make repayable investments in projects forming

2272012 Financial Report
EIB Group Consolidated Financial Statements under IFRS
part of an integrated plan for sustainable urban devel-opment. These investments are delivered to projects via Urban Development Funds or if required Holding Funds (JESSICA Holding Funds).
JESSICA Holding Funds are used in the context of the JESSICA initiative. As Manager, EIB gathers the funding received from the Managing Authorities and invests it in Urban Development Funds, according to investment guidelines agreed with the donors. The EIB prepares separate financial statements for JESSICA.
V.4. FP7 Guarantee Fund
The 7th Framework Programme (‘FP7’) is designed to support research, technological development and demonstration projects all over Europe. The rules and principles for the management of the FP7 are laid out in the Agreement between the EC on behalf of the European Atomic Energy Community and the EIB. The EC entrusted financial management of the FP7 Guarantee Fund to the EIB under an agreement signed between the two parties in December 2007. The EIB prepares separate financial statements for FP7 Guaran-tee Fund.
V.5. Special Section
The Special Section was set up by the Board of Gover-nors on 27 May 1963. Under a decision taken on 4 August 1977, its purpose was redefined as being that of recording financing operations carried out by the EIB for the account of and under mandate from third parties. It includes the FED, MED/FEMIP and Turkey mandates.
V.6. JEREMIE
JEREMIE (The Joint European Resources for Micro to Medium Enterprises) is an initiative of the European Commission’s Directorate General for Regional Policy (DG Regio) and the EIB Group.
V.7. Risk-Sharing Finance Facility (‘RSFF’)
The RSFF has been established within the framework of the Co-operation Agreement, entered into force on 5 June 2007 between the EC on behalf of the European Union and the EIB. The RSFF aims at fostering invest-ment in research, technological development and dem-onstration, and innovation. As part of the RSFF, the EIF set up the Risk Sharing Instrument for Innovative and Research oriented SMEs and small Mid-Caps (‘RSI’). The RSI provides guarantees to banks and leasing compa-nies for loans and financial leases to research-based small and medium-sized enterprises (SMEs) and small Mid-Caps. The EIB prepares separate financial state-ments for the RSFF.
V.8. EU-Africa Infrastructure Trust Fund (the ‘Trust Fund’)
The Trust Fund has been created within the framework of the Trust Fund Agreement between the EC on behalf of the European Union as the Founding Donor and the EIB as Manager, also open to Member States of the European Union which subsequently accede to this agreement as Donors. On 9 February 2006, the EC and the EIB Group signed a Memorandum of Understanding to promote jointly the EU-Africa Infrastructure Partner-ship and, in particular, to establish a supporting EU-Africa Infrastructure Trust Fund. The EIB prepares separate financial statements for the Trust Fund.
V.9. European Neighbourhood and Partnership Instrument (‘ENPI’)
The Framework Agreement between the European Union and the EIB on the implementation of operations financed from the general budget of the European Union in the countries covered by the European Neigh-bourhood Policy is channelled through the ENPI. The EIB prepares separate financial statements for ENPI.
V.10. Loan Guarantee Instrument for Ten-T Projects (’LGTT’)
The LGTT has been established within the framework of the Co-operation Agreement, entered into force on 11 January 2008 between the EC on behalf of the Euro-pean Union and the EIB. The LGTT aims at facilitating a greater private sector involvement in the financing of Trans-European transport networks infrastructure. The EIB prepares separate financial statements for the LGTT.
V.11. ECHA
On 1 April 2011 the EIB entered into an asset manage-ment agreement with the European Chemicals Agency (ECHA). Under this agreement the EIB manages the investment portfolio of ECHA in accordance with the pre-agreed Asset Management Guidelines.
V.12. SMEG 2007
In the SMEG 2007 under the Competitiveness and Inno-vation Framework Programme (CIP/SMEG 2007), the EIF is empowered to issue guarantees in its own name but on behalf and at the risk of the Commission.
V.13. GIF 2007
In the GIF 2007 under the Competitiveness and Innova-tion Framework Programme and the Technology Trans-fer Pilot Project (CIP/GIF 2007), the EIF is empowered to

228 Financial Report 2012
acquire, manage and dispose of investments, in its own name but on behalf and at the risk of the Commission.
V.14. SME Guarantee Facility
The EIF is empowered to issue guarantees in its own name but on behalf and at the risk of the European Union according to the Fiduciary and Management Agreement concluded with the European Union.
V.15. Heavily Indebted Poor Countries (‘HIPC’) Initiative
The HIPC Initiative (the ’Initiative’) is an international debt relief mechanism that provides special assistance to the world’s poorest countries. It was launched in 1996 following a proposal from the World Bank and the Inter-national Monetary Fund. The principal objective of the Initiative is to reduce the debt burden of poor countries to sustainable levels. The EIB prepares separate financial statements for the Initiative.
V.16. Neighbourhood Investment Facility (‘NIF’) Trust Fund
The NIF Trust Fund managed by the EIB was set up to achieve the strategic objective of the European Neigh-bourhood Partnership Instrument through targeted funding aimed at strengthening infrastructure intercon-nection between the EU and its neighbours in the areas of Transport and Energy, at addressing common envi-ronmental concerns and at supporting other relevant activities. The EIB prepares separate financial state-ments for the NIF Trust Fund.
V.17. MAP Equity
Under the Multi-Annual Programme (MAP) for enter-prises and entrepreneurship, the EIF manages resources on behalf and at the risk of the EC.
V.18. Greater Anatolia Guarantee Facility (‘GAGF’)
Under the GAGF signed in May 2010, the EIF manages the Instrument for Pre-Accession Assistance (IPA) funds allocated for the Regional Competitiveness Operational Programme by the European Union and Turkey. The facility provides tailor-made financial help to SMEs and micro-enterprises in Turkey’s least developed provinces in partnership with major Turkish banks.
V.19. FEMIP Trust Fund
The FEMIP (Facility for Euro-Mediterranean Investment and Partnership) Trust Fund, which is also managed by
the EIB, was set up to enhance the existing activities of the EIB in the Mediterranean Partner Countries, with the support of a number of donor countries and with a view of directing resources to operations in certain priority sectors through the provision of technical assistance and risk capital. The EIB prepares separate financial statements for the FEMIP Trust Fund.
V.20. G43 Trust Fund
Under G43 Anatolian Venture Capital Fund, signed in August 2011, the EIF is entrusted with a mandate by Central Finance Unit of Turkey (CFCU). It is dedicated to make investments in SMEs in South-Eastern Anatolia region of Turkey.
V.21. European Progress Microfinance Facility (‘EPMF’)
The EPMF aims to increase access to finance for individ-uals who have difficulties entering the labour market and to promote the start-up and growth of micro- enterprises with a particular view to providing jobs for the unemployed or the disadvantaged.
V.22. European Technology Facility (‘ETF’)
Under the ETF Start-Up Facility, the EIF is empowered to acquire, manage and dispose of ETF start-up invest-ments, in its own name but on behalf of and at the risk of the EC.
V.23. EPTA Trust Fund
EPTA (The Eastern Partnership Technical Assistance) Trust Fund is focused on increasing the quality and develop-ment impact of EIB Eastern Partnership operations by offering a multi-purpose, multi-sector funding facility for technical assistance. It will be complementary to the Neighbourhood Investment Facility. The EIB prepares separate financial statements for EPTA Trust Fund.
V.24. Bundesministerium für Wirtschaft und Technologie
The EIF manages funds on behalf of the German Bundesministerium für Wirtschaft und Technologie (Federal Ministry of Economics and Technology) and the European Recovery Programme.
V.25. GEEREF (Fund and Technical Support Facility)
GEEREF (Global Energy Efficiency and Renewable Energy Fund) is a fund of funds set-up at the initiative of the EC. Its objective is to make investments in private equity funds that focus on the fields of renewable

2292012 Financial Report
EIB Group Consolidated Financial Statements under IFRS
energy and energy efficiency in emerging markets (ACP, ALA and European Neighbour countries). The EIF also holds a technical assistance mandate for which related activities are implemented by the GEEREF front office.
V.26. Technology Transfer Pilot Project (‘TTP’)
Under the TTP, financed by the EC and signed in Novem-ber 2008, the EIF has supported a technology transfer structure through pre-seed funding and seed funding.
V.27. JASPERS
JASPERS (The Joint Assistance to Support Projects in European Regions) is a major joint policy initiative of the EIB, EC (Regional Policy Directorate-General - DG Regio) and the European Bank for Reconstruction and Development. It provides advice to the 12 Central and Eastern EU Member States and Croatia during pro-ject preparation to help improve the quality of the major projects to be submitted for grant financing under the Structural and Cohesion Funds.
V.28. European Parliament Preparatory Action (‘EPPA’)
In 2010, the EIF signed the EPPA with DG REGIO. The EIF is providing risk capital and financial support for capac-ity building purposes in order to help a select number of microfinance institutions to reach a meaningful size and improve their prospects for sustainability.
V.29. LfA-EIF Facility
LfA-EIF Facility, signed in 2009, is a joint EIF and LfA Förderbank Bayern venture providing investments to support technology-oriented early and expansion stage companies in the region of Bavaria, Germany.
V.30. Green for Growth Fund (‘GGF’)
The Green for Growth Fund was set up by the EIF in December 2009 and focuses on energy efficiency financings in South East Europe including Turkey.
V.31. AEICD
This partnership agreement signed between the King-dom of Spain (the Spanish Agency for International Development Cooperation (AECID)) and the EIB was set
up to invest in operations in the countries covered by the FEMIP together with Mauritania (the “Southern Mediterranean region”), targeting mainly risk capital activities for micro and small/medium enterprises as well as engaging in the wider development of the pri-vate sector in the region.
V.32. GF Greece
The Fund is a joint initiative between the Hellenic Republic, the EC and the EIB and was set up to support the lending to SMEs in Greece. Established by using unabsorbed Structural Funds for Greece, the Fund will guarantee EIB loans to SMEs via partner banks in Greece.
V.33. EPEC
The European PPP Expertise Centre (‘EPEC’) is a joint ini-tiative of the EIB, the EC and European Union Member States and Candidate Countries. EPEC’s mission is to strengthen the ability of the public sector to engage in Public Private Partnership (PPP) transactions. The EIB prepares separate financial statements for EPEC.
V.34. Project Bond Initiative (‘PBI’)
A Cooperation Agreement between the EC and the EIB in respect of the Project Bond Instrument: Pilot Phase was signed in November 2012. The PBI is designed to stimulate capital market financing for infrastructure delivered under ‘project finance’ structures, including Public Private Partnerships (PPPs). The initiative will seek to enhance the credit rating of bonds issued by project companies to a rating level that is attractive for inves-tors and to lower the project’s overall financing costs.
V.35. NER300
The EIB supports the EC as an agent in the implementa-tion of the NER 300 initiative - a funding programme for carbon capture and storage demonstration projects and innovative renewable energy technologies. The EIB prepares separate financial statements for NER300.
V.36. Mezzanine Dachfonds fur Deutschland (‘MDD’)
The MDD in an investment programme signed in June 2012 and funded by the German Federal Ministry of Economics and Technology (BMWi) and various institu-tions of the Federal states to subscribe into hybrid debt and equity funds investing in German MidCaps.
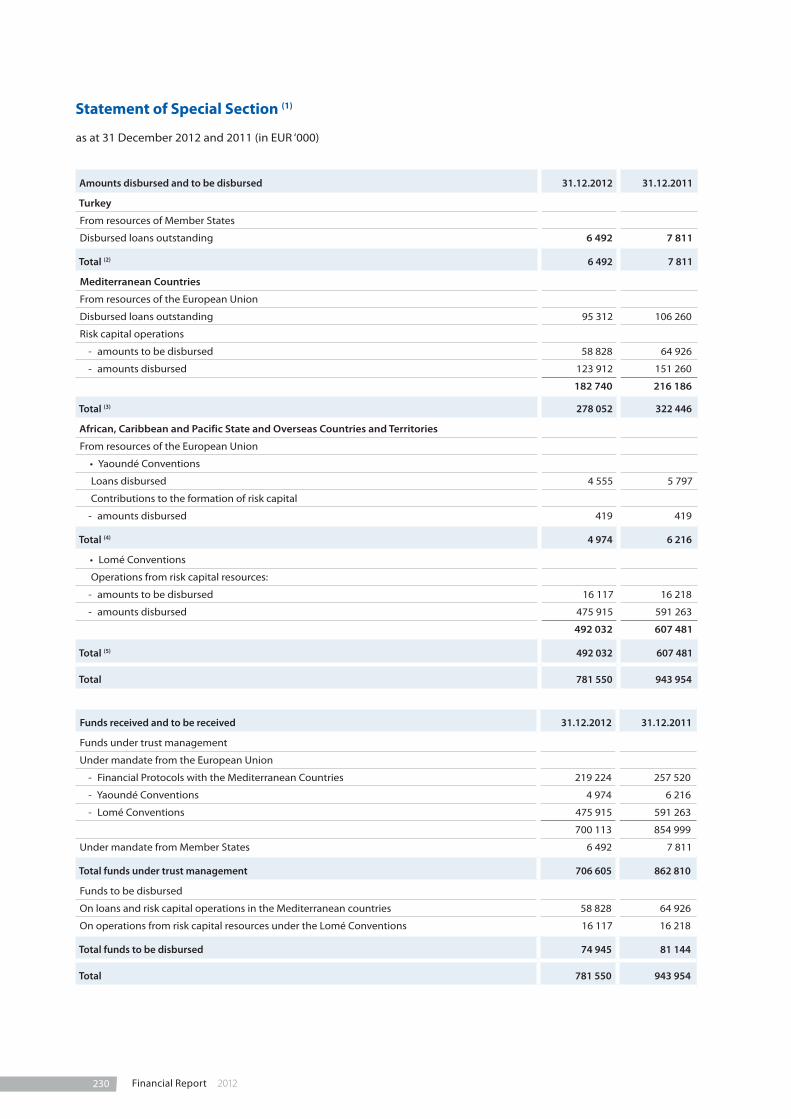
230 Financial Report 2012
Statement of Special Section (1)
as at 31 December 2012 and 2011 (in EUR ‘000)
Amounts disbursed and to be disbursed 31.12.2012 31.12.2011
Turkey
From resources of Member States
Disbursed loans outstanding 6 492 7 811
Total (2) 6 492 7 811
Mediterranean Countries
From resources of the European Union
Disbursed loans outstanding 95 312 106 260
Risk capital operations
- amounts to be disbursed 58 828 64 926
- amounts disbursed 123 912 151 260
182 740 216 186
Total (3) 278 052 322 446
African, Caribbean and Pacific State and Overseas Countries and Territories
From resources of the European Union
• YaoundéConventions
Loans disbursed 4 555 5 797
Contributions to the formation of risk capital
- amounts disbursed 419 419
Total (4) 4 974 6 216
• LoméConventions
Operations from risk capital resources:
- amounts to be disbursed 16 117 16 218
- amounts disbursed 475 915 591 263
492 032 607 481
Total (5) 492 032 607 481
Total 781 550 943 954
Funds received and to be received 31.12.2012 31.12.2011
Funds under trust management
Under mandate from the European Union
- Financial Protocols with the Mediterranean Countries 219 224 257 520
- Yaoundé Conventions 4 974 6 216
- Lomé Conventions 475 915 591 263
700 113 854 999
Under mandate from Member States 6 492 7 811
Total funds under trust management 706 605 862 810
Funds to be disbursed
On loans and risk capital operations in the Mediterranean countries 58 828 64 926
On operations from risk capital resources under the Lomé Conventions 16 117 16 218
Total funds to be disbursed 74 945 81 144
Total 781 550 943 954

2312012 Financial Report
EIB Group Consolidated Financial Statements under IFRS
For information:
Total amounts disbursed and not yet repaid on loans on special conditions made available by the Commission in respect of which the Bank has accepted an EU mandate for recovering principal and interest:
a) Under the First, Second and Third Lomé Conventions as at 31 December: 2012: EUR ‘000 417 129 (2011: EUR ‘000 472 103)
b) Under Financial Protocols signed with the Mediterranean Countries as at 31 December: 2012: EUR ‘000 85 017 (2011: EUR ‘000 90 991)
Note (1): The Special Section was set up by the Board of Governors on 27 May 1963. Under a decision taken on 4 August 1977, its purpose was redefined as being that of recording financing operations carried out by the European Investment Bank for the account of and under mandate from third parties. However, for the Investment Facility under the Cotonou Agreement, the EU-Africa Infrastructure Trust Fund, the Neighbourhood Investment Facility (NIF) Trust Fund and the FEMIP Trust Fund, separate financial statements are presented. In addition, since 2005, the EIB also prepares financial statements of different types for other mandates.
The Statement of Special Section reflects amounts disbursed or to be disbursed, less cancellations and repayments, under mandate from the European Union and the Member States. Amounts disbursed and to be disbursed and funds received and to be received are carried at nominal value. No account is taken in the Statement of Special Section of pro-visions or value adjustments, which may be required to cover risks associated with such operations. Amounts in foreign currency are translated at exchange rates prevailing on 31 December.
Note (2): Initial amount of contracts signed for financing projects in Turkey under mandate, for the account and at the risk of Member States.
Initial amount: 405 899
add: exchange adjustments 20 412
less: cancellations 215
repayments 419 604
-419 819
6 492
Note (3): Initial amount of contracts signed for financing projects in the Maghreb and Mashreq countries, Malta, Cyprus, Turkey and Greece (EUR 10 million lent prior to accession to the EC on 1 January 1981) under mandate, for the account and at the risk of the European Union.
Initial amount: 840 457 (*)
less: exchange adjustments 48 508
cancellations 119 859
repayments 394 038
-562 405
278 052
(*) Change in initial amount relates to ENPI (Note V.9) which is no longer reported as part of Special Section.

232 Financial Report 2012
Note (4): Initial amount of contracts signed for financing projects in the Associated African States, Madagascar and Mauritius and the Overseas Countries, Territories and Departments (AASMM-OCTD) under mandate, for the account and at the risk of the European Union:
Loans on special conditions 139 483
Contributions to the formation of risk capital 2 503
Initial amount: 141 986
add: capitalised interests 1 178
exchange adjustments 9 831
11 009
less: cancellations 3 310
repayments 144 711
-148 021
4 974
Note (5): Initial amount of contracts signed for financing projects in the African, Caribbean and Pacific States and the Overseas Countries and Territories (ACP-OCT) under mandate, for the account and at the risk of the European Union:
Loans from risk capital resources:
Conditional and subordinated loans 3 116 097
Equity participations 121 002
Initial amount: 3 237 099
add: capitalised interests 9 548
less: cancellations 684 845
repayments 2 011 777
exchange adjustments 57 993
-2 754 615
492 032
Loans from other resources:
Initial amount: 16 500
add: exchange adjustments 58
less: cancellations 8 414
repayments 8 144
-16 558
0
492 032

2332012 Financial Report
EIB Group Consolidated Financial Statements under IFRS
Note W – Capital and Reserves
W.1. Share capital and share premium
The European Investment Bank (EIB), the financing institution of the European Union, was created by the Treaty of Rome of 25 March 1957. The members of the EIB are the Member States of the European Union, who have all subscribed to the Group’s capital. The subscribed capital of the Bank amounts to EUR 242 392 989 000 (31 December 2011: EUR 232 392 989 000) and the uncalled capital to EUR 220 773 340 000 as of 31 December 2012. As a result of the deci-sion by the Member States, the subscribed and called capital of the Group increased by EUR 10 billion on 31 December 2012. The Member States are due to pay in their respective shares of this EUR 10 billion capital increase over no more than three instalments, with 91.6% of the capital increase due no later than 31 March 2013 and the remainder in two equal instalments no later than 31 March 2014 and 31 March 2015 respectively.
The amount of EUR ‘000 9 992 427 shown in the balance sheet under the caption Subscribed capital called but not paid represents the amount receivable from the Member States in respect of their share of the capital increase
New Member States or Member States that increase their share in the Bank’s subscribed capital pay their part of the called capital plus their part of the reserves, provisions equivalent to reserves and similar amounts, normally in several equal instalments over the course of several years. The Accession Treaties and/or the Board of Governors decisions to increase the Bank’s capital establish the specific modalities of such payments, including the calculation of the share of the new Member States in the Bank’s capital, which is normally based on the national GDP figures officially published by Eurostat.
Voting powers in the Bank’s Board of Governors and Board of Directors are established partly on the share of capital subscribed by each Member State, partly on different criteria, set forth in Articles 8 and 10 of the Bank’s statute, applied jointly or exclusively depending on the specific voting procedure.
Withdrawal from the status of EU Member State or decrease of the subscribed capital amount for a Member State is not foreseen by the legal provisions currently in force.
W.2. Capital management
Even though the Group is not subject to formal supervision, it has generally voluntarily submitted to major EU banking regulations and adopted market “best practice”. In particular, this applies to the banking regulation (“Basel II”), issued in 2004 by the Basel Committee on Banking Supervision, approved by the EU and the Member States in 2006, and applied in Internal Rating Based EU financial institutions since 1 January 2008 (2006/48/EC as of 14 June 2006).
The implementation of the “Advanced Internal Ratings Based Approach (Advanced IRB)” for credit risk and Advanced Measurement Approach (‘AMA’) for operational risk has been done under the technical assistance of the Commission de Surveillance du Secteur Financier (‘CSSF’).
In addition to the monitoring of Basel II minimum capital requirements, stress tests assess the sensitivity of capital requirements to changes in the macroeconomic environment and in the activities of the Group.
As at 31 December 2012, the Group’s capital adequacy ratio stood at 21.8% (21.7% at the end of 2011), compared to the Basel II minimum capital adequacy level of 8%. The stability of the ratio is explained by the positive impact of the increase of the consolidated Basel II own funds (adjusted for unrealised results accounted for under the fair value option after the application of Basel II prudential filters) which offset the negative impact resulting from the increase of risk-weighted assets.
As at 31 December 2012 and based on the statutory financial statements, the Bank’s capital adequacy ratio stood at 23.1% (24.9% at the end of 2011).

234 Financial Report 2012
Note X – Conversion rates
The following conversion rates were used for establishing the balance sheets at 31 December 2012 and 2011:
31.12.2012 31.12.2011
Non-euro currencies of EU member states
Bulgarian leva (BGN) 1.9558 1.9558
Czech koruna (CZK) 25.151 25.787
Danish kroner (DKK) 7.4610 7.4342
Pound sterling (GBP) 0.8161 0.8353
Hungarian forint (HUF) 292.30 314.58
Polish zloty (PLN) 4.0740 4.4580
Romanian lei (RON) 4.4445 4.3233
Swedish kronor (SEK) 8.5820 8.9120
Non-EU currencies
Australian dollar (AUD) 1.2712 1.2723
Canadian dollar (CAD) 1.3137 1.3215
Swiss franc (CHF) 1.2072 1.2156
Egyptian pound (EGP) 8.4007 7.8058
Hong Kong dollar (HKD) 10.226 10.051
Iceland Krona (ISK) 236.35 257.30
Japanese yen (JPY) 113.61 100.20
Kenyan shilling (KES) 113.68 109.53
Moroccan dirham (MAD) 11.112 11.107
Mexican peso (MXN) 17.185 18.051
Norwegian krone (NOK) 7.3483 7.7540
New Zealand dollar (NZD) 1.6045 1.6737
Russian ruble (RUB) 40.330 41.765
Serbia dinars (RSD) 112.300 106.920
Tunisia dinars (TND) 2.0472 1.9364
Turkish lira (TRY) 2.3551 2.4432
Taiwan dollars (TWD) 38.399 39.203
Ukraine Hryvnia (UAH) 10.631 10.351
United States dollar (USD) 1.3194 1.2939
Franc CFA (XOF) 655.96 655.96
South African rand (ZAR) 11.173 10.483

2352012 Financial Report
EIB Group Consolidated Financial Statements under IFRS
Note Y – Related party transactions – Key Management Personnel
The Group has identified members of the Board of Directors, the Management Committee and the Directors General heading the different EIB organisational directorates as key management personnel.
Key management personnel compensation for the relevant reporting periods, included within General administrative expenses (Note P), is disclosed in the following table:
(in EUR ’000) 2012 2011
Short-term benefits(1) 7 248 8 332
Post employment benefits(2) 613 545
Termination benefits 504 504
8 365 9 381
(1) Short-term employee benefits comprise salaries and allowances, bonuses and social security contributions of the Management Committee, the Direc-tors General and other Directors, and benefits paid to the members of the Board of Directors and the Audit Committee.
(2) Post employment benefits comprise pensions and expenses for post employment health insurance paid to members of the Management Committee and Directors General and other Directors.
Open balances with key management personnel as at 31 December 2012 comprise the compulsory and optional sup-plementary pension plan and health insurance scheme liabilities, and payments outstanding as at the year end:
(in EUR ’000) 31.12.2012 31.12.2011
Pension plans and health insurance (Note J) -34 692 -31 964
Other liabilities (Note G) -9 443 -7 012
Other assets (Note G) 0 6
Note Z – Post balance sheet events
There have been no material events after the balance sheet date that would require adjustment of, or disclosure in, the consolidated financial statements as at 31 December 2012.
236 Financial Report 2012
Independent Auditor’s Report
To the Chairman of the Audit Committee of EUROPEAN INVESTMENT BANK98-100, Boulevard Konrad AdenauerL-2950 LUXEMBOURG
REPORT OF THE REVISEUR D’ENTREPRISES AGREE
We have audited the accompanying consolidated finan-cial statements of EUROPEAN INVESTMENT BANK, which comprise the consolidated balance sheet as at 31 Decem-ber 2012 and the consolidated statements of income and comprehensive income, consolidated statement of changes in equity and consolidated cash flow statement for the year then ended, and a summary of significant accounting policies and other explanatory information.
Management’s responsibility for the consolidated financial statements
The Management is responsible for the preparation and fair presentation of these consolidated financial state-ments in accordance with International Financial Report-ing Standards as adopted by the European Union, and for such internal control as the Management determines is necessary to enable the preparation of consolidated financial statements that are free from material misstate-ment, whether due to fraud or error.
Responsibility of the Réviseur d’Entreprises agréé
Our responsibility is to express an opinion on these consolidated financial statements based on our audit. We conducted our audit in accordance with Interna-tional Standards on Auditing as adopted for Luxem-bourg by the Commission de Surveillance du Secteur Financier. Those standards require that we comply with ethical requirements and plan and perform the audit to obtain reasonable assurance about whether the consolidated financial statements are free from material misstatement.
An audit involves performing procedures to obtain audit evidence about the amounts and disclosures in the consolidated financial statements. The procedures selected depend on the judgement of the Réviseur d’Entreprises agréé, including the assessment of the risks of material misstatement of the consolidated finan-cial statements, whether due to fraud or error. In mak-ing those risk assessments, the Réviseur d’Entreprises agréé considers internal control relevant to the entity’s preparation and fair presentation of the consolidated financial statements in order to design audit procedures that are appropriate in the circumstances, but not for the purpose of expressing an opinion on the effective-ness of the entity’s internal control. An audit also includes evaluating the appropriateness of accounting policies used and the reasonableness of accounting estimates made by the Management, as well as evaluat-ing the overall presentation of the consolidated finan-cial statements.
We believe that the audit evidence we have obtained is sufficient and appropriate to provide a basis for our audit opinion.
Opinion
In our opinion, the consolidated financial statements give a true and fair view of the consolidated financial position of EUROPEAN INVESTMENT BANK as of 31 December 2012, and of its consolidated financial performance and its consolidated cash flows for the year then ended in accordance with International Financial Reporting Stand-ards as adopted by the European Union.
Luxembourg, 14 March 2013 KPMG Luxembourg S.à r.l. Cabinet de révision agréé
E. DolléKPMG Luxembourg S.à r.l.9, Allée SchefferL-2520 LuxembourgSociété à responsabilité limitéeR.C.S. Luxembourg B 149133Capital € 12 502

2372012 Financial Report
EIB Group Consolidated Financial Statements under IFRS
Statement by the Audit Committee
The Audit Committee reports to the Board of Gover-nors, the following statement being communicated to the Governors prior to their approval of the Annual Report and the financial statements for the past finan-cial year.
Statement by the Audit Committee on the EIB’s consolidated financial statements prepared in accordance with the International Financial Reporting Standards as adopted by the EU (IFRS)
The Committee, instituted in pursuance of Article 12 of the Statute and Chapter V of the Rules of Procedure of the European Investment Bank for the purpose of verifying that the operations of the Bank are conducted and its books kept in a proper manner, having
- designated KPMG as external auditors, reviewed their audit planning process, examined and dis-cussed their reports,
- noted that the opinion of KPMG on the consolidat-ed financial statements of the European Investment Bank for the year ended 31 December 2012 is un-qualified,
- convened on a regular basis with the Heads of Directorates and relevant services including,
• the Financial Controller;
• the Directors General of Risk Management and Transaction Monitoring and Restructuring.
- met regularly the Head of Internal Audit and dis-cussed the relevant internal audit reports, and stud-ied the documents which it deemed necessary to examine in the discharge of its duties,
- received assurance from the Management Commit-tee concerning the effectiveness of the internal con-trol structure and internal administration,
and considering
- the consolidated financial statements for the financial year ended 31 December 2012 as drawn up by the Board of Directors at its meeting on 14 March 2013,
- that the foregoing provides a reasonable basis for its statement and,
- Articles 24, 25 & 26 of the Rules of Procedure,
to the best of its knowledge and judgement:
confirms that the consolidated financial statements, com-prising the consolidated balance sheet, the consolidated statements of income and comprehensive income, the consolidated statement of changes in equity, the consoli-dated cash flow statement, and a summary of significant accounting policies and other explanatory information give a true and fair view of the financial position of the Bank as at 31 December 2012 in respect of its assets and liabilities, and of its consolidated financial performance and its consolidated cash flows for the year then ended, in accordance with IFRS.
Luxembourg, 14 March 2013
The Audit Committee
J. RODRIGUES DE JESUS D. NOUY M. MATEJ
M. ÜÜRIKE B. JAKOBSEN J.N. SCHAUS

Printed by Imprimerie Jouve on MagnoSatin paper using vegetable oil-based inks. Certified in accordance with Forest Stewardship Council (FSC) rules, the paper consists of 100% virgin fibre (of which at least 50% from well-managed forests).


2012
Fin
anci
al R
epo
rt 2
012
www.eib.org
© EIB – 03/2013 – QH-AB-13-001-EN-C – ISBN 978-92-861-1734-3 – ISSN 1725-3446 – doi:10.2867/18621 – EIB GraphicTeam
European Investment Bank98 -100, boulevard Konrad AdenauerL-2950 Luxembourg3 (+352) 43 79 – 15 (+352) 43 77 04 www.eib.org – U [email protected]
The EIB Group consists of the
European Investment Bank and the
European Investment Fund.
European Investment Fund15, avenue John Fitzgerald KennedyL-2968 Luxembourg3 (+352) 24 85 – 15 (+352) 24 85 – 81301www.eif.org – U [email protected]
2 012 Fi n a n ci a l R e p o r t
Financial Report