Embed Size (px)
Citation preview

ANNREP2012/2013 V1.0 Page 1 of 21
ANNUAL REPORT 2012 - 2013
For
HAEMATINIC & RELATED ASSAYS
UK NEQAS HAEMATINICS SCHEME
HEART OF ENGLAND NHS FOUNDATION TRUST
GOOD HOPE HOSPITAL
RECTORY ROAD
SUTTON COLDFIELD
B75 7RR
Report Prepared by: Sheena Blackmore Scheme Manager
Dr Malcolm S Hamilton Scheme Organiser
ANNREP2012/13 V1.0 Page 2 of 21
CONTENTS PAGE
1.0 Scope of the report 4
2.0 General Activities 4
2.1 Follow-up on 2011 report 4
2.11 Recalibration of Beckman Access group serum folate methods 4
2.12 EPO performance monitoring 4
2.2 Scientific and educational activity 4
2.21 B12 false normal results 4
2.22 Stabilities of EPO and RCF survey samples. 4
2.23 Shelf-life of samples in transit 4
2.3 Feedback from participants’ surveys and meetings 5
2.31 Participant satisfaction surveys 5
2.32 Annual participants meeting 5
2.4 Accreditation status 5
3.0 Scheme Operational Trends 6
3.1 Haematinics Scheme participation trends 6
Graph 1 Participation trends 6
3.11 Analyte participation trends 6
Graph 2 Trends in analyte participation 2001 - 2012 6
3.12 Method trends 7
3.2 Intrinsic Factor Antibody Scheme participation trends 2012 7
Table 1 IFAb participation trends 2005 - 2012 7
3.21 IFAB method trends - 2012 7
Graph 3 IFAb method participation trends 2005 - 2012 7
3.3 EPO Pilot scheme 8
3.31 Participation trends - 2012 8
Table 2 EPO participation trends 2007 - 2012 8
3.32 EPO Method trends - 2012 8
Graph 4 EPO method groups - 2012 8
3.4 HoloTC Pilot scheme 8
3.41 Participation trends 2012 8
Table 3 HoloTC participation trends 2009 - 2012 8
4.0 The Haematinics Scheme 9
4.1 Specimens/cases distributed 9
Table 4 Overview of all samples distributed 9
4.2 Summary of analyte trends for Haematinics 9
4.21 Serum B12 9
Graph 5 Serum B12 cumulative BIAS - 2012 10
4.22 Serum Folate 10
Graph 6 Serum folate cumulative BIAS - 2012 10
4.23 Serum Ferritin 11
Graph 7 Serum ferritin cumulative BIAS - 2012 11
4.24 Red Cell Folate 12

ANNREP2012/13 V1.0 Page 3 of 21
PAGE
5.0 Intrinsic Factor Antibody Scheme 13
5.1 Specimen/case distributed 13
Table 5 Summary of IFAb specimens distributed 2012 13
5.2 IFAb survey samples of interest - 2012 13
6.0 Erythropoietin pilot scheme 14
6.1 Samples/cases distributed 14
Table 6 Values of the samples distributed for EPO in 2012 14
Table 7 CVs at increasing concentration of EPO 14
7.0 Holotranscobalamin (HoloTC) Pilot Scheme 14
7.1 Samples/cases distributed 14
Table 8 Ranges of HoloTC samples distributed - 2012 14
7.2 Teething problems with HoloTC on the Architect platform 15
7.3 Plan to increase the number of surveys per annum 15
8.0 Performance monitoring (PUPs) 15
8.1 Annual PUP Trends - Haematinics 15
Table 9 Annual Haematinics PUP rates: 2004 - 2012 15
8.2 Haematinic PUPs by method group 16
Table 10 Annual summary of PUPs by method group 16
8.3 Annual PUP trends for IFAb 16
Table 11 Annual IFAb PUP trends 16
Table 12 Analysis of PUP types per survey in 2012 17
8.4 EPO and HoloTC performance issues 17
Appendices:
Appendix 1: Plots of Tracking Pool values for serum B12, Folate and Ferritin 18
Appendix 2: Comparison of MLTM vs ALTM for RCF in 2012 and 2011 19
Appendix 3: Update on Sample 1, (212101), issued in October 2012 20

ANNREP2012/13 V1.0 Page 4 of 21
1.0 Scope of the report
The Annual Report for the UK NEQAS Haematinics Scheme provides a performance summary of all the assays covered by the centre at Good Hope Hospital site for the time period April 2012 to March 2013. The schemes offered by the centre include the haematinics assays; serum B12, folate and ferritin and red cell folate (RCF), the Intrinsic Factor Antibodies (IFAb) and pilot schemes for erythropoietin (EPO) and holotranscobalamin (HoloTC, Active B12).
The Report includes follow-up from issues raised in previous annual reports, feedback from participants meetings and surveys, new schemes and scheme developments together with educational and scientific reports carried out by the centre. 2.0 General Activities
2.1 Follow-up on 2011 report
2.11 Re-calibration of the Beckman Access group serum folate methods
We report the observed changes in the Method Laboratory Trimmed Means (MLTMs) and the consequent effects on the All Laboratory Trimmed Mean (ALTM) following the recalibration of the two Beckman methods, in last years report. An update of the final outcome is summarised again in Section 4.22 and the resultant outcome on the performance monitoring statistics is described in Section 8.1
2.12 EPO performance monitoring
We were hoping to have performance monitoring systems in place for this scheme this year but these have been delayed whilst we await the outcome of an independent statistical review of data. 2.2 Scientific and educational activity
2.21 B12 false normal results
In 2005 the Scheme drew attention to the issue of false normal or high B12 results in patients with Pernicious Anaemia with elevated levels of Intrinsic Factor Antibody in their serum. An incident report was raised with the MHRA in September 2005. Following publication of new data in the New England Journal of Medicine in 2012, the matter was raised again with the MHRA. The outcome of the discussions was a decision to issue a statement for publication in the Royal College of Pathologists Bulletin and the Association for Clinical Biochemistry Newsletter. A statement can also be viewed on the Notice Board of the UK NEQAS Haematinics website (ukneqas-hamatinics.org.uk). 2.22 Stabilities on EPO and RCF survey samples (test items)
Further work has been carried out on the stabilities of the samples distributed for EPO and red cell folate extending the study period from 6 to 14 days at ambient temperature. Unfortunately the EPO data was incomplete due to instrument failure and will have to be repeated. The data for the RCF samples indicates samples are stabile at ambient temperature between Day 3 and Day 14.
2.23 Shelf-life testing results
All survey samples are prepared with antibiotics to minimise the risk of bacterial growth in samples in transit and the scheme carried out a sterility check to test the efficacy of the antibiotic regime to maintain sample sterility over a ‘worst case’ transit scenario of up to14
days at ambient temperature (25°C). None of the survey samples grew micro-organisms and as a result the Scheme will now included a statement on the shelf-life of test samples in the Handbook.

ANNREP2012/13 V1.0 Page 5 of 21
2.3 Feedback from participants’ surveys and meetings
2.31 Participant satisfaction surveys
This year the Scheme carried out the annual participant’s survey using a web-based system and distributed the Survey to the ‘Correspondence’ and ‘Main’ contact person for all participants. We sent out two surveys with the same questions to participants in both the Haematinics and Intrinsic Factor Antibody (IFAb) schemes because the formats of the two schemes are somewhat different and we anticipated that there would be different issues raised for each scheme.
The theme for this year’s survey was ‘reports to participants’ which is one of the sections in the new ISO standards for providers of proficiency testing schemes. The survey was not aimed at participants of the Erythropoietin of Holotranscobalamin schemes as these pilot schemes are not fully operational and do not currently have performance scoring systems.
We had 88 replies to the haematinics questionnaire and 44 to the intrinsic factor antibody survey which represent 25% of Haematinic Scheme participants and 32% of the IFAb scheme.
The results suggest that the formats of the scheme reports are generally compliant with the standards but have highlighted one or two areas that could be improved or clarified, particularly with regard to the navigation around our website. The full report can be found in the Reports and Educational tab in the Members Area of the website at www.ukneqas-haematinics.org.uk
2.32 Annual participants meeting
As in previous years the Haematinics Scheme was invited to participate in the meeting organised by the UK NEQAS General Haematology Scheme which, this year, was held at the National Motorcycle Museum in Birmingham. This year’s theme was ‘UK NEQAS Matters’. Two presentations were made by the Haematinics Scheme in the main programme session.
• A contribution by the Scheme Manager to the ‘How do I’ presentation, a session aimed at helping participants interpret their report and understand the performance monitoring process.
• A presentation by the Scheme Director, ‘A case to demonstrate the relevance of EQA in clinical care’.
Evaluation data provided by UK NEQAS General Haematology Scheme on the Haematinics sessions shows that 64% of delegates rated the 'How do I' session at 4 or 5 (out of 5) and 94%, as 3 or above. 53% rated the EQA case study at 4 or 5 and 93% rated this session as 3 or above.
2.4 Accreditation status
The Scheme was assessed for accreditation against the Clinical Pathology Accreditation (UK) standards for providers of External Quality Assurance schemes in December 2012 and has recently had confirmation of ongoing full accreditation status.
As part of the transitional arrangements for accreditation to ISO 17043 (standards for providers of proficiency testing services), a pre-assessment inspection was also carried out by the United Kingdom Accreditation Service (UKAS). The Scheme is working towards assessment against these new standards in the next two year period.

ANNREP2012/13 V1.0 Page 6 of 21
3.0 Scheme Operational Trends
3.1 Haematinic Scheme participation trends
The overall total number of participants in all four schemes has declined slightly in 2012. Analysis of the trends suggests that the pattern of UK participation is changing and shows that as laboratory services consolidate there is a trend to increased numbers of second and third instruments. EU participation figures continue to increase particularly in the IFAb, EPO and HoloTC schemes.
Graph 1: Participation trends: 2002 – 2012
0
50
100
150
200
250
300
350
400
450
2002 2003 2004 2005 2006 2007 2008 2009-10 2010-11 2011-12 2012-13
Year
Numbers of participants (SCALE A)
0
10
20
30
40
50
60
70
80
90
100
(SCALE B)
Total Participants
UK total
EU Scale B
Others Scale B
3.11 Analyte participation trends
Graph 2: Trends in analyte participation 2001 – 2012
80
130
180
230
280
330
380
2001 2002 2003 2004 2005 2006 2007 2008 2009 2010 2011 2012
Year
Participant Numbers
Total B12
Total Folate
Total Ferritin
Total RCF
Participation in the serum assays appears to have increased which may be due to increased registration of second and third platforms. Registration numbers for the red cell folate (RCF) assay have declined once again and currently stand at 82.

ANNREP2012/13 V1.0 Page 7 of 21
3.12 Method Trends
There are now only five major assay platforms in the haematinics field, the Immulite platform participation having fallen to fewer than 10 participants for every analyte. The major method groups are the Abbott Architect (87), Roche Cobas platform (89) and the Siemens Centaur (71) and the two smaller are the Beckman Access (18) and DxI (29).
3.2 IFAb Scheme participation trends -2012
Participation in the IFAb Scheme has increased marginally in 2012. This is due principally to increases in EU participation.
Table 1: IFAb Scheme participation trends 2005 – 2012
2005 2006 2007 2008 2009 2010 2011 2012
Country
UK 82 79 81 85 88 91 93 93
EU 32 30 34 34 30 31 29 35
Other 7 6 4 1 6 4 5 5
Total Participants 121 115 119 123 124 126 127 133
3.21 IFAb method trends - 2012
Graph 3: IFAb method participation trends 2005 to 2012
0
5
10
15
20
25
30
35
40
45
2005 2006 2007 2008 2009 2010 2011 2012
Number in method group
Orgentec Beckman Access Alphadia Euroimmun
Genisis Other Elisa CLS Alegria
D-Tek Inova Other non-Elisa
Numbers of participants in the larger method groups have changed very little between 2010 and 2012. However, numbers in the ‘Other Elisa’ group have increased from 9 to 16 and there are
now 7 different methods in this group with fewer than 5 participants using each method.

ANNREP2012/13 V1.0 Page 8 of 21
3.3 EPO Pilot Scheme
3.31 Participation trends 2012
Table 2: EPO participation trends 2007 – 2012
2007 2008 2009 2010 2011 2012
UK 17 17 17 19 21 20
EU 13 10 14 16 20 27
Others 11 10 9 10 11 10
Total 41 37 40 45 52 57
The modest increase in the participation numbers in the EPO scheme is almost entirely due to increased EU participation.
3.32 EPO method trends – 2012
DPC 2000
60%
DPC 1
4%
Beckman Access
12%
Beckman Dxi
11%
R & D
9%
Epotrax
4%
Although the Siemens Immulite platforms remains the largest method group the demise of the I2500 platform has resulted in a decrease of overall market share from 70% to 64%. Small increases have been seen in the Beckman and Epotrax method groups. 3.4 HoloTC Pilot Scheme
3.41 Participation trends - 2012
Table 3: HoloTC participation trends 2009 – 2012
2009 2010 2011 2012(3)
UK 1 2 2 6
Europe 7 8 9 15
Others 0 0 2 2
Total 8 10 13 23
Graph 4: EPO method groups 2012

ANNREP2012/13 V1.0 Page 9 of 21
The rapid increase in participation numbers in this scheme is almost certainly the result of the release of the HoloTC kit on the Abbott Architect platform. The assay was released in late 2011 and there are now 15 Architect users and 8 Abbott AxSym users. 4.0 The Haematinics Scheme
4.1 Specimens/cases distributed
Table 4 below is an overview of the routine pools and tracking pools (larger pools that are re-distributed at regular intervals) with the consensus interpretation returned from participants with each distribution
Table 4: Overview of all samples distributed
Serum B12 Serum Folate Serum Ferritin RCF
1201 N / N / L N / N / N N / H /N N / N
1202 N / N / N N / N / N N / N / L N / N
1203 N / N / N N / N / N N / N / N N / N
1204 N / N / L N / N / N N / N / N N / N
1205 N / N / N N / N / N N / N / L N / N
1206 N / N / L L/ N / N N / H / N N / N
1207 N / N / L N / N / N N / H / N N / N
1208 N / N / N L / N / N N / H / L N / N
1209 N / N / L N / N / N N / N / N N / N
1210 N / N / N N / N / N N / L / N N / N
1211 L / N / N N / N / N N / H / N N / H
N = Normal Sample (by consensus)
L = Low Sample (by consensus)
H = High sample (by consensus)
The aim of the Scheme when planning surveys is to distribute a minimum of two low and two high concentration samples for each analyte per year. Because of the nature of the donor material this is not always possible, however, in this time window we have sent out 6 low B12 samples, 2 low folate samples, 4 low and 5 high ferritin samples and 1 high red cell folate sample.
Tracking pools
Three B12/FTN trackers were sent out on 10 separate occasions during 2012 and 2 Folate tracking pools were distributed 8 times. These tracking pools assist us in monitoring changes in true method results rather than bias shifts relative to the consensus values. Comment on the tracking pool vales is reported in each analyte section below. There are no RCF tracking
pools because of the long term stability issues associated with the pools stored at 4°C.
4.2 Summary of Analyte Trends for Haematinics
4.21Serum B12 Participant base = 309 Major method groups = Abbott Architect (87), Siemens Centaur (71), Beckman Access (18), Beckman DxI (29), Roche E170 (89).

ANNREP2012/13 V1.0 Page 10 of 21
-40
-30
-20
-10
0
10
20
30
40
1201 1202 1203 1204 1205 1206 1207 1208 1209 1210 1211BIAS (%)
Architect Access Dxi E170 Centaur
The B12 cumulative bias plots (Graph 5) show good agreement between the Abbott Architect and the Roche Diagnostics group, both assays running at approximately 5% to 10% positively biased to the ALTM. The two Beckman platforms are running with a consistent negative bias of approximately 20%. Beckman is aware of this persistent negative bias but has no immediate plans to recalibrate the B12 assay.
B12 tracking pool AA is shown in Graph A in Appendix 1 and very closely reflects the cumulative bias trends above. 4.22 Serum Folate
Participant base = 294. Major method groups = Abbott Architect (85), Siemens Centaur (66), Beckman Access (12), Beckman DxI (28), Roche E170 (88).
-40
-30
-20
-10
0
10
20
30
40
1201 1202 1203 1204 1205 1206 1207 1208 1209 1210 1211BIAS (%)
Architect AB13 Access SF1 Dxi E170 Centaur (CO10) MS
Graph 6: Serum Folate Cumulative BIAS - 2012
Graph 5: Serum B12 Cumulative BIAS - 2012

ANNREP2012/13 V1.0 Page 11 of 21
Graph 6 shows the cumulative bias against the ALTM of the major serum folate methods together with the mass spectrometry (MS) method, between January and November 2012. The graph shows the continuing changes in the cumulative bias of the Beckman Access and DxI platforms following the re-calibration/harmonisation of these assays with the WHO 1st International Standard (IS) for Folate, 03/178, in July 2011. Even with the recent changes in method calibration the ALTM tracks the MS method very closely suggesting that the ALTM is a good surrogate for method accuracy.
Notwithstanding the fact that both Beckman platforms are now calibrated against the 1st IS, the cumulative bias graph (6) suggests that there is a persistent 10% bias difference between the two platforms which was also evident before recalibration. This anomaly has been highlighted with Beckman Coulter but there has been no feed-back at the time of writing.
Folate tracking Pools
Data from long term tracking pools (See Graph B Appendix 1) suggests that the values from the Beckman assays have increased by approximately 35% across the working range of the assay. The impact of this considerable increase in bias by a substantially sized group has been to shift the ALTM value by about 10%. This is likely to be the reason for the observed drop in the relative bias of the Roche Cobas group.
It should be emphasised that although there is movement in the ALTM values the tracking pools indicate that at the clinically sensitive low concentrations of folate, the Roche Cobas group continues to be significantly positively biased, being 33% positive to the ALTM and 43% to the isotope dilution, liquid chromatograph mass spectrometry method (data not presented here). See Graph B Appendix 1 4.23 Serum Ferritin
Participant base = 312 Major method groups = Abbott Architect (88), Siemens Centaur (61), Beckman Access (17), Beckman DxI (29), Roche E170 (93).
Method group participation numbers have increased in the Roche group possibly due to the decline in Siemens Immulite 2000/2500; other methods remain reasonably stable.
Ferritin Cumulative BIAS - 2011-2012
-40
-30
-20
-10
0
10
20
30
40
1201 1202 1203 1204 1205 1206 1207 1208 1209 1210 1211BIAS (%)
Architect Access Dxi E170 Centaur
Graph 7: Serum ferritin cumulative BIAS - 2012

ANNREP2012/13 V1.0 Page 12 of 21
The cumulative biases for the serum ferritin assays are very stable and very similar to the pattern of bias seen for the last five years. Although all methods are running with BIAS less than +/- 25% (Graph 7) there are three distinct method groupings. The Beckman methods are performing with a negative bias, the Roche platforms with a positive bias whilst the Centaur and Architect have minimal bias to the ALTM.
Ferritin tracking pool AA (Graph C, Appendix 1) closely resembles the relative bias graph above although it suggests that there has been a significant negative drift in the Abbott Architect method mean values around June 2012. This drift is not so evident in on Pool AD at the lower range of the assay. 4.24 RCF
Participant base = 82 Major method groups = Abbott Architect (22), Siemens Centaur (26), Beckman Access (16), Beckman DxI (13).
Participation in RCF has fallen by approximately 10 in 2012
The RCF performance monitoring target remains the MLTM for the major method groups (>10 participants) because the accuracy of the ALTM has not been verified with the reference method.
There has been a positive shift in the reported values for RCF from both the Beckman platforms following the recalibration of the serum folate methods on the Access and DxI platforms (See Graph D and E in Appendix 2). The result is better agreement between the Beckman methods and the Siemens Centaur although this only holds true over the very limited range of 250 – 350 µg/L.
Appendix 2 compares the relative biases of the methods to the consensus mean in 2011 and 2012 and illustrates the difficulties with making comparison between the results from different RCF methods.

ANNREP2012/13 V1.0 Page 13 of 21
5.0 Intrinsic Factor Antibody Scheme
5.1 Specimens/cases distributed
Table5: Summary of IFAb Specimens Distributed in 2012
Survey
No Total
Returns
Designated
Result
Positive
Responses
Negative
Responses
Equivocal
Responses
% Out of
Agreement
212012 Negative 0 122 1 0.8 21201
212012 123
Negative 8 114 1 7.3
212041 Negative 1 125 0 0.8 21204
212042 126
Positive 123 1 2 2.4
212071 Negative 2 124 0 1.6 21207
212072 126
Positive 124 1 1 1.6
212101 Negative 17 109 2 14.8 21210
212102 128
Positive 2 126 0 1.6
5.2 IFAb survey samples of interest 2012 Two samples displayed higher than expected Out of Agreement responses and these are discussed below.
Sample 212012 All the Out of Agreement results were confined to the Orgentec and Alegria method groups both of which are produce by the same manufacturer. Analysis of the values reported by participants showed a marked difference between those reporting low, negative results and those reporting high positive results for this sample. The positive results were limited to one reagent lot number but this did not cause problems with sample 212012. Orgentec reanalysed the sample in their lab and confirmed our findings but was unable to suggest an explanation for the phenomenon. We are hoping to re-issue a sample from this patient but this is dependent on the donor’s agreement to be re-bled.
Sample 212101
Background to the issue of sample 212101 This collaborative trial was undertaken as the result of discrepant results for both IFAb and GPC observed by the Haematinics Scheme over a number of years. The objective of the trial was to investigate whether the anomalies that we observed were due to method related issues, kit lot differences or patient variation.
Sample212101 was jointly distributed by the Haematinics and UK NEQAS Immunology schemes. In the IFAb Scheme, 13% of responses, principally from the Alphadia, Cambridge Life Science and Genesis method groups, were reported as POSITIVE (Designated Response (DR) nominally assigned as Negative)
Results for GPC on the same sample issued by Immunology in October showed that all participants using Elisa methods reported this sample as POSITIVE and participants using immunofluorescence methods generally reported the sample as NEGATIVE. This pattern of responses was also unexpected and had not been observed previously.
The two Schemes carried out further investigations to try and establish the reason for this pattern of responses. The full report on this trial can be viewed in Appendix 3 but in summary we were unable
establish a cause other than the possibility that the donor may have anti-porcine IFAb

ANNREP2012/13 V1.0 Page 14 of 21
6.0 Erythropoietin Pilot Scheme:
6.1 Samples/cases distributed
Table 6: Values of the EPO samples distributed - 2012
Sample A Sample B Sample C
E1201 4158.72 ٭213 ٭
E1202 42.0 4.86 69.0
E1203 2.90 11.0 711٭
E1204 8.48 4.82 406٭
E1205 7.33 26.9 62.5٭
E1206 14116.9 2.63 ٭
E1207 9.4 98.4 12.5
E1208 9.64 6.23 11.6
E1209 144 2.94 13.6
E1210 9.45 13.8 752٭
E1211 12.3 5.52 77.5٭
Samples spiked with additional Epoetin ٭
As can be seen in Table 6 above, the range of assay values has been increased to 752 IU/L by the addition of Epoetin. This value is approximately at the upper limit of the EPO assay; samples greater than this requiring dilution. Participants are encouraged to dilute the samples to obtain a result as this is deemed to be of value for monitoring purposes.
Table 7: CVs at increasing concentrations of EPO
All date mean Trimmed CV All date mean Trimmed CV All date mean Trimmed CV
2.90 14.6% 42.0 7.56% 406 5.08%
Table 7 shows the CVs of the All Laboratory Data across the range of samples distributed and shows an improvement as values increase. This may have implications for future statistical manipulation and performance monitoring.
7.0 HoloTC Pilot Scheme
7.1 Samples/cases distributed
There are now 23 participants in the HoloTC Scheme, thirteen of which are using the new method on the Abbott Architect. (See Section 3.41)
Table 8: Range of HoloTC samples distributed in 2012
Survey No Sample A Sample B Sample C
1201 21.9 19.1 15.5
1204 34.1 29.9 33.2
1207 54.9 24.5 61.2
1210 30.8 146 64.1
The samples distributed are single serum samples from donors to the Haematinics Scheme ie. patients that are venesected as part of their treatment regime for polycythaemia or haemochromatosis.

ANNREP2012/13 V1.0 Page 15 of 21
More than half of the samples distributed have values on or below the 35 pmol/L which is the cut-off value recommended for optimum specificity for discrimination of the B12 ‘grey zone’. The B12 values of the samples, as measured by our local laboratory, are also quoted on the report to participants. 7.2 ‘Teething problems’ with HoloTC on the Abbott Architect platform
At the time of writing the Annual Report for 2011/2012 the Scheme was aware of differences between the newly launched Architect and the Abbott AxSym methods. In January 2012 the results from the Architect group were significantly higher (~55%) than those reported by the AxSym group and approximately 25% higher in the following Survey (E1204).
In the period between the two surveys Abbott issued a Field Safety Notice and a Product Correction Notice pertaining to the high bias observed in the Architect ‘Active B12’ method. The field safety notice alerted Architect users to the positive bias (approx. 20-30%) obtained when using reagent lot numbers 10112UPOO, 10113UPOO and 103131UPOO. The company also alerted customers to possible problems when using the reference ranges quoted in the Expected Values of the package insert accompanying these lot numbers.
The problem was caused by two factors; the first related to components that make up the microparticle and the other related to the variable endogenous B12 present in the bovine serum albumin (BSA) component of the microparticle diluent. Rectification of these problems resulted in a fall in the values for Active B12 from the Architect and a concurrent recalibration of the assay on the AxSym produced higher values from this instrument. The results from both analysers were in agreement in Survey E1207 (July 2012).
7.3 Plans to increase the number of survey per annum
With participant numbers rapidly increasing and the introduction of a ‘second’ method for this analyte we intend to increase the number of surveys per annum in order to improve the statistical power of the data and to permit development of performance monitoring statistics. The scheme will conduct a survey of current participants to establish figures for assay turnaround times, etc, in order to decide on survey frequency and reporting intervals. 8.0 Performance monitoring.
8.1 Annual PUP trends – Haematinics
Table 9: Annual Haematinic PUP rates 2006 - 2012
2006 2007 2008 2009 2010 2011 2012 (%) (%) (%) (%) (%) (%) %
Serum B12 0.9 0.5 0.4 0.5 0.7 0.6 0.8
Serum Folate 1.7 1.1 0.5 9.0 15.0 15.9 2.9
Serum Ferritin 1.8 0.7 2.5 1.6 2.3 1.4 2.4
RC Folate 6.1 5.4 5.6 2.9 1.5 1.5 2.4
Calculation of Rate
% PUPed = Annual Number of PUPs/Possible Annual PUPs X 100
Possible Annual PUPs = Analyte Participant Number X Number of annual distributions ie.11 NB. All three serum assays are performance monitored against the ALTM since 2009
ANNREP2012/13 V1.0 Page 16 of 21
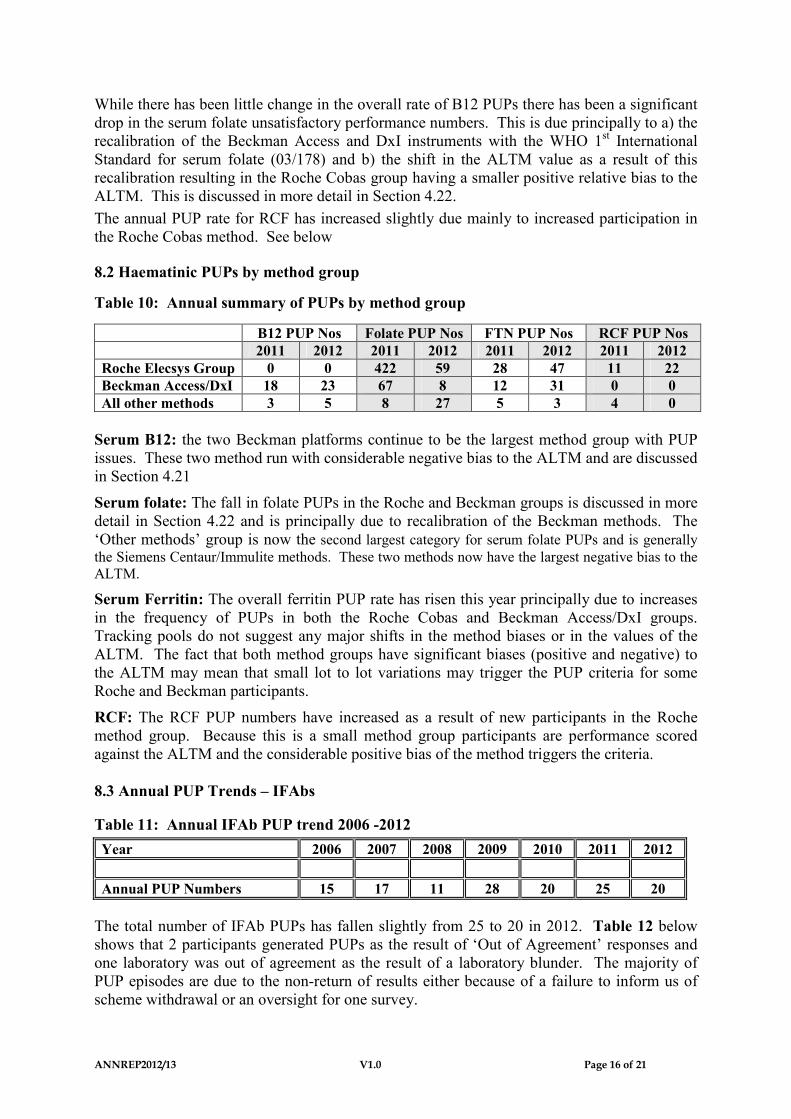
While there has been little change in the overall rate of B12 PUPs there has been a significant drop in the serum folate unsatisfactory performance numbers. This is due principally to a) the recalibration of the Beckman Access and DxI instruments with the WHO 1st International Standard for serum folate (03/178) and b) the shift in the ALTM value as a result of this recalibration resulting in the Roche Cobas group having a smaller positive relative bias to the ALTM. This is discussed in more detail in Section 4.22.
The annual PUP rate for RCF has increased slightly due mainly to increased participation in the Roche Cobas method. See below
8.2 Haematinic PUPs by method group
Table 10: Annual summary of PUPs by method group
B12 PUP Nos Folate PUP Nos FTN PUP Nos RCF PUP Nos
2011 2012 2011 2012 2011 2012 2011 2012
Roche Elecsys Group 0 0 422 59 28 47 11 22
Beckman Access/DxI 18 23 67 8 12 31 0 0
All other methods 3 5 8 27 5 3 4 0
Serum B12: the two Beckman platforms continue to be the largest method group with PUP issues. These two method run with considerable negative bias to the ALTM and are discussed in Section 4.21
Serum folate: The fall in folate PUPs in the Roche and Beckman groups is discussed in more detail in Section 4.22 and is principally due to recalibration of the Beckman methods. The ‘Other methods’ group is now the second largest category for serum folate PUPs and is generally the Siemens Centaur/Immulite methods. These two methods now have the largest negative bias to the ALTM.
Serum Ferritin: The overall ferritin PUP rate has risen this year principally due to increases in the frequency of PUPs in both the Roche Cobas and Beckman Access/DxI groups. Tracking pools do not suggest any major shifts in the method biases or in the values of the ALTM. The fact that both method groups have significant biases (positive and negative) to the ALTM may mean that small lot to lot variations may trigger the PUP criteria for some Roche and Beckman participants.
RCF: The RCF PUP numbers have increased as a result of new participants in the Roche method group. Because this is a small method group participants are performance scored against the ALTM and the considerable positive bias of the method triggers the criteria. 8.3 Annual PUP Trends – IFAbs
Table 11: Annual IFAb PUP trend 2006 -2012
Year 2006 2007 2008 2009 2010 2011 2012
Annual PUP Numbers 15 17 11 28 20 25 20
The total number of IFAb PUPs has fallen slightly from 25 to 20 in 2012. Table 12 below shows that 2 participants generated PUPs as the result of ‘Out of Agreement’ responses and one laboratory was out of agreement as the result of a laboratory blunder. The majority of PUP episodes are due to the non-return of results either because of a failure to inform us of scheme withdrawal or an oversight for one survey.

ANNREP2012/13 V1.0 Page 17 of 21
Table 12: Analysis of IFAb PUP types for surveys in 2012
PUP Type 21201 21204 21207 21210 Annual
Total
Total No PUP 5 8 3 4 20
Out of Agreement (Current Distribution) 1 1 0 0 2
Blunder/transcription for the current Distribution 0 0 1 0 1
Non-Returns for the current Distribution 3 6 2 3 14
Scores carried forward from previous Distributions 1 1 0 1 4
8.4 EPO and HoloTC performance issues
Performance criteria have not yet been developed for these schemes, however, this will be addressed as participant numbers and instrument diversity increases.

ANNREP2012/13 V1.0 Page 18 of 21
Appendix 1
Plots of Tracking Pool values for serum B12, Folate and Ferritin
Graph A: Serum B12 –Tracking Pool AA
200.00
250.00
300.00
350.00
400.00
450.00
11051 11081 11111 12021 12051 12081
Concentration B12 ng/L
ALTM Architect Beckman Access Beckman DXi Roche E170 Siemens Centaur
Graph B: Serum Folate – Tracking Pool AB
2.0
2.5
3.0
3.5
4.0
4.5
5.0
5.5
6.0
11085 11115 12025 12055 12085 12115
Folate (ug/l)
ALTM Architect Access Access DxI Roche cobas series Centaur
Graph C: Serum Ferritin – Tracking Pool AA
150.00
170.00
190.00
210.00
230.00
250.00
270.00
290.00
11051 11081 11111 12021 12051 12081
Concentration FTN ug/L
ALTM Architect Beckman Access Beckman Dxi Roche E170 Siemens Centaur

ANNREP2012/13 V1.0 Page 19 of 21
Appendix 2
Comparison of MLTM vs ALTM for RCF in 2012 and 2011
-0.6
-0.4
-0.2
0
0.2
0.4
0.6
0.8
100 200 300 400 500 600 700 800 900
Deviation
-0.6
-0.4
-0.2
0
0.2
0.4
0.6
0.8
50 100 150 200 250 300 350 400 450 500 550
Deviation
Graph D - MLTM vs ALTM for RCF - 2012
Graph E - MLTM vs ALTM for RCF - 2011

ANNREP2012/13 V1.0 Page 20 of 21
Appendix 3 Update on Sample 1, (212101), issued in October 2012
Sample 2012101 was jointly distributed by the Haematinics and UK NEQAS Immunology schemes. In the IFAb Scheme, 13% of responses, principally from the Alphadia, Cambridge Life Science and Genesis method groups, were reported as POSITIVE. As this was a patient with polycythaemia without evidence of Pernicious Anaemia the positive results were unexpected. However they were very similar to the pattern of IFAb results observed when the sample was originally distributed in 2007. Numerical results on the positive IFAb responses were generally observed to be convincingly positive and not borderline/equivocal. Results for GPC on the same sample issued by Immunology in October showed that all participants using Elisa methods reported this sample as POSITIVE and participants using immunofluorescence methods generally reported the sample as NEGATIVE. This pattern of responses was also unexpected and had not been observed previously. The sample was investigated further. Other screening tests carried out by the Haematinics Scheme to support the designation of the sample as negative and to exclude possible interferences included thyroid antibodies, anti nuclear antibodies, smooth muscle antibodies, mitochondrial antibodies, and Rheumatoid factor. All were negative. An examination of the donor’s treatment regime did not indicate drugs known to interfere with IFAb or GPC methods. The sample was tested for heterophilic antibodies which were NEGATIVE. This finding was followed by an investigation of the antibodies/epitopes employed by each method/manufacturer GPC Antigen
Manufacturer Antigen Antigen Source Specificity of epitope
OrgenTEC highly purified H+/K+ dependent
ATPase antigen
Pig alpha and beta sub units (95
and 60-90kDa)
INOVA purified H+/K+ dependent ATPase
antigen
Porcine
Phadia H+/K+ dependent ATPase
Genesis highly purified H+/K+ dependent
ATPase antigen
pig gastric mucosa Alpha (95kDA) and Beta (60-
90kDA)
Euroimmun H+/K+ - ATPase porcine gastric
mucosa
Aesku purified native H+/K+ dependent
ATPase
swine gastric mucosa

ANNREP2012/13 V1.0 Page 21 of 21
IFAb Antigen
MANUFACTURER METHODS Antigen source%POS on Survey
21210
AESKULISA ELISA HUMAN 0%
ALPHADIA Dot ELISA PORCINE 2 of 3 = 66%
ALPHADIA ELISA PORCINE 6 of 9= 66%
BECKMAN ACCESSCompetitive binding immunoenzymatic
assay paramagnetic particlesPORCINE 0 out of 21 =0%
BIOMERICA ELISA 0%
IBL Diagnostics ELISA HUMAN 0%
CLS ELISA - PORCINE 7 of 7 = 100%
DPC Binding 57 Co radio binding ?? 1 of 2 = 50%
EUROIMMUNELISA (IgG) and Indirect immuno
fluorescence IIF PORCINE 0 of 12 = 0%
GENESIS ELISA PORCINE 2 of 3 = 66%
GRIFOLS ELISA HUMAN 0%
IMMCO ELISA marked as 'Immulisa' HUMAN 0%
INOVA ELISA marked as 'Quantalite' HUMAN 0%
MENARINI ELISA 0%
ORGANTEC ELISA HUMAN 0%
ORGANTEC ALEGRIA ELISA HUMAN 0%
Observations
Five of the six GPC Elisa antigens are porcine in origin compared with IIF methods that are usually rodent. For the majority of IFAb kits the antigen source is porcine. All the positive IFAb results were in methods with porcine antibodies although this does not explain the ‘porcine kits’ that did not show positive results (Euroimmun – Elisa method and Beckman – competitive binding method). None of the human antigen kits show positive results. Conclusion
We were unable to establish the cause of these odd responses in the IFAb and GPC kits. It is possible that the IFAb donor has anti-porcine IFAb. This maybe a one off situation but serves to remind participants that care should be taken when interpreting IFAb and GPC results as in spite of good assay performance, false positive results may occur.