Embed Size (px)
Citation preview

PUMPING SOLUTIONS AROUND THE WORLD
Annual Report 2011

3 Financial Highlights
4 Letter to Shareholders
5-12 Principal Markets Served
13 The Company
14 Report of Independent Registered Public Accounting Firm
15-19 Consolidated Financial Statements
20-27 Notes to Consolidated Financial Statements
28-33 Management’s Discussion and Analysis
34 Report of Management on Internal Control Over Financial Reporting
35 Report of Independent Registered Public Accounting Firm
36-37 Eleven-Year Summary of Selected Financial Data and Summary of Quarterly Results of Operations
38 Board of Directors/Officers/Committees
39 Divisions and Subsidiaries
40-41 Shareholder Information
The Gorman-Rupp Company’s CEO, Jeff Gorman, joined by Jim Gorman, Chairman of the Board, the Board of Directors and members of the Company’s management team, rang the closing bell at the New York Stock Exchange (NYSE) on July 28, 2011.
The honor of ringing the closing bell at the NYSE represented a great milestone for Gorman-Rupp’s history following its initial listing on the American Stock Exchange in 1968 and celebration of its 75th year anniversary in 2008. The ceremony also commemorated the Company’s decision to join the NYSE Amex in 2009 following the acquisition of the American Stock Exchange by the NYSE.
CONTENTS
2

3
07 08 09 10 11
150
178
200
215
159
Equity(Millions of Dollars)
07 08 09 10 11
1.10
0.87
1.24
1.47*
1.30
Earnings Per Share(Dollars)
07 08 09 10 11
306
266
297
359
331
Sales (Millions of Dollars)
The Gorman-Rupp Company Annual Report 2011
Highlights
Operating Results
Net sales $359,490 $296,808 21.1
Net income, as adjusted 30,804* 25,963 18.6
Financial Position
Total assets $298,700 $286,707 4.2
Equity 214,764 199,834 7.5
Shareholder Information
Earnings per share, as adjusted 1.47* $1.24 18.5
Dividends paid per share 0.354 0.336 5.4
Return on average equity 13.9% 13.8% –
2011 2010 % Change(Thousands of dollars, except per share amounts)
Year ended December 31,
FINANCIAL
Consecutively Paid Quarters (62 Years)
248
39Consecutive Years
Increased
DIVIDENDS
07 08 09 10 11
.310
.324
.336
.354
.320
Dividends Paid Per Share(Dollars)
*Non-GAAP measures. Excludes GAAP-required pension settlement loss of $2.0 million and $0.10 per share, net of income taxes, respectively.

4
LETTER TO SHAREHOLDERS
We are pleased to report 2011 was a record year for incoming orders, sales and earnings, with continued strengthening of
demand in most of the markets we serve. Our National Pump Company acquisition also performed at record levels.
Total incoming orders were a record $408.9 million for the year, resulting in record shipments of $359.5 million.
The backlog of orders was a year-end record of $155.5 million. In an uncertain global economy, international sales
continued to increase slightly to a new record of $118.1 million.
Net income was a record $28.8 million even after a $3 million pension settlement loss required by accounting rules, resulting in
record earnings per share of $1.37. Without the pension charge, net income would have been $30.8 million
or earnings per share of $1.47.
Working capital was a record $105.0 million at the end of 2011 as the Company’s liquidity continues to grow.
Short-term debt related to the National Pump Company acquisition was reduced from $25 million to $10 million at year-end.
Some additional points worth noting:
• We achieved 62 years of consecutive quarterly dividends to shareholders, and our payment of increased dividends for 39 years places us in the top 50 of all U.S. public companies.
• We successfully completed the Company’s five-for-four stock split in June.
• Our recent expansion of the Mansfield, Ohio manufacturing facility positioned the Company to take advantage of the significant growth opportunities presented throughout the year.
• On July 28, 2011 we were honored to ring the closing bell at the New York Stock Exchange.
The pent-up demand for infrastructure improvements, along with global needs for safe drinking water and proper
sanitation, positions Gorman-Rupp well in the estimated $47 billion worldwide pump market.
Our highest ever year-end backlog and an economy showing signs of slow but continuing growth provide excellent
momentum into 2012. We are very pleased with the performance of the Company and the continued dedication
and accomplishments of our employees.
James C. Gorman Chairman
Jeffrey S. Gorman President & Chief Executive Officer
THE GORMAN-RUPP COMPANY

The Gorman-Rupp Company Annual Report 2011
5
Gorman-Rupp helps municipalities provide residents with clean
drinking water every day. Our extensive line of municipal clean water
and above- and below-ground wastewater-handling systems includes
pumps, motors, controls, piping, and accessories that are often housed
in corrosion-resistant fiberglass enclosures and are ready to install on site.
Our pressure booster stations and systems are the solution to low water
line pressure whenever and wherever it occurs. Gorman-Rupp Auto-Start
power pumping stations automatically convert to standby engine power
during power failures, eliminating the need for expensive generator systems.
National Pump Company provides municipalities with deep-well line shaft
and submersible pumps, while Patterson Pump Company’s large volume
products – such as split-case, centrifugal, axial flow and vertical pumps –
allow larger cities to maintain dependable water supplies.
Patterson Pump Company produces flood control pumps that are
engineered to move large volumes of water quickly and continuously in
capacities of more than 700,000 gallons per minute. Patterson is one of the
few companies in the world that has the facilities, engineering expertise
and manufacturing experience to produce pumps of this magnitude.
Municipal
5

6
Patterson Pump Company and its Ireland-based subsidiary
manufacture an extensive selection of centrifugal pumps and systems
to meet a growing global demand for automatic sprinkler systems, fire
hydrants, standpipes, fog systems and deluge systems. Our pumps stand
ready to fight fires and their destructive potential in hotels, banks,
factories, airports, schools, public buildings and countless numbers of
other large installations worldwide. Their rugged dependability has
made them the preferred choice in numerous large installations
around the globe.
Gorman-Rupp’s Mansfield Division produces a line of smaller,
high-pressure truck-mounted pumps that allow fire departments to
siphon water from pools or ponds when hydrants are not available.
To do the same job in even tighter spaces, our American Machine and
Tool (AMT) subsidiary produces smaller pumps that are even easier
to transport.
Fire

The Gorman-Rupp Company Annual Report 2011
For more than 40 years, National Pump Company has been a preferred
choice in the agricultural irrigation market. National Pump produces the
pump configurations that today’s agriculture customers need for a variety
of locations and conditions.
The Company’s pumps help farmers provide life-sustaining water for the
production of wheat, corn, cotton, soybeans, rice and produce. Due to
strategically located branches throughout the United States, the right
pumps are delivered to customers on a timely basis.
Gorman-Rupp’s Mansfield Division produces a full selection of models for
animal waste and pit agitation, irrigation, liquid fertilizer, and basic utility
and dewatering applications.
Agriculture
7

Gorman-Rupp is a longtime leader in designing and manufacturing
pumps that safely and efficiently handle refined petroleum products
such as aircraft fuels, gasoline, fuel oil, petrochemicals and solvents.
The Company continues to be the primary supplier to the aircraft
refueler pump market.
For bulk operations, our Roto-Prime® series provides dependable,
positive priming and re-priming, along with safe handling of
volatile fluids.
National Pump Company has a complete line of vertical turbine
American Petroleum Institute (API) pumps designed specially for
refinery, hydrocarbon processing, petroleum fuels and pipelines.
As new fuels, new vehicles, and new transportation systems are
developed, demanding more complex and more efficient pump
designs, Gorman-Rupp engineers continue to design products that
will safely and dependably meet new technology requirements.
Petroleum
8

The Gorman-Rupp Company Annual Report 2011
Construction Gorman-Rupp is a market leader in the construction industry, having
numerous pump models designed specifically for construction applications.
Gorman-Rupp built its reputation on the workhorses of the construction pump
market with self-priming, centrifugal trash pumps. These dependable, versatile
performers help contractors rapidly remove large volumes of water, undeterred
by sticks, stones and debris.
Our pumps are used worldwide to remove water from quarries, streams,
ditches, foundations and basements, while submersible models work below
the surface and are ideal for dewatering narrow coffer dams and deep
excavations, and our diaphragm pumps remove mud and sand-laden water at
construction sites.
For contractors requiring smaller pumps, our American Machine and Tool (AMT)
line – including engine-driven centrifugal and diaphragm pumps in a variety of
materials – provides excellent performance and rock-solid dependability.
Current demands for improved infrastructure throughout the world are
creating new opportunities in the construction market for Gorman-Rupp.
9
10
Gorman-Rupp Industries Division, Mansfield Division and Patterson Pump
Company create pumping solutions used in industries ranging from
appliance manufacturing and food processing to commercial heating,
ventilation and air conditioning (HVAC) equipment, trucking, chemical
processing, waste treatment, printing, electronics, water reclamation,
solar heating and laser cooling.
Patterson Pump Company uses their design and engineering expertise
to meet expanding global energy needs, fabricating large turbine
exhaust housings for gas powered electric generation equipment for
the OEM market.
The Company produces pumps for major government suppliers that
ultimately manufacture products designed for military use. Gorman-Rupp
pumps are an integral part of U.S. military equipment, including tank
trailers, portable air-drop or air-deliverable bulk water and fuel delivery
units, and complete mobile fueling systems to sustain massive daily
fueling requirements.OEM
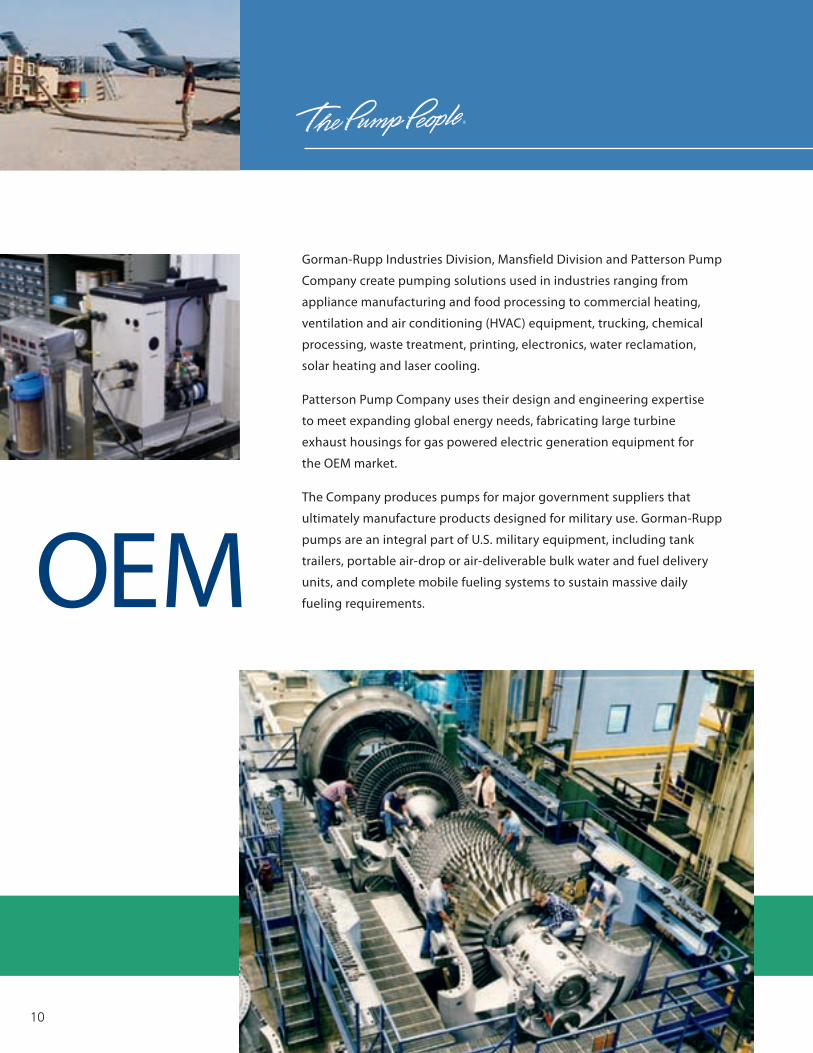
Gorman-Rupp industrial pumps consistently handle everything
from clear liquids to corrosive, abrasive slurries. The Mansfield
Division, Patterson Pump Company and American Machine and
Tool (AMT) pumps keep steel mills, paper mills, refineries,
appliance plants, wineries, mines and hundreds of other facilities
running at peak capacity throughout the world.
National Pump’s close-coupled line shaft and submersible pumps
provide efficient solutions for industrial water supply challenges.
Patterson Pump Company, National Pump and AMT serve the
commercial plumbing, heating, ventilation and air conditioning
(HVAC), and private brand markets.
Gorman-Rupp Industries Division manufactures magnetic
drive, bellows metering, centrifugal and oscillating pumps
for industrial applications in the solar heating, appliance,
medical, and food service industries.
The Gorman-Rupp Company Annual Report 2011
Industrial
11

12
International By maintaining international manufacturing and distribution facilities and
shipping to more than 100 countries worldwide, Gorman-Rupp has established
a growing international presence and a reputation for reliability.
The Company’s operation in County Westmeath, Ireland assembles pumps
primarily for the international fire protection market, while our facility in
Leeuwarden, The Netherlands shortens European lead times.
To serve the Canadian market, Gorman-Rupp’s St. Thomas, Ontario facility
produces a complete line of pumps similar to those manufactured by the
Mansfield Division.

13
The Gorman-Rupp Company Annual Report 2011
Gorman-Rupp’s family of pump companies offers a wide selection of pumps and
pumping systems for many fluid-handling applications. Ranging in diverse sizes from
fractional horsepower pumps to the largest of flood control pumps, Gorman-Rupp
pumps are in continuous duty around the globe.
The Gorman-Rupp Company designs, manufactures and sells pumps and related
equipment (pump and motor controls) for use in water, wastewater, construction,
industrial, petroleum, original equipment, agriculture, fire protection, heating, ventilation
and air conditioning (HVAC), military and other liquid-handling applications.
The Company’s pumps are marketed in the United States and worldwide through a
network of more than 1,000 distributors, through manufacturers’ representatives (for
sales to many original equipment manufacturers), through third-party distributor catalogs,
and by direct sales. International sales are made primarily through foreign distributors
and representatives. The Company sells to more than 100 countries around the world.
THE COMPANY
14
The Board of Directors and Shareholders ofThe Gorman-Rupp Company
We have audited the accompanying consolidated balance sheets of The Gorman-Rupp Company as of December 31, 2011 and 2010, and the related consolidated statements of income, equity, and cash flows for each of the three years in the period ended December 31, 2011. These financial statements are the responsibility of the Company’s management. Our responsibility is to express an opinion on these financial statements based on our audits.
We conducted our audits in accordance with the standards of the Public Company Accounting Oversight Board (United States). Those standards require that we plan and perform the audit to obtain reasonable assurance about whether the financial statements are free of material misstatement. An audit includes examining, on a test basis, evidence supporting the amounts and disclosures in the financial statements. An audit also includes assessing the accounting principles used and significant estimates made by management, as well as evaluating the overall financial statement presentation. We believe that our audits provide a reasonable basis for our opinion.
In our opinion, the financial statements referred to above present fairly, in all material respects, the consolidated financial position of The Gorman-Rupp Company at December 31, 2011 and 2010, and the consolidated results of its operations and its cash flows for each of the three years in the period ended December 31, 2011, in conformity with U.S. generally accepted accounting principles.
We also have audited, in accordance with the standards of the Public Company Accounting Oversight Board (United States), The Gorman-Rupp Company’s internal control over financial reporting as of December 31, 2011, based on criteria established in Internal Control – Integrated Framework issued by the Committee of Sponsoring Organizations of the Treadway Commission and our report dated March 5, 2012 expressed an unqualified opinion thereon.
Cleveland, OhioMarch 5, 2012
Report of Independent Registered Public Accounting Firm

The Gorman-Rupp Company Annual Report 2011
15
Consolidated Statements of Income
Share amounts and per share data reflect the 5 for 4 stock split effective June 10, 2011.See notes to consolidated financial statements.
Net sales $359,490 $296,808 $266,242
Cost of products sold 271,653 220,471 204,469
Gross profit 87,837 76,337 61,773
Selling, general and administrative expenses 44,843 37,378 35,380
Operating income 42,994 38,959 26,393
Other income 409 362 1,209
Other expense
Income before income taxes 42,685 38,333 27,255
Income taxes 13,881 12,370 8,986
Net income $ 28,804 $ 25,963 $ 18,269
Earnings per share $1.37 $1.24 $0.87
Average number of shares outstanding 20,987,663 20,905,728 20,886,309
Year ended December 31,(Thousands of dollars, except per share amounts)
(988) (347)(718)
2011 2010 2009

16
Consolidated Balance Sheets
Assets
Current assets:
Cash and cash equivalents $ 20,142 $ 32,229
Short-term investments 1,060 2,017
Accounts receivable – net 56,419 51,996
Inventories – net:Raw materials and in-process 30,480 20,128
Finished parts 36,451 27,005
Finished products 6,262 4,316
73,193 51,449
Deferred income taxes 2,711 2,172
Prepaid and other 2,347 3,331
Total current assets 155,872 143,194
Property, plant and equipment:
Land 2,270 2,024
Buildings 91,395 89,444
Machinery and equipment 132,743 124,771
226,408 216,239
Accumulated depreciation 112,059 102,713
Property, plant and equipment - net 114,349 113,526
Deferred income taxes 205 211
Prepaid pension and other 2,793 3,334
Goodwill and other intangible assets 25,481 26,442
$298,700 $286,707
(Thousands of dollars) December 31,
2011 2010
Share amounts reflect the 5 for 4 stock split effective June 10, 2011.See notes to consolidated financial statements.

The Gorman-Rupp Company Annual Report 2011
17
Liabilities and equity
Current liabilities:
Accounts payable $ 15,679 $ 12,042
Short-term debt 10,000 25,000
Payroll and employee related liabilities 10,283 10,165
Commissions payable 7,757 6,591
Accrued expenses 7,154 5,880
Total current liabilities 50,873 59,678
Pension benefits 6,571 –
Postretirement benefits 22,705 22,241
Deferred and other income taxes 3,787 4,954
Total liabilities 83,936 86,873
Equity:
Common shares, without par value: Authorized – 35,000,000 shares; Out standing – 20,990,893 shares in 2011 and
20,985,668 shares in 2010 (after deducting treasury shares of 648,603 in 2011 and 654,603 in 2010) at stated capital amount 5,128 5,127
Additional paid-in capital 2,544 2,400
Retained earnings 223,136 201,735
Accumulated other comprehensive loss
Total equity 214,764 199,834
$298,700 $286,707
(9,428)(16,044)
December 31,
2011 2010

18
Consolidated Statements of Equity
Balances January 1, 2009 $ 5,099 $ 455 $ 170,857 $ 618 $ 159,206
Comprehensive income: Net income 18,269 75 18,344Currency translation adjustments 1,750 14 1,764Pension and OPEB adjustments (net of income tax benefit of $2,831)
5,003
5,003
Total comprehensive income – – 18,269 6,753 89 25,111
Issuance of 3,750 treasury shares 1 43 18 62
Cash dividends - $0.324 a share
Balances December 31, 2009 5,100 498 182,377 707 177,612
Comprehensive income: Net income 25,963 66 26,029Currency translation adjustments 139 93Pension and OPEB adjustments (net of income tax benefit of $864)
1,549
1,549
Total comprehensive income – – 25,963 1,688 20 27,671
Purchase of noncontrolling interest 166Purchase of 31,250 treasury shares Issuance of 128,750 treasury shares 35 2,223 562 2,820
Cash dividends - $0.336 a share
Balances December 31, 2010 5,127 2,400 201,735 – 199,834
Comprehensive income: Net income 28,804 28,804Currency translation adjustments Pension and OPEB adjustments (net of income tax expense of $3,282)
Total comprehensive income – – 28,804 – 22,188
Issuance of 6,000 treasury shares 1 144 27 172Cash dividends - $0.354 a share
Balances December 31, 2011 $5,128 $2,544 $223,136 $ – $214,764
(Thousands of dollars, except per share amounts)Common
SharesRetained Earnings
Additional Paid-In Capital
Accumulated Other
Comprehensive Loss
Noncontrolling Interest Total
(8)
(6,767)
(7,024)
(143)(727)
(46)
(6,767)
(7,024)
(638)(607)(46)
(11,070)
$ (17,823)
(9,428)
(487)
(886)(886)
(5,730)(5,730)
(6,616)
(7,430) (7,430)
$(16,044)
Share amounts and per share data reflect the 5 for 4 stock split effective June 10, 2011.See notes to consolidated financial statements.
The Gorman-Rupp Company Annual Report 2011
19See notes to consolidated financial statements.
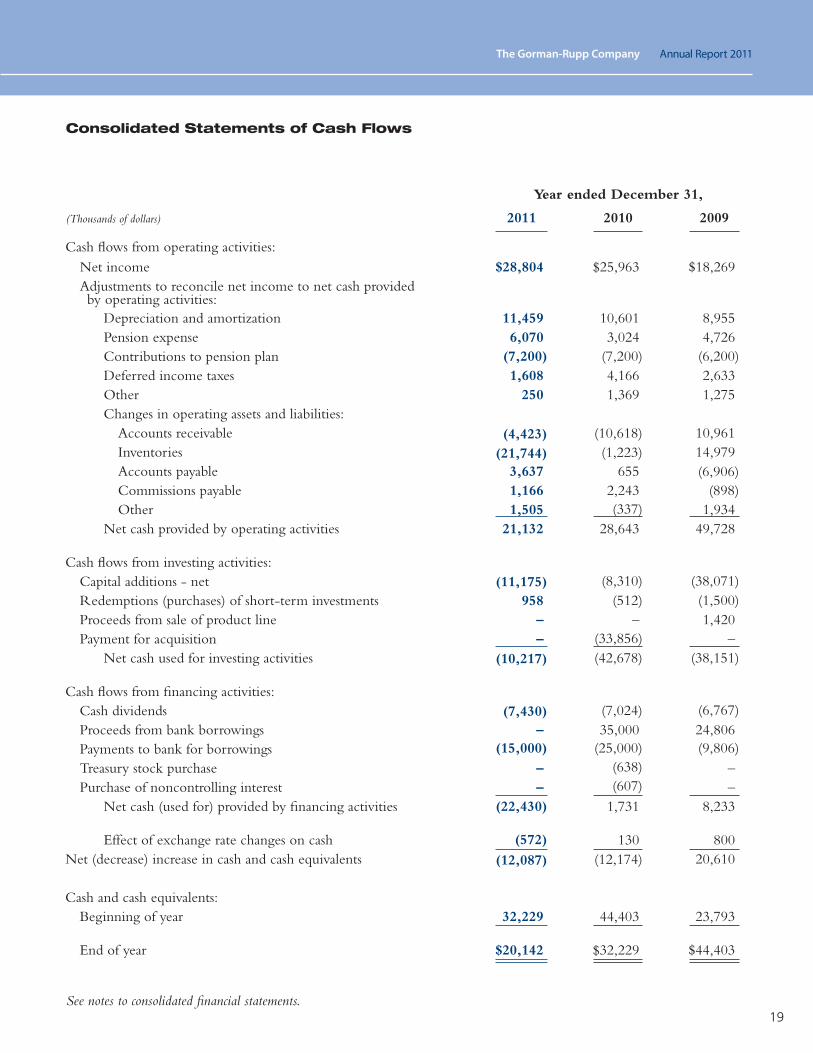
Consolidated Statements of Cash Flows
(Thousands of dollars)
Year ended December 31,
2011 2010 2009
Cash flows from operating activities:Net income $28,804 $25,963 $18,269Adjustments to reconcile net income to net cash provided by operating activities:
Depreciation and amortization 11,459 10,601 8,955Pension expense 6,070 3,024 4,726Contributions to pension planDeferred income taxes 1,608 4,166 2,633Other 250 1,369 1,275Changes in operating assets and liabilities:
Accounts receivable 10,961Inventories 14,979Accounts payable 3,637 655Commissions payable 1,166 2,243Other 1,505 1,934
Net cash provided by operating activities 21,132 28,643 49,728
Cash flows from investing activities:Capital additions - netRedemptions (purchases) of short-term investments 958Proceeds from sale of product line – – 1,420Payment for acquisition – –
Net cash used for investing activities
Cash flows from financing activities:Cash dividendsProceeds from bank borrowings – 35,000 24,806Payments to bank for borrowingsTreasury stock purchase – –Purchase of noncontrolling interest – –
Net cash (used for) provided by financing activities 1,731 8,233
Effect of exchange rate changes on cash 130 800Net (decrease) increase in cash and cash equivalents 20,610
Cash and cash equivalents:Beginning of year 32,229 44,403 23,793
End of year $20,142 $32,229 $44,403
(4,423)(21,744) (1,223)
(10,618)
(6,906)(898)
(572)
(12,087)
(15,000)
(11,175)
(10,217)
(7,430)
(22,430)
(7,024)
(25,000)(638)(607)
(12,174)
(42,678)(33,856)
(512)
(6,767)
(9,806)
(38,151)
(38,071)(8,310)(1,500)
(7,200) (6,200)(7,200)
(337)
20
Note A – Summary of Significant Accounting Policies
Consolidation
The consolidated financial statements include the accounts of the Company and its wholly-owned subsidiaries. All significant intercompany transactions and balances have been eliminated. Earnings per share are calculated based on the weighted-average number of common shares outstanding.
Common Stock Split
On April 28, 2011, the Company declared a five-for-four split of its common shares in the form of a distribution of one additional common share for each four common shares previously issued. The distribution was made on June 10, 2011. Accordingly, all share amounts and per share data throughout this Annual Report on Form 10-K have been adjusted retroactively to reflect the stock split.
Cash Equivalents and Short-Term Investments
The Company considers highly liquid instruments with maturities of 90 days or less to be cash equivalents. The Company periodically makes short-term investments for which cost approximates fair value. Short-term investments at December 31, 2011 and 2010 consist primarily of certificates of deposit.
Accounts Receivable and Allowance for Doubtful Accounts
Accounts receivable are stated at the historical carrying amount net of allowance for doubtful accounts. The Company maintains an allowance for doubtful accounts for estimated losses from the failure of its customers to make required payments for products delivered. The Company estimates this allowance based on knowledge of the financial condition of customers, review of historical receivables and reserve trends and other relevant information.
Inventories
Inventories are stated at the lower of cost or market. The costs for approximately 82% of inventories at December 31, 2011 and at December 31, 2010 are determined using the last-in, first-out (LIFO) method, with the remainder determined using the first-in, first-out method. Cost components include materials, inbound freight costs, labor and allocations of fixed and variable overheads on an absorption costing basis.
Long-Lived Assets
Property, plant and equipment are stated on the basis of cost. Repairs and maintenance costs are expensed as incurred. Depreciation for property, plant and equipment and amortization for intangible assets subject thereto are computed principally by the straight-line method over the estimated useful lives of the assets and are included in cost of products sold and selling, general and administrative expenses based on the use of the assets.
Depreciation of property, plant and equipment is determined based on the following lives:
Buildings 20-50 years Machinery and equipment 5-15 years Software 3-5 years
Amortization of intangible assets is determined based on the following lives:
Technology and drawings 15-20 years Customer relationships 9-10 years Other intangibles 2-18 years
Long-lived assets, except goodwill and indefinite life intangible assets, are reviewed for impairment whenever events or changes in circumstances indicate the carrying amount may not be recovered through future net cash flows generated by the assets. Impairment losses are recorded when the undiscounted cash flows estimated to be generated by those assets are less than the assets’ carrying amounts.
Goodwill and Indefinite Life Intangible Assets
Goodwill and indefinite life intangible assets recognized in connection with business acquisitions are not amortized to expense. Indefinite life intangible assets primarily consist of trademarks and trade names. Goodwill and indefinite life intangible assets are tested annually for impairment as of October 1, or whenever events or changes in circumstances indicate there may be a possible permanent loss of value in accordance with ASC 350, Intangibles – Goodwill and Other.
Goodwill is tested for impairment at the reporting unit level and is based on the net assets for each reporting unit, including goodwill and intangible assets. In September 2011, the FASB issued ASU 2011-08 which amends the rules for testing goodwill for impairment. Under the new rules, an entity has the option to first assess qualitative factors to determine whether the existence of events or circumstances leads to a determination that
Notes to Consolidated Financial Statements(Amounts in tables in thousands of dollars)
The Gorman-Rupp Company Annual Report 2011
21
it is more likely than not that the fair value of a reporting unit is less than its carrying amount. If, after assessing the totality of events or circumstances, an entity determines it is not more likely than not that the fair value of a reporting unit is less than its carrying amount, then performing the two-step impairment test is unnecessary. The Company early adopted ASU 2011-08 for its October 1, 2011 annual goodwill impairment test.
In assessing the qualitative factors to determine whether it is more likely than not that the fair value of a reporting unit is less than its carrying amount, we identify and assess relevant drivers of fair value and events and circumstances that may impact the fair value and the carrying amount of the reporting unit. The identification of relevant events and circumstances and how these may impact a reporting unit’s fair value or carrying amount involve significant judgment and assumptions. The judgment and assumptions include the identification of macroeconomic conditions, industry and market considerations, cost factors, overall financial performance, Company specific events and share price trends and making the assessment on whether each relevant factor will impact the impairment test positively or negatively and the magnitude of any such impact.
If our qualitative assessment concludes that it is more likely than not that impairment exists then a quantitative assessment is required. In a quantitative assessment, a discounted cash flow model is used to estimate the fair value of each reporting unit, which considers forecasted cash flows discounted at an estimated weighted-average cost of capital. The forecasted cash flows are based on the Company’s long-term operating plan and the weighted-average cost of capital is an estimate of the overall after-tax rate of return. Other valuation techniques including comparative market multiples are used when appropriate. Discount rate assumptions are based on an assessment of the risk inherent in the future cash flows of the respective reporting units.
The Company completed its annual goodwill impairment test for each year presented and confirmed no reporting unit was at risk of failing the impairment test for any periods presented herein.
Revenue Recognition
Substantially all of the Company’s revenues from product sales are recognized when all of the following criteria are met: persuasive evidence of a sale arrangement exists,
the price is fixed or determinable, product delivery has occurred or services have been rendered, there are no further obligations to customers, and collectability is probable. Product delivery occurs when the risks and rewards of ownership and title pass, which usually occurs upon shipment to the customer.
Concentration of Credit Risk
The Company generally does not require collateral from its customers and has a good collection history. There were no sales to a single customer that exceeded 10% of total net sales for the years ended December 31, 2011, 2010 or 2009.
Shipping and Handling Costs
The Company classifies all amounts billed to customers for shipping and handling as revenue and reflects shipping and handling costs in cost of products sold.
Advertising
The Company expenses all advertising costs as incurred, which for the years ended December 31, 2011, 2010 and 2009 totaled $3.4 million, $3.2 million, and $2.7 million, respectively.
Product Warranties
A liability is established for estimated future warranty and service claims based on historical claims experience and specific product failures. The Company expenses warranty costs directly to cost of products sold. Changes in the Company’s product warranty liability are:
Foreign Currency Translation
Assets and liabilities of the Company’s operations outside the United States which are accounted for in a functional currency other than U.S. dollars are translated into U.S. dollars using year-end exchange rates. Revenues and expenses are translated at weighted-average exchange rates effective during the year. Foreign currency translation gains and losses are included as a component of accumulated other comprehensive loss within shareholders’ equity.
2011 2010 2009
Balance at beginning of year $1,543 $1,863 $2,048Provision 1,081 1,217 1,915Claims
Balance at end of year $1,228 $1,543 $1,863
(2,100)(1,537)(1,396)
22
Gains and losses resulting from foreign currency transactions, the amounts of which are not material, are included in net income.
Fair Value
The book value of cash and cash equivalents, accounts receivable, accounts payable and short-term debt approximates their fair value.
Use of Estimates
The preparation of financial statements in conformity with generally accepted accounting principles requires management to make estimates and assumptions that affect the amounts reported in the consolidated financial statements and accompanying notes. Actual results could differ from those estimates.
Reclassification
Certain amounts for 2009 and 2010 have been reclassified to conform to the 2011 presentation.
New Accounting Pronouncements Not Yet Adopted
In June 2011, the FASB issued ASU 2011-05, Comprehensive Income (Topic 220): Presentation of Comprehensive Income. ASU 2011-05 amends existing guidance by allowing only two options for presenting the components of net income and other comprehensive income: (1) in a single continuous financial statement, statement of comprehensive income or (2) in two separate but consecutive financial statements, consisting of an income statement followed by a separate statement of other comprehensive income. Also, items that are reclassified from other comprehensive income to net income must be presented on the face of the financial statements. ASU 2011-05 requires retrospective application, and is effective for fiscal years, and interim periods within those years, beginning after December 15, 2011, with early adoption permitted. In December 2011, the FASB issued ASU 2011-12, deferring its requirement that companies present reclassification adjustments for each component of accumulated other comprehensive income in both net income and other comprehensive income on the face of the financial statements. Entities continue to be required to present amounts reclassified out of accumulated other comprehensive income on the face of the financial statements or to disclose those amounts in the notes to the financial statements. The requirement to present reclassification adjustments in
interim periods was also deferred. However, entities are required to report a total for comprehensive income in condensed financial statements of interim periods in a single continuous statement or in two consecutive statements. The FASB is reconsidering the presentation requirements for reclassification adjustments. The Company plans to adopt ASU 2011-05 in the first quarter of fiscal 2012. The Company believes the adoption of ASU 2011-05 will change the order in which certain financial statements are presented and provide additional detail on those financial statements when applicable, but will not have any other impact on its consolidated financial statements.
Note B – Allowance for Doubtful Accounts
The allowance for doubtful accounts was $433,000 and $371,000 at December 31, 2011 and 2010, respectively.
Note C – Inventories
Inventories are stated at the lower of cost or market. Replacement cost approximates current cost and the excess over LIFO cost is approximately $50.7 million and $47.1 million at December 31, 2011 and 2010, respectively. During 2010, some inventory quantities were reduced resulting in liquidation of certain LIFO quantities carried at lower costs from earlier years versus 2010 costs and the related effect increased net income by $829,000 or $0.04 per share. Allowances for excess and obsolete inventory totaled $3.0 million and $2.7 million at December 31, 2011 and 2010, respectively.
Note D – Financing Arrangements
On October 1, 2010, the Company borrowed $35.0 million under an unsecured bank loan agreement originally maturing in November 2011, and extended to November 2012, to help finance the acquisition of National Pump Company. The loan bears interest at LIBOR plus .75%, adjustable and payable monthly and matures in November 2012 after being extended. At December 31, 2011 and 2010, $10.0 million and $25.0 million were outstanding against this agreement, respectively.
The Company may borrow up to $20.0 million with interest at LIBOR plus .75% or at alternative rates as selected by the Company under an unsecured bank line of credit which matures in November 2012. At December 31, 2011 and 2010, $20.0 million and $18.9 million, respectively, were available for borrowing after deducting
Notes to Consolidated Financial Statements(Amounts in tables in thousands of dollars)
The Gorman-Rupp Company Annual Report 2011
23
$1.1 million in outstanding letters of credit in 2010.
The Company also has a $10.0 million unsecured bank line of credit with interest at LIBOR plus .75% payable monthly which matures in May 2012. At December 31, 2011 and 2010, $5.0 million and $6.6 million, respectively, was available for borrowing after deducting $5.0 million and $3.4 million in outstanding letters of credit, respectively.
The financing arrangements described previously contain restrictive covenants, including limits on additional borrowings and maintenance of certain operating and financial ratios. At December 31, 2011, the Company was in compliance with all requirements.
Interest expense, which approximates interest paid, was $179,000, $175,000 and $170,000 in 2011, 2010 and 2009, respectively.
The Company has operating leases for certain offices, manufacturing facilities, land, office equipment and automobiles. Rental expenses relating to operating leases were $866,000, $852,000 and $741,000 in 2011, 2010 and 2009, respectively.
The future minimum lease payments due under these operating leases as of December 31, 2011 are:
Note E – Accumulated Other Comprehensive Loss
The components of accumulated other comprehensive loss as reported in the Consolidated Balance Sheets are:
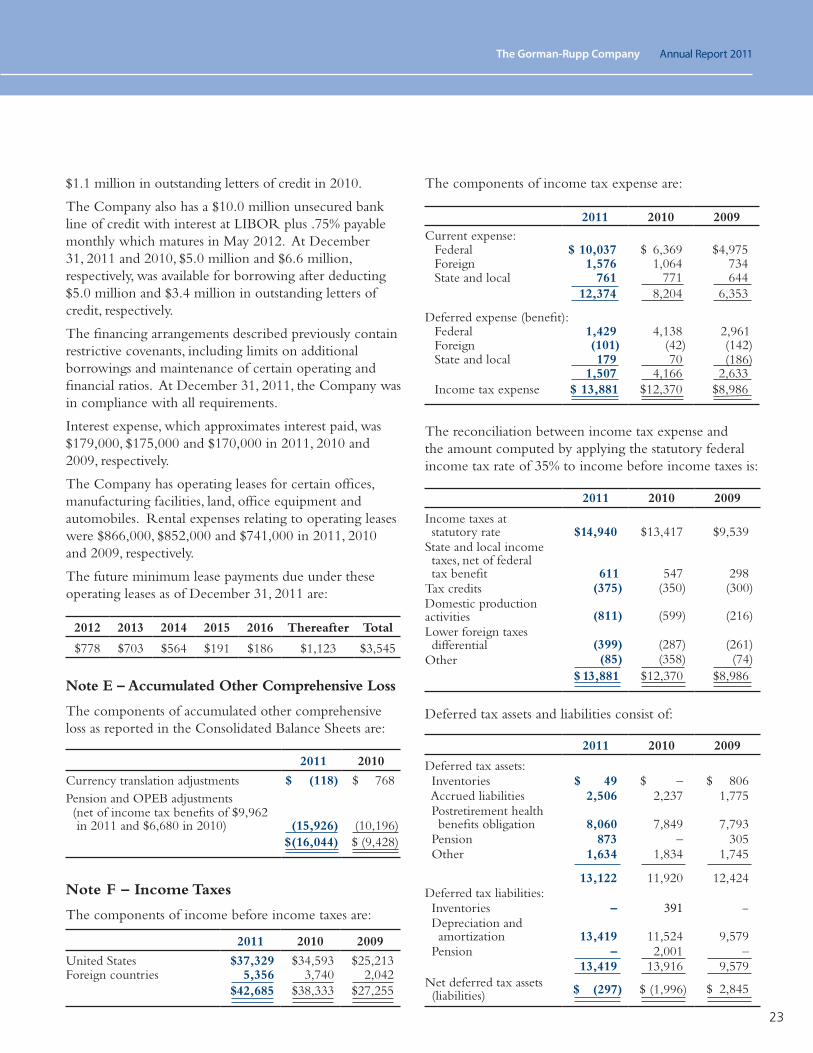
Note F – Income Taxes
The components of income before income taxes are:
The components of income tax expense are:
The reconciliation between income tax expense and the amount computed by applying the statutory federal income tax rate of 35% to income before income taxes is:
Deferred tax assets and liabilities consist of:
2012 2013 2014 2015 2016 Thereafter Total
$778 $703 $564 $191 $186 $1,123 $3,545
2011 2010 2009
United States $37,329 $34,593 $25,213Foreign countries 5,356 3,740 2,042
$42,685 $38,333 $27,255
2011 2010
Currency translation adjustments $ 768Pension and OPEB adjustments( net of income tax benefits of $9,962in 2011 and $6,680 in 2010) (15,926) (10,196)
$ (16,044) $ (9,428)
$ (118)
2011 2010 2009
Current expense:Federal $ 10,037 $ 6,369 $4,975Foreign 1,576 1,064 734State and local 761 771 644
12,374 8,204 6,353
Deferred expense (benefit):Federal 1,429 4,138 2,961ForeignState and local 179 70
1,507 4,166 2,633Income tax expense $ 13,881 $12,370 $8,986
(101) (42)(186)(142)
2011 2010 2009
Income taxes at statutory rate
$14,940
$13,417
$9,539
State and local income taxes, net of federal tax benefit
611
547
298Tax creditsDomestic production activitiesLower foreign taxes differentialOther
$ 13,881 $12,370 $8,986
(375)
(811)
(399)(85)
(300)
(216)
(261)
(350)
(599)
(287)(358) (74)
2011 2010 2009
Deferred tax assets: Inventories $ 49 $ – $ 806 Accrued liabilities 2,506 2,237 1,775 Postretirement health benefits obligation
8,060 7,849 7,793
Pension 873 – 305 Other 1,634 1,834 1,745
13,122 11,920 12,424Deferred tax liabilities: Inventories – 391 – Depreciation and amortization
13,419 11,524 9,579
Pension – 2,001 –13,419 13,916 9,579
Net deferred tax assets (liabilities) $ 2,845$ (297) $ (1,996)
24
The Company made income tax payments of $10.3 million, $8.1 million and $6.1 million in 2011, 2010 and 2009, respectively.
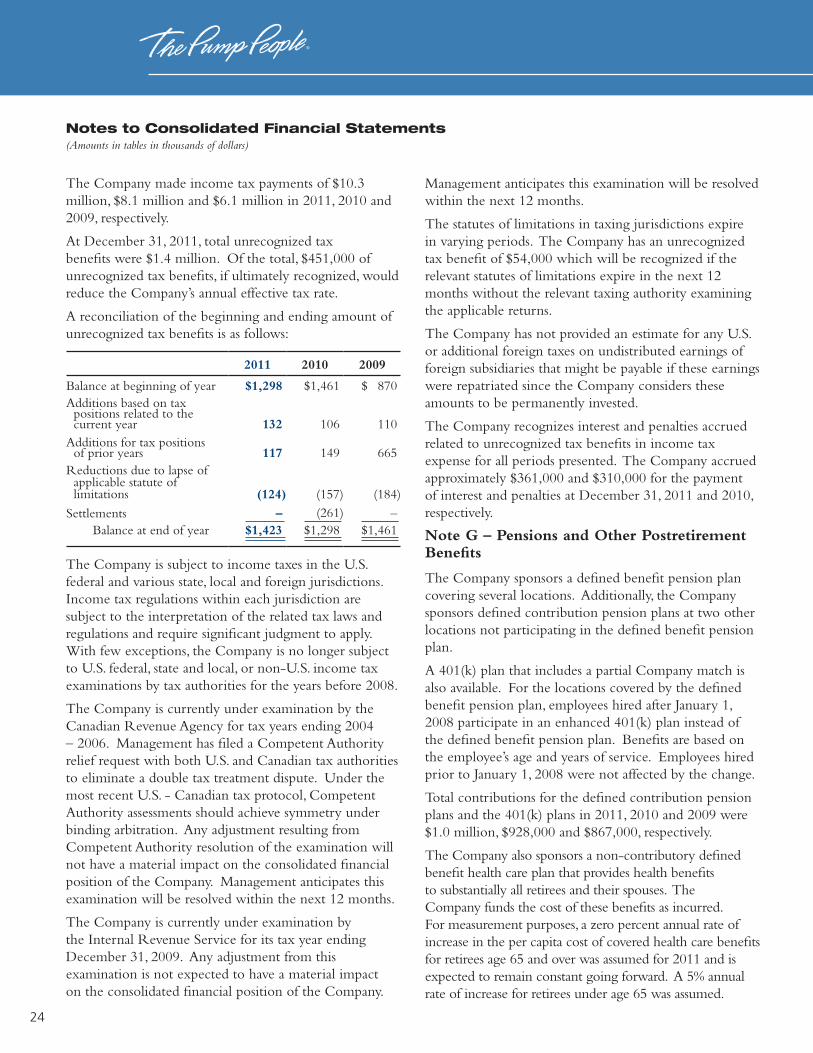
At December 31, 2011, total unrecognized tax benefits were $1.4 million. Of the total, $451,000 of unrecognized tax benefits, if ultimately recognized, would reduce the Company’s annual effective tax rate.
A reconciliation of the beginning and ending amount of unrecognized tax benefits is as follows:
The Company is subject to income taxes in the U.S. federal and various state, local and foreign jurisdictions. Income tax regulations within each jurisdiction are subject to the interpretation of the related tax laws and regulations and require significant judgment to apply. With few exceptions, the Company is no longer subject to U.S. federal, state and local, or non-U.S. income tax examinations by tax authorities for the years before 2008.
The Company is currently under examination by the Canadian Revenue Agency for tax years ending 2004 – 2006. Management has filed a Competent Authority relief request with both U.S. and Canadian tax authorities to eliminate a double tax treatment dispute. Under the most recent U.S. - Canadian tax protocol, Competent Authority assessments should achieve symmetry under binding arbitration. Any adjustment resulting from Competent Authority resolution of the examination will not have a material impact on the consolidated financial position of the Company. Management anticipates this examination will be resolved within the next 12 months.
The Company is currently under examination by the Internal Revenue Service for its tax year ending December 31, 2009. Any adjustment from this examination is not expected to have a material impact on the consolidated financial position of the Company.
Management anticipates this examination will be resolved within the next 12 months.
The statutes of limitations in taxing jurisdictions expire in varying periods. The Company has an unrecognized tax benefit of $54,000 which will be recognized if the relevant statutes of limitations expire in the next 12 months without the relevant taxing authority examining the applicable returns.
The Company has not provided an estimate for any U.S. or additional foreign taxes on undistributed earnings of foreign subsidiaries that might be payable if these earnings were repatriated since the Company considers these amounts to be permanently invested.
The Company recognizes interest and penalties accrued related to unrecognized tax benefits in income tax expense for all periods presented. The Company accrued approximately $361,000 and $310,000 for the payment of interest and penalties at December 31, 2011 and 2010, respectively.
Note G – Pensions and Other Postretirement Benefits
The Company sponsors a defined benefit pension plan covering several locations. Additionally, the Company sponsors defined contribution pension plans at two other locations not participating in the defined benefit pension plan.
A 401(k) plan that includes a partial Company match is also available. For the locations covered by the defined benefit pension plan, employees hired after January 1, 2008 participate in an enhanced 401(k) plan instead of the defined benefit pension plan. Benefits are based on the employee’s age and years of service. Employees hired prior to January 1, 2008 were not affected by the change.
Total contributions for the defined contribution pension plans and the 401(k) plans in 2011, 2010 and 2009 were $1.0 million, $928,000 and $867,000, respectively.
The Company also sponsors a non-contributory defined benefit health care plan that provides health benefits to substantially all retirees and their spouses. The Company funds the cost of these benefits as incurred. For measurement purposes, a zero percent annual rate of increase in the per capita cost of covered health care benefits for retirees age 65 and over was assumed for 2011 and is expected to remain constant going forward. A 5% annual rate of increase for retirees under age 65 was assumed.
Notes to Consolidated Financial Statements(Amounts in tables in thousands of dollars)
2011 2010 2009
Balance at beginning of year $1,298 $1,461 $ 870Additions based on tax positions related to the current year 132 106 110
Additions for tax positions of prior years 117 149 665Reductions due to lapse of applicable statute of
limitations
Settlements – – Balance at end of year $1,423 $1,298 $1,461
(157) (184)(124)
(261)
The Gorman-Rupp Company Annual Report 2011
25
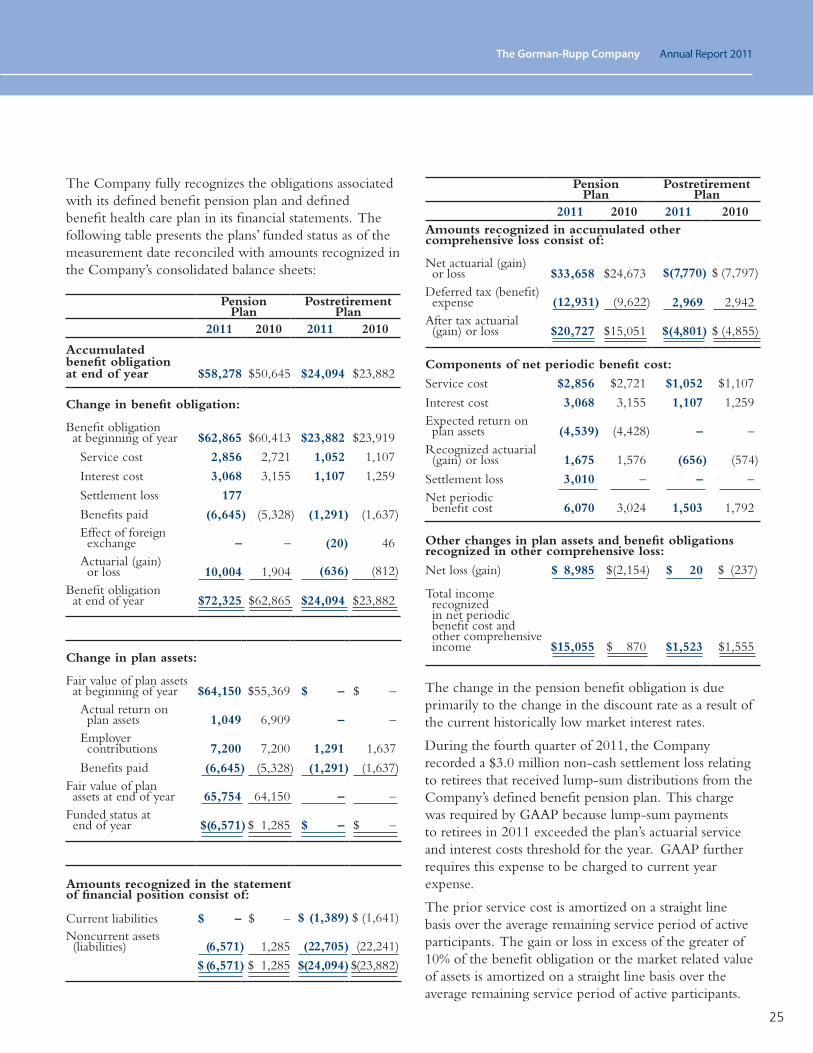
The Company fully recognizes the obligations associated with its defined benefit pension plan and defined benefit health care plan in its financial statements. The following table presents the plans’ funded status as of the measurement date reconciled with amounts recognized in the Company’s consolidated balance sheets:
The change in the pension benefit obligation is due primarily to the change in the discount rate as a result of the current historically low market interest rates.
During the fourth quarter of 2011, the Company recorded a $3.0 million non-cash settlement loss relating to retirees that received lump-sum distributions from the Company’s defined benefit pension plan. This charge was required by GAAP because lump-sum payments to retirees in 2011 exceeded the plan’s actuarial service and interest costs threshold for the year. GAAP further requires this expense to be charged to current year expense.
The prior service cost is amortized on a straight line basis over the average remaining service period of active participants. The gain or loss in excess of the greater of 10% of the benefit obligation or the market related value of assets is amortized on a straight line basis over the average remaining service period of active participants.
Pension Plan
Postretirement Plan
2011 2010 2011 2010Amounts recognized in accumulated other comprehensive loss consist of:
Net actuarial (gain) or loss $33,658 $24,673Deferred tax (benefit) expense 2,969 2,942After tax actuarial (gain) or loss $20,727 $15,051 $ (4,855)$(4,801)
$(7,770) $ (7,797)
(9,622)(12,931)
Change in plan assets:
Fair value of plan assets at beginning of year $64,150 $55,369 $ – $ –
Actual return on plan assets 1,049 6,909 – –Employer contributions 7,200 7,200 1,291 1,637
Benefits paidFair value of plan assets at end of year 65,754 64,150 – –Funded status at end of year $ 1,285 $ – $ –
Amounts recognized in the statement of financial position consist of:
Current liabilities $ – $ –Noncurrent assets (liabilities) 1,285
$ 1,285
(5,328)
$(6,571)
(1,637)(1,291)(6,645)
$ (1,641)
$ (6,571)
(6,571)
$ (1,389)
$(23,882)
(22,241)
$(24,094)
(22,705)
Pension Plan
Postretirement Plan
2011 2010 2011 2010
Accumulated benefit obligation at end of year $58,278 $50,645 $24,094 $23,882
Change in benefit obligation:
Benefit obligation at beginning of year $62,865 $60,413 $23,882 $23,919
Service cost 2,856 2,721 1,052 1,107
Interest cost 3,068 3,155 1,107 1,259
Settlement loss 177
Benefits paidEffect of foreign exchange – – 46Actuarial (gain) or loss 10,004 1,904
Benefit obligation at end of year $72,325 $62,865 $24,094 $23,882
(5,328)
(636) (812)
(6,645) (1,637)(1,291)
(20)
Components of net periodic benefit cost:
Service cost $2,856 $2,721 $1,052 $1,107
Interest cost 3,068 3,155 1,107 1,259Expected return on plan assets – –Recognized actuarial (gain) or loss 1,675 1,576
Settlement loss 3,010 – – –Net periodic benefit cost 6,070 3,024 1,503 1,792
Other changes in plan assets and benefit obligations recognized in other comprehensive loss:
Net loss (gain) $ 8,985 $ 20
Total income recognized in net periodic benefit cost and other comprehensive income $15,055 $ 870 $1,523 $1,555
(4,428)(4,539)
$(2,154) $ (237)
(656) (574)

26
The investment return of the Company’s Pension Plan asset allocation is measured against those of a target portfolio consisting of 60% equities, 35% fixed income securities, and 5% cash equivalents of domestic corporations.
Equities (including all convertible securities) may comprise up to 70% of the Plan’s market value, with a minimum requirement of 20%. Fixed income/floating rate securities (including preferred stocks and cash equivalents) should not exceed 80% of the Plan’s market value and may represent as little as 30%. Cash equivalents (including all senior debt securities with less than one year to maturity) may comprise up to 40% of the Plan’s market value. Cash may constitute zero assets in the Account at the manager’s discretion. Non-U.S. corporate securities may comprise up to 35% of the Account.
Financial instruments included in pension plan assets are categorized into a fair value hierarchy of three levels, based on the degree of subjectivity inherent in the valuation methodology. Level 1 assets are based on unadjusted quoted prices in active markets that are accessible to the reporting entity at the measurement date for identical assets and liabilities. Level 2 assets are valued at inputs other than quoted prices in active markets for identical assets and liabilities that are observable either directly or indirectly for substantially the full term of the assets or liabilities. Level 3 assets are valued based on unobservable inputs for the asset or liability (i.e., supported by little or no market activity). These inputs include management’s own assessments about the assumptions that market participants would use in pricing assets or liabilities (including assumptions about risk).
The level in the fair value hierarchy within which the fair value measurement is classified is determined based on the lowest level input that is significant to the fair value measure in its entirety.
All of the Plan’s assets are in level 1 within the fair value hierarchy, and the following table sets forth by asset class the Pension Plan’s assets.
Contributions
The Company expects to contribute approximately $6.0 million to its pension plan in 2012.
Expected future benefit payments
The following benefit payments, which reflect expected future service as appropriate, are expected to be paid as follows:
A one percentage point increase in the assumed health care trend would increase postretirement expense by approximately $212,000, changing the benefit obligation by approximately $1.8 million; while a one percentage point decrease in the assumed health care trend would decrease postretirement expense by approximately $199,000, changing the benefit obligation by approximately $1.7 million.
A one percentage point change in the assumed rate of return on Pension Plan assets is estimated to have an approximate $648,000 effect on the pension expense. Likewise, a one percentage point change in the discount rate is estimated to have approximately a $1.3 million effect on pension expense.
Notes to Consolidated Financial Statements(Amounts in tables in thousands of dollars)
2012 2013 2014 2015 2016 Thereafter
Pension $5,008 $5,081 $5,628 $5,636 $5,644 $32,021Postretirement 1,414 1,411 1,447 1,651 1,700 10,292
Pension
2011 % 2010 %
Asset allocation by category:
U.S. equity $12,439 19 $22,008 34Non-U.S. equity 6,493 10 9,668 15Balanced 7,961 12 10,706 17U.S. fixed income 38,837 59 21,753 34Cash and cash equivalents 24 – 15 –Total fair value of Plan assets $65,754 100 $64,150 100
Pension Benefits
Postretirement Benefits
2011 2010 2011 2010
Weighted-average assumptions used to determine benefit obligations at December 31:
Discount rate 4.00% 5.00% 3.76% 4.85%Rate of compensation increase 3.50% 3.50% – –
Weighted-average assumptions used to determine net periodic benefit cost for years ended December 31:
Discount rate 5.00% 5.60% 4.85% 5.50%Expected long-term rate of return on plan assets 7.00% 8.00% – –
Rate of compensation increase 3.50% 3.50% – –

The Gorman-Rupp Company Annual Report 2011
27
Note H – Goodwill and Other Intangible Assets
The major components of goodwill and other intangible assets are:
Amortization of intangible assets in 2011, 2010 and 2009 was $955,000, $421,000 and $371,000, respectively. Amortization of these intangible assets for 2012 through 2016 is expected to approximate $950,000 per year.
Note I – Business Segment Information
The Company operates in one business segment: the design, manufacture and sale of pumps and related equipment (pump and motor controls) for use in water, wastewater, construction, industrial, petroleum, original equipment, agriculture, fire protection, heating, ventilation and air conditioning (HVAC), military and other liquid-handling applications. The Company’s pumps are marketed in the United States and worldwide through a network of more than 1,000 distributors, through manufacturers’ representatives (for sales to many original equipment manufacturers), through third-party distributor catalogs, and by direct sales. International sales are made primarily through foreign distributors and representatives. The Company sells to more than 100 countries around the world.
The components of customer sales, determined based on the location of customers are:
Note J – Acquisition
On October 1, 2010, the Company acquired substantially all of the assets and certain liabilities of privately-held National Pump Company, LLC for a purchase price of approximately $36.6 million, net of cash acquired. The purchase price consisted of cash of $33.9 million and issuance of 100,000 common shares of stock with a fair value of $2.7 million. National Pump Company, founded in 1969, is headquartered in Glendale, Arizona. Its principal products are vertical turbine line shaft and submersible pumps as well as centrifugal pumps, high-pressure booster pumps and packaged pump station systems. National Pump Company’s specialty expertise is in designing, manufacturing and distributing deep-well vertical turbine pumps for industrial process water supply, agricultural irrigation supply and municipal water supply. Additionally, it provides specialty pumps for petroleum, mining and OEM applications. National Pump Company operates as a subsidiary of the Company. Pro-forma financial information is not considered material and not presented. Goodwill is primarily attributable to market synergies and is substantially all deductible for tax purposes. The final purchase price allocation of the net assets acquired, in millions of dollars, is presented below:
2011 2010Historical
CostAccumulated Amortization
Historical Cost
Accumulated Amortization
Amortized intangible assets:
Customer relationships $ 5,274
$1,011 $ 5,274
$ 457
Technology & drawings 4,600 1,118 4,600 864
Other intangibles 1,557 1,413 1,563 1,266
Total amortized intangible assets 11,431 3,542 11,437 2,587
Goodwill 14,672 – 14,672 –Trade names & trademarks 2,920 – 2,920 –
Total $29,023 $3,542 $29,029 $2,587
2011 % 2010 % 2009 %
United States $241,405 67 $180,705 61 $169,844 64Foreign countries 118,085 33 116,103 39 96,398 36
Total $359,490 100 $296,808 100 $266,242 100
Current assets (net of $3.0 million current liabilities) $10.9Property, plant and equipment 6.1Goodwill 9.9Intangibles and other assets 9.7
Net assets acquired $36.6
28
Executive Overview and OutlookThe Gorman-Rupp Company is a leading designer, manufacturer and international marketer of pumps and related equipment (pump and motor controls) for use in diverse water, wastewater, construction, industrial, petroleum, original equipment, agriculture, fire protection, heating, ventilating and air conditioning (HVAC), military and other liquid-handling applications. The Company attributes its success to long-term product quality, application and performance combined with delivery and service, and continually develops initiatives to improve performance in these key areas.
Gorman-Rupp actively pursues growth opportunities through organic growth, international business opportunities and acquisitions. We continually invest in training for our employees, new product development and modern manufacturing equipment and technology designed to increase production efficiency and capacity and drive growth by delivering innovative solutions to our customers. The Company also is currently focused on incorporating significantly changing engine designs related to new emission standards mandated by the U.S. Environmental Protection Agency (“EPA”) into our applicable products. These new governmental regulations have added, and will continue to add, additional costs to engine-driven pump products.
The following discussion of Results of Operations include certain non-GAAP financial measures. The adjusted earnings per share amounts exclude a pension settlement charge. Management utilizes these adjusted financial measures to assess comparative operations against those of prior periods without the distortion of this factor. The Company believes that these non-GAAP financial measures will be useful to investors as well as to assess the continuing strength of the Company’s underlying operations.
Net sales during 2011 increased 21.1% to a record $359.5 million compared to $296.8 million during 2010. International sales increased 1.7% and were 33.0% of total sales in 2011. Sales to most markets increased in 2011 with increases primarily in the industrial, construction, agricultural and municipal markets, while original equipment manufacturer (OEM) and international fire protection sales declined due to economic weakness which continues to affect these markets. Net income increased 10.8% to a record $28.8 million in 2011 compared to the previous record of $26.0 million in 2010. Earnings per share were $1.37 and $1.24 for the respective periods, a 10.5% increase.
As noted in the Company’s third quarter 2011 Form 10-Q, a GAAP-required $3.0 million pension settlement charge was recorded in October and decreased annual and fourth quarter earnings by $0.10 per share. Excluding this non-cash charge, 2011 earnings per share
grew 18.5% to $1.47 per share. The other major annual expense difference was $0.11 per share of higher LIFO expense in 2011 when compared to the post-recessionary lower LIFO costs in 2010.
Record sales during 2011 were exceeded by record incoming orders of $408.9 million, contributing to a backlog of $155.5 million at December 31, 2011, 44.8% higher than the backlog of $107.4 million at December 31, 2010. Due to record fourth quarter shipments, the backlog decreased 1.5% during the fourth quarter 2011 compared to the record of $157.8 million at September 30, 2011.
Working capital increased 25.7% from December 31, 2010 to a record $105.0 million at December 31, 2011 primarily due to investments in inventory to meet increased customer demand. The Company’s continuing earnings growth and cash generation enabled repayment during the fourth quarter 2011 of an additional $5.0 million of borrowings used to finance the acquisition of National Pump Company for a total of $15.0 million of repayments during the year.
We believe that the Company is well positioned to grow organically at generally comparable operating margins over the long term by expanding our customer base both domestically and globally and through new product offerings. The increasing need for water and wastewater infrastructure rehabilitation within the United States, and similar needs internationally, along with increasing demand for pumps and pump related equipment for industrial and agricultural applications, are expected to provide excellent opportunities for Gorman-Rupp in the future.
Results of Operations – 2011 Compared to 2010: The Company attained record net sales of $359.5 million in 2011 compared to net sales of $296.8 million in 2010, an increase of $62.7 million or 21.1%. The increase resulted from improved economic and business conditions in 2011 compared to 2010 with increases in net sales in most of the markets the Company serves, as well as the inclusion of National Pump Company acquired October 1, 2010.
Sales in the industrial and construction markets increased $18.6 million and $17.8 million from 2010, respectively, primarily due to volume growth related to increases in oil and gas drilling and the expansion and replacement of heavy equipment user fleets. Sales into the agriculture and petroleum markets increased $15.9 million and $6.2 million, respectively, primarily due to the acquisition of National Pump Company. Municipal market sales increased $11.3 million from 2010 principally due to higher demand for pumps supplied for domestic flood control projects. Partially offsetting these increases were decreases in the OEM market of $3.3 million related to lower power generation demand and the fire protection
Management’s Discussion and Analysis

The Gorman-Rupp Company Annual Report 2011
29
market of $9.3 million primarily due to a decline in international sales as a result of an unstable global economy.
International sales amounted to $118.1 million in 2011 compared to $116.1 million in 2010, an increase of $2.0 million or 1.7%. International sales represented 33% and 39% of total sales for the Company in 2011 and 2010, respectively. The percentage decrease is primarily due to the increase in the domestic sales ratio as a result of the acquisition of National Pump Company.
The backlog of orders at December 31, 2011 was a year-end record $155.5 million compared to $107.4 million at December 31, 2010, an increase of $48.1 million or 44.8%. The backlog increase was primarily due to record incoming orders during the year of $408.9 million with notable increases in all of the markets the Company serves, except for fire protection which was flat compared to 2010. Approximately 98% of the Company’s backlog of unfilled orders at December 31, 2011 is scheduled to be shipped during 2012, with the remainder during 2013.
Cost of products sold in 2011 was $271.7 million compared to $220.5 million in 2010, an increase of $51.2 million or 23.2%. Gross profit was $87.8 million in 2011 compared to $76.3 million in 2010, an increase of 15.1%, resulting in gross margins of 24.4% and 25.7% in 2011 and 2010, respectively. The increase in gross profit primarily reflects higher sales volume and the acquisition of National Pump Company. The decline in gross margin results largely from $2.0 million of the total $3.0 million GAAP-required pension settlement charge discussed above recorded in cost of products sold. In addition, 2011 results include increased LIFO expense of $4.2 million principally due to a non-recurring benefit in 2010 from the partial liquidation of LIFO quantities and historically lower post-recessionary producer price indexes.
Selling, general and administrative expenses for 2011 were $44.8 million, or 12.5% of net sales, compared with $37.4 million, or 12.6% of net sales for 2010. The $7.5 million increase was primarily due to higher sales volume and the impact of the acquisition of National Pump Company. Also, selling, general and administrative expenses reflect $1.0 million of the total $3.0 million GAAP-required pension settlement charge discussed above.
Operating income in 2011 was unfavorably impacted by the GAAP-required $3.0 million pension settlement charge discussed above and a full year of additional amortization expense of $540,000 for intangible assets related to the acquisition of National Pump Company. In the future, the Company will not incur further expense associated with building demolition and property reclamation relating to the former Mansfield manufacturing and office facilities, which were $770,000 and $556,000 in 2011 and 2010, respectively, as these activities were completed during 2011.
The effective income tax rate was 32.5% in 2011 compared to 32.3% in 2010.
Net income for 2011 was a record $28.8 million compared to $26.0 million in 2010, an increase of $2.8 million or 10.8%. The GAAP-required pension settlement charge described above reduced net income by $2.0 million. As a percent of net sales, net income was 8.0% and 8.7% in 2011 and 2010, respectively.
Earnings per share were $1.37 in 2011 compared to $1.24 in 2010, an increase of $0.13 per share or 10.5%. The GAAP-required pension settlement charge described above reduced net income by $0.10 per share in 2011.
Results of Operations – 2010 Compared to 2009: The Company recorded net sales of $296.8 million in 2010 compared to net sales of $266.2 million in 2009, an increase of $30.6 million or 11.5%. The increase in net sales principally resulted from improved economic and business conditions in 2010 compared to the severe economic downturn of 2009, with increases in sales in most of the markets the Company served. The fourth quarter of 2010 also included accretive results of National Pump Company acquired October 1, 2010.
In 2010, sales of fire pumps increased $8.5 million from 2009 primarily due to increased growth in international construction activity in oil-producing countries. Other markets that experienced significant increases in 2010 were the municipal market of $7.6 million, the construction and rental market of $7.5 million and the industrial market of $7.2 million. The agriculture market increased $3.1 million due to our acquisition of National Pump Company, while custom pumps increased $2.9 million due to higher levels of water supply projects. Partially offsetting these increases was a decrease in the OEM market of $6.5 million related to slow power generation demand.
International sales amounted to $116.1 million in 2010 compared to $96.4 million in 2009, an increase of $19.7 million, representing a 20.4% increase from 2009 levels. International sales represented 39% and 36% of total sales for the Company in 2010 and 2009, respectively. In 2010, the Company continued to experience positive momentum in the international market due to its emphasis on geographical expansion over the prior several years.
The backlog of orders at December 31, 2010 was $107.4 million compared to $93.7 million at December 31, 2009, an increase of $13.7 million or 14.6%. The backlog increase was primarily due to increased orders in the construction, rental and custom pump markets along with the inclusion of National Pump Company’s backlog following its acquisition. Partially offsetting these increases were declines in the municipal and OEM markets. Substantially the entire backlog of orders shipped during 2011.

30
Management’s Discussion and Analysis
Cost of products sold in 2010 was $220.5 million compared to $204.5 million in 2009, an increase of $16.0 million or 7.8%. Gross profit was $76.3 million in 2010 compared to $61.8 million in 2009, an increase of 23.5%, resulting in gross margins of 25.7% and 23.2% in 2010 and 2009, respectively. The increase in gross profit primarily reflects higher sales volume. Also, 2010 benefited from $1.4 million income due to the partial liquidation of LIFO quantities and decreased pension expense of $1.2 million due to the rebound in equity markets. Manufacturing costs included increased depreciation expense of $1.3 million as a result of a full year’s depreciation on the new Mansfield manufacturing facility that was occupied in the fourth quarter of 2009.
Selling, general and administrative expenses for 2010 were $37.4 million, or 12.6% of net sales, compared with $35.4 million, or 13.3% of net sales for 2009. The $2.0 million increase was primarily due to higher sales volume and the impact of the acquisition of National Pump Company. Also, pension expense decreased $558,000 due to the rebound in equity markets.
Other income in 2010 was $362,000 compared to $1.2 million in 2009, a decrease of $838,000 or 69.8% primarily due to gain on the sale of a product line recognized during 2009.
Other expense was $988,000 and $347,000 in 2010 and 2009, respectively. The increase of $641,000 was primarily due to losses recognized on disposal of assets related to the former Mansfield Division facilities.
The effective income tax rate was 32.3% in 2010 compared to 33.0% in 2009.
Net income for 2010 was $26.0 million compared to $18.3 million in 2009, an increase of $7.7 million or 42.1%. As a percent of net sales, net income was 8.7% and 6.9% in 2010 and 2009, respectively.
Earnings per share were $1.24 in 2010 compared to $0.87 in 2009, an increase of $0.37 per share.
TrendsThe Company does not believe that it is exposed to material market risks as a result of its export sales or operations outside of the United States. Export sales are denominated predominately in U.S. dollars and made on open account or with letters of credit.
For more than 10 years, numerous business entities in the pump and fluid-handling industries, as well as a multitude of companies in many other industries, have been targeted in a series of lawsuits in several jurisdictions by various individuals seeking redress to claimed injury as a result of the entities’ alleged use of asbestos in their products. The Company and two of its subsidiaries remain drawn into mass-scale asbestos-
related litigation, typically as one of hundreds of co-defendants in a particular proceeding; the vast majority of these cases were against Patterson Pump Company. The allegations in the lawsuits involving the Company and/or its subsidiaries are vague, general and speculative, and most cases have not advanced beyond the early stage of discovery. Insurers of the Company have engaged legal counsel to represent the Company and its subsidiaries and to protect their interests. In certain situations, the plaintiffs have voluntarily dismissed the Company and/or its subsidiaries from some of the lawsuits after the plaintiffs have acknowledged that there is no basis for their claims. In other situations, the Company and/or its subsidiaries have been dismissed from some of the lawsuits as a result of court rulings in favor of motions to dismiss and/or motions for summary judgment. In fifty-five cases the Company and/or its subsidiaries have entered into nominal economic settlements recommended and paid for by its insurers, coupled with dismissal of the lawsuits. During the fourth quarter 2011, Patterson Pump Company entered into an agreement with plaintiffs’ counsel for the voluntary dismissal of more than 95% of the cases against it at no cost to Patterson Pump Company or its insurer.
Management does not currently believe that the small number of legal proceedings arising out of the ordinary course of business, or the industry-wide asbestos litigation, will materially impact the Company’s consolidated results of operations, liquidity or financial condition.
Liquidity and Sources of CapitalCash and cash equivalents and short-term investments totaled $21.2 million and there was $10.0 million in outstanding bank debt at December 31, 2011, which is expected to be repaid during 2012. In addition, the Company had $25.0 million available in bank lines of credit after deducting $5.0 million in outstanding letters of credit primarily related to customer orders. The Company was in compliance with its nominal restrictive covenants, including limits on additional borrowings and maintenance of certain operating and financial ratios at December 31, 2011.
Capital expenditures for 2012, consisting principally of machinery and equipment, are estimated to be in the range of $14 to $17 million and are expected to be financed through internally generated funds and existing lines of credit. During 2011, 2010 and 2009, the Company financed its capital improvements and working capital requirements principally through internally generated funds and proceeds from a bank loan agreement.
Working capital increased 25.7% from December 31, 2010 to a record $105.0 million at December 31, 2011
The Gorman-Rupp Company Annual Report 2011
31
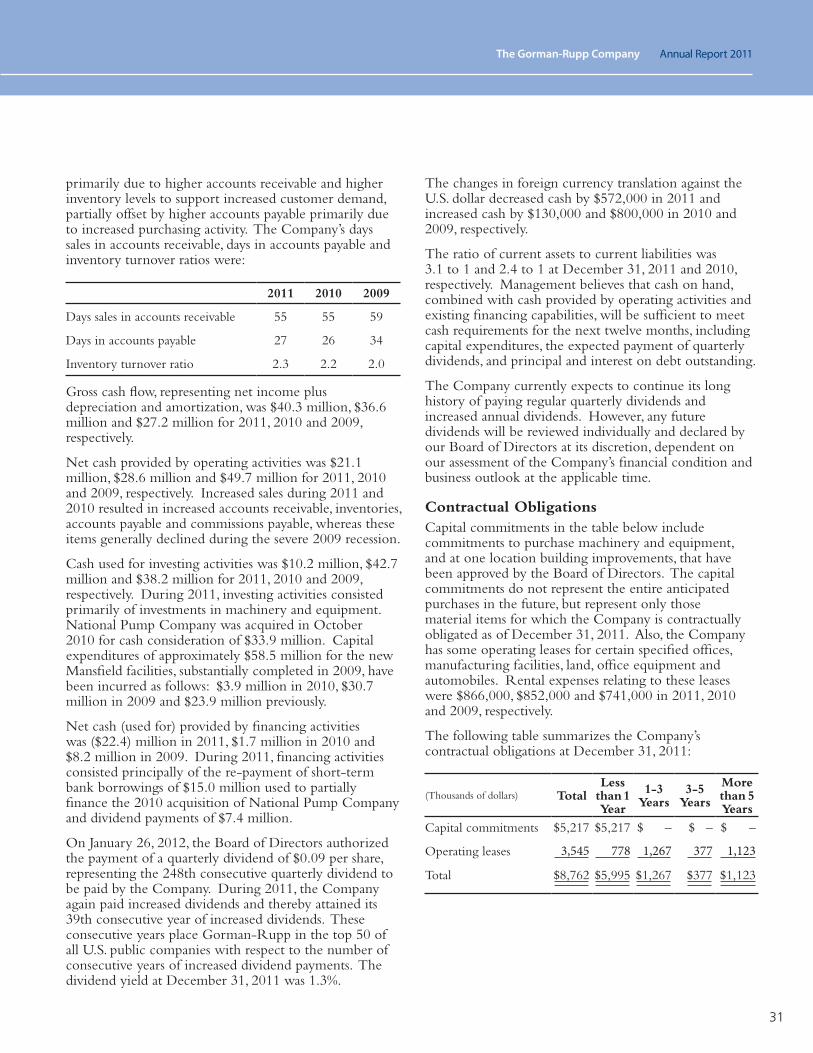
primarily due to higher accounts receivable and higher inventory levels to support increased customer demand, partially offset by higher accounts payable primarily due to increased purchasing activity. The Company’s days sales in accounts receivable, days in accounts payable and inventory turnover ratios were:
Gross cash flow, representing net income plus depreciation and amortization, was $40.3 million, $36.6 million and $27.2 million for 2011, 2010 and 2009, respectively.
Net cash provided by operating activities was $21.1 million, $28.6 million and $49.7 million for 2011, 2010 and 2009, respectively. Increased sales during 2011 and 2010 resulted in increased accounts receivable, inventories, accounts payable and commissions payable, whereas these items generally declined during the severe 2009 recession.
Cash used for investing activities was $10.2 million, $42.7 million and $38.2 million for 2011, 2010 and 2009, respectively. During 2011, investing activities consisted primarily of investments in machinery and equipment. National Pump Company was acquired in October 2010 for cash consideration of $33.9 million. Capital expenditures of approximately $58.5 million for the new Mansfield facilities, substantially completed in 2009, have been incurred as follows: $3.9 million in 2010, $30.7 million in 2009 and $23.9 million previously.
Net cash (used for) provided by financing activities was ($22.4) million in 2011, $1.7 million in 2010 and $8.2 million in 2009. During 2011, financing activities consisted principally of the re-payment of short-term bank borrowings of $15.0 million used to partially finance the 2010 acquisition of National Pump Company and dividend payments of $7.4 million.
On January 26, 2012, the Board of Directors authorized the payment of a quarterly dividend of $0.09 per share, representing the 248th consecutive quarterly dividend to be paid by the Company. During 2011, the Company again paid increased dividends and thereby attained its 39th consecutive year of increased dividends. These consecutive years place Gorman-Rupp in the top 50 of all U.S. public companies with respect to the number of consecutive years of increased dividend payments. The dividend yield at December 31, 2011 was 1.3%.
The changes in foreign currency translation against the U.S. dollar decreased cash by $572,000 in 2011 and increased cash by $130,000 and $800,000 in 2010 and 2009, respectively.
The ratio of current assets to current liabilities was 3.1 to 1 and 2.4 to 1 at December 31, 2011 and 2010, respectively. Management believes that cash on hand, combined with cash provided by operating activities and existing financing capabilities, will be sufficient to meet cash requirements for the next twelve months, including capital expenditures, the expected payment of quarterly dividends, and principal and interest on debt outstanding.
The Company currently expects to continue its long history of paying regular quarterly dividends and increased annual dividends. However, any future dividends will be reviewed individually and declared by our Board of Directors at its discretion, dependent on our assessment of the Company’s financial condition and business outlook at the applicable time.
Contractual ObligationsCapital commitments in the table below include commitments to purchase machinery and equipment, and at one location building improvements, that have been approved by the Board of Directors. The capital commitments do not represent the entire anticipated purchases in the future, but represent only those material items for which the Company is contractually obligated as of December 31, 2011. Also, the Company has some operating leases for certain specified offices, manufacturing facilities, land, office equipment and automobiles. Rental expenses relating to these leases were $866,000, $852,000 and $741,000 in 2011, 2010 and 2009, respectively.
The following table summarizes the Company’s contractual obligations at December 31, 2011:
2011 2010 2009
Days sales in accounts receivable 55 55 59
Days in accounts payable 27 26 34
Inventory turnover ratio 2.3 2.2 2.0
(Thousands of dollars) TotalLess
than 1 Year
1-3 Years
3-5 Years
More than 5 Years
Capital commitments $5,217 $5,217 $ – $ – $ –
Operating leases 3,545 778 1,267 377 1,123
Total $8,762 $5,995 $1,267 $377 $1,123
32
Critical Accounting PoliciesThe accompanying consolidated financial statements have been prepared in conformity with accounting principles generally accepted in the United States. When more than one accounting principle, or the method of its application, is generally accepted, management selects the principle or method that is appropriate in the Company’s specific circumstances. Application of these accounting principles requires management to make estimates about the future resolution of existing uncertainties; as a result, actual results could differ from these estimates.
In preparing these consolidated financial statements, management has made its best estimates and judgments of the amounts and disclosures included in the consolidated financial statements, giving due regard to materiality. The Company does not believe there is a great likelihood that materially different amounts would be reported under different conditions or using different assumptions pertaining to the accounting policies described below.
Revenue Recognition
Substantially all of the Company’s revenues from product sales are recognized when all of the following criteria are met: persuasive evidence of a sale arrangement exists, the price is fixed or determinable, product delivery has occurred or services have been rendered, there are no further obligations to customers, and collectability is probable. Product delivery occurs when the risks and rewards of ownership and title pass, which usually occurs upon shipment to the customer.
Allowance for Doubtful Accounts
The Company evaluates the collectability of its accounts receivable based on a combination of factors. In circumstances where the Company is aware of a specific customer’s inability to meet its financial obligations to the Company (e.g., bankruptcy filings, substantial downgrading of credit scores, etc.), the Company records a specific allowance for bad debts against amounts due to reduce the net recognized receivable to the amount the Company reasonably believes will be collected. For all other customers, the Company recognizes allowances for bad debts based on the length of time the receivables are past due. If circumstances change (e.g., an unexpected material adverse change in a major customer’s ability to meet its financial obligations), the Company’s estimates of the recoverability of amounts due could be reduced by a material amount. Historically, the Company’s collection history has been good.
Inventories and Related Allowance
Inventories are valued at the lower of cost or market value and have been reduced by an allowance for
excess and obsolete inventories. The estimated allowance is based on a variety of factors, including historical inventory usage and management evaluations. Historically, the Company has not experienced substantive write-offs due to obsolescence. The Company uses the last-in, first-out (LIFO) method for the majority of its inventories.
Pension Plans and Other Postretirement Benefit Plans
The Company fully recognizes the obligations associated with its defined benefit pension plan and defined benefit health care plan in its consolidated financial statements. The measurement of liabilities related to pension plans and other postretirement benefit plans is based on management’s assumptions related to future events including interest rates, return on pension plan assets, rate of compensation increases and health care cost trend rates. Actual pension plan asset performance will either reduce or increase pension losses included in accumulated other comprehensive loss, which ultimately affects net income. The Company uses a measurement date of December 31 for benefit plan determinations. The discount rates used to determine the present value of future benefits are based on estimated yields of investment grade fixed income investments.
The discount rate used to value pension plan obligations was 4.00% and 5.00% in 2011 and 2010, respectively. The discount rate used to value postretirement obligations was 3.76% and 4.85% at December 31, 2011 and 2010, respectively. The discount rate was determined by constructing a zero-coupon spot yield curve derived from a universe of high-quality bonds as of the measurement date. The expected rate of return on pension assets is designed to be a long-term assumption that will be subject to year-to-year variability. The expected rate of return was 7.00% for 2011 and 8.00% for 2010. Actual pension plan asset performance will either reduce or increase unamortized losses included in accumulated other comprehensive loss, which will ultimately affect net income. The assumed rate of compensation increase was 3.50% in 2011 and 2010.
The assumption used for the rate of increase in medical costs over the next five years was unchanged in 2011 from 2010. A one percentage point increase in the assumed health care trend would increase postretirement expense by approximately $212,000, changing the benefit obligation by approximately $1.8 million; while a one percentage point decrease in the assumed health care trend would decrease postretirement expense by approximately $199,000, changing the benefit obligation by approximately $1.7 million.
Substantially all retirees elect to take lump sum settlements of their pension benefits. This subjects the Company to the risk of exceeding an actuarial threshold
Management’s Discussion and Analysis

The Gorman-Rupp Company Annual Report 2011
33
computed on an annual basis and triggering a GAAP-required non-cash pension settlement loss. This event occurred in 2011 and previously in 2003.
Income Taxes
The basic principles related to accounting for income taxes are to recognize the amount of taxes payable or refundable for the current year and deferred tax liabilities and assets for the future tax consequences of events that have been recognized in an entity’s financial statements or tax returns.
Realization of the Company’s deferred tax assets is principally dependent upon the Company’s achievement of projected future taxable income, which management believes will be sufficient to fully utilize the deferred tax assets recorded.
Goodwill and Other Intangibles
The Company accounts for goodwill in a purchase business combination as the excess of the cost over the fair value of net assets acquired. Business combinations can also result in other intangible assets being recognized. Amortization of intangible assets, if applicable, occurs over their estimated useful lives.
Goodwill and indefinite life intangible assets are tested annually for impairment as of October 1, or whenever events or changes in circumstances indicate there may be a possible permanent loss of value in accordance with ASC 350, Intangibles - Goodwill and Other.
Goodwill is tested for impairment at the reporting unit level and is based on the net assets for each reporting unit, including goodwill and intangible assets. In September 2011, the FASB issued ASU 2011-08 which amends the rules for testing goodwill for impairment. Under the new rules, an entity has the option to first assess qualitative factors to determine whether the existence of events or circumstances leads to a determination that it is more likely than not that the fair value of a reporting unit is less than its carrying amount. If, after assessing the totality of events or circumstances, an entity determines it is not more likely than not that the fair value of a reporting unit is less than its carrying amount, then performing the two-step impairment test is unnecessary. The Company early adopted ASU 2011-08 for our October 1, 2011 annual goodwill impairment test.
In assessing the qualitative factors to determine whether it is more likely than not that the fair value of a reporting unit is less than its carrying amount, we identify and assess relevant drivers of fair value and events and circumstances that may impact the fair value and the carrying amount of the reporting unit. The identification of relevant events and circumstances and how these may impact a reporting units’ fair value or
carrying amount involve significant judgments and assumptions. The judgment and assumptions include the identification of macroeconomic conditions, industry and market considerations, cost factors, overall financial performance, Company specific events and share price trends and making the assessment on whether each relevant factor will impact the impairment test positively or negatively and the magnitude of any such impact.
When performing a quantitative assessment of goodwill impairment, a discounted cash flow model is used to estimate the fair value of each reporting unit, which considers forecasted cash flows discounted at an estimated weighted-average cost of capital. The forecasted cash flows are based on the Company’s long-term operating plan and the weighted-average cost of capital is an estimate of the overall after-tax rate of return. Other valuation techniques including comparative market multiples are used when appropriate. Discount rate assumptions are based on an assessment of the risk inherent in the future cash flows of the respective reporting units.
Based upon our fiscal 2011 qualitative impairment analysis and our 2010 quantitative impairment analysis, we concluded that it is more likely than not that the fair value of our reporting units continues to substantially exceed the respective carrying amounts.
Indefinite life intangible assets primarily consist of trademarks and trade names. The fair value of these assets are determined using a royalty relief methodology similar to that employed when the associated assets were acquired, but using updated estimates of future sales, cash flows and profitability. For 2011, the fair value of indefinite lived intangible assets substantially exceeded the respective carrying value.
Other intangible assets are reviewed for impairment whenever events or changes in circumstances indicate the carrying amount may not be recovered through future net cash flows generated by the assets.
Other Matters
Transactions with related parties are in the ordinary course of business and are not material to the Company’s consolidated financial position, net income or cash flows.
The Company does not have any off-balance sheet arrangements, financings or other relationships with unconsolidated “special purpose entities.”
The Company is not a party to any long-term debt agreements, or any material capital leases or purchase obligations.
34
Management is responsible for establishing and maintaining adequate internal control over financial reporting for the Company (as defined in Exchange Act rules 13[a]–15[f ]). Internal control over financial reporting is a process designed to provide reasonable assurance regarding the reliability of financial reporting and the preparation of financial statements for external purposes in accordance with accounting principles generally accepted in the United States.
The Company’s internal control over financial reporting includes those policies and procedures that (i) pertain to the maintenance of records that, in reasonable detail, accurately and fairly reflect the transactions and dispositions of the assets of the Company; (ii) provide reasonable assurance that transactions are recorded as necessary to permit preparation of financial statements in accordance with accounting principles generally accepted in the United States, and that receipts and expenditures of the Company are being made only in accordance with authorizations of Management and Directors of the Company; and (iii) provide reasonable assurance regarding prevention or timely detection of unauthorized acquisition, use or disposition of the Company’s assets that could have a material effect on the financial statements.
Because of its inherent limitations, internal control over financial reporting may not prevent or detect misstatements. In addition, projections of any evaluation of effectiveness to future periods are subject to the risk that controls may become inadequate because of changes in conditions, or that the degree of compliance with the policies or procedures may deteriorate.
Management conducted an evaluation of the effectiveness of internal control over financial reporting based on the framework in Internal Control – Integrated Framework issued by the Committee of Sponsoring Organizations of the Treadway Commission. Based on this evaluation, Management concluded that the Company’s internal control over financial reporting was effective as of December 31, 2011.
The independent registered public accounting firm of Ernst & Young LLP that has audited the consolidated financial statements included in this annual report on Form 10-K, has also issued an attestation report on the Company’s internal control over financial reporting as of December 31, 2011. This report is included on the following page.
Jeffrey S. Gorman
President and Chief Executive Off icer
Wayne L. Knabel
Chief Financial Off icer
March 5, 2012
Jeffrey S. Gorman
Wayne L. Knabel
Report of Management on Internal Control over Financial Reporting
The Gorman-Rupp Company Annual Report 2011
35
The Board of Directors and Shareholders of The Gorman-Rupp Company
We have audited The Gorman-Rupp Company’s internal control over financial reporting as of December 31, 2011, based on criteria established in Internal Control – Integrated Framework issued by the Committee of Sponsoring Organizations of the Treadway Commission (the COSO criteria). The Gorman-Rupp Company’s management is responsible for maintaining effective internal control over financial reporting, and for its assessment of the effectiveness of internal control over financial reporting included in the accompanying Report of Management on Internal Control Over Financial Reporting. Our responsibility is to express an opinion on the Company’s internal control over financial reporting based on our audit.
We conducted our audit in accordance with the standards of the Public Company Accounting Oversight Board (United States). Those standards require that we plan and perform the audit to obtain reasonable assurance about whether effective internal control over financial reporting was maintained in all material respects. Our audit included obtaining an understanding of internal control over financial reporting, assessing the risk that a material weakness exists, testing and evaluating the design and operating effectiveness of internal control based on the assessed risk, and performing such other procedures as we considered necessary in the circumstances. We believe that our audit provides a reasonable basis for our opinion.
A company’s internal control over financial reporting is a process designed to provide reasonable assurance regarding the reliability of financial reporting and the preparation of financial statements for external purposes in accordance with generally accepted accounting principles. A company’s internal control over financial reporting includes those policies and procedures that (1) pertain to the maintenance of records that, in reasonable detail, accurately and fairly reflect the transactions and dispositions of the assets of the company; (2) provide reasonable assurance that transactions are recorded as necessary to permit preparation of financial statements in accordance with generally accepted accounting principles, and that receipts and expenditures of the company are being made only in accordance with authorizations of management and directors of the company; and (3) provide reasonable assurance regarding prevention or timely detection of unauthorized acquisition, use, or disposition of the company’s assets that could have a material effect on the financial statements.
Because of its inherent limitations, internal control over financial reporting may not prevent or detect misstatements. Also, projections of any evaluation of effectiveness to future periods are subject to the risk that controls may become inadequate because of changes in conditions, or that the degree of compliance with the policies or procedures may deteriorate.
In our opinion, The Gorman-Rupp Company maintained, in all material respects, effective internal control over financial reporting as of December 31, 2011, based on the COSO criteria.
We also have audited, in accordance with the standards of the Public Company Accounting Oversight Board (United States), the consolidated balance sheets of The Gorman-Rupp Company as of December 31, 2011 and 2010, and the related consolidated statements of income, equity, and cash flows for each of the three years in the period ended December 31, 2011 of The Gorman-Rupp Company and our report dated March 5, 2012 expressed an unqualified opinion thereon.
Cleveland, Ohio
March 5, 2012
Report of Independent Registered Public Accounting Firm
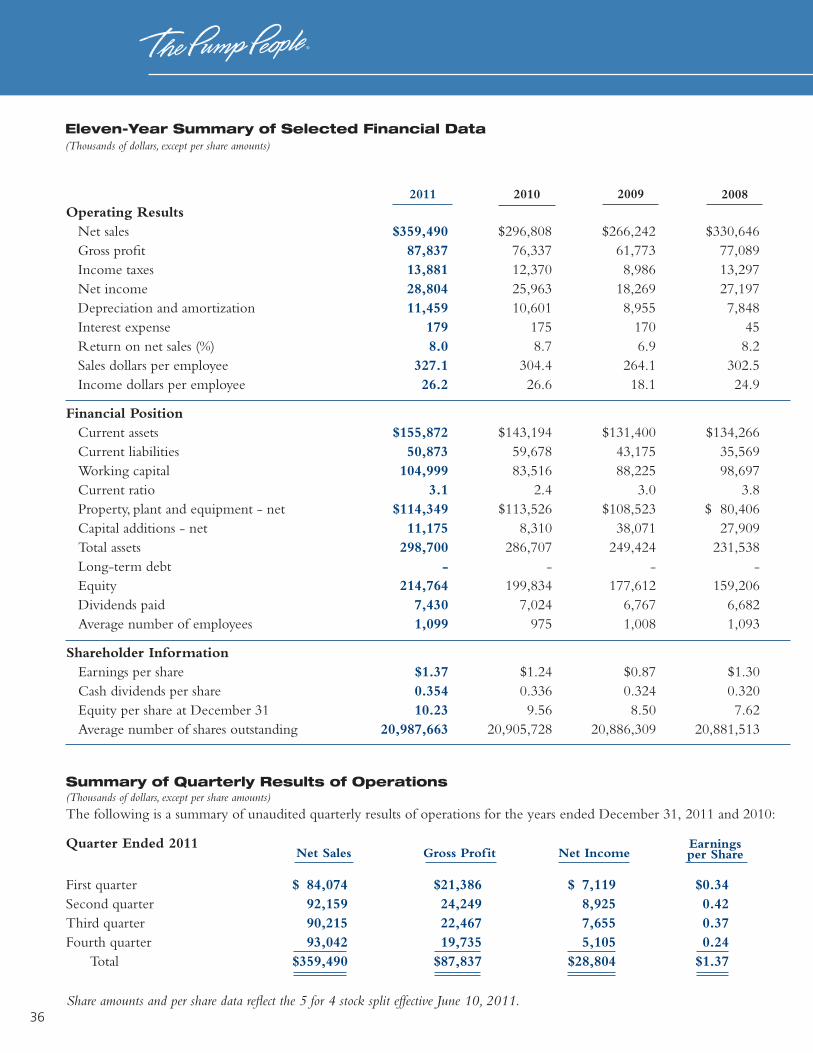
36
Quarter Ended 2011
First quarter $ 84,074 $21,386 $ 7,119 $0.34Second quarter 92,159 24,249 8,925 0.42Third quarter 90,215 22,467 7,655 0.37Fourth quarter 93,042 19,735 5,105 0.24
Total $359,490 $87,837 $28,804 $1.37
Operating ResultsNet sales $359,490 $296,808 $266,242 $330,646Gross profit 87,837 76,337 61,773 77,089Income taxes 13,881 12,370 8,986 13,297Net income 28,804 25,963 18,269 27,197Depreciation and amortization 11,459 10,601 8,955 7,848Interest expense 179 175 170 45Return on net sales (%) 8.0 8.7 6.9 8.2Sales dollars per employee 327.1 304.4 264.1 302.5Income dollars per employee 26.2 26.6 18.1 24.9
Financial PositionCurrent assets $155,872 $143,194 $131,400 $134,266Current liabilities 50,873 59,678 43,175 35,569Working capital 104,999 83,516 88,225 98,697Current ratio 3.1 2.4 3.0 3.8Property, plant and equipment - net $114,349 $113,526 $108,523 $ 80,406Capital additions - net 11,175 8,310 38,071 27,909Total assets 298,700 286,707 249,424 231,538Long-term debt - - - -Equity 214,764 199,834 177,612 159,206Dividends paid 7,430 7,024 6,767 6,682Average number of employees 1,099 975 1,008 1,093
Shareholder InformationEarnings per share $1.37 $1.24 $0.87 $1.30Cash dividends per share 0.354 0.336 0.324 0.320Equity per share at December 31 10.23 9.56 8.50 7.62Average number of shares outstanding 20,987,663 20,905,728 20,886,309 20,881,513
Eleven-Year Summary of Selected Financial Data(Thousands of dollars, except per share amounts)
The following is a summary of unaudited quarterly results of operations for the years ended December 31, 2011 and 2010:
Summary of Quarterly Results of Operations(Thousands of dollars, except per share amounts)
2011 2010 2009 2008
Share amounts and per share data reflect the 5 for 4 stock split effective June 10, 2011.
Net Sales Gross Profit Net IncomeEarnings per Share

The Gorman-Rupp Company Annual Report 2011
37
2007 2006 2005 2004 2003 2002 2001
$305,562 $270,910 $231,249 $203,554 $195,826 $195,081 $203,16967,452 58,676 47,071 42,425 41,851 41,451 48,10812,524 8,654 6,235 5,075 4,613 5,267 8,45022,859 19,072 10,903 9,277 9,787 8,936 14,5857,597 6,688 6,808 7,179 7,274 7,035 7,128
49 41 25 40 56 72 1167.5 7.0 4.7 4.6 5.0 4.6 7.2
286.9 258.3 233.3 211.4 196.4 185.1 195.221.5 18.2 11.0 9.6 9.8 8.5 14.0
$135,288 $120,118 $110,501 $ 96,974 $ 95,718 $ 85,315 $ 90,57533,481 27,646 28,219 21,112 21,908 19,282 18,103
101,807 92,472 82,282 75,862 73,810 66,033 72,4724.0 4.3 3.9 4.6 4.4 4.4 5.0
$ 59,970 $ 52,351 $ 51,505 $ 54,812 $ 54,338 $ 57,757 $ 53,89512,826 7,258 3,189 7,500 3,698 5,765 3,139
211,534 187,540 179,541 165,673 162,395 154,302 149,569- - - - - 291 -
149,960 128,142 127,048 121,898 117,918 112,912 109,3666,503 6,126 5,983 5,907 5,809 5,550 5,4751,065 1,049 991 963 997 1,054 1,041
$1.10 $0.91 $0.53 $0.44 $0.46 $0.43 $0.700.310 0.292 0.286 0.283 0.278 0.266 0.2627.18 6.14 6.09 5.84 5.66 5.42 5.24
20,876,469 20,871,203 20,865,341 20,858,746 20,851,433 20,844,109 20,885,033
Quarter Ended 2010
First quarter $ 65,786 $15,449 $ 4,497 $0.22Second quarter 72,380 17,286 5,656 0.27Third quarter 73,953 18,655 6,155 0.29Fourth quarter 84,689 24,947 9,655 0.46
Total $296,808 $76,337 $25,963 $1.24
Net Sales Gross Profit Net IncomeEarnings per Share
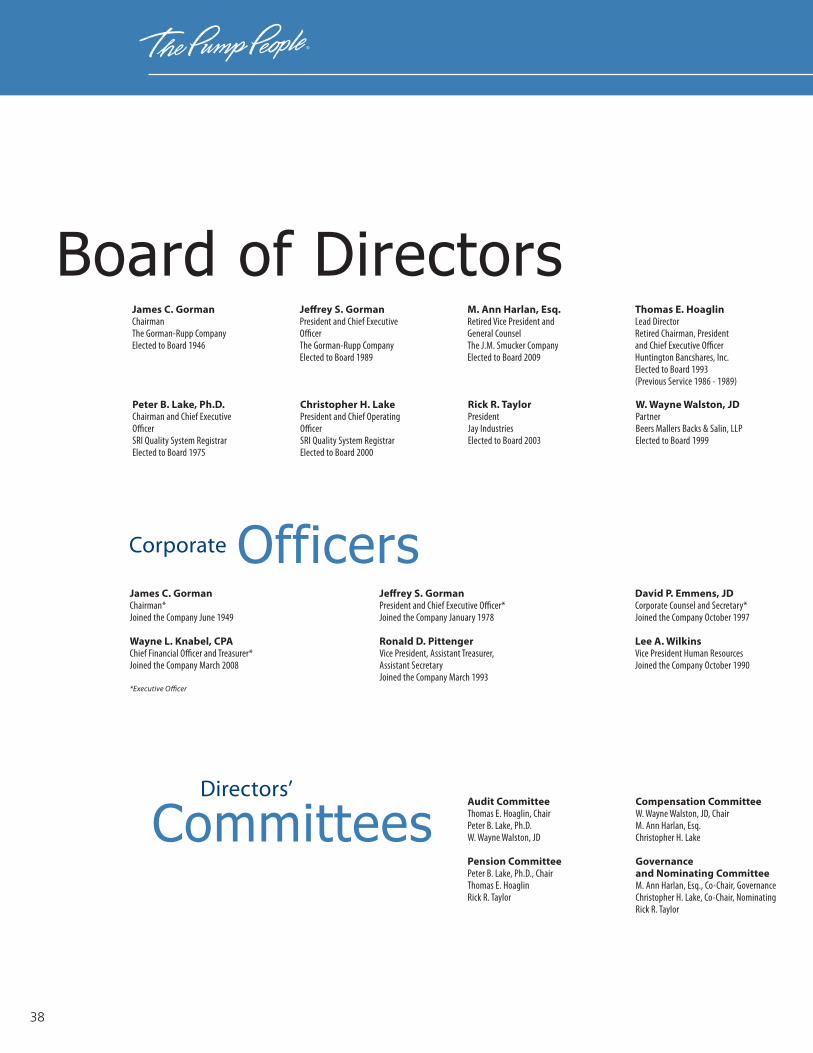
38
Christopher H. Lake President and Chief Operating OfficerSRI Quality System RegistrarElected to Board 2000
M. Ann Harlan, Esq.Retired Vice President and General CounselThe J.M. Smucker Company Elected to Board 2009
Peter B. Lake, Ph.D.Chairman and Chief Executive OfficerSRI Quality System RegistrarElected to Board 1975
Thomas E. Hoaglin Lead Director Retired Chairman, President and Chief Executive Officer Huntington Bancshares, Inc. Elected to Board 1993(Previous Service 1986 - 1989)
Jeffrey S. GormanPresident and Chief Executive OfficerThe Gorman-Rupp CompanyElected to Board 1989
Rick R. TaylorPresidentJay IndustriesElected to Board 2003
James C. GormanChairmanThe Gorman-Rupp CompanyElected to Board 1946
Audit CommitteeThomas E. Hoaglin, Chair Peter B. Lake, Ph.D. W. Wayne Walston, JD
Pension CommitteePeter B. Lake, Ph.D., Chair Thomas E. Hoaglin Rick R. Taylor
Board of Directors
James C. Gorman Chairman*Joined the Company June 1949
Wayne L. Knabel, CPA Chief Financial Officer and Treasurer* Joined the Company March 2008
*Executive Officer
W. Wayne Walston, JDPartnerBeers Mallers Backs & Salin, LLPElected to Board 1999
Jeffrey S. Gorman President and Chief Executive Officer*Joined the Company January 1978
Ronald D. Pittenger Vice President, Assistant Treasurer, Assistant SecretaryJoined the Company March 1993
David P. Emmens, JD Corporate Counsel and Secretary*Joined the Company October 1997
Lee A. Wilkins Vice President Human ResourcesJoined the Company October 1990
CommitteesDirectors’
Compensation CommitteeW. Wayne Walston, JD, Chair M. Ann Harlan, Esq. Christopher H. Lake
Governance and Nominating CommitteeM. Ann Harlan, Esq., Co-Chair, Governance Christopher H. Lake, Co-Chair, NominatingRick R. Taylor
Officers Corporate

The Gorman-Rupp Company Annual Report 2011
39
Gorman-Rupp Pumps Group: Mark L. Kreinbihl, Group President Mansfield Division 600 South Airport Road
Mansfield, OH 44903-7831 Phone 419-755-1011 Fax 419-755-1251 www.grpumps.com
The Gorman-Rupp International Company Jeffrey S. Gorman, President
600 South Airport Road Mansfield, OH 44903-7831 Phone 419-755-1011 Fax 419-755-1266
Gorman-Rupp of Canada Limited Gary W. Creeden, Vice President
and General Manager 70 Burwell Road St. Thomas, Ontario N5P 3R7 Canada Phone 519-631-2870 Fax 519-631-4624 www.grcanada.com
Gorman-Rupp Europe B.V. Martinus T. Ferkranus,
Managing Director Fahrenheitweg 35 8912 AK Leeuwarden, The Netherlands Phone 31-58-212-3774 Fax 31-58-213-2057
Patterson Pumps Group: Albert F. Huber, President Patterson Pump Company 2129 Ayersville Road Toccoa, GA 30577-3554 Phone 706-886-2101 Fax 706-886-0023 www.pattersonpumps.com
Patterson Pump Ireland Limited Rodney V. Pelot,
Managing Director Unit 14 Mullingar Business Park Mullingar, CO. Westmeath, Ireland Phone 353-44-93-47078 Fax 353-44-93-47896
Custom Pumps Group: Gorman-Rupp Industries Division Michael L. Hill, Vice President
and General Manager 180 Hines Avenue Bellville, OH 44813-1234 Phone 419-886-3001 Fax 419-886-2338 www.gripumps.com
American Machine and Tool Co., Inc.of Pennsylvania Keith Bearde, President
and General Manager 400 Spring Street Royersford, PA 19468-2519 Phone 610-948-3800 Fax 610-948-5300 www.amtpump.com
National Pump Company Roger L. Jeschke, President
7706 North 71st Avenue Glendale, AZ 85303-1703 Phone 623-979-3560 Fax 623-979-2177 www.nationalpumpcompany.com
Markets Served
Municipal • • • • • • • •Fire Protection • • • • • •Agriculture • • • • • • •Petroleum • • • •Construction • • • • • •Original Equipment • • • • • • •Industrial • • • • • • • • •International • • • • • • • • •
Gorman-Rupp Pumps Group Patterson Pumps Group Custom Pumps Group
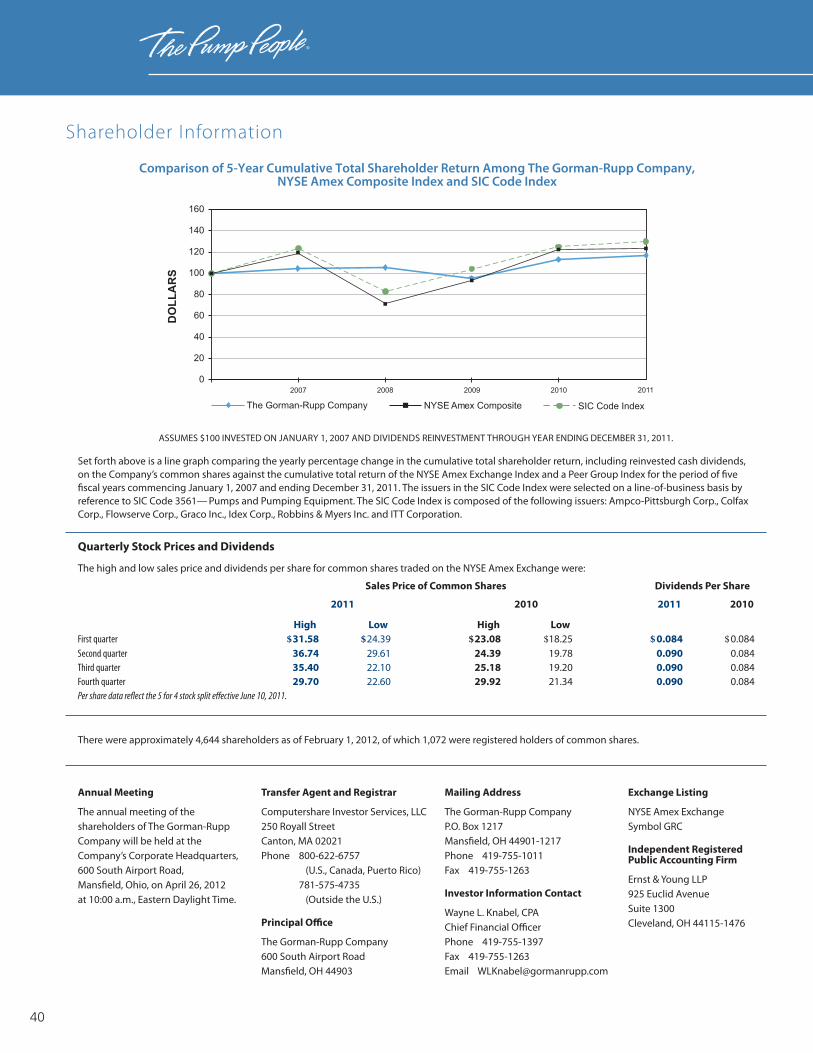
40
0
20
40
60
80
100
120
140
160
DOLLARS
The Gorman-Rupp Company NYSE Amex Composite SIC Code Index
2007 2008 2009 2010 2011
Comparison of 5-Year Cumulative Total Shareholder Return Among The Gorman-Rupp Company, NYSE Amex Composite Index and SIC Code Index
Set forth above is a line graph comparing the yearly percentage change in the cumulative total shareholder return, including reinvested cash dividends, on the Company’s common shares against the cumulative total return of the NYSE Amex Exchange Index and a Peer Group Index for the period of five fiscal years commencing January 1, 2007 and ending December 31, 2011. The issuers in the SIC Code Index were selected on a line-of-business basis by reference to SIC Code 3561— Pumps and Pumping Equipment. The SIC Code Index is composed of the following issuers: Ampco-Pittsburgh Corp., Colfax Corp., Flowserve Corp., Graco Inc., Idex Corp., Robbins & Myers Inc. and ITT Corporation.
Annual Meeting
The annual meeting of the shareholders of The Gorman-Rupp Company will be held at the Company’s Corporate Headquarters, 600 South Airport Road, Mansfield, Ohio, on April 26, 2012 at 10:00 a.m., Eastern Daylight Time.
Transfer Agent and Registrar
Computershare Investor Services, LLC 250 Royall Street Canton, MA 02021 Phone 800-622-6757
(U.S., Canada, Puerto Rico) 781-575-4735 (Outside the U.S.)
Principal Office
The Gorman-Rupp Company 600 South Airport Road Mansfield, OH 44903
Mailing Address
The Gorman-Rupp Company P.O. Box 1217 Mansfield, OH 44901-1217 Phone 419-755-1011 Fax 419-755-1263
Investor Information Contact
Wayne L. Knabel, CPA Chief Financial Officer Phone 419-755-1397 Fax 419-755-1263 Email [email protected]
Exchange Listing
NYSE Amex Exchange Symbol GRC
Independent Registered Public Accounting Firm
Ernst & Young LLP 925 Euclid Avenue Suite 1300 Cleveland, OH 44115-1476
Quarterly Stock Prices and Dividends
The high and low sales price and dividends per share for common shares traded on the NYSE Amex Exchange were:
First quarter $31.58 $24.39 $23.08 $18.25 $0.084 $0.084Second quarter 36.74 29.61 24.39 19.78 0.090 0.084Third quarter 35.40 22.10 25.18 19.20 0.090 0.084Fourth quarter 29.70 22.60 29.92 21.34 0.090 0.084Per share data reflect the 5 for 4 stock split effective June 10, 2011.
High Low High Low
Sales Price of Common Shares Dividends Per Share
2011 2010 2011 2010
ASSUMES $100 INVESTED ON JANUARY 1, 2007 AND DIVIDENDS REINVESTMENT THROUGH YEAR ENDING DECEMBER 31, 2011.
There were approximately 4,644 shareholders as of February 1, 2012, of which 1,072 were registered holders of common shares.
Shareholder Information

The Gorman-Rupp Company Annual Report 2011
41
Incorporated
April 18, 1934, under the laws of the State of Ohio
SEC Form 10-K
The SEC Annual Report Form 10-K is available free of charge by written request to:
David P. Emmens Corporate Secretary The Gorman-Rupp Company P. O. Box 1217 Mansfield, Ohio 44901-1217
Phone 419-755-1477 Fax 419-755-1263 Email [email protected]
Internet Information
Information about the Company, its U.S. Securities and Exchange Commission filings and its products are available through Gorman-Rupp’s web site at: www.gormanrupp.com
To Buy or Sell Stock
Stock cannot be purchased or sold directly through The Gorman-Rupp Company. Purchases and sales of the Company’s stock generally are made through a securities dealer or through the Dividend Reinvestment Plan offered through Computershare Investor Services, LLC.
In addition, employees of the Company may purchase shares through an Employee Stock Purchase Plan offered through monthly deductions from their paychecks.
Open Enrollment Dividend Reinvestment and Stock Purchase Plan
Computershare Investor Services, LLC offers a convenient plan for investment in shares of common stock of The Gorman-Rupp Company. Investors may buy or sell common shares of The Gorman-Rupp Company through Computershare Investor Services, LLC’s Open Enrollment Dividend Reinvestment and Stock Purchase Plan. Initial investments may be made from a minimum of $500 to a maximum of $10,000. Any subsequent investments may be made for a minimum of $50 to a maximum of $5,000 per month.
For additional information please contact The Gorman-Rupp Company, Attention: Corporate Secretary, for a copy of the Plan brochure, or call a customer service representative at Computershare Investor Services, LLC.
Phone 800-622-6757 (U.S., Canada, Puerto Rico) 781-575-4735 (Outside the U.S.)
Direct Dividend Deposit
Gorman-Rupp offers the opportunity to have your dividend directly deposited into your checking or savings account. Your dividend is available to you on the payment date.
For additional information, call a customer service representative at Computershare Investor Services, LLC.
Phone 800-622-6757 (U.S., Canada, Puerto Rico) 781-575-4735 (Outside the U.S.)
Safe Harbor Statement
In connection with the “safe harbor” provisions of the Private Securities Litigation Reform Act of 1995, The Gorman-Rupp Company provides the following cautionary statement: This Annual Report contains various forward-looking statements and includes assumptions concerning The Gorman-Rupp Company's operations, future results and prospects. These forward-looking statements are based on current expectations about important economic, political, and technological factors, among others, and are subject to risks and uncertainties, the absence of which could cause the actual results or events to differ materially from those set forth in or implied by the forward-looking statements and related assumptions.
Such factors include the following: (1) continuation of the current and projected future business environment, including interest rates and capital and consumer spending; (2) competitive factors and competitor responses to Gorman-Rupp initiatives; (3) successful development and market introductions of anticipated new products; (4) stability of government laws and regulations, including taxes; (5) stable governments and business conditions in emerging economies; (6) successful penetration of emerging economies; and (7) continuation of the favorable environment to make acquisitions, domestic and foreign, including regulatory requirements and market values of candidates.

© 2011 The Gorman-Rupp CompanyPrinted in USA