Embed Size (px)
Citation preview

ANNUAL REPORT 2011
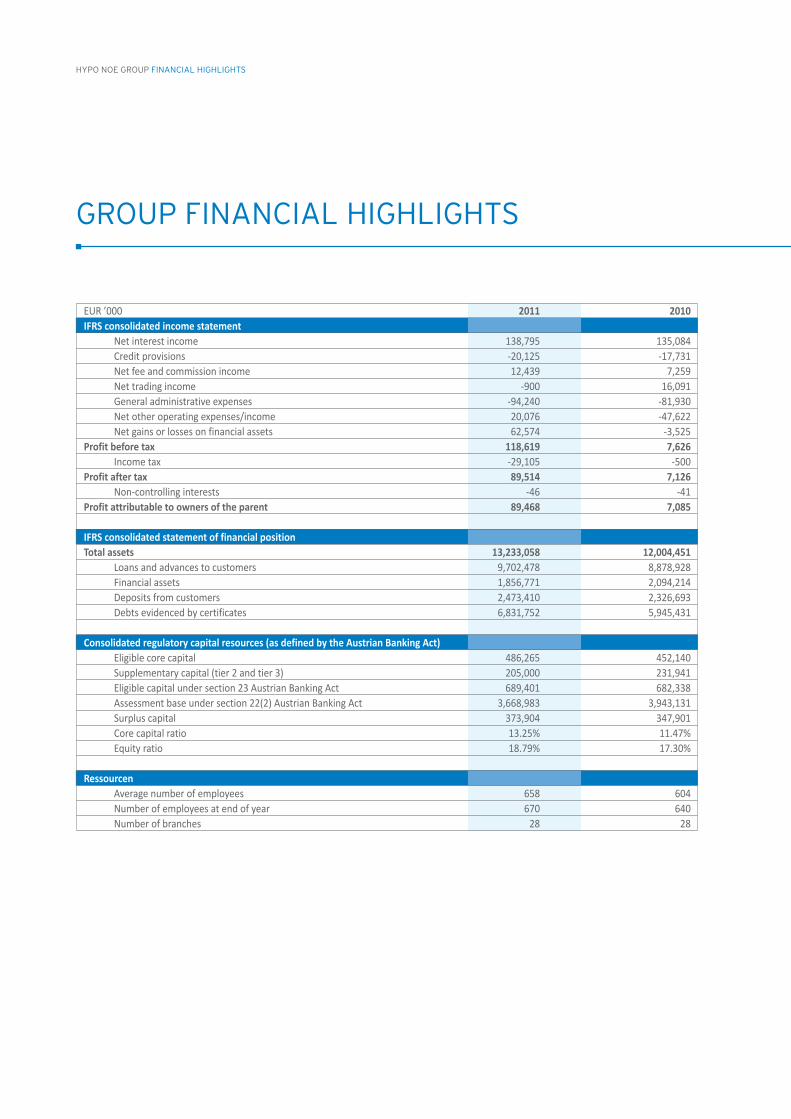
GROUP FINANCIAL HIGHLIGHTS
HYPO NOE GROUP FINANCIAL HIGHLIGHTS
EUR ’000 2011 2010 IFRS consolidated income statement Net interest income 138,795 135,084 Credit provisions -20,125 -17,731 Net fee and commission income 12,439 7,259 Net trading income -900 16,091 General administrative expenses -94,240 -81,930 Net other operating expenses/income 20,076 -47,622 Net gains or losses on financial assets 62,574 -3,525 Profit before tax 118,619 7,626 Income tax -29,105 -500 Profit after tax 89,514 7,126 Non-controlling interests -46 -41 Profit attributable to owners of the parent 89,468 7,085 IFRS consolidated statement of financial position Total assets 13,233,058 12,004,451 Loans and advances to customers 9,702,478 8,878,928 Financial assets 1,856,771 2,094,214 Deposits from customers 2,473,410 2,326,693 Debts evidenced by certificates 6,831,752 5,945,431 Consolidated regulatory capital resources (as defined by the Austrian Banking Act) Eligible core capital 486,265 452,140 Supplementary capital (tier 2 and tier 3) 205,000 231,941 Eligible capital under section 23 Austrian Banking Act 689,401 682,338 Assessment base under section 22(2) Austrian Banking Act 3,668,983 3,943,131 Surplus capital 373,904 347,901 Core capital ratio 13.25% 11.47% Equity ratio 18.79% 17.30% Ressourcen Average number of employees 658 604 Number of employees at end of year 670 640 Number of branches 28 28
ANNUAL REPORT 2011 | 3
HYPO NOE GROUP CONTENTS
STATEMENT BY THE EXECUTIVE BOARD .....................................................................................................................................5
Dynamic, flexible, fit for the future ................................................................................................................................................7
Strategy ...................................................................................................................................................................................................8
GROUP OPERATIONAL AND FINANCIAL REVIEW .................................................................................................................. 13
Economic climate ................................................................................................................................................................................ 14
Financial performance ....................................................................................................................................................................... 17
Operational performance .................................................................................................................................................................. 19
Public Finance ................................................................................................................................................................................. 19
Real Estate Finance ...................................................................................................................................................................... 20
Corporate & Project Finance ...................................................................................................................................................... 20
Institutional Customers ............................................................................................................................................................... 20
Treasury and funding ................................................................................................................................................................... 20
ALM & Capital Management ........................................................................................................................................................22
Public Loan Management .............................................................................................................................................................22
Human Resources ...............................................................................................................................................................................26
Risk report ............................................................................................................................................................................................ 28
Internal control and risk management system (ICS) ............................................................................................................. 47
Research and development ............................................................................................................................................................. 50
Group outlook for 2012 .....................................................................................................................................................................5 1
Events after the reporting period ................................................................................................................................................. 53
CONSOLIDATED FINANCIAL STATEMENTS for the year ended 31 December 2011 according to IFRS ........................ 55
Consolidated statement of comprehensive income for the year ended 31 December 2011......................................... 58
Consolidated statement of financial position as at 31 December 2011 ............................................................................. 59
Consolidated statement of changes in equity ........................................................................................................................60
Consolidated statement of cash flows ......................................................................................................................................6 1
NOTES to the consolidated financial statements and governing bodies ..................................................................................... 63
DECLARATION BY THE COMPANY’S LEGAL REPRESENTATIVES ................................................................................. 125
AUDITORS’ REPORT............................................................................................................................................................................. 126
REPORT OF THE SUPERVISORY BOARD ................................................................................................................................... 128
CONTENTS


HYPO NOE GROUP KONZERNGESCHÄFTSBERICHT
DYNAMIC, FLEXIBLE, FIT FOR THE FUTURE STRATEGY
STATEMENT BY THE MANAGEMENT BOARD

6 | ANNUAL REPORT 2011
HYPO NOE GROUP KONZERNGESCHÄFTSBERICHT
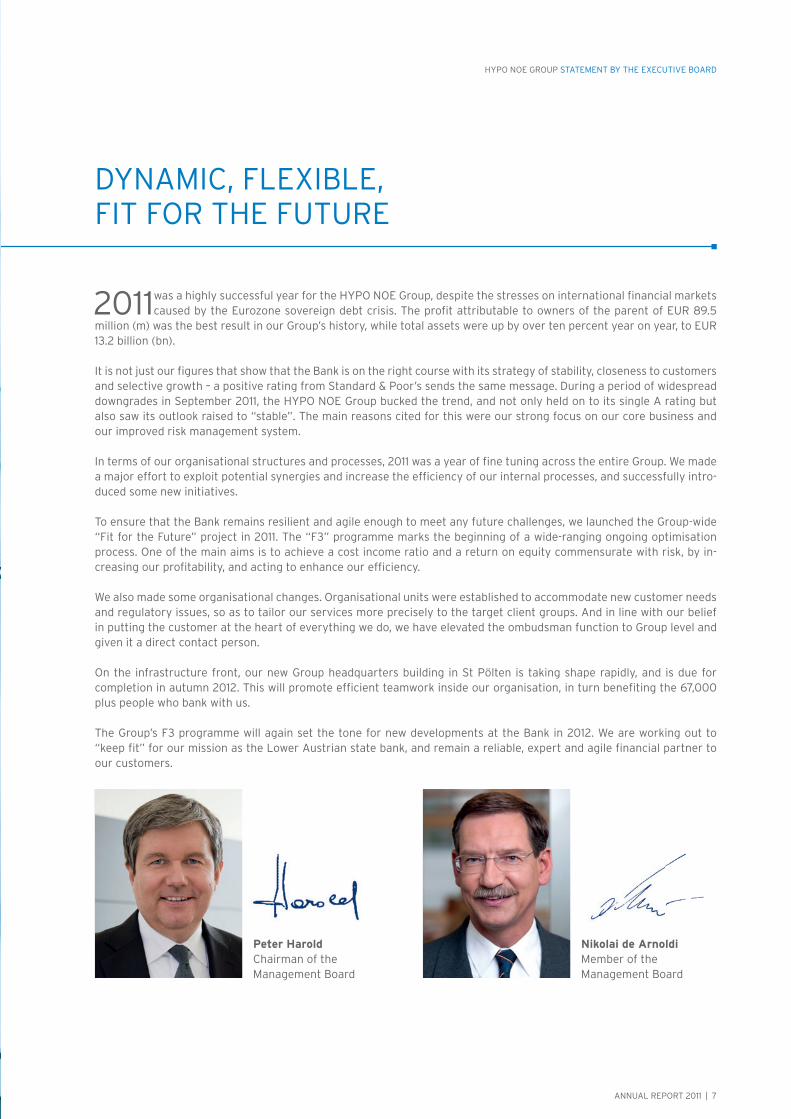
“The HYPO NOE Group is fully aware of the responsibility it carries as the Lower Austrian state bank. That’s why we will continue to do all in our power to be a reliable, expert, agile financial partner for our customers.”
ANNUAL REPORT 2011 | 7
HYPO NOE GROUP STATEMENT BY THE EXECUTIVE BOARD
DYNAMIC, FLEXIBLE,FIT FOR THE FUTURE
2011 was a highly successful year for the HYPO NOE Group, despite the stresses on international financial markets caused by the Eurozone sovereign debt crisis. The profit attributable to owners of the parent of EUR 89.5
million (m) was the best result in our Group’s history, while total assets were up by over ten percent year on year, to EUR 13.2 billion (bn).
It is not just our figures that show that the Bank is on the right course with its strategy of stability, closeness to customers and selective growth – a positive rating from Standard & Poor’s sends the same message. During a period of widespread downgrades in September 2011, the HYPO NOE Group bucked the trend, and not only held on to its single A rating but also saw its outlook raised to “stable”. The main reasons cited for this were our strong focus on our core business and our improved risk management system.
In terms of our organisational structures and processes, 2011 was a year of fine tuning across the entire Group. We made a major effort to exploit potential synergies and increase the efficiency of our internal processes, and successfully intro-duced some new initiatives.
To ensure that the Bank remains resilient and agile enough to meet any future challenges, we launched the Group-wide “Fit for the Future” project in 2011. The “F3” programme marks the beginning of a wide-ranging ongoing optimisation process. One of the main aims is to achieve a cost income ratio and a return on equity commensurate with risk, by in-creasing our profitability, and acting to enhance our efficiency.
We also made some organisational changes. Organisational units were established to accommodate new customer needs and regulatory issues, so as to tailor our services more precisely to the target client groups. And in line with our belief in putting the customer at the heart of everything we do, we have elevated the ombudsman function to Group level and given it a direct contact person.
On the infrastructure front, our new Group headquarters building in St Pölten is taking shape rapidly, and is due for completion in autumn 2012. This will promote efficient teamwork inside our organisation, in turn benefiting the 67,000 plus people who bank with us.
The Group’s F3 programme will again set the tone for new developments at the Bank in 2012. We are working out to “keep fit” for our mission as the Lower Austrian state bank, and remain a reliable, expert and agile financial partner to our customers.
Peter Harold Nikolai de Arnoldi Chairman of the Member of the Management Board Management Board
8 | ANNUAL REPORT 2011
HYPO NOE GROUP STRATEGY
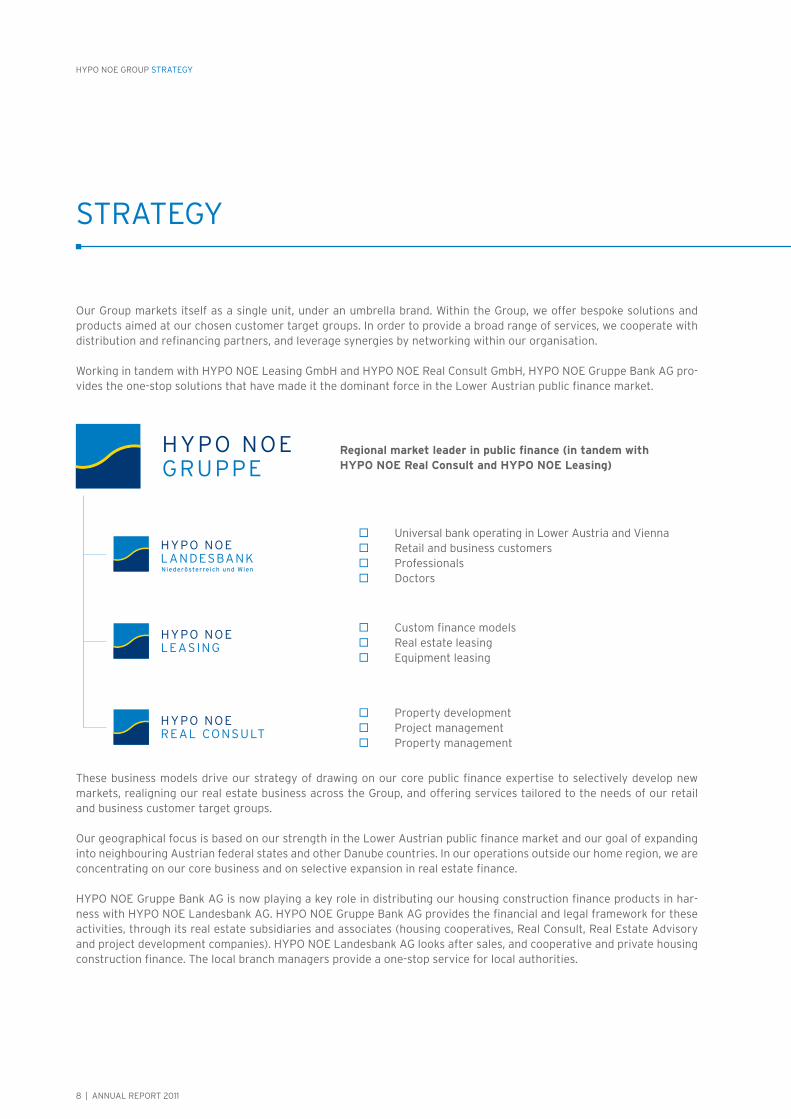
STRATEGY
Our Group markets itself as a single unit, under an umbrella brand. Within the Group, we offer bespoke solutions and products aimed at our chosen customer target groups. In order to provide a broad range of services, we cooperate with distribution and refinancing partners, and leverage synergies by networking within our organisation.
Working in tandem with HYPO NOE Leasing GmbH and HYPO NOE Real Consult GmbH, HYPO NOE Gruppe Bank AG pro-vides the one-stop solutions that have made it the dominant force in the Lower Austrian public finance market.
These business models drive our strategy of drawing on our core public finance expertise to selectively develop new markets, realigning our real estate business across the Group, and offering services tailored to the needs of our retail and business customer target groups.
Our geographical focus is based on our strength in the Lower Austrian public finance market and our goal of expanding into neighbouring Austrian federal states and other Danube countries. In our operations outside our home region, we are concentrating on our core business and on selective expansion in real estate finance.
HYPO NOE Gruppe Bank AG is now playing a key role in distributing our housing construction finance products in har-ness with HYPO NOE Landesbank AG. HYPO NOE Gruppe Bank AG provides the financial and legal framework for these activities, through its real estate subsidiaries and associates (housing cooperatives, Real Consult, Real Estate Advisory and project development companies). HYPO NOE Landesbank AG looks after sales, and cooperative and private housing construction finance. The local branch managers provide a one-stop service for local authorities.
Regional market leader in public finance (in tandem with HYPO NOE Real Consult and HYPO NOE Leasing)
Universal bank operating in Lower Austria and Vienna Retail and business customers Professionals Doctors
Custom finance models Real estate leasing Equipment leasing
Property development Project management Property management
ANNUAL REPORT 2011 | 9
HYPO NOE GROUP STRATEGY
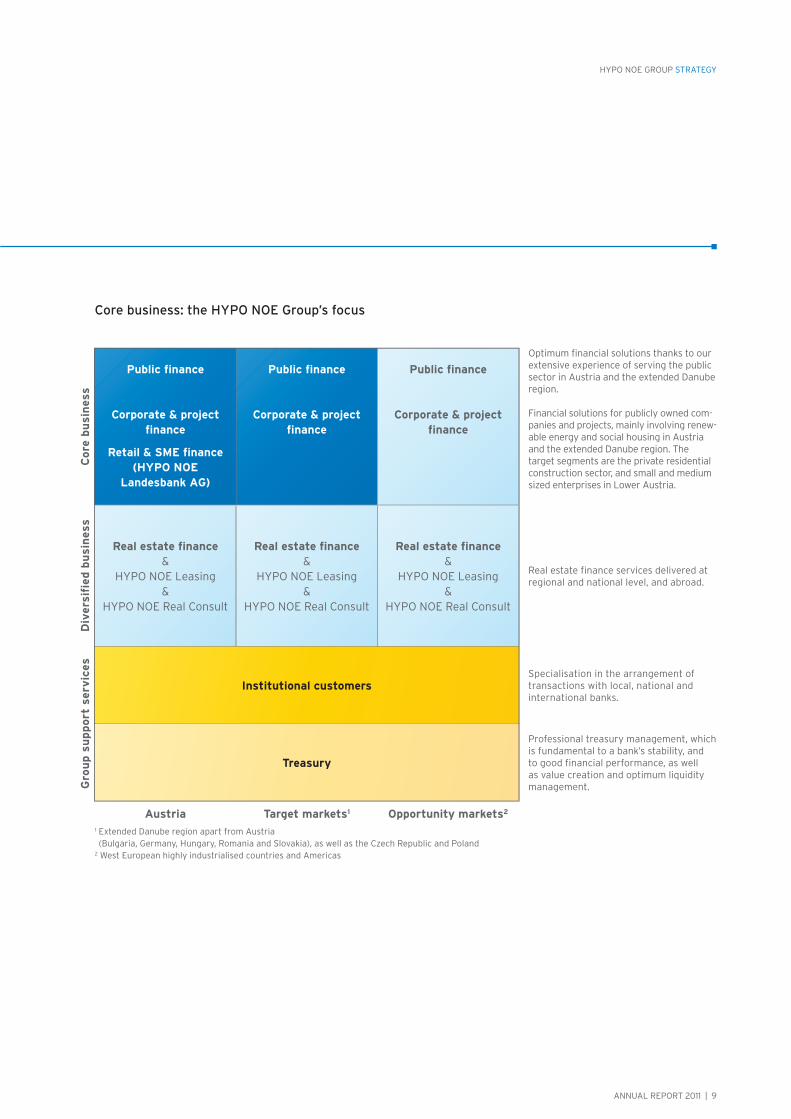
Core business: the HYPO NOE Group’s focus
Core
bu
sin
ess
Div
ersi
fied
bu
sin
ess
Gro
up s
upport
ser
vic
es
Opportunity markets2Target markets1Austria1 Extended Danube region apart from Austria (Bulgaria, Germany, Hungary, Romania and Slovakia), as well as the Czech Republic and Poland
2 West European highly industrialised countries and Americas
Specialisation in the arrangement of transactions with local, national and international banks.
Professional treasury management, which is fundamental to a bank’s stability, and to good financial performance, as well as value creation and optimum liquidity management.
Real estate finance services delivered at regional and national level, and abroad.
Financial solutions for publicly owned com-panies and projects, mainly involving renew-able energy and social housing in Austria and the extended Danube region. The target segments are the private residential construction sector, and small and medium sized enterprises in Lower Austria.
Optimum financial solutions thanks to our extensive experience of serving the public sector in Austria and the extended Danube region.
Public finance
Corporate & project finance
Public finance
Corporate & project finance
Institutional customers
Treasury
Public finance
Corporate & project finance
Retail & SME finance(HYPO NOE
Landesbank AG)
Real estate finance&
HYPO NOE Leasing&
HYPO NOE Real Consult
Real estate finance&
HYPO NOE Leasing&
HYPO NOE Real Consult
Real estate finance&
HYPO NOE Leasing&
HYPO NOE Real Consult
10 | ANNUAL REPORT 2011
HYPO NOE GROUP STRATEGY
Geographical markets: Danube region strategy
The HYPO NOE Group’s strategy for the extended Danube region addresses seven countries: Bulgaria, the Czech Republic, Germany (particularly Baden-Württemberg and Bavaria), Hungary, Poland, Romania and Slovakia. The goal is to fund projects relating to the following areas:
a) International integration of the regional economy, i.e. financing of projects targeted at promoting mobility, the use of renewable energy sources, culture and tourism.
b) Environmental protection, e.g. financing of projects designed to restore water quality, manage environmental risks and maintain biodiversity.
c) Prosperity in the region, i.e. financing of projects aimed at in-creasing research capacity, improving the education system, de-veloping information technology and promoting business com-petitiveness – with top priority for projects designed to improve vocational training.
d) Better government in the region, i.e. financing of projects aimed at enhancing institutional capacity.

ANNUAL REPORT 2011 | 11
HYPO NOE GROUP STRATEGY
Ethical principles
Customer needs are central to everything the HYPO NOE Group does. A detailed knowledge of our target groups’ business activities is vital to identifying the Bank’s risk exposures and those of its customers, and to developing optimum lending structures. Across the entire Group, particu-lar care must be exercised with regard to the following types of lending, and in case of doubt we refrain from engaging in the banking relation-ships concerned.
Finance for transactions or investments that pose a potential threat to the environment (e.g. nuclear power)
Finance for arms deals Finance for businesses involved in prostitution Finance for countries engaged in armed conflicts (Oester-
reichische Kontrollbank country list) Finance for the betting and gaming industry
Reputational risks are particularly likely to arise in con-nection with borrowers operating in industries that
are incompatible with the image and values of the HYPO NOE Group and its owner, the Lower Austrian state government. Here, too, partic-ular care must be exercised, and in case of doubt the Bank refrains from business deal-ings with those concerned.

HYPO NOE GROUP KONZERNGESCHÄFTSBERICHT
ECONOMIC CLIMATE FINANCIAL PERFORMANCE OPERATIONAL PERFORMANCE HUMAN RESOURCES RISK REPORT INTERNAL CONTROL AND
RISK MANAGEMENT SYSTEM (ICS) RESEARCH AND DEVELOPMENT GROUP OUTLOOK FOR 2012 EVENTS AFTER THE REPORTING PERIOD
GROUP OPERATIONAL AND FINANCIAL
REVIEW
14 | ANNUAL REPORT 2011
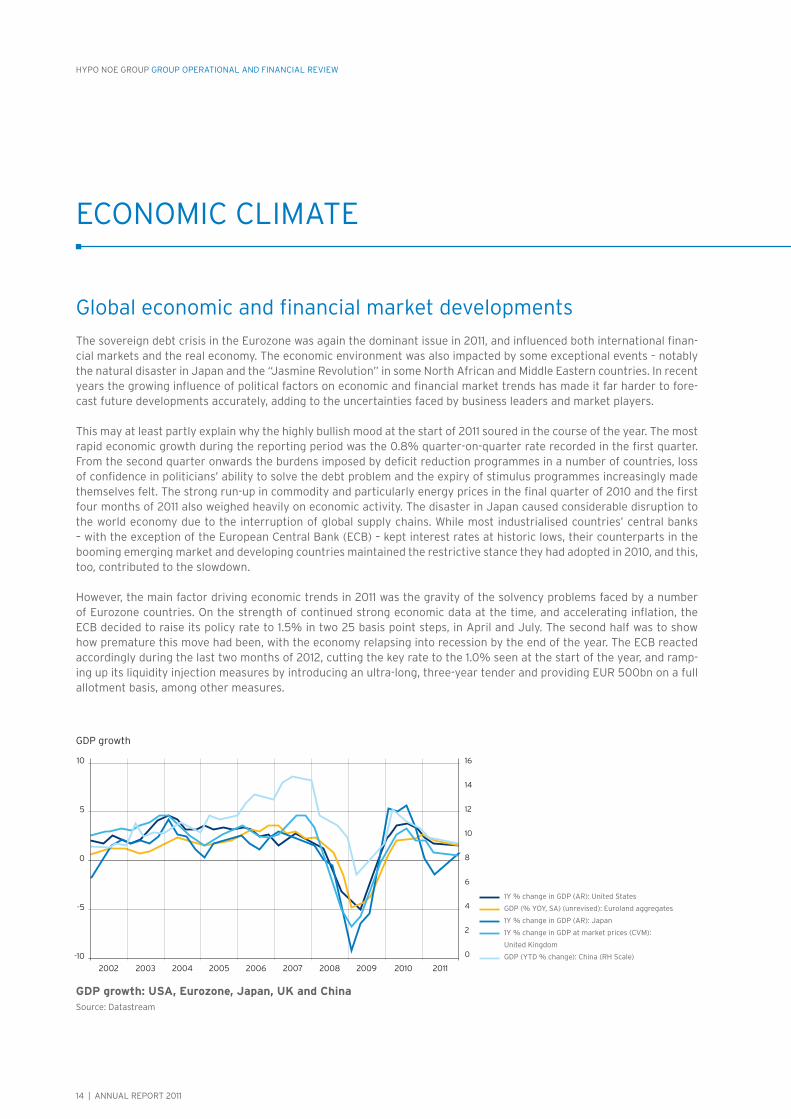
1Y % change in GDP (AR): United States
GDP (% YOY, SA) (unrevised): Euroland aggregates
1Y % change in GDP (AR): Japan
1Y % change in GDP at market prices (CVM):
United Kingdom
GDP (YTD % change): China (RH Scale)
10
5
0
-5
-10
16
14
12
10
8
6
4
2
0
2002 2003 2004 2005 2006 2007 2008 2009 2010 2011
GDP growth
HYPO NOE GROUP GROUP OPERATIONAL AND FINANCIAL REVIEW
ECONOMIC CLIMATE
Global economic and financial market developments
The sovereign debt crisis in the Eurozone was again the dominant issue in 2011, and influenced both international finan-cial markets and the real economy. The economic environment was also impacted by some exceptional events – notably the natural disaster in Japan and the “Jasmine Revolution” in some North African and Middle Eastern countries. In recent years the growing influence of political factors on economic and financial market trends has made it far harder to fore-cast future developments accurately, adding to the uncertainties faced by business leaders and market players.
This may at least partly explain why the highly bullish mood at the start of 2011 soured in the course of the year. The most rapid economic growth during the reporting period was the 0.8% quarter-on-quarter rate recorded in the first quarter. From the second quarter onwards the burdens imposed by deficit reduction programmes in a number of countries, loss of confidence in politicians’ ability to solve the debt problem and the expiry of stimulus programmes increasingly made themselves felt. The strong run-up in commodity and particularly energy prices in the final quarter of 2010 and the first four months of 2011 also weighed heavily on economic activity. The disaster in Japan caused considerable disruption to the world economy due to the interruption of global supply chains. While most industrialised countries’ central banks – with the exception of the European Central Bank (ECB) – kept interest rates at historic lows, their counterparts in the booming emerging market and developing countries maintained the restrictive stance they had adopted in 2010, and this, too, contributed to the slowdown.
However, the main factor driving economic trends in 2011 was the gravity of the solvency problems faced by a number of Eurozone countries. On the strength of continued strong economic data at the time, and accelerating inflation, the ECB decided to raise its policy rate to 1.5% in two 25 basis point steps, in April and July. The second half was to show how premature this move had been, with the economy relapsing into recession by the end of the year. The ECB reacted accordingly during the last two months of 2012, cutting the key rate to the 1.0% seen at the start of the year, and ramp-ing up its liquidity injection measures by introducing an ultra-long, three-year tender and providing EUR 500bn on a full allotment basis, among other measures.
GDP growth: USA, Eurozone, Japan, UK and China Source: Datastream

ANNUAL REPORT 2011 | 15
HYPO NOE GROUP GROUP OPERATIONAL AND FINANCIAL REVIEW
The bond market
The bond market moved in contrary directions in the two halves of the reporting period. While interest rates trended sharply upwards across all maturities in the first half of the year, yields slumped in the second half. Optimism on eco-nomic growth and gathering inflation fears held sway in the first six months. Both were supported by hard economic data, and as a result the ECB raised interest rates by 25 basis points in April. A second increase of equal size followed in July, although by then the sovereign debt crisis was already escalating dangerously. The mounting difficulties of south Euro-pean EU member states sent yields into reverse, and by year end they were back to the historic lows of 2010. This trend was accompanied by growing expectations that the Eurozone would slide into recession by the turn of 2011/2012. During the latter part of the year attention shifted away from inflation, although the inflation rate reached the year’s high during this period. In the autumn capital market players began to act on the assumption that key interest rates would fall – an expectation that was fulfilled by the ECB when it cut its main refinancing rate by a total of 50 basis points in November and December. The expansionary monetary policy pursued by the ECB of late has been accompanied by measures to boost liquidity including the reintroduction of long-term refinancing operations to assist commercial banks. For the first time in its history the ECB has conducted three-year tenders with full allotment.
Credit spread movements were almost entirely at the mercy of the Eurozone sovereign debt crisis. The lessons learned in 2010 were confirmed, and corporate bonds again held up better than bank paper during the reporting period. Spreads on corporate bonds issued by borrowers in peripheral countries were considerably wider than those on paper from issuers in core EU or non-EU countries.
Austria
Belgium
Ireland
Finland
France
Italy
Spain
Netherlands
900
800
700
600
500
400
300
200
100
0
-100
30.6.2011 31.7.2011 31.8.2011 30.9.2011 31.10.2011 30.11.2011 31.12.2011
Asset swap spreads on selected Eurozone sovereign bondsMaturing in approx. 5 years
Relative interest rate trendsSource: Bloomberg
16 | ANNUAL REPORT 2011
HYPO NOE GROUP GROUP OPERATIONAL AND FINANCIAL REVIEW
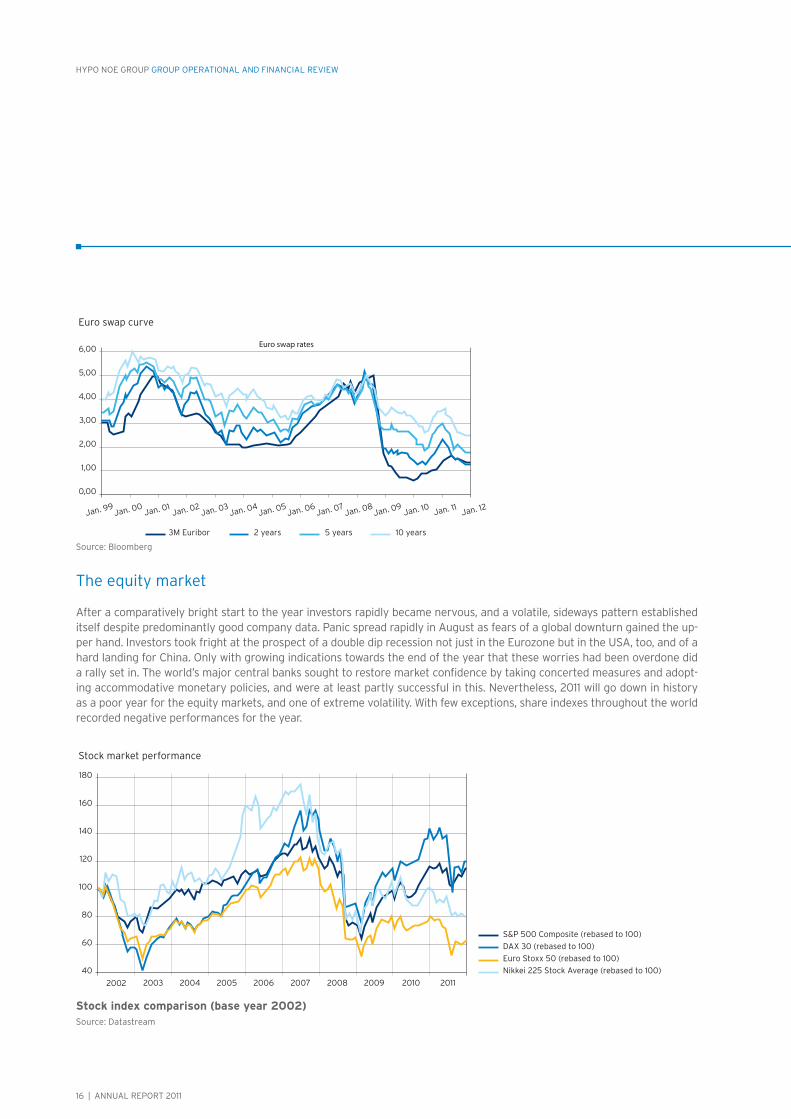
The equity market
After a comparatively bright start to the year investors rapidly became nervous, and a volatile, sideways pattern established itself despite predominantly good company data. Panic spread rapidly in August as fears of a global downturn gained the up-per hand. Investors took fright at the prospect of a double dip recession not just in the Eurozone but in the USA, too, and of a hard landing for China. Only with growing indications towards the end of the year that these worries had been overdone did a rally set in. The world’s major central banks sought to restore market confidence by taking concerted measures and adopt-ing accommodative monetary policies, and were at least partly successful in this. Nevertheless, 2011 will go down in history as a poor year for the equity markets, and one of extreme volatility. With few exceptions, share indexes throughout the world recorded negative performances for the year.
6,00
5,00
4,00
3,00
2,00
1,00
0,00
Euro swap rates
3M Euribor 2 years 5 years 10 years
Jan. 99Jan. 00
Jan. 01Jan. 02
Jan. 03Jan. 04
Jan. 05Jan. 06
Jan. 07Jan. 08
Jan. 09Jan. 10 Jan. 11 Jan. 12
Euro swap curve
S&P 500 Composite (rebased to 100)
DAX 30 (rebased to 100)
Euro Stoxx 50 (rebased to 100)
Nikkei 225 Stock Average (rebased to 100)
180
160
140
120
100
80
60
40
2002 2003 2004 2005 2006 2007 2008 2009 2010 2011
Stock market performance
Stock index comparison (base year 2002)Source: Datastream
Source: Bloomberg
ANNUAL REPORT 2011 | 17
HYPO NOE GROUP GROUP OPERATIONAL AND FINANCIAL REVIEW
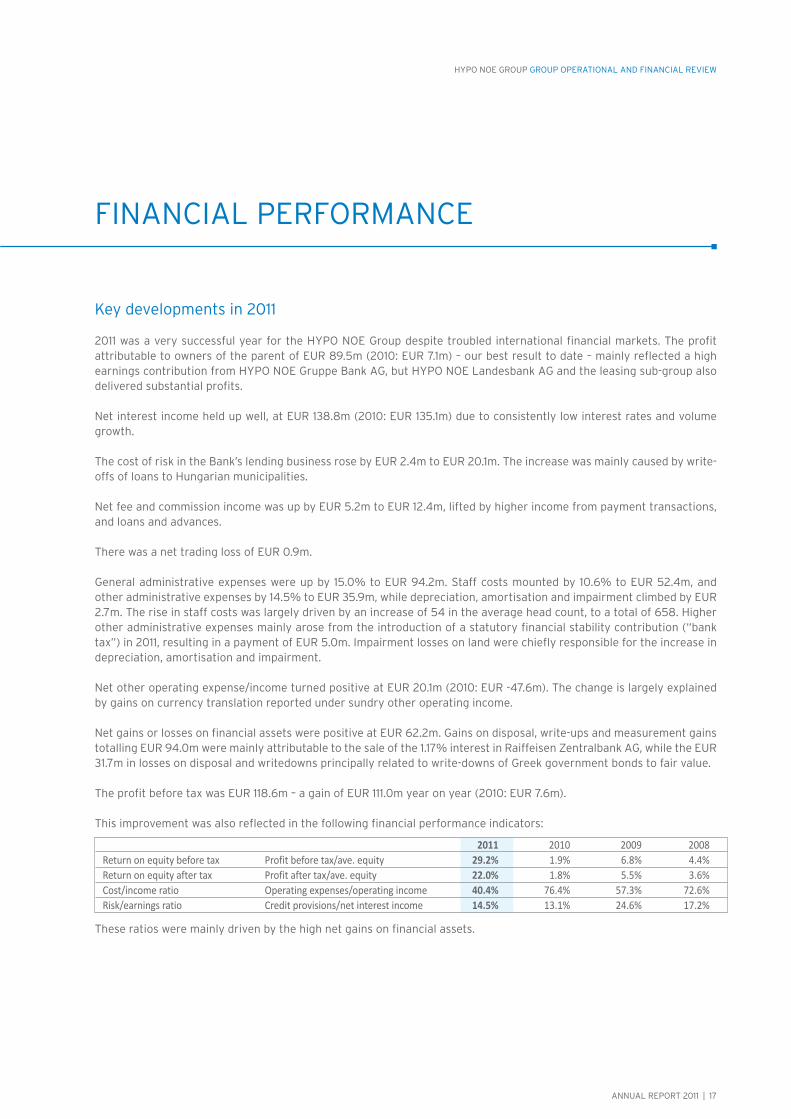
Key developments in 2011
2011 was a very successful year for the HYPO NOE Group despite troubled international financial markets. The profit attributable to owners of the parent of EUR 89.5m (2010: EUR 7.1m) – our best result to date – mainly reflected a high earnings contribution from HYPO NOE Gruppe Bank AG, but HYPO NOE Landesbank AG and the leasing sub-group also delivered substantial profits.
Net interest income held up well, at EUR 138.8m (2010: EUR 135.1m) due to consistently low interest rates and volume growth.
The cost of risk in the Bank’s lending business rose by EUR 2.4m to EUR 20.1m. The increase was mainly caused by write-offs of loans to Hungarian municipalities.
Net fee and commission income was up by EUR 5.2m to EUR 12.4m, lifted by higher income from payment transactions, and loans and advances.
There was a net trading loss of EUR 0.9m.
General administrative expenses were up by 15.0% to EUR 94.2m. Staff costs mounted by 10.6% to EUR 52.4m, and other administrative expenses by 14.5% to EUR 35.9m, while depreciation, amortisation and impairment climbed by EUR 2.7m. The rise in staff costs was largely driven by an increase of 54 in the average head count, to a total of 658. Higher other administrative expenses mainly arose from the introduction of a statutory financial stability contribution (“bank tax”) in 2011, resulting in a payment of EUR 5.0m. Impairment losses on land were chiefly responsible for the increase in depreciation, amortisation and impairment.
Net other operating expense/income turned positive at EUR 20.1m (2010: EUR -47.6m). The change is largely explained by gains on currency translation reported under sundry other operating income.
Net gains or losses on financial assets were positive at EUR 62.2m. Gains on disposal, write-ups and measurement gains totalling EUR 94.0m were mainly attributable to the sale of the 1.17% interest in Raiffeisen Zentralbank AG, while the EUR 31.7m in losses on disposal and writedowns principally related to write-downs of Greek government bonds to fair value.
The profit before tax was EUR 118.6m – a gain of EUR 111.0m year on year (2010: EUR 7.6m).
FINANCIAL PERFORMANCE
This improvement was also reflected in the following financial performance indicators:
These ratios were mainly driven by the high net gains on financial assets.
2011 2010 2009 2008 Return on equity before tax Profit before tax/ave. equity 29.2% 1.9% 6.8% 4.4% Return on equity after tax Profit after tax/ave. equity 22.0% 1.8% 5.5% 3.6% Cost/income ratio Operating expenses/operating income 40.4% 76.4% 57.3% 72.6% Risk/earnings ratio Credit provisions/net interest income 14.5% 13.1% 24.6% 17.2%
18 | ANNUAL REPORT 2011
HYPO NOE GROUP GROUP OPERATIONAL AND FINANCIAL REVIEW
Assets and liabilities
The Group’s total assets grew by EUR 1.2bn or 10.2% year on year to stand at EUR 13.2bn as at the end of the reporting period, due to increases of EUR 0.8bn in loans and advances to customers and EUR 0.2bn in loans and advances to banks.
On the liabilities side of the balance sheet, debts evidenced by certificates were up by EUR 0.9bn, and deposits from customers by EUR 0.1bn. Deposits from banks fell by EUR 0.2bn.
Equity (IFRS)
IFRS consolidated equity including non-controlling interests was EU 431.1m – up by EUR 48.6m on 31 December 2010, largely as a result of the high profit for the year, which more than offset the increase in the AFS reserve for remeasure-ment of financial assets to fair value.
Equity (Austrian Banking Act)
Consolidated eligible capital as defined by the Austrian Banking Act was EUR 689.4m as at 31 December 2011 (2010: EUR 682.3m). Surplus capital was EUR 373.9m (2010: EUR 347.9m), compared to a capital requirement of EUR 315.5m (2010: EUR 334.4m). The core capital ratio stood at 13.25% (2010: 11.47%), and the equity ratio was 18.79% (2010: 17.30%).
ANNUAL REPORT 2011 | 19
HYPO NOE GROUP GROUP OPERATIONAL AND FINANCIAL REVIEW
Gruppe Bank segment
Public Finance
Our Public Finance Department partners local and regional authorities, and public agencies, as well as infrastructure com-panies. The Public Finance team specialises in helping district and municipal councils, and state governments with all as-pects of their finances, working in tandem with HYPO NOE Landesbank.
The department’s stated aim is to provide a one-stop-shop for public sector construction, and this is reflected in the activities of its experts. An extensive product range, from medium and long-term loans through to bonds, purchase of receivables, and sale and leaseback arrangements enables it come up with ideal solutions for its clients. In 2011 there was also an increased call for alternative financing models due to the budget constraints faced by state governments and local authorities.
For instance, we succeeded in arranging public private partnerships for a variety of major healthcare and road projects. Operations in 2011 focused on the following areas of business:
Public finance Local publicly and semi-publicly owned businesses, and regional and local authorities and public agencies Project example: Krems an der Donau Riverboat Terminal and World Heritage Centre
Hard infrastructure Public transport and transport infrastructure Water supply, and wastewater and waste disposal infrastructure, and other municipal services,
e.g. development of sections of municipal utility networks Energy infrastructure and environmental projects
Project example: Eichgraben Municipal Centre
Social infrastructure Finance for investment in the healthcare sector: hospitals, and care and social facilities
Project example: Zwettl clinic Public buildings: schools, universities, student hostels, museums and sports facilities
In 2011 the Public Finance team collaborated with group companies HYPO NOE Real Consult GmbH and HYPO NOE Leas-ing GmbH, and external strategic partners on bespoke financing solutions for projects of this kind. This enabled us to ce-ment existing client relationships and open up new customer segments. The HYPO NOE Group’s strong capital resources provide a solid foundation for the Bank to excel as an expert financing partner.
During the reporting period, total lending by our Public Finance Department rose by 12.6% to EUR 5,083.2m (2010: EUR 4,512.5m).
HYPO NOE Gruppe Bank will continue to focus on financial stability and dependability. In 2012 we will be looking to extend the progress made in 2011 whilst taking care not to overreach ourselves in the current adverse economic environment. Our relationships with construction groups and the operators of public infrastructure will again play a key role.
In international public financing activities, notable progress was made in expanding our portfolio without compromising quality. We stepped up our cooperation with multilateral financial institutions and development banks, such as Oesterrei-chische Kontrollbank (OeKB), Kreditanstalt für Wiederaufbau (KfW), the European Investment Bank (EIB), the European
OPERATIONAL PERFORMANCE

20 | ANNUAL REPORT 2011
HYPO NOE GROUP GROUP OPERATIONAL AND FINANCIAL REVIEW
Bank for Reconstruction and Development (EBRD), and arms of the World Bank Group including the Multilateral Invest-ment Guarantee Agency (MIGA). Strategically, we will continue to focus on the extended Danube region; HYPO NOE Gruppe Bank already operates representative offices in the Czech Republic and Hungary.
Real Estate Finance
In 2011, we maintained our strategic focus on the extended Danube region, financing large-scale commercial projects in Austria, the Czech Republic, Germany and Slovakia. We also provided support to all of the Group’s customers in other European markets, helping them to execute a number of successful ventures, such as the acquisition of a retail portfolio in Poland.
The appointment of a head of Group Real Estate Business in 2011 was a big step forward for our efforts to capitalise on synergies in this area. The year also saw the formation of a number of new real estate subsidiaries. All the real estate projects and financing activities are now handled by a single department, and looked after by staff the relevant specialist expertise.
The Real Estate Finance business model is based on the office, shopping centre, retail park, logistics facility and city hotel asset classes, and on relatively conservative lending terms. The key product used to fund these projects is conventional loan finance. The department works with Group Treasury to offer clients interest rate hedging instruments such as swaps and caps.
In 2012, we will continue to follow our policy of only executing projects that offer an adequate return on risk-adjusted capital (RORAC) and return on equity (ROE), and are undertaken with tried and trusted partners. The geographical focus remains on the Danube region and selected EU member states neighbouring Austria.
Corporate & Project Finance
In the second half of 2011 customer service, and our corporate and project finance expertise in Austria and core foreign markets were combined in a new department. The departmental merger will allow us to build on the good work done in the past, and to leverage synergies for our customers.
Corporate & Project Finance is committed to selective, risk-averse, profitable growth in Austria and abroad, and to provid-ing comprehensive services for its existing customer portfolio. These will continue to be the priorities in 2012.
Our Austrian home market, and in particular Lower Austria, is central to the department’s Danube region strategy, and a highly selective approach will be taken to transactions in other, high potential markets.
Corporate & Project Finance concentrates on the Austrian market, and especially flagship companies in Lower Austria. In other Danube region countries the focus is on transactions related to project finance for hard infrastructure and renewable energy. For some time now the department has specialised in funding wind farm and photovoltaic projects. Biomass and biogas energy play a very limited role due to the additional risks associated with the availability of feedstock. All of our activities in the renewable energy sector are concentrated on markets within the Danube region, where feed-in compensation schemes are in place. In order to be able to create optimum financing solutions for all its clients, the department maintains close relationships with financial institutions and export credit agencies that specialise in serving the sectors concerned.
Thanks to the expertise it has built up in corporate and project finance it can now also engage in loan syndication.

ANNUAL REPORT 2011 | 21
HYPO NOE GROUP GROUP OPERATIONAL AND FINANCIAL REVIEW
It aims to offer all its customers bespoke finance solutions for their investments, both in the corporate and the project finance segment. The HYPO NOE Group regards itself as an expert partner in investment matters.
The product portfolio across the entire financing spectrum has been widened accordingly, as has the expertise of our team. Our accumulated know-how, and our well established relationships with Austrian and international funding agencies and development banks, as well as our many contacts in the public sector, have played a key role in this.
In 2012 the Corporate & Project Finance team will remain a reliable and competent partner for clients across the Danube region. Expanding the department’s quality loan portfolio will lay the groundwork for deeper international customer relationships and cooperation with international lenders.
Institutional Customers
In line with the Group’s customer driven strategy, our relationships with institutional customers were given a new or-ganisational framework in 2011. The goal is to offer comprehensive service with a single first point of contact for each customer. This will also make it easier to coordinate the activities abroad and develop this area of business in Austria, and new and existing foreign markets.
Last year the HYPO NOE Group successfully acted as a senior lead arranger and mandated lead arranger for transac-tions. Cooperation with multilateral lending institutions was stepped up in order to increase the range of refinancing options.
In 2012 the HYPO NOE Group will continue to systematically roll out its foreign market strategy and further fine tune services for institutional customers.
Treasury
Due to the turmoil on international financial markets liquidity and treasury management were pivotal to the Bank’s operations.
Another successful international market transaction gave the Bank a solid long-term liquidity base. The excellent take-up of a EUR 500m issue of three-year covered bonds, rated Aaa by Moody’s, was testament to the high level of interest from investors both in Austria and abroad. This well subscribed issue underlined the appeal of Austrian covered bonds in a volatile market environment. We were able to capitalise on this positive sentiment to generate more liquidity with private placements, mainly in the German speaking world. During the second half we introduced general collateral pooling, which offers significantly more attractive pricing than other options for short-term funding.
We pursued a strategy of cautious investment in our proprietary portfolio. The main focus was on covered bonds, which offer additional protection due to the cover funds, and are also a good way of improving liquidity ratios.
In 2012 there will again be a strong focus on maintaining long-term liquidity by means of covered bond issuance.
The capital market will continue to play a major role for us, but we will also tap alternative sources of finance. Given positive market sentiment, we plan to launch a benchmark-size covered bond issue in 2012. We also aim to broaden our investor base by increasing the number of visits to investors and presentations, in order to gain further traction for the Group’s private placements.

22 | ANNUAL REPORT 2011
HYPO NOE GROUP GROUP OPERATIONAL AND FINANCIAL REVIEW
ALM & Capital Management
In 2011 asset liability management was given an enhanced status by setting up the ALM & Capital Management Department.
The main focus of the department’s activities is on:
Actively managing the Bank-wide interest rate risk so as to improve the trade-off betweenreturn on equity and overall risk; and
Optimising the use of equity – a scarce resource – by promoting the transactions that offer the best risk/return balance.
A consistently applied benchmark rate system for the market prices of instruments with matching maturities ensures that risks are correctly allocated to market units, and the overall maturity structure is explicitly presented.
In the first half of 2011, we took advantage of higher interest rates to selectively increase our exposure to interest rate risk, and in the second half we were able to use a variety of hedges to lock in satisfactory margins. Active management of interest rate risk made a significant positive contribution to the Bank’s overall results.
Derivative financial instruments are used – mainly as hedges – to manage interest risk and the structure of the balance sheet.
The interest rate risk is low relative to regulatory requirements (maximum of 20% of eligible capital).
Public Loan Management
The Lower Austrian state government extends preferential loans to residents and businesses. HYPO NOE Gruppe Bank is the first point of contact for recipients of Lower Austrian subsidies with queries about account administration, account balances and repayments. It provides Lower Austrian owner-builders and the many housing cooperatives in the province with cheap and efficient loan management services. This includes sending them account information, instalment schedules and confirmations of payments from the tax authorities every year. Construction of a website for borrowers is currently under way. From 2013 on they will have convenient online access to account information and tax office confirmations going back several years. This will contribute to sustainable business practices by saving paper and the resources consumed by postal distribution, without reducing the level of service we provide. Alongside the correspondence that is sent out automatically, customer queries are answered individually by the customer adviser team at HYPO NOE Gruppe Bank.
The number of loan applications processed for the Lower Austrian state government rose again in 2011, and we now ad-minister almost 300,000 direct loans with a total value of over EUR 6bn. The rest of the loans administered by us were from other state government funds, such as the Lower Austrian economic and tourism, school and kindergarten, water management and agricultural support funds.
HYPO NOE Gruppe Bank also maintains the accounts for many Lower Austrian state government grants, including those related to environmental protection, schools and kindergartens.
The Bank assists with a variety of state government home construction transactions, preparing detailed breakdowns of the existing loan portfolio, providing outsourced data processing, and generating analyses of the payment flows from individual loan tranches and deviations from the original repayment plans as part of its regular reporting to the inves-tors. We expect to provide further services in this area in the coming years as part of a number of planned transactions.
ANNUAL REPORT 2011 | 23
HYPO NOE GROUP GROUP OPERATIONAL AND FINANCIAL REVIEW
Participations
HYPO NOE Gruppe Bank manages and coordinates the Group’s equity investments. 2011 was a year of restructur-ing and other organisational measures. The investments were grouped in “clusters”, according to their strategic significance. The core associates are banking or financial services companies, and as such are integral to HYPO NOE Gruppe Bank’s operations. They make up the central cluster, and almost all are consolidated. The rest of the Group’s holdings are divided into the five other clusters: non-core banking and financial services investments; prop-erty management and real estate project companies; vehicles that are related to the Hypo banking sector or fulfil service functions for the Bank; investments related to the Bank’s role as the Lower Austrian state bank; and leasing companies. A manager from HYPO NOE Gruppe Bank is assigned to each core investment, acting as the link with the rest of the organisation.
One of the key events of the reporting period was the conclusion of a put option contract for the sale of our 25% interest in HYPO Capital Management AG. Following this, HYPO NOE Gruppe Bank sold its 1.17% interest in Raiffeisen Zentralbank Österreich AG (RZB) to existing RZB core shareholders.
Foreign branches
HYPO NOE Gruppe Bank AG had no foreign branches in 2011.
Branch offices
HYPO NOE Gruppe Bank AG has operated a branch office at Wipplingerstrasse 4, 1010 Vienna since 2008.

24 | ANNUAL REPORT 2011
HYPO NOE GROUP GROUP OPERATIONAL AND FINANCIAL REVIEW
Landesbank segment
HYPO NOE Landesbank AG
For retail and business customers and professionals in its core markets – Lower Austria and Vienna – HYPO NOE Landes-bank AG is a financially sound partner that knows its business. The bank focuses on finance for residential building, SMEs and the premium banking segment. Both loans and advances to customers and deposits from customers grew in the reporting period. The marginal decline in total assets to EUR 2.33bn (2010: EUR 2.34bn) was due to a reduction in interbank business, and loans and advances to customers climbed by 2.3% year on year. A large part of this lending was to private customers and professionals, who accounted for EUR 898.2m or 45.9% of all lending. Business customers (including home construction companies and housing associations) are another major source of lending business. HYPO NOE Landesbank is an important partner for small and medium-sized enterprises, and builders, and this area of business generated 3.7% lending growth and 54.1% of total loans and advances to customers in 2011.
Deposits from customers grew by 0.8% in the reporting period, to reach EUR 1.15bn. This reflected year-on-year increas-es of 0.6% and 1.1%, respectively, in savings deposits and current account deposits.
Debts evidenced by certificates rose by EUR 51.5m or 14.6% year on year (2010: 352.1m). Due to the current yield situ-ation, with wide spreads between short and long-term interest rates, we were able to place short-term covered bonds. These were generally preferred to housing bonds, which tend to have longer maturities.
The EUR 1.62m drop in net interest income resulted from the reclassification of some sub-items to net fee and commis-sion income.
The success of the bank’s workout management activities is demonstrated by the sharp fall in impairments. As a result credit provisions were down by EUR 9.16m year on year.
HYPO NOE Landesbank stands for traditional values, stability and expertise. With HYPO NOE Gruppe Bank as its parent and the Lower Austrian state government as its owner, and with a management reinforced by the arrival of a second board member in mid-2011, the bank is well placed to nurture stable, long-term customer relationships. Experienced staff put together bespoke solutions designed to meet customers’ highest expectations. Sustainability, reliability, customer focus and decisiveness are central to the bank’s philosophy.
Leasing segment
HYPO NOE Leasing GmbH
HYPO NOE Leasing GmbH is the Group’s product subsidiary for innovative finance solutions, and in particular for leas-ing. This business expanded in 2011 thanks to the team’s specialist know-how. It focuses on lease financing for regional and local authorities, and public agencies, and its success in this area placed it on a still firmer footing. HYPO NOE Leasing is now the market leader in Austria, and wrote EUR 212m in real estate leasing and 42m in equipment leasing business in 2011.
The company’s work with NÖ Landeskliniken-Holding is an excellent example of how to build on an existing customer rela-tionship. In 2012 this client again charged HYPO NOE Leasing with structuring complex financial solutions for it.
ANNUAL REPORT 2011 | 25
HYPO NOE GROUP GROUP OPERATIONAL AND FINANCIAL REVIEW
During the year HYPO NOE Leasing designed specialised real estate and equipment lease structures as part of its product development responsibilities within the Group. Product development in 2011 also centred on leases combined with cost and completion date guarantees, and on energy efficient building. An example of a project in this area is the newly built Kindergarten im Stadtpark in Vienna.
Other segment
HYPO NOE Real Consult GmbH
HYPO NOE Real Consult GmbH has always concentrated on the Lower Austrian and Vienna markets.
Close cooperation with HYPO NOE Leasing, HYPO NOE Landesbank and HYPO NOE Gruppe Bank on lending, disposals and workout management continued in 2011.
Project management activities continued apace in 2011, with work commencing on many major construction projects and others topped out. Structural completions included the St. Pölten Stadium, the expansion of the IMC Krems campus, and a lab building at the Institute of Science and Technology (IST) Austria in Klosterneuburg.
Among the many examples of projects handed over on time and on budget and to excellent quality standards were: the University and Research Centre Tulln; the Schulzentrum Krems multi-school centre; the Norbertinum agricultural college in Tullnerbach; the Maria Enzersdorf child care centre; and the Krems World Heritage Centre.
The property management side of the business continued to grow. For example, the Lower Austrian state government awarded us the contract to manage the International Anti-Corruption Academy in Laxenburg.
In the autumn, Hausverwaltung Korneuburg awarded HYPO NOE Real Consult GmbH’s property management arm the contract to manage about 480 housing units from 1 January 2012 onwards. A field office has been set up for this purpose. The real estate companies continued to perform well in 2011, and results were ahead of expectations.
Feasibility studies were carried out for a large number of property development projects, and some are now at the execu-tion phase. These include developments in the Vienna’s 16th and 17th districts, the Quadrant in St. Pölten and a property on Obere Donaustrasse in Vienna’s second district.
There is also a pipeline of projects that are still at the appraisal stage.
Going forward, HYPO NOE Real Consult is in the running for contracts that will keep it busy for a long time to come if it wins them. There are also plans to expand HYPO NOE Real Consult’s role as a channel for disposing of property on behalf of other Group companies.

26 | ANNUAL REPORT 2011
HYPO NOE GROUP GROUP OPERATIONAL AND FINANCIAL REVIEW
HUMAN RESOURCES
In the current economic environment the central challenge for our HR management function is to support the contin-ued improvement in the Bank’s business performance. This includes optimising processes, and mounting training pro-grammes that further our people’s professional skills and personal development.
The strict legal and regulatory requirements to which the Bank is subject place heavy demands on both management and employees. The Bank’s attractiveness as a secure and reliable employer is important to recruitment, but matters still more in terms of retaining existing staff. This means that one of the HR team’s key tasks is to be a dependable partner for the Management Board, other executives and rank-and-file employees.
HR facts and figuresAt year end 2011 the HYPO NOE Group had 670 employees (end-2010: 640), of whom 36 were on parental leave. The workforce had 332 male and 338 female members (end-2010: 306 male and 334 female). In terms of full-time equivalents (FTE), there were 629.4 employees at year end (end-2010: 601.6). The head count falls to 586.1 FTE as at 31 December 2011 if non-active employees are excluded.
Six staff members were employed at our representative offices abroad (2010: seven). In 2011 a total of 106 vacancies were filled internally (2010: 132).
The table below shows changes in employee numbers over time.
Key: m = male, f = female, FTE = full time equivalent
HYPO NOE HYPO NOE HYPO NOE HYPO NOE HYPO NOE Gruppe Bank AG Landesbank AG Real Consult GmbH Leasing GmbH Group Total 152 341 22 29 544 Head count m 80 166 12 11 269 2008 f 72 175 10 18 275 FTE Total 146.7 319.5 20.7 26.1 513.0 Ave. Total 123.5 337.2 – 32.2 492.8 Total 174 359 39 32 604 Head count m 87 176 19 11 293 2009 f 87 183 20 21 311 FTE Total 168.3 336.9 32.9 29.7 567.8 Ave. Total 164.2 353.2 36.2 30.3 583.8 Total 241 324 41 34 640 Head count m 122 155 17 12 306 f 119 169 24 22 334 2010 Total 229.5 301.6 38.8 31.7 601.6 FTE m 119.2 153.4 16.6 12.0 301.2 f 110.3 148.2 22.2 19.7 300.4 Ave. Total 229.3 321.0 40.6 33.7 624.6 Total 268 326 43 33 670 Head count m 140 162 18 12 332 f 128 164 25 21 338 2011 Total 253.2 304.2 41.3 30.6 629.4 FTE m 135.2 161.4 18.0 12.0 326.6 f 118.0 142.8 23.3 18.6 302.7 Ave. Total 251.3 330.4 44.2 32.5 658.4
ANNUAL REPORT 2011 | 27
HYPO NOE GROUP GROUP OPERATIONAL AND FINANCIAL REVIEW
ReorganisationThe changes at Management Board level in 2011 also led to a major reorganisation and clearer lines of responsibility. The new reporting level of corporate coordinator was introduced to create Group-wide remits for certain strategic issues. Separate organisational units were set up for some special tasks.
The strategic realignment of HYPO NOE Landesbank, approved shortly before the end of the year, brought extensive organisational changes and a broad-based sales drive, both of which will also be major features of 2012.
Changes to the Bank’s remuneration policy to comply with the amendments to the Banking Act (transposition of CRD III) were implemented in 2011. The Supervisory Board established a Compensation Committee as required by the new legislation, and approved the principles of HYPO NOE Gruppe Bank’s remuneration policy and the guidelines for variable compensation for identified staff. A new performance review format aligned to the revised remuneration policy was also introduced.
We also updated the job profile template used at HYPO NOE Gruppe Bank AG to bring it into line with modern HR man-agement practices.
Staff developmentPersonal and professional development for executives and other staff members remains a high priority. 2011 saw the continuation of our established training programmes, as well as the launch of some new initiatives.
The Best of Leadership scheme, already in its third intake, is aimed at managers across the Group, and guides them through the challenges of taking up a new management position. Train the Trainer I and II, offering training in presenta-tion techniques, were developed in collaboration with HYPO Bildung. Alongside the many external seminars, a number of internal training courses were held on topics of special interest. The Group induction course, conducted by internal trainers, was again completed successfully by a substantial number of employees in 2011.
The Business Theater programme was immensely successful. Facilitated by professional actors, this involved all staff from the back office departments, who created and performed scenes exploring central concerns of the Group in the context of six corporate values. These events generated a number of suggestions which are already being actioned.
A further highlight of 2011 was the successful internal communication events that brought staff from different parts of the Group together.
OutlookFor the Human Resources team like the Bank as a whole, the focus in 2012 will be on optimising our activities. This will begin with standard customer satisfaction surveys across the Group, taking in both internal and external customers. These are aimed at enhancing quality and identifying areas of operations where improvements are needed.
A multi-stage leadership development programme is planned as a follow-up to the leadership forum. The main objective will be to work out a common management approach.
Drawing on the results of staff development reviews, employees, their line managers and HR will work together to map out development activities tailored to individual needs.
28 | ANNUAL REPORT 2011
HYPO NOE GROUP GROUP OPERATIONAL AND FINANCIAL REVIEW
RISK REPORT
The HYPO NOE Group defines risk as the possibility of unexpected, unfavourable future developments that could have adverse effects on the assets, earnings or liquidity of the Group or of individual Group companies.
All major business activities in pursuit of the Group’s corporate strategic goals are planned to reflect strategic risk considerations, with very close attention to risk bearing capacity. The Group attaches particular importance to ensur-ing that risks are incurred only where the potential rewards are commensurate. Risks are not ends in themselves; they are assumed in the interests of value creation, and may therefore only be incurred where risk bearing capacity is suf-ficient and the return on risk capital is adequate. The refinement of instruments and processes designed to maintain an appropriate balance of risks and rewards is integral to the Group’s long-term strategy.
The HYPO NOE Group also strives to maintain a healthy balance between risk bearing capacity and the risks incurred. The eligible risk coverage capital is very carefully defined, and the confidence level for risk quantification (i.e. the prob-ability of loss) is set at a conservative level.
The disclosure of risks is based on the Group’s internal risk management and risk reporting systems, and IFRS 7 Financial Instruments: Disclosures.
Risk management system
Achieving business success necessarily involves taking risks. The HYPO NOE Group practises active risk transformation – risks are incurred on the basis of considered decisions. The Group’s risk management objectives are to identify, quantify and ac-tively manage all types of banking risks (credit, interest rate, market, liquidity, operational and reputational risk).
Our organisational structure provides for a clear separation of the front and back office functions (four-eye principle) at every level up to the Management Board. The front office functions originate business and give initial clearance to transactions, while the back office functions cast a second vote (second opinion) that confers final approval. The unanimous approval of the front and back office functions is required for decisions going beyond the limits and collaterals established by staff members’ decision-making authorities. There is also a clearly defined process for the approval of exposures requiring resolutions of the Group Supervisory Board.
In principle, all quantifiable risks throughout the HYPO NOE Group are subject to the Group-wide, uniform limit system, which is constantly monitored. No risk may be assumed unless a corresponding limit is in place. The Group-wide risk reporting system ensures that reporting of all risks is regular, timely and comprehensive. In addition to the ICAAP report, which provides an ag-gregated summary of all risks and their capital coverage, the Management and Supervisory boards receive separate, regular risk reports for each risk category which provide comprehensive information on current risk developments.
The disclosures required by sections 26 and 26a Austrian Banking Act in conjunction with the OffV (the FMA Disclosure Order) are on a consolidated basis for the HYPO NOE Group, in a separate document posted on our corporate website.
The rules and procedures for introducing new areas of business or products, and entering new markets, require detailed analy-sis in advance of the relevant business risks. Without exception, transactions entailing risks are only permitted if the risks are explicitly covered and authorised in the Group’s risk documentation. We normally restrict our exposures to areas in which we have the necessary expertise to assess and manage the specific risks involved.
ANNUAL REPORT 2011 | 29
HYPO NOE GROUP GROUP OPERATIONAL AND FINANCIAL REVIEW
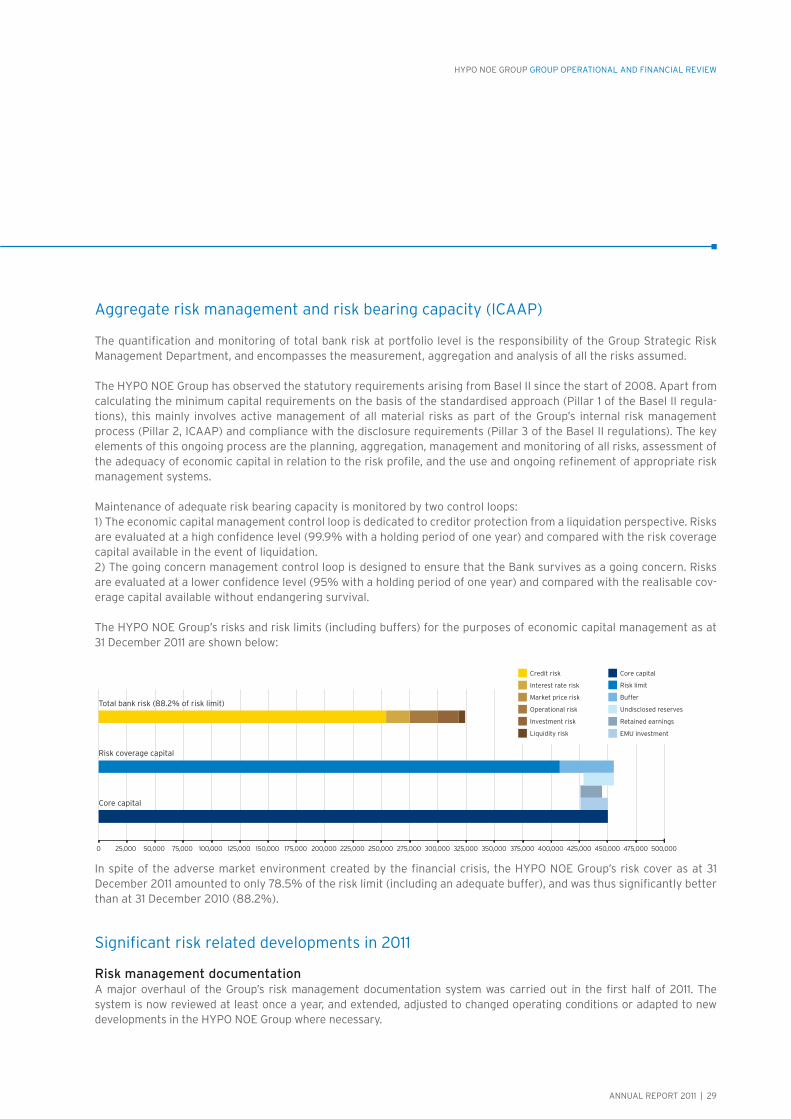
Aggregate risk management and risk bearing capacity (ICAAP)
The quantification and monitoring of total bank risk at portfolio level is the responsibility of the Group Strategic Risk Management Department, and encompasses the measurement, aggregation and analysis of all the risks assumed.
The HYPO NOE Group has observed the statutory requirements arising from Basel II since the start of 2008. Apart from calculating the minimum capital requirements on the basis of the standardised approach (Pillar 1 of the Basel II regula-tions), this mainly involves active management of all material risks as part of the Group’s internal risk management process (Pillar 2, ICAAP) and compliance with the disclosure requirements (Pillar 3 of the Basel II regulations). The key elements of this ongoing process are the planning, aggregation, management and monitoring of all risks, assessment of the adequacy of economic capital in relation to the risk profile, and the use and ongoing refinement of appropriate risk management systems.
Maintenance of adequate risk bearing capacity is monitored by two control loops:1) The economic capital management control loop is dedicated to creditor protection from a liquidation perspective. Risks are evaluated at a high confidence level (99.9% with a holding period of one year) and compared with the risk coverage capital available in the event of liquidation.2) The going concern management control loop is designed to ensure that the Bank survives as a going concern. Risks are evaluated at a lower confidence level (95% with a holding period of one year) and compared with the realisable cov-erage capital available without endangering survival.
The HYPO NOE Group’s risks and risk limits (including buffers) for the purposes of economic capital management as at 31 December 2011 are shown below:
In spite of the adverse market environment created by the financial crisis, the HYPO NOE Group’s risk cover as at 31 December 2011 amounted to only 78.5% of the risk limit (including an adequate buffer), and was thus significantly better than at 31 December 2010 (88.2%).
Significant risk related developments in 2011
Risk management documentationA major overhaul of the Group’s risk management documentation system was carried out in the first half of 2011. The system is now reviewed at least once a year, and extended, adjusted to changed operating conditions or adapted to new developments in the HYPO NOE Group where necessary.
Risk coverage capital
Core capital
Total bank risk (88.2% of risk limit)
0 25,000 50,000 75,000 100,000 125,000 150,000 175,000 200,000 225,000 250,000 275,000 300,000 325,000 350,000 375,000 400,000 425,000 450,000 475,000 500,000
Interest rate risk
Market price risk
Operational risk
Credit risk
Investment risk
Buffer
Undisclosed reserves
Retained earnings
Risk limit
EMU investment
Core capital
Liquidity risk
30 | ANNUAL REPORT 2011
HYPO NOE GROUP GROUP OPERATIONAL AND FINANCIAL REVIEW
Bank-wide stress testingThe annual internal bank-wide stress test, carried out in consultation with the risk management and portfolio manage-ment functions during the first half of 2011, began with a wide-ranging economic analysis, and went on to map out sce-narios relevant to the Group’s business model (e.g. a government solvency crisis), and simulate their impact on credit, in-vestment, interest rate and liquidity risk, at subsidiary and Group level, in terms of regulatory and economic risk-bearing capacity. The results were presented to management.
Exposure to PIIGS*, Cyprus and HungaryDue to the Greek crisis the HYPO NOE Group is keeping a particularly close watch on developments in the Eurozone peripherals, and strict risk guidelines have been established for investments in these countries. The Group’s exposure to borrowers in Greece, Ireland and Portugal did not increase in 2011. The Group reduced its exposure to Greece to a nominal EUR 30m. There is also an exposure to Portugal in the shape of bond holdings with a nominal value of EUR 5m. In addition, there is an outstanding loan to a Greek local authority in an amount of EUR 10m, for which provision has likewise been made. The Group’s holdings of Greek and Portuguese government bonds are classified as available for sale, and were therefore remeasured to fair value as at year end 2011.
There are no plans to increase our existing exposures to the PIIGS countries, Cyprus and Hungary, and all of these coun-tries are blacklisted by our risk management system.
Basel IIIWe have made an early start to preparations for Basel III, and thorough examination of the issues raised by it is a top priority. In 2011 the focus was on compliance with the regulatory changes brought by CRD III, including the new rules on remuneration policies and practices. In addition, we evaluated the planned liquidity ratios and capital buffers, as well as the potential impact of CRD IV – particularly with regard to equity components and solvency.
Credit riskCredit risk continues to reflect an increase in the probability of default by borrowers, particularly on the part of small and medium-sized businesses, and private customers.
As part of a project in 2011, the theoretical and technical requirements for the introduction of the F-IRB approach in the HYPO NOE Group in the medium term were evaluated, a system designed and the first steps taken towards introducing it. This decision was prompted by the need to achieve a uniform Group-wide approach and savings in regulatory capital requirements, and to improve credit risk management, as well as overall internal control and the associated processes.
Augustus Funding LimitedAt the instigation of the income noteholder and in conjunction with the contractual partners, in the first quarter of 2011 all of Augustus’ remaining liabilities (both senior and mezzanine financing) were retransferred to HYPO NOE Gruppe Bank without loss, in compliance with the terms (waterfall principle). HYPO NOE Gruppe Bank incurred no resultant losses in 2011.
Reputational riskTowards the end of 2010 a project was initiated to integrate issues relating to reputational risk more fully with our busi-ness processes. The work will be completed in the first half of 2012.
*Portugal, Ireland, Italy, Greece and Spain
ANNUAL REPORT 2011 | 31
HYPO NOE GROUP GROUP OPERATIONAL AND FINANCIAL REVIEW
Outlook for 2012The Bank’s business performance in the first quarter of 2012 demonstrates the wisdom of the long-term strategic fo-cus on acting as a specialist public finance and real estate lender, and financial service provider. The approach to new exposures will continue to be highly selective and attuned to the Group’s risk bearing capacity.
Basel IIIThe main emphasis of Basel III related activities was on timely analysis of the potential impact of CRD IV, CRR I and the many EBA guidelines.
IFRS 9International Financial Reporting Standard 9 Financial Instruments will replace the current standard, IAS 39 Financial Instruments: Recognition and Measurement. A project was launched in 2011 to ensure that consideration was given to all the issues raised by the new standard.
Credit riskContinued refinement of the Group’s credit risk management system is seen as a long-term growth driver. It includes im-proving organisational processes for the management of risk (watchlist and continuous evaluation of provisions), tighter monitoring, and active portfolio management (risk transfer and use of modern risk management techniques).
Central near-term challenges with regard to credit risk will be the financial crisis and its impact on the Eurozone peripherals, as well as default probability trends. Both higher risk provisions (increase in expected losses) and a rise in credit value at risk (unexpected loss) are to be expected. This has been taken into account in the budgetary plan-ning process and, on the basis of an economic analysis, a conservative rating migration of existing customers and lower credit ratings for potential borrowers than in past years have been assumed. The Bank’s risk bearing capacity has been calculated on the basis of these conservative assumptions. The monthly ICAAP and credit risk reporting analyse the changes in borrowers’ credit ratings in the course of the year as a result of technical recalibration or migration.
Liquidity riskThe central liquidity management issues in 2012 will be: achieving compliance with the new supervisory review requirements; acting to meet the LCR and NSFR requirements; making previously fallow Group liquidity reserves marketable; and refining the liquidity and cost of liquidity models.
Risk management systemsIn 2012 we will again be investing large amounts in IT infrastructure, as well as process, methodology and staff develop-ment, in order to ensure that our risk control systems remain compatible with the authorised levels of risk tolerance and our business objectives.
Credit risk
Credit risk is the risk of a deterioration in creditworthiness, and ultimately the risk of default by a counterparty. Credit risks are of various different types, depending on the products involved: loans involve classic credit risk, derivatives counterparty risk, and securities issuer risk. Credit risk also includes investment risks.
The HYPO NOE Group calculates regulatory capital for credit risks using the standardised approach required by section 22a Banking Act, and the “simple” credit risk mitigation method.
32 | ANNUAL REPORT 2011
HYPO NOE GROUP GROUP OPERATIONAL AND FINANCIAL REVIEW
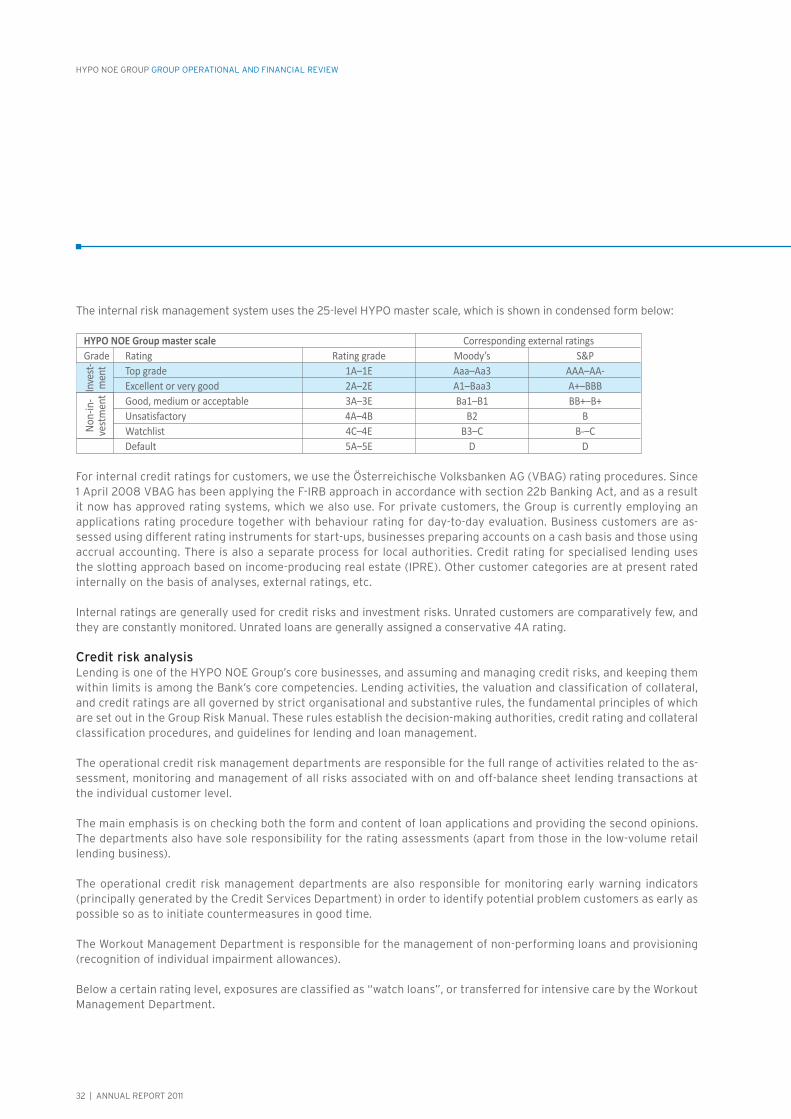
The internal risk management system uses the 25-level HYPO master scale, which is shown in condensed form below:
For internal credit ratings for customers, we use the Österreichische Volksbanken AG (VBAG) rating procedures. Since 1 April 2008 VBAG has been applying the F-IRB approach in accordance with section 22b Banking Act, and as a result it now has approved rating systems, which we also use. For private customers, the Group is currently employing an applications rating procedure together with behaviour rating for day-to-day evaluation. Business customers are as-sessed using different rating instruments for start-ups, businesses preparing accounts on a cash basis and those using accrual accounting. There is also a separate process for local authorities. Credit rating for specialised lending uses the slotting approach based on income-producing real estate (IPRE). Other customer categories are at present rated internally on the basis of analyses, external ratings, etc.
Internal ratings are generally used for credit risks and investment risks. Unrated customers are comparatively few, and they are constantly monitored. Unrated loans are generally assigned a conservative 4A rating.
Credit risk analysisLending is one of the HYPO NOE Group’s core businesses, and assuming and managing credit risks, and keeping them within limits is among the Bank’s core competencies. Lending activities, the valuation and classification of collateral, and credit ratings are all governed by strict organisational and substantive rules, the fundamental principles of which are set out in the Group Risk Manual. These rules establish the decision-making authorities, credit rating and collateral classification procedures, and guidelines for lending and loan management.
The operational credit risk management departments are responsible for the full range of activities related to the as-sessment, monitoring and management of all risks associated with on and off-balance sheet lending transactions at the individual customer level.
The main emphasis is on checking both the form and content of loan applications and providing the second opinions. The departments also have sole responsibility for the rating assessments (apart from those in the low-volume retail lending business).
The operational credit risk management departments are also responsible for monitoring early warning indicators (principally generated by the Credit Services Department) in order to identify potential problem customers as early as possible so as to initiate countermeasures in good time.
The Workout Management Department is responsible for the management of non-performing loans and provisioning (recognition of individual impairment allowances).
Below a certain rating level, exposures are classified as “watch loans”, or transferred for intensive care by the Workout Management Department.
HYPO NOE Group master scale Corresponding external ratings Grade Rating Rating grade Moody’s S&P Top grade 1A–1E Aaa–Aa3 AAA–AA- Excellent or very good 2A–2E A1–Baa3 A+–BBB Good, medium or acceptable 3A–3E Ba1–B1 BB+–B+ Unsatisfactory 4A–4B B2 B Watchlist 4C–4E B3–C B-–C Default 5A–5E D D
Inve
st-m
ent
Non-
in-
vest
men
t
ANNUAL REPORT 2011 | 33
HYPO NOE GROUP GROUP OPERATIONAL AND FINANCIAL REVIEW
The HYPO NOE Group applies rigorous standards as to what constitutes default. All customers are immediately treated as in default if they meet one of the following criteria:
Substantial loan more than 90 days overdue (regulatory definition); Recognition of an individual impairment allowance, or non-recognition where there is adequate collateral; Credit rating related restructuring; Insolvency, composition and bankruptcy; Loan writedowns or write-offs.
Risk provisionsIndividual or collective impairment allowances are recognised for identifiable lending risks.
The individual impairment allowances are determined on the basis of an assessment of the customer’s financial situa-tion, taking into account the current valuations of collaterals, the repayment structure and maturities.
Future cash flows (anticipated repayments) are discounted using the original effective interest rate. If there are col-laterals for receivables (e.g. charges on real property or guarantees), the future cash flows from their recoverable amounts less the selling costs must be deducted when measuring the impairment loss (paragraph AG84 IAS 39). Since paragraph 63 IAS 39 requires measurement of an impairment loss to reflect the present value of estimated future cash flows and their expected maturities, all expected interest payments must also be included.
The Group recognises collective impairment allowances for reductions in the value of the lending portfolio (losses incurred but not reported) as at the end of the reporting period. It is assumed that there are incurred but unreported losses in respect of a given percentage of customers without default ratings at the end of the reporting period.
To calculate these risk provisions, all loan items affecting credit risk that are measured at amortised cost (loans and re-ceivables, and liabilities held to maturity), and all outstanding lending facilities and contingent liabilities are allocated either to HYPO NOE Gruppe Bank or to HYPO NOE Landesbank, in accordance with paragraph 64 IAS 39. The treat-ment of these provisions differentiates between the two banks, due to their varying risk profiles. Financial instruments that are not classified as held to maturity and derivatives do not form part of the calculations, as they are measured at fair value. Intra-group lending ist not included because of their elimination due to IFRS consolidation. Housing con-struction loans backed by the Lower Austrian state government are likewise excluded.
Quantitative estimation is based on the expected loss, taking into account: (a) the unsecured exposure net of the market value of any collateral; (b) the historical probability of default (PD), i.e. the results of backtesting the rating system; (c) the loss given default (LGD) ratios for the individual portfolios; and (d) the period of time between occurrence of the loss and its identification, i.e. the loss identification period (LIP). For reasons of prudence no cure factor is recognised.
The collective impairment allowance is calculated for loans and advances to banks and customers with internal ratings of 2A to 4E, using the HYPO NOE Group master scale referred to above. For 2011, the loss identification period was assumed to be four months for all loans.
The collective impairment allowance is calculated using the following formula:Collective impairment allowance = (exposure + 50% range – fair value of collaterals) * PD *
“Blanco” LGD * LIP
The collective impairment allowances are reported under “Risk provisions” on the assets side of the IFRS statement of financial position, and under “Credit provisions” on the equity and liabilities side.

34 | ANNUAL REPORT 2011
HYPO NOE GROUP GROUP OPERATIONAL AND FINANCIAL REVIEW
Credit risk monitoringThe Group Strategic Risk Management Department is responsible for monitoring credit risk at the portfolio level.Credit facilities for own investments, money market deposits and derivatives are submitted to the Supervisory Board for authorisation twice a year. Compliance with the limits imposed is monitored on an ongoing basis, and reports are regularly submitted to the Supervisory Board. Approval for such credit lines is chiefly requested for sovereigns, new business from Austrian and international banking groups with good investment grade ratings, or existing customers with good ratings defined by the above master scale.
As regards individual customers, risk monitoring is the responsibility of the operational credit risk management de-partment concerned, which verifies the credit ratings, monitors the blacklists drawn up by the Workout Management Department and processes loan applications potentially entailing significant risks. Where customers’ situations re-quire close observation, relationship managers are required to prepare reviews as necessary, and in all events at least once a year, irrespective of the amount of any liabilities and of the credit ratings. The reviews are submitted for the attention of the managers with the requisite decision-making authority. Customers giving cause for concern (where significant risk is involved) are monitored by the operational credit risk management departments. Where there is a significant deterioration in the risk situation, the exposures are transferred to the specialists in the Workout Manage-ment Department, who are not involved in front office approval.
Management is kept up to date with changes in credit risks by monthly credit risk reports, and regular or case-by-case reports on risk related issues (transfer of accounts to the collections function, overdraft trends, etc). There is also a regular report to management on the ten largest exposures in each strategic business. Management is comprehen-sively briefed about the Group’s risk situation, including in-depth analysis of selected key points, at meetings of the Risk Management Committee (RICO), which are held at least six times per year.
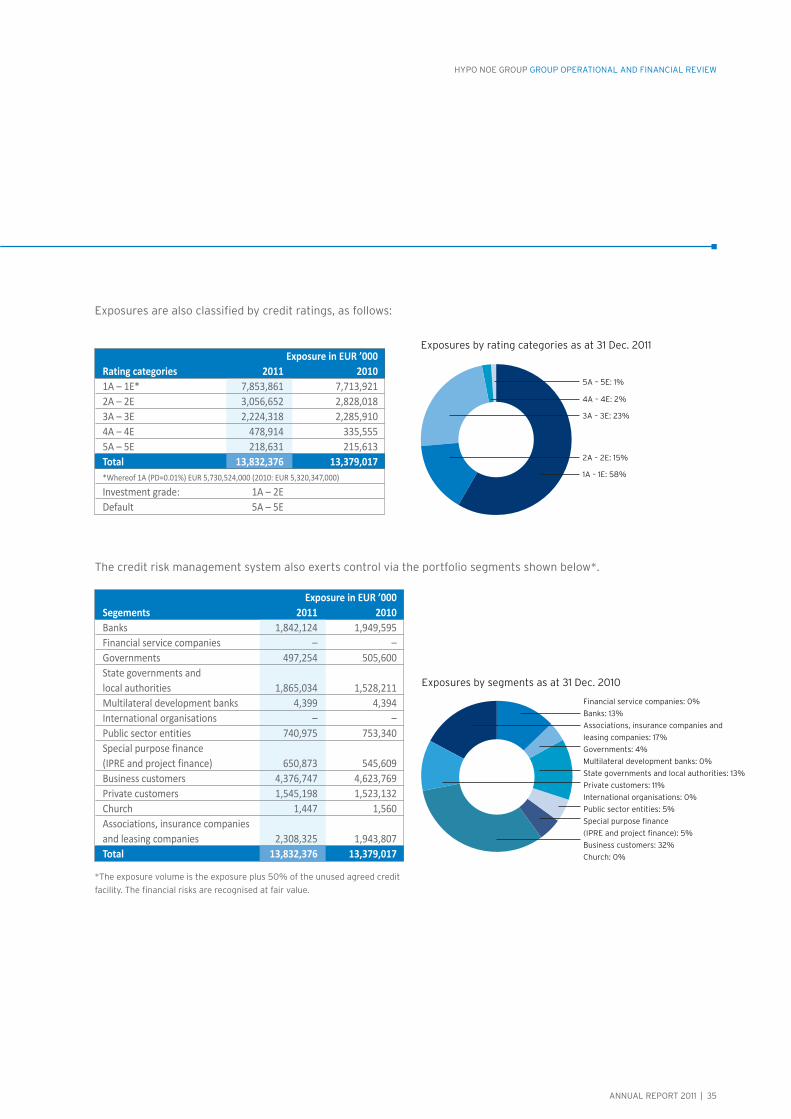
Credit risk managementThe credit risk management system is based on the following control units*:
Exposure in EUR ’000 Control units 2011 2010 Public Finance 7,770,134 6,980,312 Corporate & Project Finance 702,485 722,408 Commercial Real Estate Finance 873,998 773,381 Group Treasury & Nostro 2,422,928 2,860,680 HYPO NOE Landesbank (excl, Nostro) 2,062,831 2,042,237 Total 13,832,376 13,379,017
Exposures by financial control units as at 31 Dec. 2011
Public Finance: 56%
HYPO NOE Landesbank (excl. Nostro): 15%
Group Treasury & Nostro: 18%
Commercial Real Estate Finance: 6%
Corporate & Project Finance: 5%*The exposure volume is the exposure plus 50% of the unused agreed credit facility.
The financial risks are recognised at fair value.
ANNUAL REPORT 2011 | 35
HYPO NOE GROUP GROUP OPERATIONAL AND FINANCIAL REVIEW
Exposures are also classified by credit ratings, as follows:
The credit risk management system also exerts control via the portfolio segments shown below*.
Exposure in EUR ’000 Rating categories 2011 2010 1A – 1E* 7,853,861 7,713,921 2A – 2E 3,056,652 2,828,018 3A – 3E 2,224,318 2,285,910 4A – 4E 478,914 335,555 5A – 5E 218,631 215,613 Total 13,832,376 13,379,017 *Whereof 1A (PD=0.01%) EUR 5,730,524,000 (2010: EUR 5,320,347,000)
Investment grade: 1A – 2E Default 5A – 5E
Exposures by rating categories as at 31 Dec. 2011
5A – 5E: 1%
4A – 4E: 2%
3A – 3E: 23%
2A – 2E: 15%
1A – 1E: 58%
Exposure in EUR ’000 Segements 2011 2010 Banks 1,842,124 1,949,595 Financial service companies – – Governments 497,254 505,600 State governments and local authorities 1,865,034 1,528,211 Multilateral development banks 4,399 4,394 International organisations – – Public sector entities 740,975 753,340 Special purpose finance (IPRE and project finance) 650,873 545,609 Business customers 4,376,747 4,623,769 Private customers 1,545,198 1,523,132 Church 1,447 1,560 Associations, insurance companies and leasing companies 2,308,325 1,943,807 Total 13,832,376 13,379,017
Exposures by segments as at 31 Dec. 2010
Financial service companies: 0%
Banks: 13%
Associations, insurance companies and
leasing companies: 17%
Governments: 4%
Multilateral development banks: 0%
State governments and local authorities: 13%
Private customers: 11%
International organisations: 0%
Public sector entities: 5%
Special purpose finance
(IPRE and project finance): 5%
Business customers: 32%
Church: 0%
*The exposure volume is the exposure plus 50% of the unused agreed credit
facility. The financial risks are recognised at fair value.
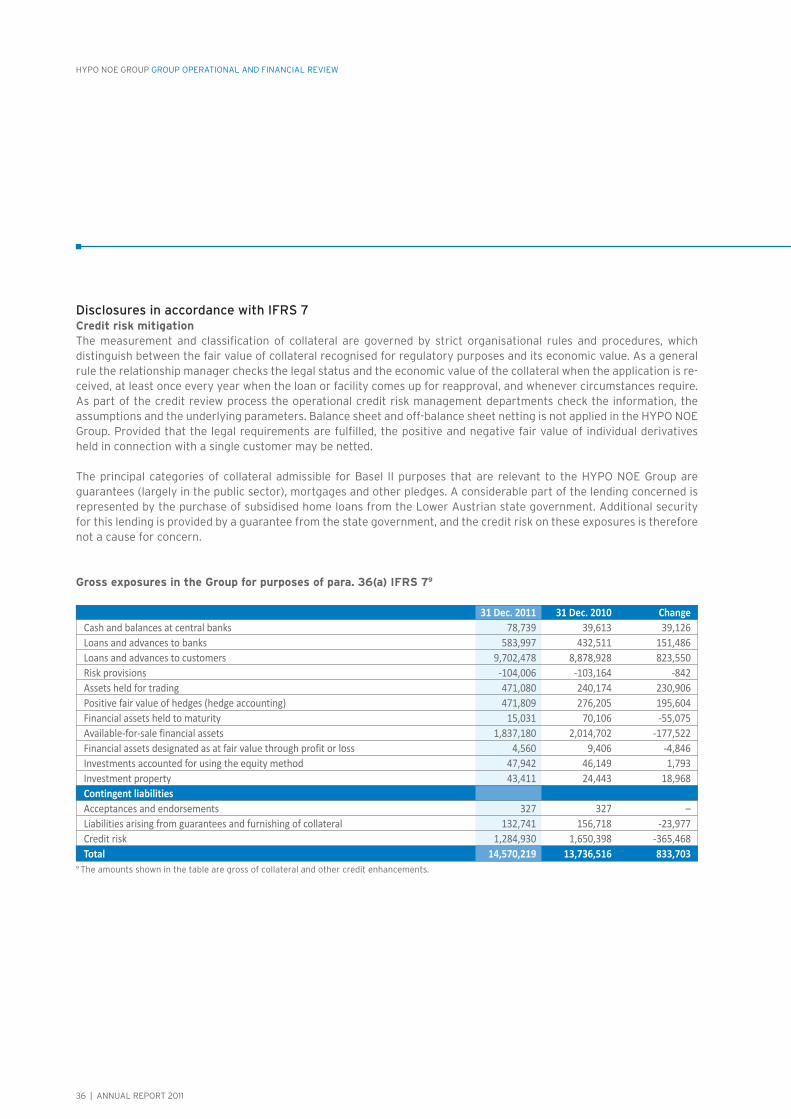
36 | ANNUAL REPORT 2011
HYPO NOE GROUP GROUP OPERATIONAL AND FINANCIAL REVIEW
Disclosures in accordance with IFRS 7Credit risk mitigationThe measurement and classification of collateral are governed by strict organisational rules and procedures, which distinguish between the fair value of collateral recognised for regulatory purposes and its economic value. As a general rule the relationship manager checks the legal status and the economic value of the collateral when the application is re-ceived, at least once every year when the loan or facility comes up for reapproval, and whenever circumstances require. As part of the credit review process the operational credit risk management departments check the information, the assumptions and the underlying parameters. Balance sheet and off-balance sheet netting is not applied in the HYPO NOE Group. Provided that the legal requirements are fulfilled, the positive and negative fair value of individual derivatives held in connection with a single customer may be netted.
The principal categories of collateral admissible for Basel II purposes that are relevant to the HYPO NOE Group are guarantees (largely in the public sector), mortgages and other pledges. A considerable part of the lending concerned is represented by the purchase of subsidised home loans from the Lower Austrian state government. Additional security for this lending is provided by a guarantee from the state government, and the credit risk on these exposures is therefore not a cause for concern.
Gross exposures in the Group for purposes of para. 36(a) IFRS 79
9 The amounts shown in the table are gross of collateral and other credit enhancements.
31 Dec. 2011 31 Dec. 2010 Change Cash and balances at central banks 78,739 39,613 39,126 Loans and advances to banks 583,997 432,511 151,486 Loans and advances to customers 9,702,478 8,878,928 823,550 Risk provisions -104,006 -103,164 -842 Assets held for trading 471,080 240,174 230,906 Positive fair value of hedges (hedge accounting) 471,809 276,205 195,604 Financial assets held to maturity 15,031 70,106 -55,075 Available-for-sale financial assets 1,837,180 2,014,702 -177,522 Financial assets designated as at fair value through profit or loss 4,560 9,406 -4,846 Investments accounted for using the equity method 47,942 46,149 1,793 Investment property 43,411 24,443 18,968 Contingent liabilities Acceptances and endorsements 327 327 – Liabilities arising from guarantees and furnishing of collateral 132,741 156,718 -23,977 Credit risk 1,284,930 1,650,398 -365,468 Total 14,570,219 13,736,516 833,703
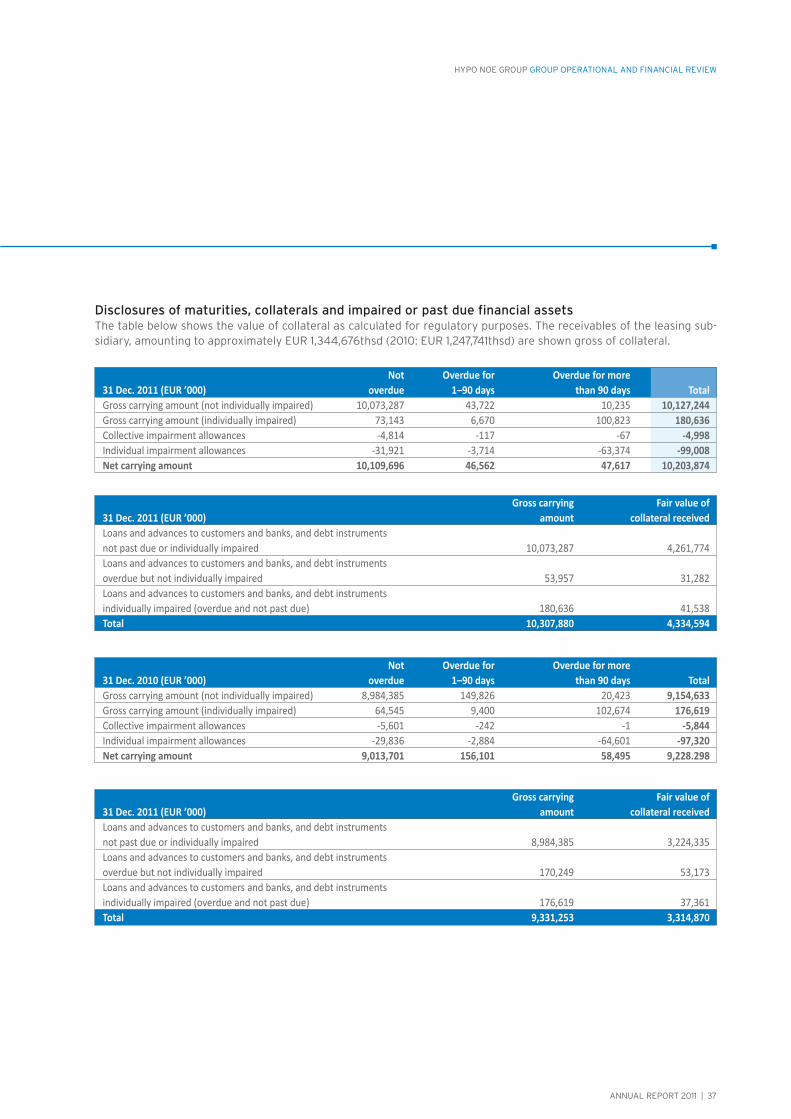
ANNUAL REPORT 2011 | 37
HYPO NOE GROUP GROUP OPERATIONAL AND FINANCIAL REVIEW
Disclosures of maturities, collaterals and impaired or past due financial assetsThe table below shows the value of collateral as calculated for regulatory purposes. The receivables of the leasing sub-sidiary, amounting to approximately EUR 1,344,676thsd (2010: EUR 1,247,741thsd) are shown gross of collateral.
Not Overdue for Overdue for more 31 Dec. 2011 (EUR ’000) overdue 1–90 days than 90 days Total Gross carrying amount (not individually impaired) 10,073,287 43,722 10,235 10,127,244 Gross carrying amount (individually impaired) 73,143 6,670 100,823 180,636 Collective impairment allowances -4,814 -117 -67 -4,998 Individual impairment allowances -31,921 -3,714 -63,374 -99,008 Net carrying amount 10,109,696 46,562 47,617 10,203,874
Not Overdue for Overdue for more 31 Dec. 2010 (EUR ’000) overdue 1–90 days than 90 days Total Gross carrying amount (not individually impaired) 8,984,385 149,826 20,423 9,154,633 Gross carrying amount (individually impaired) 64,545 9,400 102,674 176,619 Collective impairment allowances -5,601 -242 -1 -5,844 Individual impairment allowances -29,836 -2,884 -64,601 -97,320 Net carrying amount 9,013,701 156,101 58,495 9,228.298
Gross carrying Fair value of 31 Dec. 2011 (EUR ’000) amount collateral received Loans and advances to customers and banks, and debt instruments not past due or individually impaired 10,073,287 4,261,774 Loans and advances to customers and banks, and debt instruments overdue but not individually impaired 53,957 31,282 Loans and advances to customers and banks, and debt instruments individually impaired (overdue and not past due) 180,636 41,538 Total 10,307,880 4,334,594
Gross carrying Fair value of 31 Dec. 2011 (EUR ’000) amount collateral received Loans and advances to customers and banks, and debt instruments not past due or individually impaired 8,984,385 3,224,335 Loans and advances to customers and banks, and debt instruments overdue but not individually impaired 170,249 53,173 Loans and advances to customers and banks, and debt instruments individually impaired (overdue and not past due) 176,619 37,361 Total 9,331,253 3,314,870
38 | ANNUAL REPORT 2011
HYPO NOE GROUP GROUP OPERATIONAL AND FINANCIAL REVIEW
Collateral taken into possession in the meaning of paragraph 38 IFRS 7 represents rescue acquisitions where the intention is to dispose of the assets. For HYPO NOE Landesbank the value of such assets was EUR 36thsd (2010: EUR 680thsd). HYPO NOE Gruppe Bank undertook no such transactions in 2011 or 2010.
The tables below show risk provisions grouped by the maturities of the underlying transactions and segmented as required for regulatory reporting purposes.
Current risk situationThe Group’s portfolio of loans and investments largely consists of low-risk loans to public sector borrowers such as sovereigns, the federal government, state governments and local authorities (and their associated enterprises), as well as loans to banks with good external ratings (predominantly own investments, derivatives and money market invest-ments) and – generally well collateralised – loans to housing construction companies (both large housing associations and private sector). Within these low-risk areas there are nevertheless significant risk concentrations (unsecured lend-ing per individual borrower) in the loan portfolio.
A considerable part of the lending concerned is represented by the purchase of subsidised home loans from the Lower Austrian state government. Additional security for this lending is provided by a guarantee from the state government, and the credit risk on these exposures is therefore not a cause for concern.
HYPO NOE Gruppe Bank also finances property projects with excellent or good credit ratings, as well as some public sector loans, infrastructure enterprises and foreign corporate customers. HYPO NOE Landesbank specialises in retail banking, large-scale housing construction (both housing associations and private sector housing) and SME finance.
The credit portfolio shows no notable concentrations of risk from a Group perspective. Most of the Bank’s operations relate to lending to the Austrian public sector.
The HYPO NOE Group regularly calculates the statistically expected loss associated with credit risk exposures on the basis of the default probabilities and the collateral structure. The aim is to ensure that the expected loss on the overall portfolio is adequately covered by risk provisions, and that a conservative approach is taken to any possible shortfalls in risk coverage. As at year end 2011 there was no such shortfall at Group level.
31 Dec. 2011 Not Overdue for Overdue for more Total overdue 1–90 days than 90 days Risk provisions for customers: individual impairment allowances -31,921 -3,714 -63,374 -99,008 Non-banks -4,909 – – -4,909 Corporates -15,582 -2,315 -32,402 -50,298 Private customers -11,430 -1,399 -30,972 -43,801 Risk provisions for customers: collective impairment allowances -4,814 -117 -67 -4,998 Total risk provisions for customers -36,735 -3,830 -63,441 -104,006
31 Dec. 2010 Not Overdue for Overdue for more Total overdue 1–90 days than 90 days Risk provisions for customers: individual impairment allowances -29,836 -2,884 -64,601 -97,320 Non-banks – – -5,272 -5,272 Corporates -17,195 -2,059 -27,627 -46,881 Private customers -12,641 -824 -31,701 -45,167 Risk provisions for customers: collective impairment allowances -5,601 -242 -1 -5,844 Total risk provisions for customers -35,437 -3,125 -64,601 -103,164

ANNUAL REPORT 2011 | 39
HYPO NOE GROUP GROUP OPERATIONAL AND FINANCIAL REVIEW
Group Strategic Risk Management regularly checks the non-performing asset (NPA) ratios and NPA coverage of indi-vidual members of the Group. The NPA ratio is defined as the total exposure on all default (5A-5E rated) customers divided by total credit risk exposure. As at year end 2011 the HYPO NOE Group’s NPA ratio was 1.95% (2010: 1.69%). The NPA coverage is defined as risk provisions (individual and collective impairment allowances, and credit provisions) divided by the total exposure on default customers (5A-5E rated). Group coverage at 31 December 2011 was 62.6% (2010: 56.1%).
The non performing loan (NPL) ratio, defined as total exposure on default customers (5A-5E rated) divided by total loans and advances to customers, is calculated at Group level. As at 31 December 2011 the HYPO NOE Group’s NPL ratio was 2.14% (2010: 2.23%).
Interest rate risk
In its approach to the measurement and control of interest rate risk, the HYPO NOE Group uses both period net interest income risk and present value sensitivity to interest rate changes.
Interest rate risk managementThe management of interest rate risk is the responsibility of the Group Treasury Department and the ALM & Capital Management Staff Unit. Fixed interest rate risk is mainly eliminated by the use of hedges, and strategic long-term interest positions are established as recommended by the ALM & Capital Management Staff Unit.
Monitoring and quantification of interest rate risk is the responsibility of a back office department, Group Strategic Risk Management. The calculations are made in the SAP banking system. They generate interest rate gap and sensitivity analyses. The internal interest rate risk is subject to an absolute limit, imposed on the acceptance of risk in the banking book during the annual risk budgeting process.
Interest rate risk management is active, and reflects current market conditions, taking into account limits and risks in combination with the Group’s risk bearing capacity, and the interest rate structure and contribution.
Current risk situationThe Oesterreichische Nationalbank statistics indicate that in 2011 interest rate risk was moderate relative to the regula-tory limit (20% of eligible capital), at 1.61% (2010: 2.91%).
Interest rate derivatives are used to hedge interest rate risks on own debt issues and on nostro securities and loans extended. Interest rate derivatives are at present used to hedge on-balance sheet positions, and therefore almost exclusively count as micro-hedges.
IFRS 7 requirementsAs part of the HYPO NOE Group’s risk monitoring activities, interest rate risk sensitivity is computed twice monthly using ten scenarios.
In addition to parallel shifts (100 and 200 base points), twists in the yield curve (both in money markets and in capital markets) are also modelled. The resulting effects on present value are regularly reported internally and reviewed by the Asset Liability Committee (ALCO).
The sensitivity analysis captures interest rates in a variety of currency areas as risk factors. This makes it possible to apply a constant, standard measure of risk to all interest rate sensitive products. The analysis enables interest rate risks in various areas of business to be compared, and positions aggregated and netted across the Bank as a whole. In addition, interest rate risk can be compared over time.

40 | ANNUAL REPORT 2011
HYPO NOE GROUP GROUP OPERATIONAL AND FINANCIAL REVIEW
The following factors should be borne in mind with regard to the use of sensitivity analyses:
The scenarios may be not be good indicators of future events – especially where these are extreme. This could lead to underestimation or overestimation of the risks. The assumptions about changes in the risk factors and the relationships between them (e.g. simultaneous
twists in the euro and Swiss franc yield curves) may turn out to be false – particularly if extreme events oc-cur. There is no standard methodology for developing interest rate scenarios, and applying other scenarios would generate different outputs. The scenarios applied do not provide any indications of the potential losses in situations that are not mod-
elled by them.
The table below shows the results of the various interest rate scenarios for the HYPO NOE Group as a whole, and of observance of internal limits, as at 31 December 2011 (right-hand table: 31 Dec. 2010). There were no changes in the meth-odology applied and the assumptions made with regard to interest rate risk management during the reporting period.
Market risk
Market risks are the potential losses that may arise from negative changes in the fair value of positions held as a result of movements in exchange rates (currency risk), share prices, indexes or fund unit prices (equity risk), credit spreads (spread risk), or volatility (volatility risk).
Risk managementThe organisation of treasury business is based on a clear operational and disciplinary separation of trading activities from processing and control. The division between the front and back office functions ensures that the four-eye principle is adhered to. Structures, decision-making authorities and processes are laid down by the authorisation rules, the minimum requirements for investment and trading activities, and the procedures for the introduction of new products.
Market risk may only be incurred within the authorised limits and with respect to authorised products.
Interest rate scenario, Negative EUR ’000 change in 31 Dec. 2010 present value change in PV Shift +100bp -37,965 -37,965 Shift -100bp 41,732 Shift +200bp -72,283 -72,283 Shift -200bp 83,877 Twist CM +100 bp -12,273 -12,273 Twist CM -100 bp 13,786 Twist MM +100 bp -22,828 -22,828 Twist MM -100 bp 23,182 Twist 1d +100 bp 30y -250 bp -1,707 -1,707 Twist 1d -100 bp 30y +250 bp -6,630 -6,630 Internal risk -30,396 Warning level (95% of limit) -39,900 Limit /utilization (%) -42,000 72.37%
Interest rate scenario, Negative EUR ’000 change in 31 Dec. 2011 present value change in PV Shift +100bp -17,328 -17,328 Shift -100bp 17,849 Shift +200bp -33,575 -33,575 Shift -200bp 33,203 Twist CM +100 bp -2,994 -2,994 Twist CM -100 bp -1,318 -1,318 Twist MM +100 bp -14,272 -14,272 Twist MM -100 bp 11,611 Twist 1d +100 bp 30y -250 bp -1,707 -1,707 Twist 1d -100 bp 30y +250 bp -2,014 -2,014 Internal risk -10,458 Warning level (95% of limit) -39,900 Limit/utilisation (%) -42,000 24.90%
ANNUAL REPORT 2011 | 41
HYPO NOE GROUP GROUP OPERATIONAL AND FINANCIAL REVIEW
IFRS 7 requirementsThe HYPO NOE Group’s conservative risk policies are underpinned by very strict limits on open currency positions. Expo-sure to currency risk is therefore negligible.
Current risk situationThe Group does not engage in any business that requires it to maintain a large trading book as defined by the Austrian Banking Act. It maintains a small trading book, subject to section 22q Banking Act.
The use of forex derivatives and matching currency refinancing to all intents and purposes eliminates the HYPO NOE Group’s exposure to exchange risk. Where foreign currency exposures are not entirely covered they are subject to strict limits.
There are additional market risks – particularly in connection with the Group’s own investments – which are managed on an ongoing basis in accordance with the risk management guidelines for investments.
The Bloomberg trading platform – a state-of-the-art system – has been in use for management of proprietary securities trading since 2008.
Liquidity risk
Liquidity risk is the danger that the HYPO NOE Group will be unable to meet its present and future payment obliga-tions in full and on time, or may only be able to do so at prohibitive cost.
Liquidity risk managementThe task of the liquidity risk management function is to identify, measure and manage the HYPO NOE Group’s liquid-ity risk position. Different approaches are taken to short-term (up to and including one year) and long-term liquidity management. The Group’s liquidity risk management system centres on:
Regular analysis of the liquidity position; Reporting to the Management Board; Determination of the Bank’s medium and long-term refinancing needs, and preparation of an issuance pro-
gramme; Maintenance and development of the liquidity model and liquidity cost model; Regular reviewing and redetermination of internal transfer prices.
Group Treasury is responsible for tactical liquidity management. The issuance planning undertaken as part of the an-nual budgeting process plays a major role in the management of liquidity risk.
The Group is steadily refining its liquidity risk management system. During the report period the following progress was made:
Introduction of a Group-wide liquidity contingency plan; Review and enhancement of the liquidity cost model, and completion of the liquidity cost determination
process documentation; Refinement of the economic risk indicator used to model liquidity risk.
42 | ANNUAL REPORT 2011
HYPO NOE GROUP GROUP OPERATIONAL AND FINANCIAL REVIEW
Short-term liquidity risk (up to one year)Group Strategic Risk Management provides Group Treasury with a baseline and stress scenario for the next 12 months to assist it with its tactical liquidity management operations. These scenarios take account of contractual payment streams, as well as the expected proceeds of new issues, income from new business, extensions of repurchase agreements, and liquidity needs arising from terminations of existing contractual relationships.
The table below shows the expected liquidity gaps projected by the baseline scenario, the additional liquidity available from internal and external measures, and the liquidity position subsequent to those measures, for periods up to one year, as at the end of the reporting period, as well as the comparative figures for 2010.
The stress scenario envisages both bank-specific events (e.g. a rating downgrade) and market-wide shocks (e.g. persis-tent money or capital market dysfunctionality).
The liquidity management activities start with managing day-to-day payments, forecasting cash flows, and ensuring that the Group has access to collateralised refinancing from the ECB and other money market sources. With the euro crisis an ever-present concern, particular importance was attached to regular reporting to the Management Board on the status of intrayear liquidity management.
Long-term liquidity risk (more than one year)To support strategic liquidity management and structural analysis of the liquidity risk position, the HYPO NOE Group analyses the expected capital flows over the entire maturities of on and off-balance sheet transactions. Group Strategic Risk Management monitors periodic and cumulative excess capital inflows and outflows, and reports on them internally on a fortnightly basis. These reports are the basis of the strategic liquidity management activities, and in particular of the Bank’s issuance planning. At least once a year the Management Board reviews and approves the long-term refinanc-ing and issuance plan.
Contingency planThe liquidity contingency plan is aimed at maintaining efficient liquidity management even in a crisis-hit market environ-ment. The Group has a liquidity contingency plan that governs the lines of responsibility in an emergency, the composi-tion of the crisis teams, the internal and external communication channels, and the action to be taken if necessary. A crisis team would take control of liquidity management in an emergency, and in some cases would also decide on the action to be taken.
As at 31 Dec. 2011 (EUR m) Expected Additional Liquidity position liquidity gap available liquidity after measures taken Up to one month -1,149 2,014 865 Between one and three months -417 454 37 Between three months and one year -2,671 3,536 865 Total -4,237 6,004 1,767
As at 31 Dec. 2010 (EUR m) Expected Additional Liquidity position liquidity gap available liquidity after measures taken Up to one month -1,244 1,876 632 Between one and three months -991 1,003 12 Between three months and one year -1,206 1,895 689 Total -3,441 4,774 1,333
ANNUAL REPORT 2011 | 43
HYPO NOE GROUP GROUP OPERATIONAL AND FINANCIAL REVIEW
Current risk situationThe liquidity situation of the HYPO NOE Group is comfortable, in spite of the intensifying euro crisis during the re-porting period. The Group has sufficient access to short-term funds, and recourse to long-term sources of finance is also possible despite the adverse market environment. In October 2011 the Group launched a highly successful benchmark-size bond issue. The three-year covered bond raised EUR 500m. The issue was oversubscribed within a few hours. We are giving high priority to issues with long maturities as issues of bonds backed by state governments are due to end in 2017.
The Bank has sufficient assets eligible as collateral for ECB tenders to replace all of its existing sources of short-term funding in the event that markets freeze up – further proof that the current liquidity position on a 12-month horizon is satisfactory.
During the reporting period the planned Basel III LCR and NSFR regulatory liquidity indicators were calculated on the basis of the final versions of the standards. They were reported to Group management and analysed, and action was taken to ensure that they will be met.
Analysis of the maturities of financial liabilitiesThe table below presents a maturity analysis of the earliest possible undiscounted contractual cash flows arising from non-derivative financial liabilities and off-balance sheet loan commitments as at 31 December 2011 and a year earlier. The cash flows comprise payments of interest as well as principal. In the case of liabilities with variable cash flows the future cash flows are calculated on the basis of forward rates.

44 | ANNUAL REPORT 2011
HYPO NOE GROUP GROUP OPERATIONAL AND FINANCIAL REVIEW
(EUR ’000) 31 Dec. 2011 31 Dec. 2010 Deposits from banks Repayable on demand or no fixed term 52,004 71,483 Up to 3 months 976,143 1,884,414 From 3 months to 1 year 488,900 29,475 From 1 to 5 years 219,960 – Over 5 years 647,453 638,854 Total 2,384,461 2,624,226 Deposits from customers Repayable on demand or no fixed term 592,434 575,930 Up to 3 months 242,599 149,845 From 3 months to 1 year 252,725 219,261 From 1 to 5 years 441,832 392,420 Over 5 years 943,820 989,237 Total 2,473,410 2,326,693 Debts evidenced by certificates Repayable on demand or no fixed term 682 709 Up to 3 months 46,763 195,896 From 3 months to 1 year 989,493 15,126 From 1 to 5 years 2,284,511 1,932,882 Over 5 years 3,510,303 3,800,818 Total 6,831,752 5,945,431 Liabilities held for trading Repayable on demand or no fixed term – – Up to 3 months – 3,275 From 3 months to 1 year 262 4,233 From 1 to 5 years 6,708 13,743 Over 5 years 373,504 131,738 Total 380,474 152,989 Negative fair value of derivatives (hedge accounting) Repayable on demand or no fixed term – – Up to 3 months 21 95 From 3 months to 1 year 819 3,376 From 1 to 5 years 37,872 29,597 Over 5 years 371,204 171,815 Total 409,916 204,884 Other liabilities (inc. economic hedges) Repayable on demand or no fixed term – – Up to 3 months 425 37 From 3 months to 1 year – – From 1 to 5 years – 466 Over 5 years – – Total 425 504 Other liabilities (excl. economic hedges) Repayable on demand or no fixed term 11,687 8,162 Up to 3 months 6,339 12,661 From 3 months to 1 year 12,371 12,218 From 1 to 5 years 14,649 13,875 Over 5 years 6,474 9,057 Total 51,520 55,973 Subordinated capital Repayable on demand or no fixed term – – Up to 3 months – – From 3 months to 1 year – – From 1 to 5 years – – Over 5 years 202,244 202,529 Total 202,244 202,529
Analysis of liabilities by maturities
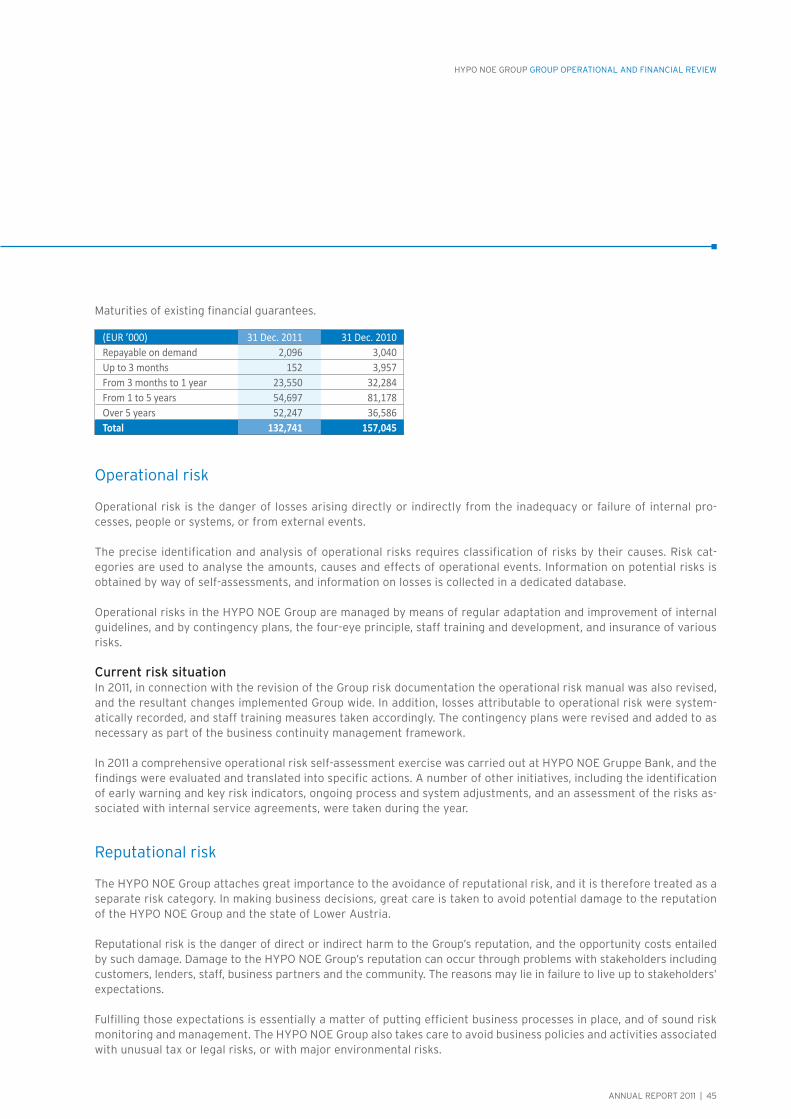
ANNUAL REPORT 2011 | 45
HYPO NOE GROUP GROUP OPERATIONAL AND FINANCIAL REVIEW
Maturities of existing financial guarantees.
Operational risk
Operational risk is the danger of losses arising directly or indirectly from the inadequacy or failure of internal pro-cesses, people or systems, or from external events.
The precise identification and analysis of operational risks requires classification of risks by their causes. Risk cat-egories are used to analyse the amounts, causes and effects of operational events. Information on potential risks is obtained by way of self-assessments, and information on losses is collected in a dedicated database.
Operational risks in the HYPO NOE Group are managed by means of regular adaptation and improvement of internal guidelines, and by contingency plans, the four-eye principle, staff training and development, and insurance of various risks.
Current risk situationIn 2011, in connection with the revision of the Group risk documentation the operational risk manual was also revised, and the resultant changes implemented Group wide. In addition, losses attributable to operational risk were system-atically recorded, and staff training measures taken accordingly. The contingency plans were revised and added to as necessary as part of the business continuity management framework.
In 2011 a comprehensive operational risk self-assessment exercise was carried out at HYPO NOE Gruppe Bank, and the findings were evaluated and translated into specific actions. A number of other initiatives, including the identification of early warning and key risk indicators, ongoing process and system adjustments, and an assessment of the risks as-sociated with internal service agreements, were taken during the year.
Reputational risk
The HYPO NOE Group attaches great importance to the avoidance of reputational risk, and it is therefore treated as a separate risk category. In making business decisions, great care is taken to avoid potential damage to the reputation of the HYPO NOE Group and the state of Lower Austria.
Reputational risk is the danger of direct or indirect harm to the Group’s reputation, and the opportunity costs entailed by such damage. Damage to the HYPO NOE Group’s reputation can occur through problems with stakeholders including customers, lenders, staff, business partners and the community. The reasons may lie in failure to live up to stakeholders’ expectations.
Fulfilling those expectations is essentially a matter of putting efficient business processes in place, and of sound risk monitoring and management. The HYPO NOE Group also takes care to avoid business policies and activities associated with unusual tax or legal risks, or with major environmental risks.
(EUR ’000) 31 Dec. 2011 31 Dec. 2010 Repayable on demand 2,096 3,040 Up to 3 months 152 3,957 From 3 months to 1 year 23,550 32,284 From 1 to 5 years 54,697 81,178 Over 5 years 52,247 36,586 Total 132,741 157,045

46 | ANNUAL REPORT 2011
HYPO NOE GROUP GROUP OPERATIONAL AND FINANCIAL REVIEW
Other risks
“Other risks” consist largely of business risk (the danger of loss as a result of a deterioration in the economic environ-ment and the Bank’s business relationships) and strategic risks (the danger of losses arising from decisions concerning the Bank’s strategic focus and business development). Our approaches to measuring these risks, based on those applied to credit or market risks, are being continuously improved.
Legal risks
Legal risks in connection with Augustus Funding LimitedUnder a notice issued by the Austrian Financial Market Authority (FMA) on 1 June 2011, an adjusted interest penalty of EUR 57,865,612.58 was imposed on HYPO NOE Gruppe Bank AG by an FMA notice dated 21 July 2011. HYPO NOE Gruppe Bank AG lodged timely appeals against this notice with the Constitutional Court and the Administrative Court of Appeal. As these appeals have no suspensive effect, the Bank paid the above penalty on 31 August 2011. On 29 November 2011 the Constitutional Court refused to consider the appeal. The proceedings before the Administrative Court of Appeal are still pending.
The existing provision was used to pay the interest penalty, and the outstanding amount arising from the lower penalty under the adjustment notice was reversed through profit or loss.
ANNUAL REPORT 2011 | 47
HYPO NOE GROUP GROUP OPERATIONAL AND FINANCIAL REVIEW
INTERNAL CONTROL ANDRISK MANAGEMENT SYSTEM (ICS)
INTERNAL AUDIT
The importance of internal audit as part of a bank’s internal control systems is shown by the fact that it is one of the few functions that are statutory requirements under the Austrian Banking Act (section 42(1)).
Banks must establish an internal audit department that reports directly to senior management, and is exclusively devoted to comprehensive, ongoing review of the legality, orderliness and expediency of the operations of the entire enterprise. Internal audit must be adequately resourced to perform its role properly, taking account of the volume of business.
Internal auditing activities in the HYPO NOE Group are based on annual audit plans approved by the Group Manage-ment Board and the managements of the subsidiaries. These, in turn, form part of a multi-year audit road map. This ensures that the audit cycle takes in all areas of operations.
The main focus is on the auditing activities required by the law, and particularly close attention is also paid to the vari-ous categories of risk (risk based auditing), i.e. operational, market and credit risk, and to risk management as a whole, as well as efficiency and quality issues.
The purpose of our internal auditing activities is not only to identify weaknesses but also to provide independent and objective audit services and advice aimed at creating value, improving business processes, and thus enhancing the overall performance of the HYPO NOE Group.
In addition, the internal audit function assists the organisation in attaining its objectives by evaluating and helping to improve the effectiveness of its risk management, internal controls, and management and supervisory processes on the basis of a systematic and targeted approach.
A total of 35 audits were carried out in 2011. These included special audit assignments from the Management Board. As a rule the audit reports contain suggestions for improvements. Implementation of these recommendations is part of the quality assurance side of the auditing work.
The Management Board was notified of the audit findings orally and in writing, in a timely manner, and the Supervi-sory Board Audit Committee regularly received information in written and oral form; additionally, this was sent to the Supervisory Board itself in summarised form.
The Audit Department was also involved in a variety of projects. The other departments made heavy use of the Depart-ment’s advisory services.
The provision of adequate human resources (and staff training and development), an audit culture that is in line with current knowledge and needs, and good networking within the organisation ensure that the Audit Department is able to deliver optimum performance and fulfil its responsibilities to the Group.
48 | ANNUAL REPORT 2011
HYPO NOE GROUP GROUP OPERATIONAL AND FINANCIAL REVIEW
RELATIONSHIP BETWEEN THE ICS AND THE ACCOUNTING PROCESS
A high priority in 2011 was the ongoing development of methods for the identification, quantification, monitoring and management of operational risk, and of the ICS as a whole.
The ICS encompasses all of the control and audit activities directed to ensuring that our processes comply with the law and our internal standards, and are adhered to. Within the system, distinctions are drawn between risk management, internal audit, and the accounting activities and standards associated with the preparation of the annual financial statements.
The ICS ensures that business information is correctly captured, analysed and assessed, and incorporated in the Bank’s accounting.
The main features of the Bank’s internal control and risk management system and their interaction with the account-ing process are summarised below.
The Management Board is responsible for designing and establishing an internal control and risk management system that meets the Bank’s needs with regard to its accounting process.
The Group Accounting Department is responsible for all accounting matters and for issuing instructions designed to maintain compliance with Group-wide standards. Directives have been drawn up to assist it in performing its duties.
The ICS encompasses accounting related instructions and processes aimed at correct and appropriate recording of business transactions, including:
The employment of the Group’s assets; Recording of all the information required to draw up the annual financial statements; Prevention of unauthorised purchases and sales which could have a material impact on the annual results; and Establishment of risk based decision-making authorities and monitoring instruments. The chart of accounts is tailored to the special requirements of the Bank. Vouchers are stored according to systematic, chronological criteria, and provide an adequate audit trail. The processes involved in the preparation of the separate parent entity and consolidated financial
statements, and parent and Group operational and financial reviews have been documented, as have the related risks and controls.
The departments involved in the accounting process are adequately resourced in terms of the quantity and quality of their staff. Standardised training programmes ensure that staff have the necessary skills for their roles in the system. However, the bedrock of the control system is the integrity and ethical standards of the individual employees concerned. The example set by senior executives is extremely important.
The functions of the main departments involved in the accounting process – Group Accounting and Controlling – are clearly demarcated.
Departmental responsibilities are unambiguously assigned. The computer systems employed are protected against unauthorised access by appropriate security
mechanisms. Accounting data is audited for its completeness and correctness on a sample basis. All data entry processes related to accounting are subject to the four-eye principle; checks are carried out
by Group Accounting, or by trained staff in the various operational departments, in accordance with internal regulations.
ANNUAL REPORT 2011 | 49
HYPO NOE GROUP GROUP OPERATIONAL AND FINANCIAL REVIEW
The computer centre validates posting lists, revenue reports, valuation lists and lists of Banking Act requirements, etc., and corrects them where necessary on a daily and monthly basis, subjecting them to automated checks. Group Accounting performs plausibility checks and prepares trial balances.
Monthly reports are sent to the Oesterreichische Nationalbank in accordance with the statutory reporting requirements for banks. These are forwarded via the computer centre, and Group Accounting performs plausibility checks and corrects any errors.
IT security checks are one of the cornerstones of the internal control system. Sensitive activities are firewalled by taking a restrictive approach to IT authorisations.
Monitoring of the ICS takes place at different levels. Internal organisational arrangements underpin monitoring of the ICS at the process level. Supervisors ensure that controls are actually performed, for example, by performing spot checks.
All internal audit activities are subject to Group-wide standards based on the Austrian Banking Act, the FMA Minimum Standards for Internal Auditing and international best practice.
The independent internal audit function regularly reviews compliance by departments and other organisational units with the internal regulations. In terms of the accounting process, this meant that audits of Group accounting with regard to data quality and consistency, and Group compliance with the regulatory reporting standards for banking groups and subsidiaries formed part of the 2011 audit plan. The internal control system and operational risk were among other subjects addressed.
The Management Board ensures that Group-wide monitoring of the ICS is in place by laying the organisational groundwork (designation of those responsible, creation of appropriate information systems, etc).
The Supervisory Board Audit Committee exercises its oversight function by holding regular discussions on the current status of the ICS.
The ICS ensures that all transactions are properly recorded, processed and documented. It also makes sure that asset and liability items in the annual financial statements are recognised, reported and measured in accordance with the ap-plicable legal and regulatory requirements.
The ICS is not set in stone, but is adapted to changed circumstances and requirements on an ongoing basis. Like any control system, however well it is resourced, operated and monitored the internal accounting control system can only provide an adequate and not an absolute assurance that its objectives will be attained. The identification of any changes required in the light of new risks, and ongoing monitoring of the system and assessment of its effectiveness is seen as a key task. The main priorities in this respect will be improving the effectiveness and efficiency of operational processes, minimising operational risk by making improvements to those processes, and refining the ICS.
Outlook for 2012A major challenge in 2012 will be strengthening the ICS. This will be addressed by a Group-wide project focusing on processes and the inherent risks associated with them. Improvements to the effectiveness and efficiency of operational processes, minimisation of operational risk by making improvements to those processes, and refinements to the ICS are planned.

50 | ANNUAL REPORT 2011
HYPO NOE GROUP GROUP OPERATIONAL AND FINANCIAL REVIEW
The main R&D goal for 2011 was to methodically analyse processes across the group and adapt them where appropri-ate. Management established the principle that all business processes throughout the Group are to be so designed that the Group acts as a single business.
The main focus was on customer facing processes. These were analysed in terms of customer friendliness, and opti-mised to achieve maximum closeness to the customer and minimum throughput times without compromising quality. With regard to internal processes, the priority was to achieve improved cost-benefit ratios in respect of the interfaces and process automation.
New products were developed in response to changes in market conditions and the legal environment. In addition, new partnerships were established and the existing product portfolio improved.
The Group-wide “Fit for the Future” project was also launched in 2011. The project is divided into three levels: custom-ers and sales; process and throughput optimisation; and the expansion of IT automation. This will increase efficiency, bringing sustainable cost reductions.
RESEARCH AND DEVELOPMENT

ANNUAL REPORT 2011 | 51
HYPO NOE GROUP GROUP OPERATIONAL AND FINANCIAL REVIEW
Following a highly successful year in 2011, the HYPO NOE Group is entering the next reporting period in a stronger position, and with a clear focus on its core target groups and geographical markets. The financial burden imposed by the sovereign debt crisis and the resultant increased risk provisions were more than offset by one-off gains on the disposal of an investment. The strengths we have honed during the financial crisis, including solid capital resources and outstanding funding expertise, have given us a platform for continued selective expansion. We are pressing ahead relentlessly with the optimisation of Group structures and the roll-out of our umbrella brand.
We are cautiously optimistic about the economic climate. In our view the debt crisis faced by the Eurozone peripherals remains the chief downside risk to economic growth. However, the threat posed by the political flashpoints around the globe should not be underestimated. Meanwhile, the flooding of the capital markets by the major central banks could turn out to be a mixed blessing, as it runs the risk of exacerbating global imbalances and capital misallocation, and encouraging speculation. The ECB is widely expected to keep its low interest rate policy in place.
HYPO NOE Gruppe Bank AG will continue to focus on financial stability and reliability. In 2012 we will be looking to extend our recent progress whilst trimming our sails to the current adverse economic environment. Our banking re-lationships with regional and local government bodies, public corporations and the operators of public infrastructure will again play a key role.
The Bank will conduct annual reviews of the rapidly changing conditions in the financial services sector and the impli-cations for its business model. Ongoing projects are already examining the implications of Basel III and IFRS 9. In the course of our planning activities economic capital is allocated to our risk exposures and lines of business. The manag-ers responsible for the various business areas are required to aim for the right business mix to deliver the desired bal-ance of risk and reward. These decisions feed into operational measures designed to promote business development in line with the Group’s strategy. The plans for our businesses are as follows.
Our specialists in Public Finance will continue to offer bespoke solutions to meet the public sector’s increasingly com-plex financing needs. We will expand our partnerships with international financial institutions and development banks. The strategic geographical markets for these activities are Austria and the extended Danube region.
Group Real Estate Business will remain true to its successful policy of collaborating with tried and tested partners, whilst paying close attention to balancing risk and rewards. The department’s geographical focus is likewise on the Danube region and selected neighbouring EU member states.
In 2012 the Corporate & Project Finance Department will drive selective expansion of its high quality loan portfolio in Austria and the Danube region.
This will open the way for deeper customer relationships in Austria and abroad, and closer cooperation with interna-tional financial institutions.
Treasury will concentrate on safeguarding long-term liquidity and broadening the funding mix. These tasks will be made easier by the fact that S&P has left our A rating unchanged.
The capital market will continue to play a major role for us, although we will also tap alternative sources of finance. Given positive market sentiment, we plan to launch a benchmark-size covered bond issue in 2012. In addition, HYPO NOE Gruppe Bank will again be expanding its private placement programme. We are responding to the increased competition for deposits by offering a range of products that are tailored to the requirements of our customer target groups and meet their need for financial security.
GROUP OUTLOOK FOR 2012

52 | ANNUAL REPORT 2011
HYPO NOE GROUP GROUP OPERATIONAL AND FINANCIAL REVIEW
In 2012 HYPO NOE Landesbank will be tightening its focus in terms of the customer target groups it sets out to serve, and the keynote themes of its marketing will be family and housing finance, education and health, in Lower Austria and Vienna. It plans to drive profitable retail and business banking growth whilst keeping a close watch on risk.
HYPO NOE Landesbank’s organisational structure has been revamped, and Premium Banking and Housing Construc-tion departments established to align it to the target group based approach.
HYPO NOE Leasing will be maintaining its successful emphasis on structured finance solutions and real estate and equipment leasing. In 2012 the leasing operation plans to expand its health service business, and develop new products for local authorities.
HYPO NOE Real Consult sets out to provide comprehensive property services, and acts as an expert, independent partner to its customers over the entire life cycle of their assets. Its extensive experience of construction and prop-erty management ensures that it will continue to meet its customers’ high expectations, and act as a trendsetter in its market.
Efforts to improve profitability have now been systematised by the ongoing “Fit for the Future” programme. Great im-portance is also being attached to the new operating framework that will be created by Basel III and IFRS 9. The HYPO NOE Group’s business model, based on pooling the expertise of the various businesses and marketing them under a strong umbrella brand, will again play a prominent role in our marketing in 2012.

ANNUAL REPORT 2011 | 53
HYPO NOE GROUP GROUP OPERATIONAL AND FINANCIAL REVIEW
It is not yet possible to gauge the full impact of the latest tax reform. While the effects will probably be minor in 2012, they are likely to be the dominant feature of 2013. Our public finance and real estate finance businesses, and our retail busi-ness with its subsidised retirement saving products will be affected. An increase in the bank tax is also expected this year.
The course of events with regard to the PIIGS countries, Hungary and Cyprus since the start of 2012 has been as follows.
In February 2012 the European Commission sharply reduced some of its growth forecasts for EU member states. The PIIGS countries – Portugal, Italy, Ireland, Greece and Spain – are thus likely to be faced with weaker export demand than was previously expected. Government austerity measures, anaemic consumer demand and risk-averse investor behaviour are hitting growth and tax revenues. As a result the budget targets of the governments concerned will be even harder to meet.
Since it is doubtful whether Portugal will be able to return to the capital markets in late 2013 as planned, a second aid package could be unavoidable. The Bank’s Portuguese exposure was completely eliminated during the first quarter of this year.
In February 2012 the Irish government announced that a referendum on the Fiscal Compact Treaty would be held in late May or early June. If Irish voters do not back the treaty, the country could cease to qualify for support from the euro bailout fund.
Since November 2011 the Italian caretaker government has pushed through eight reform packages, the most recent of which was legislation for the wholesale deregulation of the service sector passed at the start of March. The administra-tion’s term of office is due to end in the spring of 2013.
The Greek parliament has passed the budget, and pension and administrative reforms that were conditions of the EUR 130bn aid package. On 9 March 2012 the Greek government announced that 85.8% of the private creditors had signed up to the debt “haircut”. A high level of participation was another condition of the rescue. Our exposure to Greek debt was reduced by a nominal EUR 20m during the first quarter of 2012. We accepted the Greek government’s debt swap offer of 24 February 2012 for the remaining EUR 10m within the deadline.
Spain has missed its 2011 budget deficit target by some way. The autonomous regions are largely to blame for this. The Madrid government would now like to negotiate softer spending targets with Brussels than those previously agreed.
Towards the end of 2011 Russia extended a EUR 2.5bn loan to Cyprus, which will enable the country to service its debts in 2012. Nevertheless, the Cypriot banking sector, with its strong ownership ties to Greece, is still very shaky. Support from the IMF and/or the EU could be needed this year.
The European Commission has announced that it is freezing about EUR 500m in funding for Hungary because of the country’s repeated breaches of the stability pact. The Hungarian government succeeded in pushing the budget deficit below 3% of GDP in 2011, but this was achieved by one-off effects rather than long-term savings, and the deficit will prob-ably be above 3% again in 2012.
St. Pölten, 29 March 2012The Management Board
Peter Harold Nikolai de ArnoldiChairman of the Management Board Member of the Management Board
EVENTS AFTER THE REPORTING PERIOD

HYPO NOE GROUP KONZERNGESCHÄFTSBERICHT
STATEMENT OF COMPREHENSIVE INCOME FOR THE YEAR ENDED 31 DECEMBER 2011
CONSOLIDATED STATEMENT OF FINANCIAL POSITION AS AT 31 DECEMBER 2011
CONSOLIDATED STATEMENT OF CHANGES IN EQUITY CONSOLIDATED STATEMENT OF CASH FLOWS NOTES TO THE CONSOLIDATED FINANCIAL STATEMENTS GOVERNING BODIES
CONSOLIDATED FINANCIAL
STATEMENTS FOR THE YEAR ENDED 31 DECEMBER 2011
ACCORDING TO IFRS
56 | ANNUAL REPORT 2011
HYPO NOE GROUP CONSOLIDATED FINANCIAL STATEMENTS
CONTENTS
CONTENTS .................................................................................................................................................................................................. 56CONSOLIDATED FINANCIAL STATEMENTS for the year ended 31 December 2011 according to IFRS ................................... 55 Consolidated statement of comprehensive income for the year ended 31 December 2011 ....................................... 58 Consolidated statement of financial position as at 31 December 2011 ............................................................................ 59 Consolidated statement of changes in equity ....................................................................................................................... 60 Consolidated statement of cash flows .....................................................................................................................................6 1NOTES to the consolidated financial statements and governing bodies ...................................................................................... 631. General information ................................................................................................................................................................................ 642. Accounting policies ................................................................................................................................................................................ 643. Accounting and measurement policies ............................................................................................................................................. 67 3.1 Basis of consolidation .................................................................................................................................................................68 3.2 Investments ................................................................................................................................................................................... 69 3.3 Financial instruments ..................................................................................................................................................................72 3.4 Financial assets .............................................................................................................................................................................73 3.5 Financial liabilities ........................................................................................................................................................................74 3.6 Embedded derivatives .................................................................................................................................................................75 3.7 Hedge accounting .........................................................................................................................................................................75 3.8 Lease accounting ..........................................................................................................................................................................76 3.9 Investment property.....................................................................................................................................................................76 3.10 Risk provisions ...............................................................................................................................................................................76 3.11 Repurchase agreements .............................................................................................................................................................77 3.12 Currency translation ....................................................................................................................................................................784. Notes to individual items of the consolidated financial statements ...........................................................................................78 4.1 Cash ...................................................................................................................................................................................................78 4.2 Loans and advances .....................................................................................................................................................................78 4.3 Assets held for trading .................................................................................................................................................................78 4.4 Positive and negative fair value of hedges (hedge accounting) ........................................................................................78 4.5 Available-for-sale (AFS) financial assets .................................................................................................................................78 4.6 Financial assets designated as at fair value through profit or loss ..................................................................................79 4.7 Financial assets held to maturity ...............................................................................................................................................79 4.8 Investments accounted for using the equity method ...........................................................................................................79 4.9 Property, plant and equipment, and intangible assets .........................................................................................................79 4.10 Tax assets and liabilities ............................................................................................................................................................80 4.11 Other assets ..................................................................................................................................................................................80 4.12 Deposits from banks and customers; debts evidenced by certificates ..........................................................................80 4.13 Liabilities held for trading .........................................................................................................................................................80 4.14 Provisions ......................................................................................................................................................................................8 1 4.15 Other liabilities .............................................................................................................................................................................8 1 4.16 Subordinated capital .................................................................................................................................................................. 82 4.17 Equity (including non-controlling interests) .......................................................................................................................... 825. Segment information ............................................................................................................................................................................ 826. Consolidated statement of cash flows .............................................................................................................................................. 837. Notes to the statement of comprehensive income .........................................................................................................................84 7.1 Interest and similar income .........................................................................................................................................................84 7.2 Interest and similar expense ...................................................................................................................................................... 85 7.3 Impairment losses (summary table) ......................................................................................................................................... 85 7.4 Credit provisions ...........................................................................................................................................................................86 7.5 Net fee and commission income ...............................................................................................................................................86 7.6 Net trading income .......................................................................................................................................................................86 7.7 General administrative expenses ...............................................................................................................................................86 7.8 Net other operating expense/income ......................................................................................................................................88 7.9 Net gains or losses on available-for-sale financial assets ................................................................................................... 89 7.10 Net gains or losses on financial assets designated as at fair value through profit or loss ........................................ 89 7.11 Net gains or losses on financial assets held to maturity ..................................................................................................... 89 7.12 Net gains or losses on hedges ..................................................................................................................................................90
ANNUAL REPORT 2011 | 57
HYPO NOE GROUP CONSOLIDATED FINANCIAL STATEMENTS
7.13 Net gains or losses on financial assets and liabilities .........................................................................................................90 7.14 Net gains or losses on other financial investments.............................................................................................................90 7.15 Income tax .....................................................................................................................................................................................90 7.16 Non-controlling interests ............................................................................................................................................................9 18. Notes to the statement of financial position ................................................................................................................................... 92 8.1 Cash and balances at central banks .......................................................................................................................................... 92 8.2 Loans and advances .................................................................................................................................................................... 92 8.3 Loans and advances to banks ................................................................................................................................................... 92 8.4 Loans and advances to customers ........................................................................................................................................... 92 8.5 Finance lease disclosures ........................................................................................................................................................... 93 8.7 Assets held for trading ................................................................................................................................................................ 96 8.8 Positive fair value of hedges (hedge accounting) ................................................................................................................ 97 8.9 Available-for-sale financial assets ............................................................................................................................................ 97 8.10 Financial assets designated as at fair value through profit or loss ................................................................................ 97 8.11 Financial assets held to maturity ............................................................................................................................................. 97 8.12 Analysis of financial assets according to the classification of the BWG (Austrian Banking Act)............................. 98 8.13 Investments accounted for using the equity method ......................................................................................................... 98 8.14 Investment property .................................................................................................................................................................. 98 8.15 Movements in financial assets ................................................................................................................................................. 99 8.16 Intangible assets, and property, plant and equipment ....................................................................................................... 99 8.17 Tax assets .....................................................................................................................................................................................100 8.18 Other assets ................................................................................................................................................................................ 101 8.19 Deposits ........................................................................................................................................................................................ 101 8.20 Deposits from banks ................................................................................................................................................................ 101 8.21 Deposits from customers ......................................................................................................................................................... 102 8.22 Debts evidenced by certificates ............................................................................................................................................ 102 8.23 Liabilities held for trading ....................................................................................................................................................... 102 8.24 Negative fair value of hedges (hedge accounting) ........................................................................................................... 103 8.25 Provisions ................................................................................................................................................................................... 103 8.26 Tax liabilities ...............................................................................................................................................................................105 8.27 Other liabilities ..........................................................................................................................................................................106 8.28 Subordinated capital ................................................................................................................................................................106 8.29 Equity ..........................................................................................................................................................................................106 8.30 Consolidated capital resources and regulatory capital adequacy requirements ..................................................... 1079. Segment information ...........................................................................................................................................................................108 9.1 Business segment information ..................................................................................................................................................108 9.2 Geographical information ...........................................................................................................................................................1 1 110. Supplementary information .............................................................................................................................................................. 1 12 10.1 Analysis of assets by maturities .............................................................................................................................................. 1 12 10.2 Analysis of liabilities by maturities ........................................................................................................................................ 1 13 10.3 Fair value disclosures in accordance with IFRS 7 ............................................................................................................... 1 14 10.4 Derivatives ................................................................................................................................................................................... 1 15 10.5 Analyses of assets and liabilities by IAS 39 measurement categories and currencies............................................. 1 18 10.6 Disclosures on related party relationships .......................................................................................................................... 122 10.7 Assets pledged as collateral .................................................................................................................................................... 124 10.8 Trust transactions ...................................................................................................................................................................... 124 10.9 Contingent liabilities, credit risk and latent legal risk ....................................................................................................... 124 10.10 Mortgage banking in accordance with the Pfandbriefgesetz (Covered Bond Act) ................................................... 125 10.11 Supplementary disclosure pursuant to section 237(8a) Austrian Business Code in conjunction with section 64(1) Banking Act ............................................................................... 125 10.12 Events after the reporting period ......................................................................................................................................... 126 10.13 Governing bodies of HYPO NOE Gruppe Bank AG ............................................................................................................ 127Declaration by the Company’s legal representatives .........................................................................................................................131Auditors’ report .......................................................................................................................................................................................... 132Report of the Supervisory Board ........................................................................................................................................................... 134
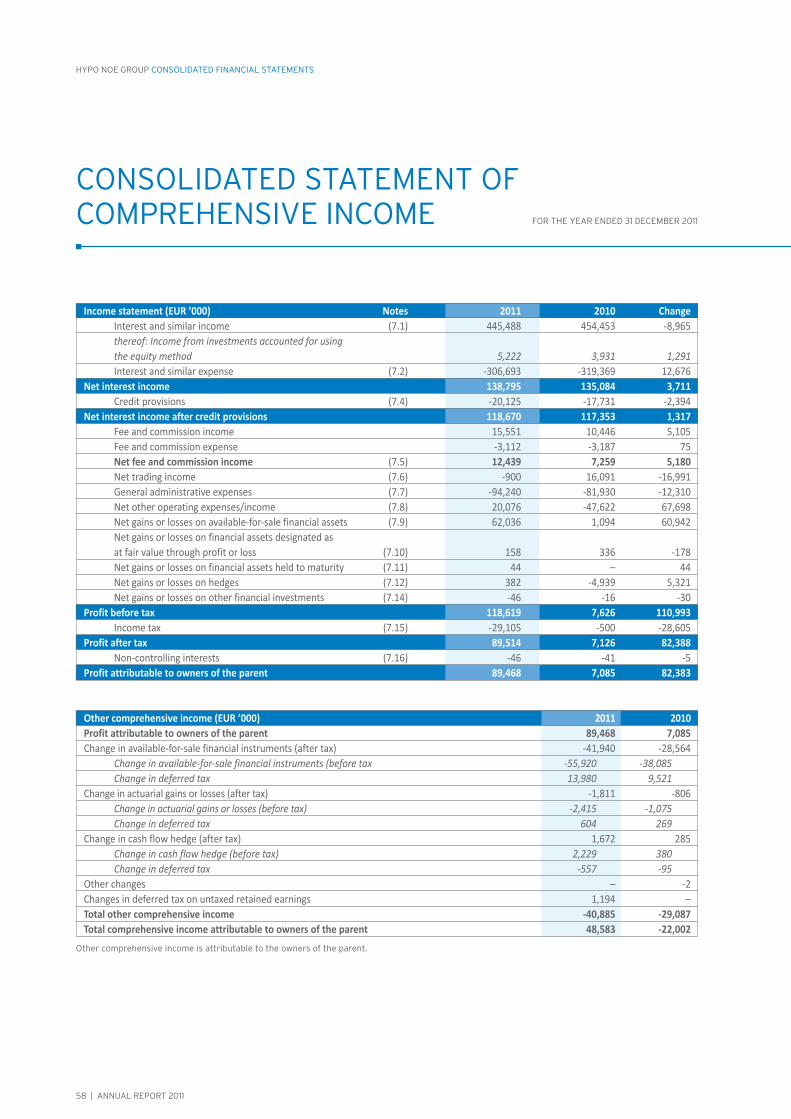
58 | ANNUAL REPORT 2011
HYPO NOE GROUP CONSOLIDATED FINANCIAL STATEMENTS
CONSOLIDATED STATEMENT OFCOMPREHENSIVE INCOME FOR THE YEAR ENDED 31 DECEMBER 2011
Income statement (EUR ’000) Notes 2011 2010 Change Interest and similar income (7.1) 445,488 454,453 -8,965 thereof: Income from investments accounted for using the equity method 5,222 3,931 1,291 Interest and similar expense (7.2) -306,693 -319,369 12,676 Net interest income 138,795 135,084 3,711 Credit provisions (7.4) -20,125 -17,731 -2,394 Net interest income after credit provisions 118,670 117,353 1,317 Fee and commission income 15,551 10,446 5,105 Fee and commission expense -3,112 -3,187 75 Net fee and commission income (7.5) 12,439 7,259 5,180 Net trading income (7.6) -900 16,091 -16,991 General administrative expenses (7.7) -94,240 -81,930 -12,310 Net other operating expenses/income (7.8) 20,076 -47,622 67,698 Net gains or losses on available-for-sale financial assets (7.9) 62,036 1,094 60,942 Net gains or losses on financial assets designated as at fair value through profit or loss (7.10) 158 336 -178 Net gains or losses on financial assets held to maturity (7.11) 44 – 44 Net gains or losses on hedges (7.12) 382 -4,939 5,321 Net gains or losses on other financial investments (7.14) -46 -16 -30 Profit before tax 118,619 7,626 110,993 Income tax (7.15) -29,105 -500 -28,605 Profit after tax 89,514 7,126 82,388 Non-controlling interests (7.16) -46 -41 -5 Profit attributable to owners of the parent 89,468 7,085 82,383
Other comprehensive income (EUR ’000) 2011 2010 Profit attributable to owners of the parent 89,468 7,085 Change in available-for-sale financial instruments (after tax) -41,940 -28,564 Change in available-for-sale financial instruments (before tax -55,920 -38,085 Change in deferred tax 13,980 9,521 Change in actuarial gains or losses (after tax) -1,811 -806 Change in actuarial gains or losses (before tax) -2,415 -1,075 Change in deferred tax 604 269 Change in cash flow hedge (after tax) 1,672 285 Change in cash flow hedge (before tax) 2,229 380 Change in deferred tax -557 -95 Other changes – -2 Changes in deferred tax on untaxed retained earnings 1,194 – Total other comprehensive income -40,885 -29,087 Total comprehensive income attributable to owners of the parent 48,583 -22,002 Other comprehensive income is attributable to the owners of the parent.
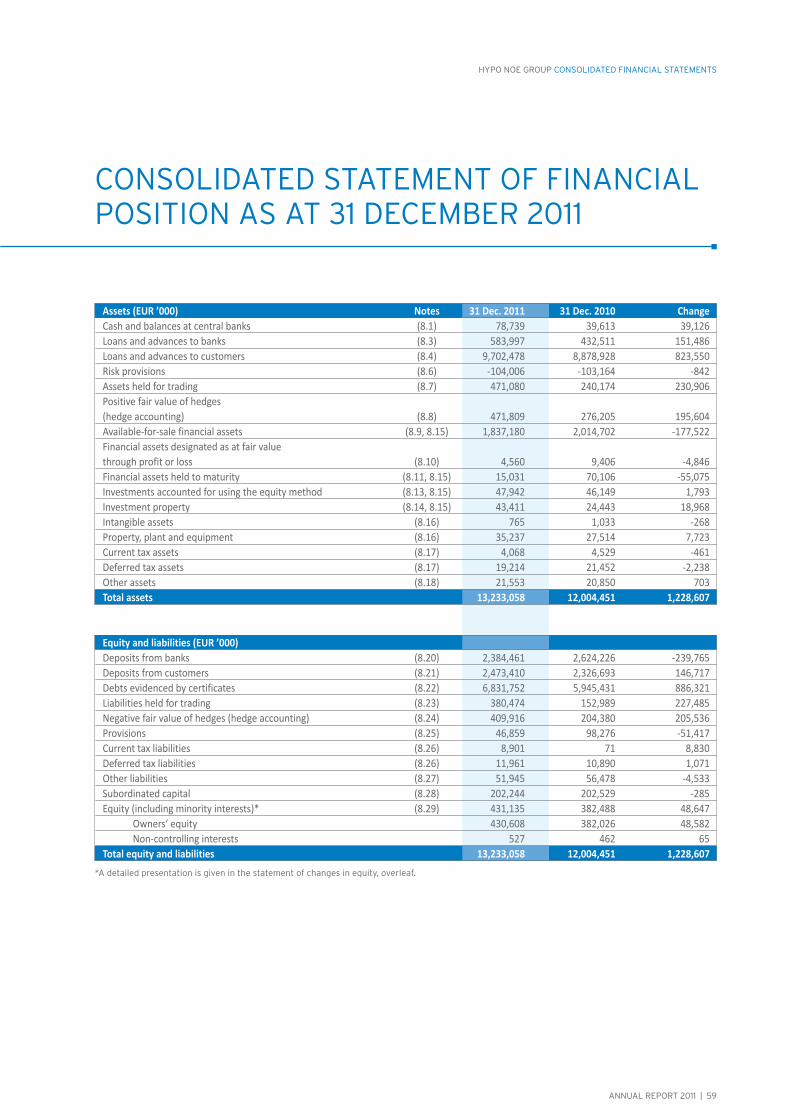
ANNUAL REPORT 2011 | 59
HYPO NOE GROUP CONSOLIDATED FINANCIAL STATEMENTS
CONSOLIDATED STATEMENT OF FINANCIAL POSITION AS AT 31 DECEMBER 2011
Assets (EUR ’000) Notes 31 Dec. 2011 31 Dec. 2010 Change Cash and balances at central banks (8.1) 78,739 39,613 39,126 Loans and advances to banks (8.3) 583,997 432,511 151,486 Loans and advances to customers (8.4) 9,702,478 8,878,928 823,550 Risk provisions (8.6) -104,006 -103,164 -842 Assets held for trading (8.7) 471,080 240,174 230,906 Positive fair value of hedges (hedge accounting) (8.8) 471,809 276,205 195,604 Available-for-sale financial assets (8.9, 8.15) 1,837,180 2,014,702 -177,522 Financial assets designated as at fair value through profit or loss (8.10) 4,560 9,406 -4,846 Financial assets held to maturity (8.11, 8.15) 15,031 70,106 -55,075 Investments accounted for using the equity method (8.13, 8.15) 47,942 46,149 1,793 Investment property (8.14, 8.15) 43,411 24,443 18,968 Intangible assets (8.16) 765 1,033 -268 Property, plant and equipment (8.16) 35,237 27,514 7,723 Current tax assets (8.17) 4,068 4,529 -461 Deferred tax assets (8.17) 19,214 21,452 -2,238 Other assets (8.18) 21,553 20,850 703 Total assets 13,233,058 12,004,451 1,228,607
Equity and liabilities (EUR ’000) Deposits from banks (8.20) 2,384,461 2,624,226 -239,765 Deposits from customers (8.21) 2,473,410 2,326,693 146,717 Debts evidenced by certificates (8.22) 6,831,752 5,945,431 886,321 Liabilities held for trading (8.23) 380,474 152,989 227,485 Negative fair value of hedges (hedge accounting) (8.24) 409,916 204,380 205,536 Provisions (8.25) 46,859 98,276 -51,417 Current tax liabilities (8.26) 8,901 71 8,830 Deferred tax liabilities (8.26) 11,961 10,890 1,071 Other liabilities (8.27) 51,945 56,478 -4,533 Subordinated capital (8.28) 202,244 202,529 -285 Equity (including minority interests)* (8.29) 431,135 382,488 48,647 Owners‘ equity 430,608 382,026 48,582 Non-controlling interests 527 462 65 Total equity and liabilities 13,233,058 12,004,451 1,228,607*A detailed presentation is given in the statement of changes in equity, overleaf.
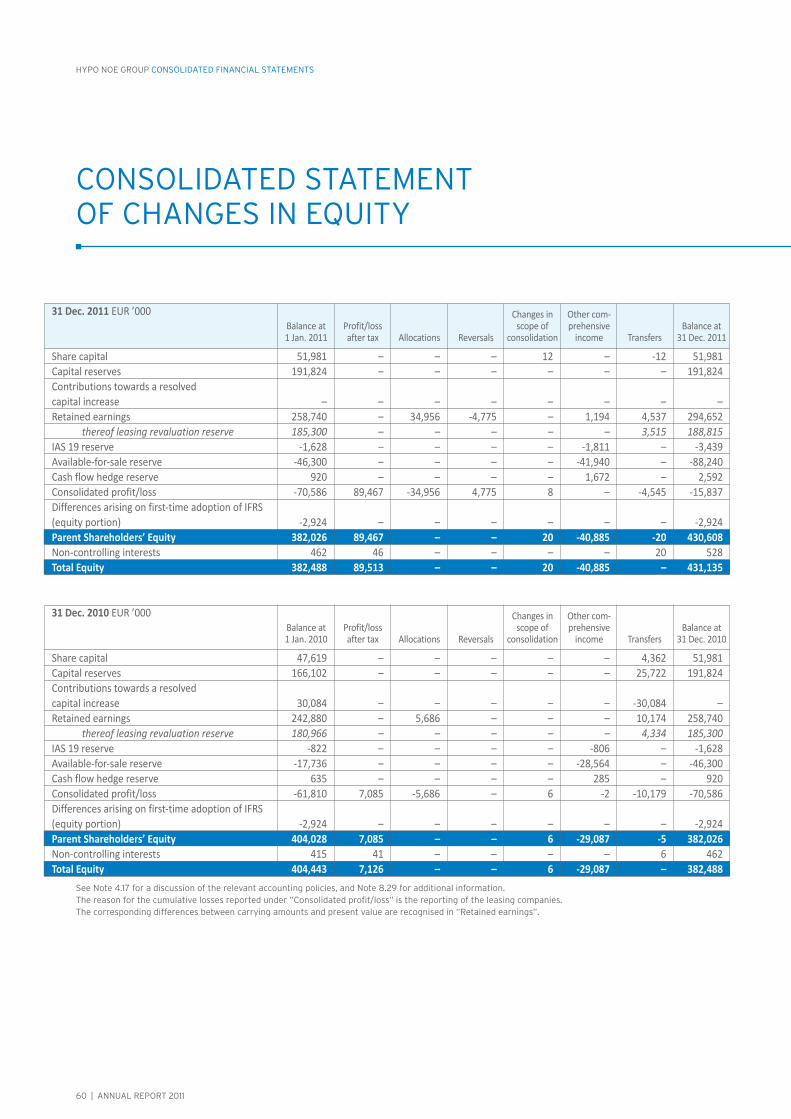
60 | ANNUAL REPORT 2011
HYPO NOE GROUP CONSOLIDATED FINANCIAL STATEMENTS
CONSOLIDATED STATEMENT OF CHANGES IN EQUITY
31 Dec. 2011 EUR ’000
Share capital 51,981 – – – 12 – -12 51,981 Capital reserves 191,824 – – – – – – 191,824 Contributions towards a resolved capital increase – – – – – – – – Retained earnings 258,740 – 34,956 -4,775 – 1,194 4,537 294,652 thereof leasing revaluation reserve 185,300 – – – – – 3,515 188,815 IAS 19 reserve -1,628 – – – – -1,811 – -3,439 Available-for-sale reserve -46,300 – – – – -41,940 – -88,240 Cash flow hedge reserve 920 – – – – 1,672 – 2,592 Consolidated profit/loss -70,586 89,467 -34,956 4,775 8 – -4,545 -15,837 Differences arising on first-time adoption of IFRS (equity portion) -2,924 – – – – – – -2,924 Parent Shareholders’ Equity 382,026 89,467 – – 20 -40,885 -20 430,608 Non-controlling interests 462 46 – – – – 20 528 Total Equity 382,488 89,513 – – 20 -40,885 – 431,135
31 Dec. 2010 EUR ’000
Share capital 47,619 – – – – – 4,362 51,981 Capital reserves 166,102 – – – – – 25,722 191,824 Contributions towards a resolved capital increase 30,084 – – – – – -30,084 – Retained earnings 242,880 – 5,686 – – – 10,174 258,740 thereof leasing revaluation reserve 180,966 – – – – – 4,334 185,300 IAS 19 reserve -822 – – – – -806 – -1,628 Available-for-sale reserve -17,736 – – – – -28,564 – -46,300 Cash flow hedge reserve 635 – – – – 285 – 920 Consolidated profit/loss -61,810 7,085 -5,686 – 6 -2 -10,179 -70,586 Differences arising on first-time adoption of IFRS (equity portion) -2,924 – – – – – – -2,924 Parent Shareholders’ Equity 404,028 7,085 – – 6 -29,087 -5 382,026 Non-controlling interests 415 41 – – – – 6 462 Total Equity 404,443 7,126 – – 6 -29,087 – 382,488
Balance at 1 Jan. 2011
Balance at 1 Jan. 2010
Profit/loss after tax
Profit/loss after tax
Allocations
Allocations
Reversals
Reversals
Changes in scope of
consolidation
Changes in scope of
consolidation
Other com-prehensive
income
Other com-prehensive
income
Transfers
Transfers
Balance at 31 Dec. 2011
Balance at 31 Dec. 2010
See Note 4.17 for a discussion of the relevant accounting policies, and Note 8.29 for additional information.The reason for the cumulative losses reported under ”Consolidated profit/loss” is the reporting of the leasing companies. The corresponding differences between carrying amounts and present value are recognised in ”Retained earnings”.

ANNUAL REPORT 2011 | 61
HYPO NOE GROUP CONSOLIDATED FINANCIAL STATEMENTS
CONSOLIDATED STATEMENT OF CASH FLOWS
EUR ’000 31 Dec. 2011 31 Dec. 2010 Profit after tax (before non-controlling interests) 89,514 7,126 Non-cash comprehensive income items Amortisation and depreciation 43,134 5,911 Allocations to and reversals of provisions and risk provisions -50,277 52,586 Gains on disposal of financial assets, and property, plant and equipment -92,716 -2,745 Other adjustments 18,936 -7,709 Changes in assets and liabilities due to operating activities after adjustments for non-cash components Loans and advances to banks -151,300 -56,687 Loans and advances to customers -628,690 -258,397 Available-for-sale financial assets 143,588 99,566 Other operating assets 3,716 -7,635 Deposits from banks -234,625 -409,888 Deposits from customers 117,924 -163,168 Debts evidenced by certificates 714,585 685,956 Other operating liabilities -58,197 4,056 Cash flows from operating activities -84,407 -51,028 Proceeds of sale of/redemption of: Financial assets held to maturity 55,041 28,945 Investments in associates 106,217 – Property, plant and equipment, intangible assets and investment property 2,119 199 Purchase of: Investments in associates -295 -247 Property, plant and equipment, intangible assets and investment property -39,263 -8,565 Cash flows from investing activities 123,818 20,331 Subordinated debt -285 -349 Cash flows from financing activities -285 -349
Cash and cash equivalents at end of previous period 39,613 70,658 Net cash used in operating activities -84,407 -51,028 Net cash from investing activities 123,818 20,331 Net cash used in financing activities -285 -349 Cash and cash equivalents at end of period 78,739 39,613
Payments of taxes, interest and dividends Income tax paid -3,088 -1,006 Interest received 432,952 308,422 Interest paid -309,172 -226,469 Dividends received 1,976 2,934Cash and cash equivalents consist of cash on hand and balances at central banks (Note 8.1). For an explanation of the relevant accounting principles see Note 6.


HYPO NOE GROUP KONZERNGESCHÄFTSBERICHT
NOTES TO THE CONSOLIDATED FINANCIAL
STATEMENTS AND GOVERNING BODIES
64 | ANNUAL REPORT 2011
HYPO NOE GROUP NOTES TO THE CONSOLIDATED FINANCIAL STATEMENTS
1. General information
HYPO NOE Gruppe Bank AG, domiciled at Kremser Gasse 20, 3100 St. Pölten, Austria is the Group’s parent bank. It is registered in the register of companies at the state/commercial court in St. Pölten, under FN 99073 x. HYPO NOE Gruppe Bank AG has been operating a branch at Wipplingerstrasse 4, 1010 Vienna since 2008.
HYPO NOE Gruppe Bank AG is one of Austria’s largest Landesbanken (state banks), and provides a comprehensive range of financial services via its subsidiaries. As the parent company of a group that also includes HYPO NOE Leasing GmbH and HYPO NOE Real Consult GmbH, HYPO NOE Gruppe Bank AG mainly serves large state and local govern-ment clients. It specialises in providing services related to public finance, real estate finance and treasury for clients based in Austria and abroad. HYPO NOE Landesbank AG is a full-service bank for retail customers, professionals and business customers in Lower Austria and Vienna with 28 branches.
The 2011 consolidated financial statements will be published in the Wiener Zeitung on 27 April 2012, and posted under Investor Relations/Publications/Reports on the Group’s site (www.hyponoe.at).
Readers are referred to the Group operational and financial review for information on key events during the reporting period.
2. Accounting principles
The consolidated financial statements of the HYPO NOE Group for the year ended 31 December 2011 were drawn up in accordance with section 245a UGB (Austrian Business Code) and section 59a BWG (Banking Act), as well as Regulation (EC) No 1606/2002 of the European Parliament and of the Council of 19 July 2002. The statements were prepared on the basis of the International Financial Reporting Standards (IFRSs) and International Accounting Standards (IAS) issued by the International Accounting Standards Board (IASB), as well as the interpretations issued by the Standing Interpreta-tions-Committee (SIC) and the International Financial Reporting Committee (IFRIC).
The consolidated financial statements have been prepared in accordance with the IFRS/IAS standards and interpretations adopt-ed and published by the European Union up to 31 December 2011, and applicable to the business activities of the HYPO NOE Group.
Amended standards applied to the 2011 financial statements
Apart from the Improvements to IFRSs, the following amended standards are relevant to the 2011 consolidated financial statements:
IAS 24 Related Party Disclosures, effective for annual periods beginning on or after 1 January 2011This standard was adopted early, and it was applied to the financial statements for the year ended 31 Decem-ber 2010.
IAS 19 Employee Benefits, mandatory effective date: 1 January 2013The HYPO NOE Group has adopted the revised IAS 19 early, and it was applied to the financial statements for the year ended 31 December 2011. The amendments to the standard relate to the recognition of actuarial gains and losses in other comprehensive income (OCI) and the elimination of the “corridor” approach. The HYPO NOE Group’s financial reporting was not affected by this change, as actuarial gains and losses were already shown in OCI before adoption of the revised standard. Another amendment concerns the expected returns (at the discount rate) on plan assets. The HYPO NOE Group does not have any plan assets. The additional dis-closures required by the revised standard are already to be found in the notes to the 2011 financial statements.
New and amended standards not applied to the 2011 financial statementsThe following standards which entered into effect in 2011 were not applied, as they were not relevant to any material transactions within the HYPO NOE Group. They might, however, affect the accounting treatment of future transactions or agreements.
IFRIC 14 Prepayments of a Minimum Funding Requirement, mandatory effective date: 1 January 2011
IFRS 1 First-time Adoption of International Financial Reporting Standards, mandatory effective date: 1 July 2011The amendments to IFRS 1 have no influence on the Group’s consolidated financial statements, as it is not a first-time adopter.
ANNUAL REPORT 2011 | 65
HYPO NOE GROUP NOTES TO THE CONSOLIDATED FINANCIAL STATEMENTS
New and amended standards not yet effective The following IFRS standards and interpretations which have already been issued, but are not yet mandatory, are rel-evant to the consolidated financial statements, but have not been applied early:
IAS 12/SIC 21 Income Taxes, mandatory effective date: 1 January 2012Under the amendments to IAS 12, the treatment of investment property (IAS 40) established by SIC 21 In-come Taxes – Recovery of Revalued Non-Depreciable Assets is eliminated, and the other rules established by the interpretation, for property, plant and equipment, and intangible assets (revaluation model, IAS 16 and IAS 38), are included in IAS 12. As the HYPO NOE Group recognises assets at the carrying amounts when applying IAS 40, IAS 16 and IAS 38 the revaluation model is not relevant to the recognition of deferred tax.
Presentation of Items of Other Comprehensive Income (amendments to IAS 1), mandatory effective date: 1 July 2012The Group’s consolidated financial statements for 2012 will reflect the changes in the presentation of other comprehensive income introduced by these amendments.
IFRS 10 Consolidated Financial Statements, mandatory effective date: 1 January 2013
IFRS 10 creates a consistent definition of control, and thus a uniform basis for establishing whether a parent-subsidiary relationship exists, and for determining the scope of consolidation. This standard replaces IAS 27 Consolidated and Separate Financial Statements (2008) and SIC 12 Consolidation – Special Purpose Entities, both of which were relevant to the Group’s financial reporting.As things stand it does not appear that this will result in any significant changes in the consolidation of the Group’s financial statements.
IFRS 11 Joint Arrangements, mandatory effective date: 1 January 2013IFRS establishes principles for financial reporting by parties to arrangements where there is joint control of a joint venture or joint operation. The new standard replaces IAS 31 Interests in Joint Ventures and SIC 13 Jointly Controlled Entities – Non-Monetary Contribution by Venturers.The main change from IAS 31 is the elimination of proportionate consolidation as a method of accounting for joint ventures; in future, the equity method will have to be used.As the HYPO NOE Group does not employ proportionate consolidation, the new standard will not affect the manner in which it accounts for joint ventures.
IFRS 12 Disclosure of Interest in Other Entities, mandatory effective date: 1 January 2013IFRS 12 governs the disclosures in the notes regarding subsidiaries, associates, unconsolidated structured entities and joint arrangements. The additional disclosure requirements will result in an increased administrative workload for the HYPO NOE Group.
IAS 27 (2011) Separate Financial Statements, mandatory effective date: 1 January 2013IAS 27 has been revised to bring it into line with IFRS 10, IFRS 11 and IFRS 12. These adjustments will have no influence on the consolidated financial reporting of the HYPO NOE Group.
IAS 28 (2011) Investments in Associates and Joint Ventures, mandatory effective date: 1 January 2013IAS 28 has been harmonised with IFRS 10, IFRS 11 and IFRS 12.These adjustments will have no influence on the consolidated financial reporting of the HYPO NOE Group.
IFRS 13 Fair Value Measurement, mandatory effective date: 1 January 2013IFRS 13 provides a single definition of fair value, which was previously governed by a variety of standards. The focus is on the measurement of fair value. This new standard has resulted in the unification of the dis-closures made in the notes, and in the provision of additional information. The augmented disclosures will result in an increased administrative workload for the HYPO NOE Group.
Offsetting Financial Assets and Financial Liabilities (amendments to IAS 32), mandatory effective date: 1 January 2014in conjunction with
Disclosures – Offsetting Financial Assets and Financial Liabilities (amendments to IFRS 7), mandatory effec-tive date: 1 January 2013

66 | ANNUAL REPORT 2011
HYPO NOE GROUP NOTES TO THE CONSOLIDATED FINANCIAL STATEMENTS
The IASB has introduced additional disclosure requirements to increase comparability with US GAAP. The offsetting model established by IAS 32 is retained as such, but the new disclosure requirements call for the statement of the gross amounts before offsetting and the net amounts after offsetting in the notes (para-graph 42, IAS 32).The new requirements also affect financial instruments that are only subject to certain netting agreements, regardless of whether they are actually set off in the statement of financial position.
IFRS 9 Financial Instruments, mandatory effective date: 1 January 2015On 16 December 2011 the IASB deferred initial application of this standard from 1 January 2013 to 1 January 2015. The background to this is the intention to ensure that all the provisions of IFRS 9 are applied simultane-ously, as only the work on the recognition and measurement of financial instruments has so far been complet-ed; impairment and hedge accounting are still being discussed as part of the IAS 39 replacement project.The Board has also decided to dispense with the restatement of comparative period figures on initial appli-cation of IFRS 9. Nevertheless, the latter will lead to additional disclosures under IFRS 7.
IFRS 9 Financial Instruments: Classification and Measurement will bring considerable changes for the HYPO NOE Group with regard to the categorisation of financial instruments. The Group launched a classification and measurement project towards the end of 2011.
At present there are four categories of financial assets: 1. at fair value through profit or loss (held for trading and fair value option); 2. held to maturity (HTM); 3. loans and receivables (LAR); and 4. available for sale (AFS). These will be replaced by two new categories: 1. amortised cost; and 2. at fair value. Classification will be according to the business model for managing the assets, and their characteristics. Measurement will be at amortised cost if an asset is held within a business model whose objective is to collect contractual cash flows, and if the contractual terms of the asset give rise on specified dates to cash flows that are solely payments of principal and interest. If it is not possible to identify these factors, the financial instruments will normally be measured at fair value through profit or loss.
It will be necessary to recognise all equity instruments that are subject to IFRS 9 at fair value, and any sub-sequent gains or losses in profit or loss. Exemptions will be possible if the entity elects to recognise equity instruments at fair value through other comprehensive income. In this case dividends from the investment will have to be recognised in profit or loss.
There will no longer be an obligation to separate embedded derivatives from the hosts. Embedded deriva-tives will be accounted for as combined instruments, and measured at fair value through profit or loss.
Exposure draft An important exposure draft that will influence the Group’s consolidated financial reporting if it is adopted is:
IAS 17 Leases, originally due to enter into effect in the second quarter of 2011, but now deferred
In July 2011 the IASB and FASB announced that they had decided to publish a new draft and again invite comments. It remains to be seen whether the standard will enter into effect in 2013 as planned.
ANNUAL REPORT 2011 | 67
HYPO NOE GROUP NOTES TO THE CONSOLIDATED FINANCIAL STATEMENTS
3. Accounting and measurement policies
The consolidated financial statements of the HYPO NOE Group for the year ended 31 December 2011 comprise the state-ment of comprehensive income, the consolidated statement of financial position, the consolidated statement of changes in equity, the consolidated statement of cash flows and the notes. The segment information is contained in the notes.
The risk report forms part of the operational and financial review, prepared in compliance with section 267 UGB (Austrian Business Code).
These consolidated financial statements are based on the separate financial statements of all the consolidated Group companies as at 31 December 2011, drawn up in accordance with IFRS. The HYPO NOE Group applies uniform Group-wide accounting policies.
The consolidated financial statements have been prepared on a going concern basis.
The Group’s significant accounting policies are discussed below.
The methods described are uniformly and consistently applied to these consolidated financial statements unless other-wise stated.
Income and expenses are recognised on an accrual basis. They are recorded and reported in the periods to which they are attributable. Premiums and discounts are amortised using the effective interest method; the accrued interest is in-cluded in the item under which the underlying financial instrument is carried.
All the estimates and judgements required by IFRS accounting are best estimates made in accordance with the relevant standards. The estimates are reviewed on an ongoing basis, and are based on experience and other factors including expectations regarding future events which appear reasonable under the circumstances. Particularly frequent use of estimates and assumptions was made when valuing investments, recognising deferred tax assets attributable to tax loss carry-forwards, and recognising credit provisions (estimating recoverable amounts and calculating default probabilities), as well as performing fair value measurement (on the basis of observable market data). Where heavy reliance on esti-mates was necessary, the assumptions made in respect of the items concerned are detailed in separate notes.
Mandatory disclosures under IFRS 7 that relate to the nature and extent of risks associated with financial instruments are also made in the risk report (pages 26ff). This forms part of the Group operational and financial review.
The reporting currency is the euro. All figures are presented in thousand euro (EUR thsd/EUR ’000) unless otherwise stated. The tables below may contain rounding differences.
68 | ANNUAL REPORT 2011
HYPO NOE GROUP NOTES TO THE CONSOLIDATED FINANCIAL STATEMENTS
3.1 Basis of consolidation
The consolidated financial statements of the HYPO NOE Group include all the subsidiaries that are directly or indirectly controlled by the parent, and are material to the presentation of the Group’s assets, finances and earnings. Apart from the parent, HYPO NOE Gruppe Bank AG, the statements include a total of 54 domestic subsidiaries in which the Group holds more than half of the voting power or which it controls by other means. A total of 47 domestic subsidiaries were included in consolidation in 2010.
In addition, 34 domestic companies are accounted for using the equity method. In 2010 the equity method was used to account for 34 domestic companies and one foreign entity in the Group’s consolidated financial statements. The Group’s holdings in these companies are set out in Note 3.2.
Subsidiaries are included in the consolidated financial statements at the date on which control is obtained. Control exists where the Bank has the power to govern the financial and operating policies of an entity so as to obtain benefits from its activities.
Consolidation is performed in accordance with IFRS 3 Business Combinations, using the purchase method. The assets acquired and liabilities assumed are recognised at their acquisition date fair values. Any excess of the cost over the fair value of the net assets acquired is reported as goodwill. Negative differences are recognised immediately in profit or loss. The carrying value of the goodwill is tested for impairment at least once a year. Under IFRS 1, it is not necessary to ap-ply IFRS 3 to business combinations that occurred before the effective date of IFRS 3. Because of this the consolidation method used for the UGB consolidated financial statements was applied. The cost of the investments was netted against the share of the carrying value of their equity held at the date of consolidation. The resultant positive and negative dif-ferences arising on consolidation were set off against the reserves and reported as a separate item, “Differences arising on first-time adoption of IFRS”, in the statement of changes in equity.
The share of the equity and profit or loss of majority-owned subsidiaries of the HYPO NOE Group attributable to non-controlling interests is separately reported, respectively, as “Non-controlling interests” in the statement of changes in equity on page 62, and in the item of the same name, after net profit, in the statement of comprehensive income (Note 7.16). The results of subsidiaries acquired or divested during the year are recognised in the statement of comprehensive income, in accordance with the actual acquisition or disposal dates.
All material intra-group transactions are eliminated on consolidation.
The HYPO NOE Group does not apply proportionate consolidation.
Joint ventures (IAS 31) and associates (IAS 28) are accounted for using the equity method unless they are immaterial to the presentation of the Group’s assets, finances and earnings, are not associated with risks and rewards of ownership, or are not-for-profit organisations (Note 3.2). If an entity accounted for using the equity method applies accounting policies diverging from those of the Group, adjustments are made to align the investee’s accounting policies to the Group IFRS policies. Joint ventures and associates are reported under a separate item in the statement of financial position, “Invest-ments accounted for using the equity method” (Note 8.13), and under “Income from investments accounted for using the equity method” as a sub-item of “Interest and similar income” (Note 7.1).
Interests in non-consolidated subsidiaries and other investments are measured at fair value or at amortised cost. Impair-ment is recognised immediately, and is reported under “Available-for-sale financial assets” (Notes 8.9. and 3.2).
ANNUAL REPORT 2011 | 69
HYPO NOE GROUP NOTES TO THE CONSOLIDATED FINANCIAL STATEMENTS
Changes in 2011Formations The following new companies were included in the consolidated financial statements for the first time in 2011.
Orchisgasse 66 Liegenschaftserrichtungs- und -verwertungs GmbH was registered on 17 May 2011 as a wholly-owned subsidiary of HYPO NOE Real Consult GmbH.
Steinmüllergasse 64 Development GmbH was registered on 26 October 2011. NÖ Hypo Beteiligungsholding GmbH holds 97% of this company, and HYPO NOE Real Consult GmbH 3%.
HYPO Immobilien-Beteiligungsholding GmbH, a wholly-owned subsidiary of HYPO NOE Gruppe Bank AG, was registered on 25 October 2011.
The following companies were formed as wholly-owned subsidiaries of HYPO Immobilien-Beteiligungsholding:
HYPO Alpha Immobilienerrichtungs- und Verwertungs GmbH, registered on 22 November 2011; HYPO Beta Immobilienerrichtungs- und Verwertungs GmbH, registered on 23 November 2011; HYPO Gamma Immobilienerrichtungs- und Verwertungs GmbH, registered on 23 November 2011; and HYPO Delta Immobilienerrichtungs- und Verwertungs GmbH, registered on 23 November 2011.
AcquisitionsNÖ Hypo Beteiligungsholding acquired a 50% interest in Franz-Glaser-Gasse 28 Immobilienentwicklung GmbH from FE-LICE Immobilienentwicklung GmbH by notarial deed on 1 September 2011. The HYPO NOE Group accounts for this invest-ment using the equity method.
Changes in holdingsThe parent HYPO NOE Leasing GmbH sold 33.3% of HOSPES-Grundstückverwaltungs Gesellschaft m.b.H., previously a wholly-owned subsidiary, to the Immorent GmbH subholding on 15 September 2011. HOSPES-Grundstückverwaltungs Gesellschaft is still included in consolidation.
DeconsolidationsOn 20 January 2011 the Group sold its 30% interest in HYPO Real Invest AG, which had been accounted for using the equity method, to IVG Immobilien AG, a listed German company.
During the first half of 2011 the words “In Voluntary Liquidation” were added to the name of Augustus Funding Limited, an entity accounted for using the equity method. The liquidation was completed, but had not been entered in the Irish register of companies by the end of the reporting period. Due to the return of the share capital, this company was de-consolidated.
3.2 Investments
The following consolidated, directly or indirectly held subsidiaries were included in the IFRS consolidated financial state-ments of HYPO NOE Gruppe Bank AG as at 31 December 2011:

70 | ANNUAL REPORT 2011
HYPO NOE GROUP NOTES TO THE CONSOLIDATED FINANCIAL STATEMENTS
Company name 54 consolidated subsidiaries HYPO NOE Gruppe Bank AG St. Pölten 31.12.2011 Gruppe Bank HYPO NOE Landesbank AG St. Pölten 100.00% - 31.12.2011 Landesbank HYPO NOE Leasing GmbH St. Pölten 100.00% - 31.12.2011 Leasing CALCULATOR Grundstückvermietungs Gesellschaft m.b.H. St. Pölten 100.00% 75.00% 31.12.2011 Leasing CURIA Grundstückvermietungs Gesellschaft m.b.H. St. Pölten 100.00% 75.00% 31.12.2011 Leasing FAVIA Grundstückvermietungs Gesellschaft m.b.H. St. Pölten 100.00% 100.00% 31.12.2011 Leasing NÖ. Verwaltungszentrum- Verwertungsgesellschaft m.b.H. St. Pölten 100.00% 100.00% 31.12.2011 Leasing PROVENTUS Grundstückvermietungs Gesellschaft m.b.H. St. Pölten 100.00% 100.00% 31.12.2011 Leasing Sana Grundstückverwaltungs Gesellschaft m.b.H. St. Pölten 100.00% 100.00% 31.12.2011 Leasing Telos Mobilien - Leasinggesellschaft m.b.H. St. Pölten 100.00% 100.00% 31.12.2011 Leasing Treisma Grundstücksverwaltungs Gesellschaft m.b.H. St. Pölten 100.00% 100.00% 31.12.2011 Leasing VIA-Grundstückverwaltungs Gesellschaft m.b.H. St. Pölten 100.00% 100.00% 31.12.2011 Leasing HYPO Niederösterreich-Immobilienleasinggesellschaft m.b.H. St. Pölten 100.00% 100.00% 31.12.2011 Leasing HYPO Niederösterreichische Liegenschaft GmbH St. Pölten 100.00% 100.00% 31.12.2011 Other NEUROM Grundstückvermietungs Gesellschaft m.b.H. St. Pölten 100.00% 100.00% 31.12.2011 Leasing NÖ. HYPO LEASING URBANITAS Grundstückvermietungs Gesellschaft m.b.H. St. Pölten 100.00% 100.00% 31.12.2011 Leasing AELIUM Grundstückvermietungs Gesellschaft m.b.H. St. Pölten 100.00% 100.00% 31.12.2011 Leasing NÖ. HYPO LEASING Landesklinken Equipment GmbH St. Pölten 100.00% 100.00% 31.12.2011 Leasing Obere Donaustrasse 61 Liegenschaftserrichtungs- und -verwertungs GmbH St. Pölten 100.00% 100.00% 31.12.2011 Other NÖ. HYPO LEASING AGILITAS Grundstücksvermietung Gesellschaft m.b.H. St. Pölten 100.00% 75.00% 31.12.2011 Leasing ALARIS Grundstückvermietungs Gesellschaft m.b.H. St. Pölten 100.00% 75.00% 31.12.2011 Leasing CALLIDUS Grundstückvermietungs Gesellschaft m.b.H. St. Pölten 100.00% 100.00% 31.12.2011 Leasing CLIVUS Grundstückvermietungs Gesellschaft m.b.H. St. Pölten 100.00% 100.00% 31.12.2011 Leasing COMITAS Grundstückvermietungs Gesellschaft m.b.H. St. Pölten 100.00% 100.00% 31.12.2011 Leasing NÖ. HYPO LEASING FIRMITAS Grundstückvermietungs Gesellschaft m.b.H. St. Pölten 100.00% 100.00% 31.12.2011 Leasing NÖ. HYPO LEASING GERUSIA Grundstückvermietungs Gesellschaft m.b.H. St. Pölten 100.00% 75.00% 31.12.2011 Leasing PINUS Grundstückvermietungs Gesellschaft m.b.H. St. Pölten 99.00% 99.00% 31.12.2011 Leasing NÖ. HYPO LEASING STRUCTOR Grundstückvermietungs Gesellschaft m.b.H. St. Pölten 100.00% 75.00% 31.12.2011 Leasing VIRTUS Grundstückvermietungs Gesellschaft m.b.H. St. Pölten 100.00% 100.00% 31.12.2011 Leasing VOLUNTAS Grundstückvermietungs Gesellschaft m.b.H. St. Pölten 65.00% 65.00% 31.12.2011 Leasing VESCUM Grundstücksvermietungs GmbH St. Pölten 100.00% 100.00% 31.12.2011 Leasing SATORIA Grundstückvermietung GmbH St. Pölten 100.00% 100.00% 31.12.2011 Leasing HOSPES-Grundstückverwaltungs Gesellschaft m.b.H. St. Pölten 66.67% 66.67% 31.12.2011 Leasing Landeskrankenhaus Tulln-Immobilienvermietung Gesellschaft m.b.H. St. Pölten 100.00% 56.42% 31.12.2011 Leasing HYPO-REAL 93 Mobilien-Leasinggesellschaft m.b.H. St. Pölten 100.00% 100.00% 31.12.2011 Leasing NÖ. HYPO LEASING DECUS Grundstückvermietungs Gesellschaft m.b.H. St. Pölten 100.00% - 31.12.2011 Other NÖ. HYPO LEASING MENTIO Grundstücksvermietungs Gesellschaft m.b.H. St. Pölten 100.00% 100.00% 31.12.2011 Leasing NÖ. HYPO LEASING NITOR Grundstücksvermietungs Gesellschaft m.b.H. St. Pölten 100.00% 100.00% 31.12.2011 Leasing NÖ. HYPO LEASING MEATUS Grundstückvermietungs Gesellschaft m.b.H. St. Pölten 100.00% 75.00% 31.12.2011 Leasing NÖ. HYPO LEASING ASTEWOG Grundstückvermietungs Gesellschaft m.b.H. St. Pölten 100.00% 75.00% 31.12.2011 Leasing NEMUS Grundstückvermietungs Gesellschaft m.b.H. St. Pölten 100.00% 75.00% 31.12.2011 Leasing HYPO NOE Real Consult GmbH St. Pölten 100.00% 100.00% 31.12.2011 Other HBV Beteiligungs-GmbH St. Pölten 100.00% - 31.12.2011 Other ZELUS Grundstückvermietungs Gesellschaft m.b.H. St. Pölten 100.00% 100.00% 31.12.2011 Leasing Benkerwiese Verwaltungs-und Verwertungsgesellschaft m.b.H. St. Pölten 100.00% 100.00% 31.12.2011 Other Orchisgasse 66 Liegenschaftserrichtungs- und -verwertungs GmbH St. Pölten 100.00% 100.00% 31.12.2011 Other Steinmüllergasse 64 Development GmbH St. Pölten 100.00% 100.00% 31.12.2011 Other HYPO Real Estate Advisory GmbH St. Pölten 100.00% 10.00% 31.12.2011 Other NÖ Hypo Beteiligungsholding GmbH St. Pölten 100.00% - 31.12.2011 Other HYPO Immobilien-Beteiligungsholding GmbH St. Pölten 100.00% - 31.12.2011 Other HYPO Alpha Immobilienerrichtungs- und Verwertungs GmbH St. Pölten 100.00% 100.00% 31.12.2011 Other HYPO Beta Immobilienerrichtungs- und Verwertungs GmbH St. Pölten 100.00% 100.00% 31.12.2011 Other HYPO Gamma Immobilienerrichtungs- und Verwertungs GmbH St. Pölten 100.00% 100.00% 31.12.2011 Other HYPO Delta Immobilienerrichtungs- und Verwertungs GmbH St. Pölten 100.00% 100.00% 31.12.2011 Other
Domicile Holding
thereof indirect interest
End of reporting
period Segment
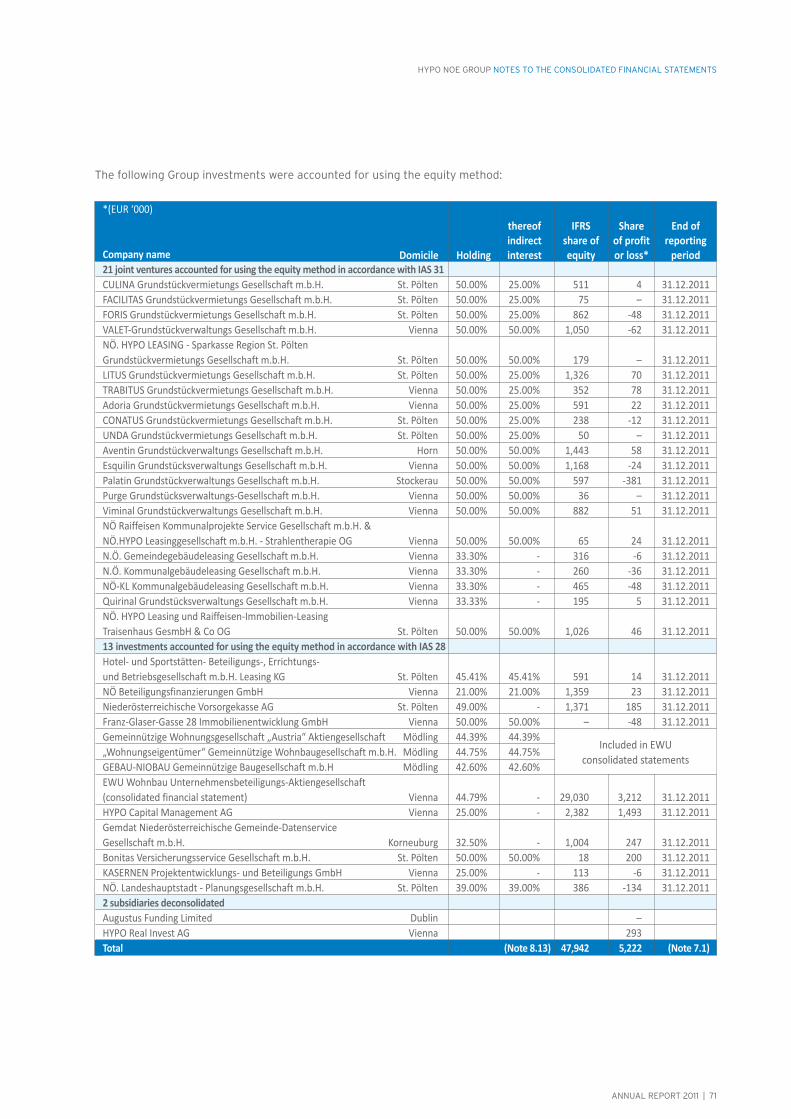
ANNUAL REPORT 2011 | 71
HYPO NOE GROUP NOTES TO THE CONSOLIDATED FINANCIAL STATEMENTS
The following Group investments were accounted for using the equity method:
*(EUR ‘000)
Company name 21 joint ventures accounted for using the equity method in accordance with IAS 31 CULINA Grundstückvermietungs Gesellschaft m.b.H. St. Pölten 50.00% 25.00% 511 4 31.12.2011 FACILITAS Grundstückvermietungs Gesellschaft m.b.H. St. Pölten 50.00% 25.00% 75 – 31.12.2011 FORIS Grundstückvermietungs Gesellschaft m.b.H. St. Pölten 50.00% 25.00% 862 -48 31.12.2011 VALET-Grundstückverwaltungs Gesellschaft m.b.H. Vienna 50.00% 50.00% 1,050 -62 31.12.2011 NÖ. HYPO LEASING - Sparkasse Region St. Pölten Grundstückvermietungs Gesellschaft m.b.H. St. Pölten 50.00% 50.00% 179 – 31.12.2011 LITUS Grundstückvermietungs Gesellschaft m.b.H. St. Pölten 50.00% 25.00% 1,326 70 31.12.2011 TRABITUS Grundstückvermietungs Gesellschaft m.b.H. Vienna 50.00% 25.00% 352 78 31.12.2011 Adoria Grundstückvermietungs Gesellschaft m.b.H. Vienna 50.00% 25.00% 591 22 31.12.2011 CONATUS Grundstückvermietungs Gesellschaft m.b.H. St. Pölten 50.00% 25.00% 238 -12 31.12.2011 UNDA Grundstückvermietungs Gesellschaft m.b.H. St. Pölten 50.00% 25.00% 50 – 31.12.2011 Aventin Grundstückverwaltungs Gesellschaft m.b.H. Horn 50.00% 50.00% 1,443 58 31.12.2011 Esquilin Grundstücksverwaltungs Gesellschaft m.b.H. Vienna 50.00% 50.00% 1,168 -24 31.12.2011 Palatin Grundstückverwaltungs Gesellschaft m.b.H. Stockerau 50.00% 50.00% 597 -381 31.12.2011 Purge Grundstücksverwaltungs-Gesellschaft m.b.H. Vienna 50.00% 50.00% 36 – 31.12.2011 Viminal Grundstückverwaltungs Gesellschaft m.b.H. Vienna 50.00% 50.00% 882 51 31.12.2011 NÖ Raiffeisen Kommunalprojekte Service Gesellschaft m.b.H. & NÖ.HYPO Leasinggesellschaft m.b.H. - Strahlentherapie OG Vienna 50.00% 50.00% 65 24 31.12.2011 N.Ö. Gemeindegebäudeleasing Gesellschaft m.b.H. Vienna 33.30% - 316 -6 31.12.2011 N.Ö. Kommunalgebäudeleasing Gesellschaft m.b.H. Vienna 33.30% - 260 -36 31.12.2011 NÖ-KL Kommunalgebäudeleasing Gesellschaft m.b.H. Vienna 33.30% - 465 -48 31.12.2011 Quirinal Grundstücksverwaltungs Gesellschaft m.b.H. Vienna 33.33% - 195 5 31.12.2011 NÖ. HYPO Leasing und Raiffeisen-Immobilien-Leasing Traisenhaus GesmbH & Co OG St. Pölten 50.00% 50.00% 1,026 46 31.12.2011 13 investments accounted for using the equity method in accordance with IAS 28 Hotel- und Sportstätten- Beteiligungs-, Errichtungs- und Betriebsgesellschaft m.b.H. Leasing KG St. Pölten 45.41% 45.41% 591 14 31.12.2011 NÖ Beteiligungsfinanzierungen GmbH Vienna 21.00% 21.00% 1,359 23 31.12.2011 Niederösterreichische Vorsorgekasse AG St. Pölten 49.00% - 1,371 185 31.12.2011 Franz-Glaser-Gasse 28 Immobilienentwicklung GmbH Vienna 50.00% 50.00% – -48 31.12.2011 Gemeinnützige Wohnungsgesellschaft „Austria“ Aktiengesellschaft Mödling 44.39% 44.39% „Wohnungseigentümer“ Gemeinnützige Wohnbaugesellschaft m.b.H. Mödling 44.75% 44.75% GEBAU-NIOBAU Gemeinnützige Baugesellschaft m.b.H Mödling 42.60% 42.60% EWU Wohnbau Unternehmensbeteiligungs-Aktiengesellschaft (consolidated financial statement) Vienna 44.79% - 29,030 3,212 31.12.2011 HYPO Capital Management AG Vienna 25.00% - 2,382 1,493 31.12.2011 Gemdat Niederösterreichische Gemeinde-Datenservice Gesellschaft m.b.H. Korneuburg 32.50% - 1,004 247 31.12.2011 Bonitas Versicherungsservice Gesellschaft m.b.H. St. Pölten 50.00% 50.00% 18 200 31.12.2011 KASERNEN Projektentwicklungs- und Beteiligungs GmbH Vienna 25.00% - 113 -6 31.12.2011 NÖ. Landeshauptstadt - Planungsgesellschaft m.b.H. St. Pölten 39.00% 39.00% 386 -134 31.12.2011 2 subsidiaries deconsolidated Augustus Funding Limited Dublin – HYPO Real Invest AG Vienna 293 Total (Note 8.13) 47,942 5,222 (Note 7.1)
Domicile Holding
thereof indirect interest
IFRS share of equity
Share of profit or loss*
End of reporting
period
Included in EWU consolidated statements

72 | ANNUAL REPORT 2011
HYPO NOE GROUP NOTES TO THE CONSOLIDATED FINANCIAL STATEMENTS
The following companies in which the Group holds interests of more than 50% were treated as AFS investments due to their being not-for-profit organisations, immaterial, or not associated with risks and rewards of ownership.
The following companies in which the Group holds 20–50% were recognised as AFS investments:
*(EUR ’000)
Company name Non-consolidated AFS investments (interest > 50%) Castellum Schallaburg Grundstückvermietungs Gesellschaft m.b.H. St. Pölten 100.00% 100.00% -94 -42 31.12.2010 VIA DOMINORUM Grundstückverwertungs Gesellschaft m.b.H. St. Pölten 95.00% 95.00% -6,934 -7,617 31.12.2010 WPS-Wirtschaftspark Sieghartskirchen Gesellschaft m.b.H. St. Pölten 100.00% 100.00% -1,155 -164 31.12.2010 Liegenschaftsverwertung Felixdorf GmbH St. Pölten 100.00% 100.00% -1,238 -56 31.12.2010 Wilax Wien-Laxenburg NÖ Veranstaltungs Gesellschaft mbH St. Pölten 100.00% 100.00% 17 3 31.12.2010 NÖ Kulturwirtschaft GesmbH St. Pölten 52.52% 52.52% 4,334 599 31.12.2010 Wohnpark Schrems Liegenschaftsverwertungs Gesellschaft m.b.H. St. Pölten 100.00% 100.00% -82 -26 31.12.2010
Domicile Holding
thereof indirect interest
Registered capital*
Profit/loss reported in register of
companies*
End of reporting
period
*(EUR ’000)
Company name Non-consolidated AFS investments (interest 20–50%) Psychosoziales Zentrum Schiltern Gesellschaft m.b.H. Langenlois-Schiltern 26.67% - 922 58 31.10.2010 EFH-Beteiligungsgesellschaft m.b.H. Vienna 50.00% - 12 -2 31.12.2010 NÖ. Landes-Sportschulanlagenbetriebsgesellschaft m.b.H. St.Pölten 49.00% 49.00% 61 1 31.12.2010 Pöchlarner Kommunalimmobilienverwaltungs Gesellschaft m.b.H. Pöchlarn 20.00% 20.00% 44 14 31.12.2010 Melker Kommunalimmobilienverwaltungs Gesellschaft m.b.H. St.Pölten 20.00% 20.00% 45 112 31.12.2010 Loosdorfer Kommunalimmobilien Gesellschaft m.b.H. Loosdorf 20.00% 20.00% 741 90 31.12.2010 Schwarzauer Kommunalimmobilienverwaltungs Gesellschaft m.b.H. Schwarzau am Steinfelde 20.00% 20.00% 2,210 48 31.12.2010
Domicile Holding
thereof indirect interest
Registered capital*
Profit/loss reported in register of
companies*
End of reporting
period
3.3 Financial instruments
A financial instrument is any contract that gives rise to a financial asset of one entity and a financial liability or equity instrument of another entity.
IAS 39 requires the recognition of all financial assets and liabilities in the consolidated statement of financial position. The regular way purchase or sale of derivatives and financial instruments is recognised on the trade date.
Financial assets are derecognised when the contractual rights to the cash flows from the financial asset expire or the transfer criteria established by IAS 39 are fulfilled. Financial liabilities are derecognised when they are extinguished or the obligations have expired.
Where financial instruments are accounted for at fair value, the latter is normally determined on the basis of quoted market prices. In the absence of a market price the future cash flows of a financial instrument are discounted to pre-sent value applying the relevant interest rate. Measurement is performed using standard financial valuation techniques. Options pricing models are used to value options and other financial instruments with similar characteristics, applying current market inputs. Amortised cost is used to measure equity instruments if the fair value is not reliably measurable.Financial instruments are initially recognised at fair value.
Fair value is the amount for which a financial instrument could be exchanged between knowledgeable, willing parties in an arm’s length transaction. Where market prices are available they are used to estimate fair value. In the absence of market prices, accepted, industry-standard valuation models are employed. The present value of derivatives (e.g. interest rate swaps, cross currency swaps, FX forwards and forward rate agreements) is calculated by discounting the replicating cash flows. Over the counter (OTC) currency and interest rate options are measured using option pricing models such as the Black Scholes, Hull White or LIBOR market model (Note 10.3).
ANNUAL REPORT 2011 | 73
HYPO NOE GROUP NOTES TO THE CONSOLIDATED FINANCIAL STATEMENTS
3.4 Financial assets
IAS 39 classifies financial assets into the following four categories:
(1) Loans and receivables (LAR)Loans and receivables are non-derivative financial assets with fixed or determinable payments that are not quoted in an active market (Notes 8.3 and 8.4).
Loans and receivables are measured at amortised cost (gross), and impairments to them as credit provisions, under “Risk provisions” (Note 8.6).
(2) Assets held for trading (HFT)Financial instruments acquired for the purpose of reselling them in the near term, or forming part of a portfolio that the entity intends to resell in the near term with the objective of generating a profit, must be classified as as-sets held for trading. This category also includes all derivatives other than those used as hedging instruments.
In the HYPO NOE Group most of the assets classified in this way represent the positive fair value attributable to derivatives used for interest rate or foreign exchange related transactions, and other derivative transactions such as share price and index-linked transactions and credit derivatives (Note 8.7).
Measurement is at fair value. Realised gains and losses, and measurement gains and losses are recognised in profit or loss (Note 7.6).
(3) Available-for-sale (AFS) financial assets This is a residual category to which all financial assets are assigned that are not classified under another category.
In the case of the HYPO NOE Group these are shares and other variable income securities, bonds, public debt certificates and other fixed income securities, holdings in non-consolidated subsidiaries (over 50%), holdings in associates (20–50%) and other investments (less than 20%) (see Note 8.9.).
Subsequent measurement is at fair value. Measurement gains and losses are recognised directly in equity, in the revaluation reserve (AFS reserve) (statement of changes in equity, page 62 and “Other comprehensive income” in the statement of comprehensive income, page 60). Market prices are applied to the determination of fair value. If fair value is not reliably measurable the carrying amount is applied. In the event of disposal of the asset, the difference from the carrying amount recognised in equity, under the AFS reserve (revaluation reserve), is reversed in the statement of comprehensive income. Gains and losses are reversed over the remaining life of the asset using the effective interest method. In the event of credit-related impairment, an impairment loss is recognised (Note 7.9.). In the event of reversal of impairment losses, equity instruments are revalued via the AFS reserve, and debt instruments via the statement of comprehensive income.
4. Financial assets designated as at fair value through profit or loss (FVPL)When the fair value option (FVO) is taken, financial assets that are not held for trading are irrevocably assigned to this category, and are subsequently measured at value fair through profit or loss (Note 8.10).
However, this classification may only be made if:a.) The financial instrument contains one or more significant embedded derivatives;b.) It eliminates or significantly reduces a measurement or recognition inconsistency;c.) A group of financial assets and/or financial liabilities is managed and its performance evaluated on a fair value basis, in accordance with a documented risk management or investment strategy.
Measurement is at fair value. Realised gains and losses, and measurement gains and losses are recognised in profit or loss. The HYPO NOE Group classifies the items reported as “Net gains or losses on financial assets (debt instruments)” in this way (Note 7.10).
5. Financial assets held to maturity (HTM) Financial assets with fixed or determinable payments and fixed maturities normally meet the criteria for assignment to this category. In the case of the Bank it consists entirely of bonds, public debt certificates and other fixed income securities (Note 8.11).
74 | ANNUAL REPORT 2011
HYPO NOE GROUP NOTES TO THE CONSOLIDATED FINANCIAL STATEMENTS
Designation of investments as held to maturity requires an intention and ability to hold these financial instruments until maturity.
Measurement is at amortised cost, and gains and losses are amortised over the remaining lives of the assets using the effective interest method. Any impairment losses are recognised in profit or loss. This was not necessary in 2011.
3.5 Financial liabilities
IAS 39 classifies financial liabilities into the following four categories:
1. Other liabilitiesThis category comprises the financial liabilities, including debt evidenced by certificates, for which the option of measurement at fair value through profit or loss was not taken (liabilities at cost [LAC]) (Notes 8.20, 8.21 and 8.22).
Measurement is normally at amortised cost. Gains and losses are amortised over the remaining lives of the liabilities using the effective interest method, and are taken to interest expense.
2. Liabilities held for trading (HFT)Financial instruments purchased for the purpose of reselling them in the near term, or forming part of a portfolio that the entity intends to resell in the near term with the objective of generating a profit, must be classified as liabili-ties held for trading. This category also includes all derivatives other than those used as hedging instruments.
In the HYPO NOE Group most of the liabilities classified in this way represent the negative fair value attributable to derivatives used for interest rate or foreign exchange related transactions and other derivative transactions such as share price and index-linked transactions, and credit derivatives (Note 8.23).
Measurement is at fair value. Realised gains and losses, and measurement gains and losses are recognised in profit or loss (Note 7.6).
3. Financial liabilities designated as at fair value through profit or loss (FVPL)When the fair value option (FVO) is taken, financial liabilities that are not held for trading are irrevocably assigned to this category, and subsequently measured at value fair through profit or loss. However, this classification may only be made if:a.) The financial instrument contains one or more significant embedded derivatives;b.) It eliminates or significantly reduces a measurement or recognition inconsistency;c.) A group of financial assets and/or financial liabilities is managed and its performance evaluated on a fair value basis, in accordance with a documented risk management or investment strategy.
Measurement is at fair value. Realised gains and losses, and measurement gains and losses are recognised in profit or loss.
The Bank has no liabilities assigned to this category.
3.6 Embedded derivatives
Financial instruments are referred to as “structured products” where they consist of a host contract and multiple embed-ded derivatives, and the latter are an integral component of the contract and cannot be separately traded. IAS 39 states that embedded derivatives must be separated from the host contracts and accounted for as independent derivatives if:
The structured financial instrument is not measured at fair value through profit or loss; The economic characteristics and risks of the embedded derivative are not clearly and closely related to
those of the host contract; The terms of the embedded derivatives meet the definition of a derivative.
Measurement gains and losses are recognised in the statement of comprehensive income. Derivatives that are not sub-ject to the separation requirement are measured together with the host contract, in accordance with the general rules for the category concerned.
ANNUAL REPORT 2011 | 75
HYPO NOE GROUP NOTES TO THE CONSOLIDATED FINANCIAL STATEMENTS
3.7 Hedge accounting
Derivatives are measured at fair value. Measurement gains and losses are recognised in profit or loss unless the deriva-tive in question meets the criteria for IFRS cash flow hedge accounting.
The IFRS hedge accounting rules govern the measurement of derivatives that are purchased to hedge an underlying transaction. The latter is classified into one of the above categories. A hedging relationship exists where the under-lying and hedging transaction and the hedged risk are designated. The hedging relationship is regarded as highly effective if the fair value or cash flow changes in the underlying and the hedge largely offset each other (hedge ratio of 80–125%). The effectiveness of the hedge must be reliably measurable, and is monitored throughout the annual reporting period.
Fair value hedge: a hedge of the exposure of assets and liabilities to changes in fair value. Gains and losses on measurement of the derivative and underlying are reported in the statement of comprehensive income, under “Net gains or losses on hedges” (Note 7.12).
Cash flow hedge: a hedge of the exposure to variability in cash flows that is attributable to an identifiable and determinable risk associated with a recognised asset or liability or a highly probable forecast transac-tion and could affect profit or loss.The effective portion of the change in fair value is recognised in the statement of comprehensive income, under “Change in cash flow hedge” (page 60). The gain or loss attributable to the ineffective portion is im-mediately recognised in profit or loss and reported in the statement of comprehensive income, under “Net gains or losses on hedges” (Note 7.12).
The HYPO NOE Group mainly uses fair value hedges. These are employed to hedge the fair value of both assets and liabilities (underlyings). The risks hedged are interest rate and currency risks. In addition, cash flow hedges are used to hedge the risk of fluctuations in cash flows (interest payments) from assets and liabilities (underlyings).
Measurement of customer swaps in the HYPO NOE GroupCustomer swaps for which there are no market prices from observable current market transactions in the same instruments are measured using an internal model, taking account of credit spreads, as well as liquidity and equity costs. The credit spreads are determined according to standard risk cost at matching maturities, on the basis of the instruments’ internal ratings, and taking due account of multi-year cumulative default probabilities and the supervisory loss given default, which are normally taken into consideration when pricing loans. The liquidity costs arise from the anticipated need to refinance cash collaterals associated with such transactions where these are not furnished by the customer. These costs are computed on the basis of maturity-specific rates, according to the current liquidity cost matrix for unsecured refinancing. The finance costs are computed on the basis of projected regulatory capital consumption.
Analyses of hedges by the underlying transactions hedged are shown in “Positive fair value of hedges (hedge account-ing)” (Note 8.8) and “Negative fair value of hedges (hedge accounting)” (Note 8.24).
3.8 Lease accounting
Treatment where the Bank is the lessorThe main determinant of the classification of, and hence the method of accounting for leases is not the legal ownership of the leased property but the substance of the lease. If substantially all the risks and rewards incidental to legal owner-ship are transferred by the lessor, then under IAS 17 the lease is a finance lease; otherwise it is an operating lease. Most of the lease agreements concluded by the HYPO NOE Group as a lessor are classifiable as finance leases. Consequently, instead of recognising the assets, the present value of the future lease payments is reported under “Loans and advances to customers”, taking account of any residual values (Note 8.5). Lease payments received are apportioned between the finance charge, recognised in profit or loss, and the reduction in the outstanding liability.
Treatment where the Bank is the lesseeAll the lease agreements concluded by the HYPO NOE Group as a lessee are operating leases. This means that leased vehicles are not stated as assets in the consolidated statement of financial position. The lease instalments are recognised as general administrative expenses (Note 7.7).
76 | ANNUAL REPORT 2011
HYPO NOE GROUP NOTES TO THE CONSOLIDATED FINANCIAL STATEMENTS
3.9 Investment property
Land and buildings held to earn rentals or for capital appreciation are classified as investment property. In cases of mixed occupation, significant parts of land and buildings used by third parties are reported as investment property provided that the conditions for separate letting or sale are met (Note 8.14).
Investment property is measured at cost. Depreciation is on a straight-line basis, over the normal useful lives of the assets. The following useful lives, which correspond to the actual useful lives of the properties concerned, are applied:
Land and buildings 25–50 years
Rental income, depreciation, gains and losses on disposal, and any impairment are recognised in profit or loss (Notes 7.1 and 7.13).
Fair value is determined internally by HYPO NOE Leasing, by capitalising the future lease income on the basis of the lease agreements and comparing it with the carrying amounts (Note 10.3.1). There are no independent valuations.
3.10 Risk provisions
Individual or collective impairment allowances are recognised for identifiable lending risks. Attention is drawn to the risk report included in the operational and financial review.
Individual impairment allowances are recognised on the basis of assessment of the borrower’s financial position, paying special attention to the Group Credit Risk Analysis Department’s current view of the value of the collaterals, and the repayment terms and maturities.
Future cash flows (repayments expected) are discounted using the original effective interest rate. If there is collateral for the amount receivable under the loan (e.g. charges on real property or guarantees), in calculating the amounts of any provision the expected proceeds of realisation of any securities net of costs of realisation are to be taken into account as future cash flows (AG84 IAS 39). Since the present value of all future cash flows and their expected due dates must be taken into account when calculating impairments in accordance with paragraph 63 IAS 39, all expected interest pay-ments must also be included.
The Group recognises collective impairment allowances for reductions in the value of the lending portfolio (losses in-curred but not reported) as at the end of the reporting period. It is assumed that there are incurred but unreported losses in respect of a given percentage of customers without default ratings at the end of the reporting period.
To calculate these risk provisions, all loan items affecting credit risk that are measured at amortised cost (loans and receivables, and liabilities held to maturity), and all outstanding lending facilities and contingent liabilities are allocated either to HYPO NOE Gruppe Bank or to HYPO NOE Landesbank, in accordance with paragraph 64 IAS 39. The treatment of these provisions differentiates between the two banks, due to the latter’s varying risk profiles. Financial instruments that are not classified as held to maturity and derivatives do not form part of the calculations, as they are measured at fair value. Intra-group lending is not included because of their elimination due to IFRS consolidation.
Housing construction loans backed by the Lower Austrian state government are likewise excluded. The calculations are based on the expected loss, taking into account: (a) the unsecured exposure net of the market value of any collateral; (b) the historical probability of default (PD), i.e. the results of backtesting the rating system; (c) the loss given default (LGD) ratios for the individual portfolios; and (d) the period of time between occurrence of the loss and its identification, i.e. the loss identification period (LIP). For reasons of prudence no cure factor is recognised.
The collective impairment allowance is calculated for loans and advances to banks and customers with internal ratings of 2A to 4E, using the HYPO NOE Group master scale described above. For 2011, the loss identification period is assumed to be four months for all loans.
ANNUAL REPORT 2011 | 77
HYPO NOE GROUP NOTES TO THE CONSOLIDATED FINANCIAL STATEMENTS
The provision is calculated using the following formula: Collective impairment allowance = (exposure + 50% range – fair value of collaterals) * PD *
“Blanco” LGD * LIP
Total risk provision in respect of loans and advances carried as assets is disclosed as a deduction on the assets side of the consolidated statement of financial position, as a deduction after “Loans and advances to banks” and “Loans and advances to customers” (Note 8.6). The risk provisions for off balance sheet transactions are included in the “Provisions” item (Note 8.25). Allocations to and reversals of impairment allowances and risk provisions arising from the lending business are re-ported in the statement of comprehensive income, under “Credit provisions” (see Note 7.4 for a detailed analysis).
Note 8.6 Risk provisions and credit provisions provides quantified and narrative disclosures on the individual and collec-tive customer impairment allowances. Impairment of AFS assets is discussed under Note 3.4.3 Available-for-sale (AFS) financial assets.
A summary of all impairment losses recognised in accordance with IFRS 7 is set out in Note 7.3. Further information on credit risk and gross exposure is given in the risk report contained in the operational and financial review.
3.11 Repurchase agreements
Repurchase agreements are agreements under which the transferor transfers the legal title to assets to the transferee for a specified period, for consideration.
At the same time it is agreed that the assets will be retransferred to the transferor at a later date, in return for an agreed sum. IAS 39 requires the transferor to continue to recognise the assets if it retains substantially all the risks and rewards of ownership. The transferor recognises a liability, and the transferee a receivable, equal to the amount received/paid. In 2011 the HYPO NOE Group entered into repurchase agreements as a transferor. The amounts concerned are detailed in Note 8.20.
3.12 Currency translation
In compliance with IAS 21, monetary assets and liabilities denominated in foreign currencies, non-monetary items meas-ured at fair value, and unsettled cash transactions are translated at the mid spot rate, and unsettled forward transactions at the mid forward rate ruling at the end of the reporting period.
Non-monetary assets and liabilities carried at amortised cost are stated at the buying rate.
As all the subsidiaries present their financial statements in euro it was not necessary to translate any statements drawn up in foreign currencies into the reporting currency, the euro.
4. Notes to individual items of the consolidated financial statements
4.1 Cash
“Cash and balances at central banks” refers to cash on hand and balances at central banks that are repayable on demand. The balances are stated at nominal value (Note 8.1).
Interest income is reported under “Interest and similar income” (see Note 7.1. for a detailed analysis).

78 | ANNUAL REPORT 2011
HYPO NOE GROUP NOTES TO THE CONSOLIDATED FINANCIAL STATEMENTS
4.2 Loans and advances
The “Loans and advances to banks” and “Loans and advances to customers” items largely relate to loans, lease re-ceivables, overnight money and time deposits, and unlisted securities. They include accrued interest but are gross of impairment losses (Notes 8.3 and 8.4). Measurement is at amortised cost and the net present value of lease receivables. Interest income is reported under “Interest and similar income” (see Note 7.1. for a detailed breakdown).
4.3 Assets held for trading
Assets held for trading relate exclusively to the positive fair value of derivatives which are not held as hedges.
This item comprises the positive fair value of derivative financial instruments measured at fair value (Note 8.7).
Realised gains and losses, and measurement gains and losses are reported under the “Net trading income” statement of comprehensive income item (see Note 7.6 for a detailed analysis).
4.4 Positive and negative fair value of hedges (hedge accounting)
The positive and negative fair value of hedges is reported separately, on the assets, and equity and liabilities sides of the con-solidated statement of financial position, provided that they qualify for hedge accounting under IAS 39 (Notes 8.8 and 8.24). Measurement gains and losses on fair value hedges are recognised in profit or loss, under “Net gains or losses on hedges” (see detailed presentation under Note 7.12). Current income from hedges is reported under “Interest and similar income” (see Note 7.1 for a detailed analysis).
4.5 Available-for-sale (AFS) financial assets
The item mainly relates to bonds and other fixed income securities. It also includes AFS equities and other variable in-come securities, holdings in non-consolidated subsidiaries and equity interests not held for sale (Note 8.9).
Measurement gains and losses are reported under equity, net of deferred tax, as an available-for-sale reserve (statement of changes in equity, page 62, and “Other comprehensive income” in the statement of comprehensive income, page 60). Gains and losses on disposal, and measurement gains and losses are recorded under “Net gains and losses on available-for-sale assets” (see Note 7.9 for a detailed analysis).
4.6 Financial assets designated as at fair value through profit or loss
Derivatives for which the fair value option is taken (FVO derivatives) are also reported under this item when they are used to hedge such underlying transactions. The item is confined to financial assets that were designated as at fair value through profit or loss on initial recognition (Note 8.10).
In the HYPO NOE Group this item includes debt instruments managed by the former HYPO Absolute Return fund, which management designated as at fair value through profit or loss on initial recognition.
4.7 Financial assets held to maturity
Bonds held to maturity are reported under this item. These are measured at amortised cost (Note 8.11).
Impairments are recognised in profit or loss, under the “Net gains or losses on financial assets held to maturity” item. In 2011 the earnings contribution from gains on disposal of HTM assets (Note 7.11) was immaterial.

ANNUAL REPORT 2011 | 79
HYPO NOE GROUP NOTES TO THE CONSOLIDATED FINANCIAL STATEMENTS
4.8 Investments accounted for using the equity method
Investments in associates and joint ventures are recognised at cost, and are included in the consolidated statement of financial position at the date on which a significant influence is obtained. In subsequent periods the carrying amount of the holdings is adjusted for changes in equity (see Notes 8.13. and 3.2). The Bank’s share of the annual profit or loss is recorded under “Income from investments accounted for using the equity method”, which is a sub-item of “Interest and similar income” (Note 7.1).
4.9 Intangible assets, and property, plant and equipment
Intangible assets with determinable useful lives, acquired for consideration, are stated at cost less straight-line amortisa-tion. As at the end of the reporting period there were no internally generated intangible assets with reliably measurable development costs that were expected to generate future economic benefits.
Land and buildings, and equipment, fixtures and furnishings used by the HYPO NOE Group in the course of its own busi-ness activities are reported as property, plant and equipment. Property, plant and equipment is measured at cost less depreciation.
Note 8.16 gives a breakdown of intangible assets, and property, plant and equipment. Depreciation and amortisation are on a straight-line basis, over the normal useful lives of the assets. The following useful lives are applied:
Land and buildings 25–50 years Equipment, fixtures and furnishings 4–10 years Computer software and hardware 3–4 years
Impairment losses are recognised whenever there are indications of impairment. Depreciation and amortisation, and impairments are reported in the statement of comprehensive income (see Note 7.7 and the detailed disclosures in Note 7.7.3). Gains and losses on disposal of property, plant and equipment are recognised under “Net other operating ex-penses/income” (Note 7.8).
4.10 Tax assets and liabilities
Since 2008 use has been made of the option of group taxation. HYPO NOE Gruppe Bank AG acts as the tax group parent company. To this end the parent concluded group taxation agreements governing tax contributions, reporting duties and due dates with each group member.
Current and deferred tax assets and liabilities are reported under the respective items in the consolidated statement of financial position (Notes 8.17 and 8.26).
Current tax assets and liabilities are measured at the amount expected to be paid to (recovered from) the tax authorities, on the basis of the current tax rates.
Deferred tax assets and liabilities are measured according to the balance sheet liability method, whereby the tax base of an asset is compared with the IFRS carrying amount, and deferred tax recognised for the temporary difference. If a tax liability is probable when the temporary difference reverses, a deferred tax liability is recognised. Deferred tax assets are recognised for temporary differences that result in tax reductions when they reverse. Offsetting of deferred tax assets and liabilities is performed on a company by company basis. Pursuant to IAS 12, deferred tax assets and liabilities are not discounted.
Deferred tax assets are recognised for tax loss carryforwards if it is probable that sufficient taxable profit will be avail-able. The carrying amounts of deferred tax assets arising from tax loss carryforwards and temporary differences are reviewed at the end of each reporting period. The recognition and reversal of deferred tax assets and liabilities is either in profit or loss, under “Income tax”, or in equity (Note 7.15) if the item itself is recognised outside profit or loss (e.g. the revaluation reserve for AFS financial instruments).

80 | ANNUAL REPORT 2011
HYPO NOE GROUP NOTES TO THE CONSOLIDATED FINANCIAL STATEMENTS
4.11 Other assets
The “Other assets” item (Note 8.18) largely relates to accruals and deferrals, other non-bank receivables (e.g. trade re-ceivables and amounts due from the tax authorities in respect of other taxes), and derivatives used in connection with banking book management. Accruals and deferrals, and other non-bank receivables are stated at nominal value.
The positive fair value of financial instruments is reported under “Other assets” if they do not qualify for hedge account-ing and instead represent economic hedges used in connection with banking book management.
Gains and losses on the measurement and disposal of hedges are reported under “Net gains or losses on hedges” (Note 7.12) in the statement of comprehensive income.
4.12 Deposits from banks and customers, and debts evidenced by certificates
Deposits from banks and customers, including debts evidenced by certificates, are carried at amortised cost (Notes 8.20, 8.21 and 8.22). Gains and losses on debts evidenced by certificates are amortised over the maturities of the liabilities.
Where hedge accounting is applied, the movements in the fair value of the underlying are recognised in profit or loss, under “Net gains or losses on hedges” (Note 7.12).
4.13 Liabilities held for trading
The negative fair value of derivatives held for trading that are measured at fair value is disclosed under this item (Note 8.23).
Realised gains and losses, and measurement gains and losses are reported under the “Net trading income” income statement item (see Note 7.6 for a detailed analysis).
4.14 Provisions
The following items are reported under “Provisions” (Note 8.25):
Long-term provisions for pensions and similar obligations; and Other provisions.
Long-term provisions for pensions and similar obligationsThere are both defined contribution and defined benefit plans in the HYPO NOE Group. Under the defined contribution schemes defined contributions are paid to an external fund. As the employer has no legal or other obligation to make ad-ditional payments, there is no need to recognise a provision.
There are also defined benefit pension, and termination and jubilee benefit commitments. These plans are “unfunded”, in that the benefits are entirely internally funded. The long-term employee benefit provisions are measured using the projected unit credit method, in accordance with IAS 19. Future obligations are measured on the basis of a report by an independent actuary. Recognition in the consolidated statement of financial position is according to the present value of the defined benefit obligation. Actuarial gains and losses on the termination benefit and pension provision are recognised in equity, under the “IAS 19 reserve” item in the statement of changes in equity, and in the statement of comprehensive in-come, under “Other comprehensive income” (page 60). However, actuarial gains and losses on the jubilee benefit provision are shown under “General administrative expenses” in the statement of comprehensive income (Note 7.7).
Measurement of the long-term employee benefit provisions is based on the statutory retirement ages of 60 for women and 65 for men.
The discount rate applied to measurement at the end of the reporting period was 5.1% p.a. (2010: 4.7%). Future salary increases of 4.0% p.a. (2010: 3.5%) and future pension increases of 4.0% p.a. (2010: 3.5% p.a.) were assumed. Downward adjustments of the provisions are not made for employee turnover.

ANNUAL REPORT 2011 | 81
HYPO NOE GROUP NOTES TO THE CONSOLIDATED FINANCIAL STATEMENTS
Measurement is based on the biometric estimates contained in the latest Austrian actuarial table for pension insurance, the AVÖ 2008 – P – Rechnungsgrundlagen für die Pensionsversicherung – Pagler & Pagler, Angestelltenbestand.
Other provisions“Other provisions” are recognised when there is a present obligation as a result of a past event, it is probable that it will be necessary to settle the obligation, and a reliable estimate can be made of the amount of the obligation. Long-term provisions are discounted if the effect is material. The measurement of contingent liabilities and impending losses is based on best estimates in accordance with paragraphs 36ff. IAS 37.
Contingent liabilities are recognised in respect of off-balance sheet liabilities such as those arising from guarantees and pledging of collaterals.
Restructuring provisions were not recognised.
Allocations to and reversals of “Other provisions” are mainly shown under “Net other operating expenses/income” (Note 7.8). Movements in provisions for credit risks are reported in the statement of comprehensive income under “Credit provisions” (Note 7.4).
4.15 Other liabilities
“Other liabilities” (Note 8.27) are stated at amortised cost where they relate to accruals and deferrals or “Sundry other liabilities”. The negative fair value of financial instruments is reported under “Other liabilities” if they do not qualify for hedge accounting and instead represent economic hedges used in connection with banking book management. Gains and losses on measurement are reported under “Net gains or losses on hedges” (Note 7.12) in the statement of compre-hensive income.
4.16 Subordinated capital
Subordinated liabilities as defined by Austrian banking legislation are reported as subordinated capital (Note 8.28).
Subordinated liabilities are certificated or uncertificated liabilities which, in the event of liquidation or insolvency, are subordinated to the claims of other creditors. Interest expense is reported under “Interest and similar expense” (see Note 7.2. for a detailed breakdown).
4.17 Equity (including non-controlling interests)
“Share capital” is the capital paid in by the shareholders in accordance with the articles of association.
The “Capital reserves” contain the share premiums paid in excess of nominal value when shares are issued.
As was the case a year earlier, at 31 December 2011 there were 7,150,000 registered shares of no par value in issue. Of these, 70.49% or 5,040,000 shares were held by NÖ Landes-Beteiligungsholding GmbH and 29.51% or 2,110,000 shares by NÖ BET GmbH. At year-end 2011 the share capital (issued capital) of HYPO NOE Gruppe Bank AG was also unchanged, at EUR 51,980,500.
The Annual General Meeting held on 24 April 2009 authorised the Management Board to increase the Company’s share capital by EUR 6,906,500, from a nominal amount of EUR 47,618,500 to EUR 54,525,000, subject to the approval of the Supervisory Board, not later than 31 December 2012, by issuing an additional 950,000 registered shares of no par value. The authorised capital of EUR 54,525,000 is divided into 7,500,000 registered shares. Each no par share represents an equal portion of the share capital. A capital increase, by 600,000 registered no par shares, was registered on 10 February 2010. No further capital increase was effected in 2011.
82 | ANNUAL REPORT 2011
HYPO NOE GROUP NOTES TO THE CONSOLIDATED FINANCIAL STATEMENTS
The retained earnings reserves required by statute and the articles of association, and the other retained earnings, as well as the liability reserve pursuant to section 23(6) Banking Act, the general banking risk fund, the differences between carrying amounts and present value (leasing companies) and the untaxed reserves (net of deferred tax) are reported under “Retained earnings”.
The “IAS 19 reserve” item comprises the actuarial gains and losses on the long-term employee benefit provisions (pen-sions and termination benefits), net of deferred tax.
The “Available-for-sale reserve” contains the measurement gains and losses (net of deferred tax) on financial assets classified as available for sale.
The financial instruments attributable to the cash flow hedge category (net of deferred tax) are reported under the “Cash flow hedge reserve” item.
The accumulated profit or loss brought forward, and the annual profit or loss and dividends are shown under “Consoli-dated profit/loss”.
The “Differences arising on first-time adoption of IFRS” item records the differences arising on consolidation which were offset against equity prior to first-time adoption of IFRS.
Non-controlling interests in subsidiaries are reported as a separate equity item, in accordance with IAS 1.Note 8.29 contains disclosures on equity; the consolidated statement of changes in equity is on page 62.
5. Segment information
The bank’s segment reporting is in accordance with IFRS 8. The segment information is derived from the quarterly reports drawn up by the Management Board, which is the “chief operating decision maker” as defined by paragraph 7 IFRS 8.
The information provided on individual segments is drawn from the IFRS financial statements of the companies attrib-uted to those segments. The same accounting policies as those described in Note 2 Accounting policies are applied to the preparation of these statements.
The four segments, which are based on the structure of the Group’s business activities, are as follows:
Gruppe BankThis segment aggregates the revenue and expenses derived from relationships with large customers – chiefly state and local government clients (public finance, real estate and treasury business).
LandesbankThis segment mainly serves retail and business customers, focusing on housing finance and finance for large non-profit housing associations.
LeasingThis segment groups together the subsidiaries that operate in the leasing business (see Note 3.8 Lease accounting). These are IFRS subgroup financial statements for 37 (2010: 37) consolidated subsidiaries.
ANNUAL REPORT 2011 | 83
HYPO NOE GROUP NOTES TO THE CONSOLIDATED FINANCIAL STATEMENTS
Other & ConsolidationThis segment is used to provide information on 15 (2010: eight) subsidiaries which are neither leasing companies nor banks, as well as consolidation adjustments. The following companies were also included in the Other & Consolidation segment in 2011 due to their formation during the year:
Orchisgasse 66 Liegenschaftserrichtungs- und -verwertungs GmbH Steinmüllergasse 64 Development GmbH HYPO Immobilien-Beteiligungsholding GmbH HYPO Alpha Immobilienerrichtungs- und Verwertungs GmbH HYPO Beta Immobilienerrichtungs- und Verwertungs GmbH HYPO Gamma Immobilienerrichtungs- und Verwertungs GmbH HYPO Delta Immobilienerrichtungs- und Verwertungs GmbH
See Note 9 for additional detailed information on segment profit or loss, and assets and liabilities, as well as descriptive information. Note 3.2 Investments contains a table listing the subsidiaries and showing the segments they are assigned to.
6. Consolidated statement of cash flows
The consolidated statement of cash flows in accordance with IAS 7 shows the change in cash and cash equivalents held by the HYPO NOE Group due to the cash flows from operating, investing and financing activities (see page 63). It is pre-sented according to the indirect method.
The cash flows from operating activities in the main relate to cash inflows and outflows arising from loans and advances to banks and customers, and from available-for-sale financial assets, as well as deposits from banks and customers, and debts evidenced by certificates.
The cash flows from investing activities largely concern cash inflows and outflows arising from property, plant and equip-ment, and financial assets held to maturity.
Cash and cash equivalents consist of cash on hand and balances at central banks repayable on demand.

84 | ANNUAL REPORT 2011
HYPO NOE GROUP NOTES TO THE CONSOLIDATED FINANCIAL STATEMENTS
7. Notes to the statement of comprehensive income
7.1 Interest and similar income
Interest income of EUR 5,550thsd (2010: EUR 4,049thsd) from individually impaired loans was recognised for the report-ing period.
The “Income from investments accounted for using the equity method” sub-item reflects the disposal of the 30% inter-est in HYPO Real Invest AG, an entity accounted for using the equity method, for EUR 293thsd, as well as the recognition of impairment of EUR 25thsd in respect of the Franz-Glaser-Gasse 28 Immoblienentwicklung GmbH acquisition.
7.1.a Interest and similar income
7.1.b Interest and similar income by IAS 39 measurement categories
EUR ’000 2011 2010 Interest income from: Cash and balances at central banks 284 234 Loans and advances to banks 8,470 10,200 Loans and advances to customers 230,961 201,544 Interest rate derivatives (economic hedges) – 175 Bonds, public debt certificates and other fixed-income securities 72,557 65,803 Hedges (hedge accounting) 85,586 122,466 Other interest income 28,956 38,192 thereof: income from investments accounted for using the equity method 5,222 3,931 thereof: income from investment property: 215 302 rental income 971 800 depreciation -756 -498 Current income from: Leases 16,762 12,905 Shares and other variable income securities 1 970 Investments in associates 1,911 1,964 Total 445,488 454,453
EUR ’000 2011 2010 Interest and similar income from: Loans and receivables (LAR) 245,496 222,833 Available-for-sale (AFS) assets 73,362 66,923 Assets held to maturity (HTM) 843 1,522 Assets measured using the fair value option (FVO) 265 291 Assets held for trading (HFT) 14,725 18,392 Interest rate derivatives (economic hedges) – 175 Impaired loans and advances (unwinding) 243 303 Hedges (hedge accounting) 85,586 122,466 Interest income attributable to other periods 259 283 Income from investments accounted for using the equity method 5,222 3,931 Income from investment property: 215 302 rental income 971 800 depreciation -756 -498 Current lease income 16,762 12,905 Current origination and commitment fees (IAS 18) 2,510 4,127 Total 445,488 454,453
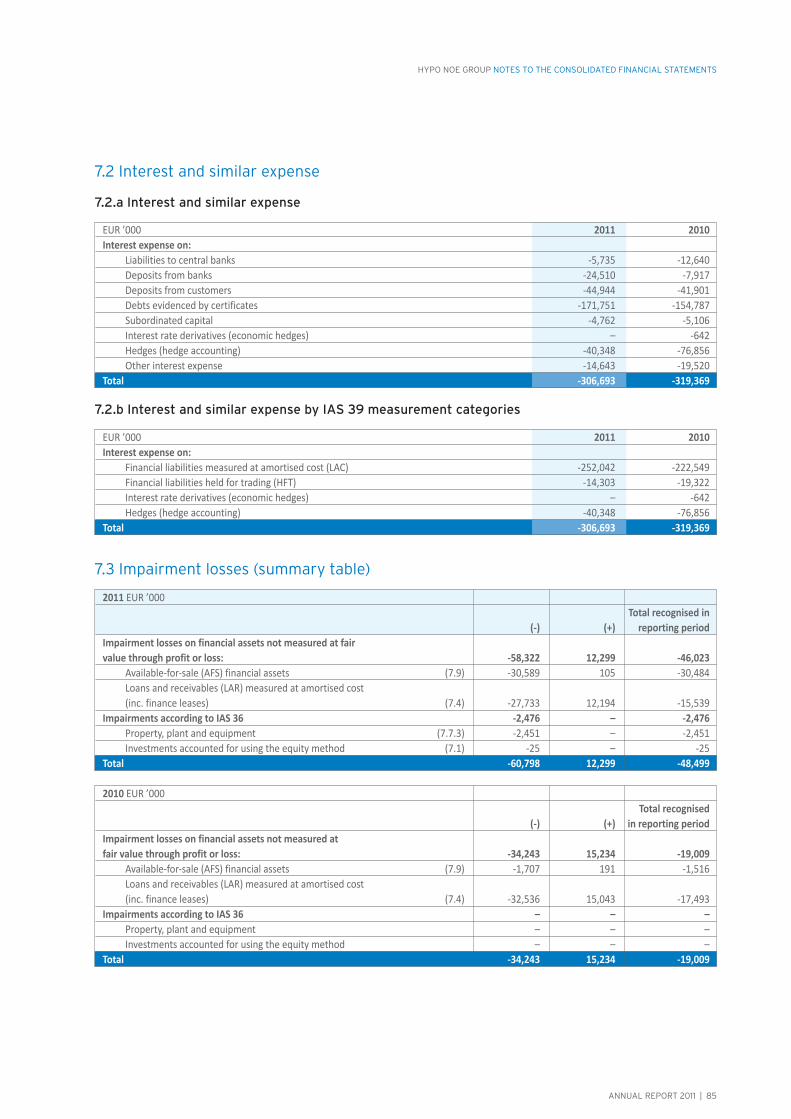
ANNUAL REPORT 2011 | 85
HYPO NOE GROUP NOTES TO THE CONSOLIDATED FINANCIAL STATEMENTS
7.2 Interest and similar expense
7.2.a Interest and similar expense
7.2.b Interest and similar expense by IAS 39 measurement categories
7.3 Impairment losses (summary table)
EUR ’000 2011 2010 Interest expense on: Liabilities to central banks -5,735 -12,640 Deposits from banks -24,510 -7,917 Deposits from customers -44,944 -41,901 Debts evidenced by certificates -171,751 -154,787 Subordinated capital -4,762 -5,106 Interest rate derivatives (economic hedges) – -642 Hedges (hedge accounting) -40,348 -76,856 Other interest expense -14,643 -19,520 Total -306,693 -319,369
EUR ’000 2011 2010 Interest expense on: Financial liabilities measured at amortised cost (LAC) -252,042 -222,549 Financial liabilities held for trading (HFT) -14,303 -19,322 Interest rate derivatives (economic hedges) – -642 Hedges (hedge accounting) -40,348 -76,856 Total -306,693 -319,369
2011 EUR ’000 Total recognised in (-) (+) reporting period Impairment losses on financial assets not measured at fair value through profit or loss: -58,322 12,299 -46,023 Available-for-sale (AFS) financial assets (7.9) -30,589 105 -30,484 Loans and receivables (LAR) measured at amortised cost (inc. finance leases) (7.4) -27,733 12,194 -15,539 Impairments according to IAS 36 -2,476 – -2,476 Property, plant and equipment (7.7.3) -2,451 – -2,451 Investments accounted for using the equity method (7.1) -25 – -25 Total -60,798 12,299 -48,499
2010 EUR ’000 Total recognised (-) (+) in reporting period Impairment losses on financial assets not measured at fair value through profit or loss: -34,243 15,234 -19,009 Available-for-sale (AFS) financial assets (7.9) -1,707 191 -1,516 Loans and receivables (LAR) measured at amortised cost (inc. finance leases) (7.4) -32,536 15,043 -17,493 Impairments according to IAS 36 – – – Property, plant and equipment – – – Investments accounted for using the equity method – – – Total -34,243 15,234 -19,009

86 | ANNUAL REPORT 2011
HYPO NOE GROUP NOTES TO THE CONSOLIDATED FINANCIAL STATEMENTS
7.4 Credit provisions
The risk provisions for on and off-balance sheet transactions are made up as follows:
The increase in the “Direct write-offs” item resulted from the write-off of loans to Hungarian municipalities.
Due to the large number of sub-items there are rounding differences (see Note 3).
7.5 Net fee and commission income
7.6 Net trading income
7.7 General administrative expenses
General administrative expenses comprise staff costs, other administrative expenses, and depreciation, amortisation and impairment. These items were as follows:
EUR ’000 2011 2010 Allocations to: -26,502 -32,235 Individual impairment allowances (7.3) -20,403 -30,274 Collective impairment allowances (7.3) -1,350 -1,566 Other credit provisions -4,749 -395 Reversals of: 11,700 14,742 Individual impairment allowances (7.3) 9,342 11,736 Collective impairment allowances (7.3) 2,195 2,849 Other credit provisions 163 157 Receipts from impaired assets (7.3) 657 458 Direct write-offs (7.3) -5,980 -696 Total -20,125 -17,731
EUR ’000 2011 2010 Fee and commission income from: 15,551 10,446 Loans and advances 2,453 179 Securities and custody account business 3,016 3,908 Payment transactions 5,995 2,453 Foreign exchange, foreign notes and coins, and precious metals 252 266 Other services 3,274 3,248 Diversification 557 386 Other fee and commission income 4 6 Fee and commission expense arising from: -3,112 -3,187 Loans and advances -112 -74 Securities and custody account business -1,382 -2,171 Payment transactions -1,216 -560 Other services -22 -23 Diversification -380 -359 Total 12,439 7,259
EUR ’000 2011 2010 Interest rate transactions -2,237 7,082 Foreign exchange transactions 268 8,669 Other transactions 1,069 340 Total -900 16,091
EUR ’000 2011 2010 Staff costs -52,406 -47,367 Other administrative expenses -35,920 -31,362 Depreciation, amortisation and impairment -5,915 -3,201 Total -94,240 -81,930
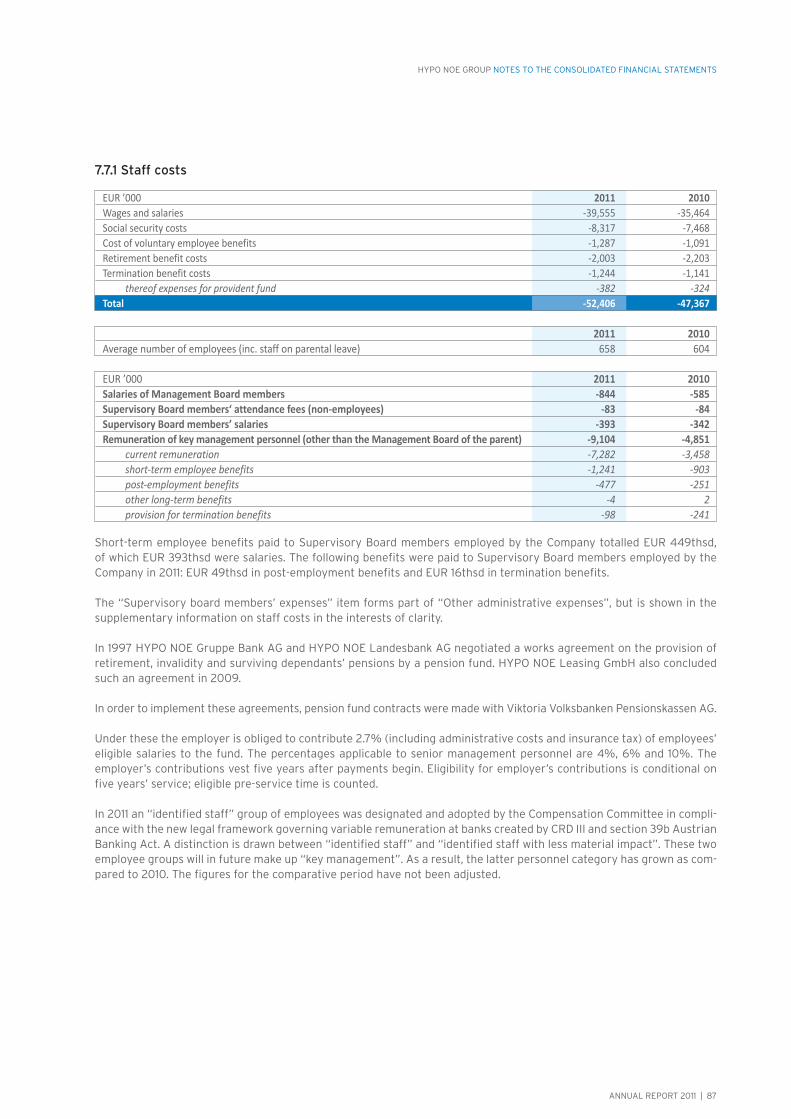
ANNUAL REPORT 2011 | 87
HYPO NOE GROUP NOTES TO THE CONSOLIDATED FINANCIAL STATEMENTS
7.7.1 Staff costs
EUR ’000 2011 2010 Wages and salaries -39,555 -35,464 Social security costs -8,317 -7,468 Cost of voluntary employee benefits -1,287 -1,091 Retirement benefit costs -2,003 -2,203 Termination benefit costs -1,244 -1,141 thereof expenses for provident fund -382 -324 Total -52,406 -47,367
EUR ’000 2011 2010 Salaries of Management Board members -844 -585 Supervisory Board members‘ attendance fees (non-employees) -83 -84 Supervisory Board members’ salaries -393 -342 Remuneration of key management personnel (other than the Management Board of the parent) -9,104 -4,851 current remuneration -7,282 -3,458 short-term employee benefits -1,241 -903 post-employment benefits -477 -251 other long-term benefits -4 2 provision for termination benefits -98 -241
2011 2010 Average number of employees (inc. staff on parental leave) 658 604
Short-term employee benefits paid to Supervisory Board members employed by the Company totalled EUR 449thsd, of which EUR 393thsd were salaries. The following benefits were paid to Supervisory Board members employed by the Company in 2011: EUR 49thsd in post-employment benefits and EUR 16thsd in termination benefits.
The “Supervisory board members’ expenses” item forms part of “Other administrative expenses”, but is shown in the supplementary information on staff costs in the interests of clarity.
In 1997 HYPO NOE Gruppe Bank AG and HYPO NOE Landesbank AG negotiated a works agreement on the provision of retirement, invalidity and surviving dependants’ pensions by a pension fund. HYPO NOE Leasing GmbH also concluded such an agreement in 2009.
In order to implement these agreements, pension fund contracts were made with Viktoria Volksbanken Pensionskassen AG.
Under these the employer is obliged to contribute 2.7% (including administrative costs and insurance tax) of employees’ eligible salaries to the fund. The percentages applicable to senior management personnel are 4%, 6% and 10%. The employer’s contributions vest five years after payments begin. Eligibility for employer’s contributions is conditional on five years’ service; eligible pre-service time is counted.
In 2011 an “identified staff” group of employees was designated and adopted by the Compensation Committee in compli-ance with the new legal framework governing variable remuneration at banks created by CRD III and section 39b Austrian Banking Act. A distinction is drawn between “identified staff” and “identified staff with less material impact”. These two employee groups will in future make up “key management”. As a result, the latter personnel category has grown as com-pared to 2010. The figures for the comparative period have not been adjusted.
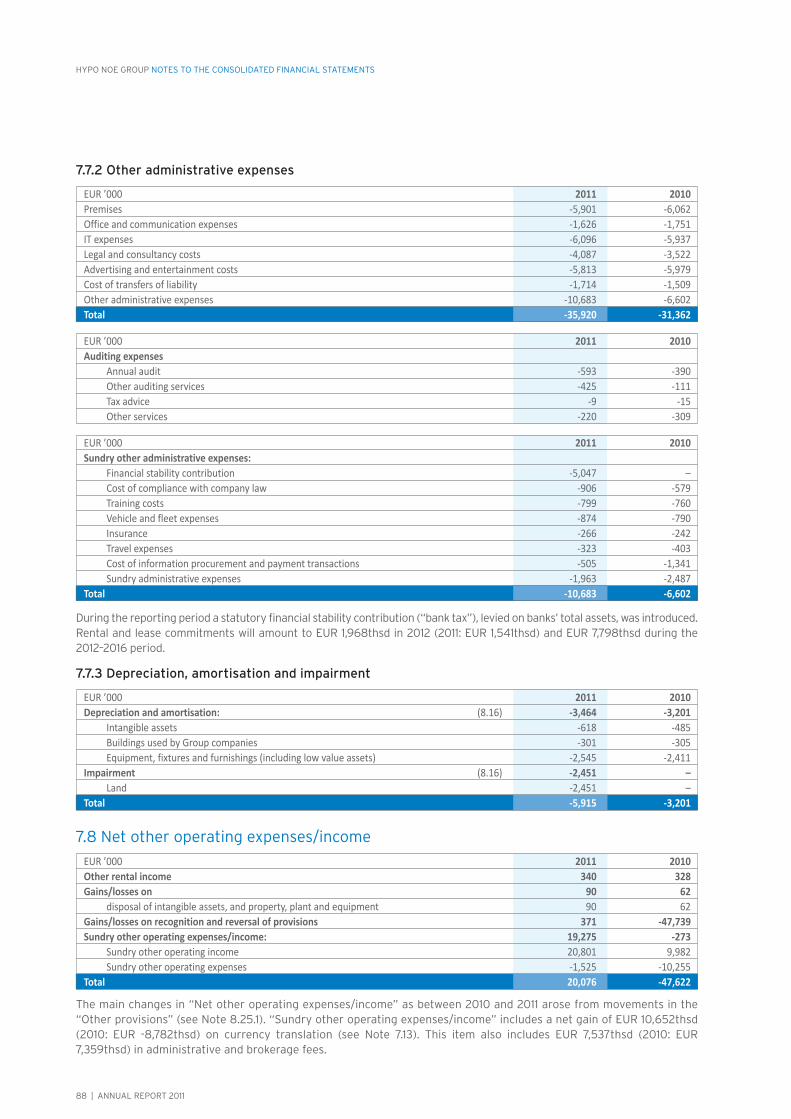
88 | ANNUAL REPORT 2011
HYPO NOE GROUP NOTES TO THE CONSOLIDATED FINANCIAL STATEMENTS
7.7.2 Other administrative expenses
7.7.3 Depreciation, amortisation and impairment
7.8 Net other operating expenses/income
During the reporting period a statutory financial stability contribution (“bank tax”), levied on banks’ total assets, was introduced.Rental and lease commitments will amount to EUR 1,968thsd in 2012 (2011: EUR 1,541thsd) and EUR 7,798thsd during the 2012–2016 period.
The main changes in “Net other operating expenses/income” as between 2010 and 2011 arose from movements in the “Other provisions” (see Note 8.25.1). “Sundry other operating expenses/income” includes a net gain of EUR 10,652thsd (2010: EUR -8,782thsd) on currency translation (see Note 7.13). This item also includes EUR 7,537thsd (2010: EUR 7,359thsd) in administrative and brokerage fees.
EUR ’000 2011 2010 Premises -5,901 -6,062 Office and communication expenses -1,626 -1,751 IT expenses -6,096 -5,937 Legal and consultancy costs -4,087 -3,522 Advertising and entertainment costs -5,813 -5,979 Cost of transfers of liability -1,714 -1,509 Other administrative expenses -10,683 -6,602 Total -35,920 -31,362
EUR ’000 2011 2010 Depreciation and amortisation: (8.16) -3,464 -3,201 Intangible assets -618 -485 Buildings used by Group companies -301 -305 Equipment, fixtures and furnishings (including low value assets) -2,545 -2,411 Impairment (8.16) -2,451 – Land -2,451 – Total -5,915 -3,201
EUR ’000 2011 2010 Other rental income 340 328 Gains/losses on 90 62 disposal of intangible assets, and property, plant and equipment 90 62 Gains/losses on recognition and reversal of provisions 371 -47,739 Sundry other operating expenses/income: 19,275 -273 Sundry other operating income 20,801 9,982 Sundry other operating expenses -1,525 -10,255 Total 20,076 -47,622
EUR ’000 2011 2010 Sundry other administrative expenses: Financial stability contribution -5,047 – Cost of compliance with company law -906 -579 Training costs -799 -760 Vehicle and fleet expenses -874 -790 Insurance -266 -242 Travel expenses -323 -403 Cost of information procurement and payment transactions -505 -1,341 Sundry administrative expenses -1,963 -2,487 Total -10,683 -6,602
EUR ’000 2011 2010 Auditing expenses Annual audit -593 -390 Other auditing services -425 -111 Tax advice -9 -15 Other services -220 -309
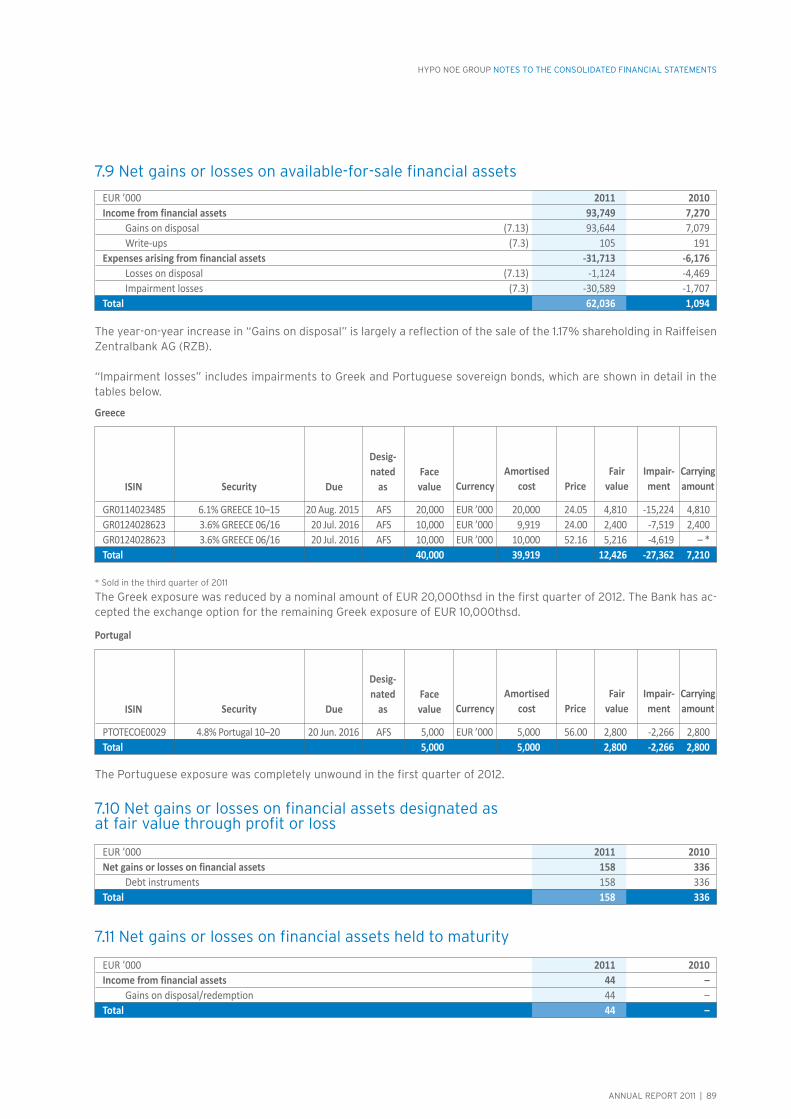
ANNUAL REPORT 2011 | 89
HYPO NOE GROUP NOTES TO THE CONSOLIDATED FINANCIAL STATEMENTS
7.9 Net gains or losses on available-for-sale financial assets
7.10 Net gains or losses on financial assets designated as at fair value through profit or loss
7.11 Net gains or losses on financial assets held to maturity
The year-on-year increase in “Gains on disposal” is largely a reflection of the sale of the 1.17% shareholding in Raiffeisen Zentralbank AG (RZB).
“Impairment losses” includes impairments to Greek and Portuguese sovereign bonds, which are shown in detail in the tables below.
* Sold in the third quarter of 2011
The Greek exposure was reduced by a nominal amount of EUR 20,000thsd in the first quarter of 2012. The Bank has ac-cepted the exchange option for the remaining Greek exposure of EUR 10,000thsd.
The Portuguese exposure was completely unwound in the first quarter of 2012.
EUR ’000 2011 2010 Income from financial assets 93,749 7,270 Gains on disposal (7.13) 93,644 7,079 Write-ups (7.3) 105 191 Expenses arising from financial assets -31,713 -6,176 Losses on disposal (7.13) -1,124 -4,469 Impairment losses (7.3) -30,589 -1,707 Total 62,036 1,094
GR0114023485 6.1% GREECE 10–15 20 Aug. 2015 AFS 20,000 EUR ’000 20,000 24.05 4,810 -15,224 4,810 GR0124028623 3.6% GREECE 06/16 20 Jul. 2016 AFS 10,000 EUR ’000 9,919 24.00 2,400 -7,519 2,400 GR0124028623 3.6% GREECE 06/16 20 Jul. 2016 AFS 10,000 EUR ’000 10,000 52.16 5,216 -4,619 – * Total 40,000 39,919 12,426 -27,362 7,210
Security
Security
ISIN
ISIN
Due
Due
Price
Price
Amortised cost
Amortised cost
Currency
Currency
Desig-nated
as
Desig-nated
as
Face value
Face value
Fair value
Fair value
Impair-ment
Impair-ment
Carrying amount
Carrying amount
Greece
PTOTECOE0029 4.8% Portugal 10–20 20 Jun. 2016 AFS 5,000 EUR ’000 5,000 56.00 2,800 -2,266 2,800 Total 5,000 5,000 2,800 -2,266 2,800
Portugal
EUR ’000 2011 2010 Net gains or losses on financial assets 158 336 Debt instruments 158 336 Total 158 336
EUR ’000 2011 2010 Income from financial assets 44 – Gains on disposal/redemption 44 – Total 44 –
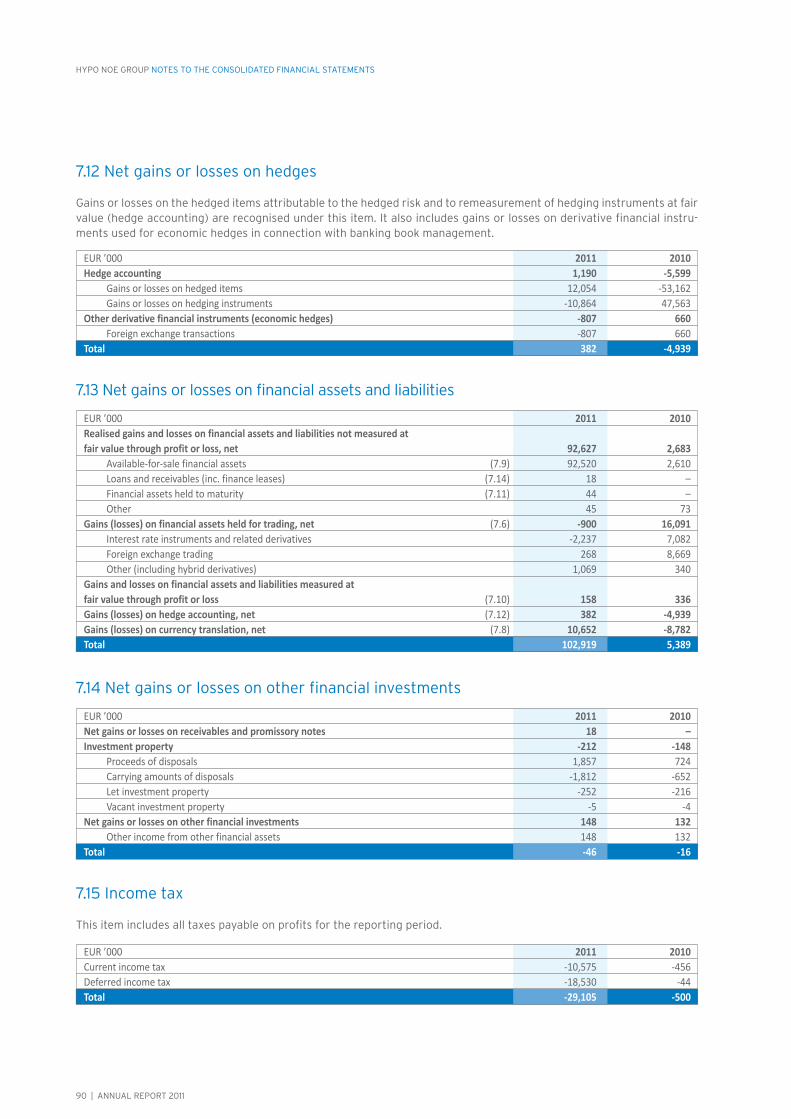
90 | ANNUAL REPORT 2011
HYPO NOE GROUP NOTES TO THE CONSOLIDATED FINANCIAL STATEMENTS
7.12 Net gains or losses on hedges
Gains or losses on the hedged items attributable to the hedged risk and to remeasurement of hedging instruments at fair value (hedge accounting) are recognised under this item. It also includes gains or losses on derivative financial instru-ments used for economic hedges in connection with banking book management.
7.15 Income tax
This item includes all taxes payable on profits for the reporting period.
7.14 Net gains or losses on other financial investments
7.13 Net gains or losses on financial assets and liabilities
EUR ’000 2011 2010 Hedge accounting 1,190 -5,599 Gains or losses on hedged items 12,054 -53,162 Gains or losses on hedging instruments -10,864 47,563 Other derivative financial instruments (economic hedges) -807 660 Foreign exchange transactions -807 660 Total 382 -4,939
EUR ’000 2011 2010 Realised gains and losses on financial assets and liabilities not measured at fair value through profit or loss, net 92,627 2,683 Available-for-sale financial assets (7.9) 92,520 2,610 Loans and receivables (inc. finance leases) (7.14) 18 – Financial assets held to maturity (7.11) 44 – Other 45 73 Gains (losses) on financial assets held for trading, net (7.6) -900 16,091 Interest rate instruments and related derivatives -2,237 7,082 Foreign exchange trading 268 8,669 Other (including hybrid derivatives) 1,069 340 Gains and losses on financial assets and liabilities measured at fair value through profit or loss (7.10) 158 336 Gains (losses) on hedge accounting, net (7.12) 382 -4,939 Gains (losses) on currency translation, net (7.8) 10,652 -8,782 Total 102,919 5,389
EUR ’000 2011 2010 Net gains or losses on receivables and promissory notes 18 – Investment property -212 -148 Proceeds of disposals 1,857 724 Carrying amounts of disposals -1,812 -652 Let investment property -252 -216 Vacant investment property -5 -4 Net gains or losses on other financial investments 148 132 Other income from other financial assets 148 132 Total -46 -16
EUR ’000 2011 2010 Current income tax -10,575 -456 Deferred income tax -18,530 -44 Total -29,105 -500
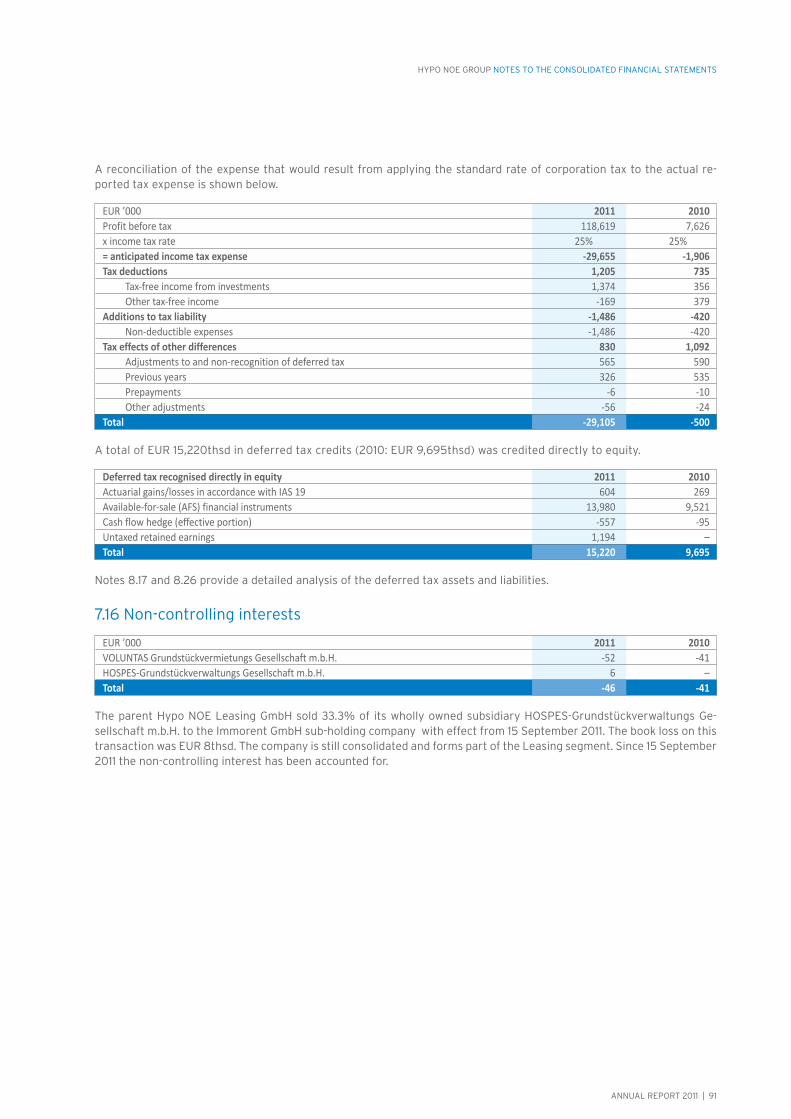
ANNUAL REPORT 2011 | 91
HYPO NOE GROUP NOTES TO THE CONSOLIDATED FINANCIAL STATEMENTS
A reconciliation of the expense that would result from applying the standard rate of corporation tax to the actual re-ported tax expense is shown below.
A total of EUR 15,220thsd in deferred tax credits (2010: EUR 9,695thsd) was credited directly to equity.
Notes 8.17 and 8.26 provide a detailed analysis of the deferred tax assets and liabilities.
The parent Hypo NOE Leasing GmbH sold 33.3% of its wholly owned subsidiary HOSPES-Grundstückverwaltungs Ge-sellschaft m.b.H. to the Immorent GmbH sub-holding company with effect from 15 September 2011. The book loss on this transaction was EUR 8thsd. The company is still consolidated and forms part of the Leasing segment. Since 15 September 2011 the non-controlling interest has been accounted for.
7.16 Non-controlling interests
EUR ’000 2011 2010 Profit before tax 118,619 7,626 x income tax rate 25% 25% = anticipated income tax expense -29,655 -1,906 Tax deductions 1,205 735 Tax-free income from investments 1,374 356 Other tax-free income -169 379 Additions to tax liability -1,486 -420 Non-deductible expenses -1,486 -420 Tax effects of other differences 830 1,092 Adjustments to and non-recognition of deferred tax 565 590 Previous years 326 535 Prepayments -6 -10 Other adjustments -56 -24 Total -29,105 -500
Deferred tax recognised directly in equity 2011 2010 Actuarial gains/losses in accordance with IAS 19 604 269 Available-for-sale (AFS) financial instruments 13,980 9,521 Cash flow hedge (effective portion) -557 -95 Untaxed retained earnings 1,194 – Total 15,220 9,695
EUR ’000 2011 2010 VOLUNTAS Grundstückvermietungs Gesellschaft m.b.H. -52 -41 HOSPES-Grundstückverwaltungs Gesellschaft m.b.H. 6 – Total -46 -41

92 | ANNUAL REPORT 2011
HYPO NOE GROUP NOTES TO THE CONSOLIDATED FINANCIAL STATEMENTS
8.3 Loans and advances to banks
8.2 Loans and advances
The “Loans and advances to banks“ (Note 8.3) and “Loans and advances to customers” (Note 8.4) items largely relate to loans, lease receivables, overnight money and time deposits, and unlisted securities.
8.4 Loans and advances to customers
8.4.1 Customer group analysis
8.4.2 Geographical analysis
EUR ’000 2011 2010 Domestic banks 111,209 114,356 Foreign banks Central and Eastern Europe (CEE) 57,384 52,441 Rest of the world (ROW) 415,404 265,714 Total 583,997 432,511
EUR ’000 2011 2010 Public sector customers 5,083,150 4,515,212 Business customers 1,647,368 1,565,311 Housing associations 1,236,914 1,217,219 Retail customers 1,624,799 1,462,096 Professionals 110,247 119,090 Total 9,702,478 8,878,928
EUR ’000 2011 2010 Domestic customers 8,187,506 7,433,058 Foreign customers Central and Eastern Europe (CEE) 598,937 524,130 Rest of the world (ROW) 916,035 921,740 Total 9,702,478 8,878,928
8. Notes to the statement of financial position
8.1 Cash and balances at central banks
This item relates to cash on hand and balances at central banks that are repayable on demand. The balances are stated at nominal value.
EUR ’000 2011 2010 Cash on hand 12,853 13,264 Balances at central banks 65,886 26,349 Total 78,739 39,613
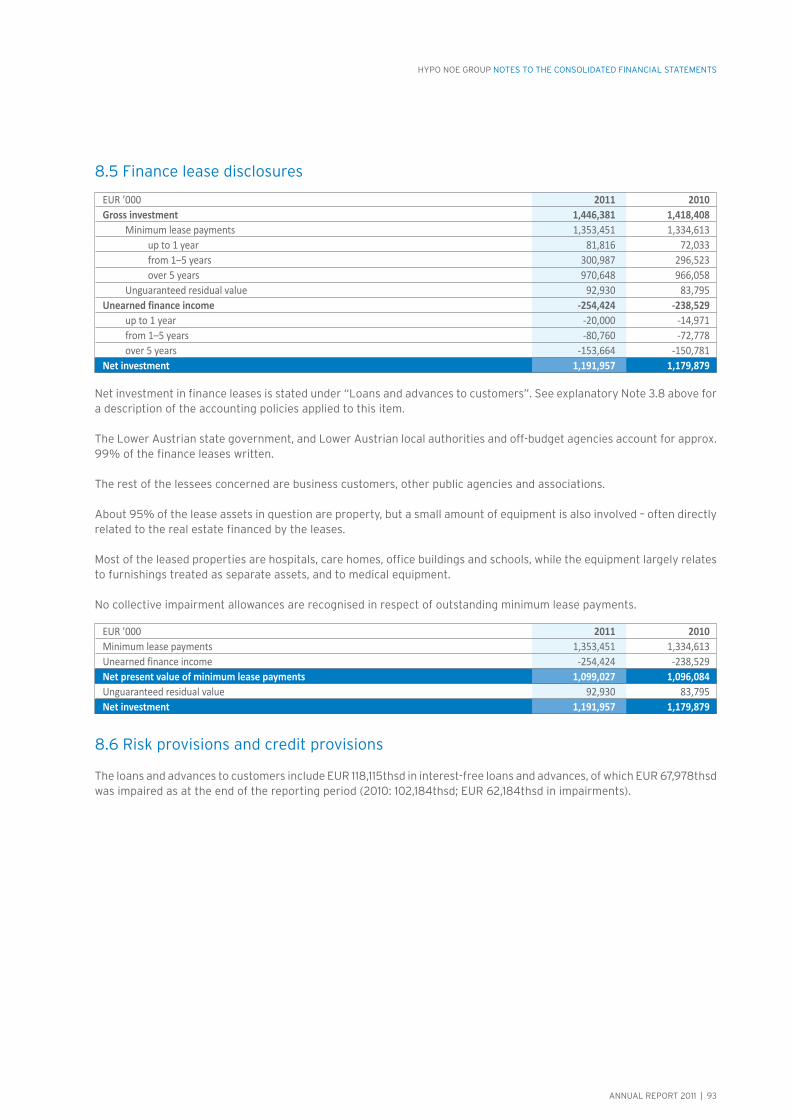
ANNUAL REPORT 2011 | 93
HYPO NOE GROUP NOTES TO THE CONSOLIDATED FINANCIAL STATEMENTS
8.5 Finance lease disclosures
EUR ’000 2011 2010 Gross investment 1,446,381 1,418,408 Minimum lease payments 1,353,451 1,334,613 up to 1 year 81,816 72,033 from 1–5 years 300,987 296,523 over 5 years 970,648 966,058 Unguaranteed residual value 92,930 83,795 Unearned finance income -254,424 -238,529 up to 1 year -20,000 -14,971 from 1–5 years -80,760 -72,778 over 5 years -153,664 -150,781 Net investment 1,191,957 1,179,879
Net investment in finance leases is stated under “Loans and advances to customers”. See explanatory Note 3.8 above for a description of the accounting policies applied to this item.
The Lower Austrian state government, and Lower Austrian local authorities and off-budget agencies account for approx. 99% of the finance leases written.
The rest of the lessees concerned are business customers, other public agencies and associations.
About 95% of the lease assets in question are property, but a small amount of equipment is also involved – often directly related to the real estate financed by the leases.
Most of the leased properties are hospitals, care homes, office buildings and schools, while the equipment largely relates to furnishings treated as separate assets, and to medical equipment.
No collective impairment allowances are recognised in respect of outstanding minimum lease payments.
EUR ’000 2011 2010 Minimum lease payments 1,353,451 1,334,613 Unearned finance income -254,424 -238,529 Net present value of minimum lease payments 1,099,027 1,096,084 Unguaranteed residual value 92,930 83,795 Net investment 1,191,957 1,179,879
8.6 Risk provisions and credit provisions
The loans and advances to customers include EUR 118,115thsd in interest-free loans and advances, of which EUR 67,978thsd was impaired as at the end of the reporting period (2010: 102,184thsd; EUR 62,184thsd in impairments).

94 | ANNUAL REPORT 2011
HYPO NOE GROUP NOTES TO THE CONSOLIDATED FINANCIAL STATEMENTS
8.6.1 Analysis of risk provisions and credit provisions by customer groups
“Unwinding” refers to interest income from impaired loans and advances.
The “Other changes” column reflects customer reclassifications, e.g. from retail to business where customers enter self-employment, or vice versa (e.g. when self-employment ceases due to retirement).
EUR ’000 Risk provisions for customers: individual impairment allowances -97,320 -20,403 9,342 9,132 243 -2 – -99,008 Public sector customers -5,635 – 338 102 94 – – -5,101 Business customers -53,750 -13,701 4,660 7,019 144 -2 22 -55,608 Housing associations -156 -4 16 – – – 129 -14 Retail customers -33,380 -5,683 3,739 1,734 5 – -494 -34,079 Professionals -4,399 -1,016 588 277 – – 343 -4,206 Risk provisions for customers: collective impairment allowances -5,844 -1,350 2,195 – – – – -4,998 Subtotal: risk provisions for customers -103,164 -21,753 11,537 9,132 243 -2 – -104,006 Credit provisions -5,795 -4,749 163 206 – 9 – -10,165 Total -108,959 -26,502 11,700 9,338 243 7 – -114,171
As at1 Jan. 2011
As at1 Jan. 2010
Allocations
Allocations
Reversals
Reversals
Utilisation
Utilisation
Unwinding
Unwinding
Exchangedifferences
Exchangedifferences
Otherchanges
Otherchanges
As at31 Dec. 2011
As at31 Dec. 2010 EUR ’000
Risk provisions for customers: individual impairment allowances -83,548 -30,274 11,735 5,108 303 -644 – -97,320 Public sector customers -11,332 – 5,638 611 92 -644 – -5,635 Business customers -41,963 -19,121 2,119 3,470 – – 1,745 -53,750 Housing associations -135 -23 1 – 180 – -180 -156 Retail customers -27,020 -9,744 3,762 1,021 30 – -1,431 -33,380 Professionals -3,098 -1,386 214 6 – – -134 -4,399 Risk provisions for customers: collective impairment allowances -7,127 -1,566 2,849 – – – – -5,844 Subtotal: risk provisions for customers -90,675 -31,840 14,585 5,108 303 -644 – -103,164 Credit provisions -5,557 -395 157 – – – – -5,795 Total -96,232 -32,234 14,741 5,108 303 -644 – -108,959
8.6.2 Geographical analysis of risk provisions
EUR ’000 2011 2010 Domestic -99,483 -93,723 Foreign Central and Eastern Europe (CEE) -1,005 -2,417 Rest of the world (ROW) -3,518 -7,024 Total risk provisions -104,006 -103,164

ANNUAL REPORT 2011 | 95
HYPO NOE GROUP NOTES TO THE CONSOLIDATED FINANCIAL STATEMENTS
8.6.4 Analysis of risk provisions for customers by maturities of underlying transactions (regulatory reporting segmentation)
8.6.3 Analysis of risk provisions according to regulatory reporting segmentation
EUR ’000 Risk provisions for customers: individual impairment allowances -97,320 -20,403 9,342 9,132 243 -2 – -99,008 Non credit institutions -5,272 – 338 102 85 – -162 -4,909 Corporates -53,065 -13,359 4,384 7,000 153 -2 4,592 -50,298 Retail -38,983 -7,044 4,620 2,030 5 – -4,429 -43,801 Risk provisions for customers: collective impairment allowances -5,844 -1,350 2,195 – – – – -4,998 Total risk provisions -103,164 -21,753 11,537 9,132 243 -2 – -104,006
EUR ’000 Risk provisions for customers: individual impairment allowances -83,548 -30,274 11,735 5,108 303 -644 – -97,320 Non credit institutions -6,032 – 483 – 113 – 163 -5,272 Corporates -41,251 -17,650 9,016 3,946 189 -644 -6,671 -53,065 Retail -36,265 -12,624 2,236 1,162 – – 6,508 -38,983 Risk provisions for customers: collective impairment allowances -7,127 -1,566 2,849 – – – – -5,844 Total risk provisions -90,675 -31,840 14,585 5,108 303 -644 – -103,164
As at1 Jan. 2011
As at1 Jan. 2010
Allocations
Allocations
Reversals
Reversals
Utilisation
Utilisation
Unwinding
Unwinding
Exchangedifferences
Exchangedifferences
OtherChanges
OtherChanges
As at31 Dec. 2011
As at31 Dec. 2010
Less than 90 More than 90 31 Dec. 2011 EUR ’000 Not past due days overdue days overdue Total Risk provisions for customers: individual impairment allowances -31,921 -3,714 -63,374 -99,008 Non credit institutions -4,909 – – -4,909 Corporates -15,582 -2,315 -32,402 -50,298 Retail -11,430 -1,399 -30,972 -43,801 Risk provisions for customers: collective impairment allowances -4,814 -117 -67 -4,998 Total risk provisions -36,735 -3,830 -63,441 -104,006
Less than 90 More than 90 31 Dec. 2010 EUR ’000 Not past due days overdue days overdue Total Risk provisions for customers: individual impairment allowances -29,836 -2,884 -64,601 -97,320 Non credit institutions – – -5,272 -5,272 Corporates -17,195 -2,059 -27,627 -46,881 Retail -12,641 -824 -31,701 -45,167 Risk provisions for customers: collective impairment allowances -5,601 -242 -1 -5,844 Total risk provisions -35,437 -3,125 -64,601 -103,164

96 | ANNUAL REPORT 2011
HYPO NOE GROUP NOTES TO THE CONSOLIDATED FINANCIAL STATEMENTS
8.6.5 Disclosures of maturities and collaterals in accordance with IFRS 7
The table below shows the value of collateral as calculated for regulatory purposes. The receivables of the leasing sub-sidiary, amounting to some EUR 1,344,676thsd (2010: EUR 1,247,741thsd), are shown without collateral.
Further information on credit risk is given in the risk report contained in the operational and financial review.
31 Dec. 2011 EUR ’000 Not past due 10,073,287 73,143 -4,814 -31,921 10,109,696 Less than 90 days overdue 43,722 6,670 -117 -3,714 46,562 90 or more days overdue 10,235 100,823 -67 -63,374 47,617 Total 10,127,244 180,636 -4,998 -99,008 10,203,874
31 Dec. 2010 EUR ’000 Not past due 8,984,385 64,545 -5,601 -29,836 9,013,701 Less than 90 days overdue 149,826 9,400 -242 -2,884 156,101 90 or more days overdue 20,423 102,674 -1 -64,601 58,495 Total 9,154,633 176,619 -5,844 -97,320 9,228,298
31 Dec. 2011 EUR ’000 Loans and advances to customers and banks, debt instruments not past due or individually impaired 10,073,287 4,261,774 Loans and advances to customers and banks, and debt instruments overdue but not individually impaired 53,957 31,282 Loans and advances to customers and banks, and debt instruments individually impaired (overdue and not past due) 180,636 41,538 Total 10,307,880 4,334,594
31 Dec. 2010 EUR ’000 Loans and advances to customers and banks, debt instruments not past due or individually impaired 8,984,385 3,224,335 Loans and advances to customers and banks, and debt instruments overdue but not individually impaired 170,249 53,173 Loans and advances to customers and banks, and debt instruments individually impaired (overdue and not past due) 176,619 37,361 Total 9,331,253 3,314,870
Gross carrying amount (not indi-vidually impaired)
Gross carrying amount (individu-
ally impaired)Collective impair-ment allowances
Individual impair-ment allowances
Net carrying amount
Fair value of collateral
received
Fair value of collateral
received
Gross carrying amount
Gross carrying amount
Gross carrying amount (not indi-vidually impaired)
Gross carrying amount (individu-
ally impaired)Collective impair-ment allowances
Individual impair-ment allowances
Net carrying amount
8.7 Assets held for trading
This item comprises the positive fair value of derivative financial instruments measured at fair value.
EUR ’000 31 Dec. 2011 31 Dec. 2010 Positive fair value of derivatives held for trading (banking book) Interest rate derivatives 446,749 214,949 Foreign exchange derivatives 10,581 11,880 Other assets held for trading 13,750 13,345 Total 471,080 240,174
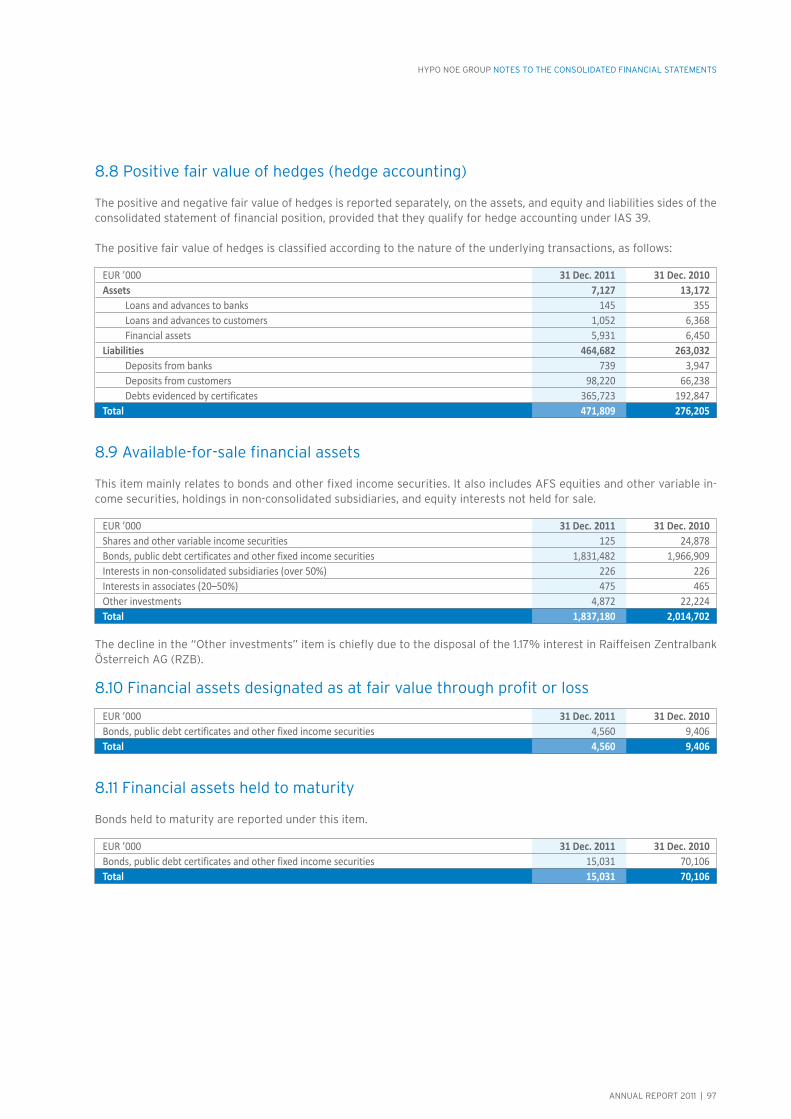
ANNUAL REPORT 2011 | 97
HYPO NOE GROUP NOTES TO THE CONSOLIDATED FINANCIAL STATEMENTS
8.10 Financial assets designated as at fair value through profit or loss
8.11 Financial assets held to maturity
Bonds held to maturity are reported under this item.
8.8 Positive fair value of hedges (hedge accounting)
The positive and negative fair value of hedges is reported separately, on the assets, and equity and liabilities sides of the consolidated statement of financial position, provided that they qualify for hedge accounting under IAS 39.
The positive fair value of hedges is classified according to the nature of the underlying transactions, as follows:
8.9 Available-for-sale financial assets
This item mainly relates to bonds and other fixed income securities. It also includes AFS equities and other variable in-come securities, holdings in non-consolidated subsidiaries, and equity interests not held for sale.
The decline in the “Other investments” item is chiefly due to the disposal of the 1.17% interest in Raiffeisen Zentralbank Österreich AG (RZB).
EUR ’000 31 Dec. 2011 31 Dec. 2010 Assets 7,127 13,172 Loans and advances to banks 145 355 Loans and advances to customers 1,052 6,368 Financial assets 5,931 6,450 Liabilities 464,682 263,032 Deposits from banks 739 3,947 Deposits from customers 98,220 66,238 Debts evidenced by certificates 365,723 192,847 Total 471,809 276,205
EUR ’000 31 Dec. 2011 31 Dec. 2010 Shares and other variable income securities 125 24,878 Bonds, public debt certificates and other fixed income securities 1,831,482 1,966,909 Interests in non-consolidated subsidiaries (over 50%) 226 226 Interests in associates (20–50%) 475 465 Other investments 4,872 22,224 Total 1,837,180 2,014,702
EUR ’000 31 Dec. 2011 31 Dec. 2010 Bonds, public debt certificates and other fixed income securities 4,560 9,406 Total 4,560 9,406
EUR ’000 31 Dec. 2011 31 Dec. 2010 Bonds, public debt certificates and other fixed income securities 15,031 70,106 Total 15,031 70,106

98 | ANNUAL REPORT 2011
HYPO NOE GROUP NOTES TO THE CONSOLIDATED FINANCIAL STATEMENTS
8.13 Investments accounted for using the equity method
Investments in associates and joint ventures are recognised at cost, and are included in the consolidated statement of financial position at the date on which a significant influence is obtained. In subsequent periods the carrying amount of the holdings is adjusted for changes in equity (see Notes 3.1. Basis of consolidation and 3.2 Investments).
The “Income from investments accounted for using the equity method” sub-item of “Interest and similar income” (Note 7.1) reflects the Company’s share of associates’ profits, and the EUR 293thsd in proceeds from the disposal of the 30% interest in HYPO Real Invest AG, an entity accounted for using the equity method, as well as the recognition of impair-ment of EUR 25thsd in respect of the Franz-Glaser-Gasse 28 Immoblienentwicklung GmbH acquisition.
Pursuant to paragraph 30 IAS 28, there are no unrealised period or cumulative losses on investments accounted for using the equity method.
As in the previous period, none of the investments accounted for using the equity method was listed as of the end of the reporting period.
Analysis of the total loans and advances, deposits, and operating income and expense of joint ventures pursuant to para-graph 56 IAS 31 (see Note 3.2 for a table of joint ventures and holdings in them):
EUR ’000 31 Dec. 2011 31 Dec. 2010 Banks 2,730 2,543 Non-banks 45,212 43,606 Total 47,942 46,149
EUR ’000 31 Dec. 2011 31 Dec. 2010 Loans and advances 176,424 154,799 Deposits 157,026 133,586 Operating income 859 1,803 Operating expense -1,043 -1,036
8.14 Investment property
Land and buildings held to earn rentals or for capital appreciation are reported under this item (see Note 3.9).
Rental income during the reporting period was EUR 971thsd (2010: EUR 800thsd).
The additions are largely due to the business model of the new real estate companies (see Note 3.1).
Movements in the properties held as financial investments are shown in the table below (Note 8.15).
EUR ’000 31 Dec. 2011 31 Dec. 2010 Investment property 43,411 24,443
8.12 Analysis of financial assets according to the classification of the BWG (Austrian Banking Act)
Listed securities:
EUR ’000 31 Dec. 2011 31 Dec. 2010 Bonds, public debt certificates and other fixed income securities 1,266,339 1,398,859 Shares and other variable income securities 78 247
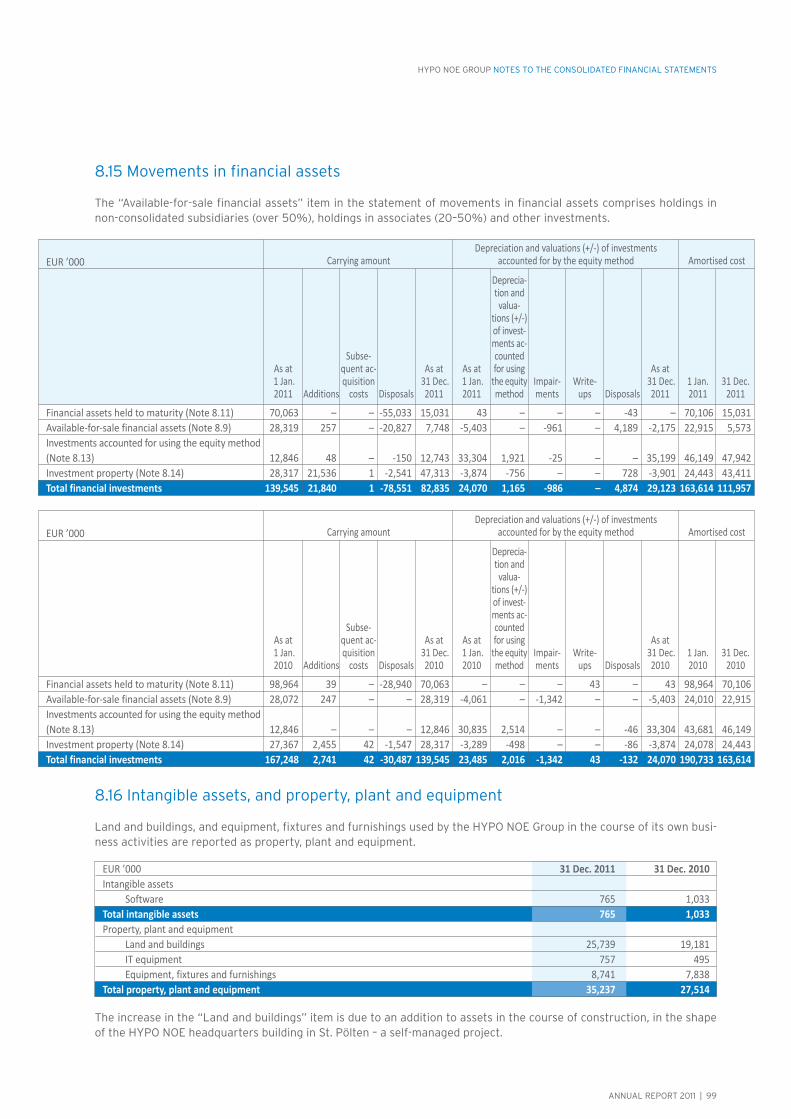
ANNUAL REPORT 2011 | 99
HYPO NOE GROUP NOTES TO THE CONSOLIDATED FINANCIAL STATEMENTS
EUR ’000
Financial assets held to maturity (Note 8.11) 70,063 – – -55,033 15,031 43 – – – -43 – 70,106 15,031 Available-for-sale financial assets (Note 8.9) 28,319 257 – -20,827 7,748 -5,403 – -961 – 4,189 -2,175 22,915 5,573 Investments accounted for using the equity method (Note 8.13) 12,846 48 – -150 12,743 33,304 1,921 -25 – – 35,199 46,149 47,942 Investment property (Note 8.14) 28,317 21,536 1 -2,541 47,313 -3,874 -756 – – 728 -3,901 24,443 43,411 Total financial investments 139,545 21,840 1 -78,551 82,835 24,070 1,165 -986 – 4,874 29,123 163,614 111,957
EUR ’000
Financial assets held to maturity (Note 8.11) 98,964 39 – -28,940 70,063 – – – 43 – 43 98,964 70,106 Available-for-sale financial assets (Note 8.9) 28,072 247 – – 28,319 -4,061 – -1,342 – – -5,403 24,010 22,915 Investments accounted for using the equity method (Note 8.13) 12,846 – – – 12,846 30,835 2,514 – – -46 33,304 43,681 46,149 Investment property (Note 8.14) 27,367 2,455 42 -1,547 28,317 -3,289 -498 – – -86 -3,874 24,078 24,443 Total financial investments 167,248 2,741 42 -30,487 139,545 23,485 2,016 -1,342 43 -132 24,070 190,733 163,614
8.15 Movements in financial assets
The “Available-for-sale financial assets” item in the statement of movements in financial assets comprises holdings in non-consolidated subsidiaries (over 50%), holdings in associates (20–50%) and other investments.
The increase in the “Land and buildings” item is due to an addition to assets in the course of construction, in the shape of the HYPO NOE headquarters building in St. Pölten – a self-managed project.
8.16 Intangible assets, and property, plant and equipment
Land and buildings, and equipment, fixtures and furnishings used by the HYPO NOE Group in the course of its own busi-ness activities are reported as property, plant and equipment.
As at 1 Jan. 2011
As at 1 Jan. 2010
Additions
Additions
Subse-quent ac-quisition
costs
Subse-quent ac-quisition
costs
Disposals
Disposals
As at 31 Dec.
2011
As at 31 Dec.
2010
As at 1 Jan. 2011
As at 1 Jan. 2010
Deprecia-tion and valua-
tions (+/-) of invest-ments ac-counted for using
the equitymethod
Deprecia-tion and valua-
tions (+/-) of invest-ments ac-counted for using
the equitymethod
Impair-ments
Impair-ments
Write-ups
Write-ups
Disposals
Disposals
As at 31 Dec.
2011
As at 31 Dec.
2010
1 Jan. 2011
1 Jan. 2010
31 Dec. 2011
31 Dec. 2010
Carrying amount
Carrying amount
Depreciation and valuations (+/-) of investments accounted for by the equity method
Depreciation and valuations (+/-) of investments accounted for by the equity method
Amortised cost
Amortised cost
EUR ’000 31 Dec. 2011 31 Dec. 2010 Intangible assets Software 765 1,033 Total intangible assets 765 1,033 Property, plant and equipment Land and buildings 25,739 19,181 IT equipment 757 495 Equipment, fixtures and furnishings 8,741 7,838 Total property, plant and equipment 35,237 27,514

100 | ANNUAL REPORT 2011
HYPO NOE GROUP NOTES TO THE CONSOLIDATED FINANCIAL STATEMENTS
EUR ’000
Intangible assets Software 4,065 350 – – 4,415 -3,032 -618 – – – -3,650 1,033 765 Other 32 – – – 32 -32 – – – – -32 – – Total intangible assets 4,097 350 – – 4,447 -3,064 -618 – – – -3,683 1,033 765 Property, plant and equipment Land and buildings 28,492 9,309 – – 37,801 -9,310 -301 -2,451 – – -12,062 19,181 25,739 IT equipment 4,167 695 -543 – 4,319 -3,672 -433 – 543 – -3,562 495 757 Equipment, fixtures and furnishings 24,580 3,281 -870 – 26,990 -16,742 -2,107 – 599 – -18,250 7,838 8,741 Other property, plant and equipment 57 – – – 57 -57 – – – – -57 – – Total property, plant and equipment 57,295 13,285 -1,413 – 69,167 -29,781 -2,840 -2,451 1,142 – -33,930 27,514 35,237
EUR ’000
Intangible assets Software 3,613 463 -11 – 4,065 -2,553 -485 – 6 – -3,032 1,059 1,033 Other 32 – – – 32 -32 – – – – -32 – – Property, plant and equipment Land and buildings 24,488 4,004 – – 28,492 -9,005 -305 – – – -9,310 15,483 19,181 IT equipment 3,864 320 -75 58 4,167 -3,261 -404 – 50 -57 -3,672 603 495 Equipment, fixtures and furnishings 22,662 2,645 -724 -3 24,580 -14,814 -1,993 – 63 2 -16,742 7,848 7,838 Other property, plant and equipment 57 – – – 57 -57 – – – – -57 – – Total property, plant and equipment 51,071 6,968 -800 55 57,295 -27,136 -2,703 – 113 -55 -29,781 23,935 27,514
8.17 Tax assets
See explanatory Note 4.10 Tax assets and liabilities for a discussion of income tax.
EUR ’000 31 Dec. 2011 31 Dec. 2010 Current tax assets 4,068 4,529 Deferred tax assets 19,214 21,452 Total 23,282 25,981
Impairment relates to land in Lower Austria owned by the Bank. The carrying amount of the land was EUR 7,535thsd (2010: 9,306thsd) as at the end of the reporting period.
Carrying amount
Carrying amount
Depreciation and valuations (+/-) of investments accounted for using the equity method
Depreciation and valuations (+/-) of investments accounted for using the equity method
Amortised cost
Amortised cost
As at 1 Jan. 2011 Additions Disposals
Reclassifi-cations
As at 31 Dec.
2011
As at 1 Jan. 2011
Amorti-sation/
deprecia-tion –
Dispos-als
Reclassifi-cations
As at31 Dec.
20111 Jan. 2011
31 Dec. 2011
As at 1 Jan. 2010 Additions Disposals
Reclassifi-cations
As at 31 Dec.
2010
As at 1 Jan. 2010
Amorti-sation/
deprecia-tion –
Dispos-als
Reclassifi-cations
As at31 Dec.
20101 Jan. 2010
31 Dec. 2010

ANNUAL REPORT 2011 | 101
HYPO NOE GROUP NOTES TO THE CONSOLIDATED FINANCIAL STATEMENTS
Deferred tax liabilities were recognised in respect of the following items:
No deferred tax assets were recognised in respect of EUR 11,561 (2010: EUR 12,708thsd) in tax loss carryforwards.
Properties owned by new real estate subsidiaries (see Note 3.1 Basis of consolidation) are reported under the “Prop-erty classified as inventory” item.
EUR ’000 31 Dec. 2011 31 Dec. 2010 Loans and advances to banks 94 141 Risk provisions – 1,477 Financial investments 11,688 7,471 Property, plant and equipment 222 101 Deposits from banks – 693 Deposits from customers 23,787 16,588 Debts evidenced by certificates 88,040 45,106 Liabilities held for trading 95,119 38,328 Negative fair value of hedges (hedge accounting) 102,479 52,636 Provisions – 3,171 Other liabilities 1,009 2,890 Subordinated capital 309 383 Tax loss carryforwards 3,381 5,467 Deferred tax assets before offsetting 326,127 174,453 Less deferred tax liabilities -306,914 -153,001 Reported net deferred tax assets 19,214 21,452
EUR ’000 31 Dec. 2011 31 Dec. 2010 Deferred items 2.383 1.791 Other receivables and assets: 19,020 18,023 thereof: value added tax (VAT) and other tax credits (other than income tax) 8,514 3,820 property classified as inventory 4,624 – trade receivables 1,249 8,798 emergency acquisitions held for sale 36 680 Positive fair value of derivatives 150 1,036 Total 21,553 20,850
EUR ’000 31 Dec. 2011 31 Dec. 2010 Domestic banks 1,656,345 1,689,734 Foreign banks Central and Eastern Europe (CEE) 45,008 – Rest of the world (ROW) 683,108 934,492 Total 2,384,461 2,624,226
8.18 Other assets
The “Other assets” item chiefly relates to accruals and deferrals, other non-bank receivables (e.g. trade receivables and amounts due from the tax authorities in respect of other taxes), and derivatives used in connection with banking book management.
The positive fair value of derivative financial instruments is reported under “Other assets” if they do not qualify for hedge accounting and instead represent economic hedges used in connection with banking book management.
8.19 Deposits
Deposits from banks and customers, including debts evidenced by certificates, are carried at amortised cost (Notes 8.20, 8.21 and 8.22).
8.20 Deposits from banks

102 | ANNUAL REPORT 2011
HYPO NOE GROUP NOTES TO THE CONSOLIDATED FINANCIAL STATEMENTS
Deposits from banks include repurchase agreements entered into by the Bank as a transferor.
Repurchase agreements entered into as a transferorAssets were loaned subject to contractual obligations to return them, as described by example AG51(a) IAS 39. The Bank, as the transferor, retained substantially all the risks and rewards of ownership.
These transactions were largely tri-party repos and collateralised loans from the ECB and the Oesterreichische Nationalbank.
EUR ’000 31 Dec. 2011 31 Dec. 2010 Savings deposits 780,002 775,156 Demand and time deposits 1,693,408 1,551,537 Public sector customers 186,220 167,628 Business customers 1,214,770 1,088,157 Housing associations 47,779 50,326 Retail customers 210,775 203,825 Professionals 33,864 41,601 Total 2,473,410 2,326,693
EUR ’000 31 Dec. 2011 31 Dec. 2010 Domestic customers 1,421,985 1,398,564 Foreign customers Central and Eastern Europe (CEE) 9,680 9,433 Rest of the world (ROW) 1,041,745 918,696 Total 2,473,410 2,326,693
EUR ’000 31 Dec. 2011 31 Dec. 2010 Liabilities to banks under repo agreements 950,000 1,354,987
8.21 Deposits from customers
8.21.1 Customer group analysis
8.21.2 Geographical analysis
EUR ’000 31 Dec. 2011 31 Dec. 2010 Covered and municipal bonds 2,633,854 1,812,519 Other bonds 4,197,395 4,131,159 Profit-sharing certificates 503 1,753 Total 6,831,752 5,945,431
EUR ’000 31 Dec. 2011 31 Dec. 2010 Negative fair value of derivatives (banking book): Interest rate derivatives 358,159 128,935 Foreign exchange derivatives 8,991 10,648 Other liabilities held for trading 13,324 13,406 Total 380,474 152,989
8.22 Debts evidenced by certificates
8.23 Liabilities held for trading
The negative fair value of derivatives held for trading that are measured at fair value is disclosed under this item. Real-ised gains and losses, and measurement gains and losses are reported under the “Net trading income” item in the state-ment of comprehensive income (see Note 7.6 for a detailed analysis).

ANNUAL REPORT 2011 | 103
HYPO NOE GROUP NOTES TO THE CONSOLIDATED FINANCIAL STATEMENTS
EUR ’000 31 Dec. 2011 31 Dec. 2010 Assets 403,116 180,761 Loans and advances to customers 331,295 142,047 Available-for-sale financial assets 71,821 38,714 Liabilities 6,800 23,619 Deposits from banks 1,046 932 Debts evidenced by certificates 5,754 22,687 Total 409,916 204,380
EUR ’000 31 Dec. 2011 31 Dec. 2010 Employee benefit provisions 35,938 33,819 Provisions for pensions 25,801 24,328 Provisions for termination benefits 8,889 8,305 Provisions for jubilee benefits 1,248 1,186 Credit provisions 10,165 5,795 Other provisions 756 58,662 Total 46,859 98,276
8.24 Negative fair value of hedges (hedge accounting)
The negative fair value of hedges is reported separately, on the equity and liabilities side of the consolidated statement of financial position, provided that they qualify for hedge accounting under IAS 39.
The negative fair value of hedges is classified according to the nature of the underlying transactions, as follows:
8.25 Provisions
The following items are reported under “Provisions”: Long-term provisions for pensions and similar obligations; and Other provisions.
8.25.1 Movements in provisions
The “Provisions” item relates to provisions for obligations which will probably need to be settled by an outflow of resources.
Provision was made for an interest penalty of EUR 57,934thsd imposed by notice of the Austrian Financial Market Authority. This is reported under utilisation in the “Other provisions” item.
EUR ’000 Employee benefit provisions 33,819 -2,479 – 587 4,010 35,938 Provisions for pensions 24,328 -1,790 – 31 3,231 25,801 Provisions for termination benefits 8,305 -600 – 445 739 8,889 Provisions for jubilee benefits 1,186 -88 – 112 39 1,248 Credit provisions 5,795 -215 -163 4,749 – 10,165 Other provisions 58,662 -58,049 -181 323 – 756 Total 98,276 -60,742 -344 5,659 4,010 46,859
EUR ’000 Employee benefit provisions 32,800 -2,559 – 514 3,065 33,819 Provisions for pensions 24,451 -1,826 – 24 1,679 24,328 Provisions for termination benefits 7,423 -719 – 426 1,174 8,305 Provisions for jubilee benefits 926 -15 – 63 212 1,186 Credit provisions 5,557 – -157 395 – 5,795 Other provisions 20,964 -10,511 -3,200 51,409 – 58,662 Total 59,321 -13,071 -3,357 52,318 3,065 98,276
As at1 Jan. 2011
As at1 Jan. 2010
Utilisation
Utilisation
Reversals
Reversals
Allocations
Allocations
Discount unwinding effect
Discount unwinding effect
As at31 Dec. 2011
As at31 Dec. 2010
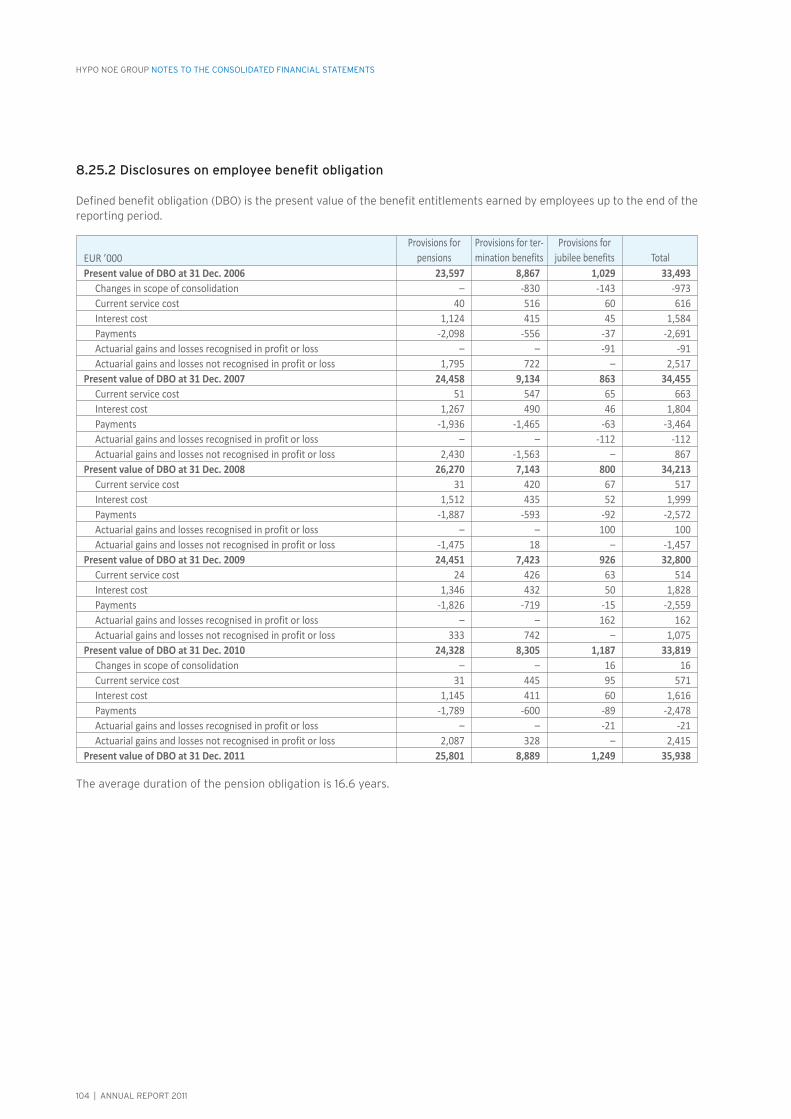
104 | ANNUAL REPORT 2011
HYPO NOE GROUP NOTES TO THE CONSOLIDATED FINANCIAL STATEMENTS
8.25.2 Disclosures on employee benefit obligation
Defined benefit obligation (DBO) is the present value of the benefit entitlements earned by employees up to the end of the reporting period.
The average duration of the pension obligation is 16.6 years.
EUR ’000 Present value of DBO at 31 Dec. 2006 23,597 8,867 1,029 33,493 Changes in scope of consolidation – -830 -143 -973 Current service cost 40 516 60 616 Interest cost 1,124 415 45 1,584 Payments -2,098 -556 -37 -2,691 Actuarial gains and losses recognised in profit or loss – – -91 -91 Actuarial gains and losses not recognised in profit or loss 1,795 722 – 2,517 Present value of DBO at 31 Dec. 2007 24,458 9,134 863 34,455 Current service cost 51 547 65 663 Interest cost 1,267 490 46 1,804 Payments -1,936 -1,465 -63 -3,464 Actuarial gains and losses recognised in profit or loss – – -112 -112 Actuarial gains and losses not recognised in profit or loss 2,430 -1,563 – 867 Present value of DBO at 31 Dec. 2008 26,270 7,143 800 34,213 Current service cost 31 420 67 517 Interest cost 1,512 435 52 1,999 Payments -1,887 -593 -92 -2,572 Actuarial gains and losses recognised in profit or loss – – 100 100 Actuarial gains and losses not recognised in profit or loss -1,475 18 – -1,457 Present value of DBO at 31 Dec. 2009 24,451 7,423 926 32,800 Current service cost 24 426 63 514 Interest cost 1,346 432 50 1,828 Payments -1,826 -719 -15 -2,559 Actuarial gains and losses recognised in profit or loss – – 162 162 Actuarial gains and losses not recognised in profit or loss 333 742 – 1,075 Present value of DBO at 31 Dec. 2010 24,328 8,305 1,187 33,819 Changes in scope of consolidation – – 16 16 Current service cost 31 445 95 571 Interest cost 1,145 411 60 1,616 Payments -1,789 -600 -89 -2,478 Actuarial gains and losses recognised in profit or loss – – -21 -21 Actuarial gains and losses not recognised in profit or loss 2,087 328 – 2,415 Present value of DBO at 31 Dec. 2011 25,801 8,889 1,249 35,938
TotalProvisions for
jubilee benefitsProvisions for ter-mination benefits
Provisions forpensions
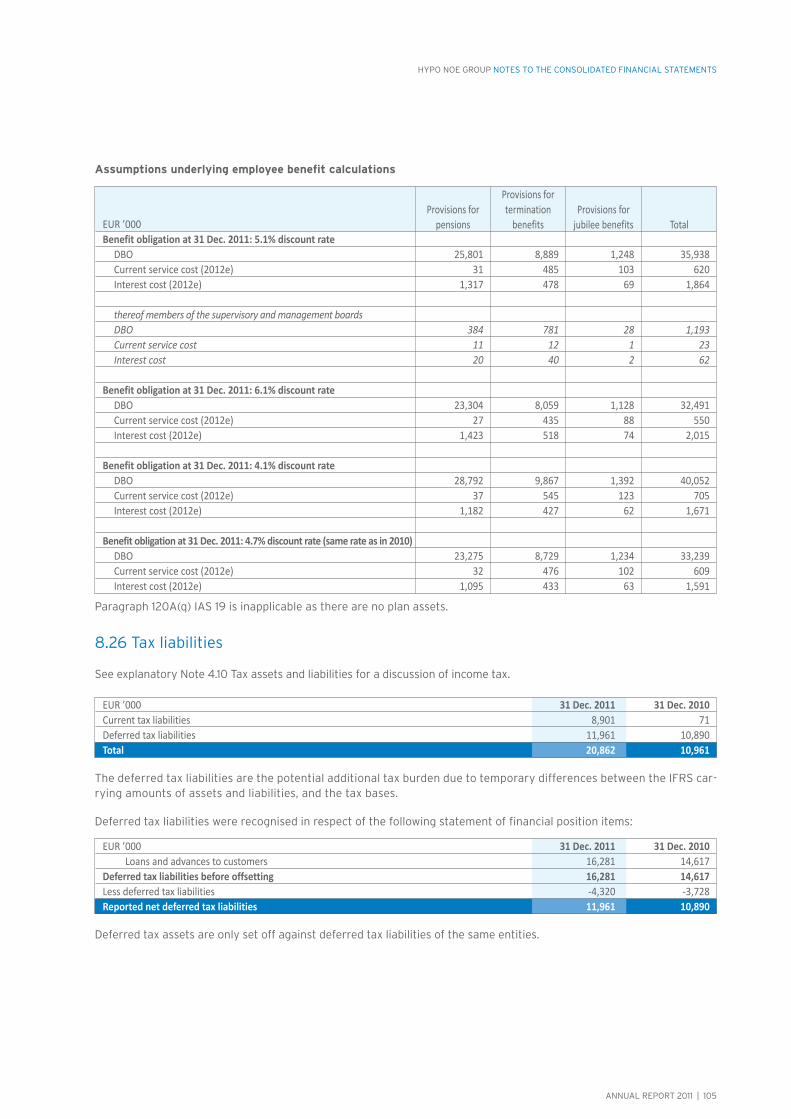
ANNUAL REPORT 2011 | 105
HYPO NOE GROUP NOTES TO THE CONSOLIDATED FINANCIAL STATEMENTS
Assumptions underlying employee benefit calculations
Paragraph 120A(q) IAS 19 is inapplicable as there are no plan assets.
EUR ’000 Benefit obligation at 31 Dec. 2011: 5.1% discount rate DBO 25,801 8,889 1,248 35,938 Current service cost (2012e) 31 485 103 620 Interest cost (2012e) 1,317 478 69 1,864 thereof members of the supervisory and management boards DBO 384 781 28 1,193 Current service cost 11 12 1 23 Interest cost 20 40 2 62 Benefit obligation at 31 Dec. 2011: 6.1% discount rate DBO 23,304 8,059 1,128 32,491 Current service cost (2012e) 27 435 88 550 Interest cost (2012e) 1,423 518 74 2,015 Benefit obligation at 31 Dec. 2011: 4.1% discount rate DBO 28,792 9,867 1,392 40,052 Current service cost (2012e) 37 545 123 705 Interest cost (2012e) 1,182 427 62 1,671 Benefit obligation at 31 Dec. 2011: 4.7% discount rate (same rate as in 2010) DBO 23,275 8,729 1,234 33,239 Current service cost (2012e) 32 476 102 609 Interest cost (2012e) 1,095 433 63 1,591
8.26 Tax liabilities
See explanatory Note 4.10 Tax assets and liabilities for a discussion of income tax.
The deferred tax liabilities are the potential additional tax burden due to temporary differences between the IFRS car-rying amounts of assets and liabilities, and the tax bases.
Deferred tax liabilities were recognised in respect of the following statement of financial position items:
Deferred tax assets are only set off against deferred tax liabilities of the same entities.
EUR ’000 31 Dec. 2011 31 Dec. 2010 Current tax liabilities 8,901 71 Deferred tax liabilities 11,961 10,890 Total 20,862 10,961
EUR ’000 31 Dec. 2011 31 Dec. 2010 Loans and advances to customers 16,281 14,617 Deferred tax liabilities before offsetting 16,281 14,617 Less deferred tax liabilities -4,320 -3,728 Reported net deferred tax liabilities 11,961 10,890
TotalProvisions for
jubilee benefits
Provisions fortermination
benefitsProvisions for
pensions
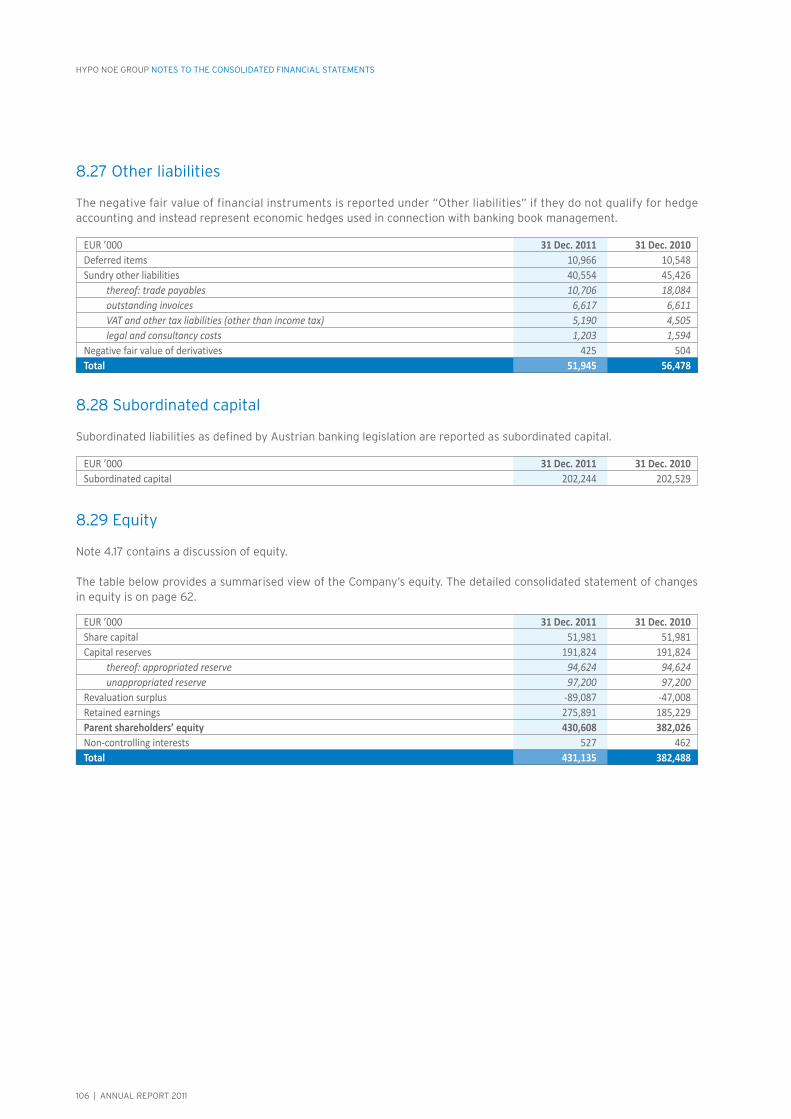
106 | ANNUAL REPORT 2011
HYPO NOE GROUP NOTES TO THE CONSOLIDATED FINANCIAL STATEMENTS
8.27 Other liabilities
The negative fair value of financial instruments is reported under “Other liabilities” if they do not qualify for hedge accounting and instead represent economic hedges used in connection with banking book management.
8.28 Subordinated capital
Subordinated liabilities as defined by Austrian banking legislation are reported as subordinated capital.
8.29 Equity
Note 4.17 contains a discussion of equity.
The table below provides a summarised view of the Company’s equity. The detailed consolidated statement of changes in equity is on page 62.
EUR ’000 31 Dec. 2011 31 Dec. 2010 Deferred items 10,966 10,548 Sundry other liabilities 40,554 45,426 thereof: trade payables 10,706 18,084 outstanding invoices 6,617 6,611 VAT and other tax liabilities (other than income tax) 5,190 4,505 legal and consultancy costs 1,203 1,594 Negative fair value of derivatives 425 504 Total 51,945 56,478
EUR ’000 31 Dec. 2011 31 Dec. 2010 Share capital 51,981 51,981 Capital reserves 191,824 191,824 thereof: appropriated reserve 94,624 94,624 unappropriated reserve 97,200 97,200 Revaluation surplus -89,087 -47,008 Retained earnings 275,891 185,229 Parent shareholders’ equity 430,608 382,026 Non-controlling interests 527 462 Total 431,135 382,488
EUR ’000 31 Dec. 2011 31 Dec. 2010 Subordinated capital 202,244 202,529
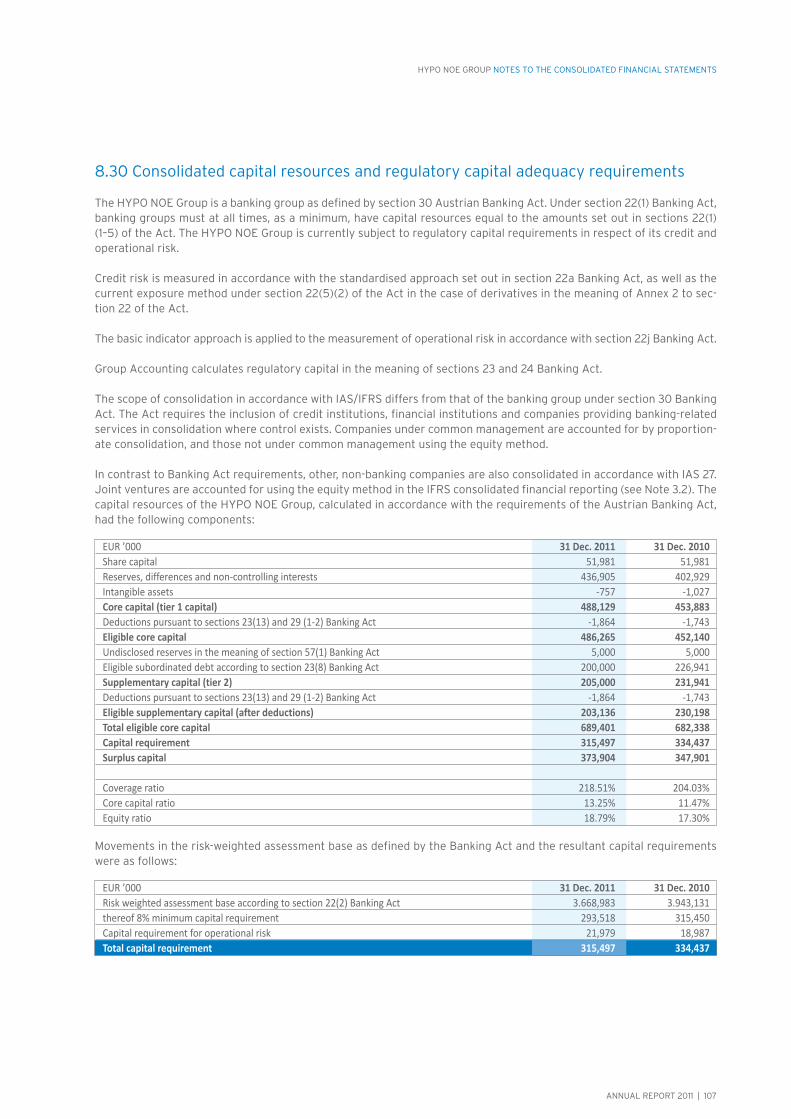
ANNUAL REPORT 2011 | 107
HYPO NOE GROUP NOTES TO THE CONSOLIDATED FINANCIAL STATEMENTS
8.30 Consolidated capital resources and regulatory capital adequacy requirements
The HYPO NOE Group is a banking group as defined by section 30 Austrian Banking Act. Under section 22(1) Banking Act, banking groups must at all times, as a minimum, have capital resources equal to the amounts set out in sections 22(1)(1–5) of the Act. The HYPO NOE Group is currently subject to regulatory capital requirements in respect of its credit and operational risk.
Credit risk is measured in accordance with the standardised approach set out in section 22a Banking Act, as well as the current exposure method under section 22(5)(2) of the Act in the case of derivatives in the meaning of Annex 2 to sec-tion 22 of the Act.
The basic indicator approach is applied to the measurement of operational risk in accordance with section 22j Banking Act.
Group Accounting calculates regulatory capital in the meaning of sections 23 and 24 Banking Act.
The scope of consolidation in accordance with IAS/IFRS differs from that of the banking group under section 30 Banking Act. The Act requires the inclusion of credit institutions, financial institutions and companies providing banking-related services in consolidation where control exists. Companies under common management are accounted for by proportion-ate consolidation, and those not under common management using the equity method.
In contrast to Banking Act requirements, other, non-banking companies are also consolidated in accordance with IAS 27. Joint ventures are accounted for using the equity method in the IFRS consolidated financial reporting (see Note 3.2). The capital resources of the HYPO NOE Group, calculated in accordance with the requirements of the Austrian Banking Act, had the following components:
Movements in the risk-weighted assessment base as defined by the Banking Act and the resultant capital requirements were as follows:
EUR ’000 31 Dec. 2011 31 Dec. 2010 Share capital 51,981 51,981 Reserves, differences and non-controlling interests 436,905 402,929 Intangible assets -757 -1,027 Core capital (tier 1 capital) 488,129 453,883 Deductions pursuant to sections 23(13) and 29 (1-2) Banking Act -1,864 -1,743 Eligible core capital 486,265 452,140 Undisclosed reserves in the meaning of section 57(1) Banking Act 5,000 5,000 Eligible subordinated debt according to section 23(8) Banking Act 200,000 226,941 Supplementary capital (tier 2) 205,000 231,941 Deductions pursuant to sections 23(13) and 29 (1-2) Banking Act -1,864 -1,743 Eligible supplementary capital (after deductions) 203,136 230,198 Total eligible core capital 689,401 682,338 Capital requirement 315,497 334,437 Surplus capital 373,904 347,901 Coverage ratio 218.51% 204.03% Core capital ratio 13.25% 11.47% Equity ratio 18.79% 17.30%
EUR ’000 31 Dec. 2011 31 Dec. 2010 Risk weighted assessment base according to section 22(2) Banking Act 3.668,983 3.943,131 thereof 8% minimum capital requirement 293,518 315,450 Capital requirement for operational risk 21,979 18,987 Total capital requirement 315,497 334,437
108 | ANNUAL REPORT 2011
HYPO NOE GROUP NOTES TO THE CONSOLIDATED FINANCIAL STATEMENTS
9. Segment information
The four segments, which are based on the structure of the Group’s business activities, are as follows:
Gruppe BankThis segment aggregates the income and expense items related to relationships with large customers – chiefly state and local government clients (public finance, real estate and treasury business).
Landesbank This segment mainly serves retail and business customers, focusing on housing finance and finance for large non-profit housing associations.
LeasingThis segment groups together the subsidiaries that operate in the leasing business (see Note 3.3 Lease accounting). These are IFRS subgroup financial statements for 37 (2010: 37) consolidated subsidiaries.
Other & ConsolidationThis segment is used to provide information on 15 subsidiaries which are neither leasing companies nor banks, as well as consolidation adjustments.
The detailed assignment of companies to segments is shown in Note 3.2 Investments, and the Bank’s segment reporting is also discussed in Note 5.
9.1 Business segment information
The internal segmental reporting ends with “Profit before tax”. “Income tax” and “Non-controlling interests”, in the Total column, reconcile the segmental analysis with the items in the consolidated financial statements. The presentation in the notes was adjusted to the internal reporting.
9.1.1 Segment profit or loss
2011 EUR ’000 Other & Gruppe Bank Landesbank Leasing Consolidation Total Interest and similar income 393,681 80,974 18,846 -48,012 445,488 thereof investments accounted for using the equity method 5,443 223 -397 -48 5,222 Interest and similar expense -294,776 -37,219 -15,904 41,206 -306,693 Credit provisions -10,182 -9,943 – – -20,125 Net interest income after risk provisions 88,723 33,812 2,942 -6,806 118,670 Net fee and commission income 3,682 8,789 -31 – 12,439 Net trading income -1,449 549 – – -900 General administrative expenses -54,911 -40,727 -3,574 4,971 -94,240 Net other operating expense/income 16,715 1,424 5,405 -3,468 20,076 Net gains or losses on financial assets 61,996 247 -7 2 62,238 Net gains or losses on hedges 490 -108 – – 382 Net gains or losses on other financial investments 18 – 46 -109 -46 Profit before tax 115,264 3,986 4,780 -5,411 118,619 Income tax -29,105 Profit after tax 89,514 Non-controlling interests -46 Profit attributable to owners of the parent 89,468

ANNUAL REPORT 2011 | 109
HYPO NOE GROUP NOTES TO THE CONSOLIDATED FINANCIAL STATEMENTS
Gruppe BankIn 2011 the Gruppe Bank segment again recorded high net interest income, while “Net gains or losses on financial as-sets” reflected one-time gains on the disposal of the 1.17% interest in Raiffeisen Zentralbank AG and heavy impairments on Greek and Portuguese securities classified as AFS assets, which were remeasured to fair value as at the end of the reporting period.
LandesbankIn contrast to the previous year’s figures, the Landesbank segment’s results for 2011 show stable income from its core business (net interest income, and net fee and commission income) and a marked reduction in credit provision charges thanks to good workout management.
LeasingPrevailing interest rates have a major influence on the operating profits of the Leasing segment, as the interest rate effect alters the capital and interest components of the annuities.
NOE HYPO Leasing GmbH registered an encouraging increase in service income in 2011.
Other & ConsolidationThe increase in the loss recorded by the Other & Consolidation segment is chiefly attributable to the higher dividend payments.
2010 EUR ’000 Other & Gruppe Bank Landesbank Leasing Consolidation Total Interest and similar income 390,854 76,795 15,780 -28,976 454,453 thereof investments accounted for using the equity method 3,545 161 224 – 3,931 Interest and similar expense -303,515 -31,440 -11,214 26,800 -319,369 Credit provisions 1,581 -19,103 -209 – -17,731 Net interest income after risk provisions 88,919 26,253 4,357 -2,176 117,353 Net fee and commission income 1,911 5,380 -32 – 7,259 Net trading income 15,675 416 – – 16,091 General administrative expenses -40,717 -37,959 -4,163 909 -81,930 Net other operating expense/income -52,239 1,175 3,568 -127 -47,622 Net gains or losses on financial assets 1,493 -48 – -15 1,430 Net gains or losses on hedges -5,406 467 – – -4,939 Net gains or losses on other financial investments – – 73 -89 -16 Profit before tax 9,636 -4,315 3,803 -1,498 7,626 Income tax -500 Profit after tax 7,126 Non-controlling interests -41 Profit attributable to owners of the parent 7,085
110 | ANNUAL REPORT 2011
HYPO NOE GROUP NOTES TO THE CONSOLIDATED FINANCIAL STATEMENTS
Other & 31 Dec. 2011 EUR ’000 Gruppe Bank Landesbank Leasing Consolidation Total Assets Cash and balances at central banks 53,411 25,328 – – 78,739 Loans and advances to banks 1,145,086 70,523 53,175 -684,786 583,997 Loans and advances to customers 7,769,141 1,958,530 1,344,676 -1,369,869 9,702,478 Risk provisions -22,528 -80,688 -790 – -104,006 Assets held for trading 471,079 237 – -236 471,080 Positive fair value of hedges (hedge accounting) 464,152 23,273 – -15,615 471,809 Available-for-sale financial assets 1,943,959 318,689 6,263 -431,732 1,837,180 Financial assets designated as at fair value through profit or loss 4,560 – – – 4,560 Financial assets held to maturity 15,031 – – – 15,031 Investments accounted for using the equity method 34,147 1,377 12,418 – 47,942 Investment property – – 244 43,167 43,411 Intangible assets 541 74 142 8 765 Property, plant and equipment 6,899 5,945 568 21,826 35,237 Tax assets 17,926 3,873 1,295 187 23,282 Other assets 9,537 4,485 47,635 -40,104 21,553 Total assets 11,912,940 2,331,645 1,465,626 -2,477,154 13,233,058 Equity and liabilities Deposits from banks 2,383,737 603,818 1,318,906 -1,922,000 2,384,461 Deposits from customers 1,390,362 1,146,116 357 -63,425 2,473,410 Debts evidenced by certificates 6,719,575 403,558 503 -291,885 6,831,752 Liabilities held for trading 380,484 226 – -236 380,474 Negative fair value of hedges (hedge accounting) 417,067 8,464 – -15,615 409,916 Provisions 34,539 11,483 474 364 46,859 Tax liabilities 8,850 – 11,961 51 20,862 Other liabilities 24,057 14,307 17,271 -3,690 51,945 Subordinated capital 190,707 51,537 – -40,000 202,244 Equity (inc. non-controlling interests) 363,562 92,137 116,154 -140,718 431,135 Parent shareholders’ equity 363,562 92,137 115,626 -140,718 430,608 Non-controlling interests – – 527 – 527 Total equity and liabilities 11,912,940 2,331,645 1,465,626 -2,477,154 13,233,058
9.1.2 Segment assets and liabilities
Although HYPO NOE Landesbank has a profit and loss transfer agreement with HYPO NOE Gruppe Bank AG, the deferred tax arising from temporary differences is attributed to the Landesbank segment.

ANNUAL REPORT 2011 | 111
HYPO NOE GROUP NOTES TO THE CONSOLIDATED FINANCIAL STATEMENTS
Other & 31 Dec. 2010 EUR ’000 Gruppe Bank Landesbank Leasing Consolidation Total Assets Cash and balances at central banks 147 39,466 – – 39,613 Loans and advances to banks 1,049,106 55,128 64,169 -735,892 432,511 Loans and advances to customers 6,956,855 1,915,094 1,247,741 -1,240,763 8,878,928 Risk provisions -22,938 -79,435 -790 – -103,164 Assets held for trading 240,172 324 – -323 240,174 Positive fair value of hedges (hedge accounting) 272,022 10,346 – -6,163 276,205 Available-for-sale financial assets 2,122,322 367,802 6,251 -481,672 2,014,702 Financial assets designated as at fair value through profit or loss 9,406 – – – 9,406 Financial assets held to maturity 55,083 15,023 – – 70,106 Investments accounted for using the equity method 31,077 1,357 13,715 1 46,149 Investment property – – 2,123 22,320 24,443 Intangible assets 888 20 119 6 1,033 Property, plant and equipment 6,607 5,180 593 15,134 27,514 Tax assets 20,090 3,298 2,490 103 25,981 Other assets 20,313 5,854 43,740 -49,058 20,850 Total assets 10,761,149 2,339,457 1,380,151 -2,476,306 12,004,451 Equity and liabilities Deposits from banks 2,592,571 675,350 1,228,073 -1,871,768 2,624,226 Deposits from customers 1,259,556 1,137,378 396 -70,637 2,326,693 Debts evidenced by certificates 5,933,668 352,071 1,753 -342,060 5,945,431 Liabilities held for trading 152,991 321 – -323 152,989 Negative fair value of hedges (hedge accounting) 196,556 13,988 – -6,163 204,380 Provisions 90,052 7,408 500 316 98,276 Tax liabilities – – 10,890 71 10,961 Other liabilities 29,173 9,076 21,635 -3,405 56,478 Subordinated capital 190,703 51,826 – -40,000 202,529 Equity (inc. non-controlling interests) 315,879 92,040 116,903 -142,334 382,488 Parent shareholders’ equity 315,879 92,040 116,441 -142,334 382,026 Non-controlling interests – – 462 – 462 Total equity and liabilities 10,761,149 2,339,457 1,380,151 -2,476,306 12,004,451
9.2 Geographical information
The main balance sheet items are broken down into domestic and foreign business.
The geographical presentation analyses the debts evidenced by certificates that relate to listed securities by the coun-tries of issue.
EUR ’000 31 Dec. 2011 31 Dec. 2010 Domestic Foreign Domestic Foreign Loans and advances to banks 111,209 472,788 114,356 318,155 Loans and advances to customers 8,187,506 1,514,972 7,433,058 1,445,870 Available-for-sale financial assets 839,498 997,682 1,028,499 986,203 Financial assets designated as at fair value through profit or loss 4,056 504 4,095 5,310 Financial assets held to maturity – 15,031 – 70,106 Deposits from banks 1,656,345 728,116 1,689,734 934,492 Deposits from customers 1,421,985 1,051,425 1,398,563 928,129 Debts evidenced by certificates 2,695,457 4,136,295 1,997,413 3,948,019

112 | ANNUAL REPORT 2011
HYPO NOE GROUP NOTES TO THE CONSOLIDATED FINANCIAL STATEMENTS
10. Supplementary information
10.1 Analysis of assets by maturities
EUR ’000 31 Dec. 2011 31 Dec. 2010 Loans and advances to banks Repayable on demand 177,210 143,490 Up to 3 months 224,395 109,975 From 3 months to 1 year 7,606 21,469 From 1 to 5 years 47,917 30,561 Over 5 years 126,869 127,016 Total 583,997 432,511 Loans and advances to customers Repayable on demand 227,421 185,407 Up to 3 months 301,588 303,593 From 3 months to 1 year 703,358 555,908 From 1 to 5 years 2,801,705 2,431,489 Over 5 years 5,668,406 5,402,530 Total 9,702,478 8,878,928 Assets held for trading Repayable on demand – – Up to 3 months – 4,115 From 3 months to 1 year 286 4,173 From 1 to 5 years 8,434 14,687 Over 5 years 462,359 217,199 Total 471,080 240,174 Financial assets (held to maturity, available for sale or designated as at fair value through profit or loss) Repayable on demand or no fixed term 19,357 128,089 Up to 3 months 32,234 135,901 From 3 months to 1 year 168,933 234,181 From 1 to 5 years 702,493 598,616 Over 5 years 933,754 997,427 Total 1,856,770 2,094,214 Positive fair value of derivatives (hedge accounting and economic hedges) Repayable on demand – – Up to 3 months 294 977 From 3 months to 1 year 16,086 244 From 1 to 5 years 96,931 35,353 Over 5 years 358,648 240,666 Total 471,959 277,240 Other assets (inc. economic hedges) Repayable on demand or no fixed term 9,842 5,137 Up to 3 months 9,137 11,132 From 3 months to 1 year 608 1,267 From 1 to 5 years 700 2,583 Over 5 years 1,267 732 Total 21,555 20,850
ANNUAL REPORT 2011 | 113
HYPO NOE GROUP NOTES TO THE CONSOLIDATED FINANCIAL STATEMENTS
10.2 Analysis of liabilities by maturities
EUR ’000 31 Dec. 2011 31 Dec. 2010 Deposits from banks Repayable on demand or no fixed term 52,004 71,483 Up to 3 months 976,143 1,884,414 From 3 months to 1 year 488,900 29,475 From 1 to 5 years 219,960 – Over 5 years 647,453 638,854 Total 2,384,461 2,624,226 Deposits from customers Repayable on demand or no fixed term 592,434 575,930 Up to 3 months 242,599 149,845 From 3 months to 1 year 252,725 219,261 From 1 to 5 years 441,832 392,420 Over 5 years 943,820 989,237 Total 2,473,410 2,326,693 Debts evidenced by certificates Repayable on demand or no fixed term 682 709 Up to 3 months 46,763 195,896 From 3 months to 1 year 989,493 15,126 From 1 to 5 years 2,284,511 1,932,882 Over 5 years 3,510,303 3,800,818 Total 6,831,752 5,945,431 Liabilities held for trading Repayable on demand or no fixed term – – Up to 3 months – 3,275 From 3 months to 1 year 262 4,233 From 1 to 5 years 6,708 13,743 Over 5 years 373,504 131,738 Total 380,474 152,989 Negative fair value of derivatives (hedge accounting and economic hedges) Repayable on demand or no fixed term – – Up to 3 months 446 95 From 3 months to 1 year 819 3,376 From 1 to 5 years 37,872 29,597 Over 5 years 371,204 171,815 Total 410,341 204,884 Other liabilities (inc. economic hedges) Repayable on demand or no fixed term 11,687 8,162 Up to 3 months 6,764 12,698 From 3 months to 1 year 12,371 12,218 From 1 to 5 years 14,649 14,341 Over 5 years 6,474 9,057 Total 51,945 56,476 Subordinated capital Repayable on demand or no fixed term – – Up to 3 months – – From 3 months to 1 year – – From 1 to 5 years – – Over 5 years 202,244 202,529 Total 202,244 202,529
114 | ANNUAL REPORT 2011
HYPO NOE GROUP NOTES TO THE CONSOLIDATED FINANCIAL STATEMENTS
10.3 Fair value disclosures in accordance with IFRS 7
The disclosures regarding the nature and extent of the risks associated with financial instruments (paragraphs 31–42 IFRS 7), the sensitivity analysis and the other disclosures required by IFRS 7 form part of the risk report contained in the operational and financial review.
All the obligations to pay principal and interest were met during the reporting period, and there were no indications of defaults as at the end of the reporting period.
10.3.1 Fair value of financial instruments
Fair value is the amount for which a financial instrument could be exchanged between knowledgeable, willing parties in an arm’s length transaction. Where market prices are available they are used to estimate fair value. In the absence of market prices, accepted, industry-standard valuation models are employed. The present value of derivatives (e.g. interest rate swaps, cross currency swaps, FX forwards and forward rate agreements) is calculated by discounting the replicating cash flows. OTC currency and interest rate options are measured using option pricing models such as the Black Scholes, Hull White or LIBOR market models.
Reference is made to explanatory Note 3.9 for information on the fair value measurement of investment property (IAS 40).
The year-on-year changes in fair value are principally due to volume effects, but also stem from improvements in fair value measurement.
EUR ’000 31 Dec. 2011 31 Dec. 2010 Fair value Carrying amount Fair value Carrying amount Assets Loans and advances to banks 583,546 583,997 456,337 432,511 Loans and advances to customers 9,718,140 9,702,478 9,468,493 8,878,928 Risk provisions – individual impairment allowances -99,008 -97,320 Assets held for trading 471,080 471,080 240,174 240,174 Positive fair value of hedges 471,809 471,809 276,205 276,205 Financial assets designated as at fair value through profit or loss 4,560 4,560 9,406 9,406 Available-for-sale financial assets 1,837,180 1,837,180 2,014,702 2,014,702 Financial assets held to maturity 15,041 15,031 70,589 70,106 Investments accounted for using the equity method 47,942 47,942 46,149 46,149 Investment property 44,431 43,411 25,455 24,443 Property, plant and equipment: land and buildings (excluding assets in the course of construction) 12,994 12,994 15,066 15,066 Sundry other assets 21,555 21,553 20,850 20,850 Total assets 13,228,276 13,113,026 12,643,426 11,931,220 Liabilities Deposits from banks 2,358,550 2,384,461 2,624,978 2,624,226 Deposits from customers 2,500,668 2,473,410 2,377,983 2,326,694 Debts evidenced by certificates 7,482,017 6,831,752 6,215,997 5,945,432 Liabilities held for trading 380,474 380,474 152,989 152,989 Negative fair value of hedges 409,916 409,916 204,380 204,380 Other liabilities 51,945 51,945 56,476 56,476 Subordinated capital 203,187 202,244 202,529 202,529 Total liabilities 13,386,758 12,734,202 11,835,332 11,512,726

ANNUAL REPORT 2011 | 115
HYPO NOE GROUP NOTES TO THE CONSOLIDATED FINANCIAL STATEMENTS
10.3.2 Fair Value hierarchy level
IFRS 7 applies to the categories of financial instruments established by IAS 39, as well as those recognised in accordance with other standards, and unrecognised instruments. Under IFRS 7 these financial instruments must be grouped into classes that are appropriate to the nature of the information disclosed and that take into account the characteristics of the instruments concerned.
Fair value measurements must be classified using a fair value hierarchy with the following levels:
Level 1: Quoted prices in active marketsThese are quoted prices in active markets for identical assets or liabilities, and mainly apply to exchange-traded underly-ing instruments and derivatives.
Level 2: Valuation techniques based on observable inputsHere, measurement is based on inputs other than quoted prices included within Level 1 that are observable for the asset or liability, either directly (i.e. as prices) or indirectly (i.e. derived from prices). This chiefly applies to OTC derivatives (as-sets and liabilities held for trading, and hedges) and unlisted securities.
Level 3: Valuation techniques not based on observable inputs Inputs for the asset or liability that are not based on observable market data (unobservable inputs). In this model meas-urement is based on management’s assumptions and assessments, which depend on the price transparency and com-plexity of the financial instrument. This mainly applies to asset-backed securities and investments (see Note 3.2 for a list of AFS investments in which the Group holds interests of over 20%).
There were no material reclassifications from Level 1 to Level 2, or from Level 2 to Level 1 in 2011. The changes in the amounts at Level 1 and Level 2 largely relate to new and matured transactions, and disposals. Note 10.3.3 Fair value hier-archy: Level 3 disclosures contains detailed information on Level 3 of the fair value hierarchy.
31 Dec. 2011 EUR ’000 Fair value measurement Total fair FV of items value Level 1 Level 2 Level 3 at cost Assets Loans and advances to banks 583,546 – – – 583,546 Loans and advances to customers 9,718,140 – – – 9,718,140 Assets held for trading 471,080 – 16,196 454,883 – Positive fair value of hedges 471,809 – 471,809 – – Financial assets designated as at fair value through profit or loss 4,560 – 4,560 – – Available-for-sale financial assets 1,837,180 920,725 904,595 11,859 – Financial assets held to maturity 15,041 – – – 15,041 Investments accounted for using the equity method 47,942 – – – 47,942 Investment property 44,431 – – – 44,431 Property, plant and equipment: Land and buildings (excluding assets in the course of construction) 12,994 – – – 12,994 Sundry other assets 21,555 – 150 – 21,405 Total assets 13,228,276 920,725 1,397,310 466,742 10,443,499 Liabilities Deposits from banks 2,358,550 – – – 2,358,550 Deposits from customers 2,500,668 – – – 2,500,668 Debts evidenced by certificates 7,482,017 – – – 7,482,017 Liabilities held for trading 380,474 – 367,151 13,324 – Negative fair value of hedges 409,916 – 409,916 – – Other liabilities 51,945 – 425 – 51,520 Subordinated capital 203,187 – – – 203,187 Total liabilities 13,386,758 – 777,492 13,324 12,595,943

116 | ANNUAL REPORT 2011
HYPO NOE GROUP NOTES TO THE CONSOLIDATED FINANCIAL STATEMENTS
31 Dec. 2010 EUR ’000 Fair value measurement Total fair FV of items value Level 1 Level 2 Level 3 at cost Assets Loans and advances to banks 456,337 – – – 456,337 Loans and advances to customers 9,468,493 – – – 9,468,493 Assets held for trading 240,174 – 18,001 222,173 – Positive fair value of hedges 276,205 – 276,205 – – Financial assets designated as at fair value through profit or loss 9,406 – 9,406 – – Available-for-sale financial assets 2,014,702 836,657 1,143,735 34,310 – Financial assets held to maturity 70,589 – – – 70,589 Investments accounted for using the equity method 46,149 – – – 46,149 Investment property 25,455 – – – 25,455 Property, plant and equipment: Land and buildings (excluding assets in the course of construction) 15,066 – – – 15,066 Sundry other assets 20,850 – 1,036 – 19,814 Total assets 12,643,426 836,657 1,448,382 256,483 10,101,904 Liabilities Deposits from banks 2,624,978 – – – 2,624,978 Deposits from customers 2,377,983 – – – 2,377,983 Debts evidenced by certificates 6,215,997 – – – 6,215,997 Liabilities held for trading 152,989 – 139,583 13,406 – Negative fair value of hedges 204,380 – 204,380 – – Other liabilities 56,476 – 504 – 55,973 Subordinated capital 202,529 – – – 202,529 Total liabilities 11,835,332 – 344,466 13,406 11,477,459
10.3.3 Fair value hierarchy: Level 3 disclosures
EUR ’000 Gains or losses
Assets Assets held for trading 222,173 232,710 – – – – – 454,883 236,584 Available-for-sale financial assets 34,310 -542 283 257 – -22,449 – 11,859 -542 Total assets 256,483 232,168 283 257 – -22,449 – 466,742 236,042 Liabilities Liabilities held for trading 13,406 -83 – – – – – 13,324 -3,292 Total liabilities 13,406 -83 – – – – – 13,324 -3,292
As at 1 Jan. 2011
in profit or loss
in other com-prehensive
income Purchases Issues SettlementsTransfers to/out of Level 3
As at 31 Dec. 2011
Gains/losses recognised
in profit and loss for assets
held at end of period
The loss on existing Level 3 assets, at EUR 542thsd (2010: EUR 342thsd), is shown under “Net gains and losses on available-for-sale financial assets” (Note 7.9). The gain of EUR 236,584thsd (2010: EUR 105,598thsd) on assets held for trading and the loss of EUR 3,292thsd (2010: EUR 13,406thsd) on liabilities held for trading are reported under “Net trad-ing income” (Note 7.6).

ANNUAL REPORT 2011 | 117
HYPO NOE GROUP NOTES TO THE CONSOLIDATED FINANCIAL STATEMENTS
As at 1 Jan. 2011
in profit or loss
in other com-prehensive
income Purchases Issues SettlementsTransfers to/out of Level 3
As at 31 Dec. 2011
Gains/losses recognised
in profit and loss for assets
held at end of period
EUR ’000 Gains or losses
Assets Assets held for trading – 90,137 – – – – 132,036 222,173 105,598 Available-for-sale financial assets 39,751 1,476 797 – 247 -7,961 – 34,310 -342 Total assets 39,751 91,613 797 – 247 -7,961 132,036 256,483 105,256 Liabilities Liabilities held for trading – -2,055 – – – – 15,461 13,406 -13,406 Total liabilities – -2,055 – – – – 15,461 13,406 -13,406
10.4 Derivatives
Virtually all of the derivative financial instruments are hedges of the Bank’s own assets and liabilities, or customer de-rivatives.
Most hedging activities related to interest rate and exchange risk in respect of the Bank’s own issues and securities, and promissory notes including certificates of deposit. Interest rate and cross currency swaps were used to hedge these instruments from the time of designation through to the maturity of the underlying transaction in question. Customer derivatives and related hedges are classified as held for trading.
Currency swaps and forwards are used as economic hedges for currency positions.
There are also bought and sold put options on own securities and issues in circulation, and a bought put option on an investment.
The cumulative dollar offset method is used for retrospective measurement of hedge effectiveness, and regression analysis for prospective measurement.
Where market prices are available they are used to estimate fair value. In the absence of market prices, accepted, industry-standard valuation models are employed. The present value of linear derivatives (e.g. interest rate swaps, cross currency swaps, FX forwards and forward rate agreements) is calculated by discounting the replicating cash flows. OTC currency and interest rate options are measured using option pricing models such as the Black Scholes, Hull White or LIBOR market models.
10.4.1 Derivatives: nominal and fair value
31 Dec. 2011 31 Dec. 2010 Fair value Fair value EUR ’000 Nominal value Positive Negative Nominal value Positive Negative Interest rate risk Interest rate swaps 13,637,281 827,658 759,528 13,793,242 437,134 326,031 Basis swaps 1,175,705 20,181 3,849 – – – Options on interest rate instruments 675,781 15,293 14,855 841,295 16,108 16,166 Other similar contracts 20,000 9,556 – 20,000 7,640 – Total 15,508,767 872,688 778,232 14,654,537 460,881 342,197 Currency risk Cross-currency (interest rate) swaps 375,798 69,295 11,911 475,431 52,676 12,905 Forward exchange operations 111,028 351 584 304,008 3,261 2,693 Total 486,825 69,646 12,495 779,439 55,937 15,598 Share price and index-linked transactions Equity and other index-linked options 7,501 705 88 7,501 596 78 Total 7,501 705 88 7,501 596 78
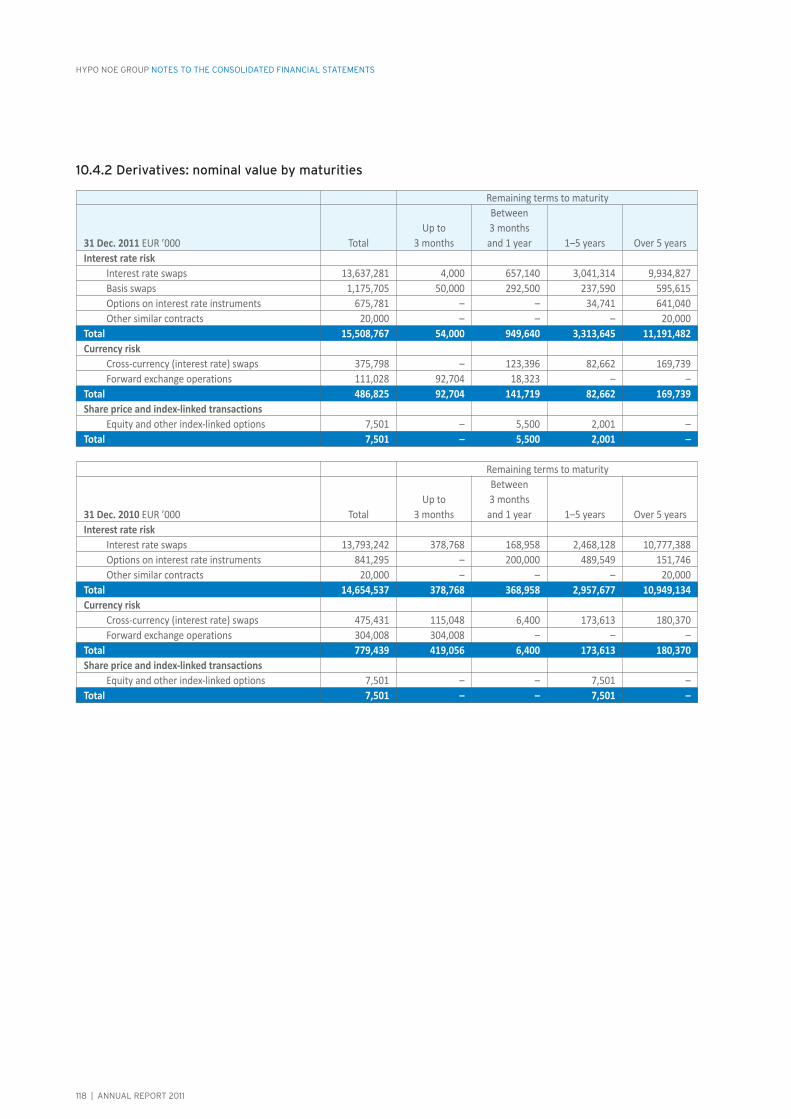
118 | ANNUAL REPORT 2011
HYPO NOE GROUP NOTES TO THE CONSOLIDATED FINANCIAL STATEMENTS
10.4.2 Derivatives: nominal value by maturities
Remaining terms to maturity
31 Dec. 2011 EUR ’000 Interest rate risk Interest rate swaps 13,637,281 4,000 657,140 3,041,314 9,934,827 Basis swaps 1,175,705 50,000 292,500 237,590 595,615 Options on interest rate instruments 675,781 – – 34,741 641,040 Other similar contracts 20,000 – – – 20,000 Total 15,508,767 54,000 949,640 3,313,645 11,191,482 Currency risk Cross-currency (interest rate) swaps 375,798 – 123,396 82,662 169,739 Forward exchange operations 111,028 92,704 18,323 – – Total 486,825 92,704 141,719 82,662 169,739 Share price and index-linked transactions Equity and other index-linked options 7,501 – 5,500 2,001 – Total 7,501 – 5,500 2,001 –
Remaining terms to maturity
31 Dec. 2010 EUR ’000 Interest rate risk Interest rate swaps 13,793,242 378,768 168,958 2,468,128 10,777,388 Options on interest rate instruments 841,295 – 200,000 489,549 151,746 Other similar contracts 20,000 – – – 20,000 Total 14,654,537 378,768 368,958 2,957,677 10,949,134 Currency risk Cross-currency (interest rate) swaps 475,431 115,048 6,400 173,613 180,370 Forward exchange operations 304,008 304,008 – – – Total 779,439 419,056 6,400 173,613 180,370 Share price and index-linked transactions Equity and other index-linked options 7,501 – – 7,501 – Total 7,501 – – 7,501 –
Total
Total
Up to 3 months
Up to 3 months
Between 3 months and 1 year
Between 3 months and 1 year
1–5 years
1–5 years
Over 5 years
Over 5 years

ANNUAL REPORT 2011 | 119
HYPO NOE GROUP NOTES TO THE CONSOLIDATED FINANCIAL STATEMENTS
10.5 Analyses of assets and liabilities by IAS 39 measurement categories and currencies
10.5.1 Analysis of assets and liabilities by IAS 39 measurement categories
31 Dec. 2010 EUR ’000 Cash and balances at central banks – – – – – – – – 39,613 39,613 Loans and advances to banks 432,511 – – – – – – – – 432,511 Loans and advances to customers 8,878,928 – – – – – – – – 8,878,928 Risk provisions -103,164 – – – – – – – – -103,164 Assets held for trading – – 240,174 – – – – – – 240,174 Positive fair value of hedges – – – – – – 274,978 1,227 – 276,205 Available-for-sale financial assets – – – – 2,014,702 – – – – 2,014,702 Financial assets designated as at fair value through profit or loss – – – 9,406 – – – – – 9,406 Financial assets held to maturity – – – – – 70,106 – – – 70,106 Investments accounted for using the equity method – – – – – – – – 46,149 46,149 Investment property – – – – – – – – 24,443 24,443 Positive fair value of banking book derivatives1 – – 1,036 – – – – – – 1,036 Other financial assets1 18,023 – – – – – – – – 18,023 Total financial assets 9,226,298 – 241,210 9,406 2,014,702 70,106 274,978 1,227 110,205 11,948,132 Deposits from banks – 2,624,226 – – – – – – – 2,624,226 Deposits from customers – 2,326,693 – – – – – – – 2,326,693 Debts evidenced by certificates – 5,945,431 – – – – – – – 5,945,431 Liabilities held for trading – – 152,989 – – – – – – 152,989 Negative fair value of hedges – – – – – – 204,380 – – 204,380 Subordinated capital – 202,529 – – – – – – – 202,529 Negative fair value of banking book derivatives1 – – 504 – – – – – – 504 Other financial liabilities1 – 45,424 – – – – – – – 45,424 Total financial liabilities – 11,144,303 153,493 – – – 204,380 – – 11,502,176
31 Dec. 2011 EUR ’000 Cash and balances at central banks – – – – – – – – 78,739 78,739 Loans and advances to banks 583,997 – – – – – – – – 583,997 Loans and advances to customers 9,702,478 – – – – – – – – 9,702,478 Risk provisions -104,006 – – – – – – – – -104,006 Assets held for trading – – 471,080 – – – – – – 471,080 Positive fair value of hedges – – – – – – 468,353 3,456 – 471,809 Available-for-sale financial assets – – – – 1,837,180 – – – – 1,837,180 Financial assets designated as at fair value through profit or loss – – – 4,560 – – – – – 4,560 Financial assets held to maturity – – – – – 15,031 – – – 15,031 Investments accounted for using the equity method – – – – – – – – 47,942 47,942 Investment property – – – – – – – – 43,411 43,411 Positive fair value of banking book derivatives1 – – 150 – – – – – – 150 Other financial assets1 19,022 – – – – – – – – 19,022 Total financial assets 10,201,491 – 471,230 4,560 1,837,180 15,031 468,353 3,456 170,092 13,171,393 Deposits from banks – 2,384,461 – – – – – – – 2,384,461 Deposits from customers – 2,473,410 – – – – – – – 2,473,410 Debts evidenced by certificates – 6,831,752 – – – – – – – 6,831,752 Liabilities held for trading – – 380,474 – – – – – – 380,474 Negative fair value of hedges – – – – – – 409,916 – – 409,916 Subordinated capital – 202,244 – – – – – – – 202,244 Negative fair value of banking book derivatives1 – – 425 – – – – – – 425 Other financial liabilities1 – 40,554 – – – – – – – 40,554 Total financial liabilities – 11,932,421 380,899 – – – 409,916 – – 12,723,236
Loans and receivables
(LAR)
Liabilities measured at
amortised cost (LAC)
Held for trading (HFT)
Designated as at fair val-ue through
profit or loss (FVPL)
Available for sale (AFS)
Held to maturity
(HTM)Fair value
hedgeCash flow
hedge
Financial as-sets/liabilites
at cost (at amortised
cost) Total
1Shown under “Other assets” or “Other liabilities” in the statement of financial position.
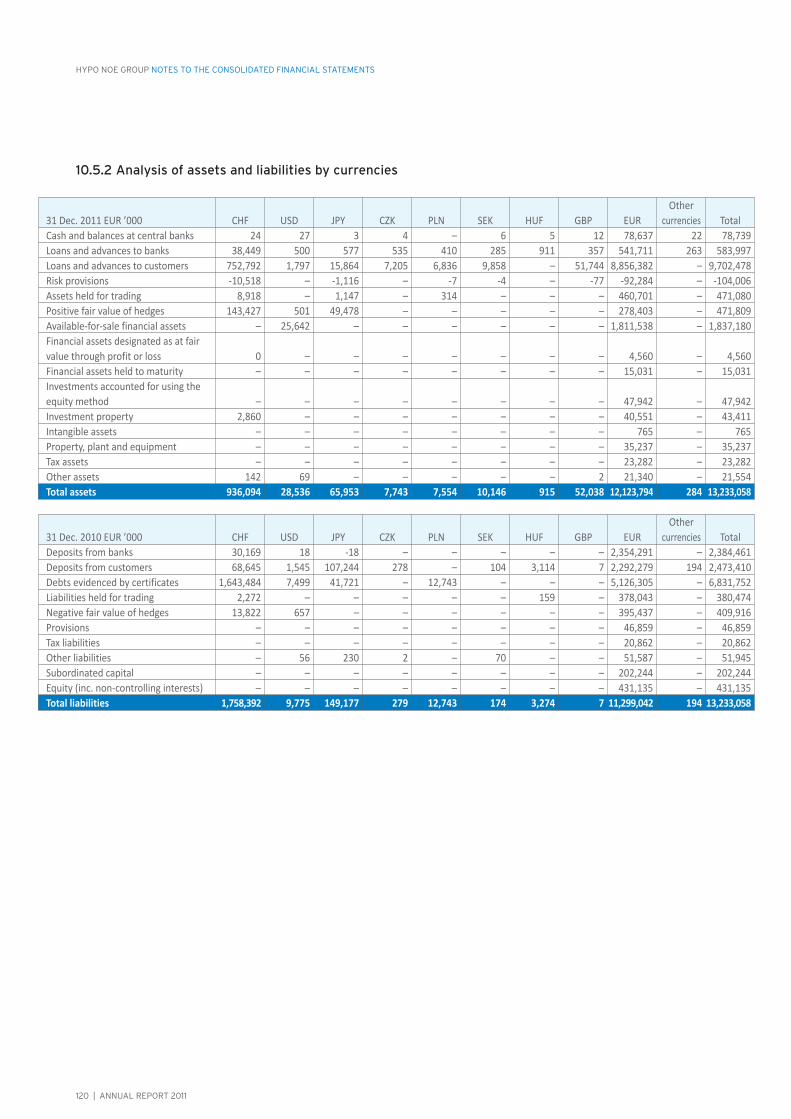
120 | ANNUAL REPORT 2011
HYPO NOE GROUP NOTES TO THE CONSOLIDATED FINANCIAL STATEMENTS
10.5.2 Analysis of assets and liabilities by currencies
Other 31 Dec. 2011 EUR ’000 CHF USD JPY CZK PLN SEK HUF GBP EUR currencies Total Cash and balances at central banks 24 27 3 4 – 6 5 12 78,637 22 78,739 Loans and advances to banks 38,449 500 577 535 410 285 911 357 541,711 263 583,997 Loans and advances to customers 752,792 1,797 15,864 7,205 6,836 9,858 – 51,744 8,856,382 – 9,702,478 Risk provisions -10,518 – -1,116 – -7 -4 – -77 -92,284 – -104,006 Assets held for trading 8,918 – 1,147 – 314 – – – 460,701 – 471,080 Positive fair value of hedges 143,427 501 49,478 – – – – – 278,403 – 471,809 Available-for-sale financial assets – 25,642 – – – – – – 1,811,538 – 1,837,180 Financial assets designated as at fair value through profit or loss 0 – – – – – – – 4,560 – 4,560 Financial assets held to maturity – – – – – – – – 15,031 – 15,031 Investments accounted for using the equity method – – – – – – – – 47,942 – 47,942 Investment property 2,860 – – – – – – – 40,551 – 43,411 Intangible assets – – – – – – – – 765 – 765 Property, plant and equipment – – – – – – – – 35,237 – 35,237 Tax assets – – – – – – – – 23,282 – 23,282 Other assets 142 69 – – – – – 2 21,340 – 21,554 Total assets 936,094 28,536 65,953 7,743 7,554 10,146 915 52,038 12,123,794 284 13,233,058
Other 31 Dec. 2010 EUR ’000 CHF USD JPY CZK PLN SEK HUF GBP EUR currencies Total Deposits from banks 30,169 18 -18 – – – – – 2,354,291 – 2,384,461 Deposits from customers 68,645 1,545 107,244 278 – 104 3,114 7 2,292,279 194 2,473,410 Debts evidenced by certificates 1,643,484 7,499 41,721 – 12,743 – – – 5,126,305 – 6,831,752 Liabilities held for trading 2,272 – – – – – 159 – 378,043 – 380,474 Negative fair value of hedges 13,822 657 – – – – – – 395,437 – 409,916 Provisions – – – – – – – – 46,859 – 46,859 Tax liabilities – – – – – – – – 20,862 – 20,862 Other liabilities – 56 230 2 – 70 – – 51,587 – 51,945 Subordinated capital – – – – – – – – 202,244 – 202,244 Equity (inc. non-controlling interests) – – – – – – – – 431,135 – 431,135 Total liabilities 1,758,392 9,775 149,177 279 12,743 174 3,274 7 11,299,042 194 13,233,058

ANNUAL REPORT 2011 | 121
HYPO NOE GROUP NOTES TO THE CONSOLIDATED FINANCIAL STATEMENTS
Other 31 Dec. 2010 EUR ’000 CHF USD JPY CZK PLN SEK HUF GBP EUR currencies Total Cash and balances at central banks 28 37 – 5 2 1 3 8 39,498 30 39,613 Loans and advances to banks 64,838 2,521 3,286 933 300 192 284 194 359,762 200 432,511 Loans and advances to customers 840,794 2,179 15,152 8,714 – 9,799 – 34,535 7,967,754 – 8,878,928 Risk provisions -9,212 – -2,224 – – – – – -91,728 – -103,164 Assets held for trading 7,951 2,691 1,985 – 1,209 – – – 226,338 – 240,174 Positive fair value of hedges 78,718 797 36,693 – – – – – 159,997 – 276,205 Available-for-sale financial assets – 29,784 45,911 – – – 76 – 1,938,931 – 2,014,702 Financial assets designated as at fair value through profit or loss – – – – – – – – 9,406 – 9,406 Financial assets held to maturity – – – – – – – – 70,106 – 70,106 Investments accounted for using the equity method – – – – – – – – 46,149 – 46,149 Investment property 2,936 – – – – – – – 21,507 – 24,443 Intangible assets – – – – – – – – 1,033 – 1,033 Property, plant and equipment – – – – – – – – 27,514 – 27,514 Tax assets – – – – – – – – 25,981 – 25,981 Other assets 2,021 2,818 21 – – – 51 307 15,631 – 20,850 Total assets 988,073 40,827 100,825 9,653 1,511 9,993 415 35,045 10,817,879 230 12,004,451
Other 31 Dec. 2010 EUR ’000 CHF USD JPY CZK PLN SEK HUF GBP EUR currencies Total Deposits from banks 40,197 5 -17 – – – – – 2,584,038 3 2,624,226 Deposits from customers 66,564 1,514 70,457 613 – – 3,250 7 2,184,211 78 2,326,693 Debts evidenced by certificates 1,542,356 8,461 226,486 – 12,222 – – – 4,155,907 – 5,945,431 Liabilities held for trading 1,245 – 619 – – – – – 151,125 – 152,989 Negative fair value of hedges 381 912 – – – – – – 203,087 – 204,380 Provisions – – – – – – – – 98,276 – 98,276 Tax liabilities – – – – – – – – 10,961 – 10,961 Other liabilities 5,843 2,644 – 11 – 45 7 1 47,925 2 56,478 Subordinated capital – – – – – – – – 202,529 – 202,529 Equity (inc. non-controlling interests) – – – – – – – – 382,488 – 382,488 Total liabilities 1,656,586 13,536 297,545 623 12,222 45 3,257 8 10,020,547 83 12,004,451

122 | ANNUAL REPORT 2011
HYPO NOE GROUP NOTES TO THE CONSOLIDATED FINANCIAL STATEMENTS
10.6 Disclosures on related party relationships
31 Dec. 2011 EUR ’000 Loans and advances to banks – – 1 – Loans and advances to customers 103,064 12,868 159,359 1,953 Equity instruments (shareholdings, etc.) 226 475 47,942 – Deposits from banks – – 333 – Deposits from customers 2,456 851 5,468 5,497 31 Dec. 2010 EUR ’000 Loans and advances to banks – – – – Loans and advances to customers 98,777 15,474 245,798 1,055 Equity instruments (shareholdings, etc.) 226 465 46,149 – Deposits from banks – – 216 – Deposits from customers 2,976 292 9,048 1,986
Non-consolidated subsidiaries (>50%) Associates
Investments accounted for using the equity method
Key management personnel
The transfer prices charged to each other by HYPO NOE Gruppe AG and related parties are at normal market levels. The non-consolidated subsidiaries and investments accounted for using the equity method are set out in Note 3.2 Investments.
The Lower Austrian state government holds a direct interest of 70.49% in HYPO NOE Gruppe Bank AG via NÖ Landes-Beteiligungsholding GmbH, and an indirect interest of 29.51% via NÖ BET GmbH.
Relationships with non-consolidated subsidiaries and associatesThe Chairman of the Management Board, Dr. Peter Harold, is a member of the supervisory board of NÖ Kulturwirtschaft GesmbH, St. Pölten.
Members of the Bank’s key management personnel hold office in the following companies: Castellum Schallaburg Grund-stückvermietungs Gesellschaft m.b.H., VIA DOMINORUM Grundstückverwertungs Gesellschaft m.b.H., WPS-Wirtschaftspark Sieghartskirchen Gesellschaft m.b.H., Liegenschaftsverwertung Felixdorf GmbH, Wilax Wien-Laxenburg NÖ Veranstaltungs Gesellschaft mbH, NÖ Kulturwirtschaft GesmbH, Melker Kommunalimmobilienverwaltungs Gesellschaft m.b.H., and Wohn-park Schrems Liegenschaftsverwertungs Gesellschaft m.b.H. – all domiciled in St. Pölten – as well as Pöchlarner Kommunal-immobilienverwaltungs Gesellschaft m.b.H., Pöchlarn, Loosdorfer Kommunalimmobilien Gesellschaft m.b.H., Loosdorf, and Schwarzauer Kommunalimmobilienverwaltungs Gesellschaft m.b.H., Schwarzau am Steinfelde.
A member of the key management personnel serves on the supervisory board of VIA DOMINORUM Grundstückverwertungs Gesellschaft m.b.H., St. Pölten.
Relationships with entities accounted for using the equity methodThe Chairman of the Management Board, Dr. Peter Harold, chairs the supervisory board of EWU Wohnbau Unternehmens-beteiligungs-Aktiengesellschaft, Vienna, and the supervisory boards of its subsidiaries “Wohnungseigentümer” Gemein-nützige Wohnbaugesellschaft m.b.H., Mödling, GEBAU-NIOBAU Gemeinnützige Baugesellschaft m.b.H., Maria Enzersdorf am Gebirge, and Gemeinnützige Wohnungsgesellschaft “Austria” Aktiengesellschaft, Mödling. Dr. Harold is also a member of the supervisory board of Niederösterreichische Vorsorgekasse AG, St. Pölten.
The other member of the Management Board, Nikolai de Arnoldi is the chairman of Niederösterreichische Vorsorgekasse AG, St. Pölten.
Members of the Bank’s key management personnel hold office on the management boards of Niederösterreichische Vor-sorgekasse AG, St. Pölten and EWU Wohnbau Unternehmensbeteiligungs-Aktiengesellschaft, Vienna.
Members of the Bank’s key management personnel are chief executives at the following companies: CULINA Grundstückvermietungs Gesellschaft m.b.H., FACILITAS Grundstückvermietungs Gesellschaft m.b.H., FORIS Grund-stückvermietungs Gesellschaft m.b.H.,VALET-Grundstückverwaltungs Gesellschaft m.b.H., NÖ. HYPO LEASING - Sparkasse Re-gion St. Pölten Grundstückvermietungs Gesellschaft m.b.H., LITUS Grundstückvermietungs Gesellschaft m.b.H., CONATUS Gr-undstückvermietungs Gesellschaft m.b.H., UNDA Grundstückvermietungs Gesellschaft m.b.H., Palatin Grundstückverwaltungs Gesellschaft m.b.H., and NÖ. Landeshauptstadt - Planungsgesellschaft m.b.H. – all domiciled in St. Pölten – as well as TRABITUS Grundstückvermietungs Gesellschaft m.b.H., Adoria Grundstückvermietungs Gesellschaft m.b.H., Esquilin Grundstücksverwal-tungs Gesellschaft m.b.H., Purge Grundstücksverwaltungs-Gesellschaft m.b.H., Viminal Grundstückverwaltungs Gesellschaft m.b.H., N.Ö. Gemeindegebäudeleasing Gesellschaft m.b.H., N.Ö. Kommunalgebäudeleasing Gesellschaft m.b.H., NÖ-KL Kom-

ANNUAL REPORT 2011 | 123
HYPO NOE GROUP NOTES TO THE CONSOLIDATED FINANCIAL STATEMENTS
munalgebäudeleasing Gesellschaft m.b.H., Quirinal Grundstücksverwaltungs Gesellschaft m.b.H., Franz-Glaser-Gasse 28 Im-mobilienentwicklung GmbH – all domiciled in Vienna – and Aventin Grundstückverwaltungs Gesellschaft m.b.H., Horn.
Members of the Bank’s key management personnel are authorised signatories at the following companies: CULINA Grundstückvermietungs Gesellschaft m.b.H., FORIS Grundstückvermietungs Gesellschaft m.b.H., VALET-Grund-stückverwaltungs Gesellschaft m.b.H., Hotel- und Sportstätten-Beteiligungs-,Errichtungs- und Betriebsgesellschaft m.b.H. Leasing KG, NÖ.HYPO LEASING - Sparkasse Region St.Pölten Grundstückvermietungs Gesellschaft m.b.H., LITUS Grund-stückvermietungs Gesellschaft m.b.H., CONATUS Grundstückvermietungs Gesellschaft m.b.H., Palatin Grundstückverwal-tungs Gesellschaft m.b.H. – all domiciled in St. Pölten – as well as Adoria Grundstückvermietungs Gesellschaft m.b.H., Es-quilin Grundstücksverwaltungs Gesellschaft m.b.H., Viminal Grundstückverwaltungs Gesellschaft m.b.H. – all domiciled in Vienna – and Aventin Grundstückverwaltungs Gesellschaft m.b.H., Horn.
Members of key management hold office with NÖ Raiffeisen Kommunalprojekte Service Gesellschaft m.b.H. & NÖ.HYPO Leasinggesellschaft m.b.H. - Strahlentherapie OG and NÖ. HYPO Leasing und Raiffeisen-Immobilien-Leasing Traisenhaus GesmbH & Co OG, both St. Pölten.
Members of key management are members, chairmen or deputy chairmen of the supervisory boards of the following com-panies: NÖ Beteiligungsfinanzierungen GmbH, HYPO Capital Management AG, EWU Wohnbau Unternehmensbeteiligungs-Ak-tiengesellschaft – all domiciled in Vienna – as well as Gemeinnützige Wohnungsgesellschaft “Austria” Aktiengesellschaft and “Wohnungseigentümer” Gemeinnützige Wohnbauggesellschaft m.b.H. – both domiciled in Mödling – and GEBAU-NI-OBAU Gemeinnützige Baugesellschaft m.b.H., Maria Enzersdorf am Gebirge.
The chairman of the Supervisory Board is the deputy chairman of the supervisory boards of EWU Wohnbau Unternehmens-beteiligungs-Aktiengesellschaft, Vienna and its subsidiaries “Wohnungseigentümer” Gemeinnützige Wohnbaugesellschaft m.b.H., Mödling, GEBAU-NIOBAU Gemeinnützige Baugesellschaft m.b.H., Maria Enzersdorf am Gebirge, and Gemeinnützige Wohnungsgesellschaft “Austria” Aktiengesellschaft, Mödling.
Relationships with parent companiesA member of the Supervisory Board chairs the supervisory board of NÖ Landes-Beteiligungsholding GmbH, St. Pölten. A supervisory commissioner of the Bank is the chief executive of NÖ BET GmbH and NÖ Landes-Beteiligungsholding GmbH, both domiciled in St. Pölten.
Relationships with subsidiaries of the parent companies and companies owned by the Lower Austrian state governmentA member of the Bank’s key management personnel is the chief executive of Landesimmobiliengesellschaft m.b.H., St. Pölten.
The deputy chairman of the Supervisory Board is the chairman of the supervisory board of EVN AG, Maria Enzersdorf, and a member of the supervisory board of Flughafen Wien AG (the operator of Vienna International Airport).
A member of the Supervisory Board is the chairman of the supervisory boards of EBG MedAustron GmbH, Wiener Neustadt and ecoplus.Niederösterreichs Wirtschaftsagentur GmbH, St. Pölten, and deputy chairman of the supervisory board of N.vest Unternehmensfinanzierungen des Landes Niederösterreich GmbH, St. Pölten and of Fachhochschule Wiener Neustadt für Wirtschaft und Technik Gesellschaft m.b.H., Wiener Neustadt; he is also a member of the supervisory board of RIZ Nied-erösterreichs Gründeragentur Ges.m.b.H., Wiener Neustadt.
A supervisory commissioner of the Bank is the chief executive of NÖ Holding GmbH and NÖ Immobilien Holding GmbH – both domiciled in St. Pölten – and chairman of the supervisory board of Land Niederösterreich Finanz- und Beteiligungsmanagement GmbH, St. Pölten, as well as deputy chairman of the supervisory boards of EBG MedAustron GmbH, Wiener Neustadt and tecnet equity NÖ Technologiebeteiligungs-Invest GmbH, St. Pölten, and a member of the supervisory board of EVN AG, Maria Enzersdorf.
Additional disclosuresDue to his office as a mayor, a member of the Supervisory Board has business dealings with the HYPO NOE Group regarding loans to his local authority.
In 2011 an “identified staff” group of employees was designated and adopted by the Compensation Committee in compli-ance with the new legal framework governing variable remuneration at banks created by CRD III and section 39b Austrian Banking Act. A distinction is drawn between “identified staff” and “identified staff with less material impact”. These two employee groups will in future make up “key management”. As a result, the latter personnel category has grown as com-pared to 2010. The figures for the comparative period have not been adjusted.

124 | ANNUAL REPORT 2011
HYPO NOE GROUP NOTES TO THE CONSOLIDATED FINANCIAL STATEMENTS
10.7 Assets pledged as collateral
Assets have been pledged as collateral for liabilities and contingent liabilities in the amounts shown below:
10.8 Trust transactions
In accordance with IFRS, trust transactions entered into by the HYPO NOE Group in its own name but for the account of third parties are not shown in the statement of financial position. Any commissions are reported under “Net fee and commission income” in the comprehensive income statement (Note 7.5, “Other fee and commission income and “Other fee and commission expense”).
An analysis of trust transactions not disclosed in the statement of financial position is shown below.
10.9 Contingent liabilities, credit risk and latent legal risk
10.9.1 Contingent liabilities
10.9.2 Credit risk
10.9.3 Legal risks
Legal risks in connection with Augustus Funding LimitedOn 21 July 2011 an interest penalty of EUR 57,934thsd was imposed on HYPO NOE Gruppe Bank AG by notice of the Austrian Financial Market Authority. HYPO NOE Gruppe Bank AG has lodged timely appeals against this notice with the Constitutional Court and the Administrative Court of Appeal. As these appeals have no suspensive effect, the Bank paid the above interest penalty on 31 August 2011. On 29 November 2011 the Constitutional Court refused to consider the ap-peal. The proceedings before the Administrative Court of Appeal are still pending.
The existing provision was used to pay the interest penalty, and the outstanding amount arising from the lower penalty under the notice was reversed through profit or loss (see Note 8.25.1 Movements in provisions).
The following assets were received as collateral for the above liabilities:
EUR ’000 31 Dec. 2011 31 Dec. 2010 Debts evidenced by certificates 4,313,619 3,453,395 Total 4,313,619 3,453,395
EUR ’000 31 Dec. 2011 31 Dec. 2010 Loans and advances to customers 4,313,619 3,453,395 Total 4,313,619 3,453,395
EUR ’000 31 Dec. 2011 31 Dec. 2010 Acceptances and endorsements 327 327 Liabilities arising from guarantees and furnishing of collateral 132,741 156,718
EUR ’000 31 Dec. 2011 31 Dec. 2010 Credit risk 1,284,930 1,650,398
EUR ’000 31 Dec. 2011 31 Dec. 2010 Assets held in trust Loans and advances to customers 2,266 2,392 Total 2,266 2,392 Liabilities held in trust Deposits from banks 2,266 2,392 Total 2,266 2,392
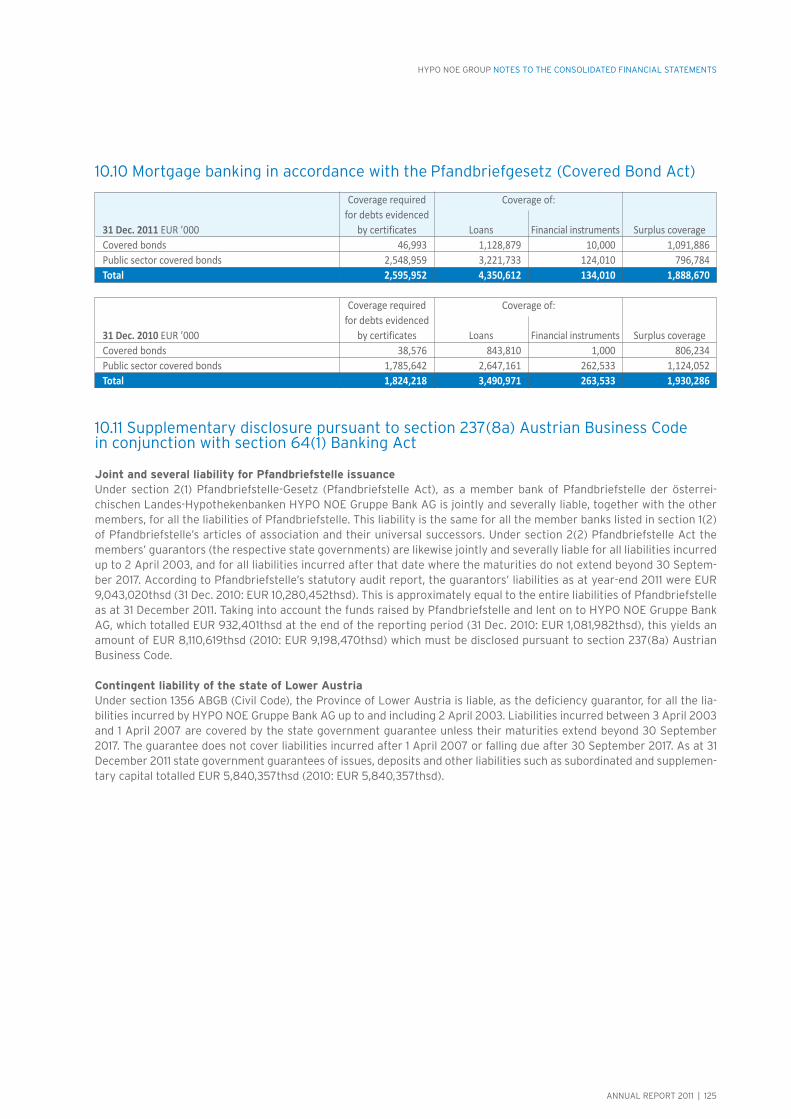
ANNUAL REPORT 2011 | 125
HYPO NOE GROUP NOTES TO THE CONSOLIDATED FINANCIAL STATEMENTS
10.10 Mortgage banking in accordance with the Pfandbriefgesetz (Covered Bond Act)
Coverage of: 31 Dec. 2011 EUR ’000 Covered bonds 46,993 1,128,879 10,000 1,091,886 Public sector covered bonds 2,548,959 3,221,733 124,010 796,784 Total 2,595,952 4,350,612 134,010 1,888,670
Coverage of: 31 Dec. 2010 EUR ’000 Covered bonds 38,576 843,810 1,000 806,234 Public sector covered bonds 1,785,642 2,647,161 262,533 1,124,052 Total 1,824,218 3,490,971 263,533 1,930,286
Coverage required for debts evidenced
by certificates
Coverage required for debts evidenced
by certificates
Loans
Loans
Financial instruments
Financial instruments
Surplus coverage
Surplus coverage
10.11 Supplementary disclosure pursuant to section 237(8a) Austrian Business Code in conjunction with section 64(1) Banking Act
Joint and several liability for Pfandbriefstelle issuance Under section 2(1) Pfandbriefstelle-Gesetz (Pfandbriefstelle Act), as a member bank of Pfandbriefstelle der österrei-chischen Landes-Hypothekenbanken HYPO NOE Gruppe Bank AG is jointly and severally liable, together with the other members, for all the liabilities of Pfandbriefstelle. This liability is the same for all the member banks listed in section 1(2) of Pfandbriefstelle’s articles of association and their universal successors. Under section 2(2) Pfandbriefstelle Act the members’ guarantors (the respective state governments) are likewise jointly and severally liable for all liabilities incurred up to 2 April 2003, and for all liabilities incurred after that date where the maturities do not extend beyond 30 Septem-ber 2017. According to Pfandbriefstelle’s statutory audit report, the guarantors’ liabilities as at year-end 2011 were EUR 9,043,020thsd (31 Dec. 2010: EUR 10,280,452thsd). This is approximately equal to the entire liabilities of Pfandbriefstelle as at 31 December 2011. Taking into account the funds raised by Pfandbriefstelle and lent on to HYPO NOE Gruppe Bank AG, which totalled EUR 932,401thsd at the end of the reporting period (31 Dec. 2010: EUR 1,081,982thsd), this yields an amount of EUR 8,110,619thsd (2010: EUR 9,198,470thsd) which must be disclosed pursuant to section 237(8a) Austrian Business Code.
Contingent liability of the state of Lower AustriaUnder section 1356 ABGB (Civil Code), the Province of Lower Austria is liable, as the deficiency guarantor, for all the lia-bilities incurred by HYPO NOE Gruppe Bank AG up to and including 2 April 2003. Liabilities incurred between 3 April 2003 and 1 April 2007 are covered by the state government guarantee unless their maturities extend beyond 30 September 2017. The guarantee does not cover liabilities incurred after 1 April 2007 or falling due after 30 September 2017. As at 31 December 2011 state government guarantees of issues, deposits and other liabilities such as subordinated and supplemen-tary capital totalled EUR 5,840,357thsd (2010: EUR 5,840,357thsd).

126 | ANNUAL REPORT 2011
HYPO NOE GROUP NOTES TO THE CONSOLIDATED FINANCIAL STATEMENTS
10.12 Events after the reporting period
The full impact of this year’s tax reform remains to be seen. While the effects will probably be modest this year, they are likely to be the dominant feature of 2013. Our public finance and real estate finance businesses, and our retail business with its subsidised retirement saving products will be affected. An increase in the bank tax is also expected this year.
Developments with regard to the PIIGS countries, Hungary and Cyprus since the start of 2012 have been as follows.
In February 2012 the European Commission downgraded its growth forecasts for the EU. The so-called PIIGS countries – Portugal, Italy, Ireland, Greece and Spain – are thus likely to be confronted with weaker export demand than was previ-ously anticipated. Government austerity programmes, weak consumer demand and risk-averse investor behaviour are depressing growth and tax revenues. As a result. the governments’ budget targets will be still more difficult to meet.
It remains questionable whether Portugal will be able to return to the capital markets towards the end of 2013, meaning that a second aid package could be necessary. The Group’s Portuguese exposure was completely eliminated during the first quarter of 2012.
In February 2012 the Irish government announced that a referendum on the Fiscal Compact Treaty would be held in late May or early June. If Irish voters reject the treaty, the country could lose its access to the euro bailout fund.
Since November 2011 the Italian caretaker government has pushed through eight reform packages, the most recent of which was a comprehensive overhaul of the service sector passed at the start of March. The government’s term of office is due to end in the spring of 2013.
The Greek parliament has met the conditions attached to the EUR 130bn aid package by passing the necessary budget, pension and administrative reform legislation. The country’s private creditors have until 8 March to state whether they will sign up to the debt haircut. A high level of participation is crucial to the success of the rescue programme. The Bank’s exposure to Greek debt was reduced by a nominal amount of EUR 20m during the first quarter of 2012. We accepted the Greek government’s debt swap offer of 24 February 2012 for the remaining EUR 10m within the deadline.
Spain has missed its 2011 budget deficit target by a wide margin. The autonomous regions are largely responsible for this. The government would now like to renegotiate or water down the spending targets agreed with Brussels.
Near the end of 2011 Russia lent Cyprus EUR 2.5bn. This will enable the country to service its debts in 2012. Nevertheless, the Cypriot banking sector, with its strong ties with Greece, is still very shaky. Support from the IMF and/or the EU could be needed this year.
The European Commission has announced that it will block about EUR 500m of funds for Hungary. The reason given is the country’s repeated infringement of the stability pact. Hungary pushed its budget deficit to below 3% of GDP in 2011, but this was only achieved by one-time effects rather than sustainable measures, and the deficit is likely to top 3% again in 2012.
ANNUAL REPORT 2011 | 127
HYPO NOE GROUP NOTES TO THE CONSOLIDATED FINANCIAL STATEMENTS
10.13 Governing bodies of HYPO NOE Gruppe Bank AG
The following persons were members of the Management and Supervisory boards during the reporting period:
Management BoardPeter Harold, ChairmanNikolai de Arnoldi, member Günther Ritzberger, MBA, member (until 30 April 2011)
Supervisory BoardHerbert Fichta, Chairman (until 31 December 2011)Burkhard Hofer, Deputy Chairman (until 31 December 2011; Chairman since 1 January 2012)Michael Lentsch (Deputy Chairman since 1 January 2012)Willibald Eigner (until 31 December 2011)Klaus SchneebergerKarl SchlöglKarl SonnweberEngelbert Josef Dockner (since 1 January 2012)Hubert Schultes (since 1 January 2012)
Delegated by the Works CouncilHermann HaitzerPeter BöhmFranz GyöngyösiFranz Siegl
State commissioners Michael Svoboda, Federal Ministry of Finance (until 31 December 2011)Franz Ternyak, Federal Accounting AgencyHans Georg Kramer, CFP, Federal Ministry of Finance (since 1 January 2012)
Supervisory commissionersReinhard Meissl, office of the Lower Austrian state governmentHelmut Frank, office of the Lower Austrian state government
St. Pölten, 29 March 2012The Management Board
Peter Harold Nikolai de ArnoldiChairman of the Management Board Member of the Management Board

128 | ANNUAL REPORT 2011

ANNUAL REPORT 2011 | 129

130 | ANNUAL REPORT 2011
HYPO NOE GROUP DECLARATION BY THE COMPANY’S LEGAL REPRESENTATIVES

ANNUAL REPORT 2011 | 131
HYPO NOE GROUP DECLARATION BY THE COMPANY’S LEGAL REPRESENTATIVES
We hereby confirm that to the best of our knowledge the consolidated financial statements of HYPO NOE Gruppe Bank AG give a true and fair view of the Company’s assets, finances and earnings to the maximum extent possible, in conformity with the relevant accounting standards, that the operational and financial review presents the course of the Company’s business, and its results and financial condition in such a manner as to give a true and fair view of the Company’s assets, finances and earnings, and that that review describes the principal risks and uncertainties to which the Company is exposed.
St. Pölten, 29 March 2012The Management Board
DECLARATION BY THE COMPANY’S LEGAL REPRESENTATIVES
Peter HaroldChairman of the Management Board
Responsible forSales, Treasury, Participations, Organisation & IT,Business Development, Human Resources,Controlling, Communications and Audit
Nikolai de Arnoldi Member of the Management Board
Responsible for Risk Management,Accounting, Legal, Credit and Treasury Services
132 | ANNUAL REPORT 2011
HYPO NOE GROUP AUDITORS’ REPORT
Report on the consolidated financial statements
We have audited the accompanying consolidated financial statements of HYPO NOE Gruppe Bank AG (formerly HYPO Investmentbank AG), St. Pölten for the year ended 31 December 2011. These consolidated financial statements com-prise the consolidated statement of financial position as at 31 December 2011, and the statement of comprehensive in-come, consolidated statement of cash flows and consolidated statement of changes in equity for the year then ended, as well as the notes thereto.
Management’s responsibility for the consolidated annual financial statements and for the accounting systemThe Company’s management is responsible for the accounting system and fair presentation of these consolidated annual financial statements in accordance with the International Financial Reporting Standards (IFRSs) as adopted by the EU. This responsibility includes: designing, implementing and maintaining an internal control system, where relevant to the preparation and fair presentation of consolidated financial statements that are free from material misstatement, whether due to fraud or error; selecting and applying appropriate accounting policies; and making ac-counting estimates that are reasonable in the circumstances. Auditors’ responsibilities, and description of the nature and scope of the statutory audit Our responsibility is to express an opinion on these consolidated financial statements based on our audit. We conduct-ed our audit in accordance with the laws and regulations applicable in Austria, as well as the International Standards on Auditing (ISAs) issued by the International Auditing and Assurance Standards Board (IAASB) of the International Federation of Accountants (IFAC). Those standards require that we comply with professional guidelines, and plan and perform the audit to obtain reasonable assurance whether the consolidated financial statements are free from mate-rial misstatement.
An audit involves performing procedures to obtain audit evidence about the amounts and disclosures in the con-solidated financial statements. The procedures selected depend on the auditor’s judgement, including the auditor’s assessment of the risks of material misstatement, whether due to fraud or error. In making those risk assessments, the auditor considers internal control relevant to the Group’s preparation and fair presentation of the consolidated financial statements in order to design audit procedures that are appropriate in the circumstances, but not for the purpose of expressing an opinion on the effectiveness of the Group’s internal control. An audit also includes evaluat-ing the appropriateness of the accounting policies used and the reasonableness of the accounting estimates made by management, as well as evaluating the overall presentation of the consolidated financial statements.
We believe that the audit evidence we have obtained is sufficient and appropriate to provide a sound basis for our audit opinion.
AUDITORS’ REPORT

GESCHÄFTSBERICHT 2011 | 133
OpinionOur audit did not give rise to any objections. In our opinion, which is based on the results of our audit, the consolidated financial statements comply with the legal requirements, and give a true and fair view of the financial position of the Group as at 31 December 2011 and of its financial performance and its cash flows for the year then ended, in accordance with International Financial Reporting Standards (IFRSs) as adopted by the EU. Opinion on the Group operational and financial reviewPursuant to statutory provisions, the Group operational and financial review is to be audited as to whether it is con-sistent with the consolidated financial statements and as to whether any additional disclosures it contains are not misleading with respect to the Group’s position. The auditor’s report must also contain a statement as to whether the Group operational and financial review is consistent with the consolidated financial statements and whether the disclosures pursuant to section 243a(2) UGB (Austrian Business Code) are appropriate.
In our opinion the Group operational and financial review is consistent with the consolidated financial statements. The disclosures pursuant to section 243a(2) Austrian Business Code are appropriate.
Vienna, 5 April 2012Deloitte Audit Wirtschaftsprüfungs GmbH
Bruno Moritz m.p. Tax consultant
Thomas Becker m.p. Peter Bitzyk m.p. Certified public accountant Certified public accountant
The consolidated financial statements bearing our audit opinion may only be published or transmitted in the version certified by us. This audit opinion relates exclusively to the complete German language consolidated financial statements, and operational and financial review. The provisions of section 281(2) Austrian Business Code apply to other versions.
HYPO NOE GROUP AUDITORS’ REPORT

134 | ANNUAL REPORT 2011
HYPO NOE GROUP REPORT OF THE SUPERVISORY BOARD
In 2011 the Supervisory Board discharged the duties incumbent upon it by virtue of the law and the articles of association, and was kept regularly informed by the Management Board on the course of business and the state of the Bank’s affairs.
The accounts and records, and the annual financial statements, as well as the operational and financial review to the extent that it discusses the financial statements, have been audited by the independent auditors Deloitte Audit Wirtschaftsprüfungs GmbH. As the audit gave rise to no objections and the statutory requirements were fully complied with, the auditors issued an unqualified audit certificate. The Supervisory Board concurred with the audit findings, is in agreement with the annual financial statements for the year ended 31 December 2011 and the operational and financial review, including the dividend recommendation, submitted to it by the Management Board, and hereby approves the 2011 annual financial statements in accordance with section 96(4) Aktiengesetz (Austrian Companies Act).
The auditors Deloitte Audit Wirtschaftsprüfungs GmbH audited the 2011 consolidated financial statements for com-pliance with the International Financial Reporting Standards (IFRSs) issued by the International Accounting Standards Board which are applicable in the EU, and the Group operational and financial review for compliance with the Austrian Business Code. The audit gave rise to no objections and the auditors found that the statutory requirements had been fully complied with. In the opinion of the auditors the consolidated financial statements give a true and fair view of the financial position of the Group as at 31 December 2011 and of its financial performance and its cash flows for the year then ended, in accordance with International Financial Reporting Standards (IFRSs) applicable in the EU. The auditors confirmed that the Group operational and financial review is consistent with the consolidated financial statements, such that the statutory requirements for exemption from the obligation to prepare consolidated financial statements according to Austrian law are fulfilled, and issued an unqualified audit certificate. The Supervisory Board concurred with the audit findings.
St. Pölten, 19 April 2012The Supervisory Board
Burkhard HoferChairman
REPORT OF THE SUPERVISORY BOARD

PROPRIETOR AND PUBLISHER:HYPO NOE Gruppe Bank AGEditorial content: HYPO NOE Gruppe Bank AGDesign: studio MgrafiX, www.mgrafix.at

www.hyponoe.at