Embed Size (px)
Citation preview

Your Satellite Connection to the World
ANNUAL REPORT2010

01 Highlights
02 Chairman’s statement
04 Corporate governance04 SES shareholders05 Chairman’s report on corporate governance and
internal control procedures
18 Financial review by management
22 Consolidated fi nancial statements22 Independent auditor’s report23 Consolidated income statement 24 Consolidated statement of comprehensive income25 Consolidated statement of fi nancial position26 Consolidated statement of cash fl ow27 Consolidated statement of changes in shareholders’ equity28 Notes to the consolidated fi nancial statements
72 SES S.A. annual accounts72 Independent auditor’s report73 Balance sheet74 Profi t and loss account74 Statement of changes in shareholders’ equity75 Notes to the accounts
84 Other information
Contents

Reported EBITDA +8.6%
€1,296.4m
Recurring2 revenue +5.1%
€1,718m
Average weighted earnings per share +1.6%
€1.24
Proposed dividend3 +9.6%
€0.80
Reported revenue +7.1%
€1,735.7m
Operating profi t +10.8%
€797.4m
Recurring EBITDA +5.0%
€1,307m
– Four new satellites brought into operation
– Net fl eet inventory increased by 76 to 1,249 available transponders4
– Utilisation rate of 79.3% with strengthened coverage of emerging markets
– Participation in the fi nal equity fi nancing round of O3b Networks
Operational highlights
Financial highlights1
Revenue (EUR million)
2010
2010
2010
2010
2009
2009
2009
2009
2008
2008
2008
2008
1,735.7
1,620.3
1,521.2
EBITDA (EUR million)
1,296.4
1,193.7
1,094.2
Average weighted earnings per share (EUR)
2009: €1,635m
2009: €1.22
2009: €0.73
2009: €1,620.3m
2009: €719.6m
1.24
1.22
0.98
Net debt/EBITDA
2009: €1,245m
2.91
2.99
3.16
1 2009 and 2008 fi gures restated for the presentation of discontinued operations under IFRS 5.
2 ‘ Recurring’ is a measure designed to represent underlying revenue/EBITDA performance by removing currency exchange effects, eliminating one-time items, considering changes in consolidation scope and excluding revenue/EBITDA from new business initiatives that are still in the start-up phase.
3 Per Class A share proposed.
4 36 MHz equivalent.
2009: €1,193.7m
Highlights
01SES Annual Report 2010

Chairman’s statement
As stressed before we pursued our ambitious multi-year investment programme to renew and expand our satellite fl eet, launching two satellites (SES-1 and ASTRA 3B) and bringing two more into commercial service (NSS-12, launched in late 2009, and SES-7 (ProtoStar 2), an in-orbit satellite acquired during 2010). The new spacecraft, after accounting for orbital relocations and adjustments, added a net 76 transponders to the available capacity on the SES fl eet.
We ordered a new spacecraft, SES-6, from Astrium. In early 2011, we announced the procurement of the SES-8 satellite with Orbital Sciences Corp. In all, SES now has 13 satellites under construction, all to be launched until 2014. Providing replacement and incremental capacity, they will add 293 transponders to the fl eet, an increase of 23% compared to year-end 2010.
During 2010, we commercialised most of the newly-launched capacity targeting the growth economies of the world. ASTRA 3B’s Middle Eastern beam was fully contracted by year-end; so was the Indian beam on SES-7. NSS-12 over the Indian Ocean region reached full utilisation shortly after entering commercial service.
Continuity, reorganisation and growth On behalf of the Board of Directors, I am proud to announce a strong set of results for the business year 2010. In line with the outstanding achievements of the past several years, the 2010 results are yet again testimony to the successful execution of the company’s growth strategy over time. The 2010 results were achieved despite operational challenges and the delayed launches of new satellites; they underline the company’s resilience and ability to adapt.
2010 was a year of refocusing the SES group’s activities on the core business of providing satellite infrastructure. Following our decision to sell a majority interest in the satellite services unit ND SatCom, we reached an agreement with Astrium, who acquired a 75.1% interest in ND SatCom. We also commited to invest a further USD 75 million in the fi nal equity fi nancing round of O3b Networks, an exciting Ka-band service that is to provide backbone connectivity via satellite to the ‘Other 3 billion’ people in developing areas of the world who are devoid of broadband access today.
SES looks into the future with confi dence. Executing on our mission to provide even better service to our customers, we are planning to launch seven satellites and payloads in 2011.
René SteichenChairman of the Board of Directors
02 SES Annual Report 2010

In 2010, we extended the core business by providing transmission capacity for four new DTH platforms, Wananchi in East Africa, Claro TV in Puerto Rico, AVG in Vietnam and Top TV in South Africa. At 67° West, we brought a new orbital position into use for the Andean Community. In Europe, we continued to develop the Eastern European customer base at 31.5° East, and we registered a favourable development in the core DTH markets.
Revenue and EBITDA growth at the top end of the guidance range Overall, SES achieved steady progress in 2010. The group’s strong fi nancial results arose from contributions from both SES ASTRA and SES WORLD SKIES. Recurring1 revenue and EBITDA both grew at the top end of the guidance range of 4% to 5%, buoyed by a strong fourth quarter 2010.
Revenue increased to EUR 1,735.7 million (+7.1%); on a recurring basis, revenue rose 5.1% to EUR 1,718 million. EBITDA increased by 8.6% to EUR 1,296.4 million on a reported basis, and by 5.0% to EUR 1,307 million on a recurring basis. The reported growth rates of full-year revenue and EBITDA also benefi ted from the stronger U.S. dollar.
EBITDA margins were strong at 74.7% on a reported and 76.1% on a recurring basis; the core infrastructure business reached an EBITDA margin of 83.0%.
The growth in EBITDA drove a 10.8% increase in reported operating profi t, to EUR 797.4 million.
Net profi t from continuing operations after tax increased by 4.9%, to EUR 523.8 million. Net profi t of the group was EUR 487.3 million, up 2.3% compared to the prior year.
Closing net debt rose by 5.6% to EUR 3,760.8 million, but with the expansion at the EBITDA level, the net debt/EBITDA ratio fell in the course of 2010 from 2.99 to 2.91 times, being well under the group’s self-imposed ceiling of 3.3 times.
Earnings per share rose to EUR 1.24 per Class A share. Refl ecting our progressive dividend policy, the Board of Directors proposed to increase the dividend to EUR 0.80 per Class A share, up from EUR 0.73 per share of Class A in 2009.
The fully protected contract backlog stood at EUR 6.6 billion at the year end, with contracts concluded in early 2011 adding EUR 0.5 billion to the backlog.
Outlook and guidanceSES’ growth is essentially based on the delivery of new capacity to serve the strong demand in the emerging markets. In 2011, new capacity contributions will derive from QuetzSat-1 (+32 transponders), which is fully contracted by EchoStar and expected to enter service in Q4 2011; from SES-4 (+27 transponders), expected to start operational service in Q4 as well, while YahSat-1A (+23 transponders), supporting the YahLive! offering, is expected to start commercial operations by mid-year 2011.
Revenue growth in 2011 will largely be contributed by SES WORLD SKIES from full year contributions of contracts initiated during 2010 and from new capacity launched during 2011.
SES’ revenue growth does not develop on a linear basis. It depends on the timing of satellite launches and of the entry into service of a spacecraft, on the ending of customer contracts and the timing of new agreements. Taking these factors into account, SES anticipates recurring revenue growth of approximately 3% in 2011. It will rise strongly thereafter as the group will benefi t from the full-year impact of the new capacity launched in 2011. SES identifi es a range of 4-5% for its three-year revenue CAGR (2010-2012) guidance.
Group indebtedness in 2011 is foreseen to stay within the group’s self-imposed net debt/EBITDA ceiling of 3.3 times.
We have also decided to adapt the company’s organisation. By consolidating the operations of SES ASTRA and SES WORLD SKIES, as well as of SES’ ENGINEERING arm under a single management structure, we expect to achieve even stronger market and customer focus for the planned new growth capacity, offering a single face to the market for our global satellite fl eet. aThe new organisational structure is anticipated to deliver enhanced effi ciencies with corresponding revenue, operating expense and EBITDA synergies for ongoing and future growth.
We look forward to a busy year 2011 SES looks into the future with confi dence. We look forward to a busy year 2011. Executing on our mission to provide ever better service to our customers, we are planning to launch seven satellites and payloads in 2011: in addition to the above-mentioned QuetzSat-1, SES-4 and the YahLive payload on YahSat-1A, we will launch replacement capacity on ASTRA 1N, SES-3, SES-2 and replacement and expansion capacity on SES-5/ASTRA4B. Following extensive testing, these spacecraft will typically enter commercial service three months after launch, creating a host of new opportunities for our customers.
I would like to thank the SES management and employees for their commitment and strong achievements in 2010. I am convinced that they will continue to invest their expertise, their imagination and their dedication to ensure that SES continues to provide the highest level of service to our customers, and the best value to our shareholders.
René SteichenChairman of the Board of Directors
1 ‘Recurring’ fi gures represent the underlying revenue and EBITDA performance by removing currency effects, eliminating one-time items, considering changes in consolidation scope and excluding revenue and EBITDA from new business initiatives that are still in a start-up phase.
03SES Annual Report 2010

Corporate governanceSES shareholders1
% Voting % Economic Number of shares shareholding participation
Class A sharesSofi na Group 18,800,000 3.76% 4.70%Luxempart Invest S.à r.l. 11,538,264 2.31% 2.89%Santander Telecommunications S.A. 9,000,000 1.80% 2.25%Other shareholders 8,529,362 1.71% 2.13%BCEE FDRs (free fl oat) 285,117,504 57.08% 71.35%Total A Shares 332,985,130 66.67% 83.33%
Class B sharesBCEE 54,336,756 10.88% 5.44%SNCI 54,329,979 10.88% 5.44%Etat du Grand-Duché de Luxembourg 57,825,830 11.58% 5.79%Total B shares2 166,492,565 33.33%3 16.67%
Total shares (actual) 499,477,695Total shares (economic) 399,582,156
1 Signifi cant shareholdings as of January 28, 2011.
2 A share of Class B carries 40% of the economic rights of a Class A share.
3 These fi gures have been rounded up to the second decimal, as a result of which the Class B shareholders appear to hold a total of 33.34 % of the voting interest in the company. The actual total voting interest of the Class B shareholders is, however, one-third.
04 SES Annual Report 2010

Corporate governance
Chairman’s report on corporate governance and internal control procedures
IntroductionSES is listed on the Luxembourg Stock Exchange and on Euronext Paris. The company follows the ‘Ten Principles of Corporate Governance’ adopted by the Luxembourg Stock Exchange (its home market) and the governance rules applied by companies listed in Paris, where most of the trading in SES FDRs takes place. Where those rules confl ict, e.g. with regard to the publication of the individual remuneration of the members of its Executive Committee, SES follows the rules of its home market by reporting the aggregate amount of the direct and indirect remuneration of the members of the Executive Committee, with the fi xed and the variable components of the benefi ts being separately identifi ed.
SES meets all the recommendations made by the ‘Ten Principles’ except two. With regard to Recommendation 3.9, stating that any of the committees created by the board should only have advisory powers, the SES board has delegated some decision-making powers to the Remuneration Committee. For the full details of these powers, see the charter of the Remuneration Committee on the SES website (www.ses.com). Also, SES does not follow Recommendation 10.6. Under this recommendation any shareholder who holds at least 5% of the company’s shares should be allowed to put topics on the agenda of the annual general meeting and propose draft resolutions to be voted upon. However, SES follows the Luxembourg law in this respect, granting such right to one or more shareholders holding at least 10% of its shares. Since no registered shareholder currently holds more than 5% but less than 10% of the SES shares, this difference between the SES articles of incorporation and Recommendation 10.6 is not considered material.
The company has also continued its policy to increase the fl ow of information to its shareholders via its website.
In this context, the section on corporate governance contains a regularly updated stream of information, such as the latest version of the company’s main governance documents, be it the articles of incorporation, the corporate governance charter (including the charters of the various committees set up by the board) or the separate sections on the composition and the mission of the board, the board’s committees and the Executive Committee. This section also contains the SES Code of Conduct and Ethics, the fi nancial calendar and any other information which may be of interest to the company’s shareholders.
Organisation principlesCreated on March 16, 2001 under the name of SES GLOBAL, SES is incorporated in Luxembourg. Following the completion of the acquisition of GE Americom on November 9, 2001, SES became the parent company of SES ASTRA, originally created in 1985. In 2001, the Board of Directors approved a set of internal regulations to complement the legal and regulatory obligations, as well as the articles of incorporation of SES. A copy of SES’ articles of incorporation, in its latest version, is available in the corporate governance section of the company’s website.
The annual general meeting of shareholdersUnder Luxembourg company law, the company’s annual or extraordinary general meetings represent the entire body of shareholders of the company. They have the widest powers, and resolutions passed by such meetings are binding upon all shareholders, whether absent, abstaining from voting or voting against the resolutions.
The meetings are presided by the Chairman or, in case of his absence, by one of the Vice Chairmen of the Board or, in their absence, by any other person hereto appointed by the meeting. Any shareholder who is recorded in the company’s shareholder register at least eight business days before the meeting is authorised to attend and to vote at the meeting. A shareholder may act at any meeting by appointing a proxy who does not need to be a shareholder.
The company has issued two classes of shares: Class A and Class B shares.
Although they constitute separate classes of shares, Class A and Class B shares have the same rights except that the shares of Class B, held by the State of Luxembourg and by two entities wholly-owned by the State of Luxembourg, entitle their holders to only 40% of the dividend, or in case the company is dissolved, to 40% of the net liquidation proceeds paid to shareholders of Class A. Class B shares are not freely traded. Each share, whether of Class A or B, is entitled to one vote. In accordance with the company’s articles of incorporation, no shareholder of Class A may hold, directly or indirectly, more than 20%, 33% or 50% of the company’s shares unless it has obtained prior approval from the meeting of the shareholders. Such limit is calculated by taking into account the shares of all classes held by a shareholder of Class A.
A shareholder or a potential shareholder that plans to acquire by whatever means, directly or indirectly, more than 20%, 33% or 50% of the shares of the company must inform the Chairman of the Board of such intention. The Chairman will then inform the government of Luxembourg of the planned acquisition which may only be opposed by the government within three months from receiving such information, should the government determine that such acquisition is against the general public interest.
In case of no opposition from the government, the board shall convene an extraordinary meeting of shareholders which may decide at a majority provided for in article 67-1 of the law of August 10, 1915, as amended, regarding commercial companies, to authorise the demanding party to acquire more than 20%, 33% or 50% of the shares.
The annual general meeting is held on the fi rst Thursday in April. Each registered shareholder will receive written notice of the annual general meeting, including the time of the meeting, the agenda, as well as the draft resolutions which will be proposed for approval at the meeting, by registered mail at least 20 days prior to the meeting. At the same time, each shareholder will receive a copy of the annual accounts and the consolidated accounts, including the balance sheets and the income statements of the company. Holders of the company’s FDRs will be represented at the meeting by Banque et Caisse d’Epargne de l’Etat acting as Fiduciary. Each FDR will represent one Class A share. If a holder of FDRs wants to attend the annual general meeting of shareholders in person, that shareholder needs to convert at least one FDR into an A share. In order to facilitate the attendance of the meeting by FDR holders, the company will pay the applicable charge for a conversion of up to 10,000 FDRs for a short period prior to the annual general meeting.
05SES Annual Report 2010
Corporate governancecontinued
Notice of the meeting and of the proposed agenda will also be published in the press. The Fiduciary will circulate the draft resolutions to both international clearing systems, Clearstream and Euroclear, allowing FDR holders to give their voting instructions to the Fiduciary in time for the meeting. At the same time, the draft resolutions will be made available on the company’s website. Unless the Fiduciary has received specifi c instructions from the FDR holder, the Fiduciary will vote in favour of the proposals submitted by the board.
The meeting may deliberate validly only if at least half of the shares of Class A and at least half of the shares of Class B are represented. In the event that the required quorum is not reached, the meeting will be reconvened in accordance with the form prescribed by the articles of incorporation. It may then validly deliberate without consideration of the number of represented shares.
The proceedings are held in French, but an English translation is provided by the company. A French version of the AGM minutes and the results of the shareholders’ votes can be found on the SES website.
All the resolutions of the meeting are adopted by a simple majority vote except if otherwise provided for by Luxembourg company law. The annual general meeting held on April 1, 2010 was attended by 98.859 % of the company’s shareholders. However, the 6,618,078 FDRs held by SES did not participate in the vote, reducing the participation in the vote to 97.534% of the company’s shares.
Following the resignation of Mr Georges Schmit at the end of 2009,the shareholders elected Mr Serge Allegrezza with 99.458% of the votes. His mandate will end like the original mandate of Mr Georges Schmit at the annual general meeting of 2011. A short biography on each of the 17 directors is published on page 5.
During the 2010 annual general meeting, the shareholders further approved the 2009 fi nancial results and the allocation of the 2009 profi ts, granted discharge to the external auditor and the directors, elected Ernst & Young as the company’s external auditor for another year and granted an authorisation to SES to buy back its own shares. The shareholders also approved the directors’ fees which remained unchanged in comparison to 2009. All of the board’s proposals were carried by a majority of at least 94.81% of the votes expressed. In accordance with article 67-1 of the Luxembourg company law, abstentions are not considered when determining whether a resolution has been passed or not. The detailed results of the shareholders’ votes are available in the corporate governance section of the company’s website.
During 2010, no extraordinary meeting of shareholders was held.
The Board of Directors and its committeesMissionThe Board of Directors is responsible for defi ning the company’s strategic objectives as well as its overall corporate plan. The board approves, upon proposal from the Executive Committee, the annual consolidated accounts of the company and the appropriation of results, the group’s medium-term business plan, the consolidated annual budget of the company and the management report to be submitted to the meeting of shareholders. It also approves major investments and is responsible vis-à-vis shareholders and third parties for the management of the company, which it delegates to the Executive Committee.
CompositionFollowing its election by the shareholders in April 2008, the board of SES was composed throughout the year of 17 directors, all of them non-executive directors. In accordance with the company’s articles of association, 11 board members represent holders of Class A shares and six board members represent holders of Class B shares. The mandates of the current directors will expire at the annual general meeting of shareholders in April 2011, when shareholders will be asked to elect a board composed of 18 directors, six of which will be elected for one year, six for two years and six for three years.
Mr René Steichen is the Chairman of the Board of Directors. He was elected by the members of the board in the meeting which followed the annual general meeting on April 3, 2008. René Steichen is currently assisted by two Vice Chairmen, Messrs François Tesch and Jean-Paul Zens, each one elected on the basis of proposals submitted by directors representing shareholders of Class A and of Class B shares, respectively.
In the event of a vacancy in the board, the remaining directors may, upon a proposal from the Nomination Committee and on a temporary basis, fi ll such a vacancy by a majority vote. In this case, the next annual general meeting of shareholders will defi nitively elect the new director who will complete the term of the director whose seat became vacant.
In accordance with internal regulations, at least one third of the board members must be independent directors. A board member is considered independent if he has no relationship of any kind with the company or management which may impact his judgment. This is defi ned as:
– not having been a director for more than 12 years;
– not having been an employee or offi cer of the company over the last fi ve years;
– not having had a material business relationship with the company in the last three years; and
– not representing a signifi cant shareholder owning directly or indirectly more than 5% of the company’s shares.
Nine of the current board members are considered independent:
Ms Bridget Cosgrave and Messrs Marcus Bicknell, Hadelin de Liedekerke Beaufort, Jacques Espinasse, Robert W. Ross, Christian Schaack, Terry Seddon, Marc Speeckaert and François Tesch.
Rules of functioningThe Board of Directors meets when required by the company’s business, and at least once in a quarter. It can only validly deliberate if a majority of the directors are present or represented. The resolutions of the board are passed by a simple majority of votes of the voting directors present or represented, not considering abstentions. Any material contract that is proposed to be signed by the company or any of its wholly controlled operating subsidiaries with a shareholder owning, directly or indirectly, at least 5% of the shares of the company is subject to a prior authorisation by the board.
Activities of the Board of Directors in 2010The Board of Directors held six meetings in 2010, with an average attendance rate of more than 96%. After endorsement by the Audit Committee, the board approved the 2009 audited accounts, including the proposed dividend as well as the results for the fi rst half of 2010. During the year, the board approved an update to the strategic plan as well as a business plan for the period 2010–2017, which served as the basis for the 2011 budget discussed by the board in December.
06 SES Annual Report 2010

During 2010, the board decided to launch a new share buyback programme, which was implemented on Euronext Paris through the fi ling of a ‘notice d’information’ on June 10. The 2010 programme was limited to the following two objectives:
– to meet the company’s obligations under its executive share ownership and stock option plans; as well as
– to operate under the framework of a liquidity contract signed with BNP Exane.
In its fi rst meeting of the year, the board co-opted Mr Serge Allegrezza as a director, in lieu of Mr Georges Schmit who had resigned from the board at the end of 2009.
During the year 2010, the board approved the procurement of SES-8. It decided that the company should acquire the remaining 10% of shares in SES SIRIUS held until then by Swedish Space Corporation. It approved the proposal to increase the company’s stake in O3b Networks Limited, a Jersey-based company which intends to provide ’fi ber-like’ connectivity to telecommunication customers in emerging markets by using a Medium Earth Orbit (MEO) satellite constellation. The board also decided to divest from ND SatCom, keeping only a minority stake. As this transaction had not closed before the end of the year, the board was asked in its December meeting to approve a Special Security Agreement between ND SatCom Inc. and the Department of Defense of the U.S. Government.
Finally during 2010, the SES board did not evaluate its workings as it is company practice to do so every 18 months only. In its last meeting of the year, the board approved the changes proposed by the Remuneration Committee to the company’s long-term equity plans and it decided to review and adapt the SES Dealing Code to refl ect the latest recommendations from the AMF.
The board is regularly informed by the Executive Committee on the group’s activities and fi nancial situation. Within that context, the board received three presentations on regional development plans that will be part of the basis for the strategic plan to be approved by the board in June 2011. At each meeting, the Executive Committee briefs the board further on ongoing matters as well as on possible upcoming investment or divestment decisions. At each board meeting, the chairmen of the three committees set up by the board present a report on the latest developments discussed in these respective committees. In addition, a business report is distributed to the members of the board on a monthly basis.
The current members of the Board of Directors are:
Mr René SteichenBorn November 27, 1942. Mr Steichen became a director on June 1, 1995. He was elected Chairman on April 15, 1996. Prior to that time, he was a member of the Luxembourg government (1984–1993) and member of the European Commission (1993–1995). He is currently an attorney at law in Luxembourg. He is also a member of the Board of Directors of SES ASTRA, SES ASTRA Services Europe and of the Special Shareholder Committee of SES WORLD SKIES. Mr Steichen is Chairman of the Board of Luxconnect s.a and a director of Dexia-Banque Internationale à Luxembourg. Mr Steichen studied law and political science in Aix-en-Provence and Paris. He holds a doctorate in law and also earned the fi nal degree in economics and fi nance from the Institut d’Etudes Politiques of Paris. Mr Steichen is the Chairman of the Board as well as of the company’s Nomination and Remuneration Committees.
Mr Steichen is not an independent director because he represents an important shareholder.
Mr François TeschBorn on January 16, 1951. Mr Tesch became director on April 15, 1999. He is Chief Executive Offi cer of Foyer S.A. and Luxempart S.A. He graduated in economics from the Faculté d’Aix-en-Provence and holds an MBA from INSEAD (Institut Européen d’Administration des Affaires). Mr Tesch is also board member of Atenor Group S.A. and Vice Chairman of the Board of SES and a member of its Audit Committee.
Mr Tesch is an independent director.
Mr Jean-Paul ZensBorn January 8, 1953. Mr Zens became a director on May 7, 2002, and was elected Vice Chairman on the same date. Mr Zens is also a member of the Board of Directors of SES ASTRA, SES ASTRA Services Europe, the Special Shareholder Committee of SES WORLD SKIES and Entreprise des Postes et Télécommunications, Luxembourg. He is currently Director of the Media and Communications department of the Ministry of State in Luxembourg. He holds a law degree as well as a degree in psychology and communications sciences from the University of Strasbourg. Mr Zens is a member of the Remuneration Committee and of the Nomination Committee of SES.
Mr Zens is not an independent director because he represents an important shareholder.
Mr Serge AllegrezzaBorn October 25, 1959. Mr Allegrezza became a director on February 11, 2010. He is currently the Director General of Statec, the Luxembourg Institute for Statistics and Economic Studies, a post he has held since April 2003. He was Conseiller de Gouvernement 1ère classe at the Ministry of Economics, responsible for internal market policy and is the Chairman of the Observatory for Competitiveness. He is also the Chairman of the Board of LuxTrust S.A. and a Vice Chairman of the Conseil Economique et Social as well as of the Board of Directors of Entreprise des Postes et Télécommunications. Mr Allegrezza, a part-time lecturer at the IAE/University of Nancy 2 , has a Master’s in Economics and a PhD in Applied Economics.
Mr Allegrezza is not an independent director, because he represents an important shareholder.
Mr Marcus BicknellBorn February 28, 1948. Mr Bicknell was appointed to the Board of Directors of SES on May 6, 2005. Mr Bicknell is a director of New Media Foundry Ltd, a non-listed company in the United Kingdom. From 1986 to 1990 he was Commercial Director of Société Européenne des Satellites. Mr Bicknell holds an MA Honours Degree in Physical Anthropology from Cambridge University. Mr Bicknell is a member of both the Remuneration and the Nomination Committees.
Mr Bicknell is an independent director.
Ms Bridget CosgraveBorn July 1, 1961. Ms Cosgrave became a director on April 3, 2008. She is Director General of DIGITALEUROPE. Ms Cosgrave is a member of the Board of Directors of SES ASTRA, SES ASTRA Services Europe and the Special Shareholder Committee of SES WORLD SKIES. Ms Cosgrave was with Belgacom S.A. from 2001-2007 as a member of the Executive Committee. Her roles there included Executive Vice President of the Enterprise division, Chairman of the International Carrier Services division, and Board Member of Belgacom Mobile (Proximus) and Telindus Group. Ms Cosgrave holds an MBA from London Business School and a BA (Hons) in Economics & History from Queen’s University in Canada.
Ms Cosgrave is an independent director.
07SES Annual Report 2010

Corporate governancecontinued
Mr Hadelin de Liedekerke BeaufortBorn April 29, 1955. Mr de Liedekerke Beaufort became a director on April 17, 2000. He is currently a director of Santander Telecommunications, a privately held company, as well as a director of other private companies with interests in various fi elds such as fi nancial, communication and real estate developments. Mr de Liedekerke Beaufort graduated from the Ecole Hôtelière de Lausanne. Mr de Liedekerke Beaufort is a member of both the Remuneration and the Nomination Committees of SES.
Mr de Liedekerke Beaufort is an independent director.
Mr Jacques EspinasseBorn May 12, 1943. Mr Espinasse was appointed a director of SES by the annual general meeting of May 6, 2005. In May 2007, after fi ve years of duty, he retired as a member of the Management Board and Chief Financial Offi cer of Vivendi. Mr Espinasse is the former Chief Operations Offi cer of TPS. He is a member of the Supervisory Boards of Maroc Telecom, LBPAM, Axa Belgium, Axa Holdings Belgium and Hammerson Plc and holds a BBA and an MBA from the University of Michigan. Mr Espinasse is a member of the Audit Committee, the Remuneration Committee and the Nomination Committee.
Mr Espinasse is an independent director.
Mr Jean-Claude FinckBorn January 22, 1956. Mr Finck became a director on May 31, 2001. Mr Finck is Chief Executive Offi cer of Banque et Caisse d’Epargne de l’Etat, a member of the Boards of Directors of Bourse de Luxembourg, Luxair, Cargolux, insurance companies La Luxembourgeoise, La Luxembourgeoise Vie, and Paul Wurth. Mr Finck graduated with a degree in economics from the University of Aix/Marseille. Mr Finck is a member of the Audit Committee of SES.
Mr Finck is not an independent director because he represents an important shareholder.
Mr Gaston ReineschBorn May 17, 1958. Mr Reinesch became a director on July 1, 1998. Mr Reinesch is invited Professor at the University of Luxembourg. He is Chairman of the Société Nationale de Crédit et d’Investissement, and of the Board of Directors of Entreprise des Postes et Télécommunications and of BGL BNP Paribas. He is also, among others, a member of the Board of Directors of Enovos and the European Investment Bank. Mr Reinesch is General Administrator of the Ministry of Finance, Luxembourg, and graduated with a Master of Science in economics from the London School of Economics. Mr Reinesch is a member of the Audit Committee of SES.
Mr Reinesch is not an independent director because he represents an important shareholder.
Mr Victor RodBorn April 26, 1950. Mr Rod became a director on November 23, 1995. He is President of Commissariat aux Assurances and Chairman of the Board of Directors of Banque et Caisse d’Epargne de l’Etat, Luxembourg. Mr Rod graduated with a degree in law from the University of Nancy.
Mr Rod is not an independent director because he represents an important shareholder.
Mr Robert W. RossBorn January 8, 1941. Mr Ross became a director of SES on June 28, 2007. He has had a long career in the fi eld of media and telecommunications in which he has held senior executive and director positions. He retired as CEO of New Skies in January 2002 but continued to serve as adviser to the company until July 2004. He is a member of the Special Shareholder Committee of SES WORLD SKIES. Mr Ross graduated from Brown University and holds MA and JD degrees from Boston University in the United States.
Mr Ross is an independent director.
Mr Luis Sanchez-MerloBorn October 10, 1947. Mr Sanchez-Merlo became a director on April 17, 2000. Mr Sanchez-Merlo is the Chairman of the Board of ASTRA Iberica S.A. and Lantana Capital S.A., as well as a member of the Board of Abantia SA. Mr Sanchez-Merlo graduated with a degree in law and economics from the Universidad Comercial de Deusto. He also holds a Master’s in law from the College of Europe and a Master’s in economics from the University of Louvain.
Mr Sanchez-Merlo is not an independent director because he has a material relationship with the company.
Mr Christian Schaack Born March 21, 1958. Mr Schaack became a director on December 7, 2000. Mr Schaack spent twenty years in senior management positions in BGL BNP PARIBAS and its parent, in both Luxembourg and Brussels. He is now an independent management consultant and director. He is a member, among others of the Board of Directors of internaxx Bank, a Luxembourg subsidiary of TD Bank. Christian Schaack graduated from the Massachusetts Institute of Technology, in Cambridge, MA, with a PhD in Operations Research and from MIT’s Sloan School of Management with a Master of Science in Management. He holds an Engineering degree from Ecole Polytechnique in Paris.
Mr Schaack is an independent director.
Mr Terry SeddonBorn February 14,a 1941. Mr Seddon joined the Board of Directors of SES in 2005. He is a member of the Special Shareholder Committee of SES WORLD SKIES. He has had a long international career in the fi eld of telecommunications, in which he held several senior executive and director positions. He was Chairman of New Skies Satellites Ltd and was the founding CEO of AsiaSat. He has also held several non-executive directorships of U.K. manufacturing and operating companies. Mr Seddon graduated from Blackburn Polytechnic and Leeds University of the U.K. Mr Seddon is a member of the Audit Committee, the Remuneration Committee and the Nomination Committee.
Mr Seddon is an independent director.
Mr Marc Speeckaert Born May 23, 1951. Mr Speeckaert joined the Board of Directors of SES in 2005. He is the General Manager of Sofi na S.A. and a Director of several non-listed corporations as well as of Rapala which is listed on the Helsinki Stock Exchange and of Mersen, listed on Euronext Paris. Mr Speeckaert graduated with a degree in Applied Economics and holds a Master’s in Business and Administration from the Université Catholique de Louvain (UCL) in Belgium. He also participated in an Advanced Management Program from Wharton, University of Pennsylvania (USA). Mr Speeckaert is the Chairman of the Audit Committee.
Mr Speeckaert is an independent Director.
08 SES Annual Report 2010

Mr Gerd TenzerBorn August 4, 1943. Mr Tenzer became a director on March 11, 1999, and was Vice Chairman from May 2002 until April 2006. From January 1990 to November 2002, Mr Tenzer was a member of the Board of Management of Deutsche Telekom AG where he was responsible for networks, purchasing, environmental protection, wholesale services for carriers, broadband cable and broadcasting services. He was special adviser to the CEO of Deutsche Telekom AG from December 2002 until December 2004. He also sits on the Board of SES ASTRA and of SES ASTRA Services Europe in Luxembourg. He is Chairman of the Advisory Board of Sutter Verzeichnisverlag GmbH&Co.KG in Essen and of the Advisory Board of Cryptsec GmbH in Cologne. He is member of the Board of Transmode Holding AB in Stockholm, of VascoDe Technologies Ltd. in Tel Aviv and of Combiphone GmbH in Cologne. Mr Tenzer graduated with a degree in Communications Engineering (Dipl. Ing.) from the Technical University in Aachen.
Mr Tenzer is not considered an independent director, because he has been a member of the Board of Directors for more than12 years.
Committees of the Board of DirectorsThe Chairman’s Offi ceThe Chairman and the two Vice Chairmen are members of the Chairman’s Offi ce. The Chairman’s Offi ce prepares the agenda for the board meetings, allowing the Vice Chairmen to coordinate the preparation of the board meetings with the directors of their share class.
Current members are:
Mr René SteichenMr François TeschMr Jean-Paul Zens.
The Chairman’s Offi ce met six times during 2010 with a members’ attendance rate of more than 94%.
The Remuneration CommitteeIn accordance with general corporate governance standards, the company’s board established a Remuneration Committee which determines the remuneration of the members of the Executive Committee, and which advises on the overall remuneration policies applied throughout the company. It reports to the board at each meeting through its Chairman. The Remuneration Committee is composed of six members, a majority of whom are independent board members in line with the SES internal regulations. After the annual general meeting, Mr Jean-Paul Zens replaced Mr Gaston Reinesch as a member of the Remuneration Committee, which is now composed of the following six non-executive directors:
Mr René SteichenMr Marcus Bicknell (independent)Mr Jacques Espinasse (independent)Mr Hadelin de Liedekerke Beaufort (independent)Mr Terry Seddon (independent)Mr Jean-Paul Zens.
The Remuneration Committee was chaired in 2010 by the Chairman of the Board.
The Remuneration Committee held four meetings with an attendance rate of 100%. Matters addressed related to the determination of the 2010 stock option grant and the 2009 bonus for members of the Executive Committee. The Remuneration Committee further determined the number of performance shares allocated to the members of the Executive Committee for their performance in 2009 and it adopted the 2010 business objectives which are used as one element in the determination of their bonus for 2010. The Remuneration Committee reviewed the STAR Plan, a share-based plan for non-executives and decided to align it with the two existing Long Term Equity Plans wherever possible. The Remuneration Committee also oversees the implementation of the decision under which the members of the Executive Committee must within fi ve years hold the equivalent of an annual salary’s worth of registered shares in the company (with the President and CEO of SES having to hold shares worth two years of his salary).
The Audit CommitteeAs part of its overall corporate governance, the board established an Audit Committee, which assists the board in carrying out its oversight responsibilities in relation to corporate policies, internal control, internal and external audit and fi nancial and regulatory reporting practices. The Committee has an oversight function and provides a link between the internal and external auditors and the board. The Audit Committee is composed of six members, four of whom are independent board members.
The current members of the Audit Committee are:
Mr Marc Speeckaert, Chairman of the Audit Committee (independent)Mr Jacques Espinasse (independent)Mr Jean-Claude FinckMr Gaston ReineschMr Terry Seddon (independent)Mr François Tesch (independent).
The Audit Committee held four meetings with a members’ attendance rate of 100%.
The meetings were dedicated in particular to the review of the 2009 fi nancial results before their submission to the board and their subsequent approval by the shareholders at the statutory annual general meeting, and to the results of the fi rst half of 2010. Members of the board also had the opportunity to channel any comments they had on the company’s quarterly results through the Chairman of the Audit Committee prior to the publication of these results.
The Audit Committee reviewed the company’s statement on internal control systems prior to its inclusion in the annual report, and endorsed the proposal to reappoint Ernst & Young for another year.
It approved the Internal Audit plan, and received bi-annual updates on the Internal Audit activities and on the follow-up of the major recommendations. It also reviewed the Ernst & Young Management letter.
The Audit Committee also continued to encourage management in its efforts to eliminate as many as possible non-operating legal entities. The Audit Committee approved the banking policy and the liquidity and funding policy, two major parts of the group’s treasury policy.
09SES Annual Report 2010
Corporate governancecontinued
In its last meeting of the year, the Audit Committee approved the new SES Dealing Code before its submission to the board. It also had a broad exchange of views on risk management, noting both the proposed risk management policy and its planned implementation. This will lead to a change in the Audit Committee’s charter to be submitted to the board for approval in early 2011. The Audit Committee will in future receive bi-annual updates on risk management from the newly established risk management committee.
The Nomination CommitteeIn line with best practice in corporate governance, the board established a Nomination Committee whose role is to identify and nominate suitable candidates for the Board of Directors, for election by the annual general meeting of shareholders. Such proposals are based on submissions from shareholders for a number of candidates at least equal to the number of posts to be fi lled for each class of shareholders. The Nomination Committee also proposes candidates for Executive Committee membership for election by the board.
The Nomination Committee is composed of six members, a majority of whom are independent board members in line with the SES internal regulations:
Mr René SteichenMr Marcus Bicknell (independent)Mr Jacques Espinasse (independent)Mr Hadelin de Liedekerke Beaufort (independent)Mr Terry Seddon (independent)Mr Jean-Paul Zens.
The Nomination Committee was chaired in 2010 by the Chairman of the Board. The Nomination Committee met three times with an attendance rate of more than 94%. The main topics discussed related to the Management Succession Plan 2010 as well as to the preparation of the board renewal in 2011.
The Executive CommitteeMissionThe Executive Committee is in charge of the daily management of the group. It functions as a collegial body. The Executive Committee is mandated to prepare and plan the overall policies and strategies of the company for approval by the board. It may approve intra-group transactions, irrespective of the amount, provided that they are consistent with the consolidated annual budget of the company as well as specifi c transactions with third parties for an amount up to EUR 10 million per project. It informs the board at its next meeting on each such transaction, it being understood that the aggregate amount for such projects can at no time be higher than EUR 30 million.
The Executive Committee may approve any external credit facilities or external guarantees, pledges, mortgages and any other encumbrances of the company, or any wholly-owned affi liate, for as long as the company will not lose its investment grade rating as a result of such facility or guarantee. It may approve increases of up to 5% in the capital expenditure budget for a satellite procurement already approved by the board, it being understood that the Internal Rate of Return will need to comply with certain specifi c thresholds defi ned by the board. The Executive Committee shall inform the board at its next meeting of each such increase.
The Executive Committee submits to the board those measures which it deems necessary to be taken in order to meet the purposes of the company. Prior to the beginning of each fi scal year, the Executive Committee submits to the board a consolidated budget for approval.
The Executive Committee is in charge of implementing all decisions taken by the board and by the committees specially mandated by the board. The Executive Committee may, in the interests of the company, sub-delegate part of its powers and duties to its members acting individually or jointly.
The Chairman of the Executive Committee organises the work of the Executive Committee and coordinates the activities of its members, who report directly to him. In order to facilitate the implementation by the board of its overall duty to supervise the affairs of the company, the Chairman of the Executive Committee informs the Chairman of the Board on a regular basis of the company’s activities. The latter receives the agenda and the minutes of all meetings of the Executive Committee in due time. During 2009, the Executive Committee met 42 times with an attendance rate of more than 90%. Mr Pierre Margue, Vice President Legal and Corporate Affairs, the secretary of the Board of Directors, also acted as secretary to the Executive Committee.
CompositionThe following persons are members of the Executive Committee:
the President and CEO of SES who assumes the chairmanship of the Executive Committee, the Chief Financial Offi cer of SES, the President and CEO of SES ASTRA, the President and CEO of SES WORLD SKIES as well as the President of SES ENGINEERING.
Members of the Executive Committee are nominated by the Board of Directors upon a proposal from the Nomination Committee. During 2010, Mr Andrew Browne replaced Mr Mark Rigolle as Chief Financial Offi cer, following the latter’s appointment as CEO of O3b Networks.
On December 31, 2010, the members of the Executive Committee were:
Mr Romain BauschBorn July 3, 1953, and appointed President and Chief Executive Offi cer in July 2001. Mr Bausch is also Chairman of the Board of Directors of SES ASTRA, SES ASTRA Services Europe, as well as of the Special Shareholder Committee of SES WORLD SKIES. Mr Bausch became the Director General and the Chairman of the Management Committee of SES in 1995, following a career in the Luxembourg civil service (Ministry of Finance). Mr Bausch occupied key positions in the banking, media and telecommunications sectors and spent a fi ve-year term as a Director and Vice Chairman of SES. Mr Bausch is also a Vice-President of ESOA - European Satellites Operators Association, Vice Chairman of Fedil - Business Federation Luxembourg and a member of the Board of Directors of BIP Investment Partners, Aperam and O3b Networks. He graduated with a degree in economics (specialisation in business administration) from the University of Nancy. He holds an honorary doctorate from the Sacred Heart University in Luxembourg.
10 SES Annual Report 2010

Mr Robert BednarekBorn October 6, 1957, and appointed President and Chief Executive Offi cer of SES WORLD SKIES, on July 10, 2009. He joined SES as Executive Vice President, Corporate Development, in January 2002 and also was President and CEO of SES NEW SKIES. Mr Bednarek came to SES from PanAmSat, where he served as Executive Vice President and Chief Technology Offi cer since 1997 and as Senior Executive for Engineering and Operations since 1990. Prior to joining PanAmSat, Mr Bednarek co-founded a technology consulting fi rm based in Washington D.C. where he was a partner from 1984 to 1990, and served as the Deputy Chief Scientist for the U.S. Corporation for Public Broadcasting from 1979 to 1984. Mr Bednarek graduated with a degree in electrical engineering (with a speciality in communications theory and mathematical analysis) from the University of Florida and holds several U.S. patents related to GPS (Global Positioning Systems). Mr Bednarek is also a member of the Boards of SES ASTRA, SES ASTRA Services Europe and a member of the Special Shareholder Committee of SES WORLD SKIES. Mr Bednarek is also a member of the Board of the Space Foundation.
Mr Andrew BrowneBorn June 4, 1955, Mr Browne became Chief Financial Offi cer of SES effective April 1, 2010. Mr Browne previously held CFO and board positions at a number of global companies and organisations, specialising in the telecommunications and high-technology sectors. Mr Browne was the CFO of Intelsat from 1995-1999, and subsequently at New Skies Satellites following the company’s spin-off from Intelsat in which Mr Browne played a signifi cant role. Mr Browne was CFO at SES NEW SKIES until 2008. He also served as acting CEO for the completion of the integration process into the SES group. Since then, Mr Browne has held a number of board and advisory positions with a number of companies, most recently as Chairman of TomTom, the Dutch satellite navigation company. Mr Browne’s earlier career has included senior fi nancial positions at Advanced Micro Devices (AMD) in California and the Development Bank of Ireland. He holds an MBA, International Business and Finance, from Trinity College, Dublin, and is a member of the Institute of Certifi ed Public Accountants of Ireland (CPA). Andrew Browne is a member of the boards of SES ASTRA and SES ASTRA Services Europe and a member of the Special Shareholder Committee of SES WORLD SKIES.
Mr Martin HalliwellBorn April 20, 1959, and appointed President of SES ENGINEERING as of January 1, 2008. Prior to this assignment, Martin Halliwell held the position of SVP and Chief Technology Offi cer at SES ASTRA where he was responsible for all engineering and operational activities. In the course of his career at SES ASTRA, Mr Halliwell held a number of positions, including General Manager, Global Multimedia Networks, Technical Director of SES Multimedia and Deputy to the Technical Director of SES ASTRA. Prior to joining SES, Martin Halliwell worked for Cable & Wireless and for Mercury Communications. Mr Halliwell holds a BA in Mathematics and Mechanical Engineering and an MBA specialising in external environment and strategic management from the Open University. Martin Halliwell is a member of the Boards of SES ASTRA, SES ASTRA Services Europe and a member of the Special Shareholder Committee of SES WORLD SKIES.
Mr Ferdinand KayserBorn July 4, 1958, and appointed President and Chief Executive Offi cer of SES ASTRA as of January 2002. Mr Kayser came to SES from Premiere World, the digital pay-TV bouquet of Germany’s Kirch Group, where he was Managing Director between 1997 and 2001. Prior to joining the Kirch Group, Mr Kayser held a number of executive positions at CLT, Europe’s largest commercial broadcaster, including Senior Vice President in charge of German TV and radio activities (1989–1992), Managing Director in charge of the launch of RTL2 (1993) and Executive Vice President and member of the Management Board responsible for all TV activities of CLT (1993–1996). Mr Kayser holds a Master of Economics from the University of Paris 1, Panthéon-Sorbonne, and has concluded specialised university studies in Media Law and Management of Electronic Media. Mr Kayser is a member of the Boards of SES ASTRA, SES ASTRA Services Europe and SES SIRIUS, and a member of the Special Shareholder Committee of SES WORLD SKIES.
RemunerationRemuneration of the members of the Board of Directors The annual general meeting of shareholders determines the remuneration of the members of the Board of Directors for attending board and committee meetings. In 2010, 99.98% of the shareholders decided to maintain the fees paid to the directors at the previous year’s level. Directors receive a fi xed fee of EUR 40,000 per year, whereas the Vice Chairmen receive an annual fi xed fee of EUR 48,000 and the Chairman receives EUR 100,000 per year. The Chairman of the Audit Committee receives an additional EUR 8,000 per year for chairing the Audit Committee.
The shareholders also maintained the fees per meeting at EUR 1,600 for each meeting of the board or a committee of the board attended. Half of that fee will be paid if the director participates via telephone or videoconference in the meeting.
All these fees are net of any Luxembourgish withholding taxes. The total net remuneration fees paid for the year 2010 to the members of the Board of Directors (net of the Luxembourgish withholding tax) amounted to EUR 1,070,400 of which EUR 306,400 were paid as variable fees, with the remaining EUR 764,000 representing the fi xed part of the board fees. The gross overall fi gure for the year 2010 was EUR 1,338,000.
Company stock owned by members of the Board of DirectorsOn December 31, 2010, the members of the Board of Directors owned a combined total of 655,525 shares and FDRs (representing 0.13% of the company’s share capital).
11SES Annual Report 2010

Corporate governancecontinued
Remuneration of the members of the Executive CommitteeThe remuneration of the members of the Executive Committee is determined by the Remuneration Committee. It is composed of a fi xed and a variable part. The total gross remuneration paid to the members of the Executive Committee relative to the year 2010 amounted to EUR 11,537,956.68, of which EUR 2,976,547.89 represented the fi xed part and EUR 8,561,408.79 the variable part. The direct remuneration paid to the members of the Executive Committee amounted to EUR 4,154,243.98 whereas the indirect remuneration was EUR 7,383,712.70. The indirect remuneration also contains the benefi ts derived by the members of the Executive Committee from the company’s executive stock option plan and the long-term incentive plan, as adopted by the Board of Directors. During 2010, the members of the Executive Committee were awarded a combined total of 168,931 options to acquire company FDRs at an exercise price of EUR 18.23, the price being based on the average of the closing price on Euronext Paris of the fi rst 15 trading days following the Remuneration Committee meeting at which the options were authorised. A quarter of those options vested on January 1, 2011, the remaining quarters vesting on January 1, 2012, 2013 and 2014, respectively. In 2010, members of the Executive Committee were granted 80,848 restricted shares as part of the company’s long-term incentive plan as well as 31,829 performance shares. These shares will vest on June 1, 2013.
During 2010, Messrs Romain Bausch, Rob Bednarek and Ferdinand Kayser exercised some of their stock options, whereas all the members of the Executive Committee sold some or all of the restricted shares which vested on July 1. SES publishes the details of all transactions made by its board members, the members of its Executive Committee and the members of the Management Committees of its main operating companies on its website: http://www.ses.com/ses/siteSections/corporateGovernance1/Management_Disclosures/.
Company stock owned by members of the Executive CommitteeOn December 31, 2010, the fi ve members of the Executive Committee then in place owned a combined total of 162,479 shares and FDRs, 329,760 unvested restricted shares and 1,126,030 options. Transactions made by members of the Executive Committee or members of the Management Committees of SES ASTRA, SES WORLD SKIES and SES ENGINEERING are published on the company’s website under Management Disclosures.
External auditorIn accordance with the Luxembourg law on commercial companies, the company’s annual and consolidated accounts are certifi ed by an external auditor appointed by the annual general meeting of shareholders. On April 1, 2010, the shareholders retained Ernst & Young for another year and approved its remuneration, with a majority of 94.81%. The mandate of Ernst & Young will expire at the annual general meeting on April 7, 2011.
Internal control proceduresObjectiveThe Board of Directors has overall responsibility for ensuring that the SES group maintains a sound system of internal controls, including fi nancial, operational and compliance controls. Such a system is an integral part of the corporate governance strategy of the group.
Internal control procedures help to ensure the proper management of risks and provide reasonable assurance that the business objectives of the company can be achieved.
The internal control procedures are defi ned and implemented by the company to ensure:
– the compliance of actions and decisions with applicable laws, regulations, standards, internal rules and contracts;
– the effi ciency and effectiveness of operations and the optimal use of the group’s resources;
– the correct implementation of the company’s internal processes, notably those to ensure the safeguarding of assets;
– the integrity and reliability of fi nancial and operational information, both for internal and external use;
– that management’s instructions and directions are properly applied; and
– that material risks are properly identifi ed, assessed, mitigated and reported.
Like all control systems, internal controls cannot provide an absolute guarantee that risks of misstatement, losses or human error have been totally mitigated or eliminated.
Organisational principlesThe Board of Directors has delegated the design, implementation and maintenance of a rigorous and effective system of internal controls to the Executive Committee of SES, which in turn works closely with the management of its subsidiaries and other controlled affi liates in establishing control policies and procedures.
Each operating company of the group applies two levels of internal control policies and procedures:
– common policies formalised by several coordination committees or cross-functional teams to apply to the employees, offi cers and directors of the group company, its subsidiaries and other controlled affi liates as the general framework for their own business process design; and
– the policies and procedures specifi c to each company and adapted to their activity, size and organisation, and to their relevant legal and regulatory environment.
The organisation, application and monitoring of these policies and procedures, and therefore, risk management, are the responsibility of each operating company’s management.
Internal control proceduresThe group has adopted a robust internal control framework based on a set of guidelines prepared by a recognised body, COSO (Committee of Sponsoring Organisations of the Treadway Commission). This framework provides reasonable assurance that the internal control objectives are being achieved; it is also consistent with the reference framework proposed by the French securities regulator, the ‘Autorité des Marchés Financiers’ (AMF).
The control environment is an essential element of the company’s internal control framework as it sets the tone for the organisation. This is the foundation of the other components of internal control, providing discipline and structure.
12 SES Annual Report 2010

Furthermore, the group has adopted in 2010 a risk management policy based on principles proposed by COSO and ISO31000. The coordination of the implementation of this policy and the development of a risk register is the role of a Risk Management Committee which reports to the Executive Committee of SES S.A. on a quarterly basis. The Executive Committee in turn reports to the Board of Directors which has the ultimate responsibility for oversight of company’s risk and ensuring an effective risk management system is in place. Common defi nitions and measures of risk management have been agreed and training is underway to ensure that the risk management policy is properly implemented.
A ‘Code of Conduct and Ethics’ has been established to reinforce the corporate governance principles and control environment. This code is applicable to all employees, offi cers and directors of the company, its subsidiaries or other controlled affi liates.
The policies outlined in this code are designed to ensure that all employees, offi cers and directors act at all times in accordance with the applicable laws, regulations and norms of conduct, and with the highest standards of integrity. The code was submitted to the Audit Committee and has been approved by the Board of Directors.
Employees and offi cers in all entities of the group have been informed of the content of the Code of Conduct and its applicable principles. For new hires, training on the code is integrated in the induction training. In SES, there is also a group-wide Compliance Committee which is chaired by the Compliance Offi cer of SES S.A. The main role of this Committee, composed of designated Compliance Offi cers of each SES subsidiary, is to raise the staff’s awareness of the code and to ensure a consistent roll-out and training programme for the code.
During 2010, mandatory refresher training sessions have been continued in the major locations where employees are based.
In 2010 the SES dealing code has been revised particularly with regard to the duration of the closed periods in order to adopt the recommendations provided by the AMF.
Regarding the internal controls in the area of accounting and fi nancial reporting, the following should be noted:
– staff involved in the group’s accounting and fi nancial reporting are appropriately qualifi ed and are, where it is relevant, kept up-to-date concerning changes in International Financial Reporting Standards (IFRS). Additionally, specifi c training and written guidance on particular matters is provided where needed. A group reporting handbook, regularly updated for business developments and regulatory changes, is available to all relevant staff members which provides a summary of the group’s accounting and fi nancial reporting guidelines and policies;
– controls have been established in the processing of accounting transactions to ensure appropriate authorisations for transactions, effective segregation of duties, and the complete and accurate recording of fi nancial information;
– activities with a signifi cant potential risk, for instance fi nancial derivative transactions, take place within a clearly defi ned framework set by the board, or are brought to the board for specifi c approval. In accordance with the requirements of IFRS, SES discloses detailed information on the market, credit and foreign exchange risks to which the group is exposed, as well as its strategy for managing those risks;
– a Financial Risk Committee has been created during 2010 which oversees compliance with SES fi nancial policies.This Committee meets on a quarterly basis. It met for the fi rst time in November 2010;
– any weaknesses in the system of internal controls identifi ed by either internal or external auditors are promptly and fully addressed;
– the group relies on a comprehensive system of fi nancial reporting. Strategic plans, business plans, budgets and the interim and full-year consolidated accounts of the company are drawn up and brought to the Board of Directors for approval. The board also approves all signifi cant investments. The board receives monthly fi nancial reports setting out the group’s fi nancial performance in comparison to the approved budget and prior year fi gures; and
– the external auditors perform a limited review of the group’s half-year fi nancial statements and a full audit of the group’s annual consolidated fi nancial statements.
Regarding the internal controls in the area of treasury management, the following should be noted:
– a specifi c software package helps to ensure the effi ciency and control of the Treasury function in the implementation of the strategy to hedge the group’s risk associated with interest rate and foreign currency fl uctuations. This package also aims to centralise the cash management of the SES operating subsidiaries;
– in order to ensure enhanced security and effi ciency of the bank payments process for the SES group, the existing banking payments system has been updated and upgraded to allow for secured authorisation and transition of payments from the existing accounting systems directly to the bank;
– a clear segregation of duties and assignment of bank mandates between members of the SES operating subsidiaries’ management, treasury and accounting departments has been defi ned, approved by the Audit Committee and implemented in the new polices;
– the foreign exchange hedging policy was approved by the Audit Committee in December 2009. The banking policy and liquidity and funding policy were approved by the Audit Committee in July 2010 and in December 2010, respectively. The two last sections (interest rate hedging policy and cash management & in-house bank) will follow during the course of 2011. Upon completion of the new treasury policy, all policy and manual sections will be submitted to the Board of Directors for their approval;
– the activities of the group Treasurer, and in particular the hedging activities engaged during the year, are authorised within the framework approved by the Board of Directors; and
– the group Treasurer reports on a formal basis every quarter to the Board of Directors as part of the fi nancial reporting.
13SES Annual Report 2010
Corporate governancecontinued
Regarding the internal controls in the area of tax management, the following should be noted:
– the tax management department aims to seek upfront tax clearance with relevant local tax authorities with regard to the tax ramifi cations of main business ventures, corporate reorganisations and fi nancing structures of the group. Where this is not possible, the tax treatment is analysed based on best authoritative interpretations and laid down in internal tax technical memos or tax opinions from external tax consultancy fi rms;
– in order to ensure full coordination with regard to developments of important fi nancing and group structures after implementation, the SES internal ‘tax programmes review platform’, consisting of corporate and operating company support functions has been instigated and has met 11 times in 2010; and
– the transfer pricing team is responsible for continuously improving and fi ne-tuning the required contemporaneous transfer pricing documentation (in accordance with local regulations) underpinning all inter-company transactions of the group.
Regarding the internal controls in the area of satellite operations, the following should be noted:
– the procurement of satellites, launch vehicles and satellite related ground infrastructure as well as the administration, control and operations of the satellite system are the responsibility of the group-wide SES ENGINEERING segment;
– a satellite operations risk management process is in place to monitor and assess sources of technical risks and to develop qualitative, quantitative and statistical methods which allow the mitigation of risk at the satellite fl eet level;
– operational procedures for satellite control and payload management exist and cover manoeuvres and confi guration changes required in nominal situations as well as in case of technical emergencies. These procedures are periodically reviewed to ensure that they are up to date. A major enhancement of the satellite control software has been implemented in 2009. The practice to use fully validated electronic station-keeping procedures are being extended to the whole SES fl eet;
– crisis management systems and supporting infrastructure and tools have been designed in order to address satellite in-orbit anomaly situations at the appropriate level of responsibility. In 2010, the Trouble Tickets escalation process has been enhanced to provide better support to customers;
– the procurement and maintenance of the ground infrastructure required to support the administration, control and operations of the global satellite ecosystem are the responsibility of the SES ENGINEERING Ground Infrastructure segment; and
– a signifi cant enhancement of the satellite control backup capabilities has been implemented in 2010 utilising the U.S. based Satellite Operations Centre.
Regarding the internal controls in the area of information and communication technology, the following should be noted:
– management is committed to ensure that data, infrastructure and information technology systems are as secure as is reasonably practicable. Security controls, policies and procedures are in place to prevent unauthorised access to premises, computer systems, networks and data. In order to address the more rigorous regulations governing handling of personally identifi able data, an assessment and update of the security policies and controls have been initiated in 2009 and the policy was implemented in 2010. A new change management policy was also implemented in 2010;
– regular back-up of electronic information is ensured and copies are stored off-site; and
– for non-satellite related business applications, disaster recovery plans exist and two disaster recovery tests have been performed in 2010.
Evaluation of the internal control proceduresThe SES group Internal Audit function was established in 2000. Internal Audit evaluates the relevance of, and compliance with, internal control procedures.
The mission of the Internal Audit function is to provide independent and objective assistance and assurance regarding the effectiveness and effi ciency of business operations, the reliability of fi nancial and operational reporting, and the group’s compliance with legal and regulatory requirements. In this context, Internal Audit is also tasked to support management with identifying, preventing and minimising risks, as well as with the safeguarding of the group’s assets.
Under its charter, which was revised and amended in 2008, the Internal Audit function reports to the President and CEO of SES, but may also report directly to the Audit Committee.
The activities of the Internal Audit function are executed in accordance with an annual audit plan which is reviewed and approved by the Audit Committee. This annual plan is derived from an annual risk assessment based on a risk mapping exercise. The introduction of an annual risk assessment responds to the need to dynamically link the audit plan to risks and exposures that may affect the organisation and its operations. This exercise involves identifying the inherent risks relative to all business processes and then assessing the levels of residual risks after consideration of specifi c mitigating controls.
Internal Audit monitors the implementation of internal control recommendations and regularly reports on effective compliance to the President and CEO of SES and to the Audit Committee.
Internal Audit also regularly coordinates audit planning and exchanges relevant information with the group’s external auditors.
As a result of an external quality assessment conducted in 2007, which confi rmed that the Internal Audit function generally conforms to the international standards for the professional practice of internal auditing defi ned by the Institute of Internal Auditors (IIA), the Internal Audit function initiated and implemented an improvement action plan. In accordance with the same standards, an internal quality assessment performed through self-assessment has been performed in 2010.
14 SES Annual Report 2010

The proxy structure of the SES WORLD SKIES U.S. Government Solutions entity, in line with common practice for businesses serving certain segments of the U.S. Government, imposes certain restrictions on the SES Board of Directors and executive management in directly supervising the maintenance of an internal control system and imposing an internal audit structure. The SES Internal Audit function did not perform any internal control review of this entity during 2010. However, these restrictions are mitigated through having agreement on a required internal control framework which will be subject to evaluation and testing from a third-party internal audit function going forward. SES WORLD SKIES U.S. Government Solutions is in the process of setting up this function which will report to the Proxy Board of this entity. It should be noted that in any event Ernst & Young, as external auditor, audited the stand-alone accounts of SES WORLD SKIES U.S. Government Solutions as included in the consolidated fi nancial statements of the SES group.
Human resourcesHuman resources strategySES aims to be the employer of choice in the industry. The company identifi es, secures, engages, develops and retains the best talent to further expand its technological reach and business objectives.
SES respects and trusts its people, embraces diversity and lives by its values. SES senior managers have a responsibility as role models to all SES employees, and must therefore act in accordance with the guidelines laid down for SES senior management. SES employees are engaged, committed and proud to be associated with their company.
To leverage the employees’ full potential, SES focuses on competency development, alignment of objectives and knowledge sharing. SES ensures that every employee has the necessary resources and support to be successful in his or her career within the context of its performance management system. Human Resources is the catalyst to drive organisational and cultural initiatives leading to sustainable stakeholders’ value creation.
SE S employeesAt year-end 2010, SES employed a total of 1,5781 staff.
The detail is shown in the table below.
2010
SES S.A.2 65SES ASTRA 292SES WORLD SKIES 346SES ENGINEERING 390ASTRA Platform Services (APS) 176ND SatCom 309Total 1,578
1 Full-time equivalents.2 Includes SES Finance S.à r.l.
SES values and cultureThe SES companies observe a common set of core values, which provide guidance for their activities. These values inspire a unique organisational culture and refl ect SES’ aspirations, which are geared towards achieving the highest performance at the service of customers, shareholders and society at large. SES’ values are primarily focused on providing highest-quality customer service.
They are:
ExcellenceHaving the passion and commitment to be the best in the industry.
PartnershipDeveloping and maintaining co-operative relationships that build upon strengths and skills within the group to achieve common goals and benefi ts at the service of the customers.
LeadershipArticulating strategic vision, demonstrating values and creating an environment in which SES can meet the needs of the marketplace.
IntegrityConsistently applying the principles of honesty, accountability, responsibility, fairness and respect.
InnovationEstablishing a business culture that stimulates creativity across the organisation, develops employees’ skills and improves processes, products and services.
RemunerationThe SES companies apply a performance-based compensation philosophy. Remuneration includes: base salaries, performance bonuses, stock options, stock appreciation rights, long-term incentives and fringe benefi ts that are continuously reviewed in line with best market practices.
Stock-related compensation schemesSES applies an equity incentive compensation plan. The purpose of the plan is to attract and retain highly qualifi ed leadership level staff. This policy applies to executive-level employees of SES. 1,194,282 options were granted in 2010 to 182 executive participants, including the members of the Executive Committee.
Long-term incentive scheme for executivesSES’ long-term incentive scheme for executives is based on restricted shares (restricted for a vesting period of three years) and on performance shares (shares which are only granted in case the company and the executive meet or exceed a certain performance threshold over a three-year period). 262,941 restricted shares and 213,922 performance shares were granted in 2010. These fi gures include the members of the Executive Committee.
Stock appreciation rights planSES operates a stock appreciation rights (STAR) plan, which applies to the non-executive-level staff. Through the grant of stock appreciation rights, the company aims to encourage the long-term commitment of the staff towards the company, and to provide the possibility to share in the value-creation of the company. 870,054 STARs were granted in 2010.
A variety of awards are being used to acknowledge and reinforce the contributions of SES’ employees. In 2010, these mechanisms included management awards, spot awards and deal attainment bonuses.
The Human resources (HR) functionSES was supported at year end by a team of HR professionals based across all SES companies. A Human Resources Coordination Committee ensures that the HR strategy and objectives are aligned within the group and with the business objectives, decisions and guidance of SES’ Executive Committee. Employee satisfaction is being periodically monitored by an employee survey, internally called ‘Voice of the Employee’ (VoE). A VoE survey was performed in 2010. A strong focus is placed on employee communications through a variety of instruments, such as employee meetings, breakfast talks and forums pertaining to specifi c topics.
15SES Annual Report 2010

Corporate governancecontinued
Development across the group of the company’s intranet has been ongoing, ensuring employees receive the most up-to-date and relevant information according to location and entity. The intranet continues to be the main vehicle for employee communications. Additionally, the company’s vision and business strategy are conveyed successfully to all employees to strengthen awareness and engagement.
A learning organisationEmployee satisfaction is consistently monitored and measured and we strive to make improvements based on employee feedback. In line with its vision of being a continuous learning organisation, SES continued, in 2010, to offer its employees a wide range of training courses. The percentage of staff taking advantage of training opportunities, offered both in-house and externally, reached 80% at the Luxembourg campus, 100% in The Hague and 57% in the North America operations. On average, the training budget per employee reached EUR 1,000 in 2010.
Building outstanding leadership talentSES focuses on identifying and developing high-potential leadership talent by means of succession planning. This includes participation in executive assessments, executive development programmes, coaching and stretch assignments.
SES continued its successful global ‘Developing Tomorrow’s Leaders’ programme in 2010. The programme covers 61 top-level executives identifi ed as high performers with high potential. The third and fi nal module of the programme took place in March, 2010. SES has a ‘Global Development Programme’ (GDP) which is used for cross-functional and cross-continent talent and knowledge exchange. The global ‘SES Associate Programme’, targeted at graduates, was continued in 2010. The two-year programme currently covers fi ve associates participating in four six-month assignments.
Social dialogue within SESIn its dealings with their employees and associates, SES and its operating entities rely upon best practices of social dialogue and openness. These principles are applied at all levels of the organisation and are rooted both in legal requirements and in management culture.
At SES ASTRA and SES ENGINEERING, the legal framework provides for a personnel delegation and a mixed committee, whereas SES ASTRA TechCom also has a personnel delegation.
The personnel delegations of SES ASTRA and SES ENGINEERING consist of fi ve members each whereas SES ASTRA TechCom has a personnel delegation composed of two delegates. All delegates have been elected for a fi ve-year term. Their mandate consists in protecting the interests of the workforce with regard to working conditions, job security and social matters. The personnel delegation is informed on the developments affecting the company and advises on amendments to work rules.
The mixed committee consists of three employer representatives and three employee representatives. The mixed committee has co-decision powers in matters covering performance assessment, health and safety and in the general criteria applied in the recruitment, promotion and dismissal policies. The mixed committee is consulted on all important decisions regarding investments in plant or equipment, work processes and working conditions. The committee is informed about the general development of the company and employment trends. In other SES companies, the social dialogue is conducted according to the rules laid out in the local legal frameworks, for instance by means of works councils in SES WORLD SKIES, ASTRA Platform Services (APS) and ND SatCom.
As SES ASTRA benefi ts from a concession granted by the Luxembourg State, three employee representatives sit on the Board of Directors of SES ASTRA. One of them sits as an observer on the board of SES.
Investor RelationsSES has a dedicated Investor Relations function reporting to the Chief Financial Offi cer and working closely with the President and CEO. Its purpose is to develop and coordinate the group’s external fi nancial communications and interactions with equity and debt investors, investment analysts, credit rating agencies, fi nancial journalists and other external audiences, to monitor stock market developments and to provide feedback and recommendations to the SES Executive Committee.
Investor Relations is responsible for the defi nition and execution of SES’ active Investor Relations programme and participation in investor conferences and similar events. Investor Relations also works closely with the group’s General Counsel to ensure that the group’s external communications comply with applicable legal and regulatory requirements.
Corporate social responsibility (CSR) policy In 2010, SES implemented a range of corporate social responsibility projects and activities in geographic areas where the SES group has commercial activities, provides communication services or otherwise interacts with local communities.
The policy SES’ CSR policy is aimed at supporting educational projects, with a focus on refl ecting the group’s position as a leading provider of global communications infrastructure and services.
SES believes it has a responsibility to support projects that contribute to the development of a communications-based society and a knowledge-based economy. We believe that progress in this area should help develop more resilient and fl exible economic structures, contribute to enhance social mobility development, and should also contribute to the emergence of more sustainable economic development models.
Projects supported by SES In 2010, SES entered into a multi-year partnership with the University of Luxembourg. The company committed to support the university’s efforts to develop a centre of excellence and innovation for advanced information and communications technology in satellite systems, by cooperating with the university’s Interdisciplinary Centre for Security, Reliability and Trust, and by fi nancing a chair in satellite, telecommunications and media law.
In 2010, SES continued its scholarship programme with the International Space University (ISU) in Strasbourg, France, supporting students in advanced space applications.
SES also supported an executive MBA programme at the International Institute of Space Commerce (IISC) based in the Isle of Man. The IISC is an off-shoot of the ISU, and the programme benefi ts students from the Isle of Man.
SES continued to provide support to the scholarship programme of the ‘Society of Satellite Professionals International’ (SSPI), a U.S.-based non-profi t organisation focusing on the skills and career development of satellite industry professionals worldwide.
SES supported the 2010 edition of the St. Gallen Symposium, an academic and networking event for representatives of business, politics, and students at the University of St. Gallen, Switzerland.
16 SES Annual Report 2010
SES is a member of the IDATE Foundation, based in Montpellier, France, which provides assistance in strategic decision-making to the telecommunications, internet and media industries. SES is also a member of the International Astronautical Federation, a global organisation that promotes awareness of space activities worldwide.
SES made a fi nancial contribution to the project ‘Business Initiative 123 – GO’ aiming to advance and support the development of innovative business projects in Luxembourg.
In 2010, SES was a member of Luxembourg’s ‘Groupement d’intérêt économique Shanghai 2010’ whose mission was to implement Luxembourg’s representation at the World Exhibition in Shanghai in 2010.
The company matched donations from its employees to emergency relief organisations providing help to earthquake victims in Haiti and fl ood victims in Pakistan. SES also donated satellite bandwidth to support humanitarian organisations in Haiti in the aftermath of the earthquake that hit the island in early 2010.
In a multi-year plan, SES donates bandwidth to the International Polar Foundation, enabling the foundation’s Princess Elisabeth research station in Antarctica to communicate via satellite. This unique facility is the fi rst ‘zero emission’ polar research station, and is the only polar research facility that was conceived and built to operate entirely on renewable energies.
SES made a donation to the Institut St. Joseph in Betzdorf, Luxembourg, a home for mentally handicapped persons.
SES continued its fi nancial support to ‘Musek am Syrdal’, a local music festival in Luxembourg, and also supported a Luxembourg-based theatre production.
Through its SES WORLD SKIES division, SES donated educational material to a local school in Baikonur, Kazakhstan, and made corporate donations to the Juliana Children’s Hospital in The Hague.
The U.S. offi ces of SES supported social initiatives such as the Trenton Soup Kitchen.
Environmental initiatives The SES companies are committed to respecting the world’s natural environment, and to aligning the companies’ and the staff’s conduct and, to the extent possible, those of their suppliers, to the principles of sustainable development.
Compliance is benchmarked against the legal rules and regulations applied in the countries in which the SES companies operate, as well as against industry-wide best practices. SES’ objective is to continuously improve its environmental performance and to further reduce the environmental impact of its activities.
The activities of SES and its companies are mainly offi ce and technology-based and overall have a light environmental impact. In SES’ operations, it promotes the most effi cient use of energy and natural resources. It has successfully implemented a programme to rely on cogeneration power. SES applies a waste recycling programme which aims to avoid, reduce and recycle waste material as effi ciently as possible; this programme is subject to independent third-party audits and quality control. SES also conducts environmental training on a regular basis and encourage its staff to adopt environmentally correct attitudes in their professional activities.
SES conducts a group-wide carbon footprint assessment covering the company’s operations. In 2009, the company’s activities related to operating and commercialising SES’ satellite fl eet, as well as general administration, fi nance and marketing generated approximately 52,500 tonnes of CO
2e worldwide. Emissions from
Scope 2 electricity consumption represented the largest component of SES’ total emissions (approximately 61%) with Scope 1 emissions (approximately 33%) and Scope 3 business travel (5%) providing the remaining contribution. Teleports represented approximately 71% of the emissions from Scope 1 and 2 sources. Details of the carbon footprint are disclosed as part of the Carbon Disclosure Project, in which SES participates (www.cdproject.net).
Based on the 2008 carbon footprint study, SES implemented measures to reduce its carbon emissions at its headquarters in Betzdorf, Luxembourg, which also houses one of the company’s largest teleports. Modifi ed heating burners operating on natural gas were installed, and the effi ciency of the cold water chiller installations was improved in 2010. Also, since January 2010, the Luxembourg campus uses electricity sourced from renewable hydropower, which can be considered carbon-free. These initiatives had a signifi cant impact on the carbon emissions of the company in Luxembourg.
The operating entities of SES apply best practices in minimising the environmental impact of the outsourced activities, such as the manufacturing and launching of spacecraft. The companies also ensure that the amount of radiation emitted from their earth stations respects or remains below the maximum levels defi ned by the countries of operation; compliance is checked through yearly internal and third-party audits by accredited organisations, which are specialised in the fi eld of industrial safety.
Responsibility statement
The Board of Directors and the executive management of the company reaffi rm their responsibility to ensure the maintenance of proper accounting records disclosing the fi nancial position of the group with reasonable accuracy at any time, and ensuring that an appropriate system of internal controls is in place to ensure the group’s business operations are carried out effi ciently and transparently. In accordance with Article 3 of the law of January 11, 2008 on the harmonisation of transparency requirements in relation to information about issuers whose securities are admitted to trading on a regulated market, we declare that, to the best of our knowledge, the consolidated fi nancial statements for the year ended December 31, 2010, prepared in accordance with IFRS as adopted for use in the E.U. give a true and fair view of the assets, liabilities, fi nancial position and profi t of the year. In addition, the management report includes a fair review of the development and performance of the group’s operations during the year and of business risks, where appropriate, facing the group.
René Steichen Romain Bausch Chairman of the President and CEOBoard of Directors
17SES Annual Report 2010

18 SES Annual Report 2010
Financial review by management All amounts are in millions of euro unless stated otherwise
Quarterly development 2010 2009 Q4 2010 Q1 2010 Q2 2010 Q3 2010 Q4
Revenue 415.1 411.1 433.8 442.3 448.5Operating expenses (126.2) (100.4) (111.8) (113.5) (113.6)EBITDA 288.9 310.7 322.0 328.8 334.9
Depreciation expenses (109.0) (108.8) (120.4) (115.0) (120.2)Amortisation expenses (8.6) (8.5) (8.7) (8.4) (9.0)Operating profi t 171.3 193.4 192.9 205.4 205.7
Transponder utilisationTransponder count at end of quarter (36 MHz-equivalent) 2009 Q4 2010 Q1 2010 Q2 2010 Q3 2010 Q4
SES ASTRAUtilised transponders 272 273 287 285 288Available transponders 318 318 322 317 317Utilisation rate 85.5% 85.8% 89.1% 89.9% 90.9%
SES WORLD SKIES North AmericaUtilised transponders 353 330 323 322 324Available transponders 465 450 448 434 430Utilisation rate 75.9% 73.3% 72.1% 74.2% 75.3%
SES WORLD SKIES InternationalUtilised transponders 345 360 358 370 378Available transponders 390 472 472 490 502Utilisation rate 88.5% 76.3% 75.8% 75.5% 75.3%
SES groupUtilised transponders 970 963 968 977 990Available transponders 1,173 1,240 1,242 1,241 1,249Utilisation rate 82.7% 77.7% 77.9% 78.7% 79.3%
At the end of Q4 2010, thirteen additional transponders were utilised, raising the utilisation rate to 79.3%, an increase of 0.6 percentage points.
U.S. dollar exchange rateEUR 1 = Average rate Closing rate Average rate Closing rate 2010 2010 2009 2009
United States dollar 1.3294 1.3362 1.3922 1.4406

19SES Annual Report 2010
Revenue 2010 2009 Variance %
Revenue 1,735.7 1,620.3 +115.4 +7.1%
SES’ reported revenue increased by 7.1%, driven by recurring growth and the strengthening U.S. dollar. On a recurring basis, revenue growth of 5.1%, or EUR 83 million was contributed by both operating companies, particularly due to the incremental revenues generated by the ASTRA 3B, NSS-12 and AMC-21 satellites and the full-year impact of Ciel-2, which was augmented by its full consolidation in the fourth quarter. Infrastructure and services business segments both developed favourably. The components of the revenue development from 2009 to 2010 are illustrated in the following table.
SES group revenue
1,620
Actual 2009 Non-recurring Constant FXUSD/SEK
Actual 2009recurring
Recurringgrowth
Actual 2010recurring
Non-recurring Actual 2010
+5.1% +7.1%
as reported
(18)
33 1,635 83 1,718 18 1,736
Operating expenses and EBITDA 2010 2009 Variance %
Operating expenses (439.3) (426.6) -12.7 -3.0%EBITDA 1,296.4 1,193.7 +102.7 +8.6%EBITDA % margin 74.7% 73.7% +1.0 pp –
2010
(439.3) 1,296.4 4
74.7%
The moderate rise in total operating expenses refl ects the increase in costs of sales directly attributable to the increase in services revenues, and the strengthening U.S. dollar. 2009 operating expenses included a one-off charge of EUR 19 million taken to impair launch prepayments made to Sea Launch before its Chapter 11 fi ling.
The favourable revenue development, coupled with the moderate operating expense increase, translated into a reported EBITDA growth of 8.6%. Recurring EBITDA growth reached EUR 62 million, or 5.0%, in line with the revenue growth, and was contributed by both segments. SES’ recurring EBITDA margin in 2010 was 76.1%, the same as in 2009.
The components of the EBITDA development from 2009 to 2010 are illustrated in the following table.
SES group EBITDA
1,194
EBITDAmargin73.7% 76.1% 76.1% 74.7%
Actual 2009 Non-recurring Constant FXUSD/SEK
Actual 2009recurring
Recurringgrowth
Actual 2010recurring
Non-recurring Actual 2010
+5.0% +8.6%
as reported
26 25 1,24562 1,307
(11)
1,296

20 SES Annual Report 2010
Financial review by management All amounts are in millions of euro unless stated otherwise continued
Elimination / Infrastructure Services Start-up activity Unallocated Total
Revenue 1,544.1 311.2 16.0 (135.6) 1,735.7EBITDA 1,282.2 57.7 (6.2) (37.3) 1,296.42010 % margin 83.0% 18.5% 74.7%2009 % margin 82.9% 14.8% 73.7%
Operating profi t 2010 2009 Variance %
Depreciation expenses (464.4) (435.6) -28.8 -6.6%Amortisation expenses (34.6) (38.5) +3.9 +10.1%Operating profi t 797.4 719.6 +77.8 +10.8%
2010
(464.4) (34.6) 797.4 4
The higher depreciation charges reported for 2010 are almost exclusively attributable to the impact of the stronger U.S. dollar on the depreciation charges for SES WORLD SKIES and SES Satellite Leasing. Adjustments totalling EUR 13.1 million were made to the carrying value of the AMC-4 and AMC-16 satellites.
The additions to the depreciable fl eet compared to 2009 were as follows: ASTRA 1M (January 2009); Ciel-2 (February 2009); NSS-9 (April 2009); NSS-12 (December 2009); SES-7 (May 2010); SES-1 (June 2010); and, ASTRA 3B (June 2010). AMC-5 completed its depreciation cycle in May 2010.
Net fi nancing charges 2010 2009 Variance %
Net interest expense (237.5) (209.9) -27.6 -13.1%Capitalised interest 58.6 46.7 +11.9 +25.5%Net foreign exchange gain / (loss) (17.0) 34.7 -51.7 –Net fi nancing charges (195.9) (128.5) -67.4 -52.5%
2010
(237.5) 58.6 (17.0)
(195.9)
The EUR 27.6 million increase in the net interest expense refl ected primarily an increase of EUR 17.0 million in debt servicing costs arising from the higher level of borrowings during the year; the balance of EUR 10.6 million related almost exclusively to increases in the amortisation of loan origination costs and payment of facility commitment fees.
On the net foreign exchange result, the gains recorded in 2009 on the revaluation of U.S. dollar liabilities in a weakening dollar environment could not be matched in 2010 where the dollar strengthened overall. The reported 2010 net foreign exchange loss of EUR 17.0 million arose in Q1 on the revaluation of certain operational inter-company balances and the revaluation of currency holdings – which were both set off by equal and opposite accretions to the group’s currency exchange reserve and had neither a cash nor an overall shareholders’ equity impact.
Profi t on continuing operations and income tax expense 2010 2009 Variance %
Profi t on continuing operations before tax 601.5 591.1 +10.4 +1.8%Income tax expense (73.9) (91.5) +17.6 +19.2%Share of associates’ result (3.8) (0.4) -3.4 NmProfi t on continuing operations after tax 523.8 499.2 +24.6 +4.9%
Reported tax rate 12.3% 15.5% -3.2 pp –
2010
601.5 (73.9)
(3.8) 523.8
12.3%
The reduction in the reported tax rate from 15.5% to 12.3% refl ects a combination of favourable impacts during the year including, and most signifi cantly, the high level of investment-related tax credits arising as a consequence of the group’s substantial ongoing capital expenditure programme.

21SES Annual Report 2010
Net profi t attributable to equity holders of the parent and earnings per share 2010 2009 Variance %
Loss after tax from discontinued operations (36.3) (21.8) -14.5 -66.5%Net profi t of the group attributable to equity holders of parent 487.3 476.5 +10.8 +2.3%Earnings per Class A share (in euro)On continuing operations 1.33 1.27 +0.06 +4.7%On discontinued operations (0.09) (0.05) -0.04 -80.0%On total operations 1.24 1.22 +0.02 +1.6%
2010
(36.3) 487.3
1.33 (0.09) 1.24 4
In 2010 the group announced its intention to dispose of its controlling interest in ND SatCom, a supplier of satellite communication systems and equipment. On October 22, 2010, SES announced that Astrium, a wholly-owned subsidiary of EADS, would purchase a 75.1 % stake in the ND SatCom group. It is expected that the transaction will close during the fi rst quarter of 2011, subject to the satisfaction of certain conditions including regulatory approvals. Therefore ND SatCom is presented as a disposal group held for sale and as a discontinued operation.
The full-year charge taken of EUR 36.3 million is set out below:
2010 2009 Variance %
Loss of the period after tax (18.3) (21.8) +3.5 +16.1%Loss on re-measurement to fair value (18.0) – -18.0 NmTotal (36.3) (21.8) -14.5 -66.5%
2010
(18.3) (18.0) (36.3)
Cash fl ow 2010 2009 Variance %
Net operating cash fl ow 1,107.1 1,076.2 +30.9 +2.9%Investing activities (912.4) (753.7) -158.7 -21.1%Free cash fl ow 194.7 322.5 -127.8 -39.6%
2010
1,107.1 (912.4) 194.7
Despite increased tax payments in 2010, net operating cash fl ow moved up slightly compared to 2009. Contributing to this was the profi t from continuing operations and stronger working capital management. Investing activity outfl ows increased in 2010, with outfl ows for capital expenditure of EUR 804.5 million (2009: EUR 761.2 million), and the acquisition of the outstanding 10% shareholding in SES ASTRA AB (formerly SES SIRIUS).
Net debt 2010 2009 Variance %
Cash and cash equivalents1 (323.7) (286.6) -37.1 -12.9%Loans and borrowings 4,084.5 3,848.5 +236.0 +6.1%Net debt 3,760.8 3,561.9 +198.9 +5.6%Net debt / EBITDA 2.91 2.99 -0.08 -2.7%
2010
(323.7) 4,084.5 3,760.8
2.91
1Including cash holdings of EUR 2.7 million held by discontinued operations.
The rise in net debt refl ected the impact of investing activities of the year. Due to the growth in the group’s EBITDA, on total operations, the net debt/EBITDA ratio fell nonetheless year-on-year.

Consolidated fi nancial statementsIndependent auditor’s report
To the shareholders ofSES L-6815 Château de Betzdorf
Report on the consolidated fi nancial statementsFollowing our appointment by the annual general meeting of the shareholders dated April 1, 2010, we have audited the accompanying consolidated fi nancial statements of SES, which comprise the consolidated statement of fi nancial position as at December 31, 2010, the consolidated income statement, the consolidated statement of comprehensive income, the consolidated statement of changes in equity, the consolidated statement of cash fl ows for the year then ended, and a summary of signifi cant accounting policies and other explanatory information.
Board of Directors’ responsibility for the consolidated fi nancial statementsThe Board of Directors is responsible for the preparation and fair presentation of these consolidated fi nancial statements in accordance with International Financial Reporting Standards as adopted by the European Union and for such internal control as the Board of Directors determines is necessary to enable the preparation and presentation of consolidated fi nancial statements that are free from material misstatement, whether due to fraud or error.
Responsibility of the ‘réviseur d’entreprises agréé’Our responsibility is to express an opinion on these consolidated fi nancial statements based on our audit. We conducted our audit in accordance with International Standards on Auditing as adopted for Luxembourg by the ‘Commission de Surveillance du Secteur Financier’. Those standards require that we comply with ethical requirements and plan and perform the audit to obtain reasonable assurance whether the consolidated fi nancial statements are free from material misstatement.
An audit involves performing procedures to obtain audit evidence about the amounts and disclosures in the consolidated fi nancial statements. The procedures selected depend on the judgement of the ‘réviseur d’entreprises agréé’, including the assessment of the risks of material misstatement of the consolidated fi nancial statements, whether due to fraud or error. In making those risk assessments, the ‘réviseur d’entreprises agréé’ considers internal control relevant to the entity’s preparation and fair presentation of the consolidated fi nancial statements in order to design audit procedures that are appropriate in the circumstances, but not for the purpose of expressing an opinion on the effectiveness of the entity’s internal control.
An audit also includes evaluating the appropriateness of accounting policies used and the reasonableness of accounting estimates made by the Board of Directors, as well as evaluating the overall presentation of the consolidated fi nancial statements.
We believe that the audit evidence we have obtained is suffi cient and appropriate to provide a basis for our audit opinion.
OpinionIn our opinion, the consolidated fi nancial statements give a true and fair view of the fi nancial position of SES as at December 31, 2010, and of its fi nancial performance and its cash fl ows for the year then ended in accordance with International Financial Reporting Standards as adopted by the European Union.
Report on other legal and regulatory requirementsThe consolidated management report, which is the responsibility of the Board of Directors, is consistent with the consolidated fi nancial statements.
ERNST & YOUNGSociété AnonymeCabinet de révision agrééThierry BERTRANDLuxembourgFebruary 17, 2011
22 SES Annual Report 2010

23SES Annual Report 2010
Consolidated income statementFor the year ended December 31, 2010
2009 2010 Restated3
Note EUR million EUR million
Continuing operationsRevenue 6 1,735.7 1,620.3
Cost of sales 7 (129.5) (115.2)Staff costs 7 (179.8) (163.0)Other operating expenses1 7 (130.0) (148.4)
Depreciation expense 14 (464.4) (435.6)Amortisation expense 16 (34.6) (38.5)Operating profi t 6 797.4 719.6
Finance revenue 9 5.6 52.2Finance costs 9 (201.5) (180.7)Profi t before tax 601.5 591.1
Income tax expense 10 (73.9) (91.5)Profi t after tax 527.6 499.6
Share of associates’ result (3.8) (0.4)Profi t from continuing operations 523.8 499.2
Discontinued operationsLoss after tax from discontinued operations 4 (36.3) (21.8)
Profi t for the year 487.5 477.4
Attributable to:Equity holders of the parent 487.3 476.5Non-controlling interests 0.2 0.9 487.5 477.4
Earnings per share (in euro)2
Class A shares 1.24 1.22Class B shares 0.50 0.49
Earnings per share on continuing operations (in euro)Class A shares 1.33 1.27Class B shares 0.53 0.51
2010
EUR million
1,735.7
(129.5) (179.8) (130.0)
(464.4) (34.6) 797.4 4
5.6 (201.5) 601.5
(73.9) 527.6
(3.8) 523.8
(36.3)
487.5
487.3 0.2
487.5
1.24 40.50
1.33 0.53
1 2009 ‘Other operating expenses’ includes (0.4) non-recurring satellite programme costs relating to the Solaris S-band payload anomaly (Note 5).2 Earnings per share are calculated by dividing the net profi t attributable to ordinary shareholders for the period by the weighted average number of shares outstanding during the year as adjusted to refl ect the economic rights of each class of share. Fully diluted earnings per share are insignifi cantly different from basic earnings per share.
3 Restated for the presentation of discontinued operations under IFRS 5.
The notes are an integral part of the consolidated fi nancial statements.

24 SES Annual Report 2010
Consolidated fi nancial statementsConsolidated statement of comprehensive incomeFor the year ended December 31, 2010
2010 2009 Note EUR million EUR million
Profi t for the year 487.5 477.4
Other comprehensive incomeImpact of currency translation 342.0 (156.3)
Net loss on hedge of net investment (97.0) (72.6)Income tax effect 21.4 12.2 (75.6) (60.4)
Net movements on cash fl ow hedges 11 10.2 8.8Income tax effect (2.5) 6.1 7.7 14.9
Total other comprehensive income for the year, net of tax 274.1 (201.8)Total comprehensive income for the year, net of tax 761.6 275.6
Attributable to:Equity holders of the parent 757.3 274.7Non-controlling interests 4.3 0.9
2010 EUR million
487.5
342.0
(97.0) 21.4 4
(75.6)
10.2 (2.5) 7.7
274.1 761.6
757.3 4.3
The notes are an integral part of the consolidated fi nancial statements.

25SES Annual Report 2010
Consolidated statement of fi nancial positionAs at December 31, 2010
2010 2009 Note EUR million EUR million
Non-current assetsProperty, plant and equipment 14 3,093.2 2,801.0Assets in the course of construction 15 1,311.6 1,020.6Total property, plant and equipment 4,404.8 3,821.6
Intangible assets 16 2,866.0 2,766.1Investments in associates 17 128.2 57.3Other fi nancial assets 18 25.1 14.0Deferred income tax assets 10 32.0 33.9Total non-current assets 7,456.1 6,692.9
Current assetsInventories 9.2 20.5Trade and other receivables 19 277.0 374.2Prepayments 35.0 34.2Valuation of fi nancial derivatives 20 2.5 –Cash and cash equivalents 22 321.0 286.6Total current assets 644.7 715.5
Assets of disposal group classifi ed as held for sale 4 127.7 –
Total assets 8,228.5 7,408.4
EquityAttributable to equity holders of the parent 23 2,093.0 1,587.7Non-controlling interests 35.5 7.9Total equity 2,128.5 1,595.6
Non-current liabilitiesInterest-bearing loans and borrowings 25 2,995.9 3,481.6Provisions and deferred income 26 298.0 311.3Valuation of fi nancial derivatives 20 14.1 4.3Deferred tax liabilities 10 737.6 756.2Other long-term liabilities 27 36.2 –Total non-current liabilities 4,081.8 4,553.4
Current liabilitiesInterest-bearing loans and borrowings 25 1,088.6 366.9Trade and other payables 27 348.9 345.6Valuation of fi nancial derivatives 20 – 53.3Income tax liabilities 2 162.4 204.9Deferred income 320.6 288.7Total current liabilities 1,920.5 1,259.4
Liabilities directly associated with the assets classifi ed as held for sale 4 97.7 –Total liabilities 6,100.0 5,812.8Total liabilities and equity 8,228.5 7,408.4
2010 EUR million
3,093.2 1,311.6 4,404.8
2,866.0 128.2
25.1 32.0
7,456.1
9.2 277.0 35.0 2.5
321.0 644.7
127.7
8,228.5
2,093.0 35.5
2,128.5
2,995.9 298.0
14.1 737.6 36.2
4,081.8
1,088.6 348.9
– –162.4 4320.6
1,920.5
97.7 6,100.0 8,228.5
The notes are an integral part of the consolidated fi nancial statements.

26 SES Annual Report 2010
Consolidated fi nancial statementsConsolidated statement of cash fl owFor the year ended December 31, 2010
2010 2009 EUR million EUR million
Profi t from continuing operations before tax 601.5 591.1Loss from discontinued operations before tax (62.1) (22.5)Profi t before tax – Total 539.4 568.6Taxes paid during the year (131.5) (58.2)Net fi nancing charges paid on non-operating activities 87.2 88.3Depreciation and amortisation 522.0 489.0Amortisation of client upfront payments (47.8) (29.0)Impairment loss recognised on the remeasurement to fair value less cost to sell (Note 4) 30.8 –Impairment of Sea Launch receivable (Note 7) (3.9) 19.6Other non-cash items in consolidated income statement 28.5 16.5Consolidated operating profi t before working capital changes 1,024.7 1,094.8
Changes in operating assets and liabilities(Increase) / decrease in inventories (2.6) (5.4)(Increase) / decrease in trade and other debtors 9.8 (39.7)(Increase) / decrease in prepayments and deferred charges (8.9) (9.2)Increase / (decrease) in trade and other creditors 35.8 8.6Increase / (decrease) in payments received on account 0.5 (9.8)Increase / (decrease) in upfront payments and deferred income 47.8 36.9Net cash generated by operations 82.4 (18.6)
Net operating cash fl ow 1,107.1 1,076.2
Cash fl ow from investing activitiesNet disposal / (purchase) of intangible assets 2.1 (12.2)Purchase of tangible assets (804.5) (761.2)Disposal of tangible assets 4.2 3.5Proceeds arising from Solaris anomaly (Note 5) – 66.5Acquisition of non-controlling interests (27.0) –Acquisition of other consolidated investments – (5.7)Investment in equity-accounted investments (0.7) (28.5)Realised proceeds on settlement of net investment hedge instruments (74.2) (15.9)Other investing activities (12.3) (0.2)Net cash absorbed by investing activities (912.4) (753.7)
Cash fl ow from fi nancing activitiesProceeds from borrowings 810.6 800.7Repayment of borrowings (651.1) (857.5)Dividends paid on ordinary shares, net of dividends received (287.5) (258.5)Net fi nancing charges paid on non-operating activities (87.2) (88.3)Net investment in other treasury shares 43.3 8.2Exercise of share-based payments (0.6) –Net cash absorbed by fi nancing activities (172.5) (395.4)
Net foreign exchange movements 14.9 (76.0)
Net (decrease) / increase in cash 37.1 (148.9)Net cash at beginning of the year (Note 22) 286.6 435.5Net cash at end of the year (Note 22) 323.7 286.6
2010 EUR million
601.5 (62.1)
539.4 4(131.5)
87.2 522.0 (47.8) 30.8 (3.9) 28.5
1,024.7
(2.6) 9.8
(8.9) 35.8
0.5 47.8 82.4 4
1,107.1
2.1 (804.5)
4.2 – –
(27.0) – –
(0.7) (74.2) (12.3)
(912.4)
810.6 (651.1) (287.5) (87.2) 43.3 (0.6)
(172.5)
14.9
37.1 286.6 323.7
The notes are an integral part of the consolidated fi nancial statements.

27SES Annual Report 2010
Consolidated statement of changes in shareholders’ equityFor the year ended December 31, 2010
Foreign Cash fl ow currency Issued Share Treasury Other Retained hedge translation Non-controlling Total capital premium shares reserves earnings reserve reserve Total interests equity EUR million EUR million EUR million EUR million EUR million EUR million EUR million EUR million EUR million EUR million
At January 1, 2009 624.4 477.1 (108.4) 918.0 387.5 (30.6) (714.9) 1,553.1 8.2 1,561.3
Result for the year – – – – 476.5 – – 476.5 0.9 477.4Other comprehensiveincome (loss) – – – – – 14.9 (216.7) (201.8) – (201.8)Total comprehensiveincome (loss)for the year – – – – 476.5 14.9 (216.7) 274.7 0.9 275.6Allocation of 2008 result – – – 129.5 (129.5) – – – – –Dividends paid1 – – – – (258.0) – – (258.0) – (258.0)Movements on treasury shares – – 11.2 – – – – 11.2 – 11.2Share-based paymentadjustment – 7.3 (1.3) – – – – 6.0 – 6.0Acquisition of non-controllingInterests – – – (1.3) – – – (1.3) (1.2) (2.5)Other movements – – – 3.8 – – (1.8) 2.0 – 2.0At December 31, 2009 624.4 484.4 (98.5) 1,050.0 476.5 (15.7) (933.4) 1,587.7 7.9 1,595.6
Foreign Cash fl ow currency Issued Share Treasury Other Retained hedge translation Non-controlling Total capital premium shares reserves earnings reserve reserve Total interests equity EUR million EUR million EUR million EUR million EUR million EUR million EUR million EUR million EUR million EUR million
At January 1, 2010 624.4 484.4 (98.5) 1,050.0 476.5 (15.7) (933.4) 1,587.7 7.9 1,595.6
Result for the year – – – – 487.3 – – 487.3 0.2 487.5Other comprehensiveincome (loss) – – – – – 7.7 262.3 270.0 4.1 274.1Total comprehensiveincome (loss)for the year – – – – 487.3 7.7 262.3 757.3 4.3 761.6Allocation of 2009 result – – – 189.0 (189.0) – – – – –Dividends paid1 – – – – (287.5) – – (287.5) – (287.5)Movements on treasury shares – – 43.3 – – – – 43.3 – 43.3Share-based paymentadjustment – 10.7 (0.6) – – – – 10.1 – 10.1Acquisition ofnon-controlling interests – – – (17.5) – – (17.5) (9.5) (27.0)Other movements – – – (0.4) – – – (0.4) – (0.4)Ciel business combination – – – – – – – – 32.8 32.8At December 31, 2010 624.4 495.1 (55.8) 1,221.1 487.3 (8.0) (671.1) 2,093.0 35.5 2,128.5
1Dividends are shown net of dividends received on treasury shares.
The notes are an integral part of the consolidated fi nancial statements
Consolidated fi nancial statementsNotes to the consolidated fi nancial statementsDecember 31, 2010
Note 1 – Corporate informationSES (‘the company’) was incorporated on March 16, 2001 as a limited liability company (Société Anonyme) under Luxembourg law. References to the ‘group’ in the following notes are to the company and its subsidiaries, joint ventures and associates. SES trades under ‘SESG’ on the Luxembourg Stock Exchange and Euronext, Paris.
The consolidated fi nancial statements of SES for the year ended December 31, 2010 were authorised for issue in accordance with a resolution of the directors on February 17, 2011. Under Luxembourg law the fi nancial statements are approved by the shareholders at the annual general meeting.
Note 2 – Summary of signifi cant accounting policiesBasis of preparationThe consolidated fi nancial statements have been prepared on a historical cost basis, except where fair value is required by IFRS as described below. The carrying values of recognised assets and liabilities that are hedged items in fair value hedges, and are otherwise carried at cost, are adjusted to record changes in the fair values attributable to the risks that are being hedged.
Statement of complianceThe consolidated fi nancial statements have been prepared in accordance with International Financial Reporting Standards (‘IFRS’) adopted by the International Accounting Standards Board, and endorsed by the European Union, as at December 31, 2010.
Basis of consolidationBasis of consolidation as from January 1, 2010The consolidated fi nancial statements comprise the fi nancial statements of the company and its controlled subsidiaries, after the elimination of all material inter-company transactions. Subsidiaries are consolidated from the date the company obtains control until such time as control ceases. Acquisitions of subsidiaries are accounted for using the purchase method of accounting. The fi nancial statements of subsidiaries and affi liates are prepared for the same reporting period as the company, using consistent accounting policies. Adjustments are made to bring into line any dissimilar accounting policies that may exist. For details regarding the subsidiaries included see Note 31.
Losses within a subsidiary are attributed to the non-controlling interest even if that results in a defi cit balance. A change in the ownership interest of a subsidiary, without a loss of control, is accounted for as an equity transaction. If the group loses control over a subsidiary, it:
– derecognises the assets (including goodwill) and liabilities of the subsidiary;
– derecognises the carrying amount of any non-controlling interest;
– derecognises the cumulative translation differences, recorded in equity;
– recognises the fair value of the consideration received;– recognises the fair value of any investment retained;– recognises any surplus or defi cit in profi t or loss;– reclassifi es the parent’s share of components previously
recognised in other comprehensive income to profi t or loss or retained earnings, as appropriate.
Basis of consolidation prior to January 1, 2010Certain of the above-mentioned requirements were applied on a prospective basis. The following differences, however, are carried forward in certain instances from the previous basis of consolidation:
– losses incurred by the group were attributed to the non-controlling interest until the balance was reduced to nil. Any further excess losses were attributed to the parent, unless the non-controlling interest had a binding obligation to cover these. Losses prior to January 1, 2010 were not reallocated between non-controlling interests and the parent equity holders;
– upon loss of control, the group accounted for the investment retained at its proportionate share of net asset value at the date control was lost. The carrying value of such investments at January 1, 2010 has not been restated.
Application of IFRS 1The group adopted IFRS on January 1, 2004 and applied the provisions of IFRS 1 for this transition. In particular, goodwill arising on business combinations (IFRS 3) that occurred before January 1, 2004 has not been restated. In accordance with IFRS 1, the group has elected not to apply IAS 21 (as revised in 2003) retrospectively to fair value adjustments and goodwill arising in business combinations that occurred before January 1, 2004.
Changes in accounting policiesThe accounting policies adopted are consistent with those of the previous fi nancial year, except for the adoption of the following new and amended IFRS and IFRIC interpretations as of January 1, 2010:
– IFRS 2 – ‘Share-based Payment’: Group Cash-settled Share-based Payment Transactions effective 1, January 2010;
– IFRS 3 – ‘Business Combinations (Revised)’ and IAS 27 Consolidated and Separate Financial Statements (Amended) effective 1 July 2009, including consequential amendments to IFRS 2, IFRS 5 IFRS 7, IAS 7, IAS 21, IAS 28, IAS 31 and IAS 39;
– IAS 39 – ‘Financial Instruments’: Recognition and Measurement – Eligible Hedged Items effective July 1, 2009;
– IFRIC 17 – ‘Distributions of Non-cash Assets to Owners effective’ July 1, 2009;
– Improvements to IFRSs (May 2008);– Improvements to IFRSs (April 2009).
Adoption of these revised standards and interpretations did not have any effect on the fi nancial performance or position of the group. They did however give rise to additional disclosures, including in some cases, revisions to accounting policies. The adoption of the standards or interpretations is described below.
IFRS 2 – ‘Share-based Payment (Revised)’The standard has been amended to clarify the accounting for group cash-settled share-based payment transactions. This amendment also supersedes IFRIC 8 and IFRIC 11. The group adopted this amendment as of January 1, 2010. It did not have an impact on the fi nancial position or performance of the group.
28 SES Annual Report 2010

IFRS 3 – ‘Business Combinations (Revised) ’and IAS 27 ‘Consolidated and Separate Financial Statements’ (Amended)IFRS 3 (Revised) introduces signifi cant changes in the accounting for business combinations occurring after becoming effective. Changes affect the valuation of non-controlling interest, the accounting for transaction costs, the initial recognition and subsequent measurement of a contingent consideration and business combinations achieved in stages. These changes will impact the amount of goodwill recognised, the reported results in the period that an acquisition occurs and future reported results.
IAS 27 – (Amended) requires that a change in the ownership interest of a subsidiary (without loss of control) is accounted for as a transaction with owners in their capacity as owners. Therefore, such transactions will no longer give rise to goodwill, nor will it give rise to a gain or loss. Furthermore, the amended standard changes the accounting for losses incurred by the subsidiary as well as the loss of control of a subsidiary. The changes by IFRS 3 (Revised) and IAS 27 (Amended) affect acquisitions or loss of control of subsidiaries and transactions with non-controlling interests after January 1, 2010. The change in accounting policy was applied prospectively and had no material impact on earnings per share.
IAS 39 – ‘Financial Instruments’: Recognition and Measurement – Eligible Hedged ItemsThe amendment clarifi es that an entity is permitted to designate a portion of the fair value changes or cash fl ow variability of a fi nancial instrument as a hedged item. This also covers the designation of infl ation as a hedged risk or portion in particular situations. The group has concluded that the amendment will have no impact on the fi nancial position or performance of the group, as the group has not entered into any such hedges.
IFRIC 17 – “Distribution of Non-cash Assets to Owners’This interpretation provides guidance on accounting for arrangements whereby an entity distributes non-cash assets to shareholders either as a distribution of reserves or as dividends. The group has not made non-cash distribution to shareholders.
Improvements to IFRSsThe group has adopted all improvements issued in May 2008 and April 2009 which have effective application date for annual periods beginning on or after July 1, 2009.
Issued in May 2008– IFRS 5 – ‘Non-current Assets Held for Sale and Discontinued
Operations’: clarifi es that when a subsidiary is classifi ed as held for sale, all its assets and liabilities are classifi ed as held for sale, even when the entity remains a non-controlling interest after the sale transaction. The amendment is applied prospectively and has no impact on the fi nancial position nor fi nancial performance of the group.
Issued in April 2009– IFRS 5 – ‘Non-current Assets Held for Sale and Discontinued
Operations’: clarifi es that the disclosures required in respect of non-current assets and disposal groups classifi ed as held for sale or discontinued operations are only those set out in IFRS 5. The disclosure requirements of other IFRSs only apply if specifi cally required for such non-current assets or discontinued operations. As a result of this amendment, the group amended its disclosures in Note 6 Operating Segment and new disclosure is shown in Note 4.
– IFRS 8 – ‘Operating Segments’: clarifi es that segment assets and liabilities need only be reported when those assets and liabilities are included in measures that are used by the chief operating decision maker. As the group’s chief operating decision maker does review segment assets, the group has continued to disclose this information in Note 6.
The following improvements to IFRS relevant to the activity of the group were also adopted:– IFRS 2 – ‘Share-based Payment’;– IAS 1 – ‘Presentation of Financial Statements’;– IAS 7 – ‘Statement of Cash Flows’;– IAS 34 – ‘Interim Financial Reporting’;– IAS 36 – ‘Impairment of Assets’;– IAS 38 – ‘Intangible Assets’;– IAS 39 – ‘ Financial Instruments: Recognition and
Measurement’;– IFRIC 9 – ‘Reassessment of Embedded Derivatives’;– IFRIC 16 – ‘Hedge of a Net Investment in a Foreign Operation’.
Adoption of these standards and interpretations did not have any effect on the fi nancial position or performance of the group.
Interests in joint venturesThe group has interests in joint ventures which are jointly controlled entities. A joint venture is a contractual arrangement whereby two or more parties undertake an economic activity that is subject to joint control, and a jointly controlled entity is a joint venture that involves the establishment of a separate entity in which each venturer has an interest. The group recognises its interest in the joint venture using proportional consolidation. The group combines its share of each of the assets, liabilities, income and expenses of the joint venture with the similar items, line by line, in its consolidated fi nancial statements. The fi nancial statements of the joint venture are prepared for the same reporting year as the parent company, using consistent accounting policies. Adjustments are made to bring into line any dissimilar accounting policies that may exist.
When the group contributes or sells assets to the joint venture, any portion of gain or loss from the transaction is recognised based on the substance of the transaction. When the group purchases assets from the joint venture, the group does not recognise its share of the profi ts of the joint venture from the transaction until it resells the assets to an independent party. The joint venture is proportionately consolidated until the date on which the group ceases to have joint control over the joint venture.
29SES Annual Report 2010

Investments in associatesThe group has investments in associates which are accounted for under the equity method. An associate is an entity in which the group has signifi cant infl uence and which is neither a subsidiary nor a joint venture.
Under the equity method, the investment in the associate is carried in the balance sheet at cost plus post-acquisition changes in the group’s share of net assets of the associate. Goodwill relating to an associate is included in the carrying amount of the investment and is not amortised. After application of the equity method, the group determines whether it is necessary to recognise any additional impairment loss with respect to the group’s net investment in the associate. The income statement refl ects the share of the results of operations of the associate. Where there has been a change recognised directly in the equity of the associate, the group recognises its share of any changes and discloses this, when applicable, in the statement of changes in equity.
In general the fi nancial statements of associates are prepared for the same reporting year as the parent company, using consistent accounting policies. Adjustments are made to bring in line any dissimilar accounting policies that may exist. Where differences arise in the reporting dates the group adjusts the fi nancial information of the associate for signifi cant transactions in the intervening period.
Signifi cant accounting judgements and estimates1) JudgementsIn the process of applying the group’s accounting policies, management has made the following judgements, apart from those involving estimations, which have the most signifi cant effect on the amounts recognised in the fi nancial statements:
1.1) Treatment of orbital slot licence rightsThe group’s operating companies have obtained rights to operate satellites at certain orbital locations and using certain frequency bands. These licences are obtained through application to the relevant national and international regulatory authorities, and are generally made available for a defi ned period. On the expiry of such agreements, the operating company will generally be in a position to re-apply for the usage of these positions and frequency rights. Where the group has obtained such rights through the acquisition of subsidiaries and associates, the rights have been identifi ed as an asset acquired and recorded at the fair value attributed to the asset at the time of the acquisition as a result of purchase accounting procedure. Such assets are deemed to have an indefi nite life where the group has a high probability that it will be able to successfully re-apply for these rights as and when they expire. Hence these assets are not amortised, but rather are subject to regular impairment reviews to confi rm that the carrying value in the group’s fi nancial statements is still appropriate. More details are given in Note 16.
1.2) TaxationThe group operates in numerous tax jurisdictions and management is required to assess tax issues and exposures across its entire operations and to accrue for potential liabilities based on its interpretation of country-specifi c tax law and best estimates. In conducting this review management assesses the materiality of the issue and the likelihood, based on experience and specialist advice, as to whether it will result in a liability for the group. If this is deemed to be the case then a provision is made for the potential taxation charge arising. These provisions are recorded as current liabilities in the consolidated balance sheet. As at December 31, 2010 an amount of EUR 163.2 million (2009: EUR 118.4 million) is disclosed under ‘Income tax liabilities’.
One signifi cant area of management judgement is in the area of transfer pricing. Whilst the group employs dedicated members of staff to establish and maintain appropriate transfer pricing structures and documentation, judgement still needs to be applied and hence potential tax exposures can be identifi ed. The group, as part of its overall assessment of liabilities for taxation, reviews in detail the transfer pricing structures in place and makes provisions where this seems appropriate on a case by case basis.
2) Estimation uncertaintyThe key assumptions concerning the future and other key sources of estimation uncertainty at the balance sheet date that have a signifi cant risk of causing a material adjustment to the carrying amounts of assets and liabilities within the next fi nancial year are discussed below.
3) Impairment of goodwillThe group determines whether goodwill is impaired at least on an annual basis. This requires an estimation of the value in use of the cash-generating units to which the goodwill is allocated. Estimating the value in use requires the group to make an estimate of the expected future cash fl ows from the cash-generating unit and also to choose a suitable discount rate in order to calculate the present value of those cash fl ows. More details are given in Note 16.
Business combinationsBusiness combinations as from January 1, 2010Business combinations are accounted for using the acquisition method. The cost of an acquisition is measured as the aggregate of the consideration transferred, measured at acquisition date fair value and the amount of any non-controlling interest in the acquiree. For each business combination, the acquirer measures the non-controlling interest in the acquiree either at fair value or at the proportionate share of the acquiree’s identifi able net assets. Acquisition costs incurred are expensed and included in administrative expenses.
When the group acquires a business, it assesses the fi nancial assets and liabilities assumed for appropriate classifi cation and designation in accordance with the contractual terms, economic circumstances and pertinent conditions as at the acquisition date. This includes the separation of embedded derivatives in host contracts by the acquiree.
Consolidated fi nancial statementsNotes to the consolidated fi nancial statements continuedDecember 31, 2010
30 SES Annual Report 2010

If the business combination is achieved in stages, the acquisition date fair value of the acquirer’s previously held equity interest in the acquiree is remeasured to fair value at the acquisition date through profi t or loss. Any contingent consideration to be transferred by the acquirer will be recognised at fair value at the acquisition date. Subsequent changes to the fair value of the contingent consideration which is deemed to be an asset or a liability will be recognised in accordance with IAS 39 either in profi t or loss or as a change to other comprehensive income. If the contingent consideration is classifi ed as equity, it should not be remeasured until it is fi nally settled within equity.
Business combinations prior to January 1, 2010In comparison to the above-mentioned requirements, the following differences applied:
Business combinations were accounted for using the purchase method. Transaction costs directly attributable to the acquisition formed part of the acquisition costs. The non-controlling interest (formerly known as minority interest) was measured at the proportionate share of the acquiree’s identifi able net assets.
Business combinations achieved in stages were accounted for as separate steps. Any additional acquired share of interest did not affect previously recognised goodwill.
Contingent consideration was recognised if, and only if, the group had a present obligation, the economic outfl ow was more likely than not and a reliable estimate was determinable. Subsequent adjustments to the contingent consideration were recognised as part of goodwill.
Non-current assets held for sale and discontinued operationsNon-current assets and disposal groups classifi ed as held for sale are measured at the lower of their carrying amount and their fair value less costs to sell. Non-current assets and disposal groups are classifi ed as held for sale if their carrying amounts will be recovered principally through a sale transaction rather than through continuing use. This condition is regarded as met only when the sale is highly probable and the asset or disposal group is available for immediate sale in its present condition. Management must be committed to the sale, which should be expected to qualify for recognition as a completed sale within one year from the date of classifi cation.
In the consolidated statement of comprehensive income of the reporting period, and of the comparable period of the previous year, income and expenses from discontinued operations are reported separately from income and expenses from continuing operations, down to the level of profi t after taxes, even when the group retains a non-controlling interest in the subsidiary after the sale. The resulting profi t or loss (after taxes) is reported separately in the statement of comprehensive income.
Property, plant and equipment and intangible assets once classifi ed as held for sale are not depreciated or amortised.
Property, plant and equipment Property, plant and equipment is initially recorded at acquisition or manufacturing cost and is depreciated over the expected useful economic life. The manufacturing cost of internally generated property, plant and equipment includes directly attributable costs as well as appropriate overheads. Costs for the repair and maintenance of these assets are recorded as expense. Relevant fi nance charges arising during the construction period of satellites are capitalised.
Property, plant and equipment is depreciated using the straight-line method, generally based on the following useful lives:
Buildings 25 yearsSpace segment assets 10 to 16 yearsGround segment assets 3 to 15 yearsOther fi xtures, fi ttings, tools and equipment 3 to 15 years
An item of property, plant and equipment is derecognised upon disposal or when no future economic benefi ts are expected from its use or disposal. Any loss or gain arising on derecognition of the asset is included in the profi t and loss account in the year the asset is derecognised.
The asset’s residual values, useful lives and depreciation methods are reviewed, and adjusted if appropriate, at each fi nancial year end.
Assets in the course of constructionAmounts payable in respect of the purchase of future satellites, launch costs and other related expenses including ground segment expenditure and fi nancing costs are included in the balance sheet when accepted and billed. When the asset is subsequently put into service, the expenditure is transferred to assets in use and depreciation commences.
Intangible assets1) GoodwillGoodwill is initially measured at cost being the excess of the aggregate of the consideration transferred and the amount recognised for non-controlling interest over the net identifi able assets acquired and liabilities assumed. If this consideration is lower than the fair value of the net assets of the subsidiary acquired, the difference is recognised in profi t or loss.
After initial recognition, goodwill is measured at cost less any accumulated impairment losses. For the purpose of impairment testing, goodwill acquired in a business combination is, from the acquisition date, allocated to each of the group’s cash-generating units that are expected to benefi t from the combination, irrespective of whether other assets or liabilities of the acquiree are assigned to those units.
31SES Annual Report 2010

The carrying value of acquisition goodwill is reviewed for impairment annually, or more frequently if required to establish whether the value is still recoverable. The recoverable amount is defi ned as the higher of fair value less costs to sell and value in use. Impairment charges are taken as charges against net profi t where a non-recoverable component is identifi ed. Impairment losses relating to goodwill cannot be reversed in future periods. The group estimates value in use on the basis of the estimated discounted cash fl ows to be generated by a cash-generating unit which are based upon business plans approved by management. Beyond a fi ve-year period, cash fl ows may be estimated on the basis of stable rates of growth or decline.
Where goodwill forms part of a cash-generating unit and part of the operation within that unit is disposed of, the goodwill associated with the operation disposed of is included in the carrying amount of the operation when determining the gain or loss on disposal of the operation. Goodwill disposed of in this circumstance is measured based on the relative values of the operation disposed of and the portion of the cash-generating unit retained.
2) Other intangiblesIntangible assets, consisting principally of rights of usage of orbital frequencies and acquired transponder service agreements, are reviewed at acquisition to establish whether they represent assets with a defi nite or indefi nite life. Those assessed as being defi nite life assets are amortised on a straight-line basis over a period not exceeding 21 years. Indefi nite life intangible assets are held at cost in the balance sheet but are subject to impairment testing in line with the treatment outlined for goodwill above. The useful life of an intangible asset with an indefi nite life is reviewed annually to determine whether indefi nite life assessment continues to be supportable. If not, the change in the useful life assessment from indefi nite to fi nite is made on a prospective basis.
Impairment of non-fi nancial assetsThe group assesses at each reporting date whether there is an indication that an asset may be impaired. If any such indication exists, or when annual impairment testing for an asset is required, the group makes an estimate of the recoverable amount.
The group’s long-lived assets and defi nite-life intangible assets, including its in-service satellite fl eet, are reviewed for impairment whenever events or changes in circumstances indicate that the carrying amount of such assets may not be recoverable. Impairments can arise from complete or partial failure of a satellite as well as other changes in expected discounted future cash fl ows. Such impairment tests are based on a comparison of estimated discounted future cash fl ows to the recorded value of the asset. The estimated discounted cash fl ows are based on the most recent business plans. If impairment is indicated, the asset value will be written down to fair value based upon discounted cash fl ows using an appropriate discount rate.
Borrowing costsBorrowing costs that are directly attributable to the acquisition, construction or production of a qualifying asset are capitalised as part of the cost of that asset. All other borrowing costs are recognised as an expense in the period in which they are incurred.
Investments and other fi nancial assetsFinancial assets in the scope of IAS 39 are classifi ed as one of: fi nancial assets at fair value through profi t or loss; loans and receivables; held-to-maturity investments; or available-for-sale fi nancial assets; as appropriate. When fi nancial assets are recognised initially, they are measured at fair value, plus, in the case of investments not at fair value through profi t or loss, directly attributable transaction costs. The group determines the classifi cation of its fi nancial assets after initial recognition and, where allowed and appropriate, re-evaluates this designation at each fi nancial year end.
All regular purchases and sales of fi nancial assets are recognised on the trade date i.e. the date that the group is committed to the purchase or sale of the asset.
The following categories of fi nancial asset as defi ned in IAS 39 are relevant in the group’s fi nancial statements.
1) Financial assets at fair value through profi t or lossFinancial assets classifi ed as held for trading are included in the category ‘fi nancial assets at fair value through profi t or loss’. Financial assets are classifi ed as held for trading if they are acquired for the purpose of selling in the near term. Derivatives are also classifi ed as held for trading unless they are designated and effective hedging instruments. Gains or losses on investments held for trading are recognised in income.
2) Held-to maturity investmentsNon-derivative fi nancial assets with fi xed or determinable payments and fi xed maturity are classifi ed as held-to-maturity when the group has the positive intent and ability to hold to maturity. Investments intended to be held for an undefi ned period are not included in this classifi cation. Other long-term investments that are intended to be held-to-maturity, such as bonds, are subsequently measured at amortised cost. This cost is computed as the amount initially recognised minus principal repayments, plus or minus the cumulative amortisation using the effective interest method of any difference between the initially recognised amount and the maturity amount. This calculation includes all fees and points paid or received between parties to the contract that are an integral part of the effective interest rate, transaction costs and all other premiums and discounts. For investments carried at amortised cost, gains and losses are recognised in income when the investments are derecognised or impaired, as well as through the amortisation process.
3) Loans and receivablesLoans and receivables are non-derivative fi nancial assets with fi xed or determinable payments that are not quoted in an active market. Such assets are carried at amortised cost using the effective interest method. Gains and losses are recognised in income when the loans and receivables are derecognised or impaired, as well as through the amortisation process.
Consolidated fi nancial statementsNotes to the consolidated fi nancial statements continuedDecember 31, 2010
32 SES Annual Report 2010

4) Available-for-sale fi nancial assetsAvailable-for-sale fi nancial assets are those non-derivative fi nancial assets that are designated as available-for-sale or are not classifi ed in any of the three preceding categories. After initial recognition available-for-sale fi nancial assets are measured at fair value with gains and losses being recognised as a separate component of equity until the investment is derecognised or until the investment is determined to be impaired at which time the cumulative gain or loss previously reported in equity is included in the income statement totally or partially.
The fair value of investments that are actively traded in organised fi nancial markets is determined by reference to quoted market bid prices at the close of business on the balance sheet date. For investments where there is no active market, fair value is determined using valuation techniques. Such techniques include using recent arm’s length market transactions; reference to the current market value of another instrument, which is substantially the same; discounted cash fl ow analysis and option pricing models.
InventoriesInventories primarily consist of work-in-progress, related accessories and network equipment spares and are stated at the lower of cost or market value, with cost determined on an average-cost method and market value based on the estimated net realisable value.
Trade and other receivablesTrade receivables are recognised and carried at original invoice amount less an allowance for any uncollectible amounts. Provision is made when there is objective evidence that the group will not be able to collect the debts. Bad debts are written off when identifi ed.
Inter-company transactionsThe group accounts for inter-segment sales and transfers as if the sales or transfers were to third parties at current market prices.
Treasury sharesAcquired own equity instruments (treasury shares) are deducted from equity. No gain or loss is recognised in profi t or loss on the purchase, sale, issue or cancellation of the group’s own equity instruments.
Cash and cash equivalentsCash and cash equivalents comprise cash at banks and on hand, deposits and short-term, highly liquid investments readily convertible to known amounts of cash and subject to insignifi cant risk of changes in value. Cash on hand and in banks and short-term deposits which are held to maturity are carried at cost. For the purposes of the consolidated statement of cash fl ow, ‘Net Cash’ consists of cash and cash equivalents, net of outstanding bank overdrafts.
Revenue recognitionThe group enters into contracts to provide high-quality satellite transponder capacity and broadcasting services through which television, radio and data broadcasting make available programming services to the general public. Revenues are generated primarily from service agreements with customers to provide satellite transponder services.
All amounts received from customers under contracts for satellite capacity are recognised, at the fair value of the consideration received or receivable, over the duration of the respective contracts on a straight-line basis. Payments received in advance are deferred and included in the balance sheet as deferred income. Interest is accrued on advance payments received using the incremental borrowing rate of the group at the time the advance payments are received. Payments of receivables in arrears are accrued and included in trade debtors.
The group also has a number of long-term construction contracts. Revenue is recognised on these contracts by reference to the stage of completion of the contract where the outcome can be estimated reliably.
DividendsThe company declares dividends after the fi nancial statements for the year have been approved. Accordingly dividends are recorded in the subsequent year’s fi nancial statements.
ProvisionsProvisions are recognised when the group has a present obligation as a result of a past event and it is probable that an outfl ow of resources embodying economic benefi ts will be required to settle the obligation and a reliable estimate can be made of the amount of the obligation.
Current taxesCurrent tax assets and liabilities for the current and prior periods are measured at the amount expected to be recovered from or paid to the taxation authorities. The tax rates and tax laws used to compute the amount are those that are enacted or substantively enacted by the balance sheet date.
Deferred taxesDeferred income tax is provided using the liability method on temporary differences at the balance sheet date between the tax bases of assets and liabilities and their carrying amounts for fi nancial reporting purposes.
Deferred tax liabilities are recognised for all taxable temporary differences, except:
– where the deferred tax liability arises from the initial recognition of goodwill or of an asset or liability in a transaction that is not a business combination and, at the time of the transaction, affects neither the accounting profi t nor taxable profi t or loss; and
– in respect of taxable temporary differences associated with investments in subsidiaries where the timing of the reversal of the temporary differences can be controlled and it is probable that the temporary differences will not reverse in the foreseeable future.
33SES Annual Report 2010

Consolidated fi nancial statementsNotes to the consolidated fi nancial statements continuedDecember 31, 2010
Deferred income tax assets are recognised for all deductible temporary differences, carry-forward of unused tax credits and unused tax losses, to the extent that it is probable that taxable profi t will be available against which the deductible temporary differences, and the carry-forward of unused tax credits and unused tax losses can be utilised except:
– where the deferred income tax asset relating to the deductible temporary difference arises from the initial recognition of an asset or liability in a transaction that is not a business combination and, at the time of the transaction, affects neither the accounting profi t nor taxable profi t or loss; and
– in respect of deductible temporary differences associated with investments in subsidiaries, deferred tax assets are recognised only to the extent that it is probable that the temporary differences will reverse in the foreseeable future and taxable profi t will be available against which the temporary differences can be utilised.
The carrying amount of deferred income tax assets is reviewed at each balance sheet date and reduced to the extent that it is no longer probable that suffi cient taxable profi t will be available to allow all or part of the deferred income tax asset to be utilised. Unrecognised deferred income tax assets are reassessed at each balance sheet date and are recognised to the extent that it has become probable that future taxable profi t will allow the deferred tax asset to be recovered.
Deferred income tax assets and liabilities are measured at the tax rates that are expected to apply to the year when the asset is realised or the liability is settled, based on tax rates (and tax laws) that have been enacted or substantively enacted at the balance sheet date.
Income tax relating to items recognised directly in equity is recognised in equity and not in the income statement.
Deferred tax assets and deferred tax liabilities are offset, if a legally enforceable right exists to set off current tax assets against current tax liabilities and the deferred taxes relate to the same taxable entity and the same taxation authority.
Translation of foreign currenciesThe consolidated fi nancial statements are presented in euro (EUR), which is the company’s functional and presentation currency. Each entity in the group determines its own functional currency and items included in the fi nancial statements of each entity are measured using the functional currency.
Transactions in foreign currencies are initially recorded in the functional currency ruling at the date of transaction. The cost of non-monetary assets is translated at the rate applicable at the date of the transaction. All other assets and liabilities are translated at closing rates of exchange. During the year, expenses and income expressed in foreign currencies are recorded at exchange rates prevailing on the date they occur or accrue. All exchange differences resulting from the application of these principles are included in the consolidated income statement.
Goodwill and fair value adjustments arising on the acquisition of a 100%-owned foreign entity are treated as assets and liabilities of the foreign entity and translated at the closing rate. In accordance with IFRS 1, the group has elected not to apply IAS 21 ‘The Effects of Changes in Foreign Currency Exchange Rates’ (as revised in 2003) retrospectively to fair value adjustments and goodwill arising in business combinations that occurred before the date of transition to IFRS.
The assets and liabilities of consolidated subsidiaries are translated into euro at the year-end exchange rates, while the income and expense items of these subsidiaries are translated at the average exchange rate of the year. The related foreign exchange differences are included in the currency exchange reserve within equity. On disposal of a foreign subsidiary or joint venture, the deferred cumulative amount recognised in equity relating to that particular foreign operation is reclassifi ed to the income statement.
The U.S. dollar exchange rates used by the group during the year were as follows:
Average rate Closing rate Average rate Closing rateEUR 1 = for 2009 for 2009 for 2010 for 2010
United States dollar USD 1.3922 USD 1.4406 USD 1.3294 USD 1.3362
Basic and diluted earnings per shareThe company’s capital structure consists of Class A and Class B shares, entitled to the payment of annual dividends as approved by the shareholders at their annual meetings. Holders of Class B shares participate in earnings and are entitled to 40% of the dividends payable per Class A share.
Basic and diluted earnings per share are calculated by dividing the net profi t attributable to ordinary shareholders by the weighted average number of common shares outstanding during the period. Diluted earnings per share are also adjusted for the effects of dilutive options.
Derivative fi nancial instruments and hedgingThe group recognises all derivatives as assets and liabilities on the balance sheet at fair value. Changes in the fair value of derivatives are recorded in the income statement or in accordance with the principles below where hedge accounting is applied. The group uses derivative fi nancial instruments such as foreign currency contracts and interest rate swaps to hedge its risks associated with interest rate and foreign currency fl uctuation. The fair value of forward exchange contracts is calculated by reference to current forward exchange rates for contracts with similar maturity profi les. The fair value of interest rate swap contracts is determined by reference to market values for similar instruments. On the date a hedging derivative instrument is entered into, the group designates the derivative as one of the following:
1) a hedge of the fair value of a recognised asset or liability or of an unrecognised fi rm commitment (fair value hedge);
2) a hedge of a forecasted transaction or of the variability of cash fl ows to be received or paid related to a recognised asset or liability (cash fl ow hedge); or
3) a hedge of a net investment in a foreign operation.
34 SES Annual Report 2010

Hedges which meet the strict criteria for hedge accounting are accounted for as follows:
1) Fair value hedgesIn relation to fair value hedges (Interest Rate Swaps on fi xed-rate debt) which meet the conditions for hedge accounting, any gain or loss from re-measuring the hedging instrument at fair value is recognised immediately in the income statement. Any gain or loss on the hedged item attributable to the hedged risk is adjusted against the carrying amount of the hedged item and recognised in the income statement as fi nance revenue or cost.
2) Cash fl ow hedgesIn relation to cash fl ow hedges (forward foreign currency contracts and interest rate swaps) to hedge fi rm commitments or forecasted transactions which meet the conditions for hedge accounting, the portion of the gain or loss on the hedging instrument that is determined to be an effective hedge is recognised directly in equity and the ineffective portion is recognised in the income statement as fi nance revenue or cost.
When the hedged commitment results in the recognition of an asset or a liability, then, at the time the asset or liability is recognised, the associated gains or losses that had previously been recognised in equity are included in the initial measurement of the acquisition cost or carrying amount of the asset or liability.
3) Hedge of a net investment in a foreign operationChanges in the fair value of a derivative or non-derivative instrument that is designated as and meets all the required criteria for a hedge of a net investment are recorded in the currency exchange reserve to the extent that it is deemed to be an effective hedge. The ineffective portion is recognised in the income statement as fi nance revenue or cost.
Hedge accounting is discontinued when the hedging instrument expires or is sold, terminated or exercised, the hedge no longer qualifi es for hedge accounting, or the group revokes the designation. At that point in time, any cumulative gain or loss on the hedging instrument recognised in equity is kept in equity until the forecasted transaction occurs. If a hedged transaction is no longer expected to occur, the net cumulative gain or loss recognised in equity is transferred to net profi t or loss for the period.
The group formally documents all relationships between hedging instruments and hedged items, as well as its risk-management objective and strategy for undertaking various hedge transactions. This process includes allocating all derivatives that are designated as fair value or cash fl ow hedges to specifi c assets and liabilities on the balance sheet or to specifi c fi rm commitments or forecasted transactions. The group also formally assesses, both at the inception of the hedge and on an ongoing basis, whether each derivative is highly effective in offsetting changes in fair values or cash fl ows of the hedged item. If it is determined that a derivative is not highly effective as a hedge or if a derivative ceases to be a highly effective hedge, the group will discontinue hedge accounting prospectively.
Derecognition of fi nancial assets and liabilities1) Financial assetsA fi nancial asset is derecognised where:
– the rights to receive cash fl ows from the asset have expired;– the group retains the right to receive cash fl ows from the asset,
but has assumed an obligation to pay them in full without material delay to a third party under a ‘pass- through’ arrangement; or
– the group has transferred its rights to receive cash fl ows from the asset and either (a) has transferred substantially all the risks and rewards of the asset, or (b) has neither transferred nor retained substantially all the risks and rewards of the asset, but has transferred control of that asset.
Where the group has transferred its rights to receive cash fl ows from an asset and have neither transferred nor retained substantially all the risks and rewards of the asset nor transferred control of the asset, the asset continues to be recognised to the extent of the group’s continuing involvement in the asset. Continuing involvement that takes the form of a guarantee over the transferred asset is measured at the lower of the original carrying amount of the asset and the maximum amount of the consideration that the group could be required to repay.
Where continuing involvement takes the form of a written and/or purchased option (including cash-settled options or similar provision) on the transferred asset, the extent of the group’s continuing involvement is the amount of the transferred asset that the group may repurchase, except that in the case of a written put option (including a cash-settled option or similar provision) on an asset measured at fair value, the extent of the group’s continuing involvement is limited to the lower of the fair value of the transferred asset and the option exercise price.
2) Financial liabilitiesA fi nancial liability is derecognised when the obligation under the liability is discharged or cancelled or expires. Where an existing fi nancial liability is replaced by another from the same lender on substantially different terms, or the terms of an existing liability are substantially modifi ed, such an exchange or modifi cation is treated as a derecognition of the original liability and the recognition of a new liability, and the difference in the respective carrying amount is recognised in profi t or loss.
Accounting for pension obligationsThe company and certain subsidiaries operate defi ned benefi t pension plans and/or defi ned contribution plans. The cost of providing benefi ts under the defi ned benefi t pension plan is determined using the projected unit credit actuarial valuation method. Actuarial gains and losses are recognised as income or expense when the cumulative unrecognised gains or losses for each individual plan exceed 10% of the higher of the defi ned benefi t obligation and the fair value of plan assets. These gains or losses are recognised over the expected average remaining working lives of the employees participating in the plans. Costs relating to the defi ned contribution plan are recognised in the income statement as incurred on an accruals basis.
35SES Annual Report 2010
Consolidated fi nancial statementsNotes to the consolidated fi nancial statements continuedDecember 31, 2010
Share-based paymentsEmployees (including senior executives) of the group receive remuneration in the form of share-based payment transactions, whereby employees render services as consideration for equity instruments (‘equity-settled transactions’).
1) Equity-settled transactionsThe cost of equity-settled transactions is measured by reference to the fair value at the date on which they are granted. The fair value is determined by an external valuer using a binomial model, further details of which are given in Note 24. In valuing equity-settled transactions, no account is taken of any performance conditions, other than conditions linked to the price of the company’s shares, if applicable.
The cost of equity-settled transactions is recognised, together with a corresponding increase in equity, over the period in which the performance and/or service conditions are fulfi lled, ending on the date on which the relevant employees become fully entitled to the award (‘the vesting date’). The cumulative expense recognised for equity-settled transactions at each reporting date until the vesting date refl ects the extent to which the vesting period has expired and the group’s best estimate of the number of equity instruments that will ultimately vest. The income statement charge or credit for a period represents the movement in cumulative expense recognised as at the beginning and end of that period. No expense is recognised for awards that do not ultimately vest.
The group has taken advantage of the transitional provisions of IFRS 2 in respect of equity-settled awards and has applied IFRS 2 only to equity-based awards granted after November 7, 2002 that had not vested on January 1, 2004.
The dilutive effect of outstanding options is refl ected as additional share dilution in the computation of earnings per share (see Note 12).
2) Cash-settled transactionsThe cost of cash-settled transactions is measured initially at fair value at the grant date using a binomial model taking into account the terms and conditions upon which the instruments were granted (see Note 24). This fair value is expensed over the period until settlement with recognition of a corresponding liability. The liability is remeasured at each balance sheet date up to and including the settlement date with changes in fair value recognised in the consolidated income statement.
Note that the last options under equity settled schemes were granted in 2005 and the exercise period for these options expired during 2010 such that at the balance sheet date the group has no options outstanding under cash-settled schemes.
LeasesThe determination of whether an arrangement is, or contains a lease is based on the substance of the arrangement at inception date of whether the fulfi lment of the arrangement is dependent on the use of a specifi c asset or assets or the arrangement conveys a right to use the asset. For arrangements entered into prior to January 1, 2005, the date of inception is deemed to be January 1, 2005 in accordance with the transitional requirements of IFRIC 4.
Finance leases, which transfer to the group substantially all risks and benefi ts incidental to ownership of the leased item, are capitalised at the inception of the lease at the fair market value of the leased item or, if lower, at the present value of the minimum lease payments. Lease payments are apportioned between the fi nance charges and reduction of the lease liability so as to achieve a constant rate of interest on the remaining balance of the liability. Finance charges are charged directly to expense. Capitalised leased assets are depreciated over the shorter of the estimated useful life of the asset or the lease term.
Leases where the lessor retains substantially all the risks and benefi ts of ownership of the asset are classifi ed as operating leases. Operating lease payments are recognised as an expense in the income statement on a straight-line basis over the lease term.
IFRS standards and interpretations issued but not yet effectiveStandards and interpretations issued but not yet effective up to the date of issuance of the group’s fi nancial statements and which are expected to be relevant for the group at a future date are listed below. The group intends to adopt those standards when they become effective and /or once endorsed by the E.U.
IAS 24 Related Party Disclosures (Amendment) – The amended standard is effective for annual periods beginning on or after January 1, 2011. It clarifi es the defi nition of a related party to simplify the identifi cation of such relationships and to eliminate inconsistencies in its application. The revised standard introduces a partial exemption of disclosure requirements for government related entities. The group does not expect any impact on its fi nancial position or performance.
IAS 32 Financial Instruments: Presentation – Classifi cation of Rights Issues (Amendment) – The amendment to IAS 32 is effective for annual periods beginning on or after February 1, 2010 and amends the defi nition of a fi nancial liability in order to classify rights issues (and certain options or warrants) as equity instruments in cases where such rights are given pro rata to all of the existing owners of the same class of an entity’s non-derivative equity instruments, or to acquire a fi xed number of the entity’s own equity instruments for a fi xed amount in any currency. This amendment will have no impact on the group after initial application.
36 SES Annual Report 2010

IFRS 9 Financial Instruments: Classifi cation and Measurement – IFRS 9 as issued refl ects the fi rst phase of the IASBs work on the replacement of IAS 39 and applies to classifi cation and measurement of fi nancial assets as well as classifi cation, measurement and de-recognition of fi nancial liabilities as defi ned in IAS 39. The standard is effective for annual periods beginning on or after January 1, 2013. In subsequent phases, the IASB will address amortised cost, impairment methodology for fi nancial assets and hedge accounting. The completion of this project is expected in early 2011. The adoption of the fi rst phase of IFRS 9 will have an effect on the classifi cation and measurement of the group’s fi nancial assets and liabilities. The group is in process of analysing the impact of this standard on their operations as well as the date at which they plan to adopt the standard. The date of the adoption of this standard by the group will also be dependent on the timing of the E.U. endorsement process.
IFRIC 19 Extinguishing Financial Liabilities with Equity Instruments – IFRIC 19 is effective for annual periods beginning on or after July 1, 2010. The interpretation clarifi es that equity instruments issued to a creditor to extinguish a fi nancial liability qualify as consideration paid. The equity instruments issued are measured at their fair value. In case that this cannot be reliably measured, the instruments are measured at the fair value of the liability extinguished. Any gain or loss is recognised immediately in profi t or loss. The adoption of this interpretation will have no effect on the fi nancial statements of the group.
Improvements to IFRSs (issued in May 2010) – The IASB issued Improvements to IFRSs, an omnibus of amendments to its IFRS standards. The amendments have not been adopted as they become effective for annual periods on or after either July 1, 2010 or January 1, 2011. The amendments listed below are considered to have a reasonable possible impact on the group:
– IFRS 3 – ‘Business Combinations’;– IFRS 7 – ‘Financial Instruments’: Disclosures;– IAS 1 – ‘Presentation of Financial Statements’;– IAS 27 – ‘Consolidated and Separate Financial Statements’;– IAS 34 – ‘Interim Financial reporting’.
The group, however, expects no impact from the adoption of the amendments on its fi nancial position or performance.
Note 3 – Business combinations and acquisition of non-controlling interests1. Ciel Satellite Limited Partnership, Canada – Business combinationIn 2010 the regulatory framework governing Canadian satellite operators was amended to allow control by non-resident shareholders. SES holds a 70% interest in Ciel Satellite Limited Partnership (‘Ciel LP’) but due to the previous regulations SES was not able to demonstrate control over the entity and hence it was reported as a joint venture with the group consolidating its 70% proportional share of Ciel LP’s results.
Once the regulatory change was passed, the shareholder agreement of Ciel LP was amended to allow SES to exercise its voting rights over its full shareholding and hence to exercise control over Ciel LP’s operations. Consequently Ciel LP has been fully consolidated from the effective date of this amendment, September 29, 2010.
The fair value of the identifi able assets and liabilities of Ciel LP at the effective date of control are set out below. Note that for the purposes of the transaction the book value of the assets and liabilities of Ciel LP were deemed to be fair values and no goodwill arose on the transaction.
Fair value recognised on acquisition EUR million
AssetsProperty, plant and equipment 202.4Intangible assets 3.1Current assets 2.7Total assets 208.2
LiabilitiesCurrent liabilities 0.8Upfront payments 101.8Total liabilities 102.6
Total identifi able net assets at fair value 105.6
2. Acquisition of additional interests in SES ASTRA AB, SwedenOn March 4, 2010, the group acquired the remaining 10% interest of the voting shares of SES ASTRA AB (former SES SIRIUS AB). A cash consideration of EUR 27.0 million was paid to the non-controlling interest shareholders. The carrying value of the additional interest acquired was EUR 9.5 million and the difference of EUR 17.5 million between the consideration and the carrying value of the interest acquired has been recognised in other reserves within equity.
37SES Annual Report 2010

Consolidated fi nancial statementsNotes to the consolidated fi nancial statements continuedDecember 31, 2010
Note 4 – Discontinued operations – ND SatCom groupDuring the year the group indicated its intention to dispose of its controlling interest in ND SatCom, a supplier of satellite communication systems and equipment, which is part of the SES ASTRA segment. On October 22, 2010, SES announced that Astrium, a wholly-owned subsidiary of EADS, would purchase a 75.1% stake in the ND SatCom group. It is expected that the transaction will close during the fi rst quarter of 2011, subject to the realisation of certain conditions.
For that reason it is expected that proceeds from the participation in ND SatCom will be predominantly from the sale of the controlling shareholding rather than from a continuing controlling interest. Therefore ND SatCom is disclosed as a disposal group held for sale and as a discontinued operation. Immediately before the classifi cation of ND SatCom as a discontinued operation, the recoverable amount attributable goodwill was impaired by an amount of EUR 15.7 million. An additional impairment of EUR 30.8 million was recognised to remeasure the current net segment assets to fair value less cost to sell.
The prior year Statement of Comprehensive Income, and the segmental information, have been restated according to the provisions of IFRS 5.
The results of ND SatCom for the year ended December 31 are as follows:
2010 2009 EUR million EUR million
Revenue 59.8 81.4
Cost of sales (31.8) (51.2)Staff costs (27.1) (28.6)Other operating expenses (5.6) (5.9)
Depreciation expense (1.9) (4.2)Amortisation expense (21.0) (10.8)Operating profi t (27.6) (19.3)
Finance revenue 4.0 6.7Finance costs (9.7) (12.7)Profi t before tax (33.3) (25.3)
Income tax expense (0.3) 0.7Profi t after tax (33.6) (24.6)
Share of associates’ result 2.0 2.8
Impairment loss recognised on the remeasurement to fair value less cost to sell (30.8) –Related tax impact 26.1 –
Loss after tax from discontinued operations (36.3) (21.8)
Earnings per share on discontinued operations (in euro)Class A shares (0.09) (0.05)Class B shares (0.03) (0.02)
2010 EUR million
59.8
(31.8) (27.1) (5.6)
(1.9) (21.0) (27.6)
4.0 (9.7)
(33.3)
(0.3) (33.6)
2.0
(30.8) 26.1
(36.3)
(0.09) (0.03)
38 SES Annual Report 2010

39SES Annual Report 2010
The statement of fi nancial position of ND SatCom for the year ended December 31 is as follows:
2010 EUR million
Non-current assetsProperty, plant and equipment 5.9Assets in the course of construction 0.1Total property, plant and equipment 6.0
Intangible assets 29.8Financial assets 3.4Deferred income tax assets 3.3Total non-current assets 42.5
Current assetsInventories 14.1Trade and other receivables 59.7Prepayments 8.7Cash and cash equivalents 2.7Total current assets 85.2
Total assets 127.7
Non-current liabilitiesProvisions and deferred income 42.4Deferred tax liabilities 6.7Total non-current liabilities 49.1
Current liabilitiesTrade and other payables 39.7Income tax liabilities 0.6Deferred income 8.3Total current liabilities 48.6
Total liabilities 97.7
2010EUR million
5.90.16.0
29.83.43.3
42.5
14.159.78.72.7
85.2
127.7
42.46.7
49.1
39.70.68.3
48.6
97.7
Below are presented the net cash fl ows of ND SatCom for the years ended December 31, 2010 and 2009.
2010 2009 EUR million EUR million
Net operating cash fl ow 20.5 (11.1)Net cash (absorbed) generated by investing activities 1.8 (7.5)Net cash (absorbed) generated by fi nancing activities (24.4) 16.0Net foreign exchange movements 3.1 (0.1)Net (decrease) / increase in cash 1.0 (2.7)
2010EUR million
20.5 1.8
(24.4) 3.1 1.0
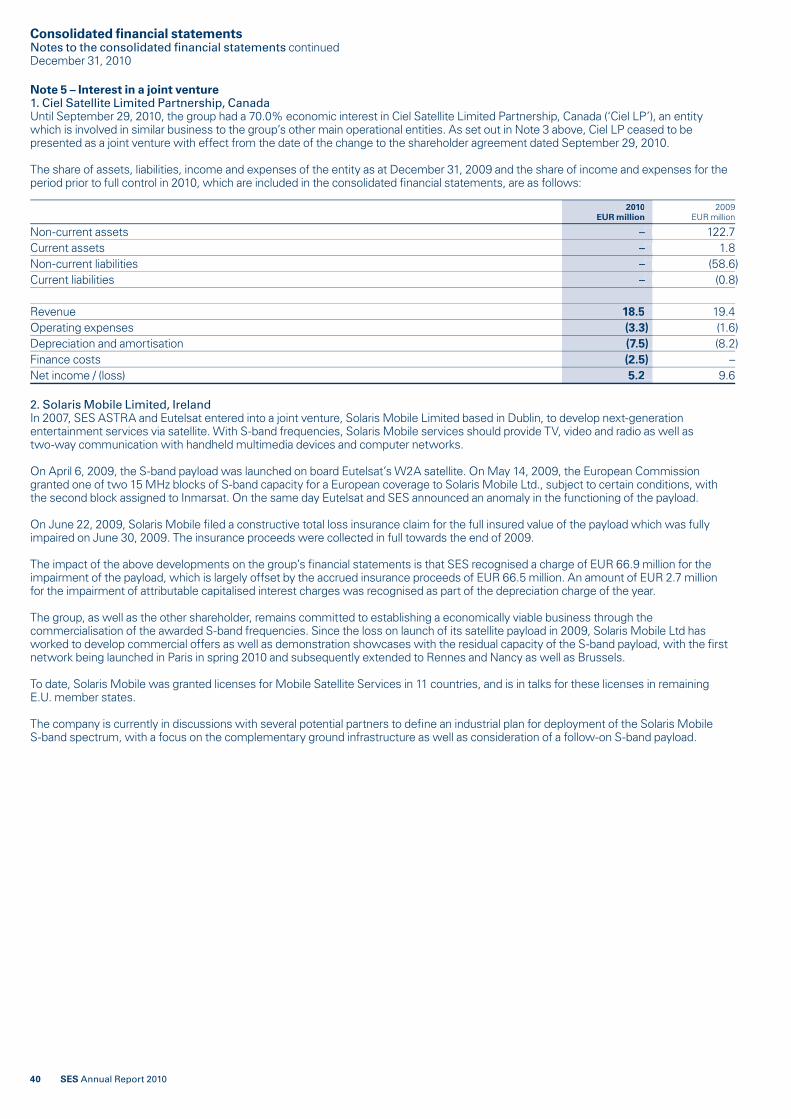
40 SES Annual Report 2010
Note 5 – Interest in a joint venture1. Ciel Satellite Limited Partnership, Canada Until September 29, 2010, the group had a 70.0% economic interest in Ciel Satellite Limited Partnership, Canada (‘Ciel LP’), an entity which is involved in similar business to the group’s other main operational entities. As set out in Note 3 above, Ciel LP ceased to be presented as a joint venture with effect from the date of the change to the shareholder agreement dated September 29, 2010.
The share of assets, liabilities, income and expenses of the entity as at December 31, 2009 and the share of income and expenses for the period prior to full control in 2010, which are included in the consolidated fi nancial statements, are as follows:
2010 2009 EUR million EUR million
Non-current assets – 122.7Current assets – 1.8Non-current liabilities – (58.6)Current liabilities – (0.8)
Revenue 18.5 19.4Operating expenses (3.3) (1.6)Depreciation and amortisation (7.5) (8.2)Finance costs (2.5) –Net income / (loss) 5.2 9.6
2010EUR million
– –– –– –– –
18.5 (3.3) (7.5) (2.5) 5.2
2. Solaris Mobile Limited, Ireland In 2007, SES ASTRA and Eutelsat entered into a joint venture, Solaris Mobile Limited based in Dublin, to develop next-generation entertainment services via satellite. With S-band frequencies, Solaris Mobile services should provide TV, video and radio as well as two-way communication with handheld multimedia devices and computer networks.
On April 6, 2009, the S-band payload was launched on board Eutelsat’s W2A satellite. On May 14, 2009, the European Commission granted one of two 15 MHz blocks of S-band capacity for a European coverage to Solaris Mobile Ltd., subject to certain conditions, with the second block assigned to Inmarsat. On the same day Eutelsat and SES announced an anomaly in the functioning of the payload.
On June 22, 2009, Solaris Mobile fi led a constructive total loss insurance claim for the full insured value of the payload which was fully impaired on June 30, 2009. The insurance proceeds were collected in full towards the end of 2009.
The impact of the above developments on the group’s fi nancial statements is that SES recognised a charge of EUR 66.9 million for the impairment of the payload, which is largely offset by the accrued insurance proceeds of EUR 66.5 million. An amount of EUR 2.7 million for the impairment of attributable capitalised interest charges was recognised as part of the depreciation charge of the year.
The group, as well as the other shareholder, remains committed to establishing a economically viable business through the commercialisation of the awarded S-band frequencies. Since the loss on launch of its satellite payload in 2009, Solaris Mobile Ltd has worked to develop commercial offers as well as demonstration showcases with the residual capacity of the S-band payload, with the fi rst network being launched in Paris in spring 2010 and subsequently extended to Rennes and Nancy as well as Brussels.
To date, Solaris Mobile was granted licenses for Mobile Satellite Services in 11 countries, and is in talks for these licenses in remaining E.U. member states.
The company is currently in discussions with several potential partners to defi ne an industrial plan for deployment of the Solaris Mobile S-band spectrum, with a focus on the complementary ground infrastructure as well as consideration of a follow-on S-band payload.
Consolidated fi nancial statementsNotes to the consolidated fi nancial statements continuedDecember 31, 2010

41SES Annual Report 2010
The share of assets, liabilities, income and expenses of the joint venture as at December 31, 2009 and 2010 and for the years then ended, which are included in the consolidated fi nancial statements, are as follows:
2010 2009 EUR million EUR million
Non-current assets 2.0 1.8Current assets 8.6 71.9Non-current liabilities – –Current liabilities 0.9 1.6
Revenue – 1.4Operating expenses (2.8) (3.2)Depreciation and amortisation (0.2) (0.1)Finance income, net 0.6 0.2Net loss (2.4) (1.7)
2010EUR million
2.0 8.6
– –0.9
– –(2.8) (0.2) 0.6
(2.4)
Note 6 – Operating segmentsFor reporting purposes, the group is divided into three operating segments, refl ecting the group’s internal reporting and responsibility structure, as well as its geographical regions of activity:
1. SES ASTRA serves primarily European and Middle-Eastern markets, as well as the African market for certain products;2. SES WORLD SKIES serves the other regions, and Africa for those services not offered by SES ASTRA;3. SES S.A. and other participations provide corporate services for the group.
SES S.A. SES and other SES ASTRA WORLD SKIES participations Elimination TotalAs at December 31, 2010 EUR million EUR million EUR million EUR million EUR million
Segmental resultsRevenueWith third parties 953.7 782.0 – – 1,735.7With other segments 11.3 2.3 – (13.6) –
Operating expenses (224.1) (191.9) (36.9) 13.6 (439.3)EBITDA 740.9 592.4 (36.9) – 1,296.4
Depreciation expenses (171.2) (292.9) (0.3) – (464.4)Amortisation expenses (31.6) (3.0) – – (34.6)Operating profi t 538.1 296.5 (37.2) – 797.4
Finance revenue 5.6Finance costs (201.5)Profi t before tax 601.5
Segmental assetsProperty, plant and equipment 1,767.9 2,620.7 16.2 – 4,404.8Intangible assets 448.5 2,417.4 0.1 – 2,866.0Allocated non-current assets 2,216.4 5,038.1 16.3 – 7,270.8
Non-allocated assets 957.7Total assets 8,228.5

42 SES Annual Report 2010
Consolidated fi nancial statementsNotes to the consolidated fi nancial statements continuedDecember 31, 2010
SES S.A. SES and other SES ASTRA WORLD SKIES participations Elimination TotalAs at December 31, 2009 EUR million EUR million EUR million EUR million EUR million
Segmental resultsRevenueWith third parties 907.9 712.4 – – 1,620.3With other segments 1.5 2.9 – (4.4) –
Operating expenses (198.7) (199.8) (32.5) 4.4 (426.6)EBITDA 710.7 515.5 (32.5) – 1,193.7
Depreciation expenses (175.1) (260.2) (0.3) – (435.6)Amortisation expenses (31.8) (6.7) – – (38.5)Operating profi t 503.8 248.6 (32.8) – 719.6
Finance revenue 52.2Finance costs (180.7)Profi t before tax 591.1
Segmental assetsProperty, plant and equipment 1,503.2 2,302.0 16.4 – 3,821.6Intangible assets 522.9 2,243.1 0.1 – 2,766.1Allocated non-current assets 2,026.1 4,545.1 16.5 – 6,587.7
Non-allocated assets 820.7Total assets 7,408.4
In analysing the fi nancial performance of these operating segments, the group’s management follows in particular the development of revenue and EBITDA (‘Earnings Before Interest, Taxation, Depreciation and Amortisation’) of the segment as a whole, as well as in the ‘Infrastructure’ and ‘Services’ components of the segments’ results. In this context ‘Infrastructure’ refers to the sale of satellite transponder capacity and directly attributable services. The ‘Services’ business refers to the provision of products such as engineering services, retail broadband two-way internet access, and playout and transmission services.
Sales between these two segments, primarily sales of infrastructure capacity through to the ‘Services’ businesses, are eliminated on consolidation. Start-up initiatives, that is to say new market initiatives in the pre-commercial phase, or initial phase of operations, are excluded from the ‘Infrastructure’ and ‘Services’ results analysis.

43SES Annual Report 2010
SES S.A. SES and other SES ASTRA WORLD SKIES participations Elimination TotalAs at December 31, 2010 EUR million EUR million EUR million EUR million EUR million
InfrastructureRevenue 868.6 677.2 – (1.7) 1,544.1EBITDA 721.1 561.1 – – 1,282.2Margin 83.0% 82.9% – – 83.0%
Services Revenue 121.2 190.0 – – 311.2EBITDA 26.7 31.0 – – 57.7Margin 22.0% 16.3% – – 18.5%
Elimination/start-up initiative/otherRevenue (36.1) (85.2) – 1.7 (119.6)EBITDA (7.0) 0.4 (36.9) – (43.5)
TotalRevenue 953.7 782.0 – – 1,735.7EBITDA 740.8 592.5 (36.9) – 1,296.4Total margin 74.7%
SES S.A. SES and other SES ASTRA WORLD SKIES participations Elimination TotalAs at December 31, 2009 EUR million EUR million EUR million EUR million EUR million
InfrastructureRevenue 835.8 609.7 – – 1,445.5EBITDA 694.7 503.7 – – 1,198.4Margin 83.1% 82.6% – – 82.9%
ServicesRevenue 109.1 165.0 – – 274.1EBITDA 22.0 18.5 – – 40.5Margin 20.1% 11.2% – – 14.8%
Elimination/start-up initiative/otherRevenue (37.0) (62.3) – – (99.3)EBITDA (6.0) (6.7) (32.5) – (45.2)
TotalRevenue 907.9 712.4 – – 1,620.3EBITDA 710.7 515.5 (32.5) – 1,193.7Total margin 73.7%

44 SES Annual Report 2010
The group’s revenues from external customers analysed by country using the customer’s billing address is as follows:
2010 2009 EUR million EUR million
Luxembourg (SES country of domicile) 44.5 46.2
United States of America 456.7 473.3Germany 374.9 354.9United Kingdom 301.3 296.4France 91.4 91.9Others 466.9 357.6Total 1,735.7 1,620.3
2010 EUR million
44.5
456.7 374.9 301.3
91.4 4466.9
1,735.7
No single customer accounted for 10% or more of total revenue in 2010 or 2009.
The group’s non-current assets are located as set out in the following table. Note that satellites are allocated to the country where the legal owner of the asset is incorporated. Similarly orbital slot rights and goodwill balances are allocated to the attributable subsidiary.
2010 2009 EUR million EUR million
Luxembourg (SES country of domicile) 1,498.3 1,558.8
United States of America 3,091.2 2,893.0The Netherlands 1,065.9 965.7Isle of Man 1,290.0 794.6Sweden 257.0 257.8Others 249.2 223.0Total 7,451.6 6,692.9
2010 EUR million
1,498.3
3,091.2 1,065.9 1,290.0
257.0 249.2
7,451.6
Note 7 – Operating expensesThe operating expense categories disclosed include the following types of expenditure:
1) Cost of sales (excluding staff costs and depreciation) represents cost categories which generally vary directly with revenue development. Such costs include the rental of third- party satellite capacity, the cost of goods sold (for example on the disposal of space segment assets), and costs directly attributable to the facilitation of customer contracts.
2) Staff costs includes gross salaries and employer’s social security payments, payments into pension schemes for employees, and charges arising under share-based payment schemes.
3) Other operating expenses are by their nature less variable to revenue development. Such costs include facility costs, in-orbit insurance costs, marketing expenses, general and administrative expenditure, consulting charges, travel-related expenditure and movements on provisions for debtors.
Provision on deposits made to Sea LaunchOn June 22, 2009, Sea Launch Company LLC, Sea Launch Limited Partnership – and their subsidiaries – fi led voluntary petitions to reorganise under Chapter 11 in a U.S. Bankruptcy Court. Prior to this fi ling, SES had made deposits to Sea Launch, for an amount of USD 29.6 million in connection with a launch contract which was terminated by SES before the Sea Launch fi ling. Whilst SES actively pursued the repayment of this amount, management elected to make a full provision against this receivable as at December 31, 2009. This charge was disclosed as part of the ‘Other operating expenses’ of the year.
In 2010 this provision has been reduced by USD 5.1 million refl ecting the progress made in the bankruptcy proceedings and increased visibility over expected settlements with creditors. The reduction in this provision has also being recorded through ‘Other operating expenses’.
Consolidated fi nancial statementsNotes to the consolidated fi nancial statements continuedDecember 31, 2010

45SES Annual Report 2010
Note 8 – Audit feesFor the year ended December 31, the group has recorded charges – both billed and accrued – from its independent auditor and affi liated companies thereof, as set out below:
2010 2009 EUR million EUR million
Total audit feesAudit fees 1.2 0.9Tax advisory fees 0.3 0.7Other services 0.3 0.1Total 1.8 1.7
2010 EUR million
1.2 0.3 0.3 1.8
Note 9 – Finance revenue and costs 2010 2009 EUR million EUR million
Finance revenueInterest income 5.6 17.5Net foreign exchange gains – 34.7Total 5.6 52.2
Finance costsInterest expense on loans and borrowings (net of amounts capitalised) (184.5) (180.7) Net foreign exchange charges (17.0) –Total (201.5) (180.7)
2010 EUR million
5.6 – –
5.6
(184.5) (17.0)
(201.5)
Note 10 – Income taxesTaxes on income comprise the taxes paid or owed on income in the individual countries, as well as deferred taxes. Current and deferred taxes can be analysed as follows:
2010 2009 EUR million EUR million
Consolidated income statementCurrent income taxCurrent income tax charge (128.5) (74.0)Adjustments in respect of prior periods 18.0 4.0
Deferred income taxRelating to origination and reversal of temporary differences 8.5 0.1Relating to tax losses brought forward 28.1 (21.6)Income tax expense per consolidated income statement (73.9) (91.5)
Consolidated statement of changes in equityDeferred income tax related to items (charged) or credited directly in equityNet loss on revaluation of fi nancial instruments – Cash fl ow hedge (2.5) 6.1Unrealised loss on loans and borrowings – Net Investment hedge 21.4 12.2Income taxes reported in equity 18.9 18.3
2010 EUR million
(128.5) 18.0
8.5 28.1
(73.9)
(2.5) 21.4 418.9

46 SES Annual Report 2010
A reconciliation between tax expenses and the profi t before tax of the group multiplied by theoretical tax rate of 29.34% which corresponds to the Luxembourg domestic tax rate for the year ended 31 December 2010 is as follows:
2010 2009 EUR million EUR million
Profi t before tax from continuing operations 601.5 591.1Loss before tax from discontinued operations (64.1) (25.3)Multiplied by theoretical tax rate of 29.34% 157.7 166.0Investment tax credits (42.4) (30.5)Tax exempt income (5.3) (3.7)Deferred tax asset on previously unrecognised tax losses (0.7) (12.0)Not income related taxes – 0.4Use of previous years unrecognised tax losses – 0.1Effect of different local tax rates (72.4) (44.3)Taxes related to prior years (18.0) (4.0)Non-deductible expenditures 29.1 8.0Effects of change in tax rate (2.0) –Reversal of previously recognised deferred tax assets – 2.8Other 2.1 8.0Income tax attributable to discontinued operations 25.8 0.7Income tax reported in the consolidated income statement 73.9 91.5
2010 EUR million
601.5 (64.1) 157.7 (42.4)
(5.3) (0.7)
– –– –
(72.4) (18.0) 29.1 (2.0)
– –2.1
25.8 73.9
The accounts related to deferred taxes included in the consolidated fi nancial statements can be analysed as follows:
Deferred Deferred Deferred Deferred Deferred Deferred tax assets tax assets tax liabilities tax liabilities tax in income tax in income 2010 2009 2010 2009 2010 2009 EUR million EUR million EUR million EUR million EUR million EUR million
Loss carried forward 89.9 66.4 – – (28.1) 21.6Tax-based special depreciation – – 47.0 15.9 8.6 2.4Amortisation – – 150.7 247.8 (5.9) (6.6)Depreciation – – 426.9 496.4 (40.1) (18.5)Retirement benefi t obligation – 7.3 2.1 – (0.4) 0.2Value adjustments on fi nancial asset – – 6.3 6.3 – –Value adjustments on treasury shares – 2.9 – – (0.2) 0.3Measurement of fi nancial instrumentsat fair value – – 33.5 43.1 (6.5) 17.4Receivables – – 0.7 24.5 (0.6) (3.3)Payables – 28.8 20.5 – 6.1 1.4Other provisions and accruals – 9.4 119.1 – (0.6) 18.5Other 11.3 – – 3.1 31.1 (13.0)Subtotal 101.2 114.8 806.8 837.1 (36.6) 20.4Offset of deferred taxes (69.2) (80.9) (69.2) (80.9) – –Total 32.0 33.9 737.6 756.2 (36.6) 20.4
Deferred tax assets have been offset against deferred tax liabilities where they relate to the same taxation authority and the entity concerned has a legally enforceable right to set off current tax assets against current tax liabilities.
In addition to the tax losses for which the group recognised deferred tax assets, the group has tax losses of EUR 217.4 million (2009: EUR 222.7 million) that are available indefi nitely for offset against future taxable profi ts of the companies in which the losses arose. Deferred tax assets have not been recognised in respect of these losses as they may not be used to offset taxable profi ts elsewhere in the group and they have arisen in subsidiaries that are not expected to generate taxable profi ts against which these profi ts could be offset in the foreseeable future.
Consolidated fi nancial statementsNotes to the consolidated fi nancial statements continuedDecember 31, 2010

47SES Annual Report 2010
Note 11 – Components of other comprehensive income 2010 2009 EUR million EUR million
Cash fl ow hedgesGains (losses) arising during the year:
On currency forward contracts 7.4 (1.1)On interest rate swaps 7.5 7.1
Reclassifi cation adjustments for (gains) / losses included in the fi xed assets (4.7) 2.8Total 10.2 8.8
2010 EUR million
7.4 47.5
(4.7) 10.2
Note 12 – Earnings per shareBasic earnings per share are calculated by dividing the net profi t for the year attributable to ordinary shareholders of each class of shares by the weighted average number of shares outstanding during the year. Earnings per share calculated on a fully diluted basis are insignifi cantly different from the basic earnings per share.
For the year 2010, earnings per share of EUR 1.24 per A share (2009: EUR 1.22), and EUR 0.50 per B share (2009: EUR 0.49) have been calculated on the following basis:
2010 2009 EUR million EUR million
Profi t attributable to equity holders of the parent 487.3 476.5
2010 EUR million
487.3
Weighted average number of shares, net of own shares held, for the purpose of calculating earnings per share:
2010 2009
Class A shares (in million) 327.2 324.5Class B shares (in million) 166.5 166.5Total 493.7 491.0
2010
327.2 166.5 493.7
The weighted average number of shares is based on the capital structure of the company as described in Note 23.
Note 13 – Dividends paid and proposedDividends declared and paid during the year:
2010 2009 EUR million EUR million
Class A dividend for 2009: EUR 0.73 (2008: EUR 0.66) 243.1 219.7Class B dividend for 2009: EUR 0.29 (2008: EUR 0.22) 48.6 44.0Total 291.7 263.7
2010 EUR million
243.1 48.6
291.7
Dividends proposed for approval at the annual general meeting to be held on April 7, 2011, which are not recognised as a liability as at December 31, 2010.
2010 2009 EUR million EUR million
Class A dividend for 2010: EUR 0.80 266.4 243.1Class B dividend for 2010: EUR 0.32 53.3 48.6Total 319.7 291.7
2010 EUR million
266.4 453.3
319.7

48 SES Annual Report 2010
Note 14 – Property, plant and equipment Other fi xtures and fi ttings, Land and Space Ground tools and buildings segment segment equipment Total EUR million EUR million EUR million EUR million EUR million
Movements in 2009 on costAs at January 1 169.5 5,342.1 383.4 176.9 6,071.9Additions 13.8 0.9 14.7 9.1 38.5Disposals (0.2) – (2.4) (4.5) (7.1)Retirements (0.3) (111.3) (27.8) (1.0) (140.4)Reclassifi cations (14.7) 2.0 – 14.7 2.0Transfers from assets in course of construction (Note 15) – 668.8 6.8 18.0 693.6Impact of currency translation (1.3) (79.0) (3.0) (1.0) (84.3)As at December 31 166.8 5,823.5 371.7 212.2 6,574.2
Movements in 2009 on depreciationAs at January 1 (82.4) (3,024.2) (281.5) (131.0) (3,519.1)Depreciation (7.6) (381.6) (28.0) (22.6) (439.8)Depreciation on disposals 0.1 – 0.2 3.3 3.6Depreciation on retirements 0.3 111.3 27.8 1.0 140.4Reclassifi cations 3.3 – – (3.3) –Transfers – (2.0) – – (2.0)Impact of currency translation 0.5 39.7 1.2 2.3 43.7As at December 31 (85.8) (3,256.8) (280.3) (150.3) (3,773.2)
Net book value as at December 31, 2009 81.0 2,566.7 91.4 61.9 2,801.0
Other fi xtures and fi ttings, Land and Space Ground tools and buildings segment segment equipment Total EUR million EUR million EUR million EUR million EUR million
Movements in 2010 on costAs at January 1 166.8 5,823.5 371.7 212.2 6,574.2Additions 1.1 62.3 13.1 27.2 103.7Disposals (1.2) – (2.7) (0.8) (4.7)Retirements (0.3) (175.2) (28.0) (4.3) (207.8)Reclassifi cations 1.3 – (2.4) 1.1 –Transfers from assets in course of construction (Note 15) – 452.2 7.4 4.4 464.0Transfer to another heading – – – (10.8) (10.8)Impact of scope change – 67.5 0.8 – 68.3Reclassifi cation to discontinued operations (1.0) – – (20.3) (21.3)Impact of currency translation 2.1 253.4 18.0 3.0 276.5As at December 31 168.8 6,483.7 377.9 211.7 7,242.1
Movements in 2010 on depreciationAs at January 1 (85.8) (3,256.8) (280.3) (150.3) (3,773.2)Depreciation (7.4) (397.8) (27.7) (18.4) (451.3)Impairment on AMC-4 and AMC-16 – (13.1) – – (13.1)Depreciation on disposals 0.1 – 0.2 0.8 1.1Depreciation on retirements 0.3 175.2 28.0 4.3 207.8Depreciation from discontinued operations (0.1) – – (1.8) (1.9)Transfers (1.9) – 1.9 – –Transfer to another heading – – – 3.1 3.1Impact of scope change – (7.4) – – (7.4)Reclassifi cation to discontinued operations – – – 15.3 15.3Impact of currency translation (0.9) (112.5) (14.1) (1.8) (129.3)As at December 31 (95.7) (3,612.4) (292.0) (148.8) (4,148.9)
Net book value as at December 31, 2010 73.1 2,871.3 85.9 62.9 3,093.2
Consolidated fi nancial statementsNotes to the consolidated fi nancial statements continuedDecember 31, 2010

49SES Annual Report 2010
Note 15 – Assets in the course of construction Land and Space Ground buildings segment segment Total EUR million EUR million EUR million EUR million
Cost and net book value as at January 1, 2009 0.2 1,197.0 46.0 1,243.2
Movements in 2009Solaris failure (Note 5) – (66.5) – (66.5)Additions 0.5 580.4 14.4 595.3Transfers to assets in use (Note 14) (0.2) (668.8) (24.6) (693.6)Transfers to current assets – (19.6) (6.4) (26.0)Impact of currency translation – (31.2) (0.6) (31.8)Cost and net book value as at December 31, 2009 0.5 991.3 28.8 1,020.6
Land and Space Ground buildings segment segment Total EUR million EUR million EUR million EUR million
Cost and net book value as at January 1, 2010 0.5 991.3 28.8 1,020.6
Movements in 2010Additions 4.6 668.2 24.0 696.8Transfers to assets in use (Note 14) – (452.2) (11.8) (464.0)Transfers to current assets – (0.2) (1.7) (1.9)Reclassifi cation to discontinued operations – – (0.1) (0.1)Transfer to another heading – – (0.4) (0.4)Disposals – – (0.4) (0.4)Impact of currency translation – 59.8 1.2 61.0Cost and net book value as at December 31, 2010 5.1 1,266.9 39.6 1,311.6
Borrowing costs of EUR 58.6 million (2009: EUR 46.7 million) arising on fi nancing specifi cally relating to satellite construction were capitalised during the year and are included in ‘Space segment’ additions in the above table.
A weighted average capitalisation rate of 5.35% (2009: 4.83%) was used, representing the borrowing group’s average weighted cost of borrowing. Excluding the impact of the loan origination costs the average weighted interest rate was 4.63% (2009: 4.38%).

50 SES Annual Report 2010
Consolidated fi nancial statementsNotes to the consolidated fi nancial statements continuedDecember 31, 2010
Note 16 – Intangible assets Indefi nite life
Orbital slot Defi nite licence rights Goodwill Other life intangibles Total EUR million EUR million EUR million EUR million EUR million
Book value as at January 1, 2009 716.0 1,736.4 5.5 424.2 2,882.1
Movements in 2009 on costAs at January 1 716.0 1,736.4 5.5 698.5 3,156.4Additions 0.4 4.0 – 8.9 13.3Transfers – – (2.6) 2.6 –Transfers to another heading – – – (1.4) (1.4)Impairment – (4.4) – – (4.4)Impact of currency translation (19.9) (56.5) – (2.1) (78.5)As at December 31 696.5 1,679.5 2.9 706.5 3,085.4
Movements in 2009 on amortisationAs at January 1 – – – (274.3) (274.3)Amortisation – – – (41.9) (41.9)Impairment – – – (3.0) (3.0)Impact of currency translation – – – (0.1) (0.1)As at December 31 – – – (319.3) (319.3)
Book value as at December 31, 2009 696.5 1,679.5 2.9 387.2 2,766.1
Movements in 2010 on costAs at January 1 696.5 1,679.5 2.9 706.5 3,085.4Additions 0.2 0.4 – 2.7 3.3Transfers – – – (0.1) (0.1)Transfers to another heading – – (0.1) – (0.1)Disposal – – – (0.2) (0.2)Impairment from discontinued operations – (15.7) – (5.2) (20.9)Impact of scope change 0.9 – – – 0.9Reclassifi cation to discontinued operations – (8.0) (2.8) (45.0) (55.8)Impact of currency translation 52.8 123.1 – 4.1 180.0As at December 31 750.4 1,779.3 – 662.8 3,192.5
Movements in 2010 on amortisationAs at January 1 – – – (319.3) (319.3)Amortisation – – – (34.6) (34.6)Amortisation from discontinued operations – – – (5.3) (5.3)Transfers to another heading – – – 8.5 8.5Reclassifi cation to discontinued operations – – – 25.9 25.9Impact of currency translation – – – (1.7) (1.7)As at December 31 – – – (326.5) (326.5)
Book value as at December 31, 2010 750.4 1,779.3 – 336.3 2,866.0

51SES Annual Report 2010
Indefi nite life intangible assetsEffective January 1, 2010, the group combined its cash-generating units for SES AMERICOM and SES NEW SKIES. Both segments are now co-managed, being operated as one single segment. No results are reviewed by management at a lower level than SES WORLD SKIES segment. The indefi nite life intangible assets as at December 31, 2010 have a net book value of EUR 2,529.7 million (2009: EUR 2,378.9 million) made up as set out per cash-generating unit in the table below.
2010 2009 EUR million EUR million
SES WORLD SKIES 2,363.5 2,198.1SES ASTRA AB (formerly SES SIRIUS AB) 87.7 85.2ASTRA Platform Services 33.9 33.9ND SatCom (discontinued operation) – 26.5SES ASTRA SA 13.7 13.7Others 30.9 21.5Total 2,529.7 2,378.9
2010 EUR million
2,363.5 87.7 33.9
– –13.7 30.9
2,529.7
1. Orbital slot licence rightsInterests in orbital slot licence rights were acquired in the course of the acquisitions of SES WORLD SKIES entities and SES ASTRA AB, as well as through the targeted acquisition of such rights from third parties. The group believes that it has a high probability of being able to achieve the extension of these rights as the current agreements expire and hence these assets are not amortised, but rather are held on the balance sheet at acquisition cost. Impairment procedures are performed at least once a year to assess whether the carrying value is still appropriate.
2. GoodwillAn impairment of EUR 4.4 million was recorded in 2009 following the recognition of deferred tax assets not valued at the date of acquisition of SES NEW SKIES.
Impairment procedures are performed at least once a year to assess whether the carrying value is still appropriate. The recoverable amount of the goodwill is determined based on a value-in-use calculation (Note 2) using the most recent business plan information approved by senior management which covers a period of up to seven years. This relatively long period for the business plan is derived from the long-term contractual base for the satellite business.
Discount rates in 2010 are between 6.60% and 7.50% (2009: 6.90% and 9.30%) and were selected to refl ect: market interest rates and commercial spreads; the capital structure of businesses in the group’s business sector; and the specifi c risk profi le of the businesses concerned. Terminal growth rates used in the valuations are set at 0.0% or 1.0%, which can be supported by reference to the trading performance of the companies concerned over a longer period.
Defi nite life intangible assetsThe group’s primary defi nite life intangible asset is the agreement concluded by SES ASTRA with the Luxembourg government in relation to the usage of the Luxembourg frequencies in the orbital positions of the geostationary arc from 45˚ West to 50˚ East for the period of January 1, 2001 to December 31, 2021. Given the fi nite nature of this agreement, these usage rights – valued at EUR 550.0 million on acquisition – are being amortised on a straight-line basis over the 21-year term of the agreement.
In December 2009, the group recorded an impairment charge of EUR 3.0 million on ‘Other Defi nite Life assets’ in the light of a new valuation of certain technology related assets.
Impairment testing of goodwill and intangibles with indefi nite livesThe cash-generating units (CGUs) for impairment testing of goodwill and intangible assets relating to SES WORLD SKIES, SES ASTRA AB are the smallest identifi able group of satellite assets that are largely independent of the cash fl ows from other groups of satellites. In identifying these CGUs the group takes into account fl eet utilisation considerations, particularly the ability of individual satellites to provide back-up services to other satellites in the light of their available frequency spectrum and geographical footprint.
For ASTRA Platform Services the companies operations as a whole are treated as a CGU.
The calculations of value in use are most sensitive to:
– movements in the underlying business plan assumptions for the satellites concerned;– changes in discount rates; and– the growth rate assumptions used to extrapolate cash fl ows beyond the business plan period.

52 SES Annual Report 2010
Movements in the underlying business plan assumptions: the group’s subsidiaries draw up annually a business plan which generally provides an assessment of the expected developments for a seven-year period beyond the end of the year when the plan is drawn up. These business plans refl ect both the most up-to-date assumptions concerning the CGU’s markets and also developments and trends in the business of the CGU. For the provision of satellite capacity business these will particularly take account of the following factors:
– the expected developments in transponder fi ll rates, including the impact of the launch of new capacity;– new products and services to be launched during the business plan period;– any changes in the expected capital expenditure cycle – due to technical degradation of a satellite or through the identifi ed need for
additional capacities; and– any changes in satellite procurement, or launch, cost assumptions.
Changes in discount rates: discount rates refl ect management’s estimate of the risks specifi c to each unit. Management uses a weighted average cost of capital as the discount rate for each entity. This refl ects the market interest rates on ten-year bonds in the market concerned, the capital structure of the group, and other factors, as necessary, applying specifi cally to the CGU concerned.
Growth rate assumptions used to extrapolate cash fl ows beyond the business planning period: rates are based on the commercial experience relating to the CGUs concerned and the expectations for developments in the markets which they serve.
As part of standard impairment testing procedures the company assesses the impact of changes in the discount rates and growth assumptions on the valuation surplus, or defi cit as the case may be, revealed by the impairment testing. Discount rates are simulated up to 1% below and above the CGU specifi c rate used in the base valuation. Likewise terminal growth assumptions are simulated at 1% higher and lower than the base assumption in the valuation. In this way a matrix of valuations is generated which reveals the exposure to impairment charges for each CGU based on movements in the valuation parameters which are within the range of outcomes foreseeable at the valuation date.
The most recent testing showed that all three CGUs tested would have no impairment even in the least favourable case – a combination of lower terminal growth rates and higher discount rates.
Note 17 – Investment in associates On November 16, 2009, SES made an initial investment of $75 million to acquire 25% of O3b Networks Limited (‘O3b’), a company establishing a new Medium Earth Orbit satellite-based backbone for telecommunications operators and internet service providers in emerging markets. In addition to its cash investment, SES agreed to provide in-kind services, including technical and commercial services, to O3b in the pre-service commercialization period in return for additional shares.
On November 29, 2010, SES announced its participation in a further fi nancing round. This ‘full funding’ round raised a total of USD 1.2 billion from a group of investors and banks, securing the fi nancing required to take O3b through to its service launch in the fi rst half of 2013. SES’s participation on the full fi nancing round comprised the subscription for additional shares to be fully paid based on current estimates by 2013. In addition SES committed to provide two tranches of loans in a total amount of USD 66 million to O3b in the pre-commercialisation period, if required, at fi xed rates. In return for making these commitments SES received additional shares in the company.
After the full fi nancing agreement, and refl ecting the additional shares arising under that agreement, SES has an equity interest of 33.32% of the O3b group of companies, compared to 25.15%, including in-kind service shares, at the end of the previous year.
The carrying value of the O3b investment has risen from EUR 49.5 million to EUR 128.2 million in 2010, including a fair value of EUR 30.9 million placed on the contingent funding described above.
The share of assets, liabilities, income and expenses of O3b Networks Limited as at December 31, 2009 and 2010 and for the years then ended, which are included in the consolidated fi nancial statements, are as follows:
2010 2009 EUR million EUR million
Non-current assets 74.5 17.5Current assets 59.3 2.5Non-current liabilities 35.7 –Current liabilities 1.6 1.1
Revenue – –Operating expenses (3.1) (0.4)Depreciation and amortisation – –Finance income, net (0.7) –Net loss (3.8) (0.4)
2010 EUR million
74.5 59.3 35.7
1.6
– –(3.1)
– –(0.7) (3.8)
On December 31, 2010, the group held no other signifi cant investments in associates (2009: EUR 7.8 million).
Consolidated fi nancial statementsNotes to the consolidated fi nancial statements continuedDecember 31, 2010

53SES Annual Report 2010
Note 18 – Other fi nancial assets 2010 2009 EUR million EUR million
Loans and receivablesAmounts receivable from associates after one year 12.7 13.6Other non-current receivables – 0.4 12.7 14.0Other fi nancial assetsSundry fi nancial assets 12.4 –
Total other fi nancial assets 25.1 14.0
2010 EUR million
12.7 – –
12.7
12.4 4
25.1
Amounts receivable from associates after one year relates to a loan made to QuetzSat S. de R. L. de C.V., a Mexican company in which the group has a participating interest.
Other fi nancial assets comprises mainly a receivable of EUR 12.3 million from ODM (Proprietary) Limited, South Africa.
During the year SES reached agreement to acquire the ProtoStar 2 satellite at an auction sale arising out of the bankruptcy proceedings of ProtoStar. ProtoStar 2 is a hybrid S-band / Ku-band satellite with a footprint over South-East Asia. Shortly after the successful acquisition of the satellite announced on May 5, 2010, SES reached an agreement with MCI Indovision, the anchor customer on the S-band payload, to sell to them, subject to regulatory approvals, the S-band payload and the transaction closed in November 2010. Hence there was an equal addition and disposal to other fi nancial assets during the year of the euro equivalent of $95.0 million.
Note 19 – Trade and other receivables 2010 2009 EUR million EUR million
Net trade debtors 152.5 158.5Unbilled accrued revenue 82.4 156.2Other receivables 42.1 59.5Total trade and other receivables 277.0 374.2
2010 EUR million
152.5 82.4 442.1
277.0
Unbilled accrued revenue represents revenue for use of satellite capacity under long-term contracts but not billed. Billing will occur based on the terms of the contracts. An amount of EUR 2.4 million was recognised to income in 2010 concerning movement on debtor provisions (2009: EUR 3.3 million was recognised to income). This amount is disclosed in ‘Other operating charges’.
Trade debtors and other receivables at December 31, 2010 included EUR 15.9 million (2009: EUR 16.2 million) of amounts becoming due and payable after more than one year.
As at December 31, 2010, trade receivables with a nominal amount of EUR 20.7 million (2009: EUR 25.5 million) were impaired and fully provided for. Movements in the provision for the impairment of receivables were as follows:
2010 2009 EUR million EUR million
As at January 1 25.5 28.8Net charge to income for the year 2.4 3.3Utilised (10.3) (6.2)Impact of currency translation 3.5 (0.4)Discontinued operations (0.4) –As at December 31 20.7 25.5
2010 EUR million
25.5 2.4 4
(10.3) 3.5 (0.4) 20.7
The impaired Sea Launch receivable (Note 7) is recorded under ‘Other receivables’ and is not included in the above table.

54 SES Annual Report 2010
Note 20 – Financial instruments Fair valuesSet out below is a comparison by category of carrying amounts and fair values of all of the group’s fi nancial instruments that are carried in the fi nancial statements.
Carried at amortised cost Carried at fair value Total
Carrying Fair Carrying Balance amount value amount SheetAs at December 31, 2010 EUR million EUR million EUR million EUR million
Financial assetsNon-current fi nancial assets:Loans and receivables 12.7 12.7 – 12.7Other 12.4 12.4 – 12.4Total other fi nancial assets 25.1 25.1 – 25.1
Current fi nancial assets:Valuation of fi nancial derivatives – – 2.5 2.5Trade & other receivables 275.4 275.4 – 275.4Cash and cash equivalents 321.0 321.0 – 321.0Total 596.4 596.4 2.5 598.9
Financial liabilitiesInterest-bearing loans and borrowings:At fl oating rates:Syndicated loan 2015 97.2 97.2 – 97.2Commercial papers 135.0 135.0 – 135.0Uncommitted loans 179.6 179.6 – 179.6COFACE 97.2 97.2 – 97.2
At fi xed rates:Euro Private Placement 2016 (EUR 150 million ) issued under EMTN 148.8 161.8 – 148.8Eurobond 2020 (EUR 650 million) 643.3 658.0 – 643.3Eurobond 2014 (EUR 650 million) 645.0 692.6 – 645.0Eurobond 2013 (EUR 500 million) 500.0 526.1 – 500.0Eurobond 2011 (EUR 650 million) 649.8 654.4 – 649.8German Bond 2012 (EUR 100 million), non-listed 99.8 107.6 – 99.8German Bond 2012 (EUR 100 million), non-listed 99.7 108.1 – 99.7Series A (USD 400 million) 126.3 138.6 – 126.3Series B (USD 513 million) 383.9 428.2 – 383.9Series C (USD 87 million) 65.1 75.6 – 65.1Series D (GBP 28 million) 13.9 15.2 – 13.9European Investment Bank (EUR 200 million) 199.9 199.9 – 199.9
Total interest-bearing loans and borrowings: 4,084.5 4,275.1 – 4,084.5Of which: Non-current 2,995.9 3,160.7 – 2,995.9Of which: Current 1,088.6 1,114.4 – 1,088.6
Interest rate swaps – – 13.2 13.2Forward currency contracts – – 0.9 0.9Total valuation of fi nancial derivatives – – 14.1 14.1Of which: Non-current – – 14.1 14.1Of which : Current – – – –
Trade & other payables 348.9 348.9 – 348.9
Consolidated fi nancial statementsNotes to the consolidated fi nancial statements continuedDecember 31, 2010

55SES Annual Report 2010
Carried at amortised cost Carried at fair value Total
Carrying Fair Carrying Balance amount value amount SheetAs at December 31, 2009 EUR million EUR million EUR million EUR million
Financial assetsNon-current fi nancial assets:Loans and receivables 13.6 13.6 – 13.6Other 0.4 0.4 – 0.4Total other fi nancial assets 14.0 14.0 – 14.0
Current fi nancial assets:Valuation of fi nancial derivatives – – – –Trade & other receivables 374.2 374.2 – 374.2Cash and cash equivalents 286.6 286.6 – 286.6Total 660.8 660.8 – 660.8
Financial liabilitiesInterest-bearing loans and borrowings:At fl oating rates:Bilateral multi-currency 91.4 91.4 – 91.4Bilateral 2010 (EUR 100 million) issued under EMTN 100.0 100.0 – 100.0Syndicated loan 2012 594.6 594.6 – 594.6Commercial papers 55.0 55.0 – 55.0Committed loans 48.6 48.6 – 48.6Uncommitted loans 27.8 27.8 – 27.8
At fi xed rates:Euro Private Placement 2016 (EUR 150 million ) issued under EMTN 148.6 155.6 – 148.6Eurobond 2014 (EUR 650 million) 643.0 678.6 – 643.0Eurobond 2013 (EUR 500 million) 500.0 515.0 – 500.0Eurobond 2011 (EUR 650 million) 649.1 662.9 – 649.1German Bond 2012 (EUR 100 million), non-listed 99.4 111.0 – 99.4German Bond 2012 (EUR 100 million), non-listed 99.5 110.3 – 99.5Series A (USD 400 million) 157.0 174.3 – 157.0Series B (USD 513 million) 356.1 403.2 – 356.1Series C (USD 87 million) 60.4 69.6 – 60.4Series D (GBP 28 million) 18.0 19.9 – 18.0European Investment Bank (EUR 200 million) 200.0 200.0 – 200.0
Total interest-bearing loans and borrowings: 3,848.5 4,017.8 – 3,848.5Of which: Non-current 3,481.6 3,650.8 – 3,481.6Of which: Current 366.9 367.0 – 366.9
Interest rate swaps – – 20.7 20.7Forward currency contracts – – 36.9 36.9Total valuation of fi nancial derivatives – – 57.6 57.6Of which: Non-current – – 4.3 4.3Of which : Current – – 53.3 53.3
Trade & other payables 345.6 345.6 – 345.6

56 SES Annual Report 2010
Set out below is an analysis of fi nancial derivatives valuation by category of hedging / trading activities and derivatives.
December 31, 2010 December 31, 2009
Analysis of fi nancial derivatives Fair value asset Fair value liability Fair value asset Fair value liability EUR million EUR million EUR million EUR million
Derivatives held for trading:Currency forwards, futures and swaps – – – 1.6
Cash fl ow hedges:Currency forwards, futures and swaps 2.5 0.9 – 1.1Interest rate swaps – 13.2 – 20.7
Net investment hedges:Currency forwards, futures and swaps – – – 34.2
Total valuation of fi nancial derivatives 2.5 14.1 – 57.6Of which: Non-current – 14.1 – 4.3Of which: Current 2.5 – – 53.3
December 31, 2010
Fair value asset Fair value liability yEUR million EUR million
– – –
2.5 0.9 – 13.2
– – –
2.5 14.1 – 14.1
2.5 – –
Fair value hierarchyThe group uses the following hierarchy for determining and disclosing the fair value of fi nancial instruments by valuation technique:
Level 1: quoted prices in active markets for identical assets or liabilities;
Level 2: other techniques for which all inputs which have a signifi cant effect on the recorded fair value are observable either directly or indirectly;
Level 3: techniques which use inputs which have a signifi cant effect on the recorded fair value that are not based on observable market data.
All fi nancial instruments valued at fair value held by the group as at December 31, 2010 and December 31, 2009 fall under the level 2 category.
The fair value of the borrowings has been calculated by discounting the expected future cash fl ows at prevailing interest rates except for the listed Eurobonds for which the quoted market price has been used. The fair value of foreign currency contracts is calculated by reference to current forward exchange rates for contracts with similar maturity profi les. The fair value of the interest rate swap contracts is determined by reference to market values for similar instruments.
All interest-bearing loans and borrowings are at amortised cost.
Note 21 – Financial risk management objectives and policiesThe group’s fi nancial instruments, other than derivatives, comprise a syndicated loan, Eurobonds, German Bonds, European Investment Bank loan, U.S.-dollar borrowings under a Private Placement issue, euro-denominated commercial papers, drawings under COFACE for specifi ed satellites under construction, uncommitted loans with banks, cash and short-term deposits. The main purpose of these fi nancial instruments is to raise cash to fi nance the group’s day-to-day operations. The group has various other fi nancial assets and liabilities such as trade receivables and trade payables, which arise directly from its operations.
The group also enters into derivative transactions, principally interest rate and forward currency contracts, in order to manage the interest rate and exchange rate exposure on the group’s assets, liabilities and fi nance operations.
The main risks arising from the group’s fi nancial instruments are liquidity risks, foreign currency risks, interest rate risks and credit risks. The general policies are reviewed and approved by the board, and are summarised below.
The risks are managed on a weekly basis through a review of the risks and hedges in place. This review includes a market update and forecasting of interest and exchange rates which are important for the portfolio of the group. The risk analysis is reviewed on a quarterly basis by the Board of Directors.
The group’s accounting policies in relation to derivatives and other fi nancial instruments are set out in Note 2.
Liquidity riskThe group’s objective is to effi ciently use cash generated so as to maintain short-term debt and bank loans at a low level. In case of liquidity needs, the group can call on uncommitted loans and a syndicated loan. In addition, if deemed appropriate based on prevailing market conditions, the group can access additional funds through the European Medium Term Note or commercial paper programme. The group’s debt maturity profi le is tailored to allow the company to cover repayment obligations as they fall due.
Consolidated fi nancial statementsNotes to the consolidated fi nancial statements continuedDecember 31, 2010

57SES Annual Report 2010
The group operates a centralised treasury function which manages the liquidity of the group in order to optimise the funding costs. This is supported by a daily cash pooling mechanism.
Liquidity is monitored on a daily basis through a review of the drawn and issued amounts and the availability of additional funding under credit lines or the commercial paper programme (EUR 2,845.0 million as at December 31, 2010, excluding COFACE, more details in Note 25). In addition the liquidity risk is analysed weekly.
The table below summarises the projected contractual undiscounted cash fl ows based on the maturity profi le of the group’s interest-bearing loans and borrowings as at December 31, 2010. The interest assumption for all fl oating debts is based on the interest rate of the last drawing.
Within Between After 1 year 1 and 5 years 5 years Total EUR million EUR million EUR million EUR million
Maturity profi le:As at December 31, 2010 1,273.4 2,567.5 1,051.7 4,892.6As at December 31, 2009 547.7 3,572.4 409.9 4,530.0
Foreign currency riskThe group’s balance sheet can be impacted by movements in the U.S. dollar / euro exchange rate as the group has signifi cant operations whose functional currency is the U.S. dollar and liabilities denominated in U.S. dollar. To mitigate this exposure the group could enter into forward foreign exchange contracts to hedge the exposure on fi nancial debt or on the net assets. Currently no hedge derivatives are in place to cover this currency exposure.
The group also has a corresponding exposure in the Income Statement. Approximately 43.5% (2009: 42.7%) of the group’s sales and 39.2% (2009: 39.4%) of the group’s operating expenses are denominated in U.S. dollars. The group does not enter into any hedging derivatives to cover this currency exposure.
The group uses forward currency contracts to eliminate or reduce the currency exposure on single deals, such as satellite procurements, tailoring the maturities to each milestone payment. The foreign currency risk might be in EUR or USD. The forward contracts are in the same currency as the hedged item and can cover up to 100% of the total value of the contract. It is the group’s policy not to enter into forward contracts until a fi rm commitment is in place, and to match the terms of the hedge derivatives to those of the hedged item to maximise effectiveness.
Cash fl ow hedges in relation to contracted commitments for capital expenditureAt December 31, 2010 and 2009, the group held forward exchange contracts designated as hedges of future contracted commitments to suppliers relating to satellite procurements.
The cash fl ow hedges were assessed to be highly effective and a net unrealised gain of EUR 1.2 million (2009: unrealised loss of EUR 1.1 million) net of deferred tax of EUR 0.4 million (2009: EUR 0.0 million) relating to the hedging instruments is included in equity. During the year 2010, EUR 4.7 million (2009: EUR 2.8 million) was removed from equity and included in the initial carrying value of the acquired satellites. As at December 31, 2010 the fair value of the contracts amounted to a liability of EUR 0.9 million and an asset of EUR 2.5 million (2009: a liability of EUR 1.1 million).
Set out below are the periods when the cash fl ows in USD and EUR for the capital expenditure programme are expected to occur.
The USD portfolio was not hedged in 2009 and 2010 as all U.S. dollar procurements are currently located in entities which have the U.S. dollar as their functional currency.
Within Between After 1 year 1 and 5 years 5 years TotalEUR portfolio EUR million EUR million EUR million EUR million
As at December 31, 2010:Cash outfl ows for procurement 236.5 285.4 – 521.9Amount covered by cash fl ow hedges 73.1 45.2 – 118.3
As at December 31, 2009:Cash outfl ows for procurement 308.9 418.4 – 727.3Amount covered by cash fl ow hedges 44.0 – – 44.0
Hedge of investment in foreign operationsIn October 2009 certain group borrowings and derivative instruments were designated as a hedge of the net investments in SES WORLD SKIES, SES Satellite Leasing and SES Re International (Bermuda) to hedge the group’s exposure to foreign exchange risk on these investments. As at December 31, 2009, the net investment hedges were assessed to be highly effective and an unrealised loss of EUR 60.4 million net of deferred tax of EUR 12.2 million relating to the hedging instruments is included in equity.

58 SES Annual Report 2010
In January 2010 all foreign currency contracts were closed, however certain USD group borrowings remained designated as a hedge of the net investments in SES AMERICOM, SES NEW SKIES, and SES Re International (Bermuda).
December 31, 2010 December 31, 2009 USD million USD million
USD balance sheet exposure:SES WORLD SKIES 6,811.1 6,902.6SES Satellite Leasing 1,112.2 977.0SES Re International (Bermuda) 58.8 28.4Total 7,982.1 7,908.0Hedged with:Foreign exchange forward contracts – 2,700.0Private Placement 771.4 828.6External borrowings 240.0 241.7Total 1,011.4 3,770.3
Hedged proportion 13% 48%
December 31, 2010 USD million
6,811.1 1,112.2
58.8 7,982.1
– –771.4 4240.0
1,011.4 4
13%
The following table demonstrates the sensitivity to a reasonably possible change in the U.S. dollar exchange rate on the nominal amount of the group’s U.S. dollar net investment, with all other variables held constant.
Amount Amount in euro at Amount in euro at Amount in euro at in closing rate of 1.3362 rate of 1.68 rate of 1.05December 31 2010 USD million EUR million EUR million EUR million
USD balance sheet exposure:SES WORLD SKIES 6,811.1 5,097.3 4,054.2 6,486.7SES Satellite Leasing 1,112.2 832.4 662.0 1,059.3SES Re International (Bermuda) 58.8 44.0 35.0 56.0Total 7,982.1 5,973.7 4,751.2 7,602.0Hedged with:Foreign exchange forward contracts – – – –Private Placement 771.4 577.3 459.2 734.7External borrowings 240.0 179.6 142.9 228.6Total 1,011.4 756.9 602.1 963.3
Absolute difference without hedging (1,222.5) 1,628.3Absolute difference with hedging (1,067.7) 1,421.9
Cash fl ow hedges in relation to U.S. dollar denominated borrowingsIn October 2009 the designation of the hedging of the U.S. dollar denominated borrowings was revoked. The U.S. dollar borrowings were used as natural hedge for the net investment portfolio.
Within Between After 1 year 1 and 5 years 5 years TotalUSD portfolio USD million USD million USD million USD million
As at December 31, 2010:USD debt exposure:External borrowings 240.0 – – 240.0Private Placement 159.7 611.7 – 771.4Total 399.7 611.7 – 1,011.4
Hedged with:Foreign exchange forward contracts – – – –Hedged proportion 0%
As at December 31, 2009:USD debt exposure:External borrowings 241.7 – – 241.7Private Placement 57.1 581.8 189.6 828.5Total 298.8 581.8 189.6 1,070.2
Hedged with:Foreign exchange forward contracts – – – –Hedged proportion 0%
Consolidated fi nancial statementsNotes to the consolidated fi nancial statements continuedDecember 31, 2010

59SES Annual Report 2010
Interest rate riskThe group’s exposure to risk of changes in market interest rates relates primarily to the group’s fl oating rate borrowings. The group carefully monitors and adjusts the mix between fi xed and fl oating rate debt from time to time following market conditions. Interest rate swaps are used to manage the interest rate risk. The terms of the hedge derivatives are negotiated to match the terms of the hedged item to maximise hedge effectiveness.
The table below summarises the split of the nominal amount of the group’s debt between fi xed and fl oating rate.
At fi xed At fl oating rates rates Total EUR million EUR million EUR million
Excluding the impact of interest rate swaps:Borrowings at December 31, 2010 3,591.3 544.5 4,135.8Borrowings at December 31, 2009 2,943.2 942.8 3,886.0Including the impact of interest rate swaps:Borrowings at December 31, 2010 3,770.9 364.9 4,135.8Borrowings at December 31, 2009 3,559.8 326.2 3,886.0
During the year 2010 the group repaid the fl oating EUR 100.0 million rate note issued under the EMTN Programme (2009: EUR 300.0 million Eurobond) and two tranches of the U.S. Private Placement – USD 57.1 million and GBP 4.0 million (2009: USD 57.1 million and GBP 4.0 million), which is a fi xed rate obligation. In March 2010 the group issued a fi xed EUR 650.0 million Eurobond. Furthermore, in April 2010 SES started drawing fl oating rate loans under the COFACE facility.
Fair value hedgesThe group had no fair value hedges in place, neither in 2009 nor in 2010.
Cash fl ow hedges in relation to interest commitments under several drawingsAt December 31, 2010 the group had no EUR interest rate swaps outstanding. The four outstanding EUR interest rate swaps at December 2009 matured in May and October 2010.
At December 31, 2010, as in 2009, the group held four USD interest rate swaps, which were designated as hedges of expected future interest expenses on USD 240.0 million of the bilateral multi-currency facilities in 2009 and USD 240.0 million of uncommitted fl oating rate loans in 2010.
The cash fl ow hedges of the expected future interest expense arising in 2010 were assessed to be highly effective and as at December 31, 2010 a net unrealised loss of EUR 13.2 million (2009: a net unrealised loss of EUR 14.6 million), stated net of deferred tax of EUR 3.9 million (2009: EUR 6.1 million), is included in equity in respect of these hedge instruments. The ineffective portion of this hedging relationship on December 31, 2009 and December, 31, 2010 was nil.
Set out below are the periods when the cash fl ows for the following interest rate payments are expected to occur in 2011:
Within Between After Bilateral multi-currency facility (EUR drawings) 1 year 1 and 5 years 5 years TotalSyndicated loan 2015, and bilateral 2010 issued under EMTN EUR million EUR million EUR million EUR million
As at December 31, 2010:Cash outfl ows for interest payments (fl oating) – – – –Cash infl ows from interest rate swap (fl oating) – – – –Cash outfl ows from interest rate swap (fi xed) – – – –Total – – – –
As at December 31, 2009:Cash outfl ows for interest payments (fl oating) (14.2) (25.2) – (39.4)Cash infl ows from interest rate swap (fl oating) 3.3 – – 3.3Cash outfl ows from interest rate swap (fi xed) (12.8) – – (12.8)Total (23.7) (25.2) – (48.9)
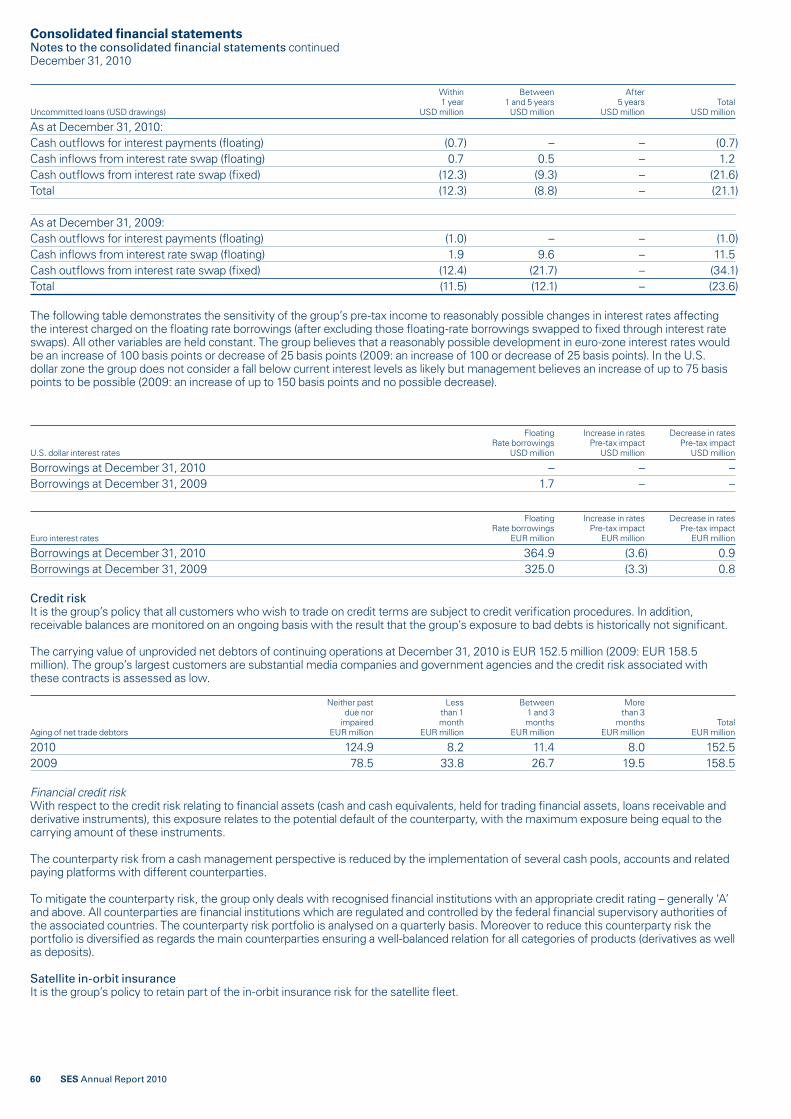
60 SES Annual Report 2010
Within Between After 1 year 1 and 5 years 5 years TotalUncommitted loans (USD drawings) USD million USD million USD million USD million
As at December 31, 2010:Cash outfl ows for interest payments (fl oating) (0.7) – – (0.7)Cash infl ows from interest rate swap (fl oating) 0.7 0.5 – 1.2Cash outfl ows from interest rate swap (fi xed) (12.3) (9.3) – (21.6)Total (12.3) (8.8) – (21.1)
As at December 31, 2009:Cash outfl ows for interest payments (fl oating) (1.0) – – (1.0)Cash infl ows from interest rate swap (fl oating) 1.9 9.6 – 11.5Cash outfl ows from interest rate swap (fi xed) (12.4) (21.7) – (34.1)Total (11.5) (12.1) – (23.6)
The following table demonstrates the sensitivity of the group’s pre-tax income to reasonably possible changes in interest rates affecting the interest charged on the fl oating rate borrowings (after excluding those fl oating-rate borrowings swapped to fi xed through interest rate swaps). All other variables are held constant. The group believes that a reasonably possible development in euro-zone interest rates would be an increase of 100 basis points or decrease of 25 basis points (2009: an increase of 100 or decrease of 25 basis points). In the U.S. dollar zone the group does not consider a fall below current interest levels as likely but management believes an increase of up to 75 basis points to be possible (2009: an increase of up to 150 basis points and no possible decrease).
Floating Increase in rates Decrease in rates Rate borrowings Pre-tax impact Pre-tax impactU.S. dollar interest rates USD million USD million USD million
Borrowings at December 31, 2010 – – –Borrowings at December 31, 2009 1.7 – –
Floating Increase in rates Decrease in rates Rate borrowings Pre-tax impact Pre-tax impactEuro interest rates EUR million EUR million EUR million
Borrowings at December 31, 2010 364.9 (3.6) 0.9Borrowings at December 31, 2009 325.0 (3.3) 0.8
Credit riskIt is the group’s policy that all customers who wish to trade on credit terms are subject to credit verifi cation procedures. In addition, receivable balances are monitored on an ongoing basis with the result that the group’s exposure to bad debts is historically not signifi cant.
The carrying value of unprovided net debtors of continuing operations at December 31, 2010 is EUR 152.5 million (2009: EUR 158.5 million). The group’s largest customers are substantial media companies and government agencies and the credit risk associated with these contracts is assessed as low.
Neither past Less Between More due nor than 1 1 and 3 than 3 impaired month months months TotalAging of net trade debtors EUR million EUR million EUR million EUR million EUR million
2010 124.9 8.2 11.4 8.0 152.52009 78.5 33.8 26.7 19.5 158.5
Financial credit riskWith respect to the credit risk relating to fi nancial assets (cash and cash equivalents, held for trading fi nancial assets, loans receivable and derivative instruments), this exposure relates to the potential default of the counterparty, with the maximum exposure being equal to the carrying amount of these instruments.
The counterparty risk from a cash management perspective is reduced by the implementation of several cash pools, accounts and related paying platforms with different counterparties.
To mitigate the counterparty risk, the group only deals with recognised fi nancial institutions with an appropriate credit rating – generally ‘A’ and above. All counterparties are fi nancial institutions which are regulated and controlled by the federal fi nancial supervisory authorities of the associated countries. The counterparty risk portfolio is analysed on a quarterly basis. Moreover to reduce this counterparty risk the portfolio is diversifi ed as regards the main counterparties ensuring a well-balanced relation for all categories of products (derivatives as well as deposits).
Satellite in-orbit insuranceIt is the group’s policy to retain part of the in-orbit insurance risk for the satellite fl eet.
Consolidated fi nancial statementsNotes to the consolidated fi nancial statements continuedDecember 31, 2010

61SES Annual Report 2010
Capital management The group’s policy is to attain, and retain, a stable BBB rating with Standard & Poors and Fitch, and a Baa2 rating with Moody’s. This investment grade rating serves to maintain investors, creditors, rating agency and market confi dence. Within this framework, the group manages its capital structure and liquidity in order to refl ect changes in economic conditions to keep its cost of debt low, maintain the confi dence of debt investors at a high level and to create added value for the shareholder.
Note 22 – Cash and cash equivalents 2010 2009 EUR million EUR million
Cash at bank and in hand 211.4 242.0Short-term deposits 109.6 44.6Cash and cash equivalents from continuing operations 321.0 286.6Cash at bank and in hand attributable to discontinued operations 2.7 –Total cash and cash equivalents 323.7 286.6
2010 EUR million
211.4 4109.6 321.0
2.7 323.7
Cash at banks earns interest at fl oating rates based on daily bank deposit rates. Short-term deposits are made for varying periods of between one day and three months depending on the immediate cash requirements of the group, and earn interest at the respective short-term deposit rates.
Note 23 – Issued capital and reservesThe company has share capital of EUR 624.4 million (2009: EUR 624.4 million), represented by Class A and Class B shares with no par value. The movement between the opening and closing number of shares issued per class of share can be summarised as follows:
Class A Class B Total shares shares shares
As at January 1, 2010 332,985,130 166,492,565 499,477,695Cancellation of A and B shares – – –As at December 31, 2010 332,985,130 166,492,565 499,477,695
FDRs with respect to Class A shares are listed on the Luxembourg Stock Exchange and on Euronext Paris. They can be traded freely and are convertible into Class A shares at any time at the option of the holder under the conditions applicable in the company’s articles of association and in accordance with the terms of the FDRs.
All Class B shares are currently held by the State of Luxembourg, or by Luxembourg public institutions. Dividends paid for one share of Class B equal 40% of the dividend for one share of Class A.
A shareholder or a potential shareholder who envisages to acquire by whatever means, directly or indirectly, more than 20%, 33% or 50% of the shares of the company (a ‘Demanding Party’) must inform the chairperson of the board of the company of such intention. The chairperson of the board shall forthwith inform the government of the Grand Duchy of Luxembourg of the envisaged acquisition which may be opposed by the government within three months from such information should the government determine that such acquisition would be against the general public interest. In case of no opposition from the government, the board shall convene an extraordinary meeting of shareholders which may decide at a majority provided for in article 67-1 of the law of 10 August 1915, as amended, regarding commercial companies, to authorise the Demanding Party to acquire more than 20%, 33% or 50% of the shares. If the Demanding Party is a shareholder of the company, it may attend the general meeting and will be included in the count for the quorum but may not take part in the vote.
SES has, in agreement with the shareholders, purchased Fiduciary Deposit Receipts in respect of ‘A’ shares for use in connection with executives’ and employees’ option schemes as well as for cancellation. At the year-end, the company held FDRs in connection with the above schemes as set out below. These FDRs are disclosed as treasury shares in the balance sheet and are carried at their historic cost to the group.
2010 2009
FDRs held as at December 31 4,254,011 7,928,510Carrying value of FDRs held (EUR million) 55.8 98.5
2010
4,254,011 55.8
In accordance with Luxembourg legal requirements, a minimum of 5% of the yearly net profi t (statutory) is transferred to a legal reserve from which a distribution is restricted. This requirement is satisfi ed when the reserve reaches 10% of the issued share capital. As at December 31, 2010 an amount of EUR 62.4 million (2009: EUR 62.4 million) is included within other reserves. Other reserves include a further undistributable amount of EUR 385.7 million (2009: EUR 363.5 million) linked to local tax legislation in Luxembourg (Net worth tax).

62 SES Annual Report 2010
Consolidated fi nancial statementsNotes to the consolidated fi nancial statements continuedDecember 31, 2010
Note 24 – Share-based payment plansThe group has four share-based payment plans, the details of which are as follows. In the case of schemes 2, 3 and 4 the relevant strike price is defi ned as the average of the market price of the underlying shares at the time of the grant.
1. IPO planThe IPO plan is an equity-settled scheme which was open to members of staff working for SES ASTRA S.A. at the time of its IPO on the Luxembourg Stock Exchange in 1998. Employees were granted options to acquire shares at a fi xed price of EUR 12.64. In 2005, the exercise period of this plan was extended to June 30, 2013. All such options were vested as at December 31, 2005.
2010 2009
Outstanding options at the end of the year 628,641 961,241Weighted average exercise price in EUR 12.64 12.64
2010
628,641 12.64 4
2. The Stock Appreciation Rights Plan (‘STAR Plan’)The STAR Plan, initiated in 2000, is a scheme available to non-executive staff of controlled group subsidiaries. Under the plan employees are granted rights to receive remuneration payments refl ecting the movement of the share price in relation to the strike price. A third of the STAR Plan rights vest each year over a three-year period and the rights have a two-year exercise period once fully vested.
Until 2005 the STAR Plan was structured as a cash-settled scheme. The 2005 STAR Plan expired on June 1, 2010 and therefore there are no outstanding cash-settled options outstanding as of December 31, 2010.
2010 2009
Outstanding options at the end of the year – 185,615Weighted average exercise price in EUR – 10.64
2010
– –– –
In 2006 the STAR Plan was converted into an equity-settled scheme. The options granted since 2006, and not exercised, are set out below:
2010 2009
Outstanding options at the end of the year 3,177,700 3,007,608Weighted average exercise price in EUR 15.20 14.12
2010
3,177,700 15.20
3. Executive Incentive Compensation Plan (‘EICP’)The EICP, initiated in 2002, is available to group executives. Under the plan, options are granted with an effective date of January 1. One quarter of the entitlement vests on each anniversary date of the original grant. Once vested, the options can be exercised until the tenth anniversary of the original grant.
2010 2009
Outstanding options at the end of the year 5,778,291 7,460,008Weighted average exercise price in EUR 14.41 13.02
2010
5,778,291 14.41
4. Long-term Incentive programme (‘LTI’)The LTI programme, initiated in 2005, is also a programme for executives and senior executives of the group. Under the scheme, until end of 2008, restricted shares were allocated to executives on July 1 and these vest on the third anniversary of the grant. Senior executives also had the possibility to be allocated performance shares whose granting was dependent on the achievement of defi ned performance criteria. Where these criteria were met, the shares vested on the third anniversary of the original grant. Since January 1, 2009, both executives and senior executives are granted restricted and performance shares.
2010 2009
Restricted and performance shares granted at the end of the year 1,291,501 1,064,315Weighted average fair value in EUR 13.12 12.74
2010
1,291,501 13.12
The fair value of equity-settled share options granted is estimated as at the date of grant using a binomial model, taking into account the terms and conditions upon which the options were granted. The following table lists the average value of inputs to the model used for the years ended December 31, 2010, and December 31, 2009.
2009 EICP STARs LTI
Dividend yield (%) 6.03% 6.18% 4.56%Expected volatility (%) 33.13% 33.20% 37.12%Risk-free interest rate (%) 2.51% 2.81% 1.94%Expected life of options (years) 9.66 5 3Share price at inception (EUR) 13.99 13.71 13.42

63SES Annual Report 2010
2010 EICP STARs LTI
Dividend yield (%) 5.16% 5.76% 4.66%Expected volatility (%) 35.68% 36.30% 42.18%Risk-free interest rate (%) 2.27% 1.76% 1.02%Expected life of options (years) 9.75 5 3Share price at inception (EUR) 18.55 16.95 17.20
The expected life of options is based on historical data and is not necessarily indicative of exercise patterns that may occur. The expected volatility refl ects the assumption that the historical volatility is indicative of future trends, which may or may not necessarily be the actual outcome.
The last cash-settled options expired in June 2010 such that the company now only has equity-settled options in place. Up to this time, the fair value of the cash-settled options is measured at the grant date using a binomial model which takes into account the terms and conditions upon which the instruments were granted. The services received, and a liability to pay for those services, are recognised over the expected vesting period. Until the liability is settled it is remeasured at each reporting date with changes in fair value recognised in the income statement.
The carrying amount of the liability relating to the cash-settled options at December 31, 2010 is EUR 0.0 million (2009: EUR 0.8 million). The total charge for the period for share-based compensation payments amounted to EUR 11.4 million (2009: EUR 5.8 million).
Note 25 – Interest-bearing loans and borrowingsAs at December 31, 2010 and 2009, the group’s interest-bearing loans and borrowings were:
Carried at amortised cost
Amounts Amounts outstanding outstanding 2010 2009 Effective interest rate Maturity EUR million EUR million
Non-currentU.S. Private Placement
Series A (USD 400 million) 5.74% September 2013 83.5 117.4Series B (USD 513 million) 5.82% September 2015 307.1 356.1Series C (USD 87 million) 5.63% September 2015 65.1 60.4Series D (GBP 28 million) 5.63% September 2013 9.3 13.5
Euro Private Placement 2016 (EUR 150 million)issued under EMTN 5.05% August 2016 148.8 148.6Eurobond 2020 (EUR 650 million) 4.625% March 2020 643.3 –Eurobond 2014 (EUR 650 million) 4.875% July 2014 645.0 643.0Eurobond 2013 (EUR 500 million) 4.375% October 2013 500.0 500.0Eurobond 2011 (EUR 650 million) 4.00% March 2011 – 649.1European Investment Bank (EUR 200 million) 3.618% May 2017 199.9 200.0German bond (EUR 100 million), non-listed 5.75% November 2012 99.8 99.5German bond (EUR 100 million), non-listed 6.00% November 2012 99.7 99.4Syndicated loan 2015 EURIBOR + 0.95% April 2015 97.2 594.6COFACE EURIBOR + 1.7% 2022 97.2 – 2,995.9 3,481.6CurrentU.S. Private Placement
Series A (USD 400 million) 5.74% September 2011 42.8 39.6Series B (USD 513 million) 5.82% September 2011 76.8 –Series D (GBP 28 million) 5.63% September 2011 4.6 4.5
Bilateral multi-currency credit facilities EURIBOR/LIBOR + 0.275% April 2010 – 91.4Bilateral (EUR 100 million) issued under EMTN EURIBOR + 0.6% October 2010 – 100.0Eurobond 2011 (EUR 650 million) 4.00% March 2011 649.8 –Commercial paper 0.943% February 2011 135.0 55.0Committed loans 2.123% February 2010 – 48.6Uncommitted loans 1.117% February 2011 179.6 27.8 1,088.6 366.9

64 SES Annual Report 2010
Consolidated fi nancial statementsNotes to the consolidated fi nancial statements continuedDecember 31, 2010
U.S. Private PlacementOn September 30, 2003, the group issued in the U.S. Private Placement market four series of unsecured notes amounting to USD 1,000.0 million and GBP 28.0 million. These notes comprised:
1. Series A USD 400.0 million of 5.29% Senior Notes due September 2013, amortising as of September 2007.2. Series B USD 513.0 million of 5.83% Senior Notes due September 2015, amortising as of September 2011.3. Series C USD 87.0 million of 5.93% Senior Notes due September 2015.4. Series D GBP 28.0 million of 5.63% Senior Notes due September 2013, amortising as of September 2007.
On these four series, the group pays interest semi-annually. SES is committed under the U.S. Private Placement to maintaining covenants requiring certain fi nancial ratios to be upheld within agreed limits in order to provide suffi cient security to the lenders. Of these, the covenant which management monitors the most actively is the requirement to maintain the net debt/EBITDA ratio at a level of 3.5 or below.
European Medium-Term Note Programme (EMTN)On December 6, 2005, SES put in place a EUR 2,000.0 million EMTN enabling SES, or SES GLOBAL-Americas Holdings GP, to issue as and when required notes up to a maximum aggregate amount of EUR 2,000.0 million. In May 2007, this programme was increased to an aggregate amount of EUR 4,000.0 million. On September 24, 2010 this programme has been extended for one further year.
As of December 31, 2010, SES has issued EUR 2,600.0 million (2009: EUR 2,050.0 million) under the EMTN Programme with maturities ranging from 2011 – 2020.
EUR 150.0 million Private Placement (2016)On July 13, 2009, SES issued a EUR 150.0 million Private Placement under the company’s European Medium-Term Note Programme with Deutsche Bank. The Private Placement has a 7-year maturity, beginning August 5, 2009, and bears interest at a fi xed rate of 5.05%.
EUR 650.0 million Eurobond (2020) issueOn March 9, 2010, SES issued a EUR 650.0 million bond under the company’s European Medium-Term Note Programme. The bond has a 10-year maturity and bears interest at a fi xed rate of 4.625%.
EUR 650.0 million Eurobond (2014)On July 9, 2009 (pricing June 30, 2009), SES issued a Euro 650.0 million bond under the company’s European Medium-Term Note Programme. The bond has a 5-year maturity and bears interest at a fi xed rate of 4.875%.
EUR 500.0 million Eurobond (2013)On October 20, 2006, SES issued a Euro 500.0 million bond under the company’s European Medium-Term Note Programme. The bond has a 7-year maturity and bears interest at a fi xed rate of 4.375%.
EUR 650.0 million Eurobond (2011)On March 15, 2006, SES issued a Euro 650.0 million bond under the company’s European Medium-Term Note Programme. The bond has a 5-year maturity and bears interest at a fi xed rate of 4.0%.
EUR 300.0 million Eurobond (2009) repayment On October 20, 2006, SES issued a Floating Rate Note for a nominal amount of EUR 300.0 million with a fl oating coupon of 3-month-EURIBOR plus a margin of 0.25%. It was settled at its maturity date October 20, 2009.
Bilateral EUR 100 million (2010), repaymentOn October 20, 2008, the company issued a fl oating rate note for general refi nancing purposes for a nominal amount of EUR 100 million with a fl oating rate of 3-month EURIBOR plus a margin of 0.6%. The note was repaid at its maturity date October 20, 2010.
EUR 200.0 million European Investment Bank fundingOn April 21, 2009, SES signed a fi nancing agreement with the European Investment Bank concerning the investment by the group in certain satellite investment projects. This facility, bearing interest at a fi xed rate of 3.618%, is repayable in six annual instalments between May 2012 and May 2017.
German Bond issue of EUR 200.0 millionOn May 21, 2008, the group also concluded an agreement to issue EUR 200 million in two equal tranches in the German Bond (‘Schuldschein’) market. The agreement for the fi rst tranche was signed on May 30, 2008 with the funds being drawn down in June 2008, and bearing interest at fi xed rate of 5.75%. The agreement for the second tranche was signed on July 14, 2008 with the funds being drawn down in July 2008 and bearing interest at fi xed rate of 6.0%. Both German bonds mature in November 2012.
Syndicated loan 2015 In April 2009 SES signed a syndicated loan facility maturing in 2012 with a consortium of 24 banks. On September 2010, the syndicated loan has been amended and restated. The amended facility, maturing April 2015, is for EUR 1,200.0 million and can be drawn in EUR and USD.
The interest rate is based on EURIBOR or U.S. LIBOR, depending on the drawing currency, plus a margin based on the rating of the company. The current rating of the company is BBB/Baa2 (S&P/Moody’s) leading to a margin of 0.95%.

65SES Annual Report 2010
EUR 522.9 million COFACE facilityOn December 16, 2009, SES signed a fi nancing agreement with COFACE (Compangnie Française d ‘Assurance pour le Commerce Extérieur) in respect of the investment in four geostationary satellites (ASTRA 2E, ASTRA 2F, ASTRA 2G, ASTRA 5B). The facility is divided into fi ve loans. The drawings under the loans are based on invoices from the supplier of the satellites. The fi rst drawing was done on April 23, 2010. Each loan will be repaid in 17 equal semi-annual instalments starting the earlier of the in-orbit date of the satellite being fi nanced by such loan and April 1, 2014 and the estimated fi nal maturity of the facility will be by the end of 2022. The facility bears interest at a fl oating rate of six month EURIBOR plus a margin of 1.7%.
Bilateral multi-currency facilities repaymentOn December 31, 2009, SES had unsecured bilateral multi-currency revolving credit facilities in place with one bank for a total of EUR 100.0 million of which EUR 91.4 million was drawn as at year-end. These bilateral facilities were available to both SES and SES GLOBAL-Americas Holdings GP. The margin was 2.75% LIBOR or EURIBOR depending on the drawdown maturity and currency. The outstanding bilateral multi-currency facility was settled at its fi nal maturity date April 7, 2010.
Commercial paper programmeOn October 25, 2005, SES put in place a EUR 500.0 million ‘Programme de Titres de Créances Négociables’ in the French market where the company issued ‘Billets de Trésorerie’ (commercial paper) in accordance with articles L.213-1 to L213-4 of the French Monetary and Financial Code and decree n°92.137 of February 13, 1992 and all subsequent regulations. The maximum outstanding amount of ‘Billet de Trésorerie’ issuable under the programme is EUR 500.0 million or its counter value at the date of issue in any other authorised currencies. On June 7, 2010, this programme was extended for one further year. As of December 31, 2010 borrowings of EUR 135.0 million (2009: EUR 55.0 million) were outstanding under this programme. The average rate of the outstanding commercial paper amounts to 0.943% (2009: 0.605%).
Note 26 – Provisions and deferred income Provisions Deferred income Total EUR million EUR million EUR million
As at January 1, 2010 65.3 246.0 311.3Increase in provisions 59.6 – 59.6Decrease in provisions (27.6) – (27.6)Movement on deferred income – (13.1) (13.1)Discontinued operations (18.0) (24.4) (42.4)Impact of currency translation 2.3 7.9 10.2As at December 31, 2010 81.6 216.4 298.0
Provisions Deferred income Total EUR million EUR million EUR million
As at January 1, 2009 65.1 279.3 344.4Increase in provisions 23.6 – 23.6Decrease in provisions (22.2) – (22.2)Movement on deferred income – (29.2) (29.2)Impact of currency translation (1.2) (4.1) (5.3)As at December 31, 2009 65.3 246.0 311.3
Provisions relate primarily to liabilities arising for withholding taxes, for post-retirement benefi t schemes and other items arising in the normal course of business.
In U.S. operations, certain employees benefi t from a post-retirement health benefi ts programme which is externally insured. As at December 31, 2010, accrued premiums of EUR 8.9 million (2009: EUR 8.7 million) are included in this position.
Contributions made in 2010 to group pension schemes totalled EUR 8.3 million (2009: EUR 7.3 million), which are recorded in the income statement under ‘staff costs’.

66 SES Annual Report 2010
Note 27 – Trade and other payables 2010 2009 EUR million EUR million
Trade creditors 58.1 93.9Payments received in advance 61.9 61.6Interest on loans 81.3 62.7Personnel-related liabilities 25.4 23.9Tax liabilities other than for income tax 5.3 5.4Other liabilities 116.9 98.1Total 348.9 345.6
2010 EUR million
58.1 61.9 81.3 25.4 45.3
116.9 348.9
In the framework of receivables securitisation transaction completed in June 2010, the group received a net cash amount of EUR 50.6 million from a fi nancial institution as advance settlement of future receivables arising between 2011 and 2013 under contracts with a specifi c customer. A corresponding liability of EUR 52.8 million, representing SES’ obligation towards the fi nancial institution to continue to provide services to the customer in accordance with the terms of the customer contract, is recorded in the Statement of Financial Position as at December 31, 2010 under ‘Other long-term liabilities’, for EUR 36.2 million, and ‘Trade and other payables’ for EUR 16.6 million.
Note 28 – Commitments and contingenciesCapital commitments The group had outstanding commitments in respect of contracted capital expenditure totalling EUR 820.4 million at December 31, 2010 (2009: EUR 1,122.5 million). These commitments largely refl ect the purchase and launch of future satellites for the expansion and replacement of the group satellite system, together with the necessary expansion of the associated ground station and control facilities. In the case of termination by the group of these contracts, contractual penalty provisions apply.
Operating lease commitmentsFuture minimum rentals payable under non-cancellable operating leases are as follows as at December 31:
2010 2009 EUR million EUR million
Within one year 9.0 9.7After one year but not more than fi ve years 23.5 20.8More than fi ve years 3.4 6.3Total 35.9 36.8
2010 EUR million
9.0 23.5
3.4 435.9
Commitments under transponder service agreements The group has entered into transponder service agreements for the purchase of satellite capacity from third parties under contracts with a maximum life of eight years. The commitment arising under these agreements as at December 31 is as follows:
2010 2009 EUR million EUR million
Within one year 43.7 59.2After one year but not more than fi ve years 61.5 106.2After more than fi ve years 2.0 2.0Total 107.2 167.4
2010 EUR million
43.7 61.5 2.0
107.2
Consolidated fi nancial statementsNotes to the consolidated fi nancial statements continuedDecember 31, 2010

67SES Annual Report 2010
Other commitments Under the O3b Networks Limited (‘O3b’) full fi nancing agreement, SES entered into commitments to provide, if needed in the pre-commercialisation phase, additional shareholder loans to O3b totalling USD 66 million. See Note 17.
LitigationSES is in dispute with the manufacturer of one of its satellites concerning the non-payment by SES of in-orbit incentive payments. SES believes that the payments are not due since the satellite is not operating as specifi ed. As the payment of the incentives is subject to delivery of a ‘successfully operating spacecraft’ complying with the original specifi cation and mission capabilities, SES is confi dent that its position will be upheld in the ongoing arbitration proceedings and has not provided for the EUR 14 million including accrued interests and legal fees, which is being claimed. There were no other signifi cant litigation claims against the group as of December 31, 2010.
GuaranteesOn December 31, 2010 the group had outstanding bank guarantees for an amount of EUR 16.2 million (2009: EUR 10.5 million). This relates mainly to a bank guarantee SES has towards ND SatCom for EUR 15.0 million (2009: nil) and to performance guarantees for services of satellite operations.
Restrictions on use of cashAt the year-end, there were no restricted cash balances (2009: nil).
Note 29 – Related partiesThe state of Luxembourg holds a direct 11.58% voting interest in the company and two indirect interests, both of 10.88%, through two state owned banks, Banque et Caisse d’Epargne de l’Etat and Société Nationale de Crédit et d’Investissement. These shares constitute the company’s Class B shares, which are described in more detail in Note 23.
The total payments to directors for attendance at board and committee meetings in 2010 amounted to EUR 1.3 million (2009: EUR 1.3 million). These payments are computed on a fi xed and variable basis, the variable part being based upon attendance at board and committee meetings.
There were no other signifi cant transactions with related parties.
The key management of the group, defi ned as the group’s Executive Committee, received compensation as follows:
2010 2009 EUR million EUR million
Remuneration including bonuses 4.2 4.1Pension benefi ts 0.5 0.5Share-based payments 6.6 1.4Other benefi ts 0.2 0.1Total 11.5 6.1
2010 EUR million
4.2 0.5 6.6 0.2
11.5
Total share-based payment instruments allocated to key management as at December 31, 2010 were 1,638,239 (2009: 1,614,155).
Note 30 – Events after the balance sheet dateSES-8 procurementOn February 16, 2011, SES entered into a contract with Orbital Sciences Corporation for the procurement of the SES-8 spacecraft. The satellite is scheduled for launch during the fi rst half of 2013, and will be positioned at 95o East, together with NSS-6, to support key strategic customers in West Asia, India and South-East Asia. The full programme costs of the SES-8 satellite, including launch and related services, is expected to be around EUR 160 million.

68 SES Annual Report 2010
Consolidated fi nancial statementsNotes to the consolidated fi nancial statements continuedDecember 31, 2010
Note 31 – Consolidated subsidiaries, joint ventures and affi liatesThe consolidated fi nancial statements include the fi nancial statements of the material subsidiaries, joint ventures and associates listed below:
Effective Effective interest (%) interest (%) Method of 2010 2009 consolidation
Held directly by SES:SES ASTRA S.A., Luxembourg 100.00 100.00 FullSES GLOBAL-Americas Inc., U.S.A. 100.00 100.00 FullSES GLOBAL Americas Holdings General Partnership, U.S.A. 100.00 100.00 FullSES GLOBAL-Americas Finance Inc., U.S.A. 100.00 100.00 FullSES GLOBAL Africa S.A., Luxembourg 100.00 100.00 FullSES Participations S.A., Luxembourg 100.00 100.00 FullSES GLOBAL Gibraltar Ltd, Gibraltar1 – 100.00 –SES Finance S.à r.l., Switzerland 100.00 100.00 FullSES Holdings (Netherlands) B.V., Netherlands 100.00 100.00 FullSES ASTRA Services Europe S.A., Luxembourg 100.00 100.00 FullSES Latin America S.A., Luxembourg 100.00 100.00 FullSES Belgium S.p.r.l, Belgium 100.00 100.00 Full
Held through SES Participations S.A., Luxembourg:Ciel Satellite Holdings Inc., Canada 100.00 100.00 FullCiel Satellite Limited Partnership, Canada 70.00 70.00 FullNorthern Americas Satellite Ventures, Inc., Canada 100.00 100.00 Full
Held through SES ASTRA Services Europe S.A., Luxembourg:Glocom (Communications and Images) Limited (Isle of Man) 75.00 75.00 FullSES ASTRA TechCom S.A., Luxembourg 100.00 100.00 FullSES ASTRA TechCom Belgium S.A., Belgium 100.00 100.00 FullAstralis S.A., Luxembourg 51.00 51.00 FullASTRA Broadband Services S.A., Luxembourg 100.00 100.00 FullSES Digital Distribution Services AG, Switzerland 100.00 100.00 FullSES Digital Distribution Services S.à r.l., Luxembourg 100.00 100.00 FullRedu Operations Services S.A., Belgium 48.00 48.00 EquityRedu Space Services S.A., Belgium 52.00 52.00 FullHD Plus GmbH, Germany (formerly entavio GmbH) 100.00 100.00 FullSES ASTRA Real Estate (Betzdorf) S.A. (formerly SES Capital Luxembourg S.A.), Luxembourg 100.00 100.00 FullSES Capital Belgium S.A., Belgium 100.00 100.00 FullND SatCom GmbH, Germany 100.00 100.00 FullND SatCom Defence GmbH, Germany 100.00 100.00 FullND SatCom Inc., U.S.A. 100.00 100.00 FullND SatCom Products GmbH, Germany 100.00 100.00 FullND Satcom FZE, (United Arab Emirates) 100.00 100.00 FullND SatCom Satellite Comm. Systems (Beijing) Co. Ltd, China 100.00 100.00 FullBosphocom Ltd, Turkey2 – 80.00 –ND SatCom Grintex Communications Ltd, India 25.00 25.00 EquityND SatCom o.o.o., Russia 100.00 100.00 FullMilsat Services GmbH, Germany 25.10 25.10 EquityASTRA Platform Services GmbH, Germany 100.00 100.00 Full5cast GmbH, Germany3 – 51.00 –SES Digital Distribution Services GmbH, Germany 100.00 100.00 FullVirtual Planet Group GmbH, Germany 90.00 90.00 Full
Effective interest (%)
2010
100.00 100.00 100.00 100.00 100.00 100.00
– –100.00 100.00 100.00 100.00 100.00
100.00 70.00
100.00
75.00 100.00 100.00
51.00 100.00 100.00 100.00 48.00 52.00
100.00
100.00 100.00 100.00 100.00 100.00 100.00 100.00 100.00
– –25.00
100.00 25.10
100.00 – –
100.00 90.00

69SES Annual Report 2010
Effective Effective interest (%) interest (%) Method of 2010 2009 consolidation
Held through SES ASTRA S.A.:ASTRA Deutschland GmbH, Germany 100.00 100.00 FullASTRA (UK) Ltd, United Kingdom 100.00 100.00 FullASTRA Iberica S.A., Spain 100.00 100.00 FullASTRA France S.A., France 100.00 100.00 FullASTRA (GB) Limited, United Kingdom 100.00 100.00 FullASTRA Benelux B.V., The Netherlands 100.00 100.00 FullSES ASTRA CEE Sp. z o.o, Poland 100.00 100.00 FullSES ASTRA Italia S.r.l. 100.00 – FullSES ENGINEERING (Luxembourg) S.à r.l., Luxembourg 100.00 100.00 FullNew Skies Investments S.à r.l, Luxembourg 100.00 100.00 FullSES ASTRA AB, Sweden4 100.00 90.00 FullSirius Satellite Services SIA, Latvia 100.00 100.00 FullSES SIRIUS Ukraine, Ukraine 100.00 100.00 FullSES ASTRA 1KR S.à r.l., Luxembourg 100.00 100.00 FullSES ASTRA 1L S.à r.l., Luxembourg 100.00 100.00 FullSES ASTRA 1M S.à r.l., Luxembourg 100.00 100.00 FullSES ASTRA 3B S.à r.l., Luxembourg 100.00 100.00 FullSES ASTRA 5B S.à r.l., Luxembourg 100.00 100.00 FullSES ASTRA 1N S.à r.l., Luxembourg 100.00 100.00 FullSolaris Mobile Limited, Ireland 50.00 50.00 ProportionalSES ASTRA 2E S.à r.l., Luxembourg 100.00 100.00 FullSES ASTRA 2F S.à r.l., Luxembourg 100.00 100.00 FullSES ASTRA 2G S.à r.l., Luxembourg 100.00 100.00 Full
Held through SES Finance S.à r.l.:SES Re International (Bermuda) Ltd., Bermuda 100.00 100.00 FullSES Satellite Leasing Ltd, Isle of Man 100.00 100.00 FullAl Maisan Satellite Communications (YahSat) LLC, UAE 35.00 – FullSES Satellites (Bermuda) Ltd, Bermuda5 100.00 – Full
Held through SES GLOBAL Africa S.A.:SES ASTRA Africa (Proprietary) Ltd, South Africa 100.00 100.00 FullODM (Proprietary) Ltd, South Africa 20.00 20.00 EquityAccelon Ltd, South Africa6 – 43.55 –
Held through SES GLOBAL-Americas Inc.:SES AMERICOM, Inc., U.S.A. 100.00 100.00 FullSES AMERICOM PAC, Inc., U.S.A. 100.00 100.00 FullWorldsat LLC, U.S.A.7 – 100.00 –Communications Satellite Int. Marketing Inc., Barbados8 100.00 100.00 FullSES AMERICOM International Holdings, Inc., U.S.A. 100.00 100.00 FullSES AMERICOM Canada, Inc., Canada 100.00 100.00 FullSES AMERICOM (Brazil) Holdings, LLC, U.S.A. 100.00 100.00 FullSES AMERICOM do Brasil Servicos de Telecomunicacoes, Ltda, Brazil 100.00 100.00 FullSES AMERICOM (Singapore) Pty, Ltd, Singapore 100.00 100.00 FullAMERICOM Government Services, Inc., U.S.A. 100.00 100.00 Full Sistemas Satelitales de Mexico S. de R.L. de C.V., Mexico 49.00 49.00 EquitySocios Aguila S.de R.L de C.V., Mexico 49.00 49.00 EquityColumbia Communications Corporation, U.S.A. 100.00 100.00 FullColumbia / WIGUSA Communications, Inc., U.S.A. 100.00 100.00 Full
Effective interest (%)
2010
100.00 100.00 100.00 100.00 100.00 100.00 100.00 100.00 100.00 100.00 100.00 100.00 100.00 100.00 100.00 100.00 100.00 100.00 100.00 50.00
100.00 100.00 100.00
100.00 100.00 35.00
100.00
100.00 20.00
– –
100.00 100.00
– –100.00 100.00 100.00 100.00 100.00 100.00 100.00 49.00 49.00
100.00 100.00

70 SES Annual Report 2010
Consolidated fi nancial statementsNotes to the consolidated fi nancial statements continuedDecember 31, 2010
Effective Effective interest (%) interest (%) Method of 2010 2009 consolidation
SES Satellites International, Inc., U.S.A. 100.00 100.00 FullSES Satellites (Gibraltar) Ltd, Gibraltar 100.00 100.00 FullSES AMERICOM Colorado, Inc., U.S.A. 100.00 100.00 FullAMC-1 Holdings LLC, U.S.A. 100.00 100.00 FullAMC-2 Holdings LLC, U.S.A. 100.00 100.00 FullAMC-3 Holdings LLC, U.S.A. 100.00 100.00 FullAMC-5 Holdings LLC, U.S.A. 100.00 100.00 FullAMC-6 Holdings LLC, U.S.A. 100.00 100.00 FullAMC-8 Holdings LLC, U.S.A. 100.00 100.00 FullAMC-9 Holdings LLC, U.S.A. 100.00 100.00 FullAMC-10 Holdings LLC, U.S.A. 100.00 100.00 FullAMC-11 Holdings LLC, U.S.A. 100.00 100.00 FullSES AMERICOM (Asia 1A) LLC, U.S.A. 100.00 100.00 FullAMERICOM Asia Pacifi c LLC, U.S.A. 100.00 100.00 Full AMC-12 Holdings LLC, U.S.A. 100.00 100.00 FullAMC-14 Holdings LLC, U.S.A.9 – 100.00 –SES AMERICOM California, Inc., U.S.A. 100.00 100.00 FullAMC-4 Holdings LLC, U.S.A. 100.00 100.00 FullAMC-7 Holdings LLC, U.S.A. 100.00 100.00 FullAMC-15 Holdings LLC, U.S.A. 100.00 100.00 FullAMC-16 Holdings LLC, U.S.A. 100.00 100.00 FullSES-1 Holdings, LLC, U.S.A.10 100.00 100.00 FullStarsys Global Positioning Inc., U.S.A. 80.00 80.00 FullCiel Satellite Communications Inc., Canada11 – 100.00 –QuetzSat Directo, S. de R.L. de C.V., Mexico 49.00 49.00 EquitySafe Sat of New York Inc., U.S.A. 100.00 100.00 FullSES ENGINEERING (U.S.) Inc., U.S.A. 100.00 100.00 FullAGS Acquisition Corp., U.S.A. 100.00 100.00 FullAOS Inc., U.S.A. 100.00 100.00 FullIP Prime, Inc., U.S.A. 100.00 100.00 Full
Held through SES Latin America S.A.:QuetzSat S. de R.L. de C.V., Mexico 49.00 49.00 EquitySatellites Globales S. de R.L. de C.V., Mexico 49.00 49.00 EquitySES Satelites Directo Ltda, Brazil 100.00 100.00 FullSES DTH do Brasil Ltda, Brazil 100.00 100.00 FullSES GLOBAL South America Holding S.L., Spain 100.00 100.00 Full
Held through SES Holdings (Netherlands) B.V.:New Skies Satellites Intermediate Holdings Ltd, Bermuda12 – 100.00 –New Skies Investments Holding B.V., The Netherlands 100.00 100.00 FullNew Skies Holding B.V., The Netherlands 100.00 100.00 FullNew Skies Satellites B.V., The Netherlands 100.00 100.00 FullNew Skies Investments (Ireland) Unltd, Ireland13 – 100.00 –SES Holdings (Bermuda) Ltd, Bermuda 100.00 100.00 FullNew Skies Holdings Ireland Unlimited, Ireland14 – 100.00 –New Skies Satellites Ireland Unlimited, Ireland15 – 100.00 –New Skies Satellites, Inc., U.S.A. 100.00 100.00 FullNew Skies Satellites de Mexico S.A. de C.V., Mexico 49.00 49.00 EquityNew Skies Satellites Mar B.V., The Netherlands 100.00 100.00 FullNew Skies Satellites Ltda, Brazil 100.00 100.00 Full
Effective interest (%)
2010
100.00 100.00 100.00 100.00 100.00 100.00 100.00 100.00 100.00 100.00 100.00 100.00 100.00 100.00 100.00
– –100.00 100.00 100.00 100.00 100.00 100.00 80.00
– –49.00
100.00 100.00 100.00 100.00 100.00
49.00 49.00
100.00 100.00 100.00
– –100.00 100.00 100.00
– –100.00
– –– –
100.00 49.00
100.00 100.00

Effective Effective interest (%) interest (%) Method of 2010 2009 consolidation
Morharras B.V., The Netherlands 100.00 100.00 FullNew Skies Networks, Inc., U.S.A. 100.00 100.00 FullNew Skies Networks (UK) Ltd, U.K. 100.00 100.00 FullSES ENGINEERING (Netherlands) B.V., The Netherlands 100.00 100.00 FullNew Skies Asset Holdings, Inc., U.S.A. 100.00 100.00 FullNew Skies Carrier Services, Inc., U.S.A. 100.00 100.00 FullNew Skies Satellites China B.V., The Netherlands16 – 100.00 –SES NEW SKIES Marketing B.V., The Netherlands 100.00 100.00 FullNew Skies Satellites India B.V., The Netherlands 100.00 100.00 FullNew Skies Satellites Argentina B.V., The Netherlands 100.00 100.00 FullNew Skies Networks Australia B.V., The Netherlands 100.00 100.00 FullNew Skies Networks Australia Pty Ltd, Australia 100.00 100.00 FullNew Skies Satellites Australia Pty Ltd, Australia 100.00 100.00 FullNew Skies Satellites Licensee B.V., The Netherlands 100.00 100.00 FullSES NEW SKIES Singapore B.V., The Netherlands 100.00 100.00 FullNSS Latin America Holdings S.A., Luxembourg 100.00 100.00 FullSES GLOBAL-South Americas Inc., U.S.A.17 – 100.00 –SES Asia S.A., Luxembourg 100.00 100.00 FullSES Finance Services AG, Switzerland 100.00 100.00 FullO3B Networks Ltd, Jersey Island18 33,32 25.15 EquitySES World Skies Singapore Pte Ltd, Singapore 100.00 100.00 FullNew Skies Satellites Collections Private Ltd, India 100.00 100.00 Full
Effective interest (%)
2010
100.00 100.00 100.00 100.00 100.00 100.00
– –100.00 100.00 100.00 100.00 100.00 100.00 100.00 100.00 100.00
– –100.00 100.00 33,32
100.00 100.00
1Dissolved in March 2010.2Participation was disposed of in January 2010.3The company was merged into ASTRA Platform Services GmbH on January 1, 2010.4Formerly SES SIRIUS AB.5Incorporated in November 2010.6Dissolved in 2010.7Merged in December 2009.8Dissolved in January 2011.9Merged in November 2010.10Formerly AMC-WB1 Holdings LLC.11Merged effective September 29, 2010.12Amalgamated into SES Holdings (Bermuda) Ltd on August 11, 2010.13Dissolved on 11 November 2010.14Dissolved on 11 November 2010.15Dissolved on 11 November 2010.16Dissolved on 30 January 2010.17Merged into New Skies Carrier Services, Inc. on 9 March 2010.18Based on total third party shareholding in O3b Networks Ltd and its affi liates.
71SES Annual Report 2010

72 SES Annual Report 2010
SES S.A. annual accountsIndependent auditor’s report
To the shareholders ofSES L-6815 Château de Betzdorf
Report on the annual accountsFollowing our appointment by the annual general meeting of the shareholders dated April 1, 2010, we have audited the accompanying annual accounts of SES, which comprise the balance sheet as at December 31, 2010 and the profi t and loss account for the year then ended, and a summary of signifi cant accounting policies and other explanatory information.
Board of Directors’ responsibility for the annual accountsThe Board of Directors is responsible for the preparation and fair presentation of these annual accounts in accordance with Luxembourg legal and regulatory requirements relating to the preparation of the annual accounts and for such internal control as Board of Directors determines is necessary to enable the preparation and presentation of annual accounts that are free from material misstatement, whether due to fraud or error.
Responsibility of the ‘réviseur d’entreprises agréé’Our responsibility is to express an opinion on these annual accounts based on our audit. We conducted our audit in accordance with International Standards on Auditing as adopted for Luxembourg by the ’Commission de Surveillance du Secteur Financier’. Those standards require that we comply with ethical requirements and plan and perform the audit to obtain reasonable assurance whether the annual accounts are free from material misstatement.
An audit involves performing procedures to obtain audit evidence about the amounts and disclosures in the annual accounts. The procedures selected depend on the judgment of the ’réviseur d’entreprises agréé’, including the assessment of the risks of material misstatement of the annual accounts, whether due to fraud or error. In making those risk assessments, the ‘réviseur d’entreprises agréé’ considers internal control relevant to the entity’s preparation and fair presentation of the annual accounts in order to design audit procedures that are appropriate in the circumstances, but not for the purpose of expressing an opinion on the effectiveness of the entity’s internal control.
An audit also includes evaluating the appropriateness of accounting policies used and the reasonableness of accounting estimates made by the Board of Directors, as well as evaluating the overall presentation of the annual accounts.
We believe that the audit evidence we have obtained is suffi cient and appropriate to provide a basis for our audit opinion.
OpinionIn our opinion, the annual accounts give a true and fair view of the fi nancial position of SES as of December 31, 2010, and of the results of its operations for the year then ended in accordance with Luxembourg legal and regulatory requirements relating to the preparation and presentation of the annual accounts.
Report on other legal and regulatory requirementsThe management report, which is the responsibility of the Board of Directors, is consistent with the annual accounts.
ERNST & YOUNGSociété AnonymeCabinet de révision agrééThierry BERTRANDLuxembourgFebruary 17, 2011

73SES Annual Report 2010
Balance sheetAs at December 31, 2010
2010 2009Assets Note EUR million EUR million
Intangible assets 3 0.1 0.1
Tangible assets 4
Other fi xtures and fi ttings, tools and equipment 0.3 0.5Payments on accounts and tangible assets in course of construction 2.1 2.1 2.4 2.6Financial assetsShares in affi liated undertakings 5 8,253.9 8,302.1Loans to affi liated undertakings 6 744.3 700.5Securities held as fi xed assets 7 52.2 94.3 9,050.4 9,096.9Current assetsDebtors (becoming due and payable within one year)Amounts owed by affi liated undertakings 8 1,283.1 758.3Other debtors 38.1 2.4
Cash at bank and in hand 112.2 59.8 1,433.4 820.5
Prepayments 50.6 36.9
Total assets 10,536.9 9,957.0
LiabilitiesCapital and reservesSubscribed capital 9 624.4 624.4Share premium 746.3 746.3Legal reserve 10 62.4 62.4Other reserves 11 294.5 569.8Result for the fi nancial year 459.7 16.5 2,187.3 2,019.4
CreditorsAmounts becoming due and payable after more than one yearNotes and bonds 12 2,693.3 2,838.0Amounts owed to credit institutions 13 429.9 820.0Amounts owed to affi liated undertakings 14 104.8 – 3,228.0 3,658.0
Amounts becoming due and payable within one yearNotes and bonds 12 929.6 210.4Amounts owed to credit institutions 13 179.6 167.8Trade creditors 0.9 0.7Amounts owed to affi liated undertakings 14 3,922.3 3,804.9Tax and social security debt
Tax debt 15 0.3 26.2Social security debt 0.2 0.2
Other creditors 88.7 69.4 5,121.6 4,279.6
Total liabilities 10,536.9 9,957.0
EUR million
0.1
0.3 2.1 2.4 4
8,253.9 744.3 52.2
9,050.4 4
1,283.1 38.1
112.2 1,433.44
50.6
10,536.9
624.4 4746.3 62.4 4
294.5 459.7
2,187.3
2,693.3 429.9 104.8
3,228.0
929.6 179.6
0.9 3,922.3
0.3 0.2
88.7 5,121.6
10,536.9
The accompanying notes form an integral part of the accounts.

74 SES Annual Report 2010
SES S.A. annual accountsProfi t and loss accountFor the year ended December 31, 2010
2010 2009Charges Note EUR million EUR million
External charges 20 14.1 36.3Staff costs 16 15.5 12.7Depreciation and amortisation 3, 4 0.2 0.2Value adjustments in respect of current assets 8 – 45.2Other operating charges 5.6 3.5Value adjustments in respect of fi nancial assets 7 – 1.6Interest payable and similar charges
concerning affi liated undertakings 54.4 67.3other interest payable and similar charges 18 225.4 240.4
Extraordinary charges 19 28.2 –Taxes on profi t 15 (90.1) (99.6)Profi t for the fi nancial year 459.7 16.5 713.0 324.1
IncomeNet turnover 20 1.3 24.9Other operating income 21 4.5 5.9Income from participating interests derived from affi liated undertakings 22 660.0 253.4Income from other transferable securities and from loans forming part of the fi xed assets 22.9 5.7Other interest receivable and similar income
derived from affi liated undertakings 19.6 32.9other interest receivable and similar income 23 4.7 1.3
713.0 324.1
2010 EUR million
14.1 15.5 0.2
– –5.6
– –
54.4 4225.4 428.2 (90.1)
459.7 713.0
1.3 4.5
660.0 22.9
19.6 4.7
713.0
Statement of changes in shareholders’ equityAs at December 31, 2010
Subscribed Share Legal Other Result for capital premium reserve reserves the year Total EUR million EUR million EUR million EUR million EUR million EUR million
Balance, beginning of the year 624.4 746.3 62.4 569.8 16.5 2,019.4Allocation of result – – – 16.5 (16.5) –Distribution of dividends – – – (291.8) – (291.8)Profi t for the fi nancial year – – – – 459.7 459.7Balance, end of the year 624.4 746.3 62.4 294.5 459.7 2,187.3
The accompanying notes form an integral part of the accounts.

75SES Annual Report 2010
Notes to the accountsDecember 31, 2010
Note 1 – GeneralSES S.A. (previously SES GLOBAL S.A.) was incorporated on March 16, 2001 as a limited liability company (Société Anonyme) under the law of the Grand Duchy of Luxembourg for an unlimited period of time.
The purpose of SES (the ‘company’) is to take generally any interest whatsoever in electronic media and to be active, more particularly, in the communications area via satellites and to invest, directly or indirectly, in other companies that are actively involved in the satellite communication industry.
The accounting period of the company is from January 1 to December 31.
The company has a 99.94% interest in a partnership, SES GOBAL-Americas Holdings GP, whose accounts are integrated in those of the company to the level of its share of the partnership.
Note 2 – Signifi cant accounting policiesIn accordance with Luxembourg legal and regulatory requirements, consolidated accounts are prepared.
The annual accounts are prepared in accordance with the generally accepted accounting principles and regulations in force in the Grand Duchy of Luxembourg.
Formation expensesThe costs of formation of the company and the costs related to the increases in issued share capital are capitalised and amortised over a period of up to fi ve years.
Intangible assetsDevelopment costs:Development expenditure incurred on an individual project is carried forward when its future recoverability can be regarded as assured. Any expenditure carried forward is amortised over the period of expected future sales from the related project.
Payments on account:Amounts payable in respect of development costs are included in the balance sheet when incurred. When the project is complete, the expenditure is transferred to assets in use and amortisation commences.
Tangible assetsOther fi xtures, fi ttings, tools and equipment:All such items are depreciated evenly over the estimated useful lives, which are ten years or less.
Tangible assets in course of construction:Amounts payable in respect of the purchase of future assets are included in the balance sheet when billed. The expenditure is transferred to assets in use and depreciation of the asset commences when it is put into service.
Financial assetsFinancial assets are carried in the balance sheet at cost of purchase. If this valuation would appear to be excessive and reduction to be permanent, such assets would be written down to their realisable value.
Loan origination costsLoan origination costs are capitalised and included in prepaid expenses. These costs are amortised over remaining estimated loan periods based on the company’s fi nancing strategy.
DividendsDividends are declared after the accounts for the year have been approved. Accordingly dividends payable are recorded in the subsequent year’s accounts. Dividends receivable from affi liated undertakings are recorded as income in the year in which they are declared by the subsidiary.
Convertible profi t participating loanReturns on convertible profi t participating loans (‘PPL’) issued by the company are calculated based on the cumulative profi ts of the PPL recipient over the life of the loan. The company’s entitlement to the return is therefore only certain at the date of maturity of the loan. The return is therefore recorded as income on fi nal maturity of the PPL.
Translation of foreign currenciesThe company maintains its accounting records in euro (EUR) and the annual accounts are expressed in that currency.
The costs of tangible and intangible assets are translated at the historical rate. Long-term fi nancial liabilities, which are hedged by fi nancial derivatives, are translated at historical rate. Long-term inter-company balances are translated at the balance sheet exchange rate unless this would give rise to an unrealised foreign exchange gain in which case the historical exchange rate is used.
Current assets and current liabilities denominated in foreign currencies are translated into euro at the balance sheet exchange rate.
Income and charges expressed in other currencies are recorded on the basis of the exchange rates prevailing on the transaction dates.
The resultant exchange gains and losses arising from the application of the above principles are refl ected in the profi t and loss account.
Financial derivativesThe company enters into fi nancial derivatives for hedging purposes. All fi nancial derivatives are maintained off balance sheet. Gains and losses realised on the settlement of such derivatives are taken to the profi t and loss account at the same time as the hedged asset/liability impacts the profi t and loss account.
Premiums paid/received on fi nancial derivatives are taken to the profi t and loss account over the term of the fi nancial derivative.
Net turnoverAll amounts received from customers under contracts for rental of satellite transponder capacity are recognised, at the fair value of the consideration received or receivable, over the duration of the respective contracts on a straight-line basis. Payments received in advance are deferred and included in the balance sheet as deferred income. Payments of receivables in arrears are accrued and included in trade debtors.

76 SES Annual Report 2010
Note 3 – Intangible assets 2010 2009 EUR million EUR million
Cost at beginning of year 0.1 0.1Additions – –Write-off – –Cost at end of year 0.1 0.1Accumulated amortisation at beginning of year – –Write-off – –Accumulated amortisation at end of year – –Net book value at beginning of year 0.1 0.1Net book value at end of year 0.1 0.1
2010 EUR million
0.1 – –– –
0.1 – –– –– –
0.1 0.1
Note 4 – Tangible assetsThe development of tangible assets during the fi nancial years 2010 and 2009 is as follows:
Other fi xtures Payments on account and fi ttings, tools and tangible assets in Total Total and equipment course of construction 2010 2009 EUR million EUR million EUR million EUR million
Cost at beginning of year 3.0 2.1 5.1 4.8Accumulated depreciation at beginning of year (2.5) – (2.5) (2.3)Net book value at beginning of year 0.5 2.1 2.6 2.5
Movements of the yearAdditions – – – 0.3Depreciation (0.2) – (0.2) (0.2)Cost at end of year 3.0 2.1 5.1 5.1Accumulated depreciation at end of year (2.7) – (2.7) (2.5)Net book value at end of year 0.3 2.1 2.4 2.6
Total 2010
EUR million
5.1 (2.5) 2.6
– –(0.2) 5.1
(2.7) 2.4 4
Note 5 – Shares in affi liated undertakings 2010 2009 EUR million EUR million
Cost at beginning of year 8,306.8 8,337.1Additions 28.8 215.6Repayment of initial investment (77.0) (245.9)
Cost at end of year 8,258.6 8,306.8
Value adjustments at beginning of year (4.7) (4.7)Value adjustment of the year – –
Value adjustments at end of year (4.7) (4.7)
Net book value at end of year 8,253.9 8,302.1
2010 EUR million
8,306.8 28.8 (77.0)
8,258.6
(4.7) – –
(4.7)
8,253.9
SES S.A. annual accountsNotes to the accounts continuedDecember 31, 2010

77SES Annual Report 2010
As at December 31, 2010, the company holds the following investments:
Net Book Value Participation EUR million
SES ASTRA S.A., Betzdorf, Luxembourg 100% 1,046.8SES GLOBAL – Americas, Inc., Princeton, United States 99.94% 3,854.8ASTRA Broadband Services S.A., Betzdorf, Luxembourg 0.01% –SES GLOBAL Americas Finance Inc., Delaware, United States 100% –SES ASTRA AB, Stockholm, Sweden (formerly SES SIRIUS AB) 32.34% 50.1SES Participations S.A., Betzdorf, Luxembourg 100% 206.8SES GLOBAL Africa S.A., Betzdorf, Luxembourg 100% 406.6SES Finance S.à r.l., Switzerland 100% 1,426.7SES Holdings (Netherlands) B.V., Netherlands 100% 1,113.3SES ASTRA Services Europe S.A., Betzdorf, Luxembourg 100% 148.8SES ASTRA TechCom Belgium S.A., Belgium 1% –SES Latin America S.A., Betzdorf, Luxembourg 100% –SES Belgium S.p.r.l., Belgium 99% – 8,253.9
In October 2010, SES GLOBAL – Americas, Inc., decided to reimburse EUR 77.0 million of paid-in capital.
In April 2010, SES contributed to a further capital increase in SES ASTRA Services Europe S.A. through a contribution in kind of an inter-company loan with SES Capital Belgium for a total amount of EUR 28.8 million.
In May 2009, with effect from January 2009, SES contributed to a further capital increase in SES Finance S.à r.l. through a contribution in kind of an inter-company loan with SES Satellite Leasing Limited for a total amount of USD 300.0 million (EUR 215.6 million).
In December 2009, SES Holdings Netherlands B.V., decided to reduce its share premium reserve by an amount of USD 369.4 million (EUR 245.9 million) thereby resulting in a reimbursement of the initial investment.
Art. 65 paragraph (1) 2º of the law of December 19, 2002 on the register of commerce and companies and the accounting and annual accounts of undertakings (the ’law’) requires the disclosure of the amount of capital and reserves and profi t and loss for the last fi nancial year of each affi liated undertaking. In conformity with article 67 (3) of the law these details have been omitted as the company prepares consolidated accounts and these consolidated accounts and the related consolidated annual report and auditors’ report thereon have been lodged with the Luxembourg Trade Registry.
Note 6 – Loans to affi liated undertakingsLoans to affi liated undertakings of EUR 744.3 million (2009: EUR 700.5 million) consist of Convertible Profi t Participating Loans with SES Finance S.à r.l.
On February 1, 2007 SES granted a Convertible Profi t Participating Loan amounting to USD 807.4 million (2010: EUR 604.3 million; 2009: EUR 560.5 million). A further loan of EUR 140.0 million was granted on November 28, 2008.
Note 7 – Securities held as fi xed assets 2010 2009 EUR million EUR million
Cost at beginning of year 95.9 107.2Value adjustments at beginning of year (1.6) –Net book value at beginning of year 94.3 107.2Movements of the yearPurchase of FDRs / own shares 1.6 –Used in connection with employee option scheme (44.9) (11.3)Reversal of value adjustments 1.2 –
Cost at end of year 52.6 95.9Value adjustments at end of year (0.4) (1.6)Net book value at end of year 52.2 94.3
2010 EUR million
95.9 (1.6)
94.3
1.6 (44.9)
1.2
52.6 (0.4)
52.2
Own Fiduciary Deposit ReceiptsAll Fiduciary Deposit Receipts (‘FDRs’) in respect of Class A shares owned by the company are for use in connection with the senior executives, executives and employees option schemes operated by the group. These shares are valued at the lower of cost and market value.
As at December 31, 2010, the company owned 4.254.011 FDRs (2009: 7,928,510).

78 SES Annual Report 2010
Note 8 – Amounts owed by affi liated undertakingsAmounts owed by affi liated undertakings of EUR 1,283.1 million (2009: EUR 758.3 million) consist of current accounts.
In 2009, the company recorded a value adjustment of EUR 45.2 million on amounts owed by an affi liated undertaking to refl ect the underlying trading position of this entity.
As at December 31, 2010, current accounts represent short-term advances bearing interest at market rates and consist principally of amounts owed by SES ASTRA 1KR S.à r.l., SES ASTRA 1L S.à r.l., SES ASTRA 2F S.à r.l., SES ASTRA 1M S.à r.l., SES ASTRA 3B S.à r.l., SES Finance S.à r.l., SES ASTRA S.A. and SES ASTRA 2E S.à r.l.
Note 9 – Subscribed capitalAs at December 31, 2010 and 2009, the issued and fully paid share capital amounted to EUR 624.4 million, represented by 499,477,695 shares with no par value (332,985,130 Class A ordinary shares and 166,492,565 Class B ordinary shares).
Note 10 – Legal reserveIn accordance with Luxembourg legal requirements, a minimum of 5% of the yearly net profi t is transferred to a legal reserve from which distribution is restricted. This requirement is satisfi ed when the reserve reaches 10% of the issued share capital.
Note 11 – Other reservesPrior to January 1, 2002, in accordance with article 174 bis of Luxembourg fi scal law, the company was entitled to credit the net worth tax due for the year against the corporate income tax charge for the year. From 2002 onwards, in accordance with paragraph 8a of the October 16, 1934 law as amended, the company is entitled to reduce the net worth tax due for the year by an amount which cannot exceed the corporate income tax due for the year. In order to avail of the above the company must set up a restricted reserve equal to fi ve times the amount of the net worth tax credited. This reserve has to be maintained for a period of fi ve years following the year in which it was created. In case of distribution of the restricted reserve, the tax credit falls due during the year in which it was distributed.
During previous years, the SES group had decided to maintain the restricted reserve for the Luxembourg fi scal integration group (the ’tax group’) under ’other reserves’ in the accounts of SES ASTRA. During the year 2008, it was decided that as from 2008 the restricted reserves are to be maintained in the accounts of SES S.A.
As at December 31, 2010, the restricted portion of ‘other reserves’ in the books of SES S.A. is as follows:
Reduction in Restricted net worth tax reserve EUR million EUR million
2008 18.2 90.82009 12.7 63.4
Upon approval of these accounts by the annual general meeting of the shareholders, an amount of EUR 70.7 million will be allocated to restricted reserves in the books of SES S.A. corresponding to fi ve times the amount of the 2010 net worth tax.
Note 12 – Notes and bondsU.S. Private PlacementOn September 30, 2003, SES, through SES GLOBAL-Americas Holdings GP, issued in the U.S. Private Placement market four series of unsecured Notes amounting to USD 1,000.0 million and GBP 28.0 million. The U.S. Private Placement was made up of four series as follows:
1. Series A USD 400.0 million of 5.29% Senior Notes due September 2013, amortising as of September 2007.2. Series B USD 513.0 million of 5.83% Senior Notes due September 2015, amortising as of September 2011.3. Series C USD 87.0 million of 5.93% Senior Notes due September 2015.4. Series D GBP 28.0 million of 5.63% Senior Notes due September 2013, amortising as of September 2007.
SES is committed under the U.S. Private Placement to maintaining a number of fi nancial covenants requiring certain fi nancial ratios to be maintained within agreed limits in order to provide suffi cient security to lenders. These fi nancial ratios are based on the consolidated fi nancial statements of SES S.A..
European Medium Term Note Programme (EMTN)On December 6, 2005, SES put in place a EUR 2,000.0 million EMTN enabling SES, or SES GLOBAL-Americas Holdings GP, to issue as and when required notes up to a maximum aggregate amount of EUR 2,000.0 million. In May 2007, this programme was increased to an aggregate amount of EUR 4,000.0 million. On September 24, 2010, this programme was extended for one more year.
As of December 31, 2010, SES has issued EUR 2,600.0 million (2009: EUR 2,050.0 million) under the EMTN Programme with maturities ranging from 2011 – 2020.
− EUR 150.0 million Private Placement (2016)On July 13, 2009, SES issued a EUR 150.0 million Private Placement under the company’s European Medium Term Note Programme with Deutsche Bank. The Private Placement has a 7-year maturity, beginning August 5, 2009, and bears interest at a fi xed rate of 5.05%.
− EUR 650.0 million Eurobond (2020) issueOn March 9, 2010, SES issued a EUR 650.0 million bond under the company`s European Medium Term Note Programme. The bond has a 10-year maturity and bears interest at a fi xed rate of 4.625%.
SES S.A. annual accountsNotes to the accounts continuedDecember 31, 2010

79SES Annual Report 2010
− EUR 650.0 million Eurobond (2014)On July 9, 2009 (pricing June 30, 2009) SES issued a Euro 650.0 million bond under the company’s European Medium Term Note Programme. The bond has a 5-year maturity and bears interest at a fi xed rate of 4.875%.
− EUR 500.0 million Eurobond (2013)On October 20, 2006, SES issued a Euro 500.0 million bond under the company’s European Medium Term Note Programme. The bond has a 7-year maturity and bears interest at a fi xed rate of 4.375%.
− EUR 650.0 million Eurobond (2011)On March 15, 2006, SES issued a Euro 650.0 million bond under the company’s European Medium Term Note Programme. The bond has a 5-year maturity and bears interest at a fi xed rate of 4.0%.
− EUR 100 million Guaranteed Floating Rate Note (2010), repaymentOn October 20, 2008, the company issued a fl oating rate note for general refi nancing purposes for a nominal amount of EUR 100 million with a fl oating rate of 3-month EURIBOR plus a margin of 0.6%. The note was repaid at its maturity date October 20, 2010.
German Bond issue of EUR 200.0 millionOn May 21, 2008, the group also concluded an agreement to issue EUR 200 million in two equal tranches in the German Bond (‘Schuldschein’) market. The agreement for the fi rst tranche was signed on May 30, 2008 with the funds being drawn down in June 2008, and bearing interest at fi xed rate of 5.75%. The agreement for the second tranche was signed on July 14, 2008 with the funds being drawn down in July 2008 and bearing interest at fi xed rate of 6.0%. Both German bonds mature in November 2012.
Commercial paper programmeOn October 25, 2005, SES put in place a EUR 500.0 million ‘Programme de Titres de Créances Négociables’ in the French market where the company issued ‘Billets de Trésorerie’ (commercial paper) in accordance with articles L.213-1 to L213-4 of the French Monetary and Financial Code and decree n°92.137 of February 13, 1992 and all subsequent regulations. The maximum outstanding amount of ‘Billet de Trésorerie’ issuable under the programme is EUR 500.0 million or its counter value at the date of issue in any other authorised currencies. On June 7, 2010, this programme was extended for one further year. As of December 31, 2010 borrowings of EUR 135.0 million (2009: EUR 55.0 million) were outstanding under this programme. The average rate of the outstanding commercial paper amounts to 0.950% (2009: 0.605%).
The maturity profi le of notes and bonds is as follows as at December 31, 2010 and 2009:
2010 2009 EUR million EUR million
Within one year 929.6 210.4Between one to two years 344.6 794.6Between two to fi ve years 1,548.7 1,728.5After fi ve years 800.0 314.9Total after one year 2,693.3 2,838.0
2010 EUR million
929.6 344.6
1,548.7 800.0
2,693.3
Note 13 – Amounts owed to credit institutionsAs at December 31, 2010 and 2009, the amount owed to credit institutions was as follows:
2010 2009 EUR million EUR million
Becoming due and payable after more than one yearEuropean Investment Bank 200.0 200.0COFACE facility 109.9 –Syndicated revolving credit facility 120.0 620.0 429.9 820.0Becoming due and payable within one yearBilateral multi-currency facilities – 91.4Committed and uncommitted loan facilities 179.6 76.4 179.6 167.8
2010 EUR million
200.0 109.9120.0 429.9
– –179.6 179.6
EUR 200.0 million European Investment Bank fundingOn April 21, 2009, SES signed a fi nancing agreement with the European Investment Bank concerning the investment by the group in certain satellite investment projects. This facility, bearing interest at a fi xed rate of 3.618%, is repayable in six annual instalments between May 2012 and May 2017.
Syndicated loan 2015In April 2009, SES signed a syndicated loan facility maturing in 2012 with a consortium of 24 banks. On September 2010, the syndicated loan has been amended and restated. The amended facility, maturing April 2015, is for EUR 1,200.0 million and can be drawn in EUR and USD. The interest rate is based on EURIBOR or U.S. LIBOR, depending on the drawing currency, plus a margin based on the rating of the company. The current rating of the company is BBB/Baa2 (S&P/Moody’s) leading to a margin of 0.95%.

80 SES Annual Report 2010
EUR 522.9 million COFACE facilityOn December 16, 2009, SES signed a fi nancing agreement with COFACE (Compangnie Française d’Assurance pour le Commerce Extérieur) in respect of the investment in four geostationary satellites (ASTRA 2E, ASTRA 2F, ASTRA 2G, ASTRA 5B). The facility is divided into fi ve loans. The drawings under the loans are based on invoices from the supplier of the satellites. The fi rst drawing was done on April 23, 2010. Each loan will be repaid in 17 equal semi-annual instalments starting the earlier of the in-orbit date of the satellite being fi nanced by such loan and April 1, 2014 and the estimated fi nal maturity of the facility will be by the end of 2022. The facility bears interest at a fl oating rate of six month EURIBOR plus a margin of 1.7%.
Bilateral multi-currency facilities repaymentOn December 31, 2009 SES had unsecured bilateral multi-currency revolving credit facilities in place with one bank for a total of EUR 100.0 million (2008: 11 banks with an amount of EUR 1,075.0 million), of which EUR 91.4 million (2008: EUR 1,046.2 million) was drawn as at year-end. These bilateral facilities were available to both SES and SES GLOBAL-Americas Holdings GP. The margin was 2.75% LIBOR or EURIBOR depending on the drawdown maturity and currency. The outstanding bilateral multi-currency facility was settled at its fi nal maturity date of April 7, 2010.
The maturity profi le of the amounts drawn is as follows as at December 31, 2010 and 2009:
2010 2009 EUR million EUR million
Between one and two years 33.3 –Between two and fi ve years 305.7 720.0After fi ve years 90.9 100.0 429.9 820.0
2010 EUR million
33.3 305.7 90.9
429.9
Committed and uncommitted loan facilitiesAs at December 31, 2010, the company had drawn USD 240.0 million (EUR 179.6 million) under uncommitted loan facilities (2009: USD 110.0 million committed and uncommitted).
Note 14 – Amounts owed to affi liated undertakingsAmounts owed to affi liated undertakings of EUR 4,027.1 million (2009: EUR 3,804.9 million) include the following:
2010 2009 EUR million EUR million
Long-term loans (maturity after 5 years) 104.8 –Short-term loans 661.1 551.7Notes 1,937.0 1,942.3Current accounts 1,324.2 1,310.9 4,027.1 3,804.9
2010 EUR million
104.8 661.1
1,937.0 1,324.2 4,027.1
Short term loans bear interest at market rates and are repayable upon demand.
As at December 31, 2010, long-term loans represent six loans bearing interest at a rate of one month USD LIBOR plus a margin of 0.50% or 0.54% with a maturity of November 2020.
As at December 31, 2010, the notes are interest free (with the exception of one note which bears interest at a rate of 4.6% per annum and four notes which bears interest at a rate of Swiss safe harbor interest rate plus a margin of 0.5%) and are repayable upon demand or at latest on the second anniversary of the note, which may be extended for successive periods of two years each.
As at December 31, 2009, the notes are interest free (with the exception of one note which bears interest at a rate of 4.6% per annum) and are repayable upon demand or at latest on the second anniversary of the note, which may be extended for successive periods of two years each.
As at December 31, 2010 and 2009, current accounts represent short-term advances bearing interest at market rates and include a short-term advance owed to SES ASTRA S.A. of EUR 489.1 million (2009: EUR 366.8 million).
Note 15 – Taxes on profi tTaxes in the profi t and loss account have been provided in accordance with the relevant laws. The balance sheet position takes into consideration the taxable result of the Luxembourg subsidiaries (SES ASTRA S.A., SES Asia S.A., ASTRA Broadband Services S.A., SES Participations S.A., SES GLOBAL Africa S.A., NSS Latin America Holdings S.A., SES ASTRA 3B S.à r.l., SES ASTRA 1KR S.à r.l., SES ASTRA 1L S.à r.l., SES ASTRA 1M S.à r.l., SES ASTRA TechCom S.A., SES ENGINEERING S.à r.l., SES ASTRA 1N S.à r.l., SES ASTRA 5 S.à r.l., SES ASTRA 2E S.à r.l., SES ASTRA 2F S.à r.l., SES ASTRA 2G S.à r.l. and SES Digital Distribution Services S.à r.l.), which are part of the Luxembourg fi scal unit, in accordance with Art 164 bis LIR.
SES S.A. annual accountsNotes to the accounts continuedDecember 31, 2010

81SES Annual Report 2010
Note 16 – Staff costsAs at December 31, 2010, the number of full-time equivalent employees was 58 (2009: 60) and the average number of employees in the workforce for 2010 was 58 (2009: 57). Staff costs can be analysed as follows:
2010 2009 EUR million EUR million
Wages and salaries 14.9 12.1Social security costs 0.6 0.6 15.5 12.7
2010 EUR million
14.9 0.6
15.5
Note 17 – Audit feesArt. 65 paragraph (1) 16º of the law of December 19, 2002 on the register of commerce and companies and the accounting and annual accounts of undertakings (the ‘law’) requires the disclosure of the independent auditor fees. In conformity with the law these details have been omitted as the company prepares consolidated accounts in which this information is disclosed and these consolidated accounts and the related consolidated annual report and auditors’ report thereon have been lodged with the Luxembourg Trade Registry.
Note 18 – Other interest payable and similar chargesOther interest payable and similar charges include the following:
2010 2009 EUR million EUR million
Interest charges 195.3 178.4Foreign exchange losses, net – 42.8Other fi nancial charges 30.1 19.2 225.4 240.4
2010 EUR million
195.3 – –
30.1 225.4 4
Foreign exchange losses, net, mainly consist of losses realised on the close-out of certain derivative instruments during the year 2009.
Note 19 – Extraordinary chargesThe amount of EUR 28.2 million consists of an affi liated undertaking debt waiver.
Note 20 – Net turnoverIn 2010 net turnover amounting to EUR 1.3 million (2009: EUR 24.9 million) consisted of transponder capacity service revenue generated from trading with affi liated undertakings for which satellite rental costs of EUR 1.3 million (2009: EUR 25.2 million) are included in ‘External charges’. This contract ended in January 2010.
Note 21 – Other operating incomeOther operating income mainly consist of group recharge revenues amounting to EUR 4.5 million (2009: EUR 4.5 million) arising from advisory support services rendered to various affi liates.
Note 22 – Income from participating interests derived from affi liated undertakingsIncome from participating interests derived from affi liated undertakings consists of the following:
2010 2009 EUR million EUR million
Dividends received from affi liated undertakings 660.0 253.4 660.0 253.4
2010 EUR million
660.0 660.0
Note 23 – Other interest receivable and similar incomeOther interest receivable and similar income include the following:
2010 2009 EUR million EUR million
Interest income 0.3 0.9Foreign exchange gain, net 4.4 –Other fi nancial income – 0.4 4.7 1.3
2010 EUR million
0.3 4.4 4
– –4.7
Net foreign exchange gains mainly consist of gains realised on the close-out of certain derivative instruments during 2010.
Note 24 – Board of Directors’ remunerationAt the annual general meeting held on April 1, 2010, payments to directors for attendance at board and committee meetings were approved. These payments are computed on a fi xed and variable basis, the variable payments being based upon attendance at board and committee meetings. Total payments arising in 2010 were EUR 1.3 million (2009: EUR 1.3 million).

82 SES Annual Report 2010
Note 25 – Off balance sheet itemsExternal interest rate swapsAs at December 31, 2010, the company had no EUR interest rate swaps outstanding. The four outstanding EUR interest rate swaps at December 31, 2009 matured in May 2010 and October 2010.
As at December 31, 2010 and 2009, the company held four interest rate swaps which were designated as hedges of expected future interest expenses on USD 240.0 million of uncommitted credit line which are fl oating rate debt.
Forward foreign exchange contractsAs at December 31, 2010 and 2009, the company had outstanding foreign exchange contracts.
As at December 31, 2010:
Each of the following contracts is mirrored exactly by an internal forward foreign exchange contract with a group entity.
Currency sold Currency bought Average weighted maturity Average FX rate Note
USD 0.6 million EUR 0.9 million January 2011 EUR/USD 1.3251 8USD 33.0 million EUR 25.1 million January 2011 EUR/USD 1.3157 1EUR 0.2 million CHF 0.3 million January 2011 EUR/CHF 1.3103 5EUR 1.5 million USD 2.0 million January 2011 EUR/USD 1.3331 5USD 0.3 million EUR 0.2 million March 2011 EUR/USD 1.3312 7USD 44.6 million EUR 33.3 million April 2011 EUR/USD 1.3404 3SEK 537.9 million USD 78.9 million January 2011 USD/SEK 6.8183 3USD 123.9 million EUR 124.1 million December 2011 EUR/USD 1.3119 6EUR 5.2 million SEK 50.0 million May 2011 EUR/SEK 9.6843 2USD 8.3 million SEK 60.9 million May 2011 USD/SEK 7.3136 2
The company also has the following outstanding foreign exchange contracts which are not mirrored by internal contracts:
Currency sold Currency bought Average weighted maturity Average FX rate
SEK 5.0 million EUR 0.6 million January 2011 EUR/SEK 8.9868EUR 5.7 million GBP 4.9 million September 2011 EUR/GBP 0.8541
As at December 31, 2009:
Each of the following contracts is mirrored exactly by an internal forward foreign exchange contract with a group entity.
Currency sold Currency bought Average weighted maturity Average exchange rate Note
USD 2,700.0 million EUR 1,840.5 million February 2010 EUR/USD 1.4671 1EUR 442.0 million USD 650.0 million February 2010 EUR/USD 1.4710 1USD 64.9 million EUR 44.0 million April 2010 EUR/USD 1.4757 3USD 13.0 million EUR 8.8 million March 2010 EUR/USD 1.4721 4SEK 661.7 million USD 91.0 million January 2010 USD/SEK 7.2684 3EUR 4.8 million SEK 49.2 million June 2010 EUR/SEK 10.1474 2USD 10.3 million SEK 73.6 million June 2010 USD/SEK 7.0782 2
The company had also the following outstanding foreign exchange contract which is not mirrored by an internal contract.
Currency sold Currency bought Average weighted maturity Average exchange rate
USD 0.5 million EUR 0.3 million January 2010 EUR/USD 1.4867
1. These foreign exchange contracts exactly mirror the internal forward foreign exchange contracts entered into with SES Finance.2. These foreign exchange contracts exactly mirror the internal forward foreign exchange contracts entered into with SES ASTRA AB
(formerly SES SIRIUS AB)3. These foreign exchange contracts exactly mirror the internal forward foreign exchange contracts entered into with SES Satellite
Leasing.4. These foreign exchange contracts exactly mirror the internal forward foreign exchange contracts entered into with ND SatCom.5. These foreign exchange contracts exactly mirror the internal forward foreign exchange contracts entered into with
SES ASTRA TechCom.6. These foreign exchange contracts exactly mirror the internal forward foreign exchange contracts entered into with New Skies.7. These foreign exchange contracts exactly mirror the internal forward foreign exchange contracts entered into with
ASTRA Broadband Services .8. These foreign exchange contracts exactly mirror the internal forward foreign exchange contracts entered into with
SES Re International Bermuda.
SES S.A. annual accountsNotes to the accounts continuedDecember 31, 2010

83SES Annual Report 2010
Inter-company fi nancial instrumentsThe company arranged several inter-company foreign exchange contracts in order to hedge the U.S. Private Placement as well as certain other USD-denominated facilities. The average terms of these inter-company contracts are as follows:
Currency sold Currency bought Average weighted maturity Exchange rate
As at Dec 31, 2010 EUR 675.0 million USD 790.9 million September 2013 EUR/USD 1.1717As at Dec 31, 2009 EUR 730.2 million USD 854.5 million April 2013 EUR/USD 1.1702
As at December 31, 2010, the company had also entered into the following additional inter-company foreign exchange contracts which are mirrored exactly by internal forward foreign exchange contract with another inter-company group entity:
Currency sold Currency bought Average weighted maturity Average exchange rate
USD 58.7 million EUR 45.3 million January 2013 EUR/USD 1.297
As at December 31, 2009, the company had also entered into the following additional inter-company foreign exchange contracts which are not mirrored by another forward foreign exchange contract:
As at December 31, 2009:
Currency sold Currency bought Average weighted maturity Average exchange rate
EUR 129.5 million USD 190.6 million May 2010 EUR/USD 1.4720USD 779.1 million EUR 533.7 million February 2010 EUR/USD 1.4598SEK 661.7 million USD 91.0 million January 2010 USD/SEK 7.2698
GuaranteesAs at December 31, 2010, the company had outstanding bank guarantees for an amount of EUR 0.7 million (2009: EUR 0.9 million). This relates to performance guarantees for services of satellite operations.
Corporate guaranteesIn 2010 and 2009, SES has given several corporate guarantees to satellite providers for the provision of communications spacecraft and related equipment contracted by fully-owned subsidiaries of the group. The company also issued guarantees toward banks regarding ND SatCom GmbH for EUR 15.0 million.

84 SES Annual Report 2010
Other information
Registered offi ce and group headquartersSES S.A. Château de Betzdorf, L-6815 Luxembourg Registre de commerce RCS Luxembourg B 81.267
Information for shareholdersFinancial calendar 2011Annual general meeting of shareholders: April 7, 2011Dividend payment: April 27, 2011First quarter trading update: May 12, 2011Announcement of fi rst-half results: July 29, 2011Third quarter trading update: October 28, 2011
Listed securityFiduciary Depositary Receipts each in respect of one A share of SES S.A. are listed on the Stock Exchange of Luxembourg and on Euronext Paris under the symbol SESG.
Fiduciary agent Banque et Caisse d’Epargne de l’Etat 16, rue Ste Zithe, L-2954 Luxembourg Tel: (352) 40 151
Shareholder enquiries For enquiries of a general nature regarding the company or Investor Relations, please contact:
SES S.A.Investor RelationsL-6815 Château de BetzdorfLuxembourgTel: (352) 710 725 490Fax: (352) 710 725 [email protected]
Satellite operatorsSES ASTRAL-6815 Château de BetzdorfLuxembourgTel: (352) 710 725 1Fax: (352) 710 725 [email protected]
SES WORLD SKIES4 Research WayPrinceton, NJ 08540-6684U.S.A.Tel: (1) 609 987 4000Fax: (1) 609 987 [email protected]
SES WORLD SKIESRooseveltplantsoen 42517 KR The HagueThe NetherlandsTel: (31) 70 306 4100Fax: (31) 70 306 [email protected]
Satellite services companies SES WORLD SKIES U.S. Government Solutions2010 Corporate Ridge, Suite 550McLean, VA 22102U.S.A.Tel: (1) 703 610 1000Fax: (1) 703 610 [email protected]
ASTRA Platform ServicesBetastraße 1–10D-85774 UnterföhringGermanyTel: (49) (0) 89 1896 3000Fax: (49) (0) 89 1896 3602www.aps.de
ASTRA Broadband ServicesL-6815 Château de BetzdorfLuxembourgTel: (352) 710 725 1Fax: (352) 710 725 [email protected]
ASTRA TechCom ServicesL-6815 Château de BetzdorfLuxembourgTel: (352) 710 725 559Fax: (352) 710 725 [email protected]

It is our policy to produce the document constituting our annual report with a minimum impact on the environment. To this end the paper used is 100% chlorine free woodpulp from sustainable forests, using thinnings and waste from the timber industry and is totally recyclable and biodegradable. Our printers are fully accredited to the ISO 14001 environmental management system. They utilise vegetable based inks and operate a direct computer to plate repro system, eliminating the need for fi lm with its chemicals such as developer and acid fi xers.
Designed and produced by Carnegie Orr +44 (0)20 7610 6140www.carnegieorr.com

SES S.A.L-6815 Château de BetzdorfLuxembourgTel: (352) 710 725 1Fax: (352) 710 725 227www.ses.com
Your Satellite Connection to the World