Embed Size (px)
Citation preview

Highlights
Contents
1 Key Performance Indicators
and Company Structure
2 The Market
6 Letter to Shareholders
10 Chief Financial Officer’s Report
16 Directorate and Executive
18 Management Committee
20 Corporate Governance
and Risk Management Review
35 Annexure A
Attendance of Meetings by Directors
36 Annexure B
Composition of Board and Board Committees
38 Sustainability Review
49 Annual Financial Statements 2008
101 Statutory Information
102 Special Resolutions of Subsidiaries
103 Notice of Annual General Meeting
110 Form of Proxy
111 Notes to the Form of Proxy
112 Shareholders’ Calendar
112 Administration and Addresses
Headline earnings 32%
Final dividend per share 75 cents
Return on equity 22%
Clients 1.37 million
Shareholders’ funds R1.2 billion
70
R’m
116
0706
05
160
08
212
He
ad
line
ea
rnin
gs
513
‘000
706
1010
1371
Act
ive
clie
nts
0807
0605
Re
turn
on
eq
uity
16
%
23
26
22
0807
0605
C a p i t e c B a n k H o l d i n g s L i m i t e d
Annual Report 2008

Highlights
Contents
1 Key Performance Indicators
and Company Structure
2 The Market
6 Letter to Shareholders
10 Chief Financial Officer’s Report
16 Directorate and Executive
18 Management Committee
20 Corporate Governance
and Risk Management Review
35 Annexure A
Attendance of Meetings by Directors
36 Annexure B
Composition of Board and Board Committees
38 Sustainability Review
49 Annual Financial Statements 2008
101 Statutory Information
102 Special Resolutions of Subsidiaries
103 Notice of Annual General Meeting
110 Form of Proxy
111 Notes to the Form of Proxy
112 Shareholders’ Calendar
112 Administration and Addresses
Headline earnings 32%
Final dividend per share 75 cents
Return on equity 22%
Clients 1.37 million
Shareholders’ funds R1.2 billion
70
R’m
116
0706
05
160
08
212
He
ad
line
ea
rnin
gs
513
‘000
706
1010
1371
Act
ive
clie
nts
0807
0605
Re
turn
on
eq
uity
16%
23
26
22
0807
0605
C a p i t e c B a n k H o l d i n g s L i m i t e d
Annual Report 2008

Free State
Northern Cape
KwaZulu-Natal
Key Performance Indicators
Change08/07
-NatalKwaZulu-N5533Free State
Northhern Cape
National Network
331 BranchesLimpopo
Mpumalanga
33666666
2233Gauteng
79
1199North West
46Western Cape
Eastern Cape
In six years Capitec Bank’s low-cost banking model
has attracted 1.4 million clients, through 331 branches,
and created over 2 800 job opportunities.
Company Structure
Board and senior management excluding
black directors23.31% Various
shareholders 25.8%PSG
Group 34.9% sBEE 15.99%
Capitec Bank Holdings Limited 1999/025903/06(Listed and registered as a bank controlling company)
100% Capitec Bank
Limited1980/003695/06
75% Key Distributors
(Pty) Ltd
100% Other
Subsidiaries2001/000964/07 No activity
Capitec BankGroup Employee
Empowerment TrustIT 4069 /2007
Capitec Bank Holdings Share
TrustIT 3044 /2000 Share
Incentive Trust
C a p i t e c B a n k H o l d i n g s L i m i t e d1
2008 2007 2006 2005 Operations
Profi tability
Income from operations Rm 1 095 857 28% 672 491
Operating expenses Rm (771) (614) 26% (506) (392)
Tax Rm (95) (76) 25% (51) (32)
Preference dividend Rm (17) (8) 123% - -
Earnings attributable to ordinary
shareholders
• Basic Rm 212 159 33% 115 67
• Headline Rm 212 160 32% 116 70
Cost-to-income ratio – banking activities % 58 60 (3%) 66 74
Return on ordinary shareholders’ equity % 22 26 (17%) 23 16
Earnings per share
• Attributable Cents 258.8 220.9 17% 163.4 97.9
• Headline Cents 259.0 222.4 16% 165.0 100.9
• Diluted attributable Cents 250.3 209.5 20% 154.7 91.7
• Diluted headline Cents 250.5 210.9 19% 156.2 94.5
Dividends per share
• Interim Cents 25.0 20.0 25% - -
• Proposed fi nal Cents 75.0 60.0 25% 45.0 30.0
Dividend cover x 2.6 2.8 (7%) 3.7 3.4
AssetsTotal assets Rm 2 936 2 191 34% 1 251 805
Net loans and advances Rm 2 019 803 151% 455 208
Cash and cash equivalents Rm 618 1 044 (41%) 582 363
Investments Rm 14 112 (87%) 7 17
Other Rm 285 232 23% 207 217
LiabilitiesTotal liabilities Rm 1 719 1 074 60% 687 332
Deposits Rm 1 528 897 71% 595 281
Other Rm 191 177 7% 92 51
EquityShareholders’ funds Rm 1 217 1 117 9% 564 473
Capital adequacy ratio % 36 79 (54%) 56 84
Net asset value per ordinary share Cents 1 297 1 175 10% 784 672
Share price Cents 3 900 3 700 5% 3 105 1 490
Market capitalisation Rm 3 195 3 031 5% 2 233 1 072
Share options
• Number outstanding ’000 5 159 6 191 (17%) 5 841 6 753
• Average strike price Cents 1 815 1 151 58% 648 271
• Average time to maturity Months 24 24 – 28 25
• Charge on settlement Rm 48 22 118% 31 16
OperationsBranches 331 280 18% 253 251
Employees 2 800 2 129 32% 1 901 1 708
Active clients ’000 1 371 1 010 36% 706 513
Own ATMs 328 264 24% 210 180
Partnership ATMs 437 143 206% - -
Mobile banking units 86 53 62% - -
Capital expenditure Rm 117 86 36% 72 84
SalesLoans
• Value of loans advanced Rm 5 162 3 449 50% 2 863 2 259
• Number of loans advanced ’000 3 155 2 924 8% 2 650 2 486
• Average loan amount R 1 636 1 180 39% 1 080 909
• Loan revenue Rm 1 284 1 001 28% 768 534
• Net loan impairment expense Rm 231 161 43% 96 39
• Net impairment to repayments % 5.10 4.12 24% 2.85 1.45
Deposits
• Value of savings deposits Rm 842 554 52% 314 74
• Number of savings clients ’000 783 583 34% 375 143
• Net transaction fee Income Rm 79 35 128% 15 4

C a p i t e c B a n k H o l d i n g s L i m i t e d
“Since Capitec’s arrival on the banking scene there has been
a shift in the mind set of conservative banks as they have
woken up to the potential in the emerging segment.”
Richard Stovin-Bradford
7 November 2007
An Innovative Alternative to Traditional Banking

C a p i t e c B a n k H o l d i n g s L i m i t e d2
The Market
The need for simplifi ed, accessible and low-cost banking is evident
across all income sectors in the market. The level of personal saving in the market is alarmingly low,
but understandable, as returns on everyday savings are poor. The average client incurs fees and costs
that exceed the savings returns in an account on an annual basis. Transaction costs are high, fi nance is
generally inaccessible and processes are cumbersome, with long delays before a response or approval is
given. Capitec Bank has tailormade its Global One Banking Facility to address all these shortcomings.
Capitec Bank has redefi ned the way retail banking is accessed in South Africa and has challenged
the conventional way of delivering value to clients. The innovative banking platform has enabled the
Bank to engage the market where other banks were reluctant to venture.
The wayto bank
C a p i t e c B a n k H o l d i n g s L i m i t e d 3
T h e M a r k e t
Value
The all-in-one Global One Banking Facility is the most
affordable day-to-day transaction account available. It is
also the most attractive and fl exible savings package of its kind
in the market with the highest interest return for the everyday
saver. Furthermore, this facility provides access to a very price
competitive range of credit products with the added advantage of
immediate availability of funds.
Transacting value is unbeatable, as purchases with the Global One
Gold Card incur no fees and cash withdrawals at selected retailers
can be done for only R1 per transaction. Access to the easiest
online banking completes this substantial package! Despite
competition in the market, the Global One offer enjoys phenomenal
success, with client numbers now in excess of 1.3 million.
Convenience and simplicity
Capitec Bank’s unique offer is communicated in such a way
that everyone clearly understands what is being delivered and
how much they are paying for it. Added to this is the paperless
application process for transacting, savings or lending options,
making our offer the most simplifi ed and accessible in the
market. This Global One Banking Facility gives clients access
to a range of products that fulfi l their essential banking needs and
which are all managed via a single card.
The application process for savings accounts and personal
loans is effortless, taking just minutes to complete. Where credit
applications are concerned, the credit-granting process complies
with the National Credit Act and gives approval of applications in
minutes.
Convenience has been further enhanced with minimum
banking hours that are from 08:00 to 17:00 on weekdays and
08:00 to 13:00 on Saturdays. Our 331 branches are often open
from 07:00 to 19:00 on peak days to accommodate clients
commuting to or from work.
Agreements have been established with major retailers to give
clients access to the banking system. Purchases and cash
withdrawals can be done at any till point at Shoprite, Checkers
and Pick n Pay. The Maestro- and Visa- endorsed Global One
debit card facilitates local and international card purchases at most
retailers. Capitec Bank is also part of the Saswitch network, so
clients can access not only our 765 ATMs, but all other banks’
ATMs nationwide for cash withdrawals and transacting.
Security
Client account security is key at Capitec Bank and advanced
technology is used to prevent unauthorised or illegal access. All
transactions performed by branch consultants are controlled via
biometric authorisation. This enables paperless tracking when
account enquiries arise, facilitating speedy resolution. Further
enhancements to security are being implemented via biometric
verifi cation of clients.
In addition to biometric verifi cation, photo ID is used to facilitate
instant client recognition. A digital photograph of the client is
captured during the opening of the Global One Banking Facility.
Whenever clients visit a branch, they swipe their Global One
Gold Card before being prompted to enter their unique PIN. The
system recalls the client’s photograph, allowing the consultant
to identify the client in person.
ATMs and drop safes ensure that Capitec Bank’s branches are
largely cashless, which provides a safer and more accessible
environment to clients, with reduced risk of robberies.
The retail internet banking service offered by Capitec Bank from
January 2008 uses a unique security token which generates a
once-off code each time a registered user does a transaction. This
is in addition to normal user identity verifi cation and passwords.
Security tokens are issued during the registration process and
linked to a client’s account.
Personal service
Capitec Bank consultants are employed for potential and trained
for skill. This ensures consistent quality at the service interface.
They are specifi cally selected from local communities where the
branch is situated, to afford clients the opportunity of being served
in the language of their choice. Branches are situated where
clients shop, commute and work. The branch design promotes an
open and friendly atmosphere with a focus on personal support
and service.
Since inception, the Bank has had a client-centric business approach which delivers the following:
value, convenience, simplicity, security and personal service.

T h e M a r k e t
C a p i t e c B a n k H o l d i n g s L i m i t e d4
Our consulting processes are directed at empowering clients to
make the right choices given their individual needs.
Capitec Bank has a dedicated 24-hour client care centre which
gives clients assistance when they need it. Capitec Bank also
encourages personal development by promoting a basic fi nancial
skills programme made accessible to interested parties.
Innovation
Capitec Bank invested in world-class systems and innovative
technology to provide unique products and services to the
market. While this has delivered accessibility, simplicity and good
value for money to clients, it has also enabled a streamlined,
low-cost service platform which drives high volume effi ciency.
Our system-driven service model which uses biometrics, photo
verifi cation and card access, means diverse skill levels are not
required throughout the entire branch network. No costly back-
offi ce functions are required in branches and the innovative
system design ensures that the minimum resources are used
for the centralised control and support functions. In-branch
processes are continuously being improved to simplify client
fl ow and reduce administrative demands. Further enhancements
are being designed and will be applied in 2008/9 to improve
effi ciency and increase capacity.
Mobile banking is another innovation from Capitec Bank. This
takes banking to the market and gives clients the opportunity
to open a Capitec Bank account, do transactions or activate
savings facilities from their place of work.
The South African market - 2007The South African market 2007
• 19 million banked adults
• 13 million unbanked adults
• 18 million active credit clients
• R32 billion was extended in credit in
the microfi nance sector of the market for
the year ended May 2007*
• 42 % of salary/wage received by
individuals was in cash
*Small loans and retail credit
Source: Finmark
Banked vs Unbanked
60.3% Currently banked
9.6% Previously banked
30.1% Never banked
Income received via
cash or account
58% Salary/wage received into bank account
42% Salary/wage received in cash

C a p i t e c B a n k H o l d i n g s L i m i t e d
“I became a client of Capitec Bank in February 2006 and since then
my life has never been the same. The attention you get from the bank staff,
the support, the approvals of loans or savings; it’s never been this easy.”
Sonia Mathe
Capitec Bank Client
780 000 savings clients trust us with their money

C a p i t e c B a n k H o l d i n g s L i m i t e d6
Letter to Shareholders
A small failure or a big success
When we started Capitec Bank seven years ago, I predicted
that Capitec would be either a small failure or a big success.
Had we failed, we would probably have done so soon and
disappeared in a puff of smoke, only to be remembered by
ourselves. If we succeeded, we would change the way banking
is done forever and not only in South Africa. At this stage we are
too substantial to be a small failure – not that we ever had the
inclination to go this route – with 331 branches, 2 800 employees
and a market capitalisation of R3 billion. Do we rate ourselves
as a success? Surely yes, with a profi t of more than R200 million
and the fact that we have established South Africa’s fi rst new
retail bank in a generation. Yet we hardly feel satisfi ed, so much
remains to be done.
Profi t - R212 million
The R212 million headline profi t we can report to our shareholders
represents a growth of 32% on last year, but growth per share of
only 16% if we bear in mind that we issued 10 million new shares
at R300 million to our BEE partners at the end of our last fi nancial
year. This latter percentage is the most modest growth in profi ts
since Capitec Bank’s inception. Our expenses grew by 26% as we
invested heavily in branch expansion, system development and
staff training. We regard the profi t growth as satisfactory for one
reason: the National Credit Act.
This piece of legislation came into force in mid 2007. We
support its main impact on credit-granting: to base credit on the
ability of a borrower to repay. We have never considered assets
when making credit decisions and only look at ability to repay. We
do, however, decry some of the consequences of the Credit Act.
We believe in transparency when dealing with our customers
and our fees are always easy to understand. The interest we
charged our customers used to be a high, but an all inclusive
number. The new Act obliges us to charge a complicated fee,
consisting of an initiation fee, a monthly administration fee and
interest. (Our fi nancial statements term these fees “loan fee
income” to distinguish them from conventional transaction
fees.) What’s more, the fees are subject to value added tax.
A structure designed to protect the consumer has cost us
R65 million in additional tax.
The most pernicious effect of the legislation is the introduction of
prescribed maximum interest rates and fees. At Capitec Bank
we have followed a consistent approach to the high interest rates
which used to be the norm in our industry: every year our rates were
lower than in the previous year. This has resulted in growth in both
the size of loans and the number of loans, the support of higher-
income customers who are more credit-worthy and overall
lower default rates. At the same time we have had to balance a
reduction in rates carefully with our cost structure, the investment
needed to grow and the profi t expectations of the market. The
Credit Act disrupted our measured approach and forced us to drop
our rates faster than we would have done, apart from diverting
time and investment to comply with an overly bureaucratic way of
doing business. These are the circumstances which lead us to be
satisfi ed with a fairly pedestrian profi t performance.
Our larger capital base means that our return on capital
dropped during the current year from 26% to 22%. This is a
temporary effect that will be nullifi ed as our business grows. This
time last year, we felt that the additional capital of R300 million
we raised was in excess of our needs but we did the transaction
to increase our BEE shareholding. We are now glad that we did.
Our three-year loans have grown signifi cantly and our total loan
book amounts to R2.1 billion (151% more than last year’s R803
million). The American subprime crisis has resulted in a tightening
of funding markets in South Africa, making a strong capital base
a big asset.
As reported last year, our employee empowerment trust is a 5%
participant in the BEE deal, amounting to 500 000 Capitec shares.
These shares have been allocated to all our staff (excluding only
those participating in our share option scheme) so that each staff
member will, over the next fi ve years, receive the growth in value
of 200 shares less the funding cost of the shares.
“Is it a bird? Is it a plane? No, it’s CAPITEC BANK!”
Suddenly Capitec Bank is everywhere. During the past year we launched our fi rst large advertising campaign and
our name is now recognised in our target market as much as the weakest of the four traditional banks (This may not be
a huge achievement, but it is a decent beginning). We have 331 branches, one in every corner of our country, 51 more than
last year. Our Internet banking is available to customers in the Eastern and Western Cape and will soon be available
everywhere. This is not an invisible service. It will be much talked about because it will bring the real benefi ts of internet
banking to all South Africans for the fi rst time. It will stress that we are building a ubiquitous bank, providing all basic banking
services, including those required by the young and modern. We have over 1.3 million customers, 36% more than last year.

C a p i t e c B a n k H o l d i n g s L i m i t e d
L e t t e r t o S h a r e h o l d e r s
7
Moody’s national credit rating
During the year Moody’s Investor Services upgraded the long-
term national scale credit rating of Capitec Bank Limited,
Capitec’s banking subsidiary, by two notches to A2.za. The short-
term rating at Prime-2.za remains unchanged.
Instant gratifi cation
The customer walks into a shop, buys a can of beans, and
walks out. What’s the big deal? This is exactly what we do:
the customer walks into Capitec Bank, applies for a loan, and
walks out with the money. If it’s a new customer, we have to
open an account for the customer’s, issue a card and make the
loan accessible via the card. What’s the big deal? The big deal is
that no private bank in South Africa can do this, not even for a
client of thirty years’ standing.
At traditional banks, a client request results in the opening of a
fi le (in modern banks, it is an electronic fi le) which will wind its
way through various departments and committees, before the
bank will respond to the client. We regard the customer’s request
as an opportunity to complete the transaction. If we need credit
bureau information, that information is immediately retrieved
electronically. If we need to verify information, that verifi cation
is done immediately. Here is an example: when a customer
opens an account, an electronic photo of her is saved on her fi le.
When a lost card needs to be replaced, one of the checks is that
we confi rm from a photo on the system that the applicant is the
same person as the one to whom the card was originally issued.
This is not only what the customer wants, it is also a very effi cient
way of doing business. Every fi le with unfi nished business
represents an impediment to the fl ow of new business. (Can you
imagine if Home Affairs had the same approach to issuing an ID
document or passport?)
We can offer this level of service only if all our processes
have been carefully planned: do it well, or don’t do it at all. Our
front-line staff need to be well trained. Every action is performed
on the system in real time.
Banking is about detail
Broad strategic approaches to banking are of limited value.
Everybody knows that the consumer wants more action and
less paperwork. To achieve it requires no unique strategy, but the
focus on detail.
No staff member may deal with the public before graduating from
our Firm Foundations programme. All new staff members have
to pass this intensive two-week course, which is offered in
Stellenbosch. In the past fi nancial year we spent R19.2 million on
staff training. Our total investment in staff training amounted to
a massive 9% of our total operations salary bill (yet we remain
subject to a special “training tax” in the form of a SETA levy of
R3.2 million, less a refund of R1.3 million.)
The same meticulous attention to detail that is found in staff
training and systems design is also present in our branch
network. The lay-out of our branches, the size of the branches
and the location of every branch are the result of careful
planning. When we started the bank, sites were readily available
in the market. We were proud of the fact that in most areas our
branches were modern and stood out in comparison to other
shops in the vicinity. In seven years the business environment,
in the poorer areas in South Africa’s townships and rural areas,
was transformed beyond recognition. A huge investment has
gone into glamorous shopping malls, as well as into strip malls
and individual shops. Upgrading these business centres has
signifi cantly improved the quality of life of local residents.
Last year we planned to open 65 new bank branches. In fact, we
only opened 54 and closed 3. We have simply not been able to
fi nd the sites we require at reasonable rates. We have slightly
moderated our ambitions and plan to open 31 new branches in
the coming year.
We have 5 branches in Soweto, 13 in downtown Johannesburg but
none in Sandton. This illustrates our focus on the market for basic
banking, but as we grow we need to cover all parts of the country,
not only MtubaTuba and Kwaggasrant, but also Sandton.
Capitec Bank is the most technologically advanced bank in
South Africa and maybe the world. We cannot operate without
a modern infrastructure, including telecommunications and
electricity. We have generators to provide electricity to our call
centre, campus and mainframe computers. We cannot provide
electricity to all our branches.
The Capitec revolution
We dream of the day when Capitec Bank will provide banking
to all South Africans who need basic banking products. Doing
banking the Capitec way should be as painless as buying
bread or a Coke*. A cold cool drink or a fresh loaf of bread
in every remote shop in South Africa is the visible tip of an
impressive production and distribution system. Capitec Bank
needs a production machine (it’s pretty much there), a brand
(we have started advertising, but everything we do is meant to
inspire confi dence in Capitec Bank), thousands of access points
(we have hundreds) and millions of customers. (“Clients” are
served by people with ties in offi ce blocks; “customers” make a
quick and easy transaction wherever it suits them.)
*Registered trademark. We respect trademarks.
Our fees are low and easy to understand. The traditional

L e t t e r t o S h a r e h o l d e r s
C a p i t e c B a n k H o l d i n g s L i m i t e d8
range of loan products, from one month to three years. Longer
term loans tend to be bigger, with lower administration costs and
we charge lower interest rates on these loans. The default ratio
is lower on a per month basis, but higher over the life of longer
term loans.
With the introduction of a three-year loan in October 2007, we
compete across the spectrum of loans on offer to our customers.
We have exceptional skills in managing risk and ensuring
repayments from our customers.
The board of directors
Jannie Mouton has been our chairman since Capitec Bank
was founded in 2001. Jannie was an early and staunch supporter
of the Capitec Bank revolution. Without his support and the support
of the PSG Group (of which he is the founder and chairman and
which remains our largest shareholder), Capitec Bank would
never have come into being. A year ago I took over as chairman
from Jannie. Since then Jannie has also retired as a director of
Capitec Bank.
At the same time Jacobus van Zyl Smit retired as a director. He
was chairman of our audit committee and also a constant source
of advice based on experience and knowledge.
We thank Jacobus and Jannie for their loyalty and wisdom.
During the year four new members were appointed to our board:
Tshepo Mahloele (CEO of Pan African Infrastructure Development
Fund and deputy chairman of Circle Capital Ventures), Piet Mouton
(managing director of Thembeka Capital), Pieter van der Merwe
(after his retirement as executive director of Absa responsible for
Group Administration, IT, Information Management, Credit and
Risk) and Kevin Hedderwick (Chief Operating Offi cer of Famous
Brands, well-known for its Steers and Wimpy restaurants). They
bring a wide range of experience with them.
It is important that the board be revitalised from time to time. The
board of directors oversees the management of the bank. It is the
management of the bank who are responsible for the amazing
story of Capitec Bank that I report on and we remain in awe of
what Riaan Stassen and his team have achieved.
The future
We see great opportunity in the expansion of our product range,
our branch network and our transaction platform in the coming year.
Capitec Bank will continue to revolutionise banking in South Africa.
Michiel Le Roux
Chairman
banks have complicated fees. Our fees are generally 50%
lower than the traditional banks. A typical Internet banking
service at a traditional bank carries a fi xed monthly cost of
R19.95. Some payment fees are as high as R3 plus 60c per
R100 with a maximum of R12.50. Our new Internet banking
service charges no monthly fee and R1.75 for a payment,
irrespective of value.
We look carefully at what our customers require. The fi rst
transaction many of our customers do, is to check the balances
on their accounts. We offer it free, on the fi rst screen that opens
on our ATMs.
Much has been said about high banking fees in South Africa.
At Capitec Bank we admire the four traditional banks that
dominate our banking scene. They manage a complicated,
universal banking model extremely well. In the same queue
at their branches you fi nd a rich businessman, a poor salary
earner and a housewife. We focus on a single slice of the South
African community and tailor our offering to meet her or his exact
needs. This both allows us and requires us to charge lower fees.
Needless to say, we do not believe in government intervention
to reduce fees which are the result of free, competitive forces.
We believe in competition. We believe in the revolution. La lutta
continua!
Two million customers
When we started we believed we needed two million
customers to be a success. Many of the targets we set
ourselves seem modest by the time we attain them. We could
reach the target of two million active customers during the
coming year, but we are now striving towards fi ve million.
In a good month we open 40 000 new accounts. At the same
time thousands of customers stop using their accounts (nobody
ever closes an account). We have over 520 000 loan customers
who took a loan during the last six months and 851 000 salary
deposit and savings customers, a total of over 1.3 million
customers. Our lending business is impressive: we granted a
total of 3.2 million individual loans during the year, with a total
value of R5.2 billion (a 50% growth over last year). At peak
times, we process 3 000 loans per hour. On average, it takes 10
minutes to approve a loan application for an existing customer.
Remember, Capitec Bank never requires any customer to fi ll
in a form. Every transaction is done by a consultant, directly on
the system. The customer must sign a printed copy of the loan
agreement and receives a copy for his own use. Every transaction
is confi rmed by our consultant by means of a fi ngerprint reader.
This creates a permanent audit trial.
We started by buying 300 cash loan stores with a single product:
a thirty-day cash loan at 30% interest per month. We now offer a

C a p i t e c B a n k H o l d i n g s L i m i t e d
Sunday Times Top 100 Companies Award Capitec ranked 3rd for investment
performance over f ive years
“Don’t expect Capitec to be anywhere other
than one step ahead of its competitors.”

C a p i t e c B a n k H o l d i n g s L i m i t e d1 0
Chief Financial
Offi cer’s Report
Infrastructure development
The Capitec Bank business strategy is aimed at ensuring
sustainable long term revenue and profi t growth and therefore
focuses heavily on infrastructure development. During the year
the following progress was made:
• 54 branches were opened, while two smaller branches were
closed and a third branch temporarily closed, bringing the total
to 331. The performance of the new branches is satisfactory
• The average number of frontline staff per branch increased
from 5.6 to 6.4
• The total number of ATMs was increased to 765, of which
437 are third party ATMs. This means that clients’ access to
cash outside business hours and without the higher cost of
SASWITCH ATMs has been extended, in addition to the access
already available through retailers at point of sale
• A further 33 mobile bank units were implemented, bringing
the total to 86 and increasing support for our sales team by
helping primarily the account opening process
• The 36 month loan product was introduced, including
changes to vetting, scoring and affordability computations
required to ensure that the product will be profi table
• Point of sale debit and credit card acquiring was launched
• Internet banking has been launched in two provinces and roll
out across the rest of the country is in progress
• E-learning was introduced to distribute technical training to
branch staff throughout the country. This also enables us to
centrally monitor progress of each staff member and identify
trends where processes and procedures require further
training.
In addition to the above, the requirements of the National Credit
Act (NCA) were successfully implemented during the year. Our
level of preparedness made an important contribution to sales
growth, while other market participants struggled to come to terms
with the requirements and implications of the Act.
Loan bookboo
Value of loans advanced by product2 000
1 500
1 000
500
0
1 month 3 month 6 month 12 month 18 month 24 month 36 month Total
2007 1 600 687 392 425 190 155 - 3 449
2008 1 692 757 314 797 430 774 398 5 162
R’m

C a p i t e c B a n k H o l d i n g s L i m i t e d 11
C h i e f F i n a n c i a l O f f i c e r ’ s R e p o r t
The NCA replaced the exemption to the Usury Act under which
Capitec previously operated. We continuously refi ne our credit
vetting, scoring, affordability and instalment recovery processes.
This enabled us to launch longer term products such as our
36 month loan product in October 2007.
We believe that the traditional model of asset based fi nance offers
little real protection to lenders in the market where we operate.
We therefore focus on behaviour, affordability and good
administration. Furthermore, we fi x our interest rates over the
term of the loans to reduce the interest rate exposure of our
clients. We match this with fi xed rate funding of at least similar
duration.
The growth in long term products led to an increase in the net loan
book of 151% over last year. The revenue from the new products is
deferred over the term of the products and therefore does not have
an immediate impact on the revenue for the current year. The impact
of the 12, 18 and 24 month products that were in place throughout
the year was more signifi cant to overall revenue growth.
Loan revenue by productLoan revenue by productLoan revenue by product
300
250
200
150
100
50
0
1 month 3 month 6 month 12 month 18 month 24 month 36 month other Total
2007 285 232 209 220 31 22 - 2 1 001
2008 259 211 113 296 169 213 39 4 1 284
R’m
Loan book by product
1 month 3 month 6 month 12 month 18 month 24 month 36 month other Total
2007 Gross 108 103 91 270 176 150 - 16 914
2007 Net 98 92 72 231 165 144 - 1 803
2008 Gross 118 138 104 449 314 660 384 25 2 192
2008 Net 109 121 89 408 292 622 370 8 2 019
700
600
500
400
300
200
100
0
R’m
C h i e f F i n a n c i a l O f f i c e r ’ s R e p o r t
C a p i t e c B a n k H o l d i n g s L i m i t e d1 2
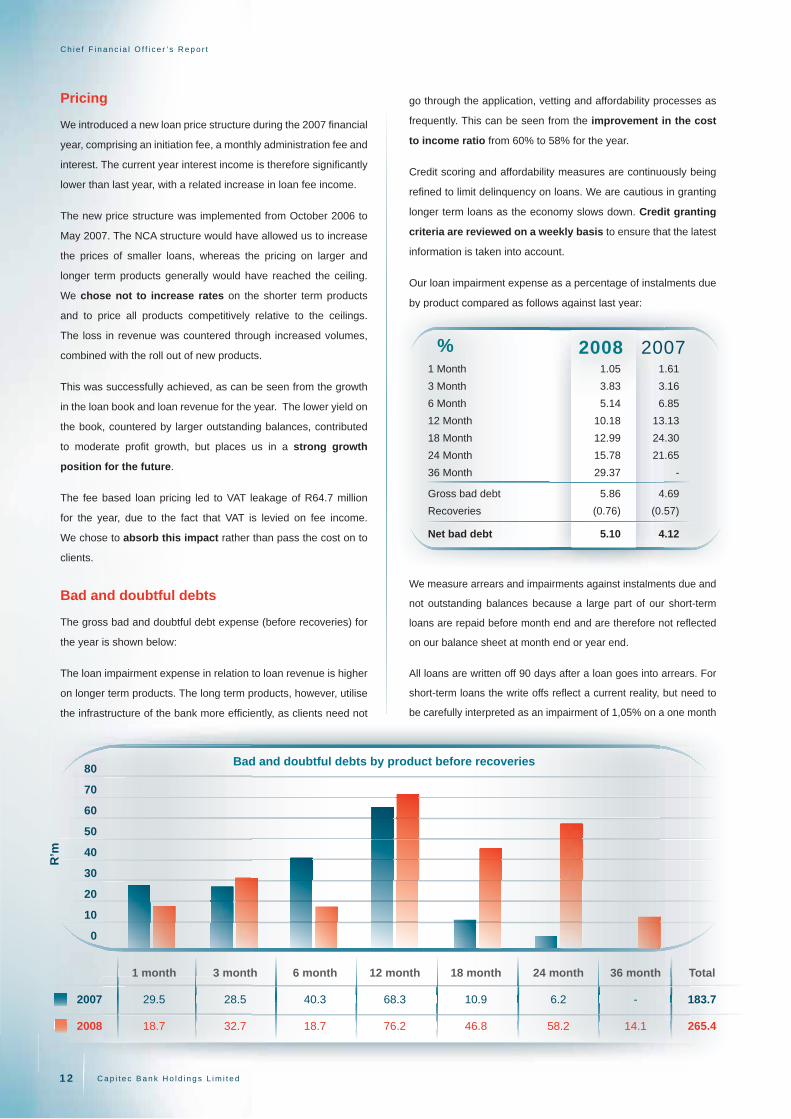
Loan revenue by productLoan revenue by productBad and doubtful debts by product before recoveries
80
70
60
50
40
30
20
10
0
1 month 3 month 6 month 12 month 18 month 24 month 36 month Total
2007 29.5 28.5 40.3 68.3 10.9 6.2 - 183.7
2008 18.7 32.7 18.7 76.2 46.8 58.2 14.1 265.4
Pricing
We introduced a new loan price structure during the 2007 fi nancial
year, comprising an initiation fee, a monthly administration fee and
interest. The current year interest income is therefore signifi cantly
lower than last year, with a related increase in loan fee income.
The new price structure was implemented from October 2006 to
May 2007. The NCA structure would have allowed us to increase
the prices of smaller loans, whereas the pricing on larger and
longer term products generally would have reached the ceiling.
We chose not to increase rates on the shorter term products
and to price all products competitively relative to the ceilings.
The loss in revenue was countered through increased volumes,
combined with the roll out of new products.
This was successfully achieved, as can be seen from the growth
in the loan book and loan revenue for the year. The lower yield on
the book, countered by larger outstanding balances, contributed
to moderate profi t growth, but places us in a strong growth
position for the future.
The fee based loan pricing led to VAT leakage of R64.7 million
for the year, due to the fact that VAT is levied on fee income.
We chose to absorb this impact rather than pass the cost on to
clients.
Bad and doubtful debts
The gross bad and doubtful debt expense (before recoveries) for
the year is shown below:
The loan impairment expense in relation to loan revenue is higher
on longer term products. The long term products, however, utilise
the infrastructure of the bank more effi ciently, as clients need not
go through the application, vetting and affordability processes as
frequently. This can be seen from the improvement in the cost
to income ratio from 60% to 58% for the year.
Credit scoring and affordability measures are continuously being
refi ned to limit delinquency on loans. We are cautious in granting
longer term loans as the economy slows down. Credit granting
criteria are reviewed on a weekly basis to ensure that the latest
information is taken into account.
Our loan impairment expense as a percentage of instalments due
by product compared as follows against last year:
We measure arrears and impairments against instalments due and
not outstanding balances because a large part of our short-term
loans are repaid before month end and are therefore not refl ected
on our balance sheet at month end or year end.
All loans are written off 90 days after a loan goes into arrears. For
short-term loans the write offs refl ect a current reality, but need to
be carefully interpreted as an impairment of 1,05% on a one month
by product compared as follows against last year:
%
irments against instalmen
1 Month 1.05 1.61
3 Month 3.83 3.16
6 Month 5.14 6.85
12 Month 10.18 13.13
18 Month 12.99 24.30
24 Month 15.78 21.65
36 Month 29.37 -
Gross bad debt 5.86 4.69
Recoveries (0.76) (0.57)
Net bad debt 5.10 4.12
2008 2007
R’m

C a p i t e c B a n k H o l d i n g s L i m i t e d 1 3
C h i e f F i n a n c i a l O f f i c e r ’ s R e p o r t
loan means that we expect to write off 12 times that percentage
over a 12 month period.
Longer term loans are more complex and provisioning against
these loans contains less certainty. The impact of a missed
instalment is more severe at the beginning of a loan, as the full loan
amount may be at risk. Therefore the provision as a percentage
of instalments is higher for a new and growing loan book. Over
time every new product reverts to a normal distribution of arrears.
This is why the impairment expense of 18 and 24 month loans
has improved signifi cantly and why the new 36 month loans
start with a high level of impairment. We expect the 36 month
fi gure to reduce signifi cantly towards maturity.
We consider the current provisions to be adequate, given our
clients’ payment history and the current economic environment.
The breakdown of the loan book between current loans, loans in
arrears and estimated incurred but not reported arrears, as well
as the movement in the loan provision account is set out in Note 6
to the fi nancial statements.
Income recognition
International Financial Reporting Standards require that revenue
from services rendered should be recognised based on the
stage of completion of the services. Revenue from the creation of
fi nancial assets such as loans and advances should be recognised
based on the yield to maturity basis over the term of the loan.
Capitec Bank offers transacting and savings services in addition
to loan products. The pricing of loan products includes recovery
of some of the transacting services. Loan fee income is therefore
partially refl ected in the month that the transacting services are
rendered and the remainder refl ected over the term of the loan,
taking into account the relative activity levels and costs related to the
respective services.
Balance sheet structure
Funding
The growth in the loan book has signifi cantly reduced our excess
funds during the second half of the fi nancial year. We disposed
of our investment in listed preference shares, where some of
our excess funds were placed. We have successfully obtained
additional funds through the issue of commercial paper. We
obtained further funding through a loan of R150 million from
PROPARCO (the French development agency) after year end.
Our cash and bank balances at month end are normally higher
than during the middle of the month, before clients’ salaries are
deposited and loans are repaid (see chart below). Our business
model therefore requires a substantial buffer of cash that appears
superfl uous at month end and we manage this extremely
conservatively.
Growth in the retail saving book, increased by 51% over last
year. Higher interest rates have made the savings rates offered
by the traditional banks more competitive and we are continually
reviewing this position in order to ensure that we are close to the
market on high value deposits but market leaders on low value
savings accounts. This gives us an advantage in marketing our
products to the mass market, though we do not rely on funding from
call savings deposits to fund term loans. We do utilise a portion of
the savings deposits to fund short term assets such as cash and
very short term loans.
Liquidity
The longer term loan products have changed the liquidity profi le of
the bank. Previously our loan book was mainly short term based,
with a short average duration for assets. The introduction of 36
month loans and the continued growth in 18 and 24 month loans
has changed this signifi cantly. We are therefore extending the
duration of our funding. We have enough history on our savings
loan means that we expect to write off 12 times that percentage Balance sheet struucture
9%
8%
7%
6%
5%
4%
3%
2%
1%
0
1 2 3 4 5 6 7 8 9 10 11 12 13 14 15 16 17
Loans over 90 days in arrears as percentage of contractual instalments
Months since advance
6 month 12 month 18 month 24 month 36 month

C h i e f F i n a n c i a l O f f i c e r ’ s R e p o r t
C a p i t e c B a n k H o l d i n g s L i m i t e d1 4
products in order to determine the stable core component of the
retail deposits and this is utilised to fund short term assets such as
cash and very short term loans. Capital and long term funding is
used to fund the medium and long term loan products, as well
as fi xed assets.
Taxation
Out tax loss was fully utilised during the 2006 fi nancial year and
together with our profi t growth, this had an impact on cash fl ow in
the current fi nancial year compared to previous years. Tax paid in
the current year amounted to R109 million compared to R21 million
in the 2007 fi nancial year.
Our approach to tax risk is very conservative and benchmarking
indicates that our tax contribution relative to indicators such as
profi tability and size is above average compared to similar and
larger listed companies.
Capital
The growth in the loan book furthermore reduced our capital
adequacy ratio as planned. The calculation of capital adequacy
ratios has changed after the introduction of the Basel II Framework
for Capital Adequacy as prescribed by the South African Reserve
Bank from 1 January 2008.
Basel II requires that capital be held against all the different risks
in the bank, with lower levels of capital required in cases where
policies, systems and procedures are in place to address these
risks, where the risks can be quantifi ed more accurately through
sophisticated event tracking and modelling and where the risks are
more predictable due to characteristics such as high volumes of
low value transactions.
We believe that our strategy of focus on a single niche market
gives us advantages in all of the requirements above.
The calculation of capital required for operational risk under
the Basic Indicator Approach (BIA) is a generic measure and is
based on the gross income for the preceding three years as
a proxy of the scale of a bank’s operational risk. In terms of the BIA
Capitec’s capital adequacy ratio at 29 February 2008 amounted
to 36%.
We will replace the BIA with the Alternative Standardised Approach
(ASA) with effect from 1 April 2008 after the South African
Reserve Bank approved our application, subject to standard
conditions, as part of the capital planning process. This will reduce
our capital requirements and allow further growth from our current
capital base.
According to our best estimate, if the ASA had been used in the
calculation of the bank’s capital adequacy as at 29 February 2008,
the capital adequacy ratio would have been 53% as against the
36% reported using the BIA.
We will consider more advanced methods for other areas as our
capital requirements and the benefi t from the application of more
advanced methods evolve over time.
André du Plessis
Chief Financial Offi cer
Loan book movement compared to retail deposits - February 2008
2 300
2 200
2 100
2 000
1 900
1 800
1 000
900
800
700
600
500
1 2 3 4 5 6 7 8 9 10 11 12 13 14 15 16 17 18 19 20 21 22 23 24 25 26 27 28 29
Loan book Deposit book
Lo
an b
oo
k R
’m
Dep
osi
t b
oo
k R
’m

FM’s Top CompaniesCapitec Bank Holdings
ehousi gg
Distribution & Warehhouussiinnggeh
nt
HHosken Coonnss IInnvvveeessttmmeen
PPetnim
Scchhaarrrriigg MMinniinngg
Aflfl eeaassee GGoolldd
Pinnnaaccllee TTecchhhnnoolloogggyyy HHoollddiinnggs
msttoonnBrim
Simmer &&
HHHoollddinQQuuyyynnn
EEEdddgggaarrs CCo
Baassiiilll RRReeeaaddd
ooonnssoollidKiinnggg CCCoooKK
HHooowwwddddeeennn AAAfrica H
Capitec Bank Holdings
Straight to number one
Financial Mail - Top Companies
29 June 2007
“This year’s top company, Capitec, achieved
a rare feat, coming from nowhere
to head a new-look top 10 list.”
Financial Mail
C a p i t e c B a n k H o l d i n g s L i m i t e d

C a p i t e c B a n k H o l d i n g s L i m i t e d1 6 C a p i t e c B a n k H o l d i n g s L i m i t e d
Directorate and Executive
Independent non-executive
Kevin Alexander Hedderwick (55)
Kevin joined the Capitec and Capitec Bank boards on 10 December 2007.
He is the chief operating officer of Famous Brands. He has an excellent
business retail record, including food, beverages and franchising. He
has held senior executive positions in a number of prominent companies
including SAB, Distell and Foodcorp. Prior to joining the Famous Brands
Group, he was a partner and managing director of Keg Franchising.
Michiel Scholtz du Pré le Roux (58) BComm LLB
Michiel was appointed chairman of Capitec and Capitec Bank on 1 April
2007. He is the founder of Capitec Bank and was chief executive officer
of the Bank until 2004. Michiel is also chairman of Quince Capital and a
board member of Zeder Investments. Michiel was managing director of
Distillers Corporation (SA) from 1979 to 1993 and from 1995 to 1998,
managing director of Boland PKS, NBS Boland and BoE Bank.
Merlyn Claude Mehl (Prof) (65) PhD (Physics)
Merlyn serves on the boards of various companies. He was previously
chancellor of Peninsula Technikon and chief executive of the
Independent Development Trust. He is presently executive chairman of
Triple L Academy.
Nonhlanhla Sylvia Mjoli-Mncube (49) MA City and Regional Planning
Nonhlanhla is economic advisor to the deputy president of South
Africa. She has formerly chaired several companies and has worked
in leadership positions in South Africa and the USA. She presently runs
her own investment company, Mjoli Development Company and sits on
the boards of inter alia Cadiz Holdings and Pioneer Foods.
Jan Georg Solms (53) BAcc, CTA, CA(SA)
Johnnie has been a member of the JSE since 1981 and is a stockbroker
and executive director of stockbrokers Independent Securities Holdings.
Jacobus Pieter van der Merwe (59) BA, CTA, CA(SA)
Pieter joined the Capitec and Capitec Bank boards on 27 September 2007.
He is an experienced retail banker. He commenced his career in banking
as chief accountant at Boland Bank in 1974 after which he joined Volkskas
Bank as general manager of finance in 1983. After the amalgamation of
Bankorp and Absa he was appointed general manager of Commercial
Bank, responsible for Absa Western Cape (1995 – 1999). In 2000 he
was appointed operating executive of Commercial Banks. In 2001 up to
his retirement in 2006 he was executive director, the last two and a half
years of which he was responsible for Group Administration, Information
Management, IT, Credit and Risk.
Non-executive
Tshepo Daun Mahloele (41) BProc
Tshepo joined the boards of Capitec and Capitec Bank on 1 April 2007. He
is the chief executive officer of the Pan African Infrastructure Development
Fund and deputy chairman of Circle Capital Ventures. He has more than 14
years of experience in project finance, private equity, investment banking
and corporate finance. Previously he was head of Corporate Finance and
the Isibaya Fund at the Public Investment Corporation (PIC). Prior to joining
the PIC he was head of Private Sector Investments at the Development
Bank of Southern Africa (DBSA). Before joining the DBSA he was managing
director of Solutions at Work. Tshepo also held positions at CDC Group Plc
(formerly the Commonwealth Development Corporation), Rand Merchant
Bank and National Sorghum Breweries.
Petrus Johannes Mouton (31) BComm (Maths)
Piet joined the boards of Capitec and Capitec Bank on 5 October
2007. He is managing director of Thembeka Capital, a black-owned and
controlled BEE investment holding company. He serves as non-executive
director on the boards of various companies including Erbacon Investment
Holdings, an AltX-listed company. He has been active in the investment
and financial services industry since 1999.
Chris Adriaan Otto (58) BComm LLB
Chris has been an executive director of PSG Group since its formation.
He has been involved in PSG Group’s investment in microfinance and
subsequent establishment of Capitec Bank of which he has been a
non-executive director since establishment. He is a director of Zeder
Investments, and Channel Life.
Executive
André Pierre du Plessis (46) BComm (Hons), CA(SA)
Chief financial officer
André joined Capitec Bank in 2000 as Executive: Financial Management
and was appointed financial director of Capitec Bank and Capitec in May
2002. He has over 20 years’ business advisory, financial consulting and
strategic and financial management experience. He was chief executive of
Financial Management of Boland PKS and NBS Boland from 1996 to 2000
and a partner at Arthur Andersen where he worked from 1986 to 1996.
Riaan Stassen (54) BComm (Hons), CA(SA)
Chief executive officer
Riaan joined Capitec Bank as managing director in 2000 and was
appointed chief executive officer of Capitec and Capitec Bank effective
31 March 2004. He gained extensive experience in retail and banking
and held senior positions in both environments. Riaan was awarded
the Cape Times/KPMG Business Personality of the Year award on
25 October 2007. The nomination criteria for this award included business
and entrepreneurial excellence and outstanding company performance.

C a p i t e c B a n k H o l d i n g s L i m i t e d
1.4 million clients have made us their bank of choice
“Through our continued innovation we will become
the bank of choice for our market.”
Riaan Stassen CEO Capitec Bank
C a p i t e c B a n k H o l d i n g s L i m i t e d1 8 C a p i t e c B a n k H o l d i n g s L i m i t e d
Management Committee
Riaan Stassen (54) BComm (Hons), CA(SA)
Chief executive officer
André Pierre du Plessis (46) BComm (Hons), CA(SA)
Chief financial officer
Ian Craig Abrahams (39)
Manager – Credit Monitoring
Ian gained extensive experience in credit with Edgars Stores
(1990 – 1997), the Edcon Group (1999 – 2001) and at Standard
Bank Card Division (1997 – 1999). Positions held within the Edcon
Group include branch administration manager, credit manager and
regional Credit Office manager. Positions within Standard Bank
included project manager, collections manager and corporate
card marketing manager.
Jacobus Everhardus Carstens (39) BCompt (Hons), CA(SA)
Chief credit officer
Jaco gained extensive experience in the credit environment
at Old Mutual Bank from 2000 to 2004 serving respectively as
head of credit, head of credit risk: policy and decision support and
assistant divisional manager: credit, pricing and decision support.
Previous positions include being manager at BoE Bank from
1997 – 1999 and assistant manager at Ernst & Young where he
worked from 1992 to 1997.
Faick Davids (31)
Head – Distribution Systems and Procedures
Faick gained wide-ranging experience at PEP Bank from 1999 to
2001 in various aspects of the retail banking environment in which
Capitec Bank has since established itself. He joined Capitec
Bank in 2001 as national conversion manager responsible for the
conversion of existing micro lending branches into fully fledged
banking and deposit taking branches. He is currently responsible
for the development, drafting and communication of all processes
and procedures for branches and other distribution channels
within the Bank.
Carl Gustav Fischer (51) BComm (Hons), MBA
Executive – Marketing and Corporate Affairs
Carl was chief executive of marketing and support services of
Boland PKS from 1999 to 2000. Previous positions include Group
marketing and sales director (1996 – 1998) and Group production/
operations director of Stellenbosch Farmers’ Winery (1993 – 1996).
Gerhardus Metselaar Fourie (44) BComm (Hons), MBA
Executive – Operations
Gerrie was area general manager of Stellenbosch Farmers’ Winery
(1997 – 2000), focusing on distribution and sales.
André Olivier (40) BComm (Hons), CA(SA)
Executive – Business Development
André was a financial risk manager at Boland PKS from 1997 to
2000, after which he was head of operations of PEP Bank, the
micro-lending division of BoE Bank. He gained extensive audit and
business advisory experience with Arthur Andersen.
Christiaan Oosthuizen (53)
Executive – Information Technology
Chris held the position of chief executive of Information Technology
at Boland PKS, where he was employed from 1976 to 2000.
Christian George van Schalkwyk (52) BComm LLB, CA(SA)
Executive – Risk Management and company secretary
Christian was chief executive of credit risk and legal services at
Boland PKS from 1997 to 2000. Previous positions include being
a partner at attorneys Jan S de Villiers (1987 – 1996) and tax
consultant at Arthur Andersen (1985).
Leonardus Venter (46) BA (Hons), MA (Industrial Psychology)
Executive – Human Resources
Leon was a human resources manager at Iridium Africa from 1998
to 1999. Previous positions include manager of human resources
and support at Telkom SA (1993 – 1997) and area personnel
manager at Iscor (1986 – 1992).

C a p i t e c B a n k H o l d i n g s L i m i t e d
Over R19 million invested in skills development in 2008
“Receiving a bursary from Capitec Bank eliminated all financial barriers
that were originally an obstacle to study further. With the bursary
I was able to complete a financial skills course at Unisa in 2007.”
Nonhlanhla Sibisi (sales manager, KZN)
C a p i t e c B a n k H o l d i n g s L i m i t e d2 0
Corporate Governance and
Risk Management ReviewBoard functioning and effectiveness
The Capitec board meets six times per annum. A record
of attendance by each board member is published as per
Annexure A. The Capitec board operates in terms of an
approved charter which, apart from detailing the powers, duties
and responsibilities of the board, also specifi es the reserved
powers of the board and which is reviewed annually.
To allow non-executive directors the opportunity to familiarise
themselves with the Capitec business outside of board meetings,
they are invited to executive meetings, and an annual board
conference is held at which senior managers present the various
aspects of the business to directors. This approach facilitates
access by board members to company information, records,
documents and property.
The board has established various board committees to monitor
the implementation of their plans and strategies.
Board structure and continuity
The board comprises a majority of non-executive directors,
consisting of a proper balance of two executive, three non-
executive and six independent non-executive directors. A
Directors’ Affairs Committee comprising all the non-executive
and independent non-executive directors and chaired by the
chairman of the board has been established and in terms of its
board-approved charter, inter alia, is responsible for recruitment
and selection of new directors.
New appointees are recommended to the board for approval,
subject to the approval of the Registrar of Banks. To facilitate
continuity of the board, one-third of the board retires at each annual
general meeting and has to date been re-elected by shareholders.
During the period under review, the board has been strengthened
by the appointment of one more black director as well as directors
with strong retail and traditional bank exposure.
Chairman/CEO power balance
The roles and responsibilities of the chairman and chief executive
offi cer are separated. Capitec has a non-executive chairman
with proven business acumen and of good standing in the South
African business community.
• He participates actively in the selection of board members;
and
• Ensures that all directors are given opportunity to add value to
the formulation of the strategy of the company.
The chief executive offi cer’s responsibilities include
• Developing and implementing of company strategy;
• Taking initiative in managing relationships with stakeholders
and the investment public in general; and
• Acting as the chief spokesperson on behalf of the company.
The performance of the chief executive offi cer and the board as a
whole, including its committees, are appraised at least annually.
Directors’ selection and orientation
A formal orientation programme consisting of extensive
discussions on the company’s business environment and
operations are held with new directors. In addition, directors are
provided with company records such as copies of board minutes,
applicable legislation and board committee charters.
Directors are invited to attend presentations by independent
specialists on matters relevant to the board in the Capitec
environment and when considered necessary, such presentations
are arranged in-house. Directors are also afforded the opportunity
to attend industry-specifi c training, inter alia, as initiated by the
Registrar of Banks.
Directors’ remuneration
A Remuneration Committee comprising one non-executive
director and three independent non-executive directors considers
matters relating to director and executive remuneration.
This committee executes its responsibilities in accordance with
the terms and references incorporated in the board-approved
remuneration committee charter. Remuneration of directors is
disclosed in 7.4 of the Directors’ Report.
Board oversight
To assist the board in reviewing processes and procedures to
determine the effectiveness of internal systems of control in
the company, the board has established committees with specifi c
mandates to cover all aspects of the Capitec business. These

C a p i t e c B a n k H o l d i n g s L i m i t e d
C o r p o r a t e G o v e r n a n c e a n d R i s k M a n a g e m e n t R e v i e w
2 1
committees report their fi ndings to the board, thereby ensuring that
the decision-making capability of the board and the accuracy
of its reporting and fi nancial results are maintained at high
levels. Information assessed by the board comprises fi nancial as
well as non-fi nancial information and enables the board to assess
the adequacy and effi ciency of corporate governance and
internal controls in operation.
Board committees
The board has established various sub-committees such as
the Executive Management, Management, Risk and Capital
Management, Audit, Directors’ Affairs and Remuneration
Committees, each with an approved charter containing terms of
reference for these committees. Further particulars on each of the
committees are set out in Annexure B.
Board/director evaluation
The Directors’ Affairs Committee meets at least twice a year
to assess, amongst other things, the skills needs of the board.
During the period under review the board was strengthened by
the appointment, inter alia, of a retail expert and the committee
feels satisfi ed that the board composition currently represents an
adequate mix of skills and diverse backgrounds.
Dealing in securities
The board has approved a policy in accordance with the JSE
Listings Requirements in terms of which directors, senior
management and employees with access to management reports
are required to obtain clearance to deal in the shares of the
company prior to transacting.
This policy also bars any trading in the shares of the company
during a prohibited period; standard closed periods are year-
end up to publication of year-end results and at half-year up to
publication of interim results. Emphasis is placed on proper and
correct declaration of interest by directors in compliance with
relevant legislation, including their shareholding in the company.
A register of directors’ interests is circulated at every board
meeting and signed by all members present.
Company secretary’s role
The company secretary administers corporate governance within
the company, supports the chairman in ensuring the effective
functioning of the board and provides the board and directors
individually with guidance on the proper discharging of their
responsibilities. As such the company secretary:
• Strives to inform the board of relevant legislation
• Makes information on the company available to board
members
• Ensures compliance with statutory and regulatory matters and
• Acts as primary point of contact with shareholders.
Auditing and accounting
We are privileged to have a prestigious international fi rm as our
external auditors; both the external auditors and internal audit
department of Capitec observe the highest levels of business and
professional ethics and independence.
The company and management encourage regular coordination
and consultation between external and internal auditors to
ensure an effi cient audit process. Non-audit work performed
by the external auditors is regulated by a policy laid down by the
Audit Committee.
Reporting
Annual and interim fi nancial results are submitted to the Audit
Committee for consideration and recommendation to the board
for fi nal approval.
The Audit Committee’s mandate includes the authority to
determine whether or not the interim report should be subject to
an independent review by the auditors.
The facts and assumptions used by the board to assess
the going concern status of Capitec Bank at each year-end are
recorded and submitted annually, in terms of the Banks Act (Act
94 of 1990), to the Registrar of Banks.
Audit Committee
The Audit Committee is chaired by an independent non-
executive director with years of experience in banking. The
chairman of the board is not a member of the Audit Committee.
The Audit Committee derives its authority and responsibilities
from a board-approved charter with which it has complied during
the year under review.
Audit fees are annually set in advance by the Audit Committee
in a manner which should not impact on the scope of the audit.
Non-audit services rendered by our external auditors are limited
to ad hoc tax advice and other assurance-related services within
the parameters of a policy approved by the Audit Committee
limiting such expense to 40% of the annual audit fee; the
consideration is disclosed in the annual fi nancial statements.

C o r p o r a t e G o v e r n a n c e a n d R i s k M a n a g e m e n t R e v i e w
C a p i t e c B a n k H o l d i n g s L i m i t e d2 2
w
Internal Audit
Status of internal audit
The company has an independent internal audit department
with direct access to the chairman and reporting to the chief
executive offi cer. Apart from own employees it functions on a co-
sourced basis with Deloitte as external consultants and in
accordance with a charter approved by the Audit Committee.
The charter formally defi nes the purpose, authority and
responsibility of the internal audit activity and is consistent with
the Institute of Internal Auditors’ defi nition. The head of internal
audit attends all audit and risk and capital management committee
meetings and submits a report to each Audit Committee meeting.
Role and function of internal audit
The internal audit function focuses on adding value to the
operations of Capitec Bank. To this end it emphasises:
• Adherence to company policies and procedures
• Prevention of theft and fraud and
• Production of quality management information.
Scope of internal audit
The department annually submits a coverage plan to the Audit
Committee for approval. The scope of this plan encompasses the
entire business of Capitec Bank and is drafted with the strategic
aim of the Bank in mind. In our developing environment great
emphasis is placed on implementation and effi ciency of systems.
In addition, the operational environment is closely monitored
and assurance derived that controls are functioning adequately.
Increased emphasis is placed on development of centralised
monitoring. In this process, any defi ciency detected in governance
is escalated to management for action.
Risk management framework
and responsibility
Capitec Bank views risk management as a measure of ensuring
a responsible return on shareholders’ equity. Ultimately, the
board remains responsible for risk management. To assist them in
performing this duty, the company is managed through a system
of internal controls functioning throughout the entity so that an
awareness of risk pervades every aspect of our business
and is seen as the responsibility of each and every employee of
Capitec Bank.
Mehl(Chairman)
Mouton
Otto
Van der Merwe
Le Roux (Chairman)Hedderwick
MahloeleMehl
Mjoli-MncubeMouton
OttoSolms
Van der Merwe
Otto(Chairman)
Hedderwick
Le Roux
Solms
Van der Merwe(Chairman)
Mehl
Mjoli-Mncube
Solms
Directors’ Affairs Executive Management Audit RemunerationRisk and Capital
Management
Management
ComplianceInternal Audit
Credit
ALCO
Operational Risk
Management Committees reporting to Risk and Capital Management Committee
Allocation of defi ned risks
Credit ALCO Operational Risk
• credit • interest rate• market • liquidity• counterparty• currency• capital adequacy
• technology• compliance• legal• human resources• reputational• operational• regulatory
Risk Framework
Board of Directors

C a p i t e c B a n k H o l d i n g s L i m i t e d
C o r p o r a t e G o v e r n a n c e a n d R i s k M a n a g e m e n t R e v i e w
2 3
C
The board has established a Risk and Capital Management
Committee, chaired by an independent non-executive director.
The committee has a formal charter in accordance with which it
assists the board in reviewing the processes followed to identify
risk and consider such risks in the Capitec Group environment.
The committee also assists the board in ensuring that risk
assessment is an ongoing process and that a formal risk
assessment is undertaken at least quarterly.
Sub-committees comprising executives and senior management
have been established to deal in a structured manner with specifi c
risks facing the company:
• Operational Risk Committee (ORCO) – legal, regulatory
compliance, technology, human resources, operational and
reputational risk;
• Assets and Liability Committee (ALCO) – interest rate, market,
liquidity, counterparty, currency and capital adequacy risk; and
• Credit Committee – credit risk.
Risk and Capital management
Risk management and capital management are directly linked.
Risk capital represents a reserve for those risk exposures where,
after applying cost-effective risk management techniques, residual
risk remains. Residual risk exists given the inherent uncertainty
related to expectations of the future, the potential for unexpected
losses as well as losses expected to occur in the future not fully
captured, accounted and provided for in terms of International
Financial Reporting Standards (IFRS).
In addressing capital matters the Group manages both the so-
called supply and demand factors impacting capital adequacy.
Supply-side risk is the risk related to procuring appropriate capital
resources at appropriate pricing and times to fund operations
and meet the stipulated requirements of regulators and rating
agencies. Demand-side risk is the management of risks impacting
negatively on earnings and capital, which is the traditional risk
management side of the business. Management of demand-side
risk also involves monitoring the growth in risk-weighted assets
which drives the growth in the regulatory capital requirement.
Capital management
The Group’s principal objectives when managing capital are:
• To address the expectations of its shareholders, and so
optimise business activities to ensure return on capital
targets are achieved through effi cient capital management
• To ensure that the Group holds suffi cient risk capital, including
capital to be held as a buffer for unexpected losses to protect
shareholders and depositors, to assure the sustainability of
the Group through the business cycle. This view is consistent
with the Group’s long-term strategy of building value.
The above two principles counter-balance each other by aiming
to maximise returns to shareholders, but not at the expense of the
needs of other stakeholders.
C i B k H l d i L i i d 2 3
Capital Suffi ciency in an Economic Down-turn
Capital demand
Capital supply
Capital suffi ciency
margin
Economic down-turnCCaappittal
Available capital Capital requirement
The CICAAP addresses the sufficiency of capital during a down-turn in the business cycle.
• Typically, capital supply is less due to losses or lower appetite for capital issues at lower prices in an economic down-turn
• Typically, capital demand is higher as risk-sensitive measures will demand more capital reserving, for example deteriorating
credit experience

C o r p o r a t e G o v e r n a n c e a n d R i s k M a n a g e m e n t R e v i e w
C a p i t e c B a n k H o l d i n g s L i m i t e d2 4
This approach safeguards the long-term sustainability of the
Group and its ability to continue as a going concern so that it
can continue to provide satisfying returns for all its stakeholders.
Implicit in this responsible approach is compliance with the
capital requirements of the Banks Act and Regulations thereto
(Regulations) and the maintenance of a strong capital base to
support the development and growth of the business.
Capital risk governance
ALCO considers reports on the capital status of the Group
on a monthly basis. ALCO reports to the Risk and Capital
Management Committee in terms of the risk management
framework. Capital adequacy and the use of regulatory capital are
reported monthly to the South African Reserve Bank, in line with
the requirements set out in the Regulations.
Capitec Internal Capital Adequacy Assessment
Process (CICAAP)
In the achievement of its objectives the Group conducts a CICAAP
on an ongoing basis, which drives the Group’s position on capital
management matters. The CICAAP addresses the management
of capital and solvency risk and the risks arising from the
procyclicality of the Group’s specific business operations through
the economic cycle.
The CICAAP reviews the historical, current and future capital
positioning of the Group both from a regulatory and management
or internal capital perspective. An essential element of the process
includes forecasting the Group’s capital supply requirements,
including “stressing” the expected forecast to determine the
sufficiency of capital in a down-turn of the economic cycle as,
typically, regulatory capital demand requirements increase, whilst
qualifying capital supply decreases in times of economic downturn.
In considering the capital requirement for credit risk from a management perspective the Group assesses what outstanding
losses, i.e. losses not written-off or provided for, exist. These are typically the future and unexpected losses not captured in
terms of the IFRS framework.
Statistical projections are made, on a product level, using historical roll rates that are adjusted for hypothetical future economic
scenarios to stress test the sufficiency of capital. Three scenarios were computed:
• Expected economic scenario
• Down-turn economic scenario
• Worst-case economic scenario
In terms of our analysis we are adequately capitalised in the event of a worst-case scenario occurring.
Roll Rates: Clients’ roll rates are their changes in credit status from one period to another. A client’s credit status can
deteriorate (roll forward), maintain the status quo (spin) or improve (roll back).
CICAAP Credit Stress Testing
Impairments
Write-offs
Total Outstanding Loss = Additional Internal Capital Requirement
Outstanding Unexpected
Outstanding Expected
% l
os
s
pe
rio
d e
nd
da
te Impairments
Write-offs
Unexpected Loss
time
The above is a stylised representation of the treatment of losses that may arise on a loan portfolio.

C a p i t e c B a n k H o l d i n g s L i m i t e d
C o r p o r a t e G o v e r n a n c e a n d R i s k M a n a g e m e n t R e v i e w
2 5
Part of the process then involves determining appropriate
management actions to address any anticipated capital needs to
weather a down-turn in the cycle.
Risk management is an integral element of the CICAAP given
the inter-relationship between capital and risk management. As
such, management considers the capital required to underwrite
the risks of the business. This is assessed both before and after
applying risk management and risk mitigation techniques so as
to determine the outstanding residual risk and related capital
reserving requirement.
• Broad participation by management
• The CICAAP involves broad-based participation from all the
key risk owners in the Group and it is subject to review by
internal audit and relevant external consulting specialists who
benchmark our process against best practice.
• Basel ll calculation methods for credit and operational
risk capital
• The CICAAP involves assessing capital from a business and
regulatory perspective. The regulatory capital requirement is
calculated using a percentage applied on a base; that base
being the Group’s risk-weighted assets. There are various
methods used for the calculation of risk-weighted assets in terms
of the Regulations. As at the year-end reporting date Capitec’s
calculations of risk-weighted assets for credit risk and equity
risk in the banking book were governed by the application of the
“Standardised” approach, whilst its calculation of operational risk
was governed by the Basic Indicator Approach (BIA). In terms of
the BIA a factor of 1.88 is applied to the average gross income
for the past three years to arrive at a risk-weighted equivalent on
which the minimum capital adequacy percentage is applied to
calculate the capital requirement.
• Quantitative information on capital adequacy is presented below
and in Note 30.6 of the Group’s annual fi nancial statements on
page 90.
• Developments
• Our current internal capital calculations indicate that we are more
than suffi ciently capitalised from a business perspective.
However, we can achieve greater regulatory capital effi ciency
by applying the more advanced approaches for operational and
credit risk management in terms of the Basel II methodologies.
As such we made a successful application to apply the
Alternative Standardised Approach (ASA) for operational risk,
an approach better suited to our business model. We received
notifi cation of approval of our application after year end. The new
ASA calculation method is effective from 1 April 2008. If the ASA
had been used in the calculation of the Banks’ capital adequacy
as at 29 February 2008, the capital adequacy ratio would have
been 53% as against the 36% reported using the BIA.
Our internal calculations on credit risk requirements show that we
can also make signifi cant gains in regulatory capital management
by applying the Foundation Internal Ratings Based approach
C i t B k H l d i L i i t d 2 5
Total regulatory capital requirement 817 462 179 744 814 568 178 248
Credit risk 400 197 147 380 400 885 148 491
on balance sheet 400 197 129 436 400 634 130 547
off balance sheet - 17 944 251 17 944
Operational risk 342 440 - 339 105 -
Equity risk in the banking book 3 606 1 827 3 606 1 827
Other assets 71 219 30 537 70 972 27 930
Property and equipment 49 043 23 346 48 547 22 219
Intangible assets (software) 9 405 6 391 9 405 5 429
Other receivables 12 771 800 13 020 282
2008* 2007** 2008* 2007**
R’000 R’000 R’000 R’000
Group Bank
* Calculated in terms of Basel II rules** Calculated in terms of Basel I rules
Total regulatory capital requirementThe total regulatory capital requirement refl ected in terms of the Regulations is as follows:
C o r p o r a t e G o v e r n a n c e a n d R i s k M a n a g e m e n t R e v i e w
C a p i t e c B a n k H o l d i n g s L i m i t e d2 6
(FIRB). This is indicative of the lower risk profi le of our Group
which operates a retail banking business model. Our internal
credit models are already more than suffi ciently sophisticated to
allow us, with only some additional investment and customisation,
to achieve potentially signifi cant savings in regulatory capital
requirements for credit risk. We shall investigate the potential
benefi ts and further requirements in the course of the year ahead.
Restrictions on transfer of capital
As the operations of the Group are in South Africa, the only
restrictions on the transfer of capital within the Group relate to the
statutory limitations on investments in certain associates in terms
of the Banks Act.
Consolidation for the purposes of determining Group
regulatory capital
All subsidiaries are consolidated for both accounting and
supervisory reporting purposes in the same way. All companies
are incorporated in the Republic of South Africa. The registered
banking subsidiary of the Group, Capitec Bank Limited, has no
subsidiaries. Consolidation for regulatory purposes relates to the
consolidation of Capitec Bank Holdings Limited.
The main consolidation entries giving rise to a difference between
Group and Bank capital relate to share options, which are refl ected
on an equity settled basis in the Group, but on a cash settled basis
in Capitec Bank Limited in terms of IFRS 2.
Risk management
The biggest risks facing Capitec reside in liquidity management,
information technology, human resources and credit extension.
The emphasis thus tends to fall in these areas. However, to
enhance shareowners’ and other stakeholders’ interests, all
risks are mitigated to an acceptable level relative to the return
produced by the activity concerned. This remains a central
theme of the manner in which Capitec conducts business. The
company operates in a structured manner with defi ned processes
and procedures enabling risk assessment within a controlled
environment. Existing controls are assessed and if necessary,
adjusted. Thereafter reports are generated at regular intervals to
enable monitoring of risk levels.
Financial risk management
The Group’s concept of day to day fi nancial risk management
extends beyond the IFRS accounting defi nitions of fi nancial risks
and includes the following: credit, liquidity, interest rate, equity risk
in the banking book, currency, solvency and capital risk. The Group
does not have any market or counterparty risk, as understood in
terms of the Regulations, as the Group does not conduct trading
activities as part of its business strategy. Those risks not already
addressed above are discussed:
Credit risk
Credit risk governance
Credit risk management is overseen by the credit committee, a
sub-committee of the Risk and Capital Management Committee.
The composition of the credit committee is broad based and includes
a cross section of executives and relevant managers from the
business. The credit committee meets on a monthly basis to consider
the activities of the credit risk management department, consider
and debate results from arrears and provisioning analysis for the
previous month, and to set and adjust credit policy going forward.
Arrears
We measure arrears rates by dividing the value of loans and
instalments in arrears that arose during a period into the value
of instalments due in that period. This is a better measure than
dividing the loans in arrears by the outstanding loan book as some
of our short-term loans are granted and repaid in the same month.
Monitoring and reporting of arrears
Our Credit Monitoring department tracks arrears to ensure
operational effi ciency and compliance to granting and follow-
up policy by identifying changes in trends and variances from
benchmarks using a variety of tools.
Arrears percentages are reported daily and are evaluated on
branch, regional, operational (provincial) manager and national
levels. Branch performance and incentive targets include arrears
targets, appropriately balanced with sales and profi t targets.
• Daily Arrears Dashboard
Daily reporting is done as early as possible, using the dashboard,
to ensure that immediate pre-emptive action is taken on a
national, regional or branch level as required. All unexpected
spikes are subjected to immediate investigation.
• Credit Events Log
All identifi ed credit events are registered on a central credit
events log and communicated continuously to branches and
operational management. Developments are reported to the
branches by sending updates of the credit events log on at
least a weekly basis.
Economic incidents like employer level retrenchments or industry
level strikes are reported to affected branches and preventative
action regarding restrictions on further lending, affordability
calculations and arrears follow-up is taken. Ad hoc emphasis
on specifi c items is communicated by using periodic Credit Alert
communications.

C a p i t e c B a n k H o l d i n g s L i m i t e d
C o r p o r a t e G o v e r n a n c e a n d R i s k M a n a g e m e n t R e v i e w
2 7
Changes in the pay dates of employers are confi rmed pro-
actively. Success is measured daily with emphasis on the big
pay dates, being the 15th, 20th, 25th-31st days of the month.
Incorrect pay date estimations are also registered and quantifi ed
on the credit events log and used to educate all in striving to
prevent recurrences. This approach also highlights which
employers tend not to follow confi rmed payment dates.
Each month credit events listed on the log are quantifi ed and fed
into the loan impairment process and the operational risk register
for reporting to the operational risk committee, where the events are
related to operational risks, e.g. system defi ciencies. All operational
risk incidents like system or interbank challenges are identifi ed,
evaluated and preventative and/or corrective actions are agreed
with the Information Technology or Interbank departments.
• Roll rate analysis
We also monitor arrears trends using observed roll rates,
derived from historic payment profi les generated by our loans
system (the same payment profi les are submitted to the National
Loans Register, soon to be the National Credit Register, and the
same payment profi les form the basis of our loan impairment
models). Variations of the roll rate tables are utilised to understand
the level of rehabilitation in the accounts in arrears and to derive
new credit screening / granting rules and collection strategies:
• First-payment-defaulter reports for early delinquency pockets,
and
• Movement tables to analyse and compare to benchmarks the
component of clients moving to better or worse arrears status.
We analyse all of the above arrears perspectives in the following
dimensions:
Dimensions of arrears analysis
• different products • tranches of sales
• payment method • payment frequency
(differentiating between (differentiating between
bank and non-bank clients weekly/ fortnightly)
(non-bank clients do not
deposit their salary with us))
• client number level • Rand value levels
Bad debts are identifi ed and managed accordingly by way of system
codes, e.g. deceased, under administration, debt review or handed
over. All accounts more than 90 days in arrears are written off on
general ledger level based on expected discounted cashfl ows.
• Weekly credit meetings
Representation at weekly credit committee meetings is broad
based and includes the majority of the members of the executive
management team. These meetings are held every Monday
afternoon and in addition to the executive management team
include key senior members from the fi nancial management
department.
At the fi rst meeting after month-end we discuss the previous month-
end arrears and events listed in the credit events log that had or
would be expected to have an impact on arrears. These items
are then considered in the evaluation of the month’s impairments
fi gure at the same meeting.
At every weekly meeting arrears events, arrears trends,
concentration risk, training requirements, technical requirements,
change management issues, scoring model shifts and new
business referral trends are discussed, actions agreed and
monitored.
Quality of new business
• Vintage graph analysis
We utilise vintage graphs to measure the quality of credit
screening as the trends indicate improvement or deterioration in
each month’s sales (a tranche).
We track the cumulative arrears fi gures at 90 days or handed-over
status (deceased or under administration, etc.) for each tranche
and divide that into the total original instalments payable.
Our market’s ability to pay has also improved over the past year.
Lower interest rates and longer term loans are now offered.
• Process changes
We have proactively made the required changes in our credit
risk management model to maintain and improve existing
levels of arrears against the back-drop of a deterioration in the
economic climate and evident growth in volumes and exposure
due to the roll out of our longer term products (18-month
and 24-month loans in October 2006 and 36-month loans in
October 2007).
We have made improvements in the areas of scoring,
affordability, pay date management, collections and the end-to-
end automation of our processes.
More specifi cally, the following changes to our credit management
process have been completed or are in process:
• Acceptance - standardisation and automation of affordability
and willingness assessment; fraud checks included; an
automated application system that integrates the bureau
enquiry, affordability calculation, product rules, allocation
of terms of business and creation of contract and loan to
payout (Rules Engine) implementation in progress; this will
ensure even better process consistency and enable us to
perform simulations of considered rule sets and champion
challenge these new rules. We will have in-house intelligence

C o r p o r a t e G o v e r n a n c e a n d R i s k M a n a g e m e n t R e v i e w
C a p i t e c B a n k H o l d i n g s L i m i t e d2 8
of all applications received and rejected to enhance our
scoring ability.
• Control - proactive pay-date confi rmation; effective collections
via regulated Non Authenticated Early Debit Order (NAEDO)
system; centrally supported early stage follow-up by branches
on a purpose-built system; central follow-up and arrangements
with clients in arrears by specialised call centres; improved
and refi ned collections strategies.
• Recovery – migrated to a user-friendly database to optimise
recoveries; structured and skilled to service debt review
applications.
Collections
• Collection method
• Capitec utilises the regulated NAEDO system to collect
instalments on the pay dates of our clients that do not deposit
their salaries with us. Collections are as mandated by our
clients in terms of their loan contracts; collections are made
from their external bank accounts or clients can deposit their
salary with Capitec and collections are then made from their
Capitec accounts under the same conditions as external
NAEDO debits.
• Daily collection processes
Collections are managed proactively with a central focus
on large employer pay-date management and decentralised
/ branch focus on the smaller local employers. Pay dates are
reconfi rmed, success is evaluated on the morning of pay-date
and follow-up on early stage arrears is performed by the
branches on a special purpose web-based system. Support is
provided to the branches by our Credit Follow-up Area (CFA)
and a central monitoring and control unit which assists
branches in managing arrears accounts more effectively.
• Early and late stage collection approach
Early collections are performed centrally from an internal
credit call-centre with some outsourcing to third-party call-
centres, based on a predetermined and continuously reviewed
collections strategy. Our legal, or late stage, collections
are handed over to various agents who are responsible for
tracing and legal action. The agents are managed in terms of
mandates and their performance is periodically reviewed. These
agents, the handed over accounts database and recoveries
are managed by our Capitec Collection Services department
(CCS). The Specialised Services area within CCS has the legal
skills, with the support of our Legal department in the Risk
Division, to manage the debt review applications, deceased
estates and under administration cases.
Credit Policies
The credit committee reviews the various policies at least
annually.
Impact of the National Credit Act (NCA)
Our NCA project addressed all technical and process requirements
before 1 June 2007, the main elements being:
• Automated quotes and pre-agreements.
• New interest rate and fee structure, instead of the fl at rate
structure that our market was used to, which we have phased
into our business since November 2006.
• Our affordability calculation was already automated and
standardised on a client level for each loan advance we
made but we added functionality to enable the printing of the
affordability calculation on the contract.
• The debt review status codes were added to our system and
we can automatically issue the notice of possible handover to
our clients when required.
Some of the intended outcomes fl owing from the implementation
of the NCA on a national level are still work in process. Capitec has
adopted a cooperative approach, working with the National Credit
Regulator (NCR) to resolve the following outstanding matters:
• We take part in the moratorium offered on debt review
applications through the Banking Association to help the debt
counselling process get off the ground.
• We have signed an agreement as a member of the National
Debt Mediation Association as part of our efforts to facilitate
the best possible route to follow for any distressed client.
• We are registering with the Credit Providers’ Association to
support the creation of the intended National Credit Register.
At Capitec we welcome what the NCA brought to our market:
• Protection (cost to consumer by all credit providers, the
demonstration of affordability by all credit providers and debt
counselling cooperation by all creditors)
• Opportunities (loans of over R10 000, longer term and a wider
market)
• Integration (microlending, retail and banking).
Credit-granting criteria
We base our credit acceptance decision on the applicant’s
Behaviour (willingness to pay), Ability to pay and the Source of
payment (BAS):
• How you pay (loan instalments paid from salary deposited with
Capitec - “Bank” client, collections for “Non-Bank” client via
NAEDO or the client is a cash payer)
• Who you get paid by (employer pay-date stability)

C a p i t e c B a n k H o l d i n g s L i m i t e d
C o r p o r a t e G o v e r n a n c e a n d R i s k M a n a g e m e n t R e v i e w
2 9
GROUPRGRROUPP
Average gross Aggregate gross Exposure post risk Risk weights
exposure (1) year end exposure (2) mitigation (2) (3) (2)
2008 2007 2008 2007 2008 2007 2008 2007 R’000 R’000 R’000 R’000 R’000 R’000 % %
Total gross credit exposure 2 082 374 1 836 290 2 385 173 1 895 186 2 377 613 1 895 186
On balance sheet 2 074 874 1 459 191 2 377 673 1 518 087 2 377 673 1 518 087
Corporate 16 193 85 022 16 582 48 351 16 582 48 351 100 100
Sovereign (SARB) 131 831 125 357 139 249 142 329 139 249 142 329 0 0
Banks 125 458 493 985 46 284 461 202 46 284 461 202 20 20
Retail loans - performing 1 616 886 659 158 1 929 021 762 692 1 929 021 762 692 75 100
Retail loans - impaired 184 506 95 669 246 537 103 513 246 537 103 513 100 100
Off balance sheet 7 500 377 099 7 500 377 099 - 377 099
Corporate guarantees 7 500 7 500 7 500 7 500 - 7 500 100 50
Retail - approved undrawn loans - 135 701 - 135 701 - 135 701 75 50
Capital and rental commitments - 233 898 - 233 898 - 233 898 0 20
Analysis of regulatory credit exposure
(1) Average gross exposure is calculated based on an average using daily balances for the six months prior to the reporting date as required by the Regulations.(2) Items are reported in line with the Regulations in force at the respective dates and represent exposure before the deduction of qualifying impairments. In
certain instances the Regulations require the use of averages based on daily balances for the reporting month.(3) Represents exposure after taking into account qualifying collateral in terms of the Regulations. Amounts are shown gross of qualifying impairments.
sed on an average using dai
ations in force at the respe
y balances ffor the six mont
ctive dates and represent
hs prior to th the reporting dat
exposure befoore the deduc
e as requuireired bd by tthhe Reegula
tion of qualifyiing impapairmee
BANK
2008 2007 2008 2007 2008 2007 2008 2007 R’000 R’000 R’000 R’000 R’000 R’000 % %
Total gross credit exposure 2 085 630 1 833 761 2 387 805 1 902 061 2 380 305 1 902 061
On balance sheet 2 076 123 1 454 174 2 378 298 1 522 474 2 378 298 1 522 474
Corporate 21 031 85 022 20 797 53 584 20 797 53 584 100 100
Sovereign (SARB) 131 831 125 357 139 249 142 329 139 249 142 329 0 0
Banks 124 990 493 139 45 816 460 356 45 816 460 356 20 20
Retail loans - performing 1 614 114 654 987 1 926 248 762 692 1 926 248 762 692 75 100
Retail loans - impaired 184 157 95 669 246 188 103 513 246 188 103 513 100 100
Off balance sheet 9 507 379 587 9 507 379 587 2 007 379 587
Corporate guarantees 9 507 9 988 9 507 9 988 2 007 9 988 100 50
Retail - approved undrawn loans - 135 701 - 135 701 - 135 701 75 50
Capital and rental commitments - 233 898 - 233 898 - 233 898 0 20
BAABBANKK
2008 02007 2008 020007 20008 020007 2008 07200
Average gross Aggregate gross Exposure post risk Risk weights
exposure (1) exposure (2) mitigation (2) (3) (2)
• When you get paid (pay-date logic with regard to for example
public holidays) and on what frequency (weekly / fortnightly /
monthly).
The willingness to pay is established externally by enquiries
performed and bureau related policy rules automatically applied on
bureau scores and bureau data (system driven). This information
is supplemented internally by application of an arrears indicator
(system driven). Fraud checks are included in the automated
bureau enquiry. The ability to pay is assessed after evaluation
and capturing of payslip and bank statement information
(system driven).
The source of payment is established by evaluating the payslip
details, bank statement and again when confi rming employment.
The source documentation is scanned and electronically fi led as
proof of verifi cation.

C o r p o r a t e G o v e r n a n c e a n d R i s k M a n a g e m e n t R e v i e w
C a p i t e c B a n k H o l d i n g s L i m i t e d3 0
The risk weightings refl ected are the standard risk weightings
applied to exposures as required by the Regulations. For the 2008
fi gures these are the risk weights in terms of the standardised
approach to credit risk. Where the Regulations refer to credit
ratings, the Group applies Fitch (international) ratings for all
exposures to determine the relevant risk weighting in line with the
Regulations’ mapping requirements. Refer to Notes 30.6 and 6
in the annual fi nancial statements, respectively, for information
on risk-weighted assets and a reconciliation of identifi ed and
unidentifi ed impairments. All the impairments shown in Note 6
relate to the retail personal loans portfolio.
In compliance with the Regulations, certain credit exposures
totalling R16.7 million (2007: R96.9 million) were deducted from
qualifying capital and reserves.
2 385 173 1 895 186 2 387 805 1 902 061
Finance intermediation (Banks) 46 283 482 533 45 816 481 686
Wholesale and retail trade 14 168 11 903 17 617 19 625
Sovereign (SARB) 139 249 142 329 139 249 142 329
Retail personal loans
Performing 1 922 353 934 252 1 922 353 934 252
Impaired 246 538 63 251 246 188 63 251
Other 16 582 260 918 16 582 260 918
* Calculated in terms of Basel II rules ** Calculated in terms of Basel I rules
2008* 2007** 2008* 2007**
Group R’000 Bank R’000
Sector
Analysis of gross exposures by industry sector in terms of the Regulations
All exposures are performing unless otherwise stated.
Rating Grades and related Risk Weightsnd relRating Grades ag lated Risk Weightsg
AAA to AA- A+ to A- BBB+ to BBB- BB+ to B- Below B- Unrated
Sovereigns 0% 20% 50% 100% 150% 100%
Public-sector entities 20% 50% 50% 100% 150% 50%
Banks 20% 50% 50% 100% 150% 50%
Security fi rms 20% 50% 50% 100% 150% 50%
Banks: short-term claims 20% 20% 20% 50% 150% 20%
Security fi rms: short-term claims 20% 20% 20% 50% 150% 20%
AAA to AA- A+ to A- BBB+ to BB- Below BB-
Corporate entities 20% 50% 100% 150% 100%
Short-term credit assessment
A-1/P-1 A-2/P-2 A-3/P-3 Other
Banks and corporate entities 20% 50% 100% 150%
Ratings are not applied to retail exposures. A standard risk weight of 75% is applied to performing exposures whilst impaired exposures
attract a standard 100% risk weight.
The following table of risk weights applies in terms of the standardised approach to credit risk for portfolios other than retail.
< 60 days 219 905 90 009 219 555 90 009
60 - 90 days 26 633 15 864 26 633 15 864
246 538 105 873 246 188 105 873
2008 2007 2008 2007
Group R’000 Bank R’000
Ageing
Ageing of impaired advances

C a p i t e c B a n k H o l d i n g s L i m i t e d
C o r p o r a t e G o v e r n a n c e a n d R i s k M a n a g e m e n t R e v i e w
3 1
Liquidity
The Group manages liquidity cautiously and conservatively.
It operates an uncomplicated liquidity profi le with a preference
for long-term fi xed funding. The Group has exposure to funding
liquidity risk but not to market liquidity risk as the Group does not
conduct a trading operation.
Liquidity risk governance
Liquidity risk is managed by ALCO in terms of the Group risk
framework. ALCO comprises broad representation by
executive and senior management and meets monthly to
consider the activities of the treasury desk which operates in
terms of an approved treasury management policy and in line with
approved limits. The Group also has the benefi t that it has an
uncomplicated structure with one treasury desk with a direct
reporting line to the chief fi nancial offi cer in line with the general
Group ethos of fl at reporting structures.
ALCO receives reports on a monthly basis of daily balances
on ATMs and funds in transit with cash management service
providers, teller cash and money market balances. Other reports
include a treasury desk maturity ladder, asset-liability matching,
deposit concentrations, progress on funding initiatives, business
as usual maturity and contractual maturity reports and minimum
liquid asset and reserve balance compliance reports.
Principal policies
Compliance with the treasury management policy results in a low
risk liquidity structure. We are not exposed to the uncertainty
that accompanies the use of corporate call deposits as a
funding mechanism and our asset structure, whilst growing in
duration, is still relatively short-term in nature. The principal risk
management policies governing the management of liquidity risk
as defi ned in the treasury management policy are:
• Wholesale deposit funding is limited to contractual maturities of
two months or more.
• Utilisation of retail deposit funding is limited to funding short-
duration assets. Surplus retail funding is maintained in call
accounts with internationally rated A-1 (short-term rating) South
African banks.
• Adequate liquid assets must be maintained in terms of the
Banks Act Regulations to fund the liquid asset requirement
and the reserve account, and to maintain collateral for balances
on the South African Multiple Option Settlement (SAMOS)
system account.
Daily cash management
The Group’s daily liquidity requirements are managed by a single
treasury desk that forecasts daily funding requirements. This
is achieved by forecasting liquidity commitments which can be
summarised in two broad categories: those which are considered
as day-to-day fl ows and those that relate to large singular
obligations.
Daily roll-overs and withdrawals by the retail personal market,
growth in the loan book, infl ows from settlements adjusted for
expected default and cash-in-transit items are forecast and
combined with the scheduled contractual cash in-fl ows and out-
fl ows in terms of the wholesale funding programme and periodic
commitments such as dividend and tax payments.
Treasury management maintains regular daily contact with
the central branch management offi ce or Business Support
Centre (BSC) to manage the in- and out-of-branch ATM
requirements. Teller cash is maintained at a minimum. The
forecasting is supported by behavioural modelling conducted
on a regular basis to determine business as usual cash fl ow
requirements including cash stress points in any given month.
The modelling is adjusted for seasonal variations based on
historical experience as adjusted for expectations around
projected growth and current market dynamics.
The treasurer has regular contact with all the Group’s large
wholesale depositors to understand their intentions regarding
the roll-over of wholesale deposits and negotiation of funding
from time to time.
The treasury management desk maintains portfolios of highly
liquid assets that can be liquidated to meet unexpected variances
in forecast requirements. In line with the Group’s preference
for long-term fi xed funding the treasury actively pursues
medium- and long-term funding opportunities to fund the
budgeted growth in the activities of the Group.
Deposit management
From a management perspective, no funding is regarded as
“permanent” other than funding contracted for fi xed terms. We
have an observed “core” deposit base within the retail savings
component of our deposits which we consider for both interest
rate and liquidity purposes.
We utilise statistical techniques to estimate this core having due
regard for the fl uctuations in day-to-day cash requirements, the
related supporting historical data, as well as our future expectation

C o r p o r a t e G o v e r n a n c e a n d R i s k M a n a g e m e n t R e v i e w
C a p i t e c B a n k H o l d i n g s L i m i t e d3 2
of daily cash fl ows. The established result is then subject to a
review by senior management and the core is established at a
conservative percentage of the empirically determined result. Our
internal defi nitions of core and fl uctuating deposits are formally
authorised by ALCO.
Interest rates are reviewed monthly to ensure that deposit
rates remain competitive. Treasury management assesses
concentration risk within the deposit portfolio and maintains a
diversifi ed funding base. Treasury management constantly
reviews the effi cient utilisation of cash resources and evaluates
new liquidity initiatives to improve the liquidity profi le of the Group
that may occur.
Liquidity contingency planning
ALCO receives, on a monthly basis, a stress mismatch report
which simulates a stress scenario based on the current asset and
liability structure of the Group for the reporting month. The report
also considers the available sources of stress funding to address
any strain on the cash fl ows of the Group that may occur.
Refer to Note 30.5 of the annual fi nancial statements for
quantitative detail on the Group’s static, contractual liquidity
maturity gap analysis.
Interest rate risk
The Group currently has a conservative interest rate profi le and
is less interest sensitive than the general banking industry.
The Group’s equity and profi t and loss have limited uncontrolled
exposure to changes in interest rates. This is because the Group
operates a fi xed and discretionary interest rate profi le for most
assets and liabilities.
Interest rate risk governance
ALCO meets formally at least monthly to, inter alia, consider the
sensitivity of the Group to interest rate movements and to review
the results of management’s analysis of the impact of interest rate
movements, including the results of model outputs. ALCO also
receives information on yield curve developments, money market
interest rates, an economic evaluation with analysis of the likely
impact on interest rates and interest rate repricing analysis.
In a declining interest rate environment the Group’s treasury
management department may on approval of the ALCO swap out
fi xed rate exposure if the Group is of the view that the environment is
entering a period of sustained low interest rates in order to minimise
funding costs. ALCO also considers the terms and durations of
fi xed term funding arrangements in view of the medium- to long-
term interest rate environment when negotiating pricing.
Regulatory sensitivity analysis
The regulatory sensitivity analysis refl ects the relative insensitivity
of the Group’s equity based on the impact of a 200 basis point
increase or decrease in interest rates, calculated on a discounted
basis.
The sensitivity of shareholders’ equity is analysed by discounting
the future, run-off cash fl ows, for monetary items, inherent in
the balance sheet at balance sheet date. A 200 basis points
upward and downward parallel shift on a zero coupon yield curve
is employed to discount the cash fl ow data. The yield curve is
constructed on a best decency basis utilising relevant government
bond data.
Cash fl ows for fl oating rate items differ under the specifi ed
scenarios (being the upward or downward shift in rates) whilst
those for fi xed rate assets and liabilities remain constant. The
resulting cash fl ow sensitivity is expressed as a percentage
change against the benchmark (expected) cash fl ows discounted
at the expected yield curve rates before any application of the
upward or downward shift.
A differentiation is made between the sensitivity calculated on the
IFRS basis and that disclosed here, calculated on a regulatory
basis, as the regulatory basis considers the overall sensitivity of
the value of equity based on a discounted cash fl ow basis whilst
the IFRS sensitivity is prepared on an undiscounted basis.
Equity risk in the banking book
Capitec does not deal or maintain a proprietary position in equity
investments. For a limited period the Group invested surplus cash
in preference shares issued by banks in order to secure better
after-tax returns than those offered in the general money market.
Equity investments in the Group at the 2008 year-end are strategic
in nature being a consequence of normal strategic operational
transactions.
All unrealised gains and losses were included in the Group’s
income statement. There are no latent unrealised gains or losses
on equities not recognised in the income statement and balance
sheet.
y
t
s
a
nalysis refl ects the relative insensitivity
y
Sensitivity of equity
200 basis points shift R’000 %
Increase 5 169 0.6
Decrease (8 768) 1.0
2008

C a p i t e c B a n k H o l d i n g s L i m i t e d
C o r p o r a t e G o v e r n a n c e a n d R i s k M a n a g e m e n t R e v i e w
3 3
Regular and frank discussions between managers on operational
risks and challenges as well as daily interaction of the executive
have contributed to the success of the Group to date. Whilst
this will continue to be a key value in the business, the Group
has enhanced its operational risk management capacity to
support growth.
A dedicated operational risk manager is responsible for policy,
providing guidance in terms of best practice, ensuring consistent
implementation and reporting of material exposures or trends to
the board and regulatory authorities. Line management accepts
accountability for the identifi cation, management, measurement
and reporting of operational risk.
The three primary operational risk management processes in the
Group are risk assessment, loss data collection and the tracking
of key risk indicators. The results of these processes are utilised
to raise awareness of operational risk management and to
enhance the internal control environment with the ultimate aim of
reducing losses.
The Group also maintains a comprehensive insurance
programme to cover losses from fraud, theft, professional liability
claims and damage to physical assets.
Business continuity planning
The Group has a documented business continuity and disaster
recovery plan (BCP) that documents processes to be followed
should an extreme event occur. The BCP is tested periodically.
Reputational risk
Capitec views reputational risk as a function of the management
of all other risks and the Group’s communication strategy in the
marketplace. If the other risks in the Group are well-managed and
this is adequately communicated to the market we are appropriately
managing reputational risk. In terms of management approach
reputational risk is dealt with by the operational risk committee.
Reputational risk is managed on an ongoing basis through
compliance with the disclosure and media policies of the
Group. Disclosure of Group information is made in our annual
fi nancial statements, via public statements made by authorised
spokespersons and through periodic disclosure of information on
our website in terms of the Banks Act requirements.
Compliance risk
The Group defi nes compliance risk as the risk that the procedures
implemented by Capitec to ensure compliance with relevant
statutory, regulatory and supervisory requirements are not
The Group did not hold any investments in listed equities at
year-end.
Currency risk
All the Group’s operations are within South Africa. The Group
hedges its limited exposure to currency fl uctuations which arise
on the importation of capital equipment and technological support
services. The Group also has some currency exposure on its
strategic investments in VISA and MasterCard.
Hedging
At this time the Group’s authorised use of derivatives as risk
mitigation instruments is limited to using forward foreign exchange
contracts (FECs) to cover obligations relating to capital equipment,
technology and technology support services needed for the core
banking activities. FECs are purchased to exactly match the total
value of the underlying foreign currency commitment.
Use of any other derivatives must fi rst be approved by ALCO prior
to transacting.
Operational risk
Operational risk is defi ned as the risk of loss resulting from
inadequate or failed internal processes, people and systems
or from external events. This defi nition includes legal risk but
excludes strategic and reputational risk.
Operational risk governance
Operational risk is managed in terms of the Group’s Operational
Risk Framework (ORF), which is a subset of the risk management
framework. The Operational Risk Committee (ORCO) has been
established to oversee the operational risk profi le of the Group. The
role of the ORCO is to direct, govern and coordinate operational
risk management processes in the Group, in accordance with an
approved policy that sets out the expectations and responsibilities
relating to operational risk management.
The heads of the Forensic, Internal Audit, Legal and
Compliance and Operational Risk management units are
members of the ORCO and provide independent monitoring.
ORCO also addresses the aspect of technological risk and the
Head of the Group’s Information Technology department is a
member of the Operational Risk Committee.
Management of operational risk
The management of operational risk is inherent in the day to
day execution of duties by management and always has been
a central element of the management process.

C o r p o r a t e G o v e r n a n c e a n d R i s k M a n a g e m e n t R e v i e w
C a p i t e c B a n k H o l d i n g s L i m i t e d3 4
w
adhered to and/or are ineffi cient and ineffective. The Group has
a Compliance Management System (CMS).
To achieve successful implementation of the CMS, software was
sourced to assist with the assessment of compliance risks, with
the documentation of controls and with monitoring activities.
Compliance champions were identifi ed, appointed and trained to
assist the Group compliance offi cer in addressing compliance in
the Group.
The Group has identifi ed the Banks Act, Companies Act, Financial
Intelligence Centre Act, National Payments System Act, Security
Services Act and the National Credit Act as key aspects of
legislation that should be focussed on in terms of CMS activities.
This focus achieves a balanced application of compliance activities
relative to the ambit of the business of the Group.
Compliance risk is dealt with by the operational risk committee.
Key accounting policies relevant to the
interpretation of the Group’s risk exposures
The key accounting policies relevant to the interpretation
of the Group’s risk exposures are contained in the Group’s
annual fi nancial statements on pages 62 to 70.

3 5C a p i t e c B a n k H o l d i n g s L i m i t e d 3 5C a p i t e c B a n k H o l d i n g s L i m i t e d
Annexure A – Attendance by Directors
Annexure B – Composition of board and board committees Frequency of Committees Purpose Composition Quorum meetings
Annexure A ndance by Directoors– Atten
Committees Board Audit Remuneration Risk and Directors’ Capital Management Affairs
Number of meetings in the
period of review 6 3 4 2 2
MS du P le Roux (Chairman) 6 3* 4 - 2
AP du Plessis 6 3* 1* 2* -
KA Hedderwick(1) 1 - - - -
TD Mahoele(2) 4 - - - 2
MC Mehl 5 - 3 2 2
NS Mjoli-Mncube 5 3 - - 2
JF Mouton(3) 2 1* - - -
PJ Mouton(4) 2 - - - -
CA Otto 6 3 4 - 2
JG Solms 6 - 3 2 2
R Stassen 6 3 4* 2* -
JP van der Merwe(5)(6) 3 2 - - 1
J van Zyl Smit(7) 2 1 - - -
6 3* 4 - 2MS du P le Roux (Chairman)
KA Hedderwick(1) 1 - - - -
5 - 3 2 2MC Mehl
JF Mouton(3) 2 1* - - -
6 3 4 - 2CA Otto
6 3 4* 2* -RR Stassen
JJ van ZylZyl Sm Smitit(7)(7) 22 11 -- - - y
Notes:(1) Appointed to the board effective 10 December 2007 (2) Appointed to the board effective 1 April 2007(3) Resigned from board effective 4 October 2007 (4) Appointed to the board effective 5 October 2007
(5) Appointed to the board effective 27 September 2007(6) Appointed chairman of the Audit Committee effective 27 September 2007(7) Resigned from the board effective 26 September 2007
* Attendance by invitation
1. Board of Directors
2.1 Executive
Management
Committee
The Board of
Directors is
responsible for the
strategy and overall
management of the
company
Responsible
for operational
decision making
and approvals of
administrative nature
on an ongoing basis
The Board consists of:
3 non-executive directors
TD Mahloele (appointed 1 April 2007)
JF Mouton (resigned 4 October 2007)
PJ Mouton (appointed 5 October 2007)
CA Otto
6 Independent non-executive directors
MS du P le Roux (Chairman)
KA Hedderwick (appointed 10 December 2007)
MC Mehl (Prof)
NS Mjoli-Mncube (Ms)
JG Solms
JP van der Merwe (appointed 27 September 2007)
J van Z Smit (Dr) (resigned 26 September 2007)
2 executive directors
R Stassen (CEO)
AP du Plessis (CFO)
R Stassen (Chairman)
AP du Plessis
GM Fourie
CG van Schalkwyk
A majority of directors
for the time being in
offi ce of which at least
50% must be non-
executive
3 members
6 times a year
Once a week

Annexure B – Composition of board and board committees
Frequency of Committees Purpose Composition Quorum meetings
2.2 Management
Committee
Responsible for
operational decision
making and
implementation of
strategic decisions
approved by the
board
R Stassen (Chairman)IC Abrahams*JE CarstensF Davids*A P du PlessisCG Fischer GM FourieA Olivier C Oosthuizen CG van Schalkwyk L Venter * Appointed to the management committee in February 2008
3 members Once a month
(members meet
weekly to report
on operational
matters)
3. Directors’ Affairs
Committee
Responsible for
evaluation of board
effectiveness; senior
management and
board succession
planning; corporate
governance
All non-executive directors Majority of members Twice a year
4. Audit Committee** Oversees fi nancial
controls, reporting
and disclosure
JP van der Merwe (Chairman)
MC Mehl
NS Mjoli-Mncube
JG Solms
Independent attendee
HD Nel (External audit partner – PricewaterhouseCoopers)
Management attendees
J-HC de Beer (Compliance offi cer)
J Delport (Operations Risk Manager)
AP du Plessis
J Gourrah (Internal Audit)
R Stassen
CG van Schalkwyk (Risk management) (secretary)
50% of members of
which 50% must be
non-executive directors
Three times a year
5 . Remuneration
Committee***
Directors’ and
senior executives’
remuneration is
discussed and
determined as well as
levels of remuneration,
adjustment thereof at
intervals and, when
applicable, additional
remuneration such as
bonuses and incentives,
including share option
incentives
CA Otto (Chairman)
KA Hedderwick
MS du P le Roux
JG Solms
Management attendees
R Stassen
L Venter
Majority of members Twice a year
6 . Risk and Capital
Management
Committee***
Identifi cation of all risks
and assists the board
in reviewing the risk
management systems
and processes and the
signifi cant risk facing
the company
MC Mehl (Chairman)
PJ Mouton
CA Otto
JP van der Merwe
Management attendees
J-HC de Beer
J Delport
AP du Plessis
J Gourrah
R Stassen
CG van Schalkwyk
Majority of members Twice a year
C a p i t e c B a n k H o l d i n g s L i m i t e d3 6
** Reconstituted in March 2008
*** Reconstituted in April 2008

C a p i t e c B a n k H o l d i n g s L i m i t e d
More than 187 non-profit organisations have benefited
Corporate Social Investment Programme
“The Carel Du Toit Centre is incredibly grateful for Capitec Bank’s
generous donation. Thanks to your support more hearing impaired children
can now learn to speak and become part of the hearing and speaking world.”
Laurette du Preez, head of the Carel du Toit Centre.

C a p i t e c B a n k H o l d i n g s L i m i t e d3 8
Sustainability Review
The report describes the sustainable business practices of the
Group that strive for economic prosperity and growth whilst
maintaining and, where relevant, encouraging ecological balance
and social progress. Certain aspects relevant to the Sustainability
Review, such as the corporate profi le, strategy, corporate
governance and risk reporting, are not duplicated in this section
as they are covered elsewhere in the annual report.
This sustainability report has been compiled using guidelines and
criteria developed by the various agencies which monitor corporate
sustainability, but has also been adapted to address issues
specifi c to our business and industry. The target audiences for
this report include all stakeholders that have an interest in
the activities of the Group, with particular emphasis on our
shareholders, clients, employees, funders and regulators.
Verification and indexes
In 2007, Capitec participated for the fi rst time in the annual
assessment for inclusion in the Socially Responsible
Investment (SRI) Index, in an effort to gain recognition for the
measures implemented by the Group to ensure sustainable growth.
The JSE SRI Index has been designed to create a benchmark
index in response to growing interest in socially responsible
investment around the world. With this purpose in mind, the
JSE invites companies to participate in its annual assessment
for potential inclusion in the SRI Index which was launched in
2004. As a means of helping to focus the debate around socially
responsible investment, the JSE has developed criteria to measure
the triple bottom line performance of companies in the FTSE/JSE
All Share Index, with the aim of compiling an index comprising
those companies that pass the criteria.
Capitec fared well in terms of governance and social criteria.
However, the lack of a policy dealing exclusively with HIV/Aids
was a point of concern. HIV/Aids subsequently is covered in
our life-threatening diseases policy which also deals with other
life-threatening diseases. In addition, an employee assistance
programme (EAP) has been established. As far as environmental
impact is concerned, the Capitec Group has always attempted to
operate in a manner so as to have as little impact as possible
on the natural environment. In fact, Capitec Bank’s business plan
is in essence conservationist; this is elaborated on in the section
dealing with environmental impact. Nonetheless, we have begun
a process of establishing measures to augment our approach
towards the conservation of natural resources and to sensitise
employees towards the responsible use thereof.
Although the 2007 Sustainability Review has been
integrated in Capitec Bank Holdings’ annual report, it may
be downloaded as a separate report from our website at
www.capitecbank.co.za.
Overview
This sustainability performance review provides an overview
of our sustainability initiatives over the past year. We report on
our consultation with major stakeholder groups and how
their feedback has been incorporated into our business. In
addition, we clarify our initiatives to continue to build a sustainable
business.
Capitec regards its role as that of improving people’s lives by
providing a means to economic upliftment in a responsible
Scope of the review
This review provides an overview of the Group’s policies, practices and performance relating
to its economic, social and environmental activities for the fi nancial year ended February 2008.

C a p i t e c B a n k H o l d i n g s L i m i t e d
S u s t a i n a b i l i t y R e p o r t
3 9
way. Sustainable development for Capitec is founded on certain
principles. It is about providing low-cost banking to our clients
in an accessible and simplistic way. It is about promoting
personal responsibility and sound practices in all our dealings.
It is about providing a safe and rewarding working environment
and promoting cultural diversity and equity in the workplace. It
is about providing a valued and personal service experience to
our clients and providing opportunities for social and economic
development through our core business activities. It is also about
proactively minimising any adverse environmental impact. In order
to achieve this, we have to be receptive towards the expectations
of our stakeholders, and identify and respond to their perceptions,
concerns and needs.
Over the past seven years, Capitec has made progress in
integrating sustainability in all our business operations. The
most signifi cant of these is our ongoing growth in client numbers
by unlocking access to affordable banking through innovation.
We also realise that the cost of credit plays a signifi cant role in
the growth of our economy. Through our ongoing drive to reduce
the cost of credit we have been able to offer clients a real
solution to affordable fi nance. Our business model, driven by
affordability, accessibility, simplicity and personal service,
has been rewarded with solid growth and profi tability this year.
This motivates us to commit to our vision of being an innovative
alternative to traditional banking with even more energy and
passion in 2008/9.
Capitec supports the need for transparency and detailed
reporting to its stakeholders, and understands the role it plays in
ensuring the credibility of the Group’s business practices. We
trust that our sustainability report will be useful to our stakeholders
and we invite constructive feedback.
Riaan Stassen
Chief Executive Offi cer
C a p iC a p i t e c t e c B a n kk H o H o l d i n g s L i m i t e d 3 9

S u s t a i n a b i l i t y R e p o r t
C a p i t e c B a n k H o l d i n g s L i m i t e d4 0
Making Capitec Bank more sustainable
Our vision is to offer banking services to our clients in an affordable, accessible, simplifi ed and personal manner. Our
continuous drive for innovation allows us to make signifi cant improvements to our processes and systems to the benefi t of
our clients. To date we have introduced many innovations. Capitec remains committed to the growth an development
of South Africa and our approach to banking holds signifi cant value in terms of profi t generation, corporate citizenship, job
creation and social upliftment. In doing so we positively engage and infl uence all our stakeholder groupings.
Clients
Affordability
• Our bank offer is still the most affordable in the market.
• We further reduced the cost of credit with price-cuts in April
2007 and in September 2007.
• We have consistently offered the highest savings return
by paying 10% interest on daily savings balances below
R10 000 on our savings accounts.
• We have signifi cantly increased loan terms from a maximum
term of 12 months to 36 months, which reduced instalment sizes
by spreading the repayment of the loans over a longer period.
• Our competitive banking solution includes debit card
purchases that are free of banking charges, cash withdrawals
at the low cost of R1 at retailers and R2.25 for Capitec Bank
ATM withdrawals.
Accessibility
• Our longer banking hours mean we can offer clients 48 more
banking hours per month than our closest competitor.
• With more than 330 branches nationwide we have a signifi cant
retail banking footprint.
• Our account opening process takes only 10 minutes, which
makes access to banking easy and convenient.
• We offer affordable banking to approximately 40 000 new
clients a month and grew our client base to over 1,3 million
in 2007.
• Our mobile banking unit (bank in a box) allows us to open
accounts at clients’ place of work.
• We have upgraded our 24-hour Client Care Centre with
world-class systems allowing us to provide continuous support
to our clients.
• Approvals within minutes and real-time gratifi cation are
integral to our service offering.
• The increase in our ATM network through retail
partnerships to over 765 ATMs provides our clients with
added convenience.
• The launch of retail Internet banking means that we can
now extend our offer to a broader client base.
Simplicity
• Biometrics for clients, introduced in September 2007,
provides our clients with added security.
• Innovative technology used in all our processes means we
can offer paperless banking.
• Our Global One Banking Facility provides clients with
access to transacting, savings and lending within a single
application.
• The Global One Gold Card means our clients can access
their account any time, anywhere in the world.
• Our simplifi ed fee structure provides clients with an
affordable and simplifi ed banking solution.
Personal service
• Employing people from the community in which we place
our branches allows for a personal service experience as
language and cultural similarity can be maintained.
• Simplifi ed, innovative systems and processes mean
consultants can focus on the client instead of doing
administration.
• Our consultants are recruited and trained with a client-
centric mindset
• More than R19.2 million has been spent on the training and
development of branch employees over the past year.
• 133 branch employees were promoted during the year,
driving an incentive for performance.
Our offer

C a p i t e c B a n k H o l d i n g s L i m i t e d
S u s t a i n a b i l i t y R e p o r t
4 1
Access to fi nancial services
According to research by Nielsen and the Finmark Trust on
increased access to fi nancial services, there has been a 9.3
percentage point increase in banked citizens since 2006. Capitec
Bank opens approximately 40 000 new accounts per month,
providing access to fi nancial services to more than 1.3 million
people each year. Our goal is to increase access to banking to
more than 2 million clients by the end of 2008. The advances
made in our product offering will ensure that we can offer clients
real alternatives to traditional banking in an innovative and
affordable way.
Consumer education
Capitec Bank has strengthened its client education drive in
2007. Since the launch of our Financial Literacy programme in
partnership with Unisa in 2005 we have enrolled almost 200
participants for the Unisa Financial Skills course. This course
equips participants with essential fi nancial skills such as
fi nancial planning, debt management, budgeting and saving
for retirement. Our Employer Sales Team is also presenting the
shortened version of this certifi cate course to schools and places
of employment, teaching consumers the basic skills needed to
become fi nancially empowered.
Capitec Bank has partnered with various consumer publications
such as Daily Sun, The Teacher and Isolezwe as well as
community radio stations to run weekly consumer editorials
highlighting fi nancial skills topics from the Bank’s Financial
Skills curriculum.
Increased market awareness
Capitec Bank’s fi rst television and print advertising campaign
has increased market awareness of our offer. The campaign
positioned Capitec Bank as the innovative company we believe
we are and also highlighted the individual benefi ts of our product
and service offering. Personal service has always been one of
the cornerstones of our business model and is key to our overall
value proposition.
In November 2007 Capitec embarked on formal and independent
research to ascertain consumer perceptions about our brand and
offer. We have been very pleased with the positive feedback the
research revealed. Our credibility was evident in the market’s
acceptance of our offer. We also received accolades for our
investment performance when we were ranked third in on
the Sunday Times Top 100 Companies list for investment and
share price performance, and fi rst in the Financial Mail Top 200
Companies list.
Client research
Capitec Bank’s key objective is to increase awareness of the
bank and our unique product offer in the market. The research
measures our key deliverables, and allows us to gauge the extent
to which we have succeeded.
These are the results:
06
07
51.4%
70.5% 2. Yes to prompted awareness
Q: Have you heard of or seen this logo before? (showing participants the logo on a card.)
Savings
06 07
29.4%
54.9%
Loans
06 07
37.7%
57.3%
Money transfer
06 07
10.7%
27.3%
Debit card purchases
06 07
11.1%
27.3%
Stop / debitorders
06 07
11.0%
25.3%
3. Awareness of product offering
Q: What products does Capitec Bank offer?
06
07
16.4%
34.8%1. Capitec Bank
mentioned*
Q: What banks are you aware of?
*Unprompted

S u s t a i n a b i l i t y R e p o r t
C a p i t e c B a n k H o l d i n g s L i m i t e d4 2
57%
6. Perceptions of Capitec Bank
Longest banking hours
23.6%
42.1%
9.3%11.8%
67.1%
46.1%
Agree
06 07
Disagree
06 07
Don’t know
06 07
Agree
06 07
29.0%
46.4%
Disagree
06 07
7.9% 7.8%
Don’t know
06 07
63.1%
45.2%
5. Perceptions of Capitec Bank
Lowest banking fees
Agree
06 07
25.9%
45.7%
Disagree
06 07
8.1% 7.8%
Don’t know
06 07
66.0%
46.5%
4. Perceptions of Capitec Bank
Paperless banking
Shareholders
Challenges
• Credit approval rates have declined over the past year as
a result of tighter affordability criteria and the new National
Credit Act regulations.
• The Competition Commission’s enquiry into banking fees
will result in other banks reviewing their fee structures.
• The economic realities of high interest rates and food and
fuel infl ation will require guarding against over-indebtedness.
Combatting fraud
Fraud can erode sustainability. To combat fraud, Capitec Bank
follows a zero tolerance policy against fraud, non-adherence
to company policies, dishonesty and disorderly behaviour.
This is driven mainly by our Forensics and Legal departments.
The bank has put several sophisticated measures in place to
ensure compliance with regulations and procedures. The bank
has also implemented biometric access systems to increase
secure access to its branches and buildings. Data integrity is
ensured via high-level data encryption, authorised user systems,
audit trails and other measures. Awareness campaigns amongst
staff are driven by articles in the bank’s inhouse magazine,
e-newsletters and posters. The bank also offers its employees a
Tip-Offs Anonymous line.
Shareholder Profi le
Capitec does not have a controlling shareholder. Its main
shareholders are the JSE-listed PSG Group Limited, a fi nancial
services group of companies holding 34.9% interest in Capitec,
BEE groups and individuals (16%) , and board and management
at 23.3%. The balance of shareholders is made up of fund
managers (4.5%), foreign investors (2.8%) and individuals,
and companies and trusts holding a varied number of shares in
Capitec.
Information provided to shareholders
Shareholders and the public are held up to date on Capitec’s
business through the publication of year-end and interim
results on the Stock Exchange News Service (SENS) and in
the media within a month from such year-end and interim periods.
In addition, the annual report containing the fi nancial results
• A negative turn in our country’s economic conditions could
have an impact on the growth of our lending income streams.
• Financial skills remain a challenge in our target market.
• The increase in demand for retail space had an impact on the
expansion of our branch network in 2007.
• Debt rehabilitation is still a challenge but a partnership with
Stellenbosch University’s Legal Aid Clinic will provide us with
a solid foundation from which we can develop real solutions
in 2008. We also participate in an industry-led debt mediation
initiative under the auspices of the Banking Association.

C a p i t e c B a n k H o l d i n g s L i m i t e d
S u s t a i n a b i l i t y R e p o r t
4 3
is distributed within three months from year-end and a leafl et
detailing half-year results is distributed within two months from the
half-year period to all shareholders and benefi cial shareholders
who have requested to receive this information. Salient details of
dividend payments are announced in the media and, when not
included in the annual report or half-year results leafl et, a leafl et
detailing this information is posted to all shareholders. Capitec
Bank’s website at www.capitecbank.co.za provides a wealth of
information for stakeholders, including clients, service providers
and investors. To ensure transparency, information pertinent to
Capitec’s business and relevant to shareholders and the public is
announced on SENS as and when deemed prudent. Shareholder
queries are dealt with one-on-one by senior management in the
Group and in the secretarial department.
Investor relations
Investor relations are managed by the company secretary who
caters for the interests of shareholders and a team consisting of
our chief executive offi cer and fi nancial director who meet on a
regular basis with asset managers, analysts, general corporate
investors and journalists. The investor community is kept informed
through one-on-one meetings and conference calls, road shows,
investor conferences and fi nancial presentations.
Market feedback is valued and is gleaned through broker reports
Dividends in respect of: 12 months ended 29 February 2008 12 months ended 28 February 2007
Final 75 c 60 c
Last day to trade 16 June 2008 8 June 2007
Record date 13 June 2008 15 June 2007
Payment date 17 June 2008 18 June 2007
Interim 25 c 20 c
Last day to trade 23 November 2007 24 November 2006
Record date 30 November 2007 1 December 2006
Payment date 3 December 2007 4 December 2006
Ordinary shares Preference shares Total shares
Shares in issue at 29 February 2008 81 928 412 1 684 211 83 612 623
Shares in issue at 28 February 2007 81 928 412 1 684 211 83 612 623
Capitec’s performance on the JSE Limited
12 months ended 29 February 2008 12 months ended 28 February 2007
Number of ordinary shares in issue 81 928 412 81 928 412
Market price (cents per share)
High 5649 (13 November 2007) 3800 (6 February 2007)
Low 3000 (22 January 2008) 2605 (1 August 2006)
Closing price 3900 3700
Market capitalisation (R million) 3 195 3 031
Dividends – ordinary shares
for 12 months
and one-on-one discussions with analysts, asset managers and
other opinion leaders.
Meetings held and information shared
Capitec encourages shareholders to attend the annual general
meeting normally held in May. Apart from the annual report containing
the notice of the annual general meeting, each and every benefi cial
shareholder disclosed in our share registers are personally invited to
attend the meeting. As a result, the Capitec annual general meeting
has become a signifi cant event on our shareholders’ calendars. Out
of a shareholder base of approximately 3 000 benefi cial members,
approximately 200 join our board at this annual meeting. To
ensure that each and every vote is accurately accounted for, we have
introduced an electronic method of voting in 2007 which has been
received with appreciation. At this meeting, the chairman of the board
and chief executive offi cer use the opportunity to present an overview
of Capitec business over the past year and shareholders are given
the opportunity to discuss matters of interest concerning Capitec
Bank’s business with members of the board and management.
Credit rating of Capitec Bank
In January 2006 Moody’s Investor Service (Moody’s) assigned a
Baa1.za/Prime-2.za national scale issuer rating to Capitec Bank,
Capitec’s banking subsidiary. In May 2007 Moody’s raised the

S u s t a i n a b i l i t y R e p o r t
C a p i t e c B a n k H o l d i n g s L i m i t e d4 4
Naval Junior Leadership Programme
Equity ownership and control
Highlights
• Direct and broad-based black shareholding through BEE
partner: 16%
• Black directors at board level: 27%
• Black women at board level: 9%
• Black people at executive management level: 18%
(2007: 0%).
Lowlights
• Black women at board level remained unchanged at one
individual. Due to board membership being extended during
the year, the percentage of black women at board level has
been reduced from 10% to 9%.
Control
The Capitec board has three black members. Professor Merlyn
Mehl has been a member of the board since the inception of the
Capitec banking group in 2001, while Nonhlanhla Mjoli-Mncube
has joined the board in 2004. Towards the end of 2004, 100 000
ordinary shares in Capitec were issued to each of Prof Mehl and
Ms Mjoli-Mncube.
In February 2007, Capitec issued 12.21% in Capitec ordinary
shares (10 million) to a black consortium headed by Tshepo
Mahloele. Other than these direct and broad-based black
holdings, Thembeka Capital, a black-owned and controlled
black economic empowerment company, holds a further 3.53%
interest in Capitec.
To date, the Capitec Group has established two employee
schemes to augment employee share ownership in Capitec.
In December 2003, the board approved an Employee Share
Purchase Scheme in terms of which employees wishing to
become co-owners in Capitec are assisted with share purchases.
The extent of shareholding through this scheme is insignifi cant,
being 0.17%. A total of 67.3% of employees participating in this
scheme are black and hold in aggregate 20% of the scheme
shares.
long-term national scale credit rating of Capitec Bank to A2.za,
the short-term rating remained at Prime-2.za. The long-term rating
refl ects a good long-term credit quality and the short-term rating a
strong ability to repay short-term debt obligations.
Gender split of
Capitec
Employee Share
Purchase Scheme
56% Female
44% Male
Demographic
split of Capitec
Employee Share
Purchase Scheme
67% Black
33% White
The issue of a 12.21% interest in Capitec to the BEE consortium
referred to above was approved with the proviso that a 5% interest
in the said consortium be allocated to the Capitec Bank Group
Employee Empowerment Trust. In terms of the rules of this
trust, employees will benefi t from the growth of Capitec through
increased share value.
A total of 16% of Capitec is therefore controlled by black individuals,
companies and trusts.
At Capitec Bank our Human Resource strategy and practices
are devised to enable our people to deliver on our service promise
to our clients. Through our national recruitment drive we employ
talent in support of our strategy, style and corporate culture. It is
of the utmost importance to us to get people onboard who have
a client-centric mindset, have the ability to learn fast, are real
team-players and who are able to thrive within a pressurised
performance-driven environment. We employ our people from
the communities we serve and follow the principle of recruit for
potential and train for skill.
As functional knowledge and competence are seen as fundamentals
of our service model we invest heavily in the development of
our people through various training platforms. Formal training
programmes are supported by a culture of continuous learning to en-
sure high levels of knowledge retention throughout our organisation.
We manage our people through teamwork and develop our leaders
in order to manage our business and people effectively. These
principles of teamwork and performance are supported through our
performance management system and reward strategy.
Employee Report
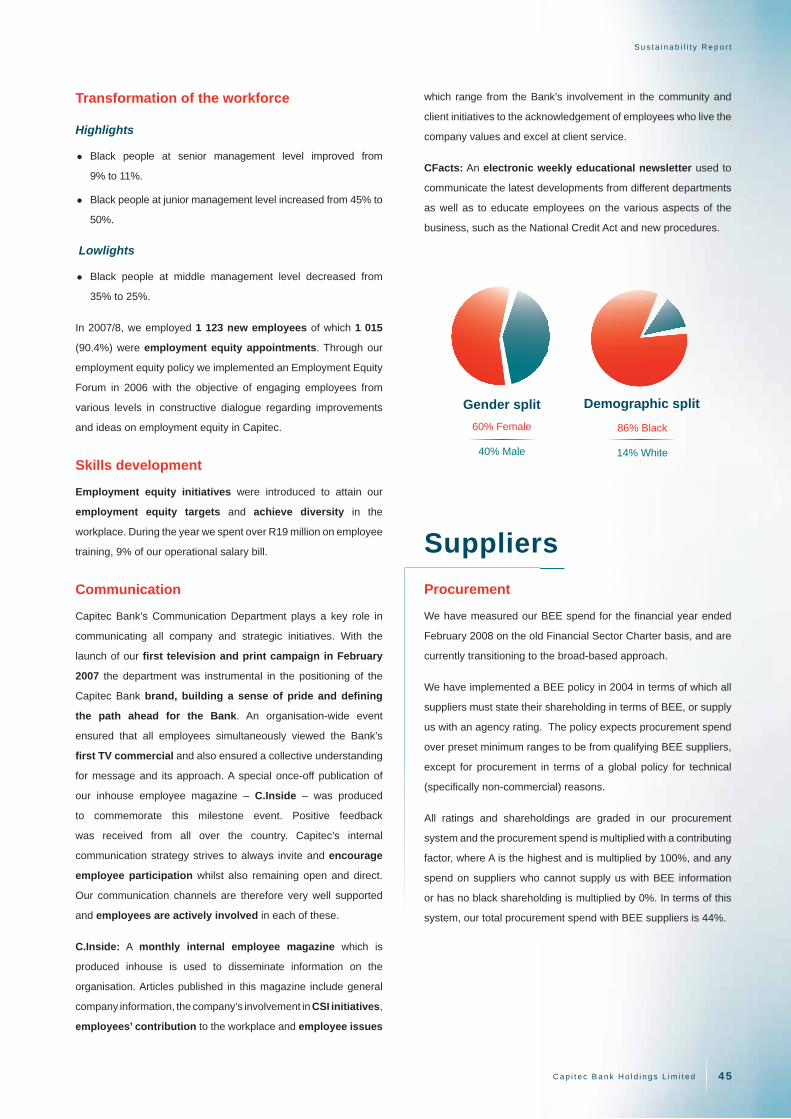
C a p i t e c B a n k H o l d i n g s L i m i t e d
S u s t a i n a b i l i t y R e p o r t
4 5
Procurement
We have measured our BEE spend for the fi nancial year ended
February 2008 on the old Financial Sector Charter basis, and are
currently transitioning to the broad-based approach.
We have implemented a BEE policy in 2004 in terms of which all
suppliers must state their shareholding in terms of BEE, or supply
us with an agency rating. The policy expects procurement spend
over preset minimum ranges to be from qualifying BEE suppliers,
except for procurement in terms of a global policy for technical
(specifi cally non-commercial) reasons.
All ratings and shareholdings are graded in our procurement
system and the procurement spend is multiplied with a contributing
factor, where A is the highest and is multiplied by 100%, and any
spend on suppliers who cannot supply us with BEE information
or has no black shareholding is multiplied by 0%. In terms of this
system, our total procurement spend with BEE suppliers is 44%.
Transformation of the workforce
Highlights
• Black people at senior management level improved from
9% to 11%.
• Black people at junior management level increased from 45% to
50%.
Lowlights
• Black people at middle management level decreased from
35% to 25%.
In 2007/8, we employed 1 123 new employees of which 1 015
(90.4%) were employment equity appointments. Through our
employment equity policy we implemented an Employment Equity
Forum in 2006 with the objective of engaging employees from
various levels in constructive dialogue regarding improvements
and ideas on employment equity in Capitec.
Skills development
Employment equity initiatives were introduced to attain our
employment equity targets and achieve diversity in the
workplace. During the year we spent over R19 million on employee
training, 9% of our operational salary bill.
Communication
Capitec Bank’s Communication Department plays a key role in
communicating all company and strategic initiatives. With the
launch of our fi rst television and print campaign in February
2007 the department was instrumental in the positioning of the
Capitec Bank brand, building a sense of pride and defi ning
the path ahead for the Bank. An organisation-wide event
ensured that all employees simultaneously viewed the Bank’s
fi rst TV commercial and also ensured a collective understanding
for message and its approach. A special once-off publication of
our inhouse employee magazine – C.Inside – was produced
to commemorate this milestone event. Positive feedback
was received from all over the country. Capitec’s internal
communication strategy strives to always invite and encourage
employee participation whilst also remaining open and direct.
Our communication channels are therefore very well supported
and employees are actively involved in each of these.
C.Inside: A monthly internal employee magazine which is
produced inhouse is used to disseminate information on the
organisation. Articles published in this magazine include general
company information, the company’s involvement in CSI initiatives,
employees’ contribution to the workplace and employee issues
Gender split
60% Female
40% Male
Demographic split
86% Black
14% White
Suppliers
which range from the Bank’s involvement in the community and
client initiatives to the acknowledgement of employees who live the
company values and excel at client service.
CFacts: An electronic weekly educational newsletter used to
communicate the latest developments from different departments
as well as to educate employees on the various aspects of the
business, such as the National Credit Act and new procedures.
S u s t a i n a b i l i t y R e p o r t
C a p i t e c B a n k H o l d i n g s L i m i t e d4 6
Communities by Unisa and funded by Capitec Bank. This course provides
participants with a comprehensive introduction and understanding
of basic fi nancial skills such as:
• Financial planning – long-term and short-term
• Understanding a budget
• Debt management and avoiding over-indebtedness
• The benefi ts of saving
• How to provide for retirement
• Understanding the world of banking.
This certifi cate course is offered via Unisa’s distance learning
programme and participants are required to complete assignments
and a fi nal assessment before being issued with a Certifi cate in
Financial Skills. This course has been accredited on an NQF
level 5 and earns 12 SAQA credits.
In 2007 Capitec Bank also launched three shorter courses
based on the Unisa course. These shorter courses are presented
free of charge to employers, schools and community groups.
The three shorter courses are supported with course handouts
and a DVD that illustrates the practical implications of fi nancial
skills. To date we have presented a signifi cant number of courses
all over the country with positive feedback. We have extended
our fi nancial skills drive to the mass media and in 2007 we ran
four separate fi nancial skills programmes in publications and two
three-month series on community radio stations.
Although Capitec Bank has received positive feedback via
informal research based on audience participation, we would like
to formally review the impact of our fi nancial literacy programme.
Having run this programme since 2005, we should now have
suffi cient data on which to base formal research. Therefore, in
2008, we will embark on research with participants of both
the Financial Skills Course (Unisa Certifi cate Course) and
the shorter courses to ascertain whether our objective of
empowering participants with basic fi nancial skills has been
successful. Capitec Bank will report on these fi ndings.
Naval Junior Leadership Programme
In 2006 Capitec Bank entered into a partnership with the SA Naval
College based in Gordon’s Bay in the Western Cape to pilot a
Financial Skills module as part of the Navy’s Junior Leadership
Programme for Schools. The Junior Leadership Programme
involves ten Grade 12 learners from eight secondary schools
in the Helderberg basin. The aim of this project is to equip learners
with leadership and management skills, as well as life skills
Corporate Social Investment Benefiting our communities
The main focus of our corporate social investment strategy is
fi nancial education and as such, donations made in 2007
have been subject to the fi nancial education theme. Institutions
involved in education, job creation and community upliftment
were favoured when allocating fi nancial support. However, it is
the Capitec Bank offer that should be considered for its value
to the predominantly previously disadvantaged communities.
Access to banking and fi nance provides the community with
upliftment and improved economic conditions which may
contribute to poverty relief. The future of our country is arguably
tied to the sustainable development of these communities through
the implementation of community programmes and initiatives by
corporates such as Capitec Bank. Our business objectives include
achieving sustainable development within these communities by:
• Increasing access to banking and fi nancing options by
growing our footprint and diversifying our product offer.
• Extending our retail partnerships to offer access to banking
beyond our trading hours.
• Reducing our interest rates to make access to credit
economically feasible for our clients.
• Continuing to offer a real return on savings balances with
an attractive savings interest rate.
Our intention is to make a sustainable difference to the lives of
South Africans within our chosen market through corporate
social investment initiatives aligned with our core business. Our
corporate social investment strategy is therefore focused on
fi nancial literacy and community upliftment. In 2007 Capitec
initiated a number of successful programmes that support these
focus areas. We partnered with more educational institutions
and have built on past successes to ensure sustainability of
previous initiatives.
Financial education
Financial literacy programme
As a retail bank we understand the value of fi nancial literacy.
Capitec launched its fi nancial literacy programme in 2005 as
one of the key focus areas of our corporate social investment
strategy. Partnering with Unisa, we developed two fi nancial
literacy courses. One is a short course in fi nancial skills offered

C a p i t e c B a n k H o l d i n g s L i m i t e d
S u s t a i n a b i l i t y R e p o r t
4 7
to enhance their performance as leaders at their schools and to
bring about social upliftment in the broader community. This
programme also promotes interaction between different schools
and cultures. The following leadership skills were covered:
Transformational Leadership: Styles; Problem-solving Using
Intellectual Stimulation; Creating a Value and Belief System (vision
/ mission); Creating an Organisational Culture.
Management: Brainstorming Techniques; SWOT Analysis;
Organising, Planning, Controlling and Communication.
Life Skills: Confl ict / Stress Management; Peer Pressure; Abuse,
Drug and HIV/Aids awareness.
Financial Skills: Financial Planning and Budgeting; Financing;
Debt Management.
The integration of fi nancial skills as part of the Junior Leadership
Programme made sense as Capitec Bank understands the value
of educating the youth on money management. We believe
that fi nancial literacy programmes partnered with leadership skills
programmes are crucial for personal empowerment.
Capitec Bank was involved in the Naval Junior Leadership
Programme for the second time in 2007. With the Bank’s fi nancial
assistance the Navy was able to invite 40 additional learners
from four additional schools, bringing the total number of
learners attending the Junior Leadership Programme to 120. The
response from teachers, parents and learners has been extremely
positive. Many learners commented positively on Capitec Bank’s
Financial Skills module and made special mention of the practical
content and interactive presentation style. They said it offered real
value in terms of their personal development.
Capitec Bank was also the main contributor to the Naval College
Open Day in 2007. This community day, which focuses on
naval activities and careers, has become a highlight on the
local calendar. After assessing our involvement in both initiatives,
Capitec Bank has decided to strengthen our support for the Naval
Junior Leadership Programme in 2008.
Support for non-profi t organisations (NPOs)
Through its CSI programme, Capitec Bank supports many
non-profi t organisations focused on education or community
upliftment. The following organisations, among others, have
benefi ted from a long-term relationship with Capitec Bank:
• Carel du Toit Centre for Hearing Impaired Children
• Paul Roos Academy
• JL Zwane Church
• World Knowledge Olympiad
• Stellenbosch University Legal Aid Clinic
• Khayamandi Cycling Project.
Employee involvement in CSI projects
Casual Day
Each year Capitec Bank goes casual in the name of charity. Our
employees dress up according to the annual Casual Day theme
and enter the C.Inside Casual Day Competition in a drive to
raise funds for people with disabilities. This initiative is very
well supported and our executive team join in to raise awareness
and funds for people with physical or mental disabilities.
HIV/Aids Employee Awareness
Living with HIV/Aids
International Aids Awareness Day is observed on 1 December.
Capitec Bank’s policy on HIV/Aids makes it clear that we do not
discriminate against employees or people living with HIV/Aids.
Mamello Motsau is one of our employees who is HIV-positive.
She has embraced life and uses her HIV status to educate
people about the prevention and treatment of HIV/Aids. She
is passionate about making a difference as Capitec Bank’s culture
of respect and honouring diversity has made it possible for her to
start spreading her message at her place of work without fear of
being victimised.
Environmental responsibility
Capitec Bank believes in the sustainable and environmentally
friendly use of resources. That is why we acknowledge our
responsibility towards conducting business in an environmentally
friendly manner. To do this the Bank fosters a culture of
environmental stewardship amongst its employees. This will
be achieved through awareness programmes and guiding policies,
procedures and standards.
Using technology to reduce paper usage
To reduce the amount of paper used in our offi ces, the Bank is
promoting and implementing effi cient technology and practices
such as the following:
• Sending out electronic payslips to employees
• Distributing training material via its e-learning platform
(E-village)

S u s t a i n a b i l i t y R e p o r t
C a p i t e c B a n k H o l d i n g s L i m i t e d4 8
• Electronic agreement management
• Streamlined, technology-assisted application processes for
new banking products
• Tracking time electronically instead of using printed
timesheets
• Distributing policies and procedures only in electronic format
• Using printers, copiers and offi ce equipment that can handle
double-sided and multi-page printing or copying.
Minimising travel costs and pollution
Mindful of transport-related pollution and travel costs, Capitec
Bank encourages its employees to use public transport or
car-pooling when commuting to and from work. That is one
of the reasons why the Bank’s branches are located close to
public transport routes. The Bank’s longer hours and branch
locations also help to reduce the amount of travel that clients
have to do in order to access the Bank’s services.
Virtualisation – which removes the Bank’s dependency on
physical resources – includes conference calls, the electronic
storage of documents and web-based and electronic
transactions. This reduces, among others, travel expenses,
pollution, and the need for costly over-the-counter banking
services.
Environmentally friendly design and
management
Where available, new offi ces and branches are fi tted with energy-
saving devices such as:
• Energy-effi cient light fi ttings and globes
• Centrally controlled air-conditioners
• Air curtains to improve the effi ciency of air-conditioners
• Outsourced cleaning services that only use eco-friendly
products
• The effi cient use of technology to minimise the need for back-
offi ce functions. This allows the Bank to reduce fl oor space, air-
conditioning, lighting and other energy-consuming functions.
The Financial Sector CharterAs a subscriber to both the Financial Sector Charter (FSC) and
the Codes of Good Practice, Capitec is committed to promoting
empowerment through all its business practices. A range of
empowerment initiatives are aimed at addressing imbalances.
The Group has reported positive outcomes in most areas and
in particular in its corporate social investment initiatives. The
activities embarked on in 2007 have been very successful.
BEE Scorecard
Capitec Bank, the banking subsidiary of the Group, has been rated
for Black Economic Empowerment purposes in terms of both the
Financial Sector Charter scorecard as well as the Codes of Good
Practice issued under Section 9(1) of the Broad Based Black
Economic Empowerment Act 52 of 2003.
Under the Financial Sector Charter a score of 41.56%, equal to
a C-rating was achieved. Under the Codes of Good Practice, the
score is 55.06%. This is equal to a BEE procurement recognition
level of 80%.
Capitec Bank Limited will continue to be scored in terms of both
ratings until such time as the Financial Sector Charter has been
aligned with the Codes and has been gazetted in terms of the
Broad Based Black Economic Empowerment Act, thus obtaining
equal status to that of the Codes. Alternatively, should the
Financial Sector Charter fall away, the score in terms of the Codes
will prevail.
Civil societiesCapitec and its subsidiaries are members of:
The Banking Association of South Africa
Hellopeter.com
MasterCard Worldwide
National Business Initiative
National Credit Regulator
The Ombudsman for Banking Services
Payments Association of South Africa
South African Banking Risk Information Centre
South African Fraud Prevention Services
South Africa Market Research Association
Unilever Institute of Strategic Marketing
Visa International Service Association
Capitec and its subsidiaries are regulated by
the following institutions:
Financial Services Board
JSE Limited
National Credit Regulator
Payments Association of South Africa
South African Reserve Bank

Annual Financial Statements 2008
50 Statement of Responsibility by the Board of Directors
50 Certifi cate by the Company Secretary
51 Independent Auditors’ Report
52 Directors’ Report
57 Balance Sheets
58 Income Statements
59 Statements of Changes in Shareholders’ Equity
61 Cash Flow Statements
62 Notes to the Annual Financial Statements
50 Statement of Responsibility by the Board of Dire
50 Certifi cate by the Company Secretary
51 Independent Auditors’ Report
52 Directors’ Report
57 Balance Sheets
58 Income Statements
59 Statements of Changes in Shareholders’ Equity
61 Cash Flow Statements
62 Notes to the Annual Financial Statements
ectors
y

C a p i t e c B a n k H o l d i n g s L i m i t e d5 0
Statement of Responsibility by the Board of Directors
Capitec Bank Holdings Limited and its subsidiaries
The directors are responsible for the preparation, integrity and fair presentation of the fi nancial statements of Capitec Bank Holdings Limited
and its subsidiaries. The fi nancial statements presented on page 52 to 100 have been prepared in accordance with International Financial
Reporting Standards (IFRS), and include amounts based on judgements and estimates made by management.
The directors consider that in preparing the fi nancial statements they have used the most appropriate accounting policies, consistently
applied and supported by reasonable and prudent judgements and estimates and that all Statements of IFRS that they consider to be
applicable have been followed. The directors are satisfi ed that the information contained in the fi nancial statements fairly presents the results
of operations for the year and the fi nancial position of the group and company at year-end. The directors also prepared the other information
included in the annual report and are responsible for both its accuracy and consistency with the fi nancial statements.
The directors have the responsibility for ensuring that accounting records are kept. The accounting records should disclose, with reasonable
accuracy, the fi nancial position of the companies to enable the directors to ensure that the fi nancial statements comply with relevant
legislation.
Capitec Bank Holdings Limited and its subsidiaries operated in a well-established control environment, which is documented and regularly
reviewed. This incorporates risk management and internal control procedures which are designed to provide reasonable, but not absolute,
assurance that assets are safeguarded and that the risks facing the business are being controlled.
The going concern basis has been adopted in preparing the fi nancial statements. The directors have no reason to believe that the Group or
any company within the Group will not be going concerns in the foreseeable future, based on forecasts and available cash resources. These
fi nancial statements support the viability of the company and the Group.
The Code of Corporate Practices and Conduct has been adhered to, as noted in the corporate governance and risk management review.
The Group’s external auditors, PricewaterhouseCoopers Incorporated, audited the fi nancial statements and their report is presented on
page 51.
The fi nancial statements were approved by the Board of Directors on 31 March 2008, and are signed on its behalf by:
Michiel le Roux Riaan Stassen
Chairman Chief Executive Offi cer
Certificate by the Company Secretary
I hereby certify, in terms of section 268G of the Companies Act, No. 61 of 1973, that to the best of my knowledge, for the year ended 29
February 2008, the company has lodged with the Registrar of Companies all such returns as are required of a public company in terms of
this Act and that all such returns are true, correct and up to date.
Christian van Schalkwyk
Stellenbosch
01 April 2008

C a p i t e c B a n k H o l d i n g s L i m i t e d 5 1
Independent Auditors’ Report
To the Members of Capitec Bank Holdings Limited
We have audited the annual fi nancial statements and the group annual fi nancial statements of Capitec Bank Holdings Limited, which
comprise the directors’ report, the balance sheet and the consolidated balance sheet as at 29 February 2008, the income statement and
the consolidated income statement, the statement of changes in equity and the consolidated statement of changes in equity, the cash fl ow
statement and the consolidated cash fl ow statement for the year then ended, and a summary of signifi cant accounting policies and other
explanatory notes, as set out on pages 52 to 100.
Directors’ Responsibility for the Financial StatementsThe company’s directors are responsible for the preparation and fair presentation of these fi nancial statements in accordance with
International Financial Reporting Standards, and in the manner required by the Companies Act of South Africa. This responsibility includes:
designing, implementing and maintaining internal control relevant to the preparation and fair presentation of fi nancial statements that are free
from material misstatement, whether due to fraud or error; selecting and applying appropriate accounting policies; and making accounting
estimates that are reasonable in the circumstances.
Auditors’ ResponsibilityOur responsibility is to express an opinion on these fi nancial statements based on our audit. We conducted our audit in accordance with
International Standards on Auditing. Those standards require that we comply with ethical requirements and plan and perform the audit to
obtain reasonable assurance whether the fi nancial statements are free from material misstatement.
An audit involves performing procedures to obtain audit evidence about the amounts and disclosures in the fi nancial statements. The
procedures selected depend on the auditor’s judgement, including the assessment of the risks of material misstatement of the fi nancial
statements, whether due to fraud or error. In making those risk assessments, the auditor considers internal control relevant to the entity’s
preparation and fair presentation of the fi nancial statements in order to design audit procedures that are appropriate in the circumstances,
but not for the purpose of expressing an opinion on the effectiveness of the entity’s internal control. An audit also includes evaluating the
appropriateness of accounting policies used and the reasonableness of accounting estimates made by the directors, as well as evaluating
the overall presentation of the fi nancial statements.
We believe that the audit evidence we have obtained is suffi cient and appropriate to provide a basis for our audit opinion.
OpinionIn our opinion, the fi nancial statements present fairly, in all material respects, the fi nancial position of the company and of the Group as of
29 February 2008, and their fi nancial performance and their cash fl ows for the year then ended in accordance with International Financial
Reporting Standards, and in the manner required by the Companies Act of South Africa.
PricewaterhouseCoopers Inc
Director: HD Nel
Registered Auditor
Cape Town
01 April 2008

C a p i t e c B a n k H o l d i n g s L i m i t e d5 2
Directors’ Report
The directors present their annual report, which forms part of the audited fi nancial statements of the company, for the year ended
29 February 2008.
1. NATURE OF BUSINESS
The main business of the company is that of a bank controlling company as envisaged in the Banks Act, 1990. The company’s
subsidiaries are involved in retail banking and the wholesale distribution of consumer goods.
2. REVIEW OF OPERATIONS
The operating results and the state of affairs of the company and the group are fully set out in the attached balance sheets, income
statements, statements of changes in equity, cash fl ow statements and notes thereto. The group’s earnings attributable to shareholders
amounted to R229.1m (2007:R166.9m).
3. FINANCIAL RESULTS AND DIVIDENDS
The fi nancial results of the company and the group are set out in the attached fi nancial statements.
Dividends
A ordinary dividend of 75.0 cents per share was declared by the directors on 01 April 2008 (2007: 60.0 cents). No accrual was made
for this dividend, which is in line with accounting practice.
A preference dividend of 527.77 cents per share (2007: 452.26 cents) was declared on 29 February 2008 (2007: 28 February 2007).
The preference dividend of R8 888 760 was paid on 25 March 2008 (2007: 26 March 2007) and is included as a distribution to
preference shareholders in the current year’s statement of changes in equity.
An ordinary dividend of 60 cents per share relating to the previous fi nancial year was declared on 28 March 2007 and paid on 18 June
2007. An interim ordinary dividend of 25 cents per share was declared on 27 September 2007 and paid on 3 December 2007. The
total ordinary dividend of R69 639 150 (2007: R46 753 468) was settled in cash and is included as a distribution to equity holders in
the current fi nancial year’s statement of changes in equity.
An interim preference share dividend of 482.26 cents per share was declared on 31 August 2007 and paid on 25 September 2007. The
interim preference dividend of R8 122 276 was settled in cash and is included as a distribution to equity holders in the current fi nancial
year’s statement of changes in equity.
4. SHARE CAPITAL
There were no changes in share capital for the current year. During the prior fi nancial year, 10 000 000 ordinary shares with a par value of
R0.01 per share were issued to a BEE consortium at a premium of R29.99 per share (market value at the time). There was also an issue of
1 684 211 non-redeemable, non-cumulative, non-participating preference shares with a par value of R0.01 per share at a premium of R94.99
per share.
Included within the statement of changes in equity as a utilisation against share premium relating to share issue expenses for the
previous year was an amount of R502 000 relating to ordinary shares issued, and an amount of R5 394 000 relating to non-redeemable,
non-cumulative, non-participating preference shares issued.
Settlement of share options
The group settled 1 769 744 options (2007: 713 056 options) relating to the existing share incentive scheme.
5. DIRECTORS AND SECRETARY
Information relating to the directors and secretary of the company is presented on pages 53 to 56 of the fi nancial statements and in the
annual report.
6. GROUP DETAILS
The Group’s place of domicile and country of incorporation is the Republic of South Africa and has a primary listing on the Johannesburg
Stock Exchange (JSE Limited).
Registered offi ce : 10 Quantum Road
Techno Park
Stellenbosch
7600

C a p i t e c B a n k H o l d i n g s L i m i t e d 5 3
Number of ordinary shares held
Direct Indirect Direct Indirect Shares %
AP du Plessis * - 900 000 - - 900 000 1.10
MS du P le Roux (Chairman) - - - 12 443 402 12 443 402 15.19
KA Hedderwick(1) - - - - - 0.00
TD Mahloele(2) - - - 1 592 500 1 592 500 1.94
MC Mehl 106 713 - - - 106 713 0.13
NS Mjoli-Mncube 100 000 - - - 100 000 0.12
PJ Mouton(3) - - - - - 0.00
CA Otto 967 - - 459 539 460 506 0.56
JG Solms 33 779 - - - 33 779 0.04
R Stassen * 200 000 - - 2 050 000 2 250 000 2.75
JP van der Merwe(4) - - - - - 0.00
441 459 900 000 - 16 545 441 17 886 900 21.83
Direct Indirect Direct Indirect Shares %
AP du Plessis * - 1 001 223 - - 1 001 223 1.22
MS du P le Roux - - - 12 292 244 12 292 244 15.00
MC Mehl 110 000 - - - 110 000 0.13
NS Mjoli-Mncube 100 000 - - - 100 000 0.12
JF Mouton (Chairman)(5) 500 697 - - 7 091 839 7 592 536 9.27
CA Otto 967 - - 453 760 454 727 0.56
JG Solms 33 779 - - 18 183 51 962 0.06
R Stassen * 100 000 - - 2 397 229 2 497 229 3.05
J van Z Smit(6) 139 647 33 783 - 30 707 204 137 0.25
985 090 1 035 006 - 22 283 962 24 304 058 29.66
* Executive (1) Appointed on 10/12/2007 (2) Appointed on 10/04/2007 (3) Appointed on 05/10/2007 (4) Appointed on 27/09/2007 (5) Resigned on 05/10/2007 (6) Resigned on 27/09/2007
2008 Benefi cial Non-benefi cial Total
2007 Benefi cial Non-benefi cial Total
Directors’ Report
7. INTERESTS OF THE DIRECTORS IN SHARE CAPITAL AND CONTRACTS
7.1 At year end, the directors, in aggregate, were directly or indirectly, benefi cially or non-benefi cially, interested in 17 886 900
(2007: 24 304 058) Capitec Bank Holdings Limited shares, equivalent to 21.83%, (2007: 29.66%) of the issued share capital of Capitec
Bank Holdings Limited. The individual interests of the directors were as follows:

C a p i t e c B a n k H o l d i n g s L i m i t e d5 4
Directors’ Report
7.2 At year end, the directors were participants in the Capitec Bank Holdings Limited share incentive scheme in respect of 1 053 500
(2007:1 450 818 ) Capitec Bank Holdings Limited share options as follows:
No options were exercised in the prior fi nancial year by the executive directors after it was decided to allow the early exercise of options
matured in the 2006/07 year to the extent that there were shares available in the Share Incentive Trust on 20 February 2006.
articipants in the Capitec Bank Holddings Limited share incentive scheme in resspect of 1 053 500 7..2 At yyear end, the directors were pa
Holdings Limited share options as ffollows: (200707:1 450 818 ) Capitec Bank H
prior fi nancial year by the executivee directors after it was decided to allallow ow the early exercise of optionsNNo optionons were exercised in the
e extent that there were shares avaailable in the Share Incentive Trust on 20 Feebruary 2006. mmatured in the 2006/07 year to the
(Options exercised)/ Closing Options granted balance
Strike Number Number Market Number
Maturity Issue price of share of share price Exercise of share
date date R options options R date options
AP du Plessis
(indirect benefi cial) 29 Apr 07 29 Apr 04 5.73 25 000 (25 000) 40.00 7 May 07 -
29 Apr 08 29 Apr 04 5.73 25 000 - 25 000
16 Jul 07 17 Jul 00 1.42 98 777 (98 777) 42.50 25 Oct 07 -
29 Apr 09 29 Apr 04 5.73 25 000 - 25 000
29 Apr 10 29 Apr 04 5.73 25 000 - 25 000
(direct benefi cial) 20 May 08 20 May 05 14.05 17 500 - 17 500
12 Apr 09 12 Apr 06 30.73 13 125 - 13 125
20 May 09 20 May 05 14.05 17 500 - 17 500
12 Apr 10 12 Apr 06 30.73 13 125 - 13 125
26 Apr 10 26 Apr 07 35.82 - 19 000 19 000
20 May 10 20 May 05 14.05 17 500 - 17 500
12 Apr 11 12 Apr 06 30.73 13 125 - 13 125
26 Apr 11 26 Apr 07 35.82 - 19 000 19 000
20 May 11 20 May 05 14.05 17 500 - 17 500
12 Apr 12 12 Apr 06 30.73 13 125 - 13 125
26 Apr 12 26 Apr 07 35.82 - 19 000 19 000
26 Apr 13 26 Apr 07 35.82 - 19 000 19 000
321 277 (47 777) 273 500
R Stassen
(indirect benefi cial) 16 Jul 07 17 Jul 00 1.42 249 541 (249 541) 46.00 1 Nov 07 -
(direct benefi cial) 29 Apr 07 29 Apr 04 5.73 100 000 (100 000) 34.85 2 Aug 07 -
29 Apr 08 29 Apr 04 5.73 100 000 - 100 000
20 May 08 20 May 05 14.05 70 000 - 70 000
12 Apr 09 12 Apr 06 30.73 50 000 - 50 000
29 Apr 09 29 Apr 04 5 73 100 000 - 100 000
20 May 09 20 May 05 14.05 70 000 - 70 000
12 Apr 10 12 Apr 06 30.73 50 000 - 50 000
29 Apr 10 29 Apr 04 5.73 100 000 - 100 000
20 May 10 20 May 05 14.05 70 000 - 70 000
12 Apr 11 12 Apr 06 30.73 50 000 - 50 000
20 May 11 20 May 05 14.05 70 000 - 70 000
12 Apr 12 12 Apr 06 30.73 50 000 - 50 000
-
1 129 541 (349 541) 780 000
Total 1 450 818 (397 318) 1 053 500
Directors
Openingbalance
2008
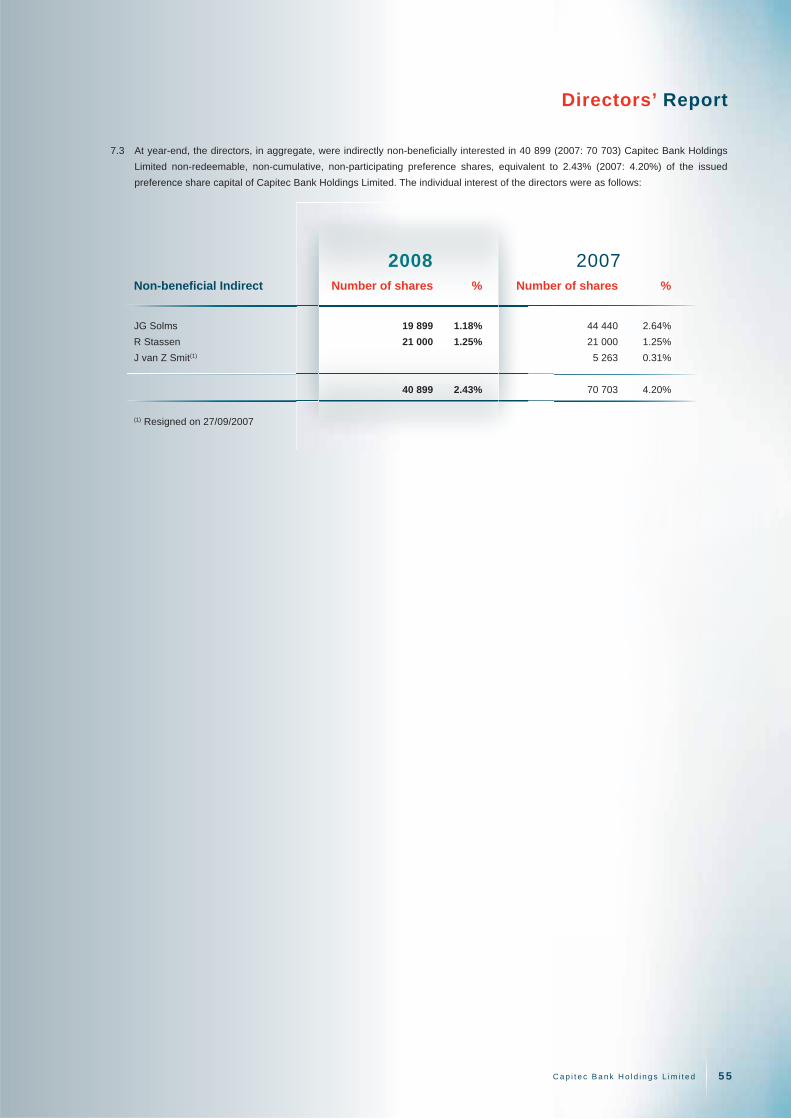
C a p i t e c B a n k H o l d i n g s L i m i t e d 5 5
Directors’ Report
7.3 At year-end, the directors, in aggregate, were indirectly non-benefi cially interested in 40 899 (2007: 70 703) Capitec Bank Holdings
Limited non-redeemable, non-cumulative, non-participating preference shares, equivalent to 2.43% (2007: 4.20%) of the issued
preference share capital of Capitec Bank Holdings Limited. The individual interest of the directors were as follows:
Non-benefi cial Indirect Number of shares % Number of shares %
JG Solms 19 899 1.18% 44 440 2.64%
R Stassen 21 000 1.25% 21 000 1.25%
J van Z Smit(1) 5 263 0.31%
40 899 2.43% 70 703 4.20%
(1) Resigned on 27/09/2007
2008 2007

C a p i t e c B a n k H o l d i n g s L i m i t e d5 6
Directors’ Report
7.4 The directors’ remuneration in respect of the fi nancial year ended 29 February 2008 was as follows:
spect of the fi nancial year ended 299 February 2008 was as follows: 7.44 The ddirectors’ remuneration in res
Salaries Fringe benefi ts Bonuses Fees Total
R’000 R’000 R’000 R’000 R’000
Executive
AP du Plessis 2 285 153 477 - 2 915
R Stassen 2 280 249 2 431 - 4 960
Non-executive
MS du P le Roux (Chairman) - - - 563 563
KA Hedderwick - - - 17 17
TD Mahloele - - - 68 68
MC Mehl - - - 150 150
NS Mjoli-Mncube - - - 100 100
JF Mouton - - - 88 88
PJ Mouton - - - 30 30
CA Otto - - - 175 175
JG Solms - - - 150 150
JP van der Merwe - - - 53 53
J van Z Smit - - - 86 86
4 565 402 2 908 1 480 9 355
The total share option expense relating to directors amounts to R1 527 855 (2007: R1 025 899).
Salaries Fringe benefi ts Bonuses Fees Total
R’000 R’000 R’000 R’000 R’000
Executive
AP du Plessis 1 462 148 229 - 1 839
R Stassen 2 328 248 1 950 - 4 526
Non-executive
MS du P le Roux (Chairman) - - - 137 137
D Lockey - - - 47 47
MC Mehl - - - 97 97
NS Mjoli-Mncube - - - 95 95
JF Mouton - - - 500 500
CA Otto - - - 149 149
JG Solms - - - 116 116
J van Z Smit - - - 122 122
3 790 396 2 179 1 263 7 628
2008
2007
8. INVESTMENTS IN SUBSIDIARIES
Information relating to the company’s fi nancial interest in its subsidiaries is set out in Note 10 to the fi nancial statements.
9. MATERIAL EVENTS AFTER YEAR-END
No event, which is material to the fi nancial affairs of the company, has occurred between the balance sheet date and the date of
approval of the fi nancial statements.
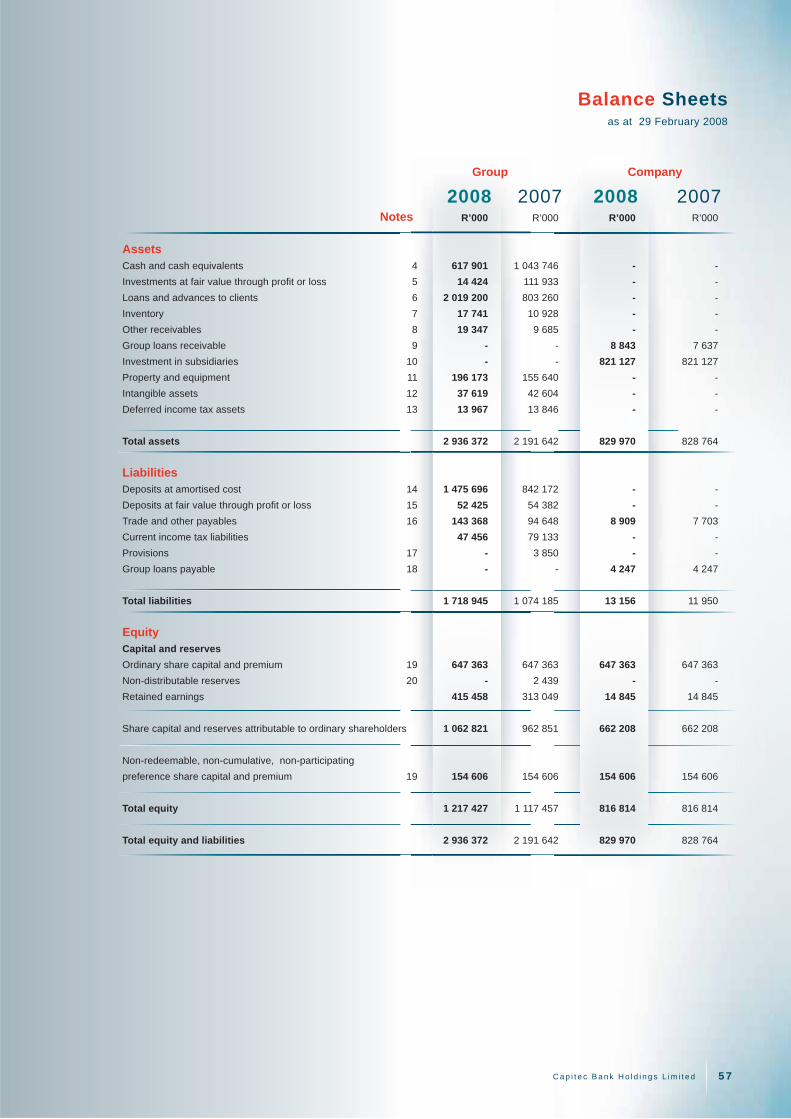
C a p i t e c B a n k H o l d i n g s L i m i t e d 5 7
R’000 R’000 R’000 R’000
Assets
Cash and cash equivalents 4 617 901 1 043 746 - -
Investments at fair value through profi t or loss 5 14 424 111 933 - -
Loans and advances to clients 6 2 019 200 803 260 - -
Inventory 7 17 741 10 928 - -
Other receivables 8 19 347 9 685 - -
Group loans receivable 9 - - 8 843 7 637
Investment in subsidiaries 10 - - 821 127 821 127
Property and equipment 11 196 173 155 640 - -
Intangible assets 12 37 619 42 604 - -
Deferred income tax assets 13 13 967 13 846 - -
Total assets 2 936 372 2 191 642 829 970 828 764
Liabilities
Deposits at amortised cost 14 1 475 696 842 172 - -
Deposits at fair value through profi t or loss 15 52 425 54 382 - -
Trade and other payables 16 143 368 94 648 8 909 7 703
Current income tax liabilities 47 456 79 133 - -
Provisions 17 - 3 850 - -
Group loans payable 18 - - 4 247 4 247
Total liabilities 1 718 945 1 074 185 13 156 11 950
Equity
Capital and reserves
Ordinary share capital and premium 19 647 363 647 363 647 363 647 363
Non-distributable reserves 20 - 2 439 - -
Retained earnings 415 458 313 049 14 845 14 845
Share capital and reserves attributable to ordinary shareholders 1 062 821 962 851 662 208 662 208
Non-redeemable, non-cumulative, non-participating
preference share capital and premium 19 154 606 154 606 154 606 154 606
Total equity 1 217 427 1 117 457 816 814 816 814
Total equity and liabilities 2 936 372 2 191 642 829 970 828 764
2008 2007 2008 2007 Notes
Group Company
Balance Sheetsas at 29 February 2008

C a p i t e c B a n k H o l d i n g s L i m i t e d5 8
Income Statementsfor the year ended 29 February 2008
R’000 R’000 R’000 R’000
Interest income 21 740 063 967 528 - -
Interest expense 21 (101 449) (69 836) - -
Net interest income 638 614 897 692 - -
Net fee income 653 400 111 557 - -
Loan fee income 574 584 76 943 - -
Transaction fee income 168 361 93 671 - -
Transaction fee expense (89 545) (59 057) - -
Dividend income 22 15 392 1 469 86 650 54 450
Net impairment charge on loans and advances 23 (230 879) (161 271) - -
Net movement in fi nancial instruments held at fair value
through profi t or loss 24 7 818 (857) - -
Non-banking gross profi t 10 938 8 025 - -
Sales 159 122 134 888 - -
Cost of sales (148 184) (126 863) - -
Other income 8 75 444 643
Income from operations 1 095 291 856 690 87 094 55 093
Banking operating expenses (762 540) (606 705) (444) (710)
Non-banking operating expenses (8 405) (6 808) - -
Operating profi t before tax 25 324 346 243 177 86 650 54 383
Tax expense 26 (95 281) (76 253) - -
Profi t for the year attributable to equity holders 229 065 166 924 86 650 54 383
Earnings per share attributable to ordinary shareholders (cents)
Basic 27 258.8 220.9
Diluted 27 250.3 209.5
Proposed fi nal ordinary dividend per share (cents) 28 75.0 60.0
Interim ordinary dividend per share (cents) 29 25.0 20.0
2008 2007 2008 2007 Notes
Group Company

C a p i t e c B a n k H o l d i n g s L i m i t e d 5 9
Ordinary Preference Shares Non-
share share held by distributable Retained
capital and capital and the Group reserves earnings Total
premium premium
R’000 R’000 R’000 R’000 R’000 R’000
Group Balance at 1 March 2006 347 865 - - 710 215 241 563 816
Shares issued during the year 300 000 160 000 - - - 460 000
Share issue expenses (502) (5 394) - - (64) (5 960)
Net profi t for the year - 7 617 - - 159 307 166 924
Ordinary dividend - - - - (46 753) (46 753)
Preference dividend - (7 617) - - - (7 617)
Share-based staff costs - - - - 4 005 4 005
Shares acquired for employee share options at cost - - (23 441) - - (23 441)
Realised loss on settlement of employee share options - - 23 441 - (22 249) 1 192
Tax effect on settlement of share options - - - - 5 291 5 291
Transfer to statutory provision reserve - - - 1 729 (1 729) -
Balance at 28 February 2007 647 363 154 606 - 2 439 313 049 1 117 457
Net profi t for the year - 17 011 - - 212 054 229 065
Ordinary dividend - - - - (69 639) (69 639)
Preference dividend - (17 011) - - - (17 011)
Share-based staff costs - - - - 7 009 7 009
Transfer from statutory provision reserve - - - (2 439) 2 439 -
Shares acquired for employee share options at cost - - (71 469) - - (71 469)
Realised loss on settlement of employee share options - - 71 469 - (66 886) 4 583
Tax effect on settlement of share options - - - - 17 432 17 432
Balance at 29 February 2008 647 363 154 606 - - 415 458 1 217 427
Notes 19 19 20
Statements of Changes in Shareholders’ Equityfor the year ended 29 February 2008

C a p i t e c B a n k H o l d i n g s L i m i t e d6 0
Statements of Changes in Shareholders’ Equityfor the year ended 29 February 2008
Ordinary Preference
share share Retained
capital premium earnings Total
R’000 R’000 R’000 R’000
CompanyBalance at 1 March 2006 347 865 - 14 832 362 697
Shares issued during the year 300 000 160 000 - 460 000
Share issue expenses (502) (5 394) - (5 896)
Net profi t for the year - 7 617 46 766 54 383
Ordinary dividend - - (46 753) (46 753)
Preference dividend - (7 617) - (7 617)
Balance at 28 February 2007 647 363 154 606 14 845 816 814
Net profi t for the year - 17 011 69 639 86 650
Ordinary dividend - - (69 639) (69 639)
Preference dividend - (17 011) - (17 011)
Balance at 29 February 2008 647 363 154 606 14 845 816 814
Notes 19 19

C a p i t e c B a n k H o l d i n g s L i m i t e d 6 1
R’000 R’000 R’000 R’000
Cash fl ow from operating activities
Cash fl ow from operations 33 (151 225) 292 041 86 584 54 469
Tax paid 34 (109 647) (21 520) - -
(260 872) 270 521 86 584 54 469
Cash fl ow from investing activities
Investment in property and equipment 11 (100 908) (71 158) - -
Investment in computer software 12 (16 047) (14 799) - -
Increase in investment in subsidiaries - - - (554 104)
Proceeds from disposal of equipment 884 148 - -
(Increase) decrease in loans receivable from group companies - - (1 206) 92 363
Acquisition of investments at fair value through profi t or loss (169 224) (108 361) - -
Disposal of investments at fair value through profi t or loss 272 586 - - -
(12 709) (194 170) (1 206) (461 741)
Cash fl ow from fi nancing activities
Decrease in group loans payable - - - (79)
Dividends paid * 35 (85 378) (46 753) (85 378) (46 753)
Shares issued 36 - 454 104 - 454 104
Shares acquired and options settled 37 (66 886) (22 249) - -
(152 264) 385 102 (85 378) 407 272
Net (decrease) increase in cash and cash equivalents (425 845) 461 453 - -
Cash and cash equivalents at beginning of year 1 043 746 582 293 - -
Cash and cash equivalents at end of year 4 617 901 1 043 746 - -
* Dividends paid have been moved from cash fl ow from operating activities to cash fl ow from fi nancing activities in line with recommended
accounting practice.
2008 2007 2008 2007 Notes
Group Company
Cash Flow Statementsfor the year ended 29 February 2008

C a p i t e c B a n k H o l d i n g s L i m i t e d6 2
1. ACCOUNTING POLICIES
The principal accounting policies applied in the preparation of these consolidated fi nancial statements are set out below. These
policies have been consistently applied to all the years presented, unless otherwise stated. Accounting policies have been consistently
applied through subsidiaries in the Group.
Basis of preparation
The Group’s consolidated fi nancial statements have been prepared in accordance with International Financial Reporting Standards
(IFRS). The consolidated fi nancial statements have been prepared under the historical cost convention, as modifi ed by the revaluation
of fi nancial instruments held at fair value through profi t or loss.
The preparation of fi nancial statements in conformity with IFRS requires the use of certain critical accounting estimates. It also
requires management to exercise its judgement in the process of applying the Group’s accounting policies. The areas involving a
higher degree of judgement or complexity, or areas where assumptions and estimates are signifi cant to the consolidated fi nancial
statements are disclosed in Note 2.
1.1 Basis of consolidation
The consolidated fi nancial statements include those of the company, all its subsidiaries, the share incentive trust and the employee
empowerment trust.
Subsidiaries are all entities (including special purpose entities) over which the Group has the power to govern the fi nancial and
operating policies, generally accompanying a shareholding of more than one half of the voting rights, for the benefi t of the Group.
The existence and effect of potential voting rights would be considered when assessing whether the Group controls another entity,
had such rights existed. Subsidiaries are fully consolidated from the date on which control is obtained by the Group. They are de-
consolidated from the date that control ceases.
The Group uses the purchase method of accounting to account for the acquisition of subsidiaries by the Group. The cost of an
acquisition is measured as the fair value of the assets given, equity instruments issued and liabilities incurred or assumed at the date
of exchange, plus costs directly attributable to the acquisition. Identifi able assets acquired and liabilities and contingent liabilities
assumed in a business combination are measured initially at their fair values at the acquisition date, irrespective of the extent of any
minority interest. The excess of the cost of acquisition over the fair value of the Group’s share of the identifi able net assets acquired
is recorded as goodwill. If the cost of acquisition is less than the fair value of the net assets of the subsidiary acquired, the difference
is recognised directly in the income statement.
Intercompany transactions, balances and unrealised gains on transactions between Group companies are eliminated.
Investments in subsidiaries are accounted for at cost less allowance for impairment. The carrying amounts of these investments are
reviewed annually and written down for impairment where considered necessary.
Transactions and minority interests
The Group applies a policy of treating transactions with minority interests as transactions with parties external to the Group. Disposals
to minority interests result in gains and losses for the Group that are recorded in the income statement. Purchases from minority
interests result in goodwill, being the difference between any consideration paid and the relevant share acquired of the carrying value
of net assets of the subsidiary.
1.2 Cash and cash equivalents
Cash and cash equivalents comprise balances with less than three months’ maturity from the date of acquisition, including: cash
and balances with central banks, treasury bills and other eligible bills, loans and advances to banks, amounts due from other banks,
money market investments and short-term government securities. Cash and cash equivalents are stated at cost which approximates
fair value due to the short-term nature of these instruments.
Notes to the Annual Financial Statementsfor the year ended 29 February 2008

C a p i t e c B a n k H o l d i n g s L i m i t e d 6 3
1.3 Financial instruments
1.3.1 The Group categorises its fi nancial assets in the following categories:
The Group recognises fi nancial assets on the balance sheet only once it becomes a party to the contractual terms of the particular
fi nancial instrument.
Financial assets are derecognised when the rights to receive cash fl ows from the fi nancial assets have expired or where the Group
has transferred substantially all risks and rewards of ownership.
Management determines the categorisation of its investments at initial recognition and re-evaluates this categorisation at each
reporting date.
(a) Financial assets at fair value through profi t or loss
This category has two sub-classes: fi nancial assets held for trading, and those designated at fair value through profi t or loss at
inception. A fi nancial asset is categorised as held for trading if acquired principally for the purpose of selling in the short term or if so
designated by management. Derivatives are categorised as held for trading unless they are designated as hedges.
Purchases and sales of fi nancial assets at fair value through profi t or loss are recognised on trade date, being the date on which the
Group commits to purchase or sell the asset.
Gains and losses on fi nancial assets at fair value through profi t or loss are measured as the difference between the proceeds and
year end fair values and the carrying amounts adjusted for dividend income (1.16.4), and are included in the income statement.
(b) Loans and advances
Loans and advances are non-derivative fi nancial assets with fi xed or determinable payments that are not quoted in an active market,
other than: (a) those that the entity intends to sell immediately or in the short term, which are categorised as held for trading, and
those that the entity upon initial recognition designates as at fair value through profi t or loss; (b) those that the entity upon initial
recognition designates as available-for-sale; or (c) those for which the holder may not recover substantially all of its initial investment,
other than because of credit deterioration. They arise when the Group provides money, goods or services directly to a debtor with no
intention of trading the advance. Included within this category are Group loans receivable and other receivables.
Loans and advances are recognised when cash is advanced to the borrowers.
(c) Held-to-maturity investments
The Group currently has no held-to-maturity investments. Held-to-maturity investments are non-derivative fi nancial assets with fi xed
or determinable payments and fi xed maturities that the Group’s management has the positive intention and ability to hold to maturity.
Were the Group to sell other than an insignifi cant amount of held-to-maturity assets, the entire category would be tainted and re-
categorised as available-for-sale.
(d) Available-for-sale fi nancial assets
The Group currently has no available-for-sale fi nancial assets. Available-for-sale fi nancial assets are assets that management intend
to hold on a continuing basis, which may be sold in response to needs for liquidity or changes in interest rates, exchange rates or
equity prices.
Financial assets, other than those held at fair value through profi t or loss, are initially recognised at fair value plus transaction
costs.
Financial assets at fair value through profi t or loss, held-to-maturity investments and available-for-sale fi nancial assets are
subsequently carried at fair value. Loans and advances are carried at amortised cost using the effective interest rate method. Gains
and losses arising from changes in the fair value of fi nancial assets at fair value through profi t or loss are included in the income
statement in the period in which they arise.
The fair values of quoted fi nancial assets in active markets are based on current bid prices.
1.3.2 The Group categorises its fi nancial liabilities in the following categories:
The Group recognises a fi nancial liability once it becomes a party to the contractual terms of the fi nancial instrument. Financial
liabilities, other than those held at fair value through profi t or loss, are recognised initially at fair value, generally being their issue
proceeds net of transaction costs incurred.
C a p i t e c B a n k H o l d i n g s L i m i t e d6 4
A fi nancial liability, or part of a fi nancial liability, is derecognised once the obligation specifi ed in the contract relating to the fi nancial
liability is discharged, cancelled or has expired.
(a) Deposits held at amortised cost
Deposits held at amortised cost are recognised initially at fair value and are subsequently stated at amortised cost using the effective
interest method. Any differences between net proceeds and the redemption value are recognised in the income statement over the
period of the borrowing using the effective yield method.
(b) Deposits held at fair value through profi t or loss
These deposits are fair valued by discounting the value using an appropriate discount rate determined with reference to quoted rates
on market instruments with similar credit characteristics and maturities.
Financial liabilities are designated at fair value through profi t or loss, where required in order to eliminate or reduce measurement
or recognition inconsistencies that would otherwise arise from measuring liabilities on different bases; or if a group of fi nancial
liabilities is managed and its performance evaluated on a fair value basis, in accordance with a documented risk management or
investment strategy, and information about the Group is provided internally on that basis to the Management Committee and Board
of Directors.
Gains and losses arising from changes in the fair value of deposits held at fair value through profi t or loss are included in the income
statement in the period in which they arise.
(c) Other fi nancial liabilities
Included within this class of fi nancial liabilities are trade and other payables, provisions and Group loans payable that will be settled
in cash and cash equivalents. Trade and other payables and Group loans payable are recognised initially at fair value and are
subsequently stated at amortised cost using the effective interest rate method. Refer to Note 1.12 for the accounting policy applied
in measuring provisions.
1.3.3 Offsetting fi nancial instruments
Financial assets and liabilities are offset and the net amount reported in the balance sheet when there is a legally enforceable right
to set off the recognised amounts and there is an intention to settle on a net basis, or to realise the asset and settle the liability
simultaneously. Deferred loan income reduces the outstanding loans and advances balance on the basis that the revenue will be
received when the underlying loans are repaid.
1.3.4 Derivative fi nancial instruments
Derivative fi nancial instruments are restricted to forward foreign exchange contracts which are initially recognised in the balance
sheet at fair value (including transaction costs) and are subsequently re-measured at their fair value. Fair values are obtained from
quoted market prices. All contracts are carried as assets when fair value is positive and as liabilities when fair value is negative.
Derivatives are held only to cover economic exposure.
The best evidence of the fair value of a derivative at initial recognition is the transaction price (i.e. the fair value of the consideration
given or received) unless the fair value of that instrument is evidenced by comparison with other observable current market
transactions in the same instrument (i.e. without modifi cation or repackaging) or based on a valuation technique whose variables
include only data from observable markets.
1.3.5 Financial guarantee contracts
A fi nancial guarantee contract is a contract that requires the Group (issuer) to make specifi ed payments to reimburse the holder for
a loss it incurs because a specifi ed debtor fails to make payment when due in accordance with the original or modifi ed terms of a
debt instrument.
Financial guarantee liabilities are initially recognised at fair value and then amortised over the life of the fi nancial guarantee.
Subsequent to initial recognition, the fi nancial guarantee liability is measured at the higher of the present value of any expected
payment, when a payment under the guarantee has become probable, and the unamortised premium.

C a p i t e c B a n k H o l d i n g s L i m i t e d 6 5
1.4 Impairment of advances
The estimation of allowances for impairments is inherently uncertain and depends on many factors, including general economic
conditions, structural changes within industries, changes in individual customer circumstances and other external factors such as
legal requirements, regulatory specifi cations and governmental policy changes.
Loans and advances are stated net of identifi ed impairments and incurred but unidentifi ed impairments.
Loans and advances are considered impaired if, and only if, there is objective evidence of impairment as a result of events that
occurred after initial asset recognition (known as loss events) and these loss events have an adverse impact on the assets’ estimated
future cash fl ows that can be reliably measured.
Objective evidence that loans and advances may be impaired, includes the following observable data:
(a) A breach of contract, such as a default or delinquency in interest or principal payments. In this regard instalments not paid one
day past due date are considered in breach of contract.
(b) Historical loss experience of groups of fi nancial assets with similar repayment terms.
(c) Data indicating that there is a measurable decrease in the estimated future cash fl ows from a group of fi nancial assets since the
initial recognition of those assets, although the decrease cannot yet be identifi ed with the individual fi nancial assets in the Group
including:
• Adverse changes in the payment status of borrowers in the group; or
• National or local economic conditions that correlate with defaults on the assets in the group.
In determining whether a loss event has occurred, loans and advances are subjected to regular evaluations of the overall client risk
profi le and payments record.
The historical loss experience is adjusted on the basis of observable data to refl ect the effects of current conditions that did not affect
the period on which the historical loss experience is based and to remove the effects of conditions in the historical period that do not
currently exist.
On a collective basis, the Group assesses whether objective evidence of impairment exists for groups of fi nancial assets with similar
repayment terms. If there is objective evidence that an impairment loss on loans and advances has been incurred, the amount of
the loss is measured as the difference between the assets’ carrying amounts and the present value of estimated future cash fl ows
(excluding future credit losses that have not yet been incurred) discounted at the respective fi nancial assets’ original effective interest
rates (the recoverable amount).
1.4.1 Identifi ed impairment
Advances within the Group comprise a large number of small homogenous assets. Statistical techniques are used to calculate
impairment allowances collectively, based on historical default and recovery rates. These statistical analyses use as primary inputs
the extent to which accounts in the portfolio are in arrears and historical loss experience on the eventual losses encountered from
such delinquent portfolios.
These statistics feed discounted cash fl ow models which have been developed for each of the loan products offered by the Group.
The models are updated periodically in order to refl ect appropriate changes in inputs.
Models contain both judgemental and non-judgemental inputs. The extent of judgement utilised in models developed for new loan
products is greater than that for older products given the limited historical experience available for the new products.
In outline, the statistical analyses are performed on a portfolio basis as follows:
• Loans and advances are monitored on a product basis, with each month’s advances being treated as a discrete portfolio, on
which an analysis of the run-off of recoveries, in period buckets, is performed in order to develop a historical base for statistics on
probability of default (PD).
• These derived statistics, based on actual experience, are used in plotting values on a model curve that refl ects the risk profi le of
the portfolio.
• Loans in arrears by more than 90 days are handed over for collection and written off. Recoveries from these loans are regarded
as negligible as collateral is not required for the granting of advances in the current product range.
• Upon write off the accrual of interest income on the original term of the advance is discontinued.

C a p i t e c B a n k H o l d i n g s L i m i t e d6 6
1.4.2 Incurred but unidentifi ed impairment
In addition to the impairment estimated for assets with recognised objective evidence of impairment, an estimate is made for impairments
associated with those assets in the balance sheet that are impaired, but for which objective evidence is not yet available.
• The impairment calculation utilises the results of the statistical analyses referred to above to estimate the proportion of assets
in each portfolio that are likely to display objective evidence of impairment over the emergence period. The emergence period is
defi ned as the experience of the length of time that it takes for objective evidence to become apparent after the asset has become
impaired.
• In considering the occurrence of a loss event over the life of a loan, it is assumed that there is a constant risk of the loss event
occurring at any point in the life of the loan.
• For a portfolio of loans in a particular month most of the provision is recognised in the early stages of the contractual period as
the outstanding loan balances are larger.
The methodology and assumptions used for estimating future cash fl ows are reviewed regularly to reduce differences between loss
estimates and actual loss experience.
All impaired loans and advances are reviewed on a monthly basis and any changes to the amount and timing of the expected future
cash fl ows compared to previous estimates will result in a change to the charges for impairment of loans and advances in the income
statement.
1.4.3 Loan write-offs
Loans (and the related impairment allowance accounts) are normally written off in full for amounts in arrears for more than 90 days.
1.5 Inventory
Inventory is stated at the lower of the cost or net realisable value. Cost is determined using the fi rst-in, fi rst-out (FIFO) method. Net
realisable value is the estimate of the selling price in the ordinary course of business, less selling expenses. Inventory is carried net
of rebates. All inventories comprise fi nished goods.
1.6 Interest-free loans granted
Interest-free Group loans with no fi xed maturities are carried at cost net of impairment.
1.7 Current tax
Income tax payable on profi ts based on the applicable tax law in each jurisdiction, is recognised as an expense in the period in which
profi ts arise. Secondary tax on companies (STC) is calculated in terms of the applicable tax law and disclosed as part of the tax
expense on the income statement.
1.8 Deferred tax
Deferred income tax is provided in full, using the liability method, on temporary differences arising between the tax bases of assets
and liabilities and their carrying amounts for fi nancial reporting purposes. Deferred income tax is determined using tax laws and rates
that have been enacted or substantially enacted by the balance sheet date and are expected to apply when the related deferred
income tax asset is realised or the deferred income tax liability is settled.
The principal temporary differences arise from depreciation of property and equipment, revaluation of certain fi nancial assets and
liabilities and tax losses carried forward. Deferred tax assets are raised only to the extent that it is probable that future taxable income
will be available against which the unused tax losses can be utilised.
A deferred tax asset is raised on unutilised secondary tax on companies (STC) credits, to the extent that these will be used in future
years.
1.9 Property and equipment
Land and buildings comprises a warehouse. All property and equipment is stated at historical cost less depreciation. Historical cost
includes expenditure that is directly attributable to the acquisition of the items.

C a p i t e c B a n k H o l d i n g s L i m i t e d 6 7
Subsequent costs are included in the assets’ carrying amount or are recognised as a separate asset, as appropriate, only when it is
probable that future economic benefi ts associated with the item will fl ow to the Group and the cost of the item can be measured reliably.
All other repairs and maintenance costs are charged to the income statement during the fi nancial period in which they were incurred.
Land is not depreciated. Depreciation on other assets is calculated using the straight-line method to allocate their cost to their
residual values over their estimated useful lives, as follows:
• Banking application hardware 3 - 5 years
• Automated teller machines 8 years
• Computer equipment 3 - 5 years
• Offi ce equipment 5 - 8 years
• Motor vehicles 5 years
• Buildings 25 years
The assets’ residual values and useful lives are reviewed annually and adjusted, if appropriate.
Gains and losses on disposals are determined by comparing proceeds with carrying amounts. These are included in the income
statement.
1.10 Intangible assets
(a) Goodwill
Goodwill represents the excess of the cost of an acquisition over the fair value of the Group’s share of the net identifi able assets of
the acquired subsidiary at the date of acquisition. Goodwill on acquisitions of subsidiaries is included in ‘intangible assets’. Goodwill
is tested annually for impairment and carried at cost less accumulated impairment losses. Gains and losses on the disposal of an
entity include the carrying amount of goodwill relating to the entity sold. Goodwill is allocated to cash-generating units for the purpose
of impairment testing.
(b) Computer software
Acquired computer software licences are capitalised on the basis of the costs incurred to acquire and bring to use the specifi c
software. Computer software is carried at cost less accumulated amortisation and impairment losses.
Costs associated with developing or maintaining computer software programmes are recognised as an expense as incurred. Costs
that are directly associated with the production of identifi able and unique software products controlled by the Group, and that will
probably generate economic benefi ts exceeding costs beyond one year, are recognised as intangible assets. Direct costs include
software development employee costs and an appropriate portion of relevant overheads.
Amortisation on computer software is calculated using the straight-line method to allocate their cost to their residual values over their
estimated useful lives, as follows:
• Banking application software 6 years
• Server software 3 - 5 years
• Desktop application software 2 - 4 years
The assets’ useful lives are reviewed annually and adjusted where appropriate.
1.11 Impairment of non-fi nancial assets (property and equipment, computer software)
Equipment and other non-fi nancial assets are reviewed for impairment losses whenever events or changes in circumstances indicate
that the carrying amount may not be recoverable. An impairment loss is recognised for the amount by which the carrying amount of
the asset exceeds its recoverable amount, which is the higher of an asset’s net selling price and value in use. For the purpose of
assessing impairment, assets are grouped at the lowest levels for which there are separately identifi able cash fl ows (cash-generating
units). Non-fi nancial assets other than goodwill that suffered impairment are reviewed for possible reversal of the impairment at each
reporting date.
1.12 Provisions
Provisions for expenses are obligations of the Group for which there is uncertainty as to the timing or amount of the outfl ow of
economic resources. Provisions are recognised when:
• The Group has a present legal or constructive obligation as a result of past events;

C a p i t e c B a n k H o l d i n g s L i m i t e d6 8
• It is probable that an outfl ow of resources embodying economic benefi ts will be required to settle the obligation; and
• A reliable estimate of the amount of the obligation can be made.
Where there are a number of similar obligations, the likelihood that an outfl ow will be required in settlement is determined by
considering the class of obligations as a whole. A provision is recognised even if the likelihood of an outfl ow with respect to any one
item included in the same class of obligations may be small.
Provisions are measured at the present value of the expenditures expected to be required to settle the obligation using a pre-tax
rate that refl ects current market assessments of the time value of money and the risks specifi c to the obligation. The increase in the
provision due to passage of time is recognised as interest expense.
1.13 Share capital
(a) Categories of share capital
Authorised Share Capital consists of
• 100 000 000 ordinary shares (par value R0,01) and
• 100 000 000 non-redeemable, non-cumulative, non-participating preference shares (par value R0.01).
(b) Share issue costs
Incremental costs directly attributable to the issue of new shares or options or to the acquisition of a business are shown in equity
as a deduction, net of tax, from the proceeds.
(c) Dividends declared
Dividends on ordinary shares and preference shares are recognised in equity in the period in which they have been approved by the
Group’s directors. Dividends for the year that are declared after the balance sheet date are dealt with in the directors’ report.
(d) Treasury shares
Where the Company or other members of the Group purchase the Company’s equity share capital, the consideration paid is deducted
from total shareholders’ equity as shares held by the Group until they are cancelled or sold.
(e) Unissued shares
An amount of 10% of the issued ordinary share capital and all unissued non-redeemable, non-cumulative, non-participating
preference shares are under the control of the directors until the next annual general meeting.
1.14 Employee benefi ts
(a) Pension obligations
The Group contributes to a provident fund classifi ed as a defi ned contribution fund.
For defi ned contribution plans, the Group pays fi xed contributions to privately administered provident fund plans on a contractual
basis. The Group has no further payment obligations once the contributions have been paid. The contributions are recognised as
employee benefi t expenses when they are due. Prepaid contributions are recognised as an asset to the extent that a cash refund or
a reduction in the future payments is available.
(b) Share-based compensation
The Group operates an equity-settled, share-based compensation plan. The fair value of the employee services received in exchange
for the grant of the options is recognised as an expense. The total amount to be expensed over the vesting period is determined
by reference to the fair value of the options on grant date, excluding the impact of any non-market vesting conditions (for example,
profi tability and sales growth targets). Non-market vesting conditions are included in assumptions about the number of options that
are expected to become exercisable. At each balance sheet date, the entity revises its estimates of the number of options that are
expected to vest. It recognises the impact of the revision of original estimates, if any, in the income statement, and a corresponding
adjustment to equity over the remaining vesting period.
The Group’s employee empowerment trust operates a cash-settled, share-based compensation plan. The fair value of the liability
incurred for employee services received is recognised as an expense over the vesting period. Until the liability is settled, the Group
remeasures the fair value of the liability at each reporting date and at the date of settlement, with any changes in value recognised
in profi t or loss for the period.
C a p i t e c B a n k H o l d i n g s L i m i t e d 6 9
1.15 Foreign currency translation
(a) Functional and presentation currency
Items included in the fi nancial statements of each of the Group’s entities are measured using the currency of the primary economic
environment in which the entity operates (“the functional currency”). The consolidated fi nancial statements are presented in South
African Rands (“Rand”), which is the Group’s functional and presentation currency. The fi nancial statements of all the subsidiaries
are also presented in Rand.
(b) Transactions and balances
Foreign currency transactions are translated into the functional currency using the exchange rates prevailing at the dates of the
transactions. Foreign exchange gains and losses resulting from the settlement of such transactions and from the translation at year
end exchange rates of monetary assets and liabilities denominated in foreign currencies are recognised in the income statement.
Translation differences on non-monetary items are reported as part of the fair value gain or loss.
1.16 Revenue recognition
1.16.1 Interest income and expense
Interest income and expense are recognised in the income statement for all instruments measured at amortised cost and at fair value
through profi t and loss using the effective interest rate method.
The effective interest rate method is a method of calculating the amortised cost of a fi nancial asset or a fi nancial liability and of
allocating the interest income or interest expense over the relevant period. The effective interest rate is the rate that exactly discounts
estimated future cash payments or receipts through the expected life of the fi nancial instrument or, when appropriate, a shorter
period to the net carrying amount of the fi nancial asset or fi nancial liability. When calculating the effective interest rate, the Group
estimates cash fl ows considering all contractual terms of the fi nancial instrument (for example, prepayment options) but does not
consider future credit losses. The calculation includes all fees and points paid or received between parties to the contract that are
an integral part of the effective interest rate.
Once a fi nancial asset or a group of similar fi nancial assets has been written down as a result of an impairment loss, interest income
is recognised using the rate of interest used to discount the future cash fl ows for the purpose of measuring the impairment loss.
1.16.2 Fee income
Transaction fees are recognised on an accrual basis in the period in which the services are rendered. The portion of loan origination
fees that relates to the creation of a fi nancial asset is amortised over the term of the loan. Transaction and service related loan fee
income is recognised when the services are provided.
1.16.3 Non-banking sales
Non-banking sales represent the net sales value of all products sold to third parties after the deduction of trade discounts. Revenue is
recognised when risks and rewards of ownership have been transferred to the customer. Revenue is recognised net of value added tax.
1.16.4 Dividend income
Dividend income is recognised in the income statement when the entity’s right to receive payment is established. Dividends on listed
preference shares accrue on a day to day basis based on the terms of underlying instruments.
1.17 Segment reporting
A business segment is a group of assets and operations engaged in providing products or services that are subject to risks and
returns that are different from those of other business segments. A geographical segment is engaged in providing products or
services within a particular economic environment that is subject to risks and returns different from those of segments operating in
other economic environments.
1.18 Leases
(a) Where a Group company is the lessee
Leases where a signifi cant portion of the risks and rewards of ownership are retained by the lessor are classifi ed as operating leases.
Payments made under operating leases, net of any incentives received from the lessor, are charged to the income statement on a
straight-line basis over the period of the lease.
When an operating lease is terminated before the lease period has expired, any penalty payment to the lessor is recognised as an
expense in the period in which termination takes place.
(b) Where a Group company is the lessor
Rental from the sub-letting of leased premises is recognised on a straight-line basis over the lease term.

C a p i t e c B a n k H o l d i n g s L i m i t e d7 0
1.19 Standards, interpretations and amendments to published standards applied for the fi rst time during the current
fi nancial year
• Amendments to IAS1 Presentation of Financial Statements – Capital Disclosures (effective from January 2007)
• IFRS 7 Financial Instruments (Disclosures) (effective from January 2007)
• IFRIC 9 Reassessment of embedded derivatives (effective from 1 June 2006)
• IFRIC 10 Interim Financial Reporting and impairment (effective from 1 November 2006)
The implications of these statements have no impact on measurements of assets and liabilities at previous year end. Comparitives
are provided for new disclosures.
• IFRIC8, AC503 and IFRIC11 are compulsory for the current year but were adopted early in the previous year (2007).
1.20 Standards, interpretations and amendments to published standards that are not yet effective
Certain new standards, amendments and interpretations to existing standards have been published that are mandatory for the Group’s
accounting periods beginning on or after 1 March 2008 or later periods but which the Group has not early adopted, as follows:
• IFRS 8 Operating Segments (effective from January 2009)
• IAS 23 Borrowing Costs – Revised (effective from January 2009)
• IAS 1 Presentation of fi nancial statements (effective from January 2009)
• IFRIC 12 Service Concession Arrangements (effective from January 2008)
• IFRIC 13 Customer Loyalty Programmes (effective from July 2008)
• IFRIC 14 IAS 19 – The Limit on a Defi ned Benefi t Asset, Minimum Funding Requirements and their Interaction
(effective from January 2008)
• IFRS 3 Business Combinations Revised (effective July 2009)
• IAS 27 Consolidated and Separate Financial Statements Revised (effective July 2009)
• Amendment to IAS 32 Financial Instruments: presentation regarding puttable instruments (effective July 2009)
Management is in the process of assessing the impact of these amendments and standards on the reported results of the Group
and the company.
2. CRITICAL ACCOUNTING ESTIMATES AND JUDGEMENTS IN APPLYING
ACCOUNTING POLICIES
In conformity with IFRS, the preparation of fi nancial statements for the Group requires management to make estimates and
assumptions that affect the reported amounts of assets, liabilities, revenues and expenses, and the disclosure of contingent assets
and liabilities in the fi nancial statements and accompanying notes. Although these estimates are based on management’s knowledge
of current events and actions that may be undertaken in the future, actual results may ultimately differ from estimates.
The estimates and assumptions that have a signifi cant risk of causing material adjustment to the carrying amounts of assets and
liabilities within the next fi nancial year are discussed below.
Impairment losses on loans and advances
The Group reviews its loan portfolios to assess impairment at least on a monthly basis. In determining whether an impairment loss
should be recorded in the income statement, the Group makes judgements as to whether there is any observable data indicating
that there is a measurable decrease in the estimated future cash fl ows from a portfolio of loans before the decrease can be identifi ed
with an individual loan in that portfolio. This evidence may include observable data indicating that there has been an adverse change
in the payment status of borrowers in a group, or national or local economic conditions that correlate with defaults on assets in the
group. Management uses estimates based on historical loss experience for assets with credit risk characteristics and objective
evidence of impairment similar to those in the portfolio when estimating its future cash fl ows. The methodology and assumptions
used for estimating both the amount and timing of future cash fl ows are reviewed regularly to reduce any differences between loss
estimates and actual loss experience. To the extent that the expected default rates increase or decrease by 5%, the impairment
allowance would be estimated R12 687 000 (2007: R7 055 000) higher or R12 706 000 (2007: R6 939 000) lower.
Property and equipment
Property and equipment are depreciated over their useful lives, taking into account their residual values at the end of their useful
lives. The residual values and useful lives are based on industry knowledge and past experience with similar assets. Refer to Note
1.9 for the accounting policy regarding property and equipment.
Management expense provisions
At year-end, the Group is exposed to various liabilities of uncertain timing or amount. Such liabilities are provided for if a present
obligation has arisen, payment is probable and the amount can be estimated reliably. Management uses its discretion to estimate
the expenditure required to settle the present obligation at the balance sheet date, i.e. the amount the Group would rationally pay to
settle the obligation or transfer it to a third party.

C a p i t e c B a n k H o l d i n g s L i m i t e d 7 1
2008
Notes to the Annual Financial Statementsfor the year ended 29 February 2008
3. SEGMENTAL REPORTING
Primary reporting format – business segments
During the year the group conducted operations in two main business areas - banking and wholesale distribution of consumer goods.
The banking segment incorporates retail banking services including savings, deposits, debit cards and consumer loans.
Wholesale distibution incorporates the wholesale distribution of fast moving consumer goods.
Transactions between the business segments are on normal commercial terms and conditions.
Adjustment for
Wholesale intra-segment
Banking distribution items Total
Year ended 29 February 2008 R’000 R’000 R’000 R’000
Revenues 1 499 115 159 122 (707) 1 657 530
Segment earnings before tax 322 660 1 686 - 324 346
Segment earnings after tax 227 379 1 686 - 229 065
Segment headline earnings attributable to ordinary shareholders 210 513 1 686 - 212 199
Segment assets 2 918 800 22 844 (5 272) 2 936 372
Segment liabilities 1 699 129 25 088 (5 272) 1 718 945
Capital expenditure 116 569 386 - 116 955
Depreciation 59 163 124 - 59 287
Amortisation 21 032 - - 21 032
Year ended 28 February 2007
Revenues 1 140 519 134 888 (833) 1 274 574
Segment earnings before tax 242 918 259 - 243 177
Segment earnings after tax 166 665 259 - 166 924
Segment headline earnings attributable to ordinary shareholders 160 133 259 - 160 392
Segment assets 2 182 304 16 934 (7 596) 2 191 642
Segment liabilities 1 064 195 17 586 (7 596) 1 074 185
Capital expenditure 85 856 101 - 85 957
Depreciation 47 712 86 - 47 798
Amortisation 19 883 - - 19 883
Secondary reporting format
No secondary geographical segment information is disclosed as all the company’s business for the years ended 29 February 2008 and
28 February 2007 was conducted within the Republic of South Africa.
2007

C a p i t e c B a n k H o l d i n g s L i m i t e d7 2
R’000 R’000 R’000 R’000
2008 2007 2008 2007
Group Company
4. CASH AND CASH EQUIVALENTS
Cash on hand 263 607 213 079 - -
Bank balances 215 045 658 073 - -
Money market placements - 45 574 - -
Central Bank balances:
Debentures 35 440 80 203 - -
Treasury bills 69 309 29 973 - -
Mandatory reserve deposits with Central Bank 34 500 16 844 - -
617 901 1 043 746 - -
Maximum exposure to credit risk 617 901 1 043 746 - -
Mandatory reserve deposits are not available for use in the
Group’s day-to-day operations. Cash on hand and mandatory
reserve deposits are non-interest bearing.
Debentures are short-term fi xed interest securities issued by the
South African Reserve Bank.
5. INVESTMENTS AT FAIR VALUE THROUGH
PROFIT OR LOSS
Listed preference shares
Balance at the beginning of the year 96 958 7 149 - -
Amortised cost 99 925 6 688 - -
Cumulative fair value adjustment - other market risk (2 967) 461 - -
Additions at cost 166 124 93 237 - -
Disposals at cost (266 049) - - -
Fair value adjustment 2 967 (3 428) - -
Interest rate risk - - - -
Credit risk - - - -
Other market risk (8 369) (3 596) - -
Realised on disposals 11 336 168 - -
Balance at the end of the year - 96 958 - -
Amortised cost - 99 925 - -
Cumulative fair value adjustment - other market risk - (2 967) - -
Unlisted investments at fair value
Balance at the beginning of the year - - - -
Amortised cost - - - -
Cumulative fair value adjustment - other market risk - - - -
Additions at cost 3 100 - - -
Fair value adjustment 11 324 - - -
Interest rate risk - - - -
Credit risk - - - -
Exchange rate risk 1 860 - - -
Other market risk 12 362 - - -
Realised on disposals (2 898) - - -
Notes to the Annual Financial Statementsfor the year ended 29 February 2008

C a p i t e c B a n k H o l d i n g s L i m i t e d 7 3
Notes to the Annual Financial Statementsfor the year ended 29 February 2008
R’000 R’000 R’000 R’000
2008 2007 2008 2007
Group Company
Balance at the end of the year 14 424 - - -
Amortised cost 3 100 - - -
Cumulative fair value adjustment - other market risk 11 324 - - -
Unlisted promissory notes
Balance at the beginning of the year 14 975 - - -
Amortised cost 14 975 - - -
Cumulative fair value adjustment - - - -
Additions at cost - 14 975 - -
Disposals at cost (14 975) - - -
Fair value adjustment - - - -
Interest rate risk - - - -
Credit risk - - - -
Balance at the end of the year - 14 975 - -
Amortised cost - 14 975 - -
Cumulative fair value adjustment - - - -
Total at fair value 14 424 111 933 - -
For fi nancial assets designated at fair value:
Maximum exposure to credit risk - 111 933 - -
Amount by which credit mitigation or derivatives offset credit risk - - - -
Credit risk exposure after taking into account credit mitigation
or derivative - 111 933 - -
The cumulative change in fair value arising from changes in
credit risk - - - -
The cumulative change in fair value arising from changes in
credit risk associated with mitigating instrument - - - -
The methods and assumptions applied to calculate the fair value changes due to exchange rate risk and market risk are set out in
Notes 30.4 and 30.8.
Fair value adjustments are not attributable to changes in credit risk during the year and cumulatively.
The directors’ valuation of investments at fair value through profi t or loss is equal to the book value.
The fi nancial assets and their peformances are managed and evaluated on a fair value basis in accordance with a documented risk
management strategy. Information about the Group is provided internally on that basis to the Management Committee and Board of
Directors.
5. INVESTMENTS AT FAIR VALUE THROUGH
PROFIT OR LOSS continued
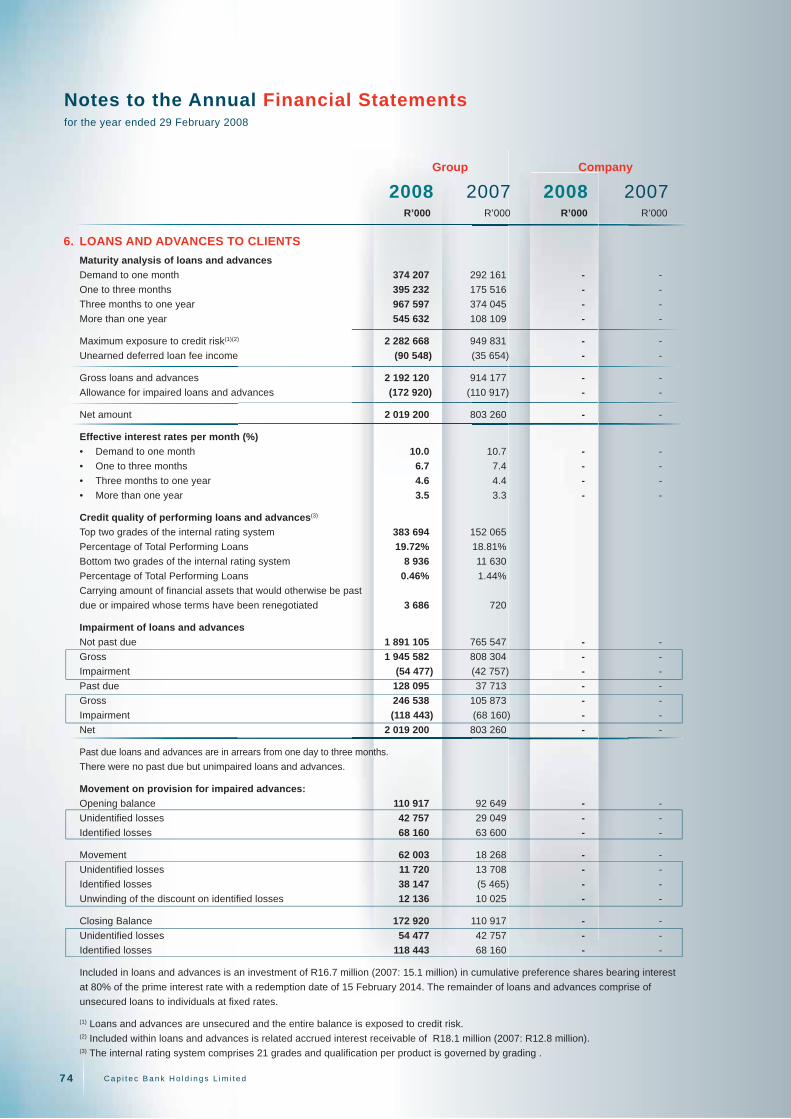
C a p i t e c B a n k H o l d i n g s L i m i t e d7 4
R’000 R’000 R’000 R’000
2008 2007 2008 2007
Group Company
6. LOANS AND ADVANCES TO CLIENTS
Maturity analysis of loans and advances
Demand to one month 374 207 292 161 - -
One to three months 395 232 175 516 - -
Three months to one year 967 597 374 045 - -
More than one year 545 632 108 109 - -
Maximum exposure to credit risk(1)(2) 2 282 668 949 831 - -
Unearned deferred loan fee income (90 548) (35 654) - -
Gross loans and advances 2 192 120 914 177 - -
Allowance for impaired loans and advances (172 920) (110 917) - -
Net amount 2 019 200 803 260 - -
Effective interest rates per month (%)
• Demand to one month 10.0 10.7 - -
• One to three months 6.7 7.4 - -
• Three months to one year 4.6 4.4 - -
• More than one year 3.5 3.3 - -
Credit quality of performing loans and advances(3)
Top two grades of the internal rating system 383 694 152 065
Percentage of Total Performing Loans 19.72% 18.81%
Bottom two grades of the internal rating system 8 936 11 630
Percentage of Total Performing Loans 0.46% 1.44%
Carrying amount of fi nancial assets that would otherwise be past
due or impaired whose terms have been renegotiated 3 686 720
Impairment of loans and advances
Not past due 1 891 105 765 547 - -
Gross 1 945 582 808 304 - -
Impairment (54 477) (42 757) - -
Past due 128 095 37 713 - -
Gross 246 538 105 873 - -
Impairment (118 443) (68 160) - -
Net 2 019 200 803 260 - -
Past due loans and advances are in arrears from one day to three months.
There were no past due but unimpaired loans and advances.
Movement on provision for impaired advances:
Opening balance 110 917 92 649 - -
Unidentifi ed losses 42 757 29 049 - -
Identifi ed losses 68 160 63 600 - -
Movement 62 003 18 268 - -
Unidentifi ed losses 11 720 13 708 - -
Identifi ed losses 38 147 (5 465) - -
Unwinding of the discount on identifi ed losses 12 136 10 025 - -
Closing Balance 172 920 110 917 - -
Unidentifi ed losses 54 477 42 757 - -
Identifi ed losses 118 443 68 160 - -
Included in loans and advances is an investment of R16.7 million (2007: 15.1 million) in cumulative preference shares bearing interest
at 80% of the prime interest rate with a redemption date of 15 February 2014. The remainder of loans and advances comprise of
unsecured loans to individuals at fi xed rates.
(1) Loans and advances are unsecured and the entire balance is exposed to credit risk.
(2) Included within loans and advances is related accrued interest receivable of R18.1 million (2007: R12.8 million).
(3) The internal rating system comprises 21 grades and qualifi cation per product is governed by grading .
Notes to the Annual Financial Statementsfor the year ended 29 February 2008

C a p i t e c B a n k H o l d i n g s L i m i t e d 7 5
Notes to the Annual Financial Statementsfor the year ended 29 February 2008
R’000 R’000 R’000 R’000
2008 2007 2008 2007
Group Company
7. INVENTORY
Finished consumer goods 17 741 10 928 - -
The cost of obsolete inventories recognised as expense
and included in cost of sales amounted to R0.3 million
and (2007: R0.3 million)
8. OTHER RECEIVABLES
Rental deposits 1 811 1 729 - -
Accrued income 8 213 780 - -
Derivative (Note 43) 290 - - -
Financial instruments 10 314 2 509 - -
Prepayments 9 033 7 176 - -
19 347 9 685 - -
Current 17 306 7 956 - -
Non-current 2 041 1 729 - -
9. GROUP LOANS RECEIVABLE
Loans to subsidiaries - - 8 843 7 637
Current - - 8 843 7 637
Non-current - - - -
Loans to subsidiaries are interest-free and have no fi xed
repayment terms.
10. INVESTMENT IN SUBSIDIARIES
Unlisted
Subsidiaries at cost - - 821 127 821 127
The directors’ valuation of the investment in subsidiaries is at least equal to the book value.
The following information relates to the company’s interest in subsidiaries:
Name Domicile Holding % Nature of business
Capitec Bank Limited South Africa 100% Banking
Keynes Rational Corporate Services (Pty) Limited South Africa 100% Dormant
Smartfi n Financial Services (Pty) Limited South Africa 100% Dormant
Finaid Financial Services (Pty) Limited South Africa 100% Dormant
Keymatrix (Pty) Limited South Africa 100% Dormant
Key Distributors (Pty) Limited South Africa 75% Wholesale distribution
Capitec Bank Holdings Share Trust South Africa - Share incentive trust
Capitec Bank Group Employee Empowerment Trust South Africa - Employee Empowerment Trust
The holding company’s interest in the aggregate income earned and losses incurred after tax by the subsidiaries amounted to
R205.5 million (2007: R117.8 million) and R0.2 million (2007: R0.5 million) respectively. All holdings are in the ordinary share capital
of the subsidiary concerned. Holdings are unchanged from 2007.
In terms of the shareholders agreement the holding company absorbed all losses incurred by Key Distributors including the minority’s
share of these losses. Prior losses must be made good before the minorities can participate in their share of the profi ts.
At year-end, Key Distributors had an accumulated loss of R7.6 million (2007: R9.3 million) and therefore the minorities will not yet
share in any profi ts.
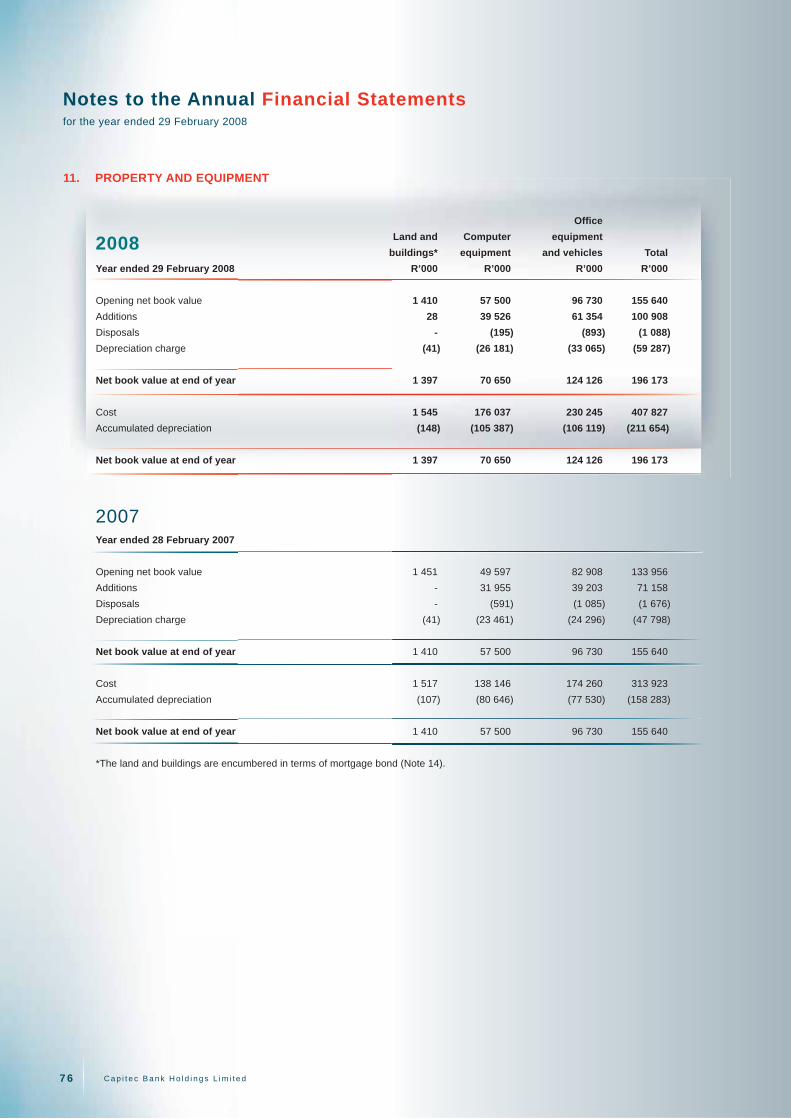
C a p i t e c B a n k H o l d i n g s L i m i t e d7 6
2008 Offi ce
Land and Computer equipment
buildings* equipment and vehicles Total
Year ended 29 February 2008 R’000 R’000 R’000 R’000
Opening net book value 1 410 57 500 96 730 155 640
Additions 28 39 526 61 354 100 908
Disposals - (195) (893) (1 088)
Depreciation charge (41) (26 181) (33 065) (59 287)
Net book value at end of year 1 397 70 650 124 126 196 173
Cost 1 545 176 037 230 245 407 827
Accumulated depreciation (148) (105 387) (106 119) (211 654)
Net book value at end of year 1 397 70 650 124 126 196 173
Year ended 28 February 2007
Opening net book value 1 451 49 597 82 908 133 956
Additions - 31 955 39 203 71 158
Disposals - (591) (1 085) (1 676)
Depreciation charge (41) (23 461) (24 296) (47 798)
Net book value at end of year 1 410 57 500 96 730 155 640
Cost 1 517 138 146 174 260 313 923
Accumulated depreciation (107) (80 646) (77 530) (158 283)
Net book value at end of year 1 410 57 500 96 730 155 640
* The land and buildings are encumbered in terms of mortgage bond (Note 14).
2007
11. PROPERTY AND EQUIPMENT
Notes to the Annual Financial Statementsfor the year ended 29 February 2008

C a p i t e c B a n k H o l d i n g s L i m i t e d 7 7
Notes to the Annual Financial Statementsfor the year ended 29 February 2008
R’000 R’000 R’000 R’000
2008 2007 2008 2007
Group Company
12. INTANGIBLE ASSETS
Software
Opening net book value 42 604 47 688 - -
Additions 16 047 14 799 - -
Amortisation charge (21 032) (19 883) - -
Net book value at end of year 37 619 42 604 - -
Cost 129 252 113 205 - -
Accumulated amortisation (91 633) (70 601) - -
Net book value at end of year 37 619 42 604 - -
Computer software substantially consists of the primary
banking application system.
13 DEFERRED INCOME TAX ASSETS
Deferred income taxes are calculated on all temporary
differences under the liability method using an effective
tax rate of 28% (2007: 29%).
The movement on the deferred income tax account is as follows:
At beginning of year 13 846 6 648 - -
Movement in deferred tax taken to income statement 121 7 198 - -
Utilisation of assessable losses - (75) - -
Movements due to other temporary differences 754 7 734 - -
STC credits received (134) (82) - -
Prior year adjustments - (379) - -
Rate change (499) - - -
At end of year 13 967 13 846 - -
Deferred tax asset may be analysed as follows:
Provisions and accruals 15 507 14 929 - -
Capital allowances 572 625 - -
Prepayments (2 112) (1 842) - -
STC credits - 134 - -
13 967 13 846 - -
Current 4 292 5 885 - -
Non-current 9 675 7 961 - -

C a p i t e c B a n k H o l d i n g s L i m i t e d7 8
R’000 R’000 R’000 R’000
2008 2007 2008 2007
Group Company
14. DEPOSITS AT AMORTISED COST
Deposits by maturity 1 475 696 842 172 - -
Within one month 942 758 579 594 - -
One to three months 185 521 477 - -
Three months to one year 186 443 6 724 - -
More than one year 160 974 255 377 - -
Deposits by nature 1 475 696 842 172 - -
Retail 842 226 554 233 - -
Wholesale 529 336 272 933 - -
Negotiable instruments 50 815 - - -
Reserve Bank settlement balance 53 319 15 006 - -
Effective interest rates per month (%)
Demand to one month 9.0 8.3
One to three months 11.7 11.8
Three months to one year 11.2 14.1
More than one year 10.6 10.7
Wholesale deposits include a mortgage bond of R1.0 million
(2007: R1.1 million) that is secured as stated in Note 11.
The remainder of the deposits are unsecured.
15. DEPOSITS AT FAIR VALUE THROUGH PROFIT OR LOSS
Deposits by maturity:
Within one month - - - -
One to three months 4 940 2 149 - -
Three months to one year 30 556 - - -
More than one year 16 667 50 000 - -
52 163 52 149 - -
Fair value adjustment attributable to changes in:
Credit risk - -
Interest rate risk 262 2 233 - -
52 425 54 382 - -
Amount payable on maturity 56 565 64 173 - -
Difference between amounts payable on maturity and the
fair value of the liabilities relating to future fi nance cost. 4 140 9 791 - -
The fi nancial liabilities and their performances are managed and evaluated on a fair value basis, in accordance with a documented risk
management strategy. Information about the Group is provided internally on that basis to the Management Committee and Board of
Directors.
The contractual interest rate on the funding is 13.075% (2007: 13.075%) fi xed, and the fair value thereof at 29 February 2008 was
determined after applying a discount rate of 12.295% (2007: 10.320%). Please refer to Note 30.5 for a description of valuation
methods applied to calculate fair value.
The credit risk premium remained constant as the impact of the Moody’s ratings upgrade for Capitec Bank from Baa1.za to A2.za in
May 2007 was offset by higher credit premium expectations in the market surrounding the sub-prime crisis (2007 - constant).
These deposits are all unsecured and comprise wholesale deposits.
Notes to the Annual Financial Statementsfor the year ended 29 February 2008

C a p i t e c B a n k H o l d i n g s L i m i t e d 7 9
Notes to the Annual Financial Statementsfor the year ended 29 February 2008
R’000 R’000 R’000 R’000
2008 2007 2008 2007
Group Company
16. TRADE AND OTHER PAYABLES
Trade payables 49 983 36 835 20 86
Preference share dividends payable 8 889 7 617 8 889 7 617
Accruals 84 496 50 194 - -
Derivative - 2 - -
143 368 94 648 8 909 7 703
Current 128 733 85 815 8 909 7 703
Non-current 14 635 8 833 - -
17. PROVISIONS
Provision for bonuses
Opening balance (2007 - pending litigation) 3 850 300 - -
Addition - 3 850 - -
Release (2007 - pending litigation) (3 850) (300) - -
Closing balance (2007 - bonuses) - 3 850 - -
Current - 3 850 - -
Non-current - - - -
18. GROUP LOANS PAYABLE
Loans from subsidiaries - - 4 247 4 247
Current - - 4 247 4 247
Non-current - - - -
Loans from subsidiaries are interest-free and have no fi xed repayment terms.

C a p i t e c B a n k H o l d i n g s L i m i t e d8 0
R’000 R’000 R’000 R’000
2008 2007 2008 2007
Group Company
19. SHARE CAPITAL AND PREMIUM
Authorised
Ordinary shares (2)
100 000 000 shares of R0.01 each 1 000 1 000 1 000 1 000
Non-redeemable, non-cumulative, non-participating
preference shares(1)
100 000 000 shares of R0.01 each 1 000 1 000 1 000 1 000
2 000 2 000 2 000 2 000
Issued
Ordinary share capital and premium 647 363 647 363 647 363 647 363
81 928 412 (2007: 81 928 412) shares of R0.01 each at par 819 819 819 819
Share premium 646 544 646 544 646 544 646 544
Non-redeemable, non-cumulative, non-participating
preference share capital and premium(1) 154 606 154 606 154 606 154 606
1 684 211 shares of R0.01 each (2007: 1 684 211) at par 17 17 17 17
Share premium 154 589 154 589 154 589 154 589
Total issued share capital and premium 801 969 801 969 801 969 801 969
(1) The preference shares carry a coupon rate of 75% of the prime overdraft rate based on a face value of R100 per share.
(2) 8 192 841 (2007: 7 192 841 ) of the unissued shares are under the control of the directors until the next annual general meeting.
The share incentive trust purchased shares in the Group for the purpose of settling share options issued to employees in terms of
the Group share incentive scheme. There were no treasury shares on hand at year-end (2007: Nil).
The shares are refl ected as a deduction against equity at cost to the group. During the year an expense of R67 million (R48 million
after tax) (2007: R22 million, R16 million after tax) was realised on the settlement of share options as refl ected in the statement of
changes in shareholders’ equity.
Notes to the Annual Financial Statementsfor the year ended 29 February 2008

C a p i t e c B a n k H o l d i n g s L i m i t e d 8 1
Notes to the Annual Financial Statementsfor the year ended 29 February 2008
R’000 R’000 R’000 R’000
2008 2007 2008 2007
Group Company
20 RESERVES
General banking risk reserve
At beginning of year 2 439 710 - -
Transfer to retained earnings (2 439) - - -
Transfer from retained earnings - 1 729 - -
At end of year - 2 439 - -
This reserve was required in terms of Basel I and is not
required in terms of Basel II, implemented in South Africa
from 1 January 2008.
Banking regulations required the Group to make an
appropriation to a general banking reserve in instances
where the allowances for impairment required for regulatory
purposes exceeded the amount that may be provided in
terms of IFRS. These reserves could only be distributed
to the extent that the differences between regulatory and
accounting impairment allowances were extinguished.
21. NET INTEREST INCOME
Interest income
Loans and advances to customers 709 166 924 370 - -
Marketable securities 3 659 4 417 - -
Cash and cash equivalents* 27 238 38 741 - -
740 063 967 528 - -
Interest expense
Demand deposits (56 640) (35 076) - -
Term deposits (43 949) (34 735) - -
Negotiable deposits (815) - - -
Forward foreign exchange contracts (45) (25) - -
(101 449) (69 836) - -
Net interest income 638 614 897 692 - -
*Interest on cash and cash equivalents comprises
Money market placements 4 314 27 502 - -
Bank balances 16 623 7 450 - -
Central bank balances 6 301 3 789 - -
27 238 38 741 - -
Included within interest income is R11.6 million (2007: R7.0 million) with respect of interest income accrued on impaired fi nancial
assets.

C a p i t e c B a n k H o l d i n g s L i m i t e d8 2
R’000 R’000 R’000 R’000
2008 2007 2008 2007
Group Company
22. DIVIDEND INCOME
Subsidiaries - - 86 650 54 450
Ordinary dividends - - 69 639 46 833
Preference dividends - - 17 011 7 617
Instruments of fair value through profi t and loss 15 392 1 469 - -
15 392 1 469 86 650 54 450
23. NET IMPAIRMENT CHARGE ON LOANS
AND ADVANCES
Bad debts 203 391 165 434 - -
Movement in impairment allowance 62 003 18 268 - -
Bad debts recovered (34 515) (22 431) - -
Net impairment charge 230 879 161 271 - -
24. NET MOVEMENT IN FINANCIAL
INSTRUMENTS HELD AT FAIR VALUE
THROUGH PROFIT OR LOSS
Financial assets held at fair value through profi t or loss 5 847 (3 577) - -
Change in fair value due to changes in credit risk - - - -
Change in fair value due to other factors 5 847 (3 577) - -
Financial liabilities held at fair value through profi t or loss 1 971 2 720 - -
Change in fair value due to changes in credit risk - - - -
Change in fair value due to other factors 1 971 2 720 - -
7 818 (857) - -
The methods and assumptions applied to calculate the fair value changes due to credit risk are set out in Note 30.8 and credit risk
mitigation techniques are set out in Note 30.1.
Notes to the Annual Financial Statementsfor the year ended 29 February 2008
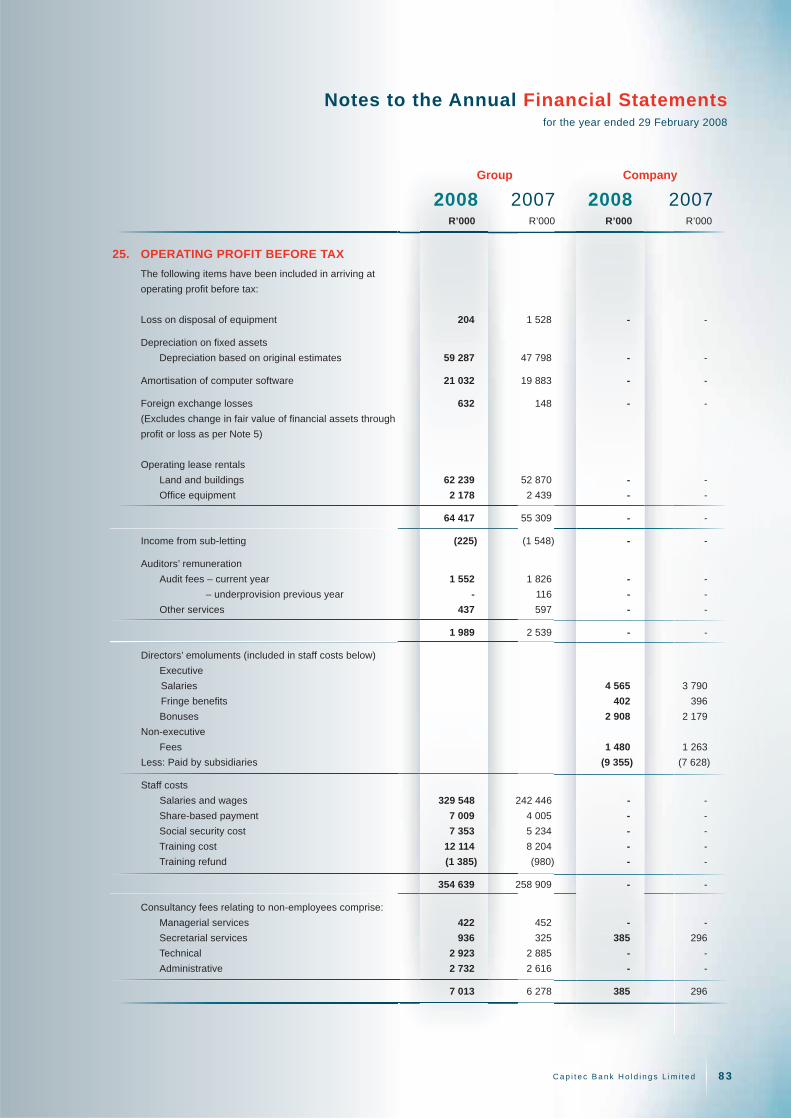
C a p i t e c B a n k H o l d i n g s L i m i t e d 8 3
Notes to the Annual Financial Statementsfor the year ended 29 February 2008
R’000 R’000 R’000 R’000
2008 2007 2008 2007
Group Company
25. OPERATING PROFIT BEFORE TAX
The following items have been included in arriving at
operating profi t before tax:
Loss on disposal of equipment 204 1 528 - -
Depreciation on fi xed assets
Depreciation based on original estimates 59 287 47 798 - -
Amortisation of computer software 21 032 19 883 - -
Foreign exchange losses 632 148 - -
(Excludes change in fair value of fi nancial assets through
profi t or loss as per Note 5)
Operating lease rentals
Land and buildings 62 239 52 870 - -
Offi ce equipment 2 178 2 439 - -
64 417 55 309 - -
Income from sub-letting (225) (1 548) - -
Auditors’ remuneration
Audit fees – current year 1 552 1 826 - -
– underprovision previous year - 116 - -
Other services 437 597 - -
1 989 2 539 - -
Directors’ emoluments (included in staff costs below)
Executive
Salaries 4 565 3 790
Fringe benefi ts 402 396
Bonuses 2 908 2 179
Non-executive
Fees 1 480 1 263
Less: Paid by subsidiaries (9 355) (7 628)
Staff costs
Salaries and wages 329 548 242 446 - -
Share-based payment 7 009 4 005 - -
Social security cost 7 353 5 234 - -
Training cost 12 114 8 204 - -
Training refund (1 385) (980) - -
354 639 258 909 - -
Consultancy fees relating to non-employees comprise:
Managerial services 422 452 - -
Secretarial services 936 325 385 296
Technical 2 923 2 885 - -
Administrative 2 732 2 616 - -
7 013 6 278 385 296
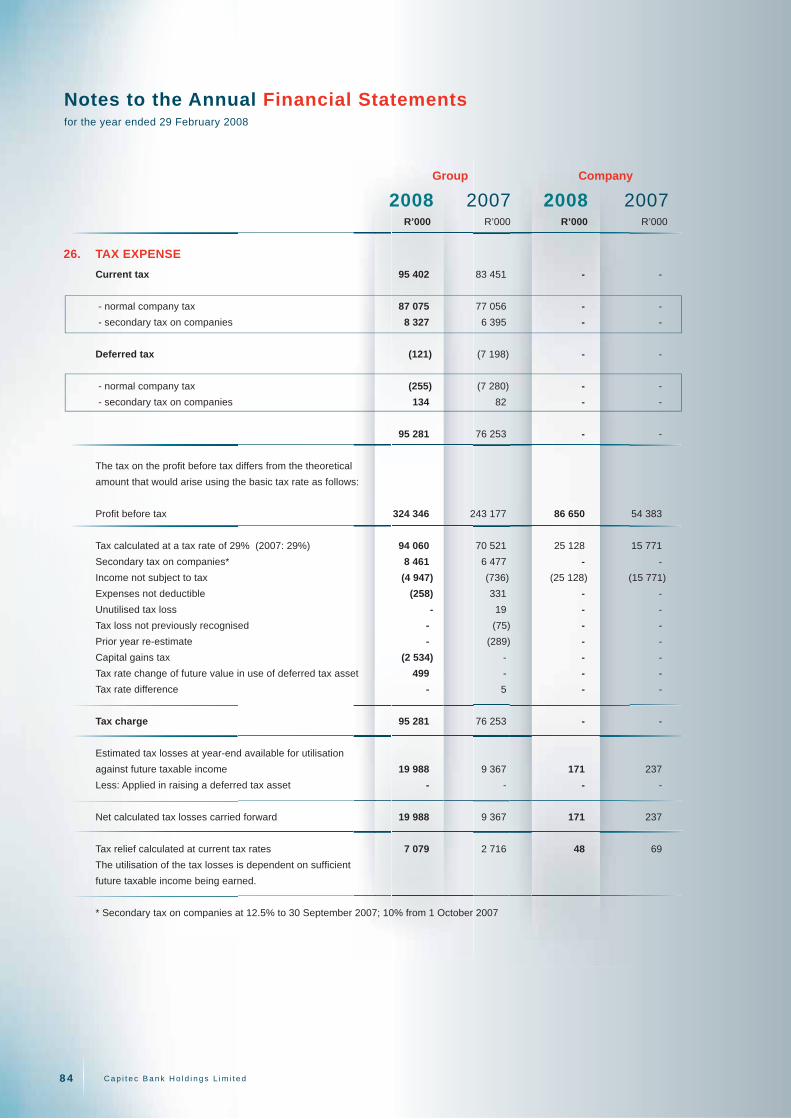
C a p i t e c B a n k H o l d i n g s L i m i t e d8 4
R’000 R’000 R’000 R’000
2008 2007 2008 2007
Group Company
26. TAX EXPENSE
Current tax 95 402 83 451 - -
- normal company tax 87 075 77 056 - -
- secondary tax on companies 8 327 6 395 - -
Deferred tax (121) (7 198) - -
- normal company tax (255) (7 280) - -
- secondary tax on companies 134 82 - -
95 281 76 253 - -
The tax on the profi t before tax differs from the theoretical
amount that would arise using the basic tax rate as follows:
Profi t before tax 324 346 243 177 86 650 54 383
Tax calculated at a tax rate of 29% (2007: 29%) 94 060 70 521 25 128 15 771
Secondary tax on companies* 8 461 6 477 - -
Income not subject to tax (4 947) (736) (25 128) (15 771)
Expenses not deductible (258) 331 - -
Unutilised tax loss - 19 - -
Tax loss not previously recognised - (75) - -
Prior year re-estimate - (289) - -
Capital gains tax (2 534) - - -
Tax rate change of future value in use of deferred tax asset 499 - - -
Tax rate difference - 5 - -
Tax charge 95 281 76 253 - -
Estimated tax losses at year-end available for utilisation
against future taxable income 19 988 9 367 171 237
Less: Applied in raising a deferred tax asset - - - -
Net calculated tax losses carried forward 19 988 9 367 171 237
Tax relief calculated at current tax rates 7 079 2 716 48 69
The utilisation of the tax losses is dependent on suffi cient
future taxable income being earned.
* Secondary tax on companies at 12.5% to 30 September 2007; 10% from 1 October 2007
Notes to the Annual Financial Statementsfor the year ended 29 February 2008

C a p i t e c B a n k H o l d i n g s L i m i t e d 8 5
Notes to the Annual Financial Statementsfor the year ended 29 February 2008
R’000 R’000
2008 2007
Group
27. EARNINGS PER SHARE ATTRIBUTABLE TO ORDINARY SHAREHOLDERS
Basic attributable earnings per share
Basic attributable earnings per share is calculated by dividing the net profi t after tax attributable to
ordinary equity holders by the weighted average number of ordinary shares in issue during the year.
Net profi t after tax 229 065 166 924
Preference dividend (17 011) (7 617)
Net profi t after tax attributable to ordinary shareholders 212 054 159 307
Weighted average number of ordinary shares in issue (thousands) 81 928 72 120
Basic attributable earnings per share (cents) 258.8 220.9
Diluted attributable earnings per share
Diluted attributable earnings per share is calculated using the weighted average number of
ordinary shares in issue, adjusted to assume conversion of all potentially dilutive ordinary
shares. For 2008 and 2007 potentially dilutive ordinary shares consisted only of share options.
A calculation is done to determine the number of shares that could have been acquired at fair
value (determined as the average annual market share price of the company’s shares) based
on the monetary value of the subscription rights attached to outstanding options. The number of
shares calculated above is compared with the number of shares that would have been issued
assuming the exercise of the share options. The difference is added to the denominator as an
issue of ordinary shares for no consideration. No adjustment is made to earnings (numerator).
Net profi t used to determine diluted attributable earnings per share 212 054 159 307
Weighted average number of ordinary shares in issue (thousands) 81 928 72 120
Adjustment for:
– exercise of share options 2 783 3 923
Weighted average number of ordinary shares for diluted attributable earnings per share (thousands) 84 711 76 043
Diluted attributable earnings per share (cents) 250.3 209.5
28. HEADLINE EARNINGS PER SHARE ATTRIBUTABLE TO
ORDINARY SHAREHOLDERS
Basic headline earnings per share
Net profi t attributable to ordinary shareholders 212 054 159 307
Non-headline items
Disposal of equipment 204 1 528
Taxation (59) (443)
Headline earnings 212 199 160 392
Headline earnings per share (cents) 259.0 222.4
Diluted headline earnings per share
Headline earnings 212 199 160 392
Diluted headline earnings per share (cents) 250.5 210.9
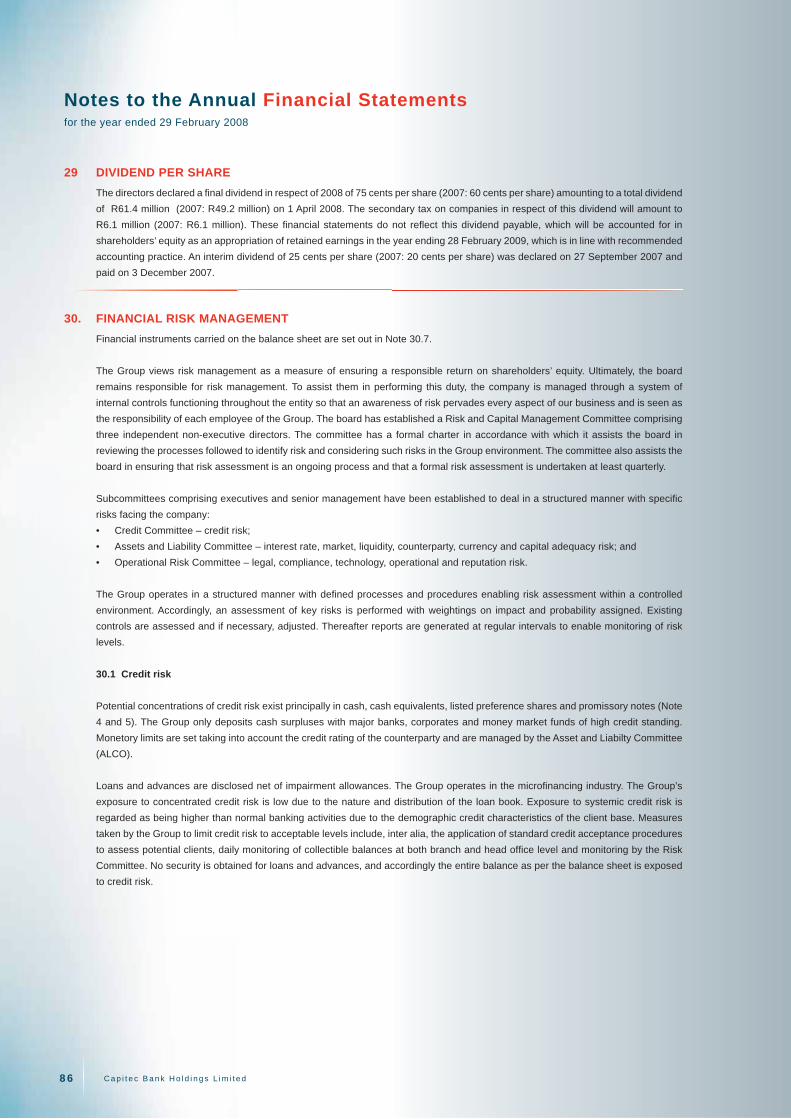
C a p i t e c B a n k H o l d i n g s L i m i t e d8 6
29 DIVIDEND PER SHARE
The directors declared a fi nal dividend in respect of 2008 of 75 cents per share (2007: 60 cents per share) amounting to a total dividend
of R61.4 million (2007: R49.2 million) on 1 April 2008. The secondary tax on companies in respect of this dividend will amount to
R6.1 million (2007: R6.1 million). These fi nancial statements do not refl ect this dividend payable, which will be accounted for in
shareholders’ equity as an appropriation of retained earnings in the year ending 28 February 2009, which is in line with recommended
accounting practice. An interim dividend of 25 cents per share (2007: 20 cents per share) was declared on 27 September 2007 and
paid on 3 December 2007.
30. FINANCIAL RISK MANAGEMENT
Financial instruments carried on the balance sheet are set out in Note 30.7.
The Group views risk management as a measure of ensuring a responsible return on shareholders’ equity. Ultimately, the board
remains responsible for risk management. To assist them in performing this duty, the company is managed through a system of
internal controls functioning throughout the entity so that an awareness of risk pervades every aspect of our business and is seen as
the responsibility of each employee of the Group. The board has established a Risk and Capital Management Committee comprising
three independent non-executive directors. The committee has a formal charter in accordance with which it assists the board in
reviewing the processes followed to identify risk and considering such risks in the Group environment. The committee also assists the
board in ensuring that risk assessment is an ongoing process and that a formal risk assessment is undertaken at least quarterly.
Subcommittees comprising executives and senior management have been established to deal in a structured manner with specifi c
risks facing the company:
• Credit Committee – credit risk;
• Assets and Liability Committee – interest rate, market, liquidity, counterparty, currency and capital adequacy risk; and
• Operational Risk Committee – legal, compliance, technology, operational and reputation risk.
The Group operates in a structured manner with defi ned processes and procedures enabling risk assessment within a controlled
environment. Accordingly, an assessment of key risks is performed with weightings on impact and probability assigned. Existing
controls are assessed and if necessary, adjusted. Thereafter reports are generated at regular intervals to enable monitoring of risk
levels.
30.1 Credit risk
Potential concentrations of credit risk exist principally in cash, cash equivalents, listed preference shares and promissory notes (Note
4 and 5). The Group only deposits cash surpluses with major banks, corporates and money market funds of high credit standing.
Monetory limits are set taking into account the credit rating of the counterparty and are managed by the Asset and Liabilty Committee
(ALCO).
Loans and advances are disclosed net of impairment allowances. The Group operates in the microfi nancing industry. The Group’s
exposure to concentrated credit risk is low due to the nature and distribution of the loan book. Exposure to systemic credit risk is
regarded as being higher than normal banking activities due to the demographic credit characteristics of the client base. Measures
taken by the Group to limit credit risk to acceptable levels include, inter alia, the application of standard credit acceptance procedures
to assess potential clients, daily monitoring of collectible balances at both branch and head offi ce level and monitoring by the Risk
Committee. No security is obtained for loans and advances, and accordingly the entire balance as per the balance sheet is exposed
to credit risk.
Notes to the Annual Financial Statementsfor the year ended 29 February 2008

C a p i t e c B a n k H o l d i n g s L i m i t e d 8 7
Notes to the Annual Financial Statementsfor the year ended 29 February 2008
30.2 Geographical concentrations of assets, liabilities and off-balance sheet items
All the Group’s operating activities are situated within the Republic of South Africa.
Capitec Bank branches are distributed across South Africa and at year-end the breakdown by province was as follows:
30.3 Interest rate risk
Prior to the implementation of the National Credit Act (NCA), the Group operated within the ambit of the Usury Act exemption notice when
considering interest rates on the advance of short-term microloans. Interest rates and loan products were reviewed pre-implementation and
adjusted to comply with the requirements of the NCA.
The current Group interest profi le is uncomplicated and is monitored by the Asset and Liability Committee (ALCO). Effective rates
on deposit balances are disclosed in Note 14 and 15. The Group currently has a conservative interest rate profi le and is interest rate
insensitive, relative to the general banking industry.
The Group’s equity and profi t and loss have limited uncontrolled exposure to changes in interest rates. The Group operates a fi xed
and discretionary interest rate profi le for most assets and liabilities. Discretionary rate items are those where the rates are not
contractually bound to a market interest rate, but rather management can at their discretion increase or decrease the rate as deemed
appropriate. Financial assets and liabilities are accounted for, in the main, on an amortised cost basis and therefore the income
statement is not signifi cantly impacted by fair value interest rate risk. Certain fi xed rate wholesale deposits have been measured at
fair value thorough profi t and loss, which has a limited profi t and loss accounting impact, (refer Note 15). The return on surplus cash
balances placed in call money market accounts varies with interest rates, resulting in cash fl ow interest rate risk. The Group has
discretion over the rates offered on its demand savings deposits. Retail advances are only offered in fi xed rate terms. The maturity
breakdown of the advances book is set out in Note 6 and Note 30.5.
ALCO meets monthly and considers the result of management’s analysis of the impact of interest rates on the Group which includes,
inter alia, the results of various models and the impact of interest rate strategy on the gross margin.
The sensitivity analysis below refl ects the impact on profi t and loss of a 200 basis point increase or decrease in interest rates:
• Immediately following the reporting date
• Based on fl oating rate assets and liabilities held at amortised cost (cash and cash equivalents, promissory notes, negotiable
instruments, retail savings deposits)
• Assets and liabilities accounted for at fair value through profi t and loss
• On balance sheet at the reporting date
The continuity of items for the purpose of this analysis is the contractual maturity dates.
anches are distributed acros
ate risk
2008 2007
Eastern Cape 41 33
Free State 19 16
Gauteng 79 65
KwaZulu-Natal 53 45
Limpopo 23 20
Mpumalanga 36 28
North West 23 18
Northern Cape 11 10
Western Cape 46 45
331 280

C a p i t e c B a n k H o l d i n g s L i m i t e d8 8
2008 2007
200 basis points Pre tax Post tax Pre tax Post tax
R’000 R’000 R’000 R’000
Increase (6 488) (4 671) 4 069 2 930
Decrease 6 473 4 660 (4 154) (2 991)
2008 2007
200 basis points Pre tax Post tax Pre tax Post tax
R’000 R’000 R’000 R’000
Increase 108 78 1 716 1 235
Decrease (123) (89) (1 801) (1 297)
If the above sensitivity is adjusted by using average February balances for cash on call and that element of discretionary retail savings
that could potentially be adjusted, maintaining such balances for the twelve months following the year end the impact on the profi t and
loss of the same basis point adjustment on year-end rates, and assuming no further rate changes in the year would be:
All other assumptions remain consistent with last year.
A parallel shift up and down in the interest rates applicable to the respective underlying exposures was used.
30.4 Currency risk
The exposure to foreign currency risk relating to the importation of capital equipment, technology and technology support services
needed for the core banking activities is managed through the purchase of forward foreign exchange contracts.
There is limited currency risk due to investments held in US Dollar-based unlisted investments held in Visa and MasterCard included
under Note 5.
30.5 Liquidity risk
The bank manages liquidity cautiously and operates an uncomplicated maturity profi le which is monitored by ALCO. The short-term
nature of the loan book relative to the size of the deposit book and the term nature of much of the funding reduces the liquidity risk of
the Group. The core component of the retail savings book that is stable exceeds the contractual maturity shortfall in the demand to
one month category signifi cantly.
The table below analyses assets and liabilities of the Group into relevant maturity groupings based on the remaining period at balance
sheet date to the contractual maturity date.
Notes to the Annual Financial Statementsfor the year ended 29 February 2008

C a p i t e c B a n k H o l d i n g s L i m i t e d 8 9
Notes to the Annual Financial Statementsfor the year ended 29 February 2008
Demand One to Three More
to one three months to than one
month months one year year Adjustment(1) Total
R’000 R’000 R’000 R’000 R’000 R’000
Assets
Loans and advances to customers 6 374 207 395 232 967 597 545 632 (90 548) 2 192 120
Cash and cash equivalents 4 568 485 49 416 - - - 617 901
Investments at fair value through profi t or loss 5 14 424 - - - - 14 424
Other receivables 8 8 128 - 145 2 041 - 10 314
Assets 965 244 444 648 967 742 547 673 (90 548) 2 834 759
Undiscounted liabilities
Liabilities to depositors 14 945 822 193 552 212 987 299 801 - 1 652 162
Trade, other payables and taxation 59 631 68 957 47 601 14 635 - 190 824
Deposits at fair value through profi t or loss 15 - 5 491 34 106 16 706 262 56 565
Provisions 17 - - - - - -
Undiscounted liabilities 1 005 453 268 000 294 694 331 142 262 1 899 551
Adjustments for undiscounted liabilities to depositors (3 064) (8 582) (30 094) (138 866) - (180 606)
Discounted liabilities 1 002 389 259 418 264 600 192 276 262 1 718 945
Net liquidity (shortfall) / excess (37 145) 185 230 703 142 355 397 (90 810) 1 115 814
Cumulative liquidity (shortfall) / excess (37 145) 148 085 851 227 1 206 624 1 115 814 1 115 814
Assets(2)
Loans and advances to customers 6 292 161 175 516 374 045 108 109 (35 654) 914 177
Cash and cash equivalents 4 1 043 746 - - - - 1 043 746
Investments at fair value through profi t or loss 5 111 933 - - - - 111 933
Other receivables 8 780 - - 1 729 - 2 509
Assets 1 448 620 175 516 374 045 109 838 (35 654) 2 072 365
Undiscounted liabilities(3)
Liabilities to depositors 14 581 650 3 524 20 989 417 299 - 1 023 462
Trade, other payables and taxation 86 944 863 80 991 4 983 - 173 781
Deposits at fair value through profi t or loss 15 - 3 242 4 366 54 332 2 233 64 173
Provisions 17 - - - 3 850 - 3 850
Undiscounted liabilities 668 594 7 629 106 346 480 464 2 233 1 265 266
Adjustments for undiscounted liabilities to depositors (2 056) (4 140) (18 631) (166 254) - (191 081)
Discounted liabilities 666 538 3 489 87 715 314 210 2 233 1 074 185
Net liquidity excess / (shortfall) 782 082 172 027 286 330 (204 372) (37 887) 998 180
Cumulative liquidity excess 782 082 954 109 1 240 439 1 036 067 998 180 998 180
(1) Adjustments to loans to customers relates to deferred initiation fee income. Adjustments to deposits at fair value through profi t or loss
relates to fair value adjustments. (2) Prior year assets have been recompiled to include all fi nancial assets in line with the current year. (3) Prior year fi nancial liabilities have been restated to gross cash fl ows as required in terms of IFRS 7.
The contractual maturity of fi nancial assets and fi nancial liabilities of the company are all on demand to one month.
Maturities of fi nancial assets and fi nancial
liabilities (discounted cash fl ows)
2008
2007

C a p i t e c B a n k H o l d i n g s L i m i t e d9 0
R’000 R’000 R’000 R’000
2008* 2007** 2008* 2007**
Group Bank
Primary (Tier 1) capital
Ordinary share capital 647 363 647 363 1 117 671 1 117 671
Retained earnings 415 458 313 049 (102 324) (221 961)
Qualifying preference share capital 154 606 154 606 154 606 154 606
Prescribed deductions (47 599) (171 538) (46 564) (171 546)
1 169 828 943 480 1 123 389 878 770
Secondary (Tier 2) capital
Qualifying unidentifi ed impairments 20 044 2 439 20 044 2 439
20 044 2 439 20 044 2 439
Total qualifying regulatory capital 1 189 872 945 919 1 143 433 881 209
Total capital adequacy % 36.4 78.9 35.1 74.1
Primary % 35.8 78.7 34.5 73.9
Secondary % 0.6 0.2 0.6 0.2
Required capital adequacy % 25.0 15.0 25.0 15.0
Required regulatory capital 817 462 179 744 814 568 178 248
Risk weighted assets
Credit risk
- on balance sheet 1 600 786 862 915 1 602 537 870 312
- off balance sheet - 119 624 1 004 119 624
1 600 786 982 539 1 603 541 989 936
Operational risk 1 369 761 - 1 356 420 -
Equity risk in the banking book 14 424 12 177 14 424 12 177
Other assets 284 876 203 578 283 885 186 208
Risk weighted assets 3 269 847 1 198 294 3 258 270 1 188 321
Total assets based on IFRS 2 936 372 2 191 642 2 937 527 2 212 907
Total risk weighted assets - adjustment 333 475 (993 348) 320 743 (1 024 586)
Total risk weighted assets - regulatory 3 269 847 1 198 294 3 258 270 1 188 321
* Calculated in terms of Basel II ** Calculated in terms of Basel I
Assets are assigned risk-weightings according to their nature. These risk-weightings, which are prescribed by the SARB with reference to
Basel II, refl ect the estimate of credit, operational and market risks after considering eligible collateral. A similar treatment is adopted for
off-balance sheet exposure, with adjustments to refl ect the more contingent nature of the potential losses.
The adjustments made to IFRS assets refl ect, in the main, the impact of risk weightings applied on calculated base IFRS values and the
addition of a risk weighted equivalent for operational risks
30.6 Capital management
The Group’s principal objectives when managing capital are to:
• Address the expectations of its shareholders, and so to optimise business activities to ensure return on capital targets are
achieved through effi cient capital management.
• Ensure that the Group holds suffi cient risk capital. Risk capital caters for unexpected losses that may arise, protects shareholders
and depositors and thereby assures the sustainability of the bank through the business cycle.
• Comply with the capital supervisory requirements of the South African Reserve Bank (SARB) as codifi ed in the Banks Act 1990
(as revised) and related Regulations.
The Group conducts a Capitec Internal Capital Adequacy Assessment Process (CICAAP) on an ongoing basis, which drives the
Group’s position on capital management matters. The CICAAP reviews the historic, current and future capital positioning of the
bank both from an internal and regulatory capital perspective.
The table below summarises the composition of
regulatory capital for the Group and principal
banking subsidiary.
Notes to the Annual Financial Statementsfor the year ended 29 February 2008

C a p i t e c B a n k H o l d i n g s L i m i t e d 9 1
Notes to the Annual Financial Statementsfor the year ended 29 February 2008
30.7 Gains and losses per category of fi nancial assets and fi nancial liabilities
30.8 Classifi cation of fi nancial assets and fi nancial liabilities
fi nancial liabilities30.7 Gains and losses peper cr catea gorg y of fi nancial assets and
Designated Held for Loans and Available Other
at fair value trading receivables for sale liabilities Total
R’000 R’000 R’000 R’000 R’000 R’000
Interest income 21 - - 740 063 - - 740 063
Interest expense 21 (6 581) (45) - - (94 823) (101 449)
Loan fee income - - 574 584 - - 574 584
Transaction fee income - - - - 168 361 168 361
ransaction fee expense - - - - (89 545) (89 545)
Dividend income 22 15 392 - - - - 15 392
Net impairment on loans and advances 23 - - (230 879) - - (230 879)
Net movement in fi nancial instruments
held at fair value through profi t and loss 24 7 818 - - - - 7 818
Interest income 21 - - 967 528 - - 967 528
Interest expense 21 (8 687) (25) - - (61 124) (69 836)
Loan fee income - - 76 943 - - 76 943
Transaction fee income - - - - 93 671 93 671
Transaction fee expense - - - - (59 057) (59 057)
Dividend income 22 1 469 1 469
Net impairment on loans and advances 23 - - (161 271) - - (161 271)
Net movement in fi nancial instruments
held at fair value through profi t and loss 24 (857) - - - - (857)
There were no gains or losses on fi nancial instruments for the company
2008
2007
2007
Notes
Group
Group
2008
Designated Held for Loans and Available Other Fair
at fair value trading receivables for sale liabilities Total Value
R’000 R’000 R’000 R’000 R’000 R’000 R’000
Financial assets
Cash and cash equivalents 4 - - 617 901 - - 617 901 617 901
Financial assets at fair value through profi t or loss 5 14 424 - - - - 14 424 14 424
Loans and advances to clients 6 - - 2 019 200 - - 2 019 200 2 009 816
Other receivables 8 - 290 10 024 - - 10 314 9 729
Financial liabilities
Deposits at amortised cost 14 - - - - 1 475 696 1 475 696 1 467 110
Deposits held at fair value
through profi t or loss 15 52 425 - - - - 52 425 52 425
Trade and other payables 16 - - - - 143 368 143 368 143 368
Provisions 17 - - - - - - -
Financial assets
Cash and cash equivalents 4 - - 1 043 746 - - 1 043 746 1 043 746
Financial assets at fair value through
profi t or loss 5 111 933 - - - - 111 933 111 933
Loans and advances to clients 6 - - 803 260 - - 803 260 803 260
Other receivables 8 - - 2 509 - - 2 509 2 327
Financial liabilities
Deposits at amortised cost 14 - - - - 842 172 842 172 844 344
Deposits held at fair value
through profi t or loss 15 54 382 - - - - 54 382 54 382
Trade and other payables 16 - 2 - - 94 646 94 648 94 648
Provisions 17 - - - - 3 850 3 850 3 850
Notes

C a p i t e c B a n k H o l d i n g s L i m i t e d9 2
Designated Held for Loans and Available Other Fair
at fair value trading receivables for sale liabilities Total value
R’000 R’000 R’000 R’000 R’000 R’000 R’000
Financial assets
Group loans receivable 9 8 843 8 843 8 843
Financial liabilities
Trade and other payables 16 8 909 8 909 8 909
Group loans payable 18 4 247 4 247 4 247
Financial assets
Group loans receivable 9 7 637 7 637 7 637
Financial liabilities
Trade and other payables 16 7 703 7 703 7 703
Group loans payable 18 4 247 4 247 4 247
Valuation of assets and liabilities
The fair value of fi nancial liabilities is calculated by discounting the contractual cash fl ows based on an appropriate market related rate.
The market related rate is determined with reference to the movement in the risk-free rate for the remaining duration of the liabilities and
adjusted for any movement in the risk premium as determined through the judgement of management taking into account their knowledge
of the market including recent transactions and developments.
The difference in the present value for assets and liabilities, based on the risk premium determined at the later of the start of the fi nancial
year or the inception of the instrument compared to the risk premium at the earlier of year end or derecognition of the fi nancial liability is
determined to be the change in fair value attributable to credit risk for the current year.
Financial assets are valued based on the nature of the item. Listed fi nancial assets are valued with reference to the closing bid price.
Unlisted debt instruments are valued by discounting expected cash fl ows based on an appropriate market related rate. The discount rate
is determined as for fi nancial liabilities, but the cash fl ows are adjusted for expected future service costs.
Unlisted equity instruments that will be converted to listed instruments are valued with reference to the current market value of the listed
instrument, adjusted for the time to and conditions of conversion and the existence of alternative markets such as over-the-counter
markets.
Other unlisted equity instruments are valued taking into account factors such as net asset value, expected cash fl ows, expected profi tability
and appropriate price to earnings ratios.
2008 Notes
30.8 Classifi cation of fi nancial assets and liabilities continued
2007
Company
Notes to the Annual Financial Statementsfor the year ended 29 February 2008

C a p i t e c B a n k H o l d i n g s L i m i t e d 9 3
Notes to the Annual Financial Statementsfor the year ended 29 February 2008
R’000 R’000 R’000 R’000
2008 2007 2008 2007
Group Company
31. RETIREMENT BENEFITS
The Group contributed on behalf of all employees who elected
to be members of the provident fund. The provident fund, a
defi ned contribution fund, is administered independently of
the Group and is subject to the Pension Funds Act, 1956 (Act
24 of 1956).
The amounts contributed are included in salaries and wages
as per Note 25. Since 1 July 2001 it is compulsory for all
new appointments to be members of the provident fund. The
company will continue to contribute to the fund on behalf of
all members. The Group has no exposure in respect of any
post-retirement benefi ts payable.
32. RELATED-PARTY TRANSACTIONS
Transactions with subsidiaries
Investments in subsidiaries are disclosed in Note 10.
Dividend received
Capitec Bank Limited - - 86 650 54 450
Loans due from:
Capitec Bank Limited - - 8 843 7 637
Loans due to:
Finaid Financial Services (Pty) Limited - - 4 246 4 246
Keymatrix (Pty) Limited - - 1 1
Guarantees:(2)
Key Distributers (Pty) Limited has received a guarantee
from a fellow subsidiary, Capitec Bank Limited. The value
guaranteed is R6.8 million (2007: R6.8 million)
The balances outstanding at year end that are covered
amounted to R2.5 million (2007: 2.5 million). A market related
guarantee fee of R102 000 (2007: R102 000) was paid by
Key Distributers (Pty) Limited by Capitec Bank Limited.
Transactions with other related parties
Transactions with Arch Equity (Pty) Limited(1)
Interest received - 1 021 - -
PSG Group and subsidiaries(3)
Brokers’ fees 294 126 - -
Sponsors’ fees 56 500 56 500
Underwriters’ fee on issue of preference shares - 3 200 - 3 200
Loans and advances to directors and other key
management personnel
Loans and advances to customers
Loans outstanding at beginning of year 134 761 - -
Loans advanced during the year 86 - - -
Interest charged on loans during the year 14 37 - -
Loan repayments during the year (145) (664) - -
Loans outstanding at end of year 89 134 - -
Less advanced by subsidiaries (89) (134) - -
16 035 12 761 - -

C a p i t e c B a n k H o l d i n g s L i m i t e d9 4
R’000 R’000 R’000 R’000
2008 2007 2008 2007
Group Company
32. RELATED-PARTY TRANSACTIONS continued
Savings accounts from directors and other
key management personnel(4)
Due to customers
Deposits at beginning of year 549 432 - -
Change in composition of related parties (340) - - -
Interest earned during the year 178 39 - -
Deposits made (repaid) during the year 15 78 - -
Deposits at end of year 402 549 - -
Key management compensation(5)
Salaries and other short-term benefi ts 12 447 8 208 - -
Post-employment benefi ts 1 002 740 - -
Share-based payments 1 260 1 154 - -
14 709 10 102 - -
Less paid by subsidiaries (14 709) (10 102) - -
(1) In the prior year Arch Equity Limited disposed of its shareholding of the share capital of Capitec Bank Holdings Limited and were
considered a related party through their representation on the board by D Lockey. D Lockey resigned 1 September 2006.
(2) Key Distributors’ creditors are included in the group balance sheet on consolidation.
(3) PSG Capital is the corporate advisor and sponsor of the Group, while PSG Financial Services Limited was Capitec Bank Limited’s
underwriter. Transactions requiring the purchase of fi nancial instruments on the open market is conducted through a number of
intermediaries in an arm’s length manner.
(4) Savings and deposits are unsecured, carry variable interest rates and are repayable on demand.
(5) Key management compensation excludes directors’ remuneration. Refer to the directors’ report for details regarding directors’
remuneration.
Key management is considered to be members of the Management Committee.
Directors
All directors of Capitec Bank Holdings Limited have given notice that they did not have a material interest in any signifi cant contract
with the company or any of its subsidiaries, which could have given rise to a confl ict of interest during the year. Details relating to
directors’ emoluments, shareholdings and share options granted are included in the directors’ report.
Notes to the Annual Financial Statementsfor the year ended 29 February 2008
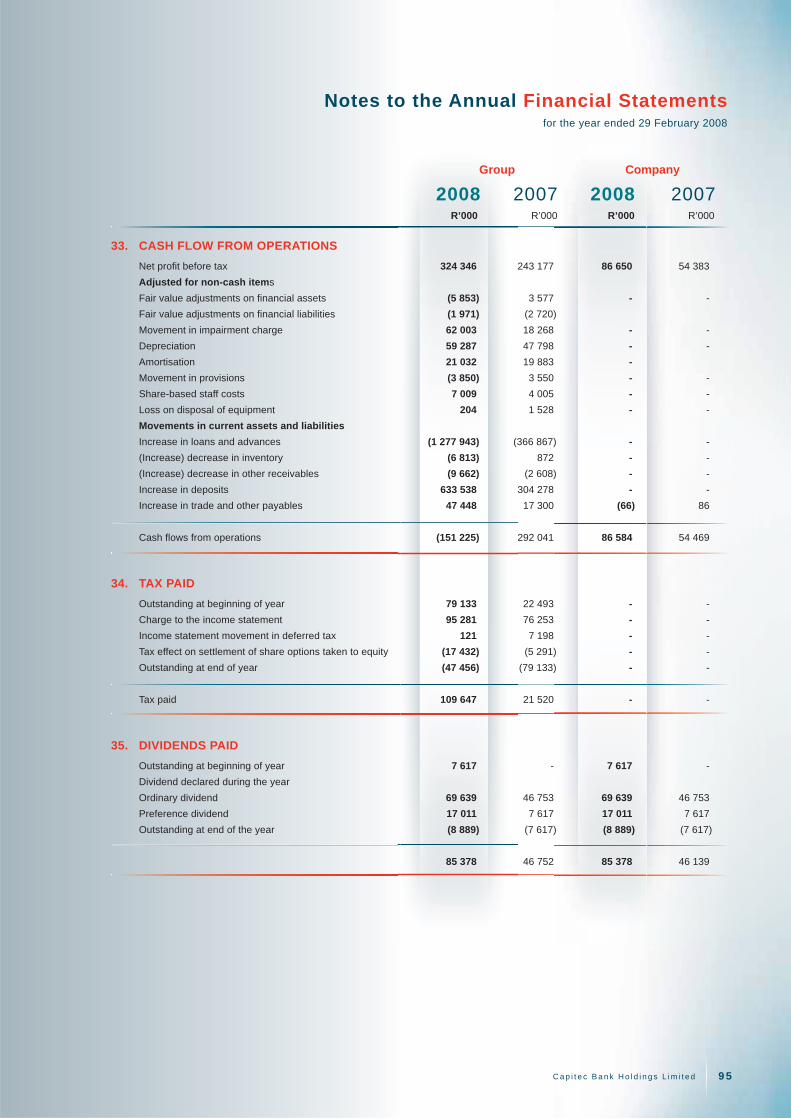
C a p i t e c B a n k H o l d i n g s L i m i t e d 9 5
Notes to the Annual Financial Statementsfor the year ended 29 February 2008
R’000 R’000 R’000 R’000
2008 2007 2008 2007
Group Company
33. CASH FLOW FROM OPERATIONS
Net profi t before tax 324 346 243 177 86 650 54 383
Adjusted for non-cash items
Fair value adjustments on fi nancial assets (5 853) 3 577 - -
Fair value adjustments on fi nancial liabilities (1 971) (2 720)
Movement in impairment charge 62 003 18 268 - -
Depreciation 59 287 47 798 - -
Amortisation 21 032 19 883 -
Movement in provisions (3 850) 3 550 - -
Share-based staff costs 7 009 4 005 - -
Loss on disposal of equipment 204 1 528 - -
Movements in current assets and liabilities
Increase in loans and advances (1 277 943) (366 867) - -
(Increase) decrease in inventory (6 813) 872 - -
(Increase) decrease in other receivables (9 662) (2 608) - -
Increase in deposits 633 538 304 278 - -
Increase in trade and other payables 47 448 17 300 (66) 86
Cash fl ows from operations (151 225) 292 041 86 584 54 469
34. TAX PAID
Outstanding at beginning of year 79 133 22 493 - -
Charge to the income statement 95 281 76 253 - -
Income statement movement in deferred tax 121 7 198 - -
Tax effect on settlement of share options taken to equity (17 432) (5 291) - -
Outstanding at end of year (47 456) (79 133) - -
Tax paid 109 647 21 520 - -
35. DIVIDENDS PAID
Outstanding at beginning of year 7 617 - 7 617 -
Dividend declared during the year
Ordinary dividend 69 639 46 753 69 639 46 753
Preference dividend 17 011 7 617 17 011 7 617
Outstanding at end of the year (8 889) (7 617) (8 889) (7 617)
85 378 46 752 85 378 46 139

C a p i t e c B a n k H o l d i n g s L i m i t e d9 6
R’000 R’000 R’000 R’000
2008 2007 2008 2007
Group Company
36. SHARES ISSUED
Specifi c issue of shares - 299 498 - 299 498
Share issues expenses - 154 606 - 154 606
- 454 104 - 454 104
37. SHARES ACQUIRED AND OPTIONS SETTLED
Cost of shares acquired for options settled 71 469 23 441 - -
Proceeds on settlement of options (4 583) (1 192) - -
66 886 22 249 - -
38. COMMITMENTS AND CONTINGENT LIABILITIES
Property rental commitments
Within one year 67 860 58 755 - -
From one to fi ve years 155 259 141 614 - -
After fi ve years 6 665 4 340 - -
229 784 204 709 - -
Other operating lease commitments
Within one year 1 602 1 576 - -
From one to fi ve years 3 230 3 757 - -
4 832 5 333 - -
Guarantees
Issued to non-banking institutions 7 500 7 500 - -
(The value of the issued guarantees to fi nancial institutions
at fair value is nil.)
Facilities
Unutilised loan facilities to clients - 135 701 - -
Capital commitments – approved by the board
Contracted for 43 030 23 855 - -
Not contracted for 132 852 141 481 - -
175 882 165 336 - -
39. BORROWING POWERS
In terms of the articles of association of Capitec Bank Holdings Limited, the directors may at their discretion raise or borrow money
for the purpose of the business of the company without limitation. These borrowing powers are subject to the limitations of the Banks
Act, 1990 (Act 94 of 1990).
The increase in borrowings from the previous year is for the purposes of funding of general banking business including future
expansion of the loan book and capital expenditure.
Notes to the Annual Financial Statementsfor the year ended 29 February 2008
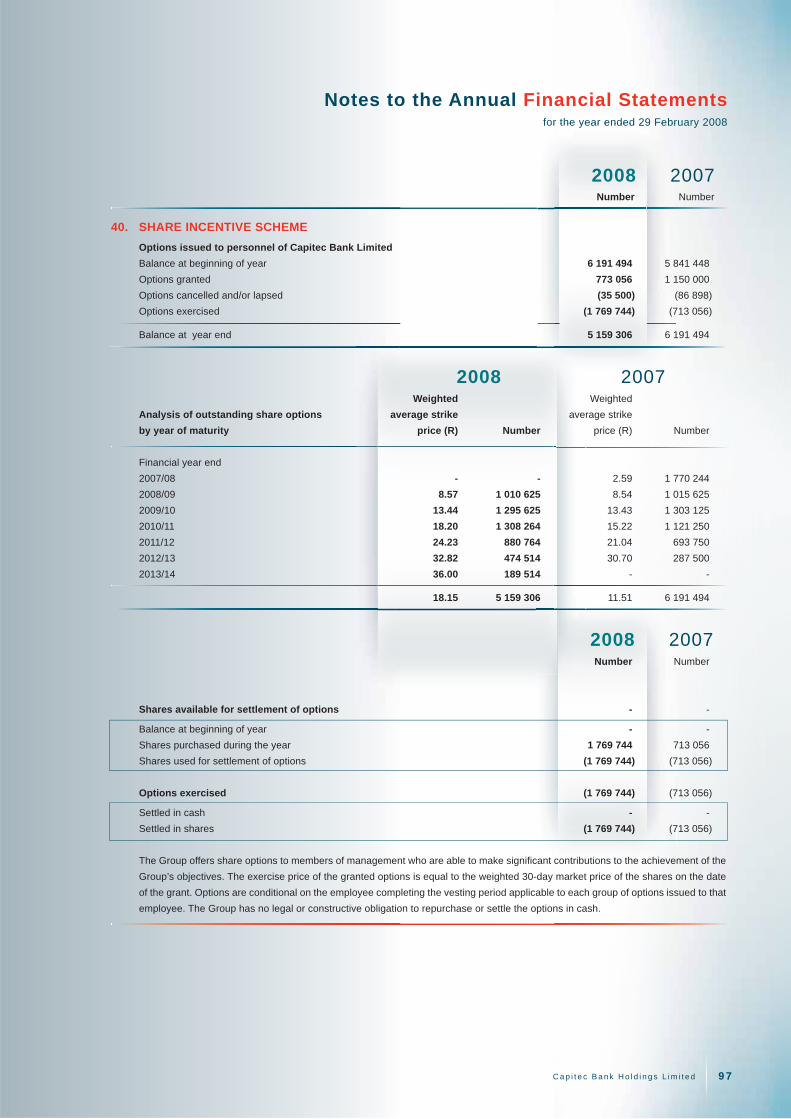
C a p i t e c B a n k H o l d i n g s L i m i t e d 9 7
Notes to the Annual Financial Statementsfor the year ended 29 February 2008forr the year ended 29 Febr
Number Number
2008 2007
2008 2007
40. SHARE INCENTIVE SCHEME
Options issued to personnel of Capitec Bank Limited
Balance at beginning of year 6 191 494 5 841 448
Options granted 773 056 1 150 000
Options cancelled and/or lapsed (35 500) (86 898)
Options exercised (1 769 744) (713 056)
Balance at year end 5 159 306 6 191 494
Weighted Weighted
Analysis of outstanding share options average strike average strike
by year of maturity price (R) Number price (R) Number
Financial year end
2007/08 - - 2.59 1 770 244
2008/09 8.57 1 010 625 8.54 1 015 625
2009/10 13.44 1 295 625 13.43 1 303 125
2010/11 18.20 1 308 264 15.22 1 121 250
2011/12 24.23 880 764 21.04 693 750
2012/13 32.82 474 514 30.70 287 500
2013/14 36.00 189 514 - -
18.15 5 159 306 11.51 6 191 494
Number Number
Shares available for settlement of options - -
Balance at beginning of year - -
Shares purchased during the year 1 769 744 713 056
Shares used for settlement of options (1 769 744) (713 056)
Options exercised (1 769 744) (713 056)
Settled in cash - -
Settled in shares (1 769 744) (713 056)
The Group offers share options to members of management who are able to make signifi cant contributions to the achievement of the
Group’s objectives. The exercise price of the granted options is equal to the weighted 30-day market price of the shares on the date
of the grant. Options are conditional on the employee completing the vesting period applicable to each group of options issued to that
employee. The Group has no legal or constructive obligation to repurchase or settle the options in cash.
2008 2007

C a p i t e c B a n k H o l d i n g s L i m i t e d9 8
Fair value Value taking Volatility on issue Expected into account Share price used in Number date ignoring vesting expected Year Strike on issuing valuation Dividend Year Risk-free of options vesting proportion vesting granted price date (1) yield maturing rate outstanding conditions (2) proportion R R % % % R’000 % R’000 2003/04 2.40 2.52 40 7.4 2008/09 10.1 176 875 126 98.9 124 2009/10 10.0 176 875 127 89.0 113
2004/05 5.73 5.30 28 3.7 2008/09 9.7 415 000 544 98.3 534 2009/10 9.8 415 000 614 88.5 544 2010/11 9.9 415 000 672 79.6 535 7.36 8.15 28 3.7 2008/09 8.5 12 500 30 94.5 29 2009/10 8.7 12 500 33 85.0 28 2010/11 8.9 12 500 35 76.5 27
2005/06 13.72 13.71 36 2.1 2008/09 7.8 18 750 75 99.1 74 2009/10 8.0 18 750 87 89.2 77 2010/11 8.2 18 750 97 80.3 77 2011/12 8.3 18 750 105 72.2 76 14.05 13.90 36 2.1 2008/09 7.5 368 750 1 462 97.7 1 428 2009/10 7.8 368 750 1 698 87.9 1 493 2010/11 8.0 368 750 1 897 79.1 1 501 2011/12 8.1 368 750 2 065 71.2 1 471 17.64 18.90 35 2.1 2008/09 7.2 18 750 110 95.7 105 2009/10 7.3 18 750 125 86.1 107 2010/11 7.5 18 750 137 77.5 106 2011/12 7.6 18 750 148 69.7 103
2006/07 30.20 31.00 36 1.4 2009/10 7.2 12 500 116 89.2 104 2010/11 7.3 12 500 135 80.3 109 2011/12 7.5 12 500 151 72.2 109 2012/13 7.6 12 500 165 65.0 107 30.59 31.05 36 1.4 2009/10 7.2 12 500 116 90.0 104 2010/11 7.3 12 500 135 81.0 109 2011/12 7.5 12 500 151 72.9 110 2012/13 7.6 12 500 165 65.6 108 30.73 34.00 36 1.3 2009/10 7.2 260 000 2 953 88.9 2 625 2010/11 7.3 260 000 3 369 80.0 2 696 2011/12 7.5 260 000 3 724 72.0 2 682 2012/13 7.6 260 000 4 030 64.8 2 611
2007/08 35.82 38.30 34 1.6 2010/11 8.0 163 000 1 950 79.7 1 554 2011/12 7.9 163 000 2 216 71.7 1 590 2012/13 7.8 163 000 2 441 64.5 1 575 2013/14 7.7 163 000 2 631 58.1 1 528 36.00 35.60 34 1.7 2010/11 8.1 13 889 138 80.1 111 2011/12 8.0 13 889 160 72.1 115 2012/13 7.9 13 889 179 64.8 116 2013/14 7.8 13 889 194 58.4 113 36.07 36.00 34 1.7 2010/11 8.2 7 500 77 80.3 62 2011/12 8.0 7 500 89 72.2 64 2012/13 7.9 7 500 99 65.0 64 2013/14 7.9 7 500 108 58.5 63 41.46 38.00 34 1.7 2010/11 9.1 5 125 51 73.9 37 2011/12 8.8 5 125 60 66.5 40 2012/13 8.6 5 125 68 59.8 41 2013/14 8.5 5 125 74 53.8 40
Grand total 5 159 306 35 932 75.5 27 139
41. SHARE OPTION EXPENSE
Data utilised in the valuation of options granted
The table below provides detail regarding the data used in the valuation of the share options to which the IFRS 2 has been applied.
Share options are refl ected on an equity-settled basis and are valued at issue date. The number of options that are expected to vest
are re-estimated on an annual basis.
(1) The share options granted prior to 28 February 2003 have been valued for disclosure purposes by applying a standard expected volatility
of 40% since the short listing history available at the valuation date for those share options was inappropriate for forecasting purposes.
The share options granted, to which IFRS 2 has been applied, have been valued by applying the expected volatility of the share price as
of December 2003 as it was considered more appropriate in the valuation because the shares were traded more frequently after the PSG
unbundling. (2) Average South African executive staff turnover of 10% p.a. used to estimate likelihood of vesting conditions realising. Will be re-estimated
in terms of IFRS 2 on an annual basis.
Notes to the Annual Financial Statementsfor the year ended 29 February 2008

C a p i t e c B a n k H o l d i n g s L i m i t e d 9 9
Notes to the Annual Financial Statementsfor the year ended 29 February 2008
42. SHARE APPRECIATION RIGHTS
The Capitec Bank Group Employee Empowerment Trust is a 5% participant in the BEE consortium that purchased 10 million shares
in the Group in February 2007. Funding for the share purchase was mainly obtained from the IDC.
During February 2008 a communication was sent out by Capitec Bank on behalf of the Trust to employees of the bank, informing
them that each permanent employee, not participating in the share incentive scheme and employed at 29 February 2008, will benefi t
from cash disbursements, based on the cumulative increase in value of 200 Capitec Bank Holdings shares less funding costs, paid in
increments of 25% over four years. The payments will be made starting February 2010 and depend on their continued employment
by the Group.
The agreement constitutes a cash-settled equity-based compensation plan in terms of IFRS 2 and the trust is considered to be a
subsidiary of the Group.
At 29 February 2008 2 742 employees qualifi ed for the rights.
The value of the rights are estimated as follows:
43. DERIVATIVE FINANCIAL INSTRUMENTS
Included in other receivables are the following forward foreign exchange contracts
Notional Fair values
amount Assets Liabilities
R’000 R’000 R’000
Year ended 29 February 2008
Forward foreign exchange contracts
- Notional amounts in ZAR 5 946 290 -
- Notional amounts in US$ 777 - -
Year ended 28 February 2007
Nil
Forward foreign exchange contracts represent commitments to purchase foreign currency, including undelivered spot transactions
and were entered into to match corresponding expected future transactions to the amount of R5.9 million (2007: nil).
Group
Risk Portion
Year Year Number free rate Value of term
granted maturing of rights % per right expired % Value
2007/08 2009/10 137 100 9.8 6.85 0.0 -
2007/08 2010/11 137 100 9.4 7.44 0.0 -
2007/08 2011/12 137 100 9.2 7.87 0.0 -
2007/08 2012/13 137 100 9.1 8.20 0.0 -
548 400 9.4 7.59 0.0 -
The following assumptions were used to calculate the value of the rights:
Dividend yield 1.7 %
Volatility 34 %
Ex dividend share price 38.35
There was no income statement effect in the current year due to the fact that the cost is expensed over the term of the rights and
no portion of the vesting period related to the 2008 fi nancial year.
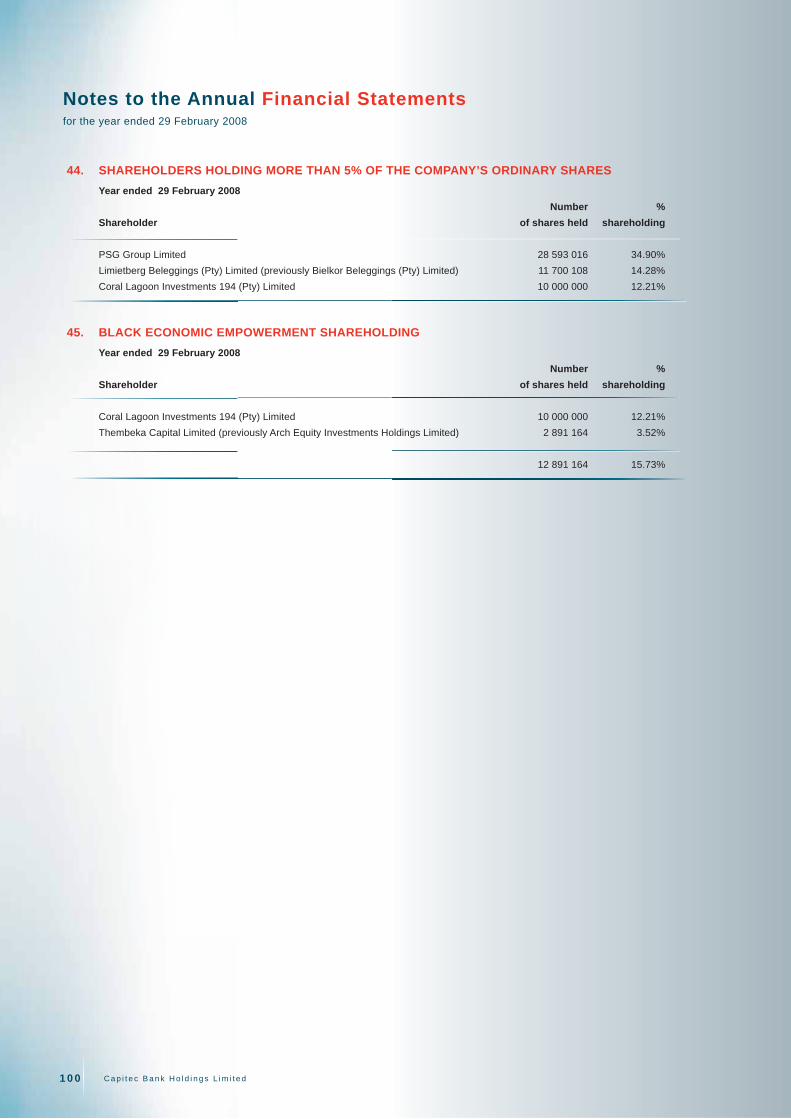
C a p i t e c B a n k H o l d i n g s L i m i t e d1 0 0
44. SHAREHOLDERS HOLDING MORE THAN 5% OF THE COMPANY’S ORDINARY SHARES
Year ended 29 February 2008
Number %
Shareholder of shares held shareholding
PSG Group Limited 28 593 016 34.90%
Limietberg Beleggings (Pty) Limited (previously Bielkor Beleggings (Pty) Limited) 11 700 108 14.28%
Coral Lagoon Investments 194 (Pty) Limited 10 000 000 12.21%
45. BLACK ECONOMIC EMPOWERMENT SHAREHOLDING
Year ended 29 February 2008
Number %
Shareholder of shares held shareholding
Coral Lagoon Investments 194 (Pty) Limited 10 000 000 12.21%
Thembeka Capital Limited (previously Arch Equity Investments Holdings Limited) 2 891 164 3.52%
12 891 164 15.73%
Notes to the Annual Financial Statementsfor the year ended 29 February 2008
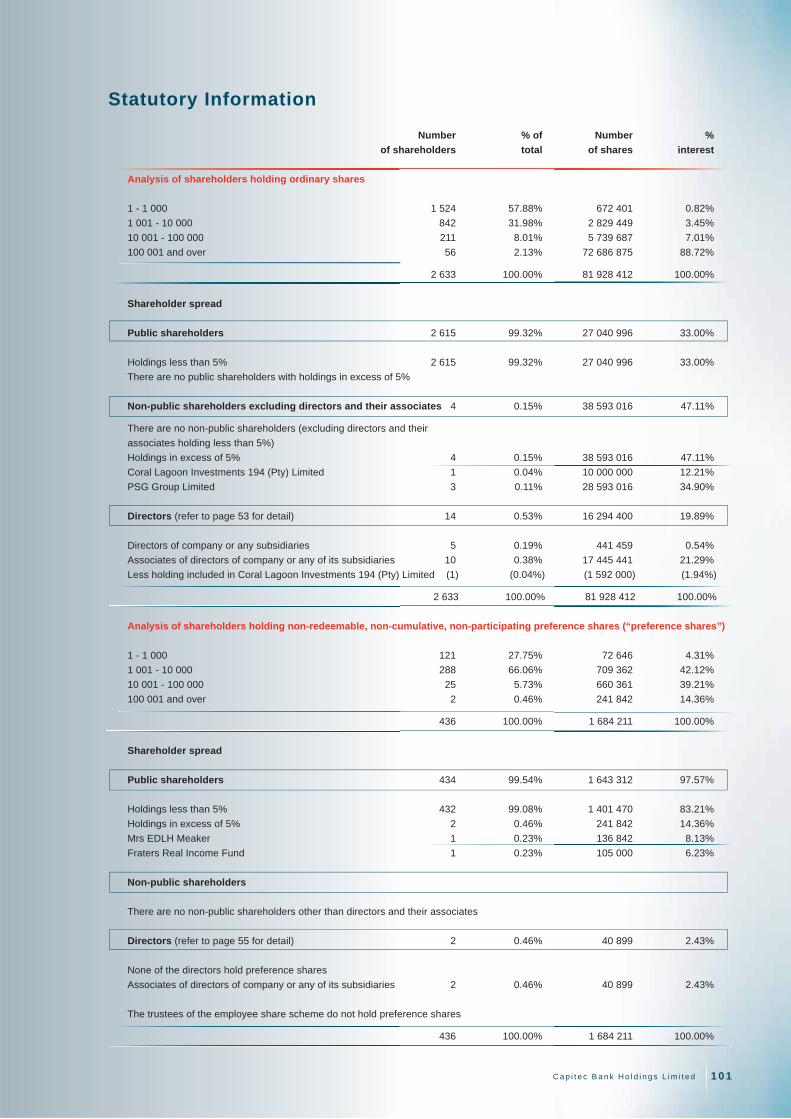
C a p i t e c B a n k H o l d i n g s L i m i t e d 1 0 1
Statutory Information
Number % of Number %
of shareholders total of shares interest
Analysis of shareholders holding ordinary shares
1 - 1 000 1 524 57.88% 672 401 0.82%
1 001 - 10 000 842 31.98% 2 829 449 3.45%
10 001 - 100 000 211 8.01% 5 739 687 7.01%
100 001 and over 56 2.13% 72 686 875 88.72%
2 633 100.00% 81 928 412 100.00%
Shareholder spread
Public shareholders 2 615 99.32% 27 040 996 33.00%
Holdings less than 5% 2 615 99.32% 27 040 996 33.00%
There are no public shareholders with holdings in excess of 5%
Non-public shareholders excluding directors and their associates 4 0.15% 38 593 016 47.11%
There are no non-public shareholders (excluding directors and their
associates holding less than 5%)
Holdings in excess of 5% 4 0.15% 38 593 016 47.11%
Coral Lagoon Investments 194 (Pty) Limited 1 0.04% 10 000 000 12.21%
PSG Group Limited 3 0.11% 28 593 016 34.90%
Directors (refer to page 53 for detail) 14 0.53% 16 294 400 19.89%
Directors of company or any subsidiaries 5 0.19% 441 459 0.54%
Associates of directors of company or any of its subsidiaries 10 0.38% 17 445 441 21.29%
Less holding included in Coral Lagoon Investments 194 (Pty) Limited (1) (0.04%) (1 592 000) (1.94%)
2 633 100.00% 81 928 412 100.00%
Analysis of shareholders holding non-redeemable, non-cumulative, non-participating preference shares (“preference shares”)
1 - 1 000 121 27.75% 72 646 4.31%
1 001 - 10 000 288 66.06% 709 362 42.12%
10 001 - 100 000 25 5.73% 660 361 39.21%
100 001 and over 2 0.46% 241 842 14.36%
436 100.00% 1 684 211 100.00%
Shareholder spread
Public shareholders 434 99.54% 1 643 312 97.57%
Holdings less than 5% 432 99.08% 1 401 470 83.21%
Holdings in excess of 5% 2 0.46% 241 842 14.36%
Mrs EDLH Meaker 1 0.23% 136 842 8.13%
Fraters Real Income Fund 1 0.23% 105 000 6.23%
Non-public shareholders
There are no non-public shareholders other than directors and their associates
Directors (refer to page 55 for detail) 2 0.46% 40 899 2.43%
None of the directors hold preference shares
Associates of directors of company or any of its subsidiaries 2 0.46% 40 899 2.43%
The trustees of the employee share scheme do not hold preference shares
436 100.00% 1 684 211 100.00%

C a p i t e c B a n k H o l d i n g s L i m i t e d1 0 2
Special Resolutions of Subsidiaries
Details of a special resolution passed by the company’s subsidiary during the fi nancial year under review are presented below:
Capitec Bank Limited
Acquisition of shares in holding company
It was resolved that the Bank be authorised as a general approval to acquire shares issued by its holding company, upon such terms and
conditions and in such amounts as the directors of the Bank may from time to time decide, but subject to the provisions of sections 85
to 89 of the Companies Act, 1973 (Act 61 of 1973) (“the Act”), the articles of association of the Bank and holding company respectively
and insofar as it may be applicable, the Listings Requirements from time to time of JSE Limited (“JSE”), provided always that :
• This general approval shall expire at the date of the Bank’s next annual general meeting in 2008, but not later than 15 November
2008;
• Purchases of securities in the listed holding company will only be effected through the order book operated by the JSE trading
system and done without any prior understanding or arrangement between the Bank and the counterparty (reported trades are
prohibited);
• An announcement must be published when the Bank has acquired, including the acquisition of shares in the holding company
through subscription, on a cumulative basis, 3% of the number of shares the holding company had in issue prior to the acquisition,
pursuant to which the aforesaid 3% threshold is reached, containing full details thereof as well as for each 3% in aggregate of the
initial number of that class acquired thereafter;
• Acquisitions by the Bank of shares in its holding company will be limited to an aggregate of 10% of the holding company’s issued
capital as at the date this authority is granted;
• The Bank will not purchase shares in the holding company at a price more than 10% above the weighted average of the market
value for the fi ve business days immediately preceding the date of acquisition;
• The Bank will at any point in time, if applicable, appoint only one agent to effect any purchase(s) of the holding company’s
shares;
• The Bank will only undertake an acquisition of the holding company’s shares if, after such acquisition, at least 500 public
shareholders as defi ned in the Listings Requirements of the JSE continue to hold at least 20% of that class of the company’s
issued shares;
• The Bank will not purchase any shares in its holding company during any prohibited period as defi ned in paragraph 3.67 of the
Listings Requirements of the JSE.
Amendment of articles of association
It was resolved that article 59 of the Bank’s articles of association be deleted in its entirety and replaced by the following new article 59:
“The board of directors of the Bank or a general meeting may from time to time declare and pay dividends to any one or more classes
of shareholders –
59.1 registered as such at a date which shall be not less than fourteen days after the date of publication of the announcement of the
declaration of the dividend on the basis that the register of shareholders may not be closed between the date of publication
of such announcement and the record date for the payment of the dividend; provided that
59.2.1 the sanction of a general meeting shall be required to pay any dividend declared either wholly or in part by the distribution of
such specifi c assets in such manner as the directors may determine, and
59.2.2 no greater dividend shall be declared by a general meeting than is recommended by the directors.”
C a p i t e c B a n k H o l d i n g s L i m i t e d 1 0 3
Notice of Annual General Meeting
Notice is hereby given that the annual general meeting of the shareholders of Capitec Bank Holdings Limited (“Capitec” or “the
company”) will be held in the Granvin Room, L’Avenir Estate, R44 Klapmuts Road, Stellenbosch, on Wednesday, 28 May 2008 at
12:00 to transact the following business:
To consider and, if deemed fi t, approve the following resolutions as ordinary and special resolutions, as the case may be, with or
without modifi cation:
1. Ordinary resolution number 1
“Resolved that the audited annual fi nancial statements of the company and the group for the year ended 29 February 2008 be
approved.”
2. Ordinary resolution number 2
“Resolved that Mr KA Hedderwick, appointed to the board of the company on 10 December 2007, having retired in terms of article
80.2.1 of the company’s articles of association and, being eligible, has offered himself for re-election, be re-elected as an independent
non-executive director of the company.”
Summary curriculum vitae of Kevin Alexander Hedderwick: Mr Hedderwick is aged 55.
Mr Hedderwick is the chief operating offi cer of Famous Brands Limited. He has extensive retail business experience, including food,
beverages and franchising. He has held senior executive positions in a number of prominent companies including SAB, Distell and
Foodcorp. Prior to joining the Famous Brands group, he was managing director of Keg Franchising.
Mr Hedderwick is a member of the directors’ affairs and remuneration committees.
3. Ordinary resolution number 3
“Resolved that Mr PJ Mouton, appointed to the board of the company on 5 October 2007, having retired in terms of article 80.2.1 of
the company’s articles of association and, being eligible, has offered himself for re-election, be re-elected as a non-executive director
of the company.”
Summary curriculum vitae of Petrus Johannes Mouton: Mr Mouton, aged 31, obtained a BComm (Maths) from the University
of Stellenbosch (1997).
Mr Mouton is the managing director of Thembeka Capital (Pty) Limited, a majority black owned and controlled BEE investment
holding company. He serves as non-executive director on the boards of various companies including Erbacon Investment Holdings
Limited, an AltX listed company. He has been active in the investment and fi nancial services industries since 1999.
Mr Mouton is a member of the directors’ affairs and risk and capital management committees.
4. Ordinary resolution number 4
“Resolved that Mr JP van der Merwe, appointed to the board of the company on 27 September 2007, having retired in terms of
article 80.2.1 of the company’s articles of association and, being eligible, has offered himself for re-election, be re-elected as an
independent non-executive director of the company.”
Summary curriculum vitae of Jacobus Pieter van der Merwe: Mr Van der Merwe, aged 59, obtained a BA from the University of
Stellenbosch and qualifi ed as a CA(SA) (1974).
Mr Van der Merwe is an experienced retail banker. He commenced his career in banking as chief accountant at Boland Bank in 1974
after which he joined Volkskas Bank as general manager of fi nance in 1983. After the amalgamation of Bankorp and ABSA he was
appointed general manager of Commercial Bank, responsible for Absa Western Cape (1995 – 1999). In 2000 he was appointed
operating executive of Commercial Bank ABSA. In 2001 up to his retirement in 2006 he was an executive director in the ABSA group.
For the last two and a half years of his term as executive director he was responsible for group administration, group information
management, group IT, group credit and risk management.
Mr Van der Merwe is the chairman of the audit committee and a member of the directors’ affairs and risk and capital management
committees.

C a p i t e c B a n k H o l d i n g s L i m i t e d1 0 4
5. Ordinary resolution number 5
“Resolved that Prof MC Mehl, who retires by rotation in terms of article 77.1 of the articles of association of the company and, being
eligible, offers himself for re-election, be re-elected as an independent non-executive director of the company.”
Summary curriculum vitae of Merlyn Claude Mehl: Prof Mehl, aged 65, obtained a Ph.D. (Physics) from the University of Cape
Town (1985).
Prof Mehl is the executive chairman of Triple L Academy (Pty) Limited. He is widely known in education and development circles
in South Africa and internationally. He is recognised as a leader in his fi elds of expertise which include educational change and
development, especially in dealing with problems of poverty. His career includes having served as professor in physics at the
University of the Western Cape, chancellor of Peninsula Technicon and chief executive offi cer of the Independent Development
Trust. Prof Mehl serves on the boards of various companies.
He is the chairman of the risk and capital management committee and a member of the audit and directors’ affairs committees.
6. Ordinary resolution number 6
“Resolved that Mr JG Solms, who retires by rotation in terms of article 77.1 of the articles of association of the company and, being
eligible, offers himself for re-election, be re-elected as an independent non-executive director of the company.”
Summary curriculum vitae of Jan Georg Solms: Mr Solms, aged 52, obtained a BAcc from the University of Stellenbosch and
qualifi ed as a CA(SA) (1978).
Mr Solms has extensive experience in the fi nancial and securities environments and became a member of the JSE in 1981. Since
then he has been a partner/director of various stockbroking fi rms such as PLJ van Rensburg & Partners, Bosman & Co, Mechiel du
Toit, Solms & Co (which became Investec’s stockbroking division when it was sold to Investec Bank in 1995), Investec Securities and
both Independent Securities (Pty) Limited and Independent Securities Holdings (Pty) Limited, the latter two of which he is currently
an executive director.
Mr Solms is a member of the audit, remuneration and directors’ affairs committees.
7. Ordinary resolution number 7
“Resolved that the directors’ remuneration for the fi nancial year ending on 28 February 2009, including payment thereof in accordance
with the scale of remuneration as set out below, be authorised:
Chairman of the board* R 672 000
Board membership** R 84 000
Chairman of any board committee** R 84 000
Committee membership** R 28 000
Notes:
* The chairman of the board is paid a retainer as chairman of the board and receives no further payment for membership of
committees; and
** Non-executive directors receive a retainer fee per membership of the board and each of the board committees. No fee is paid in
respect of the directors’ affairs committee.”
8. Ordinary resolution number 8
“Resolved that Messrs PricewaterhouseCoopers Inc. be re-appointed as auditors of the company to hold offi ce until the conclusion
of the next annual general meeting of the company.”
9. Ordinary resolution number 9
“Resolved that the directors be authorised to determine the remuneration of the auditors.”

C a p i t e c B a n k H o l d i n g s L i m i t e d 1 0 5
10. Ordinary resolution number 10
“Resolved that the payment of a dividend of 75 cents per share, payable in cash on Tuesday, 17 June 2008 to the shareholders of
the company, recorded in the register on Friday, 13 June 2008, be and is hereby authorised. The last day to trade to be eligible to
receive a dividend will be Friday, 6 June 2008.”
11. Ordinary resolution number 11
“Resolved that 8 192 841 of the unissued ordinary shares in the authorised ordinary share capital of the company and all the
non-redeemable, non-cumulative, non-participating preference shares in the authorised but unissued preference share capital of
the company be placed under the control of the directors until the next annual general meeting of the company and that they be
hereby authorised to allot and issue any such shares as they may deem fi t, subject to the Companies Act, 1973 (Act 61 of 1973), as
amended, the articles of association of the company and the Listings Requirements of the JSE Limited.”
12. Ordinary resolution number 12
“Resolved that, subject to ordinary resolution number 11 being approved, the directors be hereby authorised as a general approval
to allot and issue ordinary shares, options or convertible securities that are convertible into an existing class of equity securities for
cash without restriction, as they may deem fi t, subject to the Companies Act, 1973 (Act 61 of 1973), as amended, the articles of
association of the company and the Listings Requirements of the JSE Limited (“JSE”), provided that:
• This general approval shall expire at the date of the company’s next annual general meeting in 2009 or 28 August 2009, whichever
is the earlier;
• Any such issue will only be securities of a class already in issue, or limited to such securities or rights that are convertible into a
class already in issue;
• The securities will be issued only to the public as defi ned in the Listings Requirements of the JSE and not to related parties;
• During the period permitted in terms of this general approval:
– the general issues of shares of a specifi c class in the aggregate will not exceed 10% of the company’s issued share capital in
that class at the date of the fi rst such issue;
– the securities of a particular class will be aggregated with the securities that are compulsorily convertible into securities of that
class, and, in the case of the issue of compulsorily convertible securities, aggregated with the securities of that class into which
they are compulsorily convertible;
– the number of securities which may be issued, shall be based on the number of securities of that class in issue, added to those
that may be issued in future at the date of such application;
(1) less any securities of the class issued or to be issued in future arising from options/convertible securities issued during the
current fi nancial year;
(2) plus any securities of that class to be issued pursuant to a rights issue (which has been announced, is irrevocable and
is fully underwritten), or acquisition (which has had fi nal terms announced) which may be included as though they were
securities in issue at the date of application;
• In determining the price at which an issue of shares may be made in terms of this authority, the maximum discount permitted
will be 10% of the weighted average traded price as determined over the 30 business days prior to the date that the price of
the issue is agreed between the company and the party subscribing for the securities. The JSE will be consulted for a ruling if
the company’s securities have not traded in such 30 business day period; and
• At least 75% of the shareholders present in person or by proxy at the annual general meeting cast their vote in favour of this
resolution.”

C a p i t e c B a n k H o l d i n g s L i m i t e d1 0 6
13. Special resolution number 1
“Resolved that the company be authorised as a general approval to repurchase any of the ordinary shares issued by the company
upon such terms and conditions and in such amounts as the directors may from time to time decide, but subject to the provisions of
sections 85 to 88 of the Companies Act, 1973 (Act 61 of 1973), as amended, the Listings Requirements of the JSE Limited (“JSE”)
and the articles of association of the company, provided always that:
• This general approval shall expire at the date of the company’s next annual general meeting in 2009 or 28 August 2009, whichever
is the earlier;
• The repurchase will only be effected through the order book operated by the JSE trading system and done without any prior
understanding or arrangement between the company and the counter party (reported trades are prohibited);
• An announcement must be published when the company has acquired, on a cumulative basis, 3% of the number of shares of
the relevant class it had in issue prior to the acquisition, pursuant to which the aforesaid 3% threshold is reached, containing full
details thereof as well as for each 3% in aggregate of the initial number of that class acquired thereafter;
• Aggregate repurchases under this general authority will not exceed 20% of the company’s issued share capital of that class in
any one fi nancial year as at the date this authority is granted;
• The company will not make the repurchases at a price more than 10% above the weighted average of the market value of the
securities of that class in issue for the fi ve business days immediately preceding the date on which the transaction is effected. The
JSE will be consulted for a ruling if the company’s securities have not traded in such fi ve business day period;
• The company will, at any point in time, appoint only one agent to effect any repurchase(s) on the company’s behalf;
• The company will only undertake a general repurchase of securities if, after such repurchase, at least 300 public shareholders as
defi ned in the Listings Requirements of the JSE continue to hold at least 20% of the company’s issued ordinary shares;
• The company will not repurchase its shares during any prohibited period as defi ned in paragraph 3.67 of the Listings Requirements
of the JSE unless a repurchase programme is in place in respect of which the dates and quantities of ordinary shares to be traded
during such period are fi xed and full details of such programme have been disclosed in an announcement over SENS prior to the
commencement of the prohibited period.”
14. Special resolution number 2
“Resolved that the company, insofar as it may be necessary to do so, hereby approves, as a general approval, and authorises the
acquisition by any subsidiary of the company of shares of any class issued by such subsidiary and/or by the company upon such
terms and conditions and in such amounts as the directors of such subsidiary/ies may from time to time decide, but subject to the
provisions of sections 85 to 89 of the Companies Act, 1973 (Act 61 of 1973), as amended, the articles of association of the company
and insofar as they may be applicable, the Banks Act, 1990 (Act 94 of 1990) and the Listings Requirements of the JSE Limited
(“JSE”), provided always that:
• This general approval shall expire at the date of the company’s next annual general meeting in 2009 or 28 August 2009, whichever
is the earlier;
• A repurchase of securities in the company will only be effected through the order book operated by the JSE trading system
and done without any prior understanding or arrangement between the company and the counter party (reported trades are
prohibited);
• An announcement must be published when the subsidiary has acquired on a cumulative basis, 3% of the number of shares of that
class which the company had in issue prior to the acquisition, pursuant to which the aforesaid 3% threshold is reached, containing
full details thereof as well as for each 3% in aggregate of the initial number of that class acquired thereafter;
• Acquisitions by any company of its own securities under this general authority may not exceed 20% in the aggregate of the
acquiree company’s issued share capital of that class in any one fi nancial year as at the date this authority is granted and in the
case of the subsidiary acquiring shares in the company limited to an aggregate of 10% of the company’s issued capital of that
class as at the date this authority is granted;

C a p i t e c B a n k H o l d i n g s L i m i t e d 1 0 7
• The subsidiaries will not acquire securities in the company at a price more than 10% above the weighted average of the market
value of securities of that class for the fi ve business days immediately preceding the date of acquisition. To the extent applicable,
the JSE will be consulted for a ruling if the company’s securities have not traded in such fi ve business day period;
• The subsidiaries will, at any point in time, appoint only one agent to effect any purchase(s) of the company’s securities if
applicable;
• The subsidiaries will only undertake an acquisition of the company’s securities if, after such acquisition at least 300 public
shareholders as defi ned in the Listings Requirements of the JSE continue to hold at least 20% of the company’s issued ordinary
shares;
• The subsidiaries will not purchase any shares in the company during any prohibited period as defi ned in paragraph 3.67 of
the Listings Requirements of the JSE unless a repurchase programme is in place in respect of which the dates and quantities
of ordinary shares to be traded during such period are fi xed and full details of such programme have been disclosed in an
announcement on SENS prior to the commencement of the prohibited period.”
15. Other business
To transact such other business as may be transacted at an annual general meeting.
EXPLANATORY NOTES
The reasons for and effect of the two special resolutions set out above are:
Special resolution number 1 – General authority to purchase own shares
The reason for this special resolution is that the company seeks a general authority to repurchase its shares in the market subject
to specifi c statutory requirements. The directors have no present intention of making any purchases under this authority but believe
that the company should retain the fl exibility to take action if future purchases could be considered desirable and in the best interest
of shareholders.
In terms of the Listings Requirements of the JSE Limited (“JSE”) any general repurchase by the company must, inter alia, be
limited to a maximum of 20% of the company’s issued share capital of that class in any one fi nancial year at the time the authority
is granted.
The directors intend to use this authorisation only to repurchase if there is in their opinion no doubt that, after such repurchase:
• The company and the Group will each be able to repay its debt as it becomes due in the ordinary course of business for a period
of twelve months from the date of this annual general meeting;
• The assets of the company and the Group, valued in terms of Generally Accepted Accounting Practice, will respectively exceed
the liabilities of the company and the Group for a period of twelve months from the date of this annual general meeting; and
• The share capital and reserves and working capital of the company and the group will be adequate for ordinary business purposes
for a period of twelve months from the date of this annual general meeting.
General information in respect of directors (page 16), major shareholders (page 100), directors’ interests in securities (page 53 and 55),
material changes (page 56) and the share capital of the company (page 80) is contained in the annual report to which this notice is
attached.
The directors, whose names are given on page 16 of the annual report, are not aware of any legal or arbitration proceedings,
including proceedings that are pending or threatened, that may have or have had in the recent past, being at least the previous
twelve months, a material effect on the fi nancial position of Capitec.
The directors, whose names are given on page 16 of the annual report, collectively and individually accept full responsibility for the
accuracy of the information given and certify that to the best of their knowledge and belief there are no facts that have been omitted
which would make any statement false or misleading, and that all reasonable enquiries to ascertain such facts have been made and
that this resolution contains all information required by the JSE Listings Requirements.

C a p i t e c B a n k H o l d i n g s L i m i t e d1 0 8
The effect of this special resolution, if approved, is to grant a general authority to the directors of the company to repurchase its
shares in the market subject to the provisions of the Companies Act, 1973 (Act 61 of 1973), as amended, the articles of association
of the company and the Listings Requirements of the JSE, where applicable.
Special resolution number 2 – General authority to subsidiaries to acquire shares
The reason for this special resolution is that the company seeks a general authority to empower directors of subsidiaries to resolve
that the said subsidiaries acquire shares issued by such subsidiaries and/or by the company in terms of the Companies Act 1973
(Act 61 of 1973) (“the Act”), their respective articles of association and, where applicable, the Banks Act, 1990 (Act 94 of 1990) (“the
Banks Act”) and the Listings Requirements of the JSE Limited (“JSE”).
The directors have no present intention of making any acquisition under this authority but believe that its subsidiaries should retain
the fl exibility to take action if future acquisitions could be considered desirable and in the best interests of shareholders. One such
eventuality could be the acquisition of shares in the company for delivery in terms of the Capitec Bank Holdings Share Trust (“the
share incentive scheme”), the terms of which have been approved by shareholders at a general meeting held on 7 February 2002.
In terms of the Act, subsidiaries may acquire shares in the company to a maximum of 10% in the aggregate of the number of issued
shares of the company. In terms of the Listings Requirements of the JSE any general acquisition by a company of its listed shares
must, inter alia, be limited to a maximum of 20% of that class of the issued share capital of the acquiree company in any one fi nancial
year at the time the authority is granted.
The authorisation to subsidiaries to acquire their own shares or shares in the company will only be exercised by the directors of the
subsidiaries if, at the discretion of the board of the company, circumstances should merit and if there is in their opinion no doubt that,
after such acquisition:
• The company, relevant subsidiaries and group will each be able to repay its debts as it becomes due in the ordinary course of
business for a period of twelve months from the date of this annual general meeting;
• The assets of the company, relevant subsidiaries and the Group valued in terms of Generally Accepted Accounting Practice, will
respectively be in excess of the liabilities of the company, relevant subsidiaries and the group for a period of twelve months from
the date of this annual general meeting; and
• The share capital, reserves and working capital of the company, relevant subsidiaries and the group will be suffi cient to meet the
respective needs of the company, relevant subsidiaries and the group for a period of twelve months from the date of this annual
general meeting.
General information in respect of directors (page 16), major shareholders (page 100), directors’ interests in securities (page 53 and 55),
material changes (page 56) and the share capital of the company (page 80) is contained in the annual report to which this notice is
attached.
The directors, whose names are given on page 16 of the annual report are not aware of any legal or arbitration proceedings,
including proceedings that are pending or threatened, that may have or have had in the recent past, being at least the previous
twelve months, a material effect on the fi nancial position of Capitec.
The directors, whose names are given on page 16 of the annual report, collectively and individually accept full responsibility for the
accuracy of the information given and certify that to the best of their knowledge and belief there are no facts that have been omitted
which would make any statement false or misl eading, and that all reasonable enquiries to ascertain such facts have been made and
that this resolution contains all information required by the Listings Requirements of the JSE.
The effect of this special resolution, if approved, is to grant a general authority to the directors of the company’s subsidiaries to
acquire shares issued by such subsidiaries and/or by the company, subject to the provisions of the Act, the articles of association of
the subsidiaries and the company and where applicable, the Banks Act and the Listings Requirements of the JSE.
Special resolution numbers 1 and 2 are renewals of resolutions approved at the previous annual general meeting held on 30 May 2007.
C a p i t e c B a n k H o l d i n g s L i m i t e d 1 0 9
VOTING
Shareholders entitled to attend and vote at the annual general meeting may appoint one or more proxies to attend, speak and vote
thereat in their stead. A proxy need not be a member of the company. A form of proxy, in which are set out the relevant instructions
for its completion, is enclosed for use by a certifi cated or dematerialised shareholder with own name registration who wishes to be
represented at the annual general meeting. Completion of a form of proxy will not preclude such shareholder from attending and
voting (in preference to that shareholder’s proxy) at the annual general meeting.
Proxy forms must be delivered at or posted to Computershare Investor Services (Pty) Limited, 70 Marshall Street, Johannesburg,
2001 (PO Box 61051, Marshalltown, 2107) to be received by no later than 12:00 on Monday, 26 May 2008.
Shareholders present in person, by proxy or by authorised representative (“delegates”) shall, on a show of hands, have one vote
each and on a poll, will have one vote in respect of each share held. It is intended that voting will be conducted electronically by poll.
Upon arrival, delegates are registered, linked to their respective profi les on the share register and given an electronic keypad with
which to cast their respective votes. Upon voting, a message is displayed on the keypad screen, confi rming that the vote has been
registered. Results are displayed on an overhead screen.
Benefi cial owners who have dematerialised their shares through a Central Securities Depository Participant (“CSDP”) or stockbroker,
other than those whose shares are registered in their in own name, must provide the CSDP or stockbroker with their voting instruction.
Benefi cial owners must verify with the relevant CSDP or stockbroker the cut-off time to lodge such voting instruction. Alternatively,
they must request the CSDP or stockbroker to provide them with a letter of representation should they wish to attend the meeting in
person in terms of the custody agreement entered into between the benefi cial owner and the CSDP or stockbroker.
By order of the board
C G van Schalkwyk
Company Secretary
6 May 2008

C a p i t e c B a n k H o l d i n g s L i m i t e d11 0
FORM OF PROXY
Capitec Bank Holdings Limited (Incorporated in the Republic of South Africa)
(Registration number 1999/025903/06) (“Capitec” or “the Company”)
(JSE share code: CPI ISIN: ZAE000035861)
For use of shareholders who are:
(1) registered as such and who have not dematerialised their Capitec ordinary shares; or
(2) hold dematerialised Capitec ordinary shares in their own name,
at the annual general meeting of shareholders of the company to be held in the Granvin Room, L’Avenir Estate, R44 Klapmuts Road, Stellenbosch, on
Wednesday, 28 May 2008 at 12:00.
Benefi cial owners who have dematerialised their shares through a CSDP or stockbroker, other than those in “own name” must provide the CSDP or
stockbroker with their voting instruction. Alternatively, they must request the CSDP or stockbroker to provide them with a letter of representation should they
wish to attend the meeting in person in terms of the custody agreement entered into between the benefi cial owner and the CSDP or stockbroker.
I/We (Full names in BLOCK LETTERS please)
of (address)
being the registered holder(s) of ordinary shares hereby appoint:
1. of or failing him/her,
2. of or failing him/her,
3. the chairman of the meeting, as my proxy to vote on my/our behalf at the annual general meeting to be held on 28 May 2008 and at each adjournment
thereof for purposes of considering and, if deemed fi t, passing, with or without modifi cation, the ordinary and special resolutions to be proposed thereat and
to vote for and/or against the resolutions and/or abstain from voting in respect of the ordinary shares registered in my/our name/s in accordance with the
following instructions (see notes on the opposite page):
Ordinary resolutions
1. Approve the annual fi nancial statements
2. Re-elect Mr KA Hedderwick as a director
3. Re-elect Mr PJ Mouton as a director
4. Re-elect Mr JP van der Merwe as a director
5. Re-elect Prof MC Mehl as a director
6. Re-elect Mr JG Solms as a director
7. Approve the directors’ remuneration for the fi nancial year ending on 28 February 2009 including payment thereof
8. Re-appoint the auditors
9. Authorise the directors to determine the auditors’ remuneration
10. Authorise payment of a cash dividend of 75 cents per share
11. Approval to place 8 192 841 of the unissued ordinary shares in the authorised ordinary share capital of the company and all the non-redeemable, non-cumulative, non-participating preference shares in the authorised but unissued preference share capital of the company under the control of the directors
12. General approval to allot and issue ordinary shares for cash
Special resolutions
13. General approval to the company to repurchase shares issued by the company
14. General approval to any subsidiary of the company to acquire shares issued by such subsidiary and/or by the company
(Indicate instruction to proxy by way of a cross in the space provided above)
Signed at on this day of 2008.
Signature(s)
Assisted by (where applicable) (state capacity and full name)
Each Capitec shareholder is entitled to appoint one or more proxy(ies) (who need not be a shareholder(s) of the company) to attend, speak and vote in his/
her stead at the annual general meeting.
In favour of Against Abstain
Number of shares

C a p i t e c B a n k H o l d i n g s L i m i t e d 111
NOTES TO FORM OF PROXY
1 A Capitec shareholder may insert the name of a proxy or the names of two alternative proxies of the shareholder’s choice in the space(s)
provided, with or without deleting the chairman of the annual general meeting. The person whose name appears fi rst on the form of proxy
and who is present at the annual general meeting will be entitled to act as proxy to the exclusion of those whose names follow.
2. A Capitec shareholder’s instructions to the proxy must be indicated clearly by the insertion of the relevant number of ordinary shares to be
voted on behalf of that member in the appropriate box provided. Failure to comply with the above will be deemed to authorise the chairman
of the annual general meeting, if he/she is the authorised proxy, to vote in favour of the resolutions at the annual general meeting, or
any other proxy to vote or to abstain from voting at the annual general meeting as he/she deems fi t, in respect of all the ordinary shares
concerned. A shareholder or his/her proxy is not obliged to use all the votes exercisable by the shareholder or his/her proxy, but the total of
the votes cast and in respect whereof abstentions are recorded may not exceed the total of the votes exercisable by the shareholder or his/
her proxy.
3. When there are joint registered holders of any shares, any one of such persons may vote at the meeting in respect of such shares as if
he/she is solely entitled thereto, but, should more than one of such joint holders be present or represented at any meeting, that one of
the said persons whose name stands fi rst in the register in respect of such shares or his/her proxy, as the case may be, shall alone be
entitled to vote in respect thereof. Several executors or administrators of a deceased member, in whose name any shares stand, shall
be deemed joint holder thereof.
4. Every member present in person or by proxy shall, on a poll, have one vote for every ordinary share held, whereas on a show of hands,
members present in person, by proxy or by authorised representative shall have one vote each. It is intended that voting at the annual
general meeting will be conducted by poll, electronically.
5. Forms of proxy must be completed and returned to be received by the transfer secretaries of the company, Computershare Investor
Services (Pty) Limited, 70 Marshall Street, Johannesburg, 2001 (PO Box 61051, Marshalltown, 2107), by no later than 12:00 on Monday,
26 May 2008.
6. Any alteration or correction made to this form of proxy must be signed in full by the signatory/ies and not initialled.
7. Documentary evidence establishing the authority of a person signing this form of proxy in a representative capacity must be attached to
this form of proxy unless previously recorded by the company’s secretaries or waived by the chairman of the annual general meeting.
8. The completion and lodging of this form of proxy will not preclude the relevant shareholder from attending the annual general meeting and
speaking and voting in person thereat to the exclusion of any proxy appointed in terms hereof, should such shareholder wish to do so.
9. The chairman of the annual general meeting may reject or, provided that he is satisfi ed as to the manner in which a member wishes
to vote, accept any form of proxy which is completed other than in accordance with these instructions. Benefi cial owners who have
dematerialised their shares through a CSDP or stockbroker, other than those in own name must provide the CSDP or stockbroker with their
voting instruction. Benefi cial owners must verify with the relevant CSDP or stockbroker the cut-off time to lodge such voting instruction.
Alternatively, they must request the CSDP or stockbroker to provide them with a letter of representation should they wish to attend the
meeting in person in terms of the custody agreement entered into between the benefi cial owner and the CSDP or stockbroker.
C a p i t e c B a n k H o l d i n g s L i m i t e d11 2 e dC a p i t e c B a n k H o l d i n g s L i m i t e11 2
Administration and Addresses
Financial year end
Profi t announcement
Annual report
Annual general meeting
Interim report
Last date to trade to be considered
for the dividend payment
Record date in respect of the
dividend payment
Payment date
Share certifi cates may not be
dematerialised or rematerialised,
both days inclusive
JSE Code:
ISIN:
29 February 2008
2 April 2008
May 2008
28 May 2008
September 2008
Ordinary Dividend
Friday, 6 June 2008
Friday, 13 June 2008
Tuesday, 17 June 2008
9 to 13 June 2008
CPI
ZAE 00 0035861
Shareholders’ Calendar
1999/025903/06
PricewaterhouseCoopers Inc
AP du Plessis
KA Hedderwick (appointed 10 December 2007)
MS du P le Roux (chairman)
TD Mahloele (appointed 1 April 2007)
MC Mehl (Prof)
NS Mjoli-Mncube (Ms)
JF Mouton (resigned 4 October 2007)
PJ Mouton (appointed 5 October 2007)
CA Otto
JG Solms
R Stassen
JP van der Merwe (appointed 27 September 2007)
J van Zyl Smit (dr) (resigned 26 September 2007)
CG van Schalkwyk
10 Quantum Street
Techno Park
Stellenbosch
7600
PO Box 12451
Die Boord
Stellenbosch
7613
www.capitecbank.co.za
Registration
number
Auditors
Directors
Secretary
Registered
address
Postal
address
Website
Capitec Bank Holdings Limited

Free State
Northern Cape
KwaZulu-Natal
Key Performance Indicators
Change08/07
-NatalKwaZulu-N5533Free State
Northhern Cape
National Network
331 BranchesLimpopo
Mpumalanga
33666666
2233Gauteng
79
1199North West
46Western Cape
Eastern Cape
In six years Capitec Bank’s low-cost banking model
has attracted 1.4 million clients, through 331 branches,
and created over 2 800 job opportunities.
Company Structure
Board and senior management excluding
black directors23.31% Various
shareholders 25.8%PSG
Group 34.9% sBEE 15.99%
Capitec Bank Holdings Limited 1999/025903/06(Listed and registered as a bank controlling company)
100% Capitec Bank
Limited1980/003695/06
75% Key Distributors
(Pty) Ltd
100% Other
Subsidiaries2001/000964/07 No activity
Capitec BankGroup Employee
Empowerment TrustIT 4069 /2007
Capitec Bank Holdings Share
TrustIT 3044 /2000 Share
Incentive Trust
C a p i t e c B a n k H o l d i n g s L i m i t e d1
2008 2007 2006 2005 Operations
Profi tability
Income from operations Rm 1 095 857 28% 672 491
Operating expenses Rm (771) (614) 26% (506) (392)
Tax Rm (95) (76) 25% (51) (32)
Preference dividend Rm (17) (8) 123% - -
Earnings attributable to ordinary
shareholders
• Basic Rm 212 159 33% 115 67
• Headline Rm 212 160 32% 116 70
Cost-to-income ratio – banking activities % 58 60 (3%) 66 74
Return on ordinary shareholders’ equity % 22 26 (17%) 23 16
Earnings per share
• Attributable Cents 258.8 220.9 17% 163.4 97.9
• Headline Cents 259.0 222.4 16% 165.0 100.9
• Diluted attributable Cents 250.3 209.5 20% 154.7 91.7
• Diluted headline Cents 250.5 210.9 19% 156.2 94.5
Dividends per share
• Interim Cents 25.0 20.0 25% - -
• Proposed fi nal Cents 75.0 60.0 25% 45.0 30.0
Dividend cover x 2.6 2.8 (7%) 3.7 3.4
AssetsTotal assets Rm 2 936 2 191 34% 1 251 805
Net loans and advances Rm 2 019 803 151% 455 208
Cash and cash equivalents Rm 618 1 044 (41%) 582 363
Investments Rm 14 112 (87%) 7 17
Other Rm 285 232 23% 207 217
LiabilitiesTotal liabilities Rm 1 719 1 074 60% 687 332
Deposits Rm 1 528 897 71% 595 281
Other Rm 191 177 7% 92 51
EquityShareholders’ funds Rm 1 217 1 117 9% 564 473
Capital adequacy ratio % 36 79 (54%) 56 84
Net asset value per ordinary share Cents 1 297 1 175 10% 784 672
Share price Cents 3 900 3 700 5% 3 105 1 490
Market capitalisation Rm 3 195 3 031 5% 2 233 1 072
Share options
• Number outstanding ’000 5 159 6 191 (17%) 5 841 6 753
• Average strike price Cents 1 815 1 151 58% 648 271
• Average time to maturity Months 24 24 – 28 25
• Charge on settlement Rm 48 22 118% 31 16
OperationsBranches 331 280 18% 253 251
Employees 2 800 2 129 32% 1 901 1 708
Active clients ’000 1 371 1 010 36% 706 513
Own ATMs 328 264 24% 210 180
Partnership ATMs 437 143 206% - -
Mobile banking units 86 53 62% - -
Capital expenditure Rm 117 86 36% 72 84
SalesLoans
• Value of loans advanced Rm 5 162 3 449 50% 2 863 2 259
• Number of loans advanced ’000 3 155 2 924 8% 2 650 2 486
• Average loan amount R 1 636 1 180 39% 1 080 909
• Loan revenue Rm 1 284 1 001 28% 768 534
• Net loan impairment expense Rm 231 161 43% 96 39
• Net impairment to repayments % 5.10 4.12 24% 2.85 1.45
Deposits
• Value of savings deposits Rm 842 554 52% 314 74
• Number of savings clients ’000 783 583 34% 375 143
• Net transaction fee Income Rm 79 35 128% 15 4

Highlights
Contents
1 Key Performance Indicators
and Company Structure
2 The Market
6 Letter to Shareholders
10 Chief Financial Officer’s Report
16 Directorate and Executive
18 Management Committee
20 Corporate Governance
and Risk Management Review
35 Annexure A
Attendance of Meetings by Directors
36 Annexure B
Composition of Board and Board Committees
38 Sustainability Review
49 Annual Financial Statements 2008
101 Statutory Information
102 Special Resolutions of Subsidiaries
103 Notice of Annual General Meeting
110 Form of Proxy
111 Notes to the Form of Proxy
112 Shareholders’ Calendar
112 Administration and Addresses
Headline earnings 32%
Final dividend per share 75 cents
Return on equity 22%
Clients 1.37 million
Shareholders’ funds R1.2 billion
70
R’m
116
0706
05
160
08
212
He
ad
line
ea
rnin
gs
513
‘000
706
1010
1371
Act
ive
clie
nts
0807
0605
Re
turn
on
eq
uity
16
%
23
26
22
0807
0605
C a p i t e c B a n k H o l d i n g s L i m i t e d
Annual Report 2008