Embed Size (px)
Citation preview

AnnualReport
2007

PB 1
annualreport
2007
AnnualReport
2007

Who we are and what we do
We are the leading Croatian financial services Group engaged in retail and corporate banking, credit cards, inves-tment banking, asset management, private banking, leasing and real estate activities and investment management services. We operate in entire area of Croatia and employ over 4.2 thousand people.Our mission is to make a permanent and effective use of all resources at our disposal to continuously improve all aspects of our business activities, including human resources, the tech-nology and the business processes.Our vision is to be the model company and the center of excellence in crea-ting new values, as well as in provi-ding high-quality service in all of our activities to the benefit of our clients, the community, our stakeholders and employees.
1,563 thousand TOTAL CUSTOMERS
HRK 6.3 billionASSETS UNDER MANAGEMENT
227TOTAL BRANCHES
624 thousandCURRENT ACCOUNTS
HRK 63.4 billionTOTAL CUSTOMER FUNDS*
285 thousandINTERNET BANKING USERS
Comprises customers deposits, assets under management and in custody
*

IntroductionFive year summary and financial highlightsReport from the President of the Supervisory BoardReport from the President of the Management BoardReview of the international and Croatian economy in 2007Financial and operating highlightsOrganisational chartBusiness description of the BankThe GroupReview of activities in PBZ’s Social Responsibility ProgramCorporate governanceStatement of responsibilities of the Management BoardIndependent Auditor’s reportFinancial statements for the Bank and the GroupAccounting policiesNotes to the Bank and the Group financial statementsSupplementary financial statements in EUR (unaudited)
45
6
7
9
15
1718
2529
3233
3538
4452
103
Table of contents
540ATM MACHINES
HRK 8.4 billionTOTAL HOUSING LOANS
19,384EFT POS
HRK 40.1 billionTOTAL CUSTOMER LOANS
2,026 thousandTOTAL CARDS ISSUED
77 DAY AND NIGHT VAULTS

The Management Board of Privredna banka Zagreb d.d. has the pleasure of presenting its Annual report to the shareholders of the Bank. This com-prises summary financial information, management reviews, the audited fi-nancial statements and accompanying audit report, and unaudited supple-mentary statements in EUR. Audited
financial statements are presented for the Bank and the Group.
Croatian and English versionThis document comprises the Annual Report of Privredna banka Zagreb d.d. for the year ended 31 December 2007 expressed in English. This report is also published in Croatian for presen-tation to shareholders at the Annual General Meeting.
Introduction
Legal statusThe Annual Report includes the annual financial statements prepared in accordance with International Financial Reporting Standards and audited in accordance with International Standar-ds on Auditing.The Annual Report is prepared in accordance with the provisions of the
Companies Act and the Accounting Law, which require the Management Board to report to shareholders of the company at the Annual General Meeting.
AbbreviationsIn this Annual Report, Privredna banka Zagreb d.d. is referred to as “the Bank” or “PBZ” or as “Privredna banka Zagreb”, and Privredna banka Zagreb d.d., together with its subsidiary undertakings are referred to collecti-vely as “the Group” or “the Privredna banka Zagreb Group”.The central bank, the Croatian Natio-nal Bank, is referred to as “the CNB”.
The European Bank for Reconstructi-on and Development is referred to as “EBRD”.In this report, the abbreviations “HRK thousand”, “HRK million”, “USD thousand”, “USD million” and “EUR thousand” or “EUR million” represent thousands and millions of Croatian ku-nas, US dollars and Euros respectively.
Exchange ratesThe following mid exchange rates set by the CNB ruling on 31 December 2007 have been used to translate ba-lances in foreign currency on that date:
CHF 1 = HRK 4.412464USD 1 = HRK 4.985456EUR 1 = HRK 7.325131

4 5
annualreport
2007
Five year summary and financial highlights(in HRK million)
Group 2007 2006 2005 2004 2003
Income statement and balance sheet
Total gross revenue 5,350 4,519 3,936 3,768 3,564
Net interest income 1,918 1,714 1,583 1,517 1,492
Net operating income 3,405 3,039 2,688 2,570 2,424
Net profit for the year 1,141 963 814 735 695
Total assets 67,550 61,974 51,810 43,799 42,441
Loans and advances to customers 40,147 36,910 28,640 24,025 23,387
Due to customers 41,918 36,843 32,391 29,917 27,497
Shareholders’ equity 8,503 7,625 4,820 4,286 3,790
Other data (as per management accounts)
Return on average equity 15.45% 18.79% 21.22% 21.83% 26.85%
Return on average assets 1.73% 1.72% 1.73% 1.72% 1.77%
Assets per employee 15.3 14.8 12.4 11.1 11.3
Cost income ratio 50.51% 50.96% 53.47% 54.17% 53.96%
Bank 2007 2006 2005 2004 2003
Income statement and balance sheet
Total gross revenue 4,263 3,652 3,341 3,138 2,777
Net interest income 1,697 1,535 1,425 1,354 1,268
Net operating income 2,474 2,270 2,149 2,008 1,767
Net profit for the year 932 847 750 678 575
Total assets 61,974 55,906 48,553 40,655 37,505
Loans and advances to customers 36,436 33,572 26,687 21,858 20,377
Due to customers 38,694 33,491 30,004 27,405 23,791
Shareholders’ equity 7,847 7,114 4,433 3,915 3,355
Other data (as per management accounts)
Return on average equity 13.35% 17.28% 20.00% 21.84% 20.16%
Return on average assets 1.56% 1.66% 1.72% 1.74% 1.66%
Assets per employee 17.1 16.2 13.7 12.6 13.1
Cost income ratio 48.90% 48.79% 51.36% 50.59% 51.00%
4 5
annualreport
2007

income ratio, a key measure of our ef-ficiency, again decreased and reached 50.5 percent, while the ROAE reached 15.5 percent. These are satisfactory figures since they represent a consi-stently strong performance over the last five years.In 2007, PBZ Group has further reinfor-ced its position as one of Croatia’s foremost banks in terms of produc-tivity, returns and value creation for its shareholders. We are the second largest group in the country with strong customer base of almost 1.6 million, with over 624 thousand current accounts and 227 branches.Looking ahead, the top strategic objective of PBZ Group is to stren-gthen its market position and further improve its internal efficiency in order to continue to perform successfully. We have to succeed in a tough and highly competitive environment by meeting demands of our customers at the highest possible level and thus increasing their satisfaction.The management of Privredna banka Zagreb enjoys full confidence of the shareholders. On behalf of the Supervisory Board, I would like to thank them for their strong leaders-hip and outstanding performance. I would also like to express my gratitude and appreciation to all employees of the Group for their commitment and valued contribution. Finally, I want to express my great appreciation of the work of my colleagues on the Super-visory Board, as well as of the Audit Committee members, for their wise counsel and contribution.
Respectfully,
Dr. György Surányi12 February 2008
On behalf of the Supervisory Board of Privredna banka Zagreb, it is my honour to present the business results of the Bank and the Group for 2007. It was a very good year for Privredna banka Zagreb and its Group in terms of profitability, excellent products and services as well as market diversificati-on. This performance is the consequ-ence of having a well-grounded and robust strategy, and executing it well. This strategy has been appropriately aligned with our parent bank Intesa Sanpaolo and our strategic partner the European Bank for Reconstruction and Development. Intesa Sanpaolo’s selective diversification by geograp-hy, by financial product as well as by customer segment helped it improve financial performance, manage risk soundly and create opportunities for synergy. Its presence in Croatia is proof of well-planned strategy and the results of Privredna banka Zagreb are sign of excellent implementation of that strategy.In 2007, Croatian economy continued to record dynamic growth. The actual growth rate for the first semester of 2007 was 6.8 percent, whereas overall annual growth estimate stands at approximately 6 percent. This is higher than 4.5 percent average growth rate
Report from the President of the Supervisory Board
for the period from 2000 to 2006. The main contribution to overall GDP growth was from domestic demand and gross investments. However, Croatia was one of a long list of other European countries that experienced higher inflation. The average annual inflation rate for 2007 reached 2.9 percent vs. 2 percent in 2006. As a result of global inflationary pressures it is expected that an average inflation rate in Croatia will be somewhat more pronounced in 2008.Croatia has made several key steps forward in negotiations for the Euro-pean Union membership although a great deal of work still lies ahead. Tough challenges are still to be surpa-ssed, especially in structural reforms and fiscal consolidation. However, positive political and macroeconomic environment created in 2004, when Croatia was given candidate status for accession to the EU, has not va-nished. On contrary, it is expected that accession to the Union may take place in 2010 or 2011, whilst Croatia could enter the euro area in 2012 or 2013.Under these conditions, monetary policy remained restrictive in 2007. As marginal reserve requirement was kept at 55 percent and with no changes to the obligatory reserve requirement, the Croatian National Bank significantly tightened permissible credit growth measure (permitted growth rate of credit related portfolio without extra purchase of obligatory bills). This has affected banks in various ways. It imposed mandatory limits on growth, put significant pressure on internal efficiencies and narrowed decision-making possibilities.Notwithstanding such a difficult environment, PBZ Group managed to achieve excellent results for 2007. Our performance was supported by three strong pillars: our business portfolio, our countrywide presence and the talent and skills of our management and employees. We again succeeded in meeting our goals and increasing the value of our shareholders. Total gross revenue for PBZ Group exceeded HRK 5.3 billion. Consolida-ted net operating income amounted to HRK 3.4 billion whilst a net profit recorded HRK 1.1 billion. Our cost/

6 7
annualreport
2007
Report from the President of the Management Board
Dear Shareholders,It is a great honour and pleasure for me to present to you, on behalf of the Management Board of Privredna banka Zagreb, the financial results of the Privredna banka Zagreb Group for 2007.Our performance in 2007 can be best described as very successful in a dif-ficult and challenging environment. A great portfolio of assets and excellent managers and employees executing a consistent strategy remained our core strength. Our goals and aspirations have always been challenging and consistent which makes us proud of the overall results achieved throughout our areas of business.
Financial results and capital management2007 was another successful year for PBZ Group. A quick look at what was achieved over the last year shows that operating income improved by HRK 366 million or 12 percent. The net attri-butable profit rose by 18.5 percent to HRK 1,141 million. Higher revenue was achieved in all aspects of our operati-ons, especially in commission and fees from card and payment activities.Net interest income grew 11.9 percent whilst commission and fees increa-
level of 285 thousand users.With a base of more than 1.6 million clients, both corporate and private, the PBZ Group is today a modern, universal-type banking group whose market share, measured by the size of the balance sheet, stands at 18.5 percent whereas in retail banking that share reached almost 21 per-cent. PBZ Group holds the leading position on the credit and debit card market with market share of 33.2 percent. Moreover, total indirect deposits, i.e. funds under management of PBZ Invest (investment funds) and PBZ Croatia osiguranje (pension fund) as well as funds and securities received in custody on behalf of third parties, collectively surpassed HRK 21.5 billion, which is an increase of 35 percent compared to 2006 and 239 percent compared to 2005.Privredna banka Zagreb retained a prominent role on the capital market and in investment banking. PBZ is today the leading underwriter and arranger of debt securities in Cro-atia. In the past 5 years there were close to 100 tranches of commercial bills with total value exceeding HRK 3.5 billion. PBZ arranged approxi-mately 84 percent of total turnover. In 2007 alone, PBZ arranged 20 tranches of commercial bills with total value of debt reaching HRK 774 million or 71 percent of total transactions. We can claim to be the most trusted financial institution on the capital market of corporate entities, government agencies and municipalities.
Corporate and social responsibilityWe at PBZ Group care about corporate and social responsibility. We care about the needs of the local community we operate in. We continued to make substantial progress in pursuit of our objective of ensuring that PBZ Group is one of the leading entities in the field of corporate responsibility. For number of years we have been developing a social responsibility programme named PBZ Prijatelj (PBZ Friend). We have been actively involved in
sed by 23.9 percent to HRK 1,064 million. Net non-interest income of the Group reached 43.7 percent of total operating income, slightly higher than 43.6 percent in 2006. All performance indicators show excellent achievements and pro-vide evidence of improvements in profitability and productivity. The return on average equity at the level of the Group was 15.5 percent. The consolidated return on average assets reached the very respectable level of 1.73 percent. Earnings per share, the most evident reflection of the value we create for our share-holders, increased by 5.5 percent, amounting to HRK 60 per share. At the same time, we managed our costs carefully and, as a result, the cost to income ratio, on a consolida-ted basis, decreased to 50.5 percent in 2007.The balance sheet of the PBZ Group increased by 9 percent and surpa-ssed the amount of HRK 67.5 billion. The loan portfolio grew 8.8 percent due to very restrictive monetary mea-sures effective in the past year. Sha-reholders’ equity increased by 11.9 percent to HRK 8.5 billion. Economic Value Added ( EVA®), which is value generated in excess of capital costs rose from HRK 524 million in 2006 to HRK 602 million in 2007.
Qualitative results and market shareI am pleased to report that we see encouraging trends in electronic channels of distribution in Croatia, in which PBZ Group maintains the leading role. From the total number of all transactions in the Group, 77.5 percent were carried out electroni-cally through Internet banking, ATM machines, EFT POS devices and cell phones (mPay product). Also, I am proud to report that in 2007 we la-unched the very first trading platform in the country developed for retail and corporate investors interested in Croatian equity market. This product surpassed our expectations in terms of popularity among our clients. On a similar note, the number of Internet banking users increased in 2007 alone by 85 thousand to the current

the Supervisory Board of the Bank for their most valuable cooperation and business advice.
Božo Prka, M.S.President of the Management Board 12 February 2008
many social-awareness projects thro-ugh financial support of a number of humanitarian and social institutions. We have supported programmes in education and sports as well as nu-merous cultural institutions. In 2007, we donated over HRK 5.8 million and took on sponsorships amounting to HRK 15 million.In terms of environmental manage-ment, in 2007 PBZ started with the experimental stage of monitoring electric and thermal energy con-sumption, paper and clean water consumption as well as waste gene-ration. This was useful in highlighting any wastage in the system and providing data to estimate energy optimisation that may be needed in the future. We, therefore, intend to increase awareness of global warming issues and the necessity of implementing European Union energy policies regarding climate change in our society. Needless to say that much of our success has been achieved by sound investment in our employees and managers. With specific programmes put in place focused on enhancing work force capabilities we mana-ged to improve the overall picture significantly. Namely, the proportion of employees with a university degree increased from 27 percent several ye-ars ago, to 39 percent, whilst the ave-rage age of all employees decreased from 41.3 years to 38.9 years. More than 74 percent are women. PBZ is among the top desired employers as indicated in number of independent surveys in Croatia. In fact, in the survey conducted by the job seeking portal MojPosao.net, PBZ is the most desirable bank employer among the population looking for a first job. Last year I mentioned the launch of PBZ Corporate Academy, a progra-mme designed for lower, middle and senior management of the Bank. I am happy to announce that this project has grown in terms of importance and number of participants. Currently, 412 managers and employees of the Bank attend PBZ Corporate Acade-my compared to 240 in 2006. We feel that this programme is our best investment for the future.
Business environment and look into the futureInternationally, second half of 2007 was characterized by financial distress and a slowdown in the world growth with rising inflation. During 2007 Cro-atia experienced above average GDP dynamics (domestic demand driven), especially in the first half of the year. However, 2007 was a challenging year for banks. This is true especially for its second part due to changes in monetary regulation, constant unfol-ding of new global disturbances on the financial markets (with repricing of risks and costs of funds going up) and increase in domestic inflation. Macroeconomic fundamentals of the Croatian economy are sound, with external imbalances under control, but the balance of risks is changing. For 2008 in Croatia we expect a slowdown in GDP growth toward long term sustainable rates, fiscal and monetary policy contributing to sustained macroeconomic stability and stable exchange rate toward the Euro. Further progress to NATO and the EU membership should more than compensate for some increased ge-opolitical risks in the region. Financial markets will continue to grow in size and sophistication, albeit at a slower rate. We are confident that within the stable macroeconomic framework and our clear strategic goals, PBZ will have another successful year creating additional value for our shareholders.
ConclusionIn 2007, PBZ was a recipient of nume-rous awards, including “The Euromo-ney Awards for Excellence” for the best bank in Croatia from The Euro-money, “The Best Bank Award 2007” for the best bank in Croatia from Global Finance, and “Das Beste Kro-atiens” from Adria Zeitung newspaper publisher. In that context, on behalf of PBZ’s management team, I would like sincerely to thank our shareholders, customers and local communities for their constant support and under-standing, which continues to bolster our growth. I thank our employees for hard work and strong dedication. Finally, I would like to express my most sincere gratitude to all members of

8 9
annualreport
2007
Review of the international and Croatian econo-my in 2007
Primary goal of this part of the PBZ annual report is to give to sharehold-ers/readers an assessment of inter-national and domestic macroecono-mic en-vironment in which PBZ and the Group operated during 2007. This should help understand the results from a more objective perspective.In 2007 the international eco-nomy was marked by financial distress and slowdown...What has started as a sub prime mortgage crises in the fall of 2006 in the United States (single-sector sin-gle-country event) became a global financial distress during 2007. And it will continue to be felt in 2008, with yet unknown consequences (as of February 2008). Credit crunch, liqu-idity crisis with record high liquidity interventions by major central banks, repricing of risks, loss of confidence in banks, cases of bank insolvency are only some of the features of financial turbulence in 2007. Total sub prime credit loss forecasts in Febru-ary 2008 increased to a huge amount of USD 400 billion, far more than US Federal Reserve’s initial estimates for sub prime losses of USD 100 to 150 billion done in mid-2007. The global financial markets turmoil started to reflect itself on the real sector i.e. economic growth of the world’s largest economies like the US and the European Union. Growth in the United States slowed notably in the fourth quarter of 2007, with recent indicators showing further weake-ning of manufacturing and housing activity, employment and consump-tion. Growth has also decelerated in the Western Europe (including Euro zone), and confidence indicators have generally deteriorated. In Janu-ary 2008 the International Monetary
Fund (IMF) has reduced its projec-tions of the world economy growth to 4.1 percent in 2008, down from 4.9 percent in 2007. The projections for the advanced economies have been reduced significantly as well: in the US to 1.5 percent (2.2 percent in 2007) and for the Euro area to 1.6 percent (2.3 percent in 2007).
.... as well as rising global inflation.Unfortunately financial markets turmoil was not the only bad news in 2007. Since mid-2007 headline inflation increased in both advanced and emerging markets primarily due to the increased prices of agricultural products and oil (as well as some other commodities). The US FED
started to aggressively cut interest rates in response to increased down-side risks to economic activity, while monetary policy has been, at least so far, on hold in Euro area, primarily due to inflation well above the 2 percent target (January HICP figure was 3.2 percent). Thus, monetary policyma-kers face the difficult challenge of balancing the risks of higher inflation and slower economic activity.
Croatia experienced exceptio-nally high growth...Unexpectedly high real growth rates of 7.0 percent and 6.6 percent res-pectively in the first and second qu-arters of 2007 resulted in a dynamic growth rate of 6.8 percent in the first half of the year. However, third quarter brought us back down-to-earth with 5.1 percent growth, lowering overall
annual growth estimates to around 6 percent. This is still higher than Croatia’s medium term potential growth rate (estimated to be around 4.5 percent). Even though slightly slowing down, the highest contribution to overall GDP growth in 2007 is still coming from domestic demand (both perso-nal and public) and gross investment. The moderation of personal con-sumption (from 7.1 percent growth in first quarter down to 6.2 percent growth in third quarter) took place despite a relatively strong growth of wages and employment at the time when inflationary pressures started to emerge. Regardless of one of most successful tourist seasons that mar-ked third quarter; overall net foreign
demand contribution was negative. In 2007 in real sector developments in-dustrial production accounted for 5.6 percent growth (4.1 percent in 2006), 5.3 percent real growth in retail trade and 2.4 percent growth in constructi-on works.
... which is expected to slow down in 2008 to its long term trend. Unfortunately, 2007 economic up-swing did not last long. As mentio-ned, 2007 third quarter data indicated economic slowdown which in our opi-nion will affect year 2008 much stron-ger than anticipated. Our forecasted growth range for 2008 is between 4.2 and 5.4 percent real growth, with stronger downside risks than upside ones. As a major downside risks, we see negative impact of the EU and

world economic growth deceleration, the EU negotiations problems, possible further tightening of monetary policy, uncertain fiscal policy and possible de-lays in most needed structural reforms. Related to the international environment one has to take into account that the overall effects of the financial market turmoil are still not fully acknowledged and that the global economy started to show signs of slowdown (in the case of the US even recession, while the EU a slowdown). This might have a negative impact on the Croatian foreign trade developments and subsequently overall economic growth.
This growth generated positive labor market developments...Strong economic growth in 2007 re-sulted in a total of 1.48 million persons were registered as employed (+0.9 percent on annual basis) in Decem-ber 2007. The number of unemployed persons fell in the same period by as much as 13.2 percent and the rate of registered unemployed at the end of last year was 14.7 percent (2006: 17 percent). The fall in unemployment recorded by the registered unemployed rate is also confirmed by the results of the Labor Force Survey for the third quarter of last year. The survey unemployment rate was at its all time low of 8.4 percent. Nevertheless, when compared with the European Union member countries, it is still quite high (EU 27 average 6.9 per-cent), with only Slovakia (11.3 percent) and Poland (9.0 percent) having higher unemployment rate than Croatia in Q3 2007. We expect that positive labor market developments will continue in 2008, even though at somewhat slower pace than last year.Increased employment was accompa-nied with 5.2 percent nominal growth in net wages (January-November 2007 data), and in 2008 we expect a moderate continuation of wage growth fuelled mainly by a private sector pro-ductivity growth and a wage increase in public sector. Real income growth however will be more moderate due to the increased inflationary pressures meaning that wage purchasing power will be reduced with weaker support to overall personal consumption.
GDP real growth ratesin % (source: CBS, estimate and forecast PBZ)
Average 2000-06Real growth rates
7
6
5
4
3
2
1
02000 2001 2002 2003 2004 2005 2006 2007e 2008f
6,3
4,3 4,34,8
6,3
5,1
2,9
4,4
5,6
4,5
Contribution of domestic and foreign demand to GDP growth(source: CBS, estimate and forecast PBZ)
Domestic consumptionNet foreign consumptionGross investment
15,0
10,0
5,0
0,0
-5,0
-10,0 2000 2001 2002 2003 2004 2005 2006 1q2007 2q2007 3q2007
ILO Survey and Registered unemployment ratein % (source: CBS)
Resitered unemployment ILO unemployment rate
25,0%
23,0%
21,0%
19,0%
17,0%
15,0%
13,0%
11,0%
9,0%
7,0%
5,0%
Prices, annual growth ratesin % (source: CBS)
Producer prices Consumer pricesCore consumer prices
7,0
6,0
5,0
4,0
3,0
2,0
1,0
0,0I 2006 IV VII X I 2007 IV VII X
I/00 IV VII X I/01 IV VII X I/02 IV VII X I/03 IV VII X I/04 IV VII X I/05 IV VII X I/06 IV VII X I/07 IV VII X

10 11
annualreport
2007
... shadowed by serious increase in inflationary pressures in the second part of 2007. Except for the high economic growth, 2007 (especially second half of the year) will be remembered as a year of increased inflationary pressures that continued to grow in early 2008. The year end inflation rate jumped to 5.8 percent (average annual 2.9 percent) mainly at the account of increased food and beverages prices. The spee-ding inflation originated mostly from increased world market prices of food and other agricultural products as well as oil and other raw materials. But the supply shock was not the only factor as rapid growth of domestic consump-tion contributed to inflation as well. For 2008 we estimate that average ye-arly inflation could be in the range from 4 to 6 percent, with higher risks on the upside. The main challenge for policy-makers will be to avoid second round effects on inflation (mostly via wages and increased inflationary expec-tations) of the cost-push impact on prices. Croatia is not the only country in the region facing inflationary chall-enges. Some of the new EU member states are confronted with challenges of low-teen inflation, not seen in those countries for a long time.
In 2007 monetary regulation was frequently changed, affecting banks’ behavior...During 2007, decision making in banks was to a large degree influenced by monetary policy framework and chan-ges in regulation. Central bank, with the goal to curb down growth of total external debt and alleviate external imbalances in Croatia, introduced a 12 percent credit ceiling at the beginning of the year. Banks, whose credits would grow more than that, would have to buy compulsory CNB bills. This regulation has been changed several times. First it was relaxed from the monthly limit (1 precent) to a yearly one. However in the second part of the year it was tightened to separa-tely report for off balance sheet items growth (to stop banks from substitu-ting on and off balance sheet items). Than it was tightened to a growth of 0,5 percent per month after June 2007
(meaning banks could grow by only 3 precent for the second part of the year). Final change meant consolida-ting the growth of financial institutions owned by banks in the 12 percent limit (like leasing, credit card companies etc). The decision on the minimum required amount of foreign currency claims (32 percent) was changed in the course of 2007 (July) which translated into additional tightening for banks (incorporating forex indexed items in a forex position). Combined with other regulatory measures (from high reserve requirement to tightening of prudential regulation especially introducing provisioning for currency induced credit risk) we may conclude that the year was marked by frequent regulatory changes, most of them toward tightening of monetary policy affecting banks decision making.
...but money continued to grow at double digit figures, with some slowing down.By the end of 2007 broad money reached the level of HRK 250 billion or about 80 percent of GDP indicating further deepening of financial markets. Broad money increased in 2007 by 18 percent, the same number as in 2006. Narrow money, M1, went up by 19.3 percent, which is lower than 25 percent in 2006, but is much higher than nominal GDP growth.
Rapid loan growth started to slow down as well, mostly the ones to enterprises.In 2007, as mentioned, banking sector operated largely under influence of 12 percent loan growth limit. Total assets (consolidated) of commercial banks grew by 12.3 percent on annual basis reaching 336 billion HRK (which repre-sents 123 percent of estimated GDP). This growth rate is a slowdown when compared with 2006. Total loans increased by 13.4 percent, out of which loans to households posted 18 percent and loans to enter-prises 10.2 percent rise. As previously, the steepest rise was recorded for the housing loans, although, as with all other types of loans, due to the growth limitations its annual growth rate slim-med from 33.9 percent in 2006 to last
year’s 22.5 percent. Total deposits in banks (excluding central government deposits) reached 198 billion HRK at the end of 2007, which is a 19 percent annual increa-se, slightly above the level of the year before. Household deposits growth was somewhat slower than in 2006 and it amounted to 10.5 percent, while deposits of enterprises, in spite of slower loan growth, posted strong 25 percent annual increase. Regarding currency structure, although the banks strived to increase HRK deposits to adjust their balance sheets, its share did not rise significantly, representing 48 percent of total deposits at the year-end.
Croatian capital market was very active in 2007, with broadening of shareholders base...Several IPO and the increase in investments of broad public lead to rising attention brought to capital market (Zagreb stock exchange, which merged with Varaždin Stock Exchan-ge in March 2007). Its performance for the year was extraordinary good. However, 2007 will be remembered mostly for the last few months of the year when the equities indices were “in red”, following the world market turmoil and rising global uncertainties. Even so, the share index Crobex finished the year higher by 63 percent over the year before.
...while money market interest ra-tes in the second part of the year showed increased volatility.In the months after summer, the liquidity on domestic money market was relatively tight. One of the reasons was the irregularity of reverse repo auctions held by central bank, on which the banks were counting on in previous periods. Furthermore, events like IPO of T-HT contributed to volatility on domestic money market as well. This resulted in an increase and high volatility of HRK short-term and overnight interest rates. At some point interest rates on overnight loans were over 10 percent and the range of interest rates on overnight loans in the last three months of the year was from 2-11 percent, creating a costly and

uncertain environment for those relying on them regularly.
Benchmark rates for Croatia were on the rise, with international repricing of risks affecting banks lending interest rates....During 2007 the benchmark rates like EURIBOR and Swiss franc LIBOR also posted a significant increase compa-red with 2006. At the end of 207 3-month Swiss franc LIBOR was higher by 65 basis points compared with end 2006, and 3-month EURIBOR by almost 100 basis points. Sovereign credit rating for Croatia did not change in 2007. However, as well as for most other emerging econo-mies, credit default swap spreads (CDS) on government bonds started to increase by the end of 2007 indica-ting changes in risk preferences by creditors. Combined with increase of benchmark rates, this made external financing even more expensive for Croatian banks. These developments, as well as impact of changes in monetary and prudential regulation, resulted in the increase of average loan interest rates by domestic banks. During 2007 the increase was fairly moderate - the ave-rage interest rate on foreign currency loans and HRK loans was in Novem-ber last year higher by only 10 and 45 basis points compared with end 2006, respectively.
Balance of payments showed no improvement in 2007...Even though the income from tourism was some 7 percent higher over a year before in the first nine months of 2007, this was far from sufficient to cover the rising trading gap which pushed the current account deficit for the period up by 13 percent, as high as EUR 1.3 billion. The trade deficit for entire year 2007 was higher by 21 percent than in 2006 - deficit in trade of crude petro-leum was up by 30 percent and food and drinks by almost 40 percent. What can give a dose of optimism among all these figures is the fact that the imports of machinery and transport equipment increased by 20 percent on annual basis, signalizing the on-going technical renewal of domestic compa-
10
8
6
4
2
0
-2
2001 2002 2003 2004 2005 2006 2007
EU MS average annual inflationin % (source: Eurostat, CBS)
EU 27 PolandCzech RepublicSloveniaHungaryCroatia
Money M1 and M4in HRK million
(source: CNB)
M1M4
250,000
200,000
150,000
100,000
50,000
012/00 12/01 12/02 12/03 12/04 12/05 12/06 12/07
Loans to households and enterprises annual growth ratesin % (source: CNB)
Household Enterprises
50,0
45,0
40,0
35,0
30,0
25,0
20,0
15,0
10,0
5,0
0,02000 2001 2002 2003 2004 2005 2006 2007
Deposits of households and enterprises, annual growth ratesin %
(source: CNB)
Household Enterprises
70,0
60,0
50,0
40,0
30,0
20,0
10,0
0,02000 2001 2002 2003 2004 2005 2006 2007

12 13
annualreport
2007
nies (seen also through GDP figures on gross investments rise), which cre-ates ground for further development of our industry. With 18 percent higher trade deficit in the last quarter and no major income at the same time, we expect the current account deficit to widen from 7.8 percent of GDP in 2006 to 8.3 percent in 2007. In 2008 slower domestic demand growth should lower the imports and the trade deficit. Consequently we project 2008 current account deficit to slightly shrink down to 7.9 percent of GDP.
...but growth of total foreign debt slowed down, with banks debt share significantly falling.The increase in overall foreign debt was slowed down during 2007. At the end of year the debt stood at EUR 32.6 billion (or about 87 percent of estimated GDP). This is a positive development as foreign creditors (on which financing of our current account deficit depends on) started re-assessing Croatia’s external vulne-rabilities. It has to be stressed that commercial banks, primarily due to monetary re-gulation and the impact of 55 percent marginal reserve requirement (combi-ned with rising of benchmark interest rates) decreased their external debt significantly.
As in the last fifteen years, exchange rate toward the EURO was stable, easing inflationary pressures Average nominal exchange rate toward EURO, main anchor currency for Croatia, remained stable during 2007. During last year HRK strengt-hened against Euro on average by only 0.8 percent. The average HRK/ Euro rate was 7.34 for the year. As a highly Euroized economy, stability of the nominal exchange rate toward the Euro significantly contributed to rela-tively moderate inflation. Weakness of US dollar towards Euro on internatio-nal markets influenced directly HRK/USD rate - HRK strengthened against US$ by 8.5 percent on annual basis with the exchange rate falling to 5.37. US dollar depreciation eased pass-
ZIBOR o/n(source: Reuters)
12,0
10,0
8,0
6,0
4,0
2,0
0,0
1/2/
07
2/20
7
3/2/
07
4/2/
07
5/2/
07
6/2/
07
7/2/
07
8/2/
07
9/2/
07
10/2
/07
11/2
/07
12/2
/07
6,00
5,00
4,00
3,00
2,00
1,00
0,00
02.0
1.20
07.
17.0
1.20
07.
01.0
2.20
07.
16.0
2.20
07.
05.0
3.20
07.
20.0
3.20
07.
04.0
4.20
07.
23.0
4.20
07.
09.0
5.20
07.
24.0
5.20
07.
08.0
6.20
07.
25.0
6.20
07.
10.0
7.20
07.
25.0
7.20
07.
09.0
8.20
07.
24.0
8.20
07.
10.0
9.20
07.
25.0
9.20
07.
10.1
0.20
07.
25.1
0.20
07.
09.1
1.20
07.
26.1
1.20
07.
11.1
2.20
07.
28.1
2.20
07.
3M Euribor and CHF Libor(source: Reuters)
3M CHF LIBOR3M EURIBOR
Average interest rate on loans, annualin %
(source: CBS)
fcc loans kuna loans
10,00
9,50
9,00
8,50
8,00
7,50
7,00
6,50
6,00
5,50
5,00XII/06 I/07 II III IV V VI VII VIII IX X XI
BOP CADin % of GDP (source: CNB and PBZ forecast)
0,0
-1,0
-2,0
-3,0
-4,0
-5,0
-6,0
-7,0
-8,0
-9,02000 2001 2002 2003 2004 2005 2006 2007e 2008f
-2,4
-3,6
-8,5
-7,1
-5,1
-6,4
-7,8-8,3
-7,9

through pressures from oil (and other commodities prices in US$) increase.
Government consumption: Expansionary or not?Although a rising trend in government consumption has been evident over the last two years, a 4.4 percent real growth in last year’s third quarter was unexpec-ted due to the fact that usual pre-elec-tion over spending was more or less earmarked for the last quarter. However, first half of 2007 brought 13.9 percent higher budget revenues. Government quickly responded with budget revision and increased expenditures. Since, 2007 budget outturn is still unknown, we decided to adopt the Ministry of finance estimate of 2.6 percent of GDP deficit. As the 2008 budget has not been pa-ssed in time for this analysis (due to the election first quarter of 2008 was bud-geted through the so-called Temporary Financing Plan), fiscal plans are quite uncertain. However, not to jump with conclusions, our expectations are that the Ministry of Finance will stick to the plans as envisaged by Pre-accession Economic Program and that the deficit will be around 2,3 percent of GDP. Beside the increase in government consumption, 2007 was the second year in a row marked with the so-called pensioners’ debt repayment in the amount of around 1.2 percent of GDP (in 2006 around 1 percent of GDP) - that strongly affected personal consumption over the last two years. Although, this repayment is not part of official budget expenditures, it can not be disregarded and should be monitored as quasi-fiscal expenditure. The total repayment for the year 2006-2013 surpasses HRK 10 billion. In summing up, 2007 was a challenging year for banks to operate in. This is true especially for its second part due to: first, changes in monetary regulation, second, constant unfolding of global di-sturbances in the financial markets (with repricing of risks) and third, increase in domestic inflation. Macroeconomic fundamentals of the Croatian economy are not questioned, but the balance of risks is changing. It is in commercial banks’ best interest to operate in a stable macroeconomic framework in the medium term.
Croatia: External debt, annual growth rates(source: CNB)
BanksTotalOther sectors
50,00
40,00
30,00
20,00
10,00
0,00
-10,00
-20,0001.06. 03.06. 05.06. 07.06. 09.06. 11.06. 01.07. 03.07. 05.07. 09.07.07.07. 11.07.
EUR/HRK(source: CNB)
7,45
7,40
7,35
7,30
7,25
02.I
07 15.I
26.I
08.II
21.II
06. I
II19
.III
30.II
I13
.IV26
.IV10
.V23
.V05
.VI
19.V
I04
.VII
17.V
II30
.VII
10.V
III24
.VIII
06.IX
19.IX
02.X
16.X
29.X
12.X
I23
.XI
06.X
II19
.XII
USD/HRK(source: CNB)
5,8
5,7
5,6
5,5
5,4
5,3
5,2
5,1
5,0
4,9
4,8
02.I
07 15.I
26.I
08.II
21.II
06. I
II19
.III
30.II
I13
.IV26
.IV10
.V23
.V05
.VI
19.V
I04
.VII
17.V
II30
.VII
10.V
III24
.VIII
06.IX
19.IX
02.X
16.X
29.X
12.X
I23
.XI
06.X
II19
.XII
Consolidated General Government Deficitas % of GDP
(source: Ministry of finance)
0,0
-1,0
-2,0
-3,0
-4,0
-5,0
-6,0
-7,02002 2003 2004 2005 2006 2007p 2008p
-4,9
-6,2
-4,8
-4,0
-3,0-2,6
-2,3
Maastricht

14 15
annualreport
2007
Group resultsThe past year was particularly challen-ging for financial institutions. A relatively flat yield curve made it difficult to earn a satisfactory return on lending activities. The rise in short-term rates and the competitive commercial loan market squeezed profit margins throughout the industry. Monthly growth limitation of 1 percent (dropped to 0.5 percent in the second half of the year) of eligible assets and off-balance sheet items re-presented a major backdrop in the pro-fitability of the banking system. Against this backdrop of challenging industry and economic dynamics, PBZ Group enjoys a number of unique strengths that provide considerable competitive advantage. The Group succeeded in improving its consolidated net ope-rating income by 12 percent to HRK 3,405 million in 2007. Two major drivers of income, commissions and interest income grew by 20.7 percent and 21.8 percent respectively. Net interest inco-me amounted to HRK 1,918 million or 11.9 percent up on the figure from the previous year. Due to innovative custo-mer offerings, net fee and commission income grew by 23.9 percent to HRK 1,064 million. Commercial fees, inclu-ding cash management and bankcard fees, experienced especially strong growth this past year, with the non-inte-rest income of the Group reaching 43.7 percent of total operating income.Personnel expenses increased by 9.8 percent. Base salaries grew by 9.2 percent relative to the previous year due the larger headcount of 109 additi-onal employees on average. Increased security standards, expansion of the network, stronger marketing presence and lease costs of premises resulted in an 11 percent increase in general and administrative expenses. Our branch-building program remains robust as we expand within the growing market. In 2007, the Group added eight new branches in existing markets and performed significant renovations to a
Financial and operational highlights
underlying 2006. The group’s balan-ce sheet total increased by 9 percent relative to 2006 and stood at HRK 67.5 billion. This advance was largely attribu-table to an increase in loans to custo-mers of HRK 3.24 billion. As apparent from the above table, Banking is the main source of the Group’s profit (Pri-vredna banka Zagreb and Meimurska banka collectively). Banking segment, on aggregate, continues to make strongest contribution to the conso-lidated results. Its operating income reached HRK 2,623 million. The largerst individual contribution of the Group results was accounted for by Privredna banka Zagreb (the Bank). Net profit by the Bank amounted to HRK 932 million
Net operating income - Group 2003-2007
in HRK milion
Other operating income
Net fee and commission income
Net interest income
3500
3000
2500
2000
1500
1000
500
02003 2004 2005 2006 2007
Cost income ratio - Group 2003-2007 in %
55
54
53
52
51
50
49
482003 2004 2005 2006 2007
Group results by business segment in HRK million 2007 2006
Banking 2,623 2,407
Card services 649 566
Leasing 140 122
Other financial services 113 52
Non-financial services 32 19
Consolidation adjustments (152) (127)
Operating income 3,405 3,039
number of others. Overall, operating expenses rose by 11.1 percent against last year and amounted to HRK 1,578 million reflecting investments to support the growth of the business. As part of operating expenses, deposit insurance charges grew by 9.4 percent compared to the previous year due to increased amounts of deposits insured. Nonethe-less, the cost to income ratio improved to 50.5 percent from 51. percent in 2006, as the operational cost base over operating income improved by a better-than-expected 20 basis points above plan. Profit before taxes stood at HRK 1,446 million. Impressive upward trend in value creation was continued in 2007 with EVA® of 14.9 percent over the

(2006: HRK 847 million). The associated companies contributed HRK 209 million (2006: HRK 116 million) to the consoli-dated profit of the Group.
Changes in the GroupIn December 2006, the Bank completed its acquisition of 66.99 percent of the share capital of LT Gospodarska banka d.d. following the approvals given by the appropriate regulatory authorities. The subsidiary was first consolidated as of 31 December 2006, having no effect on 2006 results of the Group. If the combination had taken place at the beginning of the year, the total profit for the year attributable to equity holders of the Bank would have been HRK 53 thousand higher. In August 2007 LT Gospodarska banka d.d. was integrated into UPI banka d.d. Sarajevo. Privredna banka Zagreb presently holds 18.95 percent of the share capital of UPI banka and this investment is classified within financial assets available for sale. UPI banka d.d. is under controlling inte-rest of Intesa Sanpaolo, main sharehol-der of Privredna banka Zagreb. Furt-hermore, Cards d.o.o. Skopje, a wholly owned subsidiary of PBZ Card engaged in credit cards operations was liquidated in September 2007. PBZ Card recorded net effect of liquidation in amount of HRK 85 thousand as a debit to retained earnings.
Bank resultsBelow we provide an overview of the 2007 operating results of Privred-na banka Zagreb. In 2007 Privredna banka Zagreb once again recorded an outstanding result. Net profit for the year of HRK 932 million surpassed the last year’s amount of HRK 847 million by 10 percent. Underlying profit before tax rose 10.2 percent to HRK 1,147 million. Total revenue increased 16.7 percent to HRK 4,263 million driven by the increase of HRK 4.3 billion in volume of kuna loans on average combined with the growth of increasing participation of non-interest income in the Bank’s total revenue. The increased burden of compulsory reserves requirements combined with the increasing compe-titive-ness in the market resulted in a decrease in the Bank’s average rate on kuna placements and in upward shift
on the Bank’s customer deposit rates. Nonetheless, net interest income in-creased by 10.6 percent to HRK 1,697 million due to steady growth and deft balance sheet management. Innova-tive offerings of non-interest products increased net fee and commission income by 28.2 percent to HRK 373 million. Significant growth in payment system and other banking service fees of 19.9 percent raised the total fee and commission income by additional HRK 97 million in 2007. Among notable market actions, introduction of an on-line trading platform (PBZ Investor) together with the expansion of sales
51.5
51
50.5
50
49.5
49
48.5
48
47.52003 2004 2005 2006 2007
Cost income ratio - Bank 2003-2007
in %
2500
2000
1500
1000
500
02003 2004 2005 2006 2007
Net operating income
- Bank 2003-2007 in HRK milion
Other operating income
Net fee and commission income
Net interest income
1000
900
800
700
600
500
400
300
200
100
02003 2004 2005 2006 2007
Net profit for the year - Bank 2003-2007 in HRK milion
network resulted in higher commissions on automated products of 35 percent. On average, 60 additional people and appraisal program raised the total personnel expenses by 8.7 percent. Rent, marketing and municipal tax as well as other general expenses incre-ased total operating expenses by 10.3 percent to HRK 1,111 million. Moreover, deposit premium grew by 5.4 percent compared to the previous year due to increased amounts of deposits insured. Overall, cost management programmes enhanced in 2007, which, as expected, should lead to further savings in the next periods.

16 17
annualreport
2007
Corporate,Treasury & Invest.
Banking GroupIvan Gerovac
Public Sector (Entities)Division
Large Companies &Foreign Companies
Division
Financial Institutions& Spec. Financing
Division
TreasuryDivision
Investment BankingDivision
SupportDivision
Strategic ALMOffice
Small & Medium-- Size Enterprises
(SME) Group Mario Henjak
Small &Medium Size Enterprises
Division
Product Development & Branch Coordin.
Division
RetailBanking GroupTomislav LazariÊ
Retail and SMEGroups Office
Distribution ChannelDevelopment
Division
ProductDevelopment
Division
Private BankingDivision
Analysis and ClientRelationshipDevelopment
Division
Product and ServiceMarketing Division
Risk Management& Control Group
Marco Capellini
Risk ManagementDivision
Credit AnalysisDivision
Credit Risk Monitor.& Reporting
Division
Loan Recovery &Restructuring
Division
ComplianceDivision
IT & OperationsGroup
Draženko Kopljar
Business ProcessesOrganization
Division
OperationsDivision
PaymentTransactions
Division
ICT Sub-group
Central functionsICT Governance
Office
Application softwareApplication SW
DivisionApplication Operations
DivisionVIRT Department
Central system infrastructure
System Infrastructure Division
Telecom & Distributed Systems Division
Acc., Taxation Fin. Control & General
Admin. GroupGabriele Pace
Accounting and Taxation Regulation
Division
AccountingDivision
Financial ControlDivision
GeneralAdministration
Division
Equity Holdings ManagementDepartment
Human Resources
Division
Legal AffairsDivision
Office for Corporate
Communica-tions
Office for Ec.Research &
Strateg. Planning
Project Management
Office
Management Board
Božo Prka, President of the MB
Supervisory Board
György Surányi, President of the SB
Office of theManagement Board
Office of the Supervisory Board
Internal Audit Divisionresp. to the President of MB
AuditCommittee
Organisational chart
MB office for Security resp. to D. Kopljar

financial value of the world’s leading banking brands. Privredna banka Zagreb currently employs some 3,618 employees and provides a full range of specialized services in the areas of retail, corpo-rate and investment banking services. The business activities of the Bank are organized into 3 principal client-orien-ted business groups.
Retail Banking GroupWith respect to the retail banking segment, PBZ holds a comparative advantage over its competitors given its wide spread branch network in Croatia, consisting of 210 organisati-onal units in 18 regions which cover the entire territory of the country. Moreover, the banking subsidiary in the Group, Meimurska banka covers the Meimurska County and provides an effective presence in that particular region. In accordance with its business phi-losophy of focusing on client needs and demands, five years ago the Bank introduced personal bankers and the 0-24 hour self-service banking zones to the branch networks, while incre-asing the quality of services through continued staff training and underta-king quality control measures such as the “Mystery Shopper” project. These activities are constantly in develo-pment with the emphasis being placed on the standardisation of business processes. To illustrate this orientation we would like to mention the package of products (named Innovation) by which the Bank rewards its clients who are owners of several groups of products, giving them discount on cer-tain forms of fees and awarding them an incentive interest rate if they have placed their funds on time deposit with the Kuna Plus savings account. On top of that, PBZ has introduced Private banking, a specially designed service aimed at VIP clients. In addition to restructuring and repositioning the traditional distribution channel of the business network, PBZ also continues to develop and improve the distribu-
Privredna banka Zagreb d.d. is one of the largest and among the oldest financial institutions in the Republic of Croatia, with a long continuity of banking operations. It was founded in 1962 as an universal bank on the basis and banking tradition of The First Cro-atian Savings Bank which was initially established in 1846 in Zagreb by the members of the Farming Association of Croatia and Slavonia.During all periods of its history, PBZ supported the largest investment programs in tourism, agriculture, indu-strialisation, shipbuilding, electrification and road construction. PBZ has be-come a synonym for economic vitality, continuity and the Croatian identity.Privredna banka Zagreb today is a modern and dynamic financial insti-tution, which has actively sought and won the role of market leader on the financial markets in Croatia. It is a fully licensed bank with nationwide branch network. With its nationwide network of branches and outlets, as well as a broad group of banking and non-ban-king subsidiaries, PBZ is one of the universal banks that cover the whole territory of the Republic of Croatia.
Organisational Structure and Business ActivitiesNowadays, PBZ is the leading bank in Croatia in terms of subscribed share capital and the second bank in terms of total assets. It has consistently been a leading financial institution on the Croatian market with an established business base and recognised natio-nal brand name.Upon successful privatisation in December 1999, PBZ became a mem-ber of Gruppo Intesa Sanpaolo - the largest Italian banking group and one of the most significant financial institu-tions in Europe. With this partnership,
Business description of the Bank
supported by the EBRD through its minority shareholding stake, PBZ has retained its business strategy aimed at modern forms of banking and new products, confirming its image of a dynamic and modern European bank, which meets the demands of the market and its clients. The benefits of strategic partnership are clearly visible in the continuously improving financial results of the Bank, as well as of the PBZ Group.Along with the adoption of the busine-ss and corporate governance standar-ds set by its parent bank, Privredna banka Zagreb has maintained the strategic development orientation of a modern, client oriented, technically innovative universal financial instituti-on. PBZ is focused on the continued advancement of its economic perfor-mance well into the future, as well as solidifying its position as a product leader in offering the most progressive banking products, through the optimal mix of traditional and modern distribu-tion channels. This ensures that PBZ will continue to be able to set standar-ds of the highest quality for product innovations and services offered to both its domestic and international clients.This commitment to quality and advanced banking practices is clearly seen in the fact that Privredna banka Zagreb received the Best Bank in Croatia award from Euromoney in 2001, 2002, 2004 and 2007. In 2005 PBZ received The Best Debt House in Croatia award by Euromoney. PBZ also received The Banker’s Award for the Croatian Bank of the Year in 2002 and 2005. In 2003, 2004, 2005, 2006 and in 2007, PBZ’s quality was con-firmed again when it received Global Finance’s Award for the Best Bank in Croatia. In 2003, 2004, 2005 and in 2006 PBZ received the domestic prestige awards - the Golden Share Award for the Best Banking Share in the country, and the Golden Kuna Award in 2004 and 2005.In addition, Privredna banka was listed among the world’s top 500 finan-cial brands for 2007 by Global 500 Financial Brands Index. This report, initially published in 2006, was the first publicly available table analysing the

18 19
annualreport
2007
operations in Privredna banka Zagreb comprise the following divisions: the Division for the development of distribution channels, the Division for product development, the Division for private banking, the Division for analysis and client relationshiop deve-lopment, the Division for product and service marketing and the Office for retail and SME groups.
Division for the Development of Distribution ChannelsThis division is responsible for defining, structuring, implementing and moni-toring classical and direct distribution channels for the delivery of retail pro-ducts and services (branch network, ATM and EFT POS network, PBZ 365 services - telephone banking, internet banking, SMS banking, WAP banking, mPay, personal bankers, retail network education). It prepares and coordi-nates the budget and supervises the achievement of its goals for all distribu-tion channels. It chooses the appro-priate distribution channels for end products intended for specific targeted client groups. In association with the Division for product development and the Division for the development of client relationships and marketing, it chooses the right moment for the launch of a new product/service and is responsible for informing the distributi-
on channels of all pursuant marketing activities which may have an effect on them.
Division for Product DevelopmentIn cooperation with the Division for the Analysis and Client Relationship
tion channel of direct banking. It has extended its network of ATMs which accept Maestro, MasterCard, Visa Classic and Visa Electron as well as American Express cards (a total of 540 ATMs have been installed). The number of EFT POSs (points of sale) has increased from 3,500 at the end of 2000 to the present 19,384. As a leader in modern technologies, PBZ has also expanded its distribu-tion channels and products by appl-ying the most advanced technology in order to implement its PBZ 365 servi-ces; PBZ365TEL telephone banking service and PBZ365SMS service. With Internet banking PBZ365NET (PBZ365-Optima and PBZ365-Lite) and PBZ365WAP services a client can access his/her accounts 24 hours a day from any location in the world. In 2004, PBZ introduced mPay - a system of payment using mobile phones, as the first bank in Croatia offering such a service, with 95,215 clients today. These achievements have firmly established PBZ as the market leader in electronic banking as well as the technological leader on the financial market in the country. PBZ is the first bank in Croatia which has implemented secure e-commer-ce based on 3 D Secure technology (Verified by Visa). At present, approxi-mately half of all transactions with
retail customers are executed through electronic channels.The Bank is constantly modifying and supplementing its wide range of retail products and services. Thus, it has introduced several types of new loans on the basis of credit scoring.
Besides the consumer and cash loans for PBZ Card card-holders, from 2002 to 2007 the Bank launched five very successful tranches of so called quick loans (cash loans at demand to customers with sound credit scoring). Overall in the period from 2000 until present time, PBZ established itself as the market leader in retail loans with a 20.1 percent share of the loan market. In the area of customer deposits, PBZ has significantly increased its deposits to more than HRK 25.6 billion to date, which is 20.6 percent of the Croatian retail deposit market. On a consolida-ted level, PBZ Group holds almost 22 percent of the overall Croatian retail deposits.In the card products segment, PBZ, as a card issuer and acceptor, replaced all cheque cards of retail current acco-unts with the internationally accepted Cirrus Maestro debit card; it offered internationally valid Visa Electron debit card linked to a foreign currency account and issued internationally valid Visa Business Electron debit cards linked to gyro account of private persons, craftsmen and corporates, as well as MasterCard and Visa revolving credit and charge products, and it is the only Bank in Croatia offering Mae-stro prepaid gift cards. In January 2006 card operations of PBZ were shifted to the new compa-
ny, PBZ Card (former PBZ American Express), that deals with all card operations of the PBZ Group. Together with PBZ Card, the Bank has issued more than 2 million cards to its clients which accounts for 33.2 percent of the domestic card market. Retail

of services throughout the branch network. It also prepares proposals for the marketing budget and oversees it throughout the year.
Corporate, Treasury and Investment Banking GroupPrivredna banka Zagreb is one of the leading Croatian banks when it comes to corporate banking. With a wide range of products and services offered to its corporate clients both locally and internationally it is hard to find a major company in Croatia today that does not bank with Privredna banka Zagreb.
Supported by powerful electronic dis-tribution channels, our network of well-organised branches is the key driving force in serving our clients effectively. We strive to create additional value by providing integrated financial solutions to meet the individual requirements of our clients.PBZ has thoroughly developed a plat-form for supporting classic cash and non-cash transactions for corporate clients within the Bank’s network. Due to its wide network of correspondent banks, Privredna banka Zagreb offers its clients fast and affordable services in the area of international payments. Also, PBZ has significantly changed the process of handling domestic payments. The Bank directly partici-
Development and the Division for the Development of Distribution Channels, this Division monitors the macroecono-mic environment, the activities of direct competitors as well as the market position of the Bank in retail operati-ons. It controls the entire process of defining products for a targeted group of clients, determines the prices of the products and delivers end products to the Division for the development of dis-tribution channels, to which it proposes an appropriate approach and suitable moment for the product launch. In cooperation with the Division for the development of distribution channels, it participates in the monitoring of overall profitability (product distribution).
Private Banking Division The Private Banking Division provides financial services to high net worth individuals and their families in Croatia.
Utilising the most suitable products from the marketplace, the Private Banking Division works with its clients to offer both traditional and innovative ways to manage and preserve wealth whilst optimising returns. Specialist advisers of the Division are available to deliver products and services that are tailored to meet the full range of financial needs requested by our VIP clients. These services include asset manage-ment, financial consulting, monitoring and evaluation of the cli-ents’ investments, custodian services, special deposit taking, sale of insu-rance policies, etc. The Division has recently introduced bespoke electronic platform which enables clients to place orders on-line.
Division for Analysis and Client Relationship Development The Division for Analyis and Cli-ent Relationship Development is responsible for the analysis and development model which includes supervision and implementation of measuring key indicators for perfor-mance assessment of the distribu-tion network and products for retail customers.The activities relating to the analysis and segmentation of the market include: monitoring the profitability of segmented client databases, the analysis of existing products and services intended for individual client segments and their requirements. This Division also engages in the development of models for measu-ring the quality of client service by executing Mystery shopper activities, structured market researches, moni-
toring customer complaints and the overall satisfaction of our clients.
Division for Product and Service MarketingThe prime role of the Division for Pro-duct and Service Marketing is marke-ting management for all the products and services for retail clients of the entire PBZ Group. The activities of this Division include the selection and coordination of appropriate marke-ting campaigns, selection of the most suitable communica-tion channels to the defined market segment and media planning as well as planning and defining marketing messages in the branch network. It continuously monitors and improves the quality

20 21
annualreport
2007
ssible solution for the respective entity. In coordination with other units of the Bank, we participate in cross selling of all the PBZ Group products. By mana-ging the overall business relationship between the Bank and the client, thro-ugh a synergic effect we strive for the creation of new supplementary value for our clients. Appreciating the diversity of its clients’ business activities, employees of the Public Sector (Entities) Division, thro-ugh their individual approach to each client, as well as in team work, provide support to clients in all aspects of their business activities by affording them the use of a wide range of the Bank’s services and products, thus develo-ping long-term business relations and partnerships. In every segment of its business activi-ties, operations and service rendering, the Division endeavours to promote
the highest quality banking standards, first and foremost in being professio-nally and flexibly oriented, both to its present, and to its potential clients.
Large Companies and Foreign Companies DivisionThe Large Companies and Foreign Companies Division is responsible for business transactions with large domestic companies, companies in foreign ownership, as well as with fore-ign legal entities - non-residents. The Division offers all types of banking products and services rendered in co-operation with other Bank’s organisati-on units - opening business accounts, offering Internet banking accounts, approving loan facilities, purchase of
pates in the Croatian RTGS system (HSVP) and in the national clearing system (NKS) and thus has the ability to process any payment through the most appropriate channel. Improved with the new functionality, Internet banking for corporate clients - PBZ COM@NET service - is available for both domestic and international payments. In terms of finance banking, Privredna banka Zagreb is a dominant parti-cipant on the Croatian market. PBZ has originated many contemporary products and has largely initiated the development of the financial market in the country. Consequently, PBZ, with its active role in the foreign exchange market, money market and primary and secondary capital market, has earned the title of market leader. We are determined to be recognized as the best financial services company
in the region. We have achieved this recognition from our clients through our ability to deliver the best quality in everything we do.Following the adoption of the new or-ganisation of Privredna banka Zagreb, the Corporate Banking Group and the Finance Banking Group created the Corporate, Treasury and Investment Banking Group with particular empha-sis on banking with large companies, financial institutions and the Gover-nment institutions and agencies.The Corporate, Treasury and Inves-tment Banking Group consists of the following divisions: Public Sector Di-vision, Large Companies and Foreign Companies Division, Financial insti-tutions and special financing division,
Treasury Division, Investment Banking Division and Support Division.
Public Sector (Entities) DivisionPublic Sector (Entities) Division is res-ponsible for performing transactions with government institutions, local and self-government units, public enter-prises and public utility companies, insurance companies, large compani-es, affiliates and institutions. Recognising and taking into acco-unt the requirements of its clients for banking products and services, the Division offers all types and forms of short-term and long-term financing, purchase of receivables, B/E discoun-ting, factoring, letters of guarantees, letters of credit, and renders services involving the opening of business accounts, cash pooling, contrac-ting Internet banking, multi-purpose facilities, providing financial support
to export businesses, active partici-pation in the conclusion of deals of its clients abroad, as well as different models of deposit transactions and other innovative solutions adjusted to the requirements of each single client. Apart from the operations mentioned, it is also important to highlight the services in agency business - tran-sactions performed on behalf and for the account of the ordering party, and commission business - deals made in its own name and for the account of the ordering party. We particularly wish to bring into focus our financial advising services, applicable to whatever line of busine-ss/branch a legal entity is associated with, and the creation of the best po-

Credits) became part of the Financial Institutions and Special Financing Division in 2006.As part of the special financing servi-ces, this Division offers all the Bank’s clients tailor made financing solutions including trade and project financing, credit and special arrangements with financial institutions (both domestic and international) as well as with su-pranational organizations (e.g. EBRD, etc.), buyer’s credits for the promo-tion of Croatian exports, open lines of credit guaranteed by state export agencies, commodity loans for export and import financing. One of the most notable financial services provided by this Division has been arranging and participating in syndicated loan faciliti-es on behalf of the Bank and its clients (PBZ is the market leader in Croatia in arranging syndicated loans). Through this Division PBZ is an active partici-pant in the secondary loan market and forfeiting transactions. The PBZ’s Group funding has also been a part of this Division’s respon-sibilities.
Treasury DivisionThe PBZ Treasury Division is an impor-tant and among the top players on the Croatian market with a broad spec-trum of financial solutions for large corporate and institutional investors. The treasury division offers a compre-hensive range of services, involving transactions on both the international and domestic money markets, capital markets, foreign currency markets and also manages the liquidity of the bank. The PBZ Treasury division is a reliable financial partner and has an active role in trading securities issued by the Ministry of Finance, currency and short-term cash derivatives on the money market. The Treasury division consists of three sections: Securities, Foreign exchan-ge, Money market. The Securities department operates with short, me-dium and long-term debt and owners’ financial instruments. The money mar-ket section is involved in short-term securities, domestic and international T-bills, repo arrangements and depo-sits. In the foreign exchange section the most important segment of the
receivables, B/E discounting, issuing of letters of guarantees and opening of letters of credit, cash handling services (organising, transporting, collecting and transferring cash, cash poo-ling, global cash management), card operations, leasing, retail products and other. Major domestic clients are building companies (building construc-tion and civil engineering), companies engaged in tourism, and large trading companies. To companies engaged in the con-struction of residential and business premises intended for sale we offer the complete project implementation service - from the control of project documentation and building supervi-sion to the financing of construction and of the sale of real estates to final buyers.
In view of the well-developed business network of Privredna banka Zagreb with as many as 210 branches and branch offices, we have successfully organised the complete conduct and management of cash transactions for some of our clients, who are also some of the largest chain stores, and companies engaged in tourism. The International Desk forms part of the Division, and is in charge of performing transactions with domestic companies in foreign ownership and of coordinating activities of Privredna banka Zagreb and its parent bank - Intesa Sanpaolo. All banking and advisory services are provided by the International Desk to Intesa Sanpaolo Group clients present on the Croatian market, as well as to other compani-es in foreign ownership. Apart from
conducting business relations, this unit also assists foreign investors in the process of setting up a new company in Croatia, provides advisory services and general information on business terms and conditions in Croatia, con-tacts clients and puts them in touch with institutions exigent in the perfor-mance of regular business activities. The non resident department is res-ponsible for establishing and develo-ping co-operation with foreign entities (foreign companies and private indivi-duals engaged in business activities, foreign diplomatic and consular repre-sentative offices and representative offices of foreign legal entities, foreign associations, foundations and other non-profit organisations, international missions). Co-operation includes opening and
managing of accounts, depositing funds, providing the clients with all necessary information required for conducting business in Croatia, which requires the constant monitoring of all national currency regulations (close co-operation with CNB and Ministry of Finance-Foreign Exchange Inspectora-te in money laundry prevention issues).
Financial Institutions and Special Financing DivisionThe key responsibilities of this Division are establishing, monitoring and pro-moting the complete range of business relations with domestic and internati-onal banks and financial institutions. In order to provide better services to PBZ clients and fully utilize its internal synergies, the Documentary Business (i.e. Guarantees and Documentary

22 23
annualreport
2007
assessing their investment objectives and respecting their risk tolerances, we strive to ensure that each client achieves competitive returns and maximum value added on assets invested. In addition to the purchase and sale of securities on domestic and foreign stock exchanges, the Bank’s broke-rage services consist of providing de-tailed information on trading activities, supply and demand readily available through electronic trading systems, prompt reporting of securities transac-tions and margin loans. As the leader on the Croatian market, the Bank provides high quality custody services to institutional clients from all over the world who have faced the cri-tical challenge of finding the right par-tner to deliver efficient local custody
services with in-depth expertise in lo-cal market practice. The Bank is proud to emphasize that it is a sub-custodian for five of the world’s largest and well-known global custodians. At the same time, by establishing and continuously developing its own custody network, the Bank offers domestic institutional and private clients access to local and foreign markets. As a depository bank for top Croatian investment funds, we ensure that investors’ assets are pro-tected, managed and valued accor-ding to regulatory requirements and acknowledged accounting standards. Our dedicated staff in the Investment Banking Division, focused know-how and experience, combined with the ability to access local and regional markets effectively, provide our clients with top quality products and servi-
activities is covered by the Corporate desk. It is mainly oriented to corporate clients and fulfilling their needs, wants and demands. The foreign exchange department operates with foreign currencies on spot and forward, options and banknotes. The banknotes segment covers delivering, dispatching, processing and warehousing vario-us shipments of foreign currencies. Privredna banka Zagreb acts on the domestic market as one of the leading banks in this particular banking area. We are the market maker, especially in securities, commercial papers, gover-nment, municipal and corporate bonds issued on domestic and foreign mar-kets. Considering the above, we can most proudly conclude that as well as participating domestically, as a priority we are focused and open towards the global markets.
Investment Banking DivisionAs the leader in the Croatian inves-tment banking industry, the Bank’s Investment Banking Division provides institutional and private clients with a wide spectrum of investment banking products and services through capital market activities, financial advisory and structured finance services, research, as well as asset management, broke-rage and custody services. In coope-ration with Banca Intesa and its affili-ates in Hungary (CIB), Slovakia (VUB), Bosnia & Herzegovina (Upi banka) and Serbia (Banca Intesa Beograd), servi-ces to our clients are extended across South Eastern Europe.With an outstanding reputation for innovative financial solutions, the Bank has been consistently recognized as the leading Underwriter and Arranger of debt issues in the Republic of Croa-tia. The Bank specializes in originating, underwriting and sales of a compre-hensive range of debt securities, such as corporate commercial papers, eurobonds, corporate bonds, gover-nment bonds and municipal bonds. Through capital market activities, we provide financial solutions to a variety of debt issuers, including government entities, municipalities, corporate cli-ents and institutional investors on the Croatian capital markets.
Within its structured finance activities, the Bank offers its clients services involving the origination and execution of securitization processes and project finance transactions. These encom-pass, among others, preparation of fi-nancial forecasts for planned projects; identification of structured transactions risks and proposals for risk reduction measures; due diligence processes and execution of securities issues for structured transaction purposes.In the process of Croatia’s transition to a market economy, encompassing numerous privatisations and company restructurings, the Bank introduced a series of financial advisory services to meet the requirements of the inves-tment market. Our financial advisory services include: mergers and acqu-isitions; corporate restructuring and divestments; employee stock owners-hip programs; MBO’s, LBO’s and other transaction-based projects. We provi-de valuable insights into how com-panies can grow and enhance their shareholder value. Aligned with our industry capability and strong network base, we understand the dynamics of the marketplaces in which our clients operate as well as the intricacies of deal structuring and negotiations. We have represented clients in numerous industries, including oil and gas, IT, pharmaceuticals, food processing, confectionery, tourism, banking, retail, paper and paper products, sporting goods and others. The Bank’s research capacities are an indispensable information source to our investment banking operations. Through company valuations, financial analyses, credit potential analyses, company profiles and industry rese-arch reports, our clients are supplied with valuable information required for their investment banking decisions. Through asset management services, the Bank provides clients with custo-mized strategic investment solutions in a range of traditional and alternative asset classes. Our offer includes: advisory services; asset allocation; cash management; investment mana-gement in equities and fixed income; real estate and other alternative areas. While maintaining an ongoing tru-stworthy relationship with our clients,

bution channels and Credit administra-tion department.
Logistics areas Business areas focusing on client requirements can only fully exploit their potential if they are provided with a reliable and efficient infrastructure. The Accounting, Financial control and General Administration Group, led by the Chief Financial Officer, provide skilful and in-depth support with regard to all financial monitoring and reporting matters, financial planning and budge-ting as well as administrative assistance to the business groups. The IT and Operations Group repre-sents a key part of the organisation that serves the entire Bank by providing IT and communications assistance, supporting distribution channels and feeding the system with financial infor-mation. Risk management and control is a crucial part of our commitment to providing consistent, high-quality returns for our shareholders. It is our belief that delivery of superior sharehol-der returns greatly depends on achie-ving the appropriate balance between risk and return. In this context, we established the Risk Management and Risk Control Group to protect the Bank from the risk of severe loss as a result of unlikely events arising from any of the material risks we face and to limit the scope of materially adverse implications to shareholder returns. Within the same Group there is a Loan recovery and re-structuring division established with the goal of helping clients, who are unable to meet their financial obligations, to accomplish economic recovery through restructuring. The Subsidiaries mana-gement division, the Human resource division, the Legal affairs and taxation management division, the Corporate communications office, the Economic research and strategic planning office, the Project management office, the Ma-nagement Board office as well as the Supervisory Board office are integral elements of the overall logistics and support of the business groups and the management.
ces and the assurance required in successfully accomplishing all their business goals.
Support DivisionThis division offers full business sup-port to all organisational units of the Corporate, Treasury and Investment Banking Group. In order to improve communication and relations with clients, the Support division has esta-blished an Information Centre where clients can obtain all relevant informa-tion pertaining to the products and services of the Corporate, Treasury and Investment Banking Group.
Small and Medium-sizeEnterprises Group As part of the new organizational structure of the Bank, which has been in force since February 2006, the Small and Medium-size Enterpri-ses Group was formed, so instead of the previous sector within the Corpo-rate Banking Group, this segment of its operations has been raised to the highest organizational level. A new form of business was introdu-ced in 2006 with small and medium sized enterprises based on Credit Scoring and today the Bank has a number of products based on Credit Scoring. Credit Scoring enables flexi-bility and ensures proactive, direct approach to clients. Project factoring was also introduced last year. Today the factoring desk is a modern and flexible part of the or-ganization, with highly educated and motivated staff. Thanks to support from Intesa Mediofactoring, and the training and know how passed on, PBZ can now deal in international factoring, and PBZ is the only bank in Croatia to receive an international license in this field. The “cluster” project was launched recently. In this way we have a spe-cial line of credit for sub-contractors
of companies producing high quality and original Croatian products. It is planned to create similar lines for ot-her products with confirmed Croatian quality, which are able to compete on the European market. Currently, there are 51 SME desks already developed throughout PBZ’s branch network. The development of the SME desk project for financial transactions has grown from a pro-ject into a permanent organizational structure. RM online - new front line softwa-re application has recently been introduced to facilitate the work of our relationship managers. Through the use of this application, we will significantly reduce the paper work involved in the process today. The SME Group consists of two divisions:
Small and Medium-size Enterprises (SME) Division This division is responsible for opera-tions with small-medium enterprises and companies owned by foreign institutions. In order to adequately run these operations the Division has split duties between three teams: Team for Small-Medium Enterprises, International Clients Acquisition Desk and Factoring Desk. In addition to the afore-mentioned duties, the Division also coordinates and supervises operations of the Bank’s subsidiaries, PBZ Leasing and Meimurska ban-ka, which are subordinated to and under the control of the Division.
Division for Product Develo-pment and Branch Coordination This Division is responsible for mar-ket research, product development primarily oriented towards small and medium enterprises as well as craftsmen, development of payment systems, SME desk management, branch coordination, call centre supervision and SME credit admini-stration.With the aim of running these ope-rations appropriately the Division is supported by the following teams and departments: Team for branch coordination, Department for product development, Department for distri-

24 25
annualreport
2007
Privredna banka Zagreb d.d.
PBZ Card d.o.o.100%
Centurion d.o.o.LjubljanaSlovenia
25%
PBZ Nekretnine d.o.o.100%
Centurion d.o.o.Bosnia andHerzegovina
100%
Meimurskabanka d.d.
96%
PBZ Invest d.o.o.100%
PBZ Leasing d.o.o.100%
PBZ Croatiaosiguranje d.d.
50%
Invest HoldingKarlovac d.o.o.
56%
PBZ Stambenaπtedionica d.d.
100%
The Group
The Privredna banka Zagreb Group is a Croatian based financial services group which provides a full range of retail and corporate banking services to customers in Croatia. The Group employs some 4,403 employees and serves almost 1.6 million both private and corporate clients in the country. PBZ Group today is a well-organized institution whose market share in the overall banking system stands at 18.5 percent. On 31 December 2007 the Group consisted of Privredna ban-ka Zagreb and 8 subsidiaries and 2 associates. The composition of the Group and a brief description of each subsidiary are set out below.
Meimurska banka Meimurska banka was established in 1954 under the name of Zadružna banka i štedionica Ëakovec. Since that time, the bank has experienced many changes both in name and organisa-tional structure. It began operations under its current name in 1978 and became a joint stock company at the end of 1989. During 1996 Meimurska banka was among the first banks in Croatia to obtain the certificate for quality management standards in line with the ISO 9002 quality system. Privredna banka Zagreb acquired a majority stake in Meimurska banka at
the end of 2000, making it a member of the PBZ Group and Gruppo Banca Intesa (now Gruppo Intesa Sanpaolo).Currently the bank has 17 branches located in the region of Meimurje. It uses its network to provide services to more than 5 thousand companies and over 150 thousand individual clients. While monitoring the global trends in banking, the bank has continuously worked on expanding and updating its products and services. The bank is recognised as a pioneer in electro-nic banking in the country. Its main activities are concentrated on lending, and several new products have been launched including customer depo-sits, direct banking, card operations, kuna and foreign currency processing. At the beginning of 1998, the bank introduced an interactive telephone banking service. Only a year later, they were the first in the country to launch the Internet banking system. The bank also significantly increased the number of ATMs and EFT POS units during the year. Meimurska banka successfully completed the implementation and launch of its payment system during the payment system reform in 2002. The bank operates the system inde-pendently. It opens and runs business accounts and payment transactions for corporate clients while offering
them one-stop shop for banking servi-ces in less time and with lower costs.Meimurska banka plans to continue operating in all its different activities with the support of PBZ while maintai-ning its own legal and business identi-ty that is recognized by the market.
PBZ Card In late December 2005 charge, credit and debit card operations of PBZ were integrated with PBZ American Express into the new company, PBZ Card, that deals with all card operations of the PBZ Group. By combining all card brands - American Express, Master-Card and Visa, the largest card institu-tion in the region has been established with more than 2 million cards issued. The new company has established a joint IT platform for processing American Express, MasterCard and Visa products in Croatia and also for companies in Gruppo Intesa Sanpaolo that reside in several foreign markets. The aim of PBZ Card is to be the leader in the launch of innovative products and development of new te-chnologies in the region. The company will strive to maintain the leading posi-tion and to continue its market pene-tration that will further increase PBZ’s market share in card operations. PBZ Card aims to be a centre of excellence

and market leader in card processing for all brands not just in the PBZ Group but also in Intesa Sanpaolo. No matter if American Express, MasterCard or Visa cards, the three leading card bran-ds in the world, are used for shopping or for taking advantage of the related benefits and services linked to these cards, PBZ Card makes this possible throughout the world. PBZ Card is providing service to its clients 365 days in a year. American Express is an inter-nationally recognised trademark always associated with exceptional quality. The trademark has been present here on the Croatian market since 1965. PBZ American Express was operating as a subsidiary of Privredna banka Zagreb from 1998. It has grown into the largest company in the country with over 2 million issued cards (combined with
PBZ) being accepted at approximately 50,000 service establishments coun-trywide. The company recorded total turnover on all cards in circullation in amount of more than HRK 26 billion.
PBZ Invest PBZ Invest is a subsidiary of Pri-vredna banka Zagreb specialising in the establishment and management of investment funds. The company was established in 1998 and is fully owned by Privredna banka Zagreb. PBZ Invest is an active member of the Financial Brokerage Association within the Croatian Employers’ Association, as well as a member of the Group of investment fund management com-panies within the Croatian Chamber of Commerce. Investment funds are state-of-the-art financial instruments
managed by specialist managers that enable investors to earn a competitive return on money invested. PBZ Invest is confident that there is a good future for investment funds on the Croatian financial market. The company intends to offer its clients a wide range of investment funds, thus meeting the needs of investors with a variety of preferences and investment goals, ranging from conservative clients who prefer safety and liquidity of investment to those who are not averse to risk and want to see their investment grow over a long-term period. With that in mind, PBZ Invest commenced with its first fund in 1999 - PBZ NovËani fond, an open-ended investment fund. In recent years, seven new funds were esta-blished: PBZ Euro novËani fund, PBZ Kunski novËani fund, PBZ Global fund,
PBZ Bond fund, PBZ Dollar fund, PBZ Equity fund and PBZ I-Stock fund. In cooperation with PBZ, during 2005, PBZ Invest launched two tranches of a structured product - PBZ Protecto. The product is a combination of inves-tment funds and classic savings with a Bank, with guarantee for invested money. At the end of 2007, assets under management in all the funds run by the company have exceeded HRK 6.3 billion, which is almost two times higher compared to the previous year.
PBZ NovËani fond, open-ended investment fundPBZ NovËani fond is an open-ended investment fund with a strictly conser-vative investment philosophy, focusing on low risk investments and high liqu-idity. The goal of the fund is to offer all
its investors a low-risk investment, an uninterrupted and unconditional liqui-dity option, return on investment that is competitive by market standards and protection from adverse movements in the kuna exchange rate (investment with a currency clause option). Purcha-sing units of the Fund enables investors to earn higher returns on their inves-tment than would be in a case with the usual savings account.
PBZ Bond Fund, open-ended investment fundThe investment fund was developed in association with Intesa Sanpaolo. The goal of the Fund is to enable both pri-vate and institutional investors to earn income by investing in first-class global bonds, issued by foreign governments, local governments and the most stable
global corporations, denominated in stable global currencies.
PBZ Global Fund, open-ended investment fundThe Fund’s operations consist of attracting cash assets by public bidding of its shares and investment of assets thus collected in safe and profitable instruments, offered on both domestic and foreign financial markets. Given the strategy and the choice of instruments, the Fund is chosen by investors who want to invest their assets for a period of two to five years.
PBZ Euro novËani fond and PBZ Kunski novËani fond, open-ended investment fundsThese funds are open-ended inves-tment funds established in 2002,

26 27
annualreport
2007
designed for domestic investors who wish their investments to be pegged to the Euro or Kuna.
PBZ Dollar Fund, open-ended investment fundThis money market fund was launched in May 2005 as the first domestic Mo-ney Market Mutual Fund denominated in USD. Assets are invested into low risk short-term Government securities, primarily issued by USA and securities denominated in USD issued by mem-ber countries of the EU and OECD. It is suitable for conservative investors who are more inclined to invest in dollars.
PBZ Equity Fund, open-ended investment fundA higher risk fund that offers to its investors possibility of investing speci-
fically in domestic and foreign shares. This fund is appropriate for individual investors interested in high return at significant risk.
PBZ I-Stock Fund, open-ended investment fundThe newest fund of PBZ Invest is oriented to eastern equity and fixed capital markets. It offers its investors possibility of investing specifically in emerging economies of near and far east.
PBZ Nekretnine PBZ Nekretnine is a wholly owned subsidiary of Privredna banka Zagreb which engages in property transaction services, construction management and real estate valuation. Privred-na banka Zagreb established PBZ
Nekretnine with the goal of providing its clients with a complete range of services relating to property and investment in business projects. PBZ Nekretnine offers apartments, houses, business premises, construction sites and other properties for sale. The activities of PBZ Nekretnine invol-ve property transactions, property transaction services, property renting, construction, planning, construction supervision, construction evaluation, appraisal of property value, prepa-ration of feasibility studies for inves-tments, as well as legal supervision of works. PBZ Nekretnine has a professi-onal team capable of answering all its clients’ complex requests. The compa-ny provides all kinds of services related to the activities mentioned, no matter how specific and complicated the
clients’ demands are. PBZ Nekretnine employs highly trained employees, five of which are court experts in the field of construction.The company has been operating successfully within the Group since it was founded at the beginning of 1999. For the needs of its clients, PBZ Nekretnine has developed a network of associates and at the moment colla-borates with almost 60 associates.
PBZ Leasing PBZ Leasing is wholly owned by Pri-vredna banka Zagreb. It was founded in 1991 under the name of PBZ Stan. In the beginning it dealt with property appraisals and restructuring of the public housing fund. During 1995, the company commenced granting car purchase loans by placing funds of
Privredna banka Zagreb. In the past several years, leasing has become core business activity of the company. Through both finance and operating leases, the company engaged in financing of real estates, vehicles, leasure boats, heavy machinery and equipment. By the end of 2007, PBZ Leasing made over 6.2 thousand lease arrangements with customers, which in financial terms reached almost HRK 1,2 billion.
PBZ Croatia osiguranjePBZ Croatia osiguranje is a joint stock company for compulsory pension fund management. The company was incorporated on 26 July 2001 in accordance with the new changes in Croatian pension legislation and it is a mutual project of both Privredna banka
Zagreb d.d. and Croatia osiguranje d.d. with ownership in the company of 50 percent belonging to each share-holder. The principal activities of PBZ Croatia osiguranje include establishing and management of the compulsory pension fund. After the process of the initial stages of gathering members, PBZ Croatia osiguranje fund became one of the three largest compulsory funds in the country. Despite fier-ce competition on the market, the company’s pension fund continued to operate successfully during 2006. In the successful management of its fun-ds, PBZ Croatia osiguranje relies on its positive experience to date in mana-ging investment funds and association with Gruppo Intesa Sanpaolo asset management. At this point, the fund has over to 231 thousand members

and net assets in personal accounts exceeding HRK 3.6 billion which repre-sents a sound base for the long-term stable and profitable operation of the company.
PBZ Stambena štedionicaPBZ Stambena štedionica is the third largest building society on the Croatian financial market. It was founded by Privredna banka Zagreb. Given the lar-ge number of our clients interested in housing savings, the company offers them three types of savings: Prima, Basic and Golden savings. At present there are more than 110 thousand sa-vings contracts which amount to more than HRK 1.3 billion. Prima and Basic types are aimed at clients whose goal is to make use of a housing loan with exceptionally favourable interest rates. Golden savings are designed for cli-ents whose first intention is long-term saving. These forms of saving are run with a foreign currency clause in euros whilst deposits are insured in accor-dance with the Banking Law. There is also the possibility of changing the type of savings account whilst saving. Clients have the opportunity to mana-ge their own savings accounts from their own home by means of Internet banking through PBZ365@NET and PBZ365 Optima services.
Invest Holding KarlovacInvest Holding is a limited liability company incorporated on 11 Novem-ber 1990. On 22 November 1990 it was registered in the Court Register in Karlovac. The sole founder of the company was KarlovaËka banka. On 12 December 1990 KarlovaËka banka sold 56.38 percent of its shares in the company to Privredna banka Zagreb. The company is registered for various activities, however it mainly engages in renting its own premises acquired through the liquidation of Jugoturbina Karlovac.

28 29
annualreport
2007
Review of Activities in PBZ’s Social Responsibility Program

We are aware that success in business is not only measured by financial results but, in today’s modern society, it equally implies activities in the field of social responsibility and a contribution to sustainable development. Therefore PBZ has directed its energy at playing a proactive role in society and endeavors to be the initiator and supporter of ideas aimed at improving and advancing the quality of life in Croatia.
Sponsorship and DonationsPrivredna banka Zagreb endeavors to make a contribution and show its responsibility towards the wider community through sponsorship and donations. The Bank contributes to the development of local communities by actively involving our Regional branch offices in sponsorship and donation programs involving institutions, associations and individuals in Croatia.PBZ endeavors, in the course of its work, to support and initiate many cultural events and happe-nings, and contribute to the improvement of the quality of life of our community.
SponsorshipsScience and education 633.365Sport 13.816.925Culture 629.141Others 15.000Total: 15.094.431
Through its sponsorship policy, as well as promoting its own brand name, PBZ also seeks to support and encourage a large number of projects in the fields of culture, sport and science, and in that way contribute to the development of Croatian society.• From the very outset in 2003, PBZ has been involved in the major Caritas fundraising campaign
“For One thousand Joys”. The aim of the campaign is to raise money to help 1000 low income families in Croatia from funds which businesses set aside for Christmas and New Year’s parties. As well as donating money, PBZ supports the campaign by buying Caritas Christmas cards.
• As a member of the Croatian Olympic POOL, PBZ earmarks funds every year to finance the Croatian Olympic Committee and in that way provides for the quality preparation of our Olympic sportsmen and women
• In 2007 the Bank sponsored the ATP Croatian Indoors tournament and also the Croatian Fo-otball Federation.
• The Bank is a sponsor of the Faculty of economics in Zagreb and the Mediterranean Institute for Life Sciences in Split
• The various cultural programs that PBZ has supported include sponsorship of the BBC Philhar-monic Concert in Zagreb
DonationsScience and education 322,500Sport 681,000Culture 1,242,500Social solidarity 1,468,167Others 2,156,010Total: 5,870.177
• We would like to point out the donations in 2007 to the traditional cultural event “VinkovaËke jeseni” (Vinkovci Autumn Festival) and the famous Dubrovnik Summer Festival.
• Donations began in 1999 to the Humanitarian Foundation for the Children of Croatia to provide support to 350 children under the care of the Foundation, with a monthly sum of HRK 300.00 per child. We are continuing to support this aid program.
• PBZ also actively supports local and regional sporting events and organizations
Review of Activities in PBZ’s Social Responsibility Program

30 31
annualreport
2007CSR ProjectsAs a part of the program “PBZ Prijatelj”, PBZ cooperates with non profit organizations on several CSR projects:
• In cooperation with UNDP in Croatia and the Croatian Banking Association, PBZ is actively involved in a project of CSR in banking, organizing educational interactive workshops for the general public entitled “Managing your Personal Finances”. In 2007 more than 600 citizens took part in the workshops and praised their usefulness and the organization. The CBA and the nine banks participating in the project have decided to go on running free workshops for citizens in 2008.
The banks’ workshops are a unique example of sector cooperation, where one branch of indu-stry jointly runs an educational activity in the community, although they are competitors on the market.
The workshops are run by teams made up of two bank employees, that are two people from two different banks, and the banks donate their staff’s time to the community.
Apart from the joint work of the banks, a partnership relationship has been established with the cities, and city entities (library, info centers, charities…) for locations for holding the workshops.
• PBZ has joined the international student exchange program for pupils aged 15 to 18 years run by the AFS (Associated Field Service), a highly regarded international voluntary, not-for-profit organization dealing in exchanges of pupils. PBZ sponsors two one year scholarships every year.
• This year again we continued with the PBZ Bridge loans program, and for five of the best students scholarships were provided, in cooperation with Banca Intesa, to attend the Double Degree Program at one of the most prestigious Italian faculties - the Politecnico di Milano.
• PBZ supports and participates in the work of the Community for Social Responsibility within the Croatian Chamber of Commerce, co-operates with the UNDP in Croatia on projects in the field of social responsibility and has joined the global initiative - Global Compact.
Education and professional development• Based on the relevant information on each employee’s development potential given by psycho-
logical testing, over 500 high-potential employees undertook a series of assessment courses. Consequently, a final pool of 240 key employees were identified and included in the first edition of the PBZ Business School established in February 2007.
PBZ BS consists of three levels of managerial programs: 1) GENERAL MANAGEMENT PROGRAM - 120 participants, young talents 2) OPERATIVE/SALES MANAGEMENT - 86 participants, line managers, experts 3) STRATEGIC MANAGEMENT - 24 participants, executive directors
The duration of each program is 3 years and every year there are 4 modules. Each module lasts for 3 days and is given by external providers at various locations in Croatia. • In June 2007 we also launched the “eHR Management Portal” to support PBZ managers in
their decision-making. It combines all relevant data (results of testing, career history, payrolls, appraisals...) about each of 3614 employees and serves as a crucial vehicle for all major HR activities.

In accordance with the Companies Law and its Article of Association, the Bank has a Supervisory Board and a Management Board. The two boards are separate and no individual may be a member of both boards. The duties and responsibilities of members of both boards are regulated by the Companies Law.
Supervisory Board The Supervisory Board consists of
seven members. The Board meets qu-arterly and oversees the Management Board. The current members of the Bank’s Supervisory Board, appointed on the three year term by the Extraor-dinary General Assembly held on 30 January 2007, are as follows:
György Surányi (President of the Su-pervisory Board, Intesa Sanpaolo)Giovanni Boccolini (Vicepresident of the Supervisory Board, Intesa Sanpaolo)Adriano Arietti (Member of the Super-visory Board, Intesa Sanpaolo)Massimo Malagoli (Member of the Supervisory Board, Intesa Sanpaolo)Massimo Pierdicchi (Member of the Supervisory Board, Intesa Sanpaolo)
Paolo Grandi (Member of the Supervi-sory Board, Intesa Sanpaolo) Anne Fossemalle (Member of the Supervisory Board, EBRD)
Audit CommitteePursuant to the Articles of Associa-tion of Privredna banka Zagreb, the Supervisory Board on its 15th meeting held at 10 December 2002 established the Audit Committee and adopted the Audit Committee Charter. The Audit Committee may consist of up to seven members, however, there are cu-rrently six members appointed by the Supervisory Board on 21 December 2007. The Committee is responsible for monitoring various important pro-cesses such as: the financial repor-ting, internal audit, risk management, compliance with laws, regulations as well as code of conduct in PBZ Group. Finally, the Audit committee acts as an
important contact for the external au-ditor, whose independence it supervi-ses. Members of the Audit Committee are the following:
Giampiero Trevisan, presidentMassimo Pierdicchi, memberTünde Barabás, memberEzio Salvai, memberBeata Kissné Földi, memberArmando Sala, member
Management Board The Management Board consists of seven members with each being allocated a specific area of responsi-bil-ity. The Management Board meets at least twice a month to discuss and determine the operating polici-
es of the Bank. Following the three year term the mandate of the former Management Board expired on 6 February 2006. Accordingly, the new Management Board was appointed on the three year term effective from 7 February 2006.
Management Board members:
Božo Prka, President of the Management BoardMarco Capellini, Vicepresident of the Management Board, responsible for the Risk Management and Control Group - appointed on 1 November 2007Tomislav LazariÊ, Vicepresident of the Management Bo-ard, responsible for the Retail Banking GroupGabriele Pace, Chief financial officer, responsible for the Accounting, Finan-
cial Control and General Administrati-on Group Ivan Gerovac, responsible for the Corporate, Treasury and Investment Banking GroupMario Henjak, responsible for the SME Banking GroupDraženko Kopljar, responsible for the Information Technology and Operati-ons Group---Previous member in 2007 was also:Giancarlo Miranda, Vicepresident of the Management Board, responsible for the Risk Management and Con-trol Group - mandate expired on 31 October 2007
Corporate governance

32 33
annualreport
2007
Pursuant to the Croatian Accoun-ting Law in force, the Management Board is responsible for ensuring that financial statements are prepared for each financial year in accordance with the International Financial Reporting Standards (IFRS) as published by the International Accounting Standards Board (IASB) which give a true and fair view of the financial position and results of the Bank and the Group for that period.
The Management Board has a reaso-nable expectation that the Bank and the Group have adequate resources to continue in operational existence for the foreseeable future. For this reason, the Management Board continues to adopt the going concern basis in preparing the financial statements.In preparing those financial state-ments, the responsibilities of the Ma-nagement Board include ensuring that:
• suitable accounting policies are selected and then applied consi-stently;
• judgements and estimates are reasonable and prudent;
• applicable accounting standards are followed, subject to any material departures disclosed and explained in the financial statements; and
• the financial statements are pre-pared on the going concern basis unless it is inappropriate to presu-me that the Bank and the Group will continue in business.
The Management Board is respon-sible for keeping proper accounting records, which disclose with reasona-ble accuracy at any time the financial position of the Bank and the Group, and must also ensure that the financial statements comply with the Croatian Accounting Law in force. The Mana-gement Board is also responsible for safeguarding the assets of the Bank and the Group and hence for taking reasonable steps for the prevention
and detection of fraud and other irre-gularities.
Signed on behalf of the Management Board
Božo Prka, M.S.Privredna banka Zagreb d.d.RaËkoga 610000 ZagrebRepublic of Croatia
12 February 2008
Statement of responsibilities of the Manage-ment Board
Annual questionnaire on Corpora-te governanceCorporate governance in Privredna banka Zagreb is conducted by compl-ying with the regulatory requirements in Croatia. As a bank which shares are listed on the Zagreb Stock Exchange, PBZ applied the Corporate Governan-ce Code jointly drawn by the Croatian Financial Services Supervisory Agency (Hanfa) and the Zagreb Stock Exchan-ge, and subsequently stipulated by Hanfa (National Gazette No. 46/07). In that context, PBZ completed manda-tory Annual Questionnaire for 2007 (available on our website in the Internet at www.pbz.hr) which discloses corporate governance practices in the Bank in relation to the recommenda-tions set out in the Corporate Gover-nance Code.With the aim of protecting interest of the investors, shareholders, clients,
employees as well as other stake-holders, the Bank implemented the highest standards of the corporate governance well-grounded in the internationally recognized principles of the corporate governance. Privredna banka Zagreb ensured transparent bu-siness conduct which enabled sound and responsible governance in 2007 and successful supervision of opera-ting and managerial functions.


34 35
annualreport
2007
Independent auditors’ report


36 37
annualreport
2007
We have audited the accompanying financial statements of Privredna banka Zagreb d.d. (the ‘Bank’) and of Privredna banka Zagreb d.d. and its subsidiaries (the ‘Group’) (page 38 to 102), which comprise the balance sheet as at 31 December 2007, and the related income statement, statement of changes in equity and cash flow statement for the year then ended, and a summary of significant accounting policies and other explanatory notes.
Management’s Responsibility for the Financial Statements
Management is responsible for the preparation and fair presentation of these financial statements in accordance with International Financial Reporting Standards. This responsibility includes: designing, implementing and maintaining internal control relevant to the preparation and fair presentation of financial statements that are free from material misstatement, whether due to fraud or error; selecting and applying appropriate accounting policies; and making accounting estimates that are reasonable in the circumstances.
Auditor’s Responsibility
Our responsibility is to express an opinion on these financial statements based on our audit. We conducted our audit in accordance with International Standards on Auditing. Those standards require that we comply with ethical requirements and plan and perform the audit to obtain reasonable assurance whether the financial statements are free from material misstatement.
An audit involves performing procedures to obtain audit evidence about the amounts and disclosures in the financial statements. The procedures selected depend on the auditor’s judgment, including the assessment of the risks of material misstatement of the financial statements, whether due to fraud or error. In making those risk assessments, the auditor considers internal control relevant to the Bank’s and the Group’s preparation and fair presentation of the financial statements in order to design audit procedures that are appropriate in the circumstances, but not for the purpose of expressing an opinion on the effectiveness of the Bank’s and the Group’s internal control. An audit also includes evaluating the appropriateness of accounting policies used and the reasonableness of accounting estimates made by management, as well as evaluating the overall presentation of the financial statements.
We believe that the audit evidence we have obtained is sufficient and appropriate to provide a basis for our audit opinion.
Opinion
In our opinion the financial statements present fairly, in all material respects, the financial position of the Bank and of the Group as at 31 December 2007, and their financial performance and their cash flows for the year then ended in accordance with International Financial Reporting Standards.
Deloitte d.o.o.Branislav VrtaËnik, Certified Auditor
Zagreb, Republic of Croatia29 February 2008
Independent auditors’ reportTo the shareholders of Privredna banka Zagreb d.d.:
Deloitte d.o.o.ZagrebTower RadniËka 80 10 000 Zagreb, Croatia
Tel: +385 (0) 1 2351 900Fax: +385 (0) 1 2351 999www.deloitte.com/hr
Audit • Tax • Consulting • Financial Advisory • Member of Deloitte Touche Tohmatsu

Income statement NOTE GROUP BANK
(in HRK million) 2007 2006 2007 2006
Interest income 2 3,627 2,976 3,274 2,720
Interest expense 2 (1,709) (1,262) (1,577) (1,185)
Net interest income 1,918 1,714 1,697 1,535
Fee and commission income 3 1,300 1,077 585 488
Fee and commission expense 3 (236) (218) (212) (197)
Net fee and commission income 1,064 859 373 291
Other operating income 4 423 466 404 444
Operating income 3,405 3,039 2,474 2,270
Provisions 5 (121) (153) (54) (57)
Other operating expenses 6, 7 (1,578) (1,420) (1,111) (1,007)
Depreciation and amortisation of property and equipment and intangible assets 8 (268) (255) (162) (165)
Share of the profit and loss accounted for using the equity method 18 8 8 - -
Profit before income taxes 1,446 1,219 1,147 1,041
Income taxes 9 (303) (254) (215) (194)
Net profit for the year 1,143 965 932 847
Attributable to:
Equity holders of the parent 1,141 963 932 847
Minority interests 2 2 - -
1,143 965 932 847
in HRK in HRK
Basic/diluted earnings per share 47 60.0 56.9 49.0 50.1
The accompanying accounting policies and notes are an integral part of this Income statement.

38 39
annualreport
2007
Balance sheet NOTE GROUP BANK
Assets (in HRK million) 2007 2006 2007 2006
Cash and current accounts with other banks 10 2,471 2,576 2,356 2,328
Balances with Croatian National Bank 11 8,194 7,262 7,934 7,049
Financial assets at fair value through profit or loss 12 4,170 3,056 4,182 3,074
Derivative financial assets 13 33 44 33 44
Due from banks 14 7,245 7,235 6,726 6,935
Loans and advances to customers 15 40,147 36,910 36,436 33,572
Assets available for sale 16 1,853 1,305 482 53
Held to maturity investments 17 1,288 1,358 979 1,158
Equity investments in subsidiaries and associates 18 49 45 363 404
Intangible assets and goodwill 19 171 200 70 65
Property and equipment 20 1,378 1,381 847 883
Investment property 21 15 14 15 14
Non-current assets held for sale 22 - 18 - 18
Other assets 23 389 449 211 226
Deferred tax assets 9 147 121 97 83
Total assets 67,550 61,974 60,731 55,906

Balance sheet / continued NOTE GROUP BANK
Liabilities (in HRK million) 2007 2006 2007 2006
Due to banks 24 3,129 4,518 3,127 4,503
Due to customers 25 41,918 36,843 38,694 33,491
Derivative financial liabilities 13 38 15 38 15
Financial liabilities held for trading 12 - 735 - 735
Other borrowed funds 26 11,760 9,956 10,244 9,147
Debt securities issued 27 66 119 - -
Other liabilities 28 1,708 1,832 460 649
Accruals and deferred income 29 163 120 79 66
Provisions for risks and charges 30 265 211 242 186
Total liabilities 59,047 54,349 52,884 48,792
Equity attributable to equity holders of the parent
Share capital 32 1,907 1,907 1,907 1,907
Treasury shares (57) (27) (57) (27)
Share premium 1,570 1,570 1,570 1,570
Reserves and retained earnings 33 3,918 3,167 3,495 2,817
Profit and loss attributable to equity holders 1,141 963 932 847of the parent entity
8,479 7,580 7,847 7,114
Minority interests 24 45 - -
Total shareholders’ equity 8,503 7,625 7,847 7,114
Total liabilities and shareholders’ equity 67,550 61,974 60,731 55,906
The accompanying accounting policies and notes are an integral part of this Balance sheet.These financial statements were signed on behalf of the Management Board on 12 February 2008.
Božo Prka, M.S. Gabriele PacePresident of the Management Board Chief financial officer

40 41
annualreport
2007
Cash flow statement GROUP BANK
(in HRK million) 2007 2006 2007 2006
Cash flow from operating activities
Profit before tax 1,446 1,219 1,147 1,040
Provisions for bad and doubtful debts and other provisions 121 153 54 57
(Gains)/losses from sale of property and equipment (14) (38) 6 (37)
Depreciation and amortization 268 255 162 165
Unrealised (gains)/losses on securities at fair value through profit or loss (6) 16 (6) 16
Valuation of derivatives 34 (31) 34 (31)
Share of results of associates (8) (8) - -
Taxes paid (263) (200) (190) (164)
1,578 1,366 1,207 1,046
(Increase)/decrease in operating assets
Balances with Croatian National Bank (932) (1,867) (885) (1,865)
Due from banks 147 307 214 147
Loans and advances to customers, net of provisions (3,655) (8,037) (2,857) (6,923)
(Acquisitions)/sale of assets held for trading and assets available for sale (1,608) 480 (1,440) 1,367
Other assets 43 (139) 14 (39)
Increase/(decrease) in operating liabilities (4,427) (7,890) (3,747) (6,267)
Due to banks (1,352) 1,208 (1,376) 592
Due to customers 5,564 3,963 5,203 3,487
Liabilities held for trading (735) (453) (735) (453)
Other liabilities (139) 142 (226) (171)
Net cash (used in)/from operating activities (1,089) (3,030) (881) (2,812)
Cash flows from investing activities
Net purchase of property and equipment and intangible assets (258) (407) (119) (253)
Acquisition, disposal and recapitalisation of subsidiaries and associates (165) 91 (40) (106)
Repayment/(purchase) of assets held to maturity 70 (6) 179 171
Net cash (used in)/from investing activities (353) (322) 20 (188)
Cash flows from financing activities
Dividends paid to equity holders of the parent (190) - (190) -
Dividends paid to minority interest (2) - - -
Additional paid in capital - 1,811 - 1,811
Other borrowed funds 1,823 1,706 1,097 1,169
(Redemption)/proceeds from debt securities issued (53) 100 - (19)
Net proceeds from sale of treasury shares (13) 4 (13) 4
Net cash (used in)/from financing activities 1,565 3,621 894 2,965
Net increase/(decrease) in cash 123 269 33 (35)
Cash and cash equivalents at the beginning of the year 9,047 8,778 8,507 8,542
Cash and cash equivalents at the end of the year 9,170 9,047 8,540 8,507
Supplementary information
Interest paid 1,251 1,095 1,115 973
Interest received 3,045 2,494 2,692 2,202
Dividends received 6 5 144 104
The accompanying accounting policies and notes are an integral part of this Cash flow statement.

Statement of changes in equity Attributable to equity holders of the parent
Share Treasury Share Reserves Total Minority Total capital shares premium and interests equity retained (in HRK million) profits
Group
Balance at 1 January 2006 1,666 (20) - 3,152 4,798 22 4,820
Net gains on available for sale financial - - - 4 4 - 4investments
Capital gain on disposal of treasury shares - - - 11 11 - 11
Total income and expense for the year - - - 15 15 - 15recognised directly in equity
Net profit for the year - - - 963 963 2 965
Total income and expense for the year - - - 978 978 2 980
Increase of share capital 241 - 1,570 - 1,811 - 1,811
Net (purchase)/sale of treasury shares - (7) - - (7) - (7)
Acquisition of LT Gospodarska banka - - - - - 21 21
Balance at 31 December 2006 1,907 (27) 1,570 4,130 7,580 45 7,625
Net losses on available for sale financial investments - - - (39) (39) - (39)
Capital gain on disposal of treasury shares - - 17 17 - 17
Total income and expense for the year - - - (22) (22) - (22)recognised directly in equity
Net profit for the year - - - 1,141 1,141 2 1,143
Total income and expense for the year - - - 1,119 1,119 2 1,121
Equity dividends - - - (190) (190) - (190)
Net (purchase)/sale of treasury shares - (30) - - (30) - (30)
Divestment of LT Gospodarska banka - - - - - (21) (21)
Dividends of subsidiaries - - - - - (2) (2)
Balance at 31 December 2007 1,907 (57) 1,570 5,059 8,479 24 8,503

42 43
annualreport
2007
Statement of changes in equity / continued Attributable to equity holders of the parent
Share Treasury Share Reserves Total Minority Total capital shares premium and interests equity retained (in HRK million) profits
Bank
Balance at 1 January 2006 1,666 (20) - 2,787 4,433 - 4,433
Net gains on available for sale financial investments - - - 19 19 - 19
Capital gain on disposal of treasury shares - - - 11 11 - 11
Total income and expense for the year recognised directly in equity - - - 30 30 - 30
Net profit for the year - - - 847 847 - 847
Total income and expense for the year - - - 877 877 - 877
Increase of share capital 241 - 1,570 - 1,811 - 1,811
Net (purchase)/sale of treasury shares - (7) - - (7) - (7)
Balance at 31 December 2006 1,907 (27) 1,570 3,664 7,114 - 7,114
Net gains on available for sale financial investments - - - 4 4 - 4
Capital gain on disposal of treasury shares - - - 17 17 - 17
Total income and expense for the year recognised directly in equity - - - 21 21 - 21
Net profit for the year - - - 932 932 - 932
Total income and expense for the year - - - 953 953 - 953
Equity dividends - - - (190) (190) - (190)
Net (purchase)/sale of treasury shares - (30) - - (30) - (30)
Balance at 31 December 2007 1,907 (57) 1,570 4,427 7,847 - 7,847
The amount of dividends distributed to equity holders during 2007 was 10 HRK per share. There was no distribution of dividends during 2006. The accompanying accounting policies and notes are an integral part of this Statement of changes in equity.

Accounting policies
Accounting policiesA summary of the Group’s principal accounting policies is set out below.
Basis of accountingThe Bank and the Group maintain their accounting records in Croatian Kuna and in accordance with Croatian law and the accounting principles and practices observed by financial enterprises in Croatia.
Basis of preparationThe financial statements of the Bank and the Group are prepared in million of Croatian Kuna and all values have been rounded to the nearest million, unless stated otherwise. These consolidated and Bank only financial statements are prepared in accordance with the International Financial Reporting Standards as published by the International Accounting Standards Board. The consolidated and Bank only financial statements are prepared under the historical cost convention as modified by the revaluation of assets available for sale and financial assets and financial liabilities at fair value through profit and loss.The financial statements have been presented in a format generally accepted and internationally recognised by banks and in accordance with International Financial Reporting Standards.
Basis of consolidated (Privredna banka Zagreb Group) and Bank only financial statementsFinancial statements are presented for the Bank and the Group. The Group financial statements comprise the consolidated financial statements of the Bank and entities controlled by the Bank (its subsidiaries). Control is achieved where the Bank has the power to govern the financial and operating policies of an entity so as to obtain benefits from its activities. Subsidiaries are consolidated from the date on which effective control is transferred to the Group and are no longer consolidated from the date of disposal. All intercompany transactions, balances and unrealised surpluses and deficits on transactions between group companies have been eliminated. Where necessary, the accounting policies used by subsidiaries have been changed to ensure consistency with the policies adopted by the Group.Minority interests in the net assets (excluding goodwill) of consolidated subsidiaries are identified separately from the Group’s equity therein. Minority interests consist of the amount of those interests at the date of the original business combination and the minority’s share of changes in equity since the date of the combination. Losses applicable to the minority in excess of the minority’s interest in the subsidiary’s equity are allocated against the interests of the Group except to the extent that the minority has a binding obligation and is able to make an additional investment to cover the losses.Investments in associates are accounted for by the equity method of accounting in the consolidated financial statements and at cost in the Bank’s financial statements. These are undertakings over which the Group generally has between 20 percent and 50 percent of the voting rights, and over which the Group has significant influence, but which it does not control. Significant influence is the power to participate in the financial and operating policy decisions of the investee but is not control or joint control over those policies.Unrealised gains on transactions between the Group and its associated undertakings are eliminated to the extent of the Group’s interest in the associated undertakings. Unrealised losses are also eliminated unless the transaction provides evidence of an impairment of the asset transferred. The Group’s investment in associated undertakings includes goodwill. Equity accounting is discontinued when the carrying amount of the investment in an associated undertaking reaches zero, unless the Group has incurred obligations or guaranteed obligations in respect of the associated undertaking. Where necessary, the accounting policies used by the associate have been changed to ensure consistency with the policies adopted by the Group.
Business combinationAcquisitions of subsidiaries are accounted for using the purchase method. The cost of the business combination is measured as the aggregate of the fair values (at the date of exchange) of assets given, liabilities incurred or assumed, and equity instruments issued by the Group in exchange for control of the acquiree, plus any costs directly attributable to the business combination. The acquiree’s identifiable assets, liabilities and contingent liabilities that meet the conditions for recognition under IFRS 3 Business Combinations are recognised at their fair values at the acquisition date.Goodwill arising on acquisition is recognised as an asset and initially measured at cost, being the excess of the cost of the business combination over the Group’s interest in the net fair value of the identifiable assets, liabilities and contingent liabilities recognised. If, after reassessment, the Group’s interest in the net fair value of the acquiree’s identifiable assets, liabilities and contingent liabilities exceeds the cost of the business combination, the excess is recognised immediately in profit or loss.
Interest and similar income and expenseInterest income is accrued on a time basis, by reference to the principal outstanding and at the effective interest rate applicable, which is the rate that exactly discounts estimated future cash receipts through the expected life of the financial asset to that asset’s net carrying amount.Loan origination fees for loans which are probable of being drawn down, are deferred (together with related direct costs) and recognized as an adjustment to the effective yield of the loan and as such adjust the interest income. As well savings deposits origination fees are recognized as an adjustment to the effective yield of deposit and adjust interest expense.
1

44 45
annualreport
2007
2007 2006
Contributions for Pension Funds 20.00% 20.00%
Contributions for State Health Care Fund 15.00% 15.00%
Contributions for Unemployment Fund 1.70% 1.70%
Injuries at work 0.50% 0.50%
The effective interest method is a method of calculating the amortised cost of a financial asset and of allocating interest income over the relevant period. The effective interest rate is the rate that exactly discounts estimated future cash receipts (including all fees on points paid or received that form an integral part of the effective interest rate, transaction costs and other premiums or discounts) through the expected life of the financial asset, or, where appropriate, a shorter period to the net carrying amount of the financial asset.When loans become impaired, they are written down to their recoverable amounts and interest income thereafter recognised based on the rate of interest that was used to discount the future cash flows for the purpose of measuring the recoverable amount. Other fees receivable are recognised when earned. Dividend income is recognised when earned. Interest income on financial instruments at fair value through profit or loss represent nominal coupon interest.Finance lease income is allocated to accounting periods so as to reflect a constant periodic rate of return on the Group’s net investment outstanding in respect of the leases.
Fees and commission incomeFees and commission income are comprised mainly of fees receivable from enterprises for loans and guarantees granted and other services provided by the Bank and the Group, together with commissions from managing funds on behalf of legal entities and individuals and fees for foreign and domestic payment transactions. Fees and commissions are generally recognised on an accrual basis. Loan origination fees for loans which are likely to be drawn down, are generally deferred and recognised as an adjustment to the effective yield on the loan.
Operating incomeOperating income includes net interest income, net fee and commission income, foreign exchange trading gains, unrealised gains on securities at fair value, realised gains on securities classified as assets available for sale, foreign exchange revaluation, gains from disposal of fixed assets, dividends earned and other income.Rental income from operating leases is recognised on a straight-line basis over the term of the relevant lease. Initial direct costs incurred in negotiating and arranging an operating lease are added to the carrying amount of the leased asset and recognised on a straight-line basis over the lease term. Foreign currenciesIncome and expenditure arising from transactions in foreign currencies are translated to Croatian Kuna at the official rates of exchange on the transaction date. Assets and liabilities denominated in foreign currencies are translated to Croatian Kuna at the mid market exchange rate of the CNB on the last day of the accounting period. Gains and losses resulting from foreign currency translation are included in the income statement for the year.The Group has receivables and liabilities originated in HRK, which are linked to foreign currencies with one-way currency clause. Due to this clause the Group has an option to revalue the asset by the higher of: foreign exchange rate valid as of the date of repayments of the receivabes by the debtors, or foreign exchange rate valid as of the date of origination of the financial instrument. In case of the liability linked to this clause the counterparty has this option. Due to the specific conditions of the market in Republic of Croatia the fair value of this option can not be calculated as the forward rates for HRK for periods over 9 months are generally not available. As such the Group revalues its receivables and liabilities linked to this clause by the agreed reference rate valid at the date of the balance sheet or foreign exchange rate agreed by the option (rate valid at origination), whichever is higher.
Personnel expensesEmployee entitlements to annual leave are recognised when they accrue to employees. A provision is made for the estimated liability for annual leave as a result of services rendered by employees up to the balance sheet date.
Personnel social contributions According to local legislation, the Group is obliged to pay contributions to the Pension Funds and the State Health Care Fund. This obligation relates to full-time employees and provides for paying contributions in the amount of certain percentages determined on the basis of the gross salary as follows:
The Group is also obliged to withhold contributions from the gross pay on behalf of the employee for the same funds.The contributions on behalf of employees and on behalf of the employer are charged to expenses in the period to which they relate (refer to note 7).

Accounting policies
Retirement allowancesUnder the Labour Code, if determined in the employment contract or the Regulation on Personal income, the Group and the Bank are obliged to pay a retirement allowance of HRK 8 thousand to individuals who are retiring.IAS 19 Employee benefits requires post-retirement benefits and other long-term benefits to be recorded on an accrual basis. The Group and the Bank assessed their liabilities for long-term benefits in accordance with the IAS and recorded a provision in the accompanying financial statements.The obligation and costs of pension benefits are determined using a projected unit credit method, which considers each period of service as giving rise to an additional unit of benefit entitlement and measures each unit separately to build up the final obligation. Certain actuarial assumptions were made by the Management in this assessment.
TaxationCorporation tax payable is provided on taxable profits for the year at the current rate. Deferred taxes are calculated using the balance sheet liability method. Deferred income taxes reflect the net tax effects of temporary differences between the carrying amounts of assets and liabilities for financial reporting purposes and the amounts used for income tax purposes. Deferred tax assets and liabilities are measured using the tax rates expected to apply to taxable income in the years in which those temporary differences are expected to be recovered or settled. Deferred tax assets and liabilities are recognised regardless of when the temporary timing difference is likely to reverse. Deferred tax assets are recognised when it is probable that sufficient taxable profits will be available against which the deferred tax assets can be utilised. On each balance sheet date, the Bank re-assesses unrecognised deferred tax assets and the appropriateness of carrying amount of the tax assets. The Bank is subject to a tax rate of 20 percent in accordance with the Profit Tax Law.
Cash and cash equivalentsFor the purposes of the cash flow statement, cash and cash equivalents comprise balances with less than 90 days remaining maturity, including cash and current accounts with other banks.
Financial instrumentsFinancial assets and financial liabilities recorded on the balance sheet include cash and cash equivalents, marketable securities, trade and other accounts receivable and payable, long-term loans and leasing, deposits and investments. The accounting principles for these items are disclosed in the respective accounting policies.The Bank recognises financial assets and liabilities on its balance sheet when, and only when, it becomes a party to the contractual provisions of the instrument. Financial assets and liabilities held by the Group are categorised into portfolios in accordance with the Group’s intent on the acquisition and pursuant to the Group’s investment strategy. Financial assets and liabilities are classified as “At fair value through profit or loss”, “Held to maturity”, “Assets available for sale” or as “Loans and receivables”. The principal difference among the portfolios relates to the measurement of financial assets and the recognition of their fair values in the financial statements as described below.Financial assets and liabilities are offset and the net amount is reported in the balance sheet when there is a legally enforceable right to set off the recognised amounts and there is an intention to settle on a net basis, or to realise the asset and settle the liability simultaneously.Regular way transactions with financial instruments are accounted for at the date when they are transferred (settlement date). Under settlement date accounting, while the underlying asset or liability is not recognised until the settlement date, changes in fair value on the underlying asset or liability are recognised starting from trade date.When a financial asset or financial liability is recognised initially, the Group measures it at its fair value plus, in the case of a financial asset or financial liability not at fair value through profit or loss, transaction costs that are directly attributable to the acquisition or issue of the financial asset or financial liability. Financial instruments at fair value through profit or lossFinancial instruments included in this portfolio are carried at fair value financial instruments, which were either acquired for generating a profit from short-term fluctuations in price or dealer’s margin, or are securities included in a portfolio in which a pattern of short-term profit taking exists, that are classified as held for trading. These instruments are initially recognised at fair value. The fair value of investments that are actively traded in organised financial markets is determined by reference to quoted market bid prices at the close of business on the balance sheet date. For investments where there is no active market, fair value is determined using valuation techniques. Such techniques include using recent arm’s length market transactions, reference to the current market value of another instrument, which is substantially the same, and discounted cash flow analysis. All related realised and unrealised gains and losses are included in the income statement. Interest earned whilst holding these instruments is reported as interest income. Dividends earned are included in dividend income.
Financial liabilities held for tradingTrading liabilities include debt securities that the Group has sold to other parties but does not own at the balance sheet date (“short” selling). The Group is obliged to purchase securities at a future date to cover the short positions. Trading

46 47
annualreport
2007
liabilities are stated at fair value, with gains and losses from revaluation recognised directly in Income statement within Other operating income.
Held to maturity investmentsFinancial instruments included in this portfolio are non-derivative financial assets with fixed or determinable payments and fixed maturity, where management has both the intent and the ability to hold to maturity. All held-to-maturity financial instruments are carried at amortised cost, less any provision for impairment. Interest earned from held-to-maturity financial instruments is reported as interest income and recognized based on effective interest rate, which is the rate that exactly discounts estimated future cash receipts through the expected life of the financial asset to that asset’s net carrying amount.The Group assesses on a regular basis whether there is any objective evidence that an investment held to maturity may be impaired. A financial asset is impaired if its carrying amount is greater than its estimated recoverable amount which is equal to the present value of the expected future cash flows discounted at the financial instrument’s original effective interest rate. The amount of the impairment loss for assets carried at amortized cost is calculated as the difference between the asset’s carrying amount and the present value of the expected future cash flows discounted at the financial instrument’s original effective interest rate. When an impairment of assets is identified, the Group recognizes allowances through the income statement.Impairment losses are reversed in subsequent periods when an increase in the investment’s recoverable amount can be related objectively to an event occurring after the impairment was recognised, subject to the restriction that the carrying amount of the investment at the date the impairment is reversed shall not exceed what the amortised cost would have been had the impairment not been recognised.
Loans and receivablesLoans and receivables are non-derivative financial assets with fixed or determinable payments that are not quoted in an active market, other than (a) those that the Bank and the Group intends to sell immediately or in the near term, which shall be classified as held for trading, and those that the entity upon initial recognition designates as at fair value through profit or loss; (b) those that the Bank and the Group upon initial recognition designates as available for sale; or (c) those for which the Bank and the Group may not recover substantially all of its initial investment, other than because of credit deterioration, which shall be classified as available for sale. This portfolio comprises loans provided to customers.Loans and receivables are measured at initial recognition at fair value, and are subsequently measured at amortized cost using the effective interest method, less any allowance for impairment. Third party expenses, such as legal fees, incurred in securing a loan are treated as part of the cost of the transaction as well as fees received from customers. Loan origination fees for loans which are probable of being drawn down, are deferred (together with related direct costs) and recognized as an adjustment to the effective yield of the loan and as such adjust the interest income.An allowance for loan impairment is established if there is objective evidence that the Bank and the Group will not be able to collect all amounts due. The amount of the allowance is the difference between the carrying amount and the recoverable amount, being the present value of expected cash flows, including amounts recoverable from guarantees and collateral, discounted at the original effective interest rate of loans computed at initial recognition. Loan loss allowances are assessed with reference to the credit standing and performance of the borrower and take into account the value of any collateral or third party guarantees. If no objective evidence of impairment exists for an individually assessed financial asset, whether significant or not, the Bank and the Group include the asset in a group of financial assets with similar credit risk characteristics and collectively assesses them for impairment. Assets that are individually assessed for impairment and for which an impairment loss is or continues to be recognized are not included in a collective assessment of impairment.For the purposes of a collective evaluation of impairment, financial assets are grouped on the basis of similar credit risk characteristics (ie, on the basis of the Group’s grading process that considers asset type, counter party type, past-due status and other relevant factors). Those characteristics are relevant to the estimation of future cash flows for groups of such assets by being indicative of the debtors’ ability to pay all amounts due according to the contractual terms of the assets being evaluated. Future cash flows in a group of financial assets that are collectively evaluated for impairment are estimated on the basis of the contractual cash flows of the assets in the Group and historical loss experience for assets with credit risk characteristics similar to those in the Group.When a loan is deemed uncollectible, it is written off against the related provision for impairment. Subsequent recoveries are credited to the income statement.
Assets available for saleAvailable-for-sale financial assets are those non-derivative financial assets that are designated as available for sale or are not classified as (a) loans and receivables, (b) held-to-maturity investments or (c) financial assets at fair value through profit or loss.This portfolio comprises equity and debt securities. Subsequent to initial recognition, available-for-sale financial assets are re-measured at fair value based on quoted prices or amounts derived from cash flow models. In circumstances where the

Accounting policies
quoted market prices are not readily available, the fair value of debt securities is estimated using the present value of future cash flows and the fair value of unquoted equity instruments is estimated using applicable price/earnings or price/cash flow ratios refined to reflect specific circumstances of the issuer. Investments in equity instruments that do not have a quoted market price in an active market and whose fair value cannot be reliably measured are stated at cost less impairment.For available-for-sale assets, gains and losses arising from changes in fair value are recognised directly in equity under the caption “Reserves and retained profits”, until the security is disposed of or is determined to be impaired, at which time the cumulative gain or loss previously recognized in equity is included in the profit or loss for the period. Impairment losses recognized in profit or loss for equity investments classified as available-for-sale are not subsequently reversed through profit or loss. Impairment losses recognized in profit or loss for debt instruments classified as available-for-sale are subsequently reversed if an increase in the fair value of the instrument can be objectively related to an event occurring after the recognition of the impairment loss. Interest earned whilst holding available-for-sale securities is accrued on a daily basis using the effective interest rate method and reported as “Interest income” in the income statement. Foreign exchange differences related to available-for-sale equity instruments held in foreign currency are reported together with fair value gains and losses in equity until the financial asset is sold. Foreign exchange differences related to available-for-sale debt instruments held in foreign currency are reported in income statements.Dividends on securities available for sale are recorded as declared and included as a receivable in the balance sheet line “Other assets” and in “Other operating income” in the income statement. Upon payment of the dividend, the receivable is offset against the collected cash.
Derecognition of financial assetsThe Group derecognises a financial asset only when the contractual rights to the cash flows from the asset expire; or it transfers the financial asset and substantially all the risks and rewards of ownership of the asset to another entity. If the Group neither transfers nor retains substantially all the risks and rewards of ownership and continues to control the transferred asset, the Group recognises its retained interest in the asset and an associated liability for amounts it may have to pay. If the Group retains substantially all the risks and rewards of ownership of a transferred financial asset, the Group continues to recognise the financial asset and also recognises a collateralised borrowing for the proceeds received.
Collateral pending saleThe Group occasionally acquires real estate in settlement of certain loans and advances. Real estate is stated at the lower of cost of the related loans and advances and the current fair value of such assets. Gains or losses on disposal are recognised in the income statement.
Sale and repurchase agreementsSecurities sold under sale and repurchase agreements (repos) are retained in the financial statements and the counterparty is included in due to banks or customers as appropriate. Securities purchased under agreements to resell (reverse repo) are recorded as due from banks and loans and advances to customers as appropriate. The difference between sale and repurchase price is treated as interest and accrued over the life of repo agreements.
LeasesFinance - Group as lessorWhen assets are leased under finance lease arrangements, the present value of the lease payments is recognised as a receivable. The difference between the gross receivable and the present value of the receivable is recognised as unearned finance income. Initial direct costs are recognised as expenses in the income statement in the period when incurred.
Operating - Group as lessorAssets leased under operating lease arrangements are included in tangible assets in the balance sheet. They are depreciated over their expected useful lives which is based on the duration of lease contracts (see tangible fixed assets accounting policy). Initial direct costs incurred specifically to earn revenues from an operating lease are recognised as an expense in the income statement in the period in which they are incurred.
Operating - Group as lesseeLeases of assets under which the risks and rewards of ownership are effectively retained with the lessor are classified as operating lease arrangements. Lease payments under operating lease are recognised as expenses on a straight-line basis over the lease term and included in other operating expenses.
Property and equipmentProperty and equipment is stated at cost less accumulated depreciation less any provision for impairment. When assets are sold or retired, their cost and accumulated depreciation are eliminated from the accounts and any gain or loss resulting from their disposal is included in the income statement.

48 49
annualreport
2007
The initial cost of property and equipment comprises its purchase price, including import duties and non-refundable purchase taxes and any directly attributable costs of bringing the asset to its working condition and location for its intended use. Expenditures incurred after the fixed assets have been put into operation, such as repairs and maintenance, are normally charged to the income statement in the period in which the costs are incurred.Construction-in-progress represents properties under construction and is stated at cost. This includes cost of construction, property and equipment and other direct costs. Construction-in-progress is not depreciated until such time as the relevant assets are completed and put into operational use and reclassified to the apropriate category of property and equipment. Property and equipment is depreciated on a straight-line basis using useful lives. The useful lives are as follows:
Land is not depreciated.The assets’ residual values, useful lives and methods are reviewed, and adjusted if appropriate, at least at each financial year end.The carrying values of property and equipment are reviewed for impairment when events or changes in circumstances indicate that the carrying value may not be recoverable.
Intangible assets and goodwillIntangible assets are measured initially at cost. Intangible assets are recognised if it is probable that the future economic benefits attributable to the asset will flow to the enterprise and the cost of the asset can be measured reliably. After initial recognition, intangible assets are measured at cost less accumulated amortization and any accumulated impairment losses. Intangible assets are amortized on a straight line basis over the best estimate of their useful lives. The amortization period and the amortization method are reviewed at each reporting period.According to IFRS 3, Business Combinations, any excess of the cost of the acquisition over the acquirer’s interest in the fair value of the identifiable assets and liabilities acquired on the date of the acquisition is presented as goodwill and recognized as an asset. Following initial recognition, goodwill is measured at cost less any accumulated impairment losses. Goodwill is reviewed for impairment at least annually, or more frequently if events or changes in circumstances that the carrying value may be impaired.Impairment is determined by assessing the recoverable amount of the cash-generating unit (or the group of cash-generating units) to which the goodwill relates. Where the recoverable amount of the cash-generating unit is less than the carrying amount of the unit, the impairment loss is allocated first to reduce the carrying amount of any goodwill allocated to the unit and then to the other assets of the unit pro-rata on the basis of the carrying amount of each asset in the unit. An impairment loss recognised for goodwill is not reversed in a subsequent period.Intangible assets are amortised over the period of 4 years. Amortisation period and amortisation method are reviewed at least at each year-end. Changes in the expected useful life or the expected pattern of consumption of future economic benefits embodied in the asset are accounted for by changing the amortisation period or method, as appropriate, and treated as changes in accounting estimates. Investment propertyInvestment property, which is mainly property held to earn rentals, is measured initially at its cost, including transaction costs. The carrying amount includes the cost of replacing part of an existing investment property at the time that cost is incurred if the recognition criteria are met and excludes the costs of day-to-day servicing of an investment property. After initial recognition, investment property is stated at cost less accumulated depreciation and any provision for impairment. Investment property is depreciated on a straight-line basis using the useful lives of the assets in accordance with the policy stated under Property and equipment.Investment property is derecognised when either it has been disposed of or when the investment property is permanently withdrawn from use and no future economic benefit is expected from its disposal. Any gains or losses on the retirement or disposal of an investment property are recognised in the income statement in the year of retirement or disposal.Transfers are made to investment property when, and only when, there is a change in use, evidenced by ending of owner-occupation, commencement of an operating lease to another party or ending of construction or development. Transfers are made from investment property when, and only when, there is a change in use, evidenced by commencement of owner-occupation or commencement of development with a view to sale.
2007 2006 years years
Buildings 40 40
Furniture 5 5
Computers 4 4
Motor vehicles 5 5
Equipment and other assets 2 to 10 2 to 10
Accounting policies
Non-current assets held for saleThe Group classifies a non-current asset as held for sale if its carrying amount will be recovered principally through a sale transaction rather than through continuing use. This condition is regarded as met only when the sale is highly probable and the asset (or disposal group) is available for immediate sale in its present condition. Management must be committed to the sale, which should be expected to qualify for recognition as a completed sale within one year from the date of classification. A non-current asset classified as held for sale is measured at the lower of its carrying amount and fair value less costs of sale and is no longer depreciated.Impairment losses on initial classification as held for sale are included in the income statement, as well as gains and losses on subsequent measurement.
Impairment of non financial assetsProperty and equipment, intangible assets, investment property and non-current assets held for sale are reviewed for impairment whenever events or changes in circumstances indicate that the carrying amount of an asset may not be recoverable. Whenever the carrying amount of an asset exceeds its recoverable amount, an impairment loss is recognised in the income statement for items of property and equipment and intangibles carried at cost and treated as a revaluation decrease for assets that are carried at their revalued amount to the extent that the impairment loss does not exceed the amount held in the revaluation surplus for the same asset. The recoverable amount is the higher of an asset’s net selling price and its value in use.
Derivative financial instruments Derivative financial instruments are initially recognised in the balance sheet in accordance with the policy for initial recognition of financial instruments and subsequently remeasured at their fair value. Fair values are obtained from quoted market prices, dealer price quotations, discounted cash flow models and options pricing models as appropriate. All derivatives are carried as assets when fair value is positive and as liabilities when fair value is negative. Gains and losses on foreign exchange derivatives are included in Foreign exchange revaluation. Provisions for contingent liabilitiesProvisions are recognised when the Group has a present legal or constructive obligation as a result of past events, it is probable that an outflow of resources embodying economic benefits will be required to settle the obligation, and a reliable estimate of the amount of the obligation can be made. The provision for possible commitments and contingent liabilities losses is maintained at a level the Group management believes is adequate to absorb probable future losses. The Group Management Board determines the adequacy of the provision based upon reviews of individual items, recent loss experience, current economic conditions, the risk characteristics of the various categories of transactions and other pertinent factors.
Managed fundsThe Bank manages a significant amount of assets on behalf of third parties. A fee is charged for this service. These assets are not recorded in the Bank’s balance sheet. The details are set out in note 35.
Share-based payment transactionsEmployees (including senior executives) of the Group receive remuneration in the form of share-based payment transaction, whereby employees render services as consideration for equity instruments (equity-settled transactions). The cost of equity-settled transactions with employees is measured by reference to the fair value at the date on which they are granted. The fair value is determined as a market value of shares at the date of grant. The cost of equity-settled transactions is recognised over the period in which the performance and/or service conditions are fulfilled. Changes in accounting policiesIn the current year, the Group has adopted all of the new and revised Standards and Interpretations issued by the International Accounting Standards Board (the IASB) and the International Financial Reporting Interpretations Committee (the IFRIC) of the IASB that are relevant to its operations and effective for annual reporting periods beginning on 1 January 2007. The adoption of these new and revised Standards and Interpretations does not have any effect on equity as at 1 January 2007.In the current year, the Group has adopted IFRS 7 Financial Instruments: Disclosures which is effective for annual reporting periods beginning on or after 1 January 2007. The impact of the adoption of IFRS 7 has been to expand the disclosures provided in these financial statements regarding the Group’s financial instruments and management of capital.Four Interpretations issued by the International Financial Reporting Interpretations Committee are effective for the current period. These are: IFRIC 7 Applying the Restatement Approach under IAS 29, Financial Reporting in Hyperinflationary Economies; IFRIC 8 Scope of IFRS 2; IFRIC 9 Reassessment of Embedded Derivatives; and IFRIC 10 Interim Financial Reporting and Impairment. The adoption of these Interpreta-tions has not led to any changes in the Group’s accounting policies.

50 51
annualreport
2007
The Group has not applied the following IFRSs and Interpretations of the International Financial Reporting Interpretations Committee (IFRIC) that have been issued but are not yet effective:
International Financial Reporting Standards (IFRS) IFRS 8 Operating segments
International Accounting Standards (IAS) IAS 23 Borrowing costs, as revised in 2007
International Financial Reporting Interpretations Committee (IFRIC) IFRIC 11 IFRS 2 - Group and treasury share transactionsIFRIC 12 Service concession arrangementsIFRIC 13 Customer loyalty programmesIFRIC 14 IAS 19 - The limit on a defined benefit asset, minimum funding requirements and their interaction
The Group expects that the adoption of the pronouncements listed above will have no significant impact on the Group’s financial statements in the period of initial application.
The Group has not early adopted any IFRS standards where adoption is not mandatory at the balance sheet date. Where transition provisions in IFRS adopted give an entity a choice whether to apply the new standards prospectively or retrospectively the Group has elected to apply the standard prospectively from the date of transition. Significant accounting judgements and estimatesJudgementsIn the process of applying the Group’s accounting policies, the management made the following judgements, apart from those involving estimations, which have the most significant effect on the amounts recognised in the financial statements:
Operating Lease Commitments - Group as LessorThe Group has entered into commercial property leases on its investment property portfolio. The Group has determined that it retains all the significant risks and rewards of ownership of properties which are leased out on operating leases.
Held to maturity investmentsThe Group follows the guidance of IAS 39 on classifying non-derivative financial assets with fixed or determinable payments and fixed maturity as held to maturity. This classification requires significant judgement. In making this judgement, the Group evaluates its intention and ability to hold such investments to maturity. If the Group fails to keep these investments to maturity, other than under specific circumstances (such as selling an insignificant amount close to maturity) it will be required to reclassify the entire class as available for sale and measure it at fair value instead of amortised cost. Estimation uncertaintyThe key assumptions concerning the future and other key sources of estimation uncertainty at the balance sheet date, that have a significant risk of causing a material adjustment to the carrying amounts of assets and liabilities within the next financial year are discussed below.
Allowance for impairment of loans and receivablesThe Group regularly reviews its loans and receivables to assess impairment. The Group uses its experienced judgement to estimate the amount of any impairment loss in cases where a borrower is in financial difficulties and there are few available historical data relating to similar borrowers. Similarly, the Group estimates changes in future cash flows based on the observable data indicating that there has been an adverse change in the payment status of borrowers in a group, or national or local economic conditions that correlate with defaults on assets in the group. Management uses estimates based on historical loss experience for assets with credit risk characteristics and objective evidence of impairment similar to those in the group of loans and receivables. The Group uses its experienced judgement to adjust observable data for a group of loans or receivables to reflect current circumstances.
Impairment of GoodwillThe Group determines whether goodwill is impaired at least on an annual basis. This requires an estimation of the value in use of the cash-generating units to which the goodwill is allocated. Estimating the value in use requires the Group to make an estimate of the expected future cash flows from the cash-generating unit and also to choose a suitable discount rate in order to calculate the present value of those cash flows. The carrying amount of goodwill at 31 December 2007 was HRK 59 million (2006: HRK 95 million). More details are given in note 19.

Interest income earned on financial assets, analysed by category of asset, is as follows: GROUP BANK
2007 2006 2007 2006
Interest income
Loans and receivables from customers and banks 3,156 2,545 2,866 2,332
Balances with Croatian National Bank 192 165 186 160
Financial assets at fair value through profit or loss 146 145 152 150
Held to maturity investments 82 84 67 77
Assets available for sale 51 37 3 1
3,627 2,976 3,274 2,720
Notes to the Bank and the Group Financial Statements
2 Interest income and expense (in HRK million) GROUP BANK
2007 2006 2007 2006
Interest income
Citizens 1,816 1,544 1,644 1,403
Companies 855 651 751 588
Bonds and securities 299 286 236 242
Banks 334 227 321 221
Public sector and others 323 268 322 266
3,627 2,976 3,274 2,720
Interest expense
Citizens 781 654 711 598
Companies 228 149 222 142
Banks 578 387 529 376
Public sector and others 122 72 115 69
1,709 1,262 1,577 1,185

52 53
annualreport
2007
Fee and commission income and expense (in HRK million) GROUP BANK
2007 2006 2007 2006
Fee and commission income
Fees and commission on credit card services 646 581 84 71
Payment transaction fees and commission 275 250 273 248
Investment management, brokerage and consultancy fees 179 90 47 44
Fees and commission on customer loans 35 32 34 30
Fees and commission on guarantees given 40 35 39 34
Fees and commission on customer services 32 27 28 24
Other fee and commission income 93 62 80 37
1,300 1,077 585 488
Fee and commission expense
Payment transaction charges 72 90 70 87
Fees and commission expense on credit card services 98 88 105 83
Bank charges 14 11 10 9
Commission to post offices for citizens’ current accounts 1 1 1 1
Other fee and commission expense 51 28 26 17
236 218 212 197
3
Other operating income (in HRK million) GROUP BANK
2007 2006 2007 2006
Foreign exchange trading gain 77 128 68 119
Net gains on securities at fair value 5 86 5 84
Foreign exchange revaluation 142 58 143 58
Operating lease 66 57 3 3
Gains/(losses) from disposal of non-current assets held for sale (3) 24 (3) 25
Realised gains on securities classified as assets available for sale 22 22 21 20
Gains/(losses) from disposal of property and equipment 17 14 (3) 12
Dividends earned 2 1 144 104
Other income 95 76 26 19
423 466 404 444
4

7 Personnel expenses (in HRK million) GROUP BANK
2007 2006 2007 2006
Net salaries 345 316 273 255
Health insurance costs 80 73 63 58
Taxes and surtaxes due to local authorities 83 74 64 57
Pension insurance costs 102 94 81 75
Other personnel expenses 125 112 96 86
735 669 577 531
Salaries and other related costs of employees include accrued expenses for bonus to the management and employees of the Bank in the gross amount of HRK 37.7 million (2006: HRK 30.2 million), of which the remuneration of the Bank’s Man-agement Board accounts for gross amount of HRK 6.4 million (2006: HRK 5.1 million).During the year the average number of employees within the Group was 4,283 (2006: 4,174) of which the Bank accounted for 3,531 employees (2006: 3,471).
Notes to the Bank and the Group Financial Statements
Provisions (in HRK million) NOTE GROUP BANK
2007 2006 2007 2006
Provisions for loans and advances to customers 15 59 126 (7) 38
Provisions for legal claims 31 14 35 12 31
Provisions for guarantees and commitments 31 48 (8) 49 (12)
121 153 54 57
5
6 Other operating expenses (in HRK million) NOTE GROUP BANK
2007 2006 2007 2006
Personnel expenses 7 735 669 577 531
Materials and services 503 462 342 310
Deposit insurance premium 70 64 59 56
Indirect and other taxes 22 16 20 15
Other operating expenses 248 209 113 95
1,578 1,420 1,111 1,007

54 55
annualreport
2007
8 Depreciation and amortization of property and equipment and intangible assets (in HRK million) GROUP BANK
2007 2006 2007 2006
Depreciation of property and equipment 214 204 120 126
Depreciation of investment property 1 1 1 1
Amortisation of leasehold improvements 19 18 19 18
Amortization of intangible assets 34 32 22 20
268 255 162 165
There is an amount included within depreciation and amortization of fixed and intangible assets related to the impairment and write off of property and equipment and intangible assets of the Group of HRK 1.2 million (2006: HRK 16.1 million) and the Bank of HRK 0.9 million (2006: HRK 14.5 million).
Taxation Profit tax is payable at the rate of 20 percent (2006: 20 percent) on adjusted operating income. Generally, tax declarations remain open and subject to inspection for at least a three-year period. The management believes that it has adequately provided for tax liabilities in the accompanying financial statements. However, the risk remains that the relevant authorities could take differing positions with regard to interpretative issues.Taxation expense comprises:
9
The reconciliation between accounting profit and taxable profit is set out below:
GROUP BANK
(in HRK million) 2007 2006 2007 2006
Accounting profit before taxation 1,446 1,219 1,147 1,041
Statutory tax rate 20% 20% 20% 20%
Expected nominal tax 289 244 229 208
Tax effects of:
Non deductible expenses 86 89 70 57
Non taxable income (46) (32) (70) (49)
Current income tax expense 329 301 229 216
Effective tax rate 22.8% 24.7% 20.0% 20.7%
GROUP BANK
(in HRK million) 2007 2006 2007 2006
Current income tax expense (329) (301) (229) (216)
Deferred tax assets utilised during the year (121) (73) (83) (60)
Deferred tax liabilities utilised during the year 2 1 2 1
Deferred tax assets relating to temporary differences 147 121 97 83
Deferred tax liability relating to temporary difference (2) (2) (2) (2)
Tax charge per income statement (303) (254) (215) (194)

Taxation / continued Movements of deferred tax assets are as follows:
9
GROUP BANK
(in HRK million) 2007 2006 2007 2006
Deferred tax assets recognised at 1 January 121 73 83 60
Tax (profits)/losses in the year recognised as deferred tax assets 147 121 97 83
Deferred tax (debit)/credit in the income statement (121) (73) (83) (60)
Deferred tax assets recognised at 31 December 147 121 97 83
Deferred tax assets consist of:
Deferred loan origination fees as an adjustment to the 81 71 64 54effective yield
Retirement benefits 4 5 3 3
Impairment of real estate 8 8 7 7
Unrealised losses on negative revaluation of securities 21 15 21 15and derivatives
Other 33 22 2 4
147 121 97 83
Notes to the Bank and the Group Financial Statements

56 57
annualreport
2007
Cash and current accounts with other banks (in HRK million) 10
GROUP BANK
2007 2006 2007 2006
Current accounts held with central bank 1,121 1,351 1,087 1,322
Cash in hand 1,132 1,026 1,070 946
Current accounts and amounts at call with foreign banks 186 178 177 42
Current accounts and amounts at call with domestic banks 18 7 16 5
Other cash items 14 14 6 13
2,471 2,576 2,356 2,328
Balances with Croatian National Bank (in HRK million)11
GROUP BANK
2007 2006 2007 2006
Obligatory and marginal reserve 6,866 7,259 6,640 7,046
Compulsory bills 1,323 - 1,289 -
Other deposits 5 3 5 3
8,194 7,262 7,934 7,049
Obligatory reserve represents the amount of liquid assets required to be deposited with the Croatian National Bank. At the end of each month the obligatory reserve is calculated on certain balances of attracted funds for the previous month. The obligatory reserve is calculated as 17 percent of HRK denominated (2006: 17 percent) and 17 percent of foreign currency denominated balances (2006: 17 percent). From that amount the banks should maintain at least 70 percent for the kuna obligatory reserve and 50 percent for the obligatory reserve in foreign currency with the Croatian National Bank. Marginal reserve represents the amount of foreign and related parties’ borrowings required to be deposited with the Croatian National Bank. In December of 2007, the marginal reserve requirement was 40 percent of net increase in funds received from non-residents and related parties from June 2004 and an additional 15 percent of net increase in funds received from non-residents and related parties from November 2005. Marginal reserve balances maintained with the Croatian National Bank bore no interest during 2007 (2006: nil).The balances maintained with the Croatian National Bank earned annual interest of 0.75 percent for HRK amounts (2006: 0.75 percent). The balances in foreign currencies maintained with the Croatian National Bank bore annual interest of 1.75 to 2 percent for EUR amounts (2006: 2.25 percent for USD and 1.25 to 1.75 percent for EUR amounts). 50 percent of the foreign currency obligatory reserve should be maintained in HRK. USD and EUR rates are not fixed.As of the year end, the Bank and the Group maintained 70 percent of its HRK obligatory reserve and 50 percent of its foreign currency obligatory reserve (in EUR) with the Croatian National Bank. The remaining 30 percent of the HRK obligatory reserve and 50 percent of the foreign currency obligatory reserve were maintained as balance on nostro accounts or deposits with other banks. In December 2006, the CNB issued Decision on the Purchase of Compulsory Bills. During 2007 compulsory CNB bills were purchased when the growth of prescribed placements and off balance sheet exposures exceeded 1 percent per month with the purchase rate of 50 percent of the base, being the positive difference between permissible and actual growth. The compulsory CNB bills were issued at an interest rate of 0.25 percent per annum and with a maturity of 360 days. These bills were repaid in January 2008 by the CNB following the amendment of the Decision.

12 Financial assets and financial liabilities at fair value through profit or loss (in HRK million)
13 Derivative financial instruments (in HRK million)
GROUP BANK
2007 2006 2007 2006
Financial assets at fair value through profit or loss
Domestic treasury bills 1,493 1,174 1,493 1,174
Foreign government bonds 439 473 439 473
Foreign corporate bonds 324 408 324 408
Foreign treasury bills 431 396 431 396
Domestic corporate bonds 305 204 317 222
Equities and shares 264 185 264 185
Domestic government bonds 839 165 839 165
Accrued interest 75 51 75 51
4,170 3,056 4,182 3,074
Financial liabilities held for trading
Foreign government bonds - 735 - 735
Notes to the Bank and the Group Financial Statements
GROUP BANK
ASSETS 2007 2006 2007 2006
Fair values:
Foreign exchange derivatives 32 44 32 44
Security derivatives 1 - 1 -
33 44 33 44
Notional amounts:
Foreign exchange derivatives 11,837 8,480 11,837 8,480
Security derivatives 546 - 546 -
12,383 8,480 12,383 8,480
LIABILITIES
Fair values:
Foreign exchange derivatives 33 14 33 14
Security derivatives 5 1 5 1
38 15 38 15
Notional amounts:
Foreign exchange derivatives 11,841 8,447 11,841 8,447
Security derivatives 416 204 416 204
12,257 8,651 12,257 8,651

58 59
annualreport
2007
13 Derivative financial assets and liabilities / continued (in HRK million)
Due from banks (in HRK million)14
Term deposits are normally short-term deposits (up to one month) with local and foreign banks bearing an average annual interest rate of 2.50 percent to 7 percent (2006: 3.20 and 5.48 percent respectively). The Bank’s placements with other banks include HRK 6.3 million (2006: HRK 9.3 million) related to refinanced borrowings due to the Republic of Croatia and HRK 50.5 million (2006: HRK 79.9 million) of refinanced borrowings due to Government agencies. For more details refer to note 26.The related currency analysis is provided in note 44.
Geographical analysis
GROUP BANK
2007 2006 2007 2006
Italy 1,514 1,959 1,469 1,916
Belgium 1,136 459 1,010 369
Republic of Croatia 955 1,359 946 1,433
Germany 828 1,244 733 1,186
Great Britain 754 826 702 799
France 252 448 252 448
Austria 90 13 73 1
Switzerland 40 263 - 247
United States of America 7 165 - 137
Other countries 1,684 514 1,556 414
7,260 7,250 6,741 6,950
Provisions (15) (15) (15) (15)
7,245 7,235 6,726 6,935
GROUP BANK
2007 2006 2007 2006
Term deposits 6,247 5,439 5,667 5,172
Demand deposits 2 2 - -
Loans to banks 1,011 1,809 1,074 1,778
7,260 7,250 6,741 6,950
Provisions (15) (15) (15) (15)
7,245 7,235 6,726 6,935
Foreign exchange derivatives mostly relate to foreign exchange currency deals bought and sold forward. Security derivatives include bonds bought forward.The notional amounts of certain types of financials instruments provide a basis for comparison with instruments recognised on the balance sheet but do not necessarily indicate the amounts of future cash flows involved or the current fair value of the instruments and, therefore, do not indicate the Group’s exposure to credit or price risks.

Loans and advances to customers (in HRK million)15
GROUP BANK
2007 2006 2007 2006
a) Analysis by type of customer
Citizens 24,357 20,602 21,555 18,021
Companies 13,570 13,968 12,045 12,678
Public sector and other 4,814 4,943 4,809 4,916
42,741 39,513 38,409 35,615
Provisions (2,005) (2,078) (1,551) (1,661)
Deferred interest and fees recognised as an adjustment to the (589) (525) (422) (382)effective yield
40,147 36,910 36,436 33,572
b) Analysis by sector
Citizens 24,357 20,602 21,555 18,021
Wholesale and retail trade 3,276 3,414 2,768 2,873
Construction 3,073 1,513 2,893 1,355
Transport and communication 1,168 1,486 1,084 1,402
Hotels and restaurants 1,088 903 1,044 857
Agriculture, forestry and fishing 694 726 625 680
Food and beverages 395 438 361 420
Energy products 432 369 432 365
Oil refining and gas 62 100 62 100
Other 8,196 9,962 7,585 9,542
42,741 39,513 38,409 35,615
Provisions (2,005) (2,078) (1,551) (1,661)
Deferred interest and fees recognised as an adjustment to the (589) (525) (422) (382)effective yield
40,147 36,910 36,436 33,572
Within Loans and advances to customers are loans under reverse repurchase agreements of HRK 237.9 million (2006: HRK 1,241.8 million). Such agreements are secured with corporate bonds.
Notes to the Bank and the Group Financial Statements

60 61
annualreport
2007
15 Loans and advances to customers / continued (in HRK million)
2007 2006
c) Provisions for losses Individual Collective Total Individual Collective Total
Group
Balance at 1 January 1,265 813 2,078 1,242 709 1,951
Amounts collected (139) (10) (149) (172) - (172)
Amounts written off (129) (8) (137) (63) - (63)
Foreign exchange (gain)/loss 4 1 5 64 - 64
Amortisation of the discount (5) - (5) (41) - (41)
Provisions 164 49 213 235 104 339
Balance at 31 December 1,160 845 2,005 1,265 813 2,078
Reconciliation with Income statement line item Provisions for loans and advances to customers
Provisions 164 49 213 235 104 339
Amounts collected (139) (10) (149) (172) - (172)
Amortisation of the discount (5) - (5) (41) - (41)
Charge in the income statement 20 39 59 22 104 126
Bank
Balance at 1 January 1,115 546 1,661 1,136 501 1,637
Amounts collected (97) (8) (105) (90) - (90)
Amounts written off (105) - (105) (49) - (49)
Foreign exchange (gain)/loss 2 - 2 35 - 35
Amortisation of the discount (5) - (5) (41) - (41)
Provisions 103 - 103 124 45 169
Balance at 31 December 1,013 538 1,551 1,115 546 1,661
Reconciliation with Income statement line item Provisions for loans and advances to customers
Provisions 103 - 103 124 45 169
Amounts collected (97) (8) (105) (90) - (90)
Amortisation of the discount (5) - (5) (41) - (41)
Charge in the income statement 1 (8) (7) (7) 45 38

Notes to the Bank and the Group Financial Statements
The Group manages its exposure to credit risk by the application of a variety of control measures: regular assessment using agreed credit criteria; diversification of sector risk to avoid undue concentration in type of business or geographic terms. Where necessary, the Group obtains acceptable collateral to reduce the level of credit risk.On 31 December 2007 the aggregate amount of non performing loans and receivables for the Group equalled HRK 857 million and for the Bank HRK 747 million (2006: HRK 947 million and HRK 837 million respectively).During 2007 the Group sold the rights to 100 percent of the cash flows arising on a loan portfolio carried at HRK 546 million (2006: HRK 629 million) to third parties for a received payment of HRK 546 million (2006: HRK 629 million), excluding fees paid to the buyers amounting to HRK 2 million (2006: nil). The Group has determined that substantially all the risks and rewards of the portfolio have been transferred. Therefore the Group derecognised the transferred assets from its balance sheet.
(d) Loans and contingencies under guaranteeThe state budget includes support for certain key industries in the Republic of Croatia. The recovery of such loans is provided from the state budget. In addition, the Republic of Croatia issues warranties for certain loans and contingent liabilities.The support and guarantee of the Republic of Croatia was taken into consideration when determining the level of provisions required against loans to certain legal entities. Total Bank and the Group loans and contingencies guaranteed by the Republic of Croatia or repayable from the state budget amount to HRK 2,413 million (2006: HRK 2,177 million).
(e) Refinanced loansIncluded in loans and receivables are HRK 43.5 million (2006: HRK 64.9 million) related to refinanced borrowings due to the Republic of Croatia and HRK 167.2 million (2006: HRK 252.1 million) of refinanced borrowings due to the Government Agencies. For more detail on refinanced loans refer to note 26.
(f) Collaterals repossessedDuring the year, the Group took possession of real estates (business premises, houses, flats and land) with carried value of HRK 4.8 million and the Bank HRK 4.0 million (2006: 15.6 million and 13.6 million respectively). The collaterals repossessed, which the Group is in the process of selling, are disclosed within Other assets (note 23). In general, the Group does not occupy repossessed properties for business use.During 2007 the Group has sold the collaterals with the total fair value of HRK 100 million (2006: HRK 97 million).
During 2007 HRK 81 million was reclassified from Equity investments in subsidiaries due to lost of control stake of equity (refer to Note 18).
Assets available for sale (in HRK million)16
GROUP BANK
2007 2006 2007 2006
Balance at 1 January 1,305 386 53 24
Purchases 499 915 338 10
Reclassified from other investments 81 - 81 -
Fair value adjustments (32) 4 10 19
Balance at 31 December 1,853 1,305 482 53
Debt securities 1,539 1,234 187 -
Equity investments 314 71 295 53
Total 1,853 1,305 482 53
15 Loans and advances to customers / continued

62 63
annualreport
2007
The following table sets out equity investments considered available for sale.
Assets available for sale / continued (in HRK million)16
17 Held to maturity investments (in HRK million)
GROUP BANK
2007 2006 2007 2006
Recapitalisation bonds 608 725 608 725
Rehabilitation bonds 320 379 320 379
Republic of Croatia bonds 306 196 - -
Replacement bonds 28 27 25 24
Accrued interest 26 31 26 30
1,288 1,358 979 1,158
The Group holds 29 percent (2006: 29 percent) of the ordinary share capital of Questus Private Equity Kapital, a private equity investment fund. The directors of the Group do not consider that the Group is able to exercise significant influence over Questus Private Equity Kapital.The Group holds 20 percent (2006: 20 percent) of the ordinary share capital of Alstom Power d.o.o., a company involved in manufacturing.The directors of the Group do not consider that the Group is able to exercise significant influence over Alstom Power d.o.o.
Investment securities on 31 December 2007 were split into held to maturity investments and assets available for sale (refer to note 16) based on whether the management had the positive intent and ability to hold certain securities until maturity at that date.
EQUITY INVESTMENTS COUNTRY NATURE OF BUSINESS 2007 2006 holding %
Questus Private Equity Kapital Croatia finance 29 29
Alstom Power d.o.o. Croatia manufacturing 20 20
UPI banka d.d. Sarajevo Bosnia and banking 19 - Herzegovina
Europay Hrvatska d.o.o. Croatia card services 15 15
Hrvatski registar obveza po kreditima d.o.o. Croatia finance 14 14
Tehnološko inovacijski centar d.o.o. Croatia manufacturing 11 11
Agromeimurje d.d. Croatia agriculture 11 11
Tržište novca i kratkoroËnih vrijednosnica d.d. Croatia finance 8 8
Meimurske novine d.o.o. Croatia newspaper 7 7
Varaždinsko tržište vrijednosnica d.d. Croatia finance - 3
ZagrebaËka burza d.d. Croatia finance 3 2
Veterinarska stanica d.o.o. »akovec Croatia food processing 2 2
MBU d.o.o. Croatia finance 1 1
Regionalna razvojna agencija Porin d.o.o. Croatia manufacturing 1 1
Središnja depozitarna agencija d.d. Croatia finance 1 1
Elan d.d. Slovenia manufacturing 1 1

18 Equity investments in subsidiaries and associates (in HRK million) GROUP BANK
2007 2006 2007 2006
Consolidated subsidiaries - - 335 376
Associates accounted for under equity method in Group accounts (cost in Bank accounts) 49 45 28 28
49 45 363 404
Movements
Balance at 1 January 45 38 404 298
Consolidation effect arising from equity method 8 8 - -
Payment of additional capital - 3 40 25
Payment of dividend (4) (4) - -
Acquired/(disposed of) - - (81) 81
Balance at 31 December 49 45 363 404
The principal investments in subsidiaries and associates are as follows:
CONSOLIDATED SUBSIDIARIES COUNTRY NATURE OF BUSINESS 2007 2006 holding %
Meimurska banka d.d. Croatia banking 97 97
PBZ Card d.o.o. Croatia card services 100 100
PBZ Leasing d.o.o. Croatia leasing 100 100
PBZ Invest d.o.o. Croatia finance 100 100
PBZ Nekretnine d.o.o. Croatia real estate 100 100
PBZ Stambena štedionica d.d. Croatia building society 100 100
Invest Holding Karlovac d.o.o. Croatia finance 56 56
Centurion financijske usluge d.o.o. Bosnia and card services 100 100 Herzegovina
Cards d.o.o. Macedonia card services - 95
LT Gospodarska banka d.d. Bosnia and banking - 67 Herzegovina
ASSOCIATES
PBZ Croatia osiguranje d.d. Croatia finance 50 50
Centurion d.o.o. Slovenia card services 25 25
Notes to the Bank and the Group Financial Statements
Republic of Croatia bonds relate to the bonds of the Ministry of Finance of the Republic of Croatia purchased by PBZ Stambena štedionica. They are denominated in EUR, bear interest rate from 4.25 percent to 6.88 percent and become due from 2008 to 2019.Recapitalisation bonds and rehabilitation bonds were issued by the State Agency for Bank Rehabilitation and Deposit Insurance (DAB). These bonds are guaranteed by the Republic of Croatia.Replacement bonds were originaly issued by the Ministry of Finance. These kuna denominated bonds that mature in 2011, bear an interest rate of 5 percent payable in semi annual instalments.
17 Held to maturity investments / continued (in HRK million)

64 65
annualreport
2007
18 Equity investments in subsidiaries and associates / continued (in HRK million)
PBZ Croatia osiguranje d.d. and Centurion are accounted for under the equity method. The following table illustrates summarised financial information of the Group’s investment in associates:
Share of consolidated companies in equity reserves of the Group:
In December 2006, the Bank completed its acquisition of 66.99 percent of the share capital of LT Gospodarska banka d.d. following the approvals given by the appropriate regulatory authorities. The cost of acquisition (including directly at-tributable costs) amounted HRK 81.1 million, out of which 36.1 million was allocated to goodwill. The subsidiary was first consolidated as of 31 December 2006, having no effect on 2006 results of the Group. If the combination had taken place at the beginning of the year, the total profit for the year attributable to equity holders of the Bank would have been HRK 53 thousand higher. In August 2007 LT Gospodarska banka d.d. was integrated into UPI banka d.d. Sarajevo. Privredna banka Zagreb pres-ently holds 18.95 percent of the share capital of UPI banka and this investment is classified within financial assets available for sale. LT Gospodarska banka recorded net loss for 8 months of 2007 in amount of HRK 1.5 million at integration date. Of that amount, HRK 1 million was attributable to the shareholders of PBZ Group and it was not disclosed separately under the result from discontinued operations as considered insignificant.
2007 2006
Share of the associates’ balance sheet
Current assets 90 45
Non current assets 4 4
Current liabilities (14) (2)
Non current liabilities (31) (2)
Net assets, being carrying amount of investment 49 45
Share of the associates’ revenue and profit
Revenue 29 18
Profit 8 8
2007 2006
Privredna banka Zagreb d.d. 4,427 3,664
Meimurska banka d.d. 124 98
PBZ Card d.o.o. 427 316
PBZ Leasing d.o.o. 27 17
PBZ Invest d.o.o. 60 21
PBZ Nekretnine d.o.o. 26 14
PBZ Stambena štedionica d.d. (55) (20)
Invest Holding Karlovac d.o.o. 9 9
Centurion financijske usluge d.o.o. (4) (2)
PBZ Croatia osiguranje d.d. 18 13
Total equity reserves of the Group 5,059 4,130

19 Intangible assets and goodwill (in HRK million) Goodwill Software Other Assets Total intangible in Group assets preparation
Cost or revaluation
Balance at 1 January 2006 59 242 6 15 322
Additions - 59 - 6 65
Effect of LT Gospodarska banka acquisition 36 1 3 - 40
Disposals and eliminations - (31) - - (31)
Balance at 31 December 2006 95 271 9 21 396
Balance at 1 January 2007 95 271 9 21 396
Additions - 57 6 28 91
Effect of LT Gospodarska banka disposal (36) (1) (3) - (40)
Disposals and eliminations - (1) - (46) (47)
Balance at 31 December 2007 59 326 12 3 400
Amortization
Balance at 1 January 2006 - 175 - - 175
Charge for the year - 32 - - 32
Disposals and eliminations - (11) - - (11)
Balance at 31 December 2006 - 196 - - 196
Balance at 1 January 2007 - 196 - - 196
Charge for the year - 34 - - 34
Disposals and eliminations - (1) - - (1)
Balance at 31 December 2007 - 229 - - 229
Net book value
Balance at 31 December 2007 59 97 12 3 171
Balance at 31 December 2006 95 75 9 21 200
Notes to the Bank and the Group Financial Statements

66 67
annualreport
2007
19 Intangible assets and goodwill / continued (in HRK million)
Software Assets in TotalBank preparation
Cost or valuation
Balance at 1 January 2006 196 12 208
Additions 34 6 40
Disposals and eliminations (27) - (27)
Balance at 31 December 2006 203 18 221
Balance at 1 January 2007 203 18 221
Additions 45 (16) 29
Disposals and eliminations - (2) (2)
Balance at 31 December 2007 248 - 248
Amortization
Balance at 1 January 2006 146 - 146
Charge for the year 20 - 20
Disposals and eliminations (10) - (10)
Balance at 31 December 2006 156 - 156
Balance at 1 January 2007 156 - 156
Charge for the year 22 - 22
Balance at 31 December 2007 178 - 178
Net book value
Balance at 31 December 2007 70 - 70
Balance at 31 December 2006 47 18 65
As from 1 January 2005, the date of adoption of IFRS 3, goodwill was no longer amortised but is now subject to annual impairment testing. Accumulated amortisation up to that date was eliminated accordingly.Goodwill acquired through business combinations was allocated to two individual cash generating units for impairment testing - PBZ Card (American Express part of the business) and Meimurska banka. The recoverable amounts of cash generating units have been determined based on a value in use calculation using cash flow projections based on financial plans covering a five-year period. The discount rate applied to cash flow projections was 9.13 percent for PBZ Card and 8.07 percent for Meimurska banka, while the cash flows beyond the 5-year period were extrapolated using a no growth assumption (zero percent growth rate).

20 Property and equipment (in HRK million)
Land and Furniture Motor Computer Property Total buildings and other vehicles equipment and equipment equipment in Group preparation
Cost or valuation
Balance at 1 January 2006 672 278 221 524 274 1,969
Additions 351 171 56 69 (182) 465
Effect of LT Gospodarska banka acquisition 7 4 1 2 - 14
Reclassifications - 19 (8) (11) - -
Disposals and eliminations (4) (50) (33) (54) (7) (148)
Balance at 31 December 2006 1,026 422 237 530 85 2,300
Balance at 1 January 2007 1,026 422 237 530 85 2,300
Additions 81 115 102 42 (74) 266
Effect of LT Gospodarska banka disposal (7) (4) (1) (2) - (14)
Disposals and eliminations (16) (32) (54) (63) (1) (166)
Balance at 31 December 2007 1,084 501 284 507 10 2,386
Depreciation
Balance at 1 January 2006 197 161 69 370 - 797
Reclassifications - 9 (3) (6) - -
Charge for the year 34 61 39 70 - 204
Disposals and eliminations (2) (18) (18) (44) - (82)
Balance at 31 December 2006 229 213 87 390 - 919
Balance at 1 January 2007 229 213 87 390 - 919
Charge for the year 26 77 46 65 - 214
Disposals and eliminations (7) (20) (36) (62) - (125)
Balance at 31 December 2007 248 270 97 393 - 1,008
Net book value
Balance at 31 December 2007 836 231 187 114 10 1,378
Balance at 31 December 2006 797 209 150 140 85 1,381
Furniture and other equipment and Motor vehicles of the Group include assets leased under operating leases with a net book value of total of HRK 262.6 million (2006: HRK 176.5 million).
Notes to the Bank and the Group Financial Statements

68 69
annualreport
2007
20 Property and equipment / continued (in HRK million)
Land and Furniture Motor Computer Property Total buildings and other vehicles equipment and equipment equipment in Bank preparation
Cost or valuation
Balance at 1 January 2006 533 225 21 410 165 1,354
Additions 234 64 1 69 (73) 295
Disposals and eliminations (14) (15) (3) (168) (7) (207)
Balance at 31 December 2006 753 274 19 311 85 1,442
Balance at 1 January 2007 753 274 19 311 85 1,442
Additions 72 64 3 31 (77) 93
Disposals and eliminations (13) (16) (2) (54) (1) (86)
Balance at 31 December 2007 812 322 20 288 7 1,449
Depreciation
Balance at 1 January 2006 153 131 12 315 - 611
Charge for the year 30 39 3 54 126
Disposals and eliminations (6) (14) (4) (154) - (178)
Balance at 31 December 2006 177 156 11 215 - 559
Balance at 1 January 2007 177 156 11 215 - 559
Charge for the year 20 46 4 50 - 120
Disposals and eliminations (7) (14) (2) (54) - (77)
Balance at 31 December 2007 190 188 13 211 - 602
Net book value
Balance at 31 December 2007 622 134 7 77 7 847
Balance at 31 December 2006 576 118 8 96 85 883

The estimated fair value of investment property held by the Bank as at 31 December 2007 amounted to HRK 24 million (2006: HRK 23 million). The fair value was estimated by PBZ Nekretnine, a wholly owned subsidiary of Privredna banka Zagreb, engaged in real estate management.The property rental income earned by the Bank from its investment property, all of which was leased out under operating leases, amounted to HRK 3 million (2006: HRK 3 million).
Investment property (in HRK million)21
22 Non-current assets held for sale (in HRK million)
The Bank’s Management Board resolved to dispose of two office buildings together with related fixtures and fittings in 2005. The assets were classified as non-current assets held for sale and presented separately in the balance sheet.The sale of mentioned non current assets was realised in total during 2006 and 2007.The major classes of assets comprising the non-current assets held for sale are as follows:
GROUP BANK
2007 2006 2007 2006
Land and buildings - 18 - 18
- 18 - 18
Notes to the Bank and the Group Financial Statements
GROUP BANK
Cost or revaluation
Balance at 1 January 2007 28 28
Transferred from Property and equipment 2 2
Balance at 31 December 2007 30 30
Depreciation
Balance at 1 January 2007 14 14
Charge for the year 1 1
Balance at 31 December 2007 15 15
Net book value
Balance at 31 December 2007 15 15
Balance at 31 December 2006 14 14

70 71
annualreport
2007
Other assets (in HRK million)23
GROUP BANK
2007 2006 2007 2006
Leasehold improvements 53 51 53 51
Amounts due - deriving from foreign currency transactions - 42 - 42
Amounts receivable from debtors 38 37 1 1
Collaterals received in satisfaction of non-performing loans 43 37 41 37
Accrued fees 39 32 34 24
Amounts to be debited under processing 27 24 27 23
Prepaid expenses 16 8 9 8
Other 173 218 46 40
389 449 211 226
Due to banks (in HRK million)24
GROUP BANK
2007 2006 2007 2006
Term deposits 2,954 4,237 2,961 4,205
Demand deposits 175 281 166 298
3,129 4,518 3,127 4,503
Due to customers (in HRK million)25
GROUP BANK
2007 2006 2007 2006
Term deposits 27,475 23,674 24,917 21,222
Demand deposits 14,443 13,169 13,777 12,269
41,918 36,843 38,694 33,491
Retail deposits 29,525 27,163 26,658 24,163
Corporate deposits 8,625 6,959 8,268 6,607
Public sector and other 3,768 2,721 3,768 2,721
41,918 36,843 38,694 33,491

Other borrowed funds (in HRK million)26
GROUP BANK
2007 2006 2007 2006
Domestic borrowings 4,114 2,836 4,036 2,541
Foreign borrowings 7,273 6,562 5,835 6,050
Refinanced debt 373 558 373 556
11,760 9,956 10,244 9,147
(a) Domestic and Foreign borrowingsDomestic borrowingsDomestic borrowings of the Group include loans received from the Croatian Bank for Reconstruction and Development (HBOR) in amount of HRK 1.4 billion (2006: HRK 1.08 billion), borrowings from the Croatian National Bank arising from repurchase agreements in amount of 1.4 billion kuna (2006: HRK 1.1 billion), payables under repurchase agreements with other domestic banks and companies in total of HRK 205 million (2006: HRK 0.6 billion) as well as other borrowings from other domestic banks. In accordance with the overall agreement, borrowings from HBOR are used to funds loans to customers for eligible construction and development projects at preferential interest rates.Foreign borrowingsForeign borrowings of the Group include long-term loans received from foreign banks denominated mostly in EUR and with both fixed and floating interest rates. The following table is a summary of the Group’s foreign borrowings by remaining maturities.
Notes to the Bank and the Group Financial Statements
(b) Refinanced debt - Amounts due to the Republic of Croatia - London ClubThese amounts relate to foreign currency borrowings from commercial banks falling due under the New Financing Agreement signed on 20 September 1988. Repayments of principal under this agreement were due to commence in February 1994 with the first of 26 semi-annual instalments. However, negotiations continued regarding the assumption of the liabilities of the former Yugoslavia, and interest payments since 25 May 1992 and capital payments were delayed. During 1996 HRK 4,030 million liabilities to commercial banks under the New Financing Agreement were transferred from the Bank to the Rehabilitation Agency as part of the Bank’s rehabilitation. On 31 July 1996 the Government of the Republic of Croatia assumed responsibility for 29.5 percent of all rescheduled liabilities of the former Yugoslavia to commercial banks under the New Financing Agreement (London Club), representing the Republic of Croatia’s share of the debt of the former Yugoslavia. This liability was settled by the issue of bonds of the Republic of Croatia and the first payment of principal and interest was made on 31 January 1997. Consequently, the Bank’s liabilities to commercial banks under the New Financing Agreement were replaced by amounts due to the Republic of Croatia. The liabilities assumed by the Republic of Croatia were further rescheduled, for a period of 10 to 14 years; they are denominated in USD and carry interest at LIBOR + 13/16 percent. The amounts due to the Republic of Croatia by the Bank were similarly rescheduled and redenominated. The Bank expects to recover the majority of this amount from the Croatian companies who were the original borrowers of the funds.
(C) Refinanced debt - Amounts due to Government agencies - Paris ClubRepayments of foreign currency borrowings previously due between 1984 and 1988 were rescheduled and refinanced by the agreement concluded with the Paris Club. Under this agreement repayments of principal were to be made in 24 semi-annual instalments commencing January 1999. During 1996 further discussions were held with each of the contracting parties and substantially all of the Bank’s liabilities were rescheduled under the series of Consolidation Agreements. The Bank expects to recover this amount from the Croatian companies who were the original borrowers of the funds by rescheduling the loans in a manner similar to the above-described arrangements.
(in HRK million) Due in 2008 Due in 2009 Due in 2010 Due in 2011 Due after 2012 Total 2007 Total 2006
GROUP
Fixed rate - 1,075 - 1 - 1,076 1,307
Floating rate 1,132 733 549 2,030 1,753 6,197 5,255
Total foreign borrowings 1,132 1,808 549 2,031 1,753 7,273 6,562

72 73
annualreport
2007
Debt securities issuedIn April and October 2006 PBZ Card issued two tranches of commercial bills in total nominal amount of HRK 140 million. These securities were issued with maturity of 364 days and carry interest of 4.41 percent and 5.11 percent per tranche respectively. In April 2007 PBZ Card issued another tranche of commercial bills in total nominal amount of HRK 80 million. These securities were issued with maturity of 364 days and carry interest of 5.13 percent.
27
28
GROUP BANK
2007 2006 2007 2006
Amounts payable to creditors 1,144 1,098 17 49
Items in course of payment and other liabilities 345 479 284 422
Salaries and other staff costs 132 137 114 120
Taxes 87 118 45 58
1,708 1,832 460 649
Accruals and deferred income (in HRK million)29
GROUP BANK
2007 2006 2007 2006
Deferred tax liabilities 8 2 8 2
Deferred income 42 22 13 7
Accrued expenses 113 96 58 57
163 120 79 66
Other liabilities (in HRK million)
Provisions for risks and charges (in HRK million)30
GROUP BANK
2007 2006 2007 2006
a) Analysis
Provisions for contingent liabilities and commitments 154 108 150 102
Provisions for legal claims 99 89 92 84
Provisions for other risks and charges 12 14 - -
265 211 242 186
b) Movements
Balance at 1 January 211 188 186 175
Release of provisions (7) (4) (4) (8)
Provisions for guarantees and commitments (note 5) 49 (8) 49 (12)
Provisions for legal claims (note 5) 13 35 12 31
Foreign exchange loss (1) - (1) -
Balance at 31 December 265 211 242 186

Contingent liabilities and commitments
Legal claimsAs at 31 December 2007 there were several litigations outstanding against the Group. In the opinion of legal experts, there is a probability that the Group may lose certain cases. For this reason the level of provisions for potential loss in litigation as at 31 December 2007 made by the Group stood at HRK 99 million whilst the Bank provided HRK 92 million (refer to note 30).
Credit related contingencies and commitmentsThe primary purpose of these instruments is to ensure that funds are available to a customer when required. Guarantees and standby letters of credit, which represent irrevocable assurances that the Group will make payments in the event that customers cannot meet their obligations to third parties, carry the same credit risk as loans. Documentary and commercial letters of credit, which are written undertakings by the Group on behalf of a customer authorising a third party to draw drafts on the Group up to a stipulated amount under specific terms and conditions, are collateralised by the underlying shipments of goods to which they relate and therefore have significantly less risk. Cash requirements under guarantees and standby letters of credit are considerably less than the amount of the commitment because the Group does not generally expect the third party to draw funds under the agreement. The Group assessed that a provision of HRK 154 million is necessary to cover risks due to default of the respective counterparties (refer to note 30).
31
Notes to the Bank and the Group Financial Statements
The aggregate amounts of outstanding guarantees, letters of credit and other commitments at the end of the period were:
GROUP BANK
2007 2006 2007 2006
Undrawn lending commitments 11,686 10,565 11,460 10,360
Performance guarantees 1,745 1,478 1,714 1,407
Foreign currency guarantees 397 446 384 430
Foreign currency letters of credit 418 348 413 338
HRK guarantees 253 236 226 212
Other contingent liabilities 45 44 38 5
14,544 13,117 14,235 12,752
On 31 December 2007 the Group and the Bank had long-term commitments in respect of rent for business premises and equipment lease agreements expiring between 2008 and 2012. The Management Board is confident that the future net revenues and funding will be sufficient to cover this commitment. The future minimum commitments for each of the next five years along with comparative numbers for 2007 are presented below:
2007 2008 2009 2010 2011 2012 Total
Group
Premises 34 47 51 55 59 61 307
Equipment 2 3 3 4 4 4 18
36 50 54 59 63 65 325
Bank
Premises 33 46 50 54 58 60 301
Equipment 2 2 2 3 3 3 15
35 48 52 57 61 63 316

74 75
annualreport
2007
Share capitalThe total number of authorised registered shares on 31 December 2007 was 19,074,769 (2006: 19,074,769) with a nominal value of HRK 100 per share (2006: HRK 100 per share). On 17 December 1999, the State Agency for Deposit Insurance and Bank Rehabilitation and Comit Holding International (now Intesa Holding International) through Banca Commerciale Italiana (now Banca Intesa) signed the Share Purchase Agreement in Relation to Privredna banka Zagreb. By this contract, which came into effect on 28 January 2001, Banca Commerciale Italiana acquired 11,046,005 ordinary shares amounting to 66.3 percent of the total share capital of the Bank. According to this agreement the State Agency for Deposit Insurance and Bank Rehabilitation kept 4,165,002 ordinary shares which accounted for 25 percent (plus two shares) of the total share capital of the Bank (prior to 28 January 2001 the State Agency for Deposit Insurance and Bank Rehabilitation was the majority shareholder holding 15,211,007 ordinary shares which accounted for 91.3 percent of total share capital of the Bank). Furthermore, on 22 November 2002, the State Agency for Deposit Insurance and Bank Rehabilitation, Intesa Holding International and the European Bank for Reconstruction and Development signed a three-party Share Purchase Agreement Relating to Privredna banka Zagreb whereby the EBRD acquired 15 percent of the nominal capital whilst Intesa Holding International gained the remaining 10 percent from the State Agency for Deposit Insurance and Bank Rehabilitation. Following finalisation of the public tender, as required in such circumstances by the Croatian law on the take-over of joint stock companies, Intesa Holding International and the EBRD concluded a contract on 22 January 2003 for the purchase of 965,746 shares by the EBRD from Intesa Holding International. In November 2006, following Decision of the Extraordinary General Assembly held on 31 August 2006, Intesa Holding International and the EBRD subscribed to additional capital of the Bank in amount of HRK 1,811,076,750 of which Intesa Holding subscribed HRK 1,423,143,750 and the EBRD HRK 387,933,000. The new share capital was registered in the Commercial Court in Zagreb on 16 November 2006. As of 31 December 2006, following the merger of Banca Intesa with Sanpaolo IMI, Intesa Holding International changed its name into Intesa Sanpaolo Holding International. The ownership structure as at 31 December 2007 was as follows:
32
The ownership structure as at 31 December 2007 was as follows.
During the year the movement of treasury shares was as follows.
(number of shares) 2007 2006
Balance at 1 January 43,389 48,129
Increase 20,000 27,484
Decrease (12,790) (32,224)
Balance at 31 December 50,599 43,389
REGISTERED SHARES
31 December 2007 31 December 2006
Number Percentage Number Percentage of shares of ownership of shares of ownership
Intesa Sanpaolo Holding 14,609,532 76.6% 14,609,532 76.6%International
EBRD 3,981,990 20.9% 3,981,990 20.9%
Minority shareholders 432,648 2.3% 439,858 2.3%
Treasury shares 50,599 0.2% 43,389 0.2%
19,074,769 100% 19,074,769 100%
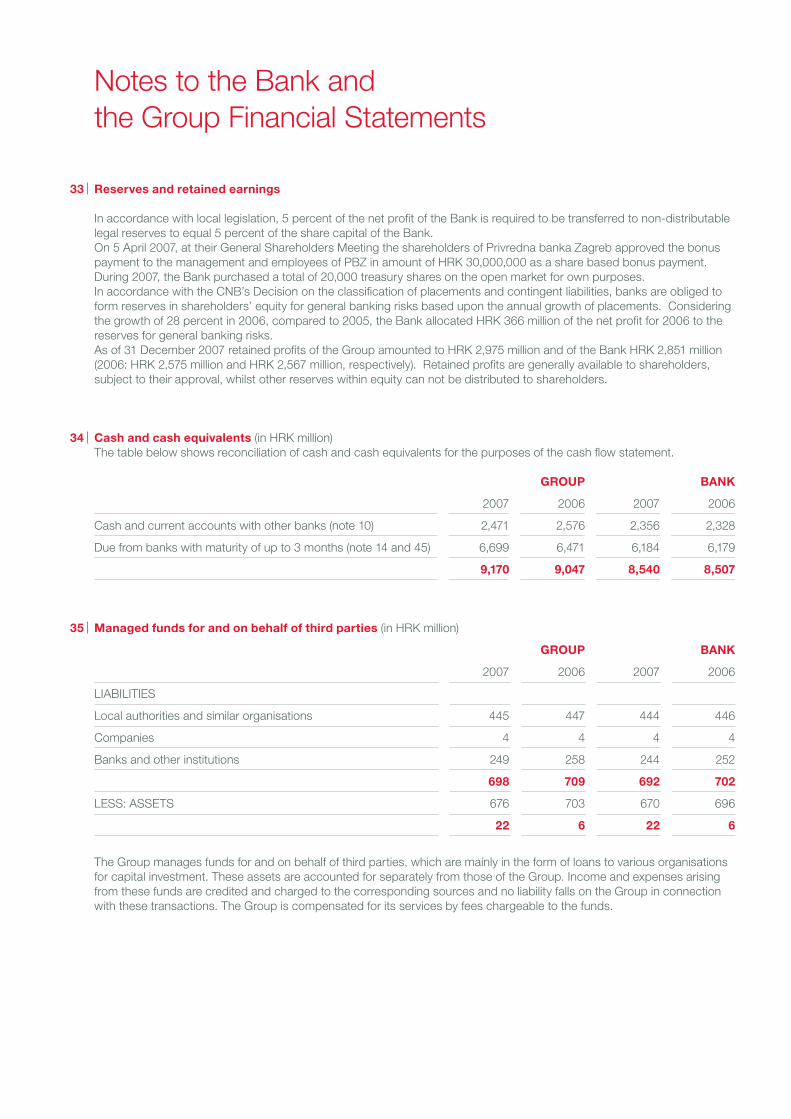
33 Reserves and retained earnings
In accordance with local legislation, 5 percent of the net profit of the Bank is required to be transferred to non-distributable legal reserves to equal 5 percent of the share capital of the Bank.On 5 April 2007, at their General Shareholders Meeting the shareholders of Privredna banka Zagreb approved the bonus payment to the management and employees of PBZ in amount of HRK 30,000,000 as a share based bonus payment.During 2007, the Bank purchased a total of 20,000 treasury shares on the open market for own purposes.In accordance with the CNB’s Decision on the classification of placements and contingent liabilities, banks are obliged to form reserves in shareholders’ equity for general banking risks based upon the annual growth of placements. Considering the growth of 28 percent in 2006, compared to 2005, the Bank allocated HRK 366 million of the net profit for 2006 to the reserves for general banking risks. As of 31 December 2007 retained profits of the Group amounted to HRK 2,975 million and of the Bank HRK 2,851 million (2006: HRK 2,575 million and HRK 2,567 million, respectively). Retained profits are generally available to shareholders, subject to their approval, whilst other reserves within equity can not be distributed to shareholders.
Notes to the Bank and the Group Financial Statements
Cash and cash equivalents (in HRK million)The table below shows reconciliation of cash and cash equivalents for the purposes of the cash flow statement.
34
GROUP BANK
2007 2006 2007 2006
Cash and current accounts with other banks (note 10) 2,471 2,576 2,356 2,328
Due from banks with maturity of up to 3 months (note 14 and 45) 6,699 6,471 6,184 6,179
9,170 9,047 8,540 8,507
Managed funds for and on behalf of third parties (in HRK million)35
GROUP BANK
2007 2006 2007 2006
LIABILITIES
Local authorities and similar organisations 445 447 444 446
Companies 4 4 4 4
Banks and other institutions 249 258 244 252
698 709 692 702
LESS: ASSETS 676 703 670 696
22 6 22 6
The Group manages funds for and on behalf of third parties, which are mainly in the form of loans to various organisations for capital investment. These assets are accounted for separately from those of the Group. Income and expenses arising from these funds are credited and charged to the corresponding sources and no liability falls on the Group in connection with these transactions. The Group is compensated for its services by fees chargeable to the funds.

76 77
annualreport
2007
LeasesPBZ Leasing d.o.o., the company wholly-owned by the Bank, has entered as a lessor into both finance and operating lease arrangements of various items of equipment, vessels and vehicles. Net investments in finance lease in the Group financial statements are included within loans and advances to customers in the total amount of HRK 920.8 million (2006: HRK 773.1 million) (refer to note 15). The amounts related to operating lease arrangements are classified within property and equipment (refer to note 20). The net book value of leased property and equipment was HRK 262.6 million (2006: HRK 176.5 million). Future minimum lease payments under finance leases together with the present value of the net minimum lease payments are set out below:
36
Minimum Present Minimum Present payments value of payments value of payments payments
(in HRK million) 2007 2007 2006 2006
Next year 263 196 216 163
Between one and five years 627 482 516 404
After five years 359 275 297 230
Total minimum lease payments receivable 1,249 953 1,029 797
Unearned finance income (296) - (232) -
Total investment in finance lease 953 953 797 797
Less: Allowance for uncollectable amounts (32) (32) (24) (24)
Net investment in finance lease 921 921 773 773
Future minimum rentals receivable under non-cancellable operating leases are as follows:(in HRK million) 2007 2006
Within one year 66 55
After one year but no more than five years 130 109
More than five years 63 67
259 231

37 Related party transactions (in HRK million)
As of 31 December 2007 Privredna banka Zagreb and its subsidiaries are under controlling interest of Intesa Sanpaolo, which owned 76.59 percent of the share capital at that date.Related parties include companies controlled or influenced by the Bank by virtue of its shareholdings and also companies that can influence the Bank by virtue of their shareholdings in the Bank, together with other companies forming part of the Intesa Sanpaolo Group. In addition, companies influenced by the key management personnel of the Bank are also considered to be related parties.The Bank grants loans to or places deposits with the companies to which it is related. Such loans are made in the ordinary course of business at terms and conditions available to third parties. The volumes of related party transactions and outstanding balances at the year end were as follows:
Notes to the Bank and the Group Financial Statements
Key management personnel Related companies
GROUP
LOANS GIVEN
Loans outstanding at 1 January 2007 7 2,160
Changes during the year 5 (181)
Loans outstanding at 31 December 2007 12 1,979
DEPOSITS AND LOANS RECEIVED
Balance at 1 January 2007 20 8,544
Changes during the year (5) (1,448)
Balance at 31 December 2007 15 7,096
Contingent liabilities and commitments - 167
Bank
LOANS GIVEN
Loans outstanding at 1 January 2007 6 2,463
Changes during the year 5 (426)
Loans outstanding at 31 December 2007 11 2,037
DEPOSITS AND LOANS RECEIVED
Balance at 1 January 2007 14 7,900
Changes during the year (1) (1,941)
Balance at 31 December 2007 13 5,959
Contingent liabilities and commitments - 94
No provisions were recognised in respect of loans given to related parties (2006: nil).

78 79
annualreport
2007
Related party transactions / continued (in HRK million)
Key management compensation:
37
GROUP BANK
2007 2006 2007 2006
Salaries and other short-term benefits 31 28 18 16
Bonus payments 12 10 11 9
Termination benefits - 1 - -
43 39 29 25
Key management personnel include Management Board and Supervisory Board members, as well as senior executive directors or executive directors responsible for the areas of strategic relevance.
Financial risk management policies
This section provides details of the Group’s exposure to risk and describes the methods used by the management to control risk. The most important types of financial risk to which the Group is exposed are credit risk, liquidity risk, market risk and operational risk. Market risk includes currency risk, interest rate risk and equity price risk.An integrated system of risk management is being established at the Group level by introducing a set of policies and procedures, determining the limits of risk levels acceptable to the Group. The limits are set according to the amount of regulatory capital and apply to all types of risk. Methodology and models for managing operational risk have been developed.
Credit riskThe Group is subject to credit risk through its trading, lending and investing activities and in cases where it acts as an intermediary on behalf of customers or other third parties or issues guarantees. The risk that counter parties to both derivative and other instruments might default on their obligations is monitored on an ongoing basis. To manage the level of credit risk, the Group deals with counter parties of good credit standing, and when appropriate, obtains collateral.The Group’s primary exposure to credit risk arises through its loans and advances. The amount of credit exposure in this regard is represented by the carrying amounts of the assets on the balance sheet. In addition, the Group is exposed to off balance sheet credit risk through commitments to extend credit and guarantees issued - refer to note 31.Commitments to lend or based on guarantees issued by the Group that are contingent upon customers maintaining specific standards (including the term of not worsening the solvency position of customers) represent liabilities that can be revoked. Irrevocable liabilities are based upon undrawn but approved loans and approved overdrafts because these liabilities are the result of terms determined by loan contracts.Guarantees and approved letters of credit that commit the Group to make payments on behalf of customers in the event of a specific act carry the same credit risk as loans. Standby letters of credit that represent written guarantees of the Group in the client’s name that the third party can withdraw funds up to the preapproved limit are covered with the collaterals, being the goods for which they were issued. Even though the credit risk for this type of product is significantly lower than for direct loans, the Group calculates impairment provisions on the same basis. Exposure to credit risk has been managed in accordance with the Group’s policies. Credit exposures to portfolios and individual group exposures are reviewed on a regular basis against the set limits. Breaches are reported to appropriate bodies and personnel within the Bank authorised to approve it. Any substantial increases in credit exposure are authorised by the Credit Committee. The Assets Quality Committee monitors changes in credit-worthiness of credit exposures and reviews proposed impairment losses. Credit risk assessment is continuously monitored and reported, thus enabling an early identification of impairment in the credit portfolio. The Group has been continually applying prudent methods and models used in the process of the credit risk assessment.
38

Where financial instruments are recorded at fair value the amounts shown above represent the credit risk exposure at the balance sheet date but not the maximum risk exposure that could arise in the future as a result of changes in fair values.Concentration of risk is managed by client/counterparty, by geographical region and by industry sector. The maximum credit exposure to any client or counterparty as of 31 December 2007 was HRK 733 million (2006: HRK 222 million) before taking account of collateral or other credit enhancements.The Group’s policy is to require suitable collateral to be provided by certain customers prior to the disbursement of approved loans. As a rule, the Group approves a facility if there are two independent and viable repayment sources - cash flow generated by the borrower’s activity and security instruments/collateral. The main types of collateral obtained are as follows:
• cash deposit for which the agreement stipulates that the Bank shall have the right to use the cash deposit for debt recovery and that the depositor may not use this deposit until the final settlement of all obligations under the approved facility,
• guarantee of the Government of the Republic of Croatia,• pledge of securities issued by the Republic of Croatia or the Croatian National Bank,• irrevocable guarantee or super guarantee issued by a domestic or foreign bank with adequate credit rating with the
conditions of “payable on first demand“ or “without objections” or similar,• credit insurance policy issued by the Croatian Bank for Reconstruction and Development,• credit insurance policy issued by an appropriate insurance company in accordance with the internal regulations of the
Bank,• pledge of units in investment funds managed by PBZ Invest,• mortgage/lien/fiduciary transfer of ownership of property, movable property or securities of other issuers.
38
Notes to the Bank and the Group Financial Statements
Financial risk management policies / continued
Credit risk / continuedThe table below shows the maximum exposure to credit risk for the components of the balance sheet, including derivatives. The maximum exposure is shown gross, before the effect of mitigation through collateral agreements.
NOTE GROUP BANK
(in HRK million) 2007 2006 2007 2006
Cash and current accounts with other banks 10 1,339 1,550 1,286 1,382(excluding cash in hand)
Balances with Croatian National Bank 11 8,194 7,262 7,934 7,049
Financial assets at fair value through profit or loss 12 4,170 3,056 4,182 3,074
Derivative financial assets 13 33 44 33 44
Due from banks 14 7,245 7,235 6,726 6,935
Loans and advances to customers 15 40,147 36,910 36,436 33,572
Assets available for sale 16 1,853 1,305 482 53
Held to maturity investments 17 1,288 1,358 979 1,158
Other assets (excluding leasehold improvements 23 293 361 117 138and real estates pledged for non-performing loans)
Total 64,562 59,081 58,175 53,405
Contingent liabilities and commitments 31 14,544 13,117 14,235 12,752
Total credit risk exposure 79,106 72,198 72,410 66,157

80 81
annualreport
2007
38
In general, a quality security instrument is an instrument with characteristics that provide a reasonable estimate of the Bank’s ability to recover its dues secured by that instrument (in case of its activation), through market or court mechanisms, within a reasonable period of time. Management monitors the market value of collateral, requests additional collateral in accordance with the underlying agreement, and monitors the market value of collateral obtained during its review of the adequacy of the allowance for impairment losses. In 2007 the Bank initiated collateral management project aimed at substantive collateral (including real estate) redesign. The project focuses on developing a new platform for collateral management, collateral revaluation as well as allocation of the value of collateral against respective loan accounts. This project, currently in pilot phase, will enable the Bank to modernise and improve collateral revaluation process and will optimise its capital adequacy. Full compleation of the project has been planned for mid 2008.
Ageing analysis of past due receivables per class of financial assets is shown below. The exposures below include not just the portion of debt that is overdue but also total receivables outstanding at the balance sheet date.
Less than 31 to 90 91 to 180 More than TotalGROUP 2007 (in HRK million) 30 days days days 180 days
Loans and advances to customers
Corporate lending 8,693 1,072 48 479 10,292
Housing loans 1,738 380 87 59 2,264
Other retail loans 3,172 932 226 500 4,830
Public sector and other 1,015 103 4 12 1,134
14,618 2,487 365 1,050 18,520
Due from banks 150 - - 120 270
Securities 3 - - - 3
Other due receivables 2,180 193 157 1,071 3,601
Total 16,951 2,680 522 2,241 22,394
GROUP 2006 (in HRK million)
Loans and advances to customers
Corporate lending 7,856 1,383 335 578 10,152
Housing loans 1,154 373 57 94 1,678
Other retail loans 2,710 1,173 302 528 4,713
Public sector and other 1,124 143 75 3 1,345
12,844 3,072 769 1,203 17,888
Due from banks 440 - - 15 455
Securities - - - - -
Other due receivables 1,124 172 147 1,283 2,726
Total 14,408 3,244 916 2,501 21,069
Financial risk management policies / continued
Credit risk / continued

Less than 31 to 90 91 to 180 More than TotalBANK 2007 (in HRK million) 30 days days days 180 days
Loans and advances to customers
Corporate lending 8,067 860 37 420 9,384
Housing loans 1,731 375 84 55 2,245
Other retail loans 2,872 761 203 449 4,285
Public sector and other 1,010 103 2 12 1,127
13,680 2,099 326 936 17,041
Due from banks 149 - - 120 269
Securities 3 - - - 3
Other due receivables 2,139 175 155 902 3,371
Total 15,971 2,274 481 1,958 20,684
BANK 2006 (in HRK million)
Loans and advances to customers
Corporate lending 7,238 1,189 329 515 9,271
Housing loans 1,146 371 55 91 1,663
Other retail loans 2,298 1,037 276 469 4,080
Public sector and other 1,097 143 75 3 1,318
11,779 2,740 735 1,078 16,332
Due from banks 439 - - 15 454
Securities - - - - -
Other due receivables 1,082 157 146 1,121 2,506
Total 13,300 2,897 881 2,214 19,292
Notes to the Bank and the Group Financial Statements
38 Financial risk management policies / continued
Credit risk / continued
The exposure is shown gross, before the effect of mitigation through collateral agreements. Other due receivables include accrued interest on overdue receivables. A portion of this interest, related to substandard and non performing loans, is not recognised in the balance sheet nor credited to the income statement until collected. As of 31 December 2007 the total amount of the Group’s past due receivables that were not individually impaired stood at HRK 19,201 million gross, before the effect of collaterals, while for the Bank the amount stood at HRK 17,735 million.
Credit risk per class of financial assetsCredit risk by type of financial assets for loans and receivables is monitored using internal classification of the credit risk. The table below provides an aggregated analysis of financial assets for the banking segment of the Group, as the main segment of consolidated balance sheet, broken down by risk grades as at 31 December 2007. The amounts provided are gross of specific or collective provisions.

82 83
annualreport
2007
38 Financial risk management policies / continued
Credit risk / continued
Liquidity riskLiquidity risk arises in the general funding of the Group’s activities and in the management of positions. It includes both the risk of being unable to fund assets at the appropriate maturities and rates and the risk of being unable to liquidate an asset at a reasonable price and in an appropriate time frame.The Group has access to a diverse funding base. Funds are raised using a broad range of instruments including deposits, borrowings, subordinated liabilities including deposits, borrowings and share capital. The Group continually assesses liquidity risk by identifying and monitoring changes in funding required to meet business goals and targets set in terms of the overall Group strategy. In addition, the Group holds a portfolio of liquid assets as part of its liquidity risk management.The Group adjusts its business activities in compliance with liquidity risk according to regulatory and internal policies for maintenance of liquidity reserves, matching of liabilities and assets, limits control, preferred liquidity ratios and contingency planning procedure. Needs for short-term liquidity are planned every month for a period of one month and controlled and maintained daily. The treasury manages liquidity reserves daily, ensuring also the fullfilment of all customer needs.
The Group uses the following basic models for measurement of the liquidity risk:• stressed short term mismatches;• maturity transformation rules;• cumulative maturity mismatches of the Group’s balance sheet by currencies;• what if analysis• funding and other structural indicators;• cash flow projections.
For the purpose of the Group’s liquidity risk exposure reporting, three main types of signals are defined:• Hard limit - breach of a prescribed limit demands action according to the Liquidity risk management policy; • Threshold of attention - breach of threshold acts as an early warning signal, demanding additional attention and action if
decided by responsible persons;• Information on various measures and indicators - serving as information to the relevant decision-making bodies.
Market riskAll trading instruments are subject to market risk, the risk that future changes in market conditions may make an instrument less valuable or more onerous. The instruments are recognised at fair value, and all changes in market conditions directly affect net trading income. The Group manages its use of trading instruments in response to changing market conditions. The limits are defined following the needs and strategy of the Group and in accordance with senior management risk policy indications.
(in HRK million) RISK GRADES
BANKING SEGMENT 2007 A B1 B2 B3 C Total
Due from banks 7,253 - - - - 7,253
Loans to customers 37,577 744 566 69 798 39,754
of which Republich of Croatia, Government agencies and municipalities 3,582 4 - - - 3,586
of which corporate and SME customers 11,126 638 189 39 338 12,330
of which retail customers 22,579 102 377 30 444 23,532
of which other loans 290 - - - 16 306
Held to maturity investments 957 - - - - 957
Assets available for sale 742 - - - - 742
Other receivables 324 - 3 - 30 357
Total 46,853 744 569 69 828 49,063

Notes to the Bank and the Group Financial Statements
38 Financial risk management policies / continued
Market risk / continued
Equity Interest rate FX VaR Effects of Total (in HRK thousand) VaR VaR correlation
2007 - 2 January 4,463 3,218 835 (3,355) 5,161
2007 - 31 December 5,159 14,192 343 (1,161) 18,533
2007 - Average daily 4,992 7,979 1,843 (5,772) 9,042
2007 - Lowest 3,838 3,130 44 (2,025) 4,987
2007 - Highest 7,645 15,030 5,828 (9,100) 19,403
Note: historical simulation used for VaR calculations
Equity Fixed Income Money market (in HRK thousand) VaR VaR securities VaR
2006 - 29 December 1,627 538 619
2006 - Average daily 2,600 2,468 1,263
2006 - Highest 5,288 3,966 2,879
Note: parametric simulation used for VaR calculations
Exposure to market risk is formally managed in accordance with risk limits approved by senior management and revised at least annually in terms of positional (nominal) exposure, VaR, PV01 and stop loss limits. The exposure figures and limit utilisation are delivered daily to the senior management and the lower management levels in the Treasury Division, which enables informed decision-making at all management and operational levels.PBZ follows advanced market risk measurement and management principles promoted by Intesa Sanpaolo Group which are prescribed by Group-wide general policy guidelines and operative procedurals standards. Starting from 2004, the Bank has fully integrated advanced techniques for risk measurement into day-to-day risk management process (introduction of VaR - parametric approach as an official limits methodology starting from June 2004 with K+ support) which served as a basis for top management reporting on the Bank’s market risk exposure. In addition to this, starting from 1 January 2007, PBZ started to use historical simulation (as Group standard VaR methodology) and RiskWatch (as Group wide VaR calculation engine), followed by all other supporting activities (pricing, back-testing, stress testing), which insured full compliance with Intesa Sanpaolo Group standards.
Bank’s internal market risk management framework defines strict and clear procedures ensuring high quality and advanced systems for market risk measurement process. The major elements of the market risk management framework include:• VaR Methodology and Backtesting, • Fair Value Measurement, • Risk Identification and Measurement Process, • Stress testing, • Internal Trading Book Regulation, • Risk Management Organisation, • PBZ Limits for Market Risk Exposures, • General Policy guidelines for Investments into AFS Portfolio, • Procedure for monitoring and measurement of counterparty and delivery risk exposure.
These measures, combined with regular control and reporting process, present a high quality and confident system for market risk measurement.The VaR that the Bank measures is an estimate, using a confidence level of 99 percent, of the potential loss that is not expected to be exceeded if the current market risk positions were to be held unchanged for one day. The use of a 99 percent confidence level means that, within a one day horison, losses exceeding the VaR figure should occur, on average, not more than once every hundred days.

84 85
annualreport
2007
38 Financial risk management policies / continued
Market risk / continuedIn terms of VaR applications, as of 01 January 2007 the market risks measured using VaR technique are: • general interest rate in the trading book, • equity risk in trading book and • foreign exchange risk on the balance sheet level (both trading and banking book). In practice the actual trading results will differ from the VaR calculation and, in particular, the calculation does not provide a meaningful indication of profits and losses in stressed market conditions. To determine the reliability of the VaR models, actual outcomes are monitored regularly to test the validity of the assumptions and the parameters used in the VaR calculation.
Currency riskThe Group takes on exposure to the effects of fluctuations in the prevailing foreign currency exchange rates on its financial position and cash flows. The foreign exchange risk exposure is monitored on the overall balance sheet level in terms of foreign exchange open position as prescribed by the regulatory provisions and additionally through the internal limits based on the advanced market risk models (FX VaR) on a daily basis.
Interest rate riskInterest rate risk is the sensitivity of the Group’s financial condition to movements in interest rates. Mismatches or gaps in the amount of assets, liabilities and off-balance sheet instruments that mature or reprice in a given period generate interest rate risk.The Group’s operations are subject to the risk of interest rate fluctuations to the extent that interest-earning assets and interest-bearing liabilities mature or reprice at different times or in differing amounts. In the case of floating rate assets and liabilities the Group is also exposed to basis risk, which is the difference in the repricing characteristics of the various floating rate indices.Asset-liability risk management activities are conducted in the context of the Group’s sensitivity to interest rate exchanges. Exposure to interest rate risk is monitored and measured using repricing gap analysis, net interest income and economic value of equity. Risk management activities are aimed at optimising net interest income and the economic value of equity, given market interest rate levels consistent with the Group’s business strategies.
Equity price riskEquity price risk is the possibility that equity prices will fluctuate affecting the fair value of equity investments and other instruments that derive their value from a particular equity investment. The primary exposure to equity prices arises from equity securities held for trading and available for sale.
Derivative financial instrumentsThe Group enters into derivative financial instruments primarily to satisfy the needs and requirements of the customers. Derivative financial instruments used by the Group include foreign exchange swaps and forwards. Derivatives are contracts individually negotiated over-the-counter.
Operational riskOperational risk is defined as the risk of loss resulting from inadequate or failed internal processes, people and systems or from external events. This definition includes legal risk but excludes strategic and reputational risk. In order to efficiently measure and manage operational risk exposure at the Group level, the Bank is developing an internal model for operational risk exposure management in line with the Basel II prescribed framework. The main goals of the internal model are: to implement techniques enabling detailed insight into the profile of the Bank’s risk exposure such as (quantitative (‘ex-post’) and qualitative (ex-ante’) risk exposure assessment); to support the management decision making process by developing efficient policies for management and mitigation of operational risk at the Group level; adjustment of the pricing/provisioning policy by incorporation of expected losses and allocation of adequate economic/regulatory capital for unexpected losses.

Notes to the Bank and the Group Financial Statements
40 Fair values of financial assets and liabilities
Fair value represents the amount at which an asset could be exchanged or a liability settled on an arms length basis. Financial assets and financial liabilities at fair value through profit or loss are measured at fair value. Loans and advances to customers and assets held to maturity are measured at amortised cost less impairment. Available for sale instruments are generally measured at fair value with exception of some equity investments which are more appropriate to be kept at cost less impairment given the lack of quoted market prices in an active market or whose fair value cannot be reliably measured.The following methods and assumptions have been made in estimating the fair value of financial instruments.• As at 31 December 2007 marginal reserve with the Croatian National Bank earned no interest. The fair value of balances with the Croatian National Bank for the Group is estimated to be 8,181 million kuna and for the Bank 7,921 million kuna (carrying value being 8,194 and 7,934 million kuna, respectively);
• Loans and advances to customers are net of specific and other provisions for impairment. The estimated fair value of loans and advances represents the discounted amount of estimated future cash flows expected to be received. Expected future cash flows are estimated considering credit risk and any indication of impairment. As the Group has a limited portfolio of loans and advances with fixed rate and longer term maturity, the fair value of loans and advances is not significantly different from their carrying value;
• The fair value of securities is based on market prices, with the exception of unquoted equity investments where fair value is based on the latest available financial statements of the issuer;
• For some of investments carried at amortised cost less impairment a quoted market price is not available and fair value is, where possible, estimated using mark to model techniques and, as a result, their estimated fair value appeared not to be materially different from their carrying value. The fair value of securities held to maturity for the Group is estimated to be at HRK 1,313 million kuna and for the Bank 1,017 million kuna (carrying value 1,288 and 979 million kuna, respectively);
• For demand deposits and deposits with no defined maturities, fair value is determined to be the amount payable on demand at the balance sheet date.
• Most of the Group’s long-term debt borrowings bear floating interest rates which are linked to market and reprice regularly. As such the management believes that the book value of the long term borrowings approximates their fair value.
In the opinion of the Management Board of the Bank there are no significant differences between the book values and the fair values of assets and liabilities.
39 Capital
The Bank maintains an actively managed capital base to cover risks in the business. The adequacy of the Bank’s capital is monitored using, among other measures, the rules and ratios established by the Croatian National Bank in supervising the Bank. During the past year, the Bank complied in full with all its externally imposed capital requirements.
Regulatory capital consists of Tier 1 capital, which comprises share capital, share premium, retained earnings including current year profit, capital gains and other reserves. The other component of regulatory capital is Tier 2 capital, which includes provision for collective impairment up to 0.5 percent of total risk weighted assets.
BANK
(in HRK million) 2007 2006
Tier 1 capital 6,866 6,842
Tier 2 capital 206 426
Deductions (434) (312)
Total capital 6,638 6,956
Risk weighted assets and other risk elements 43,402 44,157
Tier 1 capital ratio 15.82% 15.49%
Total capital ratio 15.29% 15.75%

86 87
annualreport
2007
The following tables present information on the income statement and certain assets and liabilities regarding the Group’s business segments for the years ended 31 December 2007 and 2006. The operating businesses are organised and managed separately according to the nature of the products and services provided, with each segment representing strategic segment units that offer different products and serve different markets.
41 Financial information by segment (in HRK million)
Banking Card Leasing Other Non Consolidation Total services financial financial adjustments GROUP services services
As at 31 December 2007
Interest income 3,430 74 72 51 - - 3,627
Interest expense (1,626) (7) (46) (30) - - (1,709)
Intersegment 5 - (6) - - 1 -
Net interest income 1,809 67 20 21 - 1 1,918
Fee and commission income 561 576 5 140 18 - 1,300
Fee and commission expense (199) (23) - (8) (6) - (236)
Intersegment 40 (2) - (39) - 1 -
Net fee and commission income 402 551 5 93 12 1 1,064
Other operating income 412 31 115 (1) 20 (154) 423
Operating income 2,623 649 140 113 32 (152) 3,405
Provisions, other operating expenses (1,420) (400) (126) (34) (12) 25 (1,967)and depreciation and amortisation
Share of the profit and loss accounted - (1) - 9 - - 8for using the equity method
Income taxes (227) (53) (4) (15) (4) - (303)
Minority interests (2) - - - - - (2)
Net profit for the year 974 195 10 73 16 (127) 1,141
Segment assets 63,334 1,943 1,350 1,471 68 (665) 67,501
Equity investments in subsidiaries 46 3 - - - - 49and associates
Total assets 63,380 1,946 1,350 1,471 68 (665) 67,550
Segment liabilities 55,189 1,486 1,306 1,351 2 (374) 58,960
Taxes payable 49 18 2 15 3 - 87
Total liabilities 55,238 1,504 1,308 1,366 5 (374) 59,047

Notes to the Bank and the Group Financial Statements
41 Financial information by segment / continued (in HRK million)
Banking Card Leasing Other Non Consolidation Total services financial financial adjustments GROUP services services
As at 31 December 2006
Interest income 2,837 58 53 28 - - 2,976
Interest expense (1,226) (3) (14) (19) - - (1,262)
Intersegment 22 3 (22) 6 - (9) -
Net interest income 1,633 58 17 15 - (9) 1,714
Fee and commission income 497 504 4 55 17 - 1,077
Fee and commission expense (193) (11) - (6) (8) - (218)
Intersegment 16 (12) - (12) 1 7 -
Net fee and commission income 320 481 4 37 10 7 859
Other operating income 454 27 101 - 9 (125) 466
Operating income 2,407 566 122 52 19 (127) 3,039
Provisions, other operating expenses and depreciation and amortisation (1,324) (371) (111) (24) (9) 11 (1,828)
Share of the profit and loss accounted for using the equity method - - - 8 - - 8
Income taxes (203) (41) (3) (5) (2) - (254)
Minority interests (1) - - - (1) - (2)
Net profit for the year 879 154 8 31 7 (116) 963
Segment assets 58,883 1,668 1,067 1,060 55 (804) 61,929
Equity investments in subsidiaries and associates 41 4 - - - - 45
Total assets 58,924 1,672 1,067 1,060 55 (804) 61,974
Segment liabilities 51,425 1,277 1,030 994 3 (498) 54,231
Taxes payable 59 48 5 5 1 - 118
Total liabilities 51,484 1,325 1,035 999 4 (498) 54,349

88 89
annualreport
2007
42 Interest rate risk (in HRK million)
GROUP Up to From From 3 Over Non-interest Total 1 month 1 to 3 months 1 year bearing As at 31 December 2007 months to 1 year
Assets
Cash and current accounts with other banks 194 - - - 2,277 2,471
Balances with Croatian National Bank 7,140 - - - 1,054 8,194
Financial assets at fair value through profit or loss 1,039 350 1,424 1,357 - 4,170
Derivative financial assets 33 - - - - 33
Due from banks 6,727 508 3 - 7 7,245
Loans and advances to customers 33,394 321 1,100 3,515 1,817 40,147
Assets available for sale 384 51 131 1,265 22 1,853
Held to maturity investments 28 1 112 1,147 - 1,288
Equity investments in subsidiaries and associates - - - - 49 49
Intangible assets and goodwill - - - - 171 171
Property and equipment - - - - 1,378 1,378
Investment property - - - - 15 15
Other assets 2 - 7 - 380 389
Deferred tax assets - - - - 147 147
48,941 1,231 2,777 7,284 7,317 67,550
Liabilities
Due to banks 2,951 - 1 11 166 3,129
Due to customers 33,042 615 1,187 957 6,117 41,918
Derivative financial liabilities 38 - - - - 38
Other borrowed funds 8,966 269 307 2,215 3 11,760
Debt securities issued - - 66 - - 66
Other liabilities - - - - 1,708 1,708
Accruals and deferred income - - - - 163 163
Provisions for risks and charges - - - - 265 265
44,997 884 1,561 3,183 8,422 59,047
Interest sensitivity gap 3,944 347 1,216 4,101 (1,105) 8,503
The following tables present the Group’s and the Bank’s assets and liabilities analysed according to repricing periods determined as the earlier of remaining contractual maturity and contractual repricing.

Notes to the Bank and the Group Financial Statements
42
BANK Up to From From 3 Over Non-interest Total 1 month 1 to 3 months 1 year bearing As at 31 December 2007 months to 1 year
Assets
Cash and current accounts with other banks 194 - - - 2,162 2,356
Balances with Croatian National Bank 6,880 - - - 1,054 7,934
Financial assets at fair value through profit or loss 1,016 350 1,459 1,357 - 4,182
Derivative financial assets 33 - - - - 33
Due from banks 6,235 488 - - 3 6,726
Loans and advances to customers 32,067 286 948 2,702 433 36,436
Assets available for sale 358 - - 105 19 482
Held to maturity investments 26 - - 953 - 979
Equity investments in subsidiaries and associates - - - - 363 363
Intangible assets and goodwill - - - - 70 70
Property and equipment - - - - 847 847
Investment property - - - - 15 15
Other assets - - - - 211 211
Deferred tax assets - - - - 97 97
46,809 1,124 2,407 5,117 5,274 60,731
Liabilities
Due to banks 2,949 - 1 11 166 3,127
Due to customers 31,285 604 664 79 6,062 38,694
Derivative financial liabilities 38 - - - - 38
Other borrowed funds 8,869 112 293 970 - 10,244
Other liabilities - - - - 460 460
Accruals and deferred income - - - - 79 79
Provisions for risks and charges - - - - 242 242
43,141 716 958 1,060 7,009 52,884
Interest sensitivity gap 3,668 408 1,449 4,057 (1,735) 7,847
Interest rate risk / continued (in HRK million)

90 91
annualreport
2007
42 Interest rate risk / continued (in HRK million)
GROUP Up to From From 3 Over Non-interest Total 1 month 1 to 3 months 1 year bearing As at 31 December 2006 months to 1 year
Assets
Cash and current accounts with other banks 177 - - - 2,399 2,576
Balances with Croatian National Bank 4,637 - - - 2,625 7,262
Financial assets at fair value through profit or loss 679 399 1,011 782 185 3,056
Derivative financial assets - - - - 44 44
Due from banks 7,189 42 4 - - 7,235
Loans and advances to customers 31,700 565 1,115 3,530 - 36,910
Assets available for sale 60 120 148 974 3 1,305
Held to maturity investments 30 3 - 1,325 - 1,358
Equity investments in subsidiaries and associates - - - - 45 45
Intangible assets and goodwill - - - - 200 200
Property and equipment - - - - 1,381 1,381
Investment property - - - - 14 14
Non current assets held for sale - - - - 18 18
Other assets - - - - 449 449
Deferred tax assets - - - - 121 121
44,472 1,129 2,278 6,611 7,484 61,974
Liabilities
Due to banks 4,458 14 9 37 - 4,518
Due to customers 33,571 847 1,144 1,207 74 36,843
Derivative financial liabilities - - - - 15 15
Financial liabilities held for trading 735 - - - - 735
Other borrowed funds 7,862 29 311 1,754 - 9,956
Debt securities issued - - 119 - - 119
Other liabilities - - - - 1,832 1,832
Accruals and deferred income - - - - 120 120
Provisions for risks and charges - - - - 211 211
46,626 890 1,583 2,998 2,252 54,349
Interest sensitivity gap (2,154) 239 695 3,613 5,232 7,625
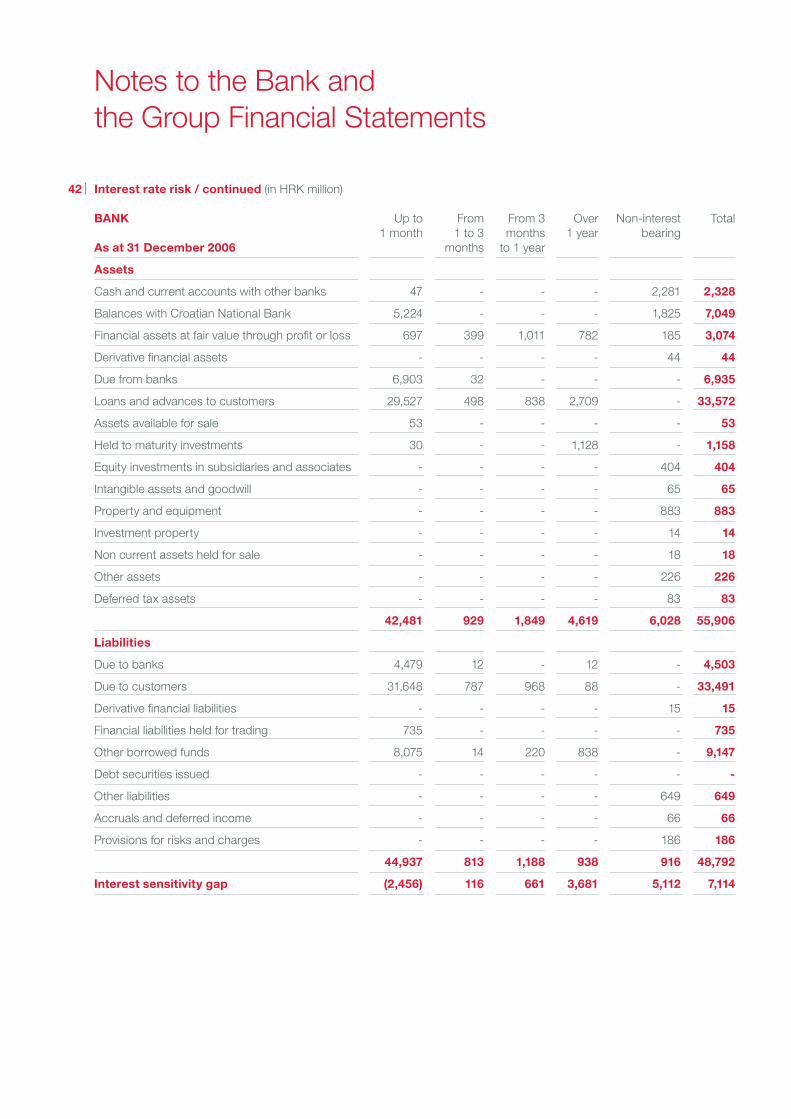
Notes to the Bank and the Group Financial Statements
42 Interest rate risk / continued (in HRK million)
BANK Up to From From 3 Over Non-interest Total 1 month 1 to 3 months 1 year bearing As at 31 December 2006 months to 1 year
Assets
Cash and current accounts with other banks 47 - - - 2,281 2,328
Balances with Croatian National Bank 5,224 - - - 1,825 7,049
Financial assets at fair value through profit or loss 697 399 1,011 782 185 3,074
Derivative financial assets - - - - 44 44
Due from banks 6,903 32 - - - 6,935
Loans and advances to customers 29,527 498 838 2,709 - 33,572
Assets available for sale 53 - - - - 53
Held to maturity investments 30 - - 1,128 - 1,158
Equity investments in subsidiaries and associates - - - - 404 404
Intangible assets and goodwill - - - - 65 65
Property and equipment - - - - 883 883
Investment property - - - - 14 14
Non current assets held for sale - - - - 18 18
Other assets - - - - 226 226
Deferred tax assets - - - - 83 83
42,481 929 1,849 4,619 6,028 55,906
Liabilities
Due to banks 4,479 12 - 12 - 4,503
Due to customers 31,648 787 968 88 - 33,491
Derivative financial liabilities - - - - 15 15
Financial liabilities held for trading 735 - - - - 735
Other borrowed funds 8,075 14 220 838 - 9,147
Debt securities issued - - - - - -
Other liabilities - - - - 649 649
Accruals and deferred income - - - - 66 66
Provisions for risks and charges - - - - 186 186
44,937 813 1,188 938 916 48,792
Interest sensitivity gap (2,456) 116 661 3,681 5,112 7,114

92 93
annualreport
2007
43 Weighted average interest rates
The weighted average interest rates at year end are disclosed as follows:
GROUP GROUP BANK BANK
Weighted average Weighted average Weighted average Weighted average interest rate interest rate interest rate interest rate
2007 (%) 2006 (%) 2007 (%) 2006 (%)
Cash reserves 0.87 0.84 0.86 0.78
Balances with the CNB 1.14 0.97 1.13 0.98
Securities held for trading 4.04 3.74 3.92 3.84
Due from banks 4.37 3.35 4.43 3.44
Loans and advances to customers 6.94 6.88 6.91 6.92
Public debt due from the Republic of Croatia 5.00 5.00 5.00 5.00
Replacement bonds 5.00 5.00 5.00 5.00
Due to customers 2.88 2.59 2.85 2.57
Other borrowed funds 4.22 3.03 4.30 3.03

44 Currency risk (in HRK million)
Notes to the Bank and the Group Financial Statements
The Group manages its exposure to currency risk through a variety of measures including the use of revaluation clauses, which have the same effect as denominating HRK assets in other currencies, and foreign currency deals bought and sold forward.
GROUP EUR CHF USD Other HRK TotalAs at 31 December 2007 currencies
Assets
Cash and current accounts with other banks 540 30 52 38 1,811 2,471
Balances with Croatian National Bank 2,911 - - - 5,283 8,194
Financial assets at fair value through profit or loss 1,288 - 73 25 2,784 4,170
Derivative financial assets - - - - 33 33
Due from banks 4,675 22 1,800 303 445 7,245
Loans and advances to customers 17,687 5,141 342 19 16,958 40,147
Assets available for sale 1,134 - 64 127 528 1,853
Held to maturity investments 1,260 - - - 28 1,288
Equity investments in subsidiaries and associates 2 - - - 47 49
Intangible assets and goodwill - - - - 171 171
Property and equipment - - - - 1,378 1,378
Investment property - - - - 15 15
Other assets 15 1 2 1 370 389
Deferred tax assets - - - - 147 147
29,512 5,194 2,333 513 29,998 67,550
Liabilities
Due to banks 419 16 27 27 2,640 3,129
Due to customers 24,520 351 1,989 299 14,759 41,918
Derivative financial liabilities - - - - 38 38
Other borrowed funds 8,249 23 221 11 3,256 11,760
Debt securities issued - - - - 66 66
Other liabilities 400 10 7 10 1,281 1,708
Accruals and deferred income 5 - - - 158 163
Provisions for risks and charges 10 - 10 2 243 265
33,603 400 2,254 349 22,441 59,047
Net on balance sheet position (4,091) 4,794 79 164 7,557 8,503

94 95
annualreport
2007
44 Currency risk / continued (in HRK million)
The Bank manages its exposure to currency risk through a variety of measures including the use of revaluation clauses, which have the same effect as denominating HRK assets in other currencies, and foreign currency deals bought and sold forward.
BANK EUR CHF USD Other HRK TotalAs at 31 December 2007 currencies
Assets
Cash and current accounts with other banks 430 27 51 34 1,814 2,356
Balances with Croatian National Bank 2,848 - - - 5,086 7,934
Financial assets at fair value through profit or loss 1,288 - 73 25 2,796 4,182
Derivative financial assets - - - - 33 33
Due from banks 4,137 20 1,789 299 481 6,726
Loans and advances to customers 15,181 5,090 342 10 15,813 36,436
Assets available for sale 19 - 64 127 272 482
Held to maturity investments 954 - - - 25 979
Equity investments in subsidiaries and associates - - - - 363 363
Intangible assets and goodwill - - - - 70 70
Property and equipment - - - - 847 847
Investment property - - - - 15 15
Other assets 13 1 1 - 196 211
Deferred tax assets - - - - 97 97
24,870 5,138 2,320 495 27,908 60,731
Liabilities
Due to banks 419 16 27 27 2,638 3,127
Due to customers 21,894 313 1,977 292 14,218 38,694
Derivative financial liabilities - - - - 38 38
Other borrowed funds 6,697 4 221 11 3,311 10,244
Other liabilities 53 10 13 2 382 460
Accruals and deferred income 5 - - - 74 79
Provisions for risks and charges 10 - 10 2 220 242
29,078 343 2,248 334 20,881 52,884
Net on balance sheet position (4,208) 4,795 72 161 7,027 7,847

Notes to the Bank and the Group Financial Statements
44 Currency risk / continued (in HRK million)
GROUP EUR CHF USD Other HRK TotalAs at 31 December 2006 currencies
Assets
Cash and current accounts with other banks 319 26 43 189 1,999 2,576
Balances with Croatian National Bank 3,638 - - - 3,624 7,262
Financial assets at fair value through profit or loss 1,403 - 87 30 1,536 3,056
Derivative financial assets 6 - - - 38 44
Due from banks 4,890 113 1,188 274 770 7,235
Loans and advances to customers 19,021 4,408 477 164 12,840 36,910
Assets available for sale 837 - 27 - 441 1,305
Held to maturity investments 1,331 - - - 27 1,358
Equity investments in subsidiaries and associates - - - 45 - 45
Intangible assets and goodwill - - - 4 196 200
Property and equipment - - - 14 1,367 1,381
Investment property - - - - 14 14
Non current assets held for sale - - - - 18 18
Other assets 42 3 8 21 375 449
Deferred tax assets - - - - 121 121
31,487 4,550 1,830 741 23,366 61,974
Liabilities
Due to banks 1,212 559 40 35 2,672 4,518
Due to customers 23,081 395 2,244 492 10,631 36,843
Derivative financial liabilities - - - - 15 15
Financial liabilities held for trading 735 - - - - 735
Other borrowed funds 7,586 28 338 20 1,984 9,956
Debt securities issued - - - - 119 119
Other liabilities 132 6 33 54 1,607 1,832
Accruals and deferred income 5 - - 2 113 120
Provisions for risks and charges 8 - 12 1 190 211
32,759 988 2,667 604 17,331 54,349
Net on balance sheet position (1,272) 3,562 (837) 137 6,035 7,625

96 97
annualreport
2007
44 Currency risk / continued (in HRK million)
BANK EUR CHF USD Other HRK TotalAs at 31 December 2006 currencies
Assets
Cash and current accounts with other banks 287 24 39 41 1,937 2,328
Balances with Croatian National Bank 3,574 - - - 3,475 7,049
Financial assets at fair value through profit or loss 1,403 - 87 30 1,554 3,074
Derivative financial assets 6 - - - 38 44
Due from banks 4,500 96 1,156 267 916 6,935
Loans and advances to customers 17,218 4,353 476 15 11,510 33,572
Assets available for sale - - 27 - 26 53
Held to maturity investments 1,133 - - - 25 1,158
Equity investments in subsidiaries and associates - - - 45 359 404
Intangible assets and goodwill - - - - 65 65
Property and equipment - - - - 883 883
Investment property - - - - 14 14
Non current assets held for sale - - - - 18 18
Other assets 41 3 8 3 171 226
Deferred tax assets - - - - 83 83
28,162 4,476 1,793 401 21,074 55,906
Liabilities
Due to banks 1,196 559 38 16 2,694 4,503
Due to customers 20,618 345 2,209 265 10,054 33,491
Derivative financial liabilities - - - - 15 15
Financial liabilities held for trading 735 - - - - 735
Other borrowed funds 6,712 5 338 17 2,075 9,147
Other liabilities 114 6 30 40 459 649
Accruals and deferred income - - - - 66 66
Provisions for risks and charges 8 - 12 - 166 186
29,383 915 2,627 338 15,529 48,792
Net on balance sheet position (1,221) 3,561 (834) 63 5,545 7,114
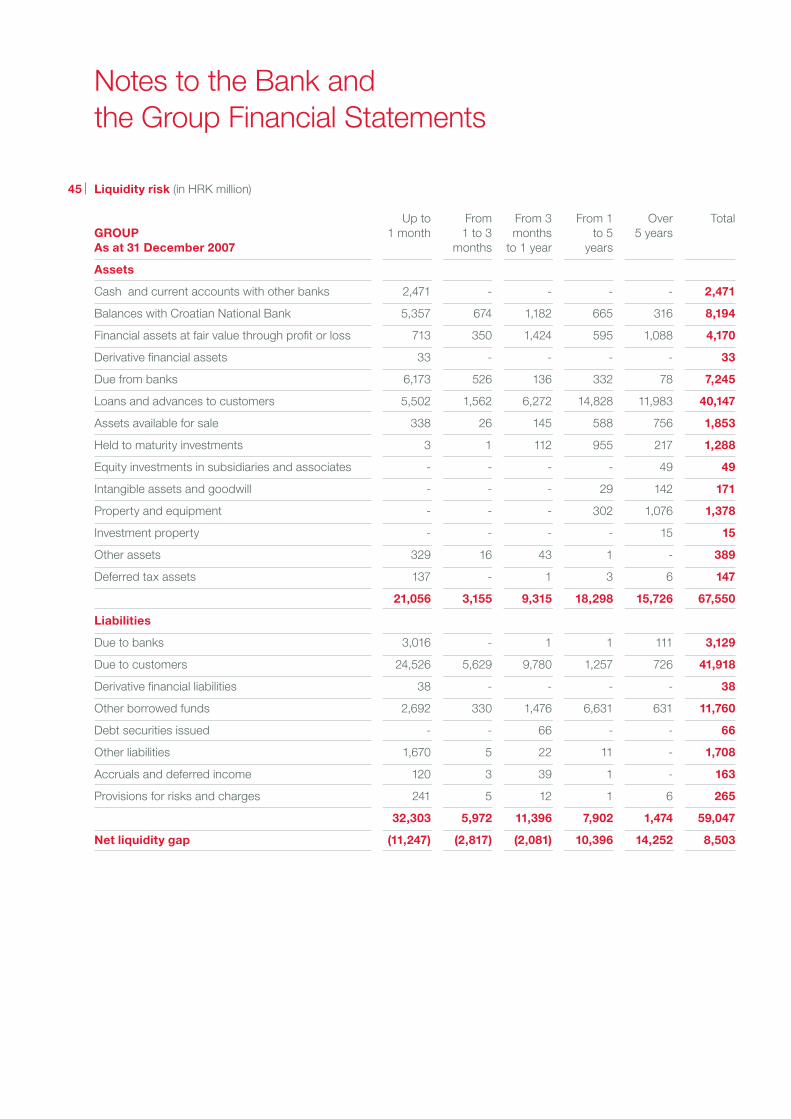
45 Liquidity risk (in HRK million)
Notes to the Bank and the Group Financial Statements
Up to From From 3 From 1 Over Total 1 month 1 to 3 months to 5 5 years months to 1 year yearsGROUPAs at 31 December 2007
Assets
Cash and current accounts with other banks 2,471 - - - - 2,471
Balances with Croatian National Bank 5,357 674 1,182 665 316 8,194
Financial assets at fair value through profit or loss 713 350 1,424 595 1,088 4,170
Derivative financial assets 33 - - - - 33
Due from banks 6,173 526 136 332 78 7,245
Loans and advances to customers 5,502 1,562 6,272 14,828 11,983 40,147
Assets available for sale 338 26 145 588 756 1,853
Held to maturity investments 3 1 112 955 217 1,288
Equity investments in subsidiaries and associates - - - - 49 49
Intangible assets and goodwill - - - 29 142 171
Property and equipment - - - 302 1,076 1,378
Investment property - - - - 15 15
Other assets 329 16 43 1 - 389
Deferred tax assets 137 - 1 3 6 147
21,056 3,155 9,315 18,298 15,726 67,550
Liabilities
Due to banks 3,016 - 1 1 111 3,129
Due to customers 24,526 5,629 9,780 1,257 726 41,918
Derivative financial liabilities 38 - - - - 38
Other borrowed funds 2,692 330 1,476 6,631 631 11,760
Debt securities issued - - 66 - - 66
Other liabilities 1,670 5 22 11 - 1,708
Accruals and deferred income 120 3 39 1 - 163
Provisions for risks and charges 241 5 12 1 6 265
32,303 5,972 11,396 7,902 1,474 59,047
Net liquidity gap (11,247) (2,817) (2,081) 10,396 14,252 8,503

98 99
annualreport
2007
45 Liquidity risk / continued (in HRK million)
Up to From From 3 From 1 Over Total 1 month 1 to 3 months to 5 5 years months to 1 year yearsBANKAs at 31 December 2007
Assets
Cash and current accounts with other banks 2,356 - - - - 2,356
Balances with Croatian National Bank 5,223 643 1,130 622 316 7,934
Financial assets at fair value through profit or loss 689 350 1,424 595 1,124 4,182
Derivative financial assets 33 - - - - 33
Due from banks 5,678 506 133 331 78 6,726
Loans and advances to customers 4,065 1,437 5,820 13,838 11,276 36,436
Assets available for sale 298 - - 79 105 482
Held to maturity investments - - - 953 26 979
Equity investments in subsidiaries and associates - - - - 363 363
Intangible assets and goodwill - - - - 70 70
Property and equipment - - - - 847 847
Investment property - - - - 15 15
Other assets 211 - - - - 211
Deferred tax assets 97 - - - - 97
18,650 2,936 8,507 16,418 14,220 60,731
Liabilities
Due to banks 3,014 - 1 1 111 3,127
Due to customers 23,734 5,359 8,815 104 682 38,694
Derivative financial liabilities 38 - - - - 38
Other borrowed funds 2,841 309 1,239 5,236 619 10,244
Other liabilities 460 - - - - 460
Accruals and deferred income 79 - - - - 79
Provisions for risks and charges 233 4 5 - - 242
30,399 5,672 10,060 5,341 1,412 52,884
Net liquidity gap (11,749) (2,736) (1,553) 11,077 12,808 7,847
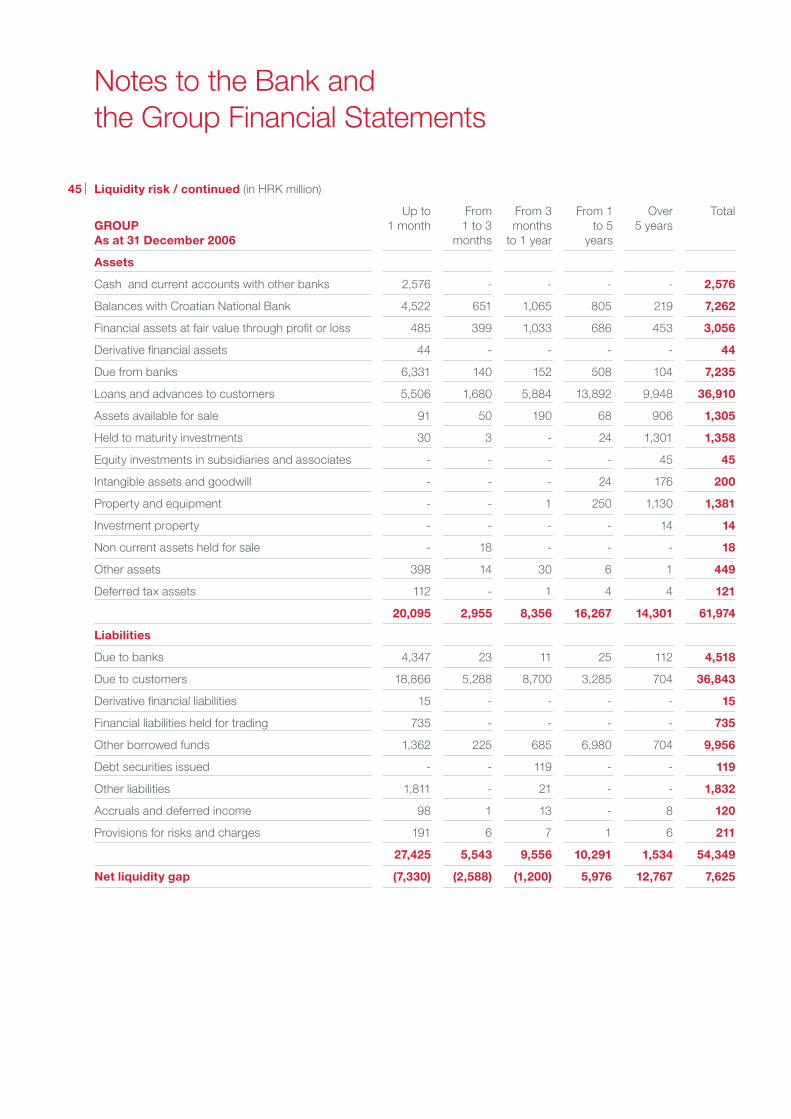
GROUPAs at 31 December 2006
Assets
Cash and current accounts with other banks 2,576 - - - - 2,576
Balances with Croatian National Bank 4,522 651 1,065 805 219 7,262
Financial assets at fair value through profit or loss 485 399 1,033 686 453 3,056
Derivative financial assets 44 - - - - 44
Due from banks 6,331 140 152 508 104 7,235
Loans and advances to customers 5,506 1,680 5,884 13,892 9,948 36,910
Assets available for sale 91 50 190 68 906 1,305
Held to maturity investments 30 3 - 24 1,301 1,358
Equity investments in subsidiaries and associates - - - - 45 45
Intangible assets and goodwill - - - 24 176 200
Property and equipment - - 1 250 1,130 1,381
Investment property - - - - 14 14
Non current assets held for sale - 18 - - - 18
Other assets 398 14 30 6 1 449
Deferred tax assets 112 - 1 4 4 121
20,095 2,955 8,356 16,267 14,301 61,974
Liabilities
Due to banks 4,347 23 11 25 112 4,518
Due to customers 18,866 5,288 8,700 3,285 704 36,843
Derivative financial liabilities 15 - - - - 15
Financial liabilities held for trading 735 - - - - 735
Other borrowed funds 1,362 225 685 6,980 704 9,956
Debt securities issued - - 119 - - 119
Other liabilities 1,811 - 21 - - 1,832
Accruals and deferred income 98 1 13 - 8 120
Provisions for risks and charges 191 6 7 1 6 211
27,425 5,543 9,556 10,291 1,534 54,349
Net liquidity gap (7,330) (2,588) (1,200) 5,976 12,767 7,625
Notes to the Bank and the Group Financial Statements
45 Liquidity risk / continued (in HRK million)
Up to From From 3 From 1 Over Total 1 month 1 to 3 months to 5 5 years months to 1 year years

100 101
annualreport
2007
BANKAs at 31 December 2006
Assets
Cash and current accounts with other banks 2,328 - - - - 2,328
Balances with Croatian National Bank 4,417 626 1,018 769 219 7,049
Financial assets at fair value through profit or loss 504 399 1,032 686 453 3,074
Derivative financial assets 44 - - - - 44
Due from banks 6,053 126 145 507 104 6,935
Loans and advances to customers 4,353 1,611 5,382 12,980 9,246 33,572
Assets available for sale 53 - - - - 53
Held to maturity investments 30 - - 24 1,104 1,158
Equity investments in subsidiaries and associates - - - - 404 404
Intangible assets and goodwill - - - - 65 65
Property and equipment - - - - 883 883
Investment property - - - - 14 14
Non current assets held for sale - 18 - - - 18
Other assets 226 - - - - 226
Deferred tax assets 83 - - - - 83
18,091 2,780 7,577 14,966 12,492 55,906
Liabilities
Due to banks 4,368 21 2 1 111 4,503
Due to customers 17,768 5,017 8,108 1,928 670 33,491
Derivative financial liabilities 15 - - - - 15
Financial liabilities held for trading 735 - - - - 735
Other borrowed funds 1,723 210 553 6,004 657 9,147
Debt securities issued - - - - - -
Other liabilities 649 - - - - 649
Accruals and deferred income 66 - - - - 66
Provisions for risks and charges 183 1 2 - - 186
25,507 5,249 8,665 7,933 1,438 48,792
Net liquidity gap (7,416) (2,469) (1,088) 7,033 11,054 7,114
45 Liquidity risk / continued (in HRK million)
Up to From From 3 From 1 Over Total 1 month 1 to 3 months to 5 5 years months to 1 year years

46 Concentration of assets and liabilities (in HRK million)
GROUP BANK
Assets Liabilities Off balance Assets Liabilities Off balance sheet items sheet items
As at 31 December 2007
Geographic region
Republic of Croatia 58,719 46,752 14,371 53,203 42,296 14,069
European Union 7,835 10,420 98 6,641 8,725 98
Other countries 996 1,875 75 887 1,863 68
67,550 59,047 14,544 60,731 52,884 14,235
Industry sector
Citizens 23,932 29,359 6,609 21,555 26,658 6,505
Finance 15,227 8,234 19 14,660 6,941 10
Government 6,860 1,757 984 5,171 1,729 959
Commerce 3,276 1,194 1,223 2,768 1,124 1,180
Tourism 1,107 233 27 1,044 225 27
Agriculture 694 64 53 625 61 51
Other sectors 16,454 18,206 5,629 14,908 16,146 5,503
67,550 59,047 14,544 60,731 52,884 14,235
As at 31 December 2006
Geographic region
Republic of Croatia 55,418 41,988 12,988 49,719 36,475 12,623
European Union 5,479 10,642 4 5,151 10,604 4
Other countries 1,077 1,719 125 1,036 1,713 125
61,974 54,349 13,117 55,906 48,792 12,752
Industry sector
Citizens 18,589 26,369 6,573 17,640 24,134 6,501
Finance 15,890 5,722 93 13,984 4,373 13
Government 7,726 1,178 711 6,697 1,108 711
Commerce 3,063 1,015 825 2,873 956 782
Tourism 860 189 40 857 189 40
Agriculture 705 41 72 680 38 49
Other sectors 15,141 19,835 4,803 13,175 17,994 4,656
61,974 54,349 13,117 55,906 48,792 12,752
Notes to the Bank and the Group Financial Statements
47 Earnings per share
For the purpose of calculating earnings per share, earnings represent net profit after tax. The number of ordinary shares is the weighted average number of ordinary shares outstanding during the year after deducting the number of ordinary treasury shares. The weighted average number of ordinary shares used for basic earnings per share was 19,030,381 (2006: 16,913,334).

102 103
annualreport
2007
Supplementary financial statements in EUR (unaudited)
Income statement items were translated from measurement currency (HRK) to euro at the average exchange rates in 2007 (1 EUR = 7.336019 HRK) and in 2006 (1 EUR = 7.322849 HRK).
GROUP BANK
2007 2006 2007 2006
Interest income 494 406 446 371
Interest expense (233) (172) (215) (161)
Net interest income 261 234 231 210
Fee and commission income 177 147 80 67
Fee and commission expense (32) (30) (29) (27)
Net fee and commission income 145 117 51 40
Other operating income 58 64 55 60
Operating income 464 415 337 310
Provisions (16) (21) (7) (8)
Other operating expenses (215) (194) (152) (138)
Depreciation and amortisation of property and equipment and intangible assets (37) (35) (22) (22)
Share of the profit and loss accounted for using the equity method 1 1 - -
Profit before income taxes 197 166 156 142
Income taxes (41) (34) (29) (26)
Net profit for the year 156 132 127 116
Attributable to:
Equity holders of the parent 156 132 127 116
Minority interests - - - -
156 132 127 116
Income statement (in EUR million)

Balance sheet (in EUR million)
Balance sheet items were translated from measurement currency (HRK) to euro at the closing exchange rates in 2007 (1 EUR = 7.325131 HRK) and in 2006 (1 EUR = 7.345081 HRK).
GROUP BANK
2007 2006 2007 2006
Assets
Cash and current accounts with other banks 337 351 322 317
Balances with Croatian National Bank 1,119 989 1,083 960
Financial assets at fair value through profit or loss 569 416 571 419
Derivative financial assets 5 6 5 6
Due from banks 989 985 918 944
Loans and advances to customers 5,481 5,025 4,974 4,571
Assets available for sale 253 178 66 7
Held to maturity investments 176 185 134 158
Equity investments in subsidiaries and associates 7 6 50 48
Intangible assets and goodwill 23 27 10 16
Property and equipment 188 188 116 120
Investment property 2 2 2 2
Non-current assets held for sale - 2 - 2
Other assets 53 61 29 31
Deferred tax assets 20 16 13 11
Total assets 9,222 8,437 8,293 7,612
Supplementary financial statements in EUR (unaudited)

104 105
annualreport
2007
Balance sheet / continued (in EUR million)
Balance sheet items were translated from measurement currency (HRK) to euro at the closing exchange rates in 2007 (1 EUR = 7.325131 HRK) and in 2006 (1 EUR = 7.345081 HRK).
GROUP BANK
2007 2006 2007 2006
Liabilities
Due to banks 427 615 427 613
Due to customers 5,722 5,017 5,282 4,561
Derivative financial liabilities 5 2 5 2
Financial liabilities held for trading - 100 - 100
Other borrowed funds 1,605 1,355 1,398 1,245
Debt securities issued 9 16 - -
Other liabilities 233 249 63 88
Accruals and deferred income 22 16 11 9
Provisions for risks and charges 36 29 33 25
Total liabilities 8,059 7,399 7,219 6,643
Equity attributable to equity holders of the parent
Share capital 250 250 250 250
Treasury shares (8) (4) (8) (4)
Share premium 214 214 214 214
Reserves and retained earnings 548 440 491 393
Profit and loss attributable to equity holders of the parent entity 156 132 127 116
1,160 1,032 1,074 969
Minority interests 3 6 - -
Total shareholders’ equity 1,163 1,038 1,074 969
Total liabilities and shareholder’s equity 9,222 8,437 8,293 7,612

Publisher Privredna banka Zagreb d.d. • Design & Production Euro RSCG Zagreb, a member of Unex GroupPhotography Igor Michieli • Printing Intergrafika • Edition 800

Annual Report 2007 in pdf version is available for download on www.pbz.hr