Embed Size (px)
Citation preview

®
®
2004 Annual ReportTexas Roadhouse, Inc.
T e x a s R o a d h o u s e , I n c.6040 Dutchmans Lane Louisville, Kentucky 40205(800) TEX-ROADwww.texasroadhouse.com
te
xa
s r
oa
dh
ou
se
, Inc
. • 20
04
an
nu
al
re
po
rt

support center(corporate office)6040 Dutchmans Lane
Louisville, KY 40205
(800) 839-7623
www.texasroadhouse.com
stock listingTexas Roadhouse, Inc. Common
Stock is listed on the NASDAQ
Stock Exchange under the
symbol TXRH.
additional informationFor additional financial
documents and information,
please visit our web site at
www.texasroadhouse.com
or contact us by phone at
(502) 515-7300 or e-mail at
For media inquiries, please call
(502) 515-7235.
Independent AuditorsKPMG LLP
400 W. Market Street, Suite 2600
Louisville, KY 40202
Phone (502) 587-0535
transfer agentNational City Bank
629 Euclid Avenue, Suite 635
Cleveland, OH 44114
Phone (800) 622-6757
ANNUAL MEETING Thursday, May 26, 2005
9:00 AM EDT
Seelbach Hilton Hotel
Mezzanine Ballroom
500 S. 4th Street
Louisville, KY 40202
BOARD OF DIRECTORSGJ Hart
President & Chief Executive Officer,
Texas Roadhouse, Inc.
Martin T. Hart
Private Investor
Gregory N. Moore
Senior Vice President & Controller,
Yum! Brands, Inc.
James F. Parker
Former Chief Executive Officer
& Vice-Chairman of the Board
Southwest Airlines Co.
James R. Ramsey
President, University of Louisville
W. Kent Taylor
Chairman of the Company & Board,
Texas Roadhouse, Inc.
James R. Zarley
President, Chief Executive Officer
& Chairman of the Board
ValueClick, Inc.
st o c k h o l d e r I n f o r m at i o n
L EGENDARY F OOD,L EGENDARY S ERVICE
A short statement with a powerful punch.
Yes, that’s the Texas Roadhouse mission.
While it’s easy to remember,
it’s a bit tougher to execute.
We take our responsibility
of providing “legendary” very seriously,
and we are very proud to claim
a commitment to excellence –
in our product, our people
and our guest experience.


S e l e c t e d f i n a n c i a l d a t a
S e l e c t e d o p e r a t i n g d a t a
(1) Average unit volume represents the average annual restaurant sales for all company restaurants open for a full six months before the beginning of the period measured. (2) Comparable restaurant sales growth reflects the change in year-over-year sales for the comparable restaurant base. We define the comparable restaurant base to include those restaurants open for a full eighteen months
before the beginning of the later fiscal period. (3) System-wide restaurants include company and franchise locations. NM - Not meaningful
Support CenterLouisville, Kentucky
location mapas of December 28, 2004
$ in thousands 2004 2003 % Change
Revenue:
Restaurant sales $354,190 $279,519 27%
Franchise royalties and fees 8,821 6,934 27%
Total Revenue $363,011 $286,453 27%
Income from operations $38,682 $34,258 13%
Total assets $276,663 $148,193
Long-term debt, including current portion $13,285 $64,313
Total stockholders’ equity $173,211 $37,902
$ in thousands 2004 2003 % Change
Company Restaurants:
Number open at end of period 107 87 23%
Average unit volumes (1) $3,679 $3,401 8%
Comparable restaurant sales growth (2) 7.6% 3.4% NM
System-wide restaurants open at end of period (3) 193 162 19%
M a p o f r e s t a u r a n t l o c a t i o n s
2 • 2 0 0 4 a n n ua l re p o rt

By any measure, 2004 was an exciting year
for Texas Roadhouse, one in which we
achieved yet another milestone.
We completed our initial public offering in
October. We see the IPO as just another beginning
– a chance to prove ourselves to new partners
who have entrusted us with their support, not to
mention their investment. To that end, we are
committed to sustained and profitable growth.
We have a proven and compelling restaurant
concept and a team committed to putting our
employees first, so they in turn create a legendary
experience for our guests.
ACHIEVING FINANCIAL PERFORMANCEIn 2004, we grew total revenue to $363.0
million, 27% above the prior year, while our
comparable sales increased
7.6%. We have now reported
positive comparable sales
for five consecutive years,
with the majority of that
gain attributable to higher
guest counts. Income from
operations increased 13% from
$34.3 million to $38.7 million.
As a result of our IPO, our
balance sheet has never been
stronger or more flexible.
SERVING QUALITY MEALS AT AN AFFORDABLE PRICEA key factor in our Texas
Roadhouse story is our appeal
to a broad demographic base.
We attract guests hungry for
a fresh, quality meal found at higher-end, more
upscale establishments, as well as those guests
looking for heapin’ helpings at a great value
typically found at lower-priced family restaurants.
We realize the importance of this broad appeal and
are committed to maintaining our quality food with
value-based prices.
KEEPING TRUE TO OUR BRAND AS WE GROWWhile 2004 is one that we’ll remember for some
very clear successes, it was also one of some great
challenges. With growth comes new demands,
especially when our goal is to stay focused,
consistent and true to our culture.
Focus To stay focused on the execution of
our mission statement of
“Legendary Food, Legendary
Service,” we developed
several operational goals.
These goals were derived by
sharing best practices from
our top operators, giving us a
synergistic approach.
CONSISTENCY With our
fast-paced growth comes the
importance of consistency
in our daily operations. In
2oo4, we added several new
Product Coaches to help us
achieve this goal. These “food
experts” travel to restaurants
in their region and assess
the level of execution in the
kitchen and work with the
t exas roa d h ou s e , i n c . • 3
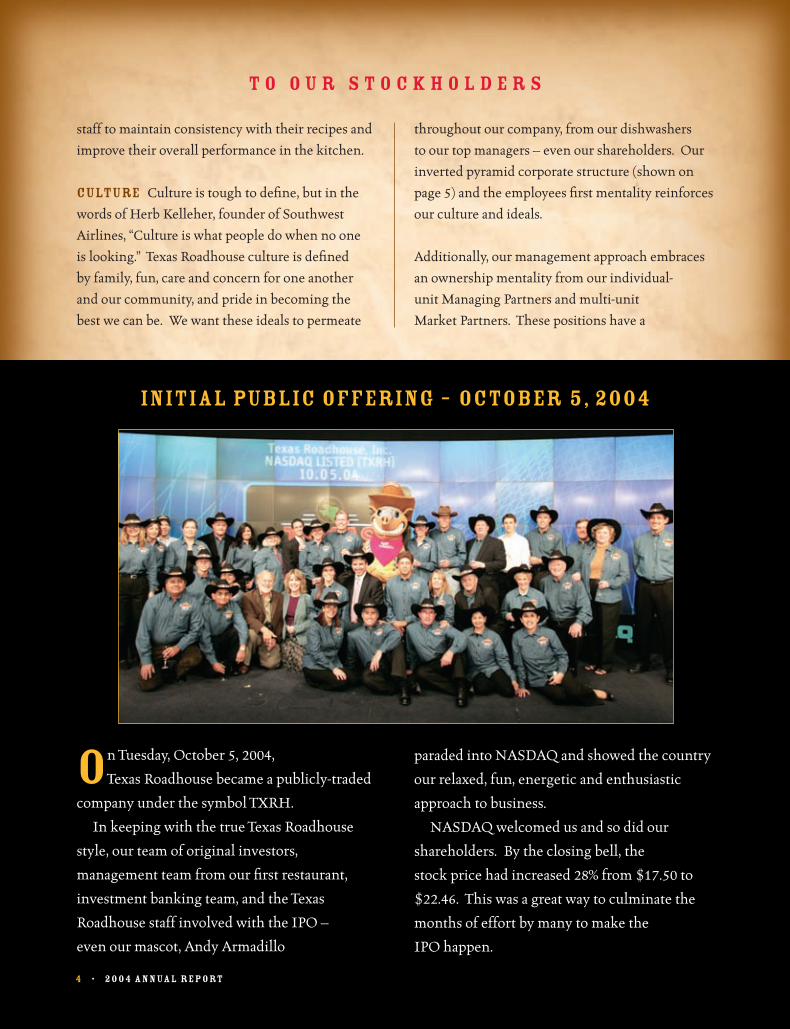
On Tuesday, October 5, 2004,
Texas Roadhouse became a publicly-traded
company under the symbol TXRH.
In keeping with the true Texas Roadhouse
style, our team of original investors,
management team from our first restaurant,
investment banking team, and the Texas
Roadhouse staff involved with the IPO –
even our mascot, Andy Armadillo
paraded into NASDAQ and showed the country
our relaxed, fun, energetic and enthusiastic
approach to business.
NASDAQ welcomed us and so did our
shareholders. By the closing bell, the
stock price had increased 28% from $17.50 to
$22.46. This was a great way to culminate the
months of effort by many to make the
IPO happen.
staff to maintain consistency with their recipes and
improve their overall performance in the kitchen.
CULTURE Culture is tough to define, but in the
words of Herb Kelleher, founder of Southwest
Airlines, “Culture is what people do when no one
is looking.” Texas Roadhouse culture is defined
by family, fun, care and concern for one another
and our community, and pride in becoming the
best we can be. We want these ideals to permeate
throughout our company, from our dishwashers
to our top managers – even our shareholders. Our
inverted pyramid corporate structure (shown on
page 5) and the employees first mentality reinforces
our culture and ideals.
Additionally, our management approach embraces
an ownership mentality from our individual-
unit Managing Partners and multi-unit
Market Partners. These positions have a
T O O U R S t o c k h o l d e r s
4 • 2 0 0 4 a n n ua l re p o rt
initial public offering – october 5, 2004

4 • 2 0 0 4 a n n ua l re p o rt
compensation
structure in which
they earn a base salary
plus a percentage of the
income of the restaurant(s)
they operate or supervise. Our
approach keeps our management
turnover low and gives operators
a sense of entrepreneurialism and
autonomy to make decisions, while always
staying true to our brand.
STAYING IN TOUCH WITH OUR EMPLOYEESWe periodically
travel across the
country visiting
with our restaurant managers
and employees to stay in touch with our culture
and our people. It is an opportunity for open
dialogue with our folks to ensure that Texas
Roadhouse will remain true to the original vision
and concept it was founded upon. In our corporate
office, which we call our Support Center, we
empowered our employees through creating the
20/20 Focus Group. It’s a team of non-management
employees from each department who represent
ideas and feedback from their colleagues to our
senior leadership.
GROWING TO NEW TOWNS ACROSS AMERICAIn 2004, we and our franchisees opened 31
restaurants, ending the year with a total of 193
locations. We plan to open 26 restaurants in 2005,
of which six will be franchised. Our focus remains
primarily on mid-sized markets, where
population size,
income levels and
nearby shopping
have proven to be fertile
ground for our expanded
growth. Over time, we are
confident that we can grow to
800+ restaurants across the country.
As we work to achieve this goal, we
are committed to making every Texas
Roadhouse guest experience as memorable
as the food we serve.
We would like to
thank you for
your interest
in, and support
of, the Texas
Roadhouse
family. We think you will find our team, from the
management to the restaurant operators, excited
about our future and eager to contribute to our
success. Together, we know we can reach
new milestones.
T O O U R S t o c k h o l d e r s
Sincerely,
GJ Hart President, Chief Executive OfficerApril 2005
W. Kent TaylorChairman of the Company and BoardApril 2005
t exas roa d h ou s e , i n c . • 5
our inverted pyramid corporate structuregives the highest importance to ourguests, employees and stockholders

our hearty steaks are hand-cut at each texas roadhouse,then seasoned and grilled to perfection

Meat Cutter Challenge
Because we pride ourselves on quality, hand-cut
steaks, we recognize the efforts of those who
put us a “cut” above the rest. Our outstanding meat
cutters are continuously rewarded with our Meat
Hero program and our annual Meat Cutter Challenge.
Last year, we held our first national finals and the
top four cutters competed at our annual conference
in Cabo San Lucas, Mexico. Our 2004 winner, Jose
Garcia of Houston, Texas, walked away with some
great prizes and bragging rights he will forever claim!
What does it truly mean to be legendary? According to Webster’s Dictionary, legendary means “well-known or famous.”
That’s how we want to be known when it comes to our hand-cut steaks, fall-off-the-bone ribs and made-from-scratch sides,
not to mention our wide variety of chicken, fish and pork dishes.
VICE PRESIDENT OF FOOD JIM BROYLES ANDFOUNDER & CHAIRMAN KENT TAYLOR CONGRATULATE
THE 2004 MEAT CUTTER OF THE YEAR, JOSE GARCIA
First, we’re known for our hearty steaks,
hand-cut at each and every Texas
Roadhouse. We begin the process with
USDA, grain-fed, aged beef. Then, our in-
house butchers cut the finest steaks you’ll
find anywhere. And so that you can see their
artistry and handiwork first hand, our fresh-
cuts are proudly displayed in their own special
case when you walk through our doors.
Our steaks range from 6 ounces for
lighter appetites to 18 ounces for our
really hungry guests. In some of our
restaurants, you can even “pick your own”
special steak selection. Our steaks are then
seasoned just right and grilled over an open
flame. Ask anyone who has tried our Texas
Roadhouse steaks, and we’re sure you’ll get
a mouth-watering response.
H E A R T Y S t e a k s , H A N D - C U T D A I LY
t exas roa d h ou s e , i n c . • 7
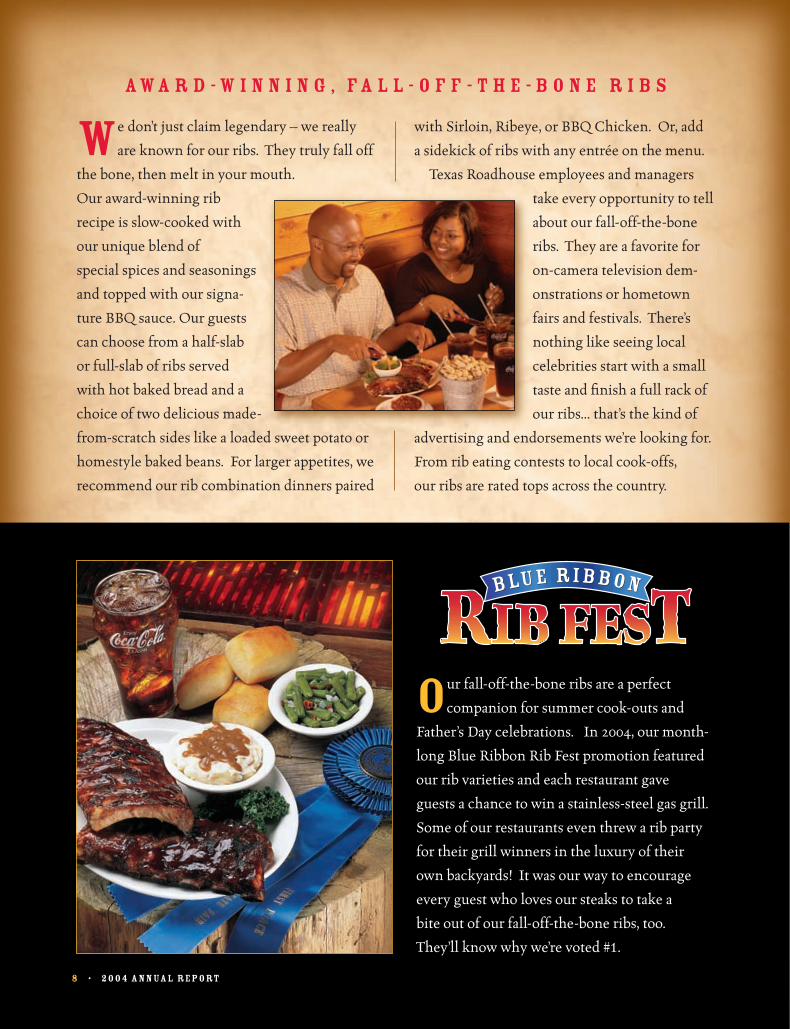
Our fall-off-the-bone ribs are a perfect
companion for summer cook-outs and
Father’s Day celebrations. In 2004, our month-
long Blue Ribbon Rib Fest promotion featured
our rib varieties and each restaurant gave
guests a chance to win a stainless-steel gas grill.
Some of our restaurants even threw a rib party
for their grill winners in the luxury of their
own backyards! It was our way to encourage
every guest who loves our steaks to take a
bite out of our fall-off-the-bone ribs, too.
They’ll know why we’re voted #1.
We don’t just claim legendary – we really
are known for our ribs. They truly fall off
the bone, then melt in your mouth.
Our award-winning rib
recipe is slow-cooked with
our unique blend of
special spices and seasonings
and topped with our signa-
ture BBQ sauce. Our guests
can choose from a half-slab
or full-slab of ribs served
with hot baked bread and a
choice of two delicious made-
from-scratch sides like a loaded sweet potato or
homestyle baked beans. For larger appetites, we
recommend our rib combination dinners paired
with Sirloin, Ribeye, or BBQ Chicken. Or, add
a sidekick of ribs with any entrée on the menu.
Texas Roadhouse employees and managers
take every opportunity to tell
about our fall-off-the-bone
ribs. They are a favorite for
on-camera television dem-
onstrations or hometown
fairs and festivals. There’s
nothing like seeing local
celebrities start with a small
taste and finish a full rack of
our ribs... that’s the kind of
advertising and endorsements we’re looking for.
From rib eating contests to local cook-offs,
our ribs are rated tops across the country.
aw a r d - w i n n i n g , f a l l - o f f - t h e - b o n e r i b s
8 • 2 0 0 4 a n n ua l re p o rt

Fresh is key to creating Legendary
Food. The moment you walk into Texas
Roadhouse, you’ll see our in-house bakers in
the window preparing hot, fresh bread along
with our seasoned croutons and butter-coated
burger buns. As our hosts seat you, follow the
aroma of the piping hot bread they’re taking to
your table, served up
with our sweet honey
cinnamon butter.
Our menu showcases
great diversity from
hearty meals to leaner
selections. We have
steak for our beef eaters,
ribs for our pork lovers,
or mouth-watering
chicken dishes grilled or topped with our
delicious portobello mushroom sauce,
jack cheese, sautéed mushrooms and onions,
or other fresh toppings.
For fish lovers, we offer “Dockside Favorites”
like our Grilled Salmon or Fried Catfish... each
dish moist and tender and cooked to perfection.
Whatever entrée you
order, each is served
with your choice of two
delicious made-from-
scratch sides like our
tasty seasoned green
beans, home-style
mashed potatoes or a
crisp Caesar Salad
with fresh croutons.
C H I C K E N , F I S H & F R E S H - B A K E D B R E A D
t exas roa d h ou s e , i n c . • 9
Prices and menu offerings may vary by location.

alley rallies are HELD TO DISCUSS THE GAME PLAN FOR THE SHIFT AND
ENERGIZE THE STAFF TO DELIVER LEGENDARY FOOD AND LEGENDARY SERVICE TO THEIR GUESTS

Texas Roadhouse prides itself on creating
an experience to remember for every guest
who dines in our restaurant. Quality food may
be the primary reason that people choose a
particular establishment, but the guest loyalty
that Texas Roadhouse enjoys comes from
something more... Legendary Service.
From the time our guests walk through our
doors until the moment
they head out, we want
them to feel special and
know their importance
to us. To achieve this,
our servers handle a
smaller number of tables
in order to spend time
interacting with their
guests. We believe
this special touch
builds guest loyalty
and helps us become a
hometown favorite in
the communities we serve.
We also treat our employees with this same
level of care and concern. We place importance
on creating a fun and energetic work
environment that treats our staff like family.
We keep this family spirit alive with monthly
fun budgets and contests with great incentives
and recognition for managers, hosts, servers,
and even those hard at work in the kitchen.
Texas Roadhouse family members also help
out one another in times of need through our
not-for-profit foundation, Andy’s Outreach.
Employees and vendor partners contribute
money to help members of the Texas Roadhouse
family dealing with a natural disaster or
overwhelming medical bills. Andy’s has granted
aid to hundreds of our
employees and those of
our franchisees.
For our restaurant
management teams,
we have a unique
compensation program
which inspires them to
have an entrepreneurial
spirit in their
restaurants. This
sense of ownership
ultimately reduces our
turnover rates.
For our Managing Partners, we spotlight
our top performers with our annual Managing
Partner Conference. Our 2004 event, held in
Cabo San Lucas, Mexico, recognized operators
and vendor partners for their excellence over
the past year. We even showed our care and
concern to the Cabo San Lucas communities by
working on several humanitarian projects.
t exas roa d h ou s e , i n c . • 1 1
“If you make your employees happy and feel good, then they’re going to make your guests happy and feel good too.”
– Kent Taylor, Chairman of the Company & Board
DUKE ELLIOTT FROM ASHLAND, KENTUCKY IS NAMED the MANAGING PARTNER OF THE YEAR at our
2004 conference FOR HIS OPERATIONS EXCELLENCE

Willie nelson always makes it a pointto spend time with the staff at every texas roadhouse he visits
MANAGING PARTNER JOHN JORDAN, WILLIE NELSON, MARKET PARTNER PAUL MARSHALL, AND Chief executive officer GJ HART CUT THE RIBBON TO OFFICIALLY OPEN OUR NEW AUSTIN, TEXAS LOCATION IN DECEMBER 2004

As we build and strengthen initiatives
that help us deliver Legendary Food and
Legendary Service to our guests, we invite
legendary champions from various fields to
share their words of wisdom with our group.
At our 2004 Managing Partner Conference
in Cabo San Lucas, Mexico, our theme was
HOOPS... Heightening Our Operational
Performance Skills.
The idea was
developed to promote
our operational
goals, but it also
led to a basketball
tournament and
motivational
messages from
six championship
coaches, including
the basketball coach
with the most wins
in history, John
Wooden. Their
words of wisdom for business growth and
personal guidance have been very beneficial
to our operators.
In 2004, we brought another Legend into
our family, Willie Nelson. Willie got to know
our business and our people as he visited
restaurants across the country in conjunction
with his concert tour. To make him feel right
at home, Texas Roadhouse has a Willie’s Corner
in every restaurant. It’s a booth that showcases
Willie’s life and career with memorabilia of
all kinds. Texas Roadhouse has also organized
numerous events in which our guests and
employees meet Willie and sit with him in his
special booth. Some restaurants have been
really creative with
Willie’s historic
career by hosting
events ranging from
Willie Wednesdays
to Willie-Oke
contests.
In December
2004, we opened
our Austin, Texas
restaurant in
which Willie is a
part owner. His
excitement and
enthusiasm in
his restaurant gives Texas Roadhouse great
pride, and from platinum records on the
wall to murals that showcase him and his
fellow musical celebrities, Willie’s presence is
definitely apparent. Willie joined in hosting a
grand opening event, which overflowed with
fans, fellow entertainers, and media.
t exas roa d h ou s e , i n c . • 1 3
President & Chief Executive Officer GJ Hart interviews legendary basketball coach John Wooden
at the 2004 Managing partner conference
“Legendary people have shared great wisdom and insight to help usdeliver Legendary Food and Legendary Service in our restaurants.”
– GJ Hart, President, Chief Executive Officer


UNITED STATES SECURITIES AND EXCHANGE COMMISSION
Washington, D.C. 20549
FORM 10-K (Mark One)
ANNUAL REPORT PURSUANT TO SECTION 13 OR 15(D) OF THE SECURITIES EXCHANGE ACT OF 1934
For the fiscal year ended December 28, 2004
OR
TRANSITION REPORT PURSUANT TO SECTION 13 OR 15(D) OF THE SECURITIES EXCHANGE ACT OF 1934
For the transition period from to
Texas Roadhouse, Inc.
(Exact name of registrant specified in its charter) Delaware
(State or other jurisdiction of incorporation or organization)
000-50972 (Commission File Number)
20-1083890 (IRS Employer Identification Number)
6040 Dutchmans Lane, Suite 400
Louisville, Kentucky 40205 (Address of principal executive offices) (Zip Code)
(502) 426-9984
(Registrant's telephone number, including area code)
Securities registered pursuant to Section 12(b) of the Act:
None
Securities registered pursuant to Section 12(g) of the Act:
Class A Common Stock, par value $0.001 per share Indicate by check mark whether registrant (1) has filed all reports required to be filed by Section 13 or 15(d) of the Securities Exchange Act of 1934 during the preceding 12 months (or for such shorter period that the registrant was required to file such reports), and (2) has been subject to such filing requirements for the past 90 days. Yes No . Indicate by check mark if disclosure of delinquent filers pursuant to Item 405 of Regulation S-K is not contained herein, and will not be contained, to the best of registrant's knowledge, in definitive proxy or information statements incorporated by reference in Part III of this Form 10-K or any amendment to the Form 10-K. . Indicate by check mark whether the registrant is an accelerated filer (as defined in Rule 12b-2 of the Exchange Act). Yes No . The aggregate market value of the voting stock held by non-affiliates of the registrant as of March 18, 2005 was $605,808,713. Our common stock began trading on the Nasdaq National Market on October 5, 2004. Shares of voting stock held by each officer and director and by each person who owns 5% or more of the outstanding common stock have been excluded in that such persons may be deemed to be affiliates. This determination of affiliate status is not necessarily a conclusive determination for other purposes. The registrant has no shares of non-voting common stock authorized or outstanding. The market value calculation was determined using the closing stock price of our Class A common stock on the Nasdaq National Market. The number of shares of Class A and Class B common stock outstanding were 31,116,643 and 2,632,688, respectively, on March 18, 2005. Portions of the registrant's definitive Proxy Statement for the registrant's 2005 Annual Meeting of Stockholders, which is expected to be filed pursuant to Regulation 14A within 120 days of the registrant's fiscal year ended December 28, 2004, are incorporated by reference into Part III of the Form 10-K. With the exception of the portions of the Proxy Statement expressly incorporated by reference, such document shall not be deemed filed with this Form 10-K.
TABLE OF CONTENTS
Page
PART I Item 1. Business 3Item 2. Properties 13Item 3. Legal Proceedings 15
Item 4. Submission of Matters to a Vote of Security Holders 15 PART II
Item 5. Market for Registrant's Common Equity, Related Shareholder Matters and Issuer Purchases of Equity Securities
16
Item 6. Selected Financial Data 18Item 7. Management's Discussion and Analysis of Financial Condition and Results of Operation 21Item 7A. Quantitative and Qualitative Disclosures About Market Risk 35Item 8. Financial Statements and Supplementary Data 35Item 9. Changes in and Disagreements with Accountants on Accounting and Financial Disclosure 35Item 9A. Controls and Procedures 36Item 9B. Other Information 36 PART III
Item 10. Directors and Executive Officers of the Registrant 37Item 11. Executive Compensation 37Item 12. Security Ownership of Certain Beneficial Owners and Management and Related Shareholder Matters 37Item 13. Certain Relationships and Related Transactions 37Item 14. Principal Accounting Fees and Services 37 PART IV
Item 15. Exhibits and Financial Statements Schedules 38
Signatures
41
2
PART I ITEM 1—BUSINESS Texas Roadhouse, Inc. ("Texas Roadhouse" or the "Company") was incorporated under the laws of the state of Delaware in 2004. From April 1, 1997 through October 8, 2004, the business of the Company was conducted by Texas Roadhouse Holdings LLC ("Holdings") and its affiliates. On October 8, 2004, Holdings and its wholly-owned and majority-owned affiliates completed a reorganization and initial public offering. In connection with the reorganization and public offering, Holdings became a subsidiary of the Company. The principal executive office is located in Louisville, Kentucky. General Development of Business Texas Roadhouse, Inc. is a growing, moderately priced, full-service restaurant chain. Our founder and chairman, W. Kent Taylor, started the business in 1993. Our mission statement is "Legendary Food, Legendary Service." Our operating strategy is designed to position each of our restaurants as the local hometown destination for a broad segment of consumers seeking high quality, affordable meals served with friendly, attentive service. As of December 28, 2004, 193 Texas Roadhouse restaurants were operating in 35 states. We owned and operated 107 restaurants in 27 states, and franchised and licensed an additional 86 restaurants in 20 states. We have successfully grown the total number of Texas Roadhouse company and franchise restaurants over the past five years from 67 restaurants as of the end of 1999 to 193 restaurants as of the end of 2004, representing a 23.6% compounded annual growth rate. Over the same period, our revenue increased from $71.0 million to $363.0 million, our income from operations increased from $6.7 million to $38.7 million, and our net income increased from $4.0 million to $21.7 million, representing compounded annual growth rates of 38.6%, 42.0% and 40.2%, respectively. Financial Information about Operating Segments As of December 28, 2004, we operated 107 Texas Roadhouse restaurants, each as a single operating segment, and franchised and licensed an additional 86 restaurants. The restaurants operate exclusively in the U.S. within the casual dining industry, providing similar products to similar customers. The restaurants also possess similar pricing structures, resulting in similar long-term expected financial performance characteristics. We consider our restaurant and franchising operations as similar and have aggregated them into a single reportable segment. Narrative Description of Business Texas Roadhouse is a full-service, casual dining restaurant chain. We offer an assortment of specially seasoned and aged steaks hand-cut daily on the premises and cooked to order over open gas-fired grills. We also offer our guests a selection of ribs, fish, chicken and vegetable plates, and an assortment of hamburgers, salads and sandwiches. The majority of our entrees include two made-from-scratch side items, and we offer all our guests a free unlimited supply of roasted in-shell peanuts and made-from-scratch yeast rolls. The operating strategy that underlies the growth of our concept is built on the following key components:
• Offering high quality, freshly prepared food. We place a great deal of emphasis on ensuring our guests receive high quality, freshly prepared food. We have developed proprietary recipes to provide consistency in quality and taste throughout all restaurants. We require that a management level employee inspect every entrée before it leaves the kitchen to confirm it matches the guest's order and meets our standards for quality, appearance and presentation.
3
Finally, we employ a team of product coaches whose sole function is to provide continual, hands-on training and education to our kitchen staff for the purpose of assuring uniform adherence to recipes, food preparation procedures, food safety standards, food appearance, freshness and

portion size.• Focusing on dinner. In a high percentage of our restaurants, we limit our operating hours to dinner only during the weekdays. By focusing on dinner, our restaurant teams have to prepare for and manage only one shift per day during the week. We believe this allows our restaurant teams to offer higher quality, more consistent food and service to our guests. We believe the dinner focus provides a better "quality-of-life" for our management teams and, therefore, is a key ingredient in attracting and retaining talented and experienced management personnel. We also focus on keeping our table-to-server ratios low to allow our servers to truly focus on their guests and serve their needs in a personal, individualized manner.
• Offering attractive price points. We offer our food and beverages at moderate price points that are as low as or lower than those offered by many of our competitors. Within each menu category, we offer a choice of several price points with the goal of fulfilling each guest's budget and value expectations. For example, our steak entrees, which include the choice of two side items, range from $7.99 for our 6-ounce sirloin to $18.99 for our 18-ounce T-bone. The per guest average check for the restaurants we owned and operated in 2004 was $13.72. Per person average check represents restaurant sales divided by the number of guests served. We considered each sale of an entrée to be a single guest served. Our per guest average check is highly influenced by our weekday dinner only focus.
• Offering performance-based manager compensation. We offer a performance-based compensation program to our restaurant managers and area managers, who are called "managing partners" and "market partners", respectively. Each of these partners earns a base salary plus a performance bonus, which represents a percentage of their respective restaurant's pre-tax net income. In 2004, performance bonuses represented 53% and 79% of the total cash compensation earned by managing and market partners, respectively. By providing our partners with a significant stake in the success of our restaurants, we believe that we are able to attract and retain talented, experienced and highly motivated managing and market partners.
• Creating a fun and comfortable atmosphere. We believe the atmosphere we establish in our restaurants is a key component for fostering repeat business. Our restaurants feature a rustic southwestern lodge décor accentuated with hand-painted murals, neon signs, and southwestern prints, rugs and artifacts. Additionally, we offer jukeboxes, which continuously play upbeat country hits, and in-house entertainment such as line dancing and birthday celebrations.
Unit Prototype and Economics We designed our prototype Texas Roadhouse to provide a relaxed atmosphere and maximize restaurant sales. The Texas Roadhouse prototypical restaurant consists of a freestanding building with approximately 6,300 to 6,900 square feet of space constructed on sites of approximately 1.7 to 2.0 acres, with seating at approximately 56 tables for a total of 239 guests, including 15 bar seats, and parking for approximately 150 automobiles. Our current prototype is adaptable to in-line locations such as spaces within an enclosed mall or a shopping center. The total cash cost of developing the current prototype Texas Roadhouse restaurant in which we own the land is $2.5 to $3.5 million. This cost includes $0.5 million to $1.2 million for land, $1.1 million to $1.4 million for building and site construction, approximately $0.7 million for furniture, fixtures, signage and equipment and approximately $0.2 million for pre-opening costs. When we lease the land, the total cash cost of developing our prototype restaurant is between $2.0 million and $2.3 million. As of December 28, 2004, we owned 53 properties and leased 54 properties.
4
Our average unit volume for 2004 was $3.7 million. The time required for a new restaurant to reach a steady level of cash flow is approximately three to six months. Site Selection We continue to develop and refine our site selection process. In analyzing each prospective site, management devotes significant time and resources to the evaluation of local market demographics, population density, household income levels and site-specific characteristics such as visibility, accessibility, traffic generators, proximity of other retail activities, traffic counts and parking. Our management works actively with real estate brokers in target markets to select high quality sites and to maintain and regularly update our database of potential sites. Management typically requires three to nine months to locate, approve and control a restaurant site and typically three to ten additional months to obtain necessary permits. Upon receipt of permits, it requires approximately four months to construct, equip and open a restaurant. Existing Restaurant Locations As of December 28, 2004, we had 107 company restaurants and 86 franchise restaurants in 35 states as shown in the chart below.
Number of Restaurants
Company
Franchise
Total
Alabama 1 — 1Arizona 4 — 4California — 1 1Colorado 9 3 12Delaware 1 — 1Florida 1 5 6Georgia — 7 7Idaho 2 — 2Illinois 4 1 5Indiana 3 15 18Iowa 3 — 3Kansas 2 1 3Kentucky 4 5 9Louisiana 4 — 4Maryland — 4 4

Massachusetts 4 1 5Michigan 4 2 6Missouri — 2 2Montana — 1 1New Hampshire 1 — 1New Jersey 1 — 1New York 1 — 1North Carolina 9 — 9Ohio 5 12 17Oklahoma 3 — 3Pennsylvania 7 4 11Rhode Island 1 — 1South Carolina — 6 6Tennessee — 9 9Texas 24 3 27Utah 1 — 1Virginia 5 — 5West Virginia — 2 2Wisconsin 2 2 4Wyoming 1 — 1
Total 107 86 193
5
Food Menu. Texas Roadhouse restaurants offer a wide variety of menu items at attractive prices that are designed to appeal to a broad range of consumer tastes. Our dinner entrée prices range from $7.99 to $18.99. We offer a broad assortment of specially seasoned and aged steaks, including 6 and 8 oz. Filets; 6, 8, 11 and 16 oz. Sirloins; and 10, 12 and 16 oz. Rib-eyes, hand-cut daily on the premises and cooked over open gas-fired grills. We also offer our guests a selection of fish, chicken and vegetable plates, and an assortment of hamburgers, salads and sandwiches. Most entrée prices include made-from-scratch yeast rolls and two of the following made from scratch sides: baked potato, sweet potato, steak fries, mashed potatoes, house or Caesar salad, green beans, chili, seasoned rice, baked beans and steamed vegetables. Our menu allows guests to customize their meals by ordering steaks that are "smothered" either in cheese, onions, gravy or mushrooms and baked potatoes "loaded" with cheese and bacon. Other menu items include specialty appetizers such as the "Cactus Blossom," "Rib Appetizer," and "Chicken Critters" (chicken tenders). We also provide a "12 & Under" menu for children that includes a sirloin steak, Chicken Critters, cheeseburger, hot dog and macaroni and cheese, all served with a beverage for under $5.00. Almost all of our restaurants feature a full bar that offers an extensive selection of draft and bottled beer. Managing partners are encouraged to tailor their beer selection to include regional brands and microbrews. We serve a selection of major brands of liquor and wine, as well as frozen margaritas. Alcoholic beverages accounted for 12.2% of restaurant sales at Texas Roadhouse in 2004. We have maintained a consistent menu over time, with a selection of approximately 60 menu items. We continually review our menu to consider enhancements to existing menu items or the introduction of new items. We change our menu only after guest feedback and an extensive study of the operational and economic implications. To maintain our high levels of food quality and service, we generally remove one menu item for every new menu item introduced, so as to facilitate our ability to execute high quality meals on a focused range of menu items. Food Quality. We are committed to serving a varied menu of high-quality, great tasting food items, with an emphasis on freshness. We have developed proprietary recipes to ensure consistency in quality and taste throughout all restaurants and provide a unique flavor experience to our guests. At each restaurant, a fully trained meat cutter hand cuts our steaks and other restaurant team members prepare all side items and yeast rolls from scratch in the restaurants daily. We assign individual kitchen employees to the preparation of designated food items in order to focus on quality, consistency and speed. Additionally, every entrée is inspected by a manager before it leaves the kitchen to ensure it matches the guest's order and meets our standards for quality, appearance and presentation. We employ a team of product coaches whose sole function is to provide continual, hands-on training and education to the kitchen staff in all Texas Roadhouse restaurants for the purpose of assuring uniform adherence to recipes, food preparation procedures, food safety standards, food appearance, freshness and portion size. The team currently consists of 21 product coaches, each handling an average of nine restaurants. We expect to maintain a comparable ratio of product coaches to restaurants as we continue to grow. Purchasing. Our purchasing philosophy is designed to consistently supply fresh, quality products to the restaurants at competitive prices while maximizing operating efficiencies. We negotiate directly with suppliers for substantially all food and beverage products to ensure consistent quality and freshness and obtain competitive prices. Certain products, such as dairy products and selected produce, are purchased locally to assure freshness. Food and supplies are ordered by, and shipped directly to, the restaurants, as we do not maintain a central product warehouse or commissary. We strive to qualify more than one supplier for all key
6
food items and believe that beef of comparable quality as well as all other essential food and beverage products are available, upon short notice, from alternative qualified suppliers. Food Safety. Food safety is of utmost importance to Texas Roadhouse. We currently employ several programs to ensure adherence to proper food preparation procedures and food safety standards. Texas Roadhouse has an established Quality Assurance department whose function is to develop, enforce and maintain programs designed to ensure strict adherence to food safety guidelines. Where required, food items purchased from qualified vendors have been inspected by reputable, outside inspection services confirming that the vendor is compliant with FDA and USDA guidelines. Each product coach is required to perform a sanitation audit on two stores each month and send the results to our Quality Assurance department for review. Furthermore, though it is typically required for food manufacturers and not for restaurants, Texas Roadhouse has developed a HAACP (Hazard Analysis and Critical Points) plan that specifies food handling and sanitation procedures for all menu items. To reinforce the importance of food safety, all HAACP points are printed in bold type on each recipe.

Service Guest Satisfaction. Through the use of guest surveys, our website "texasroadhouse.com," a toll-free guest response telephone line and personal interaction in the restaurant, we receive valuable feedback from guests. Additionally, we employ an outside service to administer a "Secret Shopper" program whereby trained individuals periodically dine and comprehensively evaluate the guest experience at each of our restaurants. Particular attention is given to food and service quality, cleanliness, staff attitude and teamwork, and manager visibility and interaction. The resulting reports are used for follow up training feedback to both staff and management. Atmosphere. The atmosphere of Texas Roadhouse restaurants is intended to appeal to broad segments of the population, children and adults, families, couples, single adults and business persons. Substantially all Texas Roadhouse restaurants are of our prototype design, reflecting a rustic southwestern lodge atmosphere, featuring an exterior of rough-hewn cedar siding and corrugated metal. The interiors feature pine floors and are decorated with hand-painted murals, neon signs, southwestern prints and rugs and artifacts. The restaurants contain jukeboxes that continuously play upbeat country hits. Guests may also view a display-cooking grill and a meat cooler displaying fresh cut steaks, and may wait for seating in either a spacious, comfortable waiting area or a southwestern style bar. While waiting for a table, guests can enjoy complimentary roasted in-shell peanuts and watch as cooks prepare steaks and other entrees on the gas-fired grills. Immediately upon being seated at a table, guests can enjoy made-from-scratch yeast rolls along with the peanuts. People Management and Employees. Each of our restaurants has one managing partner, one kitchen manager and one service manager, and, in some cases, one or more additional assistant managers. The managing partner of each restaurant has primary responsibility for the day-to-day operations of the entire restaurant and is responsible for maintaining the standards of quality and performance established by us. We use market partners to supervise the operation of our restaurants including the continuing development of each restaurant's management team. Through regular visits to the restaurants, the market partners ensure adherence to all aspects of our concept, strategy and standards of quality. To further assure adherence to our standards of quality and to achieve uniform execution throughout the system, we employ product coaches who regularly visit the restaurants to assist in training of both new and existing employees and to grade food quality. The attentive service and high quality food, which results from each restaurant having a managing partner, two to three managers and the hands-on assistance of a product coach, are critical to our success.
7
Training and Development. All restaurant employees are required to complete varying degrees of training before and during employment. Our detailed training program emphasizes our operating strategy, procedures and standards and is conducted individually at Texas Roadhouse restaurants and in groups in Louisville, Kentucky. Our managing and market partners are generally required to have significant experience in the full-service restaurant industry and are generally hired at a minimum six to twelve months before their placement in a new or existing restaurant to allow time to fully train in all aspects of restaurant operations. All managing partners are required to complete a comprehensive 16-week training course, which includes training for every position in the restaurant. Other management team members, including kitchen and service managers, are required to complete a similar, slightly shorter course. All trainees are validated at pre-determined points in training by either a product coach or a training manager. A number of our restaurants have been certified as training centers by our training department. This certification confirms that the training center adheres to established operating procedures and guidelines. Additionally, most restaurants are staffed with training coordinators responsible for ongoing daily training needs. For new restaurant openings, a full team of designated trainers, each specializing in a specific restaurant position, is deployed to the restaurant at least ten days before opening. Formal employee training begins seven days before opening, and follows a uniform, comprehensive training course as directed by a training manager. Marketing Our marketing strategy aims to promote the Texas Roadhouse brand, while retaining a localized focus, to:
• increase comparable restaurant sales by attracting new guests to our restaurants, while increasing the frequency of visits by our current guests;
• support new restaurant openings to achieve restaurant sales and operating margin goals; and
• communicate and promote the uniqueness, appeal, quality and consistency of our brand.
We accomplish these objectives through three major initiatives. In-Restaurant Marketing. A significant portion of our marketing fund is spent in communicating with our guests while they are in our restaurants through point of purchase materials. We believe special promotions such as Valentine's Day and Mother's Day drive significant repeat business. In addition, our mascot, Andy Armadillo, provides our guests with a familiar and easily identifiable face. Local Restaurant Area Marketing. Given our strategy to be a neighborhood destination, local area marketing is integral in developing brand awareness in each market. We allocate roughly 50% of all marketing dollars for local restaurant area marketing. To enhance our visibility in new markets, we deliver free food to local businesses in connection with new store openings. Managing partners are encouraged to participate in creative community-based marketing, such as hosting local radio or television programs. We also engage in a variety of promotional activities, such as contributing time, money and complimentary meals to charitable, civic and cultural programs. For instance, our involvement with the Special Olympics, a local Little League baseball team, a local church or the Armed Forces, shows our "Legendary Care, Concern and Support" for our communities. We leverage the corresponding recognition in our public relations and marketing efforts to communicate our corporate values and mission statement to our guests. We employ marketing coordinators at the restaurant and market level to develop and execute the majority of the local marketing strategies.
8
Advertising. Although our restaurant concept is not media driven, to build brand awareness we spend a limited amount of our marketing dollars on various advertising channels, including billboard, print, radio and television. These advertisements are designed to reflect "Legendary Food, Legendary Service," as well as our fun and welcoming restaurant environment.

Restaurant Franchise Arrangements Franchise Restaurants. As of December 28, 2004, we had 20 franchisees that operated 86 restaurants in 20 states. Franchise rights are granted for specific restaurants, and we do not grant any rights to develop a territory. Approximately 70% of our franchise restaurants are operated by seven franchisees. No franchisee operates more than 12 restaurants. Our standard franchise agreement has a term of 10 years with two renewal options for an additional five years each if certain conditions are satisfied. Our current form of franchise agreement requires the franchisee to pay a royalty fee of 4.0% of gross restaurant sales. The royalty fee varies depending on when the agreements were entered into and range from 2.0% of gross sales to the current 4.0% fee. "Gross sales" means the total selling price of all services and products related to the restaurant. Gross sales do not include:
• employee discounts or other discounts;
• tips or gratuities paid directly to employees by guests;
• any federal, state, municipal or other sales, value added or retailer's excise taxes; or
• adjustments for net returns on salable goods and discounts allowed to guests on sales.
Franchisees are required to spend a minimum of 2.0% of their restaurant's gross sales on local advertising or promotional activities. Franchisees are required to pay 0.3% of gross sales to a national advertising and marketing fund for the development of advertising materials, system-wide promotions and related marketing efforts, which amount is credited against the local advertising spending requirement. We have the ability under our agreements to increase the required national advertising and marketing fund contribution up to 2.5% of gross sales. We may also charge a marketing fee of 0.5% of gross sales, which we may use for market research and to develop system-wide promotional and advertising materials. A franchisee's total required advertising contribution or spending will not be more than 3.0% of gross sales. A franchise agreement may be terminated if the franchisee defaults in the performance of any of its obligations under the franchise agreement, including its obligations to operate the restaurant in strict accordance with our standards and specifications. A franchise agreement may also be terminated if a franchisee dies, becomes disabled or becomes insolvent, fails to make its required payments, creates a threat to the public health or safety, ceases to operate the restaurant, or misuses the Texas Roadhouse trademarks. Our standard franchise agreement gives us the right, but not the obligation, to compel a franchisee to transfer its assets to us in exchange for shares of our stock, or to convert its equity interests into shares of our stock. The amount of shares that a franchisee would receive is based on a formula that is included in the franchise agreement. Franchise Compliance Assurance. We have instituted a comprehensive system to ensure the selection of quality franchisees and compliance with our systems and standards, both during the development and operating of franchise restaurants. After a preliminary franchise agreement is signed, we actively work with and monitor our franchisees to ensure successful franchise operations as well as compliance with the Texas Roadhouse standards and procedures. During the restaurant development phase, we approve the selection of restaurant sites and make available copies of our prototype building plans to franchisees. During construction, we review the building for compliance with our standards.
9
We provide training to the managing partner and up to three other managers of a franchisee's first restaurant. We also provide trainers for a period of 12 to 15 days to assist in the opening of every franchise restaurant. Finally, on an ongoing basis, we conduct reviews on all franchise restaurants to determine their level of effectiveness in executing our concept at a variety of operational levels. Our franchisees are required to follow the same standards and procedures regarding equipment, food purchases and food preparation as we maintain in our company restaurants. Reviews are conducted by seasoned operations teams, and focus on key areas including health, safety and execution proficiency. To continuously improve our communications with franchisees and the consistency of the brand, we maintain a business development council that includes representatives of our franchisees. The council's functions are advisory. Its members review and comment on proposed advertising campaigns and materials and budget expenditures. Management Services. We provide management services to twelve of the franchise restaurants in which we or our founder have an ownership interest. Such management services include accounting, operational supervision, human resources, training, and food, beverage and equipment consulting for which we receive monthly fees of up to 2.5% of gross sales. We also make available to these restaurants certain legal services through outside sources on a pass-through cost basis. We also provide restaurant employees on a pass-through cost basis to three franchise restaurants in which we have an ownership interest. In addition, we receive a monthly fee of $1,250 from three franchise restaurants for providing payroll and accounting services. Management Information Systems and Restaurant Reporting All of our company restaurants use computerized management information systems, which are designed to improve operating efficiencies, provide restaurant and Support Center management with timely access to financial and operating data and reduce administrative time and expense. With our current information systems, we have the ability to generate reports showing weekly and period-to-date numbers on a company-wide, regional or individual restaurant basis. Together, this enables us to closely monitor sales, food and beverage costs and labor and operating expenses at each of our restaurants. We have created reports that provide comparative information that enables both restaurant and Support Center management to supervise the financial and operational performance of our restaurants and to recognize and understand trends in the business. Our accounting department prepares monthly profit and loss statements, which provide a detailed analysis of sales and costs, and which are compared both to the restaurant-prepared reports and to prior periods. We have implemented satellite technology at the restaurant level, which serves as a communication link between the restaurants and our Support Center as well as our credit and gift card processor. We are in the process of implementing technology that will interface every restaurant management information system with the management information systems at our Support Center. When these improvements are in place, restaurant level data will automatically be posted and compiled into our Support Center accounting and other information systems. Competition

According to the National Restaurant Association, or NRA, restaurant industry sales in 2005 will represent approximately 4.0% of the United States' gross domestic product. The NRA also forecasts that restaurant industry sales will reach $476 billion and will encompass approximately 900,000 restaurants. Competition in the restaurant industry is intense. Texas Roadhouse restaurants compete with mid-priced, full-service, casual dining restaurants primarily on the basis of taste, quality and price of the food offered, service, atmosphere, location and overall dining experience. Our competitors include a large and diverse group of restaurants that range from independent local operators to well-capitalized
10
national restaurant chains. Although we believe that we compete favorably with respect to each of the above factors, other restaurants operate with concepts that compete for the same casual dining guests as we do, with the number of casual dining restaurants emphasizing steaks increasing in recent years. We also compete with other restaurants and retail establishments for quality site locations and restaurant-level employees. Trademarks Our registered trademarks and service marks include, among others, the marks "Texas Roadhouse®" and our stylized logo. We have registered all of our marks with the United States Patent and Trademark Office. We have registered or have registrations pending for our most significant trademarks and service marks in ten foreign jurisdictions including the European Union. To better protect our brand, we have also registered the Internet domain name "www.texasroadhouse.com." We believe that our trademarks, service marks, and other proprietary rights have significant value and are important to our brand-building efforts and the marketing of our restaurant concept. Government Regulation We are subject to a variety of federal, state and local laws. Each of our restaurants is subject to permitting, licensing and regulation by a number of government authorities, relating to alcoholic beverage control, health, safety, sanitation, building and fire codes, and to compliance with the applicable zoning, land use and environmental laws and regulations. Difficulties in obtaining or failure to obtain required licenses or approvals could delay or prevent the development of a new restaurant in a particular area. In 2004, 12.2% of our restaurant sales were attributable to the sale of alcoholic beverages. Alcoholic beverage control regulations require each of our restaurants to apply to a state authority and, in certain locations, county or municipal authorities for a license that must be renewed annually and may be revoked or suspended for cause at any time. Alcoholic beverage control regulations affect numerous aspects of restaurant operations, including minimum age of patrons and employees, hours of operation, advertising, wholesale purchasing, inventory control and handling, storage and dispensing of alcoholic beverages. The failure of a restaurant to obtain or retain liquor or food service licenses would have a material adverse effect on the restaurant's operations. To reduce this risk, each company restaurant is operated in accordance with procedures intended to assure compliance with applicable codes and regulations. We are subject in certain states to "dram shop" statutes, which generally provide a person injured by an intoxicated person the right to recover damages from an establishment that wrongfully served alcoholic beverages to the intoxicated person. We carry liquor liability coverage as part of our existing comprehensive general liability insurance, as well as excess umbrella coverage of $75.0 million per occurrence, with a $10,000 deductible for the first $25.0 million. Our restaurant operations are also subject to federal and state laws governing such matters as the minimum hourly wage, unemployment tax rates, sales tax and similar matters, over which we have no control. Significant numbers of our service, food preparation and other personnel are paid at rates related to the federal minimum wage (which currently is $5.15 per hour), and further increases in the minimum wage could increase our labor costs. Seasonality Our business is subject to minor seasonal fluctuations. Historically, sales in most of our restaurants have been higher during the winter and summer months of each year.
11
Employees As of December 28, 2004, we employed approximately 12,500 people, of whom 180 were executive and administrative personnel, 518 were restaurant management personnel and the remainder were hourly restaurant personnel. Many of our hourly restaurant employees work part-time. None of our employees are covered by a collective bargaining agreement. Executive Officers of the Company Set forth below are the name, age, position and a brief account of the business experience of each of our executive officers: Name
Age
Position
W. Kent Taylor 49 Chairman of the Company, Director G. J. Hart 47 President, Chief Executive Officer Steven L. Ortiz 47 Chief Operating Officer Scott M. Colosi 40 Chief Financial Officer Sheila C. Brown 52 General Counsel, Corporate Secretary W. Kent Taylor. Mr. Taylor is our founder and was, until the completion of our initial public offering, Chief Executive Officer. Upon the completion of the offering, Mr. Taylor became Chairman of the Company, an executive position. Before his founding of our concept, Mr. Taylor founded and co-owned Buckhead Bar and Grill in Louisville, Kentucky. Mr. Taylor has over 20 years of experience in the restaurant industry. G. J. Hart. Mr. Hart has served as our President since May 15, 2000. Upon the completion of the offering, Mr. Hart became President and Chief Executive Officer. From October 1995 until May 2000, Mr. Hart was President of Al Copeland Investments in Metairie, Louisiana, a privately held business consisting of four restaurant concepts, hotels, gaming, entertainment and food processing operations. From June 1991 to September 1995, Mr. Hart was President of TriFoods International, Inc., a producer of prepared food products. Mr. Hart has over 25 years of experience in the food industry. Steven L. Ortiz. Mr. Ortiz has served as our Executive Vice President of Operations since May 2001. Upon the completion of the offering, Mr. Ortiz became

Chief Operating Officer. Mr. Ortiz joined our company in 1996 as a Market Partner in which capacity he was responsible for developing and starting new Texas Roadhouse restaurants in Texas. From 1982 to 1996, Mr. Ortiz was employed by Bennigan's Restaurants in various capacities, including General Manager, Area Director and Regional Vice President. Mr. Ortiz has over 20 years of experience in the restaurant industry. Scott M. Colosi. Mr. Colosi has served as our Chief Financial Officer since September 2002. From 1992 until September 2002, Mr. Colosi was employed by YUM! Brands, Inc., owner of the KFC, Pizza Hut, and Taco Bell brands. During this time, Mr. Colosi served in various financial positions and, immediately prior to joining us, was Director of Investor Relations. Mr. Colosi has 17 years of experience in the restaurant industry.
12
Sheila C. Brown. Ms. Brown has served as our General Counsel and Secretary since November 2001. From August 2000 to November 2001, Ms. Brown was our Director of Property Acquisition and, from September 1998 to August 2000, Development Coordinator, in which capacity Ms. Brown was responsible for our real estate development activities. Ms. Brown has over 20 years of experience in the restaurant industry. Website Access To Reports We make our annual report on Form 10-K, quarterly reports on Form 10-Q, current reports on Form 8-K, and amendments to those reports, filed or furnished pursuant to section 13(a) or 15(d) of the Securities Exchange Act of 1934, available, free of charge on or through the Internet website, www.texasroadhouse.com, as soon as reasonably practicable after we electronically file such material with, or furnish it to, the SEC. ITEM 2—PROPERTIES Properties Our Support Center is located in Louisville, Kentucky. We occupy this facility under a lease with Paragon Centre Holdings, LLC, a limited liability company in which we have a minority ownership position. As of December 28, 2004, we leased 34,143 square feet. Our lease expires on March 31, 2014. We have rights to expand our leased space as additional space in the building becomes available. We have an option to renew the lease for an additional five years. Of the 107 company restaurants in operation as of December 28, 2004, 53 locations are owned and 54 are leased, as shown in the following table.
Location
State
Owned/ Leased
1. Clarksville Indiana Leased 2. Gainesville Florida Leased 3. Louisville Kentucky Owned 4. New Philadelphia Ohio Leased 5. Louisville Kentucky Leased 6. Elizabethtown Kentucky Leased 7. Grand Junction Colorado Leased 8. Grand Prairie Texas Leased 9. Cedar Falls Iowa Leased
10. Killeen Texas Owned 11. Thornton Colorado Leased 12. Lancaster Pennsylvania Leased 13. Salt Lake City Utah Leased 14. Texarkana Texas Owned 15. Abilene Texas Owned 16. Shively Kentucky Leased 17. Champaign Illinois Owned 18. Fayetteville North Carolina Leased 19. Pueblo Colorado Owned 20. Decatur Illinois Leased 21. Greeley Colorado Owned 22. Waco Texas Owned 23. Fort Wayne Indiana Owned 24. Hickory North Carolina Leased 25. Lansing Michigan Owned
13
26. Boise Idaho Leased 27. Pasadena Texas Owned 28. Gastonia North Carolina Leased 29. Idaho Falls Idaho Leased 30. Aurora Colorado Leased 31. Cedar Rapids Iowa Leased 32. Concord North Carolina Leased 33. College Station Texas Leased 34. Joliet Illinois Leased 35. Live Oak Texas Owned 36. Arvada Colorado Leased 37. Mesquite Texas Leased 38. Wilmington North Carolina Owned 39. Dickson City Pennsylvania Leased 40. Fort Collins Colorado Owned 41. Peoria Arizona Owned 42. Houston Texas Owned 43. Mesa Arizona Leased 44. Pineville North Carolina Owned 45. Brooklyn Ohio Leased

46. Elyria Ohio Leased 47. Reading Pennsylvania Owned 48. Tyler Texas Leased 49. Richmond Virginia Owned 50. Elkhart Indiana Owned 51. Corpus Christi Texas Owned 52. Oklahoma City Oklahoma Leased 53. Cheyenne Wyoming Owned 54. West Phoenix Arizona Owned 55. N. Dartmouth Massachusetts Leased 56. Friendswood Texas Leased 57. York Pennsylvania Owned 58. Toledo Ohio Owned 59. Davenport Iowa Owned 60. Methuen Massachusetts Owned 61. Kenosha Wisconsin Leased 62. Sterling Heights Michigan Owned 63. East Peoria Illinois Leased 64. Bear Delaware Owned 65. Lynchburg Virginia Owned 66. N. Oklahoma City Oklahoma Leased 67. Asheville North Carolina Leased 68. Madison Heights Michigan Leased 69. Harvey Louisiana Leased 70. Christiansburg Virginia Leased 71. San Antonio Texas Owned 72. Lubbock Texas Owned 73. Roseville Michigan Leased 74. Conroe Texas Owned
14
75. Tulsa Oklahoma Leased 76. Denton Texas Owned 77. Amarillo Texas Owned 78. Fort Worth Texas Owned 79. Lake Charles Louisiana Owned 80. Brockton Massachusetts Leased 81. McAllen Texas Owned 82. Nashua New Hampshire Owned 83. Erie Pennsylvania Owned 84. Green Bay Wisconsin Owned 85. Olathe Kansas Owned 86. Vestal New York Leased 87. Wichita Falls Texas Owned 88. Yorktown Virginia Owned 89. Durham North Carolina Leased 90. Littleton Colorado Owned 91. Cranston Rhode Island Leased 92. Chantilly Virginia Leased 93. Longview Texas Leased 94. Springfield Massachusetts Leased 95. Topeka Kansas Owned 96. El Paso Texas Owned 97. Yuma Arizona Owned 98. Millville New Jersey Leased 99. Bethlehem Pennsylvania Leased
100. Winston-Salem North Carolina Owned 101. Royersford Pennsylvania Leased 102. Pelham Alabama Owned 103. Lafayette Louisiana Leased 104. Willoughby Ohio Owned 105. Parker Colorado Owned 106. Baton Rouge Louisiana Leased 107. Austin Texas Owned
ITEM 3—LEGAL PROCEEDINGS Occasionally, we are a defendant in litigation arising in the ordinary course of our business, including claims resulting from "slip and fall" accidents, employment related claims and claims from guests or employees alleging illness, injury or other food quality, health or operational concerns. None of these types of litigation, most of which are covered by insurance, has had a material effect on us, and as of the date of this report, we are not a party to any litigation that we believe would have a material adverse effect on our business. ITEM 4—SUBMISSION OF MATTERS TO A VOTE OF SECURITY HOLDERS None.
15
PART II

ITEM 5—MARKET FOR THE REGISTRANT'S COMMON EQUITY, RELATED STOCKHOLDER MATTERS AND ISSUER PURCHASES OF EQUITY SECURITIES Our Class A common stock is traded on the Nasdaq National Market under the symbol TXRH. The Class A common stock has been quoted on the Nasdaq National Market since October 5, 2004. The quarterly high and low closing price of our Class A common stock for the quarterly period since October 5, 2004 were as follows:
Year ended December 28, 2004
High
Low
Fourth Quarter $ 29.46 $ 20.38 The number of holders of record of our Class A common stock as of March 18, 2005 was 250. The number of holders of record of our Class B common stock as of March 18, 2005 was 1. There is no established trading market for our Class B common stock. We have never declared or paid cash dividends on our common stock. The declaration and payment of cash dividends on our common stock is at the discretion of our Board of Directors, and any decision to declare a dividend will be based on a number of factors, including, but not limited to, earnings, financial condition, applicable covenants under our credit facility and other contractual restrictions, or other factors deemed relevant. As of December 28, 2004, shares of Class A common stock authorized for issuance under our equity compensation plan are summarized in the following table. See note 16 to the consolidated financial statements for a description of the plan.
Plan Category
Shares to Be Issued Upon
Exercise
Weighted- Average Option Exercise Price
Shares Available for
Future Grants
Plan approved by shareholders 4,447,602 $ 7.99 2,638,140Plans not approved by shareholders — — —
Total 4,447,602 $ 7.99 2,638,140
Use of Proceeds We registered 10,474,669 shares of our Class A common stock in connection with our initial public offering under the Securities Act of 1933, including 1,366,261 shares that were subject to an over-allotment option. The Securities and Exchange Commission declared our Registration Statement on Form S-1, as amended (Reg. No. 333-115259), for such initial public offering effective on October 4, 2004. All 10,474,669 shares of our Class A common stock registered in the offering were sold at the initial public offering price per share of $17.50. The aggregate purchase price of the offering was $183.3 million. 6,581,481 shares of Class A common stock were sold for an aggregate purchase price of $115.2 million for the benefit of the Company and 3,893,188 shares of Class A common stock were sold for the accounts of selling stockholders. The net offering proceeds to us after deducting total expenses were approximately $105.1 million. We incurred total expenses in connection with the offering of $10.1 million, which consisted of:
• $1.6 million in legal, accounting and printing fees;
• $8.1 million in underwriters' discounts fees and commissions for those shares sold by us; and
16
•
$0.4 million in miscellaneous expenses. No payments for such expenses were made directly or indirectly to (i) any of our directors, officers or their associates, (ii) any person(s) owning 10% or more of any class of our equity securities or (iii) any of our affiliates. We completed our initial public offering on October 8, 2004. From October 8, 2004 through December 28, 2004, we applied the net proceeds as follows:
• $68.9 million was used to repay outstanding borrowings under our credit facility, including accrued interest thereon; and,
• $3.4 million was used to fund payments to equity holders of our predecessor company, Texas Roadhouse Holdings LLC, based on its undistributed net income for periods from June 30, 2004 to October 8, 2004.
Of the $3.4 million of payments we made, our executive officers, directors and 10% stockholders, including affiliates, received the amounts set forth below (in thousands):
Name
Payment
W. Kent Taylor (Chairman of the Company, Director) $ 1,765G.J. Hart (President, Chief Executive Officer) 22Steven L. Ortiz (Chief Operating Officer) 12Sheila C. Brown (General Counsel, Corporate Secretary) 1Martin T. Hart (Director) 8

We expect to use the remaining proceeds to fund a $31.2 million payment to equity holders of our predecessor company, Texas Roadhouse Holdings LLC, in redemption of its preferred shares related to its income for periods prior to October 8, 2004, and to fund working capital.
Issuer Repurchases of Securities During the quarter ended December 28, 2004, there were no repurchases made by us or on our behalf, or by any "affiliated purchaser," of shares of our Class A common stock.
17
ITEM 6—SELECTED CONSOLIDATED FINANCIAL DATA We derived the selected consolidated financial data as of and for the year 2004 from our audited consolidated financial statements. The 2004 financial data give effect to the combination of our operations under Texas Roadhouse, Inc., a "C" corporation, and the closing of the Company's initial public offering, both of which occurred on October 8, 2004. The 2004 financial data also give effect to an income tax provision for the period after October 8, 2004 and include an adjustment to establish a deferred tax liability related to the $5.0 million excess of the reported amounts of the Company's assets and liabilities over the tax basis of those assets and liabilities at October 8, 2004. The balance sheet data as of December 28, 2004 give effect to the issuances of 30,928,340 shares of Class A common stock and 2,632,688 shares of Class B common stock in connection with the combination of our operations under Texas Roadhouse, Inc. and our initial public offering. The 30,928,340 shares of Class A common stock referred to in the preceding paragraph include:
• an aggregate of 18,832,159 shares of Class A common stock that were issued in connection with the combination of the operations of Texas Roadhouse Holdings LLC, Texas Roadhouse Management Corp. and WKT Restaurant Corp. under Texas Roadhouse, Inc.;
• 1,754,531 shares of Class A common stock that were issued to Mr. Taylor for his majority interest in Texas Roadhouse Development Corporation;
• 671,089 shares of Class A common stock that were issued to Mr. Taylor for his interest in 9 controlled franchise restaurants;
• 3,089,080 shares of Class A common stock that were issued in the acquisition of the remaining equity interests in all of our 31 majority-owned or controlled company restaurants and Texas Roadhouse Development Corporation and all of the equity interests in one franchise restaurant; and,
• 6,581,481 shares of Class A common stock issued and sold in our initial public offering.
The selected consolidated financial data as of and for the years 2000 through 2003 and from December 31, 2003 through October 8, 2004 were derived from our audited consolidated financial statements and present the consolidated operations of Texas Roadhouse Holdings LLC and its wholly-owned and majority-owned restaurants, Texas Roadhouse Development Corporation, Texas Roadhouse Management Corp., WKT Restaurant Corp., and nine franchise restaurants, all of which were entities under the common control of Mr. Taylor. Our historical results are not necessarily indicative of our results for any future period.
Fiscal Year
2004
2003
2002
2001
2000
($ in thousands)
Consolidated Statements of Income: Revenue: Restaurant sales $ 354,190 $ 279,519 $ 226,756 $ 154,359 $ 111,739 Franchise royalties and fees 8,821 6,934 6,080 5,553 4,027
Total revenue 363,011 286,453 232,836 159,912 115,766
Income from operations 38,682 34,258 26,312 13,689 10,782Income before taxes 28,860 23,143 16,953 7,291 5,758Provision for income taxes(1) 7,159 — — — —
Net income $ 21,701 $ 23,143 $ 16,953 $ 7,291 $ 5,758
18
Fiscal Year
2004
2003
2002
2001
2000
(in thousands, except per share data)
Pro forma data (unaudited): Historical net income $ 21,701 $ 23,143 $ 16,953 $ 7,291 $ 5,758 Pro forma provision for income taxes(2) 7,869 8,379 6,041 2,559 1,891

Net income adjusted for pro forma provision for income taxes $ 13,832 $ 14,764 $ 10,912 $ 4,732 $ 3,867
Net income adjusted for pro forma provision for income taxes per common share: Basic $ 0.53 $ 0.63 $ 0.47 $ 0.20 $ 0.16
Diluted $ 0.49 $ 0.60 $ 0.44 $ 0.20 $ 0.16
Pro forma weighted average shares outstanding(3): Basic 25,945 23,440 23,334 23,487 23,913
Diluted 28,257 24,772 24,688 24,143 24,277
Fiscal Year
2004
2003
2002
2001
2000
($ in thousands)
Consolidated Balance Sheet Data: Total assets $ 276,663 $ 148,193 $ 128,527 $ 96,428 $ 70,064Long-term debt, net of current maturities 12,760 56,254 59,094 35,092 22,046Obligations under capital leases, net of current maturities 771 914 1,095 1,381 1,641Total liabilities 102,753 104,606 95,690 75,238 54,692Minority interest 699 5,685 5,850 4,655 3,150Total stockholders' equity 173,211 37,902 26,987 16,535 12,222
Fiscal Year
2004
2003
2002
2001
2000
($ in thousands)
Selected Operating Data: Company Restaurants: Number open at end of period 107 87 77 56 44 Average unit volumes(4) $ 3,679 $ 3,401 $ 3,270 $ 3,313 $ 3,312 Comparable restaurant sales growth(5) 7.6% 3.4% 3.7% 1.5% 9.4%Net cash provided by operating activities $ 57,275 $ 42,158 $ 31,718 $ 22,502 $ 16,122 Net cash used in investing activities $ (49,735) $ (26,524) $ (32,764) $ (35,769) $ (22,908) Net cash provided by (used in) financing activities $ 32,967 $ (17,722) $ 4,945 $ 9,894 $ 9,488
(1) Until October 8, 2004, we operated as a limited liability company and were taxed as a partnership. Accordingly, we paid no significant income taxes on our own behalf and there is no provision for income taxes prior to October 8, 2004 in our consolidated financial statements.
Our results for the year ended December 28, 2004 include a cumulative net deferred income tax provision of $5.0 million. As a result of our conversion from a nontaxable limited liability company to a taxable "C" corporation as of our October 8, 2004 initial public offering, and in accordance with Statement of Financial Accounting Standards ("SFAS") No. 109,Accounting for Income Taxes,
19
we established the beginning balances in our deferred tax assets and liabilities. Our net deferred tax liabilities are comprised primarily of differences in depreciation which were previously expensed for income tax purposes, but had not yet been expensed for financial reporting purposes. Such amounts were required to be recognized through the income tax provision in the period of the change in our tax status.
Our effective tax rate is determined based on estimates of pre-tax income, permanent differences and credits, and will be reviewed quarterly to determine if actual results require modifying the effective tax rate. Our actual effective tax rate for October 8, 2004 through December 28, 2004 was 33.6%, excluding the $5.0 million deferred tax charge discussed above, comprised of a combined state tax rate of 3.4% and an effective federal rate of 30.2%.(2) The pro forma provision for income taxes gives effect to our reorganization as a "C" corporation. The adjustment is based upon the information shown in the table below. The combined state tax rate is our estimate of the average state tax rate we would have incurred based on the mix and volume of business we do in the states and the relevant apportionment factors for those states. The combined federal and state tax rates shown below give effect to the deductibility of state taxes at the federal level and tip tax credits from 2000 through October 7, 2004.
2004
2003
2002
2001
2000
Effective federal tax rate 31.6% 32.5% 32.1% 31.0% 28.8 %Combined state tax rate 3.3% 3.7% 3.5% 4.1% 4.0 %Combined effective federal and state tax rate 34.9% 36.2% 35.6% 35.1% 32.8 %
(3) The following table sets forth the calculation of pro forma weighted average shares outstanding (in thousands):
Fiscal Year
2004
2003
2002
2001
2000
Net income adjusted for pro forma income taxes $ 13,832 $ 14,764 $ 10,912 $ 4,732 $ 3,867

Weighted-average common shares outstanding: Shares—basic 25,945 23,440 23,334 23,487 23,913 Shares assumed issued on exercise of dilutive share equivalents 4,508 3,720 3,296 2,475 1,931 Shares assumed purchased with proceeds of dilutive share equivalents (2,196) (2,388) (1,942) (1,819) (1,567)
Total 28,257 24,772 24,688 24,143 24,277
Basic EPS
$
0.53
$
0.63
$
0.47
$
0.20
$
0.16
Diluted EPS $ 0.49 $ 0.60 $ 0.44 $ 0.20 $ 0.16
(4) Average unit volume represents the average annual restaurant sales for all company restaurants open for a full six months before the beginning of the period measured.
(5)
Comparable restaurant sales growth reflects the change in year-over-year sales for the comparable restaurant base. We define the comparable restaurant base to include those restaurants open for a full eighteen months before the beginning of the later fiscal period.
20
ITEM 7—MANAGEMENT'S DISCUSSION AND ANALYSIS OF FINANCIAL CONDITION AND RESULTS OF OPERATIONS Our Company Texas Roadhouse is a growing, moderately priced, full-service restaurant chain. Our founder and chairman, W. Kent Taylor, started the business in 1993. Our mission statement is "Legendary Food, Legendary Service." Our operating strategy is designed to position each of our restaurants as the local hometown destination for a broad segment of consumers seeking high quality, affordable meals served with friendly, attentive service. As of December 28, 2004, 193 Texas Roadhouse restaurants were operating in 35 states. We owned and operated 107 restaurants in 27 states, and franchised and licensed an additional 86 restaurants in 20 states. The first Texas Roadhouse restaurant opened in Clarksville, Indiana in February 1993. As of December 28, 2004, 193 Texas Roadhouse restaurants were in existence including:
• 107 "company restaurants," of which 105 were wholly-owned and two were majority-owned. The results of operations of company restaurants are included in our consolidated operating results. The portion of income attributable to minority interests in company restaurants that are not wholly-owned is reflected in the line item entitled "minority interest" in our consolidated statements of income.
• 86 "franchise restaurants," of which 82 were franchise restaurants and four were license restaurants. We have a 10.0% ownership interest in two franchise restaurants, a 5.0% ownership interest in nine franchise restaurants, and a 1.0% ownership in one franchise restaurant. The income derived from our minority interests in these franchise restaurants is reported in the line item entitled "equity income from investments in unconsolidated affiliates" in our consolidated statements of income. Additionally, we provide various management services to twelve franchise restaurants.
We have contractual arrangements which grant us the right to acquire at pre-determined valuation formulas (i) the remaining equity interests in the two majority-owned company restaurants and (ii) 60 of the franchise restaurants. Presentation of Financial and Operating Data We operated through 2001 on a fiscal year that ended on the last Sunday in December. Beginning with fiscal year 2002, for operational reasons, we changed our fiscal year end to the last Tuesday in December. This change resulted in fiscal year 2002 consisting of 52 weeks and two days as compared to fiscal years 2004 and 2003, both of which were 52 weeks in length. The extra two days in 2002 were not significant to our results of operations. Our quarters are 13 weeks in length. Through the closing of our reorganization and initial public offering on October 8, 2004, we conducted the Texas Roadhouse restaurant business through:
• Texas Roadhouse Holdings LLC and its wholly-owned and 22 majority-owned restaurants;
• Texas Roadhouse Development Corporation, holding the rights to franchise Texas Roadhouse restaurants;
• Texas Roadhouse Management Corp., providing management services to Texas Roadhouse Holdings LLC, Texas Roadhouse Development Corporation and certain license and franchise restaurants; and
• nine controlled franchise restaurants;
21
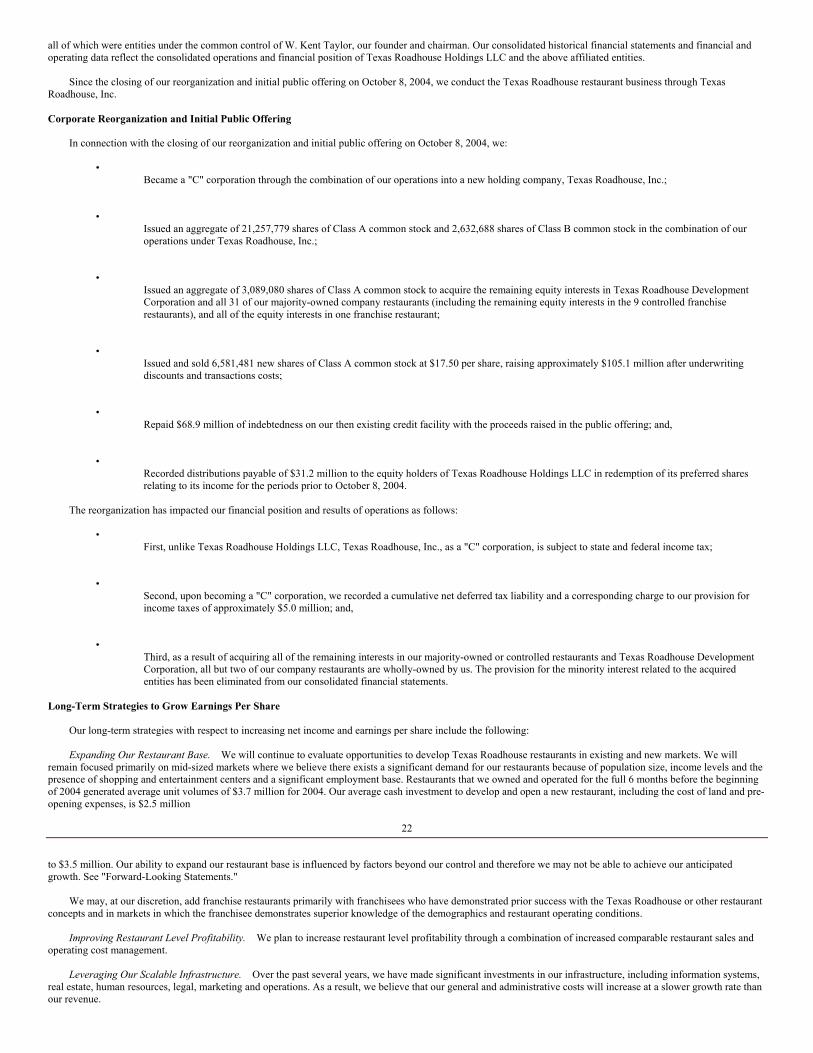
all of which were entities under the common control of W. Kent Taylor, our founder and chairman. Our consolidated historical financial statements and financial and operating data reflect the consolidated operations and financial position of Texas Roadhouse Holdings LLC and the above affiliated entities. Since the closing of our reorganization and initial public offering on October 8, 2004, we conduct the Texas Roadhouse restaurant business through Texas Roadhouse, Inc. Corporate Reorganization and Initial Public Offering In connection with the closing of our reorganization and initial public offering on October 8, 2004, we:
• Became a "C" corporation through the combination of our operations into a new holding company, Texas Roadhouse, Inc.;
• Issued an aggregate of 21,257,779 shares of Class A common stock and 2,632,688 shares of Class B common stock in the combination of our operations under Texas Roadhouse, Inc.;
• Issued an aggregate of 3,089,080 shares of Class A common stock to acquire the remaining equity interests in Texas Roadhouse Development Corporation and all 31 of our majority-owned company restaurants (including the remaining equity interests in the 9 controlled franchise restaurants), and all of the equity interests in one franchise restaurant;
• Issued and sold 6,581,481 new shares of Class A common stock at $17.50 per share, raising approximately $105.1 million after underwriting discounts and transactions costs;
• Repaid $68.9 million of indebtedness on our then existing credit facility with the proceeds raised in the public offering; and,
• Recorded distributions payable of $31.2 million to the equity holders of Texas Roadhouse Holdings LLC in redemption of its preferred shares relating to its income for the periods prior to October 8, 2004.
The reorganization has impacted our financial position and results of operations as follows:
• First, unlike Texas Roadhouse Holdings LLC, Texas Roadhouse, Inc., as a "C" corporation, is subject to state and federal income tax;
• Second, upon becoming a "C" corporation, we recorded a cumulative net deferred tax liability and a corresponding charge to our provision for income taxes of approximately $5.0 million; and,
• Third, as a result of acquiring all of the remaining interests in our majority-owned or controlled restaurants and Texas Roadhouse Development Corporation, all but two of our company restaurants are wholly-owned by us. The provision for the minority interest related to the acquired entities has been eliminated from our consolidated financial statements.
Long-Term Strategies to Grow Earnings Per Share Our long-term strategies with respect to increasing net income and earnings per share include the following: Expanding Our Restaurant Base. We will continue to evaluate opportunities to develop Texas Roadhouse restaurants in existing and new markets. We will remain focused primarily on mid-sized markets where we believe there exists a significant demand for our restaurants because of population size, income levels and the presence of shopping and entertainment centers and a significant employment base. Restaurants that we owned and operated for the full 6 months before the beginning of 2004 generated average unit volumes of $3.7 million for 2004. Our average cash investment to develop and open a new restaurant, including the cost of land and pre-opening expenses, is $2.5 million
22
to $3.5 million. Our ability to expand our restaurant base is influenced by factors beyond our control and therefore we may not be able to achieve our anticipated growth. See "Forward-Looking Statements." We may, at our discretion, add franchise restaurants primarily with franchisees who have demonstrated prior success with the Texas Roadhouse or other restaurant concepts and in markets in which the franchisee demonstrates superior knowledge of the demographics and restaurant operating conditions. Improving Restaurant Level Profitability. We plan to increase restaurant level profitability through a combination of increased comparable restaurant sales and operating cost management. Leveraging Our Scalable Infrastructure. Over the past several years, we have made significant investments in our infrastructure, including information systems, real estate, human resources, legal, marketing and operations. As a result, we believe that our general and administrative costs will increase at a slower growth rate than our revenue.

Key Operating Personnel Key personnel who have a significant impact on the performance of our restaurants include managing and market partners. Each company restaurant has one managing partner who serves as the general manager. Market partners provide supervisory services for 12 to 14 managing partners and their respective management teams. Market partners also assist with our site selection process and recruitment of new management teams. The managing partner of each company restaurant and their corresponding market partners are required, as a condition of employment, to sign a multi-year employment agreement. The annual compensation of our managing and market partners includes a base salary plus a percentage of the pre-tax net income of the restaurant(s) they operate or supervise. In 2004, the average annual bonus as a percentage of total compensation for managing and market partners was 53% and 79%, respectively. Managing and market partners are eligible to participate in our stock option plan and are required to make deposits of $25,000 and $50,000, respectively, towards the exercise price of such options. We expect that approximately three-quarters of our growth in the next several years will be in markets where we have an existing market partner. The remainder will be in markets where we have yet to hire a market partner. Each year, for the next several years, we expect to hire one or two additional market partners. We typically develop one to two restaurants during the first year of a new market partner's employment with us. Key Measures We Use To Evaluate Our Company Key measures we use to evaluate and assess our business include the following: Number of Restaurant Openings. Number of restaurant openings reflects the number of restaurants opened during a particular fiscal period. For company restaurant openings we incur pre-opening costs, which are defined below, before the restaurant opens. Typically new restaurants open with an initial start-up period of higher than normalized sales volumes, which decrease to a steady level approximately three to six months after opening. However, although sales volumes are generally higher, so are initial costs, resulting in restaurant operating margins that are generally lower during the start-up period of operation and increase to a steady level approximately three to six months after opening. Comparable Restaurant Sales Growth. Comparable restaurant sales growth reflects the change in year-over-year sales for the comparable restaurant base. We define the comparable restaurant base to include those restaurants open for a full 18 months before the beginning of the later fiscal period. Comparable restaurant sales growth can be generated by an increase in guest traffic counts or by
23
increases in the per person average check amount. Menu price changes and the mix of menu items sold can affect the per person average check amount. Average Unit Volume. Average unit volume represents the average annual restaurant sales for all company restaurants open for a full six months before the beginning of the period measured. Growth in average unit volumes in excess of comparable restaurant sales growth is generally an indication that newer restaurants are operating with sales levels in excess of the system average. Conversely, growth in average unit volumes less than growth in comparable restaurant sales growth is generally an indication that newer restaurants are operating with sales levels lower than the system average. Store Weeks. Store weeks represent the number of weeks that our company restaurants were open during the year. Other Key Definitions Restaurant Sales. Restaurant sales include gross food and beverage sales, net of promotions and discounts. Franchise Royalties and Fees. Franchisees typically pay a $40,000 initial franchise fee for each new restaurant. Franchise royalties consist of royalties in the amount of 2.0% to 4.0% of gross sales paid to us by our franchisees. Restaurant Cost of Sales. Restaurant cost of sales consists of food and beverage costs. Restaurant Labor Expenses. Restaurant labor expenses include all direct and indirect labor costs incurred in operations except for profit sharing incentive compensation expenses earned by our managing and market partners. These profit sharing expenses are reflected in restaurant other operating expenses. Restaurant Rent Expense. Restaurant rent expense includes all rent payments associated with the leasing of real estate and includes base, percentage and straight-line rent expense. Restaurant Other Operating Expenses. Restaurant other operating expenses consist of all other restaurant-level operating costs, the major components of which are utilities, supplies, advertising, repair and maintenance and general liability insurance. Profit sharing allocations to market partners and managing partners are also included in restaurant other operating expenses. Restaurant Pre-opening Expenses. Restaurant pre-opening expenses, which are charged to operations as incurred, consist of expenses incurred before the opening of a new restaurant and are comprised principally of training and opening team salaries, travel expenses, and food, beverage and other initial supplies and expenses. General and Administrative Expenses. General and administrative expenses ("G&A") is comprised of expenses associated with corporate and administrative functions that support development and restaurant operations and provide an infrastructure to support future growth. Supervision and accounting fees received from certain franchise restaurants and license restaurants are offset against general and administrative expenses. Depreciation and Amortization Expenses. Depreciation and amortization expenses ("D&A") includes the depreciation of fixed assets. Interest Expense, Net. Interest expense includes the cost of our debt obligations including the amortization of loan fees. In 2004, interest expense included write-offs of loan fees related to the disposition of the July 2003 facility.
24
Minority Interest. Our consolidated subsidiaries at December 28, 2004 included 3 majority-owned restaurants, two of which were open. Our consolidated subsidiaries at December 30, 2003 included 31 majority-owned or controlled restaurants and Texas Roadhouse Development Corporation. Minority interest represents the portion of income attributable to the other owners of the majority-owned restaurants and Texas Roadhouse Development Corporation. Equity Income from Unconsolidated Affiliates. We own a 10.0% equity interest in two franchise restaurants, a 5.0% interest in ten franchise restaurants, and a 1.0% equity interest in one franchise restaurant, all but one of which were open and operating at December 28, 2004. Equity income from unconsolidated affiliates represents our percentage share of net income earned by these unconsolidated affiliates.

Results of Operations
Fiscal Year
2004
2003
2002
$
%
$
%
$
%
($ in thousands)
Consolidated Statements of Income: Revenue: Restaurant sales 354,190 97.6 279,519 97.6 226,756 97.4 Franchise royalties and fees 8,821 2.4 6,934 2.4 6,080 2.6
Total revenue 363,011 100.0 286,453 100.0 232,836 100.0 Costs and expenses: (As a percentage of restaurant sales) Restaurant operating costs: Cost of sales 123,531 34.9 91,904 32.9 74,351 32.8 Labor 97,196 27.4 78,070 27.9 64,506 28.4 Rent 8,261 2.3 6,005 2.1 5,125 2.3 Other operating 58,044 16.4 47,382 17.0 36,237 16.0 (As a percentage of total revenue) Pre-opening 5,237 1.4 2,571 0.9 4,808 2.1 Depreciation and amortization 11,005 3.0 8,562 3.0 6,876 3.0 General and administrative 21,055 5.8 17,701 6.2 14,621 6.3
Total costs and expenses 324,329 89.3 252,195 88.0 206,524 88.7 Income from operations 38,682 10.7 34,258 12.0 26,312 11.3 Interest expense, net 4,654 (1.3) 4,350 (1.5) 4,212 (1.8)Minority interest 5,278 (1.5) 6,704 (2.3) 5,168 (2.2)Equity income (loss) from investments in unconsolidated affiliates 110 0.0 (61) 0.0 21 0.0
Income before taxes 28,860 8.0 23,143 8.2 16,953 7.3 Provision for income taxes 7,159 2.0 — 0.0 — 0.0
Net income 21,701 6.0 23,143 8.2 16,953 7.3
25
Restaurant Unit Activity
Company
Franchise
Total
Balance at December 31, 2001 56 64 120Openings 20 2 22Acquisitions (Dispositions) 1 (1) —Closures — — —
Balance at December 31, 2002 77 65 142Openings 10 10 20Acquisitions (Dispositions) — — —Closures — — —
Balance at December 30, 2003 87 75 162Openings 19 12 31Acquisitions (Dispositions) 1 (1) —Closures — — —
Balance at December 28, 2004 107 86 193
Year Ended December 28, 2004 Compared to Year Ended December 30, 2003 Restaurant Sales. Restaurant sales increased by 26.7% in 2004 as compared to 2003. This increase was primarily attributable to the opening of new restaurants and comparable restaurant sales growth. The following table summarizes additional factors that influenced the changes in restaurant sales at company restaurants for 2004 and 2003.
2004
2003
Company Restaurants Store weeks 4,920 4,234 Comparable restaurant sales growth 7.6% 3.4 % Average unit volumes (in thousands) $ 3,679 $ 3,401
The table above includes the impact of increased menu pricing of approximately 1.8%, 0.5% and 2.0% implemented in November 2003, March 2004 and November 2004, respectively. All of these menu price increases were principally driven by a significant industry wide increase in commodity costs. In 2005, we plan to open 20 additional company restaurants. We have either begun construction or have sites currently under contract for purchase or lease for all

of these restaurants. We expect to begin acquiring franchise restaurants in 2005, subject to the approval of our Board of Directors and the results of customary due diligence investigations. Franchise Royalties and Fees. Franchise royalties and fees increased by $1.9 million, or by 27.2%, from 2003 to 2004. This increase was primarily attributable to the opening of new franchise restaurants and comparable restaurant sales growth. Franchise restaurant count activity is shown in the restaurant unit activity table above. In 2005, franchisees plan to open 6 new franchise restaurants. Restaurant Cost of Sales. Restaurant cost of sales increased as a percentage of restaurant sales to 34.9% in 2004 from 32.9% in 2003. This increase was primarily due to the higher cost of beef and pork ribs. Including the benefit of the November 2004 price increase, we expect cost of sales, as a percentage of restaurant sales, to be approximately 25 to 50 basis points higher in 2005 versus 2004. This increase is expected to be principally driven by the higher cost of pork ribs.
26
Restaurant Labor Expenses. Restaurant labor expenses, as a percentage of restaurant sales, decreased to 27.4% in 2004 from 27.9% in 2003. The percentage of sales benefit generated from comparable restaurant sales growth more than offset modest wage rate inflation and higher workers' compensation and payroll tax costs. Restaurant Rent Expense. Restaurant rent expense, as a percentage of restaurant sales, increased to 2.3% in 2004 from 2.1% in 2003. This increase was primarily attributable to a $1.3 million (40 basis points) cumulative adjustment to correct our lease accounting practices. The adjustment of $1.3 million conforms the lease term used in calculating straight-line rent expense under certain leases that include fixed-rent escalations with the term used to amortize related leasehold improvements. As the correction of this error was not material to our current or prior year financial statements, we recorded the adjustment in our 2004 consolidated financial statements. See note 7 to our consolidated financial statements. We expect this correction to result in an increase of $0.3 million to rent expense in 2005. Restaurant Other Operating Expenses. Restaurant operating expenses, as a percentage of restaurant sales, decreased to 16.4% in 2004 from 17.0% in 2003. The decrease was primarily due to the percentage of sales benefit generated from comparable restaurant sales growth of approximately 0.4%, along with a cumulative adjustment to our expected redemption value for deferred gift cards (0.5% as a percentage of sales). We began selling gift cards in 2000, and prior to 2004, did not have enough history related to the redemption of gift cards to appropriately estimate a breakage rate (the percentage of gift cards that we estimate will never be redeemed). Our policy is to record a 5% breakage estimate for each gift card that is sold with the estimate amortized over 3 years. The change in estimate resulted in an adjustment of $1.7 million (0.5% as a percentage of sales). We will review and update the breakage estimates quarterly and expect to record additional breakage amounts for the full year of 2005 of $0.5 million to $0.8 million depending upon the number of gift cards sold in 2005 and our historical redemption rates. These decreases were offset by a $1.0 million (0.3% as a percentage of sales) increase in general liability insurance expense due to changes in our claim development history based on our fourth quarter actuarial analysis. Restaurant Pre-opening Expenses. Pre-opening expenses in 2004 increased to $5.2 million from $2.6 million in 2003. This increase was due to 19 restaurants which opened in 2004 compared with 10 restaurants which opened in 2003. Depreciation and Amortization Expenses. D&A, as a percentage of revenue, remained unchanged at 3.0% in 2004 from 2003. The percentage of sales benefit generated from comparable restaurant sales growth offset increases related to capital spending on new restaurants. General and Administrative Expenses. G&A increased in 2004 to $21.1 million (5.8% of revenue) from $17.7 million (6.2% of revenue) in 2003. This increase was primarily due to infrastructure additions including management, supervisory, operational and training personnel put into place to accommodate our growth plans. Interest Expense, Net. Interest expense increased to $4.7 million in 2004 from $4.4 million in 2003. Interest expense included write-offs of loan fees related to the completion in 2003 and subsequent disposition in 2004 of our July 2003 $100 million credit facility in the amount of $0.3 million and $1.0 million in 2003 and 2004, respectively. Excluding these charges, interest expense decreased by $0.4 million, or 10.0%, from 2003 to 2004 due to a significant reduction in long term debt combined with lower interest rates effective July 2003. Minority Interest. The minority interest deducted from income in 2004 decreased to $5.3 million from $6.7 million in 2003. The decrease was due to the acquisition of 31 restaurants in connection with the closing of our corporate reorganization and initial public offering on October 8, 2004. Subsequent
27
to October 8, 2004, minority interest includes three majority-owned restaurants, two of which were open and operating at December 28, 2004. Equity Income from Unconsolidated Affiliates. In 2004, we reported income of $110,000 from thirteen unconsolidated affiliates (including one affiliate which had not yet begun operations as of December 28, 2004) compared to losses of $61,000 for seven unconsolidated affiliates reported in 2003. This increase was due to seven franchise restaurants which were opened in 2003. Primarily due to pre-opening expenses, new restaurants take three to six months to become profitable; hence, these new restaurants produced net losses in 2003. Income Taxes. Until October 8, 2004, we operated as a limited liability company and were taxed as a partnership. Accordingly, we paid no significant income taxes on our own behalf and there is no provision for income taxes prior to October 8, 2004 in our consolidated financial statements. As a result of our conversion from a limited liability company to a "C" Corporation, deferred tax liabilities of $5.0 million were recognized in the fourth quarter of 2004. In connection with the closing of our corporate reorganization and initial public offering, we became a "C" corporation subject to federal and state income taxes. We account for income taxes in accordance with SFAS No. 109,Accounting for Income Taxes. Our effective tax rate for October 8, 2004 to December 28, 2004 is 33.6%, and we had income tax expense of $2.2 million for 2004, excluding the $5.0 million deferred tax charge discussed above. Year Ended December 30, 2003 Compared to December 31, 2002 Restaurant Sales. Restaurant sales increased by 23.3% in 2003 as compared to 2002. The increase in 2003 was primarily attributable to the opening of new restaurants. The following table summarizes additional factors that influenced the changes in restaurant sales at company restaurants for 2003 and 2002.
2003
2002
Company restaurants Store weeks 4,234 3,528 Comparable restaurant sales growth 3.4% 3.7 % Average unit volumes (in thousands) $ 3,401 $ 3,270

Franchise Royalties and Fees. Franchise royalties and fees increased by $0.9 million, or by 14.0%, in 2003 as compared to 2002. This increase was primarily attributable to the opening of new franchise restaurants. Franchise restaurant count activity is shown in the restaurant unit activity table. Restaurant Cost of Sales. Restaurant cost of sales increased slightly as a percentage of restaurant sales to 32.9% in 2003 from 32.8% in 2002. This increase was primarily due to the higher cost of pork ribs. Restaurant Labor Expenses. Restaurant labor expenses, as a percentage of restaurant sales, decreased from 28.4% in 2002 to 27.9% in 2003. The percentage of sales benefit generated from comparable sales growth more than offset modest wage rate inflation. Restaurant Rent Expense. Restaurant rent expense, as a percentage of restaurant sales, decreased to 2.1% in 2003 from 2.3% in 2002. During 2002 and 2003, a higher percentage of our restaurants, versus what we have done historically, were developed on owned versus leased properties. Restaurant Other Operating Expenses. Restaurant other operating expenses increased as a percentage of restaurant sales to 17.0% in 2003 from 16.0% in 2002. Increased spending on equipment
28
leases, supplies, and repair and maintenance combined with inflation in utilities, particularly natural gas, were the primary drivers of this increase. Restaurant Pre-Opening Expenses. Restaurant pre-opening expenses in 2003 decreased to $2.6 million from $4.8 million in 2002. This decrease was due to the opening of fewer restaurants in 2003 as compared to 2002. Depreciation and Amortization Expenses. D&A, as a percentage of revenue, remained constant at 3.0% for 2003 as compared to 2002. General and Administrative Expenses. G&A increased in 2003 to $17.7 million (6.2% of revenue) from $14.6 million (6.3% of revenue) in 2002. The cost increase was primarily due to infrastructure additions including executive, supervisory, operational, systems, and training personnel put into place during the 2003 and 2002 fiscal years to accommodate our growth plans. Interest Expense, Net. Interest expense increased slightly in 2003 to $4.4 million from $4.2 million in 2002. In July 2003 we completed a $100.0 million, three year credit facility that enabled us to refinance 80.0% of our existing debt at much lower rates of interest and provide us with roughly $50.0 million of available financing to fund the development of new restaurants. Interest expense included the write-off of approximately $0.3 million of loan fees related to the refinanced debt. This increase was partially offset by a reduction in interest rates on approximately $47.6 million of the refinanced debt. We have been able to borrow at steadily decreasing interest rates due both to the favorable interest environment and to our steadily improving earnings and resulting creditworthiness. The weighted average interest rate for our installment loans decreased from 5.88% at December 31, 2002 to 4.59% at December 30, 2003. Minority Interest. The minority interest deducted from income in 2003 increased to $6.7 million from $5.2 million in 2002. The increase was primarily due to an increase in majority-owned restaurant store weeks resulting from the addition of seven majority-owned or controlled restaurants which opened in 2002. Equity Income from Unconsolidated Affiliates. In 2003, we reported a loss of $61,000 from unconsolidated affiliates compared to income of $21,000 reported in 2002. In 2003, seven franchise restaurants opened in which we owned either a 5.0% or 10.0% interest. Primarily due to pre-opening expenses, new restaurants take three to six months to become profitable; hence, these new restaurants produced net losses in 2003. Liquidity and Capital Resources The following table presents a summary of our net cash provided by (used in) operating, investing and financing activities:
Fiscal Year
2004
2003
2002
Net cash provided by operating activities $ 57,275 $ 42,158 $ 31,718 Net cash used in investing activities (49,735) (26,524) (32,764)Net cash provided by (used in) financing activities 32,967 (17,722) 4,945
Net increase (decrease) in cash $ 40,507 $ (2,088) $ 3,899
Our operations have not required significant working capital and, like many restaurant companies, we have been able to operate with negative working capital. Sales are primarily for cash, and restaurant operations do not require significant inventories or receivables. In addition, we receive trade credit for
29
the purchase of food, beverages and supplies, thereby reducing the need for incremental working capital to support growth. We require capital principally for the development of new company restaurants and the refurbishment of existing restaurants. Capital expenditures totaled approximately $50.0 million, $26.9 million and $34.7 million for the years ended December 28, 2004, December 30, 2003 and December 31, 2002, respectively. We either lease our restaurant site locations under operating leases for periods of five to 30 years (including renewal periods) or purchase the land where it is cost effective. As of December 28, 2004, there were 53 restaurants developed on land which we owned. We have also required cash to pay distributions to our equity holders. Our predecessor companies paid aggregate distributions to their equity holders in 2004, 2003 and 2002 of $22.7 million, $21.7 million and $13.9 million, respectively. We will make a distribution of $31.2 million to members of our predecessor company, Texas Roadhouse Holdings LLC, in redemption of its preferred shares related to its income for periods through October 8, 2004. This distribution is shown on the accompanying consolidated balance sheet as distributions payable and will be paid in the second quarter of 2005. We intend to retain our future earnings, if any, to finance the future development and operation of our business. Accordingly, we do not anticipate paying any dividends on our common stock in the foreseeable future. In 2004, we used cash on hand, borrowings under our credit facility and net cash provided by operating activities to fund capital expenditures and distributions. On October 8, 2004, we entered into a new $150.0 million, five-year revolving credit facility with a syndicate of commercial lenders led by Bank of America,

N.A., Banc of America Securities LLC and National City Bank of Kentucky. The new facility replaced the previous credit facility. The terms of the new facility will require us to pay interest on outstanding borrowings at LIBOR plus a margin of 0.75% to 1.50% and to pay a commitment fee of 0.15% to 0.25% per year on any unused portion of the facility, in both cases depending on our leverage ratio. The facility prohibits us from incurring additional debt outside the facility with certain exceptions, including equipment financing up to $3.0 million, unsecured debt up to $500,000 and up to $20.0 million of debt incurred by majority-owned companies formed to open new restaurants. The facility also prohibits the declaration or payment of cash dividends on our stock and requires W. Kent Taylor to maintain beneficial ownership of at least 20% of the voting power of our stock. Additionally, the lenders' obligations to extend credit under the facility depends upon maintaining certain financial covenants, including a minimum fixed charge coverage ratio of 1.50 to 1.00 and a maximum consolidated leverage ratio of 3.00 to 1.00. We are currently in compliance with such covenants. The credit facility is secured by a pledge of our ownership interests in all our subsidiaries. At December 28, 2004, we had $6.0 million of borrowings outstanding under our credit facility and $141.7 million of availability net of $2.3 million of outstanding letters of credit. In addition, we had various other notes payable totaling $7.3 million with interest rates ranging from 3.1% to 10.8%. Each of these notes relate to the financing of specific restaurants. Our total weighted average effective interest rate at December 28, 2004 was 6.4%. At December 30, 2003, we had $50.2 million of borrowings outstanding under our credit facility and $47.0 million of availability net of $1.4 million of outstanding letters of credit. In addition, we had various other notes payable totaling $14.1 million with interest rates ranging from 4.2% to 10.8%. Each of these notes related to the financing of specific restaurants. Our total weighted average effective interest rate for 2003 was 4.6%. In 2003, we entered into a fixed rate swap agreement for $31.2 million of the outstanding debt under our previous credit facility to limit the variability of a portion of our interest payments. This
30
swap changes the variable-rate cash flow exposure on the debt obligations to fixed cash flows. Under the terms of this interest rate swap, we receive variable interest rate payments and make fixed interest rate payments, thereby creating the equivalent of fixed-rate debt. As of December 28, 2004 and December 30, 2003, approximately ($0.1) million and $0.2 million, respectively, of unrealized (gain)/loss on the swap was recorded in accumulated other comprehensive income. Our future capital requirements will primarily depend on the number of new restaurants we open and the timing of those openings within a given fiscal year. These requirements will include costs directly related to opening new restaurants and may also include costs necessary to ensure that our infrastructure is able to support a larger restaurant base. In 2005, we expect our capital expenditures to be approximately $50.0 million to $60.0 million, substantially all of which will relate to planned restaurant openings. We intend to satisfy our capital requirements over the next 18 months with cash on hand, net cash provided by operating activities and funds available under our credit facility. Contractual Obligations The following table summarizes the amount of payments due under specified contractual obligations as of December 28, 2004:
Payments Due by Period
Total
Less than 1 year
1-3 Years
3-5 Years
More than 5 years
(in thousands)
Long-term debt obligations $ 13,285 $ 525 $ 1,045 $ 7,052 $ 4,663Capital lease obligations 1,450 293 337 234 586Operating lease obligations 100,137 9,698 16,806 14,135 59,498Capital obligations 29,961 29,961 — — —
Total contractual obligations $ 144,833 $ 40,477 $ 18,188 $ 21,421 $ 64,747
The Company has no material minimum purchase commitments with its vendors that extend beyond a year. See notes 4 and 9 to the consolidated financial statements for details of contractual obligations. Off-Balance Sheet Arrangements Except for operating leases (primarily restaurant leases), we do not have any off-balance sheet arrangements. Guarantees We entered into real estate lease agreements for franchise restaurants located in Everett, MA and Longmont, CO prior to our granting franchise rights for those restaurants. We have subsequently assigned the leases to the franchisees, but we remain contingently liable if a franchisee defaults under the terms of a lease. The Longmont lease expires in May 2014 and the Everett lease expires in February 2018. Recent Accounting Pronouncements See note 2 in the accompanying consolidated financial statements. Critical Accounting Policies and Estimates The above discussion and analysis of our financial condition and results of operations are based upon our consolidated financial statements, which have been prepared in accordance with U.S.
31
generally accepted accounting principles. The preparation of these financial statements requires us to make estimates and judgments that affect the reported amounts of assets, liabilities, revenue and expenses, and disclosures of contingent assets and liabilities. Our significant accounting policies are described in note 2 to the accompanying consolidated financial statements. Critical accounting policies are those that we believe are most important to portraying our financial condition and results of operations and also require the greatest amount of subjective or complex judgments by management. Judgments or uncertainties regarding the application of these policies may result in materially different amounts being reported under different conditions or using different assumptions. We consider the following policies to

be the most critical in understanding the judgments that are involved in preparing the consolidated financial statements. Impairment of Long-Lived Assets. We evaluate the carrying value of individual restaurants for impairment annually or when events or circumstances indicate these assets might be impaired. In making these judgments, we consider the period of time since the restaurant was opened and the trend of operations and expectations for future sales growth. For a restaurant selected for review, we estimate the future undiscounted cash flows from operating the restaurant over its estimated useful life. In determining future cash flows, significant estimates are made by us with respect to future operating results of each restaurant. Our judgments and estimates related to the expected useful lives of long-lived assets are affected by factors such as changes in economic conditions and changes in operating performance. As we assess the ongoing expected cash flows and carrying amounts of our long-lived assets, these factors could cause us to realize a material impairment charge. If assets are determined to be impaired, we would measure the impairment charge by calculating the amount by which the asset carrying amount exceeds its fair value. The determination of asset fair value is also subject to significant judgment. If these assumptions change in the future, we may be required to record impairment charges for these assets. In our impairment evaluations for 2004, 2003 and 2002, we concluded that no impairment charge was necessary. Additionally, in our most recent impairment analysis for long-lived assets, no additional impairment charge would have resulted even if there were a permanent 10.0% reduction in revenue in our restaurants. Goodwill. The implied fair value of goodwill is determined by allocating the fair value of the reporting unit, which we consider to be at the restaurant level, in a manner similar to a purchase price allocation, in accordance with Statement of Financial Accounting Standards ("SFAS") No. 141,Business Combinations. The residual fair value after this allocation is the implied fair value of the reporting unit goodwill. Goodwill is tested annually for impairment, and is tested for impairment more frequently if events and circumstances indicate that the asset might be impaired. An impairment loss is recognized to the extent that the carrying amount exceeds the implied fair value of goodwill. The determination of impairment consists of two steps. First, we determine the fair value of the reporting unit and compare it to its carrying amount. Fair value is determined based on discounted cash flows. Second, if the carrying amount of the reporting unit exceeds its fair value, an impairment loss is recognized for any excess of the carrying amount of the reporting unit's goodwill over the implied fair value of the goodwill. The most significant assumptions we use in this analysis are those made in estimating future cash flows. In estimating future cash flows, we use the assumptions from our strategic plan for items such as sales growth and operating costs. If our assumptions used in performing the impairment test prove inaccurate, the fair value of the restaurants may ultimately prove to be significantly lower, thereby causing the carrying value to exceed the fair value and indicating impairment has occurred. We concluded that no impairment charge was required for the years ended December 28, 2004, December 30, 2003 and December 31, 2002.
32
Insurance Reserves. We self-insure a significant portion of expected losses under our workers compensation, general liability and property insurance programs. We purchase insurance for individual claims that exceed the amounts listed below:
Workers Compensation $ 250,000General Liability $ 100,000Property $ 50,000
We record a liability for all unresolved claims and for an estimate of incurred but not reported claims at the anticipated cost to us based on estimates provided by a third party administrator and actuary. Our estimated liability is based on a number of assumptions and factors regarding economic conditions, the frequency and severity of claims and claim development history and settlement practices. Estimates of claims reserves are discounted using a discount rate of approximately 3.0% at December 28, 2004 resulting in a discount of $0.2 million. An increase or decrease in the discount rate of 100 basis points would change the reserve, and resulting expense, by an immaterial amount. Because we began our self-insurance program in 2002, we rely on actuarial observations of historical claim development for the industry which we believe is representative of our history. In the future, if our experience is significantly different than the industry, we will adjust our reserve, and our future self-insurance expenses may rise. Our assumptions are reviewed, monitored, and adjusted when warranted by changing circumstances. Income Taxes. In connection with our reorganization and initial public offering, we became a "C" Corporation subject to federal and state income taxes. We account for income taxes in accordance with SFAS No. 109,Accounting for Income Taxes, under which deferred assets and liabilities are recognized based upon anticipated future tax consequences attributable to differences between financial statement carrying values of assets and liabilities and their respective tax bases. A valuation allowance is established to reduce the carrying value of deferred tax assets if it is considered more likely than not that such assets will not be realized. Any change in the valuation allowance would be charged to income in the period such determination was made. Prior to converting to a "C" corporation on October 8, 2004, the Company operated as a limited liability company and was taxed as a partnership. As such, the Company's income or losses were passed through to its owners who are liable for any related income taxes. Effects of Inflation We do not believe inflation has had a significant effect on our operations during the past several years. We generally have been able to substantially offset increases in our restaurant and operating costs resulting from inflation by altering our menu, increasing menu prices or making other adjustments. Forward-Looking Statements From time to time in annual reports and oral statements, and in this annual report on Form 10-K, we present statements about future events and expectations that constitute forward-looking statements within the meaning of Section 27A of the Securities Act of 1933, as amended, and Section 21E of the Securities Exchange Act of 1934, as amended. Forward-looking statements are based on our beliefs, assumptions and expectations of our future financial and operating performance and growth plans, taking into account the information currently available to us. These statements are not statements of historical fact. Forward-looking statements involve risks and uncertainties that may cause our actual results to differ materially from the expectations of future results we express or imply in any forward-
33
looking statements. Risks and uncertainties that could cause actual results to differ materially include, but are not limited to:
• our ability to raise capital in the future;
• our ability to successfully execute our growth strategy;

• our ability to successfully open new restaurants or acquire franchise restaurants;
• the continued service of key management personnel;
• health concerns about our food products;
• our ability to attract, motivate and retain qualified employees;
• the impact of federal, state or local government regulations relating to our employees or the sale of food and alcoholic beverages;
• the impact of litigation;
• the cost of our principal food products;
• labor shortages or increased labor costs;
• changes in consumer preferences and demographic trends;
• increasing competition in the casual dining segment of the restaurant industry;
• our ability to successfully expand into new markets;
• the rate of growth of general and administrative expenses associated with building a strengthened corporate infrastructure to support our growth initiatives;
• negative publicity regarding food safety and health concerns;
• our franchisees' adherence to our practices, policies and procedures;
• potential fluctuation in our quarterly operating results due to seasonality and other factors;
• supply and delivery shortages or interruptions;
• inadequate protection of our intellectual property;
• volatility of actuarially determined insurance losses and loss estimates;
• adoption of new, or changes in existing, accounting policies and practices;
• adverse weather conditions which impact guest traffic at our restaurants; and
•

adverse economic conditions. The words "believe," "may," "should," "anticipate," "estimate," "expect," "intend," "objective," "seek," "plan," "strive" or similar words, or the negatives of these words, identify forward-looking statements. We qualify any forward-looking statements entirely by these cautionary factors. Other risks, uncertainties and factors could cause our actual results to differ materially from those projected in any forward-looking statements we make. We assume no obligation to publicly update or revise these forward-looking statements for any reason, or to update the reasons actual results could differ materially from those anticipated in these forward-looking statements, even if new information becomes available in the future.
34
ITEM 7A—QUANTITATIVE AND QUALITATIVE DISCLOSURES OF MARKET RISK We are exposed to market risk from changes in interest rates on debt and changes in commodity prices. Our exposure to interest rate fluctuations is limited to our outstanding bank debt. At December 28, 2004, outstanding borrowings under our revolving line of credit bears interest at approximately 75 to 150 basis points (depending on our leverage ratios) over the London Interbank Offered Rate ("LIBOR"). The weighted average effective interest rate on the $6.0 million outstanding balance under this line at December 28, 2004 was 3.1%. In addition, we had various other notes payable totaling $7.3 million with interest rates ranging from 3.1% to 10.8%. In 2003, we entered into a fixed rate swap agreement to limit the variability of a portion of our interest payments. This swap changes the variable-rate cash flow exposure on the debt obligations to fixed cash flows. Under the terms of the interest rate swap, we receive variable interest rate payments and make fixed interest rate payments, thereby creating the equivalent of fixed-rate debt. The $7.3 million of notes payable outstanding are fixed rate notes. Hence, at December 28, 2004, the $6.0 million of our outstanding revolver was floating or variable. Should interest rates based on these borrowings increase by one percentage point, our estimated annual interest expense would not be affected due to our cash flow hedge which converts our variable rate debt to fixed rate debt. Many of the ingredients used in the products sold in our restaurants are commodities that are subject to unpredictable price volatility. Although we attempt to minimize the effect of price volatility by negotiating fixed price contracts for the supply of key ingredients, there are no established fixed price markets for certain commodities such as produce and cheese and we are subject to prevailing market conditions when purchasing those types of commodities. For commodities that are purchased under fixed price contracts, the prices are based on prevailing market prices at the time the contract is entered into and do not fluctuate during the contract period. We do not use financial instruments to hedge commodity prices because these purchase arrangements help control the ultimate cost paid. Extreme and/or long term increases in commodity prices could adversely affect our future results, especially if we are unable, primarily due to competitive reasons, to increase menu prices. Additionally, if there is a time lag between the increasing commodity prices and our ability to increase menu prices or, if we believe the commodity price increase to be short in duration and we choose not to pass on the cost increases, our short-term financial results could be negatively affected. We are subject to business risk as our beef supply is highly dependent upon four vendors. We currently purchase most of our beef from one of the largest beef suppliers in the country. If this vendor was unable to fulfill its obligations under its contracts, we may encounter supply shortages and incur higher costs to secure adequate supplies, any of which would harm our business. ITEM 8—FINANCIAL STATEMENTS AND SUPPLEMENTARY FINANCIAL DATA See Index to Consolidated Financial Statements at Item 15. ITEM 9—CHANGES IN AND DISAGREEMENTS WITH ACCOUNTANTS ON ACCOUNTING AND FINANCIAL DISCLOSURE None.
35
ITEM 9A—CONTROLS AND PROCEDURES As of December 28, 2004, an evaluation was performed under the supervision and with the participation of the Company's management, including the Chief Executive Officer ("CEO") and the Chief Financial Officer ("CFO"), of the effectiveness of the design and operation of the Company's disclosure controls and procedures. Based on that evaluation, the Company's management, including the CEO and CFO, concluded the Company's disclosure controls and procedures as of December 28, 2004 were effective in ensuring information required to be disclosed in this Annual Report on Form 10-K was recorded, processed, summarized and reported on a timely basis. There have been no changes in the Company's internal control over financial reporting that occurred during the quarterly period ended December 28, 2004 that have materially affected, or are reasonably likely to materially affect, the Company's internal control over financial reporting. ITEM 9B—OTHER INFORMATION None.
36
PART III ITEM 10—DIRECTORS AND EXECUTIVE OFFICERS OF THE REGISTRANT Incorporated by reference from the Company's Definitive Proxy Statement to be dated approximately April 18, 2005. ITEM 11—EXECUTIVE COMPENSATION Incorporated by reference from the Company's Definitive Proxy Statement to be dated approximately April 18, 2005. ITEM 12—SECURITY OWNERSHIP OF CERTAIN BENEFICIAL OWNERS AND MANAGEMENT AND RELATED SHAREHOLDER MATTERS Incorporated by reference from the Company's Definitive Proxy Statement to be dated approximately April 18, 2005. ITEM 13—CERTAIN RELATIONSHIPS AND RELATED TRANSACTIONS Incorporated by reference from the Company's Definitive Proxy Statement to be dated approximately April 18, 2005. ITEM 14—PRINCIPAL ACCOUNTING FEES AND SERVICES Incorporated by reference from the Company's Definitive Proxy Statement to be dated approximately April 18, 2005.
37

PART IV ITEM 15—EXHIBITS AND FINANCIAL STATEMENTS SCHEDULES (a)
1. Consolidated Financial Statements Description
Page Number in Report
Report of Independent Registered Public Accounting Firm F-1Consolidated Balance Sheets as of December 28, 2004 and December 30, 2003 F-2Consolidated Statements of Income for the years ended December 28, 2004, December 30, 2003 and December 31, 2002 F-3Consolidated Statements of Stockholders' Equity and Comprehensive Income for the years ended December 28, 2004, December 30, 2003 and December 31, 2002 F-4Consolidated Statements of Cash Flows for the years ended December 28, 2004, December 30, 2003 and December 31, 2002 F-5Notes to Consolidated Financial Statements F-62.
Financial Statement Schedules Omitted due to inapplicability or because required information is shown in the Company's Consolidated Financial Statements or notes thereto.3.
Exhibits Exhibit No.
Description
2.1
Master Transaction Agreement, dated as of May 7, 2004, among Registrant and others (incorporated by reference to Exhibit 4.1 to the Registration Statement on Form S-1 of Registrant (File No. 333-115259))
3.1
Form of Amended and Restated Certificate of Incorporation of Registrant (incorporated by reference to Exhibit 3.2 to the Registration Statement on Form S-1 of Registrant (File No. 333-115259))
3.2
Bylaws of the Registrant (incorporated by reference to Exhibit 3.3 to the Registration Statement on Form S-1 of Registrant (File No. 333-115259))
4.1
Registration Rights Agreement, dated as of May 7, 2004, among Registrant and others (incorporated by reference to Exhibit 4.3 to the Registration Statement on Form S-1 of Registrant (File No. 333-115259))
10.1
Credit Agreement dated as of October 8, 2004, among Texas Roadhouse, Inc., each lender from time to time party thereto, Bank of America, N.A., as Administrative Agent, Swing Line Lender and L/C Issuer, and National City Bank of Kentucky, as Syndication Agent (incorporated by reference to Exhibit 10.1 of the Registrant's Quarterly Report on Form 10-Q for the quarter ended September 28, 2004) (File No. 000-50972))
10.2*
Employment Agreement between Registrant and G.J. Hart (incorporated by reference to Exhibit 10.2 of the Registrant's Quarterly Report on Form 10-Q for the quarter ended September 28, 2004) (File No. 000-50972))
10.3*
Employment Agreement between Registrant and Scott M. Colosi (incorporated by reference to Exhibit 10.3 of the Registrant's Quarterly Report on Form 10-Q for the quarter ended September 28, 2004) (File No. 000-50972))
38
10.4*
Employment Agreement between Registrant and Steven L. Ortiz (incorporated by reference to Exhibit 10.4 of the Registrant's Quarterly Report on Form 10-Q for the quarter ended September 28, 2004) (File No. 000-50972))
10.5*
Employment Agreement between Registrant and W. Kent Taylor (incorporated by reference to Exhibit 10.5 of the Registrant's Quarterly Report on Form 10-Q for the quarter ended September 28, 2004) (File No. 000-50972))
10.6*
Employment Agreement between Registrant and Sheila C. Brown (incorporated by reference to Exhibit 10.6 of the Registrant's Quarterly Report on Form 10-Q for the quarter ended September 28, 2004) (File No. 000-50972))

10.7*
Texas Roadhouse, Inc. 2004 Equity Incentive Plan (incorporated by reference to Exhibit 4.1 to the Registration Statement on Form S-8 of Registrant (File No. 333-121241))
10.8
Amended and Restated Office Lease Agreement (One Paragon Centre), dated as of August 15, 2003, by and between Paragon Centre Associates, LLC and Texas Roadhouse Holdings LLC, as amended (incorporated by reference to Exhibit 10.1 to the Registration Statement on Form S-1 of Registrant (File No. 333-115259))
10.9
Amended and Restated Office Lease Agreement (Two Paragon Centre), dated as of August 15, 2003, by and between Paragon Centre Associates, LLC and Texas Roadhouse Holdings LLC, as amended (incorporated by reference to Exhibit 10.2 to the Registration Statement on Form S-1 of Registrant (File No. 333-115259))
10.10
Form of Director and Executive Officer Indemnification Agreement (incorporated by reference to Exhibit 10.9 to the Registration Statement on Form S-1 of Registrant (File No. 333-115259))
10.11
Form of Limited Partnership Agreement and Operating Agreement for company-managed Texas Roadhouse restaurants, including schedule of the owners of such restaurants and the interests held by directors, executive officers and 5% stockholders who are parties to such an agreement (incorporated by reference to Exhibit 10.10 to the Registration Statement on Form S-1 of Registrant (File No. 333-115259))
10.12
Lease Agreement dated as of April 1, 1997, by and between Texas Roadhouse of Elizabethtown, LLC and Texas Roadhouse Holdings LLC (incorporated by reference to Exhibit 10.12 to the Registration Statement on Form S-1 of Registrant (File No. 333-115259))
39
10.13
Lease Agreement dated as of November 1999, by and between TEAS II, LLC and Texas Roadhouse Holdings LLC (incorporated by reference to Exhibit 10.13 to the Registration Statement on Form S-1 of Registrant (File No. 333-115259))
10.14
Form of Franchise Agreement and Preliminary Agreement for a Texas Roadhouse Restaurant Franchise, including schedule of directors, executive officers and 5% stockholders which have entered into either agreement (incorporated by reference to Exhibit 10.14 to the Registration Statement on Form S-1 of Registrant (File No. 333-115259))
10.15
Updated schedule as of December 28, 2004 of the owners of company-managed Texas Roadhouse restaurants and the interests held by directors, executive officers and 5% stockholders who are parties to Limited Partnership Agreements and Operating Agreements as set forth at Exhibit 10.11 of this Form 10-K
10.16
Updated schedule as of December 28, 2004 of the directors, executive officers and 5% stockholders which have entered into Franchise Agreements or Preliminary Agreements for a Texas Roadhouse Franchise as set forth at Exhibit 10.14 of this Form 10-K
10.17
Second Amendment to Lease and Third Amendment to Lease (Two Paragon Centre), dated September 21, 2004 and February 18, 2005 respectively, between Paragon Centre Holdings, LLC and Texas Roadhouse Holdings LLC
10.18*
First Amendment to Employment Agreement between Registrant and Sheila C. Brown dated March 3, 2005
10.19*
Information concerning the potential bonuses to be paid to each of the named executive officers under the Registrant's bonus incentive program for fiscal 2005 (incorporated by reference to the Registrant's Current Report on Form 8-K dated February 25, 2005 (File No. 000-50972))
21.1
List of Subsidiaries (incorporated by reference to Exhibit 21.1 to the Registration Statement on Form S-1 of Registrant (File No. 333-115259))
23.1

Consent of KMPG LLP, Independent Registered Public Accounting Firm 31.1
Certifications of Chief Executive Officer pursuant to Section 302 of the Sarbanes-Oxley Act of 2002
31.2
Certifications of Chief Financial Officer pursuant to Section 302 of the Sarbanes-Oxley Act of 2002
32.1
Certifications of Chief Executive Officer pursuant to 18 U.S.C. Section 1350, as adopted pursuant to Section 906 of the Sarbanes-Oxley Act of 2002
32.2
Certifications of Chief Financial Officer pursuant to 18 U.S.C. Section 1350, as adopted pursuant to Section 906 of the Sarbanes-Oxley Act of 2002
* Management contract or compensatory plan or arrangement required to be filed as an exhibit to Form 10-K.
40
SIGNATURES Pursuant to the requirements of Section 13 or 15(d) of the Securities Exchange Act of 1934, as amended, the registrant has duly caused this report to be signed on its behalf by the undersigned, thereunto duly authorized. TEXAS ROADHOUSE, INC.
By:
/s/ G. J. HART
G. J. HART President, Chief Executive Officer Date: March 25, 2005
Pursuant to the requirements of the Securities Exchange Act of 1934, as amended, this Annual Report has been signed below by the following persons on behalf of the registrant and in the capacities and on the dates indicated.
Signature
Title
Date
/s/ W. KENT TAYLOR
W. Kent Taylor Chairman of the Company, Director March 25, 2005
/s/ G. J. HART
G. J. HART
President, Chief Executive Officer (Principal Executive Officer)
March 25, 2005
/s/ SCOTT M. COLOSI
Scott M. Colosi
Chief Financial Officer (Principal Financial Officer)
March 25, 2005
/s/ TONYA R. ROBINSON
Tonya R. Robinson
Controller (Principal Accounting Officer)
March 25, 2005
/s/ MARTIN T. HART
Martin T. Hart
Director
March 25, 2005
/s/ JAMES F. PARKER
James F. Parker
Director
March 25, 2005
/s/ JAMES R. RAMSEY
James R. Ramsey
Director
March 25, 2005
/s/ JAMES R. ZARLEY
James R. Zarley
Director
March 25, 2005

41
REPORT OF INDEPENDENT REGISTERED PUBLIC ACCOUNTING FIRM The Board of Directors and Stockholders Texas Roadhouse, Inc.: We have audited the accompanying consolidated balance sheets of Texas Roadhouse, Inc. and subsidiaries (the Company) as of December 28, 2004 and December 30, 2003, and the related consolidated statements of income, stockholders' equity and comprehensive income and cash flows for each of the years in the three-year period ended December 28, 2004. These consolidated financial statements are the responsibility of the Company's management. Our responsibility is to express an opinion on these consolidated financial statements based on our audits. We conducted our audits in accordance with the standards of the Public Company Accounting Oversight Board (United States). Those standards require that we plan and perform the audit to obtain reasonable assurance about whether the financial statements are free of material misstatement. An audit includes examining, on a test basis, evidence supporting the amounts and disclosures in the financial statements. An audit also includes assessing the accounting principles used and significant estimates made by management, as well as evaluating the overall financial statement presentation. We believe that our audits provide a reasonable basis for our opinion. In our opinion, the consolidated financial statements referred to above present fairly, in all material respects, the financial position of Texas Roadhouse, Inc. and subsidiaries as of December 28, 2004 and December 30, 2003, and the results of their operations and their cash flows for each of the years in the three-year period ended December 28, 2004, in conformity with U.S. generally accepted accounting principles. /s/ KPMG LLP Louisville, Kentucky March 23, 2005
F-1
Texas Roadhouse, Inc. and Subsidiaries
Consolidated Balance Sheets
(in thousands, except share and per share data)
December 28, 2004
December 30, 2003
Assets Current assets: Cash and cash equivalents $ 46,235 $ 5,728
Receivables, net of allowance for doubtful accounts of $24 and $18 in 2004 and 2003, respectively 6,139 10,473
Inventories 5,169 3,505 Prepaid expenses 2,652 1,232 Deferred tax asset 1,308 — Other current assets 144 36
Total current assets 61,647 20,974
Property and equipment, net 162,991 123,051 Goodwill 50,753 2,190 Other assets 1,272 1,978
Total assets $ 276,663 $ 148,193
Liabilities and Stockholders' Equity
Current liabilities: Distributions payable $ 31,176 $ — Current maturities of long-term debt 525 8,059 Current maturities of obligations under capital leases 198 221 Accounts payable 12,093 11,570 Deferred revenue—gift certificates 14,676 10,885 Accrued wages 7,285 4,182 Accrued taxes and licenses 4,818 3,546 Other accrued liabilities 2,361 2,110
Total current liabilities 73,132 40,573
Long-term debt, excluding current maturities 12,760 56,254 Obligations under capital leases, excluding current maturities 771 914 Stock option deposits 2,617 2,455 Deferred rent 3,781 1,405 Deferred tax liability 5,909 — Other liabilities 3,783 3,005
Total liabilities 102,753 104,606 Minority interest in consolidated subsidiaries 699 5,685 Stockholders' equity Preferred stock ($0.001 par value, 1,000,000 shares authorized; no shares outstanding or — —

issued)
Common stock, Class A, ($0.001 par value, 100,000,000 shares authorized, 30,928,340 shares issued and outstanding) 31 19
Common stock, Class B, ($0.001 par value, 8,000,000 shares authorized, 2,632,688 shares issued and outstanding) 3 —
Additional paid in capital 173,654 17,676 Retained (deficit) earnings (584) 20,372 Accumulated other comprehensive income (loss) 107 (165)
Total stockholders' equity 173,211 37,902
Total liabilities and stockholders' equity $ 276,663 $ 148,193
See accompanying notes to consolidated financial statements.
F-2
Texas Roadhouse, Inc. and Subsidiaries
Consolidated Statements of Income
(in thousands, except per share data)
Fiscal Year Ended
December 28, 2004
December 30, 2003
December 31, 2002
Revenue: Restaurant sales $ 354,190 $ 279,519 $ 226,756 Franchise royalties and fees 8,821 6,934 6,080
Total revenue 363,011 286,453 232,836
Costs and expenses: Restaurant operating costs: Cost of sales 123,531 91,904 74,351 Labor 97,196 78,070 64,506 Rent 8,261 6,005 5,125 Other operating 58,044 47,382 36,237 Pre-opening 5,237 2,571 4,808 Depreciation and amortization 11,005 8,562 6,876 General and administrative 21,055 17,701 14,621
Total costs and expenses 324,329 252,195 206,524
Income from operations 38,682 34,258 26,312Interest expense, net 4,654 4,350 4,212Minority interest 5,278 6,704 5,168Equity income (loss) from investments in unconsolidated affiliates 110 (61) 21
Income before taxes $ 28,860 $ 23,143 $ 16,953Provision for income taxes 7,159 — —
Net income $ 21,701 $ 23,143 $ 16,953
Pro forma data (unaudited): Historical net income $ 21,701 $ 23,143 $ 16,953 Pro forma provision for income taxes 7,869 8,379 6,041
Net income adjusted for pro forma provision for income taxes $ 13,832 $ 14,764 $ 10,912
Net income adjusted for pro forma provision for income taxes per common share: Basic $ 0.53 $ 0.63 $ 0.47
Diluted $ 0.49 $ 0.60 $ 0.44
Pro forma weighted average shares outstanding: Basic 25,945 23,440 23,334
Diluted 28,257 24,772 24,688
See accompanying notes to consolidated financial statements.
F-3
Texas Roadhouse, Inc. and Subsidiaries
Consolidated Statements of Stockholders' Equity and Comprehensive Income

($ in thousands)
Class A
Class B
Shares
Par Value
Shares
Par Value
Paid in Capital
Note Receivable— Stockholders
Retained Earnings (Deficit)
Accumulated Other
Comprehensive Income (Loss)
Total
Balance, December 30, 2001 17,951,202 $ 18 — $ — $ 13,295 $ (109) $ 3,325 $ 6 $ 16,535 Net income — — — — — — 16,953 — 16,953 Shares issued under stock option plan 225,086 — — — 342 — — — 342 Distributions to members — — — — — — (8,265) — (8,265)Capital contribution by majority stockholder 4,750 — — — 300 — — — 300 Noncash compensation expense — — — — 988 — — — 988 Minority interest liquidation adjustments — — — — 33 — — — 33 Repayment of note receivable—stockholders — — — — — 101 — — 101
Balance, December 31, 2002 18,181,038 $ 18 — $ — $ 14,958 $ (8) $ 12,013 $ 6 $ 26,987
Comprehensive income: Unrealized loss on derivative — $ — — — $ — $ — $ — $ (165) $ (165)
Unrealized loss on available-for-sale securities — — — — — — — (6) (6)
Net income — — — — — — 23,143 — 23,143
Total comprehensive income 22,972
Shares issued under stock option plan 437,175 1 — — 1,428 — — — 1,429 Distributions to members — — — — — — (14,784) — (14,784)Noncash compensation expense — — — — 1,070 — — — 1,070 Minority interest liquidation adjustments — — — — 220 — — — 220 Repayment of note receivable stockholders — — — — — 8 — — 8
Balance, December 30, 2003 18,618,213 $ 19 — $ — $ 17,676 $ — $ 20,372 $ (165) $ 37,902
Comprehensive income:
Unrealized gain on derivative, net of tax — $ — — — $ — $ — $ — $ 272 $ 272
Net income — — — — — — 21,701 — 21,701
Total comprehensive income 21,973
Shares issued under stock option plan 252,047 — — — 1,144 — — — 1,144 Distribution to members — — — — (5,325) — (42,657) (47,982)Noncash compensation expense — — — — 931 — — — 931 Minority interest liquidation adjustments — — — — 85 — — — 85 Issuance of Class A Common Stock in initial public offering 6,581,481 7 — — 115,169 — — — 115,176 Issuance of Class A Common Stock in acquisition 3,089,080 3 — — 54,056 — — — 54,059 Issuance of Class B Common Stock for the acquisition of WKT Restaurant Corp. — — 2,632,688 3 — — — — 3 Initial public offering expenses — — — — (10,082) — — — (10,082)Merger of entities under common control 2,387,519 2 — — — — — — 2
Balance, December 28, 2004 30,928,340 $ 31 2,632,688 $ 3 $ 173,654 $ — $ (584) $ 107 $ 173,211
See accompanying notes to consolidated financial statements.
F-4
Texas Roadhouse, Inc. and Subsidiaries
Consolidated Statements of Cash Flows
(in thousands)
Fiscal Year Ended
December 28, 2004
December 30, 2003
December 31, 2002
Cash flows from operating activities: Net income $ 21,701 $ 23,143 $ 16,953 Adjustments to reconcile net income to net cash provided by operating activities: Depreciation and amortization 11,005 8,562 6,876 Loss on disposal of assets 91 121 58 Noncash compensation expense 931 1,070 988 Write-off of debt issuance costs 998 308 — Minority interest 5,278 6,704 5,168 Equity (income) loss from investments in unconsolidated affiliates (110) 61 (21) Distributions received from investments in unconsolidated affiliates 137 46 22 Provision for doubtful accounts 5 100 190 Deferred tax expense 4,533 — — Changes in operating working capital:

Receivables 4,329 (6,315) (824) Inventories (1,647) (1,718) (854) Prepaid expenses and other current assets (1,420) 264 (599) Other assets 291 178 67 Accounts payable 693 4,189 (3,334) Deferred revenue—gift certificates 3,674 3,521 2,663 Accrued wages 3,013 (793) 2,723 Accrued taxes and licenses 1,340 514 (447) Accrued other liabilities (69) 549 1,516 Deferred rent 1,559 223 301 Other liabilities 943 1,431 272
Net cash provided by operating activities 57,275 42,158 31,718
Cash flows from investing activities: Capital expenditures—property and equipment (49,985) (26,882) (34,696) Proceeds from sale-leaseback transactions — — 1,992 Proceeds from sale of property and equipment 47 358 — Acquisition of cash from stock acquisition of franchise restaurant 203 — — Payment for additional ownership interest in joint venture — — (60)
Net cash used in investing activities (49,735) (26,524) (32,764)
Cash flows from financing activities: Repayments of note payable to bank — — (5,048) Proceeds from issuance of long-term debt 24,562 59,130 38,512 Proceeds from minority interest contributions and other 997 — 1,476 Repayment of stock option deposits (281) (263) (98) Proceeds from stock option deposits 547 958 674 Principal payments on long-term debt (75,591) (55,082) (17,126) Proceeds from repayment of notes receivable—stockholders — 8 101 Principal payments on capital lease obligations (166) (246) (255) Proceeds from capital contributions by majority stockholder — — 300 Payments for debt issuance costs (559) (1,673) (38) Proceeds from exercise of stock options 1,040 1,099 341 Proceeds from initial public offering, net of offering costs 105,094 — — Distributions to minority interest holders (5,870) (6,869) (5,629) Distributions to members (16,806) (14,784) (8,265)
Net cash provided by (used in) financing activities 32,967 (17,722) 4,945
Net increase (decrease) in cash 40,507 (2,088) 3,899 Cash and cash equivalents—beginning of year 5,728 7,816 3,917
Cash and cash equivalents—end of year $ 46,235 $ 5,728 $ 7,816
Supplemental disclosures of cash flow information: Interest, net of amounts capitalized $ 3,523 $ 3,426 $ 3,631 Income taxes $ 2,014 $ — $ — Supplemental schedule of noncash financing activities: Accrual of distribution to members $ 31,176 $ — $ — Stock acquisition of franchise restaurant $ 2,329 $ — $ —
See accompanying notes to consolidated financial statements.
F-5
Texas Roadhouse, Inc. and Subsidiaries
Notes to Consolidated Financial Statements
(Tabular amounts in thousands, except share and per share data) (1) Description of Business The accompanying consolidated financial statements as of December 28, 2004 include the accounts of Texas Roadhouse, Inc. (the "Company"), and its wholly-owned subsidiaries, Texas Roadhouse Holdings LLC ("Holdings"), Texas Roadhouse Development Corporation ("TRDC"), and Texas Roadhouse Management Corp. The Company and its wholly-owned subsidiaries operate Texas Roadhouse restaurants. Holdings also provides supervisory and administrative services for certain other license and franchise restaurants. TRDC sells franchise rights and collects the franchise royalties and fees. Texas Roadhouse Management Corp. provides management services to Holdings, TRDC and certain other license and franchise restaurants. Prior to October 8, 2004, the combined financial statements included the accounts of Holdings and its wholly-owned and majority-owned subsidiaries, TRDC, WKT Restaurant Corporation ("WKT"), Texas Roadhouse Management Corp. and six license and three franchise restaurants, all of which were under common control by one controlling shareholder. The controlling shareholder had the unilateral ability to implement major operating and financial policies for the entities. On October 8, 2004, Holdings and its wholly-owned and majority-owned subsidiaries completed a reorganization and initial public offering. In connection with the reorganization and public offering, Holdings became a subsidiary of the Company. See note 12. At December 28, 2004 and December 30, 2003, there were 193 and 162 Texas Roadhouse restaurants operating in 35 and 32 states, respectively. Of the 193 restaurants that were operating at December 28, 2004, (i) 107 were Company restaurants, 105 of which were wholly-owned and two of which were majority-owned, (ii) 82 were franchise restaurants and (iii) 4 were license restaurants. Of the 162 restaurants operating at December 30, 2003, (i) 87 were Company restaurants, of which 56 were wholly-owned restaurants and 31 were majority-owned or controlled restaurants, (ii) 71 were franchise restaurants and (iii) 4 were license restaurants. (2) Summary of Significant Accounting Policies
(a) Principles of Consolidation At December 28, 2004 and December 30, 2003, the Company had minority ownership in thirteen and nine restaurants, respectively. The unconsolidated restaurants are accounted for using the equity method. The Company exercises significant control over the operating and financial policies of these entities based on the rights

granted to the Company under each entity's operating or partnership agreement. Notwithstanding the significant control exercised by the Company over their affairs, the Company does not consolidate such entities because (i) the Company owns only 5% to 10% of these entities and (ii) the revenue, expense and net income, and assets and liabilities that would be attributable to these entities would not be material to our financial position or results of operations. Should the financial position and results of operations of these entities become material to the Company's financial position and results of operations in future periods, the Company will consolidate the entities into its results. All significant intercompany balances and transactions for these unconsolidated restaurants as well as the companies whose accounts have been consolidated have been eliminated.
F-6
(b) Fiscal Year
The Company utilizes a 52 or 53 week accounting period that ends on the last Tuesday in December. Beginning with fiscal year 2002, for operational reasons, the Company changed its fiscal year end from the last Sunday in December to the last Tuesday in December. This change resulted in fiscal year 2002 consisting of 52 weeks and two days as compared to fiscal years 2003 and 2004, which were both 52 weeks in length. The Company utilizes a 13 week accounting period for quarterly reporting purposes.
(c) Cash and Cash Equivalents For purposes of the consolidated statements of cash flows, the Company considers all highly liquid debt instruments with original maturities of three months or less to be cash equivalents.
(d) Receivables Receivables consist principally of amounts due from certain franchise and license restaurants for reimbursement of pre-opening and other expenses, amounts due for royalty fees from franchise stores, and credit card receivables. Receivables are recorded at the invoiced amount and do not bear interest. The allowance for doubtful accounts is the Company's best estimate of the amount of probable credit losses in the Company's existing accounts receivable. The Company determines the allowance based on historical write-off experience. The Company reviews its allowance for doubtful accounts quarterly. Past due balances over 90 days and a specified amount are reviewed individually for collectibility. Account balances are charged off against the allowance after all means of collection have been exhausted and the potential for recovery is considered remote. The Company does not have any off-balance-sheet credit exposure related to its customers.
(e) Inventories Inventories, consisting principally of food, beverages, and supplies, are valued at the lower of first-in, first-out cost or market. The Company purchases its products from a number of suppliers and believes there are alternative suppliers.
(f) Pre-opening Expenses Pre-opening expenses are charged to operations as incurred. These costs include wages, benefits, travel and lodging for the training and opening management teams, and food, beverage and other restaurant operating expenses incurred prior to a restaurant opening for business.
(g) Property and Equipment Property and equipment are stated at cost. Expenditures for major renewals and betterments are capitalized while expenditures for maintenance and repairs are expensed as incurred. Depreciation is computed over the estimated useful lives of the related assets using the straight-line method. The estimated useful lives are:
Land improvements 15 yearsBuildings and leasehold improvements 10-25 yearsEquipment and smallwares 3-10 yearsFurniture and fixtures 3-10 years
F-7
(h) Goodwill
Goodwill represents the excess of cost over fair value of assets of businesses acquired. Goodwill and intangible assets acquired in a purchase business combination and determined to have an indefinite useful life are not amortized, but instead tested for impairment at least annually in accordance with the provisions of Statement of Financial Accounting Standards ("SFAS") No. 142,Goodwill and Other Intangible Assets ("SFAS No. 142"). Goodwill is tested annually for impairment, and is tested for impairment more frequently if events and circumstances indicate that the asset might be impaired. An impairment loss is recognized to the extent that the carrying amount exceeds the asset's fair value. This determination is made at the reporting unit level and consists of two steps. First, the Company determines the fair value of a reporting unit and compares it to its carrying amount. Second, if the carrying amount of a reporting unit exceeds its fair value, an impairment loss is recognized for any excess of the carrying amount of the reporting unit's goodwill over the implied fair value of the goodwill. The implied fair value of goodwill is determined by allocating the fair value of the reporting unit in a manner similar to a purchase price allocation, in accordance with SFAS No. 141,Business Combinations ("SFAS No. 141"). The residual fair value after this allocation is the implied fair value of the reporting unit goodwill. There were no changes to the carrying amount of goodwill for the year ended December 30, 2003. On October 8, 2004, the Company acquired the remaining equity interests in 31 of its majority-owned or controlled company restaurants and TRDC and all of the equity interests in one franchise restaurant, which resulted in a goodwill of $48.6 million. See note 3. SFAS No. 142 also requires that intangible assets with estimable useful lives be amortized over their respective estimated useful lives to their estimated residual values, and reviewed for impairment in accordance with SFAS No. 144,Accounting for Impairment or Disposal of Long-Lived Assets ("SFAS No. 144").
(i) Other Assets Other assets consist primarily of costs related to the issuance of debt. The debt issuance costs are being amortized to interest expense over the term of the related debt.
(j) Impairment of Long-Lived Assets In accordance with SFAS No. 144, long-lived assets, such as property and equipment, are reviewed for impairment whenever events or changes in circumstances

indicate that the carrying amount of an asset may not be recoverable. Recoverability of assets to be held and used is measured by a comparison of the carrying amount of an asset to estimated undiscounted future cash flows expected to be generated by the asset. If the carrying amount of an asset exceeds its estimated future cash flows, an impairment charge is recognized by the amount by which the carrying amount of the asset exceeds the fair value of the asset. Assets to be disposed of would be separately presented in the consolidated balance sheet and reported at the lower of the carrying amount or fair value less costs to sell, and would no longer be depreciated. The assets and liabilities of a disposal group classified as held for sale would be presented separately in the appropriate asset and liability sections of the consolidated balance sheet.
(k) Insurance Reserves The Company self-insures a significant portion of expected losses under its workers compensation, general liability and property insurance programs. The Company purchases insurance for individual claims that exceed the amounts listed below:
Workers Compensation $ 250,000General Liability $ 100,000Property $ 50,000
F-8
The Company records a liability for all unresolved claims and for an estimate of incurred but not reported claims at its anticipated cost based on estimates provided by a third party administrator and actuary. The estimated liability is based on a number of assumptions and factors regarding economic conditions, the frequency and severity of claims and claim development history and settlement practices. Estimates of claims reserves are discounted using a discount rate of approximately 3.0% at December 28, 2004 resulting in a discount of $0.2 million. Estimates of claims reserves for 2003 were not discounted since the difference between the discounted and undiscounted claims reserves was not material. Because the Company began its self-insurance program in 2002, the Company relies on actuarial observations of historical claim development for the industry which it believes is representative of its history. In the future, if the Company's experience is significantly different from the industry, it will adjust its reserve, and its future self-insurance expenses may rise. The Company's assumptions are reviewed, monitored, and adjusted when warranted by changing circumstances.
(l) Segment Reporting As of December 28, 2004, the Company operated 107 Texas Roadhouse restaurants, each as a single operating segment, and franchised and licensed an additional 86 restaurants. The restaurants operate exclusively in the U.S. within the casual dining industry, providing similar products to similar customers. The restaurants also possess similar pricing structures, resulting in similar long-term expected financial performance characteristics. Revenue from external customers is derived principally from food and beverage sales. The Company does not rely on any major customers as a source of revenue. The Company aggregates similar operating segments into a single operating segment if the businesses are considered similar under SFAS No. 131,Disclosures about Segments of an Enterprise and Related Information. The Company considers restaurant and franchising operations as similar and has aggregated them into a single reportable segment.
(m) Revenue Recognition Revenue from restaurant sales is recognized when food and beverage products are sold. Deferred revenue primarily represents the Company's liability for gift cards and certificates that have been sold, but not yet redeemed, and is recorded at the expected redemption value. When the gift cards and certificates are redeemed, the Company recognizes restaurant sales and reduces the deferred revenue. The Company began selling gift cards in 2000, and prior to 2004, did not have enough history related to the redemption of gift cards to appropriately estimate a breakage rate (the percentage of gift cards that we estimate will never be redeemed). In 2004, the Company determined that a 5% breakage estimate, amortized over 3 years, should be recorded for each gift card that is sold, based on historical redemption trends. The change in estimate resulted in a cumulative adjustment of $1.7 million ($1.1 million after-tax, $0.04 per diluted share), primarily as a reduction of other operating expenses. The Company will review and adjust its estimates on a quarterly basis. The Company franchises Texas Roadhouse restaurants. The Company executes franchise agreements for each franchise restaurant which sets out the terms of our arrangement with the franchisee. Its franchise agreements typically require the franchisee to pay an initial, non-refundable fee and continuing fees based upon a percentage of sales. Subject to the Company's approval and payment of a renewal fee, a franchisee may generally renew the franchise agreement upon its expiration. The Company collects ongoing royalties of 2.0% to 4.0% of sales from franchise restaurants. These ongoing royalties are reflected in the accompanying consolidated statements of income as franchise royalties and fees. The Company recognizes initial franchise fees as revenue after performing substantially all initial services or conditions required by the franchise agreement, which is generally upon the opening of a restaurant. The Company received initial franchise fees of $0.4 million, $0.2 million and $0.1 million for the years ended December 28, 2004, December 30, 2003 and December 31, 2002, respectively. Continuing franchise royalties are recognized as revenue as the fees are earned. The Company also
F-9
performs supervisory and administrative services for certain franchise and license restaurants for which it receives management fees, which are recognized as the services are performed. Revenue from supervisory and administrative services is recorded as a reduction of general and administrative expenses on the accompanying consolidated statements of income. Total revenue recorded for supervisory and administrative services for the years ended December 28, 2004, December 30, 2003 and December 31, 2002 was approximately $0.3 million, $0.3 million and $0.1 million, respectively.
(n) Income Taxes In connection with the Company's reorganization and initial public offering, the Company became a "C" Corporation subject to federal and state income taxes. The Company accounts for income taxes in accordance with SFAS No. 109,Accounting for Income Taxes ("SFAS No. 109"), under which deferred assets and liabilities are recognized based upon anticipated future tax consequences attributable to differences between financial statement carrying values of assets and liabilities and their respective tax bases. A valuation allowance is established to reduce the carrying value of deferred tax assets if it is considered more likely than not that such assets will not be realized. Any change in the valuation allowance would be charged to income in the period such determination was made. Prior to converting to a "C" corporation on October 8, 2004, the Company operated as a limited liability company and was taxed as a partnership. As such, the Company's income or losses were passed through to its owners who are liable for any related income taxes.
(o) Advertising The Company has a system-wide marketing and advertising fund. The Company maintains control of the marketing and advertising fund and, as such, has consolidated the fund's activity as of December 28, 2004, December 30, 2003 and December 31, 2002. Company and franchise restaurants are required to remit a designated portion of sales, currently 0.3%, to the advertising fund. Company contributions to the fund are expensed as incurred.
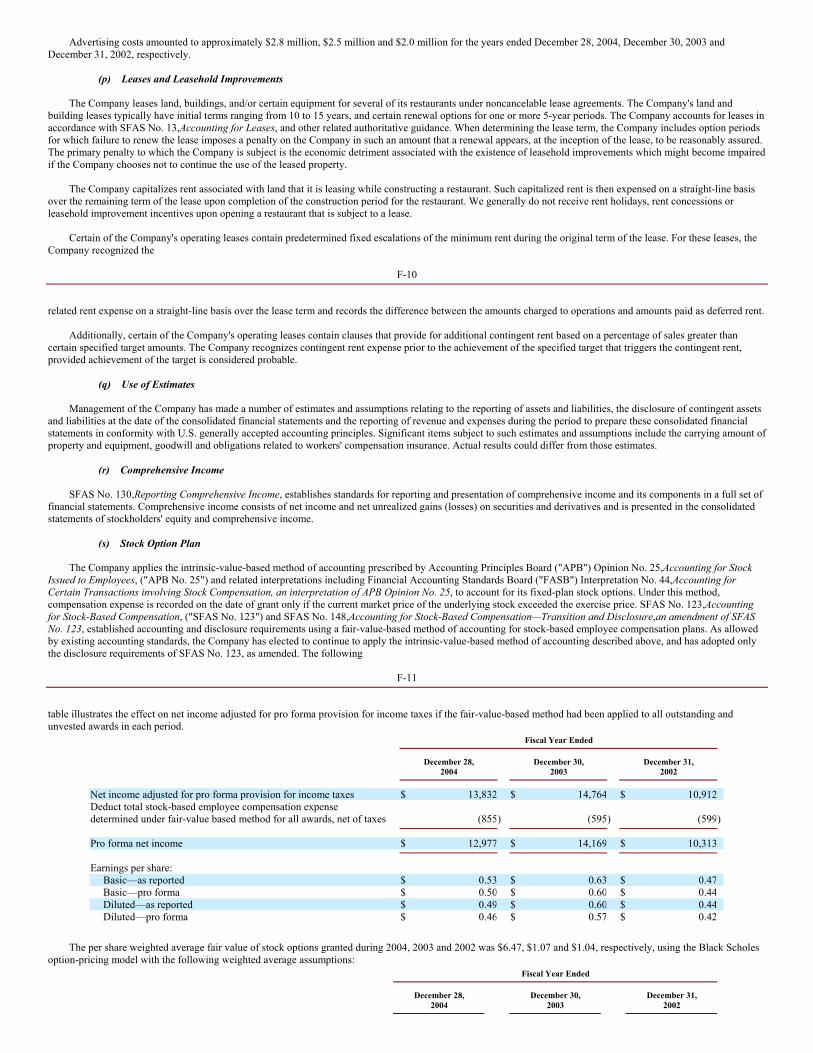
Advertising costs amounted to approximately $2.8 million, $2.5 million and $2.0 million for the years ended December 28, 2004, December 30, 2003 and December 31, 2002, respectively.
(p) Leases and Leasehold Improvements The Company leases land, buildings, and/or certain equipment for several of its restaurants under noncancelable lease agreements. The Company's land and building leases typically have initial terms ranging from 10 to 15 years, and certain renewal options for one or more 5-year periods. The Company accounts for leases in accordance with SFAS No. 13,Accounting for Leases, and other related authoritative guidance. When determining the lease term, the Company includes option periods for which failure to renew the lease imposes a penalty on the Company in such an amount that a renewal appears, at the inception of the lease, to be reasonably assured. The primary penalty to which the Company is subject is the economic detriment associated with the existence of leasehold improvements which might become impaired if the Company chooses not to continue the use of the leased property. The Company capitalizes rent associated with land that it is leasing while constructing a restaurant. Such capitalized rent is then expensed on a straight-line basis over the remaining term of the lease upon completion of the construction period for the restaurant. We generally do not receive rent holidays, rent concessions or leasehold improvement incentives upon opening a restaurant that is subject to a lease. Certain of the Company's operating leases contain predetermined fixed escalations of the minimum rent during the original term of the lease. For these leases, the Company recognized the
F-10
related rent expense on a straight-line basis over the lease term and records the difference between the amounts charged to operations and amounts paid as deferred rent. Additionally, certain of the Company's operating leases contain clauses that provide for additional contingent rent based on a percentage of sales greater than certain specified target amounts. The Company recognizes contingent rent expense prior to the achievement of the specified target that triggers the contingent rent, provided achievement of the target is considered probable.
(q) Use of Estimates Management of the Company has made a number of estimates and assumptions relating to the reporting of assets and liabilities, the disclosure of contingent assets and liabilities at the date of the consolidated financial statements and the reporting of revenue and expenses during the period to prepare these consolidated financial statements in conformity with U.S. generally accepted accounting principles. Significant items subject to such estimates and assumptions include the carrying amount of property and equipment, goodwill and obligations related to workers' compensation insurance. Actual results could differ from those estimates.
(r) Comprehensive Income SFAS No. 130,Reporting Comprehensive Income, establishes standards for reporting and presentation of comprehensive income and its components in a full set of financial statements. Comprehensive income consists of net income and net unrealized gains (losses) on securities and derivatives and is presented in the consolidated statements of stockholders' equity and comprehensive income.
(s) Stock Option Plan The Company applies the intrinsic-value-based method of accounting prescribed by Accounting Principles Board ("APB") Opinion No. 25,Accounting for Stock Issued to Employees, ("APB No. 25") and related interpretations including Financial Accounting Standards Board ("FASB") Interpretation No. 44,Accounting for Certain Transactions involving Stock Compensation, an interpretation of APB Opinion No. 25, to account for its fixed-plan stock options. Under this method, compensation expense is recorded on the date of grant only if the current market price of the underlying stock exceeded the exercise price. SFAS No. 123,Accounting for Stock-Based Compensation, ("SFAS No. 123") and SFAS No. 148,Accounting for Stock-Based Compensation—Transition and Disclosure,an amendment of SFAS No. 123, established accounting and disclosure requirements using a fair-value-based method of accounting for stock-based employee compensation plans. As allowed by existing accounting standards, the Company has elected to continue to apply the intrinsic-value-based method of accounting described above, and has adopted only the disclosure requirements of SFAS No. 123, as amended. The following
F-11
table illustrates the effect on net income adjusted for pro forma provision for income taxes if the fair-value-based method had been applied to all outstanding and unvested awards in each period.
Fiscal Year Ended
December 28, 2004
December 30, 2003
December 31, 2002
Net income adjusted for pro forma provision for income taxes $ 13,832 $ 14,764 $ 10,912 Deduct total stock-based employee compensation expense determined under fair-value based method for all awards, net of taxes (855) (595) (599)
Pro forma net income $ 12,977 $ 14,169 $ 10,313
Earnings per share: Basic—as reported $ 0.53 $ 0.63 $ 0.47 Basic—pro forma $ 0.50 $ 0.60 $ 0.44 Diluted—as reported $ 0.49 $ 0.60 $ 0.44 Diluted—pro forma $ 0.46 $ 0.57 $ 0.42
The per share weighted average fair value of stock options granted during 2004, 2003 and 2002 was $6.47, $1.07 and $1.04, respectively, using the Black Scholes option-pricing model with the following weighted average assumptions:
Fiscal Year Ended
December 28, 2004
December 30, 2003
December 31, 2002

Risk-free interest rate 3.42% 2.82 % 3.81%Expected life (years) 4.0 5.0 5.0 Expected dividend yield 0.0% 0.0 % 0.0%Volatility 44% — —
Prior to the Company's corporate reorganization and initial public offering on October 8, 2004, the Black Scholes option-pricing model excluded a volatility assumption.
(t) Fair Value of Financial Instruments At December 28, 2004 and December 30, 2003, the fair value of cash and cash equivalents, accounts receivable and accounts payable approximated their carrying value based on the short-term nature of these instruments. The fair value of the Company's long-term debt and debt-related derivative instruments is estimated based on the current rates offered to the Company for instruments of similar terms and maturities. The carrying amounts and related estimated fair values for the Company's debt and debt-related derivative instruments are as follows:
December 28, 2004
December 30, 2003
Carrying Amount
Fair Value
Carrying Amount
Fair Value
Installment loans $ 7,285 $ 8,286 $ 14,126 $ 15,877 Term loans — — 14,987 14,987 Revolver 6,000 6,000 35,200 35,200 Debt-related derivative: Open contract in a net asset (liability) position 107 107 (165) (165)
F-12
(u) Derivative Instruments and Hedging Activities
The Company accounts for derivatives and hedging activities in accordance with SFAS No. 133,Accounting for Derivative Instruments and Certain Hedging Activities, as amended, which requires that all derivative instruments be recorded on the consolidated balance sheet at their respective fair values. The Company has entered in a derivative contract to manage its interest rate exposure on its debt instruments. On the date the derivative contract was entered into, the Company designated the derivative as a hedge of the variability of cash flows to be paid related to a recognized liability (cash-flow hedge). For the hedging relationship, the Company has formally documented the hedging relationship and its risk-management objective and strategy for undertaking the hedge, the hedging instrument, the item, the nature of the risk being hedged, how the hedging instrument's effectiveness in offsetting the hedged risk will be assessed, and a description of the method of measuring ineffectiveness. This process included linking the derivative that is designated as a cash-flow hedge to a specific liability on the consolidated balance sheet. The Company also formally assesses, both at the hedge's inception and on an ongoing basis, whether the derivative that is used in the hedging transaction is highly effective in offsetting changes in the cash flows of the hedged item. Changes in the fair value of a derivative that is highly effective and that is designated and qualifies as a cash-flow hedge are recorded in other comprehensive income to the extent that the derivative is effective as a hedge, until earnings are affected by the variability in cash flows of the designated hedged item. The ineffective portion of the change in fair value of a derivative instrument that qualifies as a cash-flow hedge is reported in earnings. The Company discontinues hedge accounting prospectively when it is determined that the derivative is no longer effective in offsetting changes in cash flows of the hedged item, the derivative expires or is sold, terminated, or exercised, the derivative is dedesignated as a hedging instrument, because it is unlikely that a forecasted transaction will occur, or management determines that the designation of the derivative as a hedging instrument is no longer appropriate. When hedge accounting is discontinued because it is probable that a forecasted transaction will not occur, the Company continues to carry the derivative on the consolidated balance sheet at its fair value with subsequent changes in fair value included in earnings, and gains and losses that were accumulated in other comprehensive income are recognized immediately in earnings. In all other situations in which hedge accounting is discontinued, the Company continues to carry the derivative at its fair value on the consolidated balance sheet and recognizes any subsequent changes in its fair value in earnings.
(v) Recently Issued Accounting Standards In October 2004, the FASB ratified the consensus reached by the Emerging Issues Task Force ("EITF") on Issue 04-1,Accounting for Preexisting Relationships between the Parties to a Business Combination, ("EITF No. 04-1"). EITF No. 04-1 requires that a business combination between two parties that have a preexisting relationship be evaluated to determine if a settlement of a preexisting relationship exists. EITF No. 04-1 also requires that certain reacquired rights (including the rights to the acquirer's trade name under a franchise agreement) be recognized as intangible assets apart from goodwill. However, if a contract giving rise to the reacquired rights includes terms that are favorable or unfavorable when compared to pricing for current market transactions for the same or similar items, EITF No. 04-1 requires that a settlement gain or loss should be measured as the lesser of a) the amount by which the contract is favorable or unfavorable under market terms from the perspective of the acquirer or b) the stated settlement provisions of the contract available to the counterparty to which the contract is unfavorable. EITF No. 04-1 is effective prospectively for business combinations consummated after October 13, 2004. EITF No. 04-1 will apply to acquisitions of restaurants the Company may make from our franchisees or licensees. The Company currently attempts to have our franchisees or licensees enter
F-13
into standard franchise or license agreements when renewing or entering into a new agreement. However, in certain instances franchisees or licensees have existing agreements that possess terms that differ from the Company's current standard agreements. If in the future the Company were to acquire a franchisee or licensee with such an existing agreement, we would be required to record a settlement gain or loss at the date of acquisition. The amount and timing of any such gains or losses the Company might record is dependent upon which franchisees or licensees the Company might acquire and when they are acquired. Accordingly, any impact cannot be currently determined. In December 2004, the FASB issued SFAS No. 123 (revised 2004),Share-Based Payment ("SFAS No. 123R"), which revised SFAS No. 123, supercedes APB No. 25 and related interpretations and amends SFAS No. 95,Statement of Cash Flows. SFAS No. 123R addresses the accounting for transactions in which an entity exchanges its equity instruments for goods or services with a primary focus on transactions in which an entity obtains employee services in share-based payment transactions. The provisions of SFAS No. 123R are similar to those of SFAS No. 123, however, SFAS No. 123R requires all share-based payments to employees, including grants of employee stock options, to be recognized in the financial statements as compensation cost based on their fair value on the date of grant. Fair value of share-based awards will be determined using option-pricing models (e.g. Black Scholes or binomial models) and assumptions that appropriately reflect the specific

circumstances of the awards. Compensation cost will be recognized over the vesting period based on the fair value of the awards that actually vest. The Company will be required to choose between the modified-prospective and modified-retrospective transition alternatives in adopting SFAS No. 123R. Under the modified-prospective transition method, compensation cost will be recognized in financial statements issued subsequent to the date of adoption for all share-based payments granted, modified or settled after the date of adoption, as well as for any unvested awards that were granted prior to the date of adoption. The Company will recognize compensation cost relating to the unvested portion of awards granted prior to the date of adoption using the same estimate of the grant-date fair value and the same attribution method used to determine the pro forma disclosures under SFAS No. 123. Under the modified-retrospective transition method, compensation cost will be recognized in a manner consistent with the modified-prospective method, however, prior period financial statements will also be restated by recognizing compensation cost as previously reported in the proforma disclosures under SFAS No. 123. The restatement provisions can be applied to either a) all periods presented or b) beginning of the fiscal year in which SFAS No. 123R is adopted. SFAS No. 123R is effective at the beginning of the first interim or annual period beginning after June 15, 2005 and early adoption is encouraged. The Company will adopt SFAS No. 123R for the quarter beginning June 29, 2005. The Company has not yet finalized the adoption method or the impact of adopting the provisions of SFAS No. 123R. (3) Acquisitions On October 8, 2004, the Company acquired the remaining equity interests in 31 majority-owned or controlled company restaurants and TRDC and all of the equity interests in one franchise restaurant in exchange for an aggregate of 3,089,080 shares of Texas Roadhouse, Inc. Class A common stock. The number of shares issued in exchange for the remaining interest in TRDC was calculated so as to be neither accretive nor dilutive since the earnings per share impact on our predecessor company, Holdings, was zero. The number of shares issued in connection with the other acquisitions was calculated using predetermined acquisition formulas as required by each entity's operating or partnership agreement. These transactions were accounted for as step acquisitions using the purchase method as defined in SFAS No. 141. Based on a purchase price of $54.1 million and our preliminary estimates of the fair value of net assets acquired, $48.6 million of goodwill was generated by the
F-14
acquisitions. The purchase price of $54.1 million was calculated using the initial offering price of $17.50 per share. The purchase price was allocated as follows:
Current assets $ 220 Property and equipment, net 281 Goodwill 48,563 Other assets 6 Elimination of minority interest in consolidated subsidiaries 5,346 Current liabilities (358)
$ 54,058
Since the allocations noted above are the Company's preliminary estimates, the Company expects to adjust the basis of certain assets of the acquired entities as the fair market value of the minority interests' portion of such assets at the date of the acquisition are determined based on final appraisals. The results of operations for acquired restaurants and TRDC have been included in the Company's consolidated financial statements since the date of acquisition. These acquisitions, which are expected to be accretive to earnings, are consistent with our long-term strategy to increase net income and earnings per share. If the acquisition had been completed as of the beginning of the years ended December 28, 2004 and December 30, 2003, pro forma revenue, minority interest, net income and earnings per share would have been as follows:
Fiscal Year Ended
December 28, 2004
December 30, 2003
Revenue $ 365,963 $ 289,926Minority interest (229) —Net income 18,629 19,309
Basic EPS
$
0.66
$
0.56
Diluted EPS $ 0.61 $ 0.53 The shares used to calculate earnings per share above assumes the 3,089,080 shares of Class A common stock issued to the equity owners of the merged companies was outstanding at the beginning of each year presented. The pro forma information is not necessarily indicative of the results of operations had the acquisition actually occurred at the beginning of each of these periods nor is it necessarily indicative of future results.
F-15
(4) Long-term Debt Long-term debt consisted of the following:
December 28, 2004
December 30, 2003
Installment loans, due 2005-2026 $ 7,285 $ 14,126Term loans — 14,987Revolver 6,000 35,200
13,285 64,313Less current maturities 525 8,059

$ 12,760 $ 56,254
Maturities of long-term debt at December 28, 2004, excluding capital leases, are as follows:
2005 $ 5252006 4992007 5462008 5992009 6,453Thereafter 4,663
$ 13,285
The weighted average interest rates for installment loans outstanding at December 28, 2004 and December 30, 2003 were 8.57% and 7.70%, respectively. The debt is secured by certain land, buildings, and equipment. In July 2003, Holdings completed a $100 million three year syndicated banking arrangement (the "credit facility"), the proceeds of which were used to refinance approximately 80.0% of the existing debt. The credit facility included approximately $50 million of available financing (the "revolver") to fund development of new restaurants. The terms of this credit facility required Holdings to pay interest on outstanding term and revolver borrowings at LIBOR plus a margin of 1.50% to 2.75%, plus a commitment fee of 0.25% per year on any unused portion of the credit facility. The weighted average interest rate for term loans outstanding at December 30, 2003 was 3.93%. The weighted average interest rate for the revolver at December 30, 2003 was 3.63%. The debt was secured by certain land, buildings and equipment. In October 2004, the Company completed a $150 million five-year revolving credit facility which replaced the July 2003 credit facility. The terms of this credit facility require the Company to pay interest on outstanding borrowings at LIBOR plus a margin of 0.75% to 1.50%, plus a commitment fee of 0.15% to 0.25% per year on any unused portion of the facility, in both cases, depending on the Company's leverage ratio. The weighted average interest rate for the revolver at December 28, 2004 was 3.06%. At December 28, 2004, the Company had $6.0 million of borrowings outstanding under our credit facility and $141.7 million of availability net of $2.3 million of outstanding letters of credit. Certain debt agreements require compliance with financial covenants including minimum debt service coverages and maximum debt to worth ratios. The existing credit facility prohibits the Company from incurring additional debt outside the facility except for equipment financing up to $3 million, unsecured debt up to $500,000 and up to $20 million of debt incurred by majority-owned companies formed to own new restaurants. Additionally, the lenders' obligation to extend credit under the facility depends on the Company maintaining certain financial covenants, including a minimum consolidated
F-16
fixed charge coverage ratio of 1.50 to 1.00 and a maximum consolidated leverage ratio of 3.00 to 1.00. The Company is currently in compliance with such covenants. (5) Derivative Instruments and Hedging Activities The Company has an interest-rate-related derivative instrument to manage its exposure on its debt facility. The Company does not enter into derivative instruments for any purpose other than cash-flow-hedging purposes. That is, the Company does not speculate using derivative instruments. By using the derivative financial instrument to hedge exposures to changes in interest rates, the Company exposes itself to credit risk and market risk. Credit risk is the failure of the counterparty to perform under the terms of the derivative contract. When the fair value of a derivative contract is positive, the counterparty owes the Company, which creates credit risk for the Company. When the fair value of a derivative contract is negative, the Company owes the counterparty and, therefore, it does not possess credit risk. Market risk is the adverse effect on the value of a financial instrument that results from a change in interest rates. The market risk associated with interest-rate contracts is managed by establishing and monitoring parameters that limit the types and degree of market risk that may be undertaken. The Company assesses interest rate cash flow risk by continually identifying and monitoring changes in interest rate exposures that may adversely impact expected future cash flows and by evaluating hedging opportunities. The Company maintains risk management control systems to monitor interest rate cash flow risk attributable to both the Company's outstanding or forecasted debt obligations as well as the Company's offsetting hedge positions. The risk management control systems involve the use of analytical techniques, including cash flow sensitivity analysis, to estimate the expected impact of changes in interest rates on the Company's future cash flows. The Company uses variable-rate debt to finance a portion of its operations. The debt obligations expose the Company to variability in interest payments due to changes in interest rates. Management believes that it is prudent to limit the variability of a portion of its interest payments. To meet this objective, management entered into an interest rate swap agreement during 2003 with a notional amount of approximately $31.2 million to manage fluctuations in cash flows resulting from interest rate risk. This swap changes the variable-rate cash flow exposure on a portion of the credit facility to fixed cash flows. Under the terms of the interest rate swap, the Company receives variable interest rate payments and makes fixed interest rate payments, thereby creating the equivalent of fixed-rate debt for the portion of debt hedged. This hedge expires in July 2005. Changes in the fair value of the interest rate swap designated as an hedging instrument that effectively offsets the variability of cash flows associated with variable-rate, long-term debt obligations are reported in accumulated other comprehensive income. These amounts subsequently are reclassified into interest expense as a yield adjustment of the hedged interest payments in the same period in which the related interest affects earnings. For the year ended December 28, 2004, the Company reclassified $0.3 million into interest expense. For the year ended December 30, 2003, the Company had no change in the fair value of the interest rate swap to be reclassified into interest expense. As of December 28, 2004, approximately $107,000 of deferred gains on derivative instruments accumulated in other comprehensive income is expected to be reclassified to earnings during the next 6 months. Transactions and events expected to occur over the next six months that will necessitate reclassifying these derivatives gains to earnings include the repricing of variable-rate debt. The ineffective portion of the cash flow hedge was not material to the Company's results of operations, cash flow, or liquidity during 2004.
F-17
(6) Property and Equipment, Net

Property and equipment were as follows:
December 28, 2004
December 30, 2003
Land and improvements $ 38,253 $ 29,043 Buildings and leasehold improvements 94,260 69,878 Equipment and smallwares 15,300 31,972 Furniture and fixtures 44,214 11,622 Construction in progress 5,989 4,906 Liquor licenses 1,288 899
199,304 148,320 Accumulated depreciation and amortization (36,313) (25,269)
$ 162,991 $ 123,051
The amount of interest capitalized in connection with restaurant construction was approximately $0.3 million and $0.2 million for the years ended December 28, 2004 and December 30, 2003, respectively. (7) Deferred Rent It is the Company's policy to depreciate its property and equipment, including assets located on leased properties, over the shorter of the estimated useful lives of those assets or the underlying lease term. In some cases, these assets on leased properties are depreciated over a period of time which includes both the initial term of the lease and one or more option periods. Certain of the Company's operating leases contain predetermined fixed escalations of the minimum rent over the term of the lease. Prior to December 2004, the Company recognized the related rent expense on a straight-line basis over the base term of the lease, excluding renewals, and recorded the difference between the amounts charged to operations and amounts paid as deferred rent. In December 2004, the Company determined the calculation for straight-line rent should be based on a similar period as that used to depreciate the long-lived assets associated with the underlying leases and thus increased the straight-line term used to calculate deferred rent for those leases where it would be economically detrimental to terminate the leases at the end of the initial lease term. In December 2004, the Company recorded an adjustment of $1.3 million ($0.9 million after-tax), primarily to rent expense. The charges attributable to 2004 and prior periods were $0.3 million ($0.2 million after-tax) and $1.0 million ($0.7 million after-tax), respectively. As the correction of this error was not material to the Company's current or prior period financial statements, the Company recorded the adjustment in the 2004 consolidated financial statements.
F-18
(8) Goodwill The changes in the carrying amount of goodwill are as follows:
Balance as of December 31, 2002 $ 2,190Additions —Disposals and other, net —
Balance as of December 30, 2003 $ 2,190Additions (a) 48,563Disposals and other, net —
Balance as of December 28, 2004 $ 50,753
(a) Refer to note 3 for a discussion of acquisitions.
(9) Leases The following is a schedule of future minimum lease payments required for capital leases and operating leases that have initial or remaining noncancelable terms in excess of one year as of December 28, 2004:
Capital Leases
Operating Leases
2005 $ 293 $ 9,6982006 220 9,1322007 117 7,6742008 117 7,1242009 117 7,011Thereafter 586 59,498
Total 1,450 $ 100,137
Less amount representing interest ranging from 9.6% to 11.4% 481
Present value of minimum capital lease payments 969 Less current maturities of obligations under capital leases 198
Obligations under capital leases, excluding current maturities $ 771
Capitalized lease assets, primarily building and equipment, with an original cost of approximately $2.0 million are being amortized on a straight-line basis over the applicable lease terms and interest expense is recognized on the outstanding obligations. The total accumulated amortization of property and equipment held under
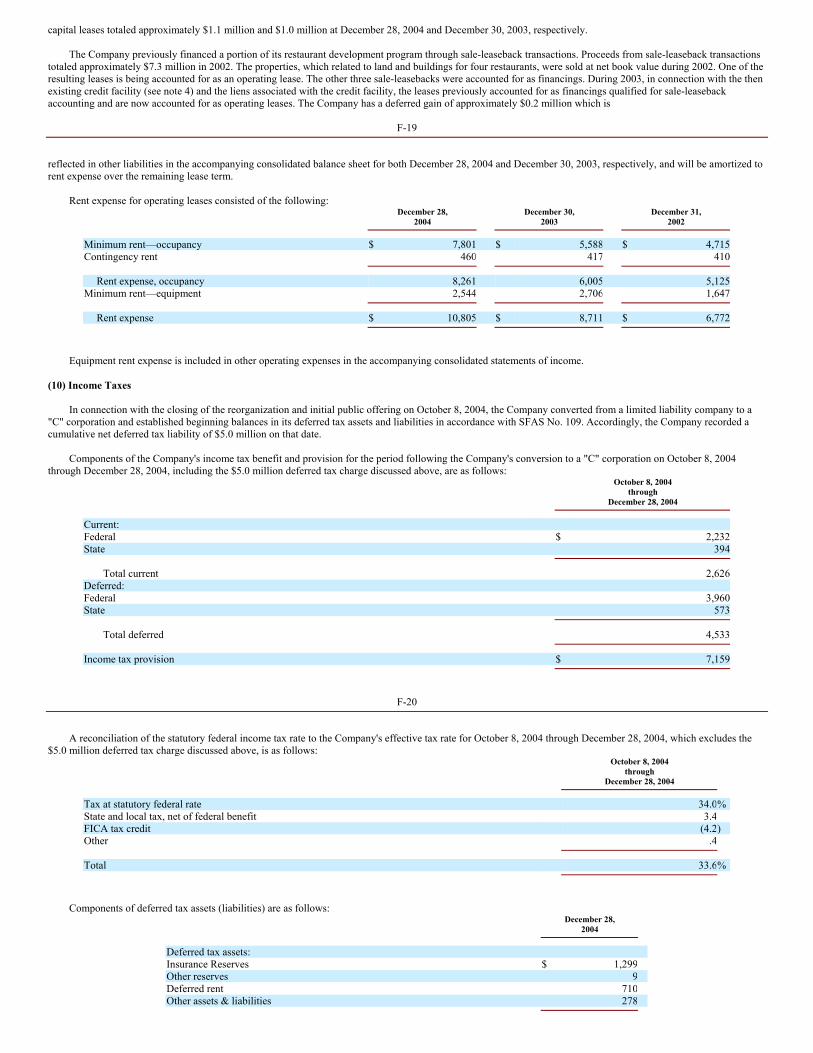
capital leases totaled approximately $1.1 million and $1.0 million at December 28, 2004 and December 30, 2003, respectively. The Company previously financed a portion of its restaurant development program through sale-leaseback transactions. Proceeds from sale-leaseback transactions totaled approximately $7.3 million in 2002. The properties, which related to land and buildings for four restaurants, were sold at net book value during 2002. One of the resulting leases is being accounted for as an operating lease. The other three sale-leasebacks were accounted for as financings. During 2003, in connection with the then existing credit facility (see note 4) and the liens associated with the credit facility, the leases previously accounted for as financings qualified for sale-leaseback accounting and are now accounted for as operating leases. The Company has a deferred gain of approximately $0.2 million which is
F-19
reflected in other liabilities in the accompanying consolidated balance sheet for both December 28, 2004 and December 30, 2003, respectively, and will be amortized to rent expense over the remaining lease term. Rent expense for operating leases consisted of the following:
December 28, 2004
December 30, 2003
December 31, 2002
Minimum rent—occupancy $ 7,801 $ 5,588 $ 4,715Contingency rent 460 417 410
Rent expense, occupancy 8,261 6,005 5,125Minimum rent—equipment 2,544 2,706 1,647
Rent expense $ 10,805 $ 8,711 $ 6,772
Equipment rent expense is included in other operating expenses in the accompanying consolidated statements of income. (10) Income Taxes In connection with the closing of the reorganization and initial public offering on October 8, 2004, the Company converted from a limited liability company to a "C" corporation and established beginning balances in its deferred tax assets and liabilities in accordance with SFAS No. 109. Accordingly, the Company recorded a cumulative net deferred tax liability of $5.0 million on that date. Components of the Company's income tax benefit and provision for the period following the Company's conversion to a "C" corporation on October 8, 2004 through December 28, 2004, including the $5.0 million deferred tax charge discussed above, are as follows:
October 8, 2004 through
December 28, 2004
Current: Federal $ 2,232State 394
Total current 2,626Deferred: Federal 3,960State 573
Total deferred 4,533
Income tax provision $ 7,159
F-20
A reconciliation of the statutory federal income tax rate to the Company's effective tax rate for October 8, 2004 through December 28, 2004, which excludes the $5.0 million deferred tax charge discussed above, is as follows:
October 8, 2004 through
December 28, 2004
Tax at statutory federal rate 34.0%State and local tax, net of federal benefit 3.4 FICA tax credit (4.2) Other .4
Total 33.6%
Components of deferred tax assets (liabilities) are as follows:
December 28, 2004
Deferred tax assets: Insurance Reserves $ 1,299 Other reserves 9 Deferred rent 710 Other assets & liabilities 278

Total deferred tax asset 2,296
Deferred tax liabilities: Depreciation and amortization (6,897)
Total deferred tax liability (6,897)
Net deferred tax liability $ (4,601)
Current deferred tax asset $ 1,308 Noncurrent deferred tax liability (5,909)
$ (4,601)
The Company has not provided any valuation allowance as it believes the realization of its deferred tax assets is more likely than not. (11) Preferred Stock The Company's board of directors is authorized, without further vote or action by the holders of Class A common stock, to issue from time to time up to an aggregate of 1,000,000 shares of preferred stock in one or more series. Each series of preferred stock will have the number of shares, designations, preferences, voting powers, qualifications and special or relative rights or privileges as shall be determined by the board of directors, which may include, but are not limited to, dividend rights, voting rights, redemption and sinking fund provisions, liquidation preferences, conversion rights and preemptive rights. There are no shares of preferred stock outstanding at December 28, 2004. (12) Stockholders' Equity The shares as shown in the Company's consolidated statements of stockholders' equity and comprehensive income through December 30, 2003 reflect the share activity of Holdings and W. Kent Taylor's ownership interests in the other entities under common control. Of the 18,618,212 shares shown at December 30, 2003, 18,580,111 are Holdings shares and 38,101 are shares controlled by
F-21
Mr. Taylor which represent his equity contribution to the entities consolidated under common control and not to Holdings. Additionally, the share activity for 2002 and 2003 reflect 225,086 and 437,175 shares that Holdings issued for the exercise of stock options. On October 8, 2004, the Company sold 6,581,481 shares of Texas Roadhouse, Inc. Class A common stock as part of its initial public offering for an aggregate purchase price of $115.2 million. In connection with this offering, the Company undertook a series of transactions that resulted in Holdings, its wholly owned and majority-owned restaurants, and the other entities under common control being consolidated under Texas Roadhouse, Inc. Concurrently with this merger, the Company acquired the remaining equity interest of TRDC and Texas Roadhouse Management Corp. through mergers of those companies with wholly-owned subsidiaries of the Company. The Company acquired the remaining equity interests in all 31 of its majority-owned or controlled company restaurants, and the entire equity interest in one franchise restaurant, through mergers of those 32 companies with wholly- owned subsidiaries of the Company. The Company issued 3,089,080 shares of Class A common stock to the equity owners of the merged companies. These shares were calculated using predetermined acquisition formulas as required by each entity's operating, partnership or franchise agreement. Under the terms of an agreement associated with the formation of Texas Roadhouse, Inc., W. Kent Taylor contributed all of his interests in WKT (1,000 shares), which owned 178,125 common shares of Holdings and the right to receive a one percent distribution on all sales of company and license Texas Roadhouse restaurants, in exchange for 178,125 shares of Texas Roadhouse, Inc. Class A common stock and 2,632,688 shares of Texas Roadhouse, Inc. Class B common stock. Mr. Taylor also received 1,754,531 shares of Texas Roadhouse, Inc. Class A common stock in exchange for his 450 shares in TRDC, and 671,089 shares of Texas Roadhouse, Inc. Class A common stock in exchange for his 36,651 shares in the six license restaurants and three franchise restaurants. The 2,425,620 Class A shares issued in exchange for Mr. Taylor's 37,101 shares in these Texas Roadhouse entities are reflected in the accompanying consolidated financial statements. The Class B common stock is identical in all respects to Class A common stock, except with respect to voting and conversion rights. Class A common stock and Class B common stock will vote together as a single class on all matters presented to a vote of stockholders, including the election of directors. Each holder of Class B common stock is entitled to ten votes to each share held of record on the applicable record date for all of these matters. W. Kent Taylor, or other entities controlled by him, will be the only holders of shares of Class B common stock. Earnings per share calculations included in the accompanying consolidated financial statements and notes thereto are calculated using the total of Class A and Class B common stock. The Company will make a distribution of $31.2 million to members of its predecessor company, Holdings, in redemption of its preferred shares representing undistributed net income for periods through October 8, 2004. This distribution is shown on the accompanying consolidated balance sheet as distributions payable and will be paid in the second quarter of 2005. (13) Earnings Per Share The pro forma share and net income per share data for all periods presented are based on the historical weighted average shares outstanding. The diluted earnings per share calculations show the effect of the weighted average stock options outstanding from the Company's stock option plan as discussed in note 16.
F-22
The following table sets forth the calculation of pro forma weighted average shares outstanding (in thousands) as presented in the accompanying consolidated statements of income:
Fiscal Year Ended
December 28, 2004
December 30, 2003
December 31, 2002
Net income adjusted for pro forma income taxes $ 13,832 $ 14,764 $ 10,912
Weighted-average common shares outstanding:

Shares—basic 25,945 23,440 23,334 Shares assumed issued on exercise of dilutive share equivalents 4,508 3,720 3,296 Shares assumed purchased with proceeds of dilutive share equivalents (2,196) (2,388) (1,942)
Shares applicable to diluted earnings 28,257 24,772 24,688
Basic EPS
$
0.53
$
0.63
$
0.47
Diluted EPS $ 0.49 $ 0.60 $ 0.44
(14) Commitments and Contingencies The estimated cost of completing capital project commitments at December 28, 2004 and December 30, 2003 was approximately $30.0 million and $22.6 million, respectively. The Company entered into real estate lease agreements for franchise restaurants located in Everett, MA and Longmont, CO before granting franchise rights for those restaurants. The Company has subsequently assigned the leases to the franchises, but remains contingently liable if a franchisee defaults. Under the terms of the lease, the Longmont lease was assigned in October 2003 and expires in May 2014, while the Everett lease was assigned in September 2002 and expires in February 2018. As the fair value of the guarantees is not considered significant, no liability has been recorded. The Company is involved in various claims and legal actions arising in the normal course of business. In the opinion of management, the ultimate disposition of these matters will not have a material effect on the Company's consolidated results of operations, financial position or liquidity. The Company currently buys most of its beef from one supplier. Although there are a limited number of beef suppliers, management believes that other suppliers could provide similar product on comparable terms. A change in suppliers, however, could cause supply shortages and a possible loss of sales, which would affect operating results adversely. The Company has no material minimum purchase commitments with its vendors that extend beyond a year. (15) Other Comprehensive Income The accumulated balances for each classification of other comprehensive income are as follows:
December 28, 2004
December 30, 2003
December 31, 2002
Unrealized gain on security $ — $ — $ 6Unrealized gain (loss) on derivative instruments 107 (165) —
$ 107 $ (165) $ 6
F-23
(16) Stock Option Plan In May 2004, the Company adopted a stock option plan (the "Plan") for eligible employees. This Plan amended and restated the 1997 Texas Roadhouse Management Corp. Stock Option Plan. The Plan provides for granting of options to purchase shares of Class A common stock at an exercise price not less than the fair value of the stock on the date of grant. Options are exercisable at various periods ranging from one to ten years from the date of grant. The Company requires certain of its eligible employees to make refundable deposits to be applied to the exercise price of the options. These deposits are classified as stock option deposits in the accompanying consolidated balance sheets. Stock option activity during the periods indicated is as follows:
Number of shares
Weighted average exercise
price
Balance at December 30, 2001 2,660,603 $ 3.11 Granted 1,394,530 6.51 Expired (85,115) 4.83 Exercised (225,086) 1.52
Balance at December 31, 2002 3,744,932 4.41 Granted 544,675 8.45 Expired (154,414) 5.37 Exercised (437,175) 3.27
Balance at December 30, 2003 3,698,018 5.10 Granted 1,102,736 16.77 Expired (101,105) 6.49 Exercised (252,047) 7.36
Balance at December 28, 2004 4,447,602 $ 7.99
The following table presents summarized information about stock options outstanding and exercisable at December 28, 2004:
Options Outstanding
Options Exercisable

Range of exercise prices
Options
Weighted average
remaining contractual life
Weighted average exercise
price
Options
Weighted average exercise
price
$ 0.00— 3.00 1,046,555 5.0 $ 2.88 952,537 $ 2.87 3.01— 5.00 886,134 5.9 4.03 713,945 4.02 5.01— 7.00 674,349 7.2 6.62 352,307 6.52 7.01— 9.00 623,760 7.7 7.97 398,637 7.93 9.01—11.00 259,069 8.6 9.12 66,720 9.05 11.01—23.00 957,735 9.7 17.91 308 17.50
4,447,602 7.1 7.99 2,484,454 $ 4.70
At December 30, 2003 and December 31, 2002, the Company had 2,061,705 and 798,595 stock options exercisable at weighted average exercise prices of $4.18 and $3.45, respectively. (17) Stock Split On September 20, 2004, the Company declared a 1.1875-for-one stock split of the Company's Class A and Class B common stock to stockholders of record immediately prior to the offering. All
F-24
share and per share information included in the accompanying consolidated financial statements for all periods presented have been adjusted to retroactively reflect the stock split. (18) Noncash Compensation Expense Prior to October 8, 2004, some of the Company's executive officers earned compensation at rates significantly below market levels and the Company paid no salary or bonus compensation to W. Kent Taylor, the Company's founder and chairman. General and administrative expense includes an adjustment to record the difference between the actual salary and bonus compensation paid to these officers and the Company's estimate of the fair market value, based on industry analysis and competitive benchmarking, of the services rendered by these officers. General and administrative expense was increased by approximately $0.9 million for the period from December 31, 2003 through October 8, 2004 and $1.1 million and $1.0 million for the years ended December 30, 2003, December 31, 2002, respectively. (19) Related Party Transactions Prior to October 8, 2004, W. Kent Taylor owned a substantial interest in Buffalo Construction, Inc., a restaurant construction business which provides services to the Company and other restaurant companies. From December 31, 2003 through October 8, 2004, the Company paid $23.0 million to Buffalo Construction, Inc. The Company paid Buffalo Construction, Inc. amounts totaling $15.0 million and $20.4 million in 2003 and 2002, respectively. In October 2004, W. Kent Taylor sold his interest in Buffalo Construction, Inc. Mr. Taylor received a promissory note in the amount of $1.5 million from the purchaser of Buffalo Construction, Inc. in partial consideration of the purchase. The Longview, Texas restaurant, which was acquired by the Company in connection with the completion of the initial public offering, leases the land and restaurant building from an entity controlled by Steven L. Ortiz, our Chief Operating Officer. The lease is for 15 years and will terminate in November 2014. The lease can be renewed for two additional periods of five years each. Rent is approximately $16,000 per month and will increase by 5% on each of the 6th and 11th anniversary dates of the lease. The lease can be terminated if the tenant fails to pay the rent on a timely basis, fails to maintain the insurance specified in the lease, fails to maintain the building or property or becomes insolvent. Total rent payments in each of the years 2004, 2003 and 2002 were approximately $186,000. One restaurant is currently leased from an entity owned by W. Kent Taylor and three other stockholders. The lease is for 10 years and will terminate on March 31, 2007. The lease can be renewed for three additional periods of five years each. Rent throughout the term is approximately $12,000 per month. The lease can be terminated if the tenant fails to pay rent on a timely basis, fails to maintain insurance, abandons the property or becomes insolvent. Rent expense for this restaurant was approximately $0.1 million in each of the years 2002 through 2004. The Company has twelve license and franchise restaurants owned in whole or part by certain officers, directors and stockholders of the Company. These twelve entities paid the Company fees of $1.4 million, $0.7 million, and $0.3 million during the years ended December 28, 2004, December 30, 2003 and December 31, 2002, respectively. The Company employs Juli Miller Hart, the wife of G.J. Hart, the Company's Chief Executive Officer, as Director of Public Relations. Ms. Hart reports to W. Kent Taylor who conducts her performance reviews and determines her compensation. WKT, which was owned by W. Kent Taylor, received royalties of $2.6 million and $2.1 million in 2003 and 2002, respectively. From December 31, 2003 to May 27, 2004, WKT received royalties of $1.3 million. WKT was entitled to receive these royalties as consideration for its contribution of the Texas Roadhouse operating system and concept to Holdings. After the completion of the Company's
F-25
initial public offering, WKT no longer received such royalties. These royalties were classified as distributions in the Company's consolidated statement of stockholders' equity and comprehensive income. John D. Rhodes, a stockholder, is a director and substantial stockholder of Confluent Inc., which provided certain business intelligence services to the Company through February 2004 for which it was paid an aggregate of $0.1 million. Services included generating marketing analysis using their proprietary software program and data provided by the Company. After completion of the corporate reorganization and initial public offering on October 8, 2004, Dr. Rhodes is no longer a 5% stockholder of the Company.

(20) Pro forma Adjustments (unaudited) In connection with the reorganization as a "C" corporation, a pro forma income tax provision has been calculated as if the Company were taxable at an estimated consolidated effective income tax rate of 34.9%, 36.2% and 35.6% on income before taxes for the period from December 31, 2003 through October 8, 2004 and for the years 2003 and 2002 and included in the accompanying calculation of pro forma provision for income tax. The reconciliation of income tax computed at the federal statutory rate to income tax expense for the pro forma provision for income taxes for the years ended December 28, 2004, December 30, 2003 and December 31, 2002 is as follows:
2004
2003
2002
Effective federal tax rate 35.0% 35.0% 35.0% State and local tax 3.3% 3.7% 3.5% FICA tax credit (3.8)% (3.3)% (3.3)% Other .4% .8% .4%
Combined effective federal and state tax rate 34.9% 36.2% 35.6%
F-26
(21) Selected Quarterly Financial Data (unaudited)
2004
First Quarter
Second Quarter
Third Quarter
Fourth Quarter
Total
Revenue $ 83,898 $ 89,919 $ 92,247 $ 96,947 $ 363,011Total costs and expenses $ 73,219 $ 80,630 $ 81,680 $ 88,800 $ 324,329Income from operations $ 10,679 $ 9,289 $ 10,567 $ 8,147 $ 38,682Net income (loss) $ 7,737 $ 6,405 $ 7,743 $ (184) $ 21,701Net income adjusted for pro forma provision for income taxes $ 5,006 $ 4,147 $ 5,010 $ (331) $ 13,832Basic earnings per common share—pro forma $ 0.21 $ 0.17 $ 0.21 $ (0.01) $ 0.53Diluted earnings per common share—pro forma $ 0.19 $ 0.16 $ 0.19 $ (0.01) $ 0.49
2003
First Quarter
Second Quarter
Third Quarter
Fourth Quarter
Total
Revenue $ 67,081 $ 71,552 $ 72,428 $ 75,392 $ 286,453Total costs and expenses $ 59,063 $ 62,350 $ 64,122 $ 66,660 $ 252,195Income from operations $ 8,018 $ 9,202 $ 8,306 $ 8,732 $ 34,258Net income $ 5,278 $ 6,424 $ 5,283 $ 6,158 $ 23,143Net income adjusted for pro forma provision for income taxes $ 3,367 $ 4,099 $ 3,371 $ 3,927 $ 14,764Basic earnings per common share—pro forma $ 0.14 $ 0.17 $ 0.14 $ 0.17 $ 0.63Diluted earnings per common share—pro forma $ 0.14 $ 0.16 $ 0.14 $ 0.16 $ 0.60 The above financial data for 2004 includes the following adjustments: $1.3 million charge ($0.9 million after-tax) to correct the Company's lease accounting practices; a $1.0 million charge ($0.7 million after-tax) for the write-off of loan fees related to the termination of the Company's July 2003 credit facility; recognition of $1.7 million ($1.1 million after-tax) of gift card breakage income; and a $5.0 million deferred tax charge related to the Company's conversion from a limited liability company to a "C" corporation. The above financial data for 2003 includes a charge of $0.3 million ($0.2 million after-tax) of loan fees related to refinanced debt.
F-27

support center(corporate office)6040 Dutchmans Lane
Louisville, KY 40205
(800) 839-7623
www.texasroadhouse.com
stock listingTexas Roadhouse, Inc. Common
Stock is listed on the NASDAQ
Stock Exchange under the
symbol TXRH.
additional informationFor additional financial
documents and information,
please visit our web site at
www.texasroadhouse.com
or contact us by phone at
(502) 515-7300 or e-mail at
For media inquiries, please call
(502) 515-7235.
Independent AuditorsKPMG LLP
400 W. Market Street, Suite 2600
Louisville, KY 40202
Phone (502) 587-0535
transfer agentNational City Bank
629 Euclid Avenue, Suite 635
Cleveland, OH 44114
Phone (800) 622-6757
ANNUAL MEETING Thursday, May 26, 2005
9:00 AM EDT
Seelbach Hilton Hotel
Mezzanine Ballroom
500 S. 4th Street
Louisville, KY 40202
BOARD OF DIRECTORSGJ Hart
President & Chief Executive Officer,
Texas Roadhouse, Inc.
Martin T. Hart
Private Investor
Gregory N. Moore
Senior Vice President & Controller,
Yum! Brands, Inc.
James F. Parker
Former Chief Executive Officer
& Vice-Chairman of the Board
Southwest Airlines Co.
James R. Ramsey
President, University of Louisville
W. Kent Taylor
Chairman of the Company & Board,
Texas Roadhouse, Inc.
James R. Zarley
President, Chief Executive Officer
& Chairman of the Board
ValueClick, Inc.
st o c k h o l d e r I n f o r m at i o n
L EGENDARY F OOD,L EGENDARY S ERVICE
A short statement with a powerful punch.
Yes, that’s the Texas Roadhouse mission.
While it’s easy to remember,
it’s a bit tougher to execute.
We take our responsibility
of providing “legendary” very seriously,
and we are very proud to claim
a commitment to excellence –
in our product, our people
and our guest experience.

®
®
2004 Annual ReportTexas Roadhouse, Inc.
T e x a s R o a d h o u s e , I n c.6040 Dutchmans Lane Louisville, Kentucky 40205(800) TEX-ROADwww.texasroadhouse.com
te
xa
s r
oa
dh
ou
se
, Inc
. • 20
04
an
nu
al
re
po
rt