Embed Size (px)
Citation preview
ANNUAL REPORT 2000
COMPANY PROFILE
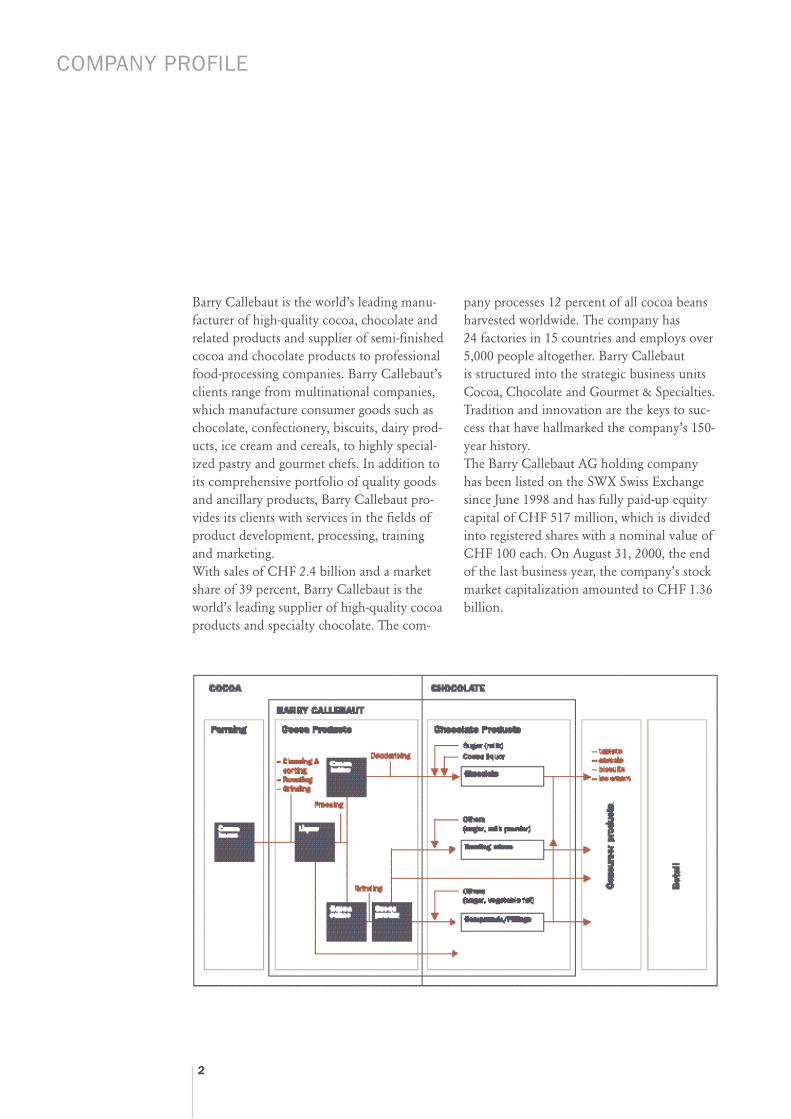
Barry Callebaut is the world’s leading manu-facturer of high-quality cocoa, chocolate andrelated products and supplier of semi-finishedcocoa and chocolate products to professionalfood-processing companies. Barry Callebaut’sclients range from multinational companies,which manufacture consumer goods such aschocolate, confectionery, biscuits, dairy prod-ucts, ice cream and cereals, to highly special-ized pastry and gourmet chefs. In addition toits comprehensive portfolio of quality goodsand ancillary products, Barry Callebaut pro-vides its clients with services in the fields ofproduct development, processing, trainingand marketing.With sales of CHF 2.4 billion and a marketshare of 39 percent, Barry Callebaut is theworld’s leading supplier of high-quality cocoaproducts and specialty chocolate. The com-
pany processes 12 percent of all cocoa beansharvested worldwide. The company has 24 factories in 15 countries and employs over5,000 people altogether. Barry Callebaut is structured into the strategic business unitsCocoa, Chocolate and Gourmet & Specialties.Tradition and innovation are the keys to suc-cess that have hallmarked the company’s 150-year history.The Barry Callebaut AG holding companyhas been listed on the SWX Swiss Exchangesince June 1998 and has fully paid-up equitycapital of CHF 517 million, which is dividedinto registered shares with a nominal value ofCHF 100 each. On August 31, 2000, the endof the last business year, the company’s stockmarket capitalization amounted to CHF 1.36billion.
2
KEY FIGURES
LETTER TO SHAREHOLDERS
BOARD OF DIRECTORS
MANAGEMENT
MARKET DEVELOPMENTBUSINESS UNITSGEOGRAPHICAL TRENDS
EMPLOYEES
FINANCIAL RESULTS
CONSOLIDATED FINANCIAL STATEMENTSWITH AUDITORS’ REPORTCONSOLIDATED FINANCIAL STATEMENTSNOTES TO THE CONSOLIDATEDFINANCIAL STATEMENTSREPORT OF THE GROUP AUDITORS
BARRY CALLEBAUT AG FINANCIAL STATEMENTSREPORT OF THE STATUTORY AUDITORS
CONTACTS
AGENDA
IMPRESSUM
CONTENTS
3
4
6
10
11
131517
18
19
21
2329
53
5562
63
66
66

KEY FIGURES
4
Development of sales volumein tons
EBIT-Developmentin mio CHF
Chocolate 1’383.4Cocoa 477.6Gourmet & Specialties 549.4
Turnover per business unitin mio CHF
2000 1999 1998
Sales volume per countryin tons
Share development
1000
500
0752,040 643,376 600,700
2000 1999 1998
148.7
00 99
130.2 148.1
Western Europe
The Americas
Asia/Pacific Eastern Europe
Africa andMiddle East
01
.09
.00
01
.07
.00
01
.05
.00
01
.03
.00
01
.01
.00
01
.11
.99
01
.09
.99
Swiss Market Index Barry Callebaut
500’000
400’000
300’000
200’000
100’000
0
125%
120%
115%
110%
105%
100%
95%
90%
85%
80%
300
200
100
0
00 99 00 99 00 99 00 99
46
8’9
63
41
6’9
03
20
2’7
98
17
3’5
41
24
’81
9
17
’50
1
31
’07
5
22
’35
8
24
’38
5
13
’07
3
In CHF mio 2000 1999 Change
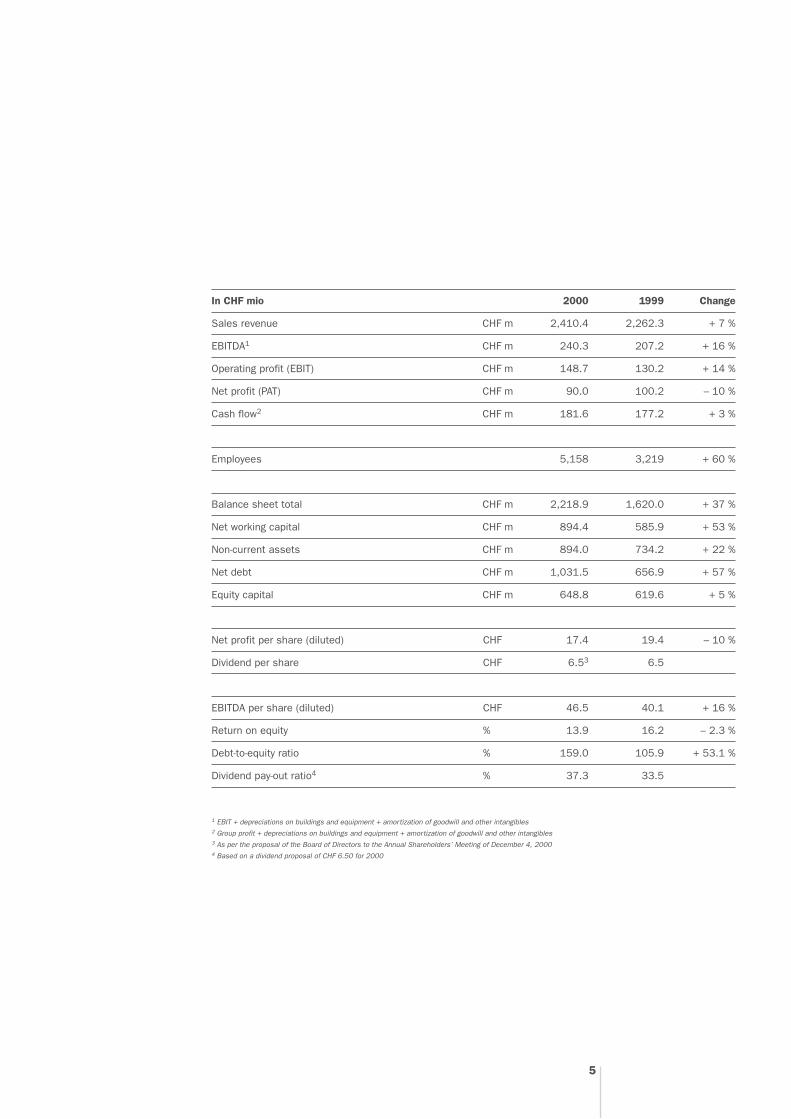
Sales revenue CHF m 2,410.4 2,262.3 + 7 %
EBITDA1 CHF m 240.3 207.2 + 16 %
Operating profit (EBIT) CHF m 148.7 130.2 + 14 %
Net profit (PAT) CHF m 90.0 100.2 – 10 %
Cash flow2 CHF m 181.6 177.2 + 3 %
Employees 5,158 3,219 + 60 %
Balance sheet total CHF m 2,218.9 1,620.0 + 37 %
Net working capital CHF m 894.4 585.9 + 53 %
Non-current assets CHF m 894.0 734.2 + 22 %
Net debt CHF m 1,031.5 656.9 + 57 %
Equity capital CHF m 648.8 619.6 + 5 %
Net profit per share (diluted) CHF 17.4 19.4 – 10 %
Dividend per share CHF 6.53 6.5
EBITDA per share (diluted) CHF 46.5 40.1 + 16 %
Return on equity % 13.9 16.2 – 2.3 %
Debt-to-equity ratio % 159.0 105.9 + 53.1 %
Dividend pay-out ratio4 % 37.3 33.5
1 EBIT + depreciations on buildings and equipment + amortization of goodwill and other intangibles2 Group profit + depreciations on buildings and equipment + amortization of goodwill and other intangibles3 As per the proposal of the Board of Directors to the Annual Shareholders’ Meeting of December 4, 20004 Based on a dividend proposal of CHF 6.50 for 2000
5

LETTER TO SHAREHOLDERS
Dear shareholders
Overall, Barr y Callebaut can look back on satisfying twelve months: With consoli-dated sales revenue growing 7 percent to CHF 2.4 billion in the business year. Up toAugust 31, 2000, operating profit surged, climbing 14 percent against the previousyear to CHF 148.7 million, and Group profit amounted to CHF 90 million. By com-parison, last year’s profit of CHF 100.2 million included the one-of f release of aCHF 15.3 million tax provision relating to the acquisition of the Barr y Group.
Our business year was characterized by a future-oriented consolidation of the strate-gic units Cocoa, Chocolate as well as Gourmet & Specialties. Building on ourleading position in industrial specialty chocolate and related products, in the pasttwelve months we have made the transition to the global market leader.
In last year’s demanding market environment, Barr y Callebaut succeeded well. Thesupply of cocoa increased strongly in impor tant producer countries as a result ofweather and liberalization measures, which prompted a drop in the price of semi-finished products at the star t of the business year. The related margins recoveredin the second half of the year. Fur thermore, the consumption of chocolate and othercocoa-based products almost stagnated in traditional markets. This had an impacton the sales price. We used this situation as an oppor tunity to fur ther strengthenour position.
CocoaThe centralization of sourcing worldwide was an impor tant step towards fur ther costreductions for raw materials. With regard to cocoa products, however, we did notfocus solely on increasing ef ficiency but also tapped potential for profitable pre-mium products by increasing the amount of cocoa procured directly from manufac-turers or small-scale cooperatives. Buying the cocoa beans directly from the farmersgenerates a competitive advantage to then market high-end products with aguaranteed origin.
We fur ther focused on the implementation of the Global Supply Chain Managementprogram in order to rationalize internal procedures and optimize inter faces toclients.
6

Chadler (USA and Brazil), Carma (Switzerland) and Van Houten’s European andAfrican operations were successfully integrated, thus increasing our presence inimpor tant markets. In par ticular, these acquisitions significantly increased ourmarket share in the United States, Asia and Eastern Europe.
ChocolateThe food industr y is experiencing substantial change, as the consolidation process,which gathered pace last year, clearly showed. In order to strengthen our positionas the preferred supplier, service provider and par tner for innovation in this compet-itive environment, we developed and implemented a set of measures aimed atglobalizing our key account management. With the successful takeover of Nestlé’sindustrial chocolate operations in Italy and the conclusion of a long-term coopera-tion agreement with this client, we distinguished ourselves to be a high-per formanceoutsourcing par tner for major manufacturers of branded goods.
Gourmet & SpecialtiesIn the past twelve months, this business area focused on expanding the productrange and strengthening the brands. We paid par ticular attention to developing newproducts with additional benefits as well as convenience food.
Customer services are becoming an increasingly impor tant factor of added value inthis business environment. We have been expanding this area in the year underreview. We offer professional clients (confectioners, patisseries, restaurants, cater-ing companies, etc.) training seminars, innovative recipes and assistance in confec-tioning and presenting their products.
ThanksOur results and achievements in the year under review would not have been possiblewithout the dedication and commitment of over 5,000 employees in 18 countries.The Board of Directors and the Management would like to take this oppor tunity tothank all employees for the excellent per formance they have achieved over the pasttwelve months.
7

Strategic developmentIn addition to achieving economic and market objectives, we also successfullycontinued to implement our long-term strategy in the past business year. We aim tofur ther internationally expand our strong position in the cocoa and chocolate busi-ness units and make use of the acquisitions and organic growth to enhance profit-ability and cost-ef ficiency. Par ticular emphasis will be placed on the promotionof high-margin products – such as those of the Gourmet & Specialties unit – andthe improvement of customer service. The main requirements for achieving prof-itable growth in all business units are strong operational per formance and a contin-ued high degree of innovation. In the year under review, these objectives have beenmet.
Management structureOur management structure is organized in line with our client profiles in order tomeet critical success factors. At the same time, each business unit must be able tooptimize its activities so as to maximize profitability. Since September 1, 2000,therefore, Group Management has been structured into the business units Cocoa,Chocolate and Gourmet & Specialties.
The Cocoa unit is responsible for activities related to semi-finished products. Tofur ther strengthen its position as world market leader, the Chocolate unit will bedivided into Europe & Asia and the Americas. Gourmet & Specialties has been madea business unit on its own with the aim of generating strong growth. Group Manage-ment integrates Finance, Supply Chain Management as well as Sourcing.
Outlook for 2001The price situation for raw materials stabilized in the last few months of the lastbusiness year, which should have a positive impact on 2001. At the same time, thesustained economic upswing in our main markets is producing increased demandfor high-quality products.
To maintain the high quality of our branded products, we have decided not to takeadvantage of the regulations for chocolate set by the European Union in March2000, which allow up to 5% non-cocoa, vegetable oils to be added to chocolate. Weare able to supply our clients with products that make use of the greater regulator yleeway at any time.
8

The rapidly changing market environment, and especially the advanced consolida-tion of the food industr y, are accelerating the structural change under way in thecocoa and chocolate business sectors. In future, only those suppliers ensuring bothquality and cost leadership will be able to be commercially successful. As themarket leader, we are committed in driving this process forward. Having previouslyfocused primarily on sales growth, Management is now concentrating on fur therincreasing profitability.
In this connection, the main objectives include unified production planning, the cen-tralization of risk management, the introduction of Internet-based procurement(e-procurement) and especially increased customer service. A series of new measureshave already been implemented within the scope of the Focus 2001 optimizationprogram in order to improve operational procedures.
The increased global presence offers Barr y Callebaut the oppor tunity to internation-ally launch successful gourmet brands.
Proposals to the Annual Meeting of ShareholdersTaking into account the annual profit, the balance-sheet situation and the outlookfor the current business year, the Board of Directors proposes to the Annual Meet-ing of Shareholders the payment of a dividend of CHF 6.50 per registered share,unchanged from the previous year.
Board of Directors and Management are committed to fur ther increase Barr y Calle-baut’s profitable growth and to create added value for its shareholders, clients andemployees in the current business year.
Andreas SchmidChairman of the Board of Directors and CEO
9

BOARD OF DIRECTORS
Andreas SchmidChairman
Klaus J. Jacobs
Gaudenz Staehelin Pierre Vermaut
Andreas W. Keller
10

MANAGEMENT
Andreas SchmidChief Executive Officer
Onno BleekerChocolate Europe & Asia Pacific
Jean-Michel MelisChocolate Americas
Rudolf SchwabSourcing, Trading & Risk Management
Dirk PoelmanSupply Chain Management
Benoît VillersCocoa
James FormanGourmet & Specialties
Ralph Schmitz-DrägerChief Financial Officer
11
12

Barry Callebaut is the world’s leading manufacturer oftop-quality cocoa, chocolate and related products. The companyhas grown significantly in recent years. This growth reflectsthe company’s professionalism, service, quality and – mostimportantly – acceptance by its clients and consumers.In order to fur ther strengthen its position, Barr y Callebaut’scorporate structure has been adapted to the growing chal-lenges of the market. The organization is divided into three business units: Cocoa,Chocolate and Gourmet & Specialties.
MARKET DEVELOPMENT

MARKET DEVELOPMENT
Market Development
Markets in the food sector are becoming in-creasingly segmented, as consumers demandeven more differentiated products tailored totheir individual requirements. At the sametime, the ongoing consolidation of the indus-try is producing bundled demand, with pur-chasing and cost synergies largely being passedon directly to consumers.In this connection, two trends are of particularsignificance and may well determine thecourse of the market over the longer term. Onthe one hand is the need for healthy and/orhealth food and on the other hand is the de-mand from professional or private consumersfor convenience food. Consumers are pre-pared to pay more for such products butat the same time they are also more demandingwith regard to quality, origin, declaration andsafety.
To be able to meet these demands, brand-name manufacturers of cocoa and chocolateproducts are dependent on the guaranteeddelivery of high-quality cocoa beans. Giventhat industrial production is increasinglybeing outsourced, however, many food man-ufacturers are much less able to check thequality of their products directly. As a resultof existing overcapacities, the cocoa pricesituation remains unsatisfactory. This leadsto oversupply, especially of cocoa of lesserquality, while supply bottlenecks exist inthe premium segment. The generally very lowprice level means there is little incentiveat present on the part of cocoa farmers toincrease the quality of their beans.
14

MARKET DEVELOPMENT
Business Units
CocoaThe Cocoa business unit, which covers pro-curement and semi-finished products in par-ticular, increased output in the year underreview by 23 percent to 155,063 tons, whichcorresponds to sales of CHF 477.6 million.The contribution made by this business unit tothe Group’s overall sales volume thus grewfrom 20 to 21 percent. This growth is dueprimarily to the integration of Chadler. TheCocoa business unit’s main products arebranded cocoa powder, cocoa butter andcocoa liquor. Around 52 percent of these semi-finished products are further processed byBarry Callebaut itself, the remainder beingsold to third parties. Barry Callebaut’s future strategy will continueto focus on high quality and integrated pro-cesses: Barry Callebaut is buying more andmore from cocoa farmers and local coopera-tives directly, and less and less through inter-mediaries. The company is therefore aimingto foster long-term cooperation with the pro-ducers in order to ensure that quality of theraw materials remains consistently high. Fromthis year onward, the entire sourcing processwill be coordinated from Barry Callebaut’sheadquarters in Switzerland. This will simul-taneously cut internal costs and raise totalmargins, increasing competitiveness overalland securing cost leadership.In the coming years, the Cocoa business unitwill not focus on increasing sales volumesbut on marketing high-margin products suchas top-quality branded cocoa powder.
ChocolateThe Chocolate business unit, which servesprimarily industrial clients, increased outputyear-on-year by 10 percent to 464,927 tons,which corresponds to sales of CHF 1,383.4million. Of this increase, 7 percent is attribut-able to organic growth. The contribution ofthis business unit to the Group sales volumeamounted to 62 percent last year and the mainproducts are chocolate, coatings and fillings.The continuing consolidation process in thefood industry means that demand for choco-late products is increasingly coming from afew major clients. In this phase, Barry Calle-baut is developing from a mere supplier to avaluable know-how partner and serviceprovider to food manufacturers. Due to inte-grated production and the expertise it hasacquired in the gourmet products sector, BarryCallebaut is in a position to take over a largerpart of the supply chain from its industrialclients, enabling them to focus on their corecompetencies.In the coming years, the Chocolate businessunit will continuously advance – especiallyin terms of quality – while cooperation withthe food industry will be intensified.
15
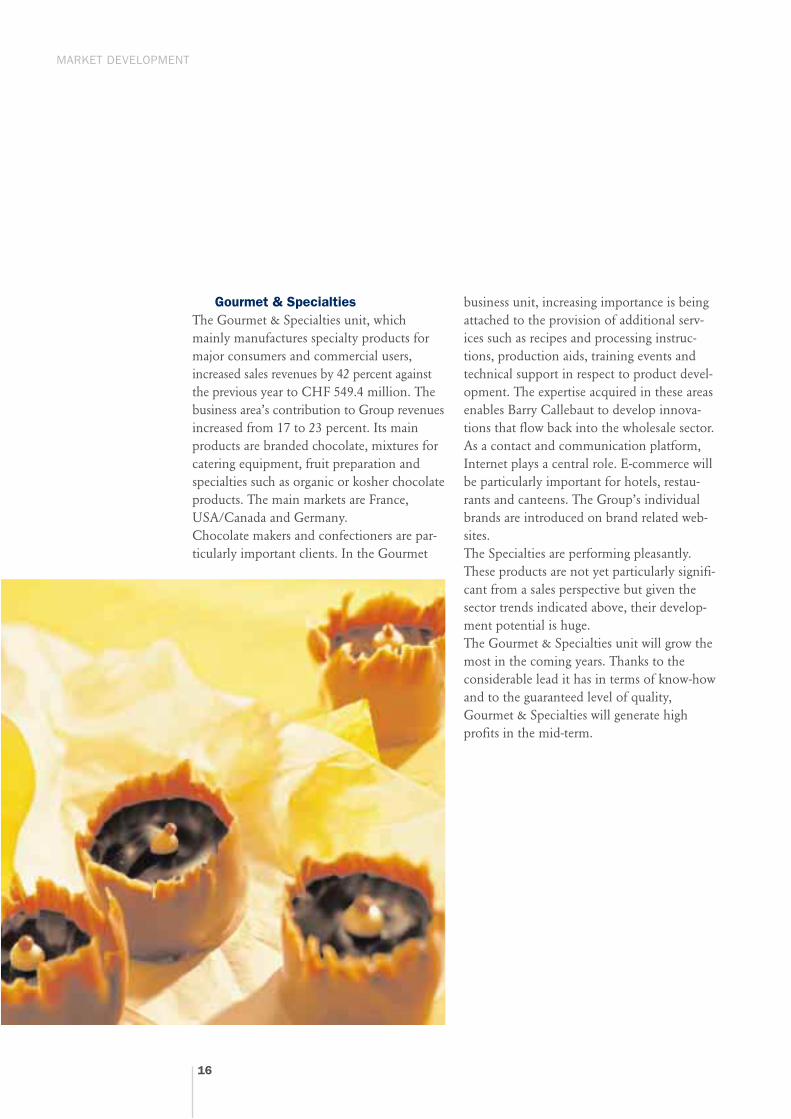
Gourmet & SpecialtiesThe Gourmet & Specialties unit, whichmainly manufactures specialty products formajor consumers and commercial users,increased sales revenues by 42 percent againstthe previous year to CHF 549.4 million. Thebusiness area’s contribution to Group revenuesincreased from 17 to 23 percent. Its mainproducts are branded chocolate, mixtures forcatering equipment, fruit preparation andspecialties such as organic or kosher chocolateproducts. The main markets are France,USA/Canada and Germany.Chocolate makers and confectioners are par-ticularly important clients. In the Gourmet
business unit, increasing importance is beingattached to the provision of additional serv-ices such as recipes and processing instruc-tions, production aids, training events andtechnical support in respect to product devel-opment. The expertise acquired in these areasenables Barry Callebaut to develop innova-tions that flow back into the wholesale sector.As a contact and communication platform,Internet plays a central role. E-commerce willbe particularly important for hotels, restau-rants and canteens. The Group’s individualbrands are introduced on brand related web-sites.The Specialties are performing pleasantly.These products are not yet particularly signifi-cant from a sales perspective but given thesector trends indicated above, their develop-ment potential is huge. The Gourmet & Specialties unit will grow themost in the coming years. Thanks to theconsiderable lead it has in terms of know-howand to the guaranteed level of quality,Gourmet & Specialties will generate highprofits in the mid-term.
MARKET DEVELOPMENT
16
MARKET DEVELOPMENT
Geographical Trends
Western EuropeBarry Callebaut’s main market is WesternEurope, which grew by 12 percent (in volumeterms) compared to the previous businessyear. Given its extraordinary strong marketposition Barry Callebaut’s main objective isqualitative growth. In the coming years,therefore, the company’s primary goal inWestern Europe will not only be the increase ofsales volumes but to strengthen cooperationwith food manufacturers and generate addedvalue. In this context, the company enhancespartnerships more than customary outsourc-ing arrangements. Barry Callebaut’s newmanagement structure is to ensure close anddirect contact with key accounts.
The AmericasBarry Callebaut’s operations in the Americaswere restructured and refocused following theintegration of Chadler US and Brazil. Inthe past business year, sales volumes in theAmericas increased by a total of 17 percent,with the highest growth rate in Latin America.In future, Barry Callebaut will enhance inoverproportional growth in these markets –both organically and as a result of acquisi-tions.
Asia/PacificThe economic recovery in this region hastriggered a marked rise in demand. Sales vol-umes increased 42 percent against the previousbusiness year. Barry Callebaut has a particu-larly strong presence in Australia, Japan andKorea, with Japan and Korea’s gourmet prod-ucts sector being especially attractive. BarryCallebaut expects that it will be able to in-crease its market position significantly in thisregion. As these markets are geared towards
European standards in terms of taste, theywill be managed together with WesternEurope at Group level.
Eastern EuropeThe East European market has recovered well,with sales volumes climbing by 39 percent.In these emerging markets there is less of anemphasis on increasing capacity simplythrough acquisitions. Barry Callebaut is muchmore interested in marketing products thatsatisfy the high quality requirements of lead-ing food manufacturers and consumers, andtherefore consequently increasing its ownproduction capacities in the medium term.
Africa and the Middle EastIn this region, sales volumes have increasedby 87 percent. In the Middle East, BarryCallebaut benefits from the fact that the com-pany is a certified manufacturer of kosherproducts.
17

Motivated and highly qualified employees arecrucial to Barry Callebaut’s success. Given itsunique market position, Barry Callebaut hasto foster, acquire and develop expertise in thefields of technology and applications in-house. Corporate cost-consciousness is pro-moted through business training for staff atall levels, and opportunities for cutting costsand increasing earnings are identified andimplemented on this basis. In view of the tight situation on the labormarket in the industrial countries, recruitingqualified employees is difficult at all levels.
Thanks to systematic staff development andencouragement, good promotion opportuni-ties and, not least, the Group’s internationaldiversification, Barry Callebaut is a veryattractive employer. This is evidenced by thewillingness of staff to be geographicallymobile. Barry Callebaut cultivates good work-ing relationships with trade unions both at alocal level and within the framework of theEuropean Workers’ Council set up last year. In cooperation with Adecco – the world’sleading company for part-time employment –and in collaboration with employees repre-sentatives, pilot projects were developed andimplemented in Belgium and Canada withthe aim of optimizing staff assignments: staffare employed by Adecco and work not onlyfor Barry Callebaut but also for other compa-nies. This allows fluctuating seasonal capacityrequirements to be met in a cost-effectivemanner, without affecting job security orresulting in know-how being lost. Once thepilot projects have been evaluated, a decisionwill be taken as to whether this model shouldbe applied to the Group as a whole.
EMPLOYEES
18

FINANCIAL RESULTS
Income statementSales revenue totaled CHF 2,410.4 million –a rise of 7% on the previous year or 17%in volume terms. 5% of this increase is due toorganic growth, while the remainder can beattributed to the acquisitions of Chadler USand Brazil (from October 22, 1999), AztecSrl, Italy, and C.J. van Houten & Zoon AG(from March 1, 2000) which is active inEurope and Africa. The Société Africaine de Cacao Saco SA(Côte d’Ivoire), in which Barry Callebaut pre-viously held a 49% stake, was fully incorpo-rated into the company on January 1, 2000.Saco is the largest and main supplier of semi-finished products. The first-time consolida-tion has changed the group’s cost structure, asexpenses previously listed under ‘Materialcosts’ are now broken down among the vari-ous expenditure items. As a result, the coststructure can only partially be compared withlast year’s. Material costs declined in absolute terms,despite the 17% increase in volume, firstbecause of the integration of Saco mentionedabove and second, because of a significantreduction in the purchase price of cocoabeans. Barry Callebaut makes around two-thirds of its sales on a cost-plus basis underwhich cocoa beans are billed to the customerat the relevant market price, so that fluctua-tions in the market price have no effect onthe profit margin of these sales.Operating profit (EBIT) surged by 14% toCHF 148.7 million – up from CHF 130.2million in the previous year. The improvedearnings situation is the result of the follow-ing changes. Restructuring costs of CHF 5million in respect of acquisitions made thisyear and last year were more than offset bycost savings of CHF 8 million achieved as a
result of the Supply Chain ManagementEfficiency Program and the central coordina-tion of sourcing worldwide. Increased vol-umes and improved margins boosted earningsby CHF 11.5 million. The new acquisitionsadded CHF 4 million to the company’sresults. The net profit of CHF 90.0 million cannot bedirectly compared to last year’s result of CHF100.2 million as the latter figure includes therelease of CHF 15.3 million in tax provisionsset aside in the year following the mergerof Barry and Callebaut. The non-operatingincome of CHF 13.0 million includes theresult on the sale of participations and fixedassets. Cash flow amounted to CHF 181.6million – up 3% against the previous year.
Balance sheet The balance sheet total grew by CHF 598.8million to CHF 2,218.9 million. CHF 421.9million of this increase is due to new acquisi-tions and CHF 195,4 million to the imple-mentation of new IAS standards, whichresulted in cocoa commodities contracts –previously an off-balance sheet item – beingincluded in the balance sheet. Net debtadvanced from CHF 656.9 million to CHF1,031.5 million, producing a debt-to-equityratio of 159.0%. On a comparable basis,excluding acquisitions and after adjustmentsfor IAS, the net borrowings ratio was 92.5%against 105.9% in the previous year.
19

20
CONSOLIDATED FINANCIAL STATEMENTSWITH AUDITORS’ REPORT
CONSOLIDATED FINANCIAL STATEMENTSCONSOLIDATED BALANCE SHEET/ASSETSCONSOLIDATED BALANCE SHEET/LIABILITIESCONSOLIDATED STATEMENT OF INCOMECONSOLIDATED STATEMENT OF CASH FLOWS/OPERATING ACTIVITIESCONSOLIDATED STATEMENT OF CASH FLOWS/INVESTING ACTIVITIES/FINANCING ACTIVITIESCONSOLIDATED STATEMENT OF CHANGES IN EQUITY
NOTES TO THE CONSOLIDATED FINANCIAL STATEMENTSSUMMARY OF ACCOUNTING POLICIESORGANIZATION AND BUSINESS ACTIVITIESGROUP COMPANIESTRADE ACCOUNTS RECEIVABLEINVENTORIESOTHER CURRENT ASSETSPROPERTY, PLANT AND EQUIPMENTINVESTMENTSINTANGIBLE ASSETSSHORT-TERM DEBTPROVISIONSOTHER CURRENT LIABILITIESLONG-TERM DEBTOBLIGATIONS UNDER FINANCE LEASESOTHER NON-CURRENT LIABILITIESMINORITY INTERESTSSHARE CAPITALRESEARCH AND DEVELOPMENT COSTSNON-OPERATING INCOME AND EXPENSEFINANCIAL INCOME AND EXPENSETAXESEARNINGS PER SHARECASH FLOW FROM ACQUISITIONSEMPLOYEE BENEFITSINFORMATION BY SEGMENT AND GEOGRAPHICAL AREARELATED PARTIESCOMMITMENTS, CONTINGENCIES AND FINANCIALINSTRUMENTS WITH OFF-BALANCE SHEET RISK
REPORT OF THE GROUP AUDITORS
23
23242526
27
28
29
293434353535363737383839394040414142424242434444485050
53

CONSOLIDATED FINANCIAL STATEMENTS WITH AUDITORS’ REPORT
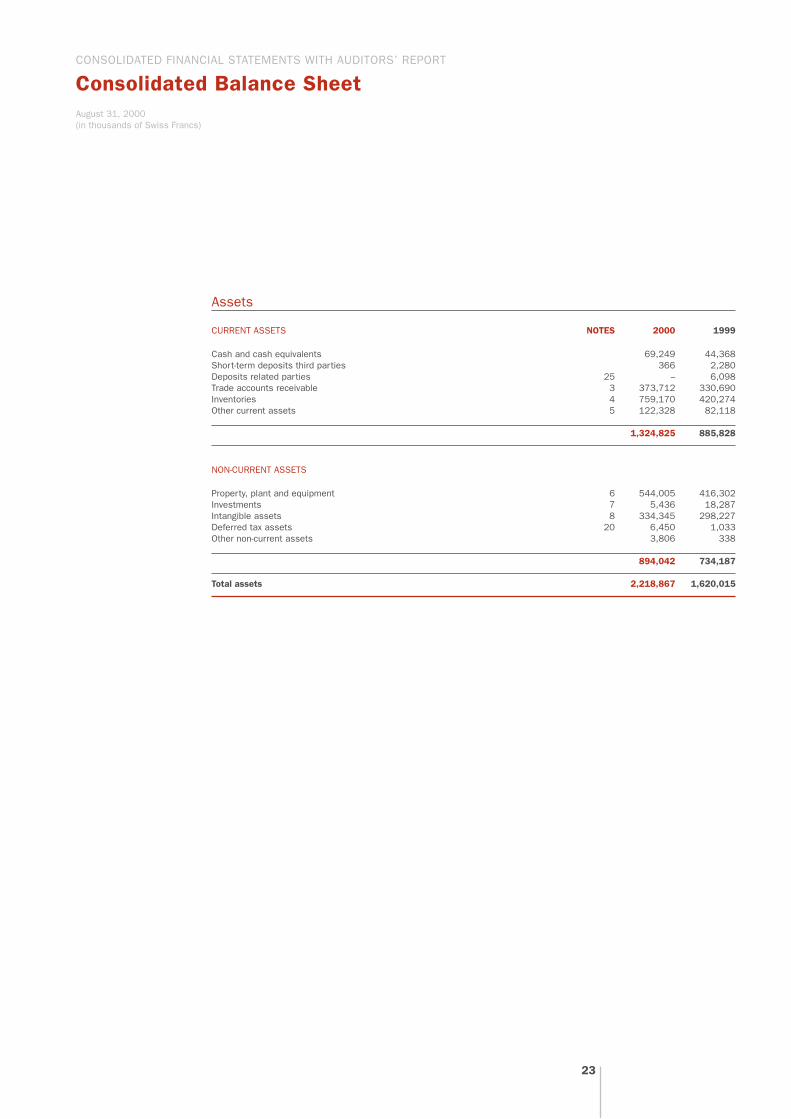
Consolidated Balance SheetAugust 31, 2000(in thousands of Swiss Francs)
Assets
CURRENT ASSETS NOTES 2000 1999
Cash and cash equivalents 69,249 44,368Short-term deposits third parties 366 2,280Deposits related parties 25 – 6,098Trade accounts receivable 3 373,712 330,690Inventories 4 759,170 420,274Other current assets 5 122,328 82,118
1,324,825 885,828
NON-CURRENT ASSETS
Property, plant and equipment 6 544,005 416,302Investments 7 5,436 18,287Intangible assets 8 334,345 298,227Deferred tax assets 20 6,450 1,033Other non-current assets 3,806 338
894,042 734,187
Total assets 2,218,867 1,620,015
23

CONSOLIDATED FINANCIAL STATEMENTS WITH AUDITORS’ REPORT
Consolidated Balance SheetAugust 31, 2000 (in thousands of Swiss Francs)
Liabilities and Shareholders’ Equity
CURRENT LIABILITIES NOTES 2000 1999
Bank overdrafts 78,000 31,779Short-term debt 9 714,828 371,467Loans from related parties 25 2,414 194Trade accounts payable 174,171 154,100Income tax payable 18,687 14,246Provisions 10 56,234 18,570Other current liabilities 11 111,794 60,280
1,156,128 650,636
NON-CURRENT LIABILITIES
Long-term debt 12 305,823 306,204Deferred tax liability 20 35,804 33,477Other non-current liabilities 14 65,769 8,185
407,396 347,866
Total liabilities 1,563,524 998,502
Minority interests 15 6,497 1,889
SHAREHOLDERS’ EQUITY
Share capital 16 517,000 517,000Retained earnings and reserves 131,846 102,624
648,846 619,624
Total liabilities, minority interests and shareholders’ equity 2,218,867 1,620,015
24

OPERATING INCOME NOTES 2000 1999
Income from sales and services 2,410,404 2,262,317
OPERATING EXPENSES
Material consumed 1,641,155 1,667,781Personnel 253,800 205,722Advertising and promotion 12,894 11,431Depreciation 6 70,076 59,968Depreciation & amortization of intangibles 8 21,521 16,978Profit/(loss) from associated companies 9,493 (4,343)Other operating expenses 252,722 174,558
Total operating expenses 2,261,661 2,132,095
Operating profit 148,743 130,222
Non operating income (expense) 18 12,987 735Financial cost, net 19 (53,337) (31,612)
Profit before taxes and minority interest 108,393 99,345
Taxes 20 (18,948) 110
Profit before minority interest 89,445 99,455
Minority interest 15 588 790
Net profit for the year 90,033 100,245
Earnings per share (CHF/share) 21 18,10 19,66
Diluted earnings per share (CHF/share) 21 17,41 19,39
CONSOLIDATED FINANCIAL STATEMENTS WITH AUDITORS’ REPORT
Consolidated Statement of Incomefor the Year ended August 31, 2000 (in thousands of Swiss Francs)
25

CONSOLIDATED FINANCIAL STATEMENTS WITH AUDITORS’ REPORT
Consolidated Statement of Cash Flowsfor the Year ended August 31, 2000 (in thousands of Swiss Francs)
Cash Flows from Operating Activities
NOTES 2000 1999
Income before minority interest and taxes 108,393 99,345Adjustments for:
Depreciation & amortization of tangible and intangible non-current assets 91,596 76,946Foreign exchange (gain)/loss (83) 823Interest income (4,901) (5,283)Interest expense 56,563 35,895Gain on sale of investments (5,390) (1,558)Other non-operating expense/(income) (7,515) –Income from associated companies 9,493 (4,343)
Operating cash flow before working capital changes 248,156 201,825
(Increase) Decrease in trade accounts receivable 29,592 (28,689)(Increase) Decrease in inventories (270,211) (62,633)(Increase) Decrease in other current assets 51,196 (33,095)(Increase) Decrease in other non-current assets (4,780) (2,327)Increase (Decrease) in trade accounts payable (36,821) (27,919)Increase (Decrease) in other current liabilities 17,400 1,362Increase (Decrease) in other non-current liabilities (31,500) (19,465)
Cash generated from operations 3,032 29,059
Interest paid (53,934) (34,496)Income taxes paid (23,574) (22,177)Realized exchange loss (20,867) (8,155)
Net cash flow from operating activities (95,343) (35,769)
26

Cash Flows from Investing Activities
NOTES 2000 1999
Purchase of property, plant and equipment (105,088) (63,538)Proceeds from sale of property, plant and equipment 16,146 9,388Proceeds from sale of investments 12,205 1,558Acquisition of subsidiaries 22 (80,744) (34,505)Other non operating income/(expense) 7,629 –Interest received 4,494 4,193
Net cash (used)/from investing activities (145,358) (82,904)
Cash Flows from Financing Activities
Increase (Decrease) in short-term debt 300,801 232,413Increase (Decrease) in loans and deposits related parties 10,848 168Increase (Decrease) in long-term debt (27,366) (98,421)Decrease in deposits long-term (1,050) (70)Dividends paid (32,769) (30,858)Dividends paid to minority shareholders (42) –IPO costs – (850)Acquisition of treasury shares (35,953) (34,079)Sale of treasury shares 1,436 –
Net cash (used)/from financing activities 215,905 68,303
Effect of change in consolidation method SACO 3,800 –Effect of change in minority interests (286) –Effect of exchange rate changes on cash and cash equivalents (58) 464
Net increase (decrease) in cash and cash equivalents (21,340) (49,906)
Cash and cash equivalents at beginning of year 12,589 62,495
Cash and cash equivalents at end of year (8,751) 12,589
Cash and cash equivalents 69,249 44,368Bank overdrafts (78,000) (31,779)
Cash and cash equivalents as defined for the cash flow statement (8,751) 12,589
CONSOLIDATED FINANCIAL STATEMENTS WITH AUDITORS’ REPORT
Consolidated Statement of Cash Flowsfor the Year ended August 31, 2000 (in thousands of Swiss Francs)
27

CONSOLIDATED FINANCIAL STATEMENTS WITH AUDITORS’ REPORT
Consolidated Statement of Changes in Equityfor the Year ended August 31, 2000(in thousands of Swiss Francs)
Share Legal Accumulated Treasury Cumulative Totalcapital reserves deficit shares translation
adjustment
At August 31, 1998 517,000 186,872 (128,583) 2,763 578,052Dividends paid (30,858) (30,858)Treasury shares (34,079) (34,079)Corrections IPO costs (850) (850)Reclassification IPO costs 11,558 (11,558) 0Current year translation adjustments 231 6,883 7,114Net profit for the year 100,245 100,245
At August 31, 1999 517,000 198,430 (71,373) (34,079) 9,646 619,624
Effect of IAS 19 revised (14,202) (14,202)Dividends paid (32,769) (32,769)Acquisition of treasury shares (35,953) (35,953)Sale of treasury shares (28) 1,464 1,436Decrease minority share 331 331Current year translation adjustments 20,346 20,346Net profit for the year 90,033 90,033
At August 31, 2000 517,000 198,430 (28,008) (68,568) 29,992 648,846
The legal reserves are not distributable to the shareholders pursuant to Swiss law.
Treasury shares include the book value of CHF 68,568 (1999: CHF 34,079) treasury shares bought by Barry Callebaut AG in or-der to allow the exercise of option rights by members of the Group’s management and Board of Directors (see Note 23).
Treasury shares are valued at cost. The fair value on August 31, 2000 of the treasury shares amounted to CHF 68.0 million.
28
CONSOLIDATED FINANCIAL STATEMENTS WITH AUDITORS’ REPORT
Summary of Accounting Policies
Basis of presentationThe consolidated financial statements ofBarry Callebaut AG and its subsidiaries havebeen prepared in accordance with Internatio-nal Accounting Standards and the provisionsof the Swiss Code of Obligations. For conso-lidation purposes, Barry Callebaut AG and itssubsidiaries (the Group) prepare financial sta-tements using the historical cost conventionon an accrual basis.
Basis of consolidationThe consolidated financial statements of theGroup include all the assets and liabilities ofBarry Callebaut AG and the companies,which it controls. Control is normally eviden-ced when a company owns, either directly orindirectly, more than 50% of the voting rightsof a company’s share capital. The equity andnet income attributable to minority sharehol-ders’ interests are shown separately in the balance sheet and statement of income. All material intercompany transactions andbalances are eliminated. Companies acquiredduring the year are consolidated from theirdate of acquisition and subsidiaries disposedof are included up to the effective date of disposal.
Foreign currency translationAssets and liabilities of Group companies re-porting in currencies other than Swiss Francsare translated to Swiss Francs using year-endrates of exchange. Income and expenses aretranslated at the average rates of exchange forthe year. Differences arising from the transla-tion of foreign currency financial statementsusing the above method are directly creditedor debited to retained earnings and reserves inshareholders’ equity.
Foreign currency transactionsTransactions during the year in foreign cur-rencies are translated into the respective localcurrencies at the exchange rate prevailing atthe date of the transaction. Monetary assetsand liabilities denominated in foreign curren-cies are translated into respective local curren-cies at the exchange rates prevailing at theyear-end date. Exchange gains and losses areincluded in the statement of income.
Financial instrumentsFinancial instruments, which are held for thelong-term or to maturity are stated in the balance sheet at cost less provisions to reducethe carrying amounts to the estimated re-coverable amounts.
Changes in the value of financial instrumentsheld to hedge commodities and currency or interest rate risks are recognized in incometogether with corresponding gains or lossesfrom a change in value of the hedged position. Foreign exchange forward, swap and option contracts are entered into to hedgeagainst foreign currency exposures of theGroup.
Financial instruments, which are not hedgesand are not held for the long-term are statedin the balance sheet at their market value at the year-end. Changes in market value arerecognized in income as they arise.
29
CONSOLIDATED FINANCIAL STATEMENTS WITH AUDITORS’ REPORT
Summary of Accounting Policies
Cash and cash equivalentsCash and cash equivalents comprise cash onhand, bank balances and unrestricted bankdeposit balances with an original maturity of90 days or less.
For the purpose of the Statement of CashFlows, cash consists of cash and cash equiva-lents reduced by the bank overdrafts.
Trade accounts receivableTrade accounts receivable are stated at theirnominal value, less necessary provisions forbad and doubtful debts.
Specific provisions are made for accounts re-ceivable balances of which recovery is doubt-ful. In addition, general provisions are recor-ded for the remaining receivables based onthe expected incidence of bad debts, takinginto account past experience.
InventoriesInventories are stated at the lower of cost ofinventories and net realizable value. The costof inventories comprises the costs of materi-als, direct labour and production overheadsand is determined using the average cost orfirst-in-first-out-method. Net realizable valueis the estimated selling price less costs ofcompletion and direct selling and distribu-tion expenses. Long-term commitments forphysical inventories are hedged and these po-sitions are valued at mark-to-market. Themark-to-market valuation principles appliedare structured to improve the matching of re-venues and expenses as they are incurred.
Investments and loansInvestments in associated companies in whichthe Group holds an interest of between 20% and 50% and has the power to participatein the financial and operating policies of the investee, are accounted for using the equitymethod. The investment is stated at the value of the Group’s share in the company’s equity, and the Group’s share of the net income or loss of the associated company is reflected in income. Goodwill in connectionwith investments in associated companies is accounted for using the same method as for goodwill arising in connection with sub-sidiaries.
Equity interests of less than 20 % and loansare carried at cost less appropriate provisionsfor permanent impairment in value.
Intangible assetsGoodwill
Goodwill, being the excess of the cost of acqui-sition of subsidiaries and associated companiesover the fair value of their attributable net assetsat the date of acquisition, is capitalized andamortized on a straight line basis over their anti-cipated useful life but not exceeding 20 years.Goodwill relating to acquisitions arising prior toAugust 31, 1995 has been fully written offagainst reserves.
30
CONSOLIDATED FINANCIAL STATEMENTS WITH AUDITORS’ REPORT
Summary of Accounting Policies
Negative goodwill, which represents the excessof the Group’s interest in the fair value of theidentifiable net assets over the cost of acquisi-tion, is eliminated proportionately against thefair value of the non-monetary assets acquired.Any amount in excess of the fair value of thenon-monetary assets acquired is treated as defer-red income on a straight-line basis over a periodgenerally not exceeding 20 years.The unamortized balance of goodwill is revie-wed annually and the value is written downif recovery by way of the expected benefits ispermanently impaired.
Other intangible assetsOther acquired intangible assets are amortisedon a straight-line basis over their anticipateduseful life but not exceeding 20 years.
Research and development costsResearch costs and product developmentcosts are expensed as incurred, because it isconsidered impossible to quantify the exi-stence of a market for the related products orprocesses with reasonable assurance.
Development costs for projects are capitalizedas an intangible asset if it can be demonstra-ted that the project will probably generate future economic benefits.
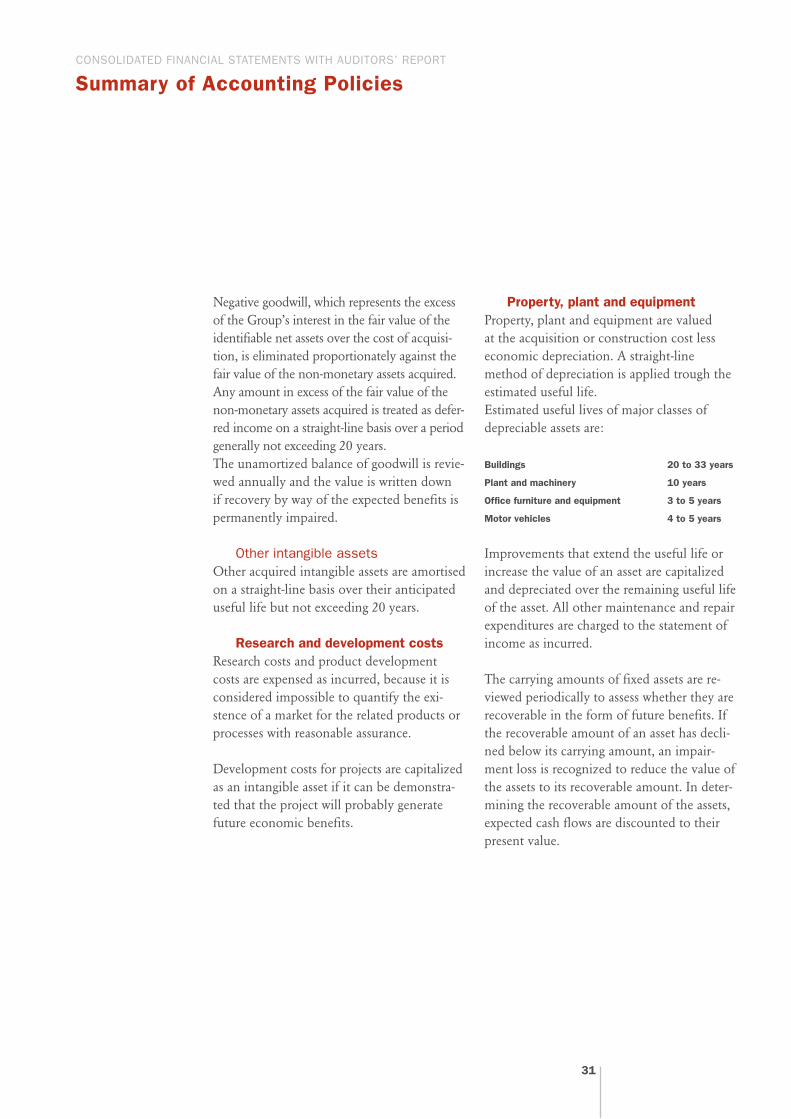
Property, plant and equipmentProperty, plant and equipment are valued at the acquisition or construction cost lesseconomic depreciation. A straight-line method of depreciation is applied trough theestimated useful life.Estimated useful lives of major classes of depreciable assets are:
Buildings 20 to 33 years
Plant and machinery 10 years
Office furniture and equipment 3 to 5 years
Motor vehicles 4 to 5 years
Improvements that extend the useful life orincrease the value of an asset are capitalizedand depreciated over the remaining useful lifeof the asset. All other maintenance and repairexpenditures are charged to the statement ofincome as incurred.
The carrying amounts of fixed assets are re-viewed periodically to assess whether they arerecoverable in the form of future benefits. Ifthe recoverable amount of an asset has decli-ned below its carrying amount, an impair-ment loss is recognized to reduce the value ofthe assets to its recoverable amount. In deter-mining the recoverable amount of the assets,expected cash flows are discounted to theirpresent value.
31

CONSOLIDATED FINANCIAL STATEMENTS WITH AUDITORS’ REPORT
Summary of Accounting Policies
Leased assetsLeases are classified as finance leases when-ever the terms of the lease transfer substanti-ally all the risk and rewards of ownership tothe lessee.
Assets held under finance leases are recog-nized as assets of the Group at their fair value at the date of acquisition. The correspondingliability to the lessor is included in the balance sheet as a finance lease obligation. Finance costs, which represent the differencebetween the total leasing commitment andthe fair value of the assets acquired, are charg-ed to the income statement over the term ofthe relevant lease so as to produce a constantperiodic interest charge on the remainingbalance of the obligations for each accountingperiod.Rentals payable under operating leases arecharged to the income statement as incurred.
Employee benefits Post-employment benefits
The liabilities of the Group arising from defin-ed benefit obligations and the related current service costs, are determined on anactuarial basis at least every three years usingthe projected unit credit method. Actuarial gains and losses are recognized inthe income statement, over the remainingworking lives of the employee, only to the extent that their cumulative amount exceeds10% of the greater of the present value of theobligation or of the fair value of plan assets.
For defined benefit plans the actuarial costscharged to the income statement consists ofcurrent service costs, interest costs, expected return on plan assets and past service costs aswell as actuarial gains or losses to the extentthey are recognized. The past service costs forthe enhancement of pension benefits is ac-counted for when such benefits vest.
Some benefits are also provided by definedcontribution plans; contributions to suchplans are charged to the income statement asincurred.
Post-retirement benefits other than pensions
Certain subsidiaries provide healthcare andinsurance benefits for a portion of their reti-red employees and their eligible dependent.The cost of these benefits is actuarially deter-mined and included in the related functionexpenses over the employees’ working lives.The related liability is included in long-termliabilities.
Employee share participation plansNo compensation cost is recognized in thesefinancial statements for options granted toemployees from employee share participationplans.
Other long-term employee benefitsOther long-term employee benefits representamounts due to employees under deferredcompensation arrangements mandated bycertain jurisdictions in which the Group con-ducts its operations. Benefit cost is recognizedon an accrual basis in the income statement.The related liability is included in other long-term liabilities.
32
CONSOLIDATED FINANCIAL STATEMENTS WITH AUDITORS’ REPORT
Summary of Accounting Policies
TaxesTaxes are provided based on reported incomeand include taxes on capital as well as non-re-coverable taxes withheld on dividends, ma-nagement fees and royalties received or paid.Such taxes are calculated in accordance withthe tax regulations in effect in each country.
The Group provides for deferred taxes usingthe comprehensive liability method. Provi-sion is made in respect of all temporary diffe-rences arising between the tax values of assetsand liabilities and their values in the consoli-dated financial statements. Provision is madeagainst deferred tax assets to the extent that itis improbable that these will be realized. De-ferred tax balances are adjusted for subse-quent changes in tax rates and for new taxesimposed.
Non-recoverable withholding taxes are onlyaccrued if distribution by subsidiary compa-nies is foreseen.
Revenues from sales and servicesRevenues from the sale of goods are recog-nized when title passes to the buyer. Appropri-ate provisions are made for all additionalcosts to be incurred in connection with thesales including the cost of returns.
Government grantsProvided that there is reasonable assurancethat they will be irrevocably received, grantsrelating to capital expenditure are deductedfrom the cost of the fixed assets. Other grantsare recognized in income over the periods ofthe related costs.
ProvisionsProvisions are recorded for identifiable penal-ties, committed costs and restructuring costs.Provision for restructuring costs are recordedat such time as the management approves thedecision to restructure and a detailed formalplan for restructuring is properly communica-ted.
33
CONSOLIDATED FINANCIAL STATEMENTS WITH AUDITORS’ REPORT
Notes
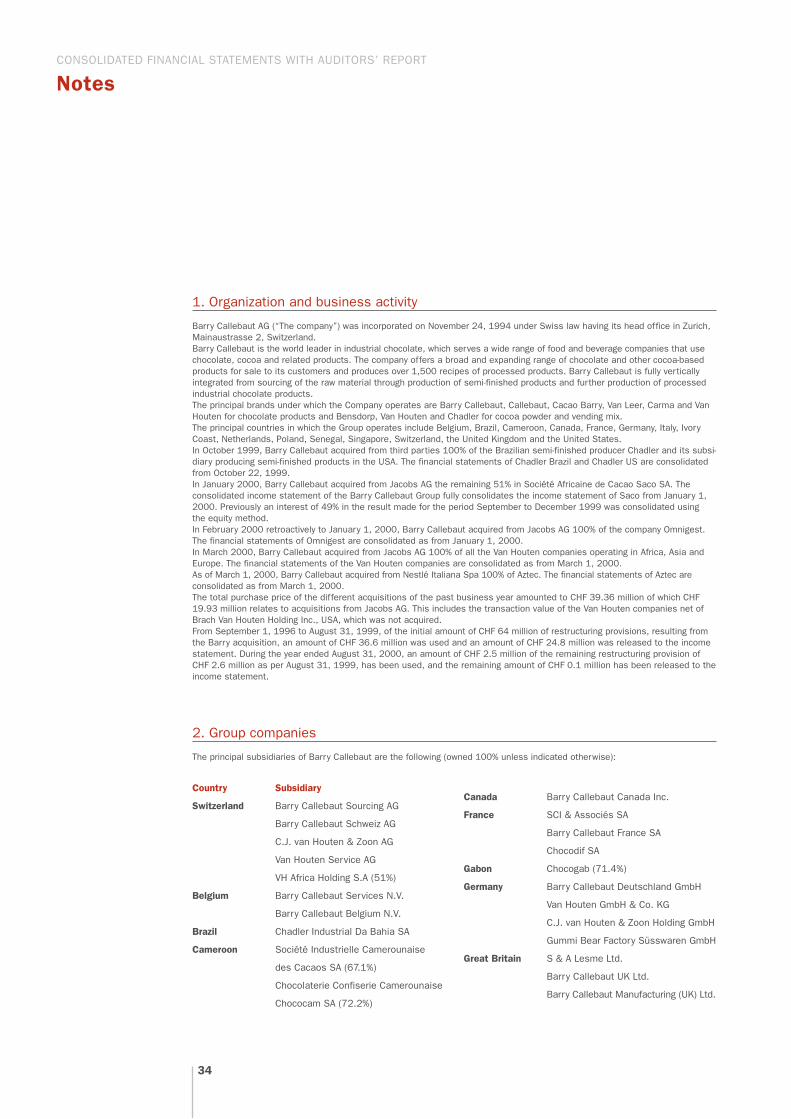
1. Organization and business activity
Barry Callebaut AG (“The company”) was incorporated on November 24, 1994 under Swiss law having its head office in Zurich,Mainaustrasse 2, Switzerland. Barry Callebaut is the world leader in industrial chocolate, which serves a wide range of food and beverage companies that usechocolate, cocoa and related products. The company offers a broad and expanding range of chocolate and other cocoa-basedproducts for sale to its customers and produces over 1,500 recipes of processed products. Barry Callebaut is fully verticallyintegrated from sourcing of the raw material through production of semi-finished products and further production of processedindustrial chocolate products.The principal brands under which the Company operates are Barry Callebaut, Callebaut, Cacao Barry, Van Leer, Carma and VanHouten for chocolate products and Bensdorp, Van Houten and Chadler for cocoa powder and vending mix.The principal countries in which the Group operates include Belgium, Brazil, Cameroon, Canada, France, Germany, Italy, IvoryCoast, Netherlands, Poland, Senegal, Singapore, Switzerland, the United Kingdom and the United States.In October 1999, Barry Callebaut acquired from third parties 100% of the Brazilian semi-finished producer Chadler and its subsi-diary producing semi-finished products in the USA. The financial statements of Chadler Brazil and Chadler US are consolidatedfrom October 22, 1999.In January 2000, Barry Callebaut acquired from Jacobs AG the remaining 51% in Société Africaine de Cacao Saco SA. Theconsolidated income statement of the Barry Callebaut Group fully consolidates the income statement of Saco from January 1,2000. Previously an interest of 49% in the result made for the period September to December 1999 was consolidated usingthe equity method.In February 2000 retroactively to January 1, 2000, Barry Callebaut acquired from Jacobs AG 100% of the company Omnigest.The financial statements of Omnigest are consolidated as from January 1, 2000.In March 2000, Barry Callebaut acquired from Jacobs AG 100% of all the Van Houten companies operating in Africa, Asia andEurope. The financial statements of the Van Houten companies are consolidated as from March 1, 2000.As of March 1, 2000, Barry Callebaut acquired from Nestlé Italiana Spa 100% of Aztec. The financial statements of Aztec areconsolidated as from March 1, 2000.The total purchase price of the different acquisitions of the past business year amounted to CHF 39.36 million of which CHF19.93 million relates to acquisitions from Jacobs AG. This includes the transaction value of the Van Houten companies net ofBrach Van Houten Holding Inc., USA, which was not acquired.From September 1, 1996 to August 31, 1999, of the initial amount of CHF 64 million of restructuring provisions, resulting fromthe Barry acquisition, an amount of CHF 36.6 million was used and an amount of CHF 24.8 million was released to the incomestatement. During the year ended August 31, 2000, an amount of CHF 2.5 million of the remaining restructuring provision ofCHF 2.6 million as per August 31, 1999, has been used, and the remaining amount of CHF 0.1 million has been released to theincome statement.
2. Group companies
The principal subsidiaries of Barry Callebaut are the following (owned 100% unless indicated otherwise):
Country Subsidiary
Switzerland Barry Callebaut Sourcing AG
Barry Callebaut Schweiz AG
C.J. van Houten & Zoon AG
Van Houten Service AG
VH Africa Holding S.A (51%)
Belgium Barry Callebaut Services N.V.
Barry Callebaut Belgium N.V.
Brazil Chadler Industrial Da Bahia SA
Cameroon Société Industrielle Camerounaise
des Cacaos SA (67.1%)
Chocolaterie Confiserie Camerounaise
Chococam SA (72.2%)
34
Canada Barry Callebaut Canada Inc.
France SCI & Associés SA
Barry Callebaut France SA
Chocodif SA
Gabon Chocogab (71.4%)
Germany Barry Callebaut Deutschland GmbH
Van Houten GmbH & Co. KG
C.J. van Houten & Zoon Holding GmbH
Gummi Bear Factory Süsswaren GmbH
Great Britain S & A Lesme Ltd.
Barry Callebaut UK Ltd.
Barry Callebaut Manufacturing (UK) Ltd.

CONSOLIDATED FINANCIAL STATEMENTS WITH AUDITORS’ REPORT
Notes
Italy Barry Callebaut Italia S.p.A.
Aztec Srl.
Ivory Coast Société Africaine de Cacao SACO SA
Barry Callebaut Negoce SA
SN Chocodi SA (98.6%)
Mexico Barry Callebaut Mexico SA
Netherlands Barry Callebaut Holding B.V.
Barry Callebaut Netherlands B.V.
Panama Adis Holdings Inc.
Van Houten Finance & Trading Inc.
3. Trade accounts receivable
CHF 000 2000 1999
Trade accounts receivable 395,689 341,595Provision for doubtful debts (21,977) (10,905)
373,712 330,690
4. Inventories
CHF 000 2000 1999
Raw materials and packaging materials 539,012 260,828Semi-finished and finished products 215,734 149,001Other 4,424 10,445
759,170 420,274
5. Other current assets
CHF 000 2000 1999
Prepaid expenses 8,699 9,651Accrued income 22,093 8,431Prepaid taxes 14,384 7,307Receivables from government 6,837 6,766Margin calls paid – 16,668Current account Jacobs AG 25,074 –Other 45,241 33,295
122,328 82,118
35
Poland Barry Callebaut Polska Sp.z.o.o (95%)
Senegal Chocosen SA (51.0%)
Singapore Barry Callebaut Asia Pacific
(Singapore) Pte. Ltd.
Van Houten (Singapore) Pte. Ltd.
Spain Barry Callebaut Iberica SL
USA Barry Callebaut USA Inc.
Chadler US
The Group had 5,158 and 3,219 employees at August 31,2000 and 1999, respectively.

CONSOLIDATED FINANCIAL STATEMENTS WITH AUDITORS’ REPORT
Notes
6. Property, plant and equipment
COSTS Land and Plant and Furniture Under Total Total CHF 000 buildings machinery equipment construction 2000 1999
and motorvehicles
Beginning of the period 207,736 600,461 76,313 34,199 918,709 847,238Change in group structure 135,885 152,134 27,378 1,161 316,558 21,293Additions 2,389 24,232 12,382 41,471 80,474 65,919Disposals (4,245) (11,789) (1,131) (8,295) (25,460) (25,656)Currency translation adjustments 4,380 11,533 (651) 1,643 16,905 9,774Reclassifications 15,539 49,439 8,948 (50,712) 23,214 141
At August 31 361,864 826,010 123,239 19,467 1,330,400 918,709
ACCUMULATED DEPRECIATION
Beginning of the period 63,559 381,825 57,027 (4) 502,407 453,200Change in Group Structure 86,524 103,717 22,616 – 212,857Depreciation change 10,928 50,443 8,705 – 70,076 59,983Disposals (719) (7,694) (901) – (9,314) (16,268)Currency translation adjustments (588) 3,633 (903) – 2,142 3,655Change for restructuring – – – – – 1,696Reclassifications 366 7,385 476 – 8,227 141
At August 31 160,070 539,309 87,020 (4) 786,395 502,407
Net at September 1, 1999 144,177 218,636 19,286 34,203 – 416,302
Net at August 31, 2000 201,614 286,701 36,219 19,471 544,005 –
Repairs and maintenance expense for the business year 2000 amounted to CHF 42,861 (1999: CHF 31,209). The fire insu-rance value of property, plant and equipment amounted to CHF 1,591,282 and CHF 1,105,879 at August 31, 2000 and 1999,respectively.
No impairment of assets had to be recognized in the income statement.
At August 31, 2000 tangible assets held under financial leases amount to CHF 2,452 (1999: CHF 1,877).
36
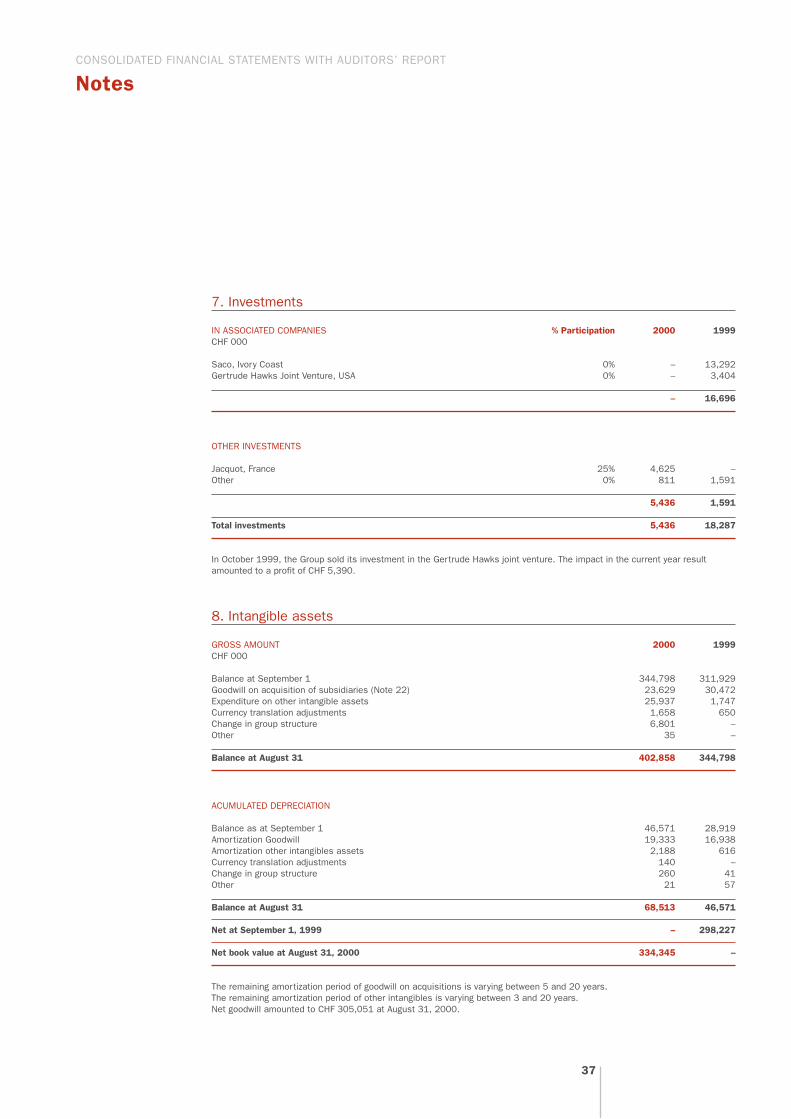
7. Investments
IN ASSOCIATED COMPANIES % Participation 2000 1999CHF 000
Saco, Ivory Coast 0% – 13,292Gertrude Hawks Joint Venture, USA 0% – 3,404
– 16,696
OTHER INVESTMENTS
Jacquot, France 25% 4,625 –Other 0% 811 1,591
5,436 1,591
Total investments 5,436 18,287
In October 1999, the Group sold its investment in the Gertrude Hawks joint venture. The impact in the current year resultamounted to a profit of CHF 5,390.
8. Intangible assets
GROSS AMOUNT 2000 1999CHF 000
Balance at September 1 344,798 311,929Goodwill on acquisition of subsidiaries (Note 22) 23,629 30,472Expenditure on other intangible assets 25,937 1,747Currency translation adjustments 1,658 650Change in group structure 6,801 –Other 35 –
Balance at August 31 402,858 344,798
ACUMULATED DEPRECIATION
Balance as at September 1 46,571 28,919Amortization Goodwill 19,333 16,938Amortization other intangibles assets 2,188 616Currency translation adjustments 140 –Change in group structure 260 41Other 21 57
Balance at August 31 68,513 46,571
Net at September 1, 1999 – 298,227
Net book value at August 31, 2000 334,345 –
The remaining amortization period of goodwill on acquisitions is varying between 5 and 20 years.The remaining amortization period of other intangibles is varying between 3 and 20 years.Net goodwill amounted to CHF 305,051 at August 31, 2000.
CONSOLIDATED FINANCIAL STATEMENTS WITH AUDITORS’ REPORT
Notes
37
CONSOLIDATED FINANCIAL STATEMENTS WITH AUDITORS’ REPORT
Notes
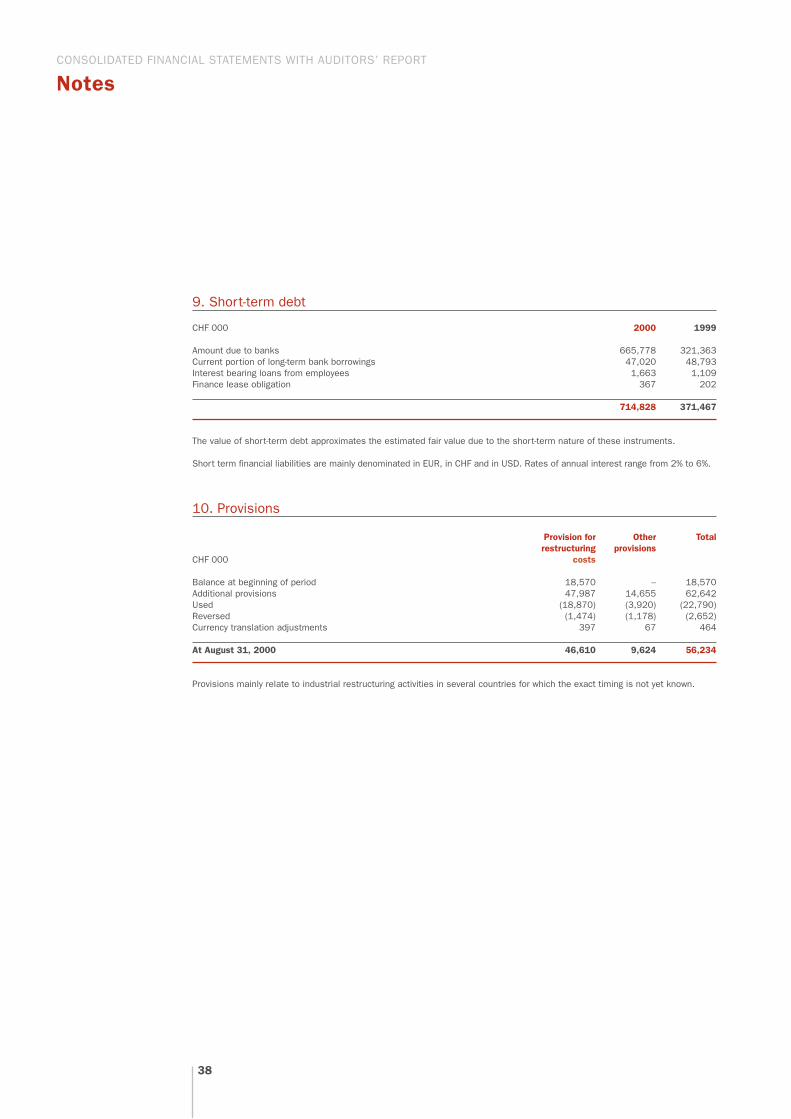
9. Short-term debt
CHF 000 2000 1999
Amount due to banks 665,778 321,363Current portion of long-term bank borrowings 47,020 48,793Interest bearing loans from employees 1,663 1,109Finance lease obligation 367 202
714,828 371,467
The value of short-term debt approximates the estimated fair value due to the short-term nature of these instruments.
Short term financial liabilities are mainly denominated in EUR, in CHF and in USD. Rates of annual interest range from 2% to 6%.
10. Provisions
Provision for Other Totalrestructuring provisions
CHF 000 costs
Balance at beginning of period 18,570 – 18,570Additional provisions 47,987 14,655 62,642Used (18,870) (3,920) (22,790)Reversed (1,474) (1,178) (2,652)Currency translation adjustments 397 67 464
At August 31, 2000 46,610 9,624 56,234
Provisions mainly relate to industrial restructuring activities in several countries for which the exact timing is not yet known.
38

CONSOLIDATED FINANCIAL STATEMENTS WITH AUDITORS’ REPORT
Notes
11. Other current liabilities
CHF 000 2000 1999
Accrued wages and social charges 35,383 30,037Pension liabilities 1,404 1,382Interest 3,029 2,164Year end rebates and commissions 6,406 4,299Other taxes 8,021 3,246Margin calls received 690 149Payable to Jacobs AG 9,177 –Other 47,684 19,003
111,794 60,280
12. Long-term debt
CHF 000 2000 1999
Bank borrowings (in various currencies and at rates varying between 2% and 12.5% p.a.) 346,155 346,949Less current portion (note 9) (47,020) (48,793)Interest bearing loans from employees 4,556 6,660Long-term other loans 1,157 203Finance lease obligation 975 1,185
305,823 306,204
Long-term debt, stemming from loans relating to the consolidation of the Barry acquisition loans in February 1998, remainssubject to financial covenants to the effect that the consolidated net shareholders’ equity, minus goodwill in excess of CHF 300million, shall not be less than to 30% of the consolidated balance sheet total minus cash and cash equivalents and minus good-will in excess of CHF 300 million. Further, the consolidated equity must be equivalent to the level reached as at August 31,1997 of CHF 315 million.
Repayments of long-term debt are due in the following fiscal years:
CHF 000 2000 1999
2000/01 – 39,9132001/02 46,416 46,3242002/03 45,629 38,4892003/04 179,194 180,3682004/05 and thereafter (1999) 4,672 1,1102005/06 and thereafter (2000) 29,912 –
305,823 306,204
39

CONSOLIDATED FINANCIAL STATEMENTS WITH AUDITORS’ REPORT
Notes
13. Obligations under finance leases
Present value of Minimum lease payments minimum lease payments
CHF 000 2000 1999 2000 1999
Amounts payables under finance leases
within one year 419 260 367 202In the second to fifth year inclusive 604 729 519 604More than five years 461 594 456 581
1,484 1,583 1,342 1,387
less: future finance charges (142) (196) n/a n/a
Present value of lease obligations 1,342 1,387 1,342 1,387
less: amount due for settlement within 12 months (367) (202)
Amount due for settlement after 12 months 975 1,185
The Group entered into finance leasing arrangements for certain buildings and machinery. The average term of finance leasesentered into is 10 years. The average effective borrowing rate was 6%. Interest rates are fixed at the contract date. All leasesare on a fixed repayment basis and no arrangement has been entered into for contingent rental payment.
The fair value of the Group’s obligations approximates to their carrying amount.
14. Other non-current liabilities
CHF 000 2000 1999
Pension liabilities (Note 23) 62,214 4,164Other 3,555 4,021
65,769 8,185
40
CONSOLIDATED FINANCIAL STATEMENTS WITH AUDITORS’ REPORT
Notes
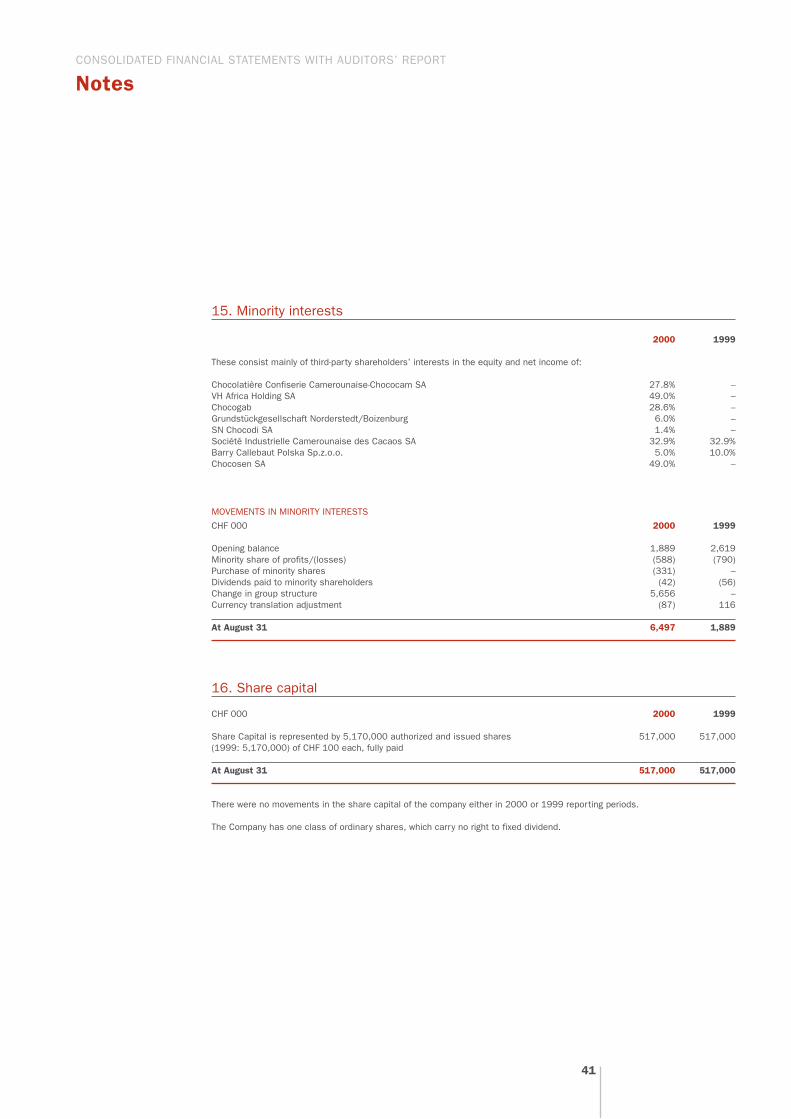
15. Minority interests
2000 1999
These consist mainly of third-party shareholders’ interests in the equity and net income of:
Chocolatière Confiserie Camerounaise-Chococam SA 27.8% –VH Africa Holding SA 49.0% –Chocogab 28.6% –Grundstückgesellschaft Norderstedt/Boizenburg 6.0% –SN Chocodi SA 1.4% –Société Industrielle Camerounaise des Cacaos SA 32.9% 32.9%Barry Callebaut Polska Sp.z.o.o. 5.0% 10.0%Chocosen SA 49.0% –
MOVEMENTS IN MINORITY INTERESTS
CHF 000 2000 1999
Opening balance 1,889 2,619Minority share of profits/(losses) (588) (790)Purchase of minority shares (331) –Dividends paid to minority shareholders (42) (56)Change in group structure 5,656 –Currency translation adjustment (87) 116
At August 31 6,497 1,889
16. Share capital
CHF 000 2000 1999
Share Capital is represented by 5,170,000 authorized and issued shares 517,000 517,000(1999: 5,170,000) of CHF 100 each, fully paid
At August 31 517,000 517,000
There were no movements in the share capital of the company either in 2000 or 1999 reporting periods.
The Company has one class of ordinary shares, which carry no right to fixed dividend.
41

CONSOLIDATED FINANCIAL STATEMENTS WITH AUDITORS’ REPORT
Notes
17. Research and development costs
Operating expenses include CHF 5.207 million (1999: CHF 5.448 million) research and development costs.
18. Non-operating income and expense
CHF 000 2000 1999
Foreign exchange results 83 (823)Gain on sale of investment in Gertrude Hawks 5,390 –Other
Gain related to fixed assets damage 5,460 –Gain on sale of property 3,577 1,418Other (1,523) 140
12,987 735
19. Financial income and expense
CHF 000 2000 1999
Interest income 4,901 5,283Interest expense (56,563) (35,895)Other (1,675) (1,000)
(53,337) (31,612)
Interest expense includes interest paid under a commodity repurchase agreement for an amount of CHF 9.9 million for the year2000. In 1999 these interests amounted to CHF 7.1 million and were included in materials consumed, because the commodityrepurchase agreement was treated as an off-balance sheet transaction.
20. Taxes
Tax losses carried forward utilised during the year were CHF 29.3 million (1999: CHF 0 million). The Group capitalized deferredtax assets relating to losses carried forward for an amount of CHF 3.2 million. At August 31, 2000, the Group had unutilized taxlosses carried forward of approximately CHF 462.1 million (1999: CHF 18.3 million) which are available for offset against futuretaxable income. Of these CHF 462.1 million, CHF 253.7 million can be used for an unlimited period of time. The remaining CHF208.4 million expires as follows: CHF 3.4 million in 2002, CHF 8.9 million in 2003, CHF 2.2 million in 2005, CHF 72.0 millionin 2006, CHF 120.9 million in 2007, CHF 0.6 million in 2009 and CHF 0.4 million in 2010.
TAX EXPENSESCHF 000 2000 1999
Current taxes 23,812 17,267Deferred taxes (1,964) (6,597)Release of tax provisions (2,900) (10,780)
18,948 (110)
42

CONSOLIDATED FINANCIAL STATEMENTS WITH AUDITORS’ REPORT
Notes
RECONCILIATION OF TAX EXPENSESCHF 000 2000 1999
Income before taxes and minority interest 108,393 99,345Expected taxes at the domestic rates applicable to profit in the countries concerned 44,632 30,977Weighted average applicable tax rate 41.18% 31.18%Tax relief on losses carried forward (9,986) –Tax effect of non deductible expenses 13,645 7,479Tax effect of income not subject to tax (28,765) (25,633)Release of tax provisions at consolidated level, net (2,900) (10,780)Adjustments related to prior years 2,322 –Benefit from previously unrecognized differences – (2,153)
18,948 (110)
The substantial increase of weighted average effective tax rate is due to a number of non tax effective expenses on consolida-tion level (goodwill amortization, provisions on group level) and an increased weight of higher taxed countries in the compositionof the profit before taxes. The increased weight of higher taxed countries is partly due to the acquisitions of companies with arelatively high tax rate.
DEFERRED TAXES
The deferred tax provision of CHF 35.8 million (1999: CHF 33.5 million) results from temporary differences arising from accele-rated depreciation of fixed assets used for tax purposes for an amount of CHF 19.1 million (1999: CHF 25.0 million), provisionswhich have been deducted only for tax purposes for an amount of CHF 6.1 million (1999: CHF 7.5 million) and other temporarydifferences for an amount of CHF 10.6 million (1999: CHF 1.0 million).
The deferred tax assets of CHF 6.5 million (1999: CHF 1.0 million) result from capitalization of tax losses carried forward for anamount of CHF 3.2 million (1999: CHF 0 million) and temporary differences for an amount of CHF 3.3 million.The deferred tax income of CHF 2.0 million (1999: CHF 6.6 million) is relating to accelerated depreciation of fixed assets fortax purposes for an amount of CHF 6.0 million (1999: 3.4 million), provisions which have been deducted only for tax purposesfor an amount of CHF 1.3 million (1999: CHF 2.9 million), other temporary differences for an amount of CHF –8.5 million (1999:CHF 0.3 million) and capitalization of tax losses carried forward for an amount of CHF 3.2 million (1999: CHF 0 million).
21. Earnings per share
The following amounts of earnings have been used as the numerator in the calculation of basic and diluted earnings per share:
CHF 000 2000 1999
Net result attributable to ordinary shareholders, used as nominator for basic earnings per share 90,033 100,245After tax effect of income and expense on dilutive potential ordinary shares – –Adjusted net result used as nominator for diluted earnings per share 90,033 100,245
The following numbers of shares have been used as the denominator in the calculation of basic and diluted earnings per share:
CHF 000 2000 1999
Weighted average number of shares issued 5,170,000 5,170,000Weighted average number of treasury shares 195,635 71,893Weighted average number of ordinary shares outstanding, used as denominator for basic earnings per share 4,974,365 5,098,107Weighted average number of dilutive treasury shares held in coverage of the stock option plan 195,635 71,893Adjusted weighted average number of ordinary shares, used as denominator for diluted earnings per share 5,170,000 5,170,000
43

CONSOLIDATED FINANCIAL STATEMENTS WITH AUDITORS’ REPORT
Notes
22. Cash flow from acquisitions
ACQUISITIONS
CHF 000 2000 1999
Current assets (229,361) (25,966)Non-current assets (132,832) (21,410)Goodwill (23,629) (31,113)Short-term liabilities 236,450 13,642Long-term liabilities 104,195 27,700Minority interest 5,814 –
Total purchase price (39,363) (37,147)
Part of purchase price not paid in cash 9,177 –
Less: Cash and bank overdrafts acquired (50,558) 2,642
Cash flow for acquisition, net of cash and bank overdrafts acquired (80,744) (34,505)
Net profit for the year includes profit of CHF 6.1 million from companies acquired in fiscal year 2000 and loss of CHF 1.5 millionfrom companies acquired in 1999 (loss of CHF 1.2 million for the year 1999 from companies acquired in 1999).
23. Employee benefits
The group has, apart from the legally required social security schemes, numerous independent pension plans. The assets are principally held externally. For certain Group companies, however, no independent assets exist for the pensionand other long-term employee benefit obligations. In these cases the related liability is included in the balance sheet.
LIABILITIES RECOGNIZED IN THE BALANCE SHEET
CHF 000 2000 1999
Pension Fundsdefined benefit plans 57,780 4,164
Other post retirement benefits plans 356 –Other long-term employee benefits 4,078 –
62,214 4,164
ASSETS RECOGNIZED IN THE BALANCE SHEET
CHF 000 2000 1999
Pension Fundsdefined benefit plans 2,269 –
2,269 –
44
CONSOLIDATED FINANCIAL STATEMENTS WITH AUDITORS’ REPORT
Notes
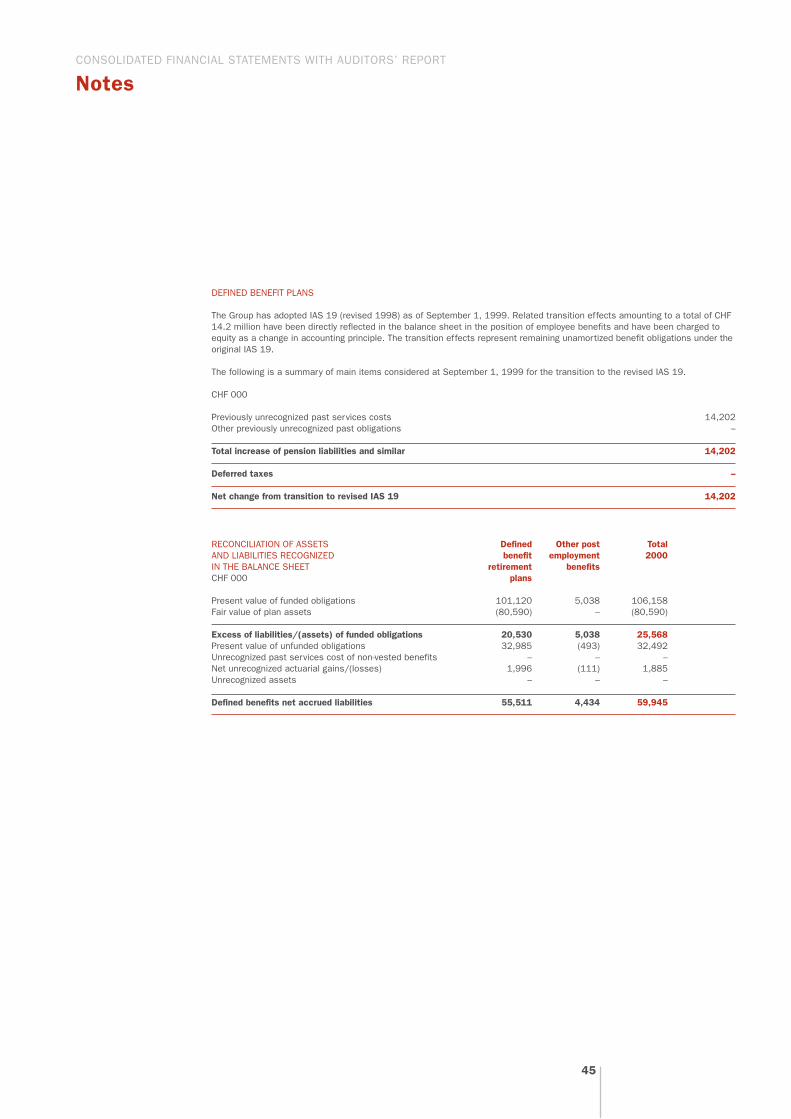
DEFINED BENEFIT PLANS
The Group has adopted IAS 19 (revised 1998) as of September 1, 1999. Related transition effects amounting to a total of CHF14.2 million have been directly reflected in the balance sheet in the position of employee benefits and have been charged toequity as a change in accounting principle. The transition effects represent remaining unamortized benefit obligations under theoriginal IAS 19.
The following is a summary of main items considered at September 1, 1999 for the transition to the revised IAS 19.
CHF 000
Previously unrecognized past services costs 14,202Other previously unrecognized past obligations –
Total increase of pension liabilities and similar 14,202
Deferred taxes –
Net change from transition to revised IAS 19 14,202
RECONCILIATION OF ASSETS Defined Other post TotalAND LIABILITIES RECOGNIZED benefit employment 2000IN THE BALANCE SHEET retirement benefitsCHF 000 plans
Present value of funded obligations 101,120 5,038 106,158Fair value of plan assets (80,590) – (80,590)
Excess of liabilities/(assets) of funded obligations 20,530 5,038 25,568Present value of unfunded obligations 32,985 (493) 32,492Unrecognized past services cost of non-vested benefits – – –Net unrecognized actuarial gains/(losses) 1,996 (111) 1,885Unrecognized assets – – –
Defined benefits net accrued liabilities 55,511 4,434 59,945
45
CONSOLIDATED FINANCIAL STATEMENTS WITH AUDITORS’ REPORT
Notes
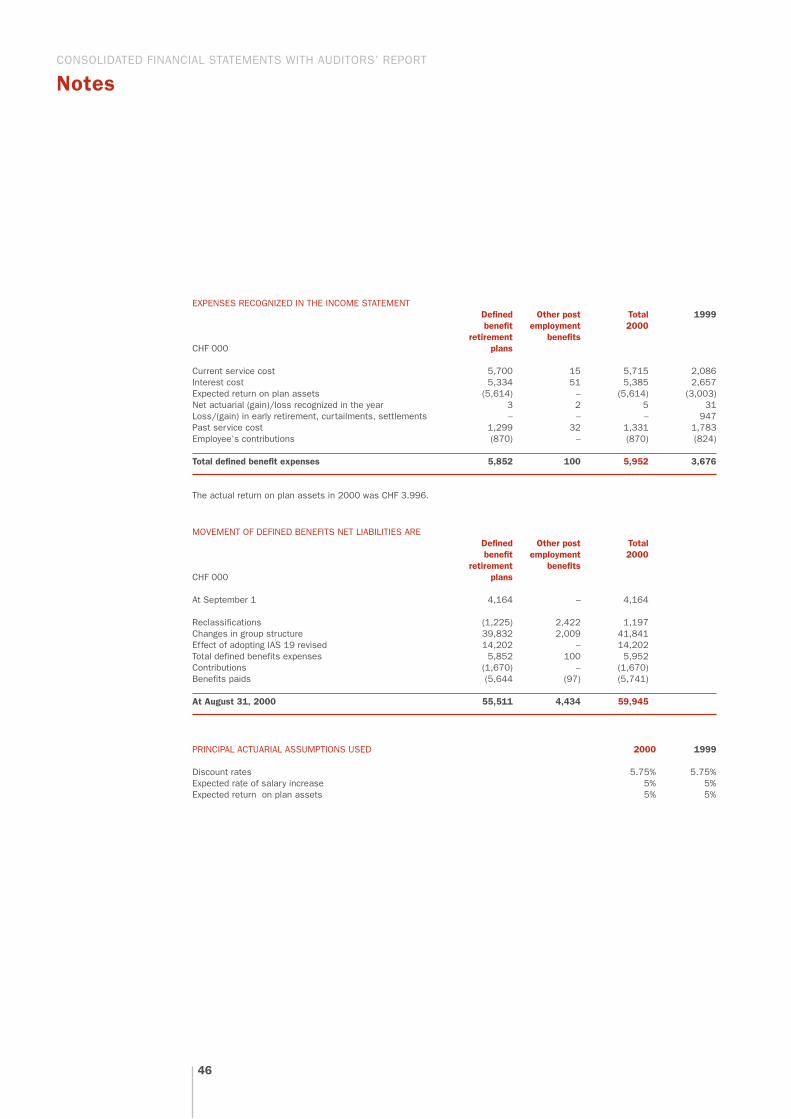
EXPENSES RECOGNIZED IN THE INCOME STATEMENTDefined Other post Total 1999benefit employment 2000
retirement benefitsCHF 000 plans
Current service cost 5,700 15 5,715 2,086Interest cost 5,334 51 5,385 2,657Expected return on plan assets (5,614) – (5,614) (3,003)Net actuarial (gain)/loss recognized in the year 3 2 5 31Loss/(gain) in early retirement, curtailments, settlements – – – 947Past service cost 1,299 32 1,331 1,783Employee’s contributions (870) – (870) (824)
Total defined benefit expenses 5,852 100 5,952 3,676
The actual return on plan assets in 2000 was CHF 3.996.
MOVEMENT OF DEFINED BENEFITS NET LIABILITIES AREDefined Other post Totalbenefit employment 2000
retirement benefitsCHF 000 plans
At September 1 4,164 – 4,164
Reclassifications (1,225) 2,422 1,197Changes in group structure 39,832 2,009 41,841Effect of adopting IAS 19 revised 14,202 – 14,202Total defined benefits expenses 5,852 100 5,952Contributions (1,670) – (1,670)Benefits paids (5,644 (97) (5,741)
At August 31, 2000 55,511 4,434 59,945
PRINCIPAL ACTUARIAL ASSUMPTIONS USED 2000 1999
Discount rates 5.75% 5.75%Expected rate of salary increase 5% 5%Expected return on plan assets 5% 5%
46

CONSOLIDATED FINANCIAL STATEMENTS WITH AUDITORS’ REPORT
Notes
SHARE COMPENSATION PLAN
The Group has adopted various incentive plans to attract, retain and motivate management and employees and to reward themfor their contribution to the performance of the Group.
In fiscal year 1998, the Group introduced a stock option plan. Under this plan, a specific limited group of executives and someof the members of the Board of Directors are granted options to acquire registered shares of Barry Callebaut AG at a predeter-mined strike price. The options will vest on the basis of 20% per year over five years. Once vested, the options can be exercisedover a period of 5 years.
The number of options granted depends on the performance of the individuals. No expenses related to the stock option planwere recorded in the income statement.
Number of Weighted Number of Weightedoptions average options average
exercise exerciseprice price
(CHF) (CHF)
2000 1999
Outstanding at September 1 127,500 –Granted during the year 187,000 127,500Exercised during the year – –Forfeited during the year – –
Outstanding as at August 31 314,500 127,500
Exercisible as at August 31 99,000 263 32,500 322
The rights are exercised through the year in accordance with the rules of the plan.
The total options outstanding at August 31, 2000 had exercise prices ranging from CHF 234.5 to CHF 322.
47
CONSOLIDATED FINANCIAL STATEMENTS WITH AUDITORS’ REPORT
Notes
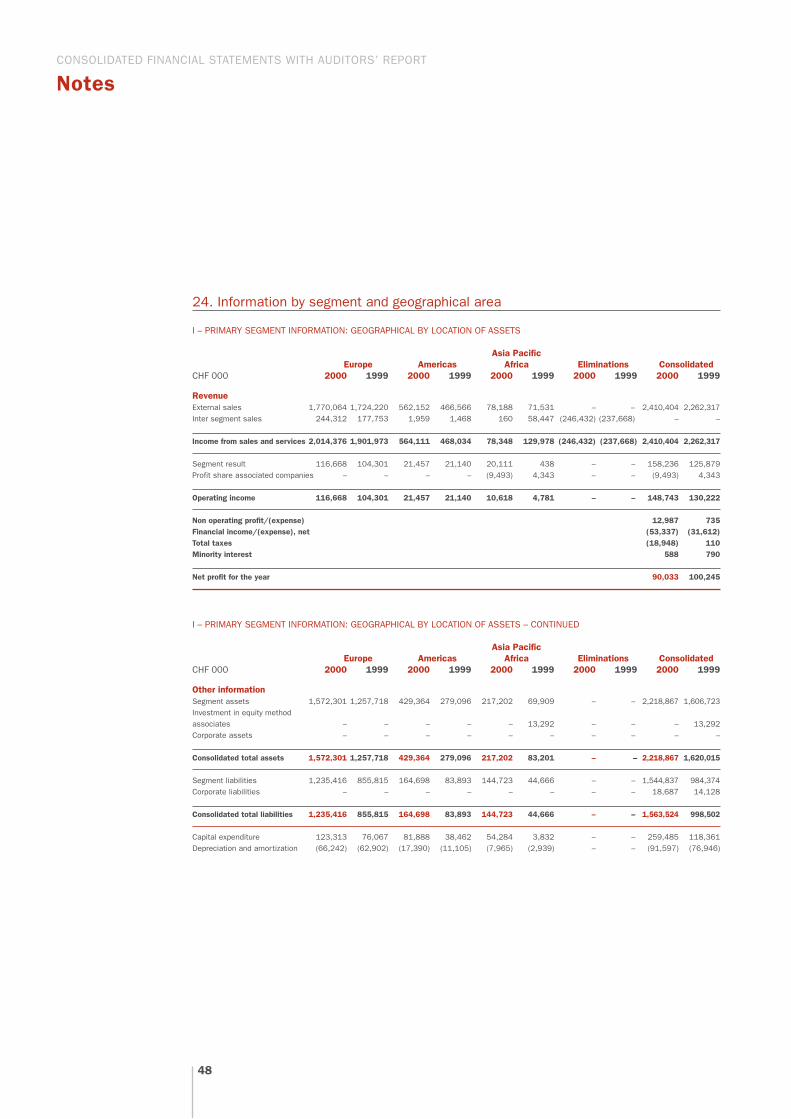
24. Information by segment and geographical area
I – PRIMARY SEGMENT INFORMATION: GEOGRAPHICAL BY LOCATION OF ASSETS
Asia PacificEurope Americas Africa Eliminations Consolidated
CHF 000 2000 1999 2000 1999 2000 1999 2000 1999 2000 1999
RevenueExternal sales 1,770,064 1,724,220 562,152 466,566 78,188 71,531 – – 2,410,404 2,262,317Inter segment sales 244,312 177,753 1,959 1,468 160 58,447 (246,432) (237,668) – –
Income from sales and services 2,014,376 1,901,973 564,111 468,034 78,348 129,978 (246,432) (237,668) 2,410,404 2,262,317
Segment result 116,668 104,301 21,457 21,140 20,111 438 – – 158,236 125,879Profit share associated companies – – – – (9,493) 4,343 – – (9,493) 4,343
Operating income 116,668 104,301 21,457 21,140 10,618 4,781 – – 148,743 130,222
Non operating profit/(expense) 12,987 735Financial income/(expense), net (53,337) (31,612)Total taxes (18,948) 110Minority interest 588 790
Net profit for the year 90,033 100,245
I – PRIMARY SEGMENT INFORMATION: GEOGRAPHICAL BY LOCATION OF ASSETS – CONTINUED
Asia PacificEurope Americas Africa Eliminations Consolidated
CHF 000 2000 1999 2000 1999 2000 1999 2000 1999 2000 1999
Other informationSegment assets 1,572,301 1,257,718 429,364 279,096 217,202 69,909 – – 2,218,867 1,606,723Investment in equity methodassociates – – – – – 13,292 – – – 13,292Corporate assets – – – – – – – – – –
Consolidated total assets 1,572,301 1,257,718 429,364 279,096 217,202 83,201 – – 2,218,867 1,620,015
Segment liabilities 1,235,416 855,815 164,698 83,893 144,723 44,666 – – 1,544,837 984,374Corporate liabilities – – – – – – – – 18,687 14,128
Consolidated total liabilities 1,235,416 855,815 164,698 83,893 144,723 44,666 – – 1,563,524 998,502
Capital expenditure 123,313 76,067 81,888 38,462 54,284 3,832 – – 259,485 118,361Depreciation and amortization (66,242) (62,902) (17,390) (11,105) (7,965) (2,939) – – (91,597) (76,946)
48

CONSOLIDATED FINANCIAL STATEMENTS WITH AUDITORS’ REPORT
Notes
II – SECONDARY BUSINESS SEGMENT INFORMATION
Chocolate/Gourmet & Cocoa Other ConsolidatedSpecialties products products products
CHF 000 2000 1999 2000 1999 2000 1999 2000 1999
Revenue from external sales 1,822,825 1,711,634 477,619 411,931 109,960 108,752 2,410,404 2,262,317
Carrying amount of segment assets 1,214,302 1,032,827 620,860 217,638 383,705 369,550 2,218,867 1,620,015
Capital expenditure 159,459 103,019 68,313 14,814 31,713 528 259,485 118,361
The carrying amount of segment assets in the segment other products includes the goodwill.
Capital expenditure includes the purchase of property, plant and equipment and the acquisition of goodwill.
III – REVENUE FROM EXTERNAL SALES BY GEOGRAPHICAL LOCATION OF CUSTOMERS
Asia PacificEurope Americas Africa Eliminations Consolidated
CHF 000 2000 1999 2000 1999 2000 1999 2000 1999 2000 1999
External sales revenue 1,630,649 1,620,554 608,969 498,689 170,786 143,074 – – 2,410,404 2,262,317
The definition of segments used in the primary and secondary business information is as follows:
Geographical Segments:Americas consists of all countries of North America and South America.
Europe consists of the following countries: the British Isles, France, Belgium, Netherlands, Luxembourg, Germany, Italy, Spain,Portugal, all Eastern Europe countries, all Scandinavian countries, Switzerland, Austria, Greece, Turkey.
Asia Pacific – Africa consists of all other countries.
Business Segments:Chocolate/Gourmet & Specialties products consist of all finished liquid and moulded chocolate and cocoa based productswhich are produced by Barry Callebaut companies and which are not included in cocoa products.
Cocoa products consist of all types of cocoa liquor, cocoa butter, cocoa cake and cocoa powder products, which are produced by Barry Callebaut companies.
Other products consist of all trade goods, which are bought from external suppliers and resold to third party customers.
The pricing of the inter segment sales is based on market ratios for cocoa products and on a cost plus mechanism for Chocolate/Gourmet & Specialties products.
49

CONSOLIDATED FINANCIAL STATEMENTS WITH AUDITORS’ REPORT
Notes
25. Related parties
64,78% of the share capital of Barry Callebaut AG is held by Jacobs AG, Zurich, Switzerland, which is owned by Mr. KlausJ. Jacobs who is resident in Kusnacht, Switzerland.
Significant transactions and balances between the group and related parties are as follows.
CHF 000 2000 1999
Sales to related parties 46,232 143,554Operating expenses paid to (received from) related parties 2,537 (6,408)Royalties (1,296) 1,016Deposits with related parties – 6,098Loans from related parties 2,414 194Accounts receivable related parties 27,529 17,475Accounts payable related parties 12,202 18,872Purchase of investments 19,929 –Purchase of treasury stocks 12,116 –Net financial expenses to related parties 1,017 (1,629)
In the 1999 figures all the transactions and balances with the Van Houten Group companies were included in the related partytransactions. Because of the acquisition of the Van Houten Group in March 2000, the balances with these companies are notincluded in the related party balances for 2000 and the transactions with these companies are included as related parties untilthe end of February.
See also note 23 for disclosure of other related party transactions and balances.
26. Commitments, contingencies and financial instruments with off-balance sheet risk
Fair value of financial instrumentsThe following methods and assumptions were used to estimate the fair value of financial instruments.
Cash and cash equivalentsThe carrying value approximates fair value because of the short-term maturity of these instruments.
Trade accounts receivableFair value approximates cost less provision for doubtful debts.
Other financial assets and financial liabilitiesOther financial assets and financial liabilities include short-term deposits third parties, deposits related parties, short-term debts and loans from related parties as well as other assets and liabilities. The carrying amount of these financial in-struments approximates fair value. The fair values of these items were based on expected cash flows or available marketprices.
Derivative financial instrumentsThe group uses derivative financial instruments to hedge underlying transactional currency exposure and to hedge the con-tract prices of future sales deliveries. All derivative financial instruments are valued at mark to market.
50
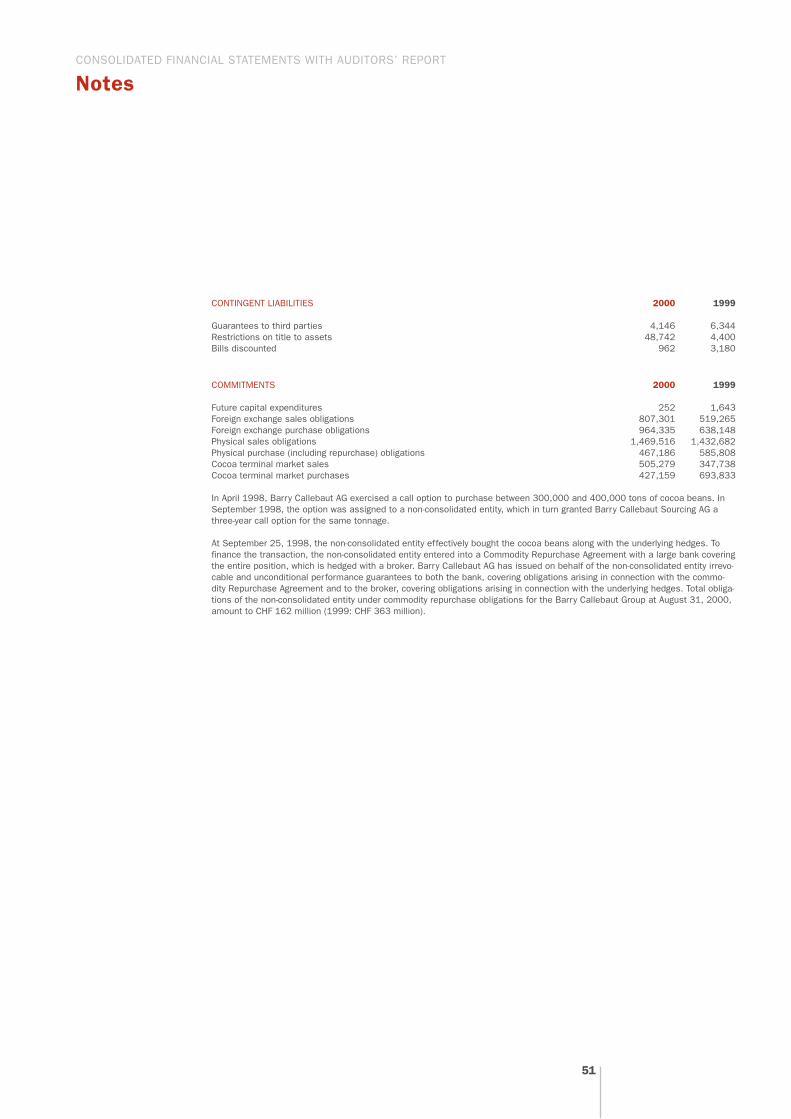
CONSOLIDATED FINANCIAL STATEMENTS WITH AUDITORS’ REPORT
Notes
CONTINGENT LIABILITIES 2000 1999
Guarantees to third parties 4,146 6,344Restrictions on title to assets 48,742 4,400Bills discounted 962 3,180
COMMITMENTS 2000 1999
Future capital expenditures 252 1,643Foreign exchange sales obligations 807,301 519,265Foreign exchange purchase obligations 964,335 638,148Physical sales obligations 1,469,516 1,432,682Physical purchase (including repurchase) obligations 467,186 585,808Cocoa terminal market sales 505,279 347,738Cocoa terminal market purchases 427,159 693,833
In April 1998, Barry Callebaut AG exercised a call option to purchase between 300,000 and 400,000 tons of cocoa beans. InSeptember 1998, the option was assigned to a non-consolidated entity, which in turn granted Barry Callebaut Sourcing AG athree-year call option for the same tonnage.
At September 25, 1998, the non-consolidated entity effectively bought the cocoa beans along with the underlying hedges. Tofinance the transaction, the non-consolidated entity entered into a Commodity Repurchase Agreement with a large bank coveringthe entire position, which is hedged with a broker. Barry Callebaut AG has issued on behalf of the non-consolidated entity irrevo-cable and unconditional performance guarantees to both the bank, covering obligations arising in connection with the commo-dity Repurchase Agreement and to the broker, covering obligations arising in connection with the underlying hedges. Total obliga-tions of the non-consolidated entity under commodity repurchase obligations for the Barry Callebaut Group at August 31, 2000,amount to CHF 162 million (1999: CHF 363 million).
51
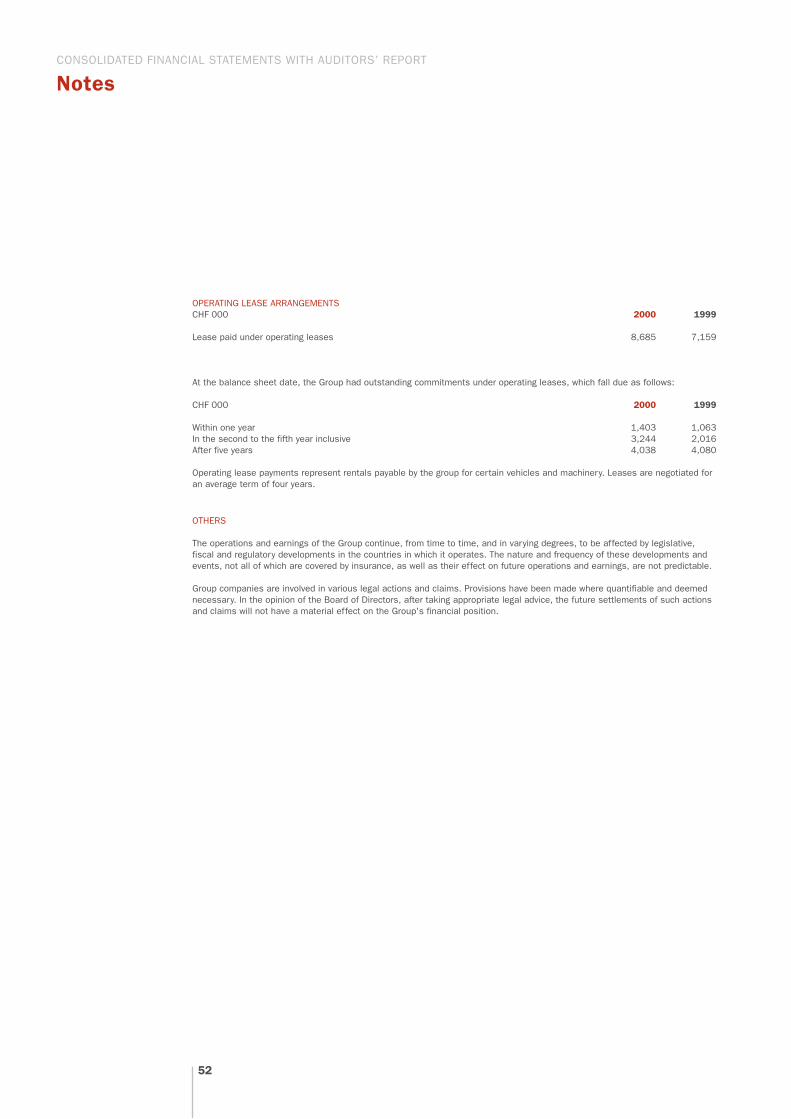
CONSOLIDATED FINANCIAL STATEMENTS WITH AUDITORS’ REPORT
Notes
OPERATING LEASE ARRANGEMENTSCHF 000 2000 1999
Lease paid under operating leases 8,685 7,159
At the balance sheet date, the Group had outstanding commitments under operating leases, which fall due as follows:
CHF 000 2000 1999
Within one year 1,403 1,063In the second to the fifth year inclusive 3,244 2,016After five years 4,038 4,080
Operating lease payments represent rentals payable by the group for certain vehicles and machinery. Leases are negotiated foran average term of four years.
OTHERS
The operations and earnings of the Group continue, from time to time, and in varying degrees, to be affected by legislative,fiscal and regulatory developments in the countries in which it operates. The nature and frequency of these developments andevents, not all of which are covered by insurance, as well as their effect on future operations and earnings, are not predictable.
Group companies are involved in various legal actions and claims. Provisions have been made where quantifiable and deemednecessary. In the opinion of the Board of Directors, after taking appropriate legal advice, the future settlements of such actionsand claims will not have a material effect on the Group's financial position.
52

Report of the group auditorsto the General Meeting of the Shareholders ofBarry Callebaut AG, Zurich
As auditors of the group, we have audited the consolidated financial statements (consolidated balance sheet, consolidatedstatement of income, consolidated statement of cash flows, consolidated statement of changes in equity and notes /pages 23 to 52) of Barry Callebaut AG for the year ended August 31, 2000.
These consolidated financial statements are the responsibility of the Board of Directors. Our responsibility is to expressan opinion on these consolidated financial statements based on our audit. We confirm that we meet the legal require-ments concerning professional qualification and independence.
Our audit was conducted in accordance with auditing standards promulgated by the profession, which require that anaudit be planned and performed to obtain reasonable assurance about whether the consolidated financial statements arefree from material misstatement. We have examined on a test basis evidence supporting the amounts and disclosuresin the consolidated financial statements. We have also assessed the accounting principles used, significant estimatesmade and the overall consolidated financial statement presentation. We believe that our audit provides a reasonable basisfor our opinion.
In our opinion, the consolidated financial statements give a true and fair view of the financial position, the results ofoperations and the cash flows in accordance with the International Accounting Standards (IAS) and comply with the lawand the accounting provisions as contained in the Listing Rules of the Swiss Exchange.
We recommend that the consolidated financial statements submitted to you be approved.
ARTHUR ANDERSEN AG
Thomas Stenz Stefan WeusteAuditors in charge
Zurich, October 26, 2000
53


BARRY CALLEBAUT AG FINANCIAL STATEMENTS
BALANCE SHEET/ASSETSBALANCE SHEET/LIABILITIESSTATEMENT OF INCOME AND RETAINED EARNINGSNOTES TO THE FINANCIAL STATEMENTSREPORT OF THE STATUTORY AUDITORS
5758596062


BARRY CALLEBAUT AG FINANCIAL STATEMENTS
Balance SheetAugust 31, 2000(Amounts in Swiss Francs)
Assets
CURRENT ASSETS 2000 1999
Cash 2,104,365 212,745Accounts receivable from group companies 42,941,687 45,540,389Other receivables and prepayments 120,931 194,419
Total current assets 45,166,983 45,947,553
NON-CURRENT ASSETS
Fixed assets 279,950 45,916Financial assets
Treasury shares 60,425,456 27,594,840Investments 854,669,066 702,076,130
Intangible assetsCapitalized costs of the capital increase and the going public 16,166,332 16,166,332less – accumulated amortization (9,699,798) (6,466,532)
Trademarks 124,650 –
Total non-current assets 921,965,656 739,416,686
Total assets 967,132,639 785,364,239
57
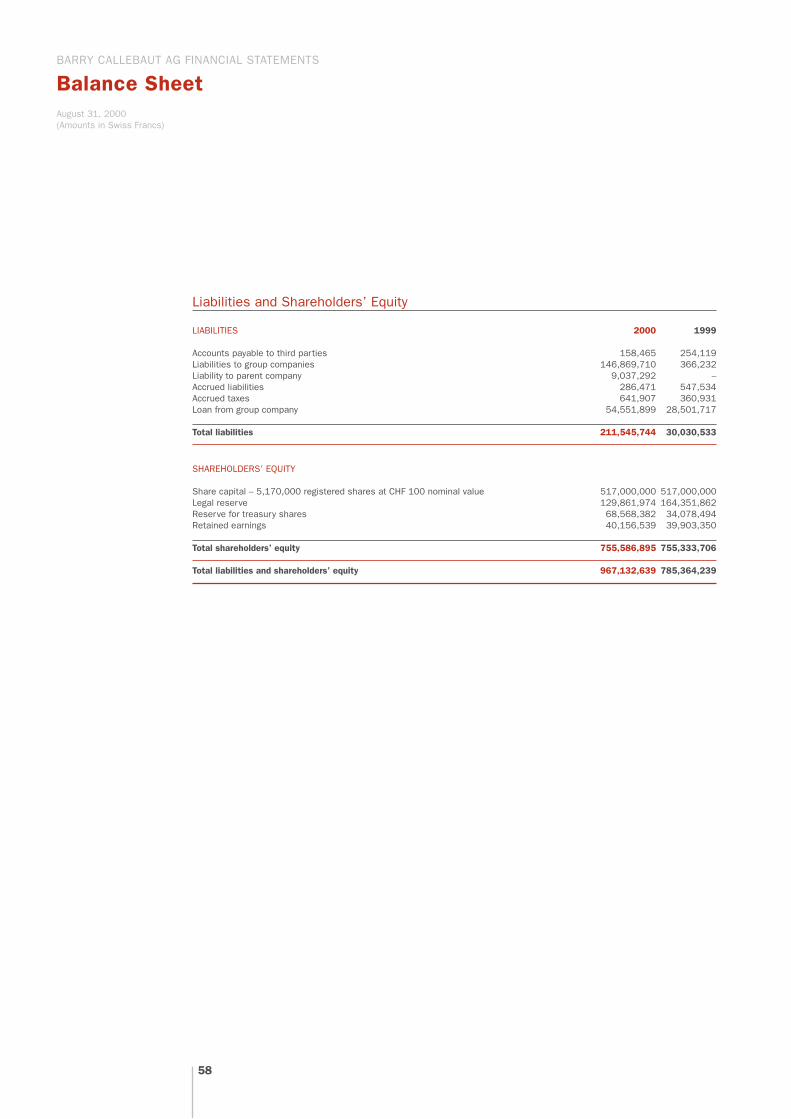
BARRY CALLEBAUT AG FINANCIAL STATEMENTS
Balance SheetAugust 31, 2000 (Amounts in Swiss Francs)
Liabilities and Shareholders’ Equity
LIABILITIES 2000 1999
Accounts payable to third parties 158,465 254,119Liabilities to group companies 146,869,710 366,232Liability to parent company 9,037,292 –Accrued liabilities 286,471 547,534Accrued taxes 641,907 360,931Loan from group company 54,551,899 28,501,717
Total liabilities 211,545,744 30,030,533
SHAREHOLDERS’ EQUITY
Share capital – 5,170,000 registered shares at CHF 100 nominal value 517,000,000 517,000,000Legal reserve 129,861,974 164,351,862Reserve for treasury shares 68,568,382 34,078,494Retained earnings 40,156,539 39,903,350
Total shareholders’ equity 755,586,895 755,333,706
Total liabilities and shareholders’ equity 967,132,639 785,364,239
58

INCOME 2000 1999
Dividend income 33,000,000 39,112,363Financial income 745,728 309,533License income 18,074,275 12,159,909Other 112,898 1,441,501
51,932,901 53,023,306
EXPENSES
Personnel 453,495 405,839Financial expenses 1,091,482 166,167Amortization and depreciation 3,247,249 3,244,744License expenses 4,910,246 –Unrealized loss on treasury shares 1,843,941 6,483,654Other 6,176,550 3,833,359
17,722,963 14,133,763
Income before taxes 34,209,938 38,889,543
TAXES 1,187,935 725,438
Net income for the year 33,022,003 38,164,105
RETAINED EARNINGS
Balance, beginning of year 39,903,350 32,713,645Dividend (32,768,814) (30,974,400)Net income for the year 33,022,003 38,164,105
Balance end of year 40,156,539 39,903,350
BARRY CALLEBAUT AG FINANCIAL STATEMENTS
Statement of Income and Retained Earningsfor the Year ended August 31, 2000 (Amounts in Swiss Francs)
59

BARRY CALLEBAUT AG FINANCIAL STATEMENTS
Notes to the Financial StatementsAugust 31, 2000 (Amounts in Swiss Francs)
2000 1999
1. Liens, guarantees and pledges in favour of third partiesThe company is a co-debtor for bank loans of BEF 9 billion (CHF 346 million) obtained by Barry Callebaut Services N.V., Belgium
2. Assets pledged, mortgaged or assigned to secure obligations of the Company none none
3. Financial lease commitments none none
4. Fire insurance value of tangible fixed assets none none
5. Obligations to employee benefit institutions none none
6. Bonds issued none none
7. Investments none none
Name and domicile Percentage of investment
2000 1999
Barry Callebaut Holding BV, Bussum, The Netherlands 100% 100%ADIS Holding Inc., Panama 100% 100%Barry Callebaut Sourcing AG, Zug, Switzerland 100% 100%Barry Callebaut Schweiz AG, Dubendorf, Switzerland 100% 100%C.J. van Houten & Zoon AG, Zurich, Switzerland 100% –
8. Material dissolution of excess reserves none none
9. Revaluation of assets none none
60

BARRY CALLEBAUT AG FINANCIAL STATEMENTS
Notes to the Financial StatementsAugust 31, 2000 (Amounts in Swiss Francs)
2000 1999
10. Treasury sharesIn connection with the stock option plan for the management theCompany holds 257,679 (1999: 112,585) treasury shares as ofAugust 31, 2000. In 1999/2000 the Company bought 150,594shares at an average price of CHF 238.74 per share (1999:112,585 shares at an average price of CHF 302.69) and sold5,500 shares at an average price of CHF 261.52 per share. As ofAugust 31, 2000 the treasury shares have been revalued to theoption strike price of CHF 234.50 per share.
11. Authorized and conditional increase of capital none none
12. Important shareholdersJacobs AG, Zurich, Switzerland 64.78% 67,0%
13. Allocation of retained earningsThe Board of Directors proposes to allocate the balance of retained earnings as follows:
Dividend CHF 33,605,000Carry-forward CHF 6,551,539
CHF 40,156,539
61

Report of the statutory auditorsto the General Meeting of the Shareholders ofBarry Callebaut AG, Zurich
As statutory auditors, we have audited the accounting records and the financial statements (balance sheet, statement ofincome and retained earnings and notes/pages 57 to 61) of Barry Callebaut AG for the year ended August 31, 2000.
These financial statements are the responsibility of the Board of Directors. Our responsibility is to express an opinion onthese financial statements based on our audit. We confirm that we meet the legal requirements concerning professionalqualification and independence.
Our audit was conducted in accordance with auditing standards promulgated by the profession, which require that anaudit be planned and performed to obtain reasonable assurance about whether the financial statements are free frommaterial misstatement. We have examined on a test basis evidence supporting the amounts and disclosures in the financialstatements. We have also assessed the accounting principles used, significant estimates made and the overall financialstatement presentation. We believe that our audit provides a reasonable basis for our opinion.
In our opinion, the accounting records and financial statements and the proposed allocation of retained earnings complywith the law and the company’s articles of incorporation.
We recommend that the financial statements submitted to you be approved.
ARTHUR ANDERSEN AG
Thomas Stenz Stefan WeusteAuditors in charge
Zurich, October 26, 2000
62
CONTACTS
63
For further information, please contact:
Barry Callebaut AGP.O. Box8034 ZurichSwitzerland
Investor RelationsDr. Ralph Schmitz-DrägerTelephone 01 388 61 42Fax 01 388 61 53
Communications:products and services
Ann BreugelmansTelephone 0032 53 73 02 56Fax 0032 53 73 05 40
General informationTelephone 01 388 61 57Fax 01 388 61 53
Adress changesSAG SEGA Aktienregister AGP.O. Box8601 OltenSwitzerlandTelephone 062 205 36 95Fax 062 205 39 66
Barry Callebaut in the internetwww.barry-callebaut.com

64
CONTACTS
CanadaBarry Callebaut Canada Inc.
Telephone +1 (450) 774-9131Fax +1 (450) 774-8335
FranceBarry Callebaut France SA
Telephone +33 1 30 22 84 00Fax +33 1 30 22 84 84
Telephone +33 2 32 09 54 00Fax +33 2 32 09 54 01
GermanyBarry Callebaut Deutschland GmbH
Telephone +49 40 55 77 600Fax +49 40 55 77 60 20
Great BritainBarry Callebaut UK Ltd.
Telephone +44 1295 22 47 00Fax +44 1295 27 32 94
SwitzerlandBarry Callebaut Sourcing AG
Telephone +41 41 748 71 71Fax +41 41 748 71 81
Barry Callebaut Schweiz AGTelephone +41 1 801 61 11Fax +41 1 801 62 92
BelgiumBarry Callebaut Belgium N.V.
Telephone +32 53 73 02 11Fax +32 53 78 04 63
Barry Callebaut Services N.V.Telephone +32 53 73 02 11Fax +32 53 73 05 01
CameroonSociété Industrielle Camerounaisedes Cacaos SA (67,1%)
Telephone +237 40 37 95Fax +237 40 39 31

65
ItalyBarry Callebaut Italia S.p.A.
Telephone +39 025 751 44 87Fax +39 025 779 07 83 - 45 51
Ivory CoastSociété Africaine de Cacao SA (49%)
Telephone +225 35 44 10Fax +225 35 94 96
Telephone +225 35 44 10Fax +225 35 44 10
MexicoBarry Callebaut Mexico SA
Telephone +52 5 202 54 21Fax +52 5 202 54 33
NetherlandsBarry Callebaut Holding B.V.
Telephone +31 35 697 49 11Fax +31 35 697 46 42
CONTACTS
PolandBarry Callebaut Polska Sp.z.o.o. (90%)
Telephone +48 42 640 45 00Fax +48 42 640 45 01
SingaporeBarry Callebaut Asia Pacific (Singapore) Pte Ltd.
Telephone +65 755 98 22Fax +65 755 83 22
SpainBarry Callebaut Ibérica SL
Telephone +34 93 363 88 33Fax +34 93 363 88 30
USABarry Callebaut USA Inc.
Telephone +1 (609) 467 00 99Fax +1 (609) 467 80 24

66
AGENDA
Annual Meeting of Shareholders, Zurich:December 4, 2000
Press release half year report:April 3, 2001
Media conference, Zurich:November 20, 2001
Analyst conference, Zurich:November 20, 2001
Annual Meeting of Shareholders, Zurich:December 11, 2001
Con
cept
and
edi
ting
:Fa
rner
PR
& C
onsu
ltin
g AG
, Zu
rich
D
esig
n:Lo
sego
& R
enfe
r, Z
uric
hTy
pese
ttin
g an
d pr
inti
ng:
DAZ
Dru
cker
ei A
lbis
ried
en A
G,
Zurich