Embed Size (px)
Citation preview
ANNUAL PLAN 2017

THE UNIVERSITY OF THE SOUTH PACIFIC | ANNUAL PLAN 2017 Page 3
1) Vice-Chancellor and President’s Foreword 4
2) 2017 at a Glance 10
3) Vision, Mission and Values 14
4) Executive Summary 16
5) AP2017 Framework and Process 20
6) Activities and Outputs of the AP2017 24
7) Funding the Priorities and Activities. 52
8) Operating Budgets and Financial Commentaries 59
9) Financial Targets and Ratios 75
10) Capital Plan and Infrastructure Developments 79
11) Risks and Mitigation Strategies 83
12) Monitoring and Evaluation Mechanisms 86
13) Appendices 87
14) List of Tables and Figures 95
15) Abbreviations and Acronyms 96
TABLE OF CONTENTS

VICE-CHANCELLOR AND PRESIDENT01

THE UNIVERSITY OF THE SOUTH PACIFIC | ANNUAL PLAN 2017 Page 5

THE UNIVERSITY OF THE SOUTH PACIFIC | ANNUAL PLAN 2017Page 6
VICE CHANCELLOR’S INTRODUCTION AND OVERVIEW01
The Strategic Plan (SP) 2013 - 2018 continues to be the main driver of this plan, in addition to plans to generate efficiencies, increase productivity and raise additional revenues to ensure that the University remains financially sustainable. The AP 2017 is based on the financial plan approved by the University Grants Committee (UGC) for the new triennium 2016 - 2018, with the goal of enabling the University to meet the financial benchmarks set by the Finance and Investments Committee (FIC) for its financial sustainability. The University is grateful for the increase in support from member countries and the continuous support of the major development partners, which provides the ability to set out a sustainable and workable three year plan.
The University has achieved a number of milestones in the first three and half years of the SP. The performance against the SP targets were externally reviewed in 2015 and the University is making the necessary adjustments in its priorities and funding to ensure that the key strategic objectives are met. The University is allocating significant SP funds and resources in 2017 for accreditations, improving research outputs, automation and re-engineering, providing additional support for regional campuses and rewarding outstanding staff performance. The AP 2017 also shifts more resources towards the Faculties to bring USP into line with international benchmarks.
LEARNING AND TEACHINGIn 2016, substantial progress has been made in the areas of learning and teaching with the conversion of eleven programmes to flexible learning and three to online delivery modes . In 2017, the University will shift into delivering more flexible modes in order to allow easier access for all students across the region and also release pressure on space and resources from its current heavy face to face model. The University will invest into new pedagogies and online systems in order to facilitate this.
From 2017, all lectures delivered from Laucala Campus lecture theatres will be recorded and podcast so that all students can review the lectures several times and as they wish and to enable many students in the region who desperately need to complete only a few courses to complete their qualifications. The University will also begin rolling out substantial support for student mobile learning.
To date, seventeen programmes have gained international accreditation and one has gained recognition. Of this, a total of six international accreditations/recognition were obtained for Pacific TAFE in 2016. Accreditation of a further seven Pacific TAFE programmes will be pursued in 2017, and three in 2018 accomplishing strategic target of sixteen as per SP. International accreditation for Foundation programmes will be pursued in 2017 through the Australian based Tertiary Education Quality and Standards Agency (TEQSA). The institutional accreditation process, which began in 2014 will continue the next phase in 2017.
The University has been granted Eligibility from the WASC Senior College and University Commission (WSCUC). This
This Annual Plan (AP) for 2017 provides the University an opportunity to make some bold and demonstrable shifts as it continues to pursue excellence, leading to its 50th anniversary in 2018.

THE UNIVERSITY OF THE SOUTH PACIFIC | ANNUAL PLAN 2017 Page 7
VICE CHANCELLOR’S INTRODUCTION AND OVERVIEW01implies that the University is eligible to proceed with an application for Candidacy and Initial Accreditation, which was submitted to WSCUC in February 2016. Following a visit from WSCUC in October 2016, the 2017 accreditation activities will play a vital role in preparation towards the Seeking Accreditation Visit. A key component of the 2017 work plan is to systematically work through each standard and criteria for review and accumulate necessary evidences that demonstrate minimal to substantial compliance.
The continuous investments into the engineering programme saw the opening of the new laboratory on 5 October 2016. The other interesting development includes the accreditation of the engineering programme by the Institute of Professional Engineers New Zealand (IPENZ). The University has registered two patents—both from Engineering and we hope students and staff of the School of Engineering and Physics (SEP) will use the new facility and that the SEP will register more patents and convert them into either community-use type of devices and services or commercialise them for a longer-term commercial benefit Accreditation of other programmes will be pursued in 2017.
STUDENT SUPPORTThe University has made significant progress in improving student support by investing in additional first year support systems and mechanisms, developing early warning systems and online support, and putting in place a student mentoring system. The University is meeting its student satisfaction KPI’s based on Quality of Teaching Survey. Improving graduation completions will be a major priority for 2017 to 2018. A number of remedial plans are being implemented to improve completions in the remaining years of the SP.
An Online Student Support Framework has been finalised and in 2017 the Planning and Quality Office will be able to compare the University’s performance with other universities in this area.
In addition, the interactive online tutorial support by third party provider “Your-Tutor” is being evaluated for it success, and it is planned that in 2017, a roll-out across the University will be implemented pending budget allocation and the outcome of this evaluation.
The University has built 144 additional beds for accommodation but this is still short of the target to meet the 2018 target of 2,000 additional beds. Two blocks with total of 48 beds for international accommodation will be
completed in early 2017. A plan is currently being developed to build an additional 400 beds at Laucala Campus to cater for cheaper twin rooms and married quarters. Additional beds are expected to be built in the Solomon Islands as part of its new planned campus.
RESEARCH AND INTERNATIONALISATIONThe University has embedded the seven Strategic Research Themes (SRT) and has provided additional funds and support to enable the achievement of the ambitious research-related objectives of the SP. The University has been hiring more professors with proven research outcomes as a major method of promoting greater research output and impact, and will continue this in 2017. To ensure that 2017 and 2018 targets are met, the Research Office will focus on improving the implementation of the Quality of Research (QoR) Policy by developing processes that better and effectively capture data. Full implementation of QoR is expected from 1 January 2017. This is crucial to our success and to the rational and prudent use of our resources. In addition, researchers based in regional campuses are being incentivised to also contribute to USP’s outputs via the creation of a new reward system that will come into effect in 2017.
In 2017, we plan to also improve the level of research income by developing a Grant Management framework that will have a direct impact on improving the level of research income because it should be able to capture information on every externally funded research projects. Furthermore, a total of thirty new SRT projects, valued at $1.5m, have been approved in August 2016. It is expected that over the 3-year period (2016 – 2018), the projects will attract additional external funding.
Our international programmes are being maintained but we are still held back due to lack of student accommodation and this is something that will be looked into in 2017. The International Office will focus on improving opportunities for USP students to study abroad; increasing international student enrolment; increasing international student postgraduate enrolment; increasing international student undergraduate enrolment; increasing EU staff/mobility training; and increasing international students’ accommodation.

THE UNIVERSITY OF THE SOUTH PACIFIC | ANNUAL PLAN 2017Page 8
VICE CHANCELLOR’S INTRODUCTION AND OVERVIEW01INFORMATION AND COMMUNICATION TECHNOLOGIES (ICT)A large part of student support is provided via USPNet. Technical improvements to the USPNet have continued, although the most important major changes are expected to come when New Zealand approves funding for the re-engineering of the USPNet. Discussion is also on-going with JICA on this for a collaborative approach. In the meanwhile, technical improvements are helping resolve some of the speed issues.
Some rapid developments are underway in submarine cabling that should provide much better, faster and cheaper bandwidth to many more of our member countries, including Cook Islands, Niue, Nauru, Samoa, Kiribati and Solomon Islands. These will have positive impact on student learning and should open up possibilities for USP to leverage new technologies in the delivery of its programmes and courses in order to reach more people faster and at affordable cost.
Major improvements have been made to USPNet with the reengineering of the overall architecture, systems and processes. The satellite component of the system has been also reengineered, with a rebalancing of C band and Ku band broadband. Additional bandwidth has also been acquired. Further improvements to consolidate student satisfaction with USPNet services will be a priority in 2017. Active bandwidth management, further improvement to the reliability of services, and some additional acquisition of bandwidth will form the core of our ICT work in 2017.
The new front-end and reporting software tool, Cognos has not moved as rapidly as earlier planned and is now being pushed harder. We hope to gain momentum with this in 2017.
REGIONAL AND COMMUNITY ENGAGEMENTFollowing the external review of the Governance, Management and Administration of the Regional Campuses in 2015, the implementation of the recommendations started in 2016. The AP will have specific provision for further support to regional campuses that will enable the University to implement the major recommendations in 2017. In 2017, the construction of the new Solomon Islands Campus will be the most significant work in our regional campus development, together with the completion of the renovations to the Long Island Hotel to convert it into the new campus for Republic of Marshall Islands. Science teaching will be expanded in Vanuatu and Tonga, while more and more in-country programmes will be offered at
regional campuses with viable numbers. We should see the appointment of many new campus directors and three new Pro Vice-Chancellors should be in post in 2017.
The University is working towards achieving excellence in regional and international engagement via the Council of Regional Organisations of the Pacific (CROP) mechanism; effective participation in and delivery of 11th European Development Fund (EDF) Pacific Regional Indicative Programme (PRIP); improved and continued linkages with donors, development partners and external stakeholders; efficient project management and delivery; and, through establishment and effective implementation of resource mobilisation strategy. We will continue our engagement with the region through visits and meetings as well as our engagement as a CROP agency. USP will continue to take part in regional activities in 2017 by taking lead in human resource development and ICT. The regional ICT initiative endorsed by Pacific Islands Forum leaders in 2015 has been scaled up and further momentum is expected to be gained in 2017 through more active engagement with all the members of the strengthened CROP ICT Working Group and governments. We will also support work in other regional priorities such as climate change, oceans, sustainable development, sustainable sea transport, disabilities etc.
OUR PEOPLEThere are plans to continue to improve efficiency and productivity of the University in 2017 by implementing a revised workload model for academics, reclassification of academic staff, and the implementation of the recommendations from the reviews of sections with a clear focus on benchmarking with appropriate comparators, productivity and efficiency. The University will continue to make large investments into its banner revitalisation plan to improve process and achieve efficiency. Resolution of issues relating to the HR Office and HR practice throughout the University will be major priorities of the University in 2017.
The review of HR was undertaken by EQUIBT and its recommendations have been incorporated in the HR Strategic Plan currently being finalised. There are five major areas in which HR section will focus on in 2016 and beyond: enhance talent management; improving leadership management; automation of HR services; improvement in staff satisfaction; creating a healthy, happy, and high performing work environment; and to be an employer of choice.

THE UNIVERSITY OF THE SOUTH PACIFIC | ANNUAL PLAN 2017 Page 9
GOVERNANCE, MANAGEMENT, LEADERSHIP AND CONTINUOUS IMPROVEMENT An external review of the SP KPIs’ has highlighted a number of gaps and remedial plans that the University will continue implementing in 2017. There are firm indications that the majority of the KPIs would be achieved by 2018. There are however, a few of the KPIs that would be either challenging to meet or will not be met. Further work will be done on these in 2017, especially in meeting the targets for those that were based on poor baseline data.
A comprehensive Risk Register has been prepared for implementation and action in 2017—the University will ensure that issues relating to risk are handled as a priority in 2017.
The University Library completed an external review in August 2016. The review report was received in mid-September and the Library will make a response and develop an action plan to address the recommendations in 2017.
We will also need to work closely with our development partners to ensure that successor partnership agreements with Australia and New Zealand are in place by 2018 for the new triennium. Apart from these partnerships, the University will also work on the planning, preparation and finalisation of new SP to be rolled out from the beginning of 2019.
CONCLUSIONOverall, AP 2017 aims to continue with the momentum achieved in the implementation of the SP and remedy shortcomings in the achievement of some of the SP KPIs. The University has learnt from the lessons of the first three and half years and will continue its pursuit of excellence as contained in the SP. This will require continued efforts toward excellence and the delivery of greater value and confidence to its stakeholders.
PROFESSOR RAJESH CHANDRAVice-Chancellor and President
VICE CHANCELLOR’S INTRODUCTION AND OVERVIEW01

2017 AT A GLANCE02

THE UNIVERSITY OF THE SOUTH PACIFIC | ANNUAL PLAN 2017 Page 11

THE UNIVERSITY OF THE SOUTH PACIFIC | ANNUAL PLAN 2017Page 12
2017 AT A GLANCE02
17%
38%25%
20%
Blended Face-to- Face Online Print
Forecast EFTS by Mode 2017
17%
38%25%
20%
Blended Face-to- Face Online Print
Forecast EFTS by Mode 2017 EFTS by mode
Mode 2014 2015 AP2016
Forecast2016
AP2017
Blended 1,089 1,524 2,438 2,400 2,887
Face-to- Face
7,153 7,610 6,603 6,400 6,452
Online 979 1,609 2,191 2,050 4,245
Print 5,318 5,090 4,788 3,314 3,396
Total 14,539 15,833 16,020 16,180 16,980
2017 FORECAST EFTS BY MODE
NOTE : AP 2016 student numbers are projected to increase by 6% in 2017.
Publications 2013 2014 2015
Journal articles 169 188 147
Books 6 6 0
Book chapters 36 36 49
Book reviews or comments 5 8 9
Conference Proceedings 31 53 41
Professional & Technical Reports
13 7 20
Creative Works 24 5 1
Other Publications 68 56 62
TOTAL 352 359 329
45%15%
3%
12%
6%19%
Journal articles Books Book chapters Book reviews or commentsConference Proceedings Professional & Technical Reports Creative Works Other Publications
Research Publications
45%15%
3%
12%
6%19%
Journal articles Books Book chapters Book reviews or commentsConference Proceedings Professional & Technical Reports Creative Works Other Publications
Research Publications
45%15%
3%
12%
6%19%
Journal articles Books Book chapters Book reviews or commentsConference Proceedings Professional & Technical Reports Creative Works Other Publications
Research Publications
RESEARCH PUBLICATIONS

THE UNIVERSITY OF THE SOUTH PACIFIC | ANNUAL PLAN 2017 Page 13
2017 AT A GLANCE02
INCOME EXPENDITURE OPERATING SURPLUS/(DEFICIT)
Staff Numbers
Actual
2014
Actual2015
AP2016
ForecastAP2016
AP2017
Academic 413 392 430 400 434
Professional 237 279 244 227 246
Intermediate & Junior
630 564 655 609 662
Hourly Paid 318 334 328 305 331
Total 1,598 1,569 1,657 1,541 1,674
FINANCES AP 2017
26%
15%
39%
20%
Academic Professional
Intermediate & Junior Hourly Paid
Staff Compnents AP 2017
50%
48%2%
Income Expenditure Operating Surplus/(Deficit)
Income Expenditure Operating Surplus/(Deficcit)
50%
48%2%
Income Expenditure Operating Surplus/(Deficit)
Income Expenditure Operating Surplus/(Deficcit)
50%
48%2%
Income Expenditure Operating Surplus/(Deficit)
Income Expenditure Operating Surplus/(Deficcit)Income and Expenditure F$'m
2014 Actual
2015 Actual
AP2016
Forecast 2016
AP2017
Income 180.8 188.0 188.5 193.3 196.1
Expenditure 175.9 180.9 183.7 182.9 190.2
Operating Surplus/(Deficit)
4.9 7.1 4.8 10.4 5.9
STAFF COMPONENTS AP 2017

VICE CHANCELLOR’S INTRODUCTION AND OVERVIEW
VISION, MISSION AND VALUES03

THE UNIVERSITY OF THE SOUTH PACIFIC | ANNUAL PLAN 2017 Page 15
OUR VISION
Achieving excellence and innovation for sustainable development of the Pacific Island countries..
VISION, MISSION AND VALUES03
OUR MISSION • To provide Pacific people with a comprehensive range of excellent and relevant tertiary qualifications;
• To deliver the benefits of advanced research and its applications;
• To provide communities and countries in the Pacific region with relevant, cost effective and sustainable solutions, including entrepreneurship, to their main challenges;
• To be an exemplar of tertiary education for Pacific Islands in quality, governance, application of technology and collaboration with national tertiary institutions.
OUR VALUES • The highest standards and quality of education in the region;
• The highest standards of performance; innovation and teamwork; management change; flexibility and achieve excellence;
• Investing, supporting, empowering, developing and rewarding excellent staff;
• Commitment to creativity and innovation;
• Distinctiveness and diversity in our Pacific heritage with investment in developing and preserving it;
• Regional cooperation and integration;
• Positive and inclusive learning environments, including welcoming campus life activities;
• Support for flexible learners in all locations to enable them to be successful in work, life and citizenship;
• The highest standards of good governance, leadership and transparency, integrity and honesty through the implementation of professional and ethical processes and behaviours by all in the USP community;
• Protecting and nurturing the environment in all our activities.

VICE CHANCELLOR’S INTRODUCTION AND OVERVIEW
EXECUTIVE SUMMARY04
THE UNIVERSITY OF THE SOUTH PACIFIC | ANNUAL PLAN 2017 Page 17
EXECUTIVE SUMMARY044.1
4.2
4.3
4.4
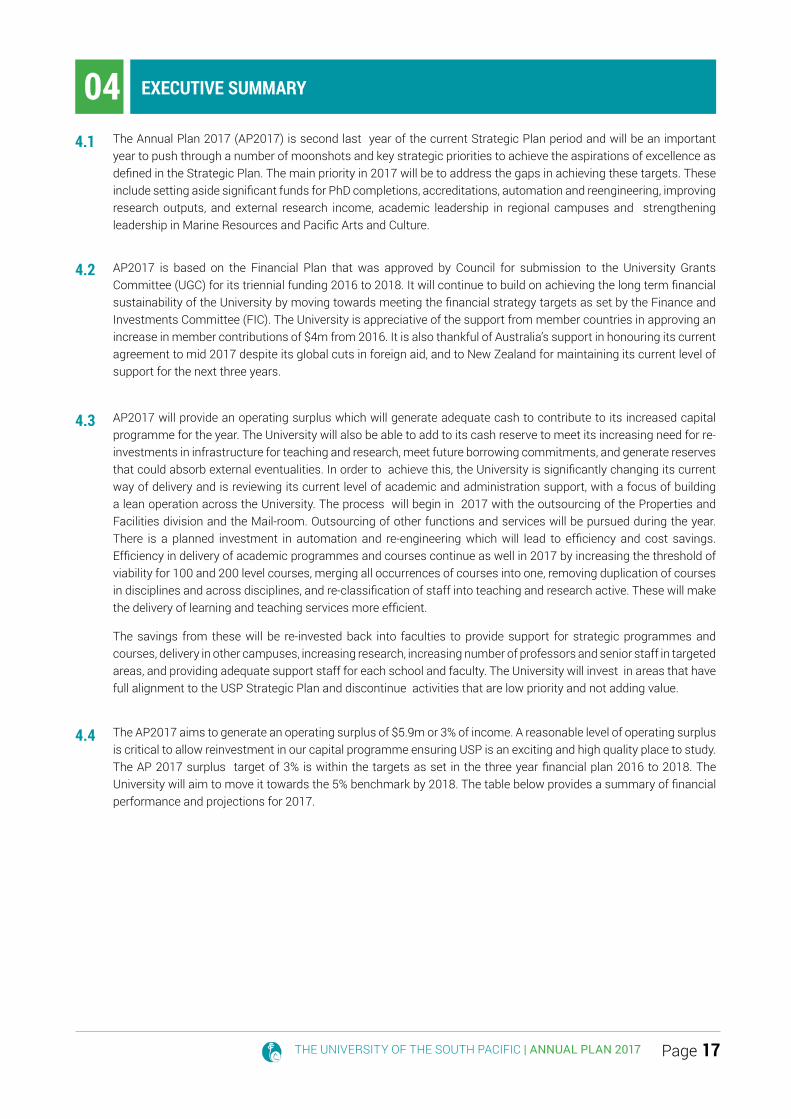
The Annual Plan 2017 (AP2017) is second last year of the current Strategic Plan period and will be an important year to push through a number of moonshots and key strategic priorities to achieve the aspirations of excellence as defined in the Strategic Plan. The main priority in 2017 will be to address the gaps in achieving these targets. These include setting aside significant funds for PhD completions, accreditations, automation and reengineering, improving research outputs, and external research income, academic leadership in regional campuses and strengthening leadership in Marine Resources and Pacific Arts and Culture.
AP2017 is based on the Financial Plan that was approved by Council for submission to the University Grants Committee (UGC) for its triennial funding 2016 to 2018. It will continue to build on achieving the long term financial sustainability of the University by moving towards meeting the financial strategy targets as set by the Finance and Investments Committee (FIC). The University is appreciative of the support from member countries in approving an increase in member contributions of $4m from 2016. It is also thankful of Australia’s support in honouring its current agreement to mid 2017 despite its global cuts in foreign aid, and to New Zealand for maintaining its current level of support for the next three years.
AP2017 will provide an operating surplus which will generate adequate cash to contribute to its increased capital programme for the year. The University will also be able to add to its cash reserve to meet its increasing need for re-investments in infrastructure for teaching and research, meet future borrowing commitments, and generate reserves that could absorb external eventualities. In order to achieve this, the University is significantly changing its current way of delivery and is reviewing its current level of academic and administration support, with a focus of building a lean operation across the University. The process will begin in 2017 with the outsourcing of the Properties and Facilities division and the Mail-room. Outsourcing of other functions and services will be pursued during the year. There is a planned investment in automation and re-engineering which will lead to efficiency and cost savings. Efficiency in delivery of academic programmes and courses continue as well in 2017 by increasing the threshold of viability for 100 and 200 level courses, merging all occurrences of courses into one, removing duplication of courses in disciplines and across disciplines, and re-classification of staff into teaching and research active. These will make the delivery of learning and teaching services more efficient.
The savings from these will be re-invested back into faculties to provide support for strategic programmes and courses, delivery in other campuses, increasing research, increasing number of professors and senior staff in targeted areas, and providing adequate support staff for each school and faculty. The University will invest in areas that have full alignment to the USP Strategic Plan and discontinue activities that are low priority and not adding value.
The AP2017 aims to generate an operating surplus of $5.9m or 3% of income. A reasonable level of operating surplus is critical to allow reinvestment in our capital programme ensuring USP is an exciting and high quality place to study. The AP 2017 surplus target of 3% is within the targets as set in the three year financial plan 2016 to 2018. The University will aim to move it towards the 5% benchmark by 2018. The table below provides a summary of financial performance and projections for 2017.

THE UNIVERSITY OF THE SOUTH PACIFIC | ANNUAL PLAN 2017Page 18
EXECUTIVE SUMMARY04TABLE 1: FINANCIAL PERFORMANCE 2014 – 2017
2014 Actual
2015 Actual
AP 2016
Forecast 2016
AP 2017
$m $m $m $m $m
Income 180.8 188.0 188.5 193.3 196.1
Expenditure 175.9 180.9 183.7 182.9 190.2
Operating Surplus/(Deficit) 4.9 7.1 4.8 10.4 5.9
Operating Surplus % 3% 4% 3% 5% 3%
AP2017 %
Member Contribution 38,420 20%
Student Tuition Fees 73,253 37%
Development Assistance 46,687 24%
Trading Activities 17,206 9%
All other Income 20,597 10%
Total 196,163 100%
20%
37%
24%
9% 10%
Member Contribution Student Tuition Fees Development AssistanceTrading Activities All other Income
AP 2017 Income Summary
20%
37%
24%
9% 10%
Member Contribution Student Tuition Fees Development AssistanceTrading Activities All other Income
AP 2017 Income Summary
20%
37%
24%
9% 10%
Member Contribution Student Tuition Fees Development AssistanceTrading Activities All other Income
AP 2017 Income Summary
FIGURE 2: SPENDING PLAN 2017 (%)
44%
46%
10%
Pay Cost Operating Costs Other Provision
AP 2017 Spending Plan
44%
46%
10%
Pay Cost Operating Costs Other Provision
AP 2017 Spending Plan
AP2017 %
Pay Cost 83,540 44%
Operating Costs 86,592 46%
Other Provision 20,123 10%
Total expenditure 190,255 100%
FIGURE 1: FUNDING SOURCES 2017

THE UNIVERSITY OF THE SOUTH PACIFIC | ANNUAL PLAN 2017 Page 19
EXECUTIVE SUMMARY044.5
4.6
4.7
The plan will generate net cash flow from operating activities of $15.5m, to contribute $11m to the capital programme and add to the cash reserve of the University with the aim of meeting the UGC cash reserve target of two months of operating costs; generate sufficient cash to invest in infrastructure for teaching, research and regional support; and adding to cash reserves in meeting short and long term borrowing commitments.
The major capital projects for the year will be the commencement of the Solomon Islands campus through ADB loan funding, a 400 bed project for student accommodation at Laucala Campus and the countinuation of the renovation of the Long Island Hotel as the new RMI campus. The University is also contributing $11m towards the capital programme from its cash to be generated during the year, $10m for recurrent sections and $1m for self-funding units. A further allocation of $1.25m is provided in the operating budget for deferred maintenance in 2017.
Management will further strengthen its accountability processes and closely monitor the progress of the plan during the year. Management has signaled its intention to tightly link the performance assessment of SMT and senior staff to the achievement of SP targets to reduce the risk of not achieving excellence as stipulated in the SP.

VICE CHANCELLOR’S INTRODUCTION AND OVERVIEW
AP2017 FRAMEWORK AND PROCESS05

THE UNIVERSITY OF THE SOUTH PACIFIC | ANNUAL PLAN 2017 Page 21
AP2017 FRAMEWORK AND PROCESS055.1 PLANNING FRAMEWORK
5.2 PRINCIPLES AND GUIDELINES
This plan was developed through the integration of the planning and budgeting process as in the past and included:• preparing faculty and section plans in line with the Strategic Plan;• allocation of funds to Faculties through the Internal Funding Model;• allocation financial and human resources to Strategic Plan priorities;• clearly defining measureable targets for each priority area;• supporting clear management accountability and measurement of performance on a regular basis.
During the planning process, further steps were taken to identify and create key principles which align the University’s financial plan directly to the strategic objectives. The table below list the budget principles which underpin the financial plan for 2017 and beyond.
TABLE 2 FINANCIAL PRINCIPLES FOR 2017
Financial Principles Established in Prior years New
Support the University’s Strategic Plan √
Improved Faculty Internal Funding Model √ √
Resource Allocation Methodology √
Meet financial benchmarks and targets √
Cash reserves √
Performance funding √
Investment in scholarships √
Administration effectiveness and efficiency √
Prudence and Compliance √
User Pay √
Value for money √
Contingency and risk pools √
Departmental carry forward of retained earnings √
Re-invest in infrastructure √
Commercial and investment strategy to maximize returns √
P & F recharging of project work √
Enhance Risk Management √
Outsourcing to achieve efficiency √
Resource Mobilisation Plan √
Decentralised model with accountability to fund controllers √
Measure and increase productivity of staff √
Full charging of direct and indirect costs for self-funding units √
Service Level Agreements for sections √
5% Royalty fee on revenue from all self funding units except institutes √
Revised overhead recovery rates for self-funding,trading & institutes √

THE UNIVERSITY OF THE SOUTH PACIFIC | ANNUAL PLAN 2017Page 22
AP2017 FRAMEWORK AND PROCESS055.3 DRIVERS
5.5 ASSUMPTIONS
5.4 LEVERS
The 2017 Annual Plan aims to continue the progress of the Strategic Plan 2013-18. The 2017 plan has been constructed to push through some high level priorities and moonshots to meet the aspirations of the Strategic Plan. This plan is also driven by the need to support growth and invest in infrastructure to support teaching, research and community support.
The assumptions made while formulating the Financial Plan for the triennium 2016-2018 serve as a starting point. These assumptions have been revised given the current year trends, changes to USP’s internal and external environment and other factors:
• Members’ contributions remain at 2016 level of $38.4m;
• Enrolments growth of 6%, with 2% increase in tuition fees across the board to account for inflation, with selected increase in programmes under Engineering and Computing to reflect costs of accreditations;
• Development assistance income assumed at same level as in 2016;
• Commercial income slightly dropped due to change in the nature of the Book Centre business;
• Staff costs funded at 95%, but no provision for salary adjustments;
• Funds of $1.25m for deferred maintenance, to also address regional campus upgrades;
• Put in place savings target for each section and by expense type;
• Contingency fund set aside for unknown occurrence at the same level as in 2016.
• Capital programme includes developments of the new Solomon Islands campus, 48 beds student accommodation (extention of 11th hall) and construction of student hostel with 400 beds for international students at Laucal campus.
The following key levers the University needs to invest in are identified in this plan in order to achieve the plan within available resources:
REVENUE GROWTH: There will be vigorous efforts to increase the enrolment of international students and post-graduate students (high level streams),and to successfully implement the Alumni Strategy to develop a winning team of fundraisers. There will be considerable efforts to move forward on the planned Commercial developments at Laucala campus that will generate commercial revenues in the future years. A Resource Mobilisation Plan has been developed and the plan is to fully implement from 2017, to take advantage of the 50th Anniversary opportunity in 2018. The policy on use of accumulated surplus or retained earnings was also reviewed to encourage revenue generation and innovation.
IMPROVED PRODUCTIVITY: Staff profiling and knowledge of workload is important to identify areas of performance improvements and maximization of current staff resources. Re-classification of academic staffing has been completed and was piloted in semester 2, 2016. This will be fully implemented from Semester 1, 2017. There will also be investments in technology to automate manual processes to drive efficiency and effectiveness in the delivery of teaching, research and regional support services. The use of Open Educational Resources (OERs) and e-Learning will be strongly promoted. Outsourcing and savings initiatives will continue in the new year, with more efforts in implementing outsourcing strategies.
INVESTMENT IN STRATEGIC Plan initiatives: The plan must generate sufficient cash to invest in Strategic Plan initiatives, capital works, infrastructure, and adding to the cash reserves for future investments and growth.

THE UNIVERSITY OF THE SOUTH PACIFIC | ANNUAL PLAN 2017 Page 23
AP2017 FRAMEWORK AND PROCESS055.6 FINANCIAL TARGETS
AP2017 has maintained the following financial targets:
TABLE 03 TARGETS FOR AP2017
INSTITUTIONAL TARGETS SECTIONAL TARGETS
• Increase the operating surplus percentage towards the benchmark of 5%.
• Exceed cash margin of 16%.
• Generate enough cash from operating activities to pay for capex of $11m.
• Add to unencumbered (cash reserve) balance and achieve the UGC approved level of two months of operating expenditures.
• Spend within approved budget.
• All Commercial and Institutes to contribute 20% of their total expenditure to the University’s Recurrent Fund.
• All self-funding programmes like MBA, Pacific TAFE to contribute 25% of their total expenditure to the Recurrent Fund.
• All self-funding units (except institutes) to pay 5% of revenue as “royalty” to USP recurrent fund.
• All non-recurrent USP activities, other than project funds, will each generate a 3% surplus (surplus over total income) after the required overhead recovery and royalty payments to the recurrent fund.

VICE CHANCELLOR’S INTRODUCTION AND OVERVIEW
ACTIVITIES AND OUTPUTS OF THE AP201706

THE UNIVERSITY OF THE SOUTH PACIFIC | ANNUAL PLAN 2017 Page 25

THE UNIVERSITY OF THE SOUTH PACIFIC | ANNUAL PLAN 2017Page 26
ACTIVITIES AND OUTPUTS OF THE AP2017066.1
6.2
6.3
The University’s efforts and activities in 2017 will be driven by the Strategic Plan 2013-2018. The focus of each of the seven Priority Areas is to enhance work that began in 2013 to shift the University from good to excellent.
The plans of all faculties and sections will be aligned to the master plan and be monitored closely by management to ensure success.
The main aim for 2017 is to make bold decisions in order to push through the achievements of the SP in its second last year of the strategic plan. Below is a list of priorities contained in the Annual Plan 2017 that is different from 2016
• Fully mainstream the outcomes of STAR and fully implement the Quality of Research (QOR), by adjusting the workload of academic staff into research intensive, normal, teaching intensive and teaching only. The savings from this will flow into academic priorities to be determined by SMT.
• Provide funding for expanded offerings for priority programmes and courses in selected campuses, with priority in 2017 for Kiribati, Vanuatu and Solomon Is campuses.
• Additional investments to be leader in the world in area of Marine Resources and Arts & Culture.
• Shift resources from non-academic activities to academic priorities based on benchmarking information. USP is currently below industry for comparable universities by 10%. SMT has agreed to shift it to 5% over the next three years, which is equivalent to shifting $2m of resources from non-academic sections to academic. These will be achieved overtime through outsourcing, automation and re-consideration of types and levels of services to be provided.
• The allocation of resources to Faculties has been quantified and fine tuned, the allocation of resources to support sections is still not based on international benchmarks and quantified workload.However, Benchmark information is being gathered to ensure that resource allocation to support sections is as rigorous as that to faculties.
• ICT initiatives as follows:
a. Review of REACT and fully negotiate with AARNET to maximize use of bandwidth capacity to deliver learning and teaching.
b. Expand pilot programmes in new campuses and locations for tablets.
c. Implement the new computer strategy of the University to maximize use of new technologies and shift away from provision of PC’s and computer labs.
d. Install a new integrated library management system (cloud based) for all campuses that enhances delivery of library and research information;
e. Huge investments in re-engineering and automation that will yield benefits of excellence by 2018.
• Introduce a new Student Learning Centre at Laucala campus, by re-configuring the Library ground floor to provide excellent learning space for interaction and effective learning, using current excellent models in other Universities.
• Invest in new pedagogies and learning spaces at faculties and regional campuses. This includes a completion of an assessment of the space needs of the University based on its current growth and pedagogical changes, and assesses the need to build additional spaces in future years, including a saving or fundraising plan to be able to fund capital expansion.
• Implement the merger of Pacific TAFE and CFS as per the SP. It includes an expansion plan into regional countries for the programmes, and plans to maximize current expanded facilities with in

THE UNIVERSITY OF THE SOUTH PACIFIC | ANNUAL PLAN 2017 Page 27
ACTIVITIES AND OUTPUTS OF THE AP201706
6.4 The key targets under each Priority Area are provided in Tables 4 to 10 below.
Fiji, Kiribati and Marshall Island towards end of 2017 or beginning of 2018.
• Implement the outsourcing of Properties & Facilities and the Mailroom. Opportunities for further outsourcing of non-core sections and services will be decided soon in 2016 for implementation in 2017.
• Implement the new security strategy for Laucala campus, and then roll these out to selected campuses in 2017.
• Implement the formation of a new Trust Fund (as approved by the Council) that will provide the legal framework for fundraising leading up to the 50th Anniversary.
• Commence the new Solomon Is campus project, funded by ADB.

THE UNIVERSITY OF THE SOUTH PACIFIC | ANNUAL PLAN 2017Page 28
Many initiatives are underway to improve graduate employability. Included are industrial attachments, entrepreneurship training and career hub services. The Careers Centre also continues with its trademark initiatives ranging from the Career-Hub portal, USP Career and Entrepreneurship Fair and Lunch Hour Career Talk sessions. Large-scale course and programme conversion to online mode is on-going across the University. Each Faculty is giving full attention to this.
The list of activities projected to undertake in 2017 are as follows, • Big emphasis place on programme mapping according to WSCUC graduate outcomes.
• Develop a standardised LT repository for all faculties to enhance information keeping and compliance with the university’s requirement to keep all USP documents together.
• Having identified issues with retention a new agreed definition work will be done to focus on improvements in areas identified to improve retention and continuously monitor the impacts.
• University-wide training in alignment of assessment to Learning outcomes to verify student learning better.
• Marketing English and IT programmes (professional) in overseas to attract international students to these accredited programmes.
PRIORITY AREA 1: LEARNING AND TEACHING
ACTIVITIES AND OUTPUTS OF THE AP201706

THE UNIVERSITY OF THE SOUTH PACIFIC | ANNUAL PLAN 2017 Page 29
ACTIVITIES AND OUTPUTS OF THE AP201706PACIFIC TAFE & COLLEGE OF FOUNDATION STUDIES MERGER
The SMT approved the Pacific TAFE and CFS merger proposal and the two sections under the leadership of the DVC LTSS are currently implementing the approved merger proposal for 2017 under the new structure. The integration of these two entities is in line with the USP Strategic Plan 2013-2018, specifically Priority Area five (5), Objective 20 - rationalising and strengthening TVET provision at USP. It also relates to the Strategic Plan Initiative 20.1, which requires strategic action to rationalize and strengthen CFS and Pacific TAFE to provide students with flexible pathways for university studies and technical and vocational programmes. The Pacific TAFE will extend its tourism programme to Nadi in 2017.The merger shall be fully implemented from January 2017.Parthways shall be monitored from 2017 to evaluate their use as predictors of success.
PSYCHOMETRIC TESTING CENTRE
The SMT approved the establishment of a Psychometric Test Centre within Pacific TAFE. The centre shall be fully operated by Pacific TAFE and will be used to evaluate all USP staff appointments, and shall be offered as commercial service on a cost recovery basis.
ONLINE STUDENT LEARNING SUPPORT
An Online Student Support Framework has been finalized and in 2017 the Planning and Quality Office will be able to compare the university’s performance with other universities in this area.
In addition, the interactive online tutorial support by third party provider “Your-Tutor” is being evaluated for it success, and it is planned that in 2017, a roll-out across the university will be implemented pending budget allocation and the outcome of this evaluation. If the evaluation is not positive then we shall consider other options such as travelling tutors, or in-country appointments. These also shall be evaluated for success looking at pass historical rates.
INSTITUTE OF EDUCATION’S PAEPP & GCEL PROGRAMMESThe Institute of Education offers 2 programs, the Professional Certificate in Educational Policy and Planning (PCEPP) and the Graduate Certificate in School Leadership (GCSL). The first cohort of the PCEPP included participants from Cook Islands and Niue – this group graduated in 2014. The second cohort is currently being run in Nauru and the group is expected to complete the programme in semester 2 2016. Arrangements are being made for a Suva Executive cohort to begin in 2017 and to be run annually thereafter.
GRADUATION From 2017, Student Administrative Services (SAS) will for the first time split the Laucala graduation ceremonies into two events. This is to cater for the growing number of graduands and the inclusion of Pacific TAFE graduands at the Laucala ceremony. The second Laucala graduation will be held later to cater for those completing mid-year. A trial graduation in Lautoka was successful, but due to low numbers will not be repeated in 2017. Likewise there was no interest in a proposed graduation in Labasa so this will not be considered for 2017.
WASC SENIOR COLLEGE AND UNIVERSITY COMMISSION ACCREDITATION A range of activities will be carried out in preparation for the Seeking Accreditation Visit in 2017. These include the implementation of the WSCUC project plans across the University. The project plans will be developed by the end of 2016 as a result of a preliminary self-review against the WSCUC standards of accreditation and criteria for review and will also feature areas in need of substantial development as identified through the regional campus road shows. Participation in the WSCUC Academic Resource Conference by the Accreditation Liaison Officer, Accreditation Project Coordinator and other relevant staff will also take place.
There will be various WSCUC workshops for targeted sections such as faculties, student bodies, etc to raise awareness on the WSCUC requirements and share progress made. These will be supported through trainings to be conducted by WSCUC specialists/consultants on particular WSCUC requirements that the university greatly lacks expertise on such as institutional research.

THE UNIVERSITY OF THE SOUTH PACIFIC | ANNUAL PLAN 2017Page 30
ACTIVITIES AND OUTPUTS OF THE AP201706Another key activity for 2017 will be the preparation of the self-review report and organization of a mock audit of evidences in close collaboration with the WSCUC consultants and submission of the 2017 WSCUC Annual Report.
In 2017 we shall systematically work through each CFR accumulating necessary evidence. All evidences shall be ratified by 2 external experts who have been through successful WSCUC accreditation at other universities.
FLEXIBLE AND ONLINE CONVERSIONSDVC LTSS shall produce an action plan. Faculties have been provided with details of which courses and programs are not converted, and a careful analysis shows which ones are achievable. Some Faculties have provided plans for this, for the others DVC LTSS shall work with them on a plan. Funding shall be via the SP funds for 2017.
AQA AUDITSMT responsible for AQA implementation have provided action plans. All will be achieved by the end of 2017.
OVERALL STUDENT SATISFACTIONIn 2017 the surveys shall be carefully analysed to identify specific areas of student concerns. This coupled with regular analysis of the student grievances and consolidation of USPSA concerns shall be used to target areas needing improvement.

THE UNIVERSITY OF THE SOUTH PACIFIC | ANNUAL PLAN 2017 Page 31
Key
Perf
orm
ance
In
dica
tors
SP T
arge
t 20
15Ac
tual
20
15Su
rplu
s/ D
efici
t 20
15Ta
rget
2
016
Targ
et
2017
SP T
arge
t 20
18Pr
ojec
ted
201
8Su
rplu
s/
Defic
it 20
18
1.0
Und
ergr
adua
te
com
plet
ions
Und
ergr
adua
te
com
plet
ions
6,01
54,
736
Defic
it (
1,27
9)5,
225
5,86
35,
413
5,33
3De
ficit
(80)
2.0
Post
grad
uate
co
mpl
etio
ns3,
462
3,50
5Su
rplu
s (4
3)3,
584
3,93
04,
274
4,07
3De
ficit
(201
)
3.1
10-y
ear P
hD
com
plet
ion
rate
s18
%19
%Su
rplu
s (1
%)
30%
30%
30%
19%
Defic
it
(11%
)
3.2
10-y
ear R
esea
rch
Mas
ter’s
co
mpl
etio
n ra
tes
45%
37%
Defic
it (8
%)
55%
55%
55%
37%
Defic
it
(18%
)
4.1
Num
bers
of
unde
rgra
duat
e pr
ogra
mm
es w
ith
flexi
ble
lear
ning
22 (f
rom
54
prog
ram
mes
)18
Pro
gram
mes
out
of
54
Surp
lus
(4
Prog
ram
mes
)13
(fro
m 5
4 pr
ogra
mm
es)
16 (f
rom
54
prog
ram
mes
)19
from
54
prog
ram
mes
33 fr
om 5
4 pr
o-gr
amm
esDe
ficit
(14)
4.2
Num
bers
of
unde
rgra
duat
e pr
ogra
mm
es
onlin
e
9 fr
om 5
4 pr
o-gr
amm
es3
from
pro
gram
mes
ou
t of 5
4De
ficit
10%
(or 6
pr
ogra
mm
es fr
om
54)
5 (fr
om 5
4 pr
ogra
mm
es)
7 (fr
om 5
4 pr
ogra
mm
es)
10 fr
om 5
4 pr
ogra
mm
es7
from
54
prog
ram
mes
Defic
it (3
)
5.1
Prog
ram
me
Accr
edita
tion
(incl
udes
Pa
cific
TAF
E pr
ogra
mm
es)
Addi
tiona
l 6
prog
ram
mes
ac
cred
ited
from
bas
elin
e
3 pr
ogra
mm
es
accr
edite
d (B
NC,
BS
E &
Cert
III i
n Co
mm
erci
al C
ooke
ry.
Prog
ram
me
accr
edita
tion
in-
prog
ress
for m
ore
than
8 p
rogr
amm
es
Defic
it 2
prog
ram
mes
Addi
tiona
l 5
prog
ram
mes
ac
cred
ited
from
bas
elin
e
Addi
tiona
l 10
prog
ram
mes
ac
cred
ited
from
bas
elin
e
Addi
tiona
l 15
prog
ram
mes
ac
cred
ited
from
bas
elin
e
2 pr
ogra
mm
esDe
ficit
(13)
TABL
E 04
: 201
7 KP
IS A
ND TA
RGET
S FO
R PR
IORI
TY A
REA
1: L
EARN
ING
AND
TEAC
HING
ACTIVITIES AND OUTPUTS OF THE AP201706

THE UNIVERSITY OF THE SOUTH PACIFIC | ANNUAL PLAN 2017Page 32
ACTIVITIES AND OUTPUTS OF THE AP201706Ke
y Pe
rfor
man
ce
Indi
cato
rsSP
Tar
get
2015
Actu
al
2015
Surp
lus/
Defi
cit
2015
Targ
et
201
6Ta
rget
20
17SP
Tar
get
2018
Proj
ecte
d 2
018
Surp
lus/
De
ficit
2018
5.2
AQA
Audi
tCo
mpl
ete
the
impl
emen
-ta
tion
of th
e re
com
men
da-
tions
aris
ing
from
AQ
A au
dit
16 o
ut 3
0 re
com
men
-da
tions
and
3 o
ut 7
af
firm
atio
ns h
ave
now
bee
n cl
osed
Defic
it (h
owev
er,
the
Uni
vers
ity
aim
s to
clo
se a
ll Re
com
men
da-
tions
and
Affi
rma-
tions
by
Mar
ch
2016
)
Com
plet
e th
e im
plem
en-
tatio
n of
the
bala
nce
of
reco
men
da-
tions
aris
ing
from
AQ
A au
dit
Com
plet
e th
e im
plem
en-
tatio
n of
the
bala
nce
of
reco
men
da-
tions
aris
ing
from
AQ
A au
dit
No
targ
etAl
l rec
omm
enda
-tio
ns a
re li
kely
to
be fu
lly im
ple-
men
ted
& cl
osed
Targ
et w
ill b
e m
et
5.3
WAS
C Ac
cred
itatio
nCo
mpl
ete
stag
es 4
/5
per W
SCU
C ac
cred
itatio
n gu
idel
ines
WSC
US
has
gran
ted
USP
elig
ibili
ty fo
r ca
ndid
acy
Defic
it (s
ever
al
stag
es p
er W
S-CU
C ol
d ac
cred
i-ta
tion
guid
elin
es).
Goo
d pr
ogre
ss a
s pe
r th
e re
vise
d gu
ide-
lines
Com
plia
nce
to s
tand
ards
of
acc
redi
ta-
tion
and
39
crite
ria fo
r re
view
Com
plia
nce
to
stan
dard
s of
ac
cred
itatio
n an
d 39
crit
eria
fo
r rev
iew
. W
SCU
C Ac
cred
itatio
n vi
sit
Achi
eve
full
WAS
C ac
-cr
edita
tion
May
be v
ery
clos
e to
full
accr
edita
-tio
n.
On
Targ
et
6G
radu
ate
empl
oy-
men
t 4 m
onth
s af
ter c
ompl
etio
n
64%
69%
(pro
ject
ed)
Surp
lus
(5%
)65
%66
%67
%70
%Su
rplu
s (3
%)
TABL
E 04
: 201
7 KP
IS A
ND TA
RGET
S FO
R PR
IORI
TY A
REA
1: L
EARN
ING
AND
TEAC
HING

THE UNIVERSITY OF THE SOUTH PACIFIC | ANNUAL PLAN 2017 Page 33
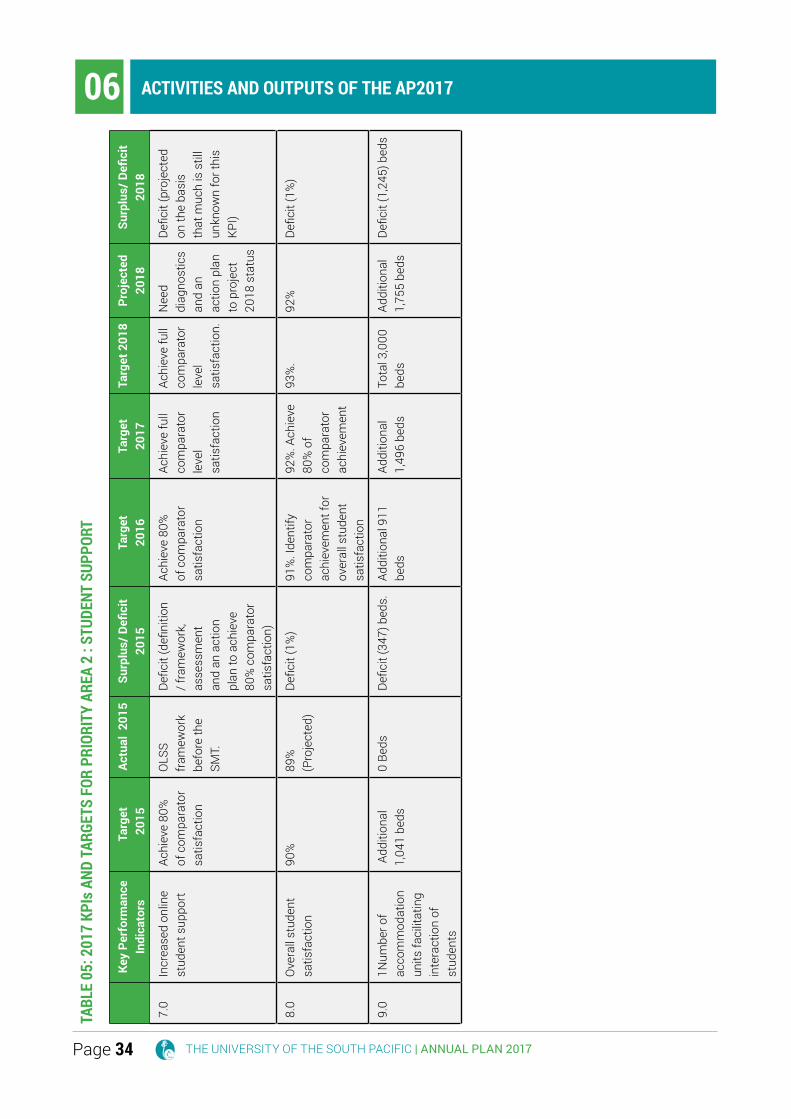
PRIORITY AREA 2: STUDENT SUPPORT
ACTIVITIES AND OUTPUTS OF THE AP201706
DISABILITY RESOURCE CENTREThe Disability Resoure Centre will continue to work on securing more internships and establishing work placement programmes for students with disabilities with more organisations. With the increasing number of students with disabilities, the Disability Resource Centre will be expanding its building to cater for this growth. This expansion is expected to be completed in 2017.
COUNSELLINGThe counselling centre will outsource some of its services in order to reach the larger regional campuses in 2017. The Laucala-based counsellors will continue to provide on campus support at Laucala as well as Skype and telephone support services.
THE UNIVERSITY OF THE SOUTH PACIFIC | ANNUAL PLAN 2017Page 34
TABL
E 05
: 201
7 KP
Is A
ND TA
RGET
S FO
R PR
IORI
TY A
REA
2 : S
TUDE
NT S
UPPO
RT
Ke
y Pe
rfor
man
ce
Indi
cato
rsTa
rget
2
015
Actu
al 2
015
Surp
lus/
Defi
cit
2015
Targ
et
2016
Targ
et
20
17Ta
rget
201
8Pr
ojec
ted
20
18Su
rplu
s/ D
efici
t 20
18
7.0
Incr
ease
d on
line
stud
ent s
uppo
rtAc
hiev
e 80
%
of c
ompa
rato
r sa
tisfa
ctio
n
OLS
S fr
amew
ork
befo
re th
e SM
T.
Defic
it (d
efini
tion
/ fra
mew
ork,
as
sess
men
t an
d an
act
ion
plan
to a
chie
ve
80%
com
para
tor
satis
fact
ion)
Achi
eve
80%
of
com
para
tor
satis
fact
ion
Achi
eve
full
com
para
tor
leve
l sa
tisfa
ctio
n
Achi
eve
full
com
para
tor
leve
l sa
tisfa
ctio
n.
Nee
d di
agno
stic
s an
d an
ac
tion
plan
to
pro
ject
20
18 s
tatu
s
Defic
it (p
roje
cted
on
the
basi
s th
at m
uch
is s
till
unkn
own
for t
his
KPI)
8.0
Ove
rall
stud
ent
satis
fact
ion
90%
89%
(P
roje
cted
)De
ficit
(1%
)91
%. I
dent
ify
com
para
tor
achi
evem
ent f
or
over
all s
tude
nt
satis
fact
ion
92%
. Ach
ieve
80
% o
f co
mpa
rato
r ac
hiev
emen
t
93%
. 92
%De
ficit
(1%
)
9.0
1Num
ber o
f ac
com
mod
atio
n un
its fa
cilit
atin
g in
tera
ctio
n of
st
uden
ts
Add
ition
al
1,04
1 be
ds0
Beds
De
ficit
(347
) bed
s.
Addi
tiona
l 911
be
dsAd
ditio
nal
1,49
6 be
dsTo
tal 3
,000
be
dsAd
ditio
nal
1,75
5 be
dsDe
ficit
(1,2
45) b
eds
ACTIVITIES AND OUTPUTS OF THE AP201706

THE UNIVERSITY OF THE SOUTH PACIFIC | ANNUAL PLAN 2017 Page 35
ACTIVITIES AND OUTPUTS OF THE AP201706
The 2017 work plan continues to focus on uplifting the performance of the University in research as measured against the institutional outputs and on what additional measures will be taken in 2017 to achieve them.
KPI’S AND TARGETS FOR PRIORITY AREA 3: RESEARCH
Priority Area 3
KPI Target2013-2015
Target2016-2018
10.0 High Quality A/A*Journal Outputs 111 131
11.0 Levels of external research income (FJ$) $15m/yr $22m/yr
12.0 Better research facilities Expand research space audit across USP & develop research facilities plan
Implement research facilities plan
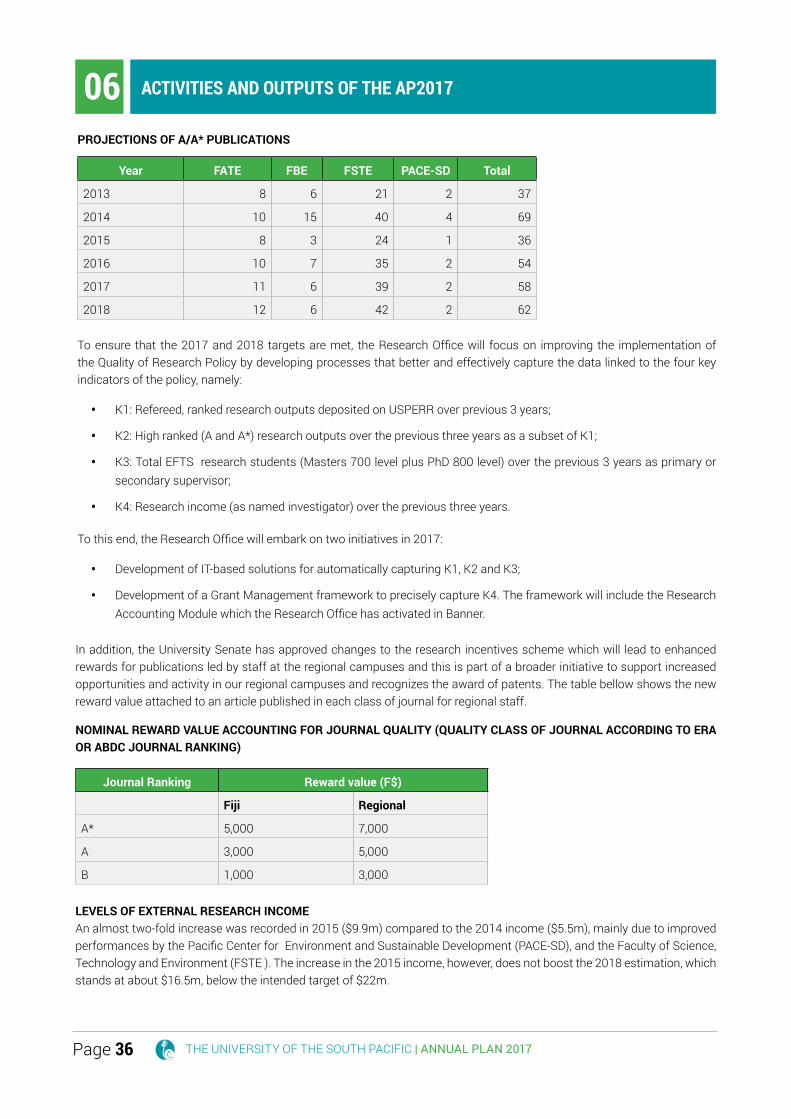
HIGH QUALITY A/A*JOURNAL OUTPUTSWith respect to KPI 10, the University ended the first triennium (2013 – 2015) with a high note, surpassing the target by 31 additional highly ranked (A/A*) publications. By extrapolation, the institutional cumulative targets ending 2016 -118, 2017 -125 and 2018 -131 can also be met, as shown in table bellow
PRIORITY AREA 3: RESEARCH AND INTERNATIONALISATION
THE UNIVERSITY OF THE SOUTH PACIFIC | ANNUAL PLAN 2017Page 36
ACTIVITIES AND OUTPUTS OF THE AP201706
In addition, the University Senate has approved changes to the research incentives scheme which will lead to enhanced rewards for publications led by staff at the regional campuses and this is part of a broader initiative to support increased opportunities and activity in our regional campuses and recognizes the award of patents. The table bellow shows the new reward value attached to an article published in each class of journal for regional staff.
NOMINAL REWARD VALUE ACCOUNTING FOR JOURNAL QUALITY (QUALITY CLASS OF JOURNAL ACCORDING TO ERA OR ABDC JOURNAL RANKING)
Journal Ranking Reward value (F$)
Fiji Regional
A* 5,000 7,000
A 3,000 5,000
B 1,000 3,000
LEVELS OF EXTERNAL RESEARCH INCOMEAn almost two-fold increase was recorded in 2015 ($9.9m) compared to the 2014 income ($5.5m), mainly due to improved performances by the Pacific Center for Environment and Sustainable Development (PACE-SD), and the Faculty of Science, Technology and Environment (FSTE ). The increase in the 2015 income, however, does not boost the 2018 estimation, which stands at about $16.5m, below the intended target of $22m.
PROJECTIONS OF A/A* PUBLICATIONS
Year FATE FBE FSTE PACE-SD Total
2013 8 6 21 2 37
2014 10 15 40 4 69
2015 8 3 24 1 36
2016 10 7 35 2 54
2017 11 6 39 2 58
2018 12 6 42 2 62
To ensure that the 2017 and 2018 targets are met, the Research Office will focus on improving the implementation of the Quality of Research Policy by developing processes that better and effectively capture the data linked to the four key indicators of the policy, namely:
• K1: Refereed, ranked research outputs deposited on USPERR over previous 3 years;
• K2: High ranked (A and A*) research outputs over the previous three years as a subset of K1;
• K3: Total EFTS research students (Masters 700 level plus PhD 800 level) over the previous 3 years as primary or secondary supervisor;
• K4: Research income (as named investigator) over the previous three years.
To this end, the Research Office will embark on two initiatives in 2017:
• Development of IT-based solutions for automatically capturing K1, K2 and K3;
• Development of a Grant Management framework to precisely capture K4. The framework will include the Research Accounting Module which the Research Office has activated in Banner.

THE UNIVERSITY OF THE SOUTH PACIFIC | ANNUAL PLAN 2017 Page 37
ACTIVITIES AND OUTPUTS OF THE AP201706EXTERNAL INCOME BY USP SECTIONS ($’000)
YEAR FALE FBE FSTE PACE-SD TOTAL Target
2011 1,848 342 3,981 7,708 13,879 -
2012 1,162 1,068 2,289 3,353 7,872 -
2013 1,407 1,306 2,125 268 5,106 -
2014 241 126 2,347 2,803 5,517 -
2015 1,743 1,059 2,357 4,770 9,929 -
2016 1,466 583 2,508 7,116 11,673 15,000
2017 1,634 460 2,624 9,367 14,085 17,300
2018 1,802 337 2,740 11,618 16,496 22,000
There continue to be difficulties with accurately capturing research grant income, in part because this data is currently captured manually in the Finance Office and in consequence ‘category’ misallocations can occur between development and research projects.
Two initiatives to be introduced in 2017 will greatly assist the better understanding and management of research income: first the Research Allocation Module (RAM) in Banner will provide a systematic approach to the identification and monitoring of research income; second, a Grant Management System that will be developed in 2017 and managed by the Research Office (lined to the RAM module in Banner) allow for both faculties and the Research Office to centrally monitor the progress and delivery of research grant activities and outcomes. This will mitigate against poor spending and late or non completion of grants and therefore improve the management of research income. It will also provide a more accurate picture of the total research income that the University is receiving which is likely to show improvements against the Strategic Plan targets.
In addition, in 2016 the Research Office instigated a new iteration of the Strategic Research Scheme funding. This scheme now requires University researchers to identify sources of external regional partner funding for projects that the University funds under the scheme. In 2016 $1.5m was allocated under the scheme and it is anticipated that in 2017, new sources of partner funding will be received by the University as this scheme gains traction and demonstrates impact. Additional a communciations and engagement plan which is now in development will be rolled out in 2017. This will include engagement with private sector partners involved or potentially involved in innovation projects as well as with a wide range of government, non government and private sector partners across all member states of the University. This work wil also support the member country research teams that are being put together to support focused partnership-based research and impacts across our region.
The University is also pursuing some major grant opportunites, including opportunities in partnership with international collaborators, such as the Horizon 2020 research bid with the University of Bergen and work that the Research Office is doing to open up access to participation in Australian Research Council Linkage projects. A Research Grants Manager will be appointed to the staff of the Research Office in 2017 and the principle functions of this person will be to identify external research grant opportunities, support grant applications and to systematically monitor grant applications, outcimes and deliverables on successful projects.
BETTER RESEARCH FACILITIES
This is seen as a factor that can boost completion rates in the masters and PhD programs. The Research Office is currently tasked with identifying research spaces in faculties and helping faculties develop space utilization plans.
The progress has been slow due to competing priorities, with the development of a Research Facilities Plan currently being undertaken with the view to complete it by the end of 2016. Additional human resources have been allocated to this KPI to enable the implementation of the Plan in 2017.

THE UNIVERSITY OF THE SOUTH PACIFIC | ANNUAL PLAN 2017Page 38
RESEARCH SPACE AUDIT PROGRESS
Key Performance
Indicators
Target 2015
Actual
2015
Deficit2015
Target2016-2018
Surplus/Deficit 2018
Better research facilities
Expand research space audit across USP & develop research facilities plan
Completed research space audit
Research facilities plan needs to be developed
Implement research facilities plan
Marginal (Research Facilities Plan needs to be completed and implemented)
Following the revision of the PG regulations by Senate in 2016 and the introduction of the postgraduate student monitoring portal, the prirority for 2017 is to enforce consistent and timely monitoring and reporting arrrangements across all faculties.
The new systems will enable a ‘flag’ to be automatically raised where difficulties or delays are experienced and imely intervention made at different levels (supervisor, Faculty, Research Office) to identify and manage blockages where these occur. It is anticipated that these improvements to postgraduate student candidature management will significantly enhance ccompletion rates, as previously the absence of these automatied systems, procedures and guidelines have made it very difficult to identify blockages in the system and mount timely interventions to address them.
Other initiatives being rolled out in 2017 include: a major revision to postgraduate supervisor training, replacing the ad hoc ‘on request’ system with a systematic training programme for all supervisors; an enhanced student research skills training programme; and the introduction of a supervisors’ register to enable better alignment between student’s research interests and supervisor expertise at the point of student application. It is important to understand the characteristic of student cohorts and an important piece of work on postgraduate student progress and completion rates by various variables including academic discipline, gender, entry qualification (GPA), part-time vs full-time enrolment, etc will be completed in 2016 and the evidence from this reported and applied in 2017 to better target areas for support as well as revisions to enrolment and candidature management criteria and practices.
INTERNATIONALISATION
In 2017, the International Office will focus on improving the following areas as per the strategic plan;
• Increase opportunities for USP students to study abroad;
• Increase in International Student Enrolment;
• Increase in International Student Postgraduate Enrolment;
• Increase in International Student Undergraduate Enrolment;
• EU Staff/Mobility Training;
• Increase in International Student Accommodation.
The benefits of consultancy primarily in our marketing plan and student support initiatives have strengthened services, team work and staff collaboration in meeting the objectives of the strategic plan. In addition, the International office will continue to engage in marketing and recruitment activities of full time and full fee paying study abroad students; and the recruitment of USP students to study abroad on a reciprocal arrangement. All these marketing activities implemented and completed in 2016 will be evident to the increase in enrolment in 2017.
ACTIVITIES AND OUTPUTS OF THE AP201706

THE UNIVERSITY OF THE SOUTH PACIFIC | ANNUAL PLAN 2017 Page 39
ACTIVITIES AND OUTPUTS OF THE AP201706
Outcomes of Excellence
Output Measures of Outputs (KPI)
Initiative in the
current SP (Y/N)
Baseline measure
2015
Target 2016
Target 2017
Target 2018
Support excellence in international student academic load forecasting, planning and management for the University
Increase in international student enrolment
% international student enrolment Y
198.6 EFTS
208.5 EFTS
218.9 EFTS
229.8 EFTS
Increase in international student PGR enrolment
No. of research of masters students
Y27.3 EFTS
28.8 EFTS
30.0 EFTS
31.5 EFTS
No. of PhD students
Y10.0 EFTS
10.5 EFTS
11.0 EFTS
11.5 EFTS
Increase in international student UG enrolment
No. of international students
Y66.2 EFTS
65.8 EFTS
69.1 EFTS
72.5 EFTS
Support excellence in staff quality
EU staff mobility training
No. of staff trained
N 2 HC 2 HC 4 HC 6 HC
Support excellence in international student accommodation
Increase international student accommodation
No. of beds on/off campus Y
188beds
197 beds
207 beds
217 beds
Support excellent in USP students studying abroad
Increase opportunities for USP students to study abroad
No. of USP students studying abroad
Y 23 25 27 30
OUTCOMES AND OUTPUTS OF EXCELLENCE

THE UNIVERSITY OF THE SOUTH PACIFIC | ANNUAL PLAN 2017Page 40
ACTIVITIES AND OUTPUTS OF THE AP201706TA
BLE
06: 2
017
KPI’S
AND
PRO
JECT
ION
FOR
PRIO
RITY
ARE
A 3:
RES
EARC
H AN
D IN
TERN
ATIO
NALI
ZATI
ON
Key
Perf
orm
ance
In
dica
tors
Targ
et
2015
Actu
al20
15Su
rplu
s/ D
efici
t 2
015
Targ
et
2016
Targ
et
2017
Targ
et
2018
Proj
ecte
d 20
18Su
rplu
s/ D
efici
t 20
18
10.0
Hig
h Q
ualit
y A/
A*Jo
urna
l Out
puts
111
132
Surp
lus
(21)
118
125
131
165
Surp
lus
(34)
11.0
Leve
ls o
f ext
erna
l re
sear
ch in
com
e (F
J$)
$15.
m$9
.93M
Defic
it ($
5.07
M)
$17.
3m/y
r$1
9.6m
/yr
$22m
/yr
$16.
5m/y
rDe
ficit
($5.
5m)
12.0
Bett
er re
sear
ch
faci
litie
sEx
pand
rese
arch
sp
ace
audi
t ac
ross
USP
&
deve
lop
rese
arch
fa
cilit
ies
plan
No
Inst
itutio
nal
Rese
arch
Fa
cilit
ies
Plan
Defic
it (In
stitu
tiona
l re
sear
ch
faci
litie
s pl
an)
Impl
emen
t re
sear
ch
faci
litie
s pl
an
Impl
emen
t re
sear
ch
faci
litie
s pl
an
Impl
emen
t re
sear
ch
faci
litie
s pl
an
Inst
itutio
nal
Rese
arch
Fa
cilit
ies
Plan
Mar
gina
l (Re
sear
ch
Faci
litie
s Pl
an n
eeds
to
be
com
plet
ed a
nd
impl
emen
ted)

THE UNIVERSITY OF THE SOUTH PACIFIC | ANNUAL PLAN 2017 Page 41
ACTIVITIES AND OUTPUTS OF THE AP201706PRIORITY AREA 4: INFORMATION & COMMUNICATION TECHNOLOGIES
The USP Strategic Plan (2013-2018), under the Priority Area 4 “Information and Communication Technologies” has four objectives: (1) ensure that the Information Communication Technology (ICT) provision adequately meets the University needs, (2) take a lead role in the region’s ICT development, (3) develop automation and business intelligence and (4) foster entrepreneurial activity in the region leveraging ICTs. These objectives are aimed to provide quality ICT services to both students and staff.
OBJECTIVE 1
For USP to provision adequately meets the University needs, USP needs on-going optimisation of the technical efficiency of its regional network (USPNet) requiring , continuing re-engineering of the USPnet. ICT resources need to be managed properly to ensure that they are used for priority areas of teaching, learning, and engagement. New bandwidth management policies and more robust service level agreements will improve this area in 2017. USPNet has now gone past the life of its antennae (which was 2015) and needs urgent replacement. New Zealand Government has shown interest in complete the re-engineering of USPNet and the replacement of all the earth stations. We are expected to have this project in place before end of 2018.
Submarine fibre-optic cable links were established to campuses in Tonga, the Marshall Islands and Vanuatu. The high capacity links have replaced expensive and less scalable satellite bandwidth and greatly improved access to online learning and teaching services. There are plans for Samoa for their submarine cable in 2017. Cook Islands, Niue, Nauru, and Kiribati all have plans for fibre connections in the next two years. USP must work hard with these countries and negotiate favourable pricing in order for these campuses to have better connectivity.

THE UNIVERSITY OF THE SOUTH PACIFIC | ANNUAL PLAN 2017Page 42
ACTIVITIES AND OUTPUTS OF THE AP201706To optimise USP ICT infrastructure for supporting cutting edge pedagogy, USP has deployed Wireless Mesh technology. This strengthens WiFi coverage to cater for the ‘explosion’ in the number of wireless devices - including smart-phones, laptops and tablets - used by staff and students.
VC has approved some fund for ITS and CFL to implement pod-casting with the intention to record the lectures starting from semester 1, 2017. Also fund was approved to implement Tablets for students (led by FSTE) and we will work with this group to implement this project in 2017. It is therefore expected that ITS continue to deploy the Network Access Control (NAC) project to Samoa, Vanuatu,Solomon Islands and Kiribati in 2017 and to the others after that.
OBJECTIVE 2Since the decision of the Leaders in 2015 that ICT would be one of the five big priorities for the Pacific and the assumption of the Chair of CROP ICT Working Group by the Vice-Chancellor, USP’s leadership in ICT in the region has strengthened considerably. The membership of the ICT Working Group has been expanded and its work aligned closely to what the region needs. The ICT Ministerial meeting held in Tonga last year agreed that the Cyber Security in the Pacific is a high priority. The CROP ICT Working has been tasked to work with the Business partners and donors and see how we could revive the Pacific Island Computer Emergency Response Team (PacCERT). The first task would be to secure the funds. Once funds are secured, the plan would be to implement the PacCERT Business Plans.
OBJECTIVE 3In terms of developing automation and business intelligence tools within USP business processes, USP IT Services has successfully deployed new server infrastructure. This is based on state-of-the-art IBM Pure Flex Server technology with the capacity to absorb growth and application development for the next five years. USP is currently looking at BANNER Self-servicing for both students and Finance models which would allow students and staff to access BANNER with a much user friendly interfaces. However, SMT has decided that it was most important to fully re-engineer our business processes and deal with data issues with current Banner before we invest further in new software and platforms. Our plan for 2017, would be to get this done, increase report development using Cognos that the University purchased in 2014. Work with Finance and Ellucian to develop USP Multi-Currency Solution is also important to resolve in 2017. Work with Student Academic Services (SAS) on Student Self-Servicing solution will proceed with the business process to be re-engineered prior to this.
OBJECTIVE 4
The development of the regional campuses become high priority now, as Nauru, Marshall and Solomon Islands campuses are underway. It is our understanding that these campuses are funded from an external funding, however, it is for our interest to make sure we have allocated funds for these developments.
In 2017, we are expected to implement the following projects. For Nauru, installation of a new satellite equipment since we can’t move the old satellite equipment to the new location. For Marshall Island, we need to run a fibre network to the new campus.
One of the major projects we are expected to implement is the Unify Telecommunication Voice over IP. The objective is to improve the quality of voice and data at the regional campuses. We also need to enhance the Laucala Campus Main Telephony services since it already 10 years old.
In order to narrow the digital gap between the USP Campuses, USP needs to secure funding for and implement the Library Management System for the Regional Campuses in 2017.Funding for this has support of FIC.
OBJECTIVE 5
Under the Strategic Plan, one of the Institution KPI’s was to develop a Pacific Knowledge Hub. In 2014, a plan was submitted to JICA and the negotiation fell short. Since than, submission was made to various donors with no success. Given that no donor is willing to commit funds to this KPI, it is our recommendation to consider remove this KPI from the Institutional KPI’s.

THE UNIVERSITY OF THE SOUTH PACIFIC | ANNUAL PLAN 2017 Page 43
ACTIVITIES AND OUTPUTS OF THE AP201706
SOLOMON ISLANDS CAMPUS DEVELOPMENTThe construction of the USP Solomon Islands Campus in Honiara will be a key priority for the University in 2017. The University Council had approved the Business Case for the USD 15.4m loan. The Solomon Islands Government has agreed to provide a sovereign guarantee for the loan. The final approval of the loan was given by ADB in mid -October 2016. The Asian Development Bank (ADB) has also approved the USD 1.5m grant under its Clean Energy Financing Partnership Facility (CERP) for the installation of the solar panel photovoltaic system at the new campus.
Expression of Interest (EOI) for the Detailed Design and Construction Supervision Consultancy for Requests for Proposals (RFP) has been issued and a consulting firm is expected to be appointed in late 2016. The consulting firm is expected to provide their final design report towards the end of Quarter 1, 2017. Following contract negotiation, appointment of contractor and mobilisation to site, it is envisaged that construction works at the new campus site is expected to commence in mid-2017. Tenders (international competitive bidding) will then be called for a civil works contractor which will be open for a period of six (6) weeks. Following assessment of the bids, contract negotiation, appointment of contractor and mobilization to site, it is envisaged that construction works at the new campus site will commence in mid-2017. The construction supervision consultant will be monitoring construction works by the contractor during the construction period .
STRENGTHENED CROP ICT WORKING GROUPThe University’s regional ICT engagement has been scaled up and further momentum is expected to be gained in 2017 through more active engagement with all the members of the strengthened CROP ICT Working Group (WG) and governments. A number of priorities have been identified by the CROP ICT WG and USP as lead agency will ensure that these priorities are undertaken by relevant agencies.
PRIORITY AREA 5: REGIONAL ENGAGEMENT

THE UNIVERSITY OF THE SOUTH PACIFIC | ANNUAL PLAN 2017Page 44
ACTIVITIES AND OUTPUTS OF THE AP201706Ta
ble
07: 2
017
KPIs
and
Targ
ets f
or P
riorit
y Are
a 5:
Reg
iona
l and
Com
mun
ity E
ngag
emen
t
Prio
rity
Area
Ke
y Pe
rfor
man
ce
Indi
cato
rs
Proj
ecte
d
2015
Actu
al
20
15Su
rplu
s/
Defic
it 20
15Pr
ojec
ted
201
6Ta
rget
201
7Ta
rget
20
18Pr
ojec
ted
201
8Su
rplu
s/
Defic
it 20
18
14.0
Upg
radi
ng
& ex
pans
ion
of R
egio
nal
cam
puse
s
Thre
e ne
w
cam
puse
s (S
olom
on
Is, K
iriba
ti,
Laut
oka)
an
d m
ajor
re
nova
tions
an
d ex
pans
ions
to
Ton
ga,
Vanu
atu
and
Tuva
lu
Kirib
ati
cam
pus
com
plet
ed
and
fully
op
erat
iona
l. Ac
quis
ition
of
the
Long
Is
land
Hot
el
by th
e RM
I go
vern
men
t
Defic
it (d
elay
ed
star
t of
Solo
mon
Is
cam
pus.
La
utok
a ca
mpu
s on
ho
ld)
RMI C
ampu
s Re
nova
tion
of
Long
Isla
nd
Hot
el
Nau
ru L
earn
ing
Villa
ge
Cons
truc
tion
com
men
ced.
ADB
Loan
Ap
prov
ed a
nd
TOR
rele
ased
fo
r SI C
ampu
s De
velo
pmen
t.
Tong
a Ca
mpu
s Co
ncep
t Mas
ter
Plan
app
rove
d by
SM
T.
Busi
ness
cas
es
for R
akira
ki
and
Siga
toka
pr
esen
ted
to E
C.
Com
plet
ion
of R
MI
New
Cam
pus.
Com
plet
ion
of N
ew N
auru
Ca
mpu
s.
Cons
truc
tion
of
New
SI C
ampu
s co
mm
ence
s.
Tuva
lu C
ampu
s Pr
oper
ty le
ase
secu
red
and
Conc
ept P
lan
appr
oved
.
Busi
ness
cas
es
for R
akira
ki a
nd
Siga
toka
to b
e ap
prov
ed.
Sant
o Sc
ienc
e La
b to
be
com
plet
ed
Thre
e ne
w
cam
puse
s na
mel
y So
lom
on
Isla
nd, K
iriba
ti,
Laut
oka
and
maj
or
reno
vatio
ns
and
expa
nsio
ns
to T
onga
, Va
nuat
u an
Tu
valu
Com
plet
e co
nstr
uctio
n of
So
lom
on Is
land
an
d La
utok
a ca
mpu
ses.
Defic
it (D
evel
opm
ent
of S
olom
on
Isla
nd a
nd
Laut
oka
cam
puse
s ar
e st
ill in
the
very
ea
rly s
tage
s)
15.0
Asso
ciat
ion
of H
eads
of
Ter
tiary
In
stitu
tions
in
the
Paci
fic
Isla
nds
(AH
TIPI
)
5 ac
tive
colla
bora
ting
wor
k st
ream
s an
d 15
m
embe
rs
May
be s
ame
as b
asel
ine
- 3 a
ctiv
e co
llabo
ratin
g w
ork
stre
ams
and
10
mem
bers
Defic
it (2
act
ive
colla
bora
ting
wor
k st
ream
s an
d 5
mem
bers
)
6 ac
tive
colla
bora
ting
wor
k st
ream
s an
d 16
mem
bers
7 ac
tive
colla
bora
ting
wor
k st
ream
s an
d 18
m
embe
rs
8 ac
tive
colla
bora
ting
wor
k st
ream
s an
d 20
m
embe
rs
May
be s
ame
as b
asel
ine
- 3 a
ctiv
e co
llabo
ratin
g w
ork
stre
ams
and
10
mem
bers
Defic
it (5
act
ive
colla
bora
ting
wor
k st
ream
s an
d 10
m
embe
rs)

THE UNIVERSITY OF THE SOUTH PACIFIC | ANNUAL PLAN 2017 Page 45
ACTIVITIES AND OUTPUTS OF THE AP201706
Despite previous efforts, our HR office and our HR practice need serious improvements as identified recently at the Risk Management Workshop. To achieve excellence, in 2016 a Re-Engineering Project was undertaken by EQUIBT, an Australian based HR Consulting Company. The objective of the Re-Engineering project is to improve the efficiency and effectiveness of the HR department in supporting the efficient management of the University’s human resource. The new organization structure approved in 2016 has paved the way for additional manpower resources at the HR department. This is a major move toward resolving the traditional shortfalls at the University HR department. In 2017 the University will place a strong focus on implementing the key recommendations detailed in this report. In particular, this will be based upon an implementation plan approved by SMT. In addition, shortcomings in the delivery of HR services will be addressed by a systematic staff training and development programme, by enhanced performance management of HR staff within the new structure, by stronger communication and engagement with stakeholders, and by the establishment of service level agreements which will hold staff and managers accountable for the performance of the department. Hence, 2017 and beyond will be crucial for the H R office to show that investments in both people and systems show actual measured improvements.
As the result of the Voice surveys conducted over the years, there are major initiatives planned for 2017 to create a healthy, satisfying, and high performing work environment that is conducive to high productivity. These initiatives also intend to further eliminate silos and promote consolidation and collaboration of efforts in the achievement of the Strategic Plan objectives such low turnover and employee satisfaction rates.
The University recently approved a workload allocation model. Staff evaluated as non–research active, or low research active, have been classified as ‘Teaching Only’ or ‘Teaching Intensive’, with highly research active staff classified as ‘Research Intensive’. Non–research active staff will be allocated proportionally more teaching duties as per the staff workload model. Research Intensive staff will have proportionally lightened teaching duties and greater time allocated for research. This will also be reflected in all new contracts issued to academic staff and to assist this process the University will introduce new templates for its contracts to ensure both consistency and accountability for outcomes and performance.
PRIORITY AREA 6: OUR PEOPLE

THE UNIVERSITY OF THE SOUTH PACIFIC | ANNUAL PLAN 2017Page 46
The University intends to review further its Performance Management Framework to facilitate a high performance culture and align staff review process more closely with Strategic Plan objectives and achievements. This will be be implemented in 2017.
A major streamlining of the recruitment process and automation is underway. It will be augmented by HR automation in the Banner revitalization.
Cross-unit discussions towards the end of 2014 explored options to ease the challenges in attracting high-quality academic staff to the regional campuses (see Table 8: KPI 17.0). Country-specific strategies will be adopted to attract quality staff using fractional/itinerant flexible appointments. The conditions for Teaching Assistants are being reviewed to provide better career paths.
There is a emphasis on building strong leadership capacities in the University, particularly at its Middle – Management level because of its critical leadership role that these managers have in the University’s organisational structure and the impact they have in setting the tone for a positive culture fostering high positive output. The HR department is working with external parties on continuing with its leadership programs. The intent is to equip middle management in dealing with issues at their level and continue to build an environment that is positive and healthy for everyone, thus improving the effectiveness of our core business.
ACTIVITIES AND OUTPUTS OF THE AP201706

THE UNIVERSITY OF THE SOUTH PACIFIC | ANNUAL PLAN 2017 Page 47
TABL
E 08
201
7 KP
Is A
ND TA
RGET
S FO
R PR
IORI
TY A
REA
6: O
UR P
EOPL
E
Prio
rity
Area
6: O
ur
Peop
le
Key
Perf
orm
ance
In
dica
tors
Targ
et
2015
Actu
al
2015
Surp
lus/
De
ficit
2015
Targ
et
201
6Pr
ojec
ted
20
16Ta
rget
20
17Ta
rget
20
18Pr
ojec
ted
20
18Su
rplu
s/ D
efici
t 20
18
16.0
Num
ber o
f Pr
ofes
sors
3022
Defic
it (8
)30
2530
6023
Defic
it (3
7)
17.0
Non
-Lau
cala
Ac
adem
ic S
taff
17%
22%
Surp
lus
(5%
)18
%19
%20
%20
%30
%Su
rplu
s (1
0%)
18.1
Seni
or L
ectu
rer
band
Sta
ff tu
rnov
er
7.07
%1.
67%
Surp
lus
(5.4
%)
0.9%
0.9%
1.2%
5.66
%1.
94%
Surp
lus
(3.7
2%)
18.2
Asso
ciat
e Pr
ofes
sor b
and
Staf
f tur
nove
r
7.25
%0.
72%
Surp
lus
(6.5
3%)
5.0%
0.5%
5.0%
5.80
%0.
73%
Surp
lus
(5.0
7%)
18.3
Prof
esso
r ban
d St
aff T
urno
ver
7.46
%0.
48%
Surp
lus
(6.9
8%)
0.4%
0.5%
0.7%
5.96
%1.
21%
Surp
lus
(4.7
5%)
19.0
Staf
f Sa
tisfa
ctio
n86
%87
%Su
rplu
s (1
%)
a. D
ata
defin
ition
of s
taff
satis
fact
ion,
b. D
eter
min
e cu
rren
t pe
rfor
man
ce p
er d
ata
defin
ition
,
c. In
stitu
tiona
l tar
gets
re
lativ
e to
com
para
tor
Uni
vers
ities
,
d. A
ctio
n pl
an to
mee
t ta
rget
55%
65%
Reac
h th
e av
erag
e sa
tisfa
ctio
n le
vels
of o
ur
com
para
tors
85%
Defic
it (im
plem
enta
tion
of
all a
ctio
ns id
entifi
ed
to im
prov
e st
aff
satis
fact
ion)
ACTIVITIES AND OUTPUTS OF THE AP201706

THE UNIVERSITY OF THE SOUTH PACIFIC | ANNUAL PLAN 2017Page 48
In 2017, the key priority will be to commence discussion with Australia and New Zealand for the new Partnership Agreement beyond 2018 to be launched during the University’s 50th Anniversary celebrations in 2018.
Current resource mobilisation strategies will be re-examined in 2017 to diversify sustainable means through which the University can increase the amount of development assistance received from external partners. New strategic approaches will be implemented through rigorous awareness raising on the work undertaken by the University through the implementation of priorities under its Strategic Plan 2013-2018 and the Seven Strategic Research Themes (SRTs), which ultimately contributes towards the development of the region. An assessment will be undertaken to ascertain the synergies between the core initiatives of the University and priorities of development partners, foundations and philanthropic organisations. These efforts will be substantiated via means of the Development Partners Forum (DPF) and the High Level Consultations (ANZ) whereby it provides an open platform for discussion with external partners and alignment of priorities.
The European Union (EU) has approved EUR 1.9m for the second phase of the Support to the Global Climate Change Alliance (GCCA) through capacity building, community engagement and applied research in the Pacific for 16 months. This project will be continue until July 2017. Care will be taken to ensure that this project is implemented effectively to set the groundwork for securing additional funding from the EU. Subject to the successful implementation of the recommendation from the EU Pillar Assessment by the end of the current year, more effort will be vested in 2017 to ensure that additional resources are secured via EU’s various resource envelopes, including signing of the Pillar Assessed Grant or Delegation Agreement (PAGODA) or Contribution Agreements for projects under the 11th European Development Fund programme.
ACTIVITIES AND OUTPUTS OF THE AP201706PRIORITY AREA 7: GOVERNANCE, MANAGEMENT, LEADERSHIP AND CONTINUOUS IMPROVEMENT /DEVELOPMENT

THE UNIVERSITY OF THE SOUTH PACIFIC | ANNUAL PLAN 2017 Page 49
PROJECTS’ FUTUREGiven the change in Australia’s foreign aid policy to shift away from project based initiative, the funding for the Pacific Islands Legal Information Institute (PacLII) and Pacific Islands Centre for Public Administration (PICPA) projects by Australia’s Department of Foreign Affairs and Trade (DFAT) is not expected to continue, whilst it is expected that some transitional funding will be allocated by Australia to enable the University to sustain the projects as Institutes of the University. The Funding Agreement for the PacLII project came to an end in June 2016 and the term for the Funding Agreement for PICPA will be completed at the end of June 2017. The priority for the remainder of this year and 2017 will be to ensure that some transitional funding is secured from DFAT and that the proposals for both PICPA and PacLII are prepared for resources to be mobilised to substantiate the projects in the future. While it is likely that some transitional funding will come from Australia, it is not clear if this will be in the case of PICPA.
Another key priority for 2017 is to have the Monitoring and Evaluation (M&E) Framework approved and effectively implemented to ensure that externally funded projects implemented by the University are effectively delivered and reported on. The M&E Framework will be aligned closely with the Grant Management System being developed in close consultation with the Research Office. The Strategic Partnership and Donor Assistance Policy and Procedure will also be implemented rigorously once approved by the Finance and Investment Committee (FIC). This Policy is designed to provide clarity of roles and responsibilities and the outline the processes and procedures for soliciting donor funds and establishing strategic relationship with existing and new partners of the University.
MARKETINGThe Marketing Unit has been steadily reducing its advertising spend over the past few years and the plan is to continue this in 2017. There will be fewer traditional form of advertising such as through newspapers, radio and television, but greater focus will be given to social media and digital marketing. The marketing campaign for 2017 with have a bigger digital component. The head office will continue working closely with the regional campuses to ensure that they are supplied with the latest marketing collaterals for their marketing campaigns and provide guidance on their marketing strategy for 2017.
In the last quarter of 2016, the Unit will call for Expressions of Interest for a suitable Re-branding consultant/agency. 2017 will see the conceptualisation of the new brand, with implementation targeted for completion by the end of 2017. Re-branding will be an important prelude to USP’s 50th Anniversary celebration.
The marketing office also plans to run a series of workshops in 2017 for the regional campuses/faculties/sections on social media/digital marketing. This is to strengthen their delivery of marketing strategies and plans in the new age of digital marketing.
COMMUNICATIONSA major focus in 2017, especially in the lead up to the 50th Anniversary celebrations would be to increase the profile of the University as the premier provider of higher education in the region. This will ensure greater transparency and accountability of the University’s activities and developments in the media as well as stakeholders. The Communications Unit will particularly focus on developing articles and press releases focusing on highlighting the major achievements of USP since its establishment up until now with emphasis on landmark achievements for the University such as the opening of the new campuses and the expansion of the University as a whole. It will work closely with the Marketing Unit to develop a Communications and Marketing Strategy for the 50th Anniversary event to increase public relations activities.
Regional campuses will continue to be supported in developing professional communications activities and materials pro-actively. There will be closer interaction with regional campuses to ensure greater public relations support for local events, activities and projects and timely sharing of information with the widest possible audience. In 2017, the Communications Unit will increase its liaison with regional campuses to ensure that those campuses are more accountable to reporting back and sending information on their achievements and events which can be used to raise their profiles through the monthly publications such as USP Beat and USP Alumni Magazine. The Communications Unit, will also conduct media a training with the Regional Directors during the Regional Directors Forum in 2017 to build the regional campus capacity in terms of responding to media requests and queries as well collating and gathering footage and photos for archival and media purposes.
ACTIVITIES AND OUTPUTS OF THE AP201706
THE UNIVERSITY OF THE SOUTH PACIFIC | ANNUAL PLAN 2017Page 50
The Communications Unit will also increase our networking with the representatives of the local and regional media to build our rapport as a media responsive and transparent University. Furthermore, the Unit will review and update the current Tukutuku Policy to ensure effective dissemination of internal information.
2017 will see USP website more closely analysed to determine areas where information needs to be updated and the scope will be expanded to include face-lift of regional campuses website. More training for new and existing staff to empower self-management of their respective websites.
The main USP server will also be upgraded to more powerful machine. As part of re-branding, the University website framework & templates will be analysed to uplift the look and feel of USP web presence. Priority will be to work towards a more responsive and user-friendly, cross browser, cross device compatible website to be launched during the 50th Anniversary celebrations in 2018. All web related policies will also be reviewed and revised as required. USP Policies website will be improved to be in compliance with accreditation requirements.
ALUMNI
2017 will be a very active year for the Alumni Unit as it will work on establishing a stronger foothold on its operational effectiveness and efficiency. It will see the initial beginnings of cultivating a culture of pride and loyalty not only amongst the alumni, but also the present students to increase affinity towards USP. This will be done by increasing visibility of alumni engagement with the University through avenues such as guest lectures and promotion of such activities.
USP Alumni will be encouraged to contribute to the University in kind as well as financially with clear indication of how their money will be spent. An Alumni Speakers Series will be commenced to bring back prominent professional alumni to share their experiences. Preparation for USP’s 50th Anniversary will begin by collating and profiling prominent alumni who have contributed socially, financially or politically to the University and the community.
The Unit will also take an active and holistic approach in identifying the needs and expectations of USP alumni and all its Faculties and Campuses. Avenues for partnership and consolidation will be explored. USP alumni will continue to gain benefits from The University of the South Pacific Alumni Network (USPAN) and the benefits suite will be expanded. Work will continue on signing up more corporate partners.
In order to encourage formation of USPAN, guideline documents will be prepared on how to start a new USPAN Group; roles and responsibilities of the group as well as how to sustain one. The Alumni Coordinator will work with the International Manager in developing an International Alumni Plan focusing on international students who attend the University.
A ‘Friends of Alumni’ sponsorship package which will be sold to corporate bodies and inviting the alumni to recruit for their companies. The range of USP alumni merchandise available for sale will also be expanded to promote income for the Unit.
The joint project by the Alumni Unit and the Student Administrative Services (SAS) on data-entry of all students’ records from the pre-banner era (1968-1991) will be completed in the first quarter of 2017. The USPAN MIS will be up and running by early 2017 as well and the Unitwill have a new website.
ACTIVITIES AND OUTPUTS OF THE AP201706

THE UNIVERSITY OF THE SOUTH PACIFIC | ANNUAL PLAN 2017 Page 51
TABL
E 09
: 2
017
KPIs
AND
TARG
ETS
FOR
PRIO
RITY
ARE
A 7:
GOV
ERNA
NCE,
MAN
AGEM
ENT,
LEAD
ERSH
IP A
ND C
ONTI
NUOU
S IM
PROV
EMEN
T
Key
Perf
orm
ance
In
dica
tors
Targ
et 2
015
Actu
al
2015
Surp
lus/
Defic
it 20
15Pr
ojec
ted
2016
Targ
et
2017
Targ
et
Proj
ecte
d
2018
Surp
lus/
De
ficit
2018
20.0
Inco
me
dive
rsifi
catio
n –
com
mer
cial
in
com
e (F
J$).
$20m
$16.
93m
Defic
it $3
.07m
$20.
6m$1
7.2m
$
26.3
4m$2
2.64
mDe
ficit
$3.7
m
21.0
Ope
ratin
g su
rplu
s3%
3.4%
(0.4
%)
5%3%
5%4%
(1%
)
22.0
Tota
l ad
min
istr
ativ
e re
view
Revi
ew &
initi
al
impl
emen
tatio
n co
mpl
eted
Fina
nce
revi
ew
com
plet
e.
HR
revi
ew
com
plet
e bu
t re-
engi
neer
ing
part
stil
l in
prog
ress
. TA
RP re
view
of
the
Uni
vers
ity
dela
yed.
Re
view
of
regi
onal
ca
mpu
ses
–
repo
rt w
ith
SMT
Mar
gina
l but
ve
ry p
ossi
ble
(revi
ew a
nd
initi
al im
ple-
men
tatio
n is
lik
ely
to b
e co
mpl
eted
be
fore
end
of
2015
)
Com
plet
ed
regi
onal
ca
mpu
ses,
HR
and
Fina
nce
revi
ew.
Full
impl
emen
tatio
n an
d ac
cept
re
com
men
datio
n
of re
gion
al
cam
puse
s, H
R an
d Fi
nanc
e re
view
.
Full
impl
emen
tatio
nFu
ll im
plem
enta
tion
Mar
gina
l
ACTIVITIES AND OUTPUTS OF THE AP201706

FUNDING THE PRIORITIES AND ACTIVITIES07
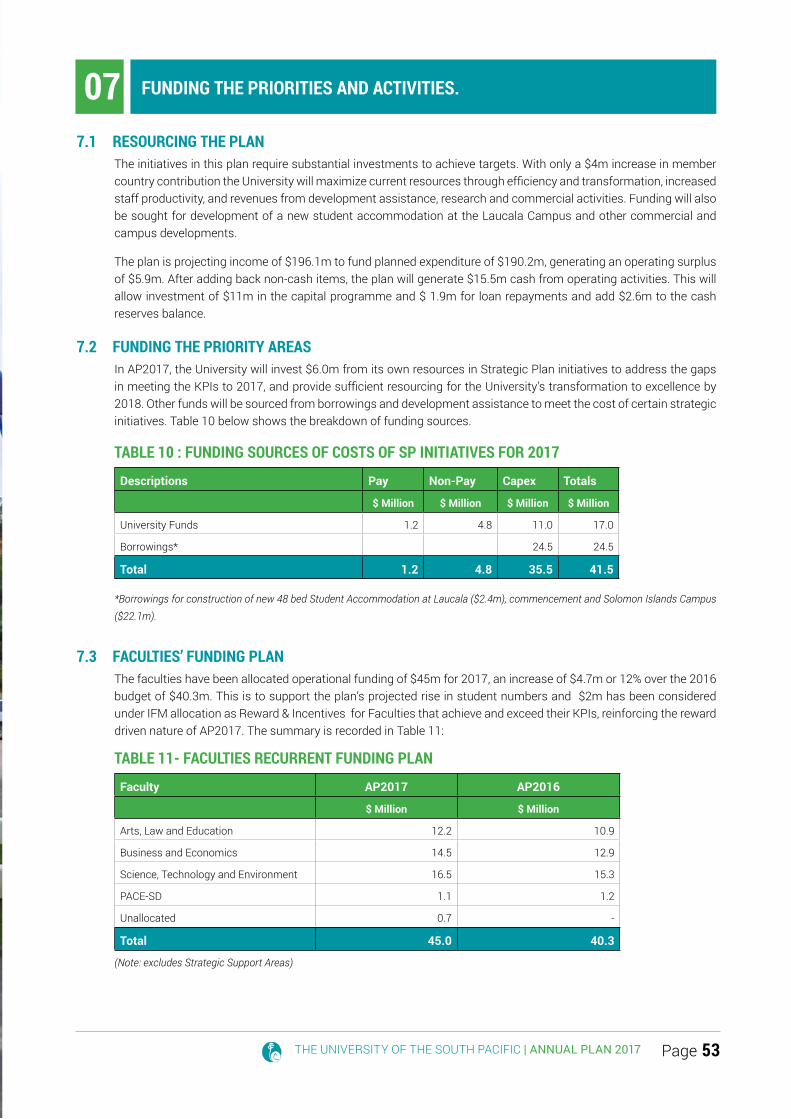
THE UNIVERSITY OF THE SOUTH PACIFIC | ANNUAL PLAN 2017 Page 53
FUNDING THE PRIORITIES AND ACTIVITIES.077.1 RESOURCING THE PLAN
The initiatives in this plan require substantial investments to achieve targets. With only a $4m increase in member country contribution the University will maximize current resources through efficiency and transformation, increased staff productivity, and revenues from development assistance, research and commercial activities. Funding will also be sought for development of a new student accommodation at the Laucala Campus and other commercial and campus developments.
The plan is projecting income of $196.1m to fund planned expenditure of $190.2m, generating an operating surplus of $5.9m. After adding back non-cash items, the plan will generate $15.5m cash from operating activities. This will allow investment of $11m in the capital programme and $ 1.9m for loan repayments and add $2.6m to the cash reserves balance.
7.2 FUNDING THE PRIORITY AREAS In AP2017, the University will invest $6.0m from its own resources in Strategic Plan initiatives to address the gaps in meeting the KPIs to 2017, and provide sufficient resourcing for the University’s transformation to excellence by 2018. Other funds will be sourced from borrowings and development assistance to meet the cost of certain strategic initiatives. Table 10 below shows the breakdown of funding sources.
TABLE 10 : FUNDING SOURCES OF COSTS OF SP INITIATIVES FOR 2017
Descriptions Pay Non-Pay Capex Totals
$ Million $ Million $ Million $ Million
University Funds 1.2 4.8 11.0 17.0
Borrowings* 24.5 24.5
Total 1.2 4.8 35.5 41.5
*Borrowings for construction of new 48 bed Student Accommodation at Laucala ($2.4m), commencement and Solomon Islands Campus ($22.1m).
7.3 FACULTIES’ FUNDING PLANThe faculties have been allocated operational funding of $45m for 2017, an increase of $4.7m or 12% over the 2016 budget of $40.3m. This is to support the plan’s projected rise in student numbers and $2m has been considered under IFM allocation as Reward & Incentives for Faculties that achieve and exceed their KPIs, reinforcing the reward driven nature of AP2017. The summary is recorded in Table 11:
TABLE 11- FACULTIES RECURRENT FUNDING PLAN
Faculty AP2017 AP2016
$ Million $ Million
Arts, Law and Education 12.2 10.9
Business and Economics 14.5 12.9
Science, Technology and Environment 16.5 15.3
PACE-SD 1.1 1.2
Unallocated 0.7 -
Total 45.0 40.3
(Note: excludes Strategic Support Areas)

THE UNIVERSITY OF THE SOUTH PACIFIC | ANNUAL PLAN 2017Page 54
FUNDING THE PRIORITIES AND ACTIVITIES.07The Faculties will continue strengthening their efforts in 2017 to improve productivity and remove unviable courses. This will release much needed resources to boost quality learning and teaching. The University remains committed to utilising its resources efficiently and effectively to produce high quality graduates and research relevant to the region. Faculties will also rationalise programmes and courses and maximise teaching resources through workload changes. This include the implementation of new QOR in 2017, reclassifying academic staff into research intensive, normal load, teaching intensive and teaching only. The savings from these changes will release funds to invest in other academic priorities to be agreed at SMT
The University has amended its internal funding model slightly and has implemented a change from 2016 to increase the viability threshold of courses from 60 to 80 students for 100 level courses and from 20 to 35 for 200 level ones. There will also be a shift of programmes to blended modes, removing the expense of extra resources to operate both face-to-face and flexible modes. Savings will be re-invested in the Faculties for more professors and senior staff in targeted areas, increasing research and conference funding, increasing reward funds to encourage right behaviours, and properly resource faculty and school support staff. The total 2017 funding for each faculty is provided in Table 12 below:
TABLE 12 TOTAL FACULTY FUNDING 2017
Recurrent Funds ($) Reward* Funds ($) Department** Funds ($) Total ($)
Arts, Law and Education 12.02 0.22 1.54 13.78
Business and Economics 14.01 0.54 2.78 17.33
Science, Technology and Environment
15.92 0.58 0.63 17.13
PACE-SD 1.05 0.03 0.56 1.65
Unallocated - 0.63 0.63
Total 43.00 2.00 5.52 50.52
*Department Funds are made up of flexi school, consultancy and fundraising activities, and are self-funding.
7.4 The funding plan for the strategic support areas under the control of the Vice Chancellor and Deans are summarized in Table 13 below. The recurrent funding for Institutes is to cover the management costs and administrative support while all other operating costs are covered by the Institute income.
TABLE 13 -RECURRENT FUNDING PLAN FOR INSTITUTES AND CENTRES
Strategic Plan Support Area AP2017 AP2016
$ millions $ millions
Oceania Centre for Arts, Culture and Pacific Studies 0.67 0.55
Confucius Institute- Admin Support 0.05 -
Centre for Pacific Languages 0.19 0.19
Institute of Education 0.13 0.19
Institute of Marine Resources 0.19 0.13
IRETA 0.20 0.13
Herbarium 0.13 0.14
Institute of Applied Science 0.18 0.18
Total 1.74 1.50
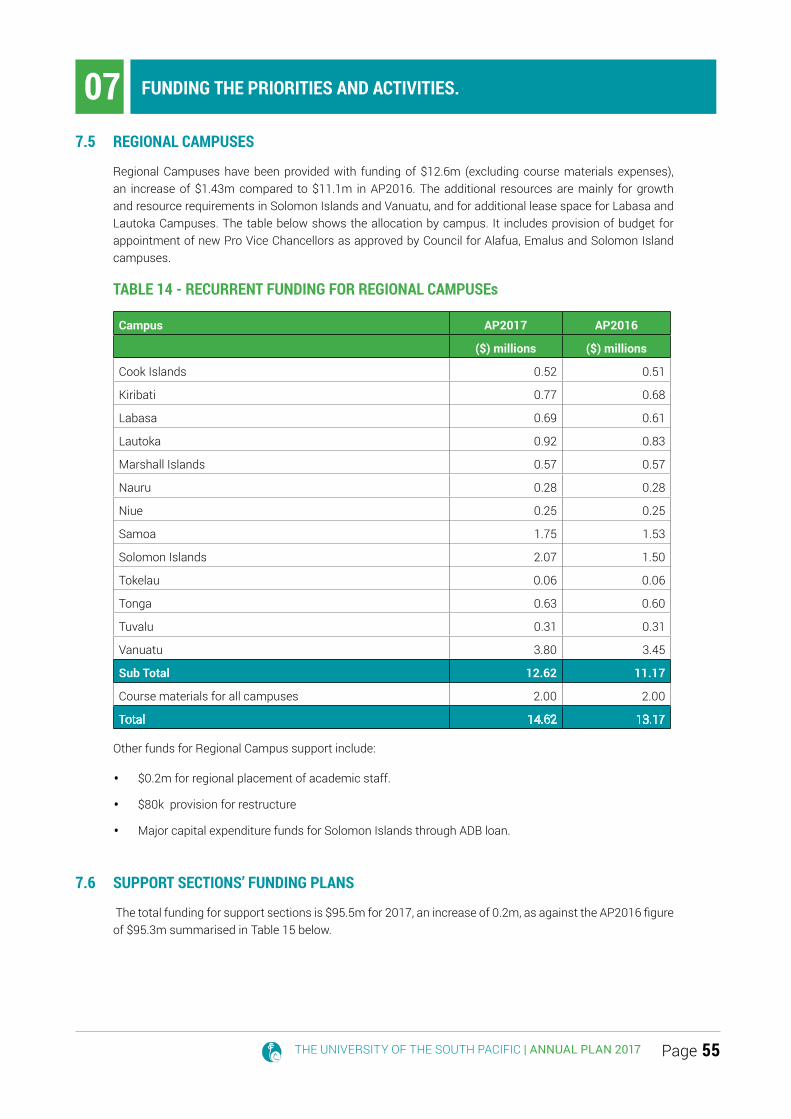
THE UNIVERSITY OF THE SOUTH PACIFIC | ANNUAL PLAN 2017 Page 55
7.5 REGIONAL CAMPUSES
Regional Campuses have been provided with funding of $12.6m (excluding course materials expenses), an increase of $1.43m compared to $11.1m in AP2016. The additional resources are mainly for growth and resource requirements in Solomon Islands and Vanuatu, and for additional lease space for Labasa and Lautoka Campuses. The table below shows the allocation by campus. It includes provision of budget for appointment of new Pro Vice Chancellors as approved by Council for Alafua, Emalus and Solomon Island campuses.
TABLE 14 - RECURRENT FUNDING FOR REGIONAL CAMPUSEs
Campus AP2017 AP2016
($) millions ($) millions
Cook Islands 0.52 0.51
Kiribati 0.77 0.68
Labasa 0.69 0.61
Lautoka 0.92 0.83
Marshall Islands 0.57 0.57
Nauru 0.28 0.28
Niue 0.25 0.25
Samoa 1.75 1.53
Solomon Islands 2.07 1.50
Tokelau 0.06 0.06
Tonga 0.63 0.60
Tuvalu 0.31 0.31
Vanuatu 3.80 3.45
Sub Total 12.62 11.17
Course materials for all campuses 2.00 2.00
Total 14.62 13.17
Other funds for Regional Campus support include:
• $0.2m for regional placement of academic staff.
• $80k provision for restructure
• Major capital expenditure funds for Solomon Islands through ADB loan.
7.6 SUPPORT SECTIONS’ FUNDING PLANS
The total funding for support sections is $95.5m for 2017, an increase of 0.2m, as against the AP2016 figure of $95.3m summarised in Table 15 below.
FUNDING THE PRIORITIES AND ACTIVITIES.07
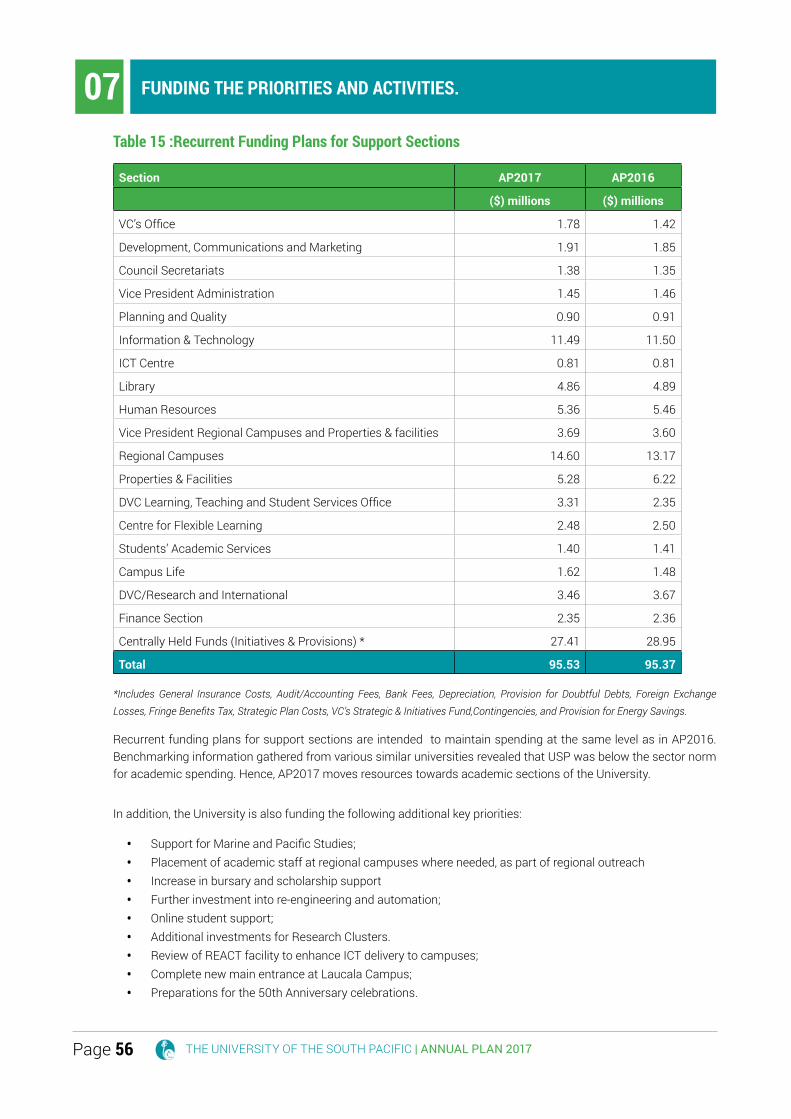
THE UNIVERSITY OF THE SOUTH PACIFIC | ANNUAL PLAN 2017Page 56
FUNDING THE PRIORITIES AND ACTIVITIES.07Table 15 :Recurrent Funding Plans for Support Sections
Section AP2017 AP2016
($) millions ($) millions
VC’s Office 1.78 1.42
Development, Communications and Marketing 1.91 1.85
Council Secretariats 1.38 1.35
Vice President Administration 1.45 1.46
Planning and Quality 0.90 0.91
Information & Technology 11.49 11.50
ICT Centre 0.81 0.81
Library 4.86 4.89
Human Resources 5.36 5.46
Vice President Regional Campuses and Properties & facilities 3.69 3.60
Regional Campuses 14.60 13.17
Properties & Facilities 5.28 6.22
DVC Learning, Teaching and Student Services Office 3.31 2.35
Centre for Flexible Learning 2.48 2.50
Students’ Academic Services 1.40 1.41
Campus Life 1.62 1.48
DVC/Research and International 3.46 3.67
Finance Section 2.35 2.36
Centrally Held Funds (Initiatives & Provisions) * 27.41 28.95
Total 95.53 95.37
*Includes General Insurance Costs, Audit/Accounting Fees, Bank Fees, Depreciation, Provision for Doubtful Debts, Foreign Exchange Losses, Fringe Benefits Tax, Strategic Plan Costs, VC’s Strategic & Initiatives Fund,Contingencies, and Provision for Energy Savings.
Recurrent funding plans for support sections are intended to maintain spending at the same level as in AP2016. Benchmarking information gathered from various similar universities revealed that USP was below the sector norm for academic spending. Hence, AP2017 moves resources towards academic sections of the University.
In addition, the University is also funding the following additional key priorities:
• Support for Marine and Pacific Studies; • Placement of academic staff at regional campuses where needed, as part of regional outreach • Increase in bursary and scholarship support • Further investment into re-engineering and automation; • Online student support; • Additional investments for Research Clusters. • Review of REACT facility to enhance ICT delivery to campuses; • Complete new main entrance at Laucala Campus; • Preparations for the 50th Anniversary celebrations.

THE UNIVERSITY OF THE SOUTH PACIFIC | ANNUAL PLAN 2017 Page 57
FUNDING THE PRIORITIES AND ACTIVITIES.077.7 NON-RECURRENT FUNDS
All other funds have been allocated budgets (both income and expenditure) in keeping with their contribution and surplus targets. These operations are expected to run as self-funding or break-even operations. Commercial will contribute 20% to the recurrent fund as overhead charge while self funding programmes like MBA and Pacific TAFE will contribute 25%. In addition to overhead recovery, a further 5% of revenue will be charged as royalty fee to trading and self- funding units except institutes.
The total contribution for 2017 is projected to be $9.66m. Appendices D, E and F show the 2017 budgets for these operations. These are summarised in Table 16 below
Table 16 : Other Funds - Income and Expenditure
Fund
AP 2017 AP 2016
Income Expenditure* Income Expenditure
$ million $ million $ million $ million
Self-Funding 16.20 15.29 16.30 13.40
Commercial 14.65 12.73 16.00 12.70
Institute 2.74 2.85 4.00 3.70
Project ** 16.83 16.83 16.70 16.70
* Expenditure includes contributions to the recurrent fund.** Project incomes are realized when the expenditures related to those project activities are incurred. Unspent project funds are not recorded as surplus but as deferred revenue liability and recorded in the Statement of Financial Position.
7.8 OTHER PROVISIONS: THE FOLLOWING PROVISIONS HAVE BEEN MADE IN AP2017Table 17 : Other provisions
Fund Purpose Amount$ million
BudgetController
Strategic and Initiatives Fund
To fund any activities that meet the Strategic Plan targets
0.50 Vice Chancellor and President
Provision for Energy Savings
To fund initiatives to realise energy savings 0.20 VP RC & P&F
Operating Contingency
For any unforeseen costs that might arise during the year
2.00 Vice Chancellor and President
Provision for Restructure
To fund planned restructuring of Regional Campuses, Security and Human Resource Services
0.08 VP Admin

THE UNIVERSITY OF THE SOUTH PACIFIC | ANNUAL PLAN 2017Page 58
FUNDING THE PRIORITIES AND ACTIVITIES.077.9 OTHER EFFICIENCY AND MONITORING INITIATIVES
• User Pay:With telephones and electricity costs now charged directly to users, the same will be done in 2017 for recruitment costs, depreciation and annual leave provisions.
• Space charge/Depreciation :All self-funding units and commercial operation have been charged market rent or depreciation for occupying the respective buildings of the University.
• Monthly Projections:
The University will prepare a month-by-month forecast of AP2017 based on the 3 year averages and actual spread and expectations of receipts and payments. This distribution will be done in January 2017 and submitted for FIC approval at its February 2017 meeting. Upon FIC approval, the month-by-month Income and Expenditure Budget and Cash Flow Budget will be used for monthly reporting purposes in 2017.
• Incentives Structure:The plan includes $2m as reward funds in 2017 for the faculties. Rewards will be distributed based on the criteria approved by SMT in 2016 for the 2016-2018 triennium.
• Other Initiatives planned:
I. Outsourcing of certain USP services which can be better facilitated by external service providers.
II. Review of Regional Campuses and ITS services to achieve efficiency.
III. Establishment of Trust Funds.
IV. Review of Investments Strategy to maximize return on investments.
V. Develop and implement a new integrated Commercial Plan.
VI. Complete and roll out new finance reporting system and commence new Banner automation and re-engineering projects.
VICE CHANCELLOR’S INTRODUCTION AND OVERVIEW
OPERATING BUDGETS AND FINANCIAL COMMENTARIES08

THE UNIVERSITY OF THE SOUTH PACIFIC | ANNUAL PLAN 2017Page 60

THE UNIVERSITY OF THE SOUTH PACIFIC | ANNUAL PLAN 2017 Page 61
OPERATING BUDGETS AND FINANCIAL COMMENTARIES08The University is budgeting a projected income of $196.1m and expenditure of $190.2m, generating a surplus of $5.9m. Table 18 presents the proposed operating budget for AP2017. Detailed summaries of income and expenditure forecasts are presented in Appendices A to F at the end of this report.
TABLE 18 : INCOME AND EXPENDITURE 2014 - AP2017
Actual 2014
Actual 2015
Forecast AP2016
AP2016 AP2017
F$'000 F$'000 F$'000 F$'000 F$'000
Government Assistance - Grants 33,620 38,426 38,420 38,426 38,420
Tuition Fees 59,860 65,067 67,191 66,605 73,253
Development Assistance- Recurrent 35,271 39,195 34,048 29,240 28,536
Development Assistance-Project 16,064 11,198 18,151 18,151 18,151
Trading Income 18,935 17,753 18,840 18,107 17,206
Consultancy Income 1,662 3,134 2,054 1,993 1,559
Other Income 9,811 7,559 8,947 10,300 13,130
Release of Deferred Revenue 4,834 5,066 5,110 4,894 5,210
Interest Income 760 661 631 800 700
Total Income 180,817 188,059 193,393 188,516 196,165
Staff Costs (82,195) (82,634) (80,835) (85,369) (83,540)
Operating Costs (79,103) (80,145) (87,541) (85,013) (91,707)
Depreciation (11,277) (11,617) (12,197) (11,111) (13,317)
Provision for doubtful debts (1,929) (4,421) (1,960) (1,481) (997)
Write-down in value of inventories - (215) (29) - -
Realised exchange loss/provision (1,150) (485) (350) (500) (500)
Loss on disposal of assets (228) - - - -
Interest expense - (106) (47) (194) (194)
Total expenditure (175,882) (179,623) (182,959) (183,668) (190,255)
Operating Surplus 4,935 8,436 10,434 4,848 5,910

THE UNIVERSITY OF THE SOUTH PACIFIC | ANNUAL PLAN 2017Page 62
OPERATING BUDGETS AND FINANCIAL COMMENTARIES088.1 OPERATING SURPLUS:
The proposed operating surplus of $5.9 m is $1.1m higher than the AP2016 target. The surplus margin is 3% of total income. The University is committed to moving this towards the FIC benchmark of 5% by 2018
Figure 3 shows the operating surplus trend for the University from 2012 to target 2017.
(2,000)
-
2,000
4,000
6,000
8,000
10,000
12,000
2012 2013 2014 2015 2016 Forecast AP2017
Actual
Budget
The surplus is necessary to allow the University to generate net cash from operating activities of $15.5m that will contribute $11m to the capital programme, $1.9m for loan repayments and add $2.6m to the cash reserves balance.
After accounting for uncollected incomes and unpaid bills, the University projects a cash balance of $52.9m at the end of 2017, with $29.4m of unencumbered cash. After adding $5m of available overdraft facility, the available cash at end of 2017 is forecast to be $28.6m which is above the cash reserve benchmark of $26.4m for 2017. This is 2.4 months of operating cash requirements for the year (excluding project expenditures).
8.2 FUNDING ENTITY BUDGETS:
The overall budget is comprised of five funding operations recurrent, departmental, trading, institutes and projects. The first two deal with activities associated with the University’s core activities of teaching and learning. Trading activities are commercial in nature but support the core activities of the University. Institutes are research and community support arms of the University. Project funds are for specific purposes controlled and received in the form of grants and donations, and must be spent within the terms and conditions or wishes of the donors. Appendix A illustrates the overall contribution of these activities for AP2017.
FIGURE 3: OPERATING SUPLUS/DEFICIT FROM 2012 TO 2017

THE UNIVERSITY OF THE SOUTH PACIFIC | ANNUAL PLAN 2017 Page 63
TABLE 19 EFTS 2014 TO AP2017
2014Actual
2015Actual
2016AP
2016Forecast
2017AP
Recurrent Funded (IFM)
100 3,988 4,244 4,397 4,416 4,637
200 3,358 3,574 3,702 3,718 3,904
300 2,373 2,669 2,617 2,628 2,760
Postgraduate (taught) 821 913 905 909 954
Master (Research) 160 254 177 178 187
PhD 73 73 80 80 84
10,773 11,727 11,878 11,929 12,526
Self-funded Courses
Eng. Lang. 15 8 7 7 7
CCE 279 556 307 315 330
Preliminary 1,033 1,035 1,139 1,169 1,226
Foundation 2,170 2,250 2,393 2,455 2,575
PDLP 82 107 90 92 95
MBA 187 150 206 211 221
Sub total 3,766 4,106 4,142 4,249 4,454
TOTAL EFTS 14,539 15,833 16,020 16,180 16,980
8.3 INCOME
The Annual Plan 2017 is projecting an income of $196.1m, an increase of $7.6m compared to the AP2016 figure of $188.5m. The major components of incomes are as follows:
• Government contributions are set at $38.4m for 2017, the same level as in AP2016.The member countries could be asked for additional contributions after the mid-term review in 2017.
• Tuition fees income increases by $6.6m or 10% from AP2016 . Enrolments are projected to increase by 5% in 2017, including international students. A 2% increase in the tuition fee rate is proposed to absorb inflation. The increase is also reflective of an increase in enrolments for the Pacific TAFE for a new hospitality programme to commence in Nadi from 2017. The MBA programme fee is also increased by 10% to reflect the new cost structure of the programme after accounting all direct, indirect and royalty payments.In addition, fees for the newly accredited programmes in FSTE have been proposed to be increased by 5% for maintaining the accredited status of,
• Bachelor of Net-Centric Computing
• Bachelor of Software Engineering
• Bachelor of Engineering – Electrical and Electronic
• Bachelor of Engineering – Mechanical
While the proposed fee increases would make USP programmes more expensive in Fiji compared to the other two universities, it is a correct reflection of the delivery costs for USP as a regional, not as a national institution and the quality of the programmes.
OPERATING BUDGETS AND FINANCIAL COMMENTARIES08
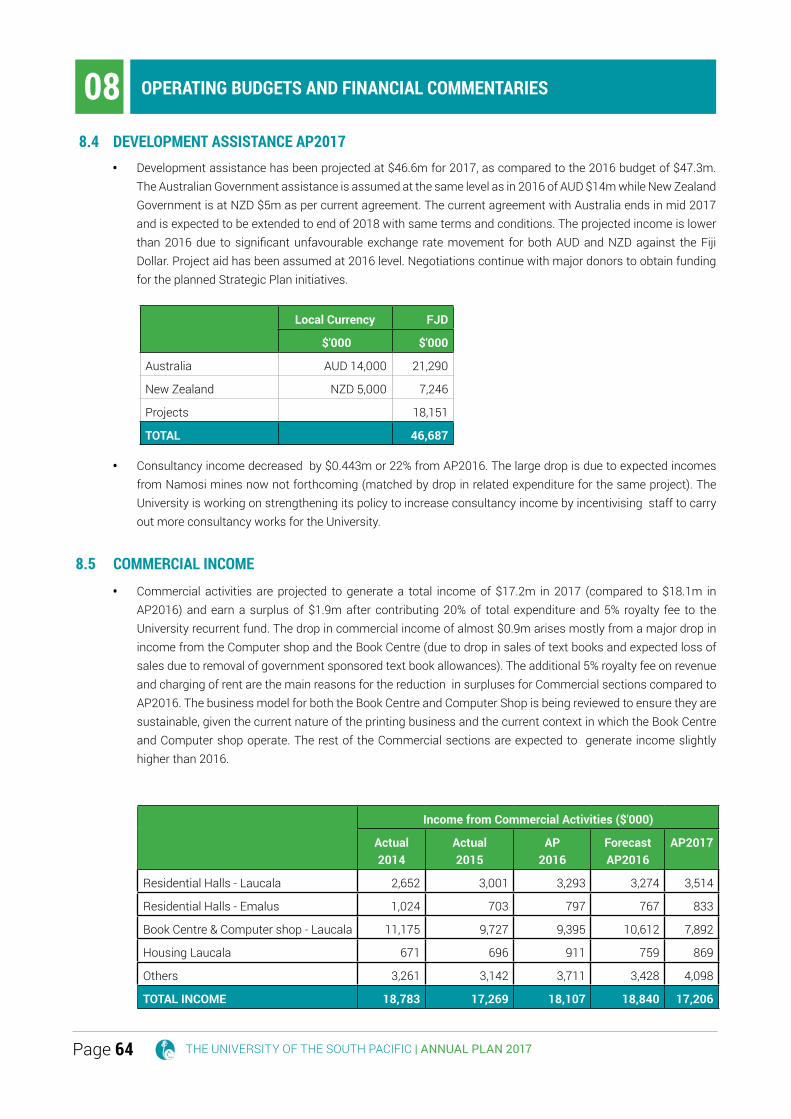
THE UNIVERSITY OF THE SOUTH PACIFIC | ANNUAL PLAN 2017Page 64
• Development assistance has been projected at $46.6m for 2017, as compared to the 2016 budget of $47.3m. The Australian Government assistance is assumed at the same level as in 2016 of AUD $14m while New Zealand Government is at NZD $5m as per current agreement. The current agreement with Australia ends in mid 2017 and is expected to be extended to end of 2018 with same terms and conditions. The projected income is lower than 2016 due to significant unfavourable exchange rate movement for both AUD and NZD against the Fiji Dollar. Project aid has been assumed at 2016 level. Negotiations continue with major donors to obtain funding for the planned Strategic Plan initiatives.
Local Currency FJD
$'000 $'000
Australia AUD 14,000 21,290
New Zealand NZD 5,000 7,246
Projects 18,151
TOTAL 46,687
• Consultancy income decreased by $0.443m or 22% from AP2016. The large drop is due to expected incomes from Namosi mines now not forthcoming (matched by drop in related expenditure for the same project). The University is working on strengthening its policy to increase consultancy income by incentivising staff to carry out more consultancy works for the University.
8.5 COMMERCIAL INCOME • Commercial activities are projected to generate a total income of $17.2m in 2017 (compared to $18.1m in
AP2016) and earn a surplus of $1.9m after contributing 20% of total expenditure and 5% royalty fee to the University recurrent fund. The drop in commercial income of almost $0.9m arises mostly from a major drop in income from the Computer shop and the Book Centre (due to drop in sales of text books and expected loss of sales due to removal of government sponsored text book allowances). The additional 5% royalty fee on revenue and charging of rent are the main reasons for the reduction in surpluses for Commercial sections compared to AP2016. The business model for both the Book Centre and Computer Shop is being reviewed to ensure they are sustainable, given the current nature of the printing business and the current context in which the Book Centre and Computer shop operate. The rest of the Commercial sections are expected to generate income slightly higher than 2016.
OPERATING BUDGETS AND FINANCIAL COMMENTARIES08
Income from Commercial Activities ($'000)
Actual2014
Actual 2015
AP2016
Forecast AP2016
AP2017
Residential Halls - Laucala 2,652 3,001 3,293 3,274 3,514
Residential Halls - Emalus 1,024 703 797 767 833
Book Centre & Computer shop - Laucala 11,175 9,727 9,395 10,612 7,892
Housing Laucala 671 696 911 759 869
Others 3,261 3,142 3,711 3,428 4,098
TOTAL INCOME 18,783 17,269 18,107 18,840 17,206
8.4 DEVELOPMENT ASSISTANCE AP2017

THE UNIVERSITY OF THE SOUTH PACIFIC | ANNUAL PLAN 2017 Page 65
OPERATING BUDGETS AND FINANCIAL COMMENTARIES08 • Other Income has been budgeted at $13.2m for 2017, compared to $10.3m in AP2016. Other income includes
income from a variety of sources, including miscellaneous student fees (such as health service fees, library fines, etc.), administration cost recovery from projects, course material and text book sales, faculty and support units income, ITS domain name registration, laboratory income, publication sales, insurance proceeds, and departmental trading income and space chargers from trading, departments and institutes. The large increase in other income compared to 2016 is due to space charges now fully charged to all non-recurrent sections (matched by rent expenditures).
• Investment income consists of interest received on bank deposits; the projections for 2017 is slightly lower than 2016 as market interest rates have generally remained low-.
FIGURE 4 TOTAL INCOME FOR 2014 TO AP2017
FIGURE 5 INCOME SUMMARY - AP2017
0%10%20%30%40%50%60%70%80%90%
100%
Actual 2014 Actual 2015 Forecast 2016
AP 2016 AP2017
Other Income
Trading Income
Development Assistance- Recrrent
Tuition Fees
Government Assistance - Grants
20%
37%
24%
9% 10%
Member Contribution Student Tuition FeesDevelopment Assistance Trading ActivitiesAll other Income
Income Summary - AP2017
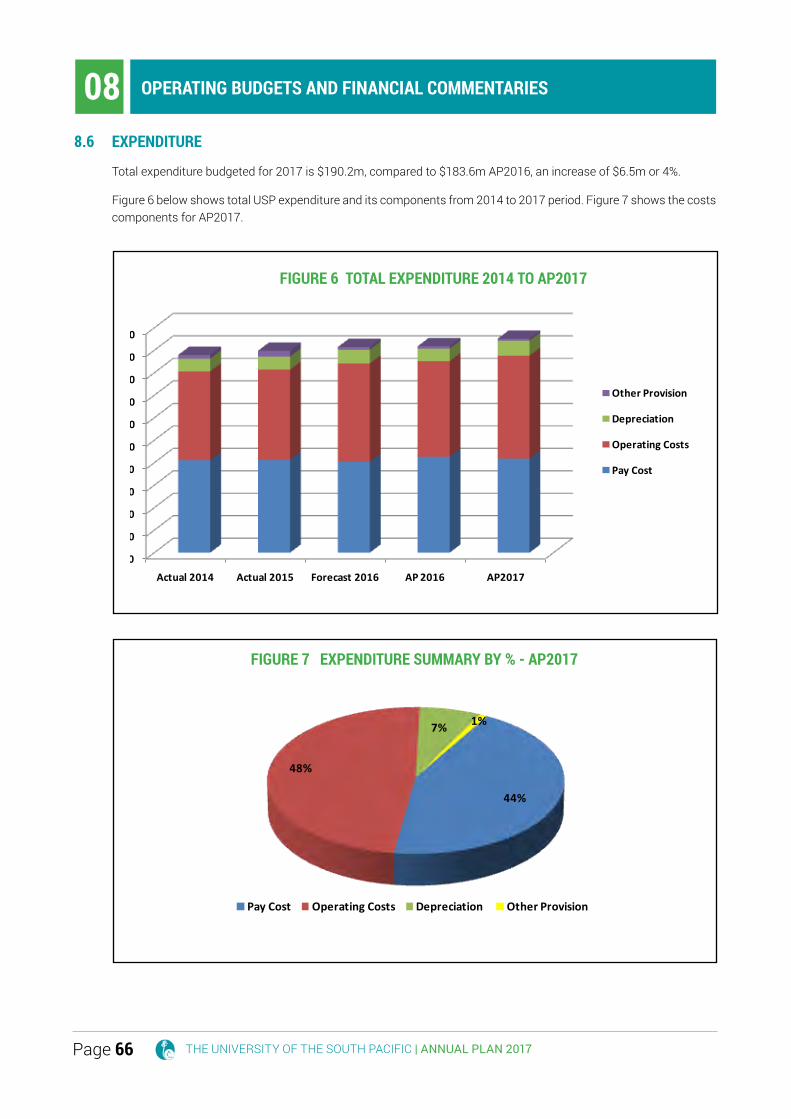
THE UNIVERSITY OF THE SOUTH PACIFIC | ANNUAL PLAN 2017Page 66
8.6 EXPENDITURE
Total expenditure budgeted for 2017 is $190.2m, compared to $183.6m AP2016, an increase of $6.5m or 4%.
Figure 6 below shows total USP expenditure and its components from 2014 to 2017 period. Figure 7 shows the costs components for AP2017.
OPERATING BUDGETS AND FINANCIAL COMMENTARIES08
FIGURE 6 TOTAL EXPENDITURE 2014 TO AP2017
0
20000
40000
60000
80000
100000
120000
140000
160000
180000
200000
Actual 2014 Actual 2015 Forecast 2016 AP 2016 AP2017
Other Provision
Depreciation
Operating Costs
Pay Cost
FIGURE 7 EXPENDITURE SUMMARY BY % - AP2017
44%
48%
7% 1%
Pay Cost Operating Costs Depreciation Other Provision
Expenditure Summary - AP2017
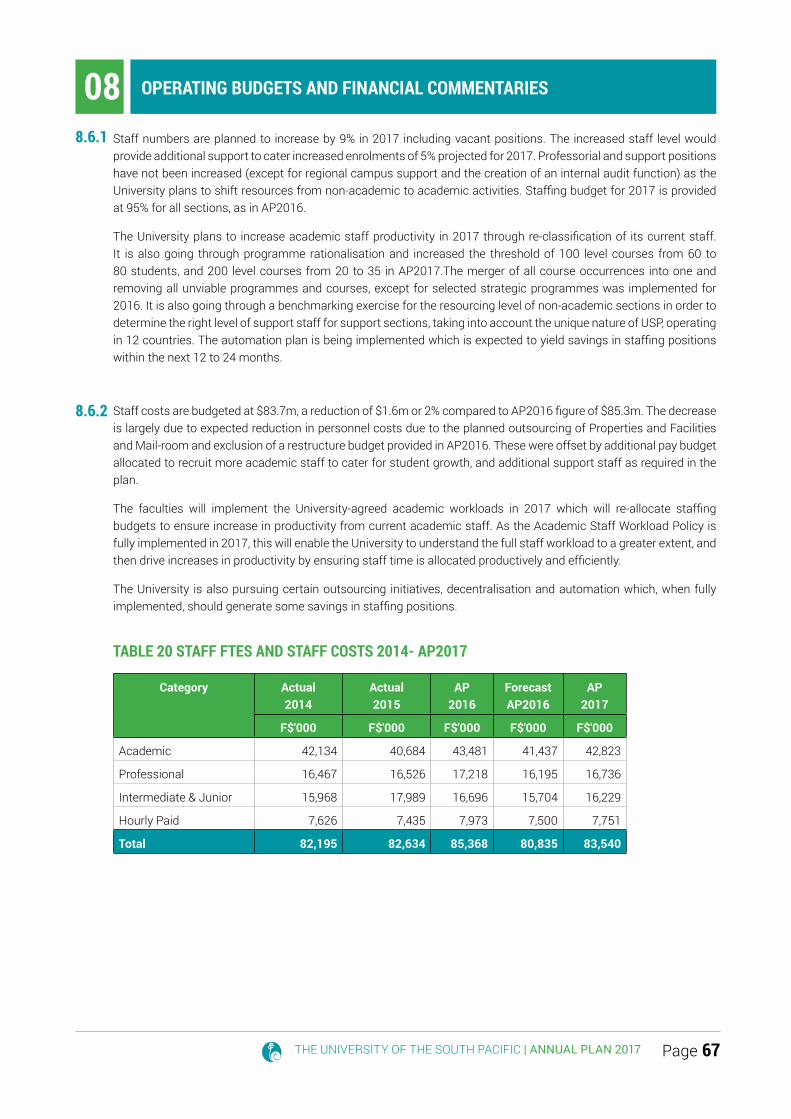
THE UNIVERSITY OF THE SOUTH PACIFIC | ANNUAL PLAN 2017 Page 67
Staff numbers are planned to increase by 9% in 2017 including vacant positions. The increased staff level would provide additional support to cater increased enrolments of 5% projected for 2017. Professorial and support positions have not been increased (except for regional campus support and the creation of an internal audit function) as the University plans to shift resources from non-academic to academic activities. Staffing budget for 2017 is provided at 95% for all sections, as in AP2016.
The University plans to increase academic staff productivity in 2017 through re-classification of its current staff. It is also going through programme rationalisation and increased the threshold of 100 level courses from 60 to 80 students, and 200 level courses from 20 to 35 in AP2017.The merger of all course occurrences into one and removing all unviable programmes and courses, except for selected strategic programmes was implemented for 2016. It is also going through a benchmarking exercise for the resourcing level of non-academic sections in order to determine the right level of support staff for support sections, taking into account the unique nature of USP, operating in 12 countries. The automation plan is being implemented which is expected to yield savings in staffing positions within the next 12 to 24 months.
Staff costs are budgeted at $83.7m, a reduction of $1.6m or 2% compared to AP2016 figure of $85.3m. The decrease is largely due to expected reduction in personnel costs due to the planned outsourcing of Properties and Facilities and Mail-room and exclusion of a restructure budget provided in AP2016. These were offset by additional pay budget allocated to recruit more academic staff to cater for student growth, and additional support staff as required in the plan.
The faculties will implement the University-agreed academic workloads in 2017 which will re-allocate staffing budgets to ensure increase in productivity from current academic staff. As the Academic Staff Workload Policy is fully implemented in 2017, this will enable the University to understand the full staff workload to a greater extent, and then drive increases in productivity by ensuring staff time is allocated productively and efficiently.
The University is also pursuing certain outsourcing initiatives, decentralisation and automation which, when fully implemented, should generate some savings in staffing positions.
TABLE 20 STAFF FTES AND STAFF COSTS 2014- AP2017
Category
Actual 2014
Actual 2015
AP2016
Forecast AP2016
AP2017
F$'000 F$'000 F$'000 F$'000 F$'000
Academic 42,134 40,684 43,481 41,437 42,823
Professional 16,467 16,526 17,218 16,195 16,736
Intermediate & Junior 15,968 17,989 16,696 15,704 16,229
Hourly Paid 7,626 7,435 7,973 7,500 7,751
Total 82,195 82,634 85,368 80,835 83,540
OPERATING BUDGETS AND FINANCIAL COMMENTARIES088.6.1
8.6.2

THE UNIVERSITY OF THE SOUTH PACIFIC | ANNUAL PLAN 2017Page 68
Category Actual 2014
Actual 2015
AP 2016
Forecast AP2016
Draft AP2017
Academic 413 392 430 400 434
Professional 237 279 244 227 246
Intermediate & Junior 630 564 655 609 662
Hourly Paid 318 334 328 305 331
Total 1,598 1,569 1,657 1,541 1,674
Non- pay expenses are projected to be $106.5m, against the AP2016 figure of $98.2m, an increase of $8.3m or 8.6%. The increase is largely to account for inflation and to cater for the increased pass through costs. Further IFM allocation for faculties increased by $ 4.9m mainly due to an additional allocation of funds from Differential Fee
OPERATING BUDGETS AND FINANCIAL COMMENTARIES08
TABLE 21 OPERATING COSTS 2014 -AP2017
Description
Actual 2014
Actual 2015
AP2016
Forecast AP2016
AP2017
F$'000 F$'000 F$'000 F$'000 F$'000
Cost of Sales 10,045 7,937 8,195 8,523 6,702
Travel – University Related 5,807 3,423 4,241 5,157 5,548
Travel – Projects Related 2,540 3,423 4,748 3,288 3,537
Student Expenses 11,271 10,853 11,313 12,265 13,194
Grounds and Maintenance 5,223 4,163 6,113 5,219 5,300
Consultancy 4,663 6,296 5,011 6,042 6,500
Utilities 5,328 5,183 5,126 5,826 6,267
Telecommunications 3,514 5,789 5,577 5,113 5,500
Library Books 2,811 2,842 2,756 3,131 3,369
Staff Recruitment 823 829 884 915 985
Printing and Stationery 2,380 2,697 2,040 2,807 3,020
Workshop Expenses 1,335 1,325 935 1,474 1,586
Others * 23,363 26,893 28,074 27,780 30,200
Total 79,103 81,652 85,013 87,541 91,707
The following major changes explain the movement in AP2017 operating costs compared to AP2016,
8.6.3

THE UNIVERSITY OF THE SOUTH PACIFIC | ANNUAL PLAN 2017 Page 69
OPERATING BUDGETS AND FINANCIAL COMMENTARIES08 • Cost of sales is forecast to decrease in 2017 compared to AP2016 due to an overall decline in the sales for
Bookshop and Computer Shop, given the changing nature of the printing and computing business.
• Travel costs are incurred primarily for project expenses and recurrent. The recurrent travel budgets are forecast at approximately $5.5m for 2017 to account for new academic international recruitments. Further targeted savings have been considered by limiting travel and requiring proper planning of international travels.
• Grounds and maintenance forecast reduced by $0.8m for 2017 as a result of outsourcing the P&F section.
• Consultancies increase due to expected increase in activities of institutes, as well as projected increase in outsourced services for various studies and reports. Previous experiences have shown that certain services are better done by consultants, maintaining both the deadlines as well as the expected quality.
• A major plan for energy saving is being developed in 2016 and 2017 for solar energy in selected campuses. A major project is also being assessed for ADB considerations for Laucala campus.
• Telecommunications will increase to cover additional costs of bandwidth to enhance ICT delivery to Soloman Island campus.
Even though the projected non-pay is at higer level compare to AP2016 various savings targets have been imposed for the operating budget of the recurrent sections in 2017, as per the commitment made to the UGC. The savings targets are also designed to discourage unnecessary spending and encourage proper planning to remain within budget.
The University remains committed to its target of $2.5m as provided in the triennial submission for 2016 to 2018. It will generate these from outsourcing and other efficiency initiatives led by the Budget Efficiency Working Group (BEWG).
8.7 STATEMENT OF FINANCIAL POSITION
This shows the value of the University at any given point in time. Table 22 shows the projected financial position of the University at 31 December 2017.

THE UNIVERSITY OF THE SOUTH PACIFIC | ANNUAL PLAN 2017Page 70
TABLE 22 STATEMENT OF FINANCIAL POSITION
Description Actual 2014
Actual 2015
AP2016
Forecast 2016
AP2017
CURRENT ASSETS
Cash and Cash Equivalents 45,646 48,361 47,633 50,297 52,900
Inventories 4,532 5,186 3,621 4,690 4,302
Accounts Receivable 9,874 9,847 11,737 15,364 16,334
Accounts Receivable - Projects 9,211 9,610 5,739 7,286 8,669
Prepayments 56 68 357 627 716
Total Current Assets 69,319 73,072 69,088 78,264 82,921
NON-CURRENT ASSETS
Property, plant and equipment 208,374 212,514 234,349 220,474 242,716
Intangible Assets 281 1,396 - -
Total Non-Current Assets 208,655 213,910 234,349 220,474 242,716
TOTAL ASSETS 277,974 286,982 303,436 298,738 325,637
CURRENT LIABILITIES
Creditors, Accruals & Provisions 21,090 20,501 22,782 19,981 21,629
Deferred Income 4,834 5,066 4,603 4,649 4,695
Project Funds Unexpended 21,050 23,591 22,524 22,559 23,138
Total Current Liabilities 46,974 49,158 49,909 47,189 49,462
NON-CURRENT LIABILITIES
Creditors and Accruals 878 931 987 974 1,017
Deferred Income 115,418 111,240 104,482 105,125 99,914
Borrowings 4,715 8,791 19,297 9,034 32,918
Total Non-Current Liabilities 121,011 120,962 124,766 115,132 133,849
TOTAL LIABILITIES 167,985 170,120 174,674 162,321 183,311
TOTAL ASSETS LESS LIABILITIES 109,989 116,862 128,762 136,417 142,326
Represented by:
FUNDS AND RESERVES
Statement of Income & Expenditure 95,866 103,039 104,752 113,473 119,382
Endowment Capital 5,949 5,648 5,906 5,778 5,778
Other Contributed Equity 8,174 8,175 18,104 17,166 17,166
Total Funds and Reserves 109,989 116,862 128,762 136,417 142,326
OPERATING BUDGETS AND FINANCIAL COMMENTARIES08

THE UNIVERSITY OF THE SOUTH PACIFIC | ANNUAL PLAN 2017 Page 71
8.7.1 FINANCIAL POSITION COMMENTARIES:
The plan projects the following movements in the financial position of the University
• Current Assets – will increase from $78.2m forecast at the end of 2016 to $82.9m in 2017,as a result of net cash flows added from operations and additional student debtors expected due to increase in student numbers.
• Non-Current Assets – will increase from $220.4m forecast at end of 2016 to $242.7m in 2017, with capital developments in Laucala for a 48 bed student accommodation as well as new Solomon Islands campus, less depreciation.
• Current Liabilities –will increase from $47.1m forecast at end of 2016 to $49.4m in 2017, due to an increase in creditors and project funds unexpended in 2017.
• Non-Current Liabilities – will increase from $115.1m forecast at end of 2016 to $133.8m in 2017 due to additional borrowings expected during the year for the building of a 48 bed student accommodation as well as new Solomon Islands Campus, offset by release of deferred income.
OPERATING BUDGETS AND FINANCIAL COMMENTARIES08

THE UNIVERSITY OF THE SOUTH PACIFIC | ANNUAL PLAN 2017Page 72
8.8 Cash Flow Projections:
Table 23 shows the projected cash-flow position of the University during AP2017, The plan projects a net increase in cash and cash equivalents of $2.6m, taking the projected cash balance to $52.9m at the end of December 2017.
TABLE 23 STATEMENT OF CASH FLOW 2014 - AP2017
Description Actual 2014
Actual 2015
AP 2016
Forecast 2016
AP 2017
Operating Activities
Government Contributions 49,364 34,426 38,426 38,426 38,420
Student Fees 42,601 64,267 64,260 66,153 70,802
Development Assistance 51,371 29,361 47,391 51,327 45,304
Trading Activities 17,387 17,161 18,107 18,681 17,206
Other Receipts 9,979 10,721 12,293 12,682 14,688
Interest Received 863 650 800 825 700
Total cash flow from operating activities 171,565 156,585 181,277 188,095 187,120
Salaries (83,839) (75,763) (82,808) (80,967) (81,033)
Other Expenses (80,453) (68,936) (86,821) (89,722) (90,575)
(164,292) (144,699) (169,628) (170,689) (171,608)
Net Cash flows from/(used in) Operating Activities 7,273 11,886 11,649 17,406 15,512
Investing Activities
Purchase of Fixed Assets (11,606) (15,752) (20,100) (15,713) (35,558)
Receipts from Investing Activities 1,782 (726) - - -
Net Cash flows used in Investing Activities (9,824)
(16,478) (20,100) (15,713) (35,558)
Financing Activities
Loan Proceeds 4,715 4,076 10,100 243 24,558
Loan Repayments - - (240) - (674)
Interest Paid - - (194) - (1,235)
Net Cash flows from/(used in) Financing Activities 4,715 4,076 9,666 243 22,649
Net Increase/(Decrease) in Cash & Cash Equivalents 2,164 (516) 1,215 1,936 2,603
Cash & Cash Equivalents at 1 January (*) 43,482 45,646 46,418 48,360 50,296
Net Increase/(Decrease) in Cash & Cash Equivalents 2,164 (516) 1,215 1,936 2,603
Cash & Cash Equivalents at 31 December 45,646 45,130 47,633 50,296 52,900
OPERATING BUDGETS AND FINANCIAL COMMENTARIES08
(*) Cash balance per 2013 year-end is F$43.5m
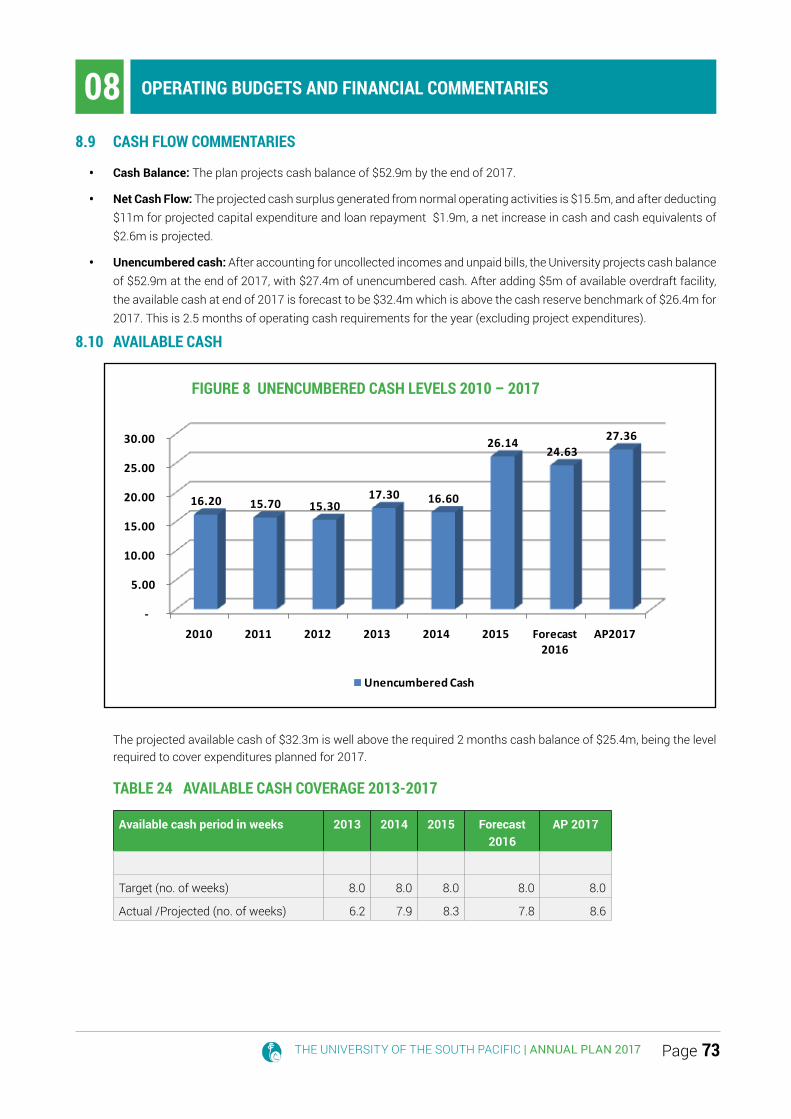
THE UNIVERSITY OF THE SOUTH PACIFIC | ANNUAL PLAN 2017 Page 73
8.9 CASH FLOW COMMENTARIES
• Cash Balance: The plan projects cash balance of $52.9m by the end of 2017.
• Net Cash Flow: The projected cash surplus generated from normal operating activities is $15.5m, and after deducting $11m for projected capital expenditure and loan repayment $1.9m, a net increase in cash and cash equivalents of $2.6m is projected.
• Unencumbered cash: After accounting for uncollected incomes and unpaid bills, the University projects cash balance of $52.9m at the end of 2017, with $27.4m of unencumbered cash. After adding $5m of available overdraft facility, the available cash at end of 2017 is forecast to be $32.4m which is above the cash reserve benchmark of $26.4m for 2017. This is 2.5 months of operating cash requirements for the year (excluding project expenditures).
8.10 AVAILABLE CASH
The projected available cash of $32.3m is well above the required 2 months cash balance of $25.4m, being the level required to cover expenditures planned for 2017.
TABLE 24 AVAILABLE CASH COVERAGE 2013-2017
Available cash period in weeks 2013 2014 2015 Forecast 2016
AP 2017
Target (no. of weeks) 8.0 8.0 8.0 8.0 8.0
Actual /Projected (no. of weeks) 6.2 7.9 8.3 7.8 8.6
OPERATING BUDGETS AND FINANCIAL COMMENTARIES08
FIGURE 8 UNENCUMBERED CASH LEVELS 2010 – 2017
-
5.00
10.00
15.00
20.00
25.00
30.00
2010 2011 2012 2013 2014 2015 Forecast 2016
AP2017
16.20 15.70 15.30 17.30 16.60
26.14 24.63
27.36
Unencumbered Cash
Unencumbered Cash $ Million

THE UNIVERSITY OF THE SOUTH PACIFIC | ANNUAL PLAN 2017Page 74
FIGURE 9 AVAILABLE CASH FOR OPERATIONS AGAINST TARGETS 2013 – 2017 ( IN $ MILLIONS)
OPERATING BUDGETS AND FINANCIAL COMMENTARIES08
-
5.0
10.0
15.0
20.0
25.0
30.0
35.0
2013 2014 2015 Forecast 2016 AP2017
24.0 24.6 25.4 25.4 26.4
16.8
21.6
26.1 24.6
32.4
Target Actual/Forecast
Available cash for operations against Targets 2013 - 2017

FINANCIAL TARGETS AND RATIOS09

THE UNIVERSITY OF THE SOUTH PACIFIC | ANNUAL PLAN 2017Page 76
FINANCIAL TARGETS AND RATIOS099.1 FINANCIAL TARGETS AS PER AP2017
The financial performance of the University is benchmarked against certain ratios set by the Finance and Investments Committee, with the goal of ensuring long term financial sustainability of the University.
Table 25 shows the table of financial ratios from 2015 to AP2017 against the benchmarks.
TABLE 25 FINANCIAL RATIOS 2015 – AP2017
External - Strategic Financial Ratios
Financial Ratio Definition of Ratio Bench mark
2015 AP2016
AP2017
FINANCIAL VIABILITY
Operating Surplus
Operating surplus/total income
5% 4.50% 2.60% 3.00%
Core Earnings EBITDA/Total income 11% 10.70% 8.60% 9.70%
Net Cash from Operations
Cash inflow from operations / cash outflow from operations
115% 108.20% 106.90% 109.00%
Liquidity Ratio Current assets – current liabilities + current deferred income/cash outflow from operations
16% 20% 14% 22%
Quick Ratio Current assets – current liabilities + current deferred income/current liabilities
1.5x 0.6 0.5 0.8
FINANCIAL SUSTAINABILITY
Debt to Equity (Gearing) Ratio
Debt/(debt + deferred income + equity)
20% 3.70% 7.50% 12.00%
Interest Coverage
Income pre interest expense/interest expense
3x 81 26 31
Return on Long Term Assets
EBITDA/LT assets averaged for 3 years
6% 9.70% 7.20% 8.60%
Debt Repayment
Total debt/3 year (averaged) operating surplus
3.0 1.9 4.2 5.5

THE UNIVERSITY OF THE SOUTH PACIFIC | ANNUAL PLAN 2017 Page 77
FINANCIAL TARGETS AND RATIOS09INTERNAL RATIOS
Financial Ratio Definition of Ratio Benchmark 2015 AP2016 AP2017
Cash Margin Net non-project cash flows/USP funded capital additions
110% 102% 116% 141%
Cash Availability Total cash/bank – endowment funds – all creditors + all debtors/non-project cash outflow + USP funded capital cash outflow
16% 29% 20% 26%
Recurrent Fund Surplus Recurrent Surplus/Recurrent Income 3% -1% 1% 3%
Non-Recurrent Fund Surplus
Non-Recurrent Surplus/Non-recurrent Income
5% 17% 18% 4%
9.2 OPERATING SURPLUSThis ratio indicates the level of retained earnings the University can generate to meet its investment needs. The current benchmark is 5% and the University plans to move towards achieving this benchmark by 2018. This Plan projects a surplus of 3% in 2017.
Almost all universities in the world are facing funding challenges in the midst of the global financial situation, the changing demand of students and the competitive higher education environment. The University is limited in its ability to grow its income substantially, and so needs to adjust its cost structure to respond to change more quickly. While the current surplus margin is below the prudent benchmark, it is worth noting that it is performing comparably better than some other universities.
Figure 10 below shows its surplus margins against the University of West Indies (UWI) and Canberra University (CU).
*2014 & 2015 Financial Statements for UWI are not yet available
FIGURE 10 USP FINANCIAL PERFORMANCE RATIOS VS COMPARABLE UNIVERSITIES.
-15%
-10%
-5%
0%
5%
10%
15%
2007 2008 2009 2010 2011 2012 2013 2014 2015
USP UWI CU

THE UNIVERSITY OF THE SOUTH PACIFIC | ANNUAL PLAN 2017Page 78
9.3 LIQUIDITY RATIO This ratio reflects the ability of the University to pay its short term liabilities using liquid assets easily convertible to cash. The benchmark is 16% while this Plan is projecting it to be 22%.
Figure 11 shows that the liquidity position (cash and available borrowings over operating cash outflow) has generally improved over the years, and is also slightly above average when compared with other universities. Except for 2010, USP’s liquidity ratio has never fallen below benchmark since 2007.
*2014 & 2015 Financial Statements for UWI are not yet available
9.4 FINANCIAL SUSTAINABILITYThis measures the ability of USP to sustain continuing robust and viable financial performance in the long term. Two important ratios are:
• Debt to Equity (Gearing) ratio – measures the proportion of total debt over total equity. The plan for end of 2017 is 12% which is bellow the benchmark of 20%.
• Interest coverage ratio – measures ability of the University to generate enough net revenues to meet the interest payments. The plan for end of 2017 is 31 and is above the benchmark requirement of 3.
FINANCIAL TARGETS AND RATIOS09
FIGURE 11 FINANCIAL LIQUIDITY AGAINST OTHER UNIVERSITIES.
-40%
-20%
0%
20%
40%
60%
80%
100%
2007 2008 2009 2010 2011 2012 2013 2014 2015
USP UWI CU
CAPITAL PLAN AND INFRASTRUCTURE DEVELOPMENTS10

THE UNIVERSITY OF THE SOUTH PACIFIC | ANNUAL PLAN 2017Page 80
CAPITAL PLAN AND INFRASTRUCTURE DEVELOPMENTS1010.1 CAPITAL PROGRAMME
The Strategic Plan put in place a capital development programme for all its campuses envisaged to assist the process of moving the University to excellence. With the Strategic Plan decision not to ask member countries to contribute more for capital developments, the University has built a stronger financial position to be able to borrow to enable some of these major priority developments to take place. The University will generate free cash from its operations during the year to contribute $11m to the capital programme. An additional $24.5m is planned to be utilised during the year from borrowings approved for the new Solomon Islands Campus and a 400 bed student accommodation at Laucala Campus. Table 26 below shows the capital expenditure plan for approved projects and projected expenditure by year.
TABLE 26 CAPITAL EXPENDITURE PLAN 2017 – 2019
Capital Projects University Funded AP
2017
Projected Expenditures $ millions
AP 2017
Forecast 2018
Forecast 2019
1.) Known Building Projects:
Solomon Islands Campus * 15.7 14.5 5.8
Students Hostels** 8.8 8.5 2.7
Teaching/Learning Spaces/Campus Upgrades
1.0 1.0 2.7 2.0
2.) ICT Infrastructure and Developments
Computers 1.8 1.8 1.2 1.5
ICT Development 3.5 3.5 3.6 2.5
3.) Vehicles and Tractor
4.) Furniture, Equipment and Renovations 4.7 4.7 3.5 5.0
Totals 11.0 35.5 34.0 19.5
*Due to the change in location and project scope for the Solomon Islands Campus, the revised estimate now stands at $36m,of which $33m will be funded through ADB loan and remaining $3m will be sourced through ADB grant.
**48 bed hostel for $2.4m and $6.4m expected to be utilised in 2017 for the 440 bed hostel (both in Laucala)
Note: All individual projects above $250k will require a full business case and the approval of the Finance and Investments Committee.
10.2 BUILDING PROJECTS IN 2017 The major capital projects for 2017 are Solomon Islands Campus and the Student Accommodation at Laucala Campus. The first phase of the student hostel project will be completed in time for first semester 2017 for 48 beds for premium accommodation suitable for international students. The second phase, which includes twin bed accommodations and married quarters, is expected to commence in 2017 and be completed in time for the 2019 academic year. The Solomon Islands project is mostly funded through the remaining tranche of the already approved ADB loan, while the student hostel project will be funded through FNPF loan. Major projects will also be pursued from 2017 for new staff residences and commercial properties and are expected to be sourced from either PPP or borrowings.

THE UNIVERSITY OF THE SOUTH PACIFIC | ANNUAL PLAN 2017 Page 81
CAPITAL PLAN AND INFRASTRUCTURE DEVELOPMENTS1010.3 INFORMATION TECHNOLOGY
The Strategic Plan has placed emphasis on leveraging ICT to deliver outcomes that enhance student experience and teaching and research outcomes, and support achievement of the strategic objectives of the University.
The University has planned $1.8m to commence implementation of the new computer strategy, with the mix of provision of tablets for first year students, establishing the right number and mix of student lab requirements, putting in more wireless provisions to facilitate use of more lap tops for students, and moving all staff to lap tops to support a more open office concept. A further $3.5m is provided under the recurrent fund for ICT developments, automation and re-engineering. It is expected these investments will shift the University’s e-platform and shift to a more digital environment.
The University is also allocating $0.6m to implement a fully integrated library management system to put all campuses into one data base.
10.4 VEHICLES, FURNITURE AND EQUIPMENTThe University has set aside $600k to replace science lab equipment and $100k for agriculture lab equipment, $1m to continue with regional campus development plans and $250k for a new generator for ICT building.
10.5 INFRASTRUCTURE PLANThe University will assess space requirements during the year and develop a capital and funding programme to respond to its current and future growth in line with the campus master plan.
The University has approved its new Asset Management Framework to govern the utilisation of facilities and spaces. The University is also implementing a Space Management Policy with an accompanying Facilities Management Manual to set standards and benchmarks for space allocation, space use, and design and layout. This Plan has allocated an additional $1.25m in 2017 to address high priority deferred maintenance.
The University has also provided $2.4m from 2016 savings for construction of its new main entrance from the Pony Club in 2017, with a view to freeing up more space for commercial ventures near the current main entrance. A further allocation of $0.7m is being set aside to re-configure the ground floor of the Library Building and convert it into a Learning Centre for students.
10.6 OTHER BUILDING AND FUNDING PLANS A plan will also be drawn up and funding sourced in 2017 for development of the remaining blocks of student hostels required to achieve the target of an additional 2,000 beds by the end of 2018. There was also a commitment to commence building of the Tonga campus on its new land. Funding to progress this will need to be sourced in 2017-2018.

THE UNIVERSITY OF THE SOUTH PACIFIC | ANNUAL PLAN 2017Page 82
CAPITAL PLAN AND INFRASTRUCTURE DEVELOPMENTS1010.7 FUNDING THE CAPITAL PROGRAMME
The table below shows the funding sources of the known capital programme for the year, with forecasts to 2018.
TABLE 27 CAPITAL EXPENDITURE FUNDING SUMMARY 2017 - 2019
Project AP 2017 $ m
Forecast 2018 $ m
Forecast 2019 $ m
University Surplus 11.0 11.0 11.0
ADB Loan 15.7 14.5 5.8
FNPF Loan * 8.8 8.5 2.7
Totals 35.5 34.0 19.5
*Business case for FNPF loan proposal for the 400 bed hostel yet to be finalised.
10.8 CAPITAL EXPENDITURE BORROWINGIn 2013, the University signed a loan agreement with the ADB to build the $5.6m Kiribati Campus, which has been completed in 2015. The loan is for 32 years, with interest payments of only 1% for the first eight years, and interest rate of 1.5% and principal repayments for the remaining 24 years.
In August 2013, additional borrowing was secured from the Fiji National Provident Fund (FNPF) of $10.3m to build a student accommodation block in Laucala Campus of $3.6m and a new Lautoka Campus for $6.7m. The Student Accommodation (11th Hall) has been built, and interest and principal repayments started. The Lautoka Project has been deferred and this loan component has been approved by the Executive Committee to be vired to build the first 48 beds for international accommodation. Further loans will be taken to provide more student accommodation at Laucala. The loan is over 15 years, with the interest rate fixed at 3.5% over the first five years, and the rate to be set for every five year period based on 0.5% below the FDL rate applicable at the beginning of the new five year period.
The University will continue to pursue the Public and Private Partnership (PPP) option to build student hostels, staff accommodation and commercial buildings. A call for expressions of interest was made in 2016 and is currently being assessed. It is aware of the implications of this option and all these projects will go through the normal due diligence and approval processes of the University through to completion and approval of business cases.
The projected debt at end of 2017 is $32.9m, and will be secured by government guarantees (for the ADB loan), while the FNPF loan is secured through mortgage over the Statham and Lower Campuses.
The cost of borrowing is expected to be less than 0.05% over the course of 2017 and majority of interest expense for the period would be capitalised.
10.9

VICE CHANCELLOR’S INTRODUCTION AND OVERVIEW
RISKS AND MITIGATION STRATEGIES11

THE UNIVERSITY OF THE SOUTH PACIFIC | ANNUAL PLAN 2017Page 84
RISKS AND MITIGATION STRATEGIES11USP recognizes the importance of risk management and has an enterprise wide appropriate risk culture that ensures financial risks will be managed with strong governance principles, practices, and systems. The effective management of risk requires both top-down oversight and bottom-up involvement and understanding to develop a strong risk culture.
In the current environment there are key risks that can impact on the University in achieving our financial targets. These can impact on our financial sustainability and involve both short term operational risks and risks to our longer term Strategic Plan objectives.
The University considers the management of the following risks will be key in achieving the 2017 financial plan and USP short and long term financial sustainability.
TABLE 28: RISK TO FINANCIAL TARGETS
THE RISK RISK IMPACT RISK MITIGATION
Member country contributions.
• Changes proposed to Fiji FHEC funding and effect it will create for other members.
• Ability to honour commitments and timely payments from Member countries.
• Reduction in per capita student funding.
• Reduction in income and liquidity.
• VC engagement with Fiji Govt over funding model.
• VC engagement with member countries. Frequent monitoring of payments and timeliness.
Development assistance.
Political changes and variations to funding levels committed or in future.
Reduction in income and liquidity. Delay and/or ceasing of some strategic initiatives.
Continued engagement with Development assistance partners Monitoring any political and fiscal changes.
Tuition Fees.
• Student volumes not achieved.
• Loss of students to competing Pacific HE institutions.
Reduction in income and impact on liquidity.
• Regular monitoring to manage enrolment levels.
• Maintain quality competitiveness of course offerings.
Under-performance from Commercial, Institutes and Centres.
Reduced income and increased risk if deficits in these areas.
Comprehensive and frequent monitoring of these areas to mitigate impacts early. Close non-performing activities.
Staff Costs affordability to USP and Budget areas.
Increased expenditure and potential loss of staff.
Ability to attract excellent staff to support Strategic Plan.
• Implement iPerform system and reward outstanding performers.
• Frequent Monitoring for all Budget areas.
11.1
11.2
11.3

THE UNIVERSITY OF THE SOUTH PACIFIC | ANNUAL PLAN 2017 Page 85
RISKS AND MITIGATION STRATEGIES11THE RISK RISK IMPACT RISK MITIGATION
Operating costs.
• Inflation increases above that budgeted.
• Budget areas do not absorb inflation as planned.
• Fraud and litigation cases, and their impact on the reputation of the University.
• Increased operating costs.
• Budget areas incur deficit positions.
• Increase costs and creates reputational risks.
• Monitor on frequent basis and manage expenditure.
• Comprehensive reporting and monitoring for all Budget areas.
• Ongoing monitoring of risk exposure areas, strengthen internal audit and ensure insurance protection in place.
Liquidity.
• Income cash receipting below planned levels.
• Expenditure incurred earlier than planned.
• Liquidity benchmarks not achieved.
• Delay in payments to creditors.
• Solvency risk for USP.
• All income streams frequently monitored for collection and risk. Debt collection across students’ fees and commercial /Institute income be enforced consistently and frequently.
• Procurement processes monitored for compliance and meeting agreed terms.
Capital Programme.
• Financial Performance below planned level
• Ineffective management of major projects.
• Delays in project schedule.
• Delay in and/or potential decrease in level of capital projects.
• Results in major cost overruns.
• Strategic Plan targets not achieved.
• Comprehensive monitoring and management of financial performance.
• Proper Service Level Agreements with contractors and regular reviews performed during project period.
Other Risks
• Exposure to currency fluctuations for member contributions, student fees, development assistance and expenditures with operations across 12 member countries
• Natural disasters could cause infrastructure damage or failure
• Foreign exchange gains/losses impacting on financial performance.
• and liquidity.
• Implications on business continuity and financial costs of re-establishment.
• Currency maintained in local country for expenditure incurred in same currency.
• Forex management tools used as appropriate.
• Proper disaster awareness and preparedness. Appropriate levels of insurance to be in place.

THE UNIVERSITY OF THE SOUTH PACIFIC | ANNUAL PLAN 2017Page 86
MONITORING AND EVALUATION MECHANISMS12
The Senior Management Team (SMT) shall be responsible for the full implementation, monitoring and evaluation of AP2017. The following reporting and monitoring structure will be in place;
The Finance Section will prepare and distribute Monthly Management Accounts to the SMT, Heads of Schools and other Heads of Departments.
• The Finance Section will prepare and submit Financial Reports to FIC at each of its meetings.
• The Finance Section, through the FIC, will prepare and submit externally audited 6-monthly financial report to the Council.
• The Finance and Planning and Quality Office will work in coordination to put together progress reports and present to SMT on a monthly basis.
• Achievement of Strategic Plan KPIs will be monitored through the Planning Office’s online system (SPOMS 2).
• The CAPEX Progress Review Group will monitor quarterly progress of spend against capital budgets.
• The progress will be reported to the FIC and Council continuously throughout 2017.
• There will be regular meeting of the Budget Efficiency Working Group to evaluate budget availability and identify savings and efficiency mechanisms. The Committee will monitor budget variances and propose options to ensure sections stay and manage within allocated budget.
• Enforcement of the Budget Policy & Procedures is essential.
In addition, there will be greater focus on analysis of financial information, particularly variances. The full development of dashboard reports from the new Cognos reporting software and the full staffing of the Financial Planning Unit in 2017 will enable this.
MONITORING AND EVALUATION MECHANISMS12.1
12.2

THE UNIVERSITY OF THE SOUTH PACIFIC | ANNUAL PLAN 2017 Page 87
APPENDICES13
Appendix A - Statement of Comprehensive Income (by Fund) - AP2017
Appendix B - Recurrent Budgets AP2017
Appendix C – Recurrent Fund Summary by Section – AP2017
Appendix D - Departmental Budget AP2017
Appendix E - Commercial Budget AP2017
Appendix F - Institute Budgets AP2017
APPENDICES

THE UNIVERSITY OF THE SOUTH PACIFIC | ANNUAL PLAN 2017Page 88
APPE
NDIX
A –
STA
TEM
ENT
OF IN
COM
E &
EXPE
NDIT
URE
(BY
FUND
) - A
P201
7
DESC
RIPT
ION
Recu
rren
t Fu
ndDe
part
men
t Fu
nds
Com
mer
cial
Fu
ndIn
stitu
te
Fund
sPr
ojec
t Fu
nds
AP 201
7AP 20
16Fo
reca
st
2016
Actu
al 2
015
Gov
ernm
ent A
ssis
tanc
e –
Gra
nts
38,4
20
-
-
-
-
38,4
20
38,
426
38,4
20
49,
516
Tuiti
on F
ees
57,
391
15,
862
-
-
-
7
3,25
3 6
6,60
5 6
7,19
1 5
3,97
7
Deve
lopm
ent A
ssis
tanc
e 2
8,53
6
-
-
-
1
8,15
1 4
6,68
7 4
7,39
1 52
,199
50
,393
Trad
ing
Activ
ities
-
-
1
7,20
6
-
-
1
7,20
6 1
8,10
7
18,8
40
17
,753
Cons
ulta
ncy
Inco
me
-
9
9
-
1,3
50
110
1
,559
1,
993
2,05
4 3,
134
Oth
er In
com
e6,
047
5,11
9
1,9
62
13
,128
1
0,30
0 8
,947
7
,547
Cont
ribut
ion
to R
ecur
rent
Fun
d- R
ecov
ery
of o
verh
ead
7,74
8 (3
,824
)(1
,694
)(5
70)
(1,6
60)
-
-
-
-
Cont
ribut
ion
to R
ecur
rent
Fun
d- R
oyal
ty
Fee
1,91
4 (1
,054
)(8
60)
-
-
-
-
-
-
Rele
ase
of D
efer
red
Reve
nue
5,1
10
-
-
-
100
5,21
0 4,
894
5,1
10
5,06
6
Inte
rest
Inco
me
571
-
-
1
30
700
800
631
67
3
Tota
l – In
com
e14
5,73
7
1
6,20
2
14,
652
2,74
2 16
,831
19
6,16
5 18
8,51
6 19
3,39
3 18
8,05
9
Pay
(64,
778)
(8,5
92)
(3,0
02)
(1,4
13)
(4,1
63)
(81,
947)
(81,
876)
(79,
039)
(80,
304)
Prov
isio
n fo
r Sal
ary
Adju
stm
ents
-
-
-
-
-
-
-
Pay
- Str
ateg
ic P
lan
(1,2
70)
-
-
-
-
(1,
270)
(1,1
20)
(1,0
69)
(1,3
75)
Prov
isio
n fo
r Lea
ve(2
43)
-
-
-
- (2
43)
(300
) 7
73
(955
)
Redu
ndan
cy P
rovi
sion
-
-
-
-
-
-
(500
)
-
-
Prov
isio
n fo
r Res
truc
ture
(80)
-
-
-
-
(80)
(650
)
-
-
Cont
inge
ncy
-
-
-
-
-
-
(9
22)
(1,5
00)
-
Tota
l Pay
(6
6,37
1)(8
,592
)(3
,002
)(1
,413
)(4
,163
) (8
3,54
0) (8
5,36
9) (8
0,83
5) (8
2,63
4)
APPENDICES13

THE UNIVERSITY OF THE SOUTH PACIFIC | ANNUAL PLAN 2017 Page 89
DESC
RIPT
ION
Recu
rren
t Fu
ndDe
part
men
t Fu
nds
Com
mer
cial
Fu
ndIn
stitu
te
Fund
sPr
ojec
t Fu
nds
AP 2
017
AP20
16Fo
reca
st
2016
Actu
al 2
015
Gen
eral
Exp
ense
s(5
2,45
7)(6
,703
)(8
,148
)(1
,440
)(1
2,66
8)(8
1,41
5)(7
3,02
0)(8
2,45
3)(7
6,84
4)
Gen
eral
Exp
ense
s - S
trat
egic
Pla
n(4
,983
)
-
-
-
-
(4
,983
)(4
,380
)(3
,721
)(3
,666
)
Depr
ecia
tion
(12,
733)
- (5
84)
-
-
(13,
317)
(11,
111)
(12,
197)
(11,
617)
Defe
rred
Mai
nten
ance
(1,2
50)
- (8
75)
-
-
(2,1
25)
(2,8
70)
-
-
Prov
isio
ns &
Acc
rual
s (1
,481
)
-
-
-
-
(1
,481
) (1
,481
)(1
,960
)(4
,165
)
Prov
isio
ns fo
r Exc
hang
e G
ain
/(Lo
ss)
(500
)
-
-
-
-
(5
00)
(500
)(3
50)
485
Stra
tegi
c &
Initi
ativ
es F
und
(50
0)
-
-
-
-
(5
00)
(500
)
-
-
Rew
ards
& In
cent
ives
Fun
d
-
-
-
-
-
-
(2
,000
)(1
,367
)(1
,035
)
Ener
gy S
avin
gs In
itiat
ives
(200
)
-
-
-
-
(200
)(2
00)
-
-
Inte
rest
Exp
ense
(68)
- (1
26)
-
-
(194
)(1
94)
(47)
(105
)
Cont
inge
ncy
(2,0
00)
-
-
-
-
(2,0
00)
(1,5
58)
-
-
VAT
Cont
inge
ncy
-
-
-
-
-
-
(1
,196
)
-
-
Savi
ngs
-
-
-
-
-
-
7
11
-
-
Writ
e of
f
-
-
-
-
-
-
-
(29)
(42)
Tota
l - N
on-P
ay(7
6,17
2)(6
,703
) (9
,733
)(1
,440
)(1
2,66
8)(1
06,7
15)
(98,
299)
(102
,124
) (9
6,98
9)
Tota
l – E
xpen
ditu
re(1
42,5
43)
(15,
295)
(12,
735)
(2,8
52)
(16,
831)
(190
,255
)(1
83,6
67)
(182
,959
)(1
79,6
23)
Ope
ratin
g Su
rplu
s / (
Defic
it)3,
194
907
1,
917
(110
)
-
5,
910
4,84
9 10
,434
8,
436
Ope
ratin
g M
argi
n2%
6%13
%-4
%0%
3%3%
5%4%
APPENDICES13

THE UNIVERSITY OF THE SOUTH PACIFIC | ANNUAL PLAN 2017Page 90
APPENDIX B - RECURRENT BUDGET - AP2017 (F$’000)
Actuals 2015 AP2016 AP 2017
F$'000 F$'000 F$'000
INCOME
Government Grants 49,516 38,426 38,420
Tuition Fees 36,907 53,183 57,391
Development Assistance 29,361 29,240 28,536
Consultancy Income 78
Other Income 3,950 2,000 6,047
Contribution to Recurrent Fund- Overhed recovery 5,412 7,044 7,748
Contribution to Recurrent Fund- Royalty fee 1,914
Release of Deferred Revenue 5,066 4,794 5,110
Interest Income 568 800 571
TOTAL INCOME 130,858 135,488 145,737
Faculties
Arts, Law & Education 11,907 10,854 12,234
Business & Economics 12,025 12,930 14,549
Science, Technology & Environment 16,028 15,321 16,499
PACE SD 739 1,178 1,082
Non-IFM allocations 294
Rewards and Incentives - Unallocated 340
Sub-Total: Faculties 40,699 40,283 44,999
Strategic Supports 1,046 1,498 1,744
Vice-Chancellor & President 4,386 4,623 5,065
DVC (LTSS) 7,482 7,744 8,813
VP Regional Campuses, P&F 20,782 22,996 23,835
VP Administration 18,406 19,527 19,511
DVC (Research & International) 1,862 3,667 3,460
EDF 2,238 2,362 2,348
EDF - University Costs 3,513 3,349 3,349
DHR 4,019 5,492 5,361
Sub-Total: Administration 62,687 69,760 73,485
Other Budgets & Provisions 27,892 26,312 24,058
Sub-Total: Other Budgets 27,892 26,312 24,058
TOTAL EXPENDITURE 132,324 137,854 142,543
Saving target (711)
TOTAL EXPENDITURE 132,324 137,143 142,543
OPERATING I&E SURPLUS/(DEFICIT) (1,466) (1,655) 3,194
APPENDICES13

THE UNIVERSITY OF THE SOUTH PACIFIC | ANNUAL PLAN 2017 Page 91
Desc
riptio
n F
ALE
FST
E F
BE
PAC
E S
trat
egic
su
ppor
t V
C V
P RC
&
P/F
VP
Adm
in
DVC
LT
SS
DVC
R
& I
EDF
Pr
ovis
ions
S
P TO
TAL
PAY
Acad
emic
&
Prof
essi
onal
8,
426
11,4
248,
693
763
1,61
01,
818
3,67
75,
814
2,51
966
51,
271
189
866
47,7
36
I & J
939
1,35
41,
334
133
5292
33,
735
3,31
91,
988
299
872
134
262
15,3
44
Hou
rly P
aid
356
154
125
68
- 68
2,01
023
488
31
-
-
142
3,27
6
TOTA
L PA
Y9,
722
12,9
3210
,152
964
1,66
22,
809
9,42
29,
367
4,59
599
52,
143
323
1,27
066
,356
NO
N P
AY
Cost
of S
ales
Trav
el51
01,
093
2,07
741
-
654
1,80
31,
532
939
217
4224
31,
047
10,1
97
Stud
ent e
xpen
ses
649
869
1,05
812
-
-
2,60
8
-
2,52
41,
843
-
311
2,90
112
,776
Gro
unds
and
m
aint
enan
ce12
089
99
-
- 75
2,67
1
-
-
- 3
388
-
3,44
4
Cons
ulta
ncy
554
512
455
20
- 47
370
290
840
820
041
340
422
5,03
5
Util
ities
122
191
215
12
- 73
2,20
764
721
710
517
243
-
4,04
9
Tele
com
mun
icat
ion
8060
109
7
- 23
1,09
63,
705
506
6
-
-
5,14
1
Libr
ary
book
s
-
-
-
-
-
-
752
1,70
4
-
-
-
97
- 2,
554
Staf
f rec
ruitm
ent
-
-
-
-
-
- 7
793
-
-
-
-
-
801
Prin
ting
and
stat
ione
ry27
924
436
721
-
175
319
285
5051
76
-
571,
923
Oth
ers
199
510
186
8278
32,
247
5,93
131
433,
367
16,4
9555
630
,268
TOTA
L N
ON
PAY
2,51
33,
568
4,39
711
882
2,25
614
,414
15,5
054,
217
2,46
53,
554
17,4
824,
983
76,1
87
TOTA
L RE
CURR
ENT
12,2
3416
,499
14,5
491,
082
1,74
45,
065
23,8
3524
,872
8,81
33,
460
5,69
717
,805
6,25
314
2,54
3
APPENDICES13AP
PEND
IX C
– R
ECUR
RENT
FUN
D SU
MM
ARY
BY S
ECTI
ON –
AP2
017
(F$’
000)

THE UNIVERSITY OF THE SOUTH PACIFIC | ANNUAL PLAN 2017Page 92
APPE
NDIX
D –
DEP
ARTM
ENT
FUND
S BU
DGET
- AP
2017
(F$’
000)
Desc
riptio
nFA
LEFS
TEFB
EPA
CERE
GIO
NAL
PACI
FIC
TAFE
DMCA
Cam
pus
life
Tota
l 2
017
Reve
nue
2,0
20
6
18
2,6
79
6
60
3,4
44
11,
373
100
1
87
21
,081
Less
: Ro
yalty
Cha
rge
(1
01)
(3
1)
(134
)
(3
3)
(172
)
(569
)
(5)
(9
)
(1,0
54)
Net
Rev
enue
1,9
19
5
87
2,5
45
6
27
3,2
72
10,
804
95
1
78
20
,027
PAY
-
Acad
emic
& P
rofe
ssio
nal
6
66
1
29
1,0
17
1
78
1
97
4,
052
-
8
6
6,3
25
I & J
23
31
91
49
4
19
932
-
2
1
1,5
66
Hou
rly P
aid
21
12
34
-
1
37
487
-
7
6
99
Tota
l Pay
7
10
1
72
1,1
42
2
27
7
54
5,
472
1
14
8
,591
NO
N-P
AY
Cost
of S
ales
-
1
34
6
78
-
-
1,
971
-
3
0
2,8
13
Trav
el
7
3
37
4
0
1
6
427
17
9
-
9
782
Stud
ent e
xpen
ses
57
30
1
14
31
2
31
182
-
7
6
52
Gro
unds
and
mai
nten
ance
63
30
25
-
3
09
185
-
7
6
19
Cons
ulta
ncy
1
31
23
49
1
10
96
101
-
7
5
18
Util
ities
27
20
73
32
1
21
165
-
5
4
43
Tele
com
mun
icat
ion
19
1
30
5
35
94
2
185
Libr
ary
book
s
1
9
-
1
6
-
-
-
-
3
6
Staf
f rec
ruitm
ent
2
-
4
1
-
-
-
7
Prin
ting
and
stat
ione
ry
6
1
29
2
8
8
9
6
16
2
5
5
3
94
Oth
ers
73
30
28
20
30
40
35
255
Tota
l non
pay
exp
endi
ture
5
23
3
34
1,0
84
2
24
1,3
46
3,
080
42
70
6
,704
Cont
ribut
ion
to o
verh
eads
3
08
1
27
5
57
1
13
5
25
2,
138
10
46
3
,824
Tota
l Exp
endi
ture
1,5
42
6
33
2,7
84
5
63
2,6
25
10,
690
52
2
30
19
,119
Surp
lus/
(defi
cit)
3
77
(4
6)
(
239)
64
6
47
1
14
43
(5
2)
9
08
APPENDICES13

THE UNIVERSITY OF THE SOUTH PACIFIC | ANNUAL PLAN 2017 Page 93
APPE
NDIX
E –
COM
MER
CIAL
BUD
GET
– AP
2017
($’0
00)
Desc
riptio
nBo
ok C
entr
eCo
mpu
ter
Shop
Resi
dent
ial
Rent
alH
ousi
ngLo
dges
Dire
ctor
Com
mer
cial
Gym
Oth
erTo
tal
2017
Lauc
ala
Emal
usAl
afua
Lauc
ala
Emal
usAl
afua
Lauc
ala
Lauc
ala
Lauc
ala
Reve
nue
5,6
19
396
100
2
,273
3,
514
833
2
08
1
,229
869
719
592
8
54
17,2
06
Less
:Roy
alty
cha
rge
(281
) (2
0) (
5)
(114
)(1
76)
(42
) (1
0)
(6
1)
(43
)
(36)
(30)
(43
) (8
61)
Net
Rev
enue
5,3
38
37
6
95
2,1
59
3
,338
7
91
198
1,16
8
826
683
-
5
62
811
1
6,34
5
PAY
Seni
or S
taff
Sala
ry25
2
-
-
116
99
28
20
-
7
2
36
1
2 2
00
836
I & J
363
36
24
1
51
24
4
-
-
35
62
3
7
5
8 2
50
1,2
60
Hou
rly P
aid
77
14
-
-
32
5 13
7
35
38
54
1
31
210
905
Tota
l Pay
692
5
0 2
4
267
6
70
4
1 2
7
70
1
72
1
28
-
202
6
61
3,00
2
NO
N P
AY
Cost
of S
ales
3,19
9 1
10
33
1
,741
-
-
-
-
-
-
(8
1)
1
39
(1
25)
5,0
15
Trav
el 7
-
-
1
0
37
-
-
5
5
-
14
1
3
91
Gro
unds
and
m
aint
enan
ce
5
-
-
1
1,
103
186
5
2
4
72
6
48
1
92
43
2,
701
Util
ities
26
10
1
1
3
0
429
260
21
73
4
6
7
0
1
2
-
987
Tele
com
mun
icat
ion
5
-
-
13
3
7
20
-
-
5
3
3
86
Prin
ting
and
stat
ione
ry
5
9
3
20
8
0 1
4 -
-
51
2
9
1
93
Oth
ers
55
7
3
84
17
5 1
6 27
73
1
18
47
39
4
13
660
Tota
l non
-pay
ex
pend
iture
3,3
02
135
5
0
1
,899
1,
860
496
10
0
6
23
8
72
3
14
(16)
209
(1
12)
9,7
32
Cont
ribut
ion
to
over
head
s24
6
37
15
108
510
111
2
6
1
39
2
09
88
12
8
2 1
10
1
,693
Tota
l exp
endi
ture
4,2
40
222
88
2,2
74
3,03
9 64
8 1
53
832
1
,253
530
(4)
494
6
59
14,
427
Surp
lus/
(defi
cit)
1,0
98
154
7
(1
15)
29
9 1
43
4
5
33
6
(4
27)
1
53
4
68
152
1
,918
APPENDICES13

THE UNIVERSITY OF THE SOUTH PACIFIC | ANNUAL PLAN 2017Page 94
APPENDIX F – INSTITUTES BUDGET – AP2017 (F$’000)
IAS IOE IRETA Total AP 2017
REVENUE 1,917 745 650 3,312
PAY
Academic & Professional 427 286 141 855
I & J 176 68 136 380
Hourly Paid 134 - 44 178
Total Pay 736 355 321 1,413
NON-PAY
Cost of Sales 380 - 234 614
Travel 135 16 10 162
Grounds and maintenance 48 5 29 83
Consultancy 236 26 - 262
Utilities 96 4 9 110
Telecommunication 24 4 3 32
Printing and stationery 66 8 3 76
Others 83 5 12 100
Total non-pay expenditure 1,068 70 302 1,440
Contribution to overheads 361 85 125 570
Total expenditure 2,166 510 747 3,423
Surplus/(deficit) (249) 235 (97) (110)
APPENDICES13

THE UNIVERSITY OF THE SOUTH PACIFIC | ANNUAL PLAN 2017 Page 95
Table 1 Financial Performances 2014 - 2017Table 2 Financial Principles for 2017Table 3 Targets for AP2017Table 4 2017 KPIs and Targets for Priority Area 1Table 5 2017 KPIs and Targets for Priority Area 2Table 6 2017 KPIs and Targets for Priority Area 3Table 7 2017 KPIs and Targets for Priority Area 5Table 8 2017 KPIs and Targets for Priority Area 6Table 9 2017 KPIs and Targets for Priority Area 7Table 10 Funding Sources of SP Initiatives for 2017Table 11 Faculties Recurrent Funding PlanTable 12 Total Faculty Funding 2017Table 13 Recurrent Funding Plan for Institutes and CentresTable 14 Recurrent Funding Plan for Regional CampusesTable 15 Recurrent Funding Plan for Support SectionsTable 16 Other Funds – Income and ExpenditureTable 17 Other ProvisionsTable 18 Operating Budgets 2014-2017 Table 19 EFTS 2014 - 2017Table 20 Staff FTE’s and Staff Costs 2014 - 2017Table 21 Operating Costs 2014 – 2017Table 22 Statements of Financial Positions 2014 - 2017Table 23 Statement of Cash Flows 2014 - 2017Table 24 Available Cash CoverageTable 25 Financial Ratios 2015 - 2017Table 26 Capital Programme 2017- 2019Table 27 Capital Programme Funding 2016 - 2018Table 28 Risks to Financial Targets
Figure 1 Funding Sources 2017 Figure 2 Spending Plan 2017Figure 3 Operating Surpluses (Deficits) 2012 – AP2017Figure 4 Total Income 2014 – AP2017Figure 5 Income Summary AP2017Figure 6 Total Expenditures 2014– AP2017Figure 7 Expenditure Summary AP2017Figure 8 Unencumbered Cash 2009 – AP2017Figure 9 Available cash for Operation Against targets 2013 – 2017Figure 10 USP Financial Performance Ratios Vs Comparable UniversitiesFigure 11 Financial Liquidity vs Comparable Universities
LIST OF TABLES AND FIGURES14
LIST OF TABLES AND FIGURES
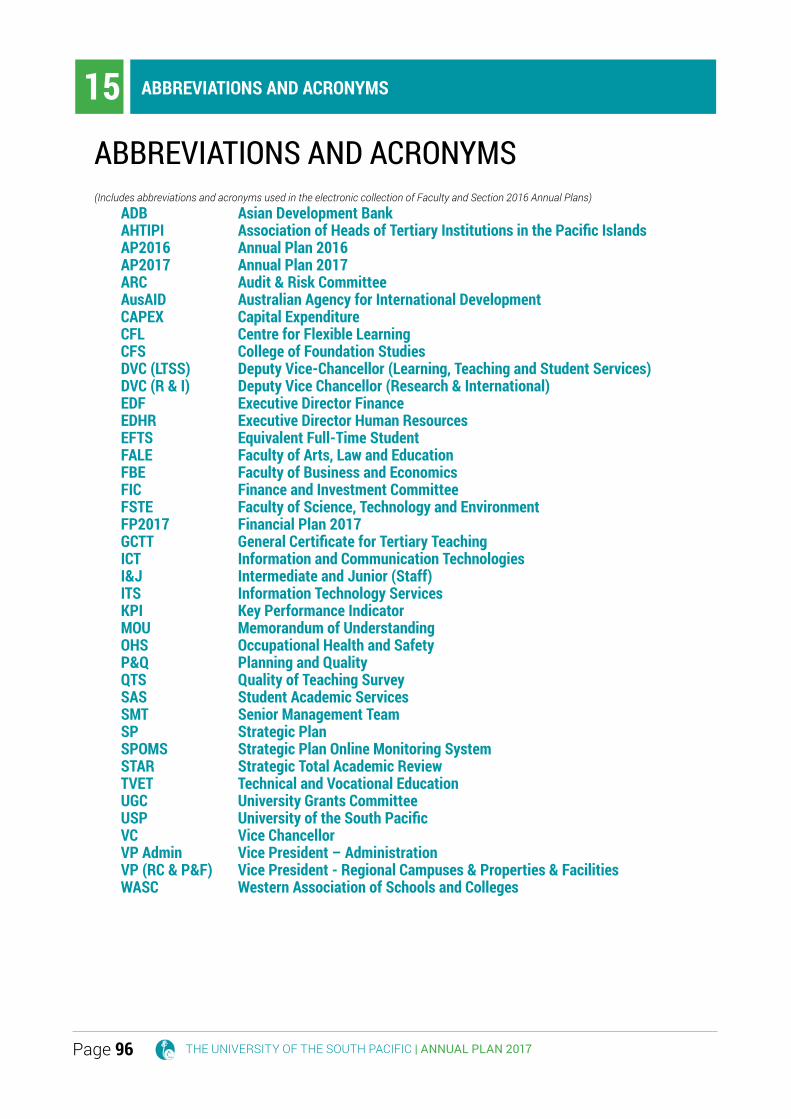
THE UNIVERSITY OF THE SOUTH PACIFIC | ANNUAL PLAN 2017Page 96
(Includes abbreviations and acronyms used in the electronic collection of Faculty and Section 2016 Annual Plans)ADB Asian Development BankAHTIPI Association of Heads of Tertiary Institutions in the Pacific IslandsAP2016 Annual Plan 2016AP2017 Annual Plan 2017ARC Audit & Risk Committee AusAID Australian Agency for International DevelopmentCAPEX Capital ExpenditureCFL Centre for Flexible LearningCFS College of Foundation StudiesDVC (LTSS) Deputy Vice-Chancellor (Learning, Teaching and Student Services)DVC (R & I) Deputy Vice Chancellor (Research & International)EDF Executive Director FinanceEDHR Executive Director Human ResourcesEFTS Equivalent Full-Time StudentFALE Faculty of Arts, Law and EducationFBE Faculty of Business and EconomicsFIC Finance and Investment CommitteeFSTE Faculty of Science, Technology and EnvironmentFP2017 Financial Plan 2017GCTT General Certificate for Tertiary TeachingICT Information and Communication TechnologiesI&J Intermediate and Junior (Staff)ITS Information Technology ServicesKPI Key Performance IndicatorMOU Memorandum of UnderstandingOHS Occupational Health and SafetyP&Q Planning and QualityQTS Quality of Teaching SurveySAS Student Academic ServicesSMT Senior Management TeamSP Strategic PlanSPOMS Strategic Plan Online Monitoring SystemSTAR Strategic Total Academic ReviewTVET Technical and Vocational EducationUGC University Grants CommitteeUSP University of the South PacificVC Vice ChancellorVP Admin Vice President – AdministrationVP (RC & P&F) Vice President - Regional Campuses & Properties & Facilities WASC Western Association of Schools and Colleges
ABBREVIATIONS AND ACRONYMS15
ABBREVIATIONS AND ACRONYMS