Embed Size (px)
Citation preview

Premium Value Defined Growth Independent
Annual Performance Presentation
In Situ Oil Sands Schemes9673 / 10147 / 10423 / 10787 / 9404
March 2019

CNQSlide 2
AgendaAgenda
• Current Approvals
• Geological Overview
• Drilling, Completions, and Artificial Lift
• Field Performance and Surveillance
• Cap Rock Integrity & Monitoring
• Future Development Plans
• Facilities
• Measuring & Reporting
• Water Use, Conservation & Disposal
• AER Compliance
• Conclusions

CNQSlide 3
Brintnell LocationBrintnell Location
R23 R22 R21 R20 R19 R18W4
82
81
80
79
Twp.
83

CNQSlide 4
Oil Sands Royalties (OSRs 101/006/061)Oil Sands Royalties (OSRs 101/006/061)

CNQSlide 5
Primary and Enhanced Approval RegionsPrimary and Enhanced Approval Regions
Primary Recovery Schemes
6619 (Central Brintnell)
9466 (Brintnell)
9884 (West and North Brintnell)
Enhanced Recovery Schemes
9673 (North Brintnell)
10787 (Central Brintnell)
10423 (South and West Brintnell)
10147 (Central Brintnell)
9404 (Pelican Lake)

CNQSlide 6
CNRL Brint 6-14-81-21 W4M Type LogCNRL Brint 6-14-81-21 W4M Type Log

CNQSlide 7
Wabiskaw ‘A’ Net Pay MapWabiskaw ‘A’ Net Pay Map

CNQSlide 8
Wabiskaw Structure MapWabiskaw Structure Map

CNQSlide 9
Produced Oil Viscosity MapProduced Oil Viscosity Map

CNQSlide 10
Type Log Clearwater Isopach/Tight StreaksType Log Clearwater Isopach/Tight Streaks
Tight Streaks
Thickness ~70-90m
The cap rock comprises the Clearwater Shales, Wabiskaw Marker and the Wabiskaw zone (which ranges in thickness from 80 to 95 meters) and over lies the Wabiskaw A Sand.Contained within this isopach are numerous tight streaks ranging from 1.5 - 4 meters in thickness throughout this interval; they are found in both the Clearwater shale interval the Wabiskaw marker interval, as illustrated in the accompanying log.

CNQSlide 11
Brintnell Regional Reservoir PropertiesBrintnell Regional Reservoir Properties
• Upper Wabiskaw Sand
� Depth of 300-425m TVD
� Net Pay Range 1 – 9m
� Porosity 28 – 32%
� Permeability 300 – 3000md
� Temperature 13-17 deg. C
� Water Saturation 30 – 40%
� Oil Viscosity (dead oil) 800 – 80,000cp @ 15 deg. C
� Initial Reservoir Pressure 1900 – 2600kpa
CNQSlide 12
Drilling, Completions, and Artificial LiftDrilling, Completions, and Artificial Lift

CNQSlide 13
Typical Drilling ConfigurationTypical Drilling Configuration
Lined Horizontal SectionIntermediate Casing Points
2 Wells to the North
2 Wells to the South
Pipeline
Build Section
• CNRL lands the intermediate casing within the Wabiskaw formation.
CNQSlide 14
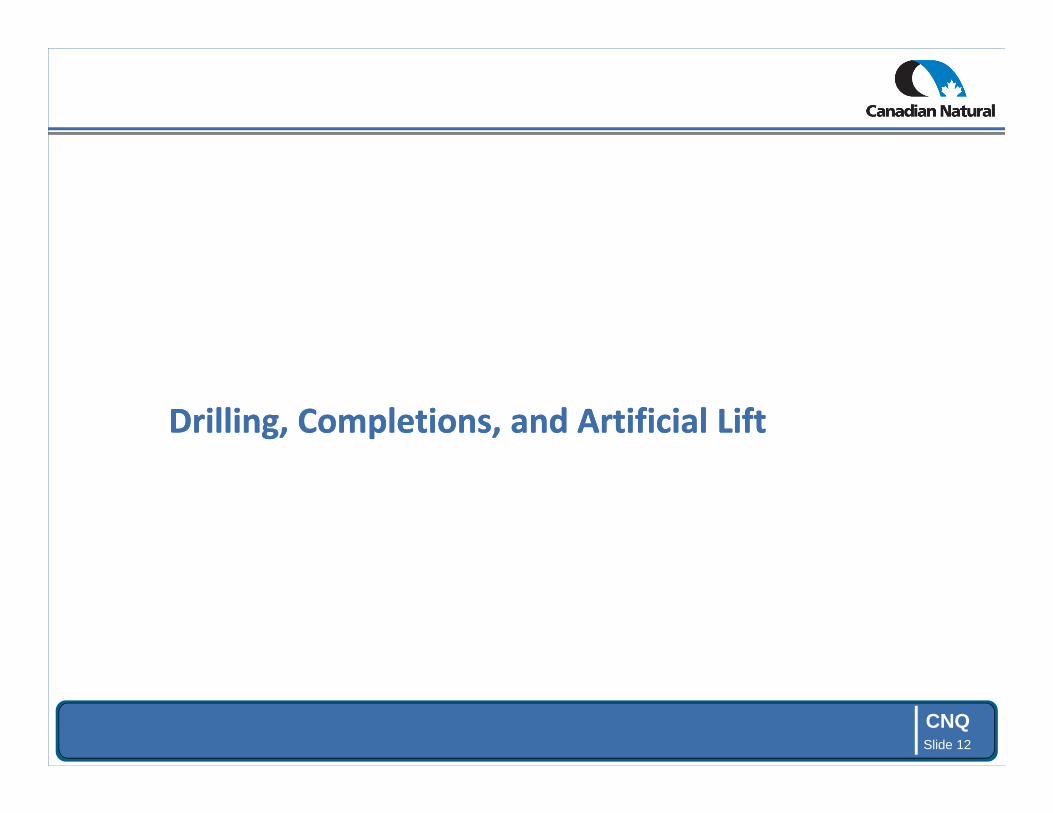
Typical Well ConfigurationsTypical Well Configurations
• Producer
• Intermediate Casing landed in Wabiskaw sand (producers and injectors).
• Injector

CNQSlide 15
EOR History and Current ApprovalsEOR History and Current Approvals

CNQSlide 16
Polymerflood DevelopmentPolymerflood Development
Polymer PilotsPolymerflood Start Dates

CNQSlide 17
Legacy Field Overview Legacy Field Overview
Approximately 63% of the legacy approved EOR scheme areas are currently developed and under flood as of the end of 2018
Cum. oil: 45,103 E3m3

CNQSlide 18
Polymerflood after WaterfloodPolymerflood after Waterflood
• With the inclusion of Approval 9404 area, the polymer after waterflood area is
significantly larger but still concentrated in the Northern half of the field,
generally corresponding to lower in-situ oil viscosity.

CNQSlide 19
Polymerflood after WaterfloodPolymerflood after Waterflood

CNQSlide 20
WaterfloodWaterflood
• Current waterflood patterns are all contained in Approval 9404 area. The
majority of these patterns have been under waterflood since the mid-2000s,
conversion to polymerflood is under evaluation.

CNQSlide 21
WaterfloodWaterflood

CNQSlide 22
Field Performance and SurveillanceField Performance and Surveillance

CNQSlide 23
Approval 10147Approval 10147
Approval 10147Approval 10147

CNQSlide 24
Approval 10147 Production UpdateApproval 10147 Production Update
Cum oil: 2,746 E3m3 Cum water: 2,504 E3m3 Cum injection: 6,051 E3m3
Started Polymer Injection

CNQSlide 25
Approval 10147 DiscussionApproval 10147 Discussion
• Contains the most mature polymer flood patterns including the original
CNRL pilot area which began flooding in 2005.
• First Polymer Response in April 2006 from the HTL6 Pilot area.
• Peak production occurred from mid 2007 to early 2010 at 650 m3/d oil.
• Injection returned to normal in 2014-2015 following a significant
reduction in 2013 for offset drilling.
• Increased water cut was observed in 2017 and 2018 due to the maturity
of the flood.
• Water cut averaged roughly 74% during 2018.
• Oil viscosity ranges from 1,300 cp to 2,800 cP.

CNQSlide 26
Approval 10423Approval 10423
Approval 10423Approval 10423

CNQSlide 27
Approval 10423 Production UpdateApproval 10423 Production Update
Cum oil: 21,769 E3m3 Cum water: 24,070 E3m3 Cum injection: 48,320 E3m3
Started Polymer Injection

CNQSlide 28
Approval 10423 DiscussionApproval 10423 Discussion
• Polymerflood started in 2006 covering roughly 5% of the approval area split
between 3 small groups. The flood was expanded every year up to 2010. In
2012, small area from PRSA 9884 was added to the approval.
• Currently 73% of the approval area is under flood.
• Small portion of approval area under waterflood starting in 2003. This area was
converted to polymer in 2008 and 2010.
• First polymer response in July 2007 but due to the size and staged flood
expansion, did not see a ramp up in oil volumes until early 2009.
• Portions of the approval area are affected by higher in-situ water saturation
and/or oil viscosity. Response in these regions has been more delayed and
erratic when compared to other portions of the pool.
• Oil viscosity ranges from 1,100 cp to 50,000 cp.
• 14 producers in WB 14 converted to injection in 2014. 6 producers in WB32 area
converted to injection in 2015.
• Average WCT in 2018 approximately 67%. 10 re-drills in late 2016 & 2017 and 10
re-drills in 2018.

CNQSlide 29
Approval 10787Approval 10787
Approval 10787Approval 10787

CNQSlide 30
Approval 10787 Production UpdateApproval 10787 Production Update
Cum oil: 10,497 E3m3 Cum water: 7,495 E3m3 Cum injection: 18,250 E3m3
Started Polymer Injection
CNQSlide 31
Approval 10787 DiscussionApproval 10787 Discussion
• Polymer flood started in Dec 2007 covering roughly 4% of the approval
area split into 2 small groups. There were no expansions until 2010, since
then there has been an expansion completed in every year including
2013. Currently 45% of the approval area is under flood.
• First polymer response in Nov 2008 but due to the size and staged flood
expansion, did not see a ramp up in oil volumes until mid 2012.
• Oil production increased in the late part of 2013 and early 2014, mostly
due to new well activations.
• Polymer injection was commenced in the Peerless and Sandy Lake
portions of the area in 2013, with the majority of wells exhibiting some
form of polymer flood response.
• Infill drills in 2018 maintained oil, tempered WCT increase (average 67%).
• Oil viscosity ranges from 1,100 cp to 14,400 cp.

CNQSlide 32
Approval 10787 – 04/01-24-079-22W4 Monitoring Approval 10787 – 04/01-24-079-22W4 Monitoring
• In May 2012, the 03/16-36-079-22W4 well intersected the 00/01-24-079-22W4
wellbore while drilling
• Numerous attempts were made to repair the 00/01-24 well but ultimately the
wellbore could not be returned to service. A non-routine abandonment was
conducted on 00/01-24 in March 2013. The 04/01-24-079-22W4 observation
well was drilled in September 2013 to monitor the polymer flood near the
00/01-24 offset following consultations with the AER (Approval 10787K).
• 04/01-24-079-22W4 Monitoring Program:
– Produced water has been monitored continuously since Q4 2013. Through 2016, the
well has not produced enough water to obtain a representative water analysis.
– The bottomhole reservoir pressure was measure quarterly in 2013/2014 and yearly
from 2015-2018.
– The pressure was measured in October 2018 to be 449 kPa; this is comparable to
measurements taken in previous years and in line with expectations for the
Wabiskaw reservoir under primary depletion.
– CNRL will continue to monitor the produced watercut and take yearly pressure
measurements on this well.

CNQSlide 33
Approval 9673Approval 9673
Approval 9673Approval 9673
CNQSlide 34
Approval 9673 Production UpdateApproval 9673 Production Update
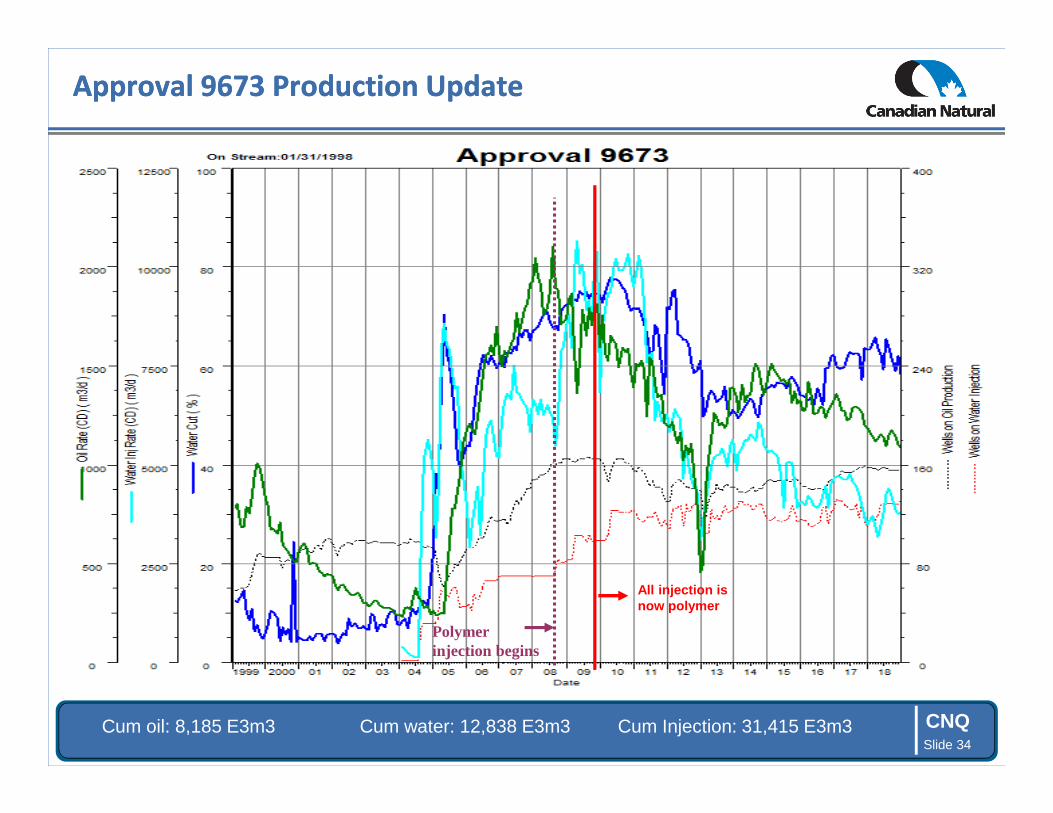
Cum oil: 8,185 E3m3 Cum water: 12,838 E3m3 Cum Injection: 31,415 E3m3
All injection is now polymer
Polymer injection begins

CNQSlide 35
Approval 9673 DiscussionApproval 9673 Discussion
• Originally approved for waterflood in 2004; waterflood was expanded in
2005/2006 to cover roughly 40% of the current approval area.
• Waterflood peak production occurred from late 2007 to early 2009 at
1850 m3/d oil.
• Polymerflood began in Sept 2008 covering 6% of approval area. Existing
waterflood patterns remained unchanged at this time.
• In 2009 all waterflood areas were converted to polymer and a small
expansion area from primary was added; additional small expansions
from primary were conducted in each year from 2010 to 2012. Currently
70% of the approval area is under flood.

CNQSlide 36
Approval 9673 DiscussionApproval 9673 Discussion
• The conversion from water to polymer has had a dramatic effect on the
conformance of the flood. Within two years of conversion for most
areas, watercuts declined.
• In 2018 watercut averaged about 62%, steady with 2017, following an
increase due to the reactivation of high WCT wells.
• Oil viscosity ranges from 600 cp to 13,000 cp.

CNQSlide 37
Approval 9673 Discussion: Polymer after WaterfloodExampleApproval 9673 Discussion: Polymer after WaterfloodExample
Results from polymer flood after waterfloodareas vary by pattern but do show substantial polymer flood response on both oil and WCUT.
Starting at the end of 2016, WCTs have been rising, showing sensitivity of area.
Decreasing WCT
Water Injection

CNQSlide 38
Approval 9404Approval 9404
Approval 9404Approval 9404

CNQSlide 39
Approval 9404 Production UpdateApproval 9404 Production Update
Cum oil: 25,208 E3m3 Cum water: 61,480 E3m3 Cum injection: 115,776 E3m3
Started Water Injection
Started Polymer Injection
Started Downspace Initiative
Significant Conversion back to Water Injection
Approval 9404
CNRL Acquisition: Polymer Injection Resumed

CNQSlide 40
Approval 9404 Production UpdateApproval 9404 Production Update
Significant Conversion back to Water Injection
CNRL Acquisition: Polymer Injection Resumed
Approval 9404
CNQSlide 41
Approval 9404 DiscussionApproval 9404 Discussion
• Waterflood initiated on SE09 in Nov 2000. Waterflood expansion began in
2002 in the SW region and spread throughout the field covering over 65%
of the approval area. Majority of waterflood expansion occurred from
2002-2007.
• Oil response to waterflood was substantial, nearly doubling primary
production rates, but water breakthrough progressed rapidly with
watercuts as high as 90% within the first two years.
• To help address breakthrough, the first polymer conversion was initiated
on SW08 in Dec 2003. Polymer expansion progressed steadily until 2014
covering over 45% of the approval area.
• The majority of injectors were converted from water to polymer, but a
small percentage were completed directly to polymer from primary.

CNQSlide 42
Approval 9404 Discussion Approval 9404 Discussion
• Downspacing initiative was undertaken from 2011-2014. This increased the
injector count by 50% and resulted in higher reservoir throughput.
• Through 2015 and 2016 injection rates were reduced significantly and
about 75% of the polymerflood was converted back to water.
• CNRL acquired the approval area in September 2017 and has worked to
resume polymer injection, by year end 2017 approximately 33% of the
shut-in polymerflood area was reactivated.
• As of the end of 2018, 98% of previously polymer flooded area has been
returned to polymer injection.
• Focus has been on re-establishing consistent polymerflood patterns.
CNQSlide 43
Estimated Ultimate Recovery Factors (EURF) for Flooded AreasEstimated Ultimate Recovery Factors (EURF) for Flooded Areas
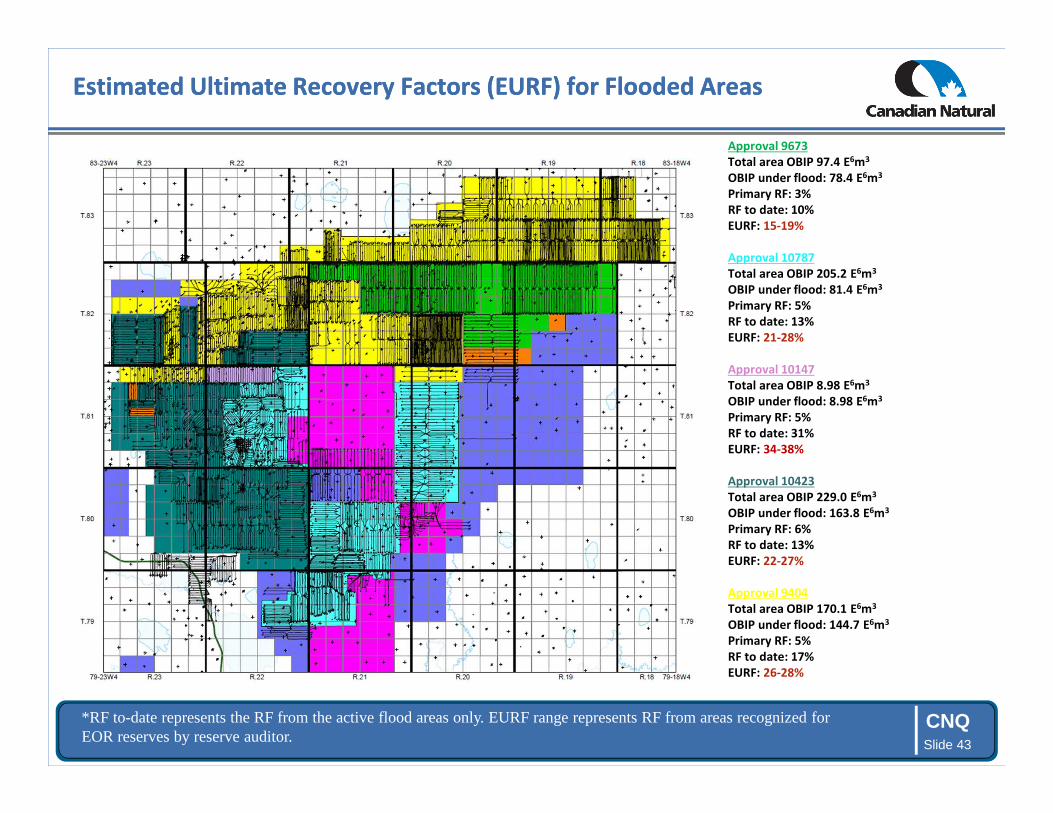
Approval 9673
Total area OBIP 97.4 E6m3
OBIP under flood: 78.4 E6m3
Primary RF: 3%
RF to date: 10%
EURF: 15-19%
Approval 10787
Total area OBIP 205.2 E6m3
OBIP under flood: 81.4 E6m3
Primary RF: 5%
RF to date: 13%
EURF: 21-28%
Approval 10147
Total area OBIP 8.98 E6m3
OBIP under flood: 8.98 E6m3
Primary RF: 5%
RF to date: 31%
EURF: 34-38%
Approval 10423
Total area OBIP 229.0 E6m3
OBIP under flood: 163.8 E6m3
Primary RF: 6%
RF to date: 13%
EURF: 22-27%
Approval 9404
Total area OBIP 170.1 E6m3
OBIP under flood: 144.7 E6m3
Primary RF: 5%
RF to date: 17%
EURF: 26-28%
*RF to-date represents the RF from the active flood areas only. EURF range represents RF from areas recognized for EOR reserves by reserve auditor.

CNQSlide 44
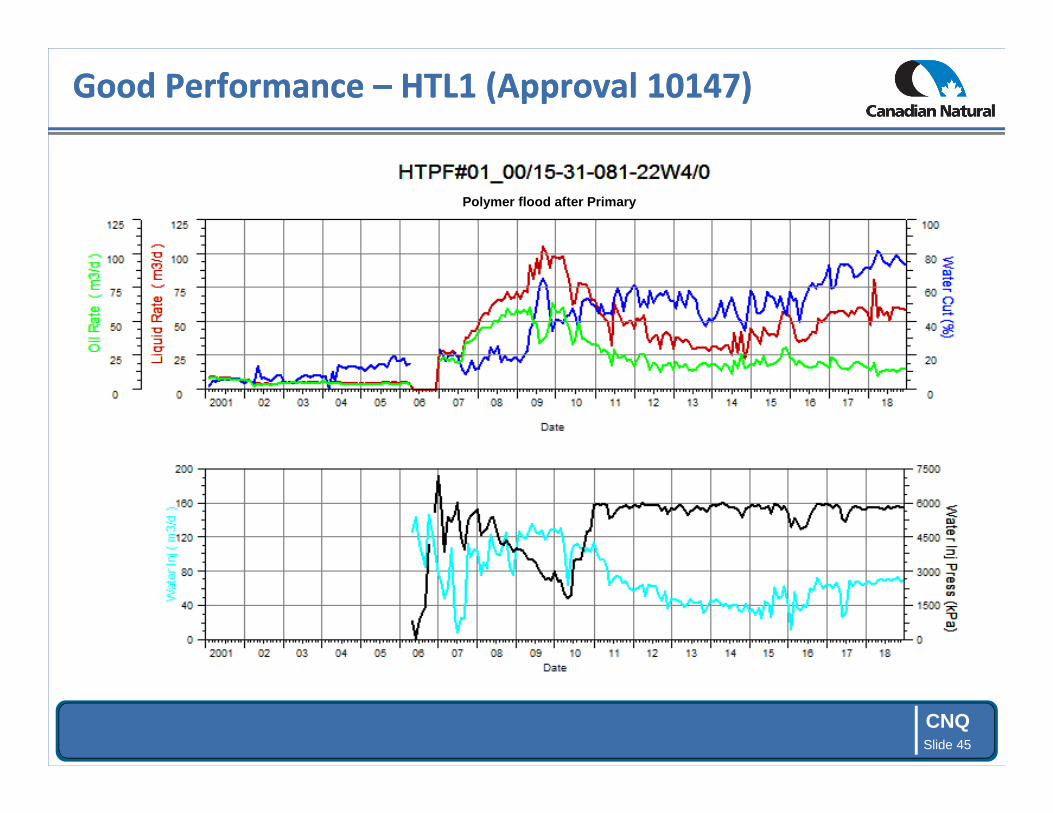
Good Performance – HTL1 (Approval 10147)Good Performance – HTL1 (Approval 10147)
• HTL1 100/15-31 Pattern
� Well list and allocation factors:
Injectors
�100/15-31-081-22W4/0 (100%)
Producers
�102/14-31-081-22W4/0 (50%)
�102/15-31-081-22W4/0 (50%)
Approval 10147
CNQSlide 45
Good Performance – HTL1 (Approval 10147)Good Performance – HTL1 (Approval 10147)
Polymer flood after Primary
CNQSlide 46
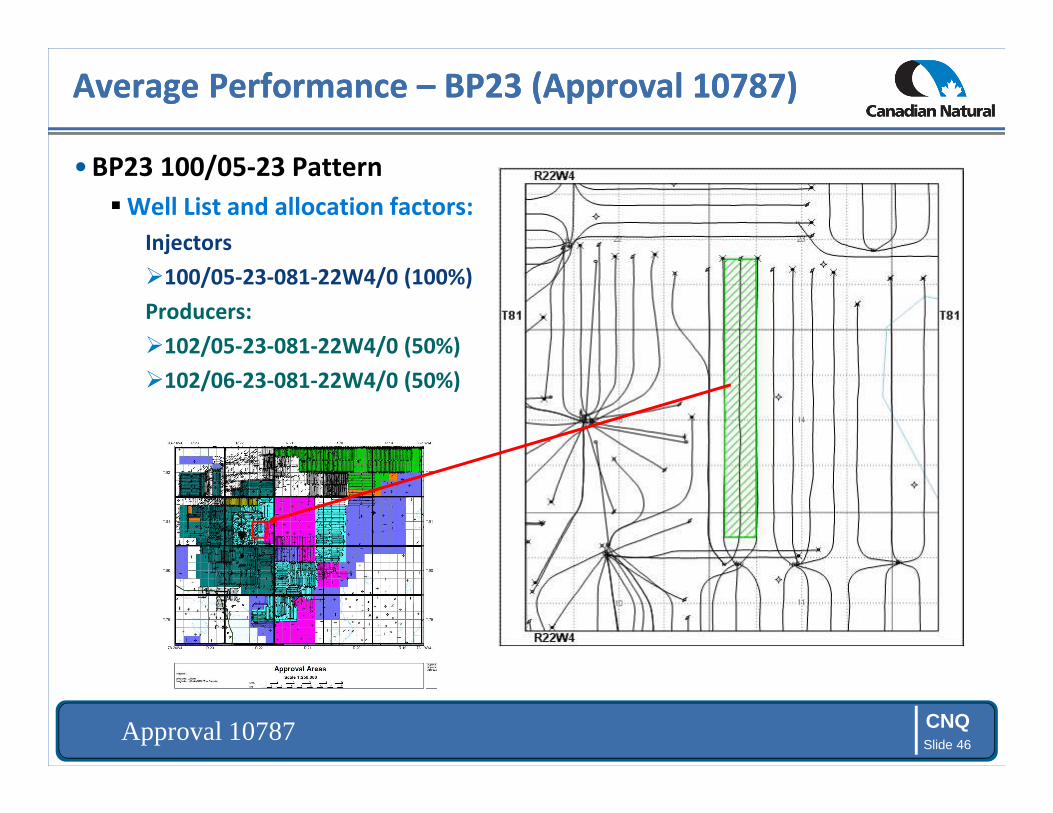
Average Performance – BP23 (Approval 10787)Average Performance – BP23 (Approval 10787)
• BP23 100/05-23 Pattern
� Well List and allocation factors:
Injectors
�100/05-23-081-22W4/0 (100%)
Producers:
�102/05-23-081-22W4/0 (50%)
�102/06-23-081-22W4/0 (50%)
Approval 10787
CNQSlide 47
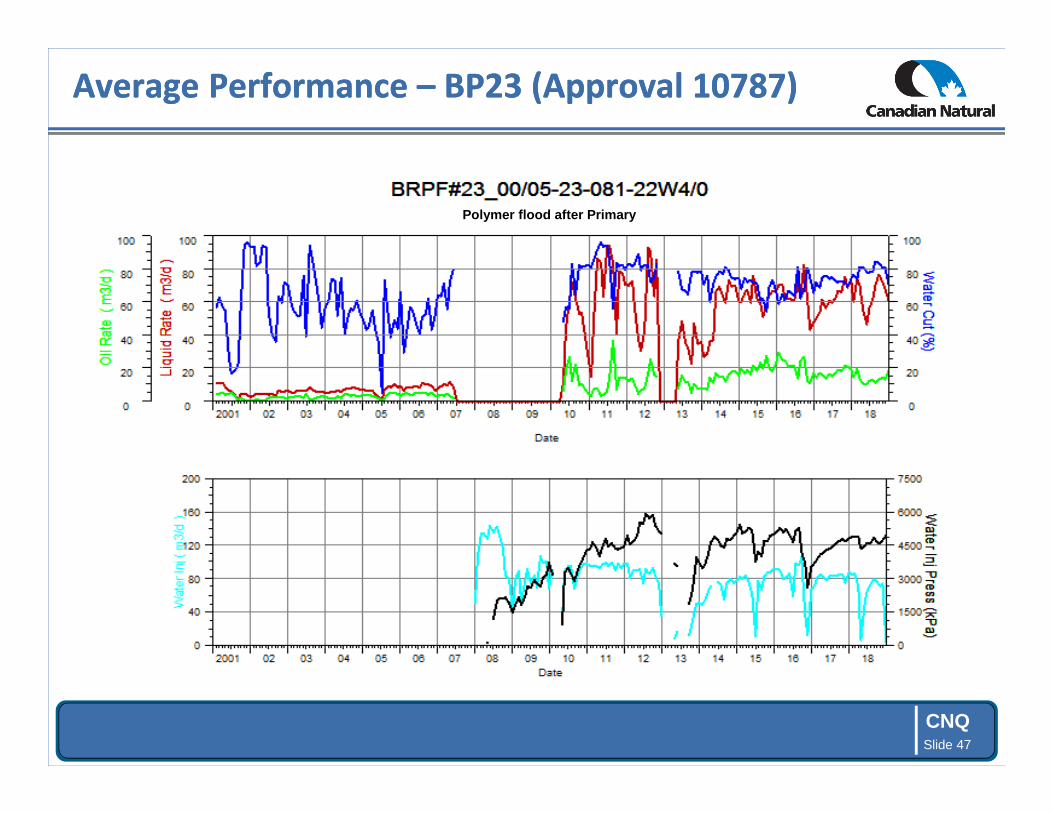
Average Performance – BP23 (Approval 10787)Average Performance – BP23 (Approval 10787)
Polymer flood after Primary
CNQSlide 48
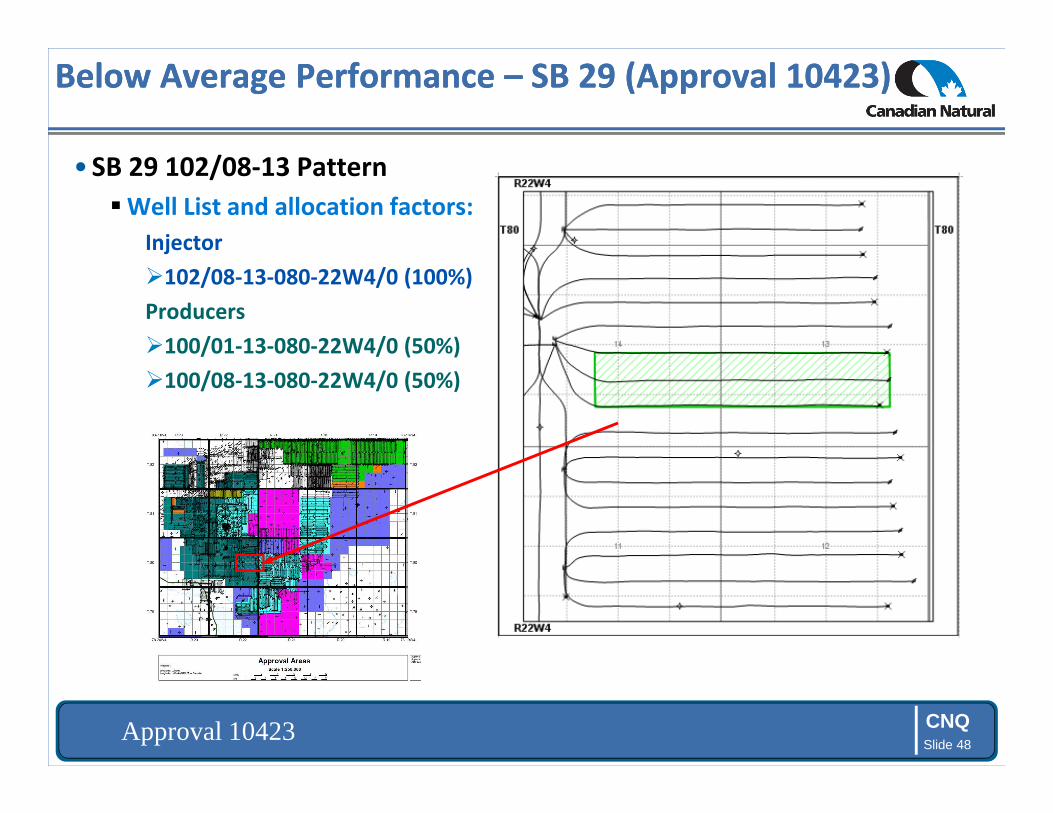
Below Average Performance – SB 29 (Approval 10423)Below Average Performance – SB 29 (Approval 10423)
• SB 29 102/08-13 Pattern
� Well List and allocation factors:
Injector
�102/08-13-080-22W4/0 (100%)
Producers
�100/01-13-080-22W4/0 (50%)
�100/08-13-080-22W4/0 (50%)
Approval 10423

CNQSlide 49
Below Average Performance – SB 29 (Approval 10423)Below Average Performance – SB 29 (Approval 10423)

CNQSlide 50
Summary of Good/Average/Poor AreasSummary of Good/Average/Poor Areas
Plot showing Recovery Factor (RF) versus Pore Volume (PF) Injected. Indicates effectiveness and performance of the flood.

CNQSlide 51
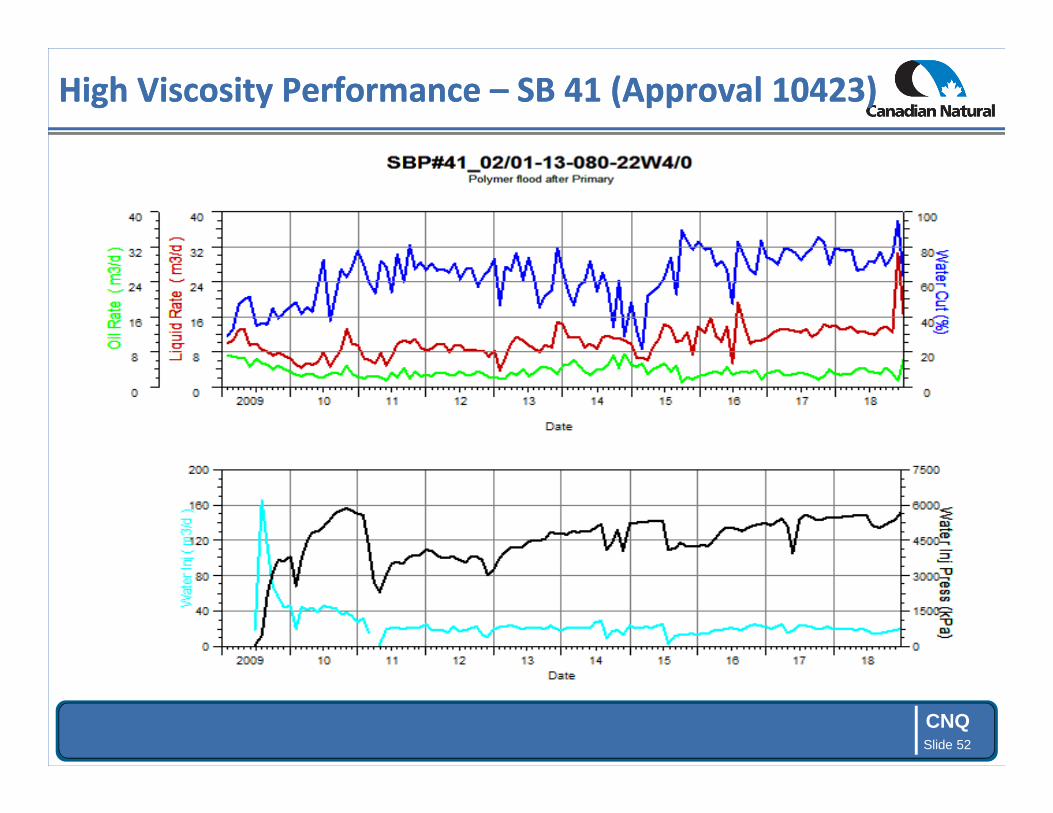
High Viscosity Performance – SB 41 (Approval 10423)High Viscosity Performance – SB 41 (Approval 10423)
• SB 41 102/01-13 Pattern
� Well list and allocation factors:
Injectors
�102/01-13-080-22W4/0 (100%)
Producers
�100/01-13-080-22W4/0 (50%)
�102/16-12-080-22W4/0 (50%)
Approval 10423
CNQSlide 52
High Viscosity Performance – SB 41 (Approval 10423)High Viscosity Performance – SB 41 (Approval 10423)

CNQSlide 53
High Viscosity Performance – SB 41 (Approval 10423)High Viscosity Performance – SB 41 (Approval 10423)
•Experience with higher viscosity flooding has been varied but
indications are that response is to be expected but is harder to
predict
�In the example total production from pattern has doubled in
response to polymer flooding
�Water cut response has been muted compared to lower
viscosity examples
•Lower injection rates and slower response characteristic of
polymer flooding higher viscosity oil.

CNQSlide 54
Cap Rock IntegrityCap Rock Integrity

CNQSlide 55
Cap Rock IntegrityCap Rock Integrity
• 2018 Anomalies (5 in total)
• 6 anomalies in 2017, 7 anomalies in 2016, 5 anomalies in 2015, 7 anomalies in
2014, 4 anomalies in 2013, 9 anomalies in 2012; 18 anomalies in 2011
All five 2018 anomalies were fully investigated. All injectors are back on-stream under normal operating conditions and have regained pressure following the event.
Date of Event Location Cause of AlarmOperations Review of Injection
Well
Initial Injection
Pressure
Anomalous
Pressure
Initial
Injection
Rate
Anomalous
RateCause of Anomaly
(MM/DD/YYYY) (Pad Name and UWI) (kPag) (kPag) (m3/d) (m3/d)
February 10, 2018 SE11 104/05-18-082-21W4
Drop in injection
pressure/injection
rate increase
Pressure transmitter on the
water line seems to have a
similar fluctuating trend
suggesting meters could be
freezing due to extreme
temperatures.
4826 3000 45 45 Meter error
February 28, 2018 NW06 100/04-17-083-20W4
Drop in injection
pressure/injection
rate increase
Surface facilities and
instrumentation were checked
and have been found to be
working properly
5775 4250 40 40Dilation within
Wabasca sand.
June 13, 2018 NBP1 102/14-31-082-21W4
Drop in injection
pressure/injection
rate increase
Surface facilities and
instrumentation were checked
and have been found to be
working properly
5,850 5,280 30 45Dilation within
Wabasca sand.
June 3, 2018 NBP2 100/16-31-082-21W4
Drop in injection
pressure/injection
rate increase
Surface facilities and
instrumentation were checked
and have been found to be
working properly
6,060 5,460 20 20Dilation within
Wabasca sand.
December 3, 2018 BP21 104/03-26-081-22W4
Drop in injection
pressure/injection
rate increase
Surface facilities and
instrumentation were checked
and have been found to be
working properly
5750 5100 75 70Dilation within
Wabasca sand.

CNQSlide 56
0.00
1,000.00
2,000.00
3,000.00
4,000.00
5,000.00
6,000.00
7,000.00
0
5
10
15
20
25
30
35
5/1/2018 6/1/2018 7/1/2018 8/1/2018 9/1/2018 10/1/2018 11/1/2018 12/1/2018
We
llh
ea
d I
nje
ctio
n P
ress
ure
(k
Pa
)
Da
ily
In
ject
ion
Ra
te (
m3
/d)
NBP2: 100/16-31-082-21W4 Injection History
Flow Pressure
Cap Rock Integrity – NBP2: 00/16-31Cap Rock Integrity – NBP2: 00/16-31
00/16-31-082-21W4: Injector was shut in shortly after anomaly to allow time for the dilation to “heal”. Restarted at a reduced rate and found pressure has built back up to pre-dilation levels.
Injection AnomalyBuilding pressure again following restart
Shut well in
Restarted at reduced rate

CNQSlide 57
Cap Rock Integrity – NBP2: 00/16-31Cap Rock Integrity – NBP2: 00/16-31
Hall plots are reviewed regularly to investigate po tential cap rock breaches. A sudden change in the Hall Plot slope may indicate a potent ial issue.
Wat
er In
j Rat
e m
3/d
Injection Pressure (kP
a)

CNQSlide 58
Cap Rock MonitoringCap Rock Monitoring
• No cap rock anomalies were recorded in the Approval 9404 area by
Cenovus or CNRL in 2017. Cenovus’ 2017 data was reviewed and there
were no anomalies identified. This is in line with the monitoring results
since injection rates and pressures were reduced in 2015.
• In early 2018, CNRL implemented a monitoring system in 9404 that has
the same parameters and setpoints as the legacy injection system.
CNQSlide 59
Future Development PlansFuture Development Plans

CNQSlide 60
Future Development PlansFuture Development Plans
• Canadian Natural plans to continue with the expansion of the polymer
flood at Brintnell over the next several years. Expansion will push the
flood to the southeastern and western edges of the pool.
• The focus of this year’s capital program will be infill drilling and polymer
flood optimization of existing well patterns. Optimization will be
achieved through continuous flood management to ensure balance and
optimal recovery factor.
• CNRL received approval in 2012 to implement a surfactant pilot in the
field. CNRL is not pursuing surfactant flooding at the present time.

CNQSlide 61
FacilitiesFacilities

CNQSlide 62
Brintnell / Pelican Lake BatteriesBrintnell / Pelican Lake Batteries
13-11 Pelican Lake
Water Knockout Facility
SE 10-5 Pelican Lake
Water Knockout Facility
7-27 North Brintnell Battery
11-7 Pelican Lake Battery
9-2 South Brintnell Battery
1-36 Central Brintnell Battery

CNQSlide 63
Facility: NBB 07-27-82-21W4 Battery Plot PlanFacility: NBB 07-27-82-21W4 Battery Plot Plan

CNQSlide 64
Facility: SBB 09-02-81-23W4 Battery Plot PlanFacility: SBB 09-02-81-23W4 Battery Plot Plan

CNQSlide 65
Facility: CBB 01-36-80-22W4 Battery Plot PlanFacility: CBB 01-36-80-22W4 Battery Plot Plan

CNQSlide 66
Facility: PLB 11-07-082-22W4 Battery Plot PlanFacility: PLB 11-07-082-22W4 Battery Plot Plan

CNQSlide 67
Facility: Typical Brintnell Battery PFDFacility: Typical Brintnell Battery PFD
CNQSlide 68
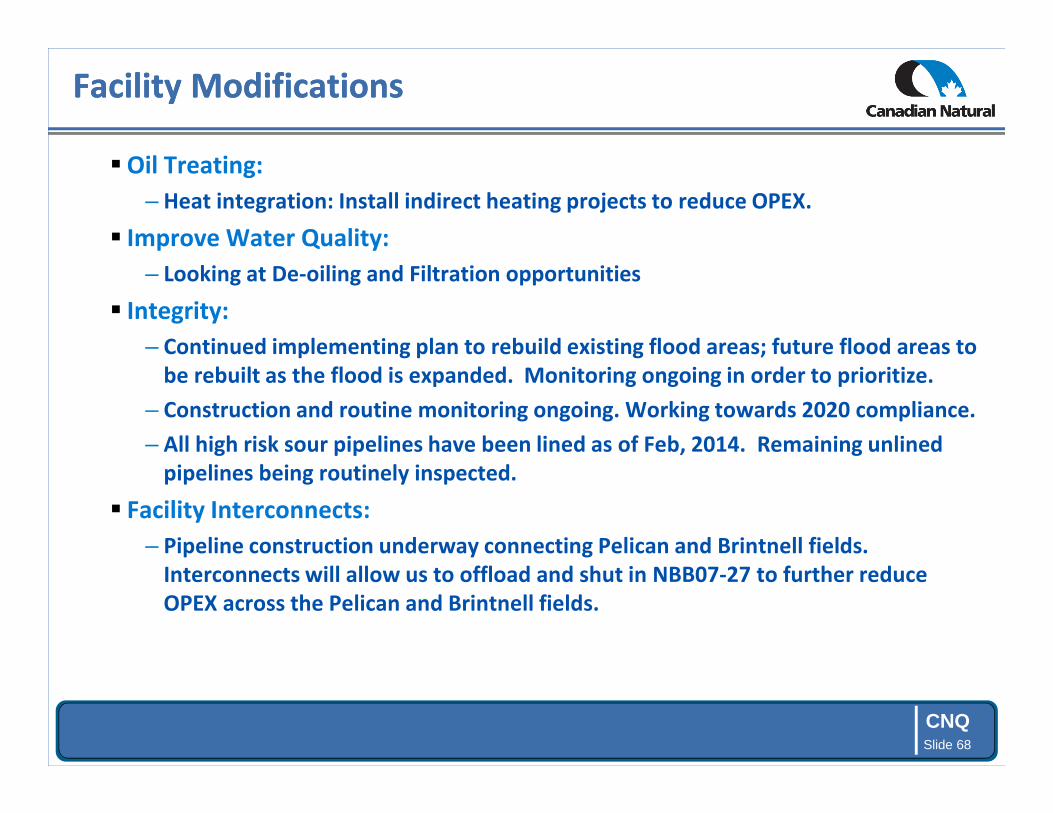
Facility ModificationsFacility Modifications
� Oil Treating:
– Heat integration: Install indirect heating projects to reduce OPEX.
� Improve Water Quality:
– Looking at De-oiling and Filtration opportunities
� Integrity:
– Continued implementing plan to rebuild existing flood areas; future flood areas to
be rebuilt as the flood is expanded. Monitoring ongoing in order to prioritize.
– Construction and routine monitoring ongoing. Working towards 2020 compliance.
– All high risk sour pipelines have been lined as of Feb, 2014. Remaining unlined
pipelines being routinely inspected.
� Facility Interconnects:
– Pipeline construction underway connecting Pelican and Brintnell fields.
Interconnects will allow us to offload and shut in NBB07-27 to further reduce
OPEX across the Pelican and Brintnell fields.

CNQSlide 69
Facility Future PlansFacility Future Plans
• Major Activities:
� Reactivated SE10.5 Satellite in 2018
� Battery consolidation underway
� Pad Rebuilds Continued
� Future Polymer Expansions
� Water Management Plan

CNQSlide 70
Brintnell/Pelican Lake Power Consumption Brintnell/Pelican Lake Power Consumption
Jan-18 Feb-18 Mar-18 Apr-18 May-18 Jun-18 Jul-18 Aug-18 Sep-18 Oct-18 Nov-18 Dec-18 Total
Central
Brintnell8,034,124 7,355,753 7,712,181 7,014,212 5,927,211 4,967,581 4,798,801 5,036,468 5,453,810 6,991,731 7,074,059 7,532,757 77,898,688
South
Brintnell8,764,615 8,047,535 8,642,695 7,838,516 6,884,064 5,728,034 5,036,415 5,264,962 5,679,778 7,295,980 7,804,226 8,431,931 85,418,751
North
Brintnell5,540,393 5,026,908 5,193,101 4,473,700 3,250,620 2,366,000 2,409,364 2,457,444 2,902,414 4,476,190 4,513,006 4,793,535 47,402,675
Pelican 9,006,312 8,070,059 8,463,836 7,700,545 6,396,952 3,648,368 3,745,236 3,859,623 4,196,000 7,882,855 8,189,026 8,630,944 79,789,756
Total 31,345,444 28,500,255 30,011,813 27,026,973 22,458,847 16,709,983 15,989,816 16,618,497 18,232,002 26,646,756 27,580,317 29,389,167 290,509,870
Power Consumption - kWh

CNQSlide 71
Battery Performance - BrintnellBattery Performance - Brintnell
2006 2007 2008 2009 2010 2011 2012 2013 2014 2015 2016 2017 2018
North Brintnell 7-27
Oi l Produced (m3) 705,917 809,627 959,335 988,448 957,855 835,263 1,075,836 1,027,258 937,154 900,340 644,767 670,070 599,394
Produced Water (m3) 1,374,731 1,775,300 2,096,258 2,292,879 2,386,085 1,484,277 1,795,440 1,567,398 1,772,860 1,618,804 1,325,432 1,669,135 1,411,728
Recycle Rates (m3) 1,220,482 1,779,160 2,057,161 2,238,740 2,330,418 1,453,371 1,786,316 1,559,325 1,772,860 1,618,804 1,325,432 1,606,228 1,383,084
Produce Recycle 88.8% 100.2% 98.1% 97.6% 97.7% 97.9% 99.5% 99.5% 100.0% 100.0% 100.0% 96.2% 98.0%
Average Daily Recycle (m3/d) 3,344 4,874 5,621 6,134 6,385 3,982 4,881 4,272 4,857 4,435 3,621 4,401 3,789
Average Disposal Rates (m3/d) 423 -11 107 148 153 85 25 22 0 0 0 172 78
Central Brintnell 12-09
Oi l Produced (m3) 568,076 603,657 569,149 533,178 528,267 492,495 546,580 237,914
Produced Water (m3) 167,755 193,349 267,607 378,988 323,086 402,772 402,822 143,284
Recycle Rates (m3) 0 26,826 159,288 346,418 301,720 357,025 329,781 104,583
Produce Recycle 0.0% 13.9% 59.5% 91.4% 93.4% 88.6% 81.9% 73.0%
Average Daily Recycle (m3/d) 0 73 435 949 827 978 901 775
Average Disposal Rates (m3/d) 460 456 296 89 59 125 200 106
Central Brintnell 01-36
Oi l Produced (m3) 584,297 780,513 951,411 1,298,572 1,161,176 1,115,119
Produced Water (m3) 638,159 1,946,244 2,347,871 2,570,249 2,475,657 2,471,567
Recycle Rates (m3) 565,099 1,615,263 1,908,506 2,150,738 2,028,121 2,061,624
Produce Recycle 88.6% 83.0% 81.3% 83.7% 81.9% 83.4%
Average Daily Recycle (m3/d) 2,457 4,425 5,229 5,876 5,556 5,648
Average Disposal Rates (m3/d) 318 907 1,204 1,149 1,340 1,123
South Brintnell 9-02
Oi l Produced (m3) 441,942 575,306 620,631 602,897 645,053 782,847 1,080,977 1,055,952 1,220,367 1,100,589 840,998 887,192 801,084
Produced Water (m3) 341,034 413,480 501,318 544,390 776,095 1,014,789 1,505,539 1,494,985 1,205,459 1,278,060 1,438,774 1,566,380 1,773,319
Recycle Rates (m3) 0 22,465 173,011 204,727 173,120 823,109 1,412,965 1,384,546 1,091,455 1,172,557 1,173,748 1,375,245 1,411,632
Produce Recycle 0.0% 5.4% 34.5% 37.6% 22.3% 81.1% 93.9% 92.6% 90.5% 91.7% 81.6% 87.8% 79.6%
Average Daily Recycle (m3/d) 0 62 473 561 474 2,255 3,861 3,793 2,990 3,212 3,207 3,768 3,867
Average Disposal Rates (m3/d) 934 1,071 897 931 1,652 525 253 303 312 289 726 524 991
Total Volumes
Oi l Produced (m3) 1,715,934 1,988,589 2,149,115 2,124,523 2,131,175 2,110,605 2,703,393 2,905,421 2,938,034 2,952,339 2,784,337 2,718,438 2,515,597
Produced Water (m3) 1,883,520 2,382,129 2,865,183 3,216,258 3,485,267 2,901,838 3,703,800 3,843,826 4,924,563 5,244,736 5,334,455 5,711,173 5,656,613
Recycle Rates (m3) 1,220,482 1,828,451 2,389,460 2,789,885 2,805,257 2,633,505 3,529,061 3,613,553 4,479,577 4,699,867 4,649,918 5,009,594 4,856,340
Fresh Water (m3) 512,766 1,026,684 1,493,264 1,433,242 1,553,045 1,479,780 1,876,840 2,041,938 2,028,731 1,937,567 1,916,943 2,162,684 108,906
Brackish Water (m3) - Grosmont 1,438,110 1,661,989 764,664 2,963,684 3,999,848 6,274,361 4,780,011 3,800,437 3,666,120 3,133,047 2,276,529 1,959,507 21,860
Disposal Volume (m3) 663,038 553,678 475,723 426,373 680,010 268,333 174,739 222,200 464,554 544,868 684,537 743,035 743,035
Total Produce Recycle (%) 64.8% 76.8% 83.4% 86.7% 80.5% 90.8% 95.3% 94.0% 91.0% 89.6% 87.2% 87.7% 85.9%
Average Daily Recycle (m3/d) 3,344 5,009 6,529 7,644 7,686 7,215 9,642 9,900 12,273 12,876 12,705 13,725 13,305
Average Daily Disposal (m3/d) 1,817 1,517 1,300 1,168 1,863 735 477 748 1,219 1,493 1,875 2,036 2,193
Battery Commissioned May 2013 - first oil May 15, 2013
Battery converted to trucked in facility May 15, 2013
CNQSlide 72
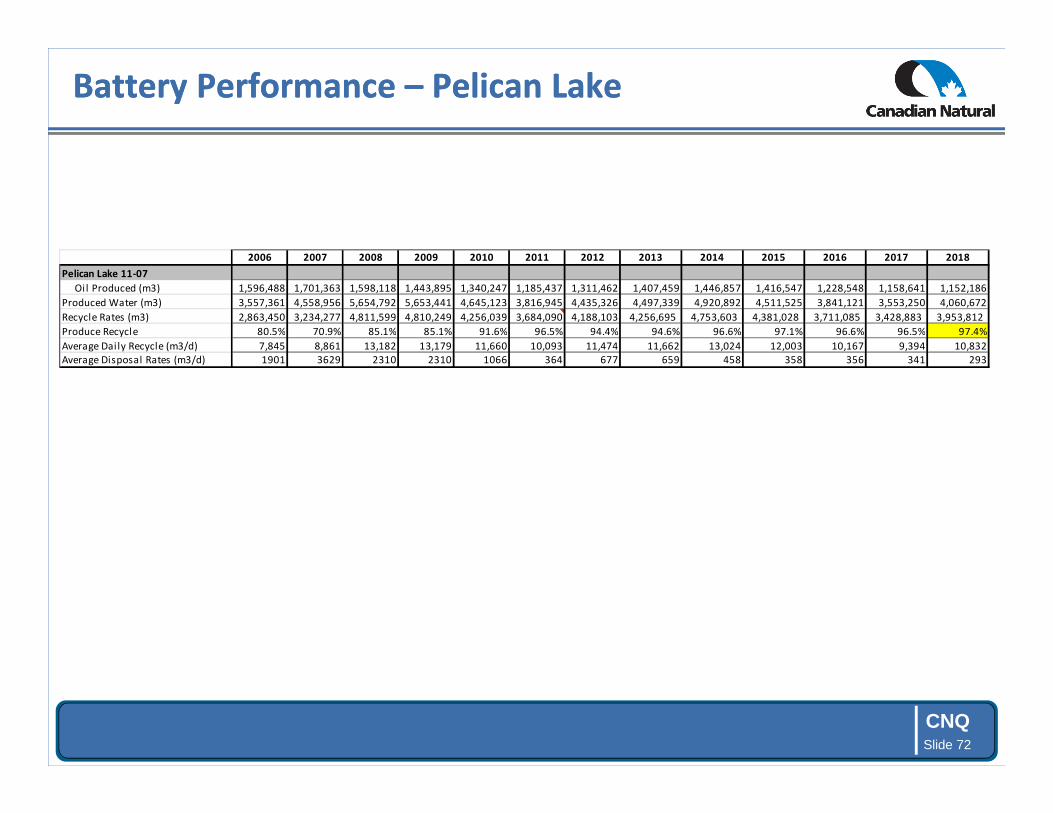
Battery Performance – Pelican LakeBattery Performance – Pelican Lake
2006 2007 2008 2009 2010 2011 2012 2013 2014 2015 2016 2017 2018
Pelican Lake 11-07
Oi l Produced (m3) 1,596,488 1,701,363 1,598,118 1,443,895 1,340,247 1,185,437 1,311,462 1,407,459 1,446,857 1,416,547 1,228,548 1,158,641 1,152,186
Produced Water (m3) 3,557,361 4,558,956 5,654,792 5,653,441 4,645,123 3,816,945 4,435,326 4,497,339 4,920,892 4,511,525 3,841,121 3,553,250 4,060,672
Recycle Rates (m3) 2,863,450 3,234,277 4,811,599 4,810,249 4,256,039 3,684,090 4,188,103 4,256,695 4,753,603 4,381,028 3,711,085 3,428,883 3,953,812
Produce Recycle 80.5% 70.9% 85.1% 85.1% 91.6% 96.5% 94.4% 94.6% 96.6% 97.1% 96.6% 96.5% 97.4%
Average Dai ly Recycle (m3/d) 7,845 8,861 13,182 13,179 11,660 10,093 11,474 11,662 13,024 12,003 10,167 9,394 10,832
Average Disposal Rates (m3/d) 1901 3629 2310 2310 1066 364 677 659 458 358 356 341 293

CNQSlide 73
Measuring and ReportingMeasuring and Reporting

CNQSlide 74
Measurement and ReportingMeasurement and Reporting
• Methods of Measurement:
� Oil and Water: flow meters and test tanks (Primary only)
� Solution Gas: orifice meters/GOR Testing
• Typical Well Testing:
� Frequency and duration: well testing as per Directive 17.
� Meter installations have replaced test tanks (high volume and flood
producers).
– Part of all new pad expansions and rebuilds.
• 2018 Field Proration Factors:
� Meets directive 17 requirements
– Brintnell:
• Oil – 0.87, Water – 1.13
– Pelican Lake:
• Oil – 0.85, Water – 0.98

CNQSlide 75
Measurement and Reporting – ContinuedMeasurement and Reporting – Continued
• Optimization:
� Remove test tanks and install flow meters on pads/wells
– Increase testing frequency and duration
– Perform testing inline
– Eliminates gas venting from tanks
– Reduces fuel gas consumption
– Reduces potential for spill
� Standardize testing equipment across field
– Reduce downtime and maintenance
– Increase reliability in calibration
– Improve & revise BS&W testing procedures for better accuracy

CNQSlide 76
Gas Volumes - Update Gas Volumes - Update
• Produced gas is captured, processed and used throughout the field as
consumable fuel gas.
• Venting only occurs at the well leases when D-60 requirements have been
approved by the AER. No sour gas vented.
Brintnell
Pelican Lake
Gas Volumes (e3m3) Jan-18 Feb-18 Mar-18 Apr-18 May-18 Jun-18 Jul-18 Aug-18 Sep-18 Oct-18 Nov-18 Dec-18 2018 Total
DIFF - - - - - - - - - - - - -
DISP 3,448 3,384 3,583 3,556 3,620 3,067 3,082 3,179 3,039 3,350 3,115 2,942 39,364
FLARE 126 114 95 48 46 50 69 96 87 73 50 82 937
FUEL 3,262 3,002 3,170 2,916 2,568 2,230 2,240 2,354 2,577 2,910 2,914 2,879 33,022
PROD 4,017 3,871 4,211 4,103 4,157 3,602 3,554 3,670 3,510 3,715 3,459 3,398 45,266
REC 3,087 2,867 2,900 2,688 2,347 2,005 2,101 2,221 2,449 2,878 2,870 2,826 31,238
VENT 268 237 264 270 270 260 265 262 256 259 249 321 3,181
Gas Volumes (e3m3) Jan-18 Feb-18 Mar-18 Apr-18 May-18 Jun-18 Jul-18 Aug-18 Sep-18 Oct-18 Nov-18 Dec-18 2018 Total
DIFF - - - - - - - - - - - - -
DISP 4 4 3 2 1 1 1 1 2 19
FLARE 31 29 38 33 2 8 13 12 11 23 20 19 238
FUEL 1,429 1,238 1,477 1,439 1,439 1,391 1,238 1,133 1,197 1,499 1,532 1,689 16,699
PROD 778 675 795 873 950 763 806 685 777 1,222 1,199 1,144 10,666
PURREC 44 40 55 49 45 46 40 318
REC 883 752 897 769 666 761 575 576 557 502 496 812 8,245
VENT 197 157 175 169 174 166 169 171 171 247 190 288 2,272

CNQSlide 77
Water UseWater Use

CNQSlide 78
Brintnell Total InjectionBrintnell Total Injection
0
100,000
200,000
300,000
400,000
500,000
600,000
700,000
800,000
900,000
1,000,000
Jan Feb Mar Apr May Jun Jul Aug Sep Oct Nov Dec
Inje
cte
d V
olu
me
(m
3)
2018 Brintnell Total Injection
Produced Water to Injection Non-Saline Make-Up Water Saline Make-Up Water

CNQSlide 79
Pelican Lake Total InjectionPelican Lake Total Injection
0
50,000
100,000
150,000
200,000
250,000
300,000
350,000
400,000
450,000
500,000
Jan Feb Mar Apr May Jun Jul Aug Sep Oct Nov Dec
Inje
cte
d V
olu
me
(m
3)
2018 Pelican Lake Total Injection
Produced Water to Injection Non-Saline Make-Up Water Saline Make-Up Water

CNQSlide 80
2018 Injection Water Summary2018 Injection Water Summary
Brintnell
Pelican Lake
2018 Polymer Injection Volumes (m³) Jan Feb Mar Apr May Jun Jul Aug Sep Oct Nov DecProduced Water to Injection 390,276 367,046 426,191 408,556 412,257 382,476 375,844 461,317 417,611 399,509 384,853 393,998Non-Saline Make-Up Water 209,426 202,158 268,214 258,584 273,575 262,183 269,804 279,749 270,515 265,977 257,714 275,714Saline Make -Up Water 133,206 104,466 91,315 76,241 94,754 93,581 114,268 130,507 98,210 129,677 106,609 108,051
Total 732,908 673,670 785,721 743,381 780,586 738,239 759,916 871,573 786,336 795,163 749,176 777,763
Total Injection Volumes (m³) 2010 2011 2012 2013 2014 201 5 2016 2017 2018
Produced Water to Injection 3,485,267 39% 2,901,838 27% 3,388,006 34% 3,522,671 38% 4,390,618 44% 4,617,604 48% 4,507,036 52% 4,946,868 55% 4,819,935 52%
Non-Saline Make-Up Water 1,553,045 17% 1,479,780 14% 1,876,840 19% 2,041,938 22% 2,028,731 20% 1,937,567 20% 1,916,943 22% 2,162,684 24% 3,093,614 34%
Saline Make-Up Water 3,999,848 44% 6,274,361 59% 4,780,011 48% 3,800,437 41% 3,666,120 36% 3,133,047 32% 2,276,529 26% 1,959,507 22% 1,280,884 14%
Total 9,038,160 10,655,979 10,044,856 9,365,047 10,085,470 9,688,218 8,700,507 9,069,059 9,194,433
2018 Injection Volumes (m³) Jan Feb Mar Apr May Jun Jul Aug Sep Oct Nov DecProduced Water to Injection 314,939 281,190 323,735 309,569 326,618 337,353 379,491 331,874 309,571 343,961 333,722 341,571Non-Saline Make-Up Water 80,339 74,087 87,396 89,131 88,077 84,454 78,202 72,277 80,897 94,270 80,275 92,661Saline Make -Up Water 0 0 0 9,139 18,345 1,208 1,535 1,591 21,990 16,056 14,881 26,732Total 395,277 355,277 411,131 407,840 433,040 423,016 459,228 405,742 412,458 454,287 428,879 460,964
Total Injection Volumes (m³) 2010 2011 2012 2013 2014 201 5 2016 2017 2018
Produced Water to Injection 4,256,039 60% 3,684,090 64% 4,188,103 56% 4,256,695 49% 4,753,603 44% 4,381,028 57% 3,711,085 70% 3,428,883 73% 3,953,812 78%
Non-Saline Make-Up Water 684,010 10% 803,000 14% 953,380 13% 1,132,595 13% 1,369,845 20% 1,078,575 14% 571,955 11% 570,130 12% 1,001,925 20%
Saline Make-Up Water 2,207,885 31% 1,270,930 22% 2,403,890 32% 3,220,395 37% 4,163,555 36% 2,224,675 29% 1,027,475 19% 713,210 15% 111,325 2%
Total 7,147,934 5,758,020 7,545,373 8,609,685 10,085,470 7,684,278 5,310,515 4,712,223 5,067,062

CNQSlide 81
Non-Saline Well Locations -BrintnellNon-Saline Well Locations -Brintnell
All Grand Rapids “B”
Source Wells

CNQSlide 82
Non-Saline Well Locations –Pelican LakeNon-Saline Well Locations –Pelican Lake

CNQSlide 83
Non-Saline Water Use - BrintnellNon-Saline Water Use - Brintnell
• Canadian Natural currently has two licenses with Alberta Energy Regulator for
the diversion of non-saline water for injection
� 00249595-02-00. 2,151,310 m3 with expiry date of 2024-01-25
� 00329572-00-00. 1,460,000 m3 with expiry date of 2019-05-25
• Working to optimize the use of non-saline water for polymer hydration to
maximize its benefit
• In Compliance with Alberta Environment and Water regarding monthly
reporting, observation well monitoring, and all other terms of the License.
CNQSlide 84
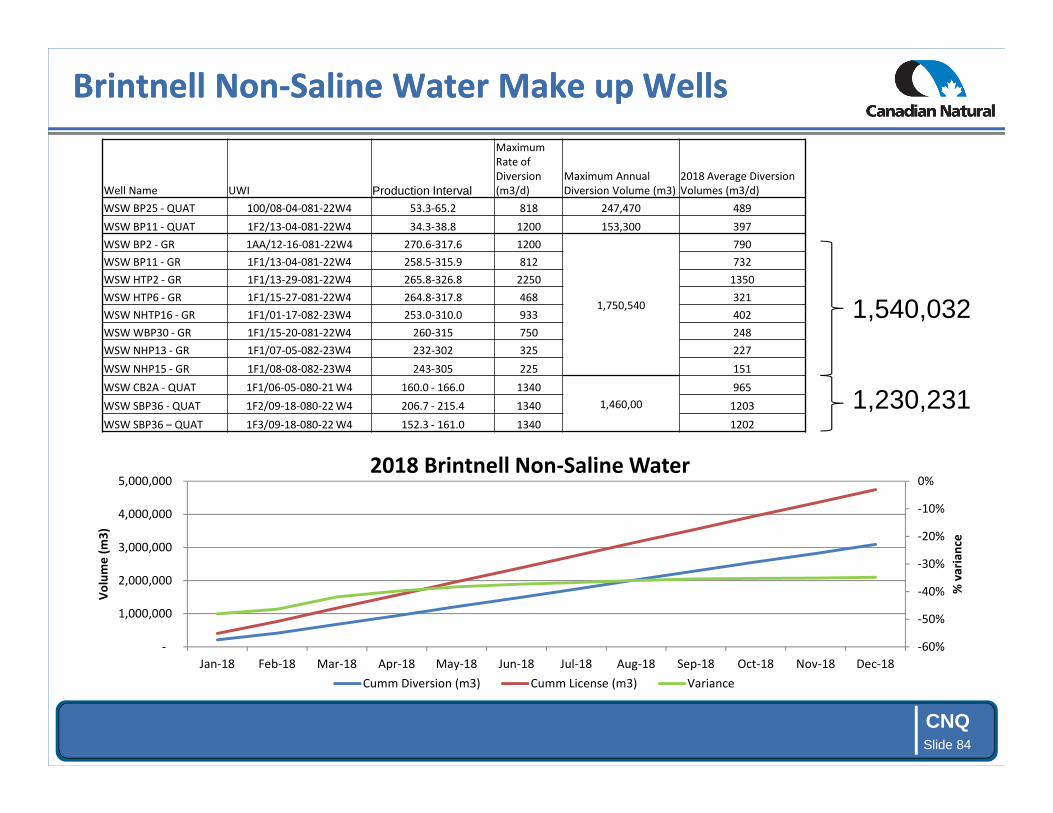
Brintnell Non-Saline Water Make up WellsBrintnell Non-Saline Water Make up Wells
1,540,032
Well Name UWI Production Interval
Maximum
Rate of
Diversion
(m3/d)
Maximum Annual
Diversion Volume (m3)
2018 Average Diversion
Volumes (m3/d)
WSW BP25 - QUAT 100/08-04-081-22W4 53.3-65.2 818 247,470 489
WSW BP11 - QUAT 1F2/13-04-081-22W4 34.3-38.8 1200 153,300 397
WSW BP2 - GR 1AA/12-16-081-22W4 270.6-317.6 1200
1,750,540
790
WSW BP11 - GR 1F1/13-04-081-22W4 258.5-315.9 812 732
WSW HTP2 - GR 1F1/13-29-081-22W4 265.8-326.8 2250 1350
WSW HTP6 - GR 1F1/15-27-081-22W4 264.8-317.8 468 321
WSW NHTP16 - GR 1F1/01-17-082-23W4 253.0-310.0 933 402
WSW WBP30 - GR 1F1/15-20-081-22W4 260-315 750 248
WSW NHP13 - GR 1F1/07-05-082-23W4 232-302 325 227
WSW NHP15 - GR 1F1/08-08-082-23W4 243-305 225 151
WSW CB2A - QUAT 1F1/06-05-080-21 W4 160.0 - 166.0 1340
1,460,00
965
WSW SBP36 - QUAT 1F2/09-18-080-22 W4 206.7 - 215.4 1340 1203
WSW SBP36 – QUAT 1F3/09-18-080-22 W4 152.3 - 161.0 1340 1202
1,230,231
-60%
-50%
-40%
-30%
-20%
-10%
0%
-
1,000,000
2,000,000
3,000,000
4,000,000
5,000,000
Jan-18 Feb-18 Mar-18 Apr-18 May-18 Jun-18 Jul-18 Aug-18 Sep-18 Oct-18 Nov-18 Dec-18
% v
ari
an
ce
Vo
lum
e (
m3
)
2018 Brintnell Non-Saline Water
Cumm Diversion (m3) Cumm License (m3) Variance

CNQSlide 85
Pelican Lake Non-Saline WaterPelican Lake Non-Saline Water
• In 2018, CNRL used 31.7% of the
total licensed volume. This is up
from 2017 rate of 17%.
• 2017 had low utilization as a
result of less water being required
for polymer hydration with
Cenovus’ decision to scale back
the polymer flood at that time.
Polymer flood has since been
ramped back up accounting for
the increase in utilization for 2018
Grand Rapids 'A'
Grand Rapids 'B'
Total
Annual Licensed Diversion (m3) 290,723 2,647,022 2,937,745
Annual Diversion (m3) 29,038 961,758 990,796
Actual % License Used 10% 36.3% 33.7%
• Grand Rapids ‘A’
� 2018, water diverted from 1 of 4
source wells
• Grand Rapids ‘B’
� 2018, water diverted from 15 of
20 source wells
At this time CNRL is evaluating the future potential to expand polymer to additional areas
of the field. This would expand the water sourcing demands and use a higher portion of
the available license. As more certainty is developed we would be in a better position to
make long term adjustments to our licensed diversions.

CNQSlide 86
Water Chemistry - Brintnell Water Chemistry - Brintnell
Monitoring Sample Lab pH Lab EC Ca Mg Na K Cl T-Alkalinity HC O3 CO3 SO4 NO2-N NO3-N NO2-N+NO3-N Hardness TDS
Well Date µS/cm mg/L mg/L mg/L mg/L mg/L mg/L mg/L mg/L mg/L mg /L mg/L mg/L mg/L mg/L
WSW HTP 2 - GR 25-Jul-15 8.95 2600 2.05 1.41 608 3.64 82.6 1270 1340 104 <0.60 <0.020 <0.040 <0.045 10.9 1460
WSW HTP 6 - GR 25-Jul-15 8.95 2580 1.95 1.34 602 3.58 91.3 1250 1320 98.7 <0.60 <0.020 <0.040 <0.045 10.4 1450
WSW NHTP 13 - GR 26-Jul-15 8.65 2570 2.35 1.56 603 4.17 94.8 1260 1400 66.6 <0.60 <0.020 <0.040 <0.045 12.3 1470
WSW NHTP 15 - GR 26-Jul-15 8.96 2560 1.88 1.52 610 3.71 99.8 1230 1300 102 <0.60 <0.020 <0.040 <0.045 11 1460
WSW NHTP 16 - GR 26-Jul-15 8.93 2670 1.99 1.71 637 3.99 93.2 1350 1430 108 <1.5 <0.050 <0.10 <0.11 12 1550
WSW BP 2 - GR 25-Jul-15 8.94 2470 1.84 1.23 609 3.57 89 1210 1270 96.2 <0.60 <0.020 <0.040 <0.045 9.7 1430
WSW BP 11 - GR 25-Jul-15 8.95 2390 1.74 1.17 595 3.53 76 1210 1280 101 <0.60 <0.020 <0.040 <0.045 9.2 1410
WSW BP 11 - Quat 25-Jul-15 8.54 740 88 24.1 53.8 4.9 0.73 329 369 16.2 73.8 <0.010 0.062 0.062 319 443
WSW BP 25 - Quat 19-Jan-16 7.59 1600 129 39.4 207 6.32 1.52 487 594 <5.0 462 <0.010 <0.020 <0.050 484 1140
WB30 - GR 25-Jul-15 9.01 2610 2.22 1.37 631 3.74 98.3 1330 1380 116 <0.60 <0.020 <0.040 <0.045 11.2 1540
• Non-Saline Water Source Wells
• Saline Water Source Wells – Grosmont
� Typical TDS range – 22,000-35,000 mg/L

CNQSlide 87
Water Chemistry – Pelican LakeWater Chemistry – Pelican Lake
Durov Plot Grand Rapids ‘A’ Durov Plot Grand Rapids ‘B’
TDS 900-2000 mg/L from Grand Rapids ‘A’ and ‘B’ aquifers.

CNQSlide 88
Saline Water Source MapSaline Water Source Map

CNQSlide 89
2018 Saline Water Source Well Diversion Volumes (m³)2018 Saline Water Source Well Diversion Volumes (m³)
• Inactive wells above have been suspended and could be reactivated for future use.
Brintnell
Pelican LakeSaline Wells Jan-18 Feb-18 Mar-18 Apr-18 May-18 Jun-18 Ju l-18 Aug-18 Sep-18 Oct-18 Nov-18 Dec-18 Totals
BR CAMP 27 1F1/04-11-083-20W4/00 SRC 0 0 0 9,139 18,345 1,208 1,535 1,591 21,990 16,056 14,881 26,732 111,478
BR PEL NE06 100/07-07-083-19W4/00 SRC 0 0 0 0 0 0 0 0 0 0 0 0 0
BR PEL NE11 1F1/06-10-083-19W4/00 SRC 0 0 0 0 0 0 0 0 0 0 0 0 0
BR PEL NW07 1F1/15-36-082-21W4/00 SRC 0 0 0 0 0 0 0 0 0 0 0 0 0
BR PEL SE05 1F1/12-19-082-21W4/00 SRC 0 0 0 0 0 0 0 0 0 0 0 0 0
TOTAL SALINE 0 0 0 9,139 18,345 1,208 1,535 1,591 21,990 16,056 14881.45 26731.66 111,478
Saline Wells 18-Jan 18-Feb 18-Mar 18-Apr 18-May 18-Jun 18 -Jul 18-Aug 18-Sep 18-Oct 18-Nov 18-Dec Totals
1F1/01-36-080-22W4/00 15,917 15,099 16,630 13,382 17,560 15,932 18,251 14,294 8,741 10,052 13,685 12,520 172,062
1F1/02-32-080-22W4/00 80 - - - 131 - 1,052 67,612 47,741 98,129 72,556 74,538 361,839
1F1/08-08-081-22W4/00 42,766 22,954 7,404 913 10,577 4,195 30,058 12,815 2,758 3,216 3,097 2,128 142,880
1F1/11-26-082-21W4/00 12,944 12,231 14,770 11,282 12,850 24,899 18,363 35,786 20,448 16,098 17,109 18,866 215,646
1F1/13-26-080-22W4/00 61,499 54,182 52,511 50,664 53,635 48,555 46,544 - 18,521 2,183 162 - 388,457
1F1/12-01-081-23W400 - - - - - - - - - - - - -
1F1/13-28-080-22W4/00 - - - - - - - - - - - - -
1F1/12-14-080-22W4/00 - - - - - - - - - - - - -
1F1/11-26-082-20W4/00 - - - - - - - - - - - - -
1F1/12-27-082-21W4/00 - - - - - - - - - - - - -
1F1/06-02-082-22W4/00 - - - - - - - - - - - - -
1F2/14-11-082-22W4/00 - - - - - - - - - - - - -
TOTAL SALINE 133,206 104,466 91,315 76,241 94,754 93,581 114,268 130,507 98,210 129,677 106,609 108,051 1,280,884

CNQSlide 90
Water Usage and DisposalWater Usage and Disposal
• Continued to focus on maintaining high water recycling ratios.
� 2018 recycle at 85.9% for legacy Brintnell and 97.4% for Pelican Lake.
• CNRL continues to be in compliance with AENV water diversion license.
• CNRL Disposal injection in compliance with Directive 51 Guidelines and Approvals.
Total Water Volumes 2010 2011 2012 2013 2014 2015 2016 2017 2018Produced Water for Injection (m3) 3,485,267 2,901,838 3,703,800 3,522,671 4,390,618 4,617,604 4,507,036 4,946,868 4,819,935Non-Saline Water (m3) 1,553,045 1,479,780 1,876,840 2,041,938 2,028,731 1,937,567 1,916,943 2,162,684 3,093,614Brackish Water (m3) - Grosmont 3,999,848 6,274,361 4,780,011 3,800,437 3,666,120 3,133,047 2,276,529 1,959,507 1,280,884Disposal Volume (m3) 680,010 268,333 174,739 222,200 464,554 544,868 684,537 743,035 800,273Total Produce Recycle (%) 80.50% 90.80% 95.30% 94.00% 91.0% 89.6% 87.2% 87.7% 85.9%Average Daily Recycle (m3/d) 7,686 7,215 9,642 9,900 12,273 12,876 12,740 13,725 13,305
Brintnell
Pelican LakeTotal Water Volumes 2010 2011 2012 2013 2014 2015 2016 2017 2018
Produced Water for Injection (m3) 4,256,039 3,684,090 4,188,103 4,256,695 4,753,603 4,381,028 3,711,085 3,428,883 3,953,812Non-Saline Water (m3) 684,010 803,000 953,380 1,132,595 1,369,845 1,078,575 571,955 570,130 1,001,925Brackish Water (m3) - Grosmont 2,207,885 1,270,930 2,403,890 3,220,395 4,163,555 2,224,675 1,027,475 713,210 111,325Disposal Volume (m3) 389,083 132,855 247,223 240,644 167,289 130,497 130,035 124,367 106,859Total Produce Recycle (%) 91.6% 96.5% 94.4% 94.6% 96.6% 97.1% 96.6% 96.5% 97.4%Average Daily Recycle (m3/d) 11,660 10,093 11,474 11,662 13,024 12,003 10,167 9,394 10,832

CNQSlide 91
Brintnell Legacy Water InformationBrintnell Legacy Water Information
Brintnell - Water Information
2007 2008 2009 2010 2011 2012 2013 2014 2015 2016 2017 2018
Non-Saline Water (m3/day) -Quaternary and Grand Rapids 2,813 4,091 3,927 4,255 4,054 5,142 5,594 5,558 5,308 5,252 5,925 8,476
Brackish Water (m3/day) - Grossmont 4,553 2,095 8,120 10,958 17,190 13,096 10,412 10,044 8,584 6,237 5,369 3,509
Total Source Water (m3/day) 7,366 6,186 12,046 15,213 21,244 18,238 16,007 15,602 13,892 11,489 11,294 11,985
Total Source Water per barrel of oil 1.4 1.1 2.1 2.6 3.7 3.0 2.3 2.0 1.7 1.5 1.5 1.7
Brackish Water per barrel of oil 0.8 0.4 1.4 1.9 3.0 2.1 1.5 1.3 1.1 0.8 0.7 0.5
Non-Saline Water per barrel of oil 0.5 0.7 0.7 0.7 0.7 0.8 0.8 0.7 0.7 0.7 0.8 1.2
Produced Water Recycle (m3/day) 5,009 6,546 7,644 7,686 7,215 9,669 9,900 12,273 12,876 12,740 13,725 13,305
Recycle Rates 76.8% 83.4% 86.7% 80.5% 90.8% 95.3% 94.0% 91.0% 89.6% 87.2% 87.7% 85.9%
Oil Produced (bbl/day) 34,269 37,035 36,612 36,726 36,372 38,656 42,934 50,194 50,877 47,982 46,847 43,351
Brintnell - Water Information 2018 Monthly
Jan Feb Mar Apr May Jun Jul Aug Sep Oct Nov Dec
Non-Saline Water (m3/day) -Quaternary and Grand Rapids 6,756 7,220 8,652 8,619 8,825 8,739 8,703 9,024 9,017 8,580 8,590 8,894
Brackish Water (m3/day) - Grossmont 4,297 3,731 2,946 2,541 3,057 3,119 3,686 4,210 3,274 4,183 3,554 3,486
Total Makeup Water (m3/day) 11,053 10,951 11,598 11,161 11,882 11,859 12,389 13,234 12,291 12,763 12,144 12,380
Total Makeup Water per barrel of oil 1.6 1.6 1.6 1.5 1.7 1.9 2.0 1.8 1.7 1.9 1.9 1.9
Brackish Water per barrel of oil 0.6 0.5 0.4 0.3 0.4 0.5 0.6 0.6 0.5 0.6 0.5 0.5
Non-Saline Water per barrel of oil 0.9 1.0 1.2 1.2 1.2 1.4 1.4 1.2 1.3 1.3 1.3 1.4
Produced Water Recylce (m3/day) 13020 12249 14212 13521 13668 12649 12463 15223 13814 13244 12701 12982
Recycle Rates 87.6% 85.2% 85.1% 84.5% 84.2% 86.0% 87.8% 86.0% 85.7% 86.4% 86.2% 85.9%
Oil Produced (bbl/day) 44,789 44,239 44,883 45,986 44,736 39,581 39,911 45,753 45,284 42,651 41,108 41,314

CNQSlide 92
Pelican Lake Water InformationPelican Lake Water Information
Pelican Lake Water Information
2007 2008 2009 2010 2011 2012 2013 2014 2015 2016 2017 2018Non-Saline Water (m3/day) - Grand Rapids 542 813 1,417 1,874 2,200 2,612 3,103 3,753 2,955 1,567 1,562 2,745
Brackish Water (m3/day) - Grossmont 13,904 10,324 7,835 6,049 3,482 6,586 8,823 11,407 6,095 2,815 1,954 305
Total Source Water (m3/day) 14,446 11,137 9,252 7,923 5,682 9,198 11,926 15,160 9,050 4,382 3,516 3,050
Total Source Water per barrel of oil 3.1 2.5 2.3 2.2 1.7 2.6 3.1 3.8 2.3 1.3 1.1 1.0
Brackish Water per barrel of oil 3.0 2.4 2.0 1.6 1.1 1.8 2.3 2.9 1.6 0.8 0.6 0.1
Non-Saline Water per barrel of oil 0.1 0.2 0.4 0.5 0.7 0.7 0.8 0.9 0.8 0.5 0.5 0.9
Produced Water Recycle (m3/day) 8,861 13,182 13,179 11,660 10,093 11,474 11,662 13,024 12,003 10,167 9,394 10,832
Recycle Rates 70.9% 85.1% 85.1% 91.6% 96.5% 94.4% 94.6% 96.6% 97.1% 96.6% 96.5% 97.4%
Oil Produced (bbl/day) 29,319 27,540 24,882 23,096 20,428 22,600 24,255 24,934 24,411 21,171 19,967 19,855
Pelican Lake Water Information 2018 Monthly
Jan Feb Mar Apr May Jun Jul Aug Sep Oct Nov DecNon-Saline Water (m3/day) - Grand Rapids 2,592 2,646 2,819 2,971 2,841 2,815 2,523 2,332 2,697 3,041 2,676 2,989
Brackish Water (m3/day) - Grossmont 0 0 0 305 592 40 50 51 733 518 496 862
Total Makeup Water (m3/day) 2,592 2,646 2,819 3,276 3,433 2,855 2,572 2,383 3,430 3,559 3,172 3,851
Total Makeup Water per barrel of oil 0.9 0.9 1.0 1.1 1.1 0.8 0.7 0.8 1.2 1.1 0.9 1.2
Brackish Water per barrel of oil 0.0 0.0 0.0 0.1 0.2 0.0 0.0 0.0 0.3 0.2 0.1 0.3
Non-Saline Water per barrel of oil 0.9 0.9 1.0 1.0 0.9 0.8 0.7 0.8 0.9 0.9 0.8 0.9
Produced Water Recylce (m3/day) 9033 10157 10499 10368 10605 11288 12290 10741 10364 11163 11153 11026
Recycle Rates 98.4% 98.0% 98.2% 98.0% 98.2% 93.7% 94.9% 97.4% 97.8% 98.0% 98.0% 98.7%
Oil Produced (bbl/day) 18,729 18,209 18,507 18,656 19,205 23,462 22,650 18,220 18,120 20,503 21,256 20,630
CNQSlide 93
Brintnell/Pelican Lake Water Management PlanBrintnell/Pelican Lake Water Management Plan
• Striving to improve field performance by increasing throughput through
injectivity improvements
• Optimize polymer loading with the use of existing non-saline water
volumes
• Additional water treatment processes previously piloted but not
implemented – economics and operating limitations posed challenges
� Disc Stack Centrifuge Pilot Nov 2016 – April 2017
• Additional Grosmont Source/Disposal options are being investigated as
we plan the long-term water sourcing options.
� 2017 Approval for additional disposal at 1F1/13-28 which was converted
from Grosmont source to disposal.

CNQSlide 94
Water and Oilfield Disposal MapWater and Oilfield Disposal Map

CNQSlide 95
CNRL Brintnell Disposal WellsCNRL Brintnell Disposal Wells

CNQSlide 96
CNRL Brintnell Disposal WellsCNRL Brintnell Disposal Wells

CNQSlide 97
CNRL Pelican Lake Disposal WellsCNRL Pelican Lake Disposal Wells

CNQSlide 98
Brintnell Disposal Well DataBrintnell Disposal Well Data
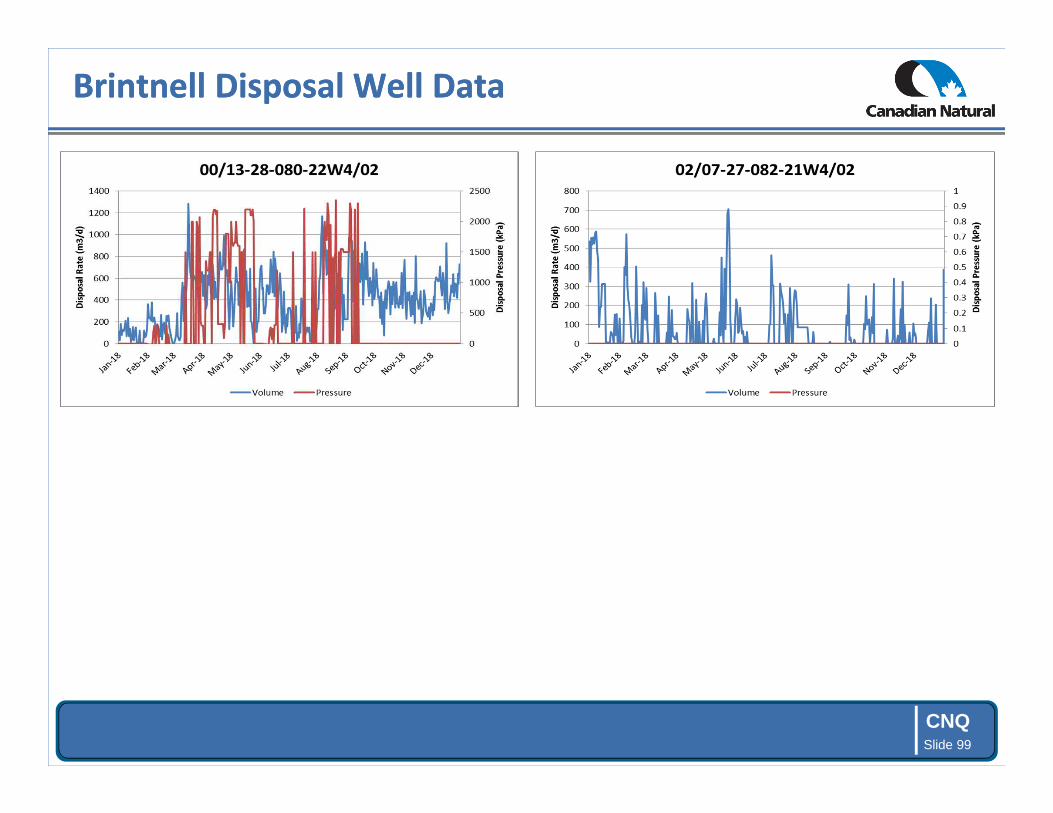
CNQSlide 99
Brintnell Disposal Well DataBrintnell Disposal Well Data

CNQSlide 100
Pelican Lake Disposal Well DataPelican Lake Disposal Well Data

CNQSlide 101
AER ComplianceAER Compliance

CNQSlide 102
Hydrogen SulphideHydrogen Sulphide
• Souring of production to occur over time, Engineering and Construction,
has and will continue to ensure compliance across the entire Field to
handle sour production (<1% H2S).
• H2S produced at padsites and batteries is expected to be in low
concentration and volume.
• CNRL collects solution gas at batteries and wellsites in a common
solution gas gathering system.
• Gas to be sweetened in field and at major facility sites (emulsion
batteries, compressor station).
CNQSlide 103
AER ComplianceAER Compliance
• CNRL continues to work with AER regarding injection well integrity:
� Formation/hydraulic isolation
� Cement bond
� Casing corrosion
• Process of upgrading existing wellsite facilities to meet current
regulations and codes for the expected service (higher WCT, higher TDS,
less than 1% H2S). Timeline to be completed over next 2-3 years
throughout field (existing facilities met regulations at time of original
construction).
� Priority on areas where we have seen corrosion through inspections, and
areas with high water cut

CNQSlide 104
Casing Failure RepairsCasing Failure Repairs
• 02/08-17-083-18W4/0 – May 2018. Failure in zone, stacked liner
• 02/04-06-083-18W4/0 – May 2018. Failure in zone, stacked liner
• 02/01-06-083-18W4/2 – May 2018. Casing patch
• 02/03-05-083-19W4/2 – May 2018. Failure in zone, stacked liner
• 03/02-05-083-19W4/0 – May 2018. Abandoned wellbore
• 02/01-05-083-19W4/0 – May 2018. Failure in zone, stacked liner
• 02/04-04-083-20W4/0 – June 2018. Failure in zone. To be re-drilled
• 03/04-03-083-20W4/0 – June 2018. Abandoned wellbore
• 03/01-01-083-20W4/0 – Nov 2018. Failure in zone. To be re-drilled
• CNRL will be evaluating additional candidates for either repair or redrill
with the focus on re-establishing consistent flood patterns.

CNQSlide 105
Casing Failure RepairsCasing Failure Repairs
• 02/01-06-083-18W4/2 – May 2018. Casing patch
� YES, 4m3 producer water (during pressure testing casing)
• 02/03-05-083-19W4/2 – May 2018. Failure in zone, stacked liner
� YES, 3m3, producer water (during pressure testing casing)
• 03/04-03-083-20W4/0 – June 2018. Abandoned wellbore
� NO
• Remainder of casing failure repairs were within zone

CNQSlide 106
AER ComplianceAER Compliance
Currently there are no serious SCVF/GM issues.
EPEA approval (1706-02-00)
In regards to the EPEA approval 1706-02-00 CNRL recognizes that our
internal processes did not catch the expiry until it was past due. Internal
processes have been adjusted to flag this type of approval more
prominently in our system to ensure there will not be any future issues. A
renewal application is almost complete and will be submitted to the AER
for review within the next 2 weeks.

CNQSlide 107
Observation WellsObservation Wells
Wabiskaw
• Primary source of reservoir pressure data is from injector fall-off analysis collected using
SCADA
• 17 observation wells in Approval 9404 connected to Scada
• 2 wells in legacy area: AA/14-10-081-22W4, 00/15-04-082-23W4
Grand Rapids/Quaternary
Legacy area non-saline water monitoring: Approval 9404 area has 46
observation wells in the
Grand Rapids
No indications of cap rock breach in 2018 from observation wells
OBS 06-05 WSW 1F1/06-05 (06-05-080-21 W4M)
OBS 09-18 Q1 WSW 1F2/09-18 (09-18-080-22 W4M)
OBS 09-18 Q2 WSW 1F3/09-18 (09-18-080-22 W4M)

CNQSlide 108
Outstanding ApplicationsOutstanding Applications

CNQSlide 109
ConclusionConclusion
• Canadian Natural continues to be committed to maximizing the value of the
resource for the both the Province of Alberta through it’s Royalty Interest and
itself.
� 2018 – Stable production in low commodity price environment
• Results from the polymer flood continue to be encouraging
� Continuing to evaluate the impacts of oil viscosity and water production on the
ultimate performance and recovery under polymer flooding
• CNRL continues to optimize the operation of the flood and expand to new, more
challenging areas
� Injection management is a balance of OPEX, power consumption and flood
management
• CNRL is working on an injection plan to maximize field throughput and thus
ultimate recovery of the field. Several options are being investigated over the
next several years.
• Compliance with all AER regulations, including cap rock integrity monitoring,
and communication with the AER remains a top priority for CNRL.

Premium Value Defined Growth Independent
THE FUTURE CLEARLY DEFINED