Embed Size (px)
Citation preview

Newcastle Town Hall 2pm, 28 October 2008
ANNUAL GENERAL MEETING
KEITH LYNCHCHAIRMAN

Mark Fitzgibbon, Managing Director & Chief Executive Officer
Harold Bentley, Non-Executive Director
Dr Annette Carruthers, Non-Executive Director
Philip Gardner, Non-Executive Director
Brian Keane, Non-Executive Director
Michelle McPherson, Chief Financial Officer & Company Secretary
3
INTRODUCTION DIRECTORS & EXECUTIVES

4
MEETING SCHEDULE Chairman’s Address
CEO’s Address
Notice of Meeting
Item 1: Consideration of Reports
Resolutions and Voting
Item 2: Remuneration Report
Item 3: Re-election of Directors – Harold Bentley and Brian Keane
Item 4: Appointment of Auditor – PricewaterhouseCoopers
Item 5: Approval of participation in Long Term Incentive Plan
Close of Meeting

5
YEAR IN REVIEW Demutualisation and ASX Listing
• Overwhelming support from policyholders (95%) to demutualise and list on ASX
• nib successfully listed on the ASX on 5 November 2007
• Policyholders crystallized their value in the company in the form of cash or shares
nib Board is very satisfied with nib’s FY2008 performance
• Exceeded Prospectus forecast in respect of underwriting margin and policyholder growth
• Despite challenging economic conditions and Medicare Levy Surcharge (MLS)

6
YEAR IN REVIEW (cont)
nib Board declared a fully franked dividend of 2.1 cents per share in respect of the FY2008 results
• Distributed to shareholders on 10 October 2008
• Equates to a payout ratio of 40.7% of normalised profits
Established nib foundation

7
nib foundation ESTABLISHED
nib donated $25 million to establish nib foundation in June 2008as part of demutualisation
Prime Minister, Kevin Rudd announced the first nib foundation beneficiary on 19 October 2008
• $100,000 donated to The Black Dog Institute to aid mood disorder research and programs in the Hunter region
nib foundation will call for funding submissions in November 2008
It is anticipated that the foundation will allocate around $2 million annually to support health and wellbeing programs, with a particular emphasis on the Hunter region
8
FOCUS FOR THE BUSINESSGOING FORWARD
Creating shareholder value by
• Business growth and development
• Accountability and risk management
• Capital management
• Good corporate citizenship
9
UNSOLICITED BID FOR nib
Confidential, unsolicited, non-binding and incomplete proposal for a third party to acquire a controlling stake in nib and establish a strategic alliance
A$1.15 – A$1.20 per nib share subject to due diligence
Board believes the proposal undervalues nib, given our robust growth prospects and having regard for comparable recent industry transactions
As a result, the Board rejected the proposal
MARK FITZGIBBONMANAGING DIRECTOR & CEO

1111
OUR MISSION
OUR BUSINESS STRATEGY Grow the market and nib market share
Target < 40’s market
Build national brand presence
Align brand, products, price and distribution
Pursue M&A
Develop new products and business opportunities
Business modernisation
nib’s mission is to shape the future of private healthcare funding in a way that increases
participation, enhances health outcomes and creates enterprise value.
12
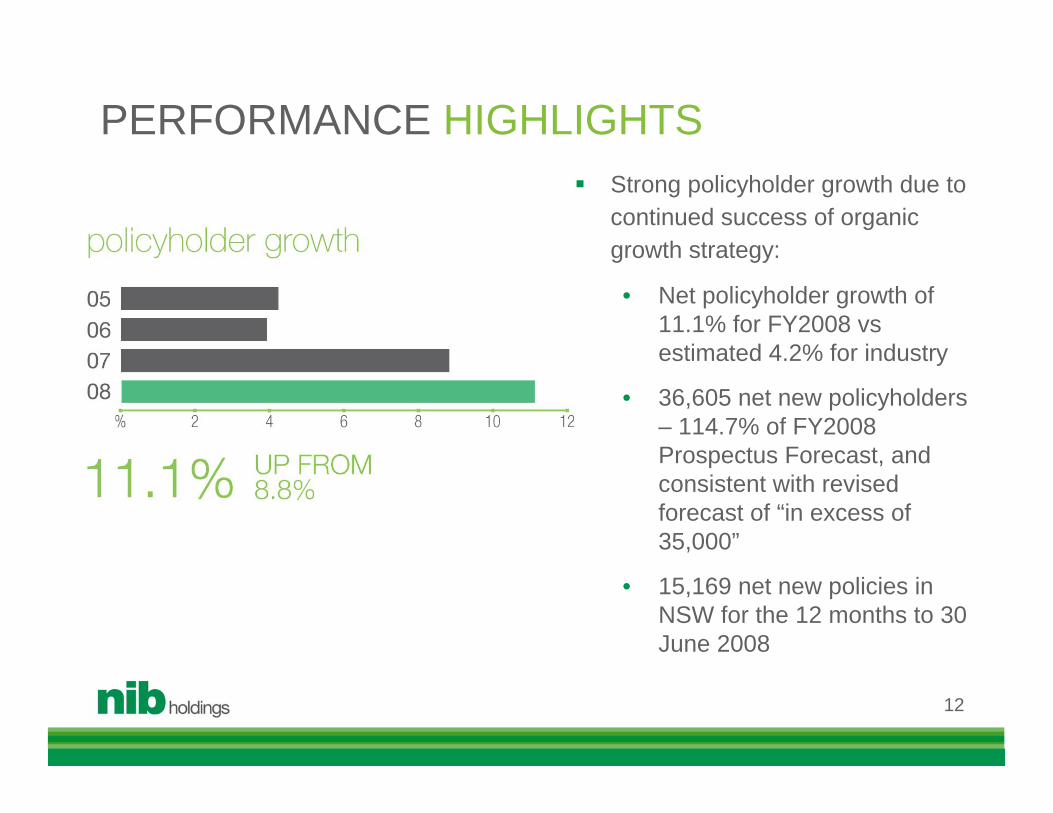
Strong policyholder growth due to continued success of organic growth strategy:
• Net policyholder growth of 11.1% for FY2008 vs estimated 4.2% for industry
• 36,605 net new policyholders – 114.7% of FY2008 Prospectus Forecast, and consistent with revised forecast of “in excess of 35,000”
• 15,169 net new policies in NSW for the 12 months to 30 June 2008
PERFORMANCE HIGHLIGHTS

13
With estimated market share of 7%1, nib accounted for an estimated 17.3% of national growth in FY2008
With estimated market share of 9.5%1 in 20-39 age group, nib accounted for estimated 20.1% of national growth
010,00020,00030,00040,00050,00060,00070,000
Medibank MBF BUPA HCF HBF nib
(1) Figures for FY08 have been estimated by nib
PERFORMANCE HIGHLIGHTS

PERFORMANCE HIGHLIGHTSTHE RIGHT KIND OF GROWTH
FY05 FY06 FY07 FY08
FY08 Prospectus
ForecastAnnualised growth in net membership
4.2% 3.9% 8.8% 11.1% 9.7%
% of new sales new to category 68.7% 70.8% 74.4% 73.2% n/a
% of new sales “under 40” 71.7% 73.6% 78.5% 78.8% n/a
% of new sales online 4.2% 13.6% 32.5% 35.1% 35.8%% of new sales outside NSW/ACT 19.1% 23.4% 32.3% 37.5% 41.1%
14
Since the launch of our new product portfolio in June 2006, we have added 63,090 net new policyholders, accounting for an estimated 15.3% of industry growth
15
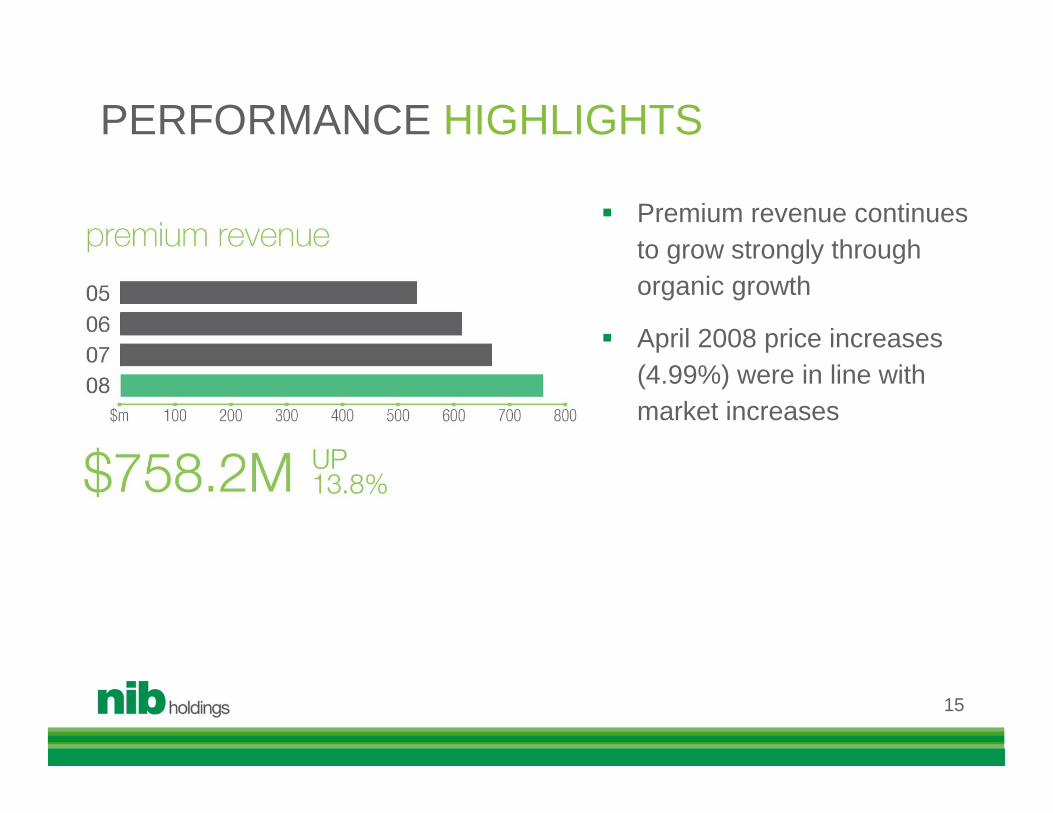
Premium revenue continues to grow strongly through organic growth
April 2008 price increases (4.99%) were in line with market increases
PERFORMANCE HIGHLIGHTS
16
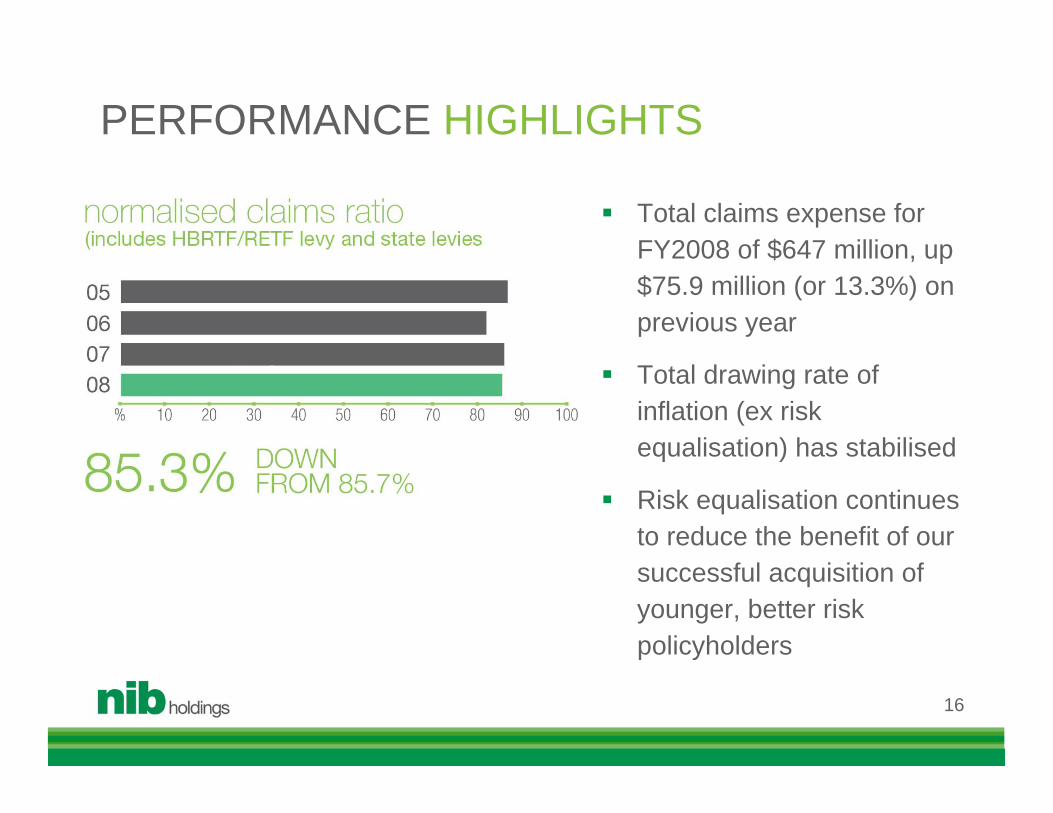
Total claims expense for FY2008 of $647 million, up $75.9 million (or 13.3%) on previous year
Total drawing rate of inflation (ex risk equalisation) has stabilised
Risk equalisation continues to reduce the benefit of our successful acquisition of younger, better risk policyholders
PERFORMANCE HIGHLIGHTS
17
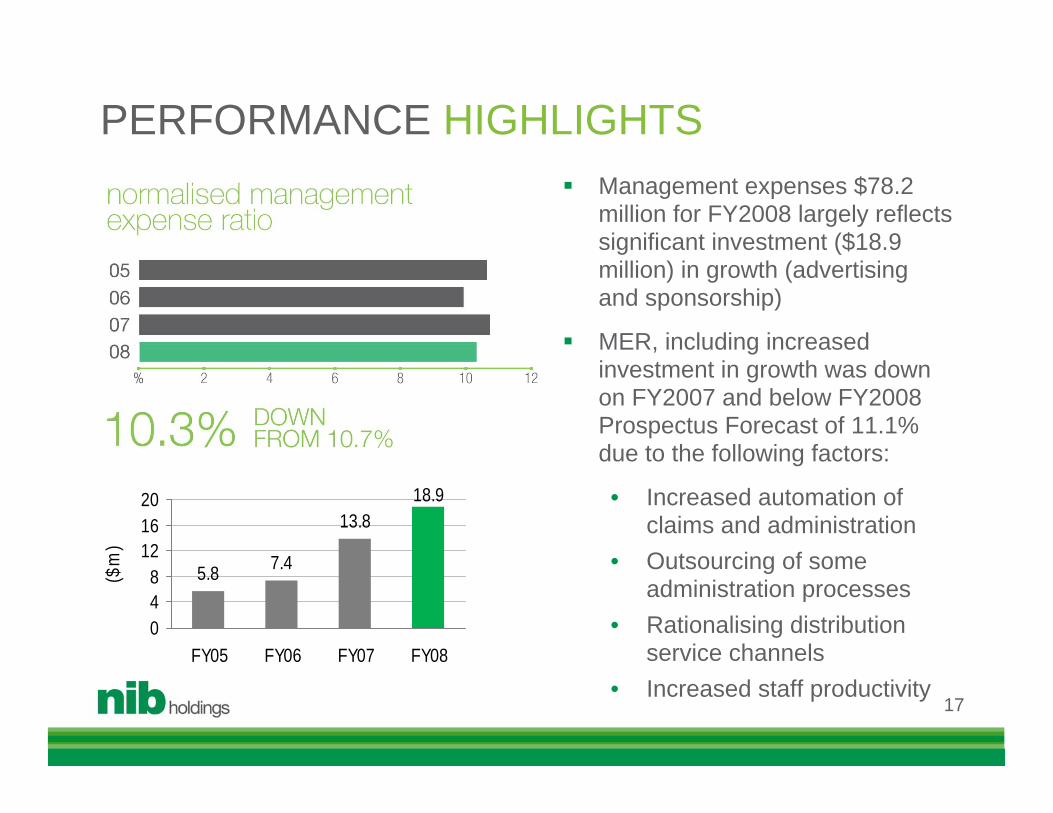
Management expenses $78.2 million for FY2008 largely reflects significant investment ($18.9 million) in growth (advertising and sponsorship)
MER, including increased investment in growth was down on FY2007 and below FY2008 Prospectus Forecast of 11.1% due to the following factors:
• Increased automation of claims and administration
• Outsourcing of some administration processes
• Rationalising distribution service channels
• Increased staff productivity
PERFORMANCE HIGHLIGHTS
5.8 7.4
13.818.9
048
121620
FY05 FY06 FY07 FY08
($m
)
18
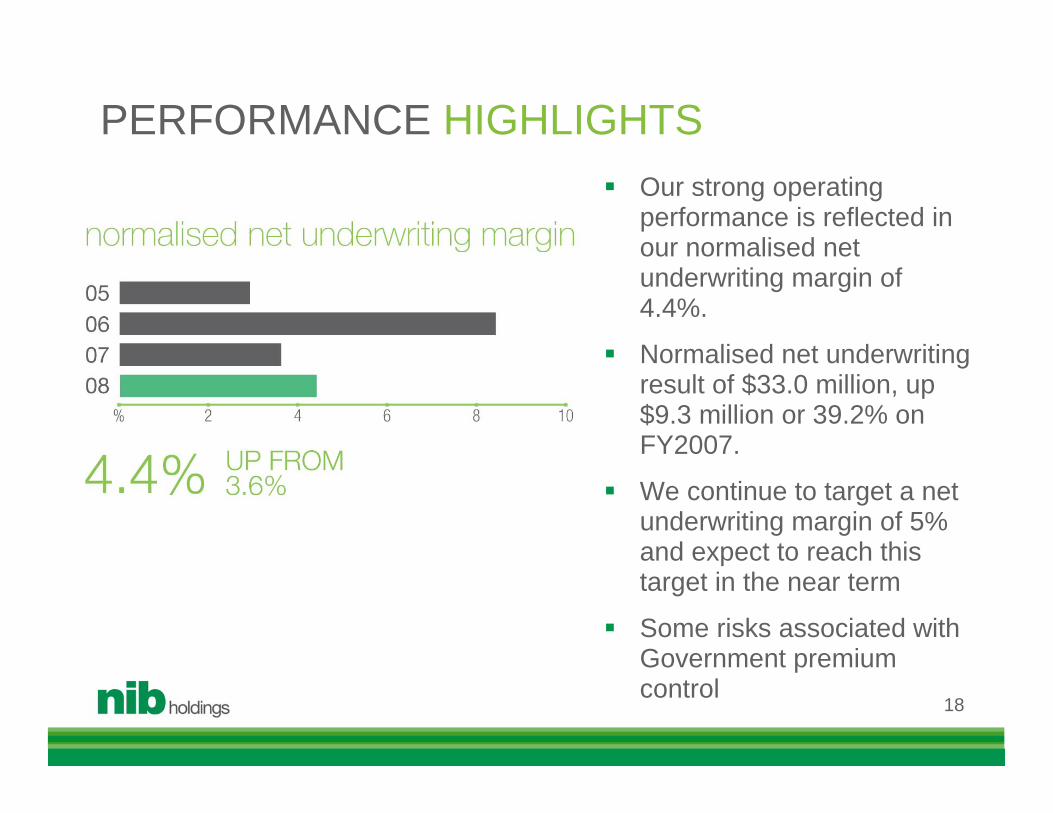
Our strong operating performance is reflected in our normalised net underwriting margin of 4.4%.
Normalised net underwriting result of $33.0 million, up $9.3 million or 39.2% on FY2007.
We continue to target a net underwriting margin of 5% and expect to reach this target in the near term
Some risks associated with Government premium control
PERFORMANCE HIGHLIGHTS

19
Volatile investment markets have resulted in low net investment earnings for the full year of $7.5 million, down from $31.3 million FY2007.
We are carefully moving our target investment asset allocation to reduce investment earnings volatility
Return on investment assets for the first three months of FY2009 was a loss of 1.1%.
PERFORMANCE HIGHLIGHTS

20
Normalised ROE of just 7% for the year driven by a combination of lower profitability as a result of volatile investment returns and a sub-optimal balance sheet
Capital management continues to be a significant priority
We continue to target a ROE of at least 15% and expect to reach this target in the near term
PERFORMANCE HIGHLIGHTS
Investment assets of $440.9 million at 30 September 2008 with a 74% defensive / 26% growth mix
We have a strong capital position:• Approximately $112 million in excess capital at 30 September
2008 above our internal target (1.5x), after allowing for $10.9 million dividend paid in October 2008.
• Ungeared balance sheet Strong balance sheet and capital position enables us to pursue attractive
acquisition opportunities as they arise and/or undertake capitalmanagement initiatives
In the absence of an acquisition, we envisage a return of capital in the near term
Given recent corporate activity, we are currently reviewing our Group capital management plan with a view to determining the most optimal capital structure
On-market share buy-back of up to 10% of issued shares Dividend of 2.1cps (40.7% payout ratio)
21
CAPITAL MANAGEMENT & INVESTMENT
During FY2008 we introduced a number of new product initiatives
• Products for single parent families
• Introduction of ancillary-only product – Just Extras
New products in pipeline are expected to be introduced during FY2009.
Launched a life insurance pilot in partnership with TOWER Australia targeting around 20,000 customers nationwide
Travel insurance continues to be an important product offer. Considerable opportunities to gain greater market share
Examining opportunities around Business to Government (B2G)
nib was awarded a CANNEX 5-Star rating Australia-wide in the package product category during FY2008
22
INNOVATION PRODUCT DEVELOPMENT
MARKET OUTLOOKMARKET FUNDAMENTALS ARE SOUND Government will remain supportive of PHI given increasing
dependency ratio
Claims inflation will be between 5%-10% (subject to MLS impact)
More rationale and certain premium setting policy likely to emerge
Industry growth post MLS could initially slow to 1%-3% given economic conditions, but supported by marketing and low confidence in public system
Further industry consolidation inevitable
Potential to increase share of healthcare spending wallet with product innovation – interest will build in next generation private healthcare funding products
23

MARKET OUTLOOK
24
Why the government must allow the private sector to play a greater role in healthcare funding…
MARKET OUTLOOKGROWTH POTENTIAL STILL SIGNIFICANT
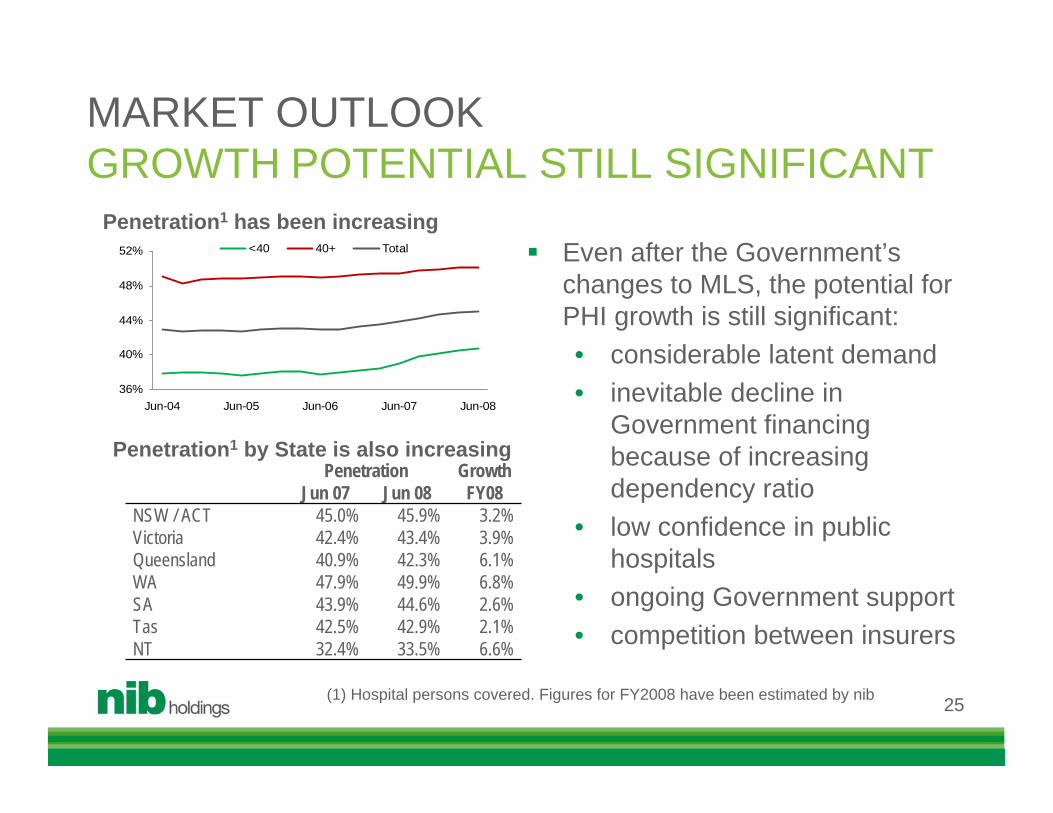
(1) Hospital persons covered. Figures for FY2008 have been estimated by nib
Penetration1 by State is also increasing
Penetration1 has been increasing
25
Penetration Growth Jun 07 Jun 08 FY08
NSW / ACT 45.0% 45.9% 3.2%Victoria 42.4% 43.4% 3.9%Queensland 40.9% 42.3% 6.1%WA 47.9% 49.9% 6.8%SA 43.9% 44.6% 2.6%Tas 42.5% 42.9% 2.1%NT 32.4% 33.5% 6.6%
Even after the Government’s changes to MLS, the potential for PHI growth is still significant: • considerable latent demand • inevitable decline in
Government financing because of increasing dependency ratio
• low confidence in public hospitals
• ongoing Government support• competition between insurers
36%
40%
44%
48%
52%
Jun-04 Jun-05 Jun-06 Jun-07 Jun-08
<40 40+ Total
Earnings and ROE
Continue to target 5% net underwriting margin
Increase market penetration and volume
Improve policy “buy up” through life stages
Create new revenue streams leveraging brand, customer base and distribution
Capital management (capital structure, dividend policy, surplus capital)
We continue to target a net underwriting margin of 5% and ROE of at least 15% and expect to reach these targets in the near term
26
WE HAVE A CLEAR VIEW OF WHAT WILLDRIVE EARNINGS
27
nib revised its FY2009 guidance on 17 October 2008 following Senate’s passing and subsequent legislation of the Medicare Levy Surcharge (MLS) Threshold Bill
nib’s updated guidance is based on income threshold limits being $70k for singles, $140k for couples/families
Net policyholder growth could be 4%
Normalised net underwriting margin in the order of 4%
FY2009 GUIDANCE

28
nib’s SHARE PRICE PERFORMANCE We believe that the current share price does not reflect the true value of
the organisation. P/E 9.9x – NTA 1.021.
Share price has been affected by macro economic factors and MLS issue. Priority within the business is to grow the share price to fair value through focus upon business performance, risk management and capital management
0.30
0.50
0.70
0.90
1.10
1.30
1.50
1.70
Nov-07 Dec-07 Jan-08 Feb-08 Mar-08 Apr-08 May-08 Jun-08 Jul-08 Aug-08 Sep-08 Oct-08
nib ASX ALL ORDINARIES ASX SMALL ORDINARIES
Shar
e Pr
ice
(Inde
x)
(1) closing share price 27/10/08, broker consensus 2009 forecast NPAT and NTA at 30/6/2008