Embed Size (px)
Citation preview

annual 2014|15
For
per
sona
l use
onl
y

ABN 97 010 721 749
Cellnet Group Limited
59-61 Qantas Drive, Eagle Farm, QLD 4009 Australia
t: 1300 255 563 www.cellnet.com.au
For
per
sona
l use
onl
y

Cellnet Group Limited and its consolidated entities
annual report 2013|14 1
The 2015 financial year was, in essence,a turnaround year for the Cellnet Group offthe back of the losses incurred in 2014.
The consolidation of the number of brands represented and focus on those remaining market leading and emerging brands has been a key driver to improving both market penetration with our key customer base and confidence from our vendor partners. Increasing the breadth of the product offering and a focus on packaging and merchandising has created a strong platform for the continued success of our own brand - 3SIXT - which has increased in sales year on year.
Cellnet’s retail representation across Australia and New Zealand is strong and our products can be seen hanging in almost all leading retail stores. Our ability to service the CE Retail, Telco and Mass Merchant channel is at the forefront of the industry.
Aggressive management of inventory and our supply chain has resulted in reduced working capital requirements and ongoing cost benefits.
The depreciation of the $AUD over the year presented challenges but by way of working with our retail partners in end user pricing adjustments together with currency hedging, the negative effects have been largely mitigated.
Alan Sparks
CEOCellnet Group Limited
Message from the CEO
For
per
sona
l use
onl
y

Cellnet Group Limited and its consolidated entities
annual report 2013|142
For
per
sona
l use
onl
y

Cellnet Group Limited and its consolidated entities
Annual Report 2014|15 3
The next represents the excitement of new innovations and products - the exhilaration of discovery.
It’s what keeps Cellnet on the hunt for the latest and greatest gear in the smartphone, tablet and hybrid accessory market.
As with any journey, a knowledgeable guide is essential.
With our deep experience and relentless dedication to discovery, Cellnet leads you to the next innovation in the world of lifestyle technology products.
For
per
sona
l use
onl
y

Cellnet Group Limited and its consolidated entities
Annual Report 2014|154
Product development
ProfessionaliseChina kitting facility
OFF
ICES
Key initiatives
ProfessionaliseChina kitting facility
For
per
sona
l use
onl
y

Cellnet Group Limited and its consolidated entities
Annual Report 2014|15 5
INTE
RNATIONAL
SALES START U
P
Further stock reduction
S & OP and MRP
CATEGORY MANAGEMENT
approach
For
per
sona
l use
onl
y

Cellnet Group Limited and its consolidated entities
Annual Report 2014|156
This is where I continue to frolick, where I find the latest and greatest technology that the STH market has to offer through our own brands and through our innovative partners.
NEO’s playground
CASESSmartphone/Tablet/Hybrid
POWERWall/Car/Portable
CONNECTIVITYCharge & Sync/Data/Audio/Adaptors
SCREEN PROTECTIONClear/Glass/Privacy/Ultra Thin
For
per
sona
l use
onl
y

Cellnet Group Limited and its consolidated entities
Annual Report 2014|15 7
AUDIOHeadphones/Speakers/BlueTooth
VIDEO/GADGETSCameras/Toys
HEALTH/WELLNESSActivity Trackers/HRMs
HOME AUTOMATIONIP Cameras/Security/Safety
INPUT DEVICESKeyboards/Stylus’
MEMORYMicroSD/USB/SDHC/OTG/CF
For
per
sona
l use
onl
y

Cellnet Group Limited and its consolidated entities
annual report 2013|148
Cellnet prides itself on our long term partnerships with market leading brands providing accessories for consumer technology devices. We focus on products that protect, connect and enhance your interaction with your device be it for personal or professional use. Cellnet can take you from the beach with Lifeproof Cases, to school with Lexar USB drives or the office with our Zagg keyboards and everywhere in-between. Our brands are what makes Cellnet different and we stand by the products we represent.
Iconic brands
For
per
sona
l use
onl
y

Cellnet Group Limited and its consolidated entities
Annual Report 2014|15 9
TM
For
per
sona
l use
onl
y

Cellnet Group Limited and its consolidated entities
Annual Report 2014|1510
When 3SIXT was launched in September 2014, our goal was to create a brand that makes technology accessories easy for consumers to understand. 3SIXT is now 12 months young and has sold in excess of a million products both in Australia, New Zealand and abroad. The sheer volume and momentum that continues to grow tells us that we are achieving our mission.
3SIXT The success story continues
For
per
sona
l use
onl
y

Cellnet Group Limited and its consolidated entities
Annual Report 2014|15 11
3SIXT is now seen on the shelves of nearly every Telco, CE Retailer and Mass Merchant in accessories from cables to action cameras. We hold true to our core business and we continue to expand our accessory range to cover the next big thing that technology manufacturers create. We are proud of the achievements 3SIXT has made but the job is not yet done. The 3SIXT team will continue to explore far and wide in the endless pursuit to discover the next.
For
per
sona
l use
onl
y

Cellnet Group Limited and its consolidated entities
Annual Report 2014|1512
Corporate information ................................................... 13
Directors’ report 14
Financial report 27
Statement of financial position .................................. 28
Statement of comprehensive income ..................... 29
Statement of changes in equity ................................. 30
Statement of cash flows ............................................... 31
Notes to the financial statements ............................. 32
1 Corporate information ..................................... 32
2 Significant accounting policies ...................... 32
3 Financial risk management objectives and policies ..................................... 41
4 Fair value measurement ................................... 44
5 Operating segments ......................................... 45
6 Other revenue .................................................... 45
7 Items included in profit/(loss) ......................... 45
8 Income tax........................................................... 46
9 Earnings per share ............................................. 48
10 Current assets – cash and cash equivalents .............................. 48
11 Current assets – trade and other receivables ............................ 48
12 Current assets – inventories ............................ 49
13 Non-current assets – property, plant and equipment ...................... 50
14 Non-current assets - intangibles ..................... 51
15 Current liabilities – trade and other payables .................................. 51
16 Provisions .............................................................. 51
17 Current liabilities – interest bearing loans and borrowings ......... 51
18 Derivative financial instruments ..................... 52
19 Contributed equity and reserves ................... 52
20 Share based payments ..................................... 53
21 Commitments and contingencies ................ 56
22 Financial guarantees ......................................... 56
23 Related party disclosure ................................... 57
24 Key management personnel .......................... 58
25 Subsequent events ............................................ 58
26 Parent entity information ................................. 58
27 Auditors’ remuneration ..................................... 58
28 Dividend franking account .............................. 58
29 Cash flow statement reconciliation .............. 59
Directors’ declaration ................................................... 60
Independent auditors’ report ..................................... 61
ASX Additional Information ......................................... 63
contents
For
per
sona
l use
onl
y

Cellnet Group Limited and its consolidated entities
Annual Report 2014|15 13
Directors’ Report
Corporate Information
Directors
A. Beard (Chairman)
M. Brookman
E. Kaplan
Company Secretary
C. Barnes
Principal Registered Office
Cellnet Group Limited
59-61 Qantas Drive
Eagle Farm QLD 4009
Phone: 1300 255 563
Fax: 1800 255 563
Banker
Westpac Banking Corporation
260 Queen Street
Brisbane QLD 4000
Auditor
Pitcher Partners
345 Queens Street
Brisbane QLD 4000
Share Register
Link Market Services Ltd
Level 15 ANZ Building
324 Queen Street, Brisbane QLD 4000
Phone: 1300 554 474
Solicitors
Thomson Geer
Level 16 Waterford Place
1 Eagle Street, Brisbane QLD 4000
Securities Exchange
The Company is listed on the Australian
Securities Exchange. The Home
exchange is Brisbane.
Corporate Governance
All corporate governance related matters and associated disclosures regarding the company,
including the company’s corporate governance statement, can be found on the company’s website
in the investor relations section at: http://www.cellnet.com.au/investorrelations/
For
per
sona
l use
onl
y

Cellnet Group Limited and its consolidated entities
Annual Report 2014|1514
Your Directors submit their report for the year ended 30 June 2015.
Directors
The names and details of the Company’s Directors in office during the financial year and until the date of this report are as follows. Directors were in office for this entire period unless otherwise stated.
Names, qualifications, experience and special responsibilities
Alexander Beard B.Com, MAICD, FCA(Non-Executive Chairman – appointed Director 15 December 2006 and Chairman 20 August 2007)
Mr Beard is a Chartered Accountant and an experienced financier of growth companies as well as having gained considerable industry experience through his investee board roles. He is a fellow of the Institute of Chartered Accountants and a member of the Institute of Company Directors.
Mr Beard is Executive Director of CVC Limited (ASX:CVC) and Executive Director of CVC Private Equity Limited. Mr Beard is currently a member of the Audit and Risk Management and Remuneration Committees.
During the past three years Mr Beard has also served as Chairman and Non-Executive Director of Villa World and Director of the following listed companies: Mnemon Limited (formerly Mnet Group Limited) (ASX:MNZ), CVC Property Fund (ASX:CJT) and Lonestar Resources Limited (formerly Amadeus Energy Limited).
Mel Brookman (Non-Executive Director – appointed 4 June 1992)
Mr Brookman was a co-founder of Cellnet in 1992. He has over 20 years’ experience in mobile phone and distribution industries. He was previously the Managing Director of the Company from 1999 to November 2002, and is presently chair of the Remuneration Committee and a member of the Audit and Risk Management Committee. Mr Brookman acted as an Executive Director from the 25 July 2012 to 7 May 2014. At all other times during the 2014 and 2015 financial years he was appointed in the capacity of a non-executive Director.
Elliott Kaplan B. Acc, CA(Non-Executive Director – appointed 25 July 2012)
Mr Kaplan is a Chartered Accountant with extensive experience in senior financial and chief executive officer roles in both private and public listed companies. His experience, from both an investor and investee perspective, spans a diverse range of industries and businesses in the manufacturing, environmental, distribution and services sectors.
Mr Kaplan is the managing director of CVC Private Equity Limited. He has previously held non-executive director and chairman roles in a number of ASX listed companies and is currently a non-executive director of ASX listed Pro-Pac Packaging Limited. Mr Kaplan is currently the chair of the Audit and Risk Management Committee and member of the Remuneration Committees.
During the past three years, Mr Kaplan also served as Non-Executive Director of Mnemon Limited (formerly Mnet Group Limited) (ASX:MNZ) and Non-Executive Director of Dolomatrix Limited (ASX:DMX).
As at the date of this report, the interest of the directors (including their related parties) in the shares and options of Cellnet Group Limited were:
DirectorNumber of ordinary shares
Number of restricted shares
Number of options
A. Beard - - 1,200,000
M. Brookman 1,851,943 - -
E. Kaplan - - 1,200,000
Company Secretary
Chris Barnes B. Acc, CPA(Company Secretary and Chief Financial Officer – appointed 9 March 2011)
Mr Barnes has been with the Company since 2006. He holds a Bachelor of Accounting Degree and is CPA qualified.
Dividends
No dividends were declared and paid in the current year.
Directors’ Report
For
per
sona
l use
onl
y

Cellnet Group Limited and its consolidated entities
Annual Report 2014|15 15
Directors’ Report
Principal activities
The principal activities of the consolidated entity are:
Sourcing products and the distribution of market leading brands of lifestyle technology products including mobile phone, tablet and notebook/hybrid accessories into retail and business channels in Australia and New Zealand.
Fulfillment services to the mobile telecommunications and retail industries in Australia and New Zealand.
Operating and financial review
Cellnet is pleased to announce an after tax profit of $1.6m (3.0. cents per share) for the year ended June 30, continuing the pleasing turnaround in profitability.
Despite difficult trading conditions and the adverse margin impacts from the material downward movement in the A$/US$ exchange rate during the financial year, cost reduction and containment strategies coupled with stronger focus on working capital employed has enabled the Company to record a much improved result. While revenue decreased by 4.8%, predominantly as a result of a refocusing and consolidation of brands, EBITDA of $2.4m and after tax profit of $1.6m was significantly higher.
With an improved balance sheet and having benefited from a number of initiatives to reduce supply chain costs and improve margins, the Company is now well placed to evaluate and potentially execute a number of organic and acquisitive growth opportunities, and is optimistic of a further improvement in operating performance in the 2016 financial year.
In recognition of the improved performance the Company has reinstated the payment ofdividends with a fully franked finaldividend of one cent per share.
Significant changes in the state of affairs
There have been no significant changes in the state of affairs of the company during the current year.
Significant events after balance date
There have been no matters or circumstances that have arisen since the end of the financial year which have significantly affected or may significantly affect the operations of Cellnet Group Limited, the results of those operations, or the state of affairs of Cellnet Group Limited in future years.
Likely developments
In respect of future strategy and future performance, the consolidated entity is constantly reviewing the strategic value inherent in the business. In conjunction with this, the consolidated entity will continue to pursue its trading activities to further improve on operational aspects to produce the most beneficial long term results for the shareholders of the Company.
Share options
At the date of this report there were a total of 2,400,000 vested and exercisable share options and 3,300,000 unvested performance rights over ordinary shares in the company on issue. Ordinary shares issued under performance rights are to be held in escrow until 30 June 2017. No option or right holder has any rights under the terms of the instruments to participate in any other share issue of the company or any other entity. Details of these instruments are outlined as follows:
Options
Grant Date Vest Date Expiry DateExercise Price ($)
Opening Lapsed Granted Closing
21/10/2011 21/10/2013 21/10/2014 0.45 1,200,000 (1,200,000) - -
24/10/2014 24/10/2014 31/10/2017 0.25 - - 2,400,000 2,400,000
Performance rights
Grant Date Vest Date Expiry Date* Exercise Price ($)
Opening Lapsed Granted Closing
3/2/2015 30/6/2015 30/9/2017 - - - 366,666 366,666
3/2/2015 30/6/2016 30/9/2017 - - - 366,667 366,667
3/2/2015 30/6/2017 30/9/2017 - - - 366,667 366,667
3/2/2015 30/6/2017 30/9/2017 - - - 2,200,000 2,200,000
* Vested performance rights will expire on the date which is 30 business days subsequent to the release of 30 June 2017 results to market.
For
per
sona
l use
onl
y
Cellnet Group Limited and its consolidated entities
Annual Report 2014|1516
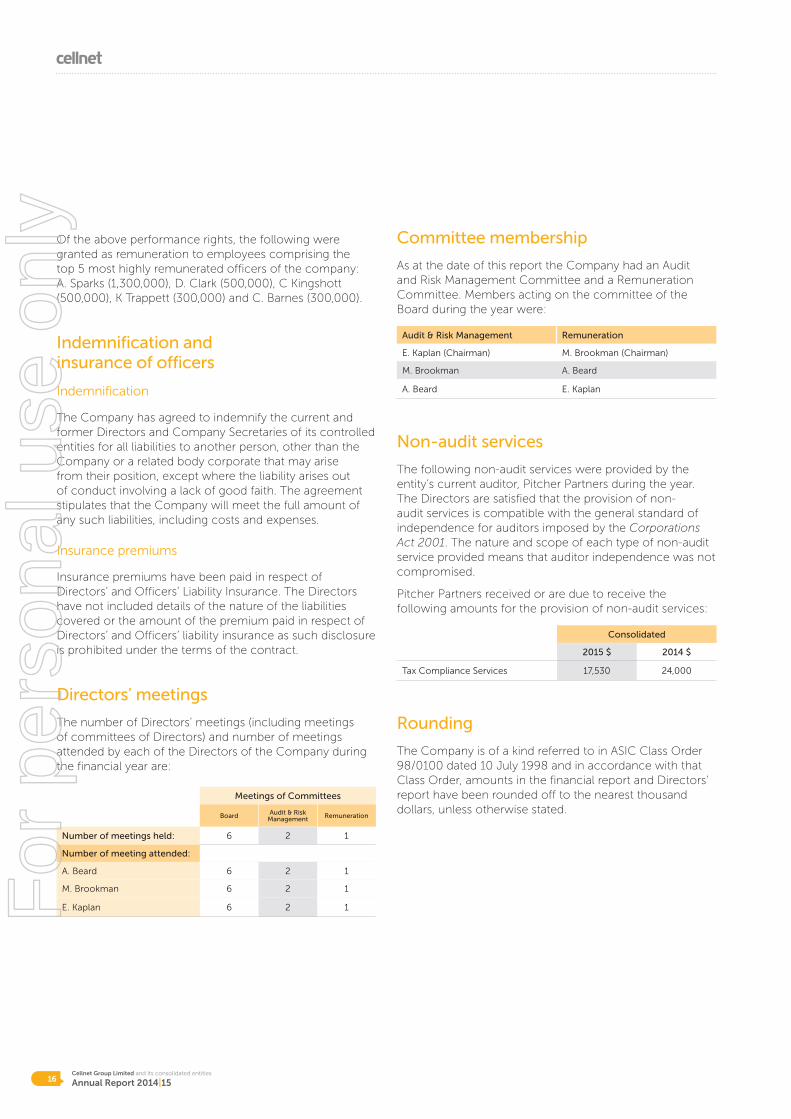
Of the above performance rights, the following were granted as remuneration to employees comprising the top 5 most highly remunerated officers of the company: A. Sparks (1,300,000), D. Clark (500,000), C Kingshott(500,000), K Trappett (300,000) and C. Barnes (300,000).
Indemnification and insurance of officers
Indemnification
The Company has agreed to indemnify the current and former Directors and Company Secretaries of its controlled entities for all liabilities to another person, other than the Company or a related body corporate that may arise from their position, except where the liability arises out of conduct involving a lack of good faith. The agreement stipulates that the Company will meet the full amount of any such liabilities, including costs and expenses.
Insurance premiums
Insurance premiums have been paid in respect of Directors’ and Officers’ Liability Insurance. The Directors have not included details of the nature of the liabilities covered or the amount of the premium paid in respect of Directors’ and Officers’ liability insurance as such disclosure is prohibited under the terms of the contract.
Directors’ meetings
The number of Directors’ meetings (including meetings of committees of Directors) and number of meetings attended by each of the Directors of the Company during the financial year are:
Meetings of Committees
Board Audit & Risk Management Remuneration
Number of meetings held: 6 2 1
Number of meeting attended:
A. Beard 6 2 1
M. Brookman 6 2 1
E. Kaplan 6 2 1
Committee membership
As at the date of this report the Company had an Audit and Risk Management Committee and a Remuneration Committee. Members acting on the committee of the Board during the year were:
Audit & Risk Management Remuneration
E. Kaplan (Chairman) M. Brookman (Chairman)
M. Brookman A. Beard
A. Beard E. Kaplan
Non-audit services
The following non-audit services were provided by the entity’s current auditor, Pitcher Partners during the year. The Directors are satisfied that the provision of non-audit services is compatible with the general standard of independence for auditors imposed by the Corporations Act 2001. The nature and scope of each type of non-audit service provided means that auditor independence was not compromised.
Pitcher Partners received or are due to receive the following amounts for the provision of non-audit services:
Consolidated
2015 $ 2014 $
Tax Compliance Services 17,530 24,000
Rounding
The Company is of a kind referred to in ASIC Class Order 98/0100 dated 10 July 1998 and in accordance with that Class Order, amounts in the financial report and Directors’ report have been rounded off to the nearest thousand dollars, unless otherwise stated.
For
per
sona
l use
onl
y

Cellnet Group Limited and its consolidated entities
Annual Report 2014|15 17
Directors’ Report
Auditor’s independence declaration
The Auditor’s independence declaration is set out on page 18 and forms part of the Directors’ report for the financial year ended 30 June 2015.
For
per
sona
l use
onl
y

Cellnet Group Limited and its consolidated entities
Annual Report 2014|1518
Auditor’s independence declaration
The Directors
Cellnet Group Limited
59-61 Qantas Drive
EAGLE FARM QLD 4009
Auditor’s Independence Declaration
As lead auditor for the audit of Cellnet Group Limited for the year ended 30 June 2015, I declare that, to the
best of my knowledge and belief, there have been:
i. no contraventions of the auditor independence requirements as set out in the Corporations Act 2001 in
relation to the audit; and
ii. no contraventions of any applicable code of professional conduct in relation to the audit.
This declaration is in respect of Cellnet Group Limited and the entities it controlled during the period.
PITCHER PARTNERS
J J EVANS
Partner
Brisbane, Queensland
24 August 2015
For
per
sona
l use
onl
y

Cellnet Group Limited and its consolidated entities
Annual Report 2014|15 19
Directors’ Report
This remuneration report for the year ended 30 June 2015 outlines the remuneration arrangements of the consolidated entity in accordance with the requirements of the Corporations Act 2001 (the Act) and its regulations. This information has been audited as required by section 308 (3C) of the Act. The remuneration report details the remuneration arrangements for key management personnel (KMP) who are defined as those persons having authority and responsibility for planning, directing and controlling the major activities of the consolidated entity, directly or indirectly, including any director (whether executive or otherwise) of the parent.
Remuneration report approval at FY14 AGM
The FY14 remuneration report received positive shareholder support at the FY14 AGM with a vote of 99.7% in favour.
For the purposes of this report, the term “executive” includes the executive directors, senior executives, general managers and secretaries of the consolidated entity and the term “director” refers to non-executive directors only.
The remuneration report is presented under the following sections:
1. Individual key management personnel disclosures
2. Remuneration at a glance
3. Board oversight of remuneration
4. Non-executive director remuneration arrangements
5. Executive remuneration arrangements and the link to company performance
6. Executive contractual arrangements
7. Additional statutory disclosures
1. Individual key management personnel disclosures
Key management personnel
(i) Directors
A. Beard Chairman (Non-Executive)
M. Brookman Director (Non-Executive)
E. Kaplan Director (Non-Executive)
(ii) Executives
A. SparksChief Executive Officer (Appointed 7 May 2014)
C. BarnesChief Financial Officer and Company Secretary
D. Clark General Manager - New Zealand
2. Remuneration at a glance
Remuneration levels for key management personnel are competitively set to attract and retain appropriately qualified and experienced executives. The Board as necessary obtains independent advice on the appropriateness of remuneration packages of the consolidated entity given trends in comparative companies both locally and internationally and the objectives of the Company’s remuneration strategy.
Non-Executive Directors receive a fixed fee for their services.
The remuneration structures explained below are designed to attract suitably qualified candidates, reward the achievement of strategic objectives, and achieve the broader outcome of creation of value for shareholders. The remuneration structures take into account:
• the capability and experience of the key management personnel;
• the key management personnel’s ability to control performance;
• the consolidated entity’s performance including:
– the consolidated entity’s earnings; and
– the growth in share price and delivering of constant returns on shareholder wealth;
• the amount of incentives within each key management person’s remuneration.
Remuneration packages include a mix of fixed and variable remuneration including short and long-term performance-based incentives.
Remuneration Report (audited)
For
per
sona
l use
onl
y

Cellnet Group Limited and its consolidated entities
Annual Report 2014|1520
3. Board oversight of remuneration
Remuneration committee
The remuneration committee is responsible for making recommendations to the board on the remuneration arrangements of directors and executives.
The remuneration committee assesses the appropriateness of the nature and amount of remuneration of non-executive directors and executives on a periodic basis by reference to the relevant employment market conditions, with the overall objective of ensuring maximum stakeholder benefit from the retention of a high performing director and executive team.
Remuneration strategy
Cellnet Group Limited’s remuneration strategy is designed to attract, motivate and retain employees and non-executive directors by identifying and rewarding high performers and recognising the contribution of each employee to the continued growth and success of the consolidated entity.
To this end, key objectives of the Company’s reward framework are to ensure that remuneration practices:
• are aligned to the consolidated entity’s business strategy;
• offer competitive remuneration benchmarked againstthe external market;
• provides strong linkage between the individual and theperformance and rewards of the consolidated entity.
Remuneration structure
In accordance with best practice corporate governance, the structure of non-executive director and executive remuneration is separate and distinct.
4. Non-executive director remuneration arrangements
Total remuneration for all Non-Executive Directors, last voted upon by shareholders at the 1999 AGM, is not to exceed $300,000 per annum.
The Chairman’s base fee is $54,500 per annum and Non-Executive Directors’ base fees are presently $50,000 per annum. Non-Executive Directors do not receive performance related remuneration. Non-executives may, at the discretion of the Remuneration Committee and subject to shareholder approval, receive compensation in the form of share options.
The following options were issued to Non-Executive Directors during the year as part of their remuneration:
Director Grant Date No. GrantedGrant Date
Fair Value ($)Exercise Price ($)
No. Forfeited
No. Vested % Vested
A. Beard 24/10/2014 1,200,000 0.03 0.25 - 1,200,000 100%
E. Kaplan 24/10/2014 1,200,000 0.03 0.25 - 1,200,000 100%
There are no vesting conditions attached to the options. Options are exercisable at any time from the grant date to the expiry date, being 31 October 2017.
5. Executive remuneration arrangements and the link tocompany performance
5.1 Fixed remuneration
Fixed remuneration consists of base remuneration (which is calculated on a total cost basis and includes any fringe benefits tax charges related to employee benefits including motor vehicles) as well as employer contributions to superannuation funds. Remuneration levels are reviewed annually by the Board.
5.2 Variable remuneration – short term incentive (STI) and long term incentive (LTI)
Performance linked remuneration includes both STI and LTI and is designed to reward key management personnel for meeting or exceeding their financial and personal objectives. The STI is an ‘at risk’ bonus provided in the form of cash.
5.3 STI bonus
The consolidated entity operates an annual STI program that applies to executives and awards a cash bonus subject to the attainment of clearly defined consolidated entity, business unit and individual measures. Actual STI payments awarded to each executive depends on the extent to which specific targets set at the beginning of each six months are met. The targets consist of a number of key performance indicators (KPIs) covering financial and non-financial, corporate and individual measures of performance. A summary of these measures and weightings are set out below.
Net Cash Position EBITDA
Chief Executive Officer 50% 50%
General Manager New Zealand 50% 50%
Chief Financial Officer 50% 50%
Remuneration Report (audited) continued
For
per
sona
l use
onl
y

Cellnet Group Limited and its consolidated entities
annual report 2013|14 21
Directors’ Report
These performance indicators were chosen as they represent the key drivers for the short term success of the business and provide a framework for delivering long-term value.
On an annual basis, after consideration of performance against KPI’s the Chief Executive Officer, in line with his responsibilities, determines the amount, if any, of the short term incentive to be paid to each KMP. On an annual basis, after consideration of the KPI’s, the board will determine the amount, if any, of the short term incentive to be paid to the Chief Executive Officer.
At the end of the financial year the Board assesses the actual performance of the consolidated entity and individual against the KPI’s set at the beginning of the financial year. A percentage of the pre-determined maximum amount is awarded depending on results, between 0% and 100% for reaching target performance for non-financial objectives, and uncapped beyond 100% in respect of financial performance objectives. No bonus is awarded where performance falls below the minimum. The following table outlines the proportion of maximum STI that was earned and forfeited in relation to the 2015 financial year.
Proportion of maximum STI earned in FY15
Proportion of maximum STI forfeited in FY15
A. Sparks 100% NIL
D. Clark 100% NIL
C. Barnes 100% NIL
No other members of the Company’s key management personnel were eligible to earn an STI in the 2015 financial year.
STI awards for 2014 and 2015 financial years
For the 2015 financial year, a total payment of $292,352 was made which represents 100% of the total STI cash bonus previously accrued in that period which has vested to executives. For the 2014 financial year, a total payment of $94,853 was made which represented 100% of the total STI cash bonus previously accrued in that period which had vested to executives.
5.4 LTIs
Executive Share Option Plan
The Board established an Executive Share Option Plan which is designed to provide incentives to the Executives of the consolidated entity. The plan was approved by shareholders at the Annual General Meeting held on 18 December 2007.
Under the plan the Board has the discretion to issue options to Executives as long as the issue does not result in the Executive owning or controlling the exercise of voting power attached to 5% or more of all shares then on issue. Each option is convertible to one ordinary share. The exercise price of the option is determined by the Board.
The rules governing the operation of the plan may be amended, waived or modified, at any time by resolution of the Board provided there is no reduction of rights to Executives in the plan. If an amendment reduces the rights of Executives in the plan, it requires written consent of three-quarters of affected Executives.
The plan may be terminated or suspended at any time by a resolution of the Board, provided the termination or suspension does not materially adversely affect the rights of persons holding shares issued under the plan at that time. No options were issued in the current year to executive directors (2014: Nil).
LTl Plan
The Board established a Long Term Incentive Plan which is designed to provide incentives to the Executives of the consolidated entity. The plan was approved by shareholders at the Annual General Meeting held on 18 December 2007.
The purpose and rules of the plan are the same as the Executive Share Option Plan described above, except that there is no prohibition on issuing shares if it would result in an Executive owning (legally or beneficially) or controlling the exercise of voting power attached to 5% or more of all shares then on issue. No shares were issued in the current year (2014: Nil).
For
per
sona
l use
onl
y

Cellnet Group Limited and its consolidated entities
Annual Report 2014|1522
Performance Rights Plan
On 24 October 2014 at the Company’s Annual General Meeting, shareholders approved a performance rights plan.
Under this plan, performance rights are issued to key management personnel. The rights deliver ordinary shares to key management personnel (at no cost to the executive) where the performance hurdle in relation to those performance rights is met. Following the exercise of a Right, the Company must, within such time as the Board determines issue or allocate to or acquire on market for the person exercising the Right, the number of shares in respect of which the Right has been exercised, credited as fully paid. A total of 2,100,000 rights were issued to KMP under this plan during the current year (2014: nil). Details of the rights granted to KMP during the period are summarised as follows:
KMPGrant Date
No. Granted
Grant Date Fair Value ($)
Exercise Price ($)
No. Forfeited
No. Vested
% Vested
A. Sparks 3/2/2015 866,667* 0.13 - - - -
A. Sparks 3/2/2015 433,333^ 0.28 - - - -
C. Barnes 3/2/2015 200,000* 0.13 - - - -
C. Barnes 3/2/2015 100,000^ 0.28 - - - -
D. Clark 3/2/2015 333,333* 0.13 - - - -
D. Clark 3/2/2015 166,667^ 0.28 - - - -
Conditions attached to performance rights:
* Rights vest subject to achievement of a total shareholder return (TSR) performance hurdle. Rights will vest if the TSR over the performance period, being 1 July 2014 to 30 June 2017, has increased by at least 20% per annum on a compounding basis. TSR will be calculated by the Board as the difference in share price from $0.25 per share over the performance period, plus the value of shares earned from notionally reinvesting dividends received over this period, expressed as a percentage of the share price of $0.25. The closing share price is calculated as the volume weighted average sale price of shares on the ASX for the 10 trading days up to and including the date that is 10 trading days following the date FY17 audited results are released to the market. Employees must remain in service with the company throughout the measurement period for the rights to vest.
^ Rights vest subject to achievement of profit before tax (PBT) performance hurdles in respect of each of the 2015, 2016 and 2017 financial years. Each annual PBT performance hurdle is achieved if actual PBT is equal to or greater than 120% of Budgeted PBT. Actual PBT means the profit before tax disclosed in the Company’s audited financial statements for the relevant performance period as adjusted in the Board’s discretion for one-off, abnormal and non-recurring items or such other matters that the Board considers fair and reasonable. Budgeted PBT means the profit before tax set out in any budget approved by the Board from time to time for the relevant performance period. The rights are subject to a cumulative vesting condition if a PBT hurdle in one or more periods is not achieved. The last date for measurement is the date which is 30 days subsequent to the release of 30 June 2017 audited results to the market. Employees must remain in service with the company throughout the measurement period for the rights to vest.
Shares issued on exercise of vested rights are held in escrow and are not transferable until 30 June 2017.
5.5 STI structure
The Board considers that the above performance-linked remuneration structure is appropriate at this time. It provides both short-term focus on operating performance and longer term focus on share price growth.
Improving the performance of the operations was the main focus in setting the financial year 2015 short-term incentive.
5.6 Consequences of performance on shareholder wealth
In considering the consolidated entity’s performance and benefits for shareholder wealth, the Board has regard to the following indices in respect of the current financial year and previous financial years.
2015 2014 2013 2012 2011
Net profit/(loss) attributable to equity holders of the Company
$1,649,000 ($3,887,000) $962,000 ($488,000) $1,041,000
Dividends paid - - - $7,912,000 $699,000
Reduction of share capital - - - $5,308,000 -
Change in share price $0.03 $0.01 - ($0.19) $0.09
5.7 Other benefits
During the current and prior year, there were no non-cash bonuses or benefits paid to key management personnel.
Remuneration Report (audited) continued
For
per
sona
l use
onl
y

Cellnet Group Limited and its consolidated entities
Annual Report 2014|15 23
Directors’ Report
6. Executive contractual arrangements
It is the consolidated entity’s policy that service contracts for key management personnel are unlimited in term but capable of termination as per the relevant period of notice and that the consolidated entity retains the right to terminate the contract immediately, by making payment that is commensurate with pay in lieu of notice.
The service contract outlines the components of remuneration paid to the key management person but does not prescribe how remuneration levels are modified year to year. Remuneration levels are reviewed each year to take into account cost-of-living changes, any change in the scope of the role performed by the senior executive and any changes required to meet the principles of the remuneration policy.
Standard KMP termination payment provisions apply to all current members of the KMP, including the Chief Executive Officer. The standards KMP provisions are as follows:
Notice periodPayment in lieu
of noticeTreatment of STI on
terminationTreatment of LTI on
termination
Employer initiated termination 3 months 3 monthsPro-rated for time and
performancePro-rated for time and
performance
Termination for serious misconduct None NoneUnvested awards
forfeitedUnvested awards
forfeited
Employee initiated termination 3 months 3 monthsPro-rated for time and
performancePro-rated for time and
performance
6.1 Directors’ and executive officers’ remuneration
The remuneration report details the remuneration arrangements for key management personnel (KMP) who are defined as those persons having authority and responsibility for planning, directing and controlling the major activities of the consolidated entity, directly or indirectly, including any director (whether executive or otherwise). Remuneration of Directors and KMP are as follows:
Short Term $Post
Employment $Long Term Benefits $
YearSalary & Fees
STI Cash Bonus
Motor Vehicle Allowances
Non Monetary benefits
Superannuation Benefits
Cash Incentives
Long Service Leave
Share-based Payment
Termination/Retention Benefits
Total%
Performance Related
Non-executive directors
A. Beard(i) 2015 - - - - - - - 37,140 - 37,140 -
2014 - - - - - - - - - - -
M. Brookman (Appointed 07/05/14) 2015 50,000 - - - - - - - - 50,000 -
2014 4,167 - - - - - - - - 4,167 -
E. Kaplan(ii) (Appointed 25/07/12) 2015 - - - - - - - 37,140 - 37,140 -
2014 - - - - - - - - - - -
Total non-executive directors 2015 50,000 - - - - - - 74,280 - 124,280 -
2014 4,167 - - - - - - - - 4,167 -
Executive director
M. Brookman (iii) (Resigned 07/05/14) 2015 - - - - - - - - - - -
2014 237,342 - - - - - - - - 237,342 -
i During both the 2015 and 2014 financial years the Company paid management fees to CVC Managers Pty Limited totalling $54,500 in relation to Directors’ services performed by Mr A Beard. ii During both the 2015 and 2014 financial years the Company paid management fees to CVC Managers Pty Limited totalling $50,000 in relation to Directors’ services performed by Mr E Kaplan. iii Mr Brookman resigned from the position of executive director 7 May 2014. From this date, for the remainder of the 2014 financial year and for the entire and 2015 financial year Mr Brookman acted as a non executive director. iv There were no performance conditions attached to options granted to non-executive directors during the year. Options were granted in lieu of cash consideration as part of the company’s remuneration strategy for non-executive directors.
For
per
sona
l use
onl
y
Cellnet Group Limited and its consolidated entities
Annual Report 2014|1524
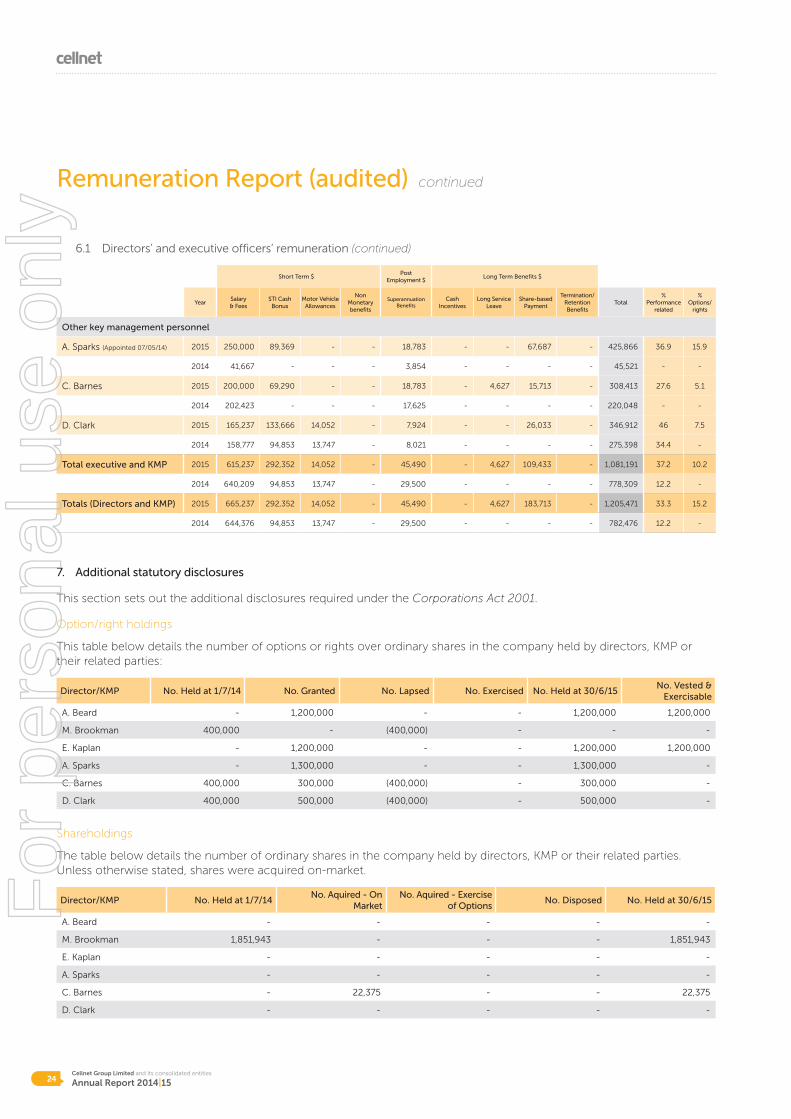
6.1 Directors’ and executive officers’ remuneration (continued)
Short Term $Post
Employment $Long Term Benefits $
YearSalary & Fees
STI Cash Bonus
Motor Vehicle Allowances
Non Monetary benefits
Superannuation Benefits
Cash Incentives
Long Service Leave
Share-based Payment
Termination/Retention Benefits
Total%
Performance related
% Options/
rights
Other key management personnel
A. Sparks (Appointed 07/05/14) 2015 250,000 89,369 - - 18,783 - - 67,687 - 425,866 36.9 15.9
2014 41,667 - - - 3,854 - - - - 45,521 - -
C. Barnes 2015 200,000 69,290 - - 18,783 - 4,627 15,713 - 308,413 27.6 5.1
2014 202,423 - - - 17,625 - - - - 220,048 - -
D. Clark 2015 165,237 133,666 14,052 - 7,924 - - 26,033 - 346,912 46 7.5
2014 158,777 94,853 13,747 - 8,021 - - - - 275,398 34.4 -
Total executive and KMP 2015 615,237 292,352 14,052 - 45,490 - 4,627 109,433 - 1,081,191 37.2 10.2
2014 640,209 94,853 13,747 - 29,500 - - - - 778,309 12.2 -
Totals (Directors and KMP) 2015 665,237 292,352 14,052 - 45,490 - 4,627 183,713 - 1,205,471 33.3 15.2
2014 644,376 94,853 13,747 - 29,500 - - - - 782,476 12.2 -
7. Additional statutory disclosures
This section sets out the additional disclosures required under the Corporations Act 2001.
Option/right holdings
This table below details the number of options or rights over ordinary shares in the company held by directors, KMP or their related parties:
Director/KMP No. Held at 1/7/14 No. Granted No. Lapsed No. Exercised No. Held at 30/6/15No. Vested &
Exercisable
A. Beard - 1,200,000 - - 1,200,000 1,200,000
M. Brookman 400,000 - (400,000) - - -
E. Kaplan - 1,200,000 - - 1,200,000 1,200,000
A. Sparks - 1,300,000 - - 1,300,000 -
C. Barnes 400,000 300,000 (400,000) - 300,000 -
D. Clark 400,000 500,000 (400,000) - 500,000 -
Shareholdings
The table below details the number of ordinary shares in the company held by directors, KMP or their related parties. Unless otherwise stated, shares were acquired on-market.
Director/KMP No. Held at 1/7/14No. Aquired - On
MarketNo. Aquired - Exercise
of OptionsNo. Disposed No. Held at 30/6/15
A. Beard - - - - -
M. Brookman 1,851,943 - - - 1,851,943
E. Kaplan - - - - -
A. Sparks - - - - -
C. Barnes - 22,375 - - 22,375
D. Clark - - - - -
Remuneration Report (audited) continued
For
per
sona
l use
onl
y

Cellnet Group Limited and its consolidated entities
Annual Report 2014|15 25
Transactions with an entity related to a director:
Storage and distribution services were provided by the company to an entity which a Cellnet director is related to. Total amounts charged to the entity for the 2015 financial year total $79,000. Amounts owing to Cellnet Group Limited but not yet due as at 30 June 2015 for these services total $7,000.
End of Remuneration Report
This report is made with a resolution of the Directors:
Alexander BeardChairman
Signed at Brisbane on 24 August 2015
For
per
sona
l use
onl
y

Cellnet Group Limited and its consolidated entities
Annual Report 2014|1526
Page left intentionally blank.
For
per
sona
l use
onl
y

Cellnet Group Limited and its consolidated entities
Annual Report 2014|15 27
Financial Report
financialreport
For
per
sona
l use
onl
y

Cellnet Group Limited and its consolidated entities
Annual Report 2014|1528
Financial ReportStatement of financial position
Consolidated
Note
2015 2014
As at 30 June 2015 $000 $000
ASSETS
Current assets
Cash and cash equivalents 10 2,373 2,551
Trade and other receivables 11 9,400 11,441
Inventories 12 8,004 8,587
Derivative financial instruments 18 261 -
Total current assets 20,038 22,579
Non-current assets
Property, plant and equipment 13 471 583
Deferred tax assets (net) 8(c) 838 828
Intangible assets 14 27 -
Total non-current assets 1,336 1,411
TOTAL ASSETS 21,374 23,990
LIABILITIES
Current liabilities
Trade and other payables 15 7,153 5,032
Provisions 16 594 539
Derivative financial instruments 18 - 732
Interest-bearing loans and borrowings 17 555 6,270
Total current liabilities 8,302 12,573
Non-current liabilities
Provisions 16 93 148
Total non-current liabilities 93 148
TOTAL LIABILITIES 8,395 12,721
NET ASSETS 12,979 11,269
EQUITY
Issued capital 19(a) 31,699 31,699
Reserves 19(b) 2,368 658
Accumulated losses (21,088) (21,088)
TOTAL EQUITY 12,979 11,269
The above statement of financial position should be read in conjunction with the accompanying notes.
For
per
sona
l use
onl
y

Cellnet Group Limited and its consolidated entities
Annual Report 2014|15 29
Financial Report
Statement of comprehensive income
Note
2015 2014 Restated*
For the year ended 30 June 2015 $000 $000
Continuing operations
Sales of goods 76,577 79,772
Rendering of services 1,691 2,456
Revenue 78,268 82,228
Other income 6 18 19
Depreciation and amortisation expense (296) (394)
Employee benefit expense (9,999) (9,395)
Finance costs (489) (435)
Freight expense (2,659) (3,542)
Impairment of intangible - (150)
Materials, packaging and consumables used (59,142) (66,236)
Occupancy expense (1,418) (1,489)
Other expense (2,634) (2,066)
Restructuring costs - (405)
Profit /(loss) from continuing operations before income tax 7 1,649 (1,865)
Income tax expense 8(b) - (2,022)
Profit/(loss) from continuing operations after income tax 1,649 (3,887)
Net profit/(loss) for the period 1,649 (3,887)
Items that may be reclassified subsequently to profit or loss
Foreign currency translation (186) 164
Total comprehensive income for the period 1,463 (3,723)
Earnings per share for profit from continuing operations attributable to the ordinary equity holders of the Company
Basic earnings per share (cents per share) 9 3.0 (6.9)
Diluted earnings per share (cents per share) 9 3.0 (6.9)
Earnings per share for profit attributable to the ordinary equity holders of the Company
Basic earnings per share (cents per share) 9 3.0 (6.9)
Diluted earnings per share (cents per share) 9 3.0 (6.9)
The above statement of comprehensive income should be read in conjunction with the accompanying notes.For
per
sona
l use
onl
y

Cellnet Group Limited and its consolidated entities
Annual Report 2014|1530
Statement of changes in equity
Share capital
$000
Reserve for own shares
$000
Foreign Currency translation reserve
$000
Share based payment reserve
$000
Reserve for Profits
$000
Accumulated losses
$000Total equity
$000
At 1 July 2014 31,699 (25) 107 576 - (21,088) 11,269
Profit for the period - - - - - 1,649 1,649
Foreign currency translation - - (186) - - - (186)
Total comprehensive income for the period - - (186) - - 1,649 1,463
Transactions with owners in their capacity as owners:
Transfers to/from reserves - - - - 1,649 (1,649) -
Share based payments - - - 247 - - 247
Balance as at 30 June 2015 31,699 (25) (79) 823 1,649 (21,088) 12,979
At 1 July 2013 31,699 (25) (57) 576 - (17,201) 14,992
Loss for the period - - - - - (3,887) (3,887)
Foreign currency translation - - 164 - - - 164
Total comprehensive income for the period - - 164 - - (3,887) (3,723)
Transactions with owners in their capacity as owners:
Share based payments - - - - - - -
Balance as at 30 June 2014 31,699 (25) 107 576 - (21,088) 11,269
The above statement of changes in equity should be read in conjunction with the accompanying notes.
For
per
sona
l use
onl
y

Cellnet Group Limited and its consolidated entities
Annual Report 2014|15 31
Financial Report
Statement of cash flows
Consolidated
Note
2015 2014
For the year ended 30 June 2015 $000 $000
Cash flows from operating activities
Receipts from customers (inclusive of GST) 88,275 88,061
Payments to suppliers and employees (inclusive of GST) (82,121) (93,056)
Interest paid (369) (325)
Net cash flows used in operating activities 29 5,785 (5,320)
Cash flows from / (used in) investing activities
Proceeds from sale of property, plant and equipment - 1
Interest received 6 18 19
Purchase of property, plant and equipment 13 (184) (120)
Payments for purchase of intangibles 14 (27) -
Net inflow from sale of discontinued operation, net of cash disposed - (66)
Net cash flows from / (used in) investing activities (193) (166)
Cash flows from / (used in) financing activities
Proceeds from borrowings 25,687 27,843
Repayment of borrowings (31,402) (22,047)
Net cash flows from / (used in) financing activities (5,715) 5,796
Net decrease in cash and cash equivalents (123) 310
Net foreign exchange differences (55) 100
Cash and cash equivalents at beginning of period 2,551 2,141
Cash and cash equivalents at end of period 10 2,373 2,551
The above statement of cash flows should be read in conjunction with the accompanying notes.
For
per
sona
l use
onl
y
Cellnet Group Limited and its consolidated entities
Annual Report 2014|1532
1. Corporate Information
Cellnet Group Limited (the ‘Company’) is a company limited by shares and incorporated in Australia. The consolidated financial report of the Company for the financial year ended 30 June 2015 comprises the Company and its subsidiaries (together referred to as the ‘consolidated entity’). The company is a for-profit entity for the purpose or preparing these financial statements. The financial statements of the subsidiaries are prepared for the same reporting period as the parent company.
The financial report was authorised for issue by the Directors on 24 August 2015. The nature of the operations and principal activities of the consolidated entity are described in the directors’ report.
2. Significant accounting policies
(a) Basis of preparation
The financial report is a general purpose financialreport, which has been prepared in accordancewith the requirements of the Corporations Act2001, Australian Accounting Standards and otherauthoritative pronouncements of the AustralianAccounting Standards Board.
The financial report is presented in Australiandollars and has been prepared on the historicalcost basis, except for derivative financialinstruments which are measured at fair value.
The Company is of a kind referred to in ASICClass Order 98/100 dated 10 July 1998 and inaccordance with that Class Order, amounts inthe financial report and directors’ report havebeen rounded off to the nearest thousanddollars, unless otherwise stated.
The estimates and underlying assumptionsare reviewed on an ongoing basis. Revisionsto accounting estimates are recognised in theperiod in which the estimate is revised if therevision affects only that period or in the periodof the revision and future periods if the revisionaffects both current and future periods.
Compliance with IFRS
The financial report complies with InternationalFinancial Reporting Standards (IFRS) as issued bythe International Accounting Standards Board.
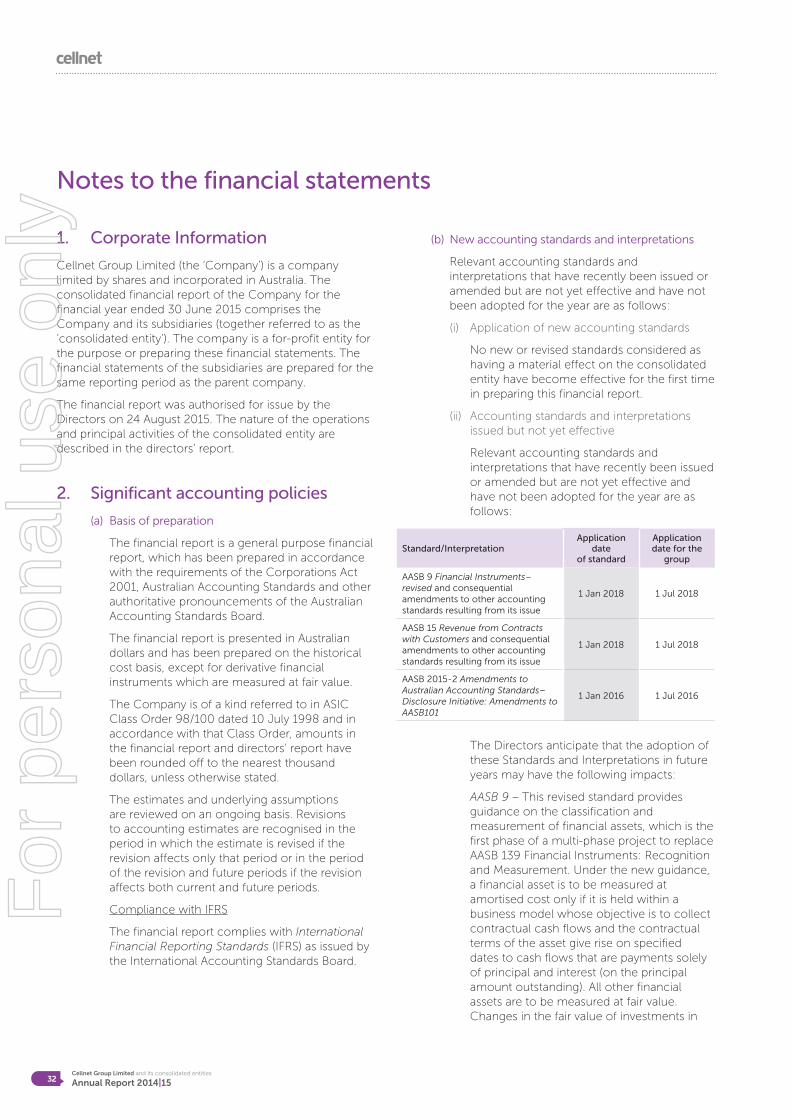
(b) New accounting standards and interpretations
Relevant accounting standards andinterpretations that have recently been issued oramended but are not yet effective and have notbeen adopted for the year are as follows:
(i) Application of new accounting standards
No new or revised standards considered ashaving a material effect on the consolidatedentity have become effective for the first timein preparing this financial report.
(ii) Accounting standards and interpretationsissued but not yet effective
Relevant accounting standards andinterpretations that have recently been issuedor amended but are not yet effective andhave not been adopted for the year are asfollows:
Standard/InterpretationApplication
date of standard
Application date for the
group
AASB 9 Financial Instruments– revised and consequential amendments to other accounting standards resulting from its issue
1 Jan 2018 1 Jul 2018
AASB 15 Revenue from Contracts with Customers and consequential amendments to other accounting standards resulting from its issue
1 Jan 2018 1 Jul 2018
AASB 2015-2 Amendments to Australian Accounting Standards– Disclosure Initiative: Amendments to AASB101
1 Jan 2016 1 Jul 2016
The Directors anticipate that the adoption of these Standards and Interpretations in future years may have the following impacts:
AASB 9 – This revised standard provides guidance on the classification and measurement of financial assets, which is the first phase of a multi-phase project to replace AASB 139 Financial Instruments: Recognition and Measurement. Under the new guidance, a financial asset is to be measured at amortised cost only if it is held within a business model whose objective is to collect contractual cash flows and the contractual terms of the asset give rise on specified dates to cash flows that are payments solely of principal and interest (on the principal amount outstanding). All other financial assets are to be measured at fair value. Changes in the fair value of investments in
Notes to the financial statements
For
per
sona
l use
onl
y

Cellnet Group Limited and its consolidated entities
Annual Report 2014|15 33
Financial Report
equity securities that are not part of a trading activity may be reported directly in equity, but upon realisation those accumulated changes in value are not recycled to the profit or loss. Changes in the fair value of all other financial assets carried at fair value are reported in the profit or loss. The Group is yet to assess the impact of the new standard. In the second phase of the replacement project, the revised standard incorporates amended requirements for the classification and measurement of financial liabilities. The new requirements pertain to liabilities at fair value through profit or loss, whereby the portion of the change in fair value related to changes in the entity’s own credit risk is presented in other comprehensive income rather than profit or loss. There is not expected to be a significant impact on the Group’s accounting for financial liabilities, as the Group’s financial liabilities at fair value through profit or loss are not exposed to material risk of change in the group’s own credit risk. Recent amendments as part of the project introduced a new hedge accounting model to simplify hedge accounting requirements and more closely align hedge accounting with risk management activities. There will be no impact on the Group’s accounting, as the Group does not utilise hedge accounting.
AASB 15 – This new standard replaces AASB 118 and AASB 111. It contains a single model that applies to contracts with customers and two approaches to recognising revenue. The model features a contract-based five step analysis of transactions to determine whether, how much and when revenue is recognised. The Group is yet to assess the impact of the new standard.
AASB 2015-2 – These amendments to AASB 101 clarify a number of presentation issues and highlight that preparers are permitted to tailor the format and presentation of the financial statements to their circumstances and the needs of the users. The Group does not expect the new standard to have a significant impact on its disclosures.
Other than as noted above, the adoption of the various Australian Accounting Standards and Interpretations and IFRSs on issue but not yet effective will not impact the Group’s accounting policies. However, the pronouncements may result in changes to information currently disclosed in the financial statements. The Group does not intend to adopt any of these pronouncements before their effective dates.
(c) Basis of Consolidation
The consolidated financial statements comprise the financial statements of Cellnet Group Ltd and its subsidiaries (as outlined in note 23) as at and for the year ended 30 June each year (the consolidated entity). Interests in associates are equity accounted and are not part of the consolidated entity. Subsidiaries are all those entities over which the consolidated entity has the power to govern the financial and operating policies so as to obtain benefits from their activities. The existence and effect of potential voting rights that are currently exercisable or convertible are considered when assessing whether the Group controls another entity.
The financial statements of the subsidiaries are prepared for the same reporting period as the parent company, using consistent accounting policies. In preparing the consolidated financial statements, all intercompany balances and transactions, income and expenses and profit and losses resulting from intra-group transactions have been eliminated in full.
Intra-group balances and any unrealised gains and losses or income and expenses arising from intra-group transactions, are eliminated in preparing the consolidated financial statements.
(d) Foreign currency
(i) Functional and presentation currency
Both the functional and presentation currency of Cellnet Group Limited and its Australian subsidiaries are Australian dollars ($). The New Zealand subsidiary’s functional currency is New Zealand dollars which is translated to the presentation currency.
For
per
sona
l use
onl
y

Cellnet Group Limited and its consolidated entities
Annual Report 2014|1534
(ii) Transactions and balances
Transactions in foreign currencies aretranslated at the foreign exchange rate rulingat the date of the transaction. Monetaryassets and liabilities denominated in foreigncurrencies at the balance date are translatedto Australian dollars at the foreign exchangerate ruling at reporting date. Foreignexchange differences arising on translationare recognised in net income.
Non-monetary assets and liabilities that aremeasured in terms of historical cost in aforeign currency are translated using theexchange rate at the date of the transaction.
(iii) Financial statements of foreign operations
The assets and liabilities of foreign operationsare translated to Australian dollars at foreignexchange rates ruling at the balance date.The revenues and expenses of foreignoperations are translated to Australian dollarsat rates approximating the foreign exchangerates ruling at the dates of the transactions.Foreign exchange differences arising ontranslation are recognised directly in aseparate component of equity.
(e) Property, plant and equipment
(i) Owned assets
Items of property, plant and equipmentare stated at cost or deemed cost lessaccumulated depreciation (see below) andimpairment losses (see accounting policy (j)).
Where parts of an item of property, plant andequipment have different useful lives, they areaccounted for as separate items of property,plant and equipment.
(ii) Leased assets
Leases in terms of which the consolidatedentity assumes substantially all the risks andrewards of ownership are classified as financeleases.
(iii) Depreciation
Depreciation is charged to net income on astraight-line basis over the estimated usefullives of each part of an item of property, plantand equipment. The estimated useful lives inthe current and comparative periods are asfollows:
Leasehold improvements 31/3–40 years
Plant and equipment 2½–10 years
Leased plant and equipment 4–5 years
The residual value, the useful life and the depreciation method applied to an asset are reassessed at least annually.
(iv) Derecognition
An item of property, plant and equipmentis derecognised upon disposal or whenno further future economic benefits areexpected from its use or disposal.
(f) Intangible assets
(i) Goodwill - Business combinations
Goodwill acquired in a business combinationis initially measured at cost of the businesscombination being the excess of theconsideration transferred over the fair valueof the identifiable net assets acquired andliabilities assumed. If this considerationtransferred is lower than the fair value ofthe net identifiable assets of the subsidiaryacquired, the difference is recognised in netincome. After initial recognition, goodwillis measured at cost less any accumulatedimpairment losses.
(ii) Other intangible assets
Other intangible assets that are acquired bythe consolidated entity are stated at cost lessaccumulated amortisation (see below) andimpairment losses (see accounting policy (j)).
(iii) Subsequent expenditure
Subsequent expenditure on capitalisedintangible assets is capitalised only whenit increases the future economic benefitsembodied in the specific asset to which itrelates. All other expenditure is expensed asincurred.
Notes to the financial statements2. Significant accounting policies continued
For
per
sona
l use
onl
y

Cellnet Group Limited and its consolidated entities
Annual Report 2014|15 35
Financial Report
(iv) Amortisation
Amortisation is charged to net income on a straight-line basis over the estimated useful lives of intangible assets unless such lives are indefinite. Goodwill and intangible assets with an indefinite useful life are systematically tested for impairment at each balance date. Other intangible assets are amortised from the date they are available for use over their estimated useful lives.
(g) Trade and other receivables
Trade, loans and other receivables are stated at their amortised cost less impairment losses. Collectability of trade receivables is reviewed on an ongoing basis at a customer level. Individual debts that are known to be uncollectable are written off when identified. An impairment provision is recognised when there is objective evidence that the consolidated entity will not be able to collect the receivable. Debts which are aged greater than 120 days or more are considered as objective evidence of impairment and a provision of 80% is recognised. For any debts that are passed onto the consolidated entity’s solicitors for collection a provision of 100% is recognised.
(h) Inventories
Inventories are stated at the lower of cost and net realisable value. Net realisable value is the estimated selling price in the ordinary course of business, less the estimated costs of completion and selling expenses. Cost is calculated using the average cost method and includes direct and allocated costs incurred in acquiring the inventories and bringing them to their present location and condition. A provision is recognised when there is objective evidence that the consolidated entity will not be able to sell the inventory at normal reseller pricing.
(i) Cash and cash equivalents
Cash and cash equivalents in the statement of financial position comprise of cash at bank and in hand and short term deposits with a maturity of 60 days or less that are readily convertible to known amounts of cash and which are subject to insignificant risks of change in values.
(j) Impairment
The carrying amounts of the consolidated entity’s assets, other than inventories (see accounting policy (h)), trade and other receivables (see accounting policy (g)) and deferred tax assets (see accounting policy (r)), are reviewed at each balance date to determine whether there is any indication of impairment. If any such indication exists, the asset’s recoverable amount is estimated (see accounting policy (j) (i)).
For goodwill, intangible assets that have an indefinite useful life and intangible assets that are not yet available for use, the recoverable amount is estimated at each balance date.
An impairment loss is recognised whenever the carrying amount of an asset or its cash-generating unit exceeds its recoverable amount. Impairment losses are recognised in net income.
Impairment losses recognised in respect of cash-generating units are allocated first to reduce the carrying amount of any goodwill allocated to cash-generating units (group of units) and then, to reduce the carrying amount of the other assets in the unit (group of units) on a pro-rata basis.
(i) Calculation of recoverable amount
The recoverable amount of assets (apart from receivables, inventory, and deferred tax) is the greater of their fair value less costs to sell and value in use. In assessing value in use, the estimated future cash flows are discounted to their present value using a pre-tax discount rate that reflects current market assessments of the time value of money and the risks specific to the asset. For an asset that does not generate largely independent cash inflows, the recoverable amount is determined for the cash-generating unit to which the asset relates.
Impairment losses, other than in respect of goodwill, are reversed when there is an indication that the impairment loss may no longer exist and there has been a change in the estimate used to determine the recoverable amount. An impairment loss in respect of goodwill is not reversed.
An impairment loss is reversed only to the extent that the asset’s carrying amount does not exceed the carrying amount that would have been determined, net of depreciation or amortisation, if no impairment loss had been recognised.
For
per
sona
l use
onl
y

Cellnet Group Limited and its consolidated entities
Annual Report 2014|1536
(k) Share capital
Ordinary shares are classified as equity.Incremental costs directly attributable to the issueof new shares or options are shown in equity as adeduction, net of tax, from the proceeds.
(l) Interest-bearing loans and borrowings
Interest-bearing borrowings are recognisedinitially at fair value of the consideration receivedless related transaction costs. Subsequent toinitial recognition, interest-bearing borrowingsare stated at amortised cost with any differencebetween cost and redemption value beingrecognised in net income over the period of theborrowings on an effective interest basis.
(m) Provisions and employee leave benefits
(i) Provisions
Provisions are recognised when theconsolidated entity has a present obligation(legal or constructive) as a result of a pastevent, it is probable that an outflow ofresources embodying economic benefitswill be required to settle the obligation and areliable estimate can be made of the amountof the obligation.
When the consolidated entity expects someor all of a provision to be reimbursed, forexample under an insurance contract, thereimbursement is recognised as a separateasset but only when the reimbursement isvirtually certain. The expense relating to anyprovision is presented in net income net ofany reimbursement.
Provisions are measured at the presentvalue of management’s best estimate of theexpenditure required to settle the presentobligation at the balance date using adiscounted cash flow methodology. Therisks specific to the provision are factoredinto the cash flows and as such a risk-free government bond rate relative to theexpected life of the provision is used as adiscount rate. If the effect of the time value ofmoney is material, provisions are discountedusing a current pre-tax rate that reflects thetime value of money and the risks specific tothe liability.
(ii) Long-term service benefits
The consolidated entity’s net obligation inrespect of long-term service benefits is theamount of future benefit that employeeshave earned in return for their service in thecurrent and prior periods. The obligation iscalculated using expected future increasesin wage and salary rates including relatedon-costs and expected settlement dates, andis discounted using the rates attached to highquality corporate bonds at the balance datewhich have maturity dates approximating theterms of the consolidated entity’s obligations.
(iii) Wages, salaries, annual leave and sick leave
Liabilities for employee benefits for wages,salaries and annual leave that are expectedto be settled within 12 months of thereporting date represent present obligationsresulting from employees’ services providedto reporting date, and are calculatedusing undiscounted amounts based onremuneration wage and salary rates thatthe consolidated entity expects to pay as atreporting date including related on-costs,such as workers remuneration insuranceand payroll tax. Amounts not expected tobe settled within 12 months are carriedat a net present value determined in thesame manner as long service leave benefitsdescribed in note 2(m)(ii). Expenses for non-accumulating sick leave are recognised whenthe leave is taken and are measured at therates paid or payable.
(iv) Contingent consideration
Contingent consideration, resulting frombusiness combinations, is valued at fair valueat the acquisition date as part of the businesscombination. Subsequent changes to thefair value of the contingent considerationthat is deemed to be an asset or liability willbe recognised in accordance with AASB 139either in profit or loss or as a change to othercomprehensive income.
Notes to the financial statements2. Significant accounting policies continued
For
per
sona
l use
onl
y

Cellnet Group Limited and its consolidated entities
Annual Report 2014|15 37
Financial Report
(n) Share based payment transactions
The consolidated entity provides benefits to KMP in the form of share based payments, whereby the KMP renders services in exchange for shares. There are currently share based payment plans in place for the KMP. The cost of share based payments with KMP is measured by reference to the fair value of the equity instrument at the date at which they are granted (refer note 20 for further details).
(o) Trade and other payables
Trade and other payables are stated at their amortised cost. Trade payables are non-interest bearing and are normally settled on average between 30 day and 45 day terms. They represent liabilities for goods and services provided to the consolidated entity prior to the end of the financial year that are unpaid and arise when the consolidated entity becomes obliged to make future payments in respect of the purchase of these goods and services.
(p) Revenue
Goods sold and services rendered
Revenue from the sale of goods is recognised in net income when the significant risks and rewards of ownership have been transferred to the customer. This transfer generally occurs when the goods are delivered to the customer. Revenue from the provision of warehousing services to external parties is recognised as the service is provided. No revenue is recognised if there are significant uncertainties regarding recovery of the consideration due, the costs incurred or to be incurred cannot be measured reliably, there is a risk of return of goods or there is continuing managerial involvement with the goods.
Interest income is recognised in net income as it accrues, using the effective interest method. Dividend income is recognised in net income on the date the entity’s right to receive payments is established.
(q) Leases
(i) Operating lease payments
Payments made under operating leases are recognised in net income on a straight-line basis over the term of the lease. Lease incentives received are recognised in net income as an integral part of the total lease expense and spread over the lease term.
(ii) Finance leases
Finance leases, which transfer to the consolidated entity substantially all the risks and benefits incidental to ownership of the leased item are capitalised at the inception of the lease at fair value of the leased asset or, if lower, at the present value of the minimum lease payments. Minimum lease payments are apportioned between the finance charge and the reduction of the outstanding liability. The finance charge is allocated to each period during the lease term so as to produce a constant periodic rate of interest on the remaining balance of the liability. Finance charges are recognised as an expense in net income.
(r) Income tax
Current tax assets and liabilities for the current and prior periods are measured at the amount expected to be recovered from or paid to the taxation authorities based on the current period’s taxable income. The tax rates and tax laws used to compute the amount are those that are enacted or substantively enacted by the reporting date.
Deferred tax is provided using the statement of financial position method, providing for temporary differences between the carrying amounts of assets and liabilities for financial reporting purposes and the amounts used for taxation purposes. The following temporary differences are not provided for - initial recognition of goodwill, the initial recognition of assets or liabilities that affect neither accounting nor taxable profit, and differences relating to investments in subsidiaries to the extent that they will probably not reverse in the foreseeable future. The amount of deferred tax provided is based on the expected manner of realisation or settlement of the carrying amount of assets and liabilities, using tax rates enacted or substantively enacted at the balance date.
For
per
sona
l use
onl
y

Cellnet Group Limited and its consolidated entities
Annual Report 2014|1538
A deferred tax asset is recognised only to the extent that it is probable that future taxable profits will be available against which the asset can be utilised. Deferred tax assets are reduced to the extent that it is no longer probable that the related tax benefit will be realised.
Deferred tax assets and deferred tax liabilities are offset only if a legally enforceable right exists to set off current tax assets against current tax liabilities and the deferred tax assets and liabilities relate to the same taxable entity and the same taxation authority.
Tax consolidation
The Company and its wholly-owned Australian resident subsidiaries have formed a tax-consolidated entity with effect from 1 July 2003 and are therefore taxed as a single entity from that date. The head entity within the tax-consolidated entity is Cellnet Group Limited.
Current tax expense/income, deferred tax liabilities and deferred tax assets arising from temporary differences of the members of the tax-consolidated entity are recognised in the separate financial statements of the members of the tax-consolidated entity using the ‘separate taxpayer’ within the consolidated entity approach. Deferred tax assets and deferred tax liabilities are measured by reference to the carrying amounts in the separate financial statements of each entity and the tax values applied under tax consolidation.
Any current tax liabilities (or assets) and deferred tax assets arising from unused tax losses or unused tax credits of the subsidiaries are assumed by the head entity in the tax consolidated entity and are recognised as amounts payable / (receivable) to / (from) other entities in the tax-consolidated entity in conjunction with any tax funding arrangement amounts (refer below). Any difference between these amounts is recognised by the Company as an equity contribution or distribution.
The Company recognises deferred tax assets arising from unused tax losses and unused tax credits of the tax-consolidated entity to the extent that it is probable that future taxable profits of the tax-consolidated entity will be available against which the asset can be utilised. Any subsequent period adjustments to deferred tax assets arising from unused tax losses and unused tax credits as a result of revised assessments of the probability of recoverability are recognised by the head entity only.
Nature of tax funding arrangements
The head entity, in conjunction with other members of the tax-consolidated entity, has entered into a tax funding arrangement which sets out the funding obligations of members of the tax-consolidated entity in respect of tax amounts. The tax funding arrangements require payments to / (from) the head entity equal to the current tax liability / (asset) assumed by the head entity and any tax-loss or tax credit related deferred tax asset assumed by the head entity, resulting in the head entity recognising an inter-entity payable / (receivable) equal in amount to the tax liability / (asset) assumed. The inter-entity payable / (receivable) is at call.
Contributions to fund the current tax liabilities are payable as per the tax funding arrangement and reflect the timing of the head entity’s obligation to make payments for tax liabilities to the relevant tax authorities.
(s) Goods and services tax
Revenue, expenses and assets are recognised net ofthe amount of goods and services tax (GST), exceptwhere the amount of GST incurred is not recoverablefrom the taxation authority. In these circumstances,the GST is recognised as part of the cost of acquisitionof the asset or as part of the expense.
Receivables and payables are stated with theamount of GST included. The net amount ofGST recoverable from, or payable to, the relevanttaxation authority is included as a current asset orliability in the statement of financial position.
Cash flows are included in the statement of cashflows on a gross basis. The GST components ofcash flows arising from investing and financingactivities which are recoverable from, or payableto, the relevant taxation authority are classified asoperating cash flows.
Notes to the financial statements2. Significant accounting policies continued
For
per
sona
l use
onl
y

Cellnet Group Limited and its consolidated entities
Annual Report 2014|15 39
Financial Report
(t) Accounting estimates and judgements
Management discussed with the Audit and Risk Management Committee the development, selection and disclosure of the consolidated entity’s critical accounting policies and estimates and the application of these policies and estimates. The estimates and judgements that have a significant risk of causing a material adjustment to the carrying amounts of assets and liabilities within the next financial year are discussed below.
Impairment losses for trade receivables and stock on hand
Note 11 contains information about the assumptions and their risk factors relating to trade receivable impairment losses and note 7 discloses the amount of stock that has been scrapped throughout the course of the year, or has been written down to net realisable value in accordance with the policy outlined in note 2 (h).
Share based payments
The consolidated entity measures the cost of equity-settled transactions with employees by reference to the fair value of the equity instruments at the date at which they are granted. The fair value is determined by management using either a binomial model or, where applicable, a Monte Carlo simulation model. The related assumptions are detailed in note 20. The accounting estimates and assumptions relating to equity-settled share-based payments would have no impact on the carrying amounts of assets and liabilities within the next annual reporting period but may impact expenses and equity.
Recovery of deferred tax assets
Deferred tax assets are recognised for deductible temporary differences as management considers that it is probable that future taxable profits will be available to utilise temporary differences and recognised tax losses. Significant judgement is required to determine the amount of deferred tax assets that can be recognised, based upon the likely timing and the level of future taxable profits over the next three years together with future tax planning strategies. Where the consolidated entity has made a taxable loss in the current or preceding year, a tax asset is only recognised to the extent that there is convincing other evidence that sufficient taxable profit will be available against which the recognised unused tax losses can be utilised.
(u) Non-current assets held for sale and discontinuing operations
Non-current assets and disposal groups classified as held for sale are measured at the lower of their carrying amount and fair value less costs to sell. Non-current assets and disposal groups are classified as held for sale if their carrying amounts will be recovered through a sale transaction rather than through continuing use. This condition is regarded as met only when the sale is highly probable and the asset or disposal group is available for immediate sale in its present condition. Management must be committed to the sale, which should be expected to qualify for recognition as a completed sale within one year from the date of classification. In the statement of comprehensive income, income and expenses from discontinued operations are reported separately from income and expenses from continuing operations, down to the level of profit after taxes.
(v) Earnings per share
The consolidated entity presents basic and diluted earnings per share (EPS) data for its ordinary shares. Basic EPS is calculated by dividing the profit or loss attributable to ordinary shareholders of the Company by the weighted average number of ordinary shares outstanding during the period. Diluted EPS is determined by adjusting the profit or loss attributable to ordinary shareholders and the weighted average number of ordinary shares outstanding for the effects of all dilutive potential ordinary shares. Potential ordinary shares shall be treated as dilutive when their conversion to ordinary shares would decrease earnings per share or increase loss per share from continuing operations.
(w) Operating segments
An operating segment is a component of an entity that engages in business activities from which it may earn revenues and incur expenses (including revenues and expenses relating to transactions with other components of the same entity), whose operating results are regularly reviewed by the entity’s chief operating decision maker to make decisions about resources to be allocated to the segment and assess its performance and for which discrete financial information is available.
For
per
sona
l use
onl
y

Cellnet Group Limited and its consolidated entities
Annual Report 2014|1540
Operating segments have been identified based on the information provided to the chief operating decision maker – being the Chief Executive Officer. Note 5 contains information on reportable segments.
(x) Business combinations
Business combinations are accounted for using the acquisition method. The cost of an acquisition is measured as the aggregate of the consideration transferred, measured at acquisition date fair value and the amount of any non controlling interest in the acquiree. For each business combination the consolidated entity elects whether it measures the non-controlling interest in the acquiree either at fair value or at the proportionate share of the acquiree’s identifiable net assets. Acquisition costs incurred are expensed and included in administrative expenses.
When the consolidated entity acquires a business, it assesses the financial assets and liabilities assumed for appropriate classification and designation in accordance with the contractual terms, economic circumstances and pertinent conditions as at the acquisition date.
If the business combination is achieved in stages, the acquisition date fair value of the acquirer’s previously held equity interest in the acquiree is remeasured to fair value at the acquisition date through profit or loss.
(y) Financial instruments
(i) Financial assets
Initial recognition and measurement
Financial assets within the scope of AASB139 are classified as financial assets at fair value through the profit or loss, loans and receivables, held to maturity investments, available for sale financial assets, or as derivatives designated as hedging instruments in an effective hedge, as appropriate. The consolidated entity determines the classification of its financial assets at initial recognition.
All financial assets are recognised initially at fair value plus transaction costs, except in the case of financial assets recorded at fair value through the profit or loss. The consolidated entity’s financial assets include cash and short term deposits, trade and other receivables, and derivative financial instruments.
(ii) Impairment of financial assets
The consolidated entity assesses, at each reporting date, whether there is any objective evidence that a financial asset or a group of financial assets is impaired. A financial asset or a group of financial assets is deemed to be impaired if, and only if, there is objective evidence of impairment as a result of one or more events that has occurred after the initial recognition of the asset (an incurred ‘loss event’) and that loss event has an impact on the estimated future cash flows of the financial asset or group of financial assets that can be reliably estimated. Evidence of impairment may include indications that the debtors or a group of debtors is experiencing significant financial difficulty, default or delinquency in interest or principal payments, the probability that they will enter bankruptcy or other financial reorganisation and when observable data indicates that there is a measurable decrease in the estimated future cash flows, such as changes in arrears or economic conditions that correlate with defaults.
(iii) Financial liabilities
Initial recognition and measurement
Financial liabilities within the scope of AASB 139 are classified as financial liabilities at fair value through profit or loss, loans and borrowings, or as derivatives designated as hedging instruments in an effective hedge as appropriate. The consolidated entity determines the classification of its financial liabilities at initial recognition.
All financial liabilities are recognised initially at fair values plus, in the case of loans and borrowings, directly attributable transaction costs. The consolidated entity’s financial liabilities include trade and other payables.
Notes to the financial statements2. Significant accounting policies continued
For
per
sona
l use
onl
y

Cellnet Group Limited and its consolidated entities
Annual Report 2014|15 41
Financial Report
Derecognition
A financial liability is derecognised when the obligation under the liability is discharged or cancelled or expires.
(iv) Fair value of financial instruments
The fair value of financial instruments that are in active markets at each reporting date is determined by reference to quoted market prices or dealer price quotations, without any deductions for transaction costs.
For financial instruments not traded in an active market, the fair value is determined using appropriate valuation techniques. Such techniques may include:
• Using recent arms length market transactions;
• Using reference to current fair value of another instrument that is substantially the same; and
• Applying a discount cash flow analysis or other valuation models.
The fair value of forward foreign exchange contracts is determined using forward exchange rates at the balance sheet date.
3. Financial risk management objectives and policies
The consolidated entity’s principal financial instruments comprise of receivables, payables, cash and short-term deposits, interest bearing loans and forward foreign currency contracts.
Risk exposures and responses
The consolidated entity manages its exposure to key financial risks, including interest and currency risk in accordance with the consolidated entity’s financial risk management policy. The objective of this policy is to support the delivery of the consolidated entity’s financial targets whilst protecting future financial security.
The consolidated entity enters into derivative transactions, principally forward currency contracts. The purpose is to manage the currency risks arising from the consolidated entity’s operations. The main risks arising from the consolidated entity’s financial instruments are interest rate risk, foreign currency risk, credit risk and liquidity risk. The consolidated entity uses different methods to measure and manage different types of risks to which it is exposed. These include monitoring levels of exposure to interest rate and foreign exchange risk and assessment of market forecasts for interest rate and foreign exchange prices. Ageing analysis and monitoring of specific credit allowances are undertaken to manage credit risk. Liquidity risk is monitored through using future rolling cash flow forecasts.
Primary responsibility for identification and control of financial risks rests with the Audit & Risk Management Committee under the authority of the Board. The Board reviews and agrees policies for managing each of the risks identified below, including the setting of limits for forward currency contracts, credit allowances and future cash flow forecast projections.
Interest rate risk
The consolidated entity’s exposure to market interest rates relates solely to the consolidated entities short-term cash deposits and interest bearing loans and borrowings as disclosed in note 10 and 17.
Note
2015 2014
$000 $000
Cash and cash equivalents 10 2,373 2,551
Interest bearing loans and borrowings
17 (555) (6,270)
1,818 (3,719)
The consolidated entity frequently analyses its interest rate exposure. Within this analysis consideration is given to potential renewals of existing positions, alternative hedging positions and the mix of fixed and variable interest rates.
The following sensitivity analysis is based on the interest rate risk exposures in existence at the reporting date.F
or p
erso
nal u
se o
nly

Cellnet Group Limited and its consolidated entities
Annual Report 2014|1542
At 30 June 2015, if interest rates had moved as illustrated in the table below, with all other variables held constant, post-tax profit and other comprehensive income would have been affected as follows:
Post tax profit higher/(lower)
Other comprehensive income
higher/(lower)
2015 2014 2015 2014
Consolidated $000 $000 $000 $000
+1% (100 basis points) (2014: 1%)
13 (26) - -
-0.5% (50 basis points) (2014: 0.5%)
6 13 - -
The movements in profit are due to higher / lower cash receipts / payments from variable rate net interest bearing balances. The assumed reasonably possible interest rate movements are based on an economic forecaster’s expectations.
Foreign currency risk
The consolidated entity is exposed to foreign currency risk on sales and purchases that are denominated in a currency other than Australian dollars. The currencies giving rise to risk are primarily U.S dollars and New Zealand dollars.
The consolidated entity enters into forward foreign exchange contracts to hedge certain anticipated purchase commitments denominated in foreign currencies (principally U.S dollars). The terms of these commitments are no more than 45 days. It is the consolidated entity’s policy not to enter into forward contracts until a firm commitment is in place.
The consolidated entity has a subsidiary based in New Zealand and all transactions for this subsidiary are denominated in New Zealand dollars. There is currently no hedge in place to mitigate the foreign currency risk for this subsidiary.
Entering into forward foreign currency exchange contracts minimises the risk of sharp fluctuations in foreign exchange rates and allows for better cash flow management in relation to paying international suppliers. At balance date, the consolidated entity had the following exposure to US$ foreign currency that is not designated as cash flow hedges:
2015 2014
Consolidated USD $000 USD $000
Financial assets
Trade and other receivables 295 486
295 486
Financial liabilities
Trade and other payables (1,809) (1,095)
Forward foreign currency contracts* (13,059) (13,433)
(14,868) (14,528)
Net exposure (14,573) (14,042)
*Denotes the amount of USD to be exchanged at the forward exchange rate.
At 30 June 2015, had the Australian dollar moved, as illustrated in the table below, with all other variables held constant, post-tax profit and other comprehensive income would have been affected as follows:
Post tax profit higher/(lower)
Other comprehensive income
higher/(lower)
2015 2014 2015 2014
Consolidated $000 $000 $000 $000
AUD / USD +10% (2014: +10%) (955) (865) - -
AUD / USD -10% (2014: -10%)
1,167 1,108 - -
Significant assumptions: The reasonably possible movement was calculated by taking the USD spot rate as at balance date, moving the spot rate by the reasonably possible movements and then re-converting the USD into AUD with the ‘new spot rate’. This amount was then tax effected. This methodology reflects the translation methodology undertaken by the consolidated entity.
Notes to the financial statements3. Financial risk management objectives and policies continued
For
per
sona
l use
onl
y
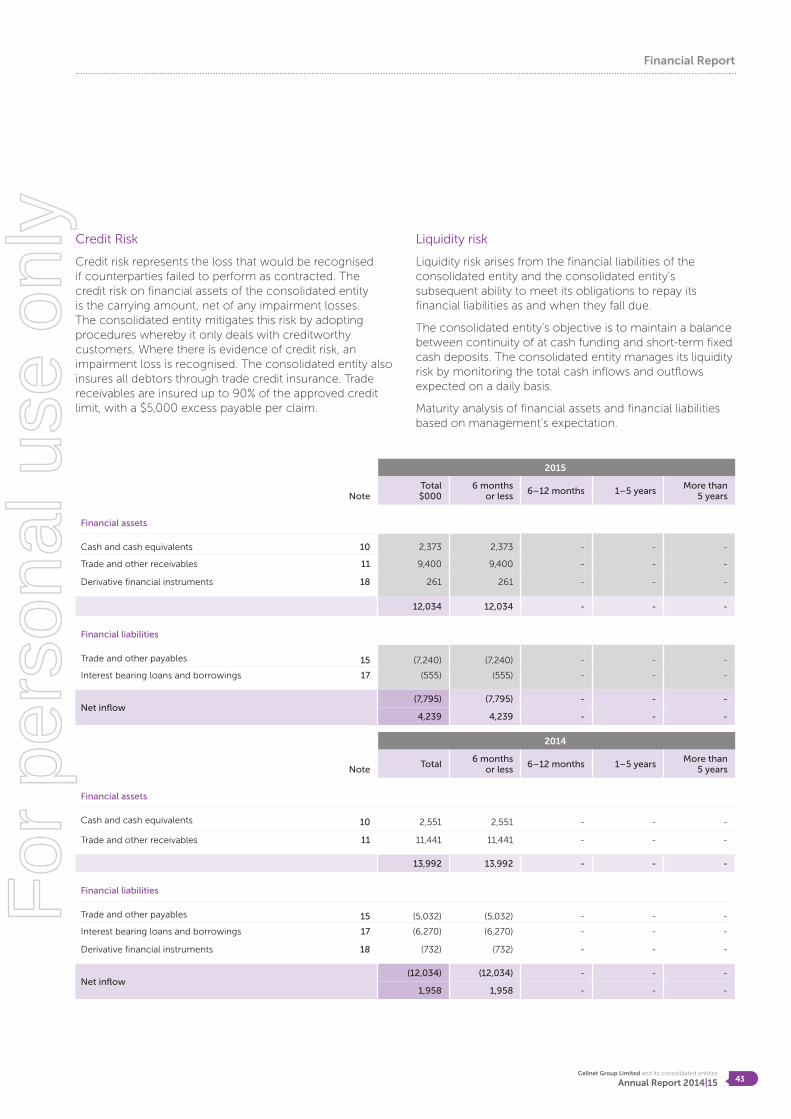
Cellnet Group Limited and its consolidated entities
Annual Report 2014|15 43
Financial Report
Credit Risk
Credit risk represents the loss that would be recognised if counterparties failed to perform as contracted. The credit risk on financial assets of the consolidated entity is the carrying amount, net of any impairment losses. The consolidated entity mitigates this risk by adopting procedures whereby it only deals with creditworthy customers. Where there is evidence of credit risk, an impairment loss is recognised. The consolidated entity also insures all debtors through trade credit insurance. Trade receivables are insured up to 90% of the approved credit limit, with a $5,000 excess payable per claim.
Liquidity risk
Liquidity risk arises from the financial liabilities of the consolidated entity and the consolidated entity’s subsequent ability to meet its obligations to repay its financial liabilities as and when they fall due.
The consolidated entity’s objective is to maintain a balance between continuity of at cash funding and short-term fixed cash deposits. The consolidated entity manages its liquidity risk by monitoring the total cash inflows and outflows expected on a daily basis.
Maturity analysis of financial assets and financial liabilities based on management’s expectation.
2015
NoteTotal $000
6 months or less
6–12 months 1–5 yearsMore than
5 years
Financial assets
Cash and cash equivalents 10 2,373 2,373 - - -
Trade and other receivables 11 9,400 9,400 - - -
Derivative financial instruments 18 261 261 - - -
12,034 12,034 - - -
Financial liabilities
Trade and other payables 15 (7,240) (7,240) - - -
Interest bearing loans and borrowings 17 (555) (555) - - -
Net inflow(7,795) (7,795) - - -
4,239 4,239 - - -
2014
NoteTotal
6 months or less
6–12 months 1–5 yearsMore than
5 years
Financial assets
Cash and cash equivalents 10 2,551 2,551 - - -
Trade and other receivables 11 11,441 11,441 - - -
13,992 13,992 - - -
Financial liabilities
Trade and other payables 15 (5,032) (5,032) - - -
Interest bearing loans and borrowings 17 (6,270) (6,270) - - -
Derivative financial instruments 18 (732) (732) - - -
Net inflow(12,034) (12,034) - - -
1,958 1,958 - - -
For
per
sona
l use
onl
y

Cellnet Group Limited and its consolidated entities
Annual Report 2014|1544
4. Fair Value Measurement
The fair values together with the carrying amounts of financial assets and financial liabilities shown in the statement of financial position are outlined in the table below. For short term trade receivables and payables with a maturity date of less than one year, the carrying amount, as adjusted for any allowances for impairment, is deemed to reflect the fair value.
2015 2014
NoteCarrying amount
$000Fair value
$000Carrying amount
$000Fair value
$000
Cash and cash equivalents 10 2,373 2,373 2,551 2,551
Trade and other receivables 11 9,400 9,400 11,441 11,441
Trade and other payables 15 (7,240) (7,240) (5,032) (5,032)
Borrowings 17 (555) (555) (6,270) (6,270)
Derivative financial instruments 18 261 261 (732) (732)
4,239 4,239 1,958 1,958
Fair value hierarchy
Outlined below are the judgements and estimates made in determining the fair value of assets and liabilities that are recognised and measured at fair value. To provide an indication about the reliability of the inputs used in determining fair value, the group has classified its assets and liabilities into the three levels prescribed under the accounting standards, as follows:
Level 1: The fair value of financial instruments traded in active markets is based on quoted market prices at the end of the reporting period.
Level 2: The fair value of financial instruments that are not traded in an active market is determined using valuation techniques which maximise the use of observable market data and rely as little as possible on entity-specific estimates. That is, all valuation inputs are observable.
Level 3: If one or more of the significant inputs is not based on observable market data, the instrument is included in level 3.
The only balance on the consolidated entity’s balance sheet which is measured at fair value are forward foreign exchange contracts (refer note 18). The fair value of these financial instruments is determined using forward exchange rates at the balance sheet date. Such fair value measurement is included in level 2, as it is based on an observable input.
Notes to the financial statements
For
per
sona
l use
onl
y

Cellnet Group Limited and its consolidated entities
Annual Report 2014|15 45
Financial Report
5. Operating segments
Identification of reportable segments
The consolidated entity has identified its operating segments based on the internal reports that are reviewed and used by the Chief Executive Officer (the chief operating decision maker) in assessing performance and in determining the allocation of resources.
The operating segments are identified by management based on the manner in which products are sold, whether direct to retail customer or via on-line sales. Discrete financial information about each of these operating segments is reported to the Chief Executive Officer at least on a monthly basis. For the 2014 and 2015 financial years the consolidated entity’s activities related solely to retail sales.
As there is only one segment, segment revenues, profit/(loss), assets and liabilities are consistent with those reported in the statement of comprehensive income and statement of financial position.
Revenue from external customers by geographical location is detailed below. Revenue is attributable to geographic location based on the location of the customers. The company does not have external revenues from external customers that are attributable to any foreign country or region other than as shown.
2015 2014
$000 $000
Australia 58,712 62,040
New Zealand 19,169 20,188
Asia 387 -
Total revenue 78,268 82,228
6. Other revenue
2015 2014
$000 $000
Interest 18 19
Total other revenue 18 19
7. Items included in profit/(loss)
2015 2014
$000 $000
Doubtful debts expense 66 34
Loss on scrapping of / provisioning for obsolete inventory
1,124 1,972
Minimum lease payments – operating leases
869 978
Share-based payments expense/(income)
247 -
Fair value (gains) / losses on FX derivatives
(261) 732
Net foreign exchange losses / (gains) (1,137) 76
For
per
sona
l use
onl
y

Cellnet Group Limited and its consolidated entities
Annual Report 2014|1546
8. Income Tax
2015 2014*
(a) Income tax (expense)/benefit $000 $000
The major components to income tax are:
Current income tax charge - (4)
Items charged to equity (10) 9
Deferred income tax charge 10 (2,027)
Total income tax (expense)/benefit reported in net income - (2,022)
(b) Numerical reconciliation between aggregate tax expense recognised in net income and taxexpense calculated per the statutory income tax rate.A reconciliation between tax expense and the product of accounting profit before income tax multiplied by the consolidated entity’s applicable income tax rate is as follows:
Accounting profit / (loss) before tax from continuing operations 1,649 (1,865)
Total accounting profit before income tax 1,649 (1,865)
At the parent entity’s statutory income tax rate 30% (2014: 30%) (495) 560
Adjustments in respect of income tax of previous years (6) (395)
Entertainment (13) (10)
Share-based payments (74) -
Effect of lower tax rate in New Zealand (28%) 10 2
Other (13) -
Recognition/(De-recognition) of prior year losses 467 (1,813)
Utilisation of previously unrecognised tax losses 124 129
Current year losses not recognised - (495)
Aggregate income tax - (2,022)
Notes to the financial statements
For
per
sona
l use
onl
y

Cellnet Group Limited and its consolidated entities
Annual Report 2014|15 47
Financial Report
Recognised deferred tax assets and liabilities
Consolidated
2015 2015 2014 2014
$000 $000 $000 $000
(c)Current
income taxDeferred
income taxCurrent
income taxDeferred
income tax
Opening balance - 828 4 2,855
Charged to income / (expense) - - (4) (2,018)
FX translation - 10 - (9)
Closing balance - 838 - 828
Amounts recognised in the statement of financial position:
Deferred tax asset - 838 - 845
Deferred tax liability - - - (17)
- 838 - 828
Deferred income tax at 30 June relates to the following:
2015 2014
$000 $000
Net deferred tax assets
Doubtful debts 30 17
Employee provisions 198 196
Foreign exchange differences (540) 224
Inventory and consumables - 5
Other 12 29
Property, plant and equipment 134 134
Tax losses carried forward 518 223
Net deferred tax asset 838 828
As at 30 June 2015, the Company has a deferred tax asset relating to timing differences and tax losses arising from prior years totalling $838,000 (2014: $828,000). Management has recognised deferred tax assets on the basis that achievement of profit before tax within the next 3-5 years in the amounts sufficient to offset the reversal of timing differences and enable the utilisation of recognised unused losses is probable.
(d) Tax losses
The consolidated entity has gross tax losses, stated in the reporting currency of Australian dollars, for which no deferred tax asset is recognised on the statement of financial position of $24,546,877 (2014: $26,569,072) which are available indefinitely for offset against future gains subject to meeting the relevant statutory tests.
The consolidated entity has recognised tax losses to the extent that forecasts suggest it is probable that sufficient taxable income will be earned to recoup the recognised losses.
For
per
sona
l use
onl
y

Cellnet Group Limited and its consolidated entities
Annual Report 2014|1548
9. Earnings per share
The following reflects the income used in the basic and diluted earnings per share computations:
2015 2014
$000 $000
(a) Earnings used in calculating earnings per share
For basic earnings per share
Profit / (Loss) from continuing operations
1,649 (3,887)
Net profit/(loss) attributable to ordinary equity holders
1,649 (3,887)
For diluted earnings per share:
Profit / (loss) from continuing operations
1,649 (3,887)
Net profit/(loss) attributable to ordinary equity holders
1,649 (3,887)
(b) Weighted number of shares
Weighted average number of shares (basic) at 30 June
55,684 55,684
Weighted average number of shares adjusted for effect of dilution
55,684 55,684
Potential ordinary shares under option and restricted shares are considered non-dilutive where the current share price is lower than the exercise price.
2015 2014
$000 $000
(c) Earnings per share
Basic earnings per share (cents per share) 3.0 (6.9)
Diluted earnings per share (cents per share)
3.0 (6.9)
Notes to the financial statements
10. Current assets – cash and cash equivalents
2015 2014
$000 $000
Cash at bank and in hand 2,023 2,201
Funds held by bank (note 22) 350 350
2,373 2,551
Cash and funds held at bank earns interest at floating rates based on daily bank deposit rates. Funds held by banks represent monies pledged to fulfil financial guarantee collateral requirements.
11. Current assets – trade and other receivables
2015 2014
$000 $000
Trade receivables 9,240 11,069
Allowances for impairment loss (a) (104) (59)
9,136 11,010
Other receivables and prepayments 264 431
Carrying amount of trade and other receivables
9,400 11,441
For
per
sona
l use
onl
y

Cellnet Group Limited and its consolidated entities
Annual Report 2014|15 49
Financial Report
(a) Allowance for impairment loss
Trade receivables are non-interest bearing and are generally on 30 day terms. Trade receivables are insured through a debtors’ insurance policy, as described in note 3. A provision for impairment loss is recognised when there is objective evidence that an individual trade receivable is impaired and not recoverable within the terms of the insurance policy.
Movements in the provision for impairment loss were as follows:
2015 2014
$000 $000
At 1 July 59 92
Charge for the year 66 34
Amounts written off (21) (67)
As at 30 June 104 59
At 30 June, the ageing analysis of trade receivables is as follows:
Total $000
Not past due $000
0-30 days PDNI*
$000
31-60 days PDNI*
$000
+ 60 days PDNI*
$000
+ 60 days CI*
$000
2015 Consolidated 9,240 8,584 288 156 108 104
2014 Consolidated 11,069 8,870 1,105 345 690 59
*Past due not impaired (PDNI) *Considered impaired (CI)
Receivables past due but not considered impaired are $552,000 (2014: $2,140,000). Payment terms on these amounts have not been re-negotiated however credit has been stopped until full payment is made. Each debtor has been directly contacted by debt recovery agents and the consolidated entity is satisfied that payment will be received in full. Note 2(g) details how the Company manages and measures credit quality of trade receivables that are neither past due nor impaired.
12. Current assets – inventories
2015 2014
$000 $000
Stock on hand 8,322 9,645
Less: provision for obsolescence (318) (1,058)
Total inventories at the lower of cost and net realisable value
8,004 8,587
For
per
sona
l use
onl
y

Cellnet Group Limited and its consolidated entities
Annual Report 2014|1550
13. Non-current assets – property, plant and equipment
Reconciliation of the carrying amounts at the beginning and end of the period.
Leasehold improvements
Plant & Equipment Total
$000 $000 $000
For the year ended 30 June 2015
At 1 July 2014 net of accumulated depreciation and impairment 131 452 583
Additions 31 153 184
Write-offs/(Disposals) - - -
Depreciation charge for the year (63) (233) (296)
At 30 June 2015 net of accumulated depreciation and impairment 99 372 471
At 30 June 2015
Cost or fair value 386 6,666 9,187
Accumulated depreciation and impairment (287) (6,294) (8,716)
Net carrying amount 99 372 471
Leasehold improvements Plant & Equipment Total
$000 $000 $000
For the year ended 30 June 2014
At 1 July 2013 net of accumulated depreciation and impairment 187 668 858
Additions 20 100 120
Write-offs/(Disposals) - (1) (1)
Depreciation charge for the year (76) (315) (394)
At 30 June 2014 net of accumulated depreciation and impairment 131 452 583
At 30 June 2014
Cost or fair value 355 6,513 9,003
Accumulated depreciation and impairment (224) (6,061) (8,420)
Net carrying amount 131 452 583
Notes to the financial statements
For
per
sona
l use
onl
y

Cellnet Group Limited and its consolidated entities
Annual Report 2014|15 51
Financial Report
14. Non-current assets - intangibleassets
2015 2014
$000 $000
Opening balance - 150
Acquisitions 27 -
Impairment - (150)
Closing balance 27 -
15. Current liabilities –trade and other payables
2015 2014
$000 $000
Trade payables 5,250 4,043
Other payables and accrued expenses 1,990 989
7,240 5,032
For terms and conditions relating to trade payables refer to Note 2(o).
16. Provisions
2015 2014
$000 $000
Current
Provision for fringe benefits tax 21 27
Provision for long-service leave 145 132
Liability for annual leave and employee provisions
428 380
594 539
Non-Current
Liability for long-service leave 93 148
93 148
(a) Nature and timing of provisions
Refer to Note 2(m)(i) for the relevant accounting policy and a discussion of the significant estimates and assumptions applied in the measurement of this provision.
17. Current liabilities - interestbearing loans and borrowings
Interest Rate Maturity 2015 2014
% $000 $000 $000
Business Finance
3.99 3 July 2014 - 251
3.99 7 July 2014 - 450
3.99 10 July 2014 - 427
3.99 21 July 2014 - 190
5.32 6 July 2014 128 -
5.31 20 July 2014 220 -
Invoice Finance
5.71 Various - 4,952
5.36 Various 207 -
555 6,270
$4,000,000 Business finance
This facility consists of three individual facilities, namely surrendered bills of lading, trade finance-imports and special documentary import letters of credit. The combined limit of $4,000,000 applies across these individual facilities. As at 30 June 2015, the company has drawn down $348,000 (2014: $1,318,000) under its trade finance – imports facility. This facility is a perpetual facility and has no fixed expiry date, although individual trade finance drawdowns under the facility as at balance date mature on the dates disclosed above. The facility is secured by a general security agreement given by Cellnet Group Limited over all existing and future assets and undertakings.
$6,000,000 Invoice finance
This facility was extended to the company on 10 March 2014. It is a facility for terms of trade. The total limit of the facility is $6,000,000. As at 30 June 2015, the company has drawn down $207,000 (2014: $4,952,000) under this facility. The facility is secured by general security agreement given by Cellnet Group Limited over all existing and future assets and undertakings, and a flawed asset agreement providing for deposits by Cellnet Group Limited in relation to a deposit account held with the financier. Amounts owing under the facility are matched to the trade terms of the underlying financed transaction up to a maximum of 60 days.
For
per
sona
l use
onl
y

Cellnet Group Limited and its consolidated entities
Annual Report 2014|1552
Notes to the financial statements
18. Derivative Financial Instruments
2015 2014
$000 $000
Current
Forward foreign currency exchange contracts 261 (732)
261 (732)
The consolidated entity fair values forward foreign currency exchange contracts held at balance date. Changes in the fair value of forward foreign currency exchange contracts that economically hedge monetary assets and liabilities in foreign currencies are recognised in profit or loss. Both the changes in fair value of the forward contracts and the foreign exchange gains and losses relating to the monetary items are recognised as part of materials, packaging and consumables used expenditure in the statement of comprehensive income, and are included in foreign currency gains or losses disclosed in note 7.
19. Contributed equity and reserves
(a) Share capital
2015 2014
No. of shares No. of shares
Ordinary shares on issue at 30 June
55,684,090 55,684,090
Fully paid ordinary shares carry one vote per share and carry the right to receive a dividend.
2015 2014
$000 $000
Ordinary shares on issue 31,699 31,699
(b) Reserves
2015 2014
$000 $000
Translation reserve (79) 107
Reserve for own shares (25) (25)
Reserve for profit 1,649 -
Share based payment reserve 823 576
2,368 658
Translation reserve
The translation reserve comprises all foreign exchange differences arising from the translation of the financial statements of foreign operations whose functional currency is different to the presentation currency of the reporting entity.
Reserve for own shares
The reserve for own shares represents the cost of shares held by an equity remuneration plan that the consolidated entity is required to include in the financial report. At 30 June 2015 the consolidated entity held 107,110 of the Company’s shares (2014: 107,110). This reserve will be reversed against share capital when the underlying shares are exercised under performance rights. No gain or loss is recognised in profit or loss on the purchase, sale, issue or cancellation of the consolidated entity’s own equity instruments.
Reserve for profit
Profits are transferred to the reserve for profits to facilitate future dividend payments in accordance with Australian taxation requirements for dividend payments to be sourced from profits.
Share based payment reserves
The share based payment reserve is used to recognise the value of equity-settled share based payments to KMP.
(c) Capital management
When managing capital, management’s objective is to ensure the entity continues as a going concern as well as to maintain optimal returns to shareholders and benefits for other stakeholders. Management also aims to maintain a capital structure that ensures the lowest cost of capital available to the entity.
Management adjusts the capital structure to take advantage of favourable costs of capital or high returns on assets. As the market is constantly changing, management may change the amount of dividends to be paid to shareholders, return capital to shareholders, or issue new shares.F
or p
erso
nal u
se o
nly

Cellnet Group Limited and its consolidated entities
Annual Report 2014|15 53
Financial Report
Management monitors capital through the capital adequacy ratio (net assets/total assets). The target for the consolidated entity’s capital adequacy ratio is between 40% and 60%. The capital adequacy ratios based on continuing operations at 30 June 2015 and 2014 were as follows:
2015 2014
$000 $000
Net assets 12,979 11,269
Total assets 21,461 23,990
Capital adequacy ratio 60% 47%
20. Share based payments
(a) Long term incentive plan - performance rights
On 24 October 2014 at the Company’s Annual General Meeting, shareholders approved a performance share rights plan.
Under this plan, performance rights are issued to key management personnel. The rights deliver ordinary shares to key management personnel (at no cost to the executive) where the performance hurdle in relation to those performance rights is met. Following the exercise of a Right, the Company must, within such time as the Board the Board determines issue or allocate to or acquire on market for the person exercising the Right, the number of shares in respect of which the Right has been exercised, credited as fully paid.
Details of performance rights granted during the year
Rights granted 3,300,000
Grant date 3 February 2015
Consideration payable Nil $
Exercise price Nil $
Last exercise date 5pm on the date which is 30 days subsequent to market release of FY17 results
Exercise conditions Subject to the Plan Rules, a Performance Right cannot be exercised unless the Board acting reasonably is satisfied that the following conditions have been satisfied:
• The employee remains employed by the company• There is no outstanding breach of the terms of engagement with the Company.• No notice of termination of engagement has been either been given by the employee or received by the
Company.• All performance hurdles have been met.
Performance hurdles 2,200,000 will vest upon meeting a total shareholder return (TSR) performance hurdle 1,100,000 will vest upon meeting various profit before tax (PBT) performance hurdles
Fair value of performance rights granted
The fair value of the performance rights granted during the year was determined by management using either a binomial pricing model (PBT hurdle) or a trinomial lattice pricing model incorporating a Monte-Carlo simulation (TSR hurdle), depending on the nature of the associated vesting conditions.
Market conditions, such as the TSR vesting condition, were factored into the initial valuation of the options through use of a Monte Carlo simulation which derives a valuation based on a range of possible outcomes.
Expected volatility was determined based on historical stock price volatility over a period consistent with the life of the performance rights.
For
per
sona
l use
onl
y
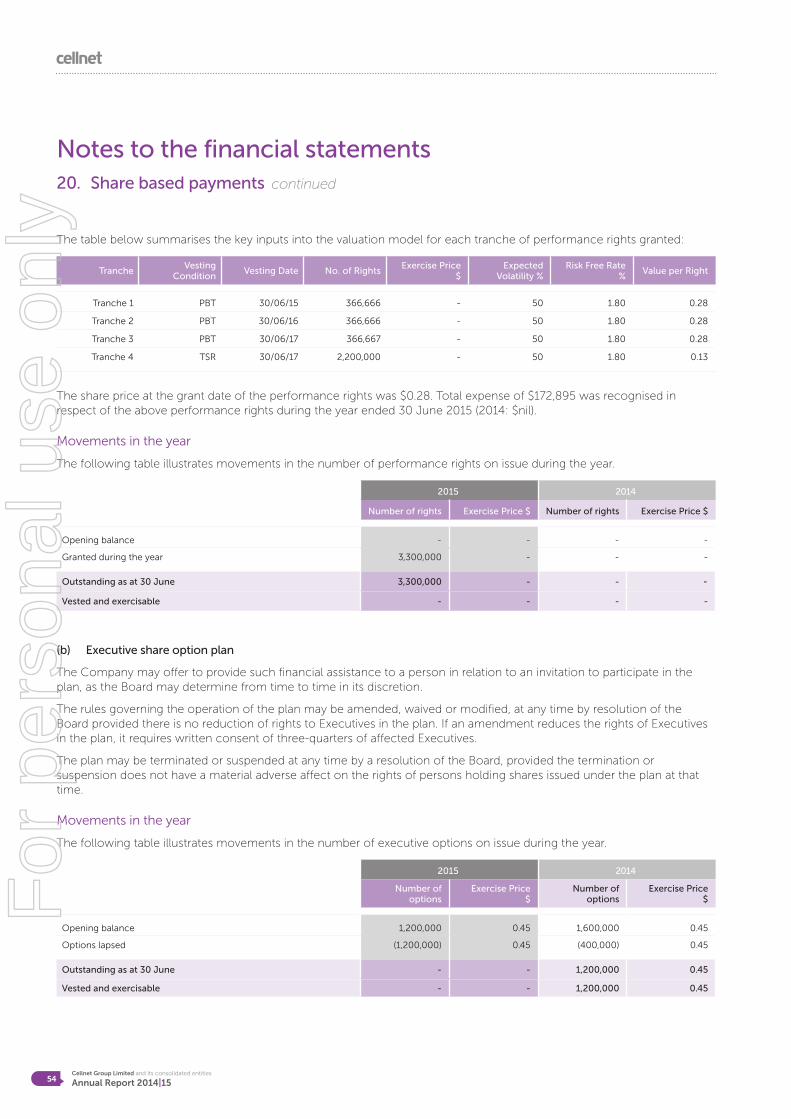
Cellnet Group Limited and its consolidated entities
Annual Report 2014|1554
Notes to the financial statements20. Share based payments continued
The table below summarises the key inputs into the valuation model for each tranche of performance rights granted:
TrancheVesting
ConditionVesting Date No. of Rights
Exercise Price $
Expected Volatility %
Risk Free Rate %
Value per Right
Tranche 1 PBT 30/06/15 366,666 - 50 1.80 0.28
Tranche 2 PBT 30/06/16 366,666 - 50 1.80 0.28
Tranche 3 PBT 30/06/17 366,667 - 50 1.80 0.28
Tranche 4 TSR 30/06/17 2,200,000 - 50 1.80 0.13
The share price at the grant date of the performance rights was $0.28. Total expense of $172,895 was recognised in respect of the above performance rights during the year ended 30 June 2015 (2014: $nil).
Movements in the year
The following table illustrates movements in the number of performance rights on issue during the year.
2015 2014
Number of rights Exercise Price $ Number of rights Exercise Price $
Opening balance - - - -
Granted during the year 3,300,000 - - -
Outstanding as at 30 June 3,300,000 - -
Vested and exercisable - - - -
(b) Executive share option plan
The Company may offer to provide such financial assistance to a person in relation to an invitation to participate in the plan, as the Board may determine from time to time in its discretion.
The rules governing the operation of the plan may be amended, waived or modified, at any time by resolution of the Board provided there is no reduction of rights to Executives in the plan. If an amendment reduces the rights of Executives in the plan, it requires written consent of three-quarters of affected Executives.
The plan may be terminated or suspended at any time by a resolution of the Board, provided the termination or suspension does not have a material adverse affect on the rights of persons holding shares issued under the plan at that time.
Movements in the year
The following table illustrates movements in the number of executive options on issue during the year.
2015 2014
Number of options
Exercise Price $
Number of options
Exercise Price $
Opening balance 1,200,000 0.45 1,600,000 0.45
Options lapsed (1,200,000) 0.45 (400,000) 0.45
Outstanding as at 30 June - - 1,200,000 0.45
Vested and exercisable - - 1,200,000 0.45
-
For
per
sona
l use
onl
y

Cellnet Group Limited and its consolidated entities
Annual Report 2014|15 55
Financial Report
(c) Non-executive director options
At the Company’s AGM in October 2014, the shareholders approved the grant of 2,400,000 options to non-executive Directors of the company as part of the remuneration strategy for such directors. The details of options granted are as follows:
Grant date 24 October 2014
First exercise date 24 October 2014
Last exercise date 31 October 2017
Exercise price* $0.25
Exercise Conditions • Each option is exercisable at any time during the period from the date of its issue until 31 October 2017.
Lapse of options The options will lapse at the earlier of:
• 1 November 2017; and• The date on which an option holder ceases to hold the office of Director in the company (other than due to the
occurrence of death or total and permanent disablement).
Fair value of non-executive options granted
The fair value of the non-executive options granted during the year was determined by management using a binomial pricing model. There were no vesting conditions attached to the options.
Expected volatility was determined based on historical stock price volatility over a period consistent with the life of the options.
The table below summarises the key inputs into the valuation model:
Tranche Vesting Date No. of OtionsExercise Price
$Expected Volatility
%Risk Free Rate
%Value per Option
Director Options 24/10/14 2,400,000 0.25 50 2.49 0.03
The share price at the grant date of the options was $0.19. Total expense of $74,280 was recognised in respect of the above options during the year ended 30 June 2015 (2014: $nil).
Movements in the year
The following table illustrates movements in the number of non-executive options on issue during the year.
2015 2014
Number of options
Exercise Price $
Number of options
Exercise Price $
Opening balance - - - -
Granted during the year 2,400,000 0.25 - -
Options lapsed - - - -
Outstanding as at 30 June 2,400,000 0.25 - -
Vested and exercisable 2,400,000 0.25 - -For
per
sona
l use
onl
y

Cellnet Group Limited and its consolidated entities
Annual Report 2014|1556
Notes to the financial statements
21. Commitments and contingencies
Commitments
The consolidated entity has entered into commercial leases on office and warehouse facilities, and items of computer equipment. The leases typically run for a period of 1 to 5 years, with an option to renew the lease after that date. Lease payments generally comprise a base amount plus an incremental contingent rental which is based on movements in the Consumer Price Index.
Future minimum rentals payable under non-cancellable operating leases at 30 June 2015 are payable as follows and are inclusive of any revenue received from third parties that are sub leasing premises which the consolidated entity is lessee of the head lease of the associated facility:
2015 2014
$000 $000
Less than one year 578 844
Between one and five years 135 978
713 1,822
The group subleases a portion of its office space and warehouse space to two external parties at its Eagle Farm premises. Both of the sublease terms are matched to the term of the head lease, with an expiry date of September 2016. Minimum amounts receivable under the subleases total $588,000 within one year (2014: $257,000), and $197,000 after one year but within 5 years (2014: $332,000).
Contingencies
Recovery of an alleged outstanding debt relating to a freight consultancy agreement from 2006 was settled by the Company within the 2015 year. Legal and settlement costs totalling $61,000 were expensed in the period.
22. Financial guarantees
The consolidated entity has provided financial guarantees in respect of rental leasing arrangements disclosed in Note 21. The Directors are of the opinion that provisions are not required in respect of these matters, as it is not probable that a future sacrifice of economic benefits will be required.
2015 2014
$000 $000
Bank guarantees provided 350 350
350 350
For
per
sona
l use
onl
y

Cellnet Group Limited and its consolidated entities
Annual Report 2014|15 57
Financial Report
23. Related party disclosure
Subsidiaries
The consolidated financial statements include the financial statements of Cellnet Group Ltd and the subsidiaries included in the following table:
% of equity interest
Name Country of incorporation 2015 2014
Cellnet Group Ltd (Parent) Australia 100 100
Cellnet Ltd New Zealand 100 100
C&C Warehouse (Holdings) Pty Ltd Australia 100 100
Regadget Pty Ltd Australia 100 100
OYT Pty Ltd Australia 100 100
Cellnet Online Pty Ltd Australia 100 100
3SIXT Limited* Hong Kong 100 -
* Company incorporated 1 August 2014.
The following table provides the total amount of transactions which have been entered into with related parties during the twelve month periods ending 30 June 2015 and 30 June 2014.
Interest paid on loans from related parties
Services from related parties
Drawdown’s on loans from related parties
Repayment of loans from
related parties
$000 $000 $000 $000
Entity with ultimate control over the consolidated entity
CVC Ltd2015 - - - -
2014 11 - 800 800
CVC Managers Pty Limited2015 - 105 - -
2014 - 105 - -
Entity with ultimate control over the consolidated entity
CVC Ltd holds 54.81% (2014: 52.99%) of the ordinary shares in Cellnet Group Limited.
Terms and conditions of transactions with related parties
The sales to and purchases from related parties are made on terms equivalent to those that prevail in arm’s length transactions.F
or p
erso
nal u
se o
nly

Cellnet Group Limited and its consolidated entities
Annual Report 2014|1558
Notes to the financial statements
24. Key management personnel
(a) Key management personnel remuneration
2015 2014
$000 $000
Short-term employee benefits 971,641 752,976
Post-employment benefits 45,490 29,500
Long term benefits 188,340 -
Total compensation 1,205,471 782,476
25. Subsequent events
There were no matters or circumstances that have arisen since the end of the financial year which significantly affected or may significantly affect the operations of the consolidated entity, the results of those operations, or the state of affairs of the consolidated entity in future periods.
26. Parent entity information
2015 2014
$000 $000
Current assets 14,411 17,950
Total assets 16,400 20,022
Current liabilities (7,120) (10,564)
Total liabilities (7,917) (12,782)
Net assets 8,483 7,220
Issued capital 31,699 31,699
Retained earnings / (accumulated losses) (24,013) (25,028)
Reserve for own shares (26) (26)
Reserve for share based payment 823 575
Total shareholder’s equity 8,483 7,220
Profit / (loss) of the parent entity after tax 1,015 (4,379)
Total comprehensive income of the parent entity 1,015 (4,739)
The parent has not issued any guarantees in relation to the debts of its subsidiaries and has no contingent liabilities or contractual obligations as at 30 June 2015 (2014: Nil).
27. Auditors’ remuneration
2015 2014
$000 $000
Amounts received or due and receivable by the auditors for: Audit or review of the financial report of the entity and any other entity in the consolidated entity
Pitcher Partners 75,000 75,000
Other services in relation to the entity and any other entity in the consolidated entity
Pitcher Partners 17,530 24,000
92,530 99,000
28. Dividends franking account
Franking credit balance
The amount of franking credits available for the subsequent financial year are:
2015 2014
$000 $000
Franking account balance as at the end of the financial year at 30% (2014:30%)
586 586
The above available amounts are based on the balance of the dividend franking account at year end adjusted for:
(i) franking debits that will arise from the refund of the current tax receivable;
(ii) franking debits that will arise from the payment of dividends recognised as a liability at the year end;
(iii) franking credits that will arise from the receipt of dividends recognised as receivables by the tax consolidated entity at the year end; and
(iv) franking credits that the entity may be prevented from distributing in subsequent years.
The ability to utilise the franking credits is dependent upon there being sufficient available profits to declare dividends. The impact on the dividend franking account of dividends proposed after the balance date but not recognised as a liability is to reduce it by $239,000 (2014: $Nil). In accordance with the tax consolidation legislation, the Company as the head entity in the tax-consolidated entity has also assumed the benefit of $Nil (2014: $Nil) franking credits from its Australian wholly-owned subsidiaries during the year.
For
per
sona
l use
onl
y

Cellnet Group Limited and its consolidated entities
Annual Report 2014|15 59
Financial Report
29. Cash flow statement reconciliation
Consolidated
2015 2014
$000 $000
Reconciliation of net profit after tax to net cash flows from operations:
Net profit / (loss) 1,649 (3,887)
Adjustments for:
Depreciation and amortisation 296 394
Impairment - 150
Movement in provision for obsolescence (827) (603)
Movement in provision for impairment 45 (34)
Interest revenue classified as investing cash flow (18) (19)
Share based payments expense 247 -
Changes in assets and liabilities:
(Increase) / decrease in trade and other receivables 1,860 (1,869)
(Increase) / decrease in inventories 1,267 1,050
(Increase) / decrease in current tax assets - 4
(Increase) / decrease in deferred tax assets (14) 2,036
(Decrease) / increase in trade and other payables 2,270 (3,150)
(Decrease) / increase in other financial instruments (994) 732
(Decrease) / increase in provisions 4 (124)
Net cash used in operating activities 5,785 (5,320)
For
per
sona
l use
onl
y

Cellnet Group Limited and its consolidated entities
Annual Report 2014|1560
In accordance with a resolution of the Directors of Cellnet Group Limited, I state that:
In the opinion of the Directors:
a) the financial statements and notes of the company are in accordance with the Corporations Act 2001, including:
i) giving a true and fair view of the company’s financial position as at 30 June 2015 and of their performance for the year ended on that date;
ii) complying with Australian Accounting Standards and Corporations Regulations 2001;
b) the financial statements and notes also comply with International Financial Reporting Standards as disclosed in note 2(a);
c) there are reasonable grounds to believe that the company will be able to pay its debts as and when they become due and payable; and
d) this declaration has been made after receiving the declarations required to be made to the directors in accordance with section 295A of the Corporations Act 2001 for the financial year ending 30 June 2015.
On behalf of the Board
Alexander BeardChairman
Brisbane 24 August 2015
Directors’ declaration
For
per
sona
l use
onl
y

Cellnet Group Limited and its consolidated entities
Annual Report 2014|15 61
Financial Report
Independent Auditor’s Report to the Members of Cellnet Group Limited
Report on the Financial Report
We have audited the accompanying financial report of Cellnet Group Limited, which comprises the consolidated
statement of financial position as at 30 June 2015, the consolidated statement of comprehensive income, the
consolidated statement of changes in equity and the consolidated statement of cash flows for the year then ended,
notes comprising a summary of significant accounting policies and other explanatory information, and the directors’
declaration of the consolidated entity comprising the company and the entities it controlled at the year’s end or from
time to time during the financial year.
Directors’ Responsibility for the Financial Report
The directors of the company are responsible for the preparation of the financial report that gives a true and fair
view in accordance with Australian Accounting Standards and the Corporations Act 2001 and for such internal control
as the directors determine is necessary to enable the preparation of the financial report that gives a true and fair
view and is free from material misstatement, whether due to fraud or error. In Note 2(a), the directors also state, in
accordance with Accounting Standard AASB101 Presentation of Financial Statements, that the financial statements
comply with International Financial Reporting Standards.
Auditor’s Responsibility
Our responsibility is to express an opinion on the financial report based on our audit. We conducted our audit
in accordance with Australian Auditing Standards. Those standards require that we comply with relevant ethical
requirements relating to audit engagements and plan and perform the audit to obtain reasonable assurance whether
the financial report is free from material misstatement.
An audit involves performing procedures to obtain audit evidence about the amounts and disclosures in the financial
report. The procedures selected depend on the auditor’s judgement, including the assessment of the risks of
material misstatement of the financial report, whether due to fraud or error. In making those risk assessments, the
auditor considers internal control relevant to the company’s preparation of the financial report that gives a true and For
per
sona
l use
onl
y

Cellnet Group Limited and its consolidated entities
Annual Report 2014|1562
fair view in order to design audit procedures that are appropriate in the circumstances, but not for the purpose of
expressing an opinion on the effectiveness of the company’s internal control. An audit also includes evaluating the
appropriateness of accounting policies used and the reasonableness of accounting estimates made by the directors,
as well as evaluating the overall presentation of the financial report.
We believe that the audit evidence we have obtained is sufficient and appropriate to provide a basis for our audit
opinion.
Independence
In conducting our audit, we have complied with the independence requirements of the Corporations Act 2001.
Opinion
In our opinion:
a) the financial report of Cellnet Group Limited is in accordance with the Corporations Act 2001, including:
i) giving a true and fair view of the consolidated entity’s financial position as at 30 June 2015 and of its
performance for the year ended on that date; and
ii) complying with Australian Accounting Standards and the Corporations Regulations 2001; and
b) the consolidated financial report also complies with International Financial Reporting Standards as disclosed in
Note 2(a).
Report on the Remuneration Report
We have audited the Remuneration Report included in pages 19 to 25 of the directors’ report for the year ended 30
June 2015. The directors of the company are responsible for the preparation and presentation of the Remuneration
Report in accordance with Section 300A of the Corporations Act 2001. Our responsibility is to express an opinion on
the Remuneration Report, based on our audit conducted in accordance with Australian Auditing Standards.
Opinion
In our opinion the Remuneration Report of Cellnet Group Limited for the year ended 30 June 2015 complies with
Section 300A of the Corporations Act 2001.
PITCHER PARTNERS
J J EVANS
Partner
Brisbane, Queensland
24 August 2015
For
per
sona
l use
onl
y

Cellnet Group Limited and its consolidated entities
Annual Report 2014|15 63
Financial Report
As at 7 September 2015
Additional information required by the Australian Securities Exchange Limited Listing Rules and not disclosed elsewhere in this report is set out below.
Shareholdings
20 largest shareholders
NameOrdinary
share held% of capital
held
CVC Limited 3,0354,904 54.49
McNeil Nominees Pty Limited 3,702,155 6.65
Hesley Consultants Limited 2,800,000 5.03
Bywater Investments Limited 2,074,800 3.72
Ms Amaya Margaret Brookman 1,851,943 3.32
Chemical Trustee Ltd 1,820,000 3.27
Philadelphia Investments Pty Ltd 1,650,274 2.96
TUP Pty Ltd 1,000,000 1.80
Mr Thien Dinh Nguyen 823,731 1.48
Kailva Pty Ltd 500,000 0.90
Angueline Capital Pty Limited 500,000 0.90
Carmant Pty Ltd 220,000 0.39
Citicorp Nominees Pty Limited 203,180 0.36
Mr Simon William Galbraith 196,125 0.35
ASB Nominees Limited 184,246 0.33
Grootemaat Super Pty Ltd 172,901 0.31
Henry Family Superannuation Fund P/L 172,900 0.31
Epic Trustees Limited 147,600 0.26
Organisational Change Consultants P/L 140,000 0.25
334 Capital Pty Ltd 125,000 0.22
Top 20 holders 48,639,759 87.31
All other holders 7,067,352 12.69
All holders 55,707,111 100.00
Substantial shareholders
The number of shares held by substantial shareholders and their associates, as advised in substantial holder notices given to the Company, are set out below:
Name Ordinary share held
CVC Ltd 30,354,904
McNeil Nominees Pty Limited 3,702,155
Hesley Consultants Limited 2,800,000
Distribution of equity security holders
Category No. of holders
1–1000 81
1,001–5,000 527
5,001–10,000 171
10,001–50,000 150
50,001–100,000 20
100,001 and over 26
975
The number of shareholders holding less than a marketable parcel of ordinary shares is 388.
ASX Additional information
For
per
sona
l use
onl
y

Cellnet Group Limited and its consolidated entities
Annual Report 2014|1564
Page left intentionally blank.
For
per
sona
l use
onl
y

ABN 97 010 721 749
Cellnet Group Limited
59-61 Qantas Drive, Eagle Farm, QLD 4009 Australia
t: 1300 255 563 www.cellnet.com.au
For
per
sona
l use
onl
y

For
per
sona
l use
onl
y