Embed Size (px)
Citation preview

Annual financial statements in accordance with International Financial Reporting Standards (IFRS)The Group and Company annual financial statements were audited in terms of the
Companies Act 71 of 2008.
The preparation of the Group and Company annual financial statements was supervised
by the Group chief financial officer, NI Patel, BCom, BCompt (Hons), CA(SA).
These annual financial statements were authorised on 5 March 2013 by the board of
directors.

05Annual financial statements
MTN Group Limited and its subsidiaries
(Registration number: 1994/009584/06)
05
MTN Group Limited Integrated Report for the year ended 31 December 2012 Page 105

05 Annual financial statements
107 Statement of directors’ responsibility
107 Certificate by the company secretary
108 Report of the audit committee
110 Directors’ report
113 Independent auditors’ report
Group annual financial statements114 Group income statement
115 Group statement of comprehensive income
116 Group statement of financial position
117 Group statement of changes in equity
118 Group statement of cash flows
119 Basis of preparation and principal accounting policies
126 Critical accounting estimates and assumptions
129 Operating segments
132 Notes to the Group income statement
140 Notes to the Group statement of financial position
140 Non-current assets
154 Current assets
159 Equity
162 Non-current liabilities
167 Current liabilities
168 Notes to the statement of cash flows
169 Other notes to the Group annual financial statements
Company annual financial statements201 Company statement of comprehensive income
201 Company statement of financial position
202 Company statement of changes in equity
202 Company statement of cash flows
203 Notes to the Company annual financial statements
212 Annexure 1 – Interests in subsidiary companies and joint ventures
Co
nte
nts
MTN Group Limited Financial Report for the year ended 31 December 2012
Statement of directors’ responsibility
The Group’s internal audit function, which operates unimpeded and independently from operational management, and has unrestricted access to the Group’s audit committee, assesses and, when necessary, recommends improvements in the system of internal controls and accounting practices, based on audit plans that take cognisance of the relative degrees of risk of each function or aspect of the business.
The going concern basis has been adopted in preparing the Group and Company annual financial statements. The directors have no reason to believe that the Group or any company within the Group will not be a going concern in the year ahead based on forecasts and available cash resources. These annual financial statements support the viability of the Group and the Company.
The Group’s external auditors, PricewaterhouseCoopers Incorporated and SizweNtsalubaGobodo Incorporated, jointly audited the Group and Company annual financial statements and their unqualified audit report is presented on page 113.
The external auditors were given unrestricted access to all financial records and related data, including minutes of all meetings of shareholders, the board of directors and committees of the board.
The Group annual financial statements and Company annual financial statements which appear on pages 114 to 211 were approved for issue by the board of directors on 5 March 2013 and are signed on its behalf by:
MC RamaphosaChairman
RS DabengwaGroup president and chief executive officerFairland5 March 2013
for the year ended 31 December 2012
The directors are responsible for the integrity of the integrated report as a whole, as well as for the preparation and fair presentation of the annual consolidated financial statements of MTN Group Limited (the Company), its subsidiaries, joint ventures, associates and special purpose entities (together the Group) in accordance with International Financial Reporting Standards (IFRS), and the South African Companies Act, No 71 of 2008 (the Companies Act), which form an integral part of the integrated report.
The preparation of financial statements in conformity with IFRS requires management to consistently apply appropriate accounting policies, supported by reasonable and prudent judgements and estimates.
The directors are of the opinion that the information contained in the annual financial statements fairly presents the financial position at year end and the financial performance and cash flows of the Group and Company.
The directors have responsibility for ensuring that accurate and complete accounting records are kept to enable the Group and Company to satisfy their obligation with respect to the preparation of financial statements.
The Group operates in an established controlled environment, which is documented and regularly reviewed. This incorporates risk management and internal control procedures which are designed to provide reasonable, but not absolute, assurance that assets are safeguarded and that the risks facing the business are controlled.
Nothing has come to the attention of the directors to indicate that any material breakdown in the functioning of these controls, procedures and systems has occurred during the year under review.
The Group audit committee plays an integral role in risk management as well as in overseeing the Group’s integrated reporting and internal audit function.
for the year ended 31 December 2012
Certificate by the company secretary
I certify that MTN Group Limited has filed all its returns and notices for the year ended 31 December 2012, as are required of a public company in terms of section 88(2)(e) of the Companies Act, No 71 of 2008, and that such returns and notices are, to the best of my knowledge and belief, true, correct and up to date.
SB MtshaliCompany secretary
Fairland5 March 2013
05
MTN Group Limited Integrated Report for the year ended 31 December 2012 Page 107

The committee is therefore pleased to report that it
discharged the following responsibilities during the year
under review:
External auditors � Considered the independence and objectivity of the
joint external auditors and ensured that the scope of
non-audit services rendered did not impair their
independence.
� Approved the non-audit-related services performed by
the joint external auditors during the year under review
in accordance with the policy established and approved
by the board.
� Determined the joint external auditors’ terms of
engagement and fees for 2012.
� Satisfied itself that the joint external auditors and the
designated auditors are accredited on the JSE list of
auditors and advisers. The committee therefore
recommends the reappointment of the joint external
auditors and the appointment of the designated
auditors at the next annual general meeting (AGM).
Financial statements and accounting practices � Reviewed the accounting policies and the annual
financial statements of MTN Group for the year ended
31 December 2012 and based on the information
provided to it, the committee considers that, in all
material respects, they are appropriate and comply with
the provisions of the Companies Act, International
Financial Reporting Standards, the SAICA Financial
Reporting Guides as issued by the Accounting Practices
Committee and the JSE Listings Requirements.
� Reviewed the processes in place for the reporting of
concerns and complaints relating to reporting and
accounting practices, internal audit, contents of the
Group’s financial statements, internal financial controls
and any related matters. The committee can confirm
that there were no such complaints of substance during
the year under review.
Internal financial controls � Oversaw the project established by the Group for the
formalisation of the annual review of the design,
implementation and effectiveness of internal financial
controls, most notably in the South African and Nigerian
operations. It is the intention of the Group that all
material operations are incorporated into the formal
annual review of internal financial control by the end
of 2013.
The MTN Group audit committee (the committee)
presents its report in terms of section 94(7)(f) of the
Companies Act and as recommended by King III for the
financial year ended 31 December 2012.
Terms of referenceThe committee has adopted comprehensive and formal
terms of reference which have been approved by the
board and which are reviewed on an annual basis.
Membership, meeting attendance and evaluation Members of the committee are formally nominated by
the board for re-election by shareholders. The committee
meets at least four times a year. The composition of
the committee and the attendance at meetings by
its members are set out below:
Members Attendance
AF van Biljon 4/4
NP Mageza 4/4
J van Rooyen 4/4
MJN Njeke 4/4
JHN Strydom* 2/4
* Withdrawn on 29 May 2012.
The biographical details of members are set out on pages
22 to 25. The committee members’ fees are included in
the table of directors’ emoluments and related payments
on page 87.
The Group president and CEO, Group chief financial
officer, Group chief business risk officer, joint external
auditors and other assurance providers attend committee
meetings by invitation. The committee also meets
separately with the joint external auditors, internal
auditors and senior management before or after every
meeting.
The effectiveness of the audit committee as a whole and
its individual members are assessed on an annual basis.
Execution of functions of the audit committeeThe committee is satisfied that, in respect of the period
under review, it has conducted its affairs and discharged
its duties and responsibilities in accordance with its
terms of reference, the Companies Act and King III. To the
extent that King III recommendations have not been
applied, an explanation is given in the schedule of the
75 King III principles in the Corporate Governance report
on our website.
Report of the audit committee
Page 108 MTN Group Limited Integrated Report for the year ended 31 December 2012

Finance director and finance function � Reviewed the performance of the Group chief financial
officer, Mr NI Patel, and was satisfied that he has the
necessary expertise and experience to fulfil this role
and has performed appropriately during the year under
review.
� Considered, and has satisfied itself of the appropriateness
of the expertise and adequacy of resources of the
finance function and experience of senior members of
the finance function.
Solvency and liquidity review � The committee is satisfied that the board has performed
a solvency and liquidity test on the Company in terms
of sections 4 and 46 of the Companies Act and has
concluded that the Company will satisfy the test after
payment of the final dividend.
In addition, the majority of members of the committee
attended the Group risk management and compliance
and corporate governance committee meetings held
during the year under review.
The Group’s joint external auditors are Pricewaterhouse-
Coopers Inc. and SizweNtsalubaGobodo Inc. Fees paid to
the auditors for the year under review are disclosed in
note 6 of the annual financial statements on page 134.
AF van BiljonChairman
5 March 2013
� Oversaw the process in terms of which internal audit
performed a written assessment of the effectiveness of
the Group’s system of internal control (including
internal financial controls). This written assessment by
internal audit formed the basis of the committee’s
recommendation in this regard to the board in order for
the board to report thereon. The board report on the
effectiveness of the system of internal controls which
the committee fully supports is included in the directors’
report on page 112.
� Reviewed the reports of both internal and external
auditors detailing their concerns arising from their audits
and requested appropriate responses from management.
Integrated reporting and combined assurance � Considered the Group’s sustainability information as
disclosed in the integrated report and has assessed its
accuracy against all the information available to the
committee and the annual financial statements.
� Discussed the sustainability information with the
chairman of the Group risk management, compliance
and corporate governance committee. The committee
is satisfied that the Group has optimised the assurance
coverage obtained from management, external and
internal assurance providers in accordance with an
appropriate combined assurance model.
� At its meeting held on 1 March 2013, considered and
recommended the integrated report for approval by
the board.
Going concern status � Considered the going concern status of the Company
and the Group on the basis of review of the annual
financial statements and the information available to
the committee and recommended such going concern
status for adoption by the board. The board statement
on the going concern status of the Group and
Company is contained on page 110 in the directors’
report.
Internal audit � Considered the effectiveness of the internal audit
function and monitored adherence to the annual
internal audit plan.
� Reviewed the performance, appropriateness and
effectiveness of the chief business risk officer, S Fakie
and was satisfied with his effectiveness.
05
MTN Group Limited Integrated Report for the year ended 31 December 2012 Page 109

Directors’ reportfor the year ended 31 December 2012
Related party transactions Details of related party transactions are set out on pages 178 and 179 of these annual financial statements.
Year under review The detailed reviews and the activities of the Group are contained in the reports of the Group president and chief executive officer, and the Group chief financial officer as set out on pages 32 to 39 of the integrated report.
Borrowing powers In terms of the memorandum of incorporation, the borrowing powers of the Company are unlimited, however all borrowings by the MTN Group are subject to limitations set out in the treasury policy of the Group. The details of borrowings are disclosed in note 25.
Going concernThe directors have reviewed the Group’s budget and cash flow forecast for the year to 31 December 2013. On the basis of this review, and in light of the current financial position and existing borrowing facilities, the directors are satisfied that the Group and Company have access to adequate resources to continue in operational existence for the foreseeable future and are going concerns and have continued to adopt the going concern basis in preparing the annual financial statements.
Subsidiary companies and joint venturesDetails of entities in which MTN Group has a direct or indirect interest are set out in Annexure 1 of the integrated report on pages 212 and 213.
All Group subsidiaries have a year end consistent with that of the Company with the exception of Irancell Telecommunication Company Services (PJSC) (MTN Irancell), a joint venture of the Group that has a year end of 20 December, in line with statutory requirements in Iran.
Distribution to shareholders Final dividend Notice is hereby given that a gross final dividend of 503 cents per share for the period to 31 December 2012 has been declared payable to MTN shareholders. The number of ordinary shares in issue at the date of this declaration is 1 883 484 324 (including 22 337 752 treasury shares).
The dividend will be subject to a maximum local dividend tax rate of 15% which will result in a net dividend of 427,55 cents per share to those shareholders that bear the maximum rate of dividend withholding tax of 75,45 cents per share.
MTN Group Limited’s tax reference number is 9692/942/71/8. In compliance with the requirements of STRATE, the electronic settlement and custody system
Nature of business MTN Group Limited (the Company) incorporated in the Republic of South Africa on 23 November 1994 carries on the business of investing in the telecommunications industry through its subsidiary companies, joint ventures and associated companies. The Group is listed on the JSE Limited. The Company’s registered address is 216 14th Avenue, Fairland, Roodepoort, Gauteng 2195.
Integrated report The board acknowledges its responsibility for the integrity of this integrated report. Guidelines as provided by King III have been adopted in preparation of this integrated report.
Accounting practicesThe Group and Company annual financial statements were prepared in accordance with International Financial Reporting Standards (IFRS) as issued by the International Accounting Standards Board (IASB) and comply with the SAICA Financial Reporting Guides as issued by the Accounting Practices Committee, the JSE Listings Requirements and the requirements of the Companies Act.
Financial results The Group recorded a profit after tax for the year ended 31 December 2012 of R24 068 million (2011: R23 787 million).
Full details of the financial results of the Group and Company are set out on pages 114 to 211 of these annual financial statements and accompanying notes for the year ended 31 December 2012.
Capital expenditure Capital expenditure for the year ended 31 December 2012 totalled R30 101 million (2011: R17 717 million) which comprised the following:
2012Rm
2011
Rm
Property, plant and equipment 27 024 16 258
Land and buildings 311 722
Leasehold improvements 243 315
Network infrastructure 14 862 11 154
Information systems, furniture and office equipment 1 552 811
Capital work in progress/other 9 820 3 173
Vehicles 236 83
Intangible assetsSoftware 3 077 1 459
30 101 17 717
Page 110 MTN Group Limited Integrated Report for the year ended 31 December 2012

Share capitalAuthorised share capitalThere was no change in the authorised share capital of the Company during the year under review. The authorised ordinary share capital of MTN Group is 2,5 billion shares of 0,01 cent each.
Issued share capitalThe issued share capital of the Company is R188 348 (2011: R188 481) comprising 1 883 484 324 (2011: 1 884 811 569) ordinary shares of 0,01 cent each. The issued share capital of the Company was decreased during the year by the cancellation of shares issued to MTN Zakhele, offset by the allotment and issue of shares to employees who exercised share options in terms of the MTN Group Limited share option scheme. Details of these allotments are set out on page 159 of the annual financial statements.
MTN Zakhele Scheme Details of the MTN Zakhele Scheme are set out in note 23.
Details of participation in the MTN Zakhele Scheme by directors of the Company, directors of major subsidiaries and the company secretary are set out on page 95 of the integrated report.
Control of unissued share capitalThe unissued ordinary shares are the subject of a general authority granted to the directors in terms of section 38 of the Companies Act. As this general authority remains valid only until the next AGM, shareholders will be asked at that meeting to consider an ordinary resolution placing the said unissued ordinary shares, up to a maximum of 10% of the Company’s issued share capital, under the control of the directors until the next AGM.
Acquisition of the Company’s own shares At the last AGM held on 29 May 2012, shareholders gave the Company or any of its subsidiaries a general approval in terms of section 48 of the Companies Act, by way of special resolution, for the acquisition of its own shares. As this general approval remains valid only until the next AGM is held on 28 May 2013, shareholders will be asked at that meeting to consider a special resolution to renew this general authority until the next AGM, subject to a maximum extension of 15 months.
During the year under review a subsidiary of the Group acquired 15 573 340 (2011: 6 764 412) shares in the Company at an average share price of R134,07 (2011: R137,50), including costs.
Further details of the authorised and issued shares are set out in note 23.
Shareholders’ interest Details of shareholders’ interest and a shareholder spread analysis are set out on page 211 of the integrated report.
used by the JSE Limited, the salient dates relating to the payment of the dividend are as follows:
Last day to trade cum dividend on the JSE Wednesday, 20 March 2013First trading day ex dividend on the JSE Friday, 22 March 2013Record date Thursday, 28 March 2013Payment date Tuesday, 2 April 2013
No share certificates may be dematerialised or rematerialised between Friday, 22 March 2013 and Thursday, 28 March 2013, both days inclusive. On Tuesday, 2 April 2013, the dividend will be transferred electronically to the bank accounts of certificated shareholders who make use of this facility.
In respect of those who do not use this facility, cheques dated Tuesday, 2 April 2013 will be posted on or about that date. Shareholders who hold dematerialised shares will have their accounts held by the Central Securities Depository Participant or broker credited on Tuesday, 2 April 2013.
The MTN Board confirms that the Group will satisfy the solvency and liquidity test immediately after completion of the dividend distribution.
Interim dividend A gross interim dividend of 321 cents per share (2011: 273 cents per share) amounting to R5 979 million (2011: R5 145 million) in respect of the half year period ended 30 June 2012 was declared on 7 August 2012 and paid to shareholders on 3 September 2012.
Before declaring the interim dividend, the board: � applied the solvency and liquidity test on the Company; and
� reasonably concluded that the Company would satisfy the solvency and liquidity test immediately after payment of the interim dividend.
The payments of future dividends will depend on the board’s ongoing assessment of MTN Group’s earnings, financial position, cash needs, future earnings prospects and other factors.
Shareholders on the South African register who dematerialised their ordinary shares receive payment of their dividends electronically, as provided for by STRATE. For those shareholders who have not yet dematerialised their shareholding in the Company in certificated form, the Company operates an electronic funds transmission service, whereby dividends may be electronically transferred to shareholders’ bank accounts. These shareholders are encouraged to mandate this method of payment for all future dividends, by approaching the Company’s share registrar, Computershare Investor Services Proprietary Limited, whose contact details are set out on page 224 of the notice of the AGM.
05
MTN Group Limited Integrated Report for the year ended 31 December 2012 Page 111

for the year ended 31 December 2012
Directors’ report continued
Employee share schemes Details of the Group’s share schemes are provided on pages 84 and 85 of the remuneration report and in note 44.
Material resolutions There were no material resolutions passed in the Company or its subsidiaries during the year under review.
Mergers and acquisitions Details of the Group’s acquisitions and disposals are disclosed in note 42.
Events after the reporting periodDetails of events after the reporting period are set out in note 40 of these annual financial statements.
American depository receipt facility A sponsored American depository receipt facility has been established. This facility is sponsored by the Bank of New York and details of the administrators are reflected on page 238 of the integrated report.
AGM The AGM will be held at 14:30 on 28 May 2013. Refer to page 216 of the integrated report for further details of the ordinary and special business for consideration at the meeting.
Internal financial controls During the year under review, the board, through the audit committee, assessed the results of the formal documented review of the Company’s system of internal controls and risk management, including the design, implementation and effectiveness of the internal financial controls conducted by internal audit and considered information and explanations given by management and discussions with the external auditors on the results of the audit. Although the audit identified certain weaknesses in financial controls, whether in design, implementation or execution, the board does not consider these control weaknesses (individually or in combination with other weaknesses) to have resulted in actual material financial loss, fraud or material errors. Based on the above results nothing has come to the attention of the board that caused it to believe that the Company’s system of internal controls and risk management is not effective and that the internal financial controls do not form a sound basis for the preparation of reliable financial statements. The board’s opinion is supported by the audit committee.
Audit committee The report of the audit committee appears on page 108 of the integrated report.
Auditors PricewaterhouseCoopers Inc. and SizweNtsalubaGobodo Inc. will continue in office as joint auditors in accordance with section 90 of the Companies Act. Suren Sooklal will be the registered audit partner who will be undertaking the audit for PricewaterhouseCoopers Inc. Suleman Lockhat will be the registered audit partner who will be undertaking the audit for SizweNtsalubaGobodo Inc. The audit committee reviewed the independence of the auditors during the period under review and satisfied itself that the auditors were independent of the Group.
Share price performance Details of the share price performance of the Company are set out on page 235 of the integrated report.
Directorate The composition and profiles of the board of directors of the Company are set out on page 22 and the information on the board and board committees, its activities, appointment policy, meetings and attendance are set out in the corporate governance statement appearing on page 73 of the integrated report.
Details of directors’ remuneration and shareholding are set out in the remuneration report on pages 87 to 95 of the integrated report.
Retirement by rotation of directorsIn accordance with the Company’s memorandum of incorporation (MOI) MC Ramaphosa (chairman), RS Dabengwa, NI Patel and AT Mikati retire by rotation at the forthcoming AGM. The retiring directors, being eligible, offer themselves for re-election with the exception of MC Ramaphosa, who will be retiring at the next AGM. Following a review of his business related commitments, MC Ramaphosa has informed the Company that he wishes to relinquish his position as non-executive director and chairman of the Company.
In accordance with the policy adopted by the board and the MOI of the Company, directors who have been in office for an aggregate period in excess of nine years, are required to retire at the next AGM and at each GM thereafter. Accordingly, AF van Biljon and JHN Strydom (non-executive directors), who have served on the board for an aggregate period of nine years, retire at the forthcoming AGM and are eligible and offer themselves for re-election following an evaluation of their independence.
The profiles of the directors retiring by rotation and seeking re-election are set out on page 217 of the integrated report.
Resignations and appointments During the year under review, F Titi was appointed to the board as an independent non-executive director, with effect from 1 July 2012. His appointment is subject to shareholder approval at the next AGM to be held on 28 May 2013.
There were no resignations other than those mentioned above.
Interests of directors and prescribed officers Details of the interests of directors and prescribed officers are provided in the remuneration report on page 95 of the integrated report.
Directors’ and prescribed officers’ shareholdings and dealings Details of the directors’ and prescribed officers’ shareholdings and dealings are provided in the remuneration report on page 95 of the integrated report.
Page 112 MTN Group Limited Integrated Report for the year ended 31 December 2012

05
MTN Group Limited Integrated Report for the year ended 31 December 2012 Page 113
We believe that the audit evidence we have obtained is
sufficient and appropriate to provide a basis for our audit
opinion.
OpinionIn our opinion, the consolidated and separate annual
financial statements present fairly, in all material respects,
the consolidated and separate financial position of
MTN Group Limited as at 31 December 2012, and its
consolidated and separate financial performance and its
consolidated and separate cash flows for the year then
ended in accordance with International Financial
Reporting Standards and in the manner required by the
Companies Act of South Africa.
Other reports required by the Companies Act As part of our audit of the consolidated and separate
annual financial statements for the year ended
31 December 2012, we have read the directors’ report, the
report of the audit committee and the certificate by the
company secretary for the purpose of identifying whether
there are material inconsistencies between these reports
and the audited consolidated and separate annual
financial statements. These reports are the responsibility
of the respective preparers. Based on reading these
reports we have not identified material inconsistencies
between these reports and the audited consolidated and
separate annual financial statements. However, we have
not audited these reports and accordingly do not express
an opinion on these reports.
PricewaterhouseCoopers Inc.Director: S SooklalRegistered auditor
Sunninghill
5 March 2013
SizweNtsalubaGobodo Inc. Director: SY LockhatRegistered auditor
Woodmead
5 March 2013
We have audited the consolidated and separate annual
financial statements of MTN Group Limited, which
comprise the statements of financial position as at
31 December 2012 and the income statement, statements
of comprehensive income, statements of changes in
equity and statements of cash flows for the year then
ended, and the notes comprising significant accounting
policies and explanatory information, as set out in pages
114 to 211 and specified sections of the remuneration
report contained within pages 87 to 95.
Directors’ responsibility for the annual financial statementsThe Company’s directors are responsible for the
preparation and fair presentation of these consolidated
and separate annual financial statements in accordance
with International Financial Reporting Standards and
the requirements of the Companies Act of South Africa,
and for such internal control as the directors determine
is necessary to enable the preparation of the
consolidated and separate annual financial statements
that are free from material misstatements, whether due
to fraud or error.
Auditors’ responsibilityOur responsibility is to express an opinion on these
annual financial statements based on our audit. We
conducted our audit in accordance with International
Standards on Auditing. Those standards require that we
comply with ethical requirements and plan and perform
the audit to obtain reasonable assurance whether the
consolidated and separate annual financial statements
are free from material misstatement.
An audit involves performing procedures to obtain audit
evidence about the amounts and disclosures in the
annual financial statements. The procedures selected
depend on the auditor’s judgement, including the
assessment of the risks of material misstatement of the
annual financial statements, whether due to fraud or
error. In making those risk assessments, the auditor
considers internal control relevant to the entity’s
preparation and fair presentation of the annual financial
statements in order to design audit procedures that are
appropriate in the circumstances, but not for the purpose
of expressing an opinion on the effectiveness of the
entity’s internal control. An audit also includes evaluating
the appropriateness of accounting policies used and
the reasonableness of accounting estimates made by
management, as well as evaluating the overall
presentation of the annual financial statements.
for the year ended 31 December 2012
Independent auditors’ report to the shareholders of MTN Group Limited

for the year ended 31 December 2012
Group income statement
Note
2012Rm
2011
Rm
Revenue 4 135 112 121 884
Other income 5 894 1 458
Direct network operating costs (20 464) (18 782)
Costs of handsets and other accessories (9 789) (8 160)
Interconnect and roaming (15 041) (13 395)
Employee benefits 6 (7 775) (6 754)
Selling, distribution and marketing expenses (16 052) (14 805)
Other operating expenses (8 359) (6 793)
Reversal of impairment of property, plant and equipment 11 59 97
Impairment of property, plant and equipment 11 (21) –
EBITDA 58 564 54 750
Depreciation of property, plant and equipment 11 (14 860) (13 296)
Amortisation of intangible assets 12 (2 386) (2 163)
Impairment of goodwill 12 – (31)
Operating profit 6 41 318 39 260
Finance income 7 5 966 5 028
Finance costs 7 (10 123) (6 610)
Share of results of associates after tax 13 (180) (38)
Profit before tax 36 981 37 640
Income tax expense 8 (12 913) (13 853)
Profit after tax 24 068 23 787
Attributable to: Equity holders of the Company 20 704 20 754
Non-controlling interests 3 364 3 033
24 068 23 787
Basic earnings per share (cents) 9 1 126,4 1 119,5
Diluted earnings per share (cents) 9 1 119,5 1 110,8
Page 114 MTN Group Limited Integrated Report for the year ended 31 December 2012

for the year ended 31 December 2012
Group statement of comprehensive income
2012
Rm2011
Rm
Profit after tax 24 068 23 787
Other comprehensive income after tax:Exchange differences on translating foreign operations1 (3 507) 10 796
Attributable to equity holders of the Company (3 498) 10 415
Attributable to non-controlling interests (9) 381
Total comprehensive income for the year 20 561 34 583
Attributable to:Equity holders of the Company 17 206 31 169
Non-controlling interests 3 355 3 414
20 561 34 583
1This component of other comprehensive income does not attract any tax.
05
MTN Group Limited Integrated Report for the year ended 31 December 2012 Page 115

at 31 December 2012
Group statement of financial position
Note
2012Rm
2011
Rm
ASSETS
Non-current assets 121 097 113 787
Property, plant and equipment 11 77 485 71 610
Intangible assets and goodwill 12 33 935 34 540
Investment in associates 13 1 765 2 681
Loans and other non-current receivables 14 6 475 3 672
Deferred tax assets 15 1 437 1 284
Current assets 60 287 67 621
Non-current assets held for sale 16 1 373 820
58 914 66 801
Inventories 17 2 593 2 629
Trade and other receivables 18 17 523 17 916
Taxation prepaid 31 556 415
Current investments 19 7 074 9 480
Derivative assets 20 191 9
Restricted cash 21 5 277 546
Cash and cash equivalents 22 25 700 35 806
Total assets 181 384 181 408
EQUITY
Ordinary share capital and share premium 23 42 593 44 678
Retained earnings 62 247 56 567
Other reserves 24 (15 834) (12 348)
Attributable to equity holders of the Company 89 006 88 897
Non-controlling interests 3 881 3 802
Total equity 92 887 92 699
LIABILITIES
Non-current liabilities 33 307 33 392
Borrowings 25 21 742 23 554
Deferred tax liabilities 15 8 782 8 036
Other non-current liabilities 26 2 320 1 802
Provisions 27 461 –
Derivative liabilities 20 2 –
Current liabilities 55 190 55 317
Trade and other payables 29 25 915 25 054
Unearned income 7 011 7 330
Provisions 27 4 017 3 252
Taxation liabilities 31 7 227 9 037
Borrowings 25 10 621 9 869
Derivative liabilities 20 14 4
Put option liability 28 216 178
Bank overdrafts 22 169 593
Total liabilities 88 497 88 709
Total equity and liabilities 181 384 181 408
Page 116 MTN Group Limited Integrated Report for the year ended 31 December 2012

for the year ended 31 December 2012
Group statement of changes in equity
Note
Sharecapital
Rm
Sharepremium
Rm
Retained earnings
Rm
Otherreserves
Rm
Attri-butable
to equityholders
of the Company
Rm
Non-controlling
interests Rm
Total equity
Rm
Balance at 1 January 2011 * 45 602 48 977 (22 724) 71 855 2 219 74 074
Share buy-back * (930) – – (930) – (930)
Shares issued during the year * 6 – – 6 – 6
Transfer between reserves – – 37 (37) – – –
Settlement of put option – – (1 603) (59) (1 662) 1 662 –
Transactions with
non-controlling interests – – – (30) (30) (224) (254)
Share-based payment reserve – – – 74 74 – 74
Total comprehensive income – – 20 754 10 415 31 169 3 414 34 583
Profit after tax – – 20 754 – 20 754 3 033 23 787
Other comprehensive income – – – 10 415 10 415 381 10 796
Dividends paid 10 – – (11 722) – (11 722) (2 954) (14 676)
Other movements – – 124 13 137 (315) (178)
Balance at 31 December 2011 * 44 678 56 567 (12 348) 88 897 3 802 92 699
Balance at 1 January 2012 * 44 678 56 567 (12 348) 88 897 3 802 92 699 Share buy-back * (2 088) – – (2 088) – (2 088)Shares issued during the year * 3 – – 3 – 3 Shares cancelled * – – – * – *Transfer between reserves – – 22 (22) – – –Transactions with
non-controlling interests – – – (122) (122) (55) (177)Share-based payment reserve – – – 147 147 – 147 Total comprehensive income – – 20 704 (3 498) 17 206 3 355 20 561 Profit after tax – – 20 704 – 20 704 3 364 24 068 Other comprehensive income – – – (3 498) (3 498) (9) (3 507)Dividends paid 10 – – (14 919) – (14 919) (3 255) (18 174)Other movements – – (127) 9 (118) 34 (84)
Balance at 31 December 2012 * 42 593 62 247 (15 834) 89 006 3 881 92 887
Note 23 23 24
*Amounts less than R1 million.
05
MTN Group Limited Integrated Report for the year ended 31 December 2012 Page 117

for the year ended 31 December 2012
Group statement of cash flows
Note
2012Rm
20111
Rm
CASH FLOWS FROM OPERATING ACTIVITIES
Cash generated from operations 30 57 856 50 277
Finance income received 3 075 1 982
Finance costs paid (3 768) (3 341)
Dividends paid to equity holders of the Company (14 919) (11 722)
Dividends paid to non-controlling interests (3 018) (2 647)
Income tax paid 31 (14 303) (9 414)
Dividends received from associates 13 155 92
Net cash generated from operating activities 25 078 25 227
CASH FLOWS FROM INVESTING ACTIVITIES
Acquisition of property, plant and equipment (22 572) (14 103)
– to maintain operations (203) (1 024)
– to expand operations (22 369) (13 079)
Proceeds from sale of property, plant and equipment and intangible assets 235 36
Acquisition of intangible assets (3 250) (1 488)
Loans receivable repaid – 2 271
Loans receivable granted (515) (126)
Increase in investment in associates (360) (1 915)
Proceeds from/(investment in) bonds, treasury bills and foreign deposits 1 968 (8 508)
Proceeds on disposal of non-current assets held for sale 5 1 405 3 217
Advance received on non-current assets held for sale 40 158 –
Increase in restricted cash (4 128) –
Net cash used in investing activities (27 059) (20 616)
CASH FLOWS FROM FINANCING ACTIVITIES
Proceeds from the issuance of ordinary shares 23 3 6
Acquisition of treasury shares 23 (2 088) (930)
Net cash outflows from changes in shareholding 42 (177) (254)
Proceeds from borrowings 11 108 4 848
Repayment of borrowings (14 552) (10 007)
Increase in restricted cash – (182)
Settlement of Nigeria put option – (2 817)
Other financing activities (53) (50)
Net cash used in financing activities (5 759) (9 386)
Net decrease in cash and cash equivalents (7 740) (4 775)
Net cash and cash equivalents at beginning of the year 35 213 35 907
Exchange (losses)/gains on cash and cash equivalents (1 942) 4 081
Net cash and cash equivalents at end of the year 22 25 531 35 213
The cash flows shown above are presented net of VAT.1 2011 amounts reclassified, refer to note 45.
Page 118 MTN Group Limited Integrated Report for the year ended 31 December 2012

1. Basis of preparation and principal accounting policies
1.1 Basis of preparationThe consolidated and separate annual financial statements have been prepared in accordance with International Financial
Reporting Standards (IFRS) as issued by the International Accounting Standards Board (IASB) and comply with the SAICA
Financial Reporting Guides as issued by the Accounting Practices Committee, the JSE Listings Requirements and the
requirements of the South African Companies Act, No 71 of 2008. The Group and the Company have adopted all new
accounting pronouncements that became effective in the current reporting period, none of which had a material impact
on the Group or the Company.
The financial statements have been prepared on the historical cost basis, except for certain financial instruments
that have been measured at fair value. The methods used to measure fair value are discussed further in the
accounting policies in the respective notes.
Amounts are rounded to the nearest million with the exception of earnings per share and the related shares (note 9),
ordinary share capital and share premium (note 23) and share-based payments (note 44).
The preparation of financial statements in conformity with IFRS requires management to make judgements,
estimates and assumptions that affect the application of accounting policies and the reported amounts of assets,
liabilities, income and expenses. Actual results may differ from these estimates. Estimates and underlying
assumptions are reviewed on an ongoing basis. Revisions to accounting estimates are recognised in the period in
which the estimates are revised and in any future periods affected. Information about significant areas of estimation
uncertainty and critical judgements in applying accounting policies that have the most significant effect on the
amounts recognised in the consolidated annual financial statements are included in note 2.
1.2 Going concernThe Group’s and Company’s forecasts and projections, taking account of reasonably possible changes in trading
performance, show that the Group and Company should be able to operate within their current funding levels.
After making enquiries, the directors have a reasonable expectation that the Group and Company have adequate
resources to continue in operational existence for the foreseeable future. The Group and Company therefore
continue to adopt the going concern basis in preparing the annual financial statements.
1.3 Principal accounting policies1
The principal accounting policies applied in the preparation of these consolidated annual financial statements are
set out below and in the related notes and are consistent with those adopted in the prior year, unless otherwise
stated.
1.3.1 Consolidation of subsidiariesThe Group annual financial statements incorporate the annual financial statements of MTN Group Limited and
all its subsidiaries, joint ventures, associates and special purpose entities (SPEs) for the reporting date
31 December 2012 on the basis outlined below.
Subsidiaries are all entities (including SPEs) controlled by the Group. Control exists when the Group has the power to
govern the financial and operating policies of an entity so as to obtain benefits from its activities, generally
accompanying shareholding of more than one-half of the voting rights. The existence and effect of potential voting
rights that are currently exercisable or currently convertible are considered when assessing whether the Group has
the power to control another entity. The Group also assesses existence of control where it does not have more
than 50% of the voting power but is able to govern the financial and operating policies by virtue of de facto control.
De facto control may arise in circumstances where the size of the Group’s voting rights relative to the size and
dispersion of holdings of other shareholders give the Group the power to govern the financial and operating policies.
Subsidiaries are fully consolidated from the date on which control is transferred to the Group and are deconsolidated
from the date that control ceases.
1 The principal accounting policies applied in the Company annual financial statements are consistent with those applied in the Group annual financial
statements.
Notes to the Group annual financial statementsfor the year ended 31 December 2012
05
MTN Group Limited Integrated Report for the year ended 31 December 2012 Page 119

Notes to the Group annual financial statements continued
for the year ended 31 December 2012
1. Basis of preparation and principal accounting policies (continued)1.3 Principal accounting policies (continued)1.3.1 Consolidation of subsidiaries (continued)
SPEs (including insurance cell captives and the various MTN Group share schemes) are consolidated when the
substance of the relationship indicates that the SPE is controlled by the Group. The following indicators are
considered:
�� in substance, the activities of the SPE are being conducted on behalf of the Group according to its specific
business needs so that the Group obtains benefits from the SPE’s operation;
�� in substance, the Group has the decision-making powers to obtain the majority of the benefits of the activities of
the SPE or, by setting up an “autopilot” mechanism, the Group has delegated these decision-making powers;
�� in substance, the Group has rights to obtain the majority of the benefits of the SPE and therefore may be exposed
to risks incidental to the activities of the SPE; or
�� in substance, the Group retains the majority of the residual or ownership risks related to the SPE or its assets in
order to obtain benefits from its activities.
All intercompany transactions, balances and unrealised gains on transactions between Group companies are
eliminated on consolidation. Unrealised losses are also eliminated and are considered an impairment indicator of
the asset transferred.
Non-controlling interests in the net assets of consolidated subsidiaries are identified separately from the Group’s
equity. Non-controlling interests consist of the amount of those interests at the date of the business combination
and the non-controlling interests’ share of changes in equity since the acquisition date. Total comprehensive
income is attributed to non-controlling interests even if this results in the non-controlling interests having a
deficit balance.
The acquisition method is used to account for the acquisition of subsidiaries by the Group. The consideration
transferred is measured at the fair value of the assets given, equity instruments issued and liabilities incurred or
assumed at the date of acquisition. The consideration transferred includes the fair value of any asset or liability
resulting from a contingent consideration arrangement. Acquisition-related costs are recognised in profit or loss.
Identifiable assets acquired and liabilities and contingent liabilities assumed in a business combination are measured
initially at their fair values at the acquisition date, irrespective of the extent of any non-controlling interests.
Goodwill is measured as the excess of the sum of the consideration transferred, the amount of any non-controlling
interests in the acquiree, and the fair value of the acquirer’s previously held equity interest in the acquiree (if any)
over the net of the acquisition date amounts of the identifiable assets acquired and liabilities assumed. If, after
reassessment, the net of the acquisition date amounts of the identifiable assets acquired and liabilities assumed
exceeds the sum of the consideration transferred, the amount of any non-controlling interests in the acquiree and
the fair value of the acquirer’s previously held interest in the acquiree (if any), such excess is recognised immediately
in profit or loss as a bargain purchase gain.
When the consideration transferred by the Group in a business combination includes assets or liabilities resulting
from a contingent consideration arrangement, the contingent consideration is measured at its acquisition date fair
value and included as part of the consideration transferred. Changes in the fair value of the contingent consideration
that qualify as measurement period adjustments are adjusted retrospectively, with corresponding adjustments
against goodwill. Measurement period adjustments are adjustments that arise from additional information obtained
during the “measurement period” (which cannot exceed one year from the acquisition date) about facts and
circumstances that existed at the acquisition date.
Page 120 MTN Group Limited Integrated Report for the year ended 31 December 2012

1. Basis of preparation and principal accounting policies (continued)1.3 Principal accounting policies (continued)1.3.1 Consolidation of subsidiaries (continued)
The subsequent accounting for changes in the fair value of the contingent consideration that do not qualify as
measurement period adjustments depends on how the contingent consideration is classified. Contingent
consideration that is classified as equity is not remeasured at subsequent reporting dates and its subsequent
settlement is accounted for within equity. Contingent consideration that is classified as an asset or a liability is
remeasured at subsequent reporting dates in accordance with IAS 39 Financial Instruments: Recognition and
Measurement, or IAS 37 Provisions, Contingent Liabilities and Contingent Assets, as appropriate, with the corresponding
gain or loss being recognised in profit or loss.
When a business combination is achieved in stages, the Group’s previously held equity interest in the acquiree is
remeasured to fair value at the acquisition date (i.e. the date when the Group obtains control) and the resulting gain
or loss, if any, is recognised in profit or loss. Amounts arising from an interest in the acquiree prior to the acquisition
date that have previously been recognised in other comprehensive income, are reclassified to profit or loss where
such treatment would be appropriate if that interest were disposed of.
Non-controlling interests in the acquiree may initially be measured either at fair value or at the non-controlling
shareholders’ proportion of the net fair value of the identifiable assets acquired and liabilities and contingent
liabilities assumed. The choice of measurement basis is made on an acquisition-by-acquisition basis.
Non-controlling shareholders are treated as equity participants and, therefore, all acquisitions of non-controlling
interests or disposals by the Group of its interests in subsidiary companies, where control is maintained subsequent
to the disposal, are accounted for as equity transactions. Consequently, the difference between the fair value of the
consideration transferred and the carrying amount of a non-controlling interest purchased is recorded in equity. All
profits or losses arising as a result of the disposal of interests in subsidiaries to non-controlling shareholders, where
control is maintained subsequent to the disposal, are also recorded in equity.
When the Group ceases to have control, any retained interest in the entity is remeasured to its fair value, with the
change in carrying amount recognised in profit or loss. The fair value is the initial carrying amount for the purposes
of subsequently accounting for the retained interest as an associate, joint venture or financial asset. In addition, any
amounts previously recognised in other comprehensive income in respect of that entity are accounted for as if the
Group had directly disposed of the related assets or liabilities. This may mean that amounts previously recognised
in other comprehensive income are reclassified to profit or loss.
Accounting policies of subsidiaries have been changed where necessary to align them with the policies adopted
by the Group.
The Company accounts for investments in subsidiaries at cost, less accumulated impairment losses.
05
MTN Group Limited Integrated Report for the year ended 31 December 2012 Page 121

Notes to the Group annual financial statements continued
for the year ended 31 December 2012
1. Basis of preparation and principal accounting policies (continued)1.3 Principal accounting policies (continued)1.3.2 Foreign currency
Functional and presentation currencyItems included in the annual financial statements of each entity in the Group are measured using the currency that
best reflects the primary economic environment in which the entity operates (the functional currency). The Group
annual financial statements are presented in South African rand, which is the functional and presentation currency
of the parent company and the presentation currency of the Group.
Transactions and balancesForeign currency transactions are translated into the functional currency using the exchange rates at the dates of
the transactions. Foreign exchange gains or losses resulting from the settlement of such transactions and from the
translation at reporting date exchange rates of monetary assets and liabilities denominated in foreign currencies are
recognised in profit or loss except when deferred in other comprehensive income as qualifying cash flow hedges.
Translation of foreign operationsThe results, cash flows and financial position of all Group entities (none of which have been accounted for as entities
operating in hyperinflationary economies) that have a functional currency different from the presentation currency
of the Group are translated into the presentation currency as follows:
�� assets and liabilities are translated at rates of exchange ruling at the reporting date;
�� specific transactions in equity are translated at rates of exchange ruling at the transaction dates;
�� income and expenditure and cash flow items are translated at weighted average exchange rates for the period;
and
�� foreign exchange translation differences are recognised as other comprehensive income.
An entity may have a monetary item that is receivable from or payable to a foreign operation. An item for which
settlement is neither planned nor likely to occur in the foreseeable future is, in substance, a part of the entity’s net
investment in that foreign operation. On consolidation, exchange differences arising from the translation of the net
investment in foreign operations are taken to other comprehensive income.
Goodwill and fair value adjustments arising on the acquisition of a foreign entity are treated as assets and liabilities
of the foreign entity and translated at the exchange rate ruling at the reporting date. Exchange differences arising
are recognised in other comprehensive income.
The exchange rates relevant to the Group are disclosed in note 39.
Disposal of foreign operationsOn the disposal of a foreign operation, all of the exchange differences accumulated in equity in respect of that
operation attributable to the equity holders of the Group are reclassified to profit or loss.
In the case of a partial disposal that does not result in the Group losing control over a subsidiary that includes a
foreign operation, the proportionate share of accumulated exchange differences is re-attributed to non-controlling
interests and are not recognised in profit or loss. For all other partial disposals, the proportionate share of the
accumulated exchange differences is reclassified to profit or loss.
Page 122 MTN Group Limited Integrated Report for the year ended 31 December 2012

1. Basis of preparation and principal accounting policies (continued)1.3 Principal accounting policies (continued)1.3.3 Measurement principles
Key assets and liabilities shown in the consolidated statement of financial position are measured as follows:
Items included in the statement of financial position Measurement principle
Items included in the statement of financial position Measurement principle
Assets LiabilitiesNon-current assets Non-current liabilitiesProperty, plant and equipment
Historical cost, less accumulated depreciation and impairment losses
Borrowings Amortised cost
Intangible assets Historical cost, less accumulated amortisation and impairment losses
Deferred tax liabilities Undiscounted amount measured at the tax rates that are expected to apply to the period when the liability is settled
Goodwill Historical cost, less impairment losses
Finance lease obligations
Amortised cost
Investment in associates
Pro-rata value of investment's equity carried forward plus goodwill
Provisions Present value of settlement amount
Loans receivable Amortised cost Other Cost
Prepayments Cost Derivative liabilities Fair value
Deferred tax assets Undiscounted amount measured at the tax rates that are expected to apply to the period when the asset is realised
Current assets Current liabilitiesNon-current assets held for sale
Lower of carrying amount and fair value less costs to sell
Trade and other payables
Amortised cost
Inventories Lower of cost and net realisable value
Unearned income Cost
Trade receivables Amortised cost Provisions Present value of settlement amount
Prepayments Cost Taxation liabilities Amount expected to be paid to the tax authorities, using tax rates that have been enacted or substantively enacted at the reporting date
Sundry debtors and advances
Amortised cost Borrowings Amortised cost
Taxation prepaid Amount expected to be recovered from the tax authorities, using tax rates that have been enacted or substantively enacted at the reporting date
Derivative liabilities Fair value
Current investments Amortised cost Put option liabilities Amortised cost
Derivative assets Fair value Bank overdrafts Amortised cost
Restricted cash Amortised cost
Cash and cash equivalents
Amortised cost
05
MTN Group Limited Integrated Report for the year ended 31 December 2012 Page 123

Notes to the Group annual financial statements continued
for the year ended 31 December 2012
1. Basis of preparation and principal accounting policies (continued)1.4 New accounting pronouncements
The Group has adopted all the new, revised or amended accounting pronouncements as issued by the IASB which
were effective for the Group from 1 January 2012. None of the adopted pronouncements had a material impact on
the Group’s results for the year ended 31 December 2012.
The pronouncements listed below will be effective in future reporting periods and are considered significant to the
Group. The Group has elected not to early adopt the new pronouncements. It is expected that the Group will adopt
the new pronouncements on their effective dates in accordance with the requirements of the pronouncements.
Topic Key requirement Effective date
IFRS 9 Financial
Instruments
IFRS 9 is the first standard issued as part of a wider project to replace
IAS 39. IFRS 9 retains but simplifies the mixed measurement model
and establishes two primary measurement categories for financial
assets: amortised cost and fair value. The basis of classification
depends on the entity’s business model and the contractual cash
flow characteristics of the financial asset. The guidance in IAS 39 on
impairment of financial assets and hedge accounting continues to
apply.
The adoption of IFRS 9 is not expected to change the measurement
of the Group’s financial assets and liabilities significantly, but will
require a review of the current classification of financial assets and
liabilities.
1 January 2015
IFRS 10 Consolidated
Financial Statements
The objective of IFRS 10 is to establish principles for the presentation
and preparation of consolidated financial statements when an
entity controls one or more other entities. IFRS 10 defines the
principle of control and establishes it as the basis for consolidation.
It further sets out how to apply the principle of control to identify
whether an investor controls an investee and therefore must
consolidate the investee. It further sets out the accounting
requirements for the preparation of consolidated financial
statements.
IFRS 10 is not expected to result in a significant change in the
financial results of the Group but will require a detailed analysis of
existing control relationships.
1 January 2013
IFRS 11 Joint
Arrangements
IFRS 11 places a focus on rights and obligations of joint arrangements
rather than its legal form. There are two types of joint arrangements:
joint operations and joint ventures. Joint operations arise where a
joint operator has rights to the assets and obligations relating to the
arrangement and hence accounts for its interest in assets, liabilities,
revenue and expenses. Joint ventures arise where the joint operator
has rights to the net assets of the arrangement and hence equity
accounts for its interest.
1 January 2013
Page 124 MTN Group Limited Integrated Report for the year ended 31 December 2012
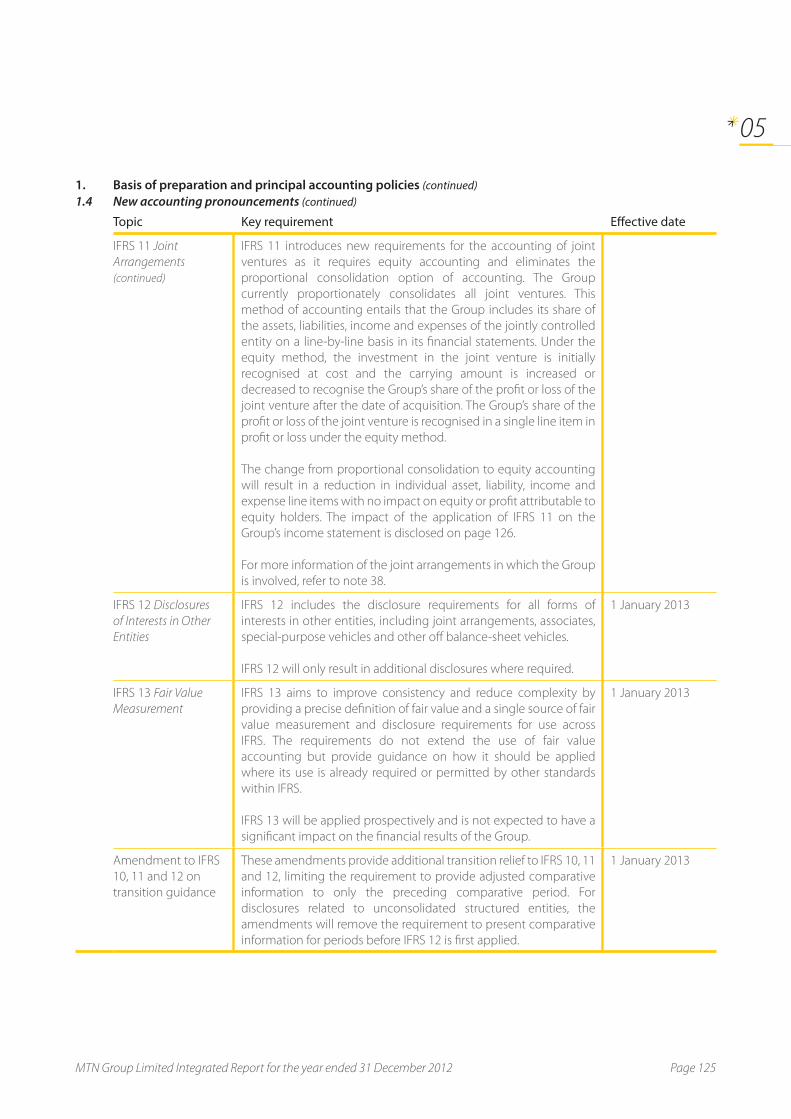
1. Basis of preparation and principal accounting policies (continued)1.4 New accounting pronouncements (continued)
Topic Key requirement Effective date
IFRS 11 Joint
Arrangements
(continued)
IFRS 11 introduces new requirements for the accounting of joint
ventures as it requires equity accounting and eliminates the
proportional consolidation option of accounting. The Group
currently proportionately consolidates all joint ventures. This
method of accounting entails that the Group includes its share of
the assets, liabilities, income and expenses of the jointly controlled
entity on a line-by-line basis in its financial statements. Under the
equity method, the investment in the joint venture is initially
recognised at cost and the carrying amount is increased or
decreased to recognise the Group’s share of the profit or loss of the
joint venture after the date of acquisition. The Group’s share of the
profit or loss of the joint venture is recognised in a single line item in
profit or loss under the equity method.
The change from proportional consolidation to equity accounting
will result in a reduction in individual asset, liability, income and
expense line items with no impact on equity or profit attributable to
equity holders. The impact of the application of IFRS 11 on the
Group’s income statement is disclosed on page 126.
For more information of the joint arrangements in which the Group
is involved, refer to note 38.
IFRS 12 Disclosures
of Interests in Other
Entities
IFRS 12 includes the disclosure requirements for all forms of
interests in other entities, including joint arrangements, associates,
special-purpose vehicles and other off balance-sheet vehicles.
IFRS 12 will only result in additional disclosures where required.
1 January 2013
IFRS 13 Fair Value
Measurement
IFRS 13 aims to improve consistency and reduce complexity by
providing a precise definition of fair value and a single source of fair
value measurement and disclosure requirements for use across
IFRS. The requirements do not extend the use of fair value
accounting but provide guidance on how it should be applied
where its use is already required or permitted by other standards
within IFRS.
IFRS 13 will be applied prospectively and is not expected to have a
significant impact on the financial results of the Group.
1 January 2013
Amendment to IFRS
10, 11 and 12 on
transition guidance
These amendments provide additional transition relief to IFRS 10, 11
and 12, limiting the requirement to provide adjusted comparative
information to only the preceding comparative period. For
disclosures related to unconsolidated structured entities, the
amendments will remove the requirement to present comparative
information for periods before IFRS 12 is first applied.
1 January 2013
05
MTN Group Limited Integrated Report for the year ended 31 December 2012 Page 125

Notes to the Group annual financial statements continued
for the year ended 31 December 2012
1. Basis of preparation and principal accounting policies (continued)1.4 New accounting pronouncements (continued)
Impact of the application of IFRS 11The application of IFRS 11 will change the subsequent accounting of the Group’s investment in joint ventures, which are currently accounted for using the proportionate consolidation method under IAS 31 Interests in Joint Ventures. Under IFRS 11, the Group’s joint ventures will subsequently be accounted for using the equity method.
The change in accounting for the Group’s investments in joint ventures will be applied in accordance with the relevant transitional provisions. The initial investment as at 1 January 2012 for the purposes of applying the equity method is measured as the aggregate of the carrying amounts of the assets and liabilities that the Group had previously proportionately consolidated.
Such a change in accounting will affect the amounts reported in the Group’s consolidated financial statements. The impact on the Group’s income statement is presented below.
Currently reported
Rm
Adjustmentsrequired in
accordancewith IFRS 11
Rm
Reported in accordance with IFRS 111
Rm
2012Revenue 135 112 (13 247) 121 865EBITDA 58 564 (5 929) 52 635 Operating profit 41 318 (4 636) 36 682 Share of results of joint ventures – 848 848 Profit for the year 24 068 – 24 068
1 Effective 1 January 2013.
2. Critical accounting estimates and assumptions2
The Group makes estimates and assumptions concerning the future when preparing the consolidated annual financial statements. Actual results may differ from these estimates. The estimates and assumptions that have a significant risk of causing a material adjustment to the carrying amounts of assets and liabilities within the next financial year are discussed below.
The “Critical accounting estimates and assumptions” note should be read in conjunction with the “Principal accounting policies” disclosed in note 1.
2.1 Impairment of goodwillThe Group tests goodwill for impairment on an annual basis, in accordance with the accounting policy disclosed in note 12. The recoverable amounts of cash-generating units have been determined based on value-in-use calculations. These calculations are performed internally by the Group and require the use of estimates and assumptions.
The input factors most sensitive to change are management estimates of future cash flows based on budgets and forecasts, growth rates and discount rates. Further detail on these assumptions has been disclosed in note 12. The Group has performed a sensitivity analysis by varying these input factors by a reasonably possible margin and assessing whether the changes in input factors result in any of the goodwill allocated to appropriate cash-generating units being impaired. Goodwill impairment in the current year amounted to Rnil (2011: R31 million), refer to note 12.
2 The critical accounting estimates and assumptions applied in the Company annual financial statements are consistent with those applied in the Group
annual financial statements.
Page 126 MTN Group Limited Integrated Report for the year ended 31 December 2012

2. Critical accounting estimates and assumptions (continued)2.2 Impairment of trade receivables
The Group determines impairment of trade receivables when objective evidence indicates that one or more events
have had a negative effect on the estimated future cash flows of the trade receivables. Management exercises
significant judgement in assessing the impact of adverse indicators and events on the recoverability of trade
receivables using the indicators disclosed in the accounting policy in note 43.
The impairment loss is determined as the difference between the carrying amount of the trade receivables and the
present value of their estimated future cash flows. In the current year, an impairment loss of R263 million
(2011: R455 million) was recognised (note 6).
2.3 Connection incentives and subscriber acquisition costsConnection incentives paid to service providers are expensed by the Group in the period incurred. Service providers
utilise the incentives received from the Group to fund a variety of administrative costs and/or to provide incentives
to maintain/sign up customers on behalf of the Group, at their own discretion. The portion of the incentive used by
the respective service providers as an incentive to retain/acquire existing/new subscribers on behalf of the Group
is capitalised only to the extent that it is reliably measurable (prepaid discount). In accordance with the Conceptual
Framework under IFRS, the Group has resolved not to capitalise these fees due to the portion of incentives utilised
to retain/acquire subscribers on behalf of the Group by the respective independent service providers not being
reliably measurable.
In accordance with the recognition criteria in IAS 38 Intangible Assets, the Group has also resolved not to capitalise
commissions paid to dealers, utilised to acquire new subscribers, as intangible assets (subscriber acquisition cost),
due to the portion utilised to acquire subscribers on behalf of the Group not being reliably measurable.
2.4 Interconnect revenue recognitionDue to the receipt of interconnect revenue in certain operations not being certain at transaction date, the Group
has resolved only to recognise interconnect revenue relating to these operations as the cash is received.
2.5 Income taxesThe Group is subject to income taxes in numerous jurisdictions. As a result, significant judgement is required in
determining the Group’s provision for income taxes. There are numerous calculations and transactions for which the
ultimate tax position is uncertain during the ordinary course of business. The Group recognises tax liabilities for
anticipated tax issues based on estimates of whether additional taxes will be payable. Where the final outcome of
these matters is different from the amounts that were initially recorded, such differences will impact the current and
deferred tax in the period in which such determination is made.
Deferred tax assetsDeferred tax assets are recognised to the extent that it is probable that taxable profits will be available against which
the deferred tax assets can be utilised. When recognising deferred tax assets, the Group exercises judgement in
determining whether sufficient taxable profits will be available; this is done by assessing the future financial
performance of the underlying Group entities to which the deferred tax assets relate. The Group’s deferred tax assets
for the current year amounted to R1 437 million (2011: R1 284 million), refer to note 15.
2.6 Property, plant and equipmentProperty, plant and equipment represent a significant proportion of the Group’s asset base. Therefore, the
judgements made in determining their estimated useful lives and residual values are critical to the Group’s financial
position and performance. Useful lives and residual values are reviewed on an annual basis with the effects of any
changes in estimates accounted for on a prospective basis.
In determining residual values, the Group uses historical sales and management’s best estimate based on market
prices of similar items.
05
MTN Group Limited Integrated Report for the year ended 31 December 2012 Page 127

Notes to the Group annual financial statements continued
for the year ended 31 December 2012
2. Critical accounting estimates and assumptions (continued)2.6 Property, plant and equipment (continued)
Useful lives of property, plant and equipment are based on management estimates and take into account historical experience with similar assets, the expected usage of the asset, physical wear and tear, technical or commercial obsolescence and legal restrictions on the use of the assets.
The estimated useful lives of property, plant and equipment are as follows:
2012Years
2011Years
Buildings – owned 10 – 60 3 – 60
Buildings – leased1 15 – 25 3 – 25
Network infrastructure 3 – 20 2 – 20
Information systems equipment 3 – 10 2 – 10
Furniture and fittings 3 – 15 3 – 10
Leasehold improvements1 3 – 11 2 – 11
Office equipment 3 – 12 2 – 10
Motor vehicles 3 – 10 3 – 10
1 Shorter of lease term and useful life.
2.7 Intangible assets with finite useful livesThe relative size of the Group’s intangible assets with finite useful lives makes the judgements surrounding the estimated useful lives and residual values critical to the Group’s financial position and performance. Useful lives are reviewed on an annual basis with the effects of any changes in estimate accounted for on a prospective basis. The residual values of intangible assets are assumed to be zero.
The basis for determining the useful lives for the various categories of intangible assets is as follows:
LicencesThe useful lives of licences are determined primarily with reference to the unexpired licence period.
Customer relationshipsThe useful life principally reflects management’s view of the average economic life of the customer base and is assessed by reference to factors such as customer churn rates. An increase in churn rates may lead to a reduction in the estimated useful life.
SoftwareThe useful life is determined with reference to the licence term of the computer software. For unique software products controlled by the Group, the useful life is based on historical experience with similar assets as well as anticipation of future events such as technological changes, which may impact the useful life.
Other intangible assetsUseful lives of other intangible assets are based on management’s estimates and take into account historical experience as well as future events which may impact the useful lives.
The estimated useful lives of intangible assets with finite useful lives are as follows:
2012Years
2011Years
Licences 1 – 20 1 – 20 Customer relationships 2 – 10 2 – 5Software 3 – 5 3 – 5
Other intangible assets 3 – 20 3 – 20
Page 128 MTN Group Limited Integrated Report for the year ended 31 December 2012

2. Critical accounting estimates and assumptions (continued)
2.8 ProvisionsThe Group exercises judgement in determining the expected cash outflows related to its provisions. Judgement is necessary in determining the timing of outflow as well as quantifying the possible range of the financial settlements that may occur.
The present value of the Group’s provisions is based on management’s best estimate of the future cash outflows expected to be required to settle the obligations, discounted using appropriate pre-tax discount rates that reflect current market assessment of the time value of money and the risks specific to each provision. Additional information on provisions is disclosed in note 27.
2.9 Restricted cashThe Group exercises judgement in determining the appropriate treatment of restricted cash. The judgement exercised takes into account the severity of exchange control regulations, the availability of foreign currency in the operations affected and the purpose for which the funds will be used. The Group has determined that an amount of R2 869 million (2011: Rnil) relating to its Syrian operation should be treated as restricted cash, refer to note 21. The cash and cash equivalents relating to the Group’s Iranian operation is deemed to be available for use by the operation, refer to note 22.
2.10 Exchange rates for consolidationThe assets and liabilities of foreign operations (including entities that are subsidiaries, associates and joint ventures of the Group) are translated into the presentation currency of the Group using the spot exchange rates prevailing at the reporting date. Irancell Telecommunication Company Services (PJSC) is a joint venture of the Group which is accounted for on a proportionate consolidation basis. Multiple exchange rates existed in the Iranian economy at the reporting date and therefore, in accordance with IAS 21 The Effects of Changes in Foreign Exchange Rates, management assessed which rate most appropriately reflects the rate at which the future cash flows represented by the transactions and balances of the entity could have been settled if those cash flows had occurred at the reporting date.
Management has determined that if any loan or dividend payments were to be made at the reporting date, any such payments would be effected at the trade rate (R1 = IRR2 905) and consequently the trade rate has been used for purposes of translating the transactions and balances of Irancell Telecommunication Company Services (PJSC) for purposes of preparing the consolidated annual financial statements. The other rates that were in existence at the reporting date are the Central Bank of Iran rate (R1 = IRR1 448) and the market rate (R1 = IRR3 774).
3. Operating segments
The Group has four reportable segments that are used by the Group executive committee (chief operating decision maker) to make key operating decisions, allocate resources and assess performance. The reportable segments are geographically differentiated and grouped by their relative size, namely South Africa, Nigeria, large opco cluster and small opco cluster.
Large opco cluster comprises the Group’s operations in Iran, Ghana, Ivory Coast, Syria, Cameroon, Uganda and Sudan. Small opco cluster consists of the Group’s operations in Cyprus, Guinea, Guinea-Bissau, Botswana, Rwanda, Benin, Congo, Liberia, Afghanistan, Swaziland, Yemen, Zambia and South Sudan.
The Group’s principal activities include the provision of network IT services, local, national and international telecommunications services; broadband and internet products and services; and converged fixed/mobile products and services.
Operating results are reported and reviewed regularly by the Group executive committee and include items directly attributable to a segment as well as those that can be attributed on a reasonable basis, whether from external transactions or from transactions with other Group segments.
Unallocated items mainly comprise corporate expenses which do not directly relate to the operating activities of the segments or which cannot be re-allocated on a reasonable basis. Segment results are determined before any adjustment for non-controlling interests.
Segment assets and liabilities comprise those operating assets and liabilities that are directly attributable to the segment or can be allocated to the segment on a reasonable basis.
EBITDA is used as a measure of reporting profit or loss of each segment.
05
MTN Group Limited Integrated Report for the year ended 31 December 2012 Page 129

Notes to the Group annual financial statements continued
for the year ended 31 December 2012
3. Operating segments (continued)The Group changed the composition and presentation of its segment analysis following the announcement of a
change in its operating structure and reporting responsibilities in March 2012. In terms of the implemented changes,
the Group replaced the previous segments (SEA, WECA and MENA) with the segments as reflected in the table
below. In addition, the Group redefined the composition of its executive committee and its executive organisational
structure which is deemed to be the chief operating decision maker (CODM) of the Group. The comparative
numbers have been restated accordingly.
South Africa
RmNigeria
RmIranRm
GhanaRm
2012Revenue 41 350 38 697 12 175 6 862EBITDA 14 476 22 544 5 388 2 537 Depreciation, amortisation and impairment of assetsNet finance costsShare of results of associates after tax
Profit before taxSegment assetsNon-current assets 24 210 33 653 3 490 13 587 Current assets 13 809 8 533 4 636 1 853 Total assets 38 019 42 186 8 126 15 440 Segment liabilitiesNon-current liabilities 13 755 13 536 63 616 Current liabilities 14 410 19 527 6 818 2 696 Total liabilities 28 165 33 063 6 881 3 312 EBITDA margin (%) 35,0 58,3 44,3 37,0 Capital expenditure3 6 416 13 733 1 122 1 091 Capex/revenue (%) 15,5 35,5 9,2 15,9
2011Revenue 38 597 34 879 11 050 5 941
EBITDA 13 591 21 514 4 697 4 129 Depreciation, amortisation and impairment of assetsNet finance costsShare of results of associates after tax
Profit before taxSegment assetsNon-current assets 20 142 24 675 6 998 13 374 Current assets 13 207 16 639 3 673 1 560
Total assets 33 349 41 314 10 671 14 934
Segment liabilitiesNon-current liabilities 16 035 14 103 1 676 679 Current liabilities 9 898 18 012 6 883 2 374
Total liabilities 25 933 32 115 8 559 3 053
EBITDA margin (%) 35,2 61,7 42,5 69,52 Capital expenditure3 4 105 6 331 1 168 845 Capex/revenue (%) 10,6 18,2 10,6 14,2 1 Head office and eliminations consist mainly of the Group’s central financing activities, management fees and
dividends received from segments as well as intersegment eliminations.2 Including profit on tower sales.3 Capital expenditure comprises additions to property, plant and equipment and software.
The Group is domiciled in South Africa.
Page 130 MTN Group Limited Integrated Report for the year ended 31 December 2012

Head officeLarge opco cluster Small companies
SyriaRm
CameroonRm
Ivory Coast
RmUganda
RmSudan
Rm
opco cluster
Rm
and eliminations1
Rm
Con-solidated
Rm
5 391 3 812 4 124 3 296 2 158 17 761 (514) 135 112 1 238 1 750 1 662 1 762 598 6 129 480 58 564
(17 246)(4 157)
(180)36 981
1 245 1 820 5 648 2 903 5 480 21 591 7 470 121 097 4 459 2 580 1 876 1 187 1 464 7 396 12 494 60 287 5 704 4 400 7 524 4 090 6 944 28 987 19 964 181 384
92 360 435 609 3 722 6 420 (6 301) 33 307 4 873 2 049 2 455 1 263 2 767 7 914 (9 582) 55 190 4 965 2 409 2 890 1 872 6 489 14 334 (15 883) 88 497
23,0 45,9 40,3 53,52 27,7 34,5 43,32 577 724 903 435 1 336 3 052 712 30 101 10,7 19,0 21,9 13,2 61,9 17,2 22,3
6 463 3 331 3 351 2 481 1 946 14 144 (299) 121 884
1 690 1 454 1 395 856 435 4 299 690 54 750
(15 490)(1 582)
(38)
37 640
1 900 2 350 5 533 2 780 7 156 21 468 7 411 113 787 5 776 1 280 929 1 511 1 371 6 219 15 456 67 621
7 676 3 630 6 462 4 291 8 527 27 687 22 867 181 408
109 524 713 723 3 412 5 659 (10 241) 33 392 5 954 1 529 1 917 929 2 025 7 518 (1 722) 55 317
6 063 2 053 2 630 1 652 5 437 13 177 (11 963) 88 709
26,1 43,7 41,6 34,5 22,4 30,4 44,92 442 326 406 651 952 2 333 158 17 717 6,8 9,8 12,1 26,2 48,9 16,5 14,5
05
MTN Group Limited Integrated Report for the year ended 31 December 2012 Page 131
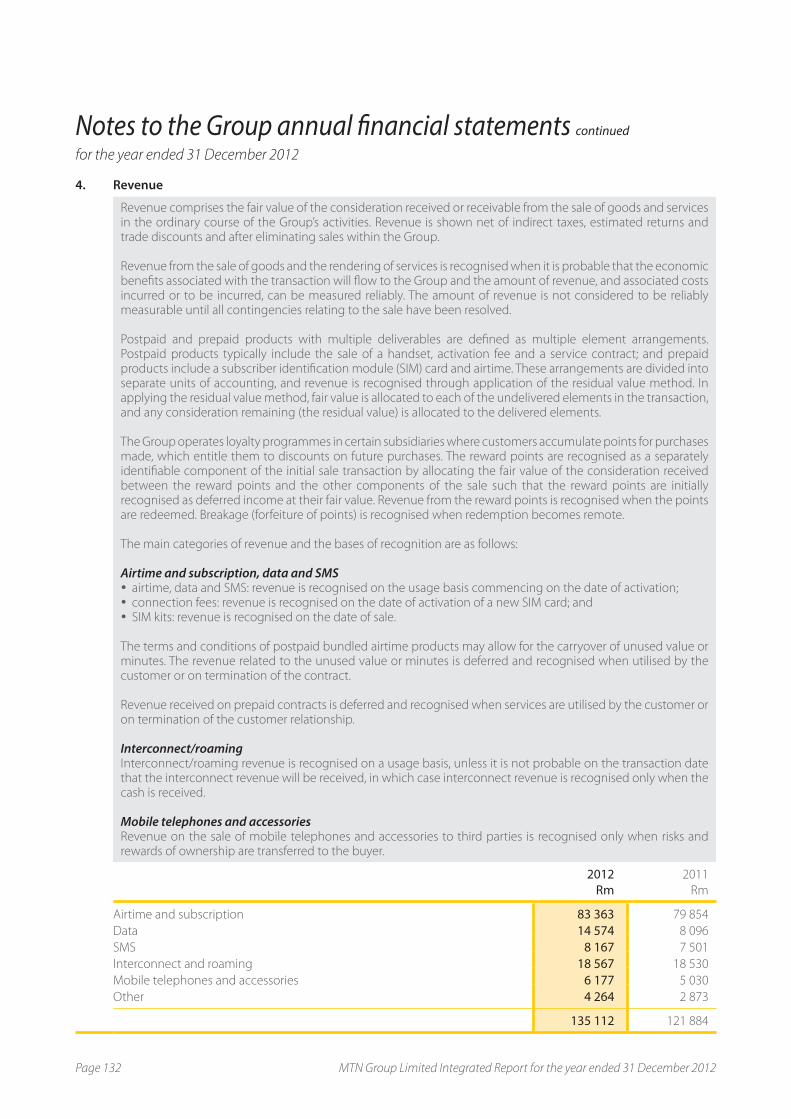
Notes to the Group annual financial statements continued
for the year ended 31 December 2012
4. Revenue
Revenue comprises the fair value of the consideration received or receivable from the sale of goods and services in the ordinary course of the Group’s activities. Revenue is shown net of indirect taxes, estimated returns and trade discounts and after eliminating sales within the Group.
Revenue from the sale of goods and the rendering of services is recognised when it is probable that the economic benefits associated with the transaction will flow to the Group and the amount of revenue, and associated costs incurred or to be incurred, can be measured reliably. The amount of revenue is not considered to be reliably measurable until all contingencies relating to the sale have been resolved.
Postpaid and prepaid products with multiple deliverables are defined as multiple element arrangements. Postpaid products typically include the sale of a handset, activation fee and a service contract; and prepaid products include a subscriber identification module (SIM) card and airtime. These arrangements are divided into separate units of accounting, and revenue is recognised through application of the residual value method. In applying the residual value method, fair value is allocated to each of the undelivered elements in the transaction, and any consideration remaining (the residual value) is allocated to the delivered elements.
The Group operates loyalty programmes in certain subsidiaries where customers accumulate points for purchases made, which entitle them to discounts on future purchases. The reward points are recognised as a separately identifiable component of the initial sale transaction by allocating the fair value of the consideration received between the reward points and the other components of the sale such that the reward points are initially recognised as deferred income at their fair value. Revenue from the reward points is recognised when the points are redeemed. Breakage (forfeiture of points) is recognised when redemption becomes remote.
The main categories of revenue and the bases of recognition are as follows:
Airtime and subscription, data and SMS�� airtime, data and SMS: revenue is recognised on the usage basis commencing on the date of activation; �� connection fees: revenue is recognised on the date of activation of a new SIM card; and�� SIM kits: revenue is recognised on the date of sale.
The terms and conditions of postpaid bundled airtime products may allow for the carryover of unused value or minutes. The revenue related to the unused value or minutes is deferred and recognised when utilised by the customer or on termination of the contract.
Revenue received on prepaid contracts is deferred and recognised when services are utilised by the customer or on termination of the customer relationship.
Interconnect/roamingInterconnect/roaming revenue is recognised on a usage basis, unless it is not probable on the transaction date that the interconnect revenue will be received, in which case interconnect revenue is recognised only when the cash is received.
Mobile telephones and accessoriesRevenue on the sale of mobile telephones and accessories to third parties is recognised only when risks and rewards of ownership are transferred to the buyer.
2012Rm
2011
Rm
Airtime and subscription 83 363 79 854
Data 14 574 8 096
SMS 8 167 7 501
Interconnect and roaming 18 567 18 530
Mobile telephones and accessories 6 177 5 030
Other 4 264 2 873
135 112 121 884
Page 132 MTN Group Limited Integrated Report for the year ended 31 December 2012

5. Other income
Other income is recognised when the risks and rewards of ownership of the assets are transferred to the buyer.
2012Rm
2011
Rm
Profit on tower sales 547 1 185
Profit on disposal 547 1 957
Sale proceeds 1 405 3 217
Carrying amount of assets disposed (803) (1 133)
Effects of exchange rate differences – 48
Warranty provision and consultancy cost (55) (175)
Elimination1 – (772)
Realisation of deferred gain on Ghana tower sale1 39 –
Realisation of deferred gain on asset swap for investment in BICS2 308 273
894 1 458
1 Profit is eliminated to the extent of the Group’s interest in the associate. Such unrealised profit is realised by the Group as the underlying assets are
depreciated by the associate.2 The deferred gain arose on the contribution of various assets from MTN Dubai, MTN International Carrier Services and Uniglobe in exchange for a 20%
investment in the associate, Belgacom International Carrier Services SA (BICS) (note 13). This gain was deferred and is being amortised over a five-year
period, which is the period of the commitment to use the international gateway of BICS.
MTN Uganda Limited concluded a transaction with American Tower Company (ATC) in 2012, which involved the
sale of 962 of MTN Uganda’s existing base transceiver stations (BTS) sites to TowerCo Uganda for an agreed purchase
price of US$175 million. ATC holds a 51% stake in TowerCo Uganda’s holding company, with the remaining 49%
stake held by the Group. MTN Uganda will be the anchor tenant on commercial terms on each of the towers being
sold. The transaction resulted in a sale and lease back transaction classified as an operating lease.
In 2011, Scancom Limited (MTN Ghana) concluded a transaction with ATC which involved the sale of 1 856 of MTN
Ghana’s existing BTS sites to TowerCo Ghana for an amount of US$498 million. ATC holds a 51% stake in TowerCo
Ghana’s holding company, with the remaining 49% stake held by the Group. The transaction resulted in a sale and
lease back transaction classified as an operating lease.
6. Operating profit
Employee benefitsShort-term employee benefitsRemuneration to employees in respect of services rendered during a reporting period is expensed in that
reporting period. A liability is recognised for accumulated leave when there is a present legal or constructive
obligation as a result of past service rendered by employees.
A liability for unvested short-term benefits is recognised when there is no realistic alternative other than to settle
the liability, and at least one of the following conditions is met:
�� there is a formal plan and the amounts to be paid are determined before the time of issuing the annual
financial statements; or
�� achievement of previously agreed bonus criteria has created a valid expectation by employees that they will
receive a bonus and the amount can be determined before the time of issuing the annual financial statements.
Post-employment benefits – defined contribution plansGroup companies operate various defined contribution plans. A defined contribution plan is a post-employment
benefit plan (such as a pension plan) under which the Group pays a fixed percentage of employees’ remuneration
as contributions into a separate entity (a fund), and have no further legal or constructive obligations to pay
additional contributions if the fund does not hold sufficient assets to pay all employee benefits relating to
employee service in the current and prior periods. Contributions to defined contribution plans in respect of
services rendered during a period are recognised as an employee benefit expense when they are due.
05
MTN Group Limited Integrated Report for the year ended 31 December 2012 Page 133

Notes to the Group annual financial statements continued
for the year ended 31 December 2012
6. Operating profit (continued)
Employee benefits (continued) Share-based payment transactionsThe Group operates a number of share incentive schemes. For further details refer to note 44.
Termination benefitsTermination benefits may be payable when an employee’s employment is terminated before the normal
retirement date due to death or retrenchment or whenever an employee accepts voluntary redundancy in
exchange for these benefits. Termination benefits are recognised when the Group is demonstrably committed
to any such plan without the possibility of withdrawal or to provide termination benefits as a result of an offer
made to encourage voluntary redundancy and it is probable that the offer will be accepted and the number of
acceptances can be estimated reliably. Benefits falling due more than 12 months after the reporting date are
discounted to their present value. In the case of an offer made to encourage voluntary redundancy, the
termination benefits are measured based on the number of employees expected to accept the offer.
2012Rm
2011
Rm
Employee benefits (7 775) (6 754)
Salaries and wages (6 227) (5 441)Post-employment benefits (305) (256)Share options granted to directors and employees (note 44) (147) (74)Training (263) (261)Other (833) (722)
The following disclosable items have been included in arriving at operating profit:2012
Rm2011
Rm
Auditors’ remuneration (127) (109)
Audit fees (91) (82)Fees for other services (26) (19)Expenses (10) (8)
Emoluments to directors and prescribed officers (note 41) (165) (220)
Operating lease rentals (2 161) (1 676)
Property (1 898) (1 454)Equipment and vehicles (263) (222)
Research costs (10) (2)(Loss)/profit on disposal of property, plant and equipment (note 30) (58) 6 Loss on disposal of intangible assets (note 30) (10) (29)Write-down of inventories (note 17) (101) (67)Impairment of trade receivables (note 18) (263) (455)
Page 134 MTN Group Limited Integrated Report for the year ended 31 December 2012

7. Finance income and finance costs
Finance incomeFinance income comprises interest income on funds invested, increases in the fair value of dated financial assets
at fair value through profit or loss, foreign exchange gains and gains on hedging instruments that are recognised
in profit or loss. Interest income is recognised as it accrues in profit or loss, using the effective interest method.
Finance costsFinance costs comprise interest expense on borrowings, unwinding of the discount on provisions, reductions in
the fair value of dated financial assets at fair value through profit or loss, foreign exchange losses and any losses
on hedging instruments that are recognised in profit or loss. All borrowing costs are recognised in profit or loss
using the effective interest method, unless the borrowing costs are directly attributable to the acquisition,
construction or production of qualifying assets, in which case the directly attributable borrowing costs are
capitalised.
2012Rm
2011
Rm
Interest income on loans and receivables 1 729 79 Interest income on bank deposits 1 611 2 233 Foreign exchange gains 2 626 1 641 Functional currency gains1 – 778 Put options – 297
Finance income 5 966 5 028
Interest expense on financial liabilities measured at amortised cost (4 165) (3 766)Foreign exchange losses (5 002) (2 385)Functional currency losses1 (926) – Put options (30) (459)
Finance costs (10 123) (6 610)
Net finance costs recognised in profit or loss (4 157) (1 582)
1 The functional currency of the Group’s operation in Mauritius is considered to be South African rand for accounting purposes and the foreign exchange
gains and losses for this entity are disclosed separately as functional currency gains or losses.
8. Income tax expense
The tax expense for the period comprises current and deferred tax. Tax is recognised in profit or loss, except to
the extent that it relates to items recognised in other comprehensive income or items recognised directly in
equity. For these items the tax is also recognised in other comprehensive income or directly in equity, respectively.
Current taxCurrent tax is the expected tax payable on taxable income for the year, using tax rates enacted or substantively
enacted at the reporting date in the countries where the Company and its subsidiaries, joint ventures and
associates operate and generate taxable income, and any adjustment to tax payable in respect of previous years.
Management periodically evaluates positions taken in tax returns with respect to situations in which applicable
tax regulations are subject to interpretation and establishes provisions where appropriate on the basis of
amounts expected to be paid to the tax authorities.
05
MTN Group Limited Integrated Report for the year ended 31 December 2012 Page 135
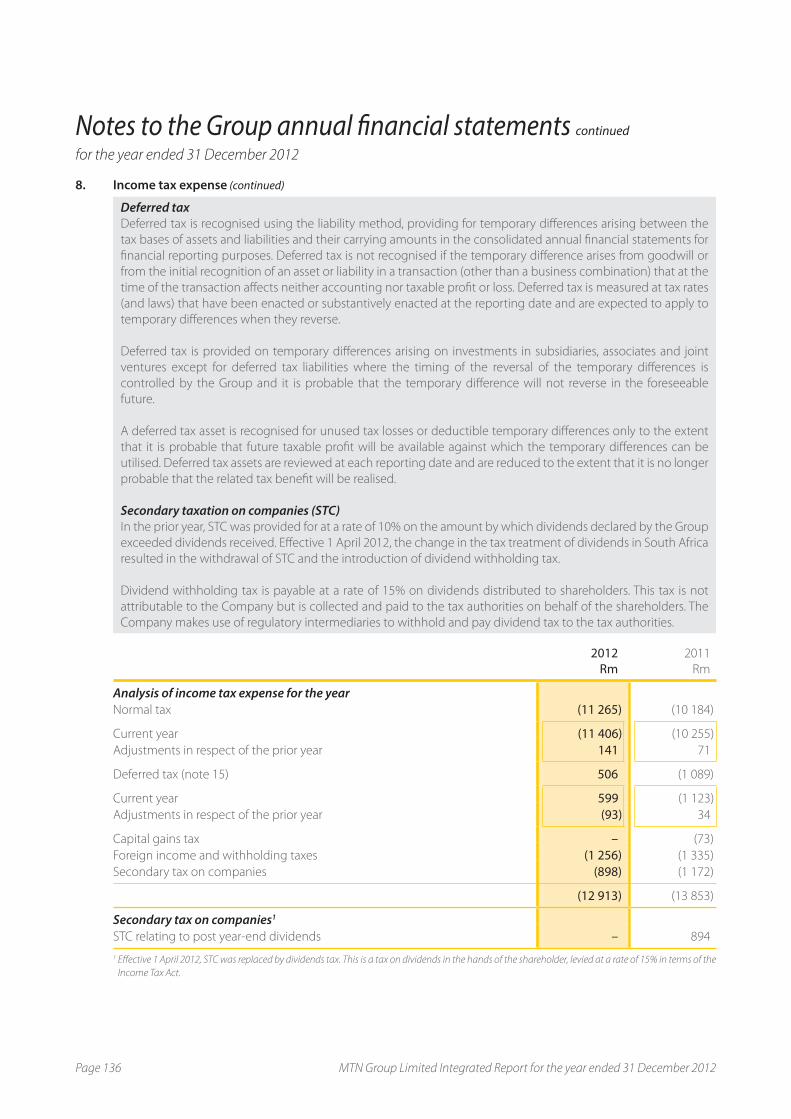
Notes to the Group annual financial statements continued
for the year ended 31 December 2012
8. Income tax expense (continued)
Deferred taxDeferred tax is recognised using the liability method, providing for temporary differences arising between the
tax bases of assets and liabilities and their carrying amounts in the consolidated annual financial statements for
financial reporting purposes. Deferred tax is not recognised if the temporary difference arises from goodwill or
from the initial recognition of an asset or liability in a transaction (other than a business combination) that at the
time of the transaction affects neither accounting nor taxable profit or loss. Deferred tax is measured at tax rates
(and laws) that have been enacted or substantively enacted at the reporting date and are expected to apply to
temporary differences when they reverse.
Deferred tax is provided on temporary differences arising on investments in subsidiaries, associates and joint
ventures except for deferred tax liabilities where the timing of the reversal of the temporary differences is
controlled by the Group and it is probable that the temporary difference will not reverse in the foreseeable
future.
A deferred tax asset is recognised for unused tax losses or deductible temporary differences only to the extent
that it is probable that future taxable profit will be available against which the temporary differences can be
utilised. Deferred tax assets are reviewed at each reporting date and are reduced to the extent that it is no longer
probable that the related tax benefit will be realised.
Secondary taxation on companies (STC)In the prior year, STC was provided for at a rate of 10% on the amount by which dividends declared by the Group
exceeded dividends received. Effective 1 April 2012, the change in the tax treatment of dividends in South Africa
resulted in the withdrawal of STC and the introduction of dividend withholding tax.
Dividend withholding tax is payable at a rate of 15% on dividends distributed to shareholders. This tax is not
attributable to the Company but is collected and paid to the tax authorities on behalf of the shareholders. The
Company makes use of regulatory intermediaries to withhold and pay dividend tax to the tax authorities.
2012Rm
2011
Rm
Analysis of income tax expense for the yearNormal tax (11 265) (10 184)
Current year (11 406) (10 255)
Adjustments in respect of the prior year 141 71
Deferred tax (note 15) 506 (1 089)
Current year 599 (1 123)
Adjustments in respect of the prior year (93) 34
Capital gains tax – (73)
Foreign income and withholding taxes (1 256) (1 335)
Secondary tax on companies (898) (1 172)
(12 913) (13 853)
Secondary tax on companies1
STC relating to post year-end dividends – 894
1 Effective 1 April 2012, STC was replaced by dividends tax. This is a tax on dividends in the hands of the shareholder, levied at a rate of 15% in terms of the
Income Tax Act.
Page 136 MTN Group Limited Integrated Report for the year ended 31 December 2012

8. Income tax expense (continued)The table below explains the differences between the expected tax expense on continuing operations, at the South
African statutory rate of 28% and the Group’s total tax expense for each year.
The Group’s effective tax rate is reconciled to the South African statutory rate as follows:
2012%
2011
%
Tax rate reconciliationStatutory tax rate 28,00 28,00
Expenses not allowed 1,42 1,61
Effect of different tax rates in other countries (0,57) (0,20)
Income not subject to tax (2,20) (0,24)
Nigeria put option revaluation – 0,12
Foreign income and withholding taxes 3,40 3,55
Effect of STC 2,43 3,11
Capital gains tax – 0,21
Foreign exchange loss – MTN Sudan Company Limited and Investcom Mobile
Communications Limited 1,42 –
Other 1,02 0,64
Effective tax rate 34,92 36,80
The Group holds investments in Afghanistan, Belgium, Benin, Botswana, Cameroon, Congo-Brazzaville, Ivory Coast,
Cyprus, Ghana, Guinea-Bissau, Guinea-Conakry, Iran, Kenya, Liberia, Monaco, Namibia, Nigeria, Rwanda, South
Africa, Sudan, South Sudan, Swaziland, Syria, Uganda, Yemen, Netherlands and Zambia. Taxation for foreign
jurisdictions is calculated at the rates that have been enacted or substantively enacted in the respective
jurisdictions.
9. Earnings per ordinary share
Basic earnings per shareEarnings per share is calculated using the weighted average number of ordinary shares in issue during the
period and is based on the net profit attributable to ordinary shareholders. For the purpose of calculating
earnings per share, treasury shares are deducted from the number of ordinary shares in issue.
Diluted earnings per share is calculated by adjusting the weighted average number of ordinary shares outstanding
to assume conversion of all dilutive potential ordinary shares and is based on the net profit attributable to
ordinary shareholders, adjusted for the after-tax dilutive effect. The Company has dilutive potential ordinary
shares which comprise share options and share rights issued in terms of the Group’s share schemes, performance
share plan and the MTN Zakhele transaction.
For the share options and share rights, a calculation is done to determine the number of the Company’s shares
that would be required at fair value to settle the monetary value of the rights, after deducting the unamortised
share-based payment value. For the purposes of this calculation the average annual market share price of the
Company is used.
Headline earnings per shareHeadline earnings per share is calculated using the weighted average number of ordinary shares in issue during
the period and is based on the earnings attributable to ordinary shareholders, after excluding those items as
required by Circular 3/2012 issued by the South African Institute of Chartered Accountants (SAICA).
05
MTN Group Limited Integrated Report for the year ended 31 December 2012 Page 137

Notes to the Group annual financial statements continued
for the year ended 31 December 2012
9. Earnings per ordinary share (continued)In terms of the MTN Zakhele broad-based black economic empowerment (B-BBEE) transaction, the Group issued
notional vendor financing shares to MTN Zakhele at par value. The Group has a call option over these shares.
As these shares are potentially dilutive shares, these are included in the diluted earnings per share calculation.
A calculation is done at each reporting period to determine the number of shares that could have been acquired
at fair value.
2012’000
2011
’000
Weighted average number of shares (excluding treasury shares) 1 837 992 1 853 922
Adjusted for:
– Share options – MTN Zakhele 9 836 12 328
– Share options 194 377
– Share appreciation rights 894 897
– Performance share plan 487 799
Weighted average number of shares for diluted earnings per share calculation 1 849 403 1 868 323
Refer to note 23 for a reconciliation of total shares in issue.
Reconciliation between net profit attributable to the equity holders of the Company and headline earnings:
2012 2011
RmGross
RmNet1
Rm
Gross
Rm
Net1
Profit after tax 20 704 20 754
Adjusted for:
Loss on disposal of property, plant and
equipment and intangible assets
(IAS 16 and IAS 38) 68 49 23 21
Realisation of deferred gain (IAS 28) (308) (308) (273) (273)
Net reversal of impairment of property,
plant and equipment (IAS 36) (38) (26) (97) (74)
Impairment of associate (IAS 36) 6 6 – –
Impairment of goodwill (IAS 36) – – 31 31
Profit on disposal of non-current assets
held for sale (IFRS 5) (547) (368) (1 185) (648)
Realisation of deferred gain on disposal of
non-current assets held for sale (IFRS 5) (39) (39) – –
Headline earnings 20 018 19 811
1 Amounts are measured after taking into account non-controlling interests and tax. Headline earnings is calculated in accordance with Circular 3/2012
Headline Earnings as issued by the South African Institute of Chartered Accountants at the request of the JSE Limited.
Page 138 MTN Group Limited Integrated Report for the year ended 31 December 2012

9. Earnings per ordinary share (continued)
2012 2011
Earnings per ordinary share (cents)– Basic earnings 1 126,4 1 119,5
– Basic headline earnings 1 089,1 1 068,6
– Diluted earnings 1 119,5 1 110,8
– Diluted headline earnings 1 082,4 1 060,4
10. Dividend
Dividend distribution to the Company’s shareholders is recognised as a liability in the Group’s financial statements
in the period in which the dividends are approved by the Company’s directors.
2012 2011
Cents per share Rm
Cents per share Rm
Dividends paidFinal dividend paid in respect of the prior year 476 8 9402 349 6 5772
Interim dividend paid in respect of the current year 321 5 9792 273 5 1452
14 919 11 722
Dividends declaredApproved after the reporting date and not recognised as a liability 5031 9 3622 476 8 9402
1 Declared at the board meeting on 5 March 2013.2 Excluding dividends on treasury shares (note 23).
05
MTN Group Limited Integrated Report for the year ended 31 December 2012 Page 139

Notes to the Group annual financial statements continued
for the year ended 31 December 2012
11. Property, plant and equipment
Property, plant and equipment are measured at historical cost less accumulated depreciation and accumulated
impairment losses. Property, plant and equipment acquired through business combinations are initially shown
at fair value and are subsequently carried at the initially determined fair value less accumulated depreciation and
accumulated impairment losses.
The cost of property, plant and equipment includes expenditure that is directly attributable to the acquisition or
construction of the assets, any other costs directly attributable to bringing the assets to the location and
condition for their intended use and the present value of estimated decommissioning costs. Purchased software
that is integral to the functionality of the related equipment is capitalised as part of the equipment.
Property, plant and equipment under construction are measured at initial cost and depreciated from the date
the assets are available for use in the manner intended by management over their estimated useful lives. Assets
are transferred from capital work-in-progress to an appropriate category of property, plant and equipment when
commissioned and ready for their intended use.
The Group capitalises general and specific borrowing costs directly attributable to the acquisition, construction
or production of a qualifying asset as part of the cost of that asset. A qualifying asset is deemed to be an asset
which takes more than 12 months to acquire, construct or produce. Borrowing costs include general and specific
borrowings directly attributable to the acquisition, construction or production of qualifying assets. Other
borrowing costs are expensed in profit or loss.
Asset exchange transactions are transactions where one or more items of property, plant and equipment are
acquired in exchange for non-monetary assets, or a combination of monetary and non-monetary assets. In
circumstances whereby the Group enters into an asset exchange transaction, the Group determines whether
such an exchange has commercial substance. Commercial substance depends on the extent to which the
Group’s future cash flows are expected to change as a result of the transaction. A transaction has commercial
substance if the difference in either of the points below is significant relative to the fair value of the assets
exchanged:
� the configuration of the cash flows of the asset received differs from the configuration of the cash flows of the
asset given up; or
� the entity-specific value of the part of the operations affected by the transaction changes as a result of the
exchange.
Property, plant and equipment acquired in an exchange transaction is measured at fair value unless the exchange
transaction lacks commercial substance or the fair value of neither the asset received nor the asset given up is
reliably measurable. If the acquired item is not measured at fair value, its cost is measured at the carrying amount
of the asset given up. Any consideration paid or payable is included in the cost of the asset received.
In instances whereby the Group receives assets for no consideration, the Group accounts for these at cost in
accordance with IAS 16 Property, Plant and Equipment, being zero value.
When parts of an item of property, plant and equipment have different useful lives, they are accounted for as
separate items (major components) of property, plant and equipment.
Depreciation is calculated on a straight-line basis to write off the cost of the assets to their residual values over
their estimated useful lives. For a summary of useful lives, refer to note 2.
Useful lives and residual values are reviewed on an annual basis and the effect of any changes in estimate is
accounted for on a prospective basis.
Land is not depreciated. Assets held under finance leases are depreciated over their expected useful lives on the
same basis as owned assets or, where shorter, the expected term of the relevant lease.
Page 140 MTN Group Limited Integrated Report for the year ended 31 December 2012

11. Property, plant and equipment (continued)
Subsequent costs are included in the asset’s carrying amount or recognised as a separate asset, only when it is
probable that future economic benefits associated with the item will flow to the Group and the cost of the item
can be measured reliably. The carrying amount of the replaced part is derecognised. Repairs and maintenance
are charged to profit or loss during the financial period in which they are incurred.
The gain or loss arising on the disposal or retirement of an asset is determined as the difference between the
proceeds from the disposal and the carrying amount of the asset, and is included in profit or loss.
Determination of fair valuesThe fair value of property, plant and equipment recognised as a result of a business combination is based on
depreciated replacement cost.
ImpairmentAn impairment loss is recognised in profit or loss if the carrying amount of an asset or its cash-generating unit
exceeds its estimated recoverable amount. The recoverable amount of an asset or cash-generating unit is the
greater of its value in use and its fair value less costs to sell. In assessing value in use, the estimated future cash
flows are discounted to their present value using a pre-tax discount rate that reflects current market assessments
of the time value of money and the risks specific to the asset.
For the purpose of impairment testing, assets are grouped together into the smallest group of assets that
generates cash inflows from continuing use that are largely independent of the cash inflows of other assets or
groups of assets (the cash-generating unit).
Impairment losses recognised in respect of cash-generating units are allocated first to reduce the carrying
amount of any goodwill allocated to the units and then to reduce the carrying amounts of the other assets in the
unit (group of units) on a pro rata basis.
When an impairment loss subsequently reverses, the carrying amount of the asset (or cash-generating unit) is
increased to the revised estimate of its recoverable amount, but limited to the carrying amount that would have
been determined had no impairment loss been recognised for the asset (or cash-generating unit) in prior years.
A reversal of an impairment loss is recognised immediately in profit or loss.
Property, plant and equipment with finite useful livesThe Group annually reviews the carrying amounts of its property, plant and equipment with finite useful lives in
order to determine whether there is any indication that those assets have suffered an impairment loss. If any
such indication exists, the recoverable amounts of the assets are estimated in order to determine the extent, if
any, of the impairment loss.
05
MTN Group Limited Integrated Report for the year ended 31 December 2012 Page 141
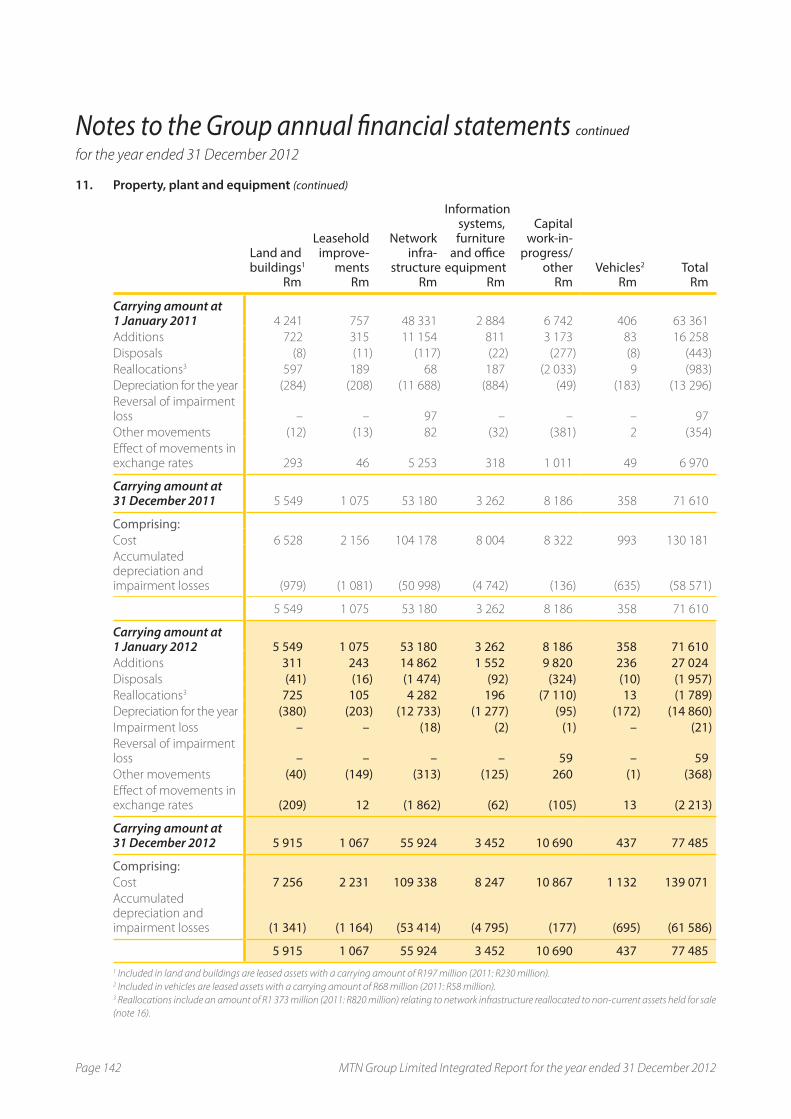
Notes to the Group annual financial statements continued
for the year ended 31 December 2012
11. Property, plant and equipment (continued)
Land and buildings1
Rm
Leasehold improve-
mentsRm
Network infra-
structureRm
Information systems, furniture
and office equipment
Rm
Capital work-in-
progress/other
RmVehicles2
RmTotal
Rm
Carrying amount at 1 January 2011 4 241 757 48 331 2 884 6 742 406 63 361
Additions 722 315 11 154 811 3 173 83 16 258
Disposals (8) (11) (117) (22) (277) (8) (443)
Reallocations3 597 189 68 187 (2 033) 9 (983)
Depreciation for the year (284) (208) (11 688) (884) (49) (183) (13 296)
Reversal of impairment loss – – 97 – – – 97
Other movements (12) (13) 82 (32) (381) 2 (354)
Effect of movements in exchange rates 293 46 5 253 318 1 011 49 6 970
Carrying amount at 31 December 2011 5 549 1 075 53 180 3 262 8 186 358 71 610
Comprising:Cost 6 528 2 156 104 178 8 004 8 322 993 130 181
Accumulated depreciation and impairment losses (979) (1 081) (50 998) (4 742) (136) (635) (58 571)
5 549 1 075 53 180 3 262 8 186 358 71 610
Carrying amount at 1 January 2012 5 549 1 075 53 180 3 262 8 186 358 71 610 Additions 311 243 14 862 1 552 9 820 236 27 024 Disposals (41) (16) (1 474) (92) (324) (10) (1 957)Reallocations3 725 105 4 282 196 (7 110) 13 (1 789)Depreciation for the year (380) (203) (12 733) (1 277) (95) (172) (14 860)Impairment loss – – (18) (2) (1) – (21)Reversal of impairment loss – – – – 59 – 59Other movements (40) (149) (313) (125) 260 (1) (368)Effect of movements in exchange rates (209) 12 (1 862) (62) (105) 13 (2 213)
Carrying amount at 31 December 2012 5 915 1 067 55 924 3 452 10 690 437 77 485
Comprising:Cost 7 256 2 231 109 338 8 247 10 867 1 132 139 071 Accumulated depreciation and impairment losses (1 341) (1 164) (53 414) (4 795) (177) (695) (61 586)
5 915 1 067 55 924 3 452 10 690 437 77 485 1 Included in land and buildings are leased assets with a carrying amount of R197 million (2011: R230 million).2 Included in vehicles are leased assets with a carrying amount of R68 million (2011: R58 million).3 Reallocations include an amount of R1 373 million (2011: R820 million) relating to network infrastructure reallocated to non-current assets held for sale
(note 16).
Page 142 MTN Group Limited Integrated Report for the year ended 31 December 2012

11. Property, plant and equipment (continued)11.1 Register of land and buildings
Registers with details of land and buildings are available for inspection by shareholders or their duly authorised
representatives at the registered office of the Company and its respective subsidiaries.
11.2 Impairment lossMTN Nigeria reversed a portion of the previously recognised impairment losses amounting to R59 million
(2011: R85 million). Côte d’Ivoire had an impairment loss reversal of R12 million in the prior year and none in the
current year.
11.3 Leased property, plant and equipmentThe Group leases various premises and sites which have varying terms, escalation clauses and renewal rights.
Finance lease commitments are disclosed in note 37.
11.4 Capital work-in-progressThere are various capital work-in-progress projects underway within the Group, a summary thereof can be found
below:
2012Rm
2011
Rm
Mobile Telephone Network Proprietary Limited (South Africa) (MTN RSA) 1 099 1 865
Scancom Limited (Ghana) 849 769
MTN Sudan Company Limited 1 028 819
MTN Nigeria Communications Limited 1 186 480
MTN Afghanistan Limited 166 160
Mascom Wireless Botswana Proprietary Limited 129 57
Areeba Guinea S.A. 176 212
MTN Côte d’ Ivoire S.A. 92 136
Irancell Telecommunication Company Services (PJSC) 184 216
MTN Uganda Limited 200 446
MTN (Dubai) Limited 68 470
Other 950 571
6 127 6 201
11.5 Changes in estimatesDuring the year, Scancom Limited (Ghana) revised the useful life of its network equipment from seven to 10 years.
This resulted in a decrease of R134 million in the annual depreciation charge.
11.6 Encumbrances Borrowings are secured by various categories of property, plant and equipment with the following carrying amounts:
2012Rm
2011
Rm
MTN Côte d’ Ivoire S.A. 870 1 356
MTN Uganda Limited 1 956 1 868
MTN Sudan Company Limited 2 566 2 752
MTN Congo S.A. 40 46
Mascom Wireless Botswana Proprietary Limited 115 426
Mobile Telephone Network Proprietary Limited (South Africa) – 230
Scancom Limited (Ghana) 579 –
MTN Rwandacell S.A.R.L. 1 228 –
7 354 6 678
05
MTN Group Limited Integrated Report for the year ended 31 December 2012 Page 143

Notes to the Group annual financial statements continued
for the year ended 31 December 2012
12. Intangible assets and goodwill
Intangible assets with an indefinite useful lifeGoodwill is measured at cost less accumulated impairment losses and is not amortised but tested for impairment
annually.
Goodwill arising on the acquisition of subsidiaries and joint ventures is included in intangible assets.
Goodwill arising on the acquisition of an associate is included in “investment in associates” and is tested for
impairment as part of the overall balance.
Gains or losses on the disposal of an entity include the carrying amount of goodwill allocated to the entity sold.
Intangible assets with finite useful livesIntangible assets with finite useful lives are measured at historical cost less accumulated amortisation and
accumulated impairment losses. Intangible assets acquired through business combinations are initially shown at
fair value and are subsequently carried at the initially determined fair value less accumulated amortisation and
accumulated impairment losses. The initial cost incurred in respect of licences is capitalised. Contingent licence
fees are expensed as they are incurred.
Amortisation is calculated on a straight-line basis to write off the cost of intangible assets over their estimated
useful lives. For a summary of useful lives, refer to note 2.
The gain or loss arising on the disposal or retirement of an intangible asset is determined as the difference
between the proceeds from the disposal and the carrying amount of the asset, and is included in profit or loss.
The Group’s intangible assets with finite useful lives are as follows:
� licences;
� customer relationships;
� software; and
� other intangible assets.
Costs associated with maintaining intangible assets are recognised as an expense as incurred.
Costs that are directly associated with the production of identifiable intangible assets controlled by the Group,
and that will probably generate economic benefits, are capitalised when all the criteria for capitalisation are met.
Expenditure that enhances or extends the performance of intangible assets beyond their original specifications
is recognised as a capital improvement and added to the original cost of the assets.
Expenditure on research activities is recognised as an expense in the period in which it is incurred.
Page 144 MTN Group Limited Integrated Report for the year ended 31 December 2012

12. Intangible assets and goodwill (continued)
Determination of fair valuesThe fair value of customer relationships acquired in a business combination is determined using the multi-period
excess earnings method, whereby the subject asset is valued after deducting a fair return on all other assets that
are part of creating the related cash flows.
The fair values of all other intangible assets acquired in a business combination applicable to the Group are
based on the discounted cash flows expected to be derived from the use and eventual sale of the assets.
ImpairmentThe accounting policy on impairment testing and the recognition of an impairment loss is disclosed in note 11.
Goodwill acquired in a business combination is allocated to cash-generating units that are expected to benefit
from the synergies of the combination. An impairment loss in respect of goodwill is not reversed.
Intangible assets with an indefinite useful life or not yet available for useGoodwill and intangible assets with an indefinite useful life or not yet available for use are tested for impairment
at least annually and whenever there is an indication that the asset may be impaired.
Intangible assets with finite useful livesThe Group annually reviews the carrying amounts of its intangible assets with finite useful lives in order to
determine whether there is any indication that those assets have suffered an impairment loss. If any such
indication exists, the recoverable amounts of the assets are estimated in order to determine the extent, if any, of
the impairment loss.
05
MTN Group Limited Integrated Report for the year ended 31 December 2012 Page 145
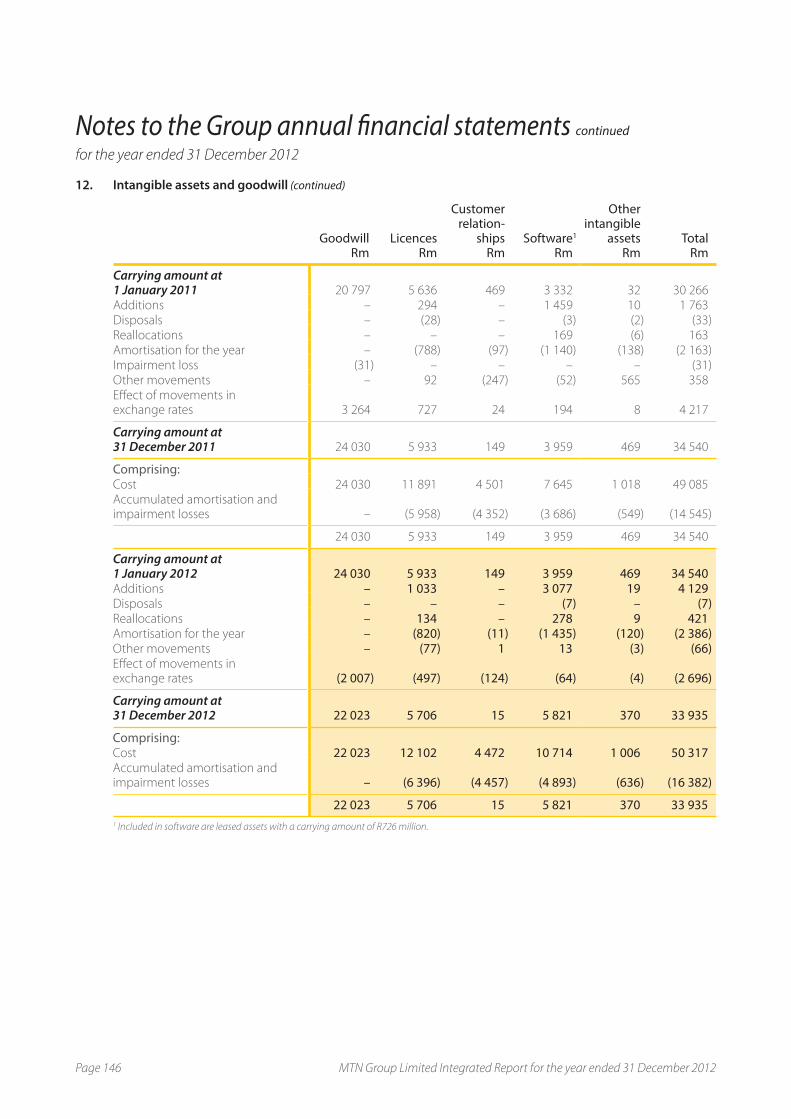
Notes to the Group annual financial statements continued
for the year ended 31 December 2012
12. Intangible assets and goodwill (continued)
GoodwillRm
LicencesRm
Customer relation-
shipsRm
Software1
Rm
Other intangible
assetsRm
TotalRm
Carrying amount at 1 January 2011 20 797 5 636 469 3 332 32 30 266
Additions – 294 – 1 459 10 1 763
Disposals – (28) – (3) (2) (33)
Reallocations – – – 169 (6) 163
Amortisation for the year – (788) (97) (1 140) (138) (2 163)
Impairment loss (31) – – – – (31)
Other movements – 92 (247) (52) 565 358
Effect of movements in exchange rates 3 264 727 24 194 8 4 217
Carrying amount at 31 December 2011 24 030 5 933 149 3 959 469 34 540
Comprising:Cost 24 030 11 891 4 501 7 645 1 018 49 085
Accumulated amortisation and impairment losses – (5 958) (4 352) (3 686) (549) (14 545)
24 030 5 933 149 3 959 469 34 540
Carrying amount at 1 January 2012 24 030 5 933 149 3 959 469 34 540Additions – 1 033 – 3 077 19 4 129Disposals – – – (7) – (7)Reallocations – 134 – 278 9 421Amortisation for the year – (820) (11) (1 435) (120) (2 386)Other movements – (77) 1 13 (3) (66)Effect of movements in exchange rates (2 007) (497) (124) (64) (4) (2 696)
Carrying amount at 31 December 2012 22 023 5 706 15 5 821 370 33 935
Comprising:Cost 22 023 12 102 4 472 10 714 1 006 50 317 Accumulated amortisation and impairment losses – (6 396) (4 457) (4 893) (636) (16 382)
22 023 5 706 15 5 821 370 33 935 1 Included in software are leased assets with a carrying amount of R726 million.
Page 146 MTN Group Limited Integrated Report for the year ended 31 December 2012

12. Intangible assets and goodwill (continued)A summary of the goodwill allocation and related assumptions applied for impairment testing purposes are
presented below.
2012 2011
Growth rate
%
Discount rate
% Rm
Growth
rate
%
Discount
rate
% Rm
MTN Côte d’Ivoire S.A. 3,0 11,6 2 078 2,0 16,2 1 945
Scancom Limited (Ghana) 5,0 16,4 8 560 3,0 11,9 8 295
MTN Sudan Company Limited 3,0 18,3 2 477 3,0 14,3 3 398
MTN Yemen 3,0 36,1 2 448 3,0 19,9 2 012
MTN Afghanistan Limited 5,0 16,4 1 350 3,0 13,7 1 189
MTN Uganda Limited 4,0 14,9 518 3,0 13,1 527
MTN Congo S.A. 3,0 10,6 688 3,0 12,4 644
MTN Syria (JSC) 5,0 20,6 245 2,0 14,6 326
MTN Cyprus Limited 1,0 8,3 676 3,0 8,7 551
Spacetel Benin SA 3,0 10,2 1 064 2,0 13,4 871
Areeba Guinea S.A. 5,0 20,9 695 1,0 15,8 566
MTN Business Solutions Limited – – – 4,5 12,3 1 472
Mascom Wireless Botswana Proprietary
Limited 3,0 12,6 692 3,0 9,3 687
Other 532 1 547
Total 22 023 24 030
Goodwill is tested annually for impairment. There was no impairment of any of the cash-generating units (CGUs) above to which goodwill had been allocated, apart from an impairment charge of R31 million in respect of the investment in Cell Place Proprietary Limited held by the Mobile Telephone Networks Proprietary Limited (South Africa) CGU in 2011.
The recoverable amounts of CGUs were determined based on value-in-use calculations. The calculations mainly used cash flow projections based on financial budgets approved by management covering a three to ten year period. Management is confident that projections covering periods longer than five years are appropriate based on the long-term nature of the Group’s infrastructure and operating model. Cash flows beyond the above period were extrapolated using the estimated growth rates measured below. The following key assumptions were used for the value-in-use calculations:
� growth rates: the Group used constant growth rates to extrapolate revenues beyond the budget period cash flows. The growth rates were consistent with publicly available information relating to long-term average growth rates for each of the markets in which the respective CGU operated. The average growth rates used ranged from 1% to 5% (2011: 1% to 4,5% as set out per operation in the table above); and
� discount rates: discount rates range from 8,3% to 36,1% (2011: 7,8% to 19,9%). Discount rates used reflect specific risks relating to the relevant CGU.
Goodwill impairment sensitivityFor MTN Business Solutions Limited, the discount rate had a significant influence on the sensitivity of the impairment test for 2011. For the detailed five year forecast period, a discount rate of 11,2% was projected, growth rate of 4,5%, capex to revenue ratio in terminal year of 5% and EBITDA margin in terminal year of 14,99%. If the discount rate had to increase by 0,25% the recoverable amount would have been equal to its carrying amount. The operation has been restructured in 2012 and forms part of Mobile Telephone Networks Proprietary Limited (South Africa).
Individually material intangible assetsOther than goodwill and network licences, there were no items of intangible assets that were individually material at the end of the current or prior year.
05
MTN Group Limited Integrated Report for the year ended 31 December 2012 Page 147

Notes to the Group annual financial statements continued
for the year ended 31 December 2012
12. Intangible assets and goodwill (continued)
Licence agreements TypeDate granted/
renewed Term
Mobile Telephone Networks Proprietary Limited
(South Africa)
ECS licence 15/01/2009 15 years
ECNS licence 15/01/2009 20 years
900MHz 1/01/2010 renewable annually
1 800MHz
3G
MTN Uganda Limited 900MHz 15/04/1998 20 years
1 800MHz
MTN Rwandacell S.A.R.L. GSM 1/07/2008 13 years
SNO 30/06/2006 15 years
Mascom Wireless Botswana Proprietary Limited 900MHz 13/06/2007 15 years
1 800MHz
2 100MHz
MTN Zambia Limited 1 800MHz 23/09/2010 15 years
Swazi MTN Limited 900MHz 28/11/2008 10 years
1 800MHz
2 100MHz 26/09/2011 7 years
MTN Nigeria Communications Limited 900MHz 9/02/2001 15 years
1 800MHz
3G spectrum licence 1/05/2007 15 years
Unified access licence (including
International gateway) 1/09/2006 15 years
WACS 1/01/2010 20 years
Wimax 3,5GHz spectrum 2007 renewable annually
Microwave spectrum 8GHz – 26GHz 2001 renewable annually
Scancom Limited (Ghana) 900MHz 2/12/2004 15 years
1 800MHz
3G 23/01/2009 15 years
Mobile Telephone Network Cameroon Limited 900MHz 15/02/2000 15 years
1st category network for
internet access
and VPN 31/03/2006 10 years
MTN Côte d’Ivoire S.A. 900MHz/1 800MHz 2/04/1996 20 years
Wimax 2,5 – 3,5GHz 31/07/2002 20 years
3G/UMTS 1,9/2,1GHz 31/05/2012 10 years
Spacetel Benin SA 900MHz 19/10/2007 25 years
1 800MHz
Universal licence 19/03/2012 20 years
Page 148 MTN Group Limited Integrated Report for the year ended 31 December 2012

12. Intangible assets and goodwill (continued)
Licence agreements TypeDate granted/
renewed Term
Areeba Guinea S.A. 900MHz 31/08/2005 18 years
1 800MHz
WiMax 4/06/2009 5 years
MTN Congo S.A. 900MHz 15/10/1999 15 years
1 800MHz 21/08/2002 15 years
International gateway 5/02/2002 15 years
Optical fibre licence 2/04/2010 15 years
3G licence 25/11/2011 17 years
2G licence 25/11/2011 15 years
Lonestar Communications Corporation LLC
(Liberia)
900MHz 24/03/2009 15 years
1 800MHz
WiMax
Spacetel Guinea-Bissau S.A. 1 800MHz 1/03/2004 10 years
900MHz 1/03/2004 10 years
Irancell Telecommunication Company Services
(PJSC)
GSM 9/7/2006 15 years
WiMAX 28/02/2009 6 years
MTN Syria (JSC) 900MHz 29/06/2002 15 years
1 800MHz 22/03/2007 10 years
3G 29/04/2009 8 years
ISP1 31/05/2009 3 years
MTN Sudan Company Limited Frequency 2G + 3G 25/10/2003 20 years
Transmission
VSAT gateway
VSAT hub
VSAT terminal
MTN Afghanistan Limited 3G unified licence 1/07/2012 15 years
MTN Yemen 900MHz 31/07/2000 15 years
1 800MHz 17/02/2008
MTN Cyprus Limited 900MHz 1/12/2003 20 years
1 800MHz
3G
1 Renewal application lodged.
05
MTN Group Limited Integrated Report for the year ended 31 December 2012 Page 149

Notes to the Group annual financial statements continued
for the year ended 31 December 2012
13. Investment in associates
Associates are all entities over which the Group has significant influence, but not control, over the financial and
operating policies. Significant influence is presumed to exist when the Group holds between 20% and 50% of
the voting power of another entity.
Associates are accounted for using the equity method and are recognised initially at cost. The Group’s investment
in associates includes goodwill identified on acquisition net of any accumulated impairment losses. The
consolidated annual financial statements include the Group’s share of post-acquisition accumulated profits or
losses of associated companies in the carrying amount of the investments, which are generally determined from
their latest audited annual financial statements or management accounts and the annual profit attributable to
the Group is recognised in profit or loss. The Group’s share of post-acquisition movement in reserves is recognised
in other comprehensive income. The cumulative post-acquisition movements are adjusted against the carrying
amount of the investment.
The carrying amount of such interests is reduced to recognise any potential impairment in the value of individual
investments. When the Group’s share of losses in an associate equals or exceeds its interest in the associate, the
Group does not recognise further losses, unless the Group has an obligation, issued guarantees or made
payments on behalf of the associate.
Dilution gains or losses arising on investments in associates are recognised in profit or loss.
If the ownership interest in an associate is reduced but significant influence is retained, only a proportionate
share of the amounts previously recognised in other comprehensive income are reclassified to profit or loss.
Profits or losses resulting from upstream and downstream transactions between the Group and its associates are
recognised in the Group’s annual financial statements only to the extent of unrelated investors’ interests in the
associates. Unrealised losses are eliminated unless the transaction provides evidence of an impairment of
the asset transferred.
Accounting policies of associates have been changed where necessary to align them with the policies of the
Group.
Unless otherwise stated, the Group’s associates’ countries of incorporation are also their principal place of operation.
The Group has the following effective interests in associates:
2012 2011
Associate Principal activityCountry of incorporation
Effective % interest in issued ordinary share capital
Number Portability Proprietary Limited Number porting South Africa 20 20
Leaf Wireless Proprietary Limited Cellular dealership South Africa 44 44
Belgacom International Carrier Services
SA (BICS) Telecommunications Belgium 20 20
Ghana Tower InterCo BV1 Management of
telecommunication
infrastructure Netherlands 49 49
Uganda Tower InterCo BV1 Management of
telecommunication
infrastructure Netherlands 49 49
1The Group acquired a 49% stake in both Ghana Tower InterCo BV and Uganda Tower InterCo BV in 2011.
Page 150 MTN Group Limited Integrated Report for the year ended 31 December 2012
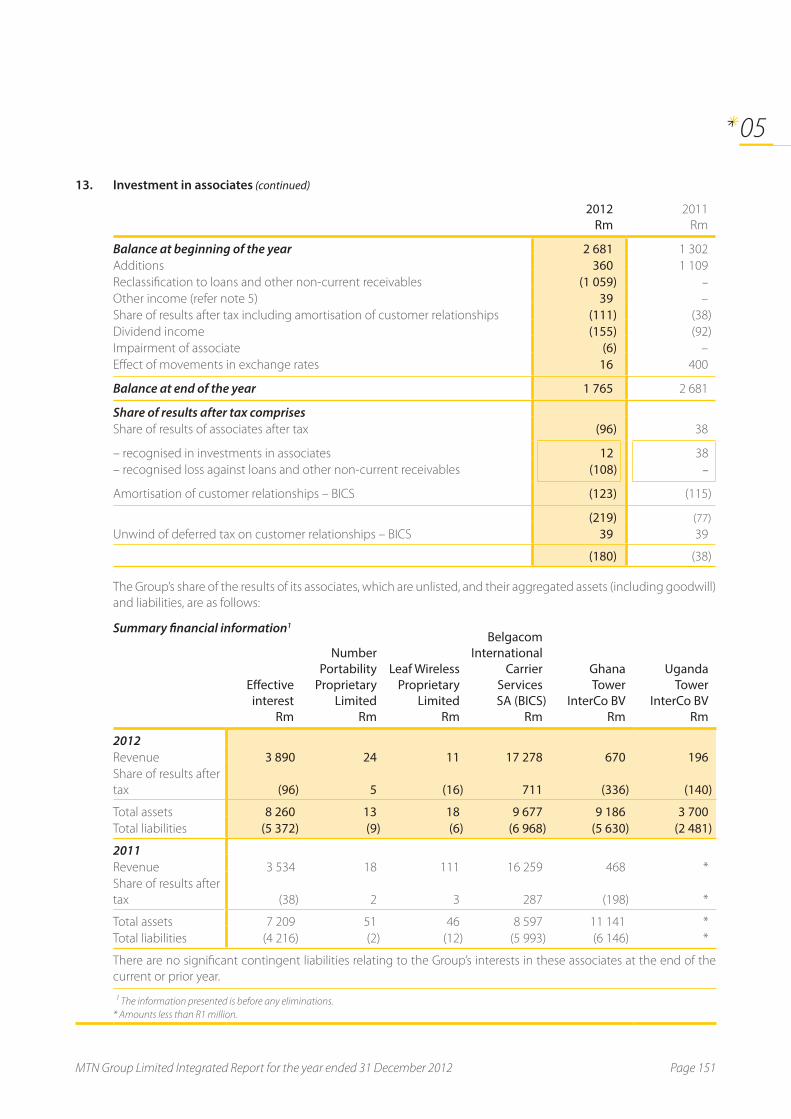
13. Investment in associates (continued)
2012Rm
2011
Rm
Balance at beginning of the year 2 681 1 302
Additions 360 1 109
Reclassification to loans and other non-current receivables (1 059) –Other income (refer note 5) 39 –
Share of results after tax including amortisation of customer relationships (111) (38)
Dividend income (155) (92)
Impairment of associate (6) –
Effect of movements in exchange rates 16 400
Balance at end of the year 1 765 2 681
Share of results after tax comprisesShare of results of associates after tax (96) 38
– recognised in investments in associates 12 38
– recognised loss against loans and other non-current receivables (108) –
Amortisation of customer relationships – BICS (123) (115)
(219) (77)
Unwind of deferred tax on customer relationships – BICS 39 39
(180) (38)
The Group’s share of the results of its associates, which are unlisted, and their aggregated assets (including goodwill)
and liabilities, are as follows:
Summary financial information1
Effective interest
Rm
NumberPortability
ProprietaryLimited
Rm
Leaf WirelessProprietary
LimitedRm
BelgacomInternational
CarrierServicesSA (BICS)
Rm
Ghana Tower
InterCo BVRm
Uganda Tower
InterCo BVRm
2012Revenue 3 890 24 11 17 278 670 196 Share of results after
tax (96) 5 (16) 711 (336) (140)
Total assets 8 260 13 18 9 677 9 186 3 700 Total liabilities (5 372) (9) (6) (6 968) (5 630) (2 481)
2011Revenue 3 534 18 111 16 259 468 *
Share of results after
tax (38) 2 3 287 (198) *
Total assets 7 209 51 46 8 597 11 141 *
Total liabilities (4 216) (2) (12) (5 993) (6 146) *
There are no significant contingent liabilities relating to the Group’s interests in these associates at the end of the
current or prior year.
1 The information presented is before any eliminations.
* Amounts less than R1 million.
05
MTN Group Limited Integrated Report for the year ended 31 December 2012 Page 151

Notes to the Group annual financial statements continued
for the year ended 31 December 2012
14. Loans and other non-current receivables
Loans and other non-current receivables are accounted for as loans and receivables in accordance with the
accounting policy disclosed in note 43.
2012Rm
2011
Rm
Loan to Irancell Telecommunication Company Services (PJSC)1 1 755 1 596
Loan to Uganda Tower InterCo BV2 534 –
Loan to Ghana Tower InterCo BV3 1 131 –
Non-current prepayments and advances 3 055 2 076
6 475 3 672
1 The loan to Irancell Telecommunication Company Services (PJSC) attracts interest at LIBOR +4% per annum which is capitalised against the loan. The
loan and capitalised interest are payable in 2014. The loan is registered with the Organisation for Investments Economic and Technical Assistance of Iran
(OIETAI) under the foreign investment licence obtained by the Company and which is covered by the Foreign Investment Promotion and Protection Act
(FIPPA).2 The loan to Uganda Tower InterCo BV attracts interest at LIBOR +5,3% per annum. The loan is repayable in 2019.3 The loan to Ghana Tower InterCo BV attracts interest at a fixed rate of 9,0% per annum. The loan is repayable in 2016.
The recoverability of the loans was assessed at the reporting date and was found not to be impaired.
15. Deferred taxes
Deferred tax is accounted for in accordance with the accounting policy disclosed in note 8.
1 January2011
Rm
Recognised in profit
or lossRm
Exchange and other
movementsRm
31 December2011
Rm
Recognised in profit
or lossRm
Exchange and other
movementsRm
31 December2012
Rm
Deferred tax assetsProvisions and other temporary differences 1 066 (9) (124) 933 355 (190) 1 098 Depreciation in excess of tax allowances 249 – 34 283 – 5 288 Tax loss carried forward 89 (361) 322 50 (16) (4) 30 Arising due to fair value adjustments on business combinations 3 16 (1) 18 4 21 43 Working capital allowances – – – – (22) – (22)
1 407 (354) 231 1 284 321 (168) 1 437
Page 152 MTN Group Limited Integrated Report for the year ended 31 December 2012
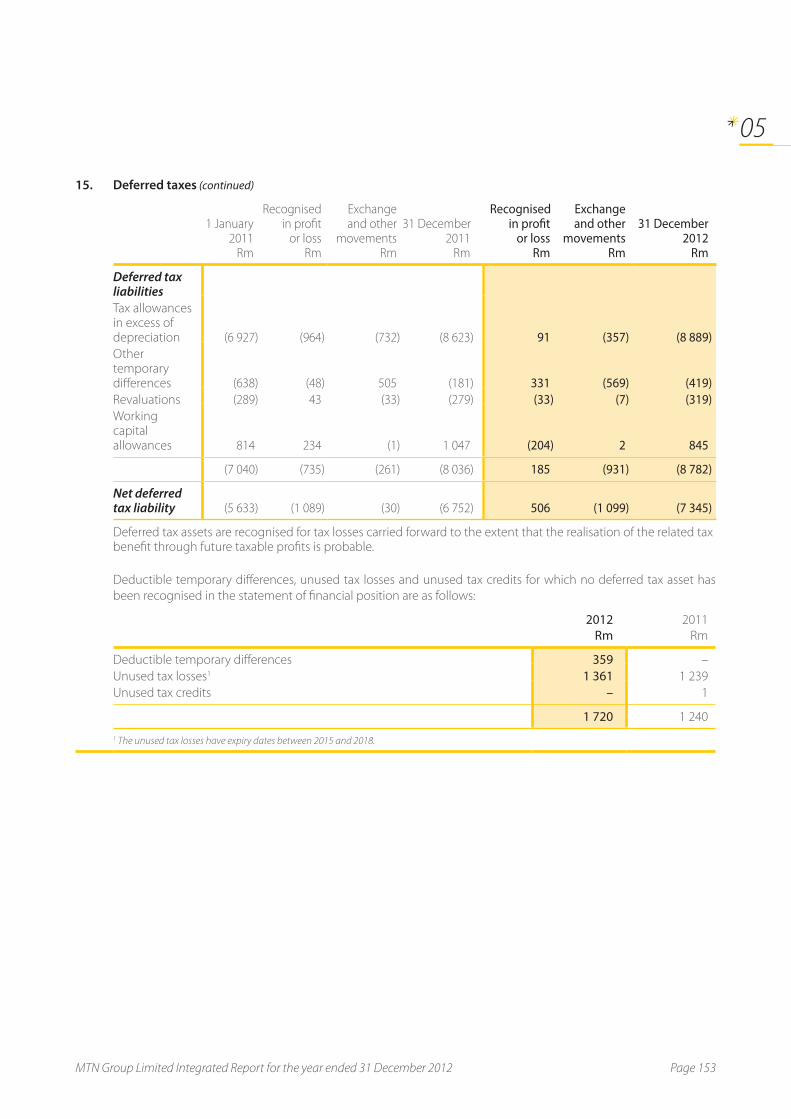
15. Deferred taxes (continued)
1 January2011
Rm
Recognised in profit
or lossRm
Exchange and other
movementsRm
31 December2011
Rm
Recognised in profit
or lossRm
Exchange and other
movementsRm
31 December2012
Rm
Deferred tax liabilitiesTax allowances in excess of depreciation (6 927) (964) (732) (8 623) 91 (357) (8 889)Other temporary differences (638) (48) 505 (181) 331 (569) (419)Revaluations (289) 43 (33) (279) (33) (7) (319)Working capital allowances 814 234 (1) 1 047 (204) 2 845
(7 040) (735) (261) (8 036) 185 (931) (8 782)
Net deferred tax liability (5 633) (1 089) (30) (6 752) 506 (1 099) (7 345)
Deferred tax assets are recognised for tax losses carried forward to the extent that the realisation of the related tax benefit through future taxable profits is probable.
Deductible temporary differences, unused tax losses and unused tax credits for which no deferred tax asset has
been recognised in the statement of financial position are as follows:
2012 Rm
2011
Rm
Deductible temporary differences 359 –
Unused tax losses1 1 361 1 239
Unused tax credits – 1
1 720 1 240
1 The unused tax losses have expiry dates between 2015 and 2018.
05
MTN Group Limited Integrated Report for the year ended 31 December 2012 Page 153

Notes to the Group annual financial statements continued
for the year ended 31 December 2012
16. Non-current assets held for sale
Non-current assets (or disposal groups) are classified as non-current assets held for sale and are stated at the
lower of their carrying amounts and fair value less costs to sell when their carrying amounts are to be recovered
principally through sale rather than continued use and the sale is considered to be highly probable.
2012Rm
2011
Rm
Property, plant and equipment – network assets 1 373 820
The Group entered into a transaction with IHS Holding Limited (IHS) in which IHS will acquire 931 mobile network
towers from MTN Côte d’Ivoire S.A. for US$141 million and 827 towers from Mobile Telephone Networks Cameroon
Limited for US$143 million. Under the agreements, IHS will be a 100% shareholder of the tower companies set up
in each country to manage the towers and other passive infrastructure. MTN Côte d’Ivoire S.A. and Mobile Telephone
Networks Cameroon Limited will, on commercial terms, become the anchor tenants on the towers being sold for
an initial term of ten years.
Formal notice regarding the close of the Mobile Telephone Networks Cameroon Limited and MTN Côte d’Ivoire S.A.
tower sale transactions has been issued. The Mobile Telephone Networks Cameroon Limited transaction closed on
28 February 2013, refer to note 40.
In 2012, MTN Uganda Limited concluded a transaction with American Tower Company (ATC) which involved the
sale of 962 of MTN Uganda’s existing BTS sites to TowerCo Uganda for an agreed purchase price of US$175 million.
ATC holds a 51% stake in TowerCo Uganda’s holding company, with the remaining 49% stake held by the Group.
MTN Uganda will be the anchor tenant on commercial terms on each of the towers being sold.
Page 154 MTN Group Limited Integrated Report for the year ended 31 December 2012
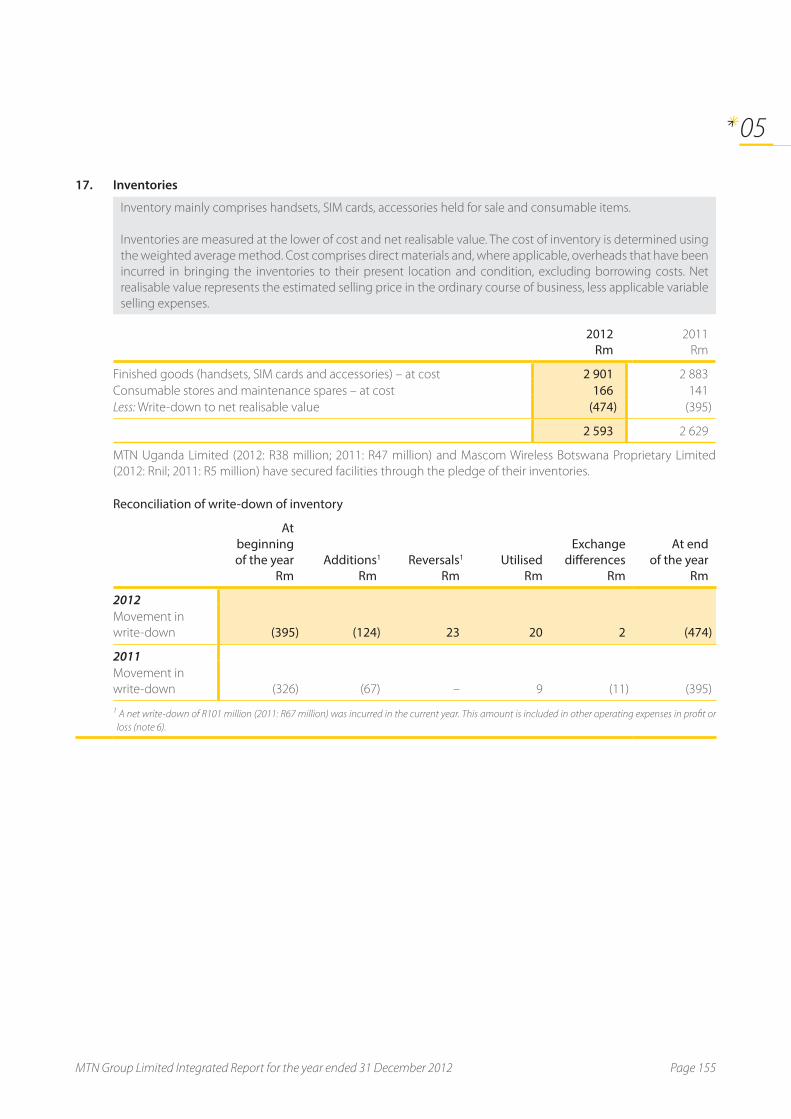
17. Inventories
Inventory mainly comprises handsets, SIM cards, accessories held for sale and consumable items.
Inventories are measured at the lower of cost and net realisable value. The cost of inventory is determined using
the weighted average method. Cost comprises direct materials and, where applicable, overheads that have been
incurred in bringing the inventories to their present location and condition, excluding borrowing costs. Net
realisable value represents the estimated selling price in the ordinary course of business, less applicable variable
selling expenses.
2012Rm
2011
Rm
Finished goods (handsets, SIM cards and accessories) – at cost 2 901 2 883
Consumable stores and maintenance spares – at cost 166 141
Less: Write-down to net realisable value (474) (395)
2 593 2 629
MTN Uganda Limited (2012: R38 million; 2011: R47 million) and Mascom Wireless Botswana Proprietary Limited
(2012: Rnil; 2011: R5 million) have secured facilities through the pledge of their inventories.
Reconciliation of write-down of inventory
At beginning of the year
RmAdditions1
RmReversals1
RmUtilised
Rm
Exchange differences
Rm
At end of the year
Rm
2012Movement in
write-down (395) (124) 23 20 2 (474)
2011Movement in
write-down (326) (67) – 9 (11) (395)
1 A net write-down of R101 million (2011: R67 million) was incurred in the current year. This amount is included in other operating expenses in profit or
loss (note 6).
05
MTN Group Limited Integrated Report for the year ended 31 December 2012 Page 155

Notes to the Group annual financial statements continued
for the year ended 31 December 2012
18. Trade and other receivables
Trade receivables are amounts due from customers for merchandise sold or services rendered in the ordinary
course of business; they are accounted for as loans and receivables in accordance with the accounting policy
disclosed in note 43.
Prepayments and other receivables are stated at their nominal values.
2012Rm
2011
Rm
Trade receivables 14 960 14 159
Less: Allowance for impairment of trade receivables (note 43.3) (2 098) (1 900)
Net trade receivables 12 862 12 259
Prepayments and other receivables1 3 246 2 595
Sundry debtors and advances2 1 415 3 062
17 523 17 916
1 Prepayments and other receivables include prepayments for BTS and other property leases.2 Sundry debtors and advances include advances to suppliers.
An impairment loss of R263 million (2011: R455 million) was incurred in the current year, and this amount is included
in other operating expenses in profit or loss (note 6).
MTN Uganda Limited (2012: Rnil; 2011: R370 million), and Mascom Wireless Botswana Proprietary Limited (2012: Rnil;
2011: R95 million) have secured facilities through the pledge of their trade and other receivables.
The Group does not hold any collateral for trade and other receivables.
The Group's exposure to credit and currency risk relating to trade and other receivables is disclosed in note 43.
Page 156 MTN Group Limited Integrated Report for the year ended 31 December 2012

19. Current investments
Current investments consist of loans and receivables and held-to-maturity financial assets that are accounted for
in accordance with the accounting policy disclosed in note 43.
2012Rm
2011
Rm
Loans and receivablesGovernment bonds with fixed interest rates of 18% – 20% (2011: 16,5% – 17%)1 489 215
Foreign currency fixed deposits with fixed interest rates of 1,5% – 2,5%
(2011: 0,2% – 2,75%)2 1 234 1 462
Foreign currency fixed deposits with fixed interest rates of 2,24% – 2,54%2 3 620 –
5 343 1 677
Held-to-maturity financial assetsGovernment bonds with interest rates of 5,5% – 9,45% (2011: 9,5% – 9,92%)
and maturity dates between January and February 2013 (2011: January and
February 2012) 4842 6983
Treasury bills with interest rates of 14,1% – 15,6% (2011: 7,7% – 16,8%) and
maturity dates between January and August 2013 (2011: January and
November 2012)3 1 247 7 105
1 731 7 803
Total current investments 7 074 9 480
1 Denominated in Iranian rial.2 Denominated in United States dollar.3 Denominated in Nigeria naira.
No provision for impairment has been raised as at the reporting date as the loans and receivables and held-to-
maturity assets are considered to be fully performing.
There were no disposals of held-to-maturity financial assets in 2012 or in 2011.
20. Derivatives
Derivatives are accounted for in accordance with the accounting policy disclosed in note 43.
2012 Rm
2011 Rm
Derivatives held for tradingCurrent assetsForward exchange contracts 191 9
Non-current liabilitiesInterest rate swap (2) – Current liabilitiesForward exchange contracts (14) (4)
175 5
Gains/(losses) accounted for directly in profit or loss 179 (12)
Notional principal amount (US$ forward exchange contracts) 4 783 470
Notional principal amount (EUR forward exchange contracts) 20 9
Notional principal amount (US$ interest rate swap) 2 117 –
05
MTN Group Limited Integrated Report for the year ended 31 December 2012 Page 157

Notes to the Group annual financial statements continued
for the year ended 31 December 2012
21. Restricted cash
Restricted cash comprises short-term deposits that are not highly liquid and are accounted for as loans and
receivables in accordance with the accounting policy disclosed in note 43.
2012 Rm
2011 Rm
Restricted cash deposits 5 277 546
Restricted cash deposits include an amount of R2 869 million (2011: Rnil) relating to the Syrian operation, which is not available for use by the Group due to exchange control regulations largely prohibiting the repatriation of foreign currency, the current sanction environment and a lack of foreign currency in Syria. The majority of the cash balance is considered to represent excess cash not required for payment of SYP denominated liabilities.
Other restricted cash deposits consist of monies placed on deposit with banks mainly in Nigeria and Sudan to
secure letters of credit, which were undrawn and not freely available at the reporting date.
22. Net cash and cash equivalents
Cash and cash equivalents are accounted for as loans and receivables in accordance with the accounting policy
disclosed in note 43.
Bank overdrafts are accounted for as financial liabilities in accordance with the accounting policy disclosed in
note 43.
Cash and cash equivalents comprise cash on hand and deposits held on call, all of which are available for use by
the Group. Bank overdrafts are included within current liabilities on the statement of financial position, unless the
Group has a legally enforceable right to set off the amounts and intends to settle on a net basis, or realise
the asset and settle the liability simultaneously, in which case it is netted off against cash and cash equivalents
on the statement of financial position.
For the purposes of the statement of cash flows, cash and cash equivalents comprise of the following:
2012Rm
2011Rm
Cash at bank and on hand 25 700 35 806
Bank overdrafts (169) (593)
25 531 35 213
Cash and cash equivalents include an amount of R2 680 million relating to Iran Telecommunication Company
Services (PJSC), which is subject to sanctions, but is available for use within the Iranian operation. The Group
continues to explore acceptable channels that are compliant with ongoing sanctions for repatriation of these funds.
MTN Uganda Limited (2012: R709 million; 2011: R195 million) and Mascom Wireless Botswana Proprietary Limited
(2012: Rnil; 2011: R126 million) have secured facilities through the pledge of their cash and cash equivalents.
Page 158 MTN Group Limited Integrated Report for the year ended 31 December 2012

23. Ordinary share capital and share premium
Ordinary shares are classified as equity. Incremental external costs directly attributable to the issue of new
ordinary shares or share options are recognised in equity as a deduction (net of tax) from the proceeds.
Where any Group company purchases the Company’s equity share capital (treasury shares), the consideration
paid, including any directly attributable incremental external costs (net of tax), is deducted from equity
attributable to the Company’s equity holders. Where such ordinary shares are subsequently reissued, any
consideration received, net of any directly attributable incremental transaction costs and the related income tax
effects, is included in equity attributable to the Company’s equity holders.
2012 2011
Number of shares
Ordinary share capital (par value of 0,01 cents)Authorised 2 500 000 000 2 500 000 000
Issued (fully paid up) 1 883 484 324 1 884 811 569
In issue at beginning of the year 1 884 811 569 1 884 510 117
Options exercised and allotted 193 780 301 452
Strike priceR9.31 161 360 88 330
R13.53 – 107 734
R27.00 21 600 12 240
R40.50 10 820 93 148
Shares cancelled (1 521 025) –
In issue at end of the year 1 883 484 324 1 884 811 569
Options – MTN Zakhele transaction1 (28 473 927) (29 994 952)
Treasury shares2 (22 337 752) (6 764 412)
In issue at end of the year – excluding MTN Zakhele transaction and treasury shares3 1 832 672 645 1 848 052 205
1 Due to the call option over the notional vendor finance shares, these shares, although legally issued to MTN Zakhele, are not deemed to be issued in
terms of IFRS and are shown as such in the share capital reconciliation.2 Treasury shares held by MTN Holdings Proprietary Limited.3 There are no restrictions, rights and preferences including restrictions on dividend distributions attached to these shares.
05
MTN Group Limited Integrated Report for the year ended 31 December 2012 Page 159

Notes to the Group annual financial statements continued
for the year ended 31 December 2012
23. Ordinary share capital and share premium (continued)
2012Rm
2011
Rm
Share capitalBalance at beginning of the year * *
Additions * *
Shares cancelled * –
Balance at end of the year * *
Share premium Balance at beginning of the year 44 678 45 602
Options exercised 3 6
Share buy-back (2 088) (930)
Balance at end of the year 42 593 44 678
*Amounts less than R1 million.
MTN Zakhele transactionThe Group concluded its broad-based black economic empowerment (B-BBEE) transaction “MTN Zakhele” during
October 2010. The transaction is designed to provide long-term, sustainable benefits to all B-BBEE participants and
will run for a period of six years. Over 122 552 applicants subscribed for shares and were successful.
The total cost of this transaction was R2 973 million which was recognised as a once-off charge in profit or loss
in 2010. This charge included the once-off share-based payment transaction charges for notional vendor finance of
R1 382 million, the employee share option plan of R171 million and a donation of R1 294 million. Transaction costs
amounted to R126 million.
The donation was used to subscribe for 12 045 412 shares at a price of R107,46 per share. Through the notional
vendor finance, the Company issued 29 994 952 shares (NVF shares) to MTN Zakhele at par value. In the current year
1 521 025 shares (2011: nil shares) were cancelled. The Group has a call option over these shares. The value of the
call option is R1 747 million (2011: R1 772 million) and was determined using a Monte Carlo valuation model. The
significant inputs into the model were the market share price of the Company’s shares of R128,85 at the grant date,
being 14 October 2010, volatility of 28,7% (2011: 39,9%), dividend yield of 6,1% (2011: 7,6%), expected option life of
five years (2011: six years) and an annual risk free rate of 5,5% (2011: 6,8%).
Share buy-backMTN Holdings Proprietary Limited acquired 15 573 340 (2011: 6 764 412) shares at an average price of R134,07
(2011: R137,50) per share, inclusive of transaction costs, in the Company on the JSE Limited during the period of
April – June 2012. The total amount paid to acquire the shares, inclusive of transaction costs, was R2 088 million
(2011: R930 million). The shares are fully paid shares and are held as treasury shares.
The Group’s objective in terms of the buy-back is to create shareholder value over time and improve the structure
of the statement of financial position.
Page 160 MTN Group Limited Integrated Report for the year ended 31 December 2012

24. Other reserves
2012 Rm
2011
Rm
Balance at beginning of the year (12 348) (22 724)
Transactions with non-controlling interests (122) (89)
Transfer to retained earnings (22) (37)
Share-based payment reserve 147 74
Exchange differences on translating foreign operations (3 498) 10 415
Other 9 13
Balance at end of the year (15 834) (12 348)
Consisting of:Contingency reserve (as required by insurance regulations)1 4 28
Statutory reserve (as required by Rwanda and Congo-Brazzaville legislation)2 211 209
Transactions with non-controlling interests3 (10 901) (10 779)
Share-based payment reserve4 2 189 2 042
Foreign currency translation reserve5 (7 348) (3 850)
Other 11 2
(15 834) (12 348)
1 A contingency reserve has been created in terms of the Short-term Insurance Act, 1988. Transfers to the contingency reserve are treated as an
appropriation of income, and the balance of the reserve is disclosed in the statement of financial position as a non-distributable reserve, forming part
of shareholders’ funds. On dissolution of the special purpose entities to which these reserves relate, they will become available for distribution.2 A statutory reserve has been created in terms of local legislation. Transfers to the statutory reserve are treated as an appropriation of income, and the
balance of the reserve is disclosed in the statement of financial position as a non-distributable reserve, forming part of the shareholders’ funds.3 Non-controlling shareholders are treated as equity participants and, therefore, all acquisitions of non-controlling interests or disposals by the Group of
its interests in subsidiary companies where control is maintained subsequent to the disposal are accounted for as equity transactions. Consequently, the
difference between the fair value of the consideration transferred and the carrying amount of a non-controlling interest purchased is recorded in equity.
All profits or losses arising as a result of the disposal of interests in subsidiaries to non-controlling shareholders, where control is maintained subsequent
to the disposal, are also recorded in equity.4 Refer to the accounting policy in note 44 with regards to equity-settled share-based payments. 5 Refer to the translation and disposal of foreign operations sections in accounting policy 1.3.2 Foreign currency.
05
MTN Group Limited Integrated Report for the year ended 31 December 2012 Page 161

Notes to the Group annual financial statements continued
for the year ended 31 December 2012
25. Borrowings
Borrowings are accounted for as financial liabilities in accordance with the accounting policy disclosed in note 43.
Fees paid on the establishment of loan facilities are recognised as transaction costs and capitalised to the extent
that it is probable that some or all of the facility will be drawn down. When the draw down is made, the transaction
costs are amortised to profit or loss using the effective interest method. To the extent there is no evidence that
it is probable that some or all of the facility will be drawn down, the fee is capitalised as a prepayment for liquidity
services and amortised over the period of the facility to which it relates.
Details of the Group’s significant unsecured borrowings are provided below:
2012Rm
2011Rm
Denominated currency
Nominal interest*
% Repayment details
UnsecuredMTN Holdings Proprietary Limited 12 439 13 042
7 192 5 300 ZAR1, 2 5,2 – 10,2 Maturity: January 2013 – July 20172 992 – ZAR3, 4 6,5 Maturity: December 2015
1 005 742 ZAR2, 5 5,5 Capital repayment – January 2013 2011 loan repaid during the year
1 000 1 000 ZAR 4, 6 6,6 Interest paid quarterly. Bullet capital repayment – March 2014
250 – ZAR4, 7 6,6 Maturity: June 2016 – 6 000 ZAR3, 4 8,0 Loan repaid during the year
MTN Nigeria Communications Limited 12 613 13 065
10 134 10 222 NGN3, 4 16,0 Annual. Final repayment – December 2015
1 251 893 US$4, 8 3,2 Semi-annual. Final repayment – June 2015
1 228 1 155 US$4, 8 1,3 Semi-annual. Final repayment – June and December 2015
– 795 US$3, 4 2,0 Loan repaid during the year
MTN Zambia Limited 1 248 951
975 951 ZMK3, 4 11,0 Interest semi-annual. Bullet capital repayment – January 2014
273 – US$4, 6 4,0 Interest semi-annual. Final repayment – June 2019
Spacetel Benin SA 1 083 478
341 478 XOF2, 3 8,3 Semi-annual. Final repayment – August 2014
742 – XOF2, 3 7,8 Semi-annual. Final repayment – March 2017
Mobile Telephone Networks Cameroon Limited 537
704 XAF2, 3 6,0
Semi-annual. Final repayment – May 2015
MTN Congo S.A. 474 510 XAF2, 3 7,0 Monthly. Final repayment – November 2016
Other unsecured borrowings 706 1 588
Total unsecured borrowings 29 100 30 338
1 Domestic medium-term notes 2 Fixed interest rate 3 Syndicated term loan facility 4 Variable interest rate 5 Commercial paper 6 Bilateral term loan facility 7 Revolving credit facility 8 Export credit facility9 Vendor finance facility 10 Bank borrowings
* Nominal interest rates are the contractual interest rates on loans as at 31 December 2012.
Page 162 MTN Group Limited Integrated Report for the year ended 31 December 2012
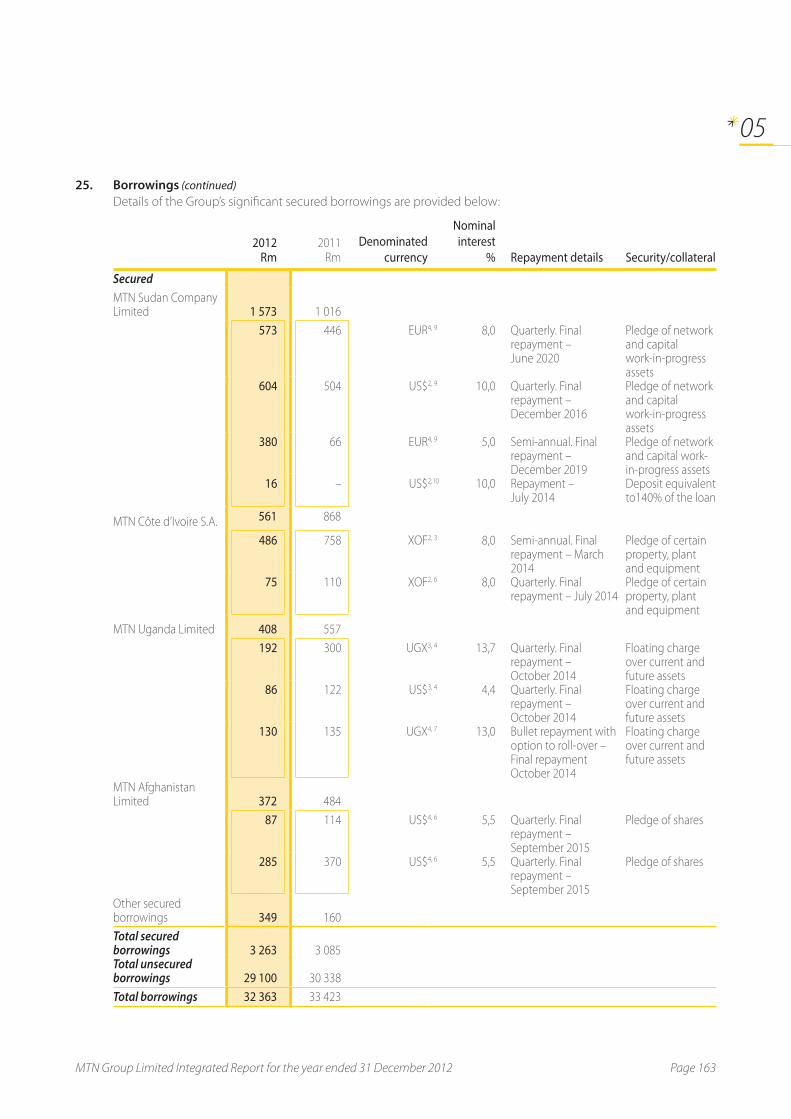
25. Borrowings (continued)Details of the Group’s significant secured borrowings are provided below:
2012Rm
2011Rm
Denominated currency
Nominal interest
% Repayment details Security/collateral
SecuredMTN Sudan Company Limited 1 573 1 016
573 446 EUR4, 9 8,0 Quarterly. Final repayment – June 2020
Pledge of network and capital work-in-progress assets
604 504 US$2, 9 10,0 Quarterly. Final repayment – December 2016
Pledge of network and capital work-in-progress assets
380 66 EUR4, 9 5,0 Semi-annual. Final repayment – December 2019
Pledge of network and capital work-in-progress assets
16 – US$2, 10 10,0 Repayment – July 2014
Deposit equivalent to140% of the loan
MTN Côte d’Ivoire S.A. 561 868
486 758 XOF2, 3 8,0 Semi-annual. Final repayment – March 2014
Pledge of certain property, plant and equipment
75 110 XOF2, 6 8,0 Quarterly. Final repayment – July 2014
Pledge of certain property, plant and equipment
MTN Uganda Limited 408 557
192 300 UGX3, 4 13,7 Quarterly. Final repayment – October 2014
Floating charge over current and future assets
86 122 US$3, 4 4,4 Quarterly. Final repayment – October 2014
Floating charge over current and future assets
130 135 UGX4, 7 13,0 Bullet repayment with option to roll-over – Final repayment October 2014
Floating charge over current and future assets
MTN Afghanistan Limited 372 484
87 114 US$4, 6 5,5 Quarterly. Final repayment – September 2015
Pledge of shares
285 370 US$4, 6 5,5 Quarterly. Final repayment – September 2015
Pledge of shares
Other secured borrowings 349 160
Total secured borrowings 3 263 3 085 Total unsecured borrowings 29 100 30 338
Total borrowings 32 363 33 423
05
MTN Group Limited Integrated Report for the year ended 31 December 2012 Page 163

Notes to the Group annual financial statements continued
for the year ended 31 December 2012
25. Borrowings (continued)2012
Rm2011
Rm
The classification of the Group’s borrowings is as follows:Current 10 621 9 869
Non-current 21 742 23 554
32 363 33 423
The carrying amounts of the Group’s borrowings are denominated in the following currencies:South African rand 12 712 13 300
Nigerian naira 10 134 10 222
United States dollar 3 983 4 188
Euro 1 209 1 234
Benin Communaute Financiere Africaine franc 1 083 478
Zambian kwacha 975 951
Côte d’Ivoire Communaute Financiere Africaine franc 632 1 129
Cameroon Communaute Financiere Africaine franc 537 704
Congo-Brazzaville Communaute Financiere Africaine franc 515 556
Uganda shilling 322 435
Various other currencies 261 226
32 363 33 423
Undrawn facilitiesFloating rate 21 627 14 806
Fixed rate 16 419 17 593
38 046 32 399
MTN Sudan – Breach of loan agreementDuring 2012, MTN Sudan Company Limited breached the required EBITDA to Financial Net Payable covenant on
one of its borrowing facilities with a carrying amount of R573 million. The breach is primarily attributable to
significant realised foreign exchange losses incurred in the current year. Management has notified the affected
lender and is currently in the process of finalising a waiver of the breach. The lender has not requested accelerated
repayment of the loan. The loan has, however, been reflected as current at 31 December 2012.
Page 164 MTN Group Limited Integrated Report for the year ended 31 December 2012

26. Other non-current liabilities
Finance leases are accounted for in accordance with the accounting policy disclosed in note 37 and other
liabilities are accounted for in accordance with the accounting policy disclosed in note 43.
2012Rm
2011
Rm
Finance lease obligations (note 37) 858 189
Other non-current provisions – 457
Deferred gain on asset swap1 599 870
Other 1 176 585
2 633 2 101
Less: current portion of deferred gain on asset swap (note 29) (313) (299)
2 320 1 802
1 The deferred gain arose on the contribution of various assets from MTN (Dubai) Limited, MTN International Carrier Services and Uniglobe in exchange
for a 20% investment in the associate, Belgacom International Carrier Services SA (BICS) (note 13). This gain was deferred and is being amortised over a
five-year period, which is the period of the commitment to use the international gateway of Belgacom SA (note 5).
27. Provisions
A provision is recognised when there is a present legal or constructive obligation as a result of a past event for
which it is more likely than not that an outflow of resources will be required to settle the obligation and a reliable
estimate can be made of the amount of the obligation. Provisions are not recognised for future operating losses.
Where there are a number of similar obligations, the likelihood that an outflow will be required in settlement is
determined by considering the class of obligations as a whole. A provision is recognised even if the likelihood of
an outflow with respect to any one item included in the same class of obligations may be small.
Provisions are measured at the present value of the expected outflow of resources required to settle the
obligation using a pre-tax rate that reflects current market assessments of the time value of money and the risks
specific to the obligation. The increase in the provision due to the passage of time is recognised as a finance cost.
05
MTN Group Limited Integrated Report for the year ended 31 December 2012 Page 165
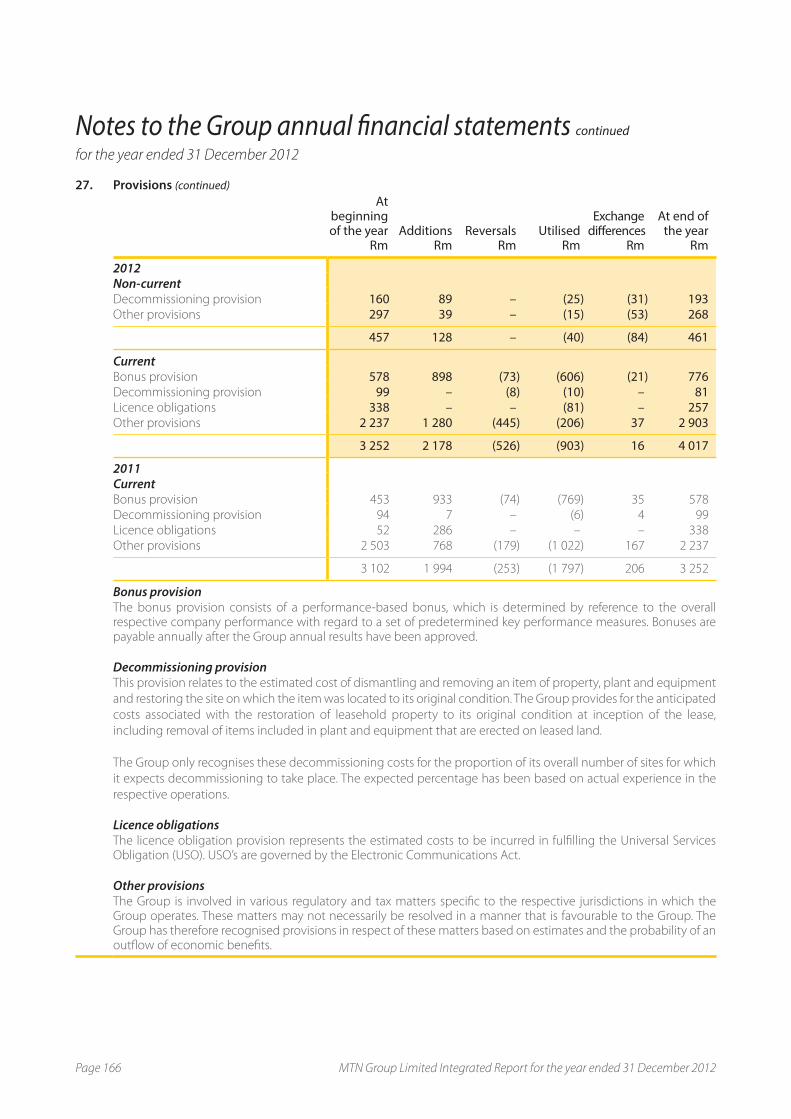
Notes to the Group annual financial statements continued
for the year ended 31 December 2012
27. Provisions (continued)At
beginning of the year
RmAdditions
RmReversals
RmUtilised
Rm
Exchange differences
Rm
At end ofthe year
Rm
2012Non-currentDecommissioning provision 160 89 – (25) (31) 193 Other provisions 297 39 – (15) (53) 268
457 128 – (40) (84) 461
CurrentBonus provision 578 898 (73) (606) (21) 776 Decommissioning provision 99 – (8) (10) – 81 Licence obligations 338 – – (81) – 257Other provisions 2 237 1 280 (445) (206) 37 2 903
3 252 2 178 (526) (903) 16 4 017
2011CurrentBonus provision 453 933 (74) (769) 35 578
Decommissioning provision 94 7 – (6) 4 99
Licence obligations 52 286 – – – 338
Other provisions 2 503 768 (179) (1 022) 167 2 237
3 102 1 994 (253) (1 797) 206 3 252
Bonus provisionThe bonus provision consists of a performance-based bonus, which is determined by reference to the overall respective company performance with regard to a set of predetermined key performance measures. Bonuses are payable annually after the Group annual results have been approved.
Decommissioning provisionThis provision relates to the estimated cost of dismantling and removing an item of property, plant and equipment
and restoring the site on which the item was located to its original condition. The Group provides for the anticipated
costs associated with the restoration of leasehold property to its original condition at inception of the lease,
including removal of items included in plant and equipment that are erected on leased land.
The Group only recognises these decommissioning costs for the proportion of its overall number of sites for which
it expects decommissioning to take place. The expected percentage has been based on actual experience in the
respective operations.
Licence obligationsThe licence obligation provision represents the estimated costs to be incurred in fulfilling the Universal Services Obligation (USO). USO’s are governed by the Electronic Communications Act.
Other provisionsThe Group is involved in various regulatory and tax matters specific to the respective jurisdictions in which the Group operates. These matters may not necessarily be resolved in a manner that is favourable to the Group. The Group has therefore recognised provisions in respect of these matters based on estimates and the probability of an outflow of economic benefits.
Page 166 MTN Group Limited Integrated Report for the year ended 31 December 2012

28. Put option liability
The put option liability is accounted for as a financial liability in accordance with the accounting policy disclosed
in note 43.
2012Rm
2011
Rm
Put option in respect of subsidiary 216 178
The put option in respect of the subsidiary arises from an arrangement whereby certain of the non-controlling
shareholders of MTN Afghanistan Limited have the right to put their shareholding to MTN (Dubai) Limited.
The fair value of the MTN Afghanistan put option, in terms of which the IFC has the right to put 9,1% of their
shareholding to MTN (Dubai) Limited, is determined based on an EBITDA multiple, as determined in accordance
with the terms and conditions of the contractual arrangement. This put option is currently exercisable.
29. Trade and other payables
Trade payables are obligations to pay for goods or services that have been acquired in the ordinary course of
business from suppliers; they are accounted for as financial liabilities in accordance with the accounting policy
disclosed in note 43.
Other payables are stated at their nominal values.
2012Rm
2011
Rm
Trade payables 6 508 7 615
Sundry creditors 1 711 858
Accrued expenses 13 988 12 203
Current portion of deferred gain on asset swap (note 26) 313 299
Other payables 3 395 4 079
25 915 25 054
05
MTN Group Limited Integrated Report for the year ended 31 December 2012 Page 167

Notes to the Group annual financial statements continued
for the year ended 31 December 2012
30. Cash generated from operations
2012Rm
2011
Rm
Profit before tax 36 981 37 640
Adjusted for:
Finance costs (note 7) 10 123 6 610
Finance income (note 7) (5 966) (5 028)
Depreciation of property, plant and equipment (note 11) 14 860 13 296
Amortisation of intangible assets (note 12) 2 386 2 163
Loss/(profit) on disposal of property, plant and equipment (note 6) 58 (6)
Loss on disposal of intangible assets (note 6) 10 29
Share of results of associates after tax (note 13) 180 38
Increase in provisions 1 416 773
Impairment loss on goodwill (note 12) – 31
Impairment loss on property, plant and equipment (note 11) 21 –
Reversal of impairment loss on property, plant and equipment (note 11) (59) (97)
Impairment of trade receivables (note 18) 263 455
Profit on disposal of non-current assets held for sale (note 5) (547) (1 185)
Realisation of deferred gain on Ghana tower sale (note 5) (39) –
Other (12) 393
59 675 55 112
Changes in working capital (1 819) (4 835)
Increase in inventories (77) (1 025)
Increase in trade and other receivables (1 361) (2 586)
Decrease in trade and other payables (451) (2 387)
Increase in unearned income 70 1 163
Cash generated from operations 57 856 50 277
31. Income tax paid
At beginning of the year (8 622) (3 738)
Amounts recognised in profit or loss (note 8) (12 913) (13 853)
Deferred tax charge (note 15) (506) 1 089
Effect of movements in exchange rates 599 (1 634)
Other 468 100
At end of the year 6 671 8 622
Taxation prepaid (556) (415)
Taxation liabilities 7 227 9 037
Total tax paid (14 303) (9 414)
Page 168 MTN Group Limited Integrated Report for the year ended 31 December 2012

32. Underwriting activities
Underwriting results are determined on an annual basis whereby the incurred cost of claims, commission and
related expenses are charged against earned premiums, net of reinsurance, as follows:
� premiums written relate to business incepted during the period and exclude value added tax;
� unearned premiums represent the portion of premiums written during the period that relate to unexpired
terms of policies in force at the reporting date, generally calculated on a time-apportionment basis;
� claims incurred comprise claims and related expenses paid in the period and changes in the provisions for
claims incurred but not reported and related expenses, together with any other adjustments to claims from
prior years. Where applicable, deductions are made for salvage and other recoveries; and
� claims outstanding represent the ultimate cost of settling all claims (including direct and indirect settlement
costs) arising from events that have occurred up to the reporting date, including provision for claims incurred
but not yet reported, less any amounts paid in respect of those claims. Claims outstanding are reduced by
anticipated salvage and other recoveries.
Underwriting activities are conducted through special purpose entities on commercial terms and conditions and at
market prices.
2012Rm
2011
Rm
Income statement effectGross premiums written 661 335
Outwards reinsurance premiums (296) (124)
Other1 (219) (229)
146 (18)
Balance sheet effectShare of technical provision:
Outstanding claims 30 55
Unearned premiums (16) 1
14 56
Receivables 145 99
Payables (214) (174)
1 Includes claims incurred, net of reinsurance, commissions paid, net operating costs, net investment income and taxation.
05
MTN Group Limited Integrated Report for the year ended 31 December 2012 Page 169

Notes to the Group annual financial statements continued
for the year ended 31 December 2012
33. Contingent liabilities
Contingent liabilities represent possible obligations that arise from past events and whose existence will be confirmed only by the occurrence or non-occurrence of uncertain future events not wholly within the control of the Group. Contingent liabilities also represent present obligations that arise from past events but are not recognised because an outflow of resources is not probable or a reliable estimate cannot be made. The Group does not recognise contingent liabilities in the statement of financial position until future events indicate that it is probable that an outflow of resources will take place and a reliable estimate can be made, at which time a provision is raised.
2012Rm
2011
Rm
Contingent liabilities 1 224 838
Incentives for handset upgrades1 751 838
Licence fee and regulatory matters 298 –Litigation and other matters 158 –Other 17 –
1 The Group’s present policy is to pay incentives to Service Providers (SP) for handset upgrades. These upgrades are only payable once the subscribers
have completed a 21-month period with the SP since the initial commencement of their contract or previous upgrade and the eligible subscribers have
exercised their right to receive upgrades for new post-paid contracts with minimum terms. The value of the obligation may vary depending on the
prevailing business rules at the time of the upgrade. The total number of eligible subscribers who had not yet exercised their right to upgrade at
31 December 2012 was 960 325 (2011: 892 328). The Group has, however, provided for those upgrades which have been made but which have not been
presented for payment.
34. Commercial commitments
Irancell Telecommunication Company Services (PJSC)The investment in Irancell is subject to a number of sovereign, regulatory and commercial risks, which could result
in the Group failing to realise full market value of its investment should it be required to dispose of any portion
thereof. In this regard, 21% of Irancell is required to be offered to members of the Iranian public within approximately
three years from the date of the licence. Such offering could have a proportional dilutory effect on the Group’s
49% shareholding, effectively reducing its shareholding by 10,3% to 38,7%. The substantial terms and conditions of
this commitment are yet to be finalised.
Cable systems and gateways
The Group, together with various other parties, has entered into construction and maintenance agreements for the
Eastern Africa Submarine Cable System (EASSy), Europe India Gateway (EIG), West Africa Cable System (WACS) and
The East African Marine System (TEAMS) to address the growing demand for international bandwidth in Africa.
Page 170 MTN Group Limited Integrated Report for the year ended 31 December 2012

34. Commercial commitments (continued)Eastern African Submarine Cable System (EASSy)The Group’s operational and maintenance commitments in respect of the contract amount to US$27,1 million as at
31 December 2012 (2011: US$27,5 million).
Europe India Gateway (EIG)The Group’s commitment in respect of the contract amounts to US$50,4 million (2011: US$50,4 million), which has
been settled in full at 31 December 2012 (2011: US$49,8 million).
The Group’s operational and maintenance commitments in respect of the contract amount to US$33,1 million as at
31 December 2012 (2011: US$35,7 million).
West Africa Cable System (WACS)The Group’s commitment in respect of the contract amounts to US$96,5 million (2011: US$90 million), of which
US$75,8 million has been paid at 31 December 2012 (2011: US$54,5 million).
The Group’s operational and maintenance commitments in respect of the contract amount to US$69,2 million as
at 31 December 2012 (2011: US$67,5 million).
The East African Marine System (TEAMS)The Group’s commitment in respect of the contract amounted to US$4,8 million at 31 December 2011, of which
US$1,9 million had been paid.
The Group’s operational and maintenance commitments in respect of the contract amounted to US$3,1 million as
at 31 December 2011.
In 2012, the Group decided not to invest in the TEAMS cable and entered into a capacity lease agreement. The
amount of US$1,9 million paid up to December 2011 and an additional amount of US$2,9 million paid in 2012, were
recognised as a prepayment.
35. Capital commitments
Commitments for the acquisition of property, plant and equipment and software:
2012Rm
2011
Rm
Capital expenditure not yet incurred at the reporting date is as follows:
– Contracted 13 325 8 626
– Authorised but not contracted 13 832 13 913
Share of capital commitments of joint ventures:
– Contracted 691 691
– Authorised but not contracted 369 1 170
Total commitments for property, plant and equipment and software 28 217 24 400
Capital expenditure will be funded from operating cash flows, existing borrowing facilities and where necessary by
raising additional facilities.
05
MTN Group Limited Integrated Report for the year ended 31 December 2012 Page 171

Notes to the Group annual financial statements continued
for the year ended 31 December 2012
36. Operating lease commitments
Leases, where a significant portion of the risks and rewards of ownership are retained by the lessor, are classified
as operating leases. Rentals payable under operating leases are charged to profit or loss on a straight-line basis
over the term of the relevant lease.
Sub-lease income is recognised in profit or loss on a straight-line basis over the term of the lease.
In all significant operating lease arrangements in place during the year, the Group acted as the lessee.
Sale and leasebackIn sale and leaseback transactions that result in operating leases, where it is clear that the transaction is priced at
fair value, any profit or loss is recognised on the effective date of the sale transaction. If the sale price is below fair
value, any profit or loss is recognised on the effective date of the sale transaction except that, if a loss is
compensated for by future lease payments at below market price, it is deferred and amortised in proportion to
the lease payments over the period during which the asset is expected to be used. If the sale price is above
fair value, the excess over fair value is deferred and amortised over the period for which the asset is expected
to be used.
If the fair value at the time of a sale and leaseback transaction is less than the carrying amount of the asset, a loss
equal to the amount of the difference between the carrying amount and fair value is recognised immediately.
The Group leases various premises and sites under non-cancellable/cancellable operating lease agreements. The
leases have varying terms, escalation clauses and renewal rights. Penalties are chargeable on certain leases should
they be cancelled before the end of the agreement.
2012Rm
2011
Rm
The future aggregate minimum lease payments under non-cancellable operating lease arrangements are as follows: Not later than one year 285 190
Later than one year and no later than five years 359 478
Later than five years 37 –
681 668
The future aggregate minimum lease payments under cancellable operating lease arrangements are as follows: Not later than one year 1 579 1 161
Later than one year and no later than five years 4 667 4 614
Later than five years 8 861 7 599
15 107 13 374
Page 172 MTN Group Limited Integrated Report for the year ended 31 December 2012
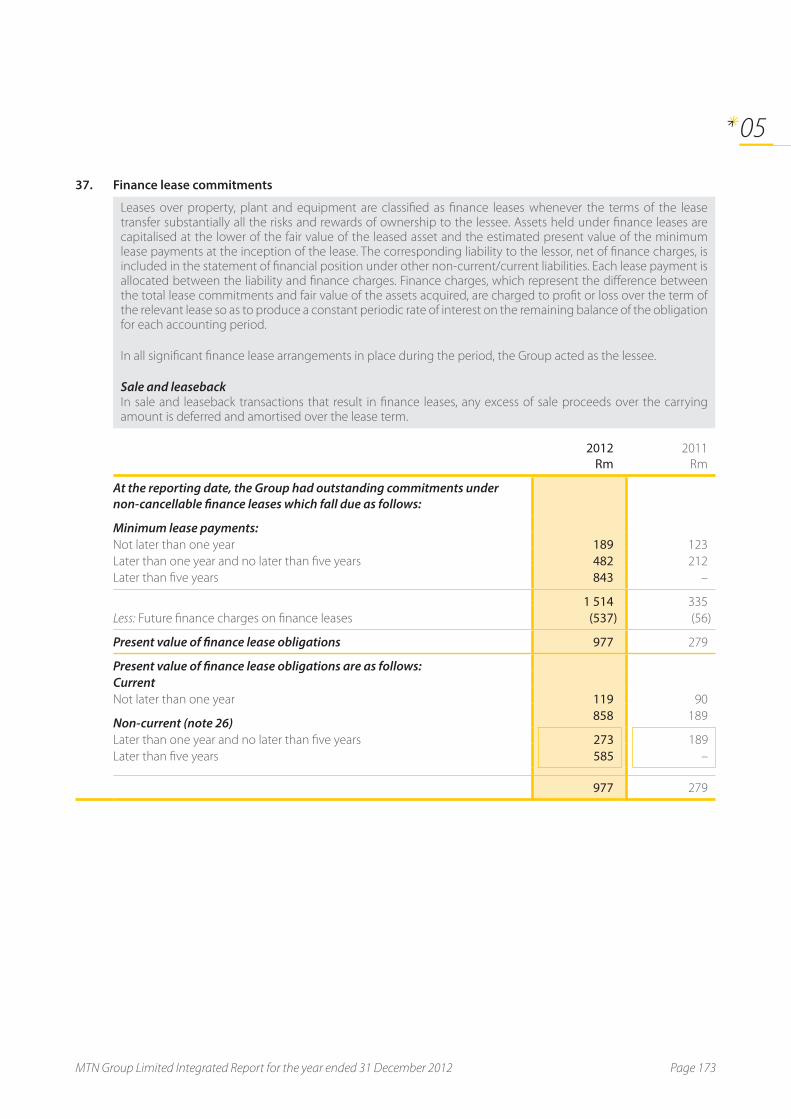
37. Finance lease commitments
Leases over property, plant and equipment are classified as finance leases whenever the terms of the lease transfer substantially all the risks and rewards of ownership to the lessee. Assets held under finance leases are capitalised at the lower of the fair value of the leased asset and the estimated present value of the minimum lease payments at the inception of the lease. The corresponding liability to the lessor, net of finance charges, is included in the statement of financial position under other non-current/current liabilities. Each lease payment is allocated between the liability and finance charges. Finance charges, which represent the difference between the total lease commitments and fair value of the assets acquired, are charged to profit or loss over the term of the relevant lease so as to produce a constant periodic rate of interest on the remaining balance of the obligation for each accounting period.
In all significant finance lease arrangements in place during the period, the Group acted as the lessee.
Sale and leasebackIn sale and leaseback transactions that result in finance leases, any excess of sale proceeds over the carrying amount is deferred and amortised over the lease term.
2012Rm
2011
Rm
At the reporting date, the Group had outstanding commitments under non-cancellable finance leases which fall due as follows:
Minimum lease payments:Not later than one year 189 123
Later than one year and no later than five years 482 212
Later than five years 843 –
1 514 335
Less: Future finance charges on finance leases (537) (56)
Present value of finance lease obligations 977 279
Present value of finance lease obligations are as follows:Current
Not later than one year 119 90
Non-current (note 26) 858 189
Later than one year and no later than five years 273 189
Later than five years 585 –
977 279
05
MTN Group Limited Integrated Report for the year ended 31 December 2012 Page 173

Notes to the Group annual financial statements continued
for the year ended 31 December 2012
38. Investment in joint ventures
A joint venture is a contractual arrangement whereby the Group and other parties undertake an economic
activity which is subject to joint control.
Jointly controlled entitiesJoint venture arrangements which involve the establishment of a separate entity in which each venturer has an
interest, are referred to as jointly controlled entities. The Group reports its interests in jointly controlled entities
using the proportionate consolidation method. The Group’s share of the assets, liabilities, income, expenses and
cash flows of jointly controlled entities are combined with the equivalent items in the Group financial statements
on a line-by-line basis.
Goodwill arising on the acquisition of jointly controlled entities is included in intangible assets.
Where the Group transacts with its jointly controlled entities, unrealised profits or losses are eliminated to the
extent of the Group’s interest in the joint venture, except where unrealised losses provide evidence of an
impairment of the asset transferred.
Accounting policies of joint ventures have been changed where necessary to align them with the policies
adopted by the Group.
The Company accounts for investments in joint ventures at cost, which includes transaction costs, less
accumulated impairment losses.
Jointly controlled assetsJointly controlled assets are joint ventures where the venturers jointly control one or more assets constructed or
acquired for the purpose of its joint venture and dedicated to its purposes. The assets are used to obtain benefits
for the venturers. Each venturer takes a share of the output from the assets and each bears an agreed share of the
expenses incurred.
In respect of its interest in jointly controlled assets the Group recognises in its financial statements its share of the
jointly controlled assets, classified according to the nature of the assets, any liabilities that it has incurred, its share
of any liabilities incurred jointly with the other venturers in relation to the joint venture, any income from the sale
or use of its share of the output of the joint venture, together with its share of any expenses incurred by the joint
venture and any expenses that it has incurred in respect of its interest in the joint venture.
Page 174 MTN Group Limited Integrated Report for the year ended 31 December 2012

38. Investment in joint ventures (continued)The Group’s effective percentage interests in its joint ventures are disclosed below.
Unless otherwise mentioned, the Group’s joint ventures’ countries of incorporation are also their principal place of operation.
Country of
Effective % interest in issued ordinary share capital
Joint venture Principal activity incorporation 2012 2011
Swazi MTN Limited Network operator Swaziland 30 30
Oltio Proprietary Limited (MTN Mobile Money Holdings Proprietary Limited)
Wireless banking services South Africa 50 50
Deci Investments Investment holding company Botswana 33 33
Mascom Wireless Botswana Proprietary Limited Network operator Botswana 53 53
Irancell Telecommunication Company Services (PJSC) Network operator Iran 49 49
Satellite Data Networks Mauritius Proprietary Limited
Internet service provider Mauritius 60 60
Summary of financial informationThe following table presents, on a condensed basis, the Group’s share of assets and liabilities, revenue and expenses of the joint ventures which are included in the consolidated statement of financial position and income statement.
2012Rm
2011Rm
Revenue 13 247 12 019
Expenses (7 318) (6 859)
Total assets 9 302 12 176
Total liabilities (7 761) (9 382)
There are no significant contingent liabilities relating to the Group’s interests in these joint ventures at the end of the current or prior year.
Refer to note 1.4 for the impact of the adoption of IFRS 11 which will change the subsequent accounting of the Group’s investment in its joint ventures, which are currently accounted for using the proportionate consolidation method under IAS 31 Interests in Joint Ventures. Under IFRS 11, the Group’s joint ventures will subsequently be accounted for using the equity method.
Jointly controlled assetsThe Group’s jointly controlled assets are high capacity fibre optic submarine cable systems, which have been recorded in property, plant and equipment.
The following table presents, on a condensed basis, the Group's share of assets and liabilities, revenue and expenses of the jointly controlled assets which are included in the consolidated statement of financial position and income statement.
2012Rm
2011Rm
Revenue 98 167
Expenses (139) (203)
Total assets 1 439 1 237
Total liabilities (220) (213)
05
MTN Group Limited Integrated Report for the year ended 31 December 2012 Page 175

Notes to the Group annual financial statements continued
for the year ended 31 December 2012
39. Exchange rates to South African rand used for the purposes of foreign currency translations
Closing rates Average rates2012 2011 2012 2011
United States dollar US$ 0,12 0,12 0,12 0,14
Uganda shilling UGX 312,26 306,73 303,08 347,60
Rwanda franc RWF 73,99 74,76 74,46 81,97
Cameroon Communaute Financière Africaine
franc XAF 58,70 62,73 62,20 65,67
Nigerian naira NGN 18,47 20,10 19,50 21,76
Iranian rial IRR 2 905,20 1 378,10 1 685,67 1 474,34
Botswana pula BWP 0,92 0,93 0,93 0,95
Côte d'Ivoire Communaute Financière
Africaine franc CFA 58,70 62,73 62,31 64,81
Congo-Brazzaville Communaute Financière
Africaine franc XAF 58,70 62,73 62,20 66,09
Zambian kwacha ZMK 610,66 633,91 631,93 665,22
Swaziland lilangeni E 1,00 1,00 1,00 1,00
Lebanese pound LBP 177,18 186,14 183,55 203,88
Afghanistan afghani AFN 6,16 6,11 6,23 6,24
Euro EUR 0,09 0,10 0,10 0,10
Ghanaian cedi GHS 0,22 0,20 0,23 0,21
Benin Communaute Financière Africaine
franc XOF 58,70 62,73 62,28 63,67
Guinean franc GNF 810,04 869,14 841,45 956,91
Sudanese pound SDG 0,52 0,33 0,43 0,36
Syrian pound SYP 10,22 6,71 8,34 6,54
Guinea-Bissau Communaute Financière
Africaine franc XOF 58,70 62,73 62,12 63,10
Yemen rial YER 25,39 27,02 26,35 30,73
Page 176 MTN Group Limited Integrated Report for the year ended 31 December 2012

40. Events after the reporting period
Potential litigation by Turkcell Iletism Hizmetlera AS (Turkcell)In 2012, Turkcell, the largest mobile phone operator in Turkey, brought a legal claim against MTN Group Limited and
MTN International (Mauritius) Limited before a United States (US) court, which is based on allegations that the
Group violated certain US laws in its effort to obtain Iran’s second GSM licence.
The MTN Group board established a special committee (Hoffmann Committee) consisting of an external chairman
and non-executive directors to take all actions the committee deemed appropriate to investigate the Turkcell
allegations. To ensure the integrity and independence of the investigation, the MTN Group board appointed Lord
Leonard Hoffmann, an internationally renowned jurist and former UK House of Lords judge, as the chairman.
On 1 February 2013, following a critical examination of the evidence, the Hoffmann Committee found that Turkcell’s
allegations are “a fabric of lies, distortions and inventions”.
The MTN Group board is satisfied that Turkcell’s allegations have been the subject of a thorough, comprehensive
and independent investigation and is satisfied with the findings presented to it.
In addition, the Group has noted a US federal court ruling to put on hold the lawsuit by Turkcell pending a US
Supreme Court ruling whether the case can be heard in a US court. The Group had asked Judge Walton of the
Washington District Court to either dismiss the Turkcell case outright, or wait until after the Supreme Court renders
its decision on what has become known as the Kiobel case.
Using the Kiobel case, the judge will then decide whether Turkcell’s case against the Group can be heard in a US
court when neither is a US company, and the alleged conduct happened on foreign territory. Legal experts predict
the Supreme Court will use the Kiobel case to restrict such cases. The Group continues to believe that there is no
legal merit to Turkcell’s claim and no basis for such claim to be brought before a US court. The Group expects the
Turkcell claim to be disposed of after the Supreme Court issues its decision in the Kiobel case. That is expected to
happen by the end of June 2013.
The Group will accordingly continue to oppose the claim.
Mobile Telephone Networks Cameroon Limited and MTN Côte d’Ivoire S.A. tower sale transactionsFormal notice regarding the close of the Mobile Telephone Networks Cameroon Limited and MTN Côte d’Ivoire S.A.
tower sale transactions has been issued. The MTN Cameroon Limited transaction closed on 28 February 2013.
An advance payment of R158 million was received in October 2012.
Acquisition of additional interest in MTN Cyprus LimitedThe Group has agreed to acquire the remaining 50% equity interest in MTN Cyprus Limited from its local partner,
Amaracos Holdings for an amount of approximately EUR73 million, including the acquisition of a shareholder’s loan
to the amount of EUR15 million. The purchase price in respect of the shares to the amount of EUR58 million will bear
interest at a rate of EURIBOR plus three percent per annum from 1 April 2013 if the transaction closes after that date.
The transaction will increase the Group’s ownership interest to 100%.
The acquisition is subject to approval by the Commission for Protection of Competition of the Republic of Cyprus.
05
MTN Group Limited Integrated Report for the year ended 31 December 2012 Page 177

Notes to the Group annual financial statements continued
for the year ended 31 December 2012
41. Related party transactions
Related party transactions constitute the transfer of resources, services or obligations between the Group and a
party related to the Group, regardless of whether a price is charged. For the purposes of defining related party
transactions with key management, key management has been defined as directors and prescribed officers of
the Group and includes close members of their families and entities controlled or jointly controlled by these
individuals.
2012Rm
2011
Rm
Key management compensationSalaries and other short-term employee benefits 66 58
Post-employment benefits 5 6
Other benefits 37 53
Bonuses 57 70
Termination benefits – 33
Total 165 220
Details of the directors’ remuneration are disclosed in note 6 as well as in the remuneration report on pages 87
to 95 of the integrated report.
Loan to shareholderPreviously, certain legal claims were made against MTN (Dubai) Limited and Scancom Limited (Ghana) by two
previous MTN Ghana shareholders; claiming beneficial title to a portion of the shares in MTN Ghana. As a result of
this, an agreement was reached between M1 Limited (M1) and MTN (Dubai) Limited that they will share the cost of
settlement of these claims. During 2009 a loan was granted to M1 in respect of their share of these costs which was
paid by the Group on their behalf.
This loan has fixed repayments and is interest free. The balance of this loan as at year-end is as follows:
2012Rm
2011
Rm
Balance at beginning of the year 53 89 Payments received for the year (58) (46)Effect of movement in exchange rates 5 10
Balance at end of the year – 53
Subsidiaries and joint venturesDetails of investments in subsidiaries and joint ventures are disclosed in Annexure 1 of the annual financial
statements.
For details on the put option refer to note 28.
Outstanding loans with Irancell Telecommunication Company Services (PJSC) are disclosed in note 14.
Page 178 MTN Group Limited Integrated Report for the year ended 31 December 2012

41. Related party transactions (continued) Details of transactions and balances with joint ventures:
Net income for the year
Balance receivable
2012Rm
2011
Rm
2012Rm
2011
Rm
Swazi MTN Limited 42 61 25 34
Mascom Wireless Botswana Proprietary
Limited 83 235 2 5
Irancell Telecommunication Company
Services (PJSC) 79 31 2 356 95
Satellite Data Networks Mauritius
Proprietary Limited 1 1 3 1
AssociatesDetails of investments in associates are disclosed in note 13.
Details of transactions and balances with associates:
Net income for the year
Balance receivable
2012Rm
2011
Rm
2012Rm
2011
Rm
Belgacom International Carrier Services SA 245 145 3 26
Ghana Tower InterCo BV 97 – 1 230 –
Uganda Tower InterCo BV 17 – 534 –
In 2011, Scancom Limited (Ghana) entered into an operating lease agreement with Ghana Tower InterCo BV. The
operating lease commitment amounts to R8 200 million at 31 December 2012 (2011: R7 906 million). The rental
amount escalates every year by inflation and the initial term is 10 years, followed by four times five-year automatic
renewals.
MTN Uganda entered into an operating lease agreement with Uganda Tower InterCo BV in 2012. The operating
lease commitment amounts to R1 739 million at 31 December 2012 (2011: Rnil). The rental amount escalates every
year by inflation and the initial term is 10 years, followed by four times five-year automatic renewals.
ShareholdersThe principal shareholders of the Company are disclosed on page 211 of the integrated report.
DirectorsCyril Ramaphosa, the chairman of the Company, has an effective shareholding of 29,63% in Shanduka which
acquired a non-controlling interest in MTN Nigeria Communications Limited, a subsidiary of the Group, for
US$335 million in November 2012.
05
MTN Group Limited Integrated Report for the year ended 31 December 2012 Page 179

Notes to the Group annual financial statements continued
for the year ended 31 December 2012
42. Changes in shareholding
Changes in shareholding of subsidiaries are transactions that result in increases or reductions in the interest held
in a subsidiary of the Group and are accounted for as transactions with non-controlling shareholders as disclosed
in note 1.3.1.
None of the transactions outlined below resulted in a change in control.
42.1 Current year changes in shareholding42.1.1 MTN Côte d’Ivoire S.A.
During the year, the Group increased its shareholding in MTN Cote d’Ivoire S.A. by 3% to 67,7% for R177 million.
The impact on equity arising from the acquisition is as follows:Carrying amount
on acquisition date Rm
Purchase consideration (177)Net asset value acquired 55
Difference included in equity on consolidation (122)
42.2 Prior year changes in shareholding42.2.1 MTN Nigeria Communications Limited
During 2011, the Group sold 0,25% of the shareholding in MTN Nigeria Communications Limited to a minority shareholder of the Company for an amount of R228 million.
The impact on equity arising from the disposal was as follows: Carrying amount
on disposal date Rm
Consideration received 228 Net assets disposed of (30)
Difference included in equity on consolidation 198
42.2.2 MTN Rwandacell S.A.R.L.During 2011, the Group increased its shareholding in MTN Rwandacell S.A.R.L. from 55% to 80% for R487 million.
The impact on equity arising from the acquisition was as follows: Carrying amount
on acquisition date Rm
Purchase consideration (487)Net asset value acquired 254
Difference included in equity on consolidation (233)
42.2.3 MTN Zambia LimitedDuring 2011, the Group sold 4% of its shareholding in MTN Zambia for an amount of R50 million. The sale was partly funded through a loan provided by MTN (Dubai) Limited to the value of R45 million to the acquirer and partly from the acquirer’s own financial resources (R5 million).
Due to the risks and rewards not being transferred at a Group level, the percentage consolidated (98,7%) remains unchanged.
The impact on equity arising from the disposal was as follows: Carrying amount
on disposal date Rm
Consideration received 5 Net assets disposed of –
Difference included in equity on consolidation 5
Page 180 MTN Group Limited Integrated Report for the year ended 31 December 2012

42. Changes in shareholding (continued)42.3 Net cash flows relating to business combinations and changes in shareholdings
2012Rm
2011
Rm
Consideration for acquisition from non-controlling interests
– MTN Côte d’Ivoire S.A. (177) –
– MTN Rwandacell S.A.R.L. – (487)
Proceeds from the issue of shares to non-controlling interests
– MTN Nigeria Communications Limited – 228
– MTN Zambia Limited – 5
(177) (254)
43. Financial risk management and financial instruments
Accounting for financial instrumentsFinancial assets and liabilities are recognised in the Group’s statement of financial position when the Group becomes a party to the contractual provisions of the instruments.
All financial assets and liabilities are initially measured at fair value, including transaction costs, except for those classified as at fair value through profit or loss which are initially measured at fair value excluding transaction costs. Transaction costs directly attributable to the acquisition of financial assets or financial liabilities at fair value through profit or loss are recognised immediately in profit or loss. Financial assets are recognised (derecognised) on the date the Group commits to purchase (sell) the instruments (trade date accounting).
Financial assets and liabilities are classified as current if expected to be realised or settled within 12 months; if not, they are classified as non-current.
Offsetting financial instrumentsOffsetting of financial assets and liabilities is applied when there is a legally enforceable right to offset the recognised amounts and there is an intention to settle on a net basis, or realise the asset and settle the liability simultaneously. The net amount is reported in the statement of financial position.
Financial instrument classificationThe Group classifies its financial instruments into the following categories:�� financial assets at fair value through profit or loss;�� loans and receivables;�� held-to-maturity investments;�� financial liabilities at fair value through profit or loss; and�� financial liabilities at amortised cost.
The classification is dependent on the purpose for which the financial instruments were acquired. Management determines the classification of financial instruments at initial recognition.
Financial instruments comprise investments, loans receivable, trade and other receivables, restricted cash, cash and cash equivalents, borrowings, other non-current liabilities, put option liabilities, bank overdrafts, derivatives and trade and other payables.
Subsequent measurementSubsequent to initial recognition, financial instruments are measured as described below and on the following page.
Financial assets at fair value through profit or lossAn instrument is classified at fair value through profit or loss if it is held for trading, i.e. acquired principally for the purpose of selling the item in the short term. Financial instruments at fair value through profit or loss are subsequently measured at fair value and changes therein are recognised in profit or loss. Derivatives are also categorised as held for trading unless they are designated as hedging instruments.
05
MTN Group Limited Integrated Report for the year ended 31 December 2012 Page 181

Notes to the Group annual financial statements continued
for the year ended 31 December 2012
43. Financial risk management and financial instruments (continued)
Subsequent measurement (continued)Loans and receivablesLoans and receivables are non-derivative financial assets with fixed or determinable payments that are not quoted in an active market. The Group’s loans and receivables comprise loans and other non-current receivables, certain of its investments, trade and other receivables (excluding prepayments), restricted cash and cash and cash equivalents. Loans and receivables are subsequently measured at amortised cost using the effective interest method, less any impairment losses.
Interest income is recognised by applying the effective interest rate, except for short-term receivables when the recognition of interest would be immaterial.
Held-to-maturity investmentsHeld-to-maturity investments are non-derivative financial assets with fixed or determinable payments and fixed maturity that the Group has the positive intention and ability to hold to maturity other than those that the Group upon initial recognition designates as at fair value through profit or loss and those that are loans and receivables.
Held-to-maturity investments are subsequently measured at amortised cost using the effective interest method, less any impairment losses.
Financial liabilitiesFinancial liabilities comprise trade and other payables, a put option liability, bank overdrafts, borrowings, derivative liabilities and other non-current liabilities (excluding provisions).
All financial liabilities, excluding derivative liabilities, are subsequently measured at amortised cost using the effective interest method.
Derivative liabilities are subsequently measured at fair value and changes therein are recognised in profit or loss.
DerecognitionFinancial assets are derecognised when the rights to receive cash flows from the assets have expired or have been transferred and the Group has transferred substantially all risks and rewards of ownership.
Financial liabilities are derecognised when the obligations specified in the contracts are discharged, cancelled or expires.
ImpairmentThe Group assesses at the end of each reporting date whether there is any objective evidence that a financial asset is impaired. A financial asset or group of financial assets is impaired if objective evidence indicates that one or more events have had a negative effect on the estimated future cash flows of that asset.
An impairment loss in respect of a financial asset measured at amortised cost is calculated as the difference between its carrying amount and the present value of the estimated future cash flows discounted at the original effective interest rate.
When a loan or receivable is impaired, the Group reduces the carrying amount to its recoverable amount, being the estimated future cash flows discounted at the original effective interest rate of the instrument, and continues unwinding the discount as interest income. Interest income on impaired loans and receivables is recognised using the effective interest rate.
Individually significant financial assets are tested for impairment on an individual basis. The remaining financial assets are assessed collectively in groups that share similar credit risk characteristics.
All impairment losses are recognised in profit or loss.
An impairment loss is reversed if the reversal can be related objectively to an event occurring after the impairment loss was recognised.
Impairment of trade receivablesAn impairment of trade receivables is established when there is objective evidence that the Group will not be able to collect all amounts due according to the original terms of the receivables. Significant financial difficulties of the debtor, probability that the debtor will enter bankruptcy or financial reorganisation and default or delinquency in payments are considered indicators that the trade receivable is impaired.
The carrying amount of the trade receivable is reduced through the use of an allowance account and the amount of the loss is recognised in profit or loss. When a trade receivable is uncollectible, it is written off against the allowance account for trade receivables. Subsequent recoveries of amounts previously written off are credited to profit or loss.
Page 182 MTN Group Limited Integrated Report for the year ended 31 December 2012

43. Financial risk management and financial instruments (continued)Risk managementIntroductionThe Group has exposure to the following risks from its use of financial instruments: credit risk, liquidity risk and market risk (foreign exchange and interest rate risk). This note presents information about the Group’s exposure to each of the above risks, the Group’s objectives, policies and processes for measuring and managing risk, and the Group’s management of capital. Further quantitative disclosures are included throughout these consolidated annual financial statements.
Risk profileThe Group’s overall risk management programme focuses on the unpredictability of financial markets and seeks to
minimise potential adverse effects on the financial performance of the Group. The Group uses derivative financial
instruments, such as forward exchange contracts and interest rate swaps, to hedge certain exposures, but as a
matter of principle, the Group does not enter into derivative contracts for speculative purposes.
Risk management is carried out under policies approved by the board of directors of the Group and of relevant subsidiaries. The MTN Group executive committee identifies, evaluates and hedges financial risks in co-operation with the Group’s operating units. The board provides written principles for overall risk management, as well as for specific areas such as foreign exchange risk, interest rate risk, credit risk, use of derivative financial instruments, and investing excess liquidity.
43.1 Categories of financial instrumentsAssets Liabilities
Loans and receivables
Rm
Fair value through profit or
loss1
Rm
Held-to-maturity
Rm
Amortised costRm
Fair value through profit or
loss1
Rm
Total carrying amount2
Rm
2012Non-current financial assetsLoans and other non-current receivables 3 823 – – – – 3 823Current financial assetsTrade and other receivables 13 952 – – – – 13 952Current investments 5 343 – 1 731 – – 7 074 Derivative assets – 191 – – – 191 Restricted cash 5 277 – – – – 5 277 Cash and cash equivalents 25 700 – – – – 25 700
54 095 191 1 731 – – 56 017
Non-current financial liabilitiesBorrowings – – – 21 742 – 21 742 Other non-current liabilities – – – 1 044 – 1 044 Derivative liabilities – – – – 2 2 Current financial liabilitiesTrade and other payables – – – 24 520 – 24 520Borrowings – – – 10 621 – 10 621 Derivative liabilities – – – – 14 14 Put option liability – – – 216 – 216 Bank overdrafts – – – 169 – 169
– – – 58 312 16 58 328
1 All financial instruments at fair value through profit or loss are held for trading.
2 The carrying amounts of all financial instruments not measured at fair value closely approximate fair value.
05
MTN Group Limited Integrated Report for the year ended 31 December 2012 Page 183

Notes to the Group annual financial statements continued
for the year ended 31 December 2012
43. Financial risk management and financial instruments (continued)43.1 Categories of financial instruments (continued)
Assets Liabilities
Loans and
receivables
Rm
Fair value
through
profit or
loss1
Rm
Held-to-
maturity
Rm
Amortised
cost
Rm
Fair value
through
profit or
loss1
Rm
Total
carrying
amount2
Rm
2011Non-current financial assetsLoans and other non-current
receivables 1 596 – – – – 1 596
Current financial assetsTrade and other receivables 15 321 – – – – 15 321
Current investments 1 677 – 7 803 – – 9 480
Derivative assets – 9 – – – 9
Restricted cash 546 – – – – 546
Cash and cash equivalents 35 806 – – – – 35 806
54 946 9 7 803 – – 62 758
Non-current financial liabilitiesBorrowings – – – 23 554 – 23 554
Other non-current liabilities – – – 439 – 439
Current financial liabilitiesTrade and other payables – – – 24 755 – 24 755
Borrowings – – – 9 869 – 9 869
Derivative liabilities – – – – 4 4
Put option liability – – – 178 – 178
Bank overdrafts – – – 593 – 593
– – – 59 388 4 59 392
1 All financial instruments at fair value through profit or loss are held for trading. 2 The carrying amounts of all financial instruments not measured at fair value closely approximate fair value.
Page 184 MTN Group Limited Integrated Report for the year ended 31 December 2012
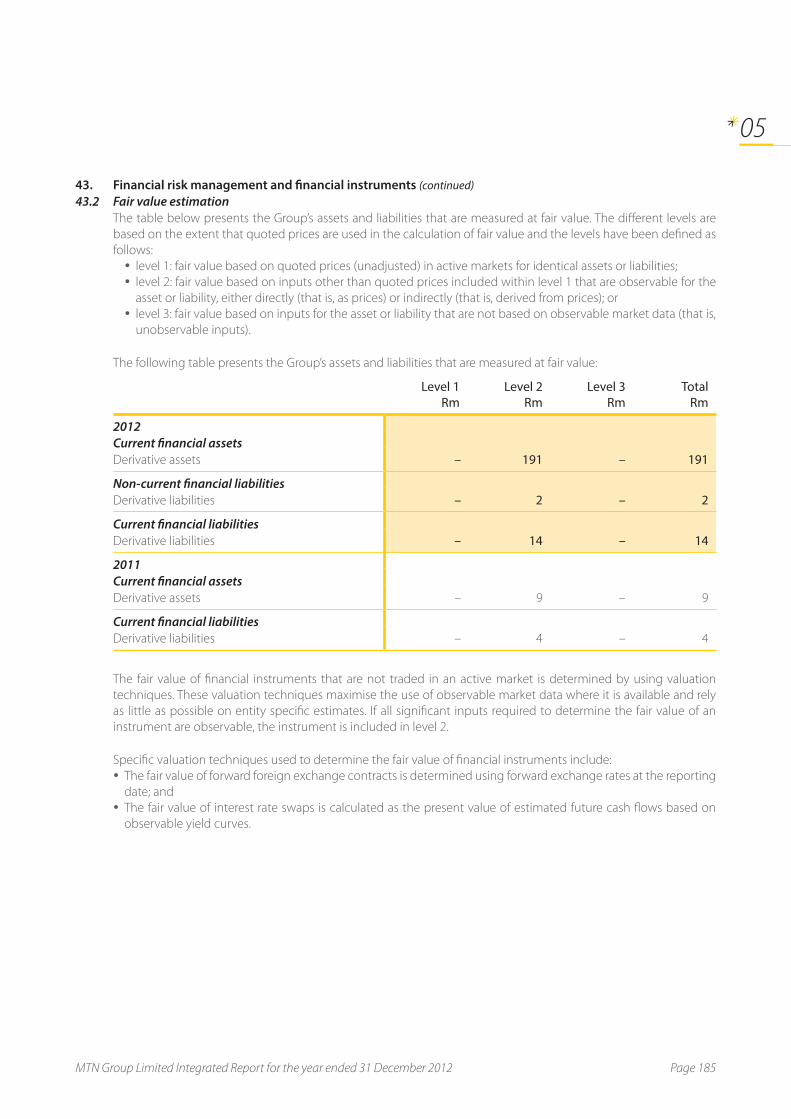
43. Financial risk management and financial instruments (continued) 43.2 Fair value estimation
The table below presents the Group’s assets and liabilities that are measured at fair value. The different levels are
based on the extent that quoted prices are used in the calculation of fair value and the levels have been defined as
follows:
�� level 1: fair value based on quoted prices (unadjusted) in active markets for identical assets or liabilities;
�� level 2: fair value based on inputs other than quoted prices included within level 1 that are observable for the
asset or liability, either directly (that is, as prices) or indirectly (that is, derived from prices); or
�� level 3: fair value based on inputs for the asset or liability that are not based on observable market data (that is,
unobservable inputs).
The following table presents the Group’s assets and liabilities that are measured at fair value:
Level 1Rm
Level 2Rm
Level 3Rm
Total Rm
2012Current financial assetsDerivative assets – 191 – 191
Non-current financial liabilitiesDerivative liabilities – 2 – 2
Current financial liabilitiesDerivative liabilities – 14 – 14
2011Current financial assetsDerivative assets – 9 – 9
Current financial liabilitiesDerivative liabilities – 4 – 4
The fair value of financial instruments that are not traded in an active market is determined by using valuation
techniques. These valuation techniques maximise the use of observable market data where it is available and rely
as little as possible on entity specific estimates. If all significant inputs required to determine the fair value of an
instrument are observable, the instrument is included in level 2.
Specific valuation techniques used to determine the fair value of financial instruments include:
�� The fair value of forward foreign exchange contracts is determined using forward exchange rates at the reporting
date; and
�� The fair value of interest rate swaps is calculated as the present value of estimated future cash flows based on
observable yield curves.
05
MTN Group Limited Integrated Report for the year ended 31 December 2012 Page 185

Notes to the Group annual financial statements continued
for the year ended 31 December 2012
43. Financial risk management and financial instruments (continued)43.3 Credit risk
Credit risk, or the risk of financial loss to the Group due to customers or counterparties not meeting their contractual
obligations, is managed through the application of credit approvals, limits and monitoring procedures.
The Group’s maximum exposure to credit risk is represented by the carrying amount of the financial assets that are
exposed to credit risk.
The Group considers its maximum exposure per class, without taking into account any collateral and financial
guarantees, to be as follows:
2012Rm
2011
Rm
Loans and other non-current receivables 3 823 1 596
Trade and other receivables 13 952 15 321
Current investments 7 074 9 480
Derivative assets 191 9
Restricted cash 5 277 546
Cash and cash equivalents 25 700 35 806
56 017 62 758
Cash and cash equivalents and current investmentsThe Group’s exposure and the credit ratings of its counterparties are continuously monitored and the aggregate
values of transactions concluded is spread among approved financial institutions. The Group actively seeks to limit
the amount of credit exposure to any one financial institution and credit exposure is controlled by counterparty
limits that are reviewed and approved by the credit risk department.
The operations in Nigeria, Dubai and South Africa (including head office entities) hold their cash balances in financial
institutions with a rating range from BBB– to AA.
Given these credit ratings, management does not expect any counterparty to fail to meet its obligations.
Page 186 MTN Group Limited Integrated Report for the year ended 31 December 2012

43. Financial risk management and financial instruments (continued)43.3 Credit risk (continued)
Trade receivablesThe Group has no significant concentrations of credit risk, due to its wide spread of customers across various
operations and dispersion across geographical locations. The Group has policies in place to ensure that retail sales
of products and services are made to customers with an appropriate credit history.
The recoverability of interconnect receivables in certain international operations is uncertain; however, this is
actively managed within acceptable limits and has been incorporated in the assessment of an appropriate revenue
recognition policy (note 4) and the impairment of trade receivables where applicable. In addition, in certain
countries there exists a right of set-off with interconnect parties to assist in settling outstanding amounts.
Ageing and impairment analysis
2012 2011
GrossRm
ImpairedRm
NetRm
Gross
Rm
Impaired
Rm
Net
Rm
Fully performing trade receivables 9 832 – 9 832 8 892 – 8 892
Interconnect receivables 2 440 – 2 440 2 499 – 2 499
Contract receivables 6 182 – 6 182 5 273 – 5 273
Other receivables 1 210 – 1 210 1 120 – 1 120
Past due trade receivables 5 128 (2 098) 3 030 5 267 (1 900) 3 367
Interconnect receivables 2 090 (889) 1 201 2 811 (788) 2 023
0 to 3 months 607 (126) 481 756 (65) 691
3 to 6 months 339 (45) 294 447 (60) 387
6 to 9 months 296 (45) 251 365 (74) 291
9 to 12 months 848 (673) 175 1 243 (589) 654
Contract receivables 1 531 (1 046) 485 1 982 (1 084) 898
0 to 3 months 245 (97) 148 488 (111) 377
3 to 6 months 152 (32) 120 385 (151) 234
6 to 9 months 526 (392) 134 416 (203) 213
9 to 12 months 608 (525) 83 693 (619) 74
Other receivables 1 507 (163) 1 344 474 (28) 446
0 to 3 months 1 093 (6) 1 087 302 (28) 274
3 to 6 months 150 (46) 104 75 – 75
6 to 9 months 92 (11) 81 20 – 20
9 to 12 months 172 (100) 72 77 – 77
Total 14 960 (2 098) 12 862 14 159 (1 900) 12 259
05
MTN Group Limited Integrated Report for the year ended 31 December 2012 Page 187

Notes to the Group annual financial statements continued
for the year ended 31 December 2012
43. Financial risk management and financial instruments (continued)43.3 Credit risk (continued)
Trade receivables (continued)Total past due per significant operation
Inter-connect
receivablesRm
Contractreceivables
Rm
Other receivables
RmTotal
Rm
2012MTN RSA 29 533 68 630 MTN Nigeria Communications Limited 416 252 26 694 Irancell Telecommunication Company Services (PJSC) 929 24 35 988Other operations 716 722 1 378 2 816
2 090 1 531 1 507 5 128
2011MTN RSA 147 733 – 880
MTN Nigeria Communications Limited 376 21 51 448
Irancell Telecommunication Company Services (PJSC) 1 207 51 45 1 303
Other operations 1 081 1 177 378 2 636
2 811 1 982 474 5 267
Provision for impairment of trade receivables
At beginning
of the yearRm
Additions1
RmReversals1
RmUtilised
Rm
Exchangedifferences
and othermovements
Rm
At end of the year
Rm
2012Movement in provision for
impairment of trade
receivables (1 900) (346) 83 26 39 (2 098)
2011Movement in provision for
impairment of trade
receivables (1 571) (500) 45 316 (190) (1 900)
1 A net impairment loss of R263 million (2011: R455 million) was incurred in the current year. This amount is included in other operating expenses in profit
or loss (note 6).
The Group does not hold any collateral for trade receivables.
Page 188 MTN Group Limited Integrated Report for the year ended 31 December 2012

43. Financial risk management and financial instruments (continued)43.4 Liquidity risk
Liquidity risk is the risk that an entity in the Group will be unable to meet its obligations as they become due.
The Group’s approach to managing liquidity risk is to ensure that sufficient liquidity is available to meet its liabilities
when due under both normal and stressed conditions, without incurring unacceptable losses or risking damage to
the Group’s reputation.
The Group ensures it has sufficient cash on demand (currently the Group is maintaining a positive cash position) or
access to facilities to meet expected operational expenses, including the servicing of financial obligations; this
excludes the potential impact of extreme circumstances that cannot reasonably be predicted, such as natural
disasters.
The following liquid resources are available:
2012Rm
2011
Rm
Trade and other receivables 13 952 15 321
Current investments 5 343 1 677
Derivative assets 191 –
Cash and cash equivalents, net of overdrafts 25 531 35 213
45 017 52 211
The Group’s undrawn borrowing facilities are disclosed in note 25.
The following are the contractual cash flows of financial liabilities:
Carrying amount
RmTotal
Rm
More than one year
but not exceeding two years
Rm
More than two years
but not exceeding
five years Rm
More than five years
Rm
Non-current financial liabilities2012Borrowings 21 742 26 302 11 308 14 713 281 Other non-current liabilities 1 044 1 517 295 379 843Derivative liabilities 2 2 2 – –
22 788 27 821 11 605 15 092 1 124
2011Borrowings 23 554 28 319 8 492 17 249 2 578
Other non-current liabilities 439 461 213 248 –
23 993 28 780 8 705 17 497 2 578
05
MTN Group Limited Integrated Report for the year ended 31 December 2012 Page 189

Notes to the Group annual financial statements continued
for the year ended 31 December 2012
43. Financial risk management and financial instruments (continued)43.4 Liquidity risk (continued)
Carrying amount
RmTotal
Rm
Payable within one month or
on demandRm
More than one month
but not exceeding
three monthsRm
More than three months
but not exceeding
one yearRm
Current financial liabilities2012Trade and other payables 24 520 24 760 13 180 4 755 6 825Borrowings 10 621 11 363 5 559 97 5 707 Derivative liabilities 14 14 9 5 – Put option liability 216 216 216 – – Bank overdrafts 169 169 164 5 –
35 540 36 522 19 128 4 862 12 532
2011Trade and other payables 24 755 24 823 9 090 9 608 6 125
Borrowings 9 869 11 782 3 829 2 972 4 981
Put option liability 178 178 178 – –
Bank overdrafts 593 593 593 – –
35 395 37 376 13 690 12 580 11 106
43.5 Market riskMarket risk is the risk that changes in market prices (interest rate and currency risk) will affect the Group’s income or
the value of its holding of financial instruments. The objective of market risk management is to manage and control
market risk exposures within acceptable parameters, while optimising the return.
43.5.1 Interest rate riskInterest rate risk is the risk borne by an interest-bearing asset or liability, due to variability of interest rates.
Financial assets and liabilities that are sensitive to interest rate risk are cash and cash equivalents, restricted cash,
current investments, trade and other receivables/payables, loans receivable/payable and bank overdrafts. The interest
rates applicable to these financial instruments are a combination of floating and fixed rates in line with those currently
available in the market.
The Group’s interest rate risk arises from the repricing of the Group’s forward cover and floating rate debt, incremental
funding or new borrowings, the refinancing of existing borrowings and the magnitude of the significant cash
balances which exist.
Debt in the South African entities and all holding companies (including MTN (Dubai) Limited and MTN International
(Mauritius) Limited) is managed on an optimal fixed versus floating interest rate basis, in line with the approved Group
Treasury Policy. Significant cash balances are also considered in the fixed versus floating interest rate exposure mix.
Debt in the majority of the Group’s non-South African operations is at floating interest rates. This is due to the
underdeveloped and expensive nature of derivative products in these financial markets. The Group continues to
monitor developments which may create opportunities as these markets evolve in order to align each underlying
operation with the Group Treasury Policy.
The Group makes use of various products including interest rate derivatives and other appropriate hedging tools as
a way to manage these risks; however, derivative instruments may only be used to hedge existing exposures.
Page 190 MTN Group Limited Integrated Report for the year ended 31 December 2012

43. Financial risk management and financial instruments (continued)43.5 Market risk (continued)43.5.1 Interest rate risk (continued)
ProfileAt the reporting date the interest rate profile of the Group’s interest-bearing financial instruments was:
2012 2011
Fixed rate instruments
Rm
Variable rate instruments
Rm
Fixed rate
instruments
Rm
Variable rate
instruments
Rm
Non-current financial assetsLoans and other non-current receivables 1 683 1 861 – 1 596
Current financial assetsTrade and other receivables 667 38 261 15
Current investments 7 074 – 9 480 –
Restricted cash 109 4 726 114 330
Cash and cash equivalents 8 217 14 836 6 295 26 570
17 750 21 461 16 150 28 511
Non-current financial liabilitiesBorrowings 6 191 15 283 8 545 23 097
Other non-current liabilities 849 166 54 610
Current financial liabilitiesTrade and other payables 1 149 654 52 155
Borrowings 5 506 5 115 – –
Bank overdrafts 5 164 – 593
13 700 21 382 8 651 24 455
Sensitivity analysisThe Group has used a sensitivity analysis technique that measures the estimated change to profit or loss of an
instantaneous increase or decrease of 1% (100 basis points) in market interest rates, from the rate applicable at
31 December, for each class of financial instrument with all other variables remaining constant. This analysis is for
illustrative purposes only, as in practice market rates rarely change in isolation.
The Group is mainly exposed to fluctuations in the following market interest rates: JIBAR, LIBOR, NIBOR and EURIBOR,
money market rates and prime rate. Changes in market interest rates affect the interest income or expense of
floating rate financial instruments. Changes in market interest rates only affect profit or loss in relation to financial
instruments with fixed interest rates if these financial instruments are recognised at their fair value.
A change in the above market interest rates at the reporting date would have increased/(decreased) profit before
tax by the amounts shown on the next page.
The analysis has been performed on the basis of the change occurring at the start of the reporting period and
assumes that all other variables, in particular foreign currency rates, remain constant. The analysis is performed on
the same basis as was used for 2011.
05
MTN Group Limited Integrated Report for the year ended 31 December 2012 Page 191

Notes to the Group annual financial statements continued
for the year ended 31 December 2012
43. Financial risk management and financial instruments (continued)43.5 Market risk (continued)43.5.1 Interest rate risk (continued)
Sensitivity analysis (continued)2012
(Decrease)/increase in profit before tax2011
(Decrease)/increase in profit before tax
Change in interest rate
%
Upward change in
interest rateRm
Downward change in
interest rateRm
Change in
interest rate
%
Upward
change in
interest rate
Rm
Downward
change in
interest rate
Rm
JIBAR 1 (42,4) 42,4 1 (65,5) 65,5
LIBOR 1 7,0 (7,0) 1 (15,0) 15,0
3-month LIBOR 1 (9,9) 9,9 1 (4,7) 4,7
NIBOR 1 (82,2) 82,2 1 (44,7) 44,7
EURIBOR 1 (7,1) 7,1 1 (3,3) 3,3
Money market 1 65,0 (65,0) 1 90,2 (90,2)
Prime 1 (2,5) 2,5 1 16,9 (16,9)
Other 1 72,6 (72,6) 1 66,7 (66,7)
43.5.2 Currency riskCurrency risk is the exposure to exchange rate fluctuations that have an impact on cash flows and financing
activities.
The Group operates internationally and is exposed to currency risk arising from various currency exposures. Refer to
the table on the next page for the Group’s exposure to foreign currency risk based on notional amounts. Currency
risk arises when future commercial transactions or recognised assets and liabilities are denominated in a currency
that is not the entity’s functional currency. The Group is also exposed to translation risk as holding companies do
not report in the same currencies as operating entities.
Where possible, entities in the Group use forward contracts to hedge their actual exposure to foreign currency.
Refer to note 20 for the Group’s outstanding foreign exchange contracts. The Group’s Nigerian subsidiary manages
foreign currency risk on major foreign purchases by placing foreign currency on deposit as security against letters
of credit (LCs) when each order is placed.
The Group has foreign subsidiaries whose assets are exposed to foreign currency translation risk, which is managed
primarily through borrowings denominated in the relevant foreign currencies to the extent that such funding is
available on reasonable terms in the local capital markets.
Page 192 MTN Group Limited Integrated Report for the year ended 31 December 2012

43. Financial risk management and financial instruments (continued)43.5 Market risk (continued)43.5.2 Currency risk (continued)
Foreign currency exposureIncluded in the Group statement of financial position are the following amounts denominated in currencies other
than the functional currency of the reporting entities:
2012 Rm
2011
Rm
Assets
Non-current
– United States dollar – 11
– 11
Current
– United States dollar 12 247 3 695
– Euro 1 347 2 304
– South African rand 54 –
– British pound sterling 5 5
13 653 6 004
Total assets 13 653 6 015
Liabilities
Non-current
– United States dollar 2 953 2 416
– Euro 368 511
3 321 2 927
Current
– United States dollar 4 191 4 913
– Euro 1 122 728
– South African rand 40 65
– British pound sterling 48 10
5 401 5 716
Total liabilities 8 722 8 643
05
MTN Group Limited Integrated Report for the year ended 31 December 2012 Page 193

Notes to the Group annual financial statements continued
for the year ended 31 December 2012
43. Financial risk management and financial instruments (continued)43.5 Market risk (continued)43.5.2 Currency risk (continued)
Sensitivity analysisThe Group has used a sensitivity analysis technique that measures the estimated change to profit or loss and equity
of an instantaneous 10% strengthening or weakening in the rand against all other currencies, from the rate
applicable at 31 December, for each class of financial instrument with all other variables remaining constant. This
analysis is for illustrative purposes only, as in practice, market rates rarely change in isolation.
The Group is mainly exposed to fluctuations in foreign exchange rates against functional currencies in respect of the
South African rand, US dollar, Euro and Syrian pound. This analysis considers the impact of changes in foreign exchange
rates on profit, excluding foreign exchange translation differences resulting from the translation of Group entities that
have functional currencies different from the presentation currency, into the Group’s presentation currency (and
recognised in the foreign currency translation reserve).
A change in the foreign exchange rates to which the Group is exposed at the reporting date would have increased/
(decreased) profit before tax by the amounts shown below.
The analysis has been performed on the basis of the change occurring at the start of the reporting period and
assumes that all other variables, in particular interest rates, remains constant. The analysis is performed on the same
basis as applied in 2011.
Increase/(decrease) in profit before tax
Denominated: functional currency
Change in exchange rate
%
Weakening in functional
currencyRm
Strengthening in functional
currencyRm
2012US$:ZAR 10 699,5 (699,5)US$:IRR 10 (22,4) 22,4 US$:SDG 10 (225,2) 225,2 US$:SSP 10 (81,2) 81,2US$:NGN 10 (195,3) 195,3 EUR:SDG 10 (322,9) 322,9 EUR:US$ 10 330,0 (330,0)US$:GNF 10 (97,2) 97,2 SYP:US$ 10 285,6 (285,6)US$:ZMK 10 (119,8) 119,8IRR:ZAR 10 118,1 (118,1)
2011US$:ZAR 10 247,6 (247,6)
US$:IRR 10 (163,7) 163,7
US$:SDG 10 (230,0) 230,0
US$:NGN 10 (326,3) 326,3
EUR:SDG 10 (239,1) 239,1
EUR:US$ 10 268,8 (268,8)
US$:GNF 10 (93,0) 93,0
SYP:US$ 10 325,1 (325,1)
Page 194 MTN Group Limited Integrated Report for the year ended 31 December 2012

43. Financial risk management and financial instruments (continued)43.5 Market risk (continued)43.5.3 Price risk
The Group is not directly exposed to commodity price risk or material equity securities price risk.
43.6 Capital risk managementThe Group’s policy is to maximise borrowings at an operating company level, on a non-recourse basis, within an
acceptable level of debt for the maturity of the local company.
Equity funding for existing operations or new acquisitions is raised centrally, first from excess cash and then from
new borrowings while retaining an acceptable level of debt for the consolidated Group. Where funding is not
available to the operation locally or in specific circumstances where it is more efficient to do so, funding is sourced
centrally and on-lent. The Group’s policy is to borrow using a mixture of long-term and short-term capital market
issues and borrowing facilities from the local and international capital markets as well as multilateral organisations
together with cash generated to meet anticipated funding requirements.
The board of directors has approved three key debt protection ratios at a consolidated level being net debt:EBITDA,
net debt:equity and net interest:EBITDA. Net debt is defined as borrowings and bank overdrafts less cash and cash
equivalents.
These internal ratios establish levels of debt that the Group should not exceed other than for relatively short periods
of time and are shared with the Group’s debt rating agencies, being Moody’s and Fitch.
The Group’s net debt:EBITDA, net debt:equity and net interest:EBITDA at the end of the year are set out below.
2012 2011
Net debt:EBITDABorrowings and bank overdrafts (Rm) 32 532 34 016
Less: Bank balances, deposits and cash (Rm) (38 051) (45 832)
Net debt (Rm) (5 519) (11 816)
EBITDA (Rm) 58 564 54 750
Net debt/EBITDA (0,1) (0,2)
Net debt:total equityNet debt (Rm) (5 519) (11 816)
Total equity (Rm) 92 887 92 699
Net debt/total equity (%) (5,9) (12,7)
Net interest:EBITDANet finance costs (Rm) (4 157) (1 582)
EBITDA (Rm) 58 564 54 750
Net interest/EBITDA (%) 7,1 2,9
05
MTN Group Limited Integrated Report for the year ended 31 December 2012 Page 195
Notes to the Group annual financial statements continued
for the year ended 31 December 2012
44. Share-based payments
Equity-settled share-based paymentsThe schemes described below are accounted for as equity-settled share-based payments to employees.
Equity-settled share-based payments are measured at fair value (excluding the effect of non-market-based
vesting conditions) at the grant date. The fair value is measured using a stochastic model. The expected life used
in the model is based on management’s best estimate, after considering the effects of non-transferability,
exercise restrictions and behavioural considerations where applicable. The fair value determined at the grant
date of the equity-settled share-based options or rights is expensed on a straight-line basis over the vesting
period, based on the Group’s estimate of the shares that will eventually vest. The expense is adjusted to reflect
the actual number of options and share rights for which the related service and non-market based vesting
conditions are met.
Where employees exercise options or share rights in terms of the rules and regulations of the schemes, treasury
shares, if available within the MTN Group Share Trust, are allocated, or alternatively new shares are issued to
participants as beneficial owners. The directors procure a listing of these shares on the JSE Limited, the securities
exchange on which the Company’s shares are listed. In terms of the share option scheme, participants with
vested share options pay a consideration equal to the option price when the options are exercised. The nominal
value of shares issued is credited to share capital and the difference between the nominal value and the option
price is credited to share premium.
The MTN Group share options, share appreciation rights and share rights schemes and performance share planThe Group operates a number of equity-settled share-based payment schemes for the benefit of eligible employees,
including executive directors, in accordance with the schemes’ rules. The schemes are designed to retain and
recognise the contributions of executive directors and eligible employees and to provide additional incentives to
contribute to the Group’s continued growth.
The performance share plan is the active scheme which superseded the share option scheme, the share appreciation
rights and share rights schemes. The superseded schemes will be wound up once all unvested and/or unexercised
awards previously made have run their remaining courses.
The vesting periods under the share rights scheme, share option scheme and share appreciation rights scheme are
as follows: 20%, 20%, 30% and 30% on the anniversary of the second, third, fourth and fifth years respectively, after
the grant date. The strike price for these schemes is determined as the closing market price for MTN Group Limited
shares on the day prior to the date of allocation. Unexercised options and rights lapse 10 years from the date of
grant and are forfeited if the employee leaves the Group before they vest.
The vesting period for the performance share plan is three years and the awards vest in full based on set performance
targets.
The total number of shares which may be allocated for the purposes of the schemes shall not exceed 5% of the total
issued ordinary share capital of the Company, being 91 633 632 (2011: 92 402 610 shares), excluding Zakhele
transactions and treasury shares, as approved by shareholders in 2001.
Page 196 MTN Group Limited Integrated Report for the year ended 31 December 2012

44. Share-based payments (continued)MTN Group share options Details of the outstanding share options are as follows:
Offer dateStrike price
R
Number
outstanding at
31 December
2011
Forfeitedduring 2012
Exercisedduring 2012
Number outstanding at
31 December 2012
2 September 2002 9,31 166 550 (5 190) (161 360) –1 December 2003 27,00 205 700 (5 910) (21 600) 178 1901 December 2004 40,50 81 300 (3 340) (10 820) 67 140
Total 453 550 (14 440) (193 780) 245 330
The options outstanding at the end of the year under review have a weighted average remaining contractual life of
one year (2011: two years). No new options were granted in the current or prior year and no expense was recognised
as the above options vested in prior periods.
The share option scheme has been superseded by the introduction of the Group share appreciation rights scheme
described below.
MTN Group Share Appreciation Rights Scheme and Share Rights Scheme (the rights schemes)The share appreciation rights scheme was implemented on 31 May 2006, and superseded the share option scheme.
On 26 August 2008, the board approved the share rights scheme, which superseded the share appreciation rights
scheme. Both the rights schemes operate under the same provisions with the exception that the share rights
scheme was extended to allow participation by junior managers.
Share rights under the rights schemes are granted to eligible employees by the relevant employer subsidiary
company.
Exercised rights are equity-settled whereby the relevant subsidiary purchases the required MTN shares in the open
market.
Details of the outstanding share appreciation rights are as follows:
Offer dateStrike price
R
Number
outstanding at
31 December
2011
Forfeitedduring 2012
Exercisedduring 2012
Number outstanding at
31 December 2012
31 May 2006 56,83 506 475 (9 000) (225 815) 271 660 21 November 2006 71,00 395 070 (5 970) (234 200) 154 900 1 January 2007 85,30 31 380 – – 31 380 22 June 2007 96,00 248 420 (57 280) (84 860) 106 280 19 March 2008 126,99 408 860 (67 910) (42 270) 298 680
Total 1 590 205 (140 160) (587 145) 862 900
05
MTN Group Limited Integrated Report for the year ended 31 December 2012 Page 197

Notes to the Group annual financial statements continued
for the year ended 31 December 2012
44. Share-based payments (continued)Details of the outstanding share rights are as follows:
Offer dateStrike price
R
Number
outstanding at
31 December
2011
Forfeitedduring 2012
Exercisedduring 2012
Number outstanding at
31 December 2012
1 September 2008 118,64 1 547 880 (160 390) (440 490) 947 00028 June 2010 107,49 2 916 315 (296 820) (440 838) 2 178 657
Total 4 464 195 (457 210) (881 328) 3 125 657
The share rights and share appreciation rights outstanding at the end of the year under review have a weighted
average remaining contractual life of six years (2011: eight years).
There were no new grants during the 2012 or 2011 financial year.
MTN performance share plan (PSP)During the 2012 and 2011 financial years the Group granted eligible employees share rights under the PSP,
established in 2010. The rights were granted to employees on level 3 – 4, and 5 – 6. The PSP was established in order
to attract, retain and reward selected employees who are able to contribute to the business of the employer
companies and to stimulate their personal involvement, thereby encouraging their continued service and
encouraging them to advance the interests of the relevant employer company and the Group in general.
The share rights vest after three years from date of grant. The following performance conditions must be fulfilled to
qualify for the percentage of the shares granted as stated in the table below:
Proportion of grant
Vesting conditions for shares granted
Employee level 3 – 4
%
Employee level 5 – 6
%
Total shareholder return 37,5 50,0 Adjusted free cash flow 37,5 50,0 Individual retention (guaranteed, subject to remaining on the PSP for
the duration of the award fulfilment period) 25,0 –
For the total shareholder return vesting condition, vesting is based on a sliding scale that ranges from 25% vesting
at the median to 100% vesting at the 75% percentile of the performance of a comparable group of companies listed
on the JSE. For the adjusted free cash flow vesting condition, vesting is based on a sliding scale between 11% – 19%
growth on the adjusted free cash flow. The individual retention vesting condition is guaranteed subject to the
employee remaining employed by the Group for the duration of the vesting period.
Page 198 MTN Group Limited Integrated Report for the year ended 31 December 2012

44. Share-based payments (continued)MTN performance share plan (PSP) (continued)Details of the outstanding equity-settled performance share plan rights are as follows:
Offer date
Number
outstanding at
31 December
2011
Offered during 2012
Forfeitedduring 2012
Number outstanding at 31 December
2012
29 June 2011 1 584 800 – (87 500) 1 497 30029 December 2011 1 491 714 – (103 000) 1 388 714 28 December 2012 – 1 960 540 – 1 960 540
Total 3 076 514 1 960 540 (190 500) 4 846 554
A valuation has been prepared using a stochastic model to determine the fair value of the obligation under the
performance share plan and the expense to be recognised during the year.
The range of inputs into the stochastic model used for rights granted during the year were as follows:
2012 2011
Share price R178,28 R142,80 – R143,00
Expected life 3 years 3 years
Risk-free rate 4,97% – 5,35% 6,84% – 6,18%
Expected volatility 21,00% – 22,54% 32,19% – 26,49%
Dividend yield 5,08% 2,22% – 2,92%
The risk-free rate was estimated using the implied yield on SA zero-coupon government bonds.
Volatility was estimated using the weekly closing share price and the dividend yield was estimated by using a
one year (2011: two year) moving average of the dividend yield at valuation date.
2012Rm
2011
Rm
Expense arising from equity-settled share-based payment
transactions (note 6) 147 74
05
MTN Group Limited Integrated Report for the year ended 31 December 2012 Page 199

Notes to the Group annual financial statements continued
for the year ended 31 December 2012
45. Reclassification
Group statement of cash flows
2011
As
previously
reported
Rm
Reclassi-
fication1
Rm
Reclassified
Rm
Net cash generated from operating activities 27 874 (2 647) 25 227
Net cash used in investing activities (20 616) – (20 616)
Net cash used in financing activities (12 033) 2 647 (9 386)
Cash and cash equivalents at end of the year 35 213 – 35 213
1 Dividends paid to non-controlling interestsDividends paid to non-controlling interests were reclassified from financing activities to operating activities to include all dividends paid to equity
holders in operating activities.
Page 200 MTN Group Limited Integrated Report for the year ended 31 December 2012

Note
2012Rm
2011
Rm
Finance income 1 11 456 17 688
Finance costs 1 (5) (4)
Management fees received 68 72
Operating expenses 2 (129) (140)
Profit before tax 11 390 17 616
Income tax expense 3 (897) (1 177)
Total comprehensive income after tax attributable to the equity holders of the Company 10 493 16 439
Note
2012Rm
2011
Rm
ASSETS
Non-current assets
Investment in subsidiaries 4 23 708 23 708
Current assets 270 4 784
Trade and other receivables 5 136 60
Cash and cash equivalents 6 134 4 724
Total assets 23 978 28 492
SHAREHOLDERS’ EQUITY
Ordinary share capital and share premium 7 45 611 45 608
Retained earnings (23 451) (18 921)
Reserves 1 662 1 662
Total equity 23 822 28 349
LIABILITIES
Non-current liabilities
Deferred tax liabilities 1 1
Current liabilities 155 142
Taxation liabilities 21 31
Trade and other payables 8 134 111
Total liabilities 156 143
Total equity and liabilities 23 978 28 492
for the year ended 31 December 2012
Company statement of comprehensive income
at 31 December 2012
Company statement of financial position
05
MTN Group Limited Integrated Report for the year ended 31 December 2012 Page 201

Sharecapital
Rm
Sharepremium
Rm
Retained earnings
RmReserves1
Rm
Total equity
Rm
Balance at 1 January 2011 * 45 602 (23 638) 1 662 23 626
Shares issued during the year * 6 – – 6
Total comprehensive income – – 16 439 – 16 439
Dividends paid – – (11 722) – (11 722)
Balance at 31 December 2011 * 45 608 (18 921) 1 662 28 349
Balance at 1 January 2012 * 45 608 (18 921) 1 662 28 349 Shares issued during the year * 3 – – 3 Shares cancelled * – – – *Total comprehensive income – – 10 493 – 10 493 Dividends paid – – (15 023) – (15 023)
Balance at 31 December 2012 * 45 611 (23 451) 1 662 23 822
Note 7 7
1 Share-based payment reserve.
*Amounts less than R1 million.
Company statement of cash flows
Note
2012Rm
2011
Rm
CASH FLOWS (USED IN)/FROM OPERATING ACTIVITIES
Cash utilised in operations 9 (116) (72)
Finance costs paid – (1)
Finance income received 93 24
Income tax paid 10 (907) (1 175)
Dividends paid (15 023) (11 722)
Dividends received 11 360 17 660
Net cash (utilised in)/generated from operating activities (4 593) 4 714
CASH FLOWS FROM FINANCING ACTIVITIES
Proceeds from the issuance of ordinary shares 3 6
Net cash generated from financing activities 3 6
Net (decrease)/increase in cash and cash equivalents (4 590) 4 720
Cash and cash equivalents at beginning of the year 4 724 4
Cash and cash equivalents at end of the year 6 134 4 724
for the year ended 31 December 2012
for the year ended 31 December 2012
Company statement of changes in equity
Page 202 MTN Group Limited Integrated Report for the year ended 31 December 2012

1. Finance income and finance costs
Finance incomeFinance income comprises interest income on funds invested, dividend income and foreign exchange gains.
Interest income is recognised as it accrues in profit or loss, using the effective interest method. Dividend income
is recognised when the right to receive payment is established.
Finance costsRefer to note 7 of the Group annual financial statements for the applicable accounting policy.
2012Rm
2011
Rm
Interest income 93 24
Foreign exchange gains 3 4
Dividend income 11 360 17 660
Finance income 11 456 17 688
Interest on borrowings (1) (4)
Foreign exchange losses (4) –
Finance costs (5) (4)
Net finance income recognised in profit or loss 11 451 17 684
2. Operating expenses
The following disclosable items have been included in operating expenses:
Directors’ emoluments (13) (12)
Fees paid for services (87) (93)
Professional fees (25) (27)
Management fees (note 11) (62) (66)
Auditors’ remuneration (5) (7)
Audit fees (3) (3)
Fees for other services (2) (4)
for the year ended 31 December 2012
Notes to the Company annual financial statements 05
MTN Group Limited Integrated Report for the year ended 31 December 2012 Page 203

Notes to the Company financial statements continued
for the year ended 31 December 2012
3. Income tax expense
Refer to note 8 of the Group annual financial statements for the applicable accounting policy.
2012Rm
2011
Rm
Secondary tax on companies (STC) (898) (1 172)
Normal tax 1 (6)
Current year (18) (6)
Adjustments in respect of the prior year 19 –
Deferred tax charge – 1
(897) (1 177)
South African normal taxation is calculated at 28% (2011: 28%) of the estimated taxable income for the year.
2012%
2011
%
Tax rate reconciliationThe charge for the year can be reconciled to the effective rate of taxation in
South Africa as follows:
Statutory tax rate 28,0 28,0
Income not subject to tax (27,9) (28,1)
Effect of STC 7,9 6,7
Expenses not allowed – 0,1
Effect of normal tax adjustment in respect of the prior year (0,1) –
Effective tax rate 7,9 6,7
4. Investment in subsidiaries
Refer to note 1.3.1 of the Group annual financial statements for applicable accounting policy.
2012Rm
2011
Rm
Total interest in subsidiary Mobile Telephone Networks Holdings Proprietary Limited 23 651 23 651
Total interest in MTN Group Management Services Proprietary Limited 57 57
MTN Group Management Services Proprietary Limited * *
Loan owing by subsidiary 57 57
Total interest in subsidiary companies 23 708 23 708
* Amounts less than R1 million.
5. Trade and other receivables
Refer to note 18 of the Group annual financial statements for the applicable accounting policy.
2012Rm
2011
Rm
Trade receivables due from related parties 134 57
Prepayments and other receivables 2 –
Sundry debtors and advances – 3
136 60
Page 204 MTN Group Limited Integrated Report for the year ended 31 December 2012

6. Cash and cash equivalents
Refer to note 22 of the Group annual financial statements for the applicable accounting policy.
2012Rm
2011
Rm
Cash at bank and on hand 134 4 724
7. Ordinary share capital and share premium
Refer to note 23 of the Group annual financial statements for the applicable accounting policy.
2012 2011
Number of shares
Authorised 2 500 000 000 2 500 000 000
Issued 1 883 484 324 1 884 811 569
In issue at beginning of the year 1 884 811 569 1 884 510 117
Options exercised 193 780 301 452
Shares cancelled (1 521 025) –
In issue at end of the year 1 883 484 324 1 884 811 569
Options – MTN Zakhele transaction1 (28 473 927) (29 994 952)
In issue at end of the year– excluding MTN Zakhele transaction2 1 855 010 397 1 854 816 617
1 Due to the call option over the notional vendor finance shares, these shares, although legally issued to MTN Zakhele, are not deemed to be issued in terms
of IFRS and are shown as such in the share capital reconciliation.2 Treasury shares are held by MTN Holdings Proprietary Limited and are therefore excluded from this reconciliation. Refer to note 23 of the Group annual
financial statements.
2012Rm
2011
Rm
Share capitalBalance at beginning of the year * *
Additions * *
Shares cancelled * –
Balance at end of the year * *
Share premium Balance at beginning of the year 45 608 45 602
Options exercised 3 6
Balance at end of the year 45 611 45 608
*Amounts less than R1 million.
05
MTN Group Limited Integrated Report for the year ended 31 December 2012 Page 205

Notes to the Company financial statements continued
for the year ended 31 December 2012
8. Trade and other payables
Refer to note 29 of the Group annual financial statements for the applicable accounting policy.
2012Rm
2011
Rm
Payables due to related parties 12 15
Accrued expenses and other payables 122 96
134 111
9. Cash utilised in operations
Profit before tax 11 390 17 616
Adjusted for:
Finance income (note 1) (11 456) (17 688)
Finance costs (note 1) 5 4
Other (1) (29)
(62) (97)
Changes in working capital (54) 25
(Increase)/decrease in trade and other receivables (73) 75
Increase/(decrease) in trade and other payables 19 (50)
(116) (72)
10. Income tax paid
Balance at beginning of the year (31) (24)
Amounts recognised in profit or loss (note 3) (897) (1 177)
Other – (5)
Balance at end of the year 21 31
Total tax paid (907) (1 175)
Page 206 MTN Group Limited Integrated Report for the year ended 31 December 2012

11. Related party transactions
Refer to note 41 of the Group annual financial statements for the applicable accounting policy.
Various transactions were entered into by the Company during the period with related parties.
The following is a summary of significant transactions with related parties during the period and significant balances
receivable at the reporting date:
2012Rm
2011
Rm
Dividends paid
– Mobile Telephone Networks Holdings Proprietary Limited (104) –
Dividends received
– Mobile Telephone Networks Holdings Proprietary Limited 11 360 17 660
Management fees paid
– MTN Group Management Services Proprietary Limited (62) (66)
Management fees received
– MTN International Proprietary Limited 68 72
Professional fees paid
– MTN Group Management Services Proprietary Limited (11) –
Receivables
– Mobile Telephone Networks Holdings Proprietary Limited 121 1
DirectorsDetails of directors’ remuneration are disclosed in note 2 of the Company annual financial statements.
ShareholdersThe principal shareholders of the Company are disclosed in the integrated report on page 211.
12. Contingent liabilities and commitments
Refer to note 33 of the Group annual financial statements for the applicable accounting policy.
The Company does not have any contingent liabilities or commitments at year-end.
05
MTN Group Limited Integrated Report for the year ended 31 December 2012 Page 207

Notes to the Company financial statements continued
for the year ended 31 December 2012
13. Financial guarantee contracts
A financial guarantee contract is a contract that requires the issuer to make specified payments to reimburse the
holder for a loss it incurs because a specified debtor fails to make payments when due in accordance with the
terms of a debt instrument.
Financial guarantee contracts issued by the Company are initially measured at fair value and are subsequently
measured at the higher of:
� the amount of the obligation under the contract, as determined in accordance with IAS 37 Provisions, Contingent
Liabilities and Contingent Assets; and
� the amount initially recognised less, where appropriate, cumulative amortisation, recognised in accordance
with IAS 18 Revenue.
Where financial guarantees are issued by a wholly owned subsidiary to its parent company in respect of debt
incurred by the parent company, these are deemed to be liquidity instruments only as opposed to financial
guarantee contracts per IFRS.
The Company along with certain of its subsidiaries has guaranteed the bonds, revolving credit facilities and general
banking facilities of Mobile Telephone Networks Holdings Proprietary Limited. The Company will make payments to
reimburse the lenders upon failure of the guaranteed entity to make payments when due.
2012Rm
2011
Rm
Terms and drawn down balances of the guarantees at the end of the year are as follows:Bond guaranteesBonds and commercial paper 7 192 6 050
These bonds are listed on the Bond Exchange of South Africa
Syndicated and other loan facilitiesZAR long-term loan 4 254 7 096
General banking facilityZAR facility 502 –
11 948 13 146
In addition, the Company has provided unrestricted suretyship with regards to the cash management facility of
Mobile Telephone Networks Holdings Proprietary Limited and suretyship to the amount of R5 850 million with
regards to the banking facilities of Mobile Telephone Networks Proprietary Limited, MTN International (Mauritius)
Limited, MTN International Proprietary Limited, Mobile Telephone Networks Holdings Proprietary Limited and MTN
Service Provider Proprietary Limited.
Page 208 MTN Group Limited Integrated Report for the year ended 31 December 2012

14. Financial risk management and financial instruments
Refer to note 43 of the Group annual financial statements for the applicable accounting policy.
14.1 Categories of financial instruments
Loans and receivables
Rm
Amortised costRm
Total1 carrying amount
Rm
2012Trade and other receivables 136 – 136 Cash and cash equivalents 134 – 134
270 – 270
Trade and other payables – 134 134
2011Trade and other receivables 60 – 60
Cash and cash equivalents 4 724 – 4 724
4 784 – 4 784
Trade and other payables – 111 111
1 The carrying value of all financial instruments not measured at fair value closely approximates fair value.
14.2 Credit risk
Refer to note 43.3 of the Group annual financial statements for an explanation on credit risk and how it is managed.
The Company considers its maximum exposure per class, without taking into account any collateral and financial
guarantees, to be as follows:
2012Rm
2011
Rm
Cash and cash equivalents 134 4 724
Trade and other receivables 136 60
270 4 784
14.3 Liquidity risk
Refer to note 43.4 of the Group annual financial statements for an explanation on liquidity risk and how it
is managed.
The following liquid resources are available:
2012Rm
2011
Rm
Cash and cash equivalents 134 4 724
Trade and other receivables 136 60
270 4 784
05
MTN Group Limited Integrated Report for the year ended 31 December 2012 Page 209

Notes to the Company financial statements continued
for the year ended 31 December 2012
14. Financial risk management and financial instruments (continued)14.3 Liquidity risk (continued)
The following are the contractual maturities of financial liabilities:
Carrying amount
RmTotal
Rm
Payablewithin
1 month or on demand
Rm
Payable more than
1 month but not
exceeding 3 months
Rm
2012Trade and other payables
– Accrued expenses and other payables 122 122 122 –– Payables due to related parties 12 12 12 –
134 134 134 –
2011Trade and other payables
– Accrued expenses and other payables 96 96 51 45
– Payables due to related parties 15 15 15 –
111 111 66 45
14.4 Market risk14.4.1 Interest rate risk
Refer to note 43.5.1 of the Group annual financial statements for an explanation on interest rate risk and how it
is managed.
At the reporting date the interest rate profile of the Company’s interest bearing financial instruments was:
Variable rate
instrumentsRm
2012Financial assetsCash and cash equivalents 134
2011Financial assetsCash and cash equivalents 4 724
14.4.2 Currency risk
Refer to note 43.5.2 of the Group annual financial statements for an explanation on currency risk and how it
is managed.
The Company is not exposed to significant currency risk.
15. Events after the reporting period
Refer to note 40 of the Group annual financial statements with regards to the potential litigation by Turkcell Iletism
Hizmetlera AS (Turkcell).
Page 210 MTN Group Limited Integrated Report for the year ended 31 December 2012

16. Shareholders’ information
Shareholder spreadNumber of
shareholders %Number of
shares %
1 – 1 000 shares 125 170 88,17 27 820 025 1,481 001 – 10 000 shares 14 347 10,11 39 171 099 2,0810 001 – 100 000 shares 1 640 1,16 52 258 674 2,77100 001 – 1 000 000 shares 632 0,44 195 846 776 10,401 000 001 shares and over 170 0,12 1 568 387 750 83,27
Total 141 959 100,00 1 883 484 324 100,00
Nominees holding shares in excess of 5% of the issued ordinary share capital of the Company
2012 2011
Number of shares
% of issued share capital
Number of
shares
% of issued
share capital
Nedcor Bank Nominees Limited 397 863 194 21,12 454 420 485 24,11
Standard Bank Nominees (Tvl) Proprietary
Limited 626 718 889 33,27 582 963 175 30,93
First National Nominees Proprietary Limited 296 249 416 15,73 302 536 665 16,05
Absa Nominees Proprietary Limited 157 902 523 8,38 158 215 872 8,39
Spread of ordinary shareholders2012 2011
Number of shareholdings
Number of shares
% of issued share capital
Number of
shares
% of issued
share capital
Public 141 919 1 280 878 892 68,01 1 282 083 602 68,02
Non-public 40 602 605 432 31,99 602 727 967 31,98
Directors and associates of the
Company 13 1 958 440 0,10 2 456 067 0,13
Empowerment 2 76 748 338 4,07 85 509 785 4,54
Lombard Odier Darier Hentsch
& Cie (M1 Limited) 8 183 152 564 9,72 183 152 564 9,72
Government Employees
Pension Fund 16 318 408 338 16,91 324 845 139 17,23
Mobile Telephone Networks
Holdings 1 22 337 752 1,19 6 764 412 0,36
Total 141 959 1 883 484 324 100,00 1 884 811 569 100,00
Beneficial shareholders holding 5% or more2012 2011
Number of shares
% of issued share capital
Number of
shares
% of issued
share capital
Government Employees Pension Fund 318 408 338 16,91 324 845 139 17,23
Lombard Odier Darier Hentsch & Cie
(M1 Limited) 183 152 564 9,72 183 152 564 9,72
17. Resolutions
During the year there were no material special resolutions passed in the Company or its subsidiary companies.
05
MTN Group Limited Integrated Report for the year ended 31 December 2012 Page 211

Annexure 1
Interests in subsidiary companies and joint ventures at 31 December 2012
Subsidiaries and joint ventures in which MTN Group Limited has a direct and indirect interest
2012 2011
Principal activityPlace of incorporation
Effective % interest in issued ordinary
share capital
MTN Afghanistan Limited Telecommunications Afghanistan 90,9 90,9
Spacetel Benin SA Telecommunications Benin 75 75
Deci Investments Proprietary Limited1 Investment holding company Botswana 33,3 33,3
Econet Wireless Citizens Limited Investment holding company Botswana 82,8 82,8
Mascom Wireless Botswana Proprietary Limited1 Network operator Botswana 53,1 53,1
MTN Business Solutions Botswana Proprietary Limited Internet service provider Botswana 80 80
Easydial International Limited Holding company British Virgin Islands 99 99
Interserve Overseas Limited International business British Virgin Islands 99 99
Investcom Consortium Holding S.A. Holding company British Virgin Islands 99 99
Investcom Global Limited Managing and holding
company British Virgin Islands 99 99
Investcom International Limited Dormant company British Virgin Islands 99 99
Investcom Mobile Benin Limited Holding company British Virgin Islands 99 99
Investcom Mobile Communications Limited Holding company British Virgin Islands 100 100
Investcom Telecommunications Afghanistan Limited Holding company British Virgin Islands 100 100
Investcom Telecommunications Guinea (Conakry)
Limited Holding company British Virgin Islands 99 99
Investcom Telecommunications Yemen Limited Telecommunications British Virgin Islands 100 100
MTN Yemen Telecommunications British Virgin Islands 82,8 82,8
Spacetel Africa Limited Telecommunications British Virgin Islands 100 100
Starcom Global Limited Holding company British Virgin Islands 89 89
Mobile Telephone Networks Cameroon Limited Network operator Cameroon 70 70
MTN Network Solutions Limited Internet service provider Cameroon 70 70
Afnet Internet service provider Côte d’ Ivoire 67,7 64,7
Arobase Fixed line operator Côte d’ Ivoire 67,7 64,7
MTN Côte d’Ivoire S.A. Network operator Côte d’ Ivoire 67,7 64,7
Infotel Limited Telecommunications and
consumer products Cyprus 50 50
MTN Cyprus Limited Telecommunications Cyprus 50 50
OTEnet Cyprus Limited Telecommunications Cyprus 50 50
Fourteenth Avenue Investment Holding Limited Holding company Dubai 100 100
MTN ICT Services PLC ICT service provider Ethiopia 99,9 –
Uniglobe SA2 Management company France – 99,8
Easynet Search Limited Internet service provider Ghana 99,6 99,6
Scancom Limited Telecommunications Ghana 97,7 97,7
Areeba Guinea S.A. Telecommunications Guinea 75 75
Spacetel Guinea-Bissau S.A. Telecommunications Guinea-Bissau 100 100
Irancell Telecommunication Company Services (PJSC)1 Network operator Iran 49 49
MTN Business Limited (Kenya) Internet service provider Kenya 42 42
MTN Business Kenya Limited Internet service provider Kenya 42 42
Inteltec Offshore SAL Maintenance and
engineering services Lebanon 99,8 99,8
MTN (Dubai) Limited Holding company UAE 100 100
Servico SAL Services and transportation
of goods Lebanon 99,97 99,97
Lonestar Communications Corporation LLC Telecommunications Liberia 60 60
1 Joint venture.2 Company dissolved in 2012.
Page 212 MTN Group Limited Integrated Report for the year ended 31 December 2012

Subsidiaries and joint ventures in which MTN Group Limited has a direct and indirect interest
2012 2011
Principal activityPlace of incorporation
Effective % interest in issued ordinary
share capital
Guardrisk International Limited PCC Insurance company Mauritius 100 100
Mobile Botswana Limited Investment holding company Mauritius 100 100
MTN International (Mauritius) Limited Investment holding company Mauritius 100 100
Satellite Data Networks Mauritius Proprietary
Limited1 Internet service provider Mauritius 60 60
MTN Business Solutions Namibia Proprietary Limited Internet service provider Namibia 100 100
MTN (Netherlands) Co-Op UA Holding company Netherlands 100 100
MTN (Netherlands) BV Holding company Netherlands 100 100
MTN NIC BV Holding company Netherlands 100 100
Electronic Funds Transfer Operations Nigeria Limited Virtual airtime Nigeria 50 50
MTN Nigeria Communications Limited Network operator Nigeria 78,83 78,83
XS Broadband Limited Telecommunications Nigeria 78,83 78,83
Galactic Engineering Projects SA Holding company Panama 78 78
Vernis Associates SA Holding company Panama 100 100
MTN Congo S.A. Network operator Republic of the
Congo 100 100
MTN Rwandacell S.A.R.L Network operator Rwanda 80 80
Village Phone Rwanda2 Airtime sales Rwanda – 100
Aconcagua 11 Proprietary Limited Property holding South Africa 100 100
Cell Place Proprietary Limited Cellular dealership South Africa 100 100
iTalk Cellular Proprietary Limited Service provider South Africa 100 100
Mobile Telephone Networks Proprietary Limited Network operator South Africa 100 100
Mobile Telephone Networks Holdings Proprietary
Limited Investment holding company South Africa 100 100
MTN Business Solutions Proprietary Limited Internet service provider South Africa 100 100
MTN Group Management Services
Proprietary Limited Management services South Africa 100 100
MTN International Proprietary Limited Investment holding company South Africa 100 100
Oltio Proprietary Limited (MTN Mobile Money
Holdings Proprietary Limited)1 Wireless banking services South Africa 50 50
MTN Network Solutions Proprietary Limited Internet service provider South Africa 100 100
MTN Propco Proprietary Limited Property holding South Africa 100 100
MTN Service Provider Proprietary Limited Service provider South Africa 100 100
Satellite Data Networks Proprietary Limited Dormant company South Africa 100 100
Inteltec Macroc SA Maintenance and
engineering services Monaco 99,83 99,83
MTN Sudan Company Limited Network operator Sudan 85 85
Swazi MTN Limited1 Network operator Swaziland 30 30
MTN Syria (JSC) Telecommunications Syria 75 75
MTN Publicom Limited Payphone services Uganda 96 96
MTN Uganda Limited Network operator Uganda 96 96
MTN SEA Shared Services Limited Shared services hub Uganda 100 –
Spacetel International Limited Dormant company United Kingdom 100 100
Cotel Holdings Limited Investment holding company Zambia 100 100
MTN (Zambia) Limited Network operator Zambia 86 86
MTN Business Solutions Limited (Zambia) Internet service provider Zambia 48 48
MTN Mobile Money Limited Wireless banking services Zambia 86 –
1 Joint venture.2 Company dissolved in 2012.
05
MTN Group Limited Integrated Report for the year ended 31 December 2012 Page 213