Embed Size (px)
Citation preview

ANNUALFINANCIAL
STATEMENTS
2020

Reporting formats Forward-looking informationAll references to forward-looking information and targets in the 2020 reports are extracted from the 2020/21 Transnet Corporate Plan and approved by the Board of Directors
Feedback on this reportWe welcome feedback on our 2020 Annual Financial Statements. Please provide written feedback to Kilford Gondo at [email protected].
The 2020 Integrated Report is the Company’s primary report to all stakeholders.
The 2020 Annual Financial Statements include the reports of the directors and independent auditors.

1
2 Performance highlights
4 Approval of the annual financial statements
5 Group Company Secretary certificate
6 Independent auditor’s report
14 Audit Committee report
17 Report of the directors
Annual financial statements
26 Accounting policies
52 Income statements
53 Statements of comprehensive income
54 Disclosure of components of other comprehensive income
55 Statements of financial position
56 Statements of changes in equity
57 Statements of cash flows
58 Segment information
62 Notes to the annual financial statements
130 Abbreviations and acronyms
131 Glossary of terms
132 Corporate information
Contents

2 Annual financial statementsPerformance highlights
Performance highlights
Revenue increased by 1,3% to R75,1 billion, due to a weighted tariff increase of 2,9%, partially offset by a 1,3% decline in rail freight volumes and a 2,4% decline in port container throughput.
Net operating expenses increased by 1,9% to R41,1 billion, which is especially pleasing when considering that the prior year cost level had shown zero growth on the year before that.
EBITDA increased by 0,7% to R34,0 billion, with the EBITDA margin decreasing from 45,6% to 45,3%.
Gearing of 47,6% and cash interest cover at 2,9 times are both within loan covenant requirements.
Net profit decreased by 34,9% to R3,9 billion, primarily due to fair value adjustments in the prior year being R2,5 billion higher than in the current year.
Cash generated from operations increased by 2,1% to R35,9 billion.
Capital investment of R18,6 billion represents a 3,5% increase compared to the prior year.
B-BBEE status maintained at level 2 with spend amounting to R31,31 billion or 111,82% of total measured procurement spend, as defined by DTIC codes.
2,7% of labour costs was spent on training, focusing on artisans, engineers and engineering technicians.
DIFR performance of 0,73, which is the tenth consecutive year that a ratio below 0,75 has been achieved against a global benchmark of 1,0.

3
Revenue (R million)
0
80 000
70 000
60 000
40 000
10 000
62 167 65 478 72 887 74 070 75 065
2016 2017 2018 2019 2020
50 000
30 000
20 000
EBITDA (R million)
0
35 000
30 000
20 000
5 000
26 250 27 557 32 515 33 750 33 984
2016 2017 2018 2019 2020
25 000
15 000
10 000
Gearing (percent)
0
50
30
10
43,2 44,2 43,4 44,5 47,6
2016 2017 2018 2019 2020
40
20
Capital investment (R million)
0
35 000
30 000
20 000
5 000
29 561 21 438 21 781 17 941 18 561
2016 2017 2018 2019 2020
25 000
15 000
10 000
Cash interest cover (times)
0
4
2
3.1 2.9 3.0 2.9 2.9
2016 2017 2018 2019 2020
3
1
Net profit for the year (R million)
0
7 000
3 000
393 2 765 4 851 6 047 3 938
2016 2017 2018 2019 2020
4 000
2 000
1 000
5 000
6 000

4
Approval of the annual financial statements for the year ended 31 March 2020
Annual financial statementsApproval of the annual financial statements
Directors’ responsibilitiesThe Board of Directors (Board) is required by the Companies Act, No 71 of 2008 of South Africa (Companies Act) and the Public Finance Management Act, No 1 of 1999 (PFMA) to prepare annual financial statements which fairly present the state of affairs of Transnet SOC Ltd (Transnet or the Company) and its subsidiaries (the Group) as at the end of the financial year, as well as the profit or loss and cash flows of the Company and the Group for the financial year then ended.
In preparing these annual financial statements, the directors are required to: • Select suitable accounting policies and apply them
consistently;• Make judgements and estimates that are
reasonable and prudent;• State whether applicable accounting standards
have been followed; and• Prepare the annual financial statements on the
going-concern basis unless it is inappropriate to presume that the Company and/or the Group will continue in business for the foreseeable future.
The Board is responsible for the maintenance of adequate accounting records, maintenance of appropriate systems of internal control, as well as the preparation and integrity of the annual financial statements and related information.
Directors’ statementsThe internal audit activities undertaken during the year are in accordance with the internal audit plan approved by the Audit Committee. Transnet internal audit has executed the internal audit plan during the year and has provided assurance to the Board as to the state of the internal controls of the Company. Their assessment of the internal controls of the Company is included in the Audit Committee report.
The Audit Committee has evaluated the Company and Group annual financial statements and has recommended their approval to the Board. In preparing the Company and Group annual financial statements, the Company and the Group have complied with International Financial Reporting Standards (IFRS) and the Companies Act. In addition, the Group has complied with the reporting requirements of the PFMA, except as set out in the report of the directors on page 20. The Group has used appropriate accounting policies supported by reasonable and prudent judgements and estimates. Judgements and estimates made in the application of IFRS, that have a significant impact on the annual financial statements, are disclosed in the notes to the annual financial statements.
The Board has every reason to believe that the Company and Group have adequate resources and facilities in place to be able to continue in operation for the foreseeable future. Therefore, the Board is satisfied that Transnet is a going concern and has continued to adopt the going-concern basis in preparing the annual financial statements.
The external auditors, SizweNtsalubaGobodo Grant Thornton, are responsible for independently auditing and reporting on the annual financial statements in conformity with International Standards on Auditing (ISA). Their qualified audit report on the annual financial statements, prepared in terms of the Public Audit Act of South Africa, No 25 of 2004, appears on pages 6 to 13.
The Board is of the opinion that the Company and the Group have complied with applicable laws and regulations except as disclosed in the report of the directors as set out on page 20.
The Board is of the opinion that these annual financial statements fairly present the financial position of the Company and the Group as at 31 March 2020, and the results of their operations and cash flow information for the year then ended. The annual financial statements have been prepared under the supervision of the Group Chief Executive.
Statement in terms of Article 3(2)(c) of the Transparency Law of 2008Management declares that, to the best of their knowledge, the consolidated and separate annual financial statements have been prepared in accordance with IFRS and give a true and fair view of the assets, liabilities, financial position and profit or loss of Transnet. The 31 March 2020 annual financial statements and integrated report includes a fair review of the development and performance of the business and the position of Transnet, together with a description of the principal risks and uncertainties that Transnet faces.
PS MolefeChairperson
PPJ DerbyGroup Chief Executive
NS DlaminiGroup Chief Financial Officer
29 September 2020Johannesburg

I hereby certify that in terms of section 88(2)(e) of the Companies Act, the Company has filed with the Companies and Intellectual Property Commission (CIPC) the required returns and notices for the year ended 31 March 2020, as required in terms of this Act, and that all such returns are true, correct and up to date.
S BopapeInterim Group Company Secretary
29 September 2020Johannesburg
5
Group Company Secretary certificate for the year ended 31 March 2020

6 Annual financial statementsIndependent auditor’s report
Independent auditor’s report to Parliament and the Shareholder – Minister of Public Enterprises on Transnet SOC Ltd
for the year ended 31 March 2020
Report on the audit of the consolidated and separate financial statementsQualified opinionWe have audited the consolidated and separate financial statements of Transnet SOC Ltd and its subsidiaries (the Group) set out on pages 26 to 129, which comprise the consolidated and separate statement of financial position as at 31 March 2020, and the consolidated and separate statement of profit or loss and other comprehensive income, statement of changes in equity and statement of cash flows for the year then ended, as well as the notes to the consolidated and separate financial statements, including a summary of significant accounting policies.
In our opinion, except for the possible effects of the matter described in the basis for qualified opinion section of our report, the consolidated and separate financial statements present fairly, in all material respects, the consolidated and separate financial position of the Group as at 31 March 2020, and their financial performance and cash flows for the year then ended in accordance with IFRS and the requirements of the PFMA and the Companies Act of South Africa.
Basis for qualified opinionIrregular expenditureThe public entity did not have adequate systems in place to identify and account for all irregular expenses as required by Section 55(2)(b)(i) of the PFMA. Payments made in the contravention of supply chain management requirements resulted in irregular expenditure that was not always identified and reported. As in the prior year, we were unable to determine the full extent of the understatement of irregular expenditure stated in note 39 of the consolidated and separate financial statements as it was impracticable to do so.
Context for the opinionWe conducted our audit in accordance with the International Standards on Auditing (ISAs). Our responsibilities under those standards are further described in the auditor’s responsibilities for the audit of the consolidated and separate financial statements section of this auditor’s report.
We are independent of the Group in accordance with section 290 and 291 of the Independent Regulatory Board for Auditors’ Code of professional conduct for Registered Auditors (Revised January 2018), parts 1 and 3 of the Independent Regulatory Board for Auditors’ Code of Professional Conduct for Registered Auditors (Revised November 2018) (together the IRBA Codes) and other independence requirements applicable to performing audits of financial statements in South Africa. We have fulfilled our other ethical responsibilities, as applicable in accordance with the IRBA Codes and in accordance with other ethical requirements applicable to performing audits in South Africa. The IRBA Codes are consistent with the corresponding sections of the International Ethics Standards Board for Accountants International Code of Ethics for Professional Accountants (including International Independence Standards) respectively.
We believe that the audit evidence we have obtained is sufficient and appropriate to provide a basis for our qualified opinion.
Key audit mattersKey audit matters are those matters that, in our professional judgement, were of most significance in our audit of the consolidated and separate financial statements of the current period. These matters were addressed in the context of our audit of the consolidated and separate financial statements as a whole, and in forming our opinion thereon, and we do not provide a separate opinion on these matters.
The following key audit matters relate to the consolidated and separate financial statements:

7
Key audit matters How our audit addressed the key audit matterRevaluation of infrastructure and operating assetsInfrastructure and operating assets are subsequently measured at revalued amounts. Revaluations are performed with sufficient regularity such that the carrying amount does not differ materially from that which would be determined using fair values at the end of the reporting period.
The Group applies the following valuation techniques for the below in revaluating its assets:
Rail infrastructure• Depreciated optimised replacement cost• Discounted cash flows
Port infrastructure• Depreciated optimised replacement cost• Discounted cash flows
Port operating assets• Depreciated optimised replacement cost• Discounted cash flows
Pipeline networks• Modern equivalent asset value• Discounted cash flows
Management assesses the reasonableness of these fair values determined using the different techniques and selects the point within the range that is most representative of the fair value of the assets in the circumstances.
For the rail infrastructure and port infrastructure assets, the discounted cash flow (DCF) calculations were performed by management for these assets in order to assess the range most representative of the fair value of the various applicable Transnet cash generating units.
For the port operating assets, the assets were revalued in terms of the depreciated optimised replacement costs and the pipelines assets were revalued based on an index valuation.
These values represent the future cash flows of the relevant operating divisions business, discounted at the prevailing after tax WACC rate for each operating division.
Refer to note 9 of the consolidated and separate financial statements for further details.
This area was significant to our audit due to the materiality of the carrying amount of the assets to which the revaluation adjustments have been allocated. There are significant management judgements and assumptions involved in performing the revaluation tests.
With the exception of port operating assets, no formal revaluation was performed by independent experts in the current year in line with the Group’s accounting policy which requires these to be performed on a three-year cycle. During the interim period, indices are applied, where appropriate. We obtained audit evidence as to management’s assumptions used in the DCF model, and identified the most significant assumptions as:• Future cash flow forecasts.• Terminal growth rate; and• Discount rate (weighted average cost of capital (WACC)).
As indicated in note 9 of the consolidated and separate financial statements, the Group’s discounted cash flow (DCF) model is the most sensitive to these assumptions.
We utilised our valuations expertise to assess the integrity of the DCF models. For the key inputs to the models we critically assessed their reasonableness pertaining to the following:• We assessed the mathematical accuracy of the DCF models
and agreed the critical inputs of the model to the 2020/21 corporate plan of the Group that was approved by the Transnet Board;
• We assessed the reasonableness of the projected volumes to be railed, expected future tariff increases, the current capacity of the infrastructure networks, projected future sustainable capital expenditure to maintain the current capacity and the terminal growth rate to achieve the current network capacity;
• Management assumed real discount rates as disclosed in note 9 of the consolidated and separate financial statements. We independently calculated the discount rates, taking into account independently obtained data to ensure that the discount rates are within an acceptable range; and
• We assessed and evaluated management’s basis for the assumptions used. In respect of the budgeting process, we compared the current year actual results with the 2020/21 corporate plan. This was done to assess that the 2020 actual results were within reasonable ranges compared to the latest estimates included in the 2020/21 corporate plan adjusted to take into account the expected effect of Covid-19.
The revaluations of port operating assets and pipeline networks were performed by management’s experts.• We evaluated the judgements applied in determining the fair
values, including the model, methods and significant assumptions used; and
• Furthermore, we tested a selection of data inputs and confirmed these against appropriate supporting documents to verify the accuracy, completeness and relevance of such inputs.

8 Annual financial statementsIndependent auditor’s report
Key audit matters How our audit addressed the key audit matterGoing concern assessment due to Covid-19 PandemicOn 15 March 2020, a national state of disaster was declared in South Africa due to the Covid-19 pandemic and subsequently, on 26 March 2020, a national lockdown became effective for all South African citizens and businesses. This national lockdown was extended until 30 April 2020. On 1 May 2020 a risk-adjusted phased in approach of economic activity was implemented and promulgated in terms of the Disaster Management Act of South Africa, 2002 (Act 57 of 2002).
The pandemic required management to exercise significant judgement in the going concern assessment, through the preparation of forecasts, due to the Covid-19 pandemic and lock down.
The forecasts incorporate an element of uncertainty due to the pandemic and is used by the Group to conclude that no material uncertainty exists for the Group.
Refer to the impact of Covid-19 on the annual financial statements included under critical judgements and estimates in the accounting policiesof the financial statements indicating the Group’s ability to continue as a going concern for the foreseeable future. In making the assessment, management considered and evaluated the following:• Financial performance and projections. • Solvency and liquidity considerations. • Current litigation matters. • Contingent liabilities and post balance sheet events; and • Counter party credit risk.
The forecasts and critical judgements applied to such forecasts, which are used in management’s going concern assessment, were evaluated and tested for reasonability through the performance of the following procedures:
The forecasts used in management’s going concern assessment were evaluated and tested for reasonability through the performance of the following procedures:• Comparing the forecast to actual results after year end to
evaluate whether the impact of the pandemic and lock down have been factored into the forecast.
• Evaluating the forecast against historical results for the entities to determine whether the forecasted information is reliable.
• Determined whether there is adequate support for the assumptions underlying the forecasts.
• Performed an analysis of the forecasts and the future outcomes of events or conditions in the evaluation of management’s plans for future actions.
• We evaluated the solvency and liquidity position of the Group at year end and at the end of the forecast period.
• We further evaluated the cash position of the Group and the ability to secure funding as well as how this ability was affected by the National lock-down in order to critically assess whether it can meet its obligations as they fall due.
Allowance for expected credit losses (ECL) on trade receivables from contracts with customersThe Group applies the simplified approach in IFRS 9 in measuring expected credit losses which uses a lifetime ECLs allowance for all trade and lease receivables. To measure the ECLs, trade and lease receivables are grouped based on shared credit risk characteristics and the days past due.
The expected loss rates are based on the payment profiles of customers over a 5-year period and the corresponding historical credit losses experienced within this period. The historical loss rates are adjusted to reflect current and forward-looking information on factors affecting the ability of the customers to settle the receivables. This includes the customer’s credit risk profile, including their latest credit scores, the general macroeconomic conditions as well as industry sector-specific conditions affecting the Group’s customers.
Due to the complexity in the application of the requirements of IFRS 9 and the magnitude of the allowance expected credit losses on trade receivables from contracts with customers and disclosed in note 18 to the consolidated and separate financial statements, the ECL provision requires management to make significant judgements and estimates. We therefore consider there to be a significant risk of material misstatement due to fraud or error and short comings identified in the ECL model used to calculate Transnet’s ECL provision and thus a key audit matter.
We performed a comprehensive technical review on the application of the simplified approach that was used in measuring expected credit losses against the requirements of IFRS 9.
We assessed the judgements and estimates applied by management against our understanding of current market practice and conditions.
We obtained an understanding of management’s process and considered the reasonableness of receivables that have been grouped together based on similar credit characteristics and the accuracy of calculations used in the separate expected loss provision matrix has been calculated for each of the categories based on the net loss history associated to the specific category of receivable.
We independently recalculated the exposure of default (EAD) and loss given default (LGD) per debtor category.
We analysed the receivable’s categories in detail and considered the method used to categorise each debtor for consistent application. Our assessment took into account that a significant portion of the provision was relating to specific balances where management has provided in full for long outstanding balances.
We performed a review on disclosures provided relating to ECL provisions and we were satisfied that those disclosures are sufficient.
Independent auditor’s report to Parliament and the Shareholder – Minister of Public Enterprises on Transnet SOC Ltd
for the year ended 31 March 2020

9
Responsibilities of the accounting authority for the consolidated and separate financial statementsThe board of directors, which constitutes the accounting authority, is responsible for the preparation and fair presentation of the consolidated and separate financial statements in accordance with IFRS and the requirements of the Companies Act and PFMA, and for such internal controls as the accounting authority determines are necessary to enable the preparation of consolidated and separate financial statements that are free from material misstatement, whether due to fraud or error.
In preparing the consolidated and separate financial statements, the accounting authority is responsible for assessing the Group’s ability to continue as a going concern, disclosing, as applicable, matters relating to going concern and using the going-concern basis of accounting unless the appropriate governance structure either intends to liquidate the Group or to cease operations or has no realistic alternative but to do so.
Auditor’s responsibilities for the audit of the consolidated and separate financial statementsOur objectives are to obtain reasonable assurance about whether the consolidated and separate financial statements as a whole are free from material misstatement, whether due to fraud or error, and to issue an auditor’s report that includes our opinion. Reasonable assurance is a high level of assurance but is not a guarantee that an audit conducted in accordance with the ISAs will always detect a material misstatement when it exists. Misstatements can arise from fraud or error and are considered material if, individually or in aggregate, they could reasonably be expected to influence the economic decisions of users taken on the basis of these consolidated and separate financial statements.
A further description of our responsibilities for the audit of the consolidated and separate financial statements is included in the annexure to this auditor’s report.
Report on other legal and regulatory requirementsIn accordance with our responsibilities in terms of sections 44(2) and 44(3) of the Auditing Profession Act, we report that we have identified a reportable irregularity in terms of the Auditing Profession Act. We have reported such matter to the Independent Regulatory Board for Auditors. The matters pertaining to the reportable irregularity have been described in note 40 of the consolidated and separate financial statements.
Report on the audit of the annual performance reportIntroduction and scopeIn accordance with the Public Audit Act of South Africa, 2004 (Act No. 25 of 2004) (PAA) and the general notice issued in terms thereof, we have a responsibility to report on the usefulness and reliability of the reported performance information against predetermined objectives for selected key performance areas presented in the performance in terms of the Shareholder’s Compact section of the report of the directors. We performed procedures to identify findings but not to gather evidence to express assurance.
Our procedures address the reported performance information, which must be based on the approved performance planning documents of the public entity. We have not evaluated the completeness and appropriateness of the performance indicators included in the planning documents. Our procedures do not examine whether the actions taken by the public entity enabled service delivery. Our procedures also did not extend to any disclosures or assertions relating to planned performance strategies and information in respect of future periods that may be included as part of the reported performance information. Accordingly, our findings do not extend to these matters.
We evaluated the usefulness and reliability of the reported performance information in accordance with the criteria developed from the performance management and reporting framework, as defined in the general notice, for the following key performance areas presented in the performance in terms of the Shareholder’s Compact section of the report of the directors of the public entity for the year ended 31 March 2020:
Key performance area
Page in the report of the
directors
Annexure C – Capital programmes and Strategic Initiatives 24
We performed procedures to determine whether the reported performance information was properly presented and whether performance was consistent with the approved performance planning documents. We performed further procedures to determine whether the indicators and related targets were measurable and relevant, and assessed the reliability of the reported performance information to determine whether it was valid, accurate and complete.We did not identify any material findings on the usefulness and reliability of the reported performance information for this objective:• Annexure C – Capital programmes and Strategic
Initiatives

10 Annual financial statementsIndependent auditor’s report
Other mattersWe draw attention to the matters below. Our opinion is not modified in respect of these matters.
Achievement of planned targetsRefer to the performance in terms of the Shareholder’s Compact section of the report of the directors on pages 22 to 25 for information on the achievement of planned targets for the year.
Adjustment of material misstatementsWe identified material misstatements in the Shareholder’s Compact section of the report of the directors submitted for auditing. These material misstatements were on the reported performance information of: Annexure C – Capital programmes and Strategic Initiatives. As management subsequently corrected this misstatement, we did not raise any material findings on the usefulness and reliability of the reported performance information.
Report on the audit of compliance with legislationIntroduction and scopeIn accordance with the PAA and the general notice issued in terms thereof, we have a responsibility to report material findings on the public entity’s compliance with specific matters in key legislation. We performed procedures to identify findings but not to gather evidence to express assurance.
The material findings on compliance with specific matters in key legislations are as follows:
Expenditure managementIrregular expenditure Effective and appropriate steps were not taken to prevent irregular expenditure, as required by section 51(1)(b)(ii) of the PFMA. As reported in the basis for the qualified opinion the full extent of the value of irregular expenditure disclosed in note 39 of the consolidated and separate financial statements could not be quantified. The majority of the irregular expenditure disclosed in the financial statements was caused by non-compliance to the Preferential Procurement Policy Framework Act and its regulations.
Fruitless and wasteful expenditureEffective steps were not taken to prevent fruitless and wasteful expenditure amounting to R108 million (2019: R 484 million), as disclosed in note 39 of the consolidated and separate financial statements, as
required by section 51(1)(b)(ii) of the PFMA. The majority of the fruitless and wasteful expenditure was caused by poor contract management and inappropriate delegation of authority.
Procurement and contract managementSufficient appropriate audit evidence could not be obtained for three contracts that were awarded in accordance with the legislative requirements as management indicated that for one of the contracts the information was requested from a storage service provider but documents could not be located and for the other two contracts the information could not be found. Similar non-compliance was also reported in the prior year.
Some of the goods, works or service were not procured through a procurement process which is fair, equitable, transparent and competitive, as required by section 51(1)(a)(iii) of the PFMA. Similar non-compliance was also reported in the prior year.
Some of the contracts and quotations were awarded to bidders based on preference points that were not allocated and calculated in accordance with the requirements of the Preferential Procurement Policy Framework Act of South Africa, 2000 (Act No. 5 of 2000) and its regulations. Similar non-compliance was also reported in the prior year.
Some of the tenders which achieved the minimum qualifying score for functionality criteria were not evaluated further in accordance with the 2017 preferential procurement regulation 5(7). Similar non-compliance was also reported in the prior year.
Some of the contracts and quotations were awarded to bidders based on pre-qualification criteria that differed from those stipulated in the original invitation for bidding and quotations, in contravention of the 2017 preferential procurement regulation 4(1) and 4(2). Similar non-compliance was also reported in the prior year.
Tender requirements for certain of the contracts above R30 million did not include a condition for mandatory subcontracting to advance designated groups, as required by the 2017 preferential procurement regulation 9(1). Similar non-compliance was also reported in the prior year.
Some of the construction contracts were awarded to contractors that were not registered with the Construction Industry Development Board and/or did not qualify for the contract in accordance with section 18(1) of the CIDB Act and CIDB regulations 17 and/or 25(7A). Similar non-compliance was also reported in the prior year.
Independent auditor’s report to Parliament and the Shareholder – Minister of Public Enterprises on Transnet SOC Ltd
for the year ended 31 March 2020
11
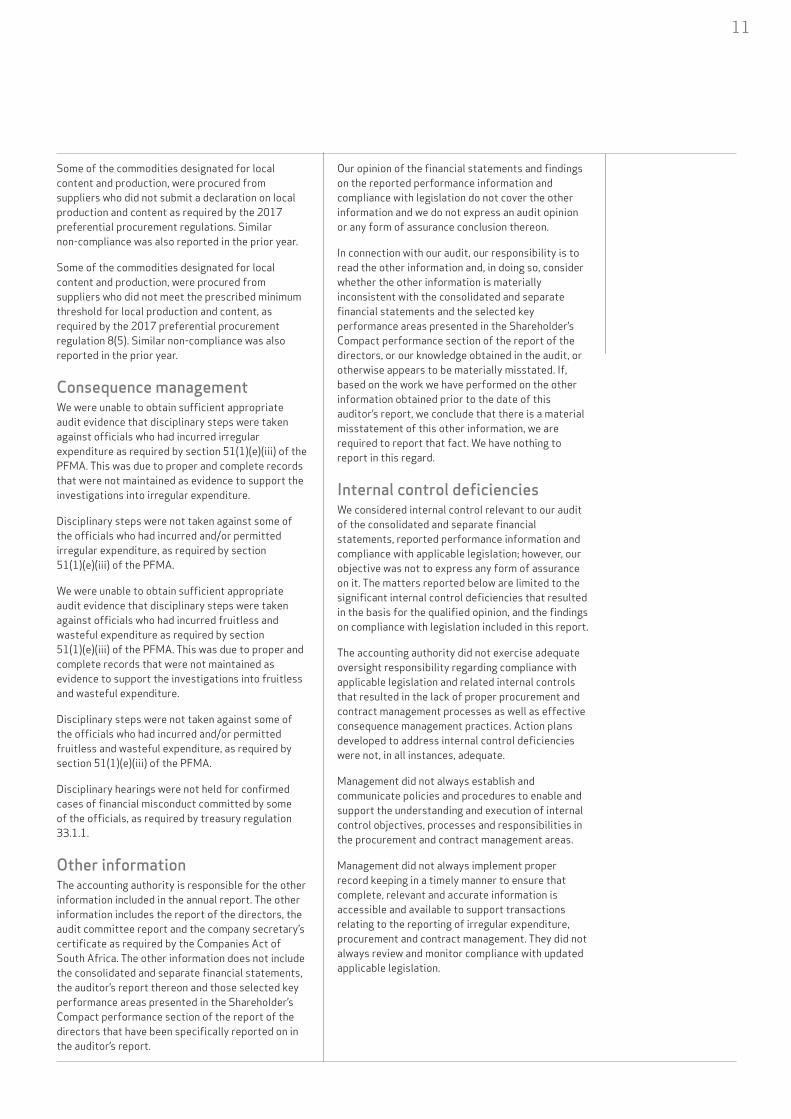
Some of the commodities designated for local content and production, were procured from suppliers who did not submit a declaration on local production and content as required by the 2017 preferential procurement regulations. Similar non-compliance was also reported in the prior year.
Some of the commodities designated for local content and production, were procured from suppliers who did not meet the prescribed minimum threshold for local production and content, as required by the 2017 preferential procurement regulation 8(5). Similar non-compliance was also reported in the prior year.
Consequence managementWe were unable to obtain sufficient appropriate audit evidence that disciplinary steps were taken against officials who had incurred irregular expenditure as required by section 51(1)(e)(iii) of the PFMA. This was due to proper and complete records that were not maintained as evidence to support the investigations into irregular expenditure.
Disciplinary steps were not taken against some of the officials who had incurred and/or permitted irregular expenditure, as required by section 51(1)(e)(iii) of the PFMA.
We were unable to obtain sufficient appropriate audit evidence that disciplinary steps were taken against officials who had incurred fruitless and wasteful expenditure as required by section 51(1)(e)(iii) of the PFMA. This was due to proper and complete records that were not maintained as evidence to support the investigations into fruitless and wasteful expenditure.
Disciplinary steps were not taken against some of the officials who had incurred and/or permitted fruitless and wasteful expenditure, as required by section 51(1)(e)(iii) of the PFMA.
Disciplinary hearings were not held for confirmed cases of financial misconduct committed by some of the officials, as required by treasury regulation 33.1.1.
Other information The accounting authority is responsible for the other information included in the annual report. The other information includes the report of the directors, the audit committee report and the company secretary’s certificate as required by the Companies Act of South Africa. The other information does not include the consolidated and separate financial statements, the auditor’s report thereon and those selected key performance areas presented in the Shareholder’s Compact performance section of the report of the directors that have been specifically reported on in the auditor’s report.
Our opinion of the financial statements and findings on the reported performance information and compliance with legislation do not cover the other information and we do not express an audit opinion or any form of assurance conclusion thereon.
In connection with our audit, our responsibility is to read the other information and, in doing so, consider whether the other information is materially inconsistent with the consolidated and separate financial statements and the selected key performance areas presented in the Shareholder’s Compact performance section of the report of the directors, or our knowledge obtained in the audit, or otherwise appears to be materially misstated. If, based on the work we have performed on the other information obtained prior to the date of this auditor’s report, we conclude that there is a material misstatement of this other information, we are required to report that fact. We have nothing to report in this regard.
Internal control deficienciesWe considered internal control relevant to our audit of the consolidated and separate financial statements, reported performance information and compliance with applicable legislation; however, our objective was not to express any form of assurance on it. The matters reported below are limited to the significant internal control deficiencies that resulted in the basis for the qualified opinion, and the findings on compliance with legislation included in this report.
The accounting authority did not exercise adequate oversight responsibility regarding compliance with applicable legislation and related internal controls that resulted in the lack of proper procurement and contract management processes as well as effective consequence management practices. Action plans developed to address internal control deficiencies were not, in all instances, adequate.
Management did not always establish and communicate policies and procedures to enable and support the understanding and execution of internal control objectives, processes and responsibilities in the procurement and contract management areas.
Management did not always implement proper record keeping in a timely manner to ensure that complete, relevant and accurate information is accessible and available to support transactions relating to the reporting of irregular expenditure, procurement and contract management. They did not always review and monitor compliance with updated applicable legislation.

12 Annual financial statementsIndependent auditor’s report
Management did not implement adequate controls over daily and monthly processing and reconciling of transactions, which resulted in the material adjustment of irregular expenditure on the consolidated and separate financial statements and the adjustment of material misstatements in the performance report.
The accounting authority did not implement appropriate risk management activities to ensure that risk assessments are conducted and that adequate risk strategies are developed and monitored to address specific risks relating to the identification and reporting of irregular expenditure and compliance specifically pertaining to the supply chain management environment.
Those charged with governance did not always ensure that the audit committee promoted the evaluation and the monitoring of responses to risks and provided oversight on the effectiveness of the internal control environment, specifically relating to the identification and reporting of irregular expenditure, and compliance with legislation pertaining to the supply chain management environment, therefore not promoting accountability.
Other reportsWe draw attention to the following engagements conducted by various parties that have or could potentially have a material impact on the matters reported in the Group’s financial, performance and compliance related matters. The reports noted do not form part of our opinion on the consolidated and separate financial statements or our findings on the reported performance information or compliance with legislation..
Matters under investigation During the financial year under review the regulatory authorities and the accounting authority conducted investigations into alleged irregularities, fraud and corruption within the procurement environment and other areas of the entity. As at the reporting date, some of these investigations were still ongoing. As disclosed in note 39 to the consolidated and separate financial statements, various matters are reported to be under investigation.
Agreed-upon procedure engagementsAgreed-upon procedure engagements were performed on the following:• National Treasury consolidation template that
covered the period from 1 April 2019 to 31 March 2020.
• Sustainable development review process that covered the period 1 April 2019 to 31 March 2020.
Independent auditor’s report to Parliament and the Shareholder – Minister of Public Enterprises on Transnet SOC Ltd
for the year ended 31 March 2020
Auditor’s tenureIn terms of the IRBA rule published in Government Gazette Number 39475 dated 4 December 2015, we report that SizweNtsalubaGobodo Grant Thornton have been the auditors of Transnet SOC Ltd for eight years and the designated auditor, Mr Alex Philippou, for three years.
SizweNtsalubaGobodo Grant Thornton Inc. Per: Alex Philippou CA(SA)DirectorRegistered Auditor
20 Morris Street EastWoodmead
16 October 2020Johannesburg

13
As part of an audit in accordance with the ISAs, we exercise professional judgement and maintain professional scepticism throughout our audit of the consolidated and separate financial statements, and the procedures performed on reported performance information for selected key performance areas and on the Group’s compliance with respect to the selected subject matters.
Financial statementsIn addition to our responsibility for the audit of the consolidated and separate financial statements as described in the auditor’s report, we also:• Identify and assess the risks of material
misstatement of the consolidated and separate financial statements, whether due to fraud or error, design and perform audit procedures responsive to those risks, and obtain audit evidence that is sufficient and appropriate to provide a basis for our opinion. The risk of not detecting a material misstatement resulting from fraud is higher than for one resulting from error, as fraud may involve collusion, forgery, intentional omissions, misrepresentations, or the override of internal control.
• Obtain an understanding of internal controls relevant to the audit to design audit procedures that are appropriate in the circumstances, but not for the purpose of expressing an opinion on the effectiveness of the Group’s internal controls.
• Evaluate the appropriateness of accounting policies used and the reasonableness of accounting estimates and related disclosures made by the accounting authority.
• Conclude on the appropriateness of the accounting authority’s use of the going-concern basis of accounting in the preparation of the financial statements. We also conclude, based on the audit evidence obtained, whether a material uncertainty exists related to events or conditions that may cast significant doubt on the Group’s ability to continue as a going concern. If we conclude that a material uncertainty exists, we are required to draw attention in our auditor’s report to the related disclosures in the financial statements about the material uncertainty or, if such disclosures are inadequate, to modify the opinion on the financial statements. Our conclusions are based on the information available at the date of the auditor’s report. However, future events or conditions may cause the Group to cease to continue as a going concern.
Annexure – Auditor’s responsibility for the audit
for the year ended 31 March 2020
• Evaluate the overall presentation, structure and content of the consolidated and separate financial statements, including the disclosures, and whether the financial statements represent the underlying transactions and events in a manner that achieves fair presentation.
• Obtain sufficient appropriate audit evidence regarding the financial information of the entities or business activities within the Group to express an opinion on the consolidated and separate financial statements. We are responsible for the direction, supervision and performance of the Group audit. We remain solely responsible for our audit opinion.
Communication with those charged with governance• We communicate with the accounting authority
regarding, among other matters, the planned scope and timing of the audit and significant audit findings, including any significant deficiencies in internal control that we identify during our audit.
• We also provide the accounting authority with a statement that we have complied with relevant ethical requirements regarding independence, and to communicate with them all relationships and other matters that may reasonably be thought to bear on our independence, and where applicable, related safeguards.
• From the matters communicated with the accounting authority, we determine those matters that were of most significance in the audit of the consolidated and separate financial statements of the current period and are therefore the key audit matters. We describe these matters in our auditor’s report unless law or regulation precludes public disclosure about the matter or when, in extremely rare circumstances, we determine that a matter should not be communicated in our report because the adverse consequences of doing so would reasonably be expected to outweigh the public interest benefits of such communication.

14 Annual financial statementsAudit Committee report
Audit Committee report for the year ended 31 March 2020
MandateThe Audit Committee presents this report in terms of the requirements of the PFMA, section 94(7)(f) of the Companies Act and in accordance with the King IV Report on Corporate Governance for South Africa 2016, for the financial year ended 31 March 2020.
The role of the committee is defined in the Audit Committee mandate, which is approved by the Board. It covers, among others, its statutory duties and assistance to the Board with the oversight of financial and non-financial reporting and disclosure, the internal control system, risk management, internal and external audit functions and combined assurance, including information technology governance.
Execution of statutory dutiesIn the conduct of its duties the committee has, inter alia, reviewed the following functions:
Oversight of financial and non-financial reporting and disclosureThe committee considered the annual financial statements for fair presentation with the relevant requirements of the PFMA, Companies Act and IFRS for adequacy, reliability and accuracy of financial and non-financial information provided by management and risks that may impact the integrity of the report. The committee also focusses on disclosure of sustainability information in the report to ensure that it is reliable and does not conflict with the financial information and the expertise, resources and experience of the finance function.
Covid-19The committee had regular engagements with management since the announcements made by the President. Specific focus was applied to cash flow management and liquidity and the impact on financial performance. Forecasts were done at the hand of specific scenarios, which is reported in more detail in the integrated report.
Going-concern assumptionThe committee concurs with the view expressed by management and evaluated by external audit that the adoption of the going concern assumption in the preparation of the annual financial statements is appropriate.
In performing their going-concern assessment, members of the committee have considered the current year audit qualification and, due to the nature of the qualification being similar to that of the prior financial year (related to the accuracy and completeness of reported irregular expenditure), do not expect any impact on the going concern ability of the Company.
Furthermore, the committee considered the robustness of budgets and business results, cash flow projections, cost-saving opportunities to reduce any impact of revenue shortfall, the cost of capital projects and the funding plan, which factored in the potential impact of Covid-19 on operations.
Shareholder’s Compact performanceThe committee reviewed the performance information presented. There were no material findings reported on in the current financial year. The effectiveness of controls implemented from the prior year and more in depth interaction with external audit from an understanding perspective contributed to the positive results in the current financial period. Overall performance though, against the Shareholder’s Compact, requires significant improvement.
Internal control, risk management and compliance with legal and regulatory provisionsThe committee considered the effectiveness of internal control systems and governance processes, reviewed legal matters that could have a material impact on the Company, the Company’s risks and mitigation plans, and the effectiveness of the entity’s compliance with legal and regulatory requirements.
Internal control assessmentBased on the independent and objective assurance reports from the Company’s internal and external auditors, as well as representations by management, the Audit Committee is of the opinion that, overall:• Transnet’s corporate governance requires
moderate, and in some areas, significant improvement; and
• Supply chain management in Transnet remains problematic. The process to identify and accurately report all irregular expenditure is largely manual in nature and continues to result in reporting inaccuracies. The resultant concern relating to the completeness of the reported irregular expenditure in note 39 of the annual financial statements has, once again, resulted in the external auditors issuing a qualified opinion for the year under review.
Transnet Internal Audit’s overall opinion for the current financial year, which is issued in line with the requirements of Standard 2450, is that the governance, risk management and internal control processes require improvement. While management has made good progress in implementing agreed remedial action plans, significant effort is still required to embed these plans and ensure achievement of a strengthened and sustainable overall control environment.

15
Irregular expenditureThis is a matter that in the past few years has resulted in a qualification of the annual financial statements. Management made a special effort to improve on PFMA non-compliance and interpretation issues from the past with R9 965 million reported for irregular expenditure in the current year of which only R394 million related to expenditure on contracts entered into in the current year. Specific attention of the reader is drawn to the executive having agreed a final outcome of the supplier development matter raised in the previous year. Although further submissions have been made to National Treasury, the financial statements now reflect the initial ruling by National Treasury regarding this matter. More detailed disclosure on non-compliance with the PFMA and the associated consequence management is set out in note 39 of the annual financial statements.
Reportable irregularityThe committee considered the alleged reportable irregularity and engaged management and internal assurance providers to supplement controls to avoid a recurrence of this instance. For further detail on the reportable irregularity, refer to note 40 of the annual financial statements.
Internal auditThe committee considered the internal audit charter, annual audit plan, alignment of the audit plan with Company risks, the independence and the effectiveness of the function, internal audit reports, management action plans and the coordination with external auditors.
The committee further reviewed and assessed the maturity and impact of combined and integrated assurance processes within Transnet. As part of improving these processes, the committee resolved to transfer the custodianship of combined and integrated assurance from Group Risk and Compliance to Transnet Internal Audit, thereby facilitating compliance with Treasury Regulations 27.2.6 and 27.2.9.
Mr B Kgomo was appointed as Chief Audit Executive on 1 June 2020. The committee and the Board expressed some concern in the area of internal audit. Under the new leadership the operating model and operating procedures will be revisited and the expectation is that a vast improvement in the quality of work will already become noticeable during the 2021 financial year.
External auditThe committee considered the appointment of the external auditors in terms of the Companies Act and other applicable requirements, external audit plan, the audit budget, the audit fee and terms of engagement of the external auditors.
The committee reviewed the independence and objectivity of the external auditors, and the accounting, sustainability and auditing concerns identified by the external auditors, including reportable irregularity.
This will be the final year of SizweNtsalubaGobodo Grant Thornton Inc. as external auditor with the Auditor-General of South Africa (AGSA) taking the role as external auditor, effective for the 2021 financial year external audit process. The committee wishes to thank SizweNtsalubaGobodo Grant Thornton Inc. for their support particularly in the past two years and specifically thank the lead partner Mr A Philippou. The committee welcomes the AGSA as the external auditors of Transnet and looks forward to a sound business relationship as the Group continues to execute the turnaround strategy to restore Transnet to a leading State-owned enterprise and contributor to the South African economy into the future.
Group Chief Financial OfficerTransnet appointed Ms NS Dlamini as Group Chief Financial Officer on 1 July 2020. Her appointment was part of a total restructure of the Group’s executive committee. The new team in place has already made an impact and with stability in key positions, the expectations are that the 2021 financial year will see further improvement in how the executive team delivers on its mandate. The Group was able to retain the services of Mr MD Gregg-Macdonald as Group Treasurer and the team now has a healthy balance of new leaders but also adequate Transnet experience in other layers of management.
Audit Committee composition and meeting attendanceThe Audit Committee comprises independent non-executive directors who are duly elected by the Shareholder Representative at the annual general meeting in line with legislative requirements. A total of 8 meetings were held during the year under review and all quorum requirements were met. The meetings and attendance records of the committee are reflected in the tables on page 16.

16 Annual financial statementsAudit Committee report
Schedule of attendance at meetings from 1 April to 30 June 2019
Directors29/4 28/5(SP)
Ms RJ Ganda* (Chairperson) ✓ ✓
Ms ME Letlape ✓ ✓
Mr AP Ramabulana ✓ ✓
Ms G Ramphaka ✓ ✓
Mr LL von Zeuner ✓ ✓
✓ Present.SP Special meeting.* Resigned with effect from 31 March 2020.
Schedule of attendance at meetings from 1 July to 30 September 2019
Directors20/8 19/9(SP) (SP)
MS RJ Ganda* (Chairperson) ✓ AMs ME Letlape ✓ ✓
Mr AP Ramabulana ✓ ✓
Ms G Ramphaka ✓ ✓
Mr LL von Zeuner A A✓ Present.A Apology.SP Special meeting.* Resigned with effect from 31 March 2020.
Schedule of attendance at meetings from 1 October to 31 December 2019
Directors22/10 8/11
(SP)MS RJ Ganda* (Chairperson) ✓ ✓
Ms ME Letlape ✓ ✓
Mr AP Ramabulana A ✓
Ms G Ramphaka ✓ ✓
Mr LL von Zeuner ✓ A✓ Present.A Apology.SP Special meeting.* Resigned with effect from 31 March 2020.
Audit Committee report for the year ended 31 March 2020
Schedule of attendance at meetings from 1 January to 31 March 2020
Directors11/2 23/3
(SP)MS RJ Ganda* (Chairperson) ✓ AMs ME Letlape ✓ ✓
Mr AP Ramabulana A ✓
Ms G Ramphaka ✓ ✓
Mr LL von Zeuner ✓ ✓
✓ Present.A Apology.SP Special meeting.* Resigned with effect from 31 March 2020.
The Group Chief Executive, the Chief Financial Officer, the Chief Audit Executive and other key executive management are required to attend all meetings of the Audit Committee. In addition, representatives from the office of the AGSA and the external auditors have a standing invitation to attend all committee meetings. The internal auditors, the external auditors and management are afforded individual closed sessions with the Audit Committee.
Recommendation of the annual financial statementsThe committee has evaluated the annual financial statements of Transnet for the year ended 31 March 2020 and, based on the information provided to it, considers that they comply, in all material respects, with the requirements of the Companies Act, the PFMA and IFRS. LL Von ZeunerChairperson of the Transnet Audit Committee
29 September 2020Johannesburg

17
1,3%INCREASE IN REVENUE
IntroductionThe directors submit their report, together with the Company and Group annual financial statements, for the year ended 31 March 2020.
Nature of businessTransnet is a public company, wholly owned by the Government of South Africa, and is the custodian of the country’s rail, ports and pipelines. Transnet is responsible for enabling the competitiveness, growth and development of the South African economy by delivering reliable freight transport and handling services that satisfy customer demand.
As the custodian of ports, rail and pipelines, Transnet has a responsibility to ensure the optimal development of the national freight system. Furthermore, as a responsible corporate citizen and key implementing agent of the developmental state, Transnet conducts its activities in order to optimise developmental outcomes, such as job creation, skills development, economic transformation, regional integration and industrial capability building.
Board of directorsThe composition of the Board of Directors at 31 March 2020, summary curricula vitae of the directors, key activities and decisions of the Board and its committees and performance evaluations are set out in the ‘abridged governance’ section of the integrated report. A separate, unabridged version of the governance report is also available online.
The remuneration and fees paid to directors are set out in note 38 of the annual financial statements.
Sadly, Advocate OM Motaung, passed away in September 2020. Advocate OM Motaung joined the Transnet Board in May 2018, and helped the Board navigate through a critical time in the Company’s history. The Transnet Board and employees wish his family strength and fortitude during this difficult time.
Performance for the reporting periodThe performance for the reporting period was characterised by a subdued economic environment. The South African economy entered a technical recession as real gross domestic product (GDP) contracted by 1,4% in the fourth quarter of 2019. Economic activity in the primary, secondary and tertiary sectors, all declined. The agricultural sector’s decline worsened from 4,5% in the third quarter to 7,6% in the fourth quarter of 2019, while the mining sector recovered by 1,8% in the fourth quarter of 2019 after contracting sharply by 6,1% in the preceding quarter.
The manufacturing sector contracted by 1,8% in the fourth quarter of 2019. Production decreased in 7 of the 10 manufacturing subsectors due to the impact of load-shedding, continued weak domestic demand, structural constraints and persistent low business confidence. Lower production in the motor vehicles,
parts and accessories and other transport equipment; wood and wood products; as well as food and beverages weighed the most on manufacturing output (SARB, 2020).
Transnet’s 2019/20FY performance was impacted by the lower than budgeted bulk commodities railed, as a result of the contraction in the mining sector and other variables that impacted performance.
• Group revenue grew by a marginal 1,3% year-on-year to R75,1 billion, due mainly to a weighted average tariff increase of 2,9% which was partially offset by a 1,3% decline in rail freight volumes and a 2,4% decline in port container throughput.
• Net operating expenses increased by 1,9% to R41,1 billion, (2019: R40,3 billion) with personnel costs increasing by 1,7% and energy costs increasing by 4,8%. Numerous cost-optimisation initiatives implemented throughout the Company aided cost containment, resulting in a R4,7 billion saving against planned costs. These initiatives included overtime management, reducing professional and consulting fees; rolling out programmes to measure the execution of condition-assessment versus time-based maintenance; and limiting discretionary costs relating to travel, printing, stationery and telecommunications.
• Earnings before interest, tax, depreciation and amortisation (EBITDA) increased by 0,7% to R34,0 billion (2019: R33,8 billion) with a decrease in the EBITDA margin to 45,3% (2019: 45,6%).
• Gearing is at 47,6%, and remains within the Transnet target <50% and well within the financial covenants contained in some loan agreements .
• Cash interest cover at 2,9 times reflects Transnet’s strong cash-generating capability, and is comfortably above the triggers in loan covenants.
• Capital investment of R18,6 billion, represent a 3,5% increase compared to the prior year.
Detailed commentary on the performance for the year is contained in the integrated report on pages 76 to 112.
Accounting policiesThe accounting policies applied in the preparation of the annual financial statements for the year ended 31 March 2020 are in accordance with IFRS and are consistent with those applied in the prior year.
Judgements made by management in the application of IFRS that have a significant impact on the annual financial statements are disclosed in the accompanying notes to the annual financial statements.
Share capitalThere has been no change in the authorised or issued share capital of the Company during the year. The issued share capital of the Company is 12 660 986 310 ordinary shares of R1 each. Further details pertaining to the Company’s share capital are contained in note 21 to the annual financial statements.
Report of the directors for the year ended 31 March 2020

18 Annual financial statementsReport of the directors
R31,1 BILLION
NET DEVALUATION
Report of the directors for the year ended 31 March 2020
DividendDistributions to the Shareholder are governed in detail in paragraph 28 of the Company’s Memorandum of Incorporation in line with the requirements of section 46 of the Companies Act.
The key considerations in determining a declaration of dividends are:• Approval by the Shareholder after Transnet’s
Board resolution for a distribution;• The Corporate Plan and strategic objectives,
including investments and expenditures in fulfilling the Company’s Shareholder mandate;
• The solvency and liquidity test immediately after completing the proposed distribution; and
• Key financial requirements and ratios should be sustained, including current and future gearing, cash interest cover, loan covenants requirements and credit ratings.
The Company has assessed the following factors in arriving at the decision to not declare a dividend:• Based on the 2021 Corporate Plan, Transnet will
be in a net borrowing position for the next five years;
• The cumulative impact of dividend distribution on Transnet’s solvency and liquidity ratios in relation to trade-offs against the funding of capital investment versus dividends as a net borrower.
• The Company has an intensive capital investment programme given its strategy;
• The funding of strategic priorities in the Corporate Plan, including but not limited to, enterprise development and social investments;
• Transnet’s current sub-investment grade credit rating, may increase the cost of borrowing; and
• The Company has limited headroom to absorb cash shortfalls arising from the Covid-19 nationwide lockdown.
The declaration of dividend is reviewed annually and is subject to the approval of the Shareholder Representative at the annual general meeting.
Divisions, subsidiaries and associate companiesA detailed list of subsidiaries and equity-accounted investees is contained in note 37 to the annual financial statements.
Revaluation of property, plant and equipmentThe Group assesses the revaluation of its rail infrastructure, port infrastructure and pipeline networks in line with its accounting policy, which requires an independent valuation every three years, as well as index or discounted cash flow valuations in the intervening years. As at 31 March 2020, the rail
infrastructure assets were revalued based on the discounted cash flows generated by the assets in order to ensure that they are not carried at amounts in excess of their recoverable amount. An external index valuation was performed for the pipeline networks by an independent firm of professional valuers, on the basis of the modern equivalent net asset value. Port infrastructure assets were revalued based on the discounted cash flows method and an independent firm of professional valuers, performed a valuation of port operating assets as at 31 March 2020 on the basis of the depreciated replacement cost.
Rail infrastructureThe carrying value of rail infrastructure was devalued by R14,9 billion (2019: R23,2 billion devaluation).
Port facilitiesThe carrying value of port infrastructure was devalued by R17,0 billion (2019: R3,1 billion devaluation) and port operating assets were revalued by R328 million (2019: R465 million devaluation).
Pipeline networksThe carrying value of pipeline networks was revalued by R427 million (2019: R698 million revaluation).
Fair valuation of investment propertyThe Group fair values its investment property on an annual basis, in terms of its accounting policy, and in compliance with IAS 40 Investment Property. The fair value of the Group’s investment properties at 31 March 2020 was arrived at on the basis of valuations carried out at that date by Transnet Property valuers, applying principles consistent with the prior year. The valuations were arrived at by capitalising the first year’s normalised net operating income at a market-derived capitalisation rate.
These processes resulted in a fair value increase in investment property of R681 million (2019: R3,2 billion increase).
Capital expenditure and commitmentsThe Company continued to execute its infrastructure investment programme, spending R18,6 billion for the year (2019: R17,9 billion).
The capital investment for the year comprises R3,5 billion invested in the expansion of infrastructure and equipment and R15,1 billion invested to maintain capacity in the rail, pipelines and ports divisions.

19
3,5%INCREASE IN CAPITAL
INVESTMENT
accelerated repayment of loans due to credit rating downgrades, agreed to waive such right.
The directors have considered the impact of the current year audit qualification and, due to the nature of the qualification being similar to that of the prior financial year (related to the accuracy and completeness of reported irregular expenditure), do not expect any impact on the going concern ability of the Company.
The coronavirus pandemic has had a significant impact on the global economy, adversely impacting the Group’s operations, customers and employees. Based on the magnitude of the pandemic and its potential impact on the annual financial statements, management conducted a review of the possible financial effects the pandemic could have on the Group’s ability to continue as a going concern, as well as on the carrying amounts of the assets and liabilities reported in the financial statements. Refer to the critical estimates and judgements section of the accounting policies on pages 26 to 29 for more detail.
FundingAs at 31 March 2020, the Company’s total borrowings amounted to R133,3 billion (2019: R127,7 billion), an increase of R5,6 billion compared to the prior year, due to new debt raised and foreign exchange rate movements. The increase in the value of debt arising from movements in exchange rates, is offset by a corresponding increase in net derivative financial assets, as the exposure to foreign currency is fully hedged.
In the period under review, the Group raised funding of R10,4 billion through the issuance of bond and commercial paper (under the Domestic Medium-Term Note (DMTN) programme) and the execution of bilateral loans without the provision of Government guarantees.
The decision to limit future capital expenditure to 80% of cash generated from operations, together with the expected cost compression through improved procurement processes, will ensure a reduction in forward looking debt levels.
Credit ratingsTransnet has two officially recognised rating agencies: S&P Global Ratings (S&P) and Moody’s Investors Service (Moody’s). Transnet’s credit rating at the date of issuing this report is depicted in the table below.
Further details regarding capital commitments are contained in note 30.1 to the annual financial statements.
Passenger Rail Agency of South Africa (Prasa)Prasa owed Transnet R2,0 billion at 31 March 2020 (2019: R1,8 billion), of which R552 million related to services provided during the year.
Given the long-term nature of the amounts outstanding, the settlement of these amounts has been escalated to the Departments of Transport and Public Enterprises, as well as National Treasury, for resolution. Transnet and Prasa ensure that their records reconcile on a monthly basis and have no material disputes.
The Group, through its Freight Rail division did not recognise R411,9 million of revenue billed to Prasa in accordance with IFRS 15 Revenue from Contracts with Customers as the collectability requirement was not met due to a history of late and non-payment by Prasa, as well as its subsequent placement under administration by the Minister of Transport on 9 December 2019. Transnet however, remains committed to working with Prasa in providing passenger rail services in South Africa.
South African Express Airways SOC LtdOn 29 December 2017, Transnet provided South African Express Airways SOC Ltd (SA Express) with a R222 million loan, as requested by the then Minister of Public Enterprises. To date, no interest or capital payments have been received from SA Express and the full balance (R260 million) was provided for as irrecoverable. The airline has been put into liquidation and Transnet has lodged a claim along with other creditors.
Going concernIn adopting the going concern assumption, the Board reviewed the Group’s performance for the year and considered the robustness of budgets and business results, cash flow projections for the 15 months ending 30 June 2021, cost-saving opportunities, the cost of capital projects and related optimisation opportunities and the funding plan.
The impact of the prior year audit qualification on loan agreements has been resolved with all affected funders having provided a waiver to Transnet. Similarly, all lenders that became entitled to guarantees or
Issuer rating Moody’s S&PForeign currency rating Ba1/negative outlook BB-/stable outlookLocal currency rating Ba1/negative outlook BB-/stable outlookNational scale rating (NSR) – long and short term Aa2.za/P-1.za zaAA/zaA-1+BCA/SACP ba2/negative outlook bb-/stable outlook
Report of the directors for the year ended 31 March 2020
20 Annual financial statementsReport of the directors
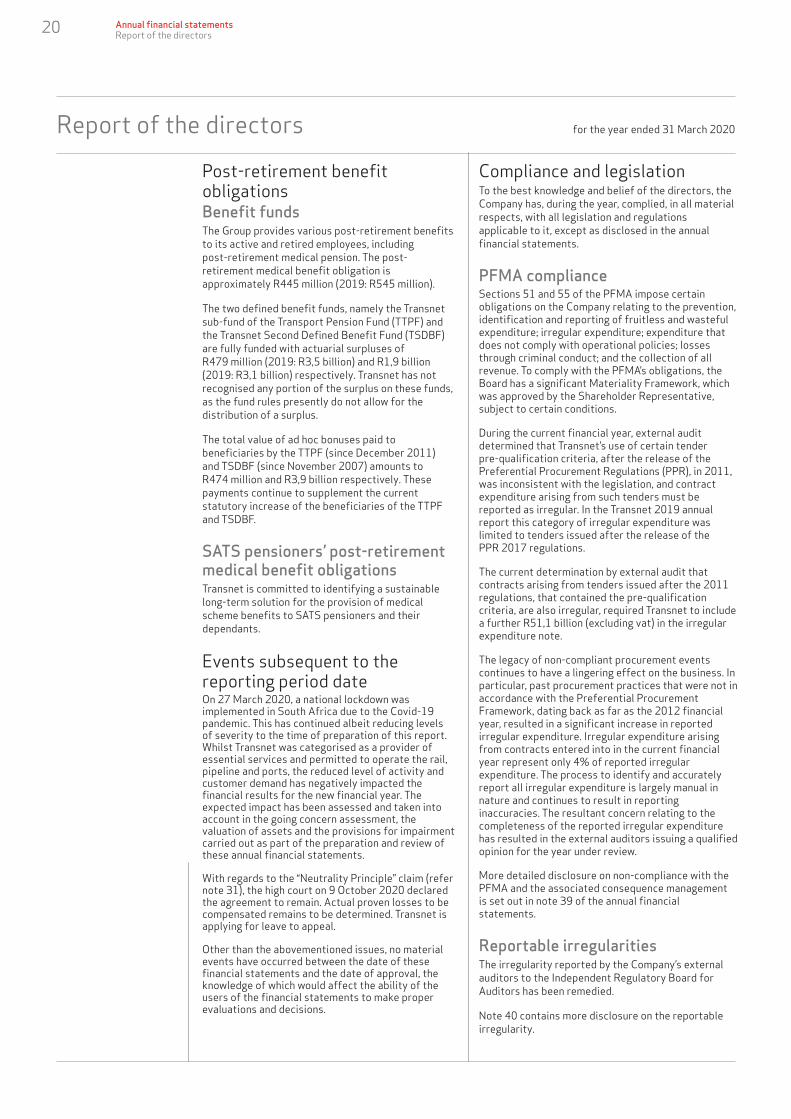
Post-retirement benefit obligationsBenefit fundsThe Group provides various post-retirement benefits to its active and retired employees, including post-retirement medical pension. The post-retirement medical benefit obligation is approximately R445 million (2019: R545 million).
The two defined benefit funds, namely the Transnet sub-fund of the Transport Pension Fund (TTPF) and the Transnet Second Defined Benefit Fund (TSDBF) are fully funded with actuarial surpluses of R479 million (2019: R3,5 billion) and R1,9 billion (2019: R3,1 billion) respectively. Transnet has not recognised any portion of the surplus on these funds, as the fund rules presently do not allow for the distribution of a surplus.
The total value of ad hoc bonuses paid to beneficiaries by the TTPF (since December 2011) and TSDBF (since November 2007) amounts to R474 million and R3,9 billion respectively. These payments continue to supplement the current statutory increase of the beneficiaries of the TTPF and TSDBF.
SATS pensioners’ post-retirement medical benefit obligationsTransnet is committed to identifying a sustainable long-term solution for the provision of medical scheme benefits to SATS pensioners and their dependants.
Events subsequent to the reporting period dateOn 27 March 2020, a national lockdown was implemented in South Africa due to the Covid-19 pandemic. This has continued albeit reducing levels of severity to the time of preparation of this report. Whilst Transnet was categorised as a provider of essential services and permitted to operate the rail, pipeline and ports, the reduced level of activity and customer demand has negatively impacted the financial results for the new financial year. The expected impact has been assessed and taken into account in the going concern assessment, the valuation of assets and the provisions for impairment carried out as part of the preparation and review of these annual financial statements.
With regards to the “Neutrality Principle” claim (refer note 31), the high court on 9 October 2020 declared the agreement to remain. Actual proven losses to be compensated remains to be determined. Transnet is applying for leave to appeal.
Other than the abovementioned issues, no material events have occurred between the date of these financial statements and the date of approval, the knowledge of which would affect the ability of the users of the financial statements to make proper evaluations and decisions.
Compliance and legislationTo the best knowledge and belief of the directors, the Company has, during the year, complied, in all material respects, with all legislation and regulations applicable to it, except as disclosed in the annual financial statements.
PFMA complianceSections 51 and 55 of the PFMA impose certain obligations on the Company relating to the prevention, identification and reporting of fruitless and wasteful expenditure; irregular expenditure; expenditure that does not comply with operational policies; losses through criminal conduct; and the collection of all revenue. To comply with the PFMA’s obligations, the Board has a significant Materiality Framework, which was approved by the Shareholder Representative, subject to certain conditions.
During the current financial year, external audit determined that Transnet’s use of certain tender pre-qualification criteria, after the release of the Preferential Procurement Regulations (PPR), in 2011, was inconsistent with the legislation, and contract expenditure arising from such tenders must be reported as irregular. In the Transnet 2019 annual report this category of irregular expenditure was limited to tenders issued after the release of the PPR 2017 regulations.
The current determination by external audit that contracts arising from tenders issued after the 2011 regulations, that contained the pre-qualification criteria, are also irregular, required Transnet to include a further R51,1 billion (excluding vat) in the irregular expenditure note.
The legacy of non-compliant procurement events continues to have a lingering effect on the business. In particular, past procurement practices that were not in accordance with the Preferential Procurement Framework, dating back as far as the 2012 financial year, resulted in a significant increase in reported irregular expenditure. Irregular expenditure arising from contracts entered into in the current financial year represent only 4% of reported irregular expenditure. The process to identify and accurately report all irregular expenditure is largely manual in nature and continues to result in reporting inaccuracies. The resultant concern relating to the completeness of the reported irregular expenditure has resulted in the external auditors issuing a qualified opinion for the year under review.
More detailed disclosure on non-compliance with the PFMA and the associated consequence management is set out in note 39 of the annual financial statements.
Reportable irregularitiesThe irregularity reported by the Company’s external auditors to the Independent Regulatory Board for Auditors has been remedied.
Note 40 contains more disclosure on the reportable irregularity.

21
Economic regulation and regulatory reformThe tariffs of two operating divisions, namely Transnet Pipelines (Pipelines) and Transnet National Ports Authority (National Ports Authority) are regulated by the National Energy Regulator of South Africa (Nersa) and the Ports Regulator of South Africa (Ports Regulator) respectively. The railway safety permit fees are determined by the Department of Transport and are payable to the Railway Safety Regulator (RSR).
The Company operates within a policy context determined by the Department of Public Enterprises (DPE) and the Department of Transport (DoT) respectively.
With approximately 21,4% of Transnet’s revenue and 34,4% of EBITDA impacted by economic regulation, it is critical that relationships with regulators are managed proactively and strategically as their decisions could have a significant impact on operating results, capital investment decisions and investor confidence.
PipelinesOn 29 August 2018, Nersa approved guidelines for prudency assessment (guidelines). The guidelines will be used to assess the prudency of costs incurred by licensees for both capital expenditure and operational expenditure. The guidelines are applicable to assess costs incurred retrospectively (ex-post) and prospectively (ex-ante). The guidelines are a minimum standard and Nersa reserves its right to exercise discretion by requesting additional information over and above what is required in the guidelines.
On 26 February 2020, Nersa made a decision to set Pipelines’ 2021 financial year tariffs as per Sections 4(f) and 28(1) of the Petroleum Pipelines Act, 2003 (Act No. 60 of 2003). The Regulator increased Pipelines’ allowable revenue by 9,01%. This translates into an 11,06% increase in the Durban to Alrode tariff from 45,69 cents per litre to 51,00 cents per litre for the 2021 financial year.
In its decision, the Regulator decided to smooth the tariff increases over the next 4 years. Nersa also deferred the claw-back on assets until the finalisation of their prudency study.
In its decision, the Regulator highlighted the following:• In line with the 2014 financial year decision,
Transnet corporate overhead costs will continue to be escalated by the consumer price index (CPI).
• In the 2017 financial year decision, Nersa decided to place a hold on the new multi product pipeline (NMPP) assets at a value of R26,21 billion. Nersa will only lift this hold upon completion of the NMPP project (June 2023) and Nersa’s prudency exercise.
• The Regulator decided to implement the Transnet NMPP imprudent amount of R3,16 billion pending the finalisation of the Nersa NMPP Prudency Review.
National Ports AuthorityThe Ports Regulator published, on 29 November 2019, the 2021 financial year tariff decision
determining that the overall increase in average tariffs for the 2021 financial year is 0,3% vs the National Ports Authority’s application of 4,8%.
The Ports Regulator published the draft multi-year tariff methodology version 3 on 29 November 2019 for public consultation. On 6 March 2020, the Ports Regulator, after consultation with the port users and Transnet published the approved multi-year tariff methodology version 3 (approved MYT3) applicable to the 2022, 2023, and 2024 tariff periods.
Freight RailOn 20 November 2019, the South African Cabinet approved the submission of the Economic Regulation of Transport Bill of 2019 to Parliament. Transnet will engage with the final consultation process through the Parliamentary Portfolio Committee of Transport.
Application for Transnet Single Entity Railway Safety Permit for the period 2019 to 2022 The Railway Safety Regulator has taken a unilateral decision to increase the Railway Safety Permit’s validity period from one to three years. The current permit issued on 31 August 2019, is therefore valid from the date of issue to 30 June 2022.
The 2019-2022 railway safety permit was issued with the following two special conditions: • Special condition 1 (human factor management):
Transnet had to demonstrate to the Railway Safety Regulator the criteria that Transnet is using for workforce selection, how it manages vacancies, how competency is managed and further demonstrate how workload planning and management is addressed.
• Special condition 2 (safety interface management agreement): Transnet had to finalise and submit the signed safety interface management agreement between Transnet and Prasa.
Transnet’s response to both special conditions met the Railway Safety Regulator’s requirements and the Regulator has since issued the compliance notice for both special conditions.
Railway Safety Permit Fees 2020 financial year determination On 12 April 2019, the Minister of Transport published a notice setting out the safety permit fees payable to the RSR for the 2020 financial year. Transnet paid a non-refundable application fee of R56 333 and a permit fee of R104,9 million.
Judicial proceedingsThe annual financial statements include a best estimate of expected settlement costs for judicial proceedings involving Transnet, as either defendant or plaintiff, where the outcome can be assessed with reasonable certainty. These estimates take into account the legal opinions obtained for the Group. Contingent liabilities of the Group are disclosed in note 31 of the annual financial statements.

Report of the directors for the year ended 31 March 2020
22 Annual financial statementsReport of the directors
Transnet pensioners’ class actionOn 5 June 2015, two pensioners, following the certification of a class of pensioners on 31 July 2014, issued summons against Transnet, the Transport Pension Fund (the TPF), and the Transnet Second Defined Benefit Fund (the TSDBF) (the Pension Funds). While the class action litigation was proceeding, the attorneys for the plaintiffs, and the attorneys for Transnet and for the two funds, were in regular engagement to find a settlement that would dispose of the class action litigation. Accordingly in June 2019 Transnet’s attorneys concluded a joint memorandum of agreement (JMoA) with plaintiffs’ attorneys recording matters that are resolved on the essential economic arrangements for the settlement of the litigation, which was also accepted by the boards of the funds. The JMoA formed the basis for a comprehensive settlement agreement that was negotiated, signed by the class legal representative, the class representative plaintiffs, Transnet and both funds, and ultimately concluded on 11 December 2019.
The settlement agreement was presented to the High Court by the parties acting jointly, requesting that it be made an order of court. In the judgment handed down on 22 June 2020, it was duly ordered that:• The settlement agreement of 11 December 2019
be made an order of court;• The settlement agreement is binding on all the
members of the class, and on all the parties to the settlement agreement; and
• The class action litigation against the two funds and Transnet, is settled and concluded among the parties and the members of the class on the terms of the settlement agreement.
This judgment and order therefore put an end to the class action litigation.
The settlement agreement provides for specified, enhanced pension increases and specified bonus lump sum payments to pensioners of the two funds. The enhancements are fully funded from the existing actuarial surpluses in the funds and Transnet is not required to inject any monies into either of the funds. Transnet has agreed to pay a once-off amount of R18 million in settlement of the plaintiffs’ legal and actuarial costs. The funds are, in terms of the judgment and order, required to merge into one and this process is underway and expected to be effective from 31 March 2021.
Investigation by the Competition CommissionThe Competition Commission is investigating allegations of uncompetitive conduct at three of Transnet’s operating divisions, namely Transnet Port Terminals (TPT), Transnet National Ports Authority (TNPA) and Transnet Freight Rail (TFR). The investigation poses a potential financial exposure in the form of a fine of up to 10% of Transnet’s annual turnover should evidence of uncompetitive conduct be found.
During December 2019, the Commission communicated its preliminary findings against TNPA and TPT on excessive pricing and exclusionary conduct/ preferential treatment on the part of both Operating divisions. On 29 January 2020, Transnet representatives met with the Commission for an in-depth discussion on the preliminary findings. The Commission indicated with regard to TNPA that it will advocate for the unbundling of TNPA in line with the National Ports Act, instead of imposing a fine. In the case of TPT the Commission indicated that it would prefer that Transnet consider settlement of the excessive pricing preliminary finding. The economics team met with TPT on 24 February 2020 in Durban to review its profitability data. Weekly meetings have been scheduled with the legal and economics team and TPT to coordinate the response strategy on dealing with the preliminary findings.
Regarding TFR, the Commission has issued a further request for information (RFI) which the legal team is currently attending to. The Commission had given Transnet a deadline of 17 April 2020 to provide the information, however, due to the nation-wide lockdown, the Commission has extended this deadline to three weeks post the date when the lockdown ends. The Commission has further requested a meeting with Transnet to clarify the RFI.
Investigation by the Zondo Judicial Commission of InquiryThe appointment of a judicial commission of inquiry by Proclamation No. 3 of 2018 published in Government Gazette No. 41403 dated 25 January 2018 poses significant financial and reputational risks to Transnet should the award of major procurement events and payments be found to have been tainted by improper conduct and/or corruption.
Transnet appointed a firm of attorneys to represent Transnet during the conduct of investigations and sittings of the Commission. Full co-operation with the Commission has been monitored through weekly meetings with the Commission investigators housed at Transnet premises and Transnet continues to provide the Commission with all information requested by it in conducting the investigations.
Shareholder’s Compact – performance criteriaThe Shareholder’s Compact KPIs that the Board and the Shareholder Representative agree on, serve as the performance-monitoring framework for the Company.
Performance against the Shareholder’s Compact targets are outlined in the tables that follow. The performance information contained therein has been subjected to independent audit review, and the auditors have reported their findings in the independent auditor’s report.
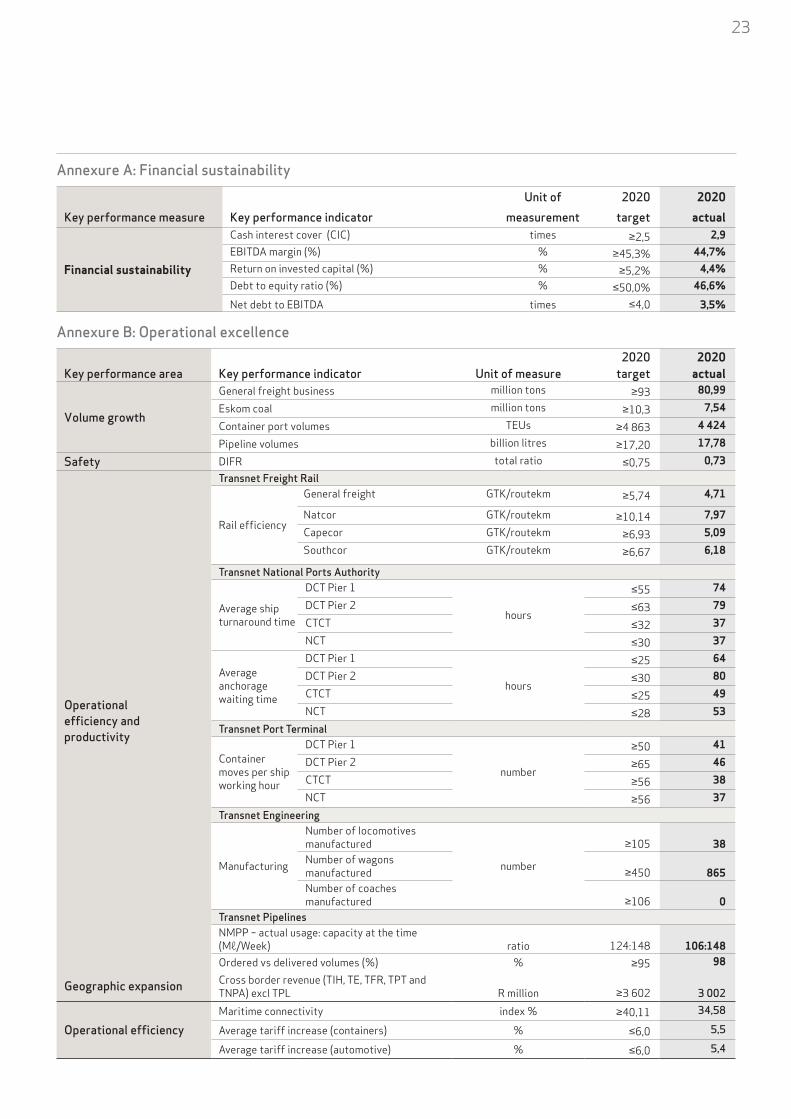
23
Annexure A: Financial sustainabilityUnit of 2020 2020
Key performance measure Key performance indicator measurement target actual
Financial sustainability
Cash interest cover (CIC) times ≥2,5 2,9EBITDA margin (%) % ≥45,3% 44,7%Return on invested capital (%) % ≥5,2% 4,4%Debt to equity ratio (%) % ≤50,0% 46,6%
Net debt to EBITDA times ≤4,0 3,5%
Annexure B: Operational excellence2020 2020
Key performance area Key performance indicator Unit of measure target actual
Volume growth
General freight business million tons ≥93 80,99
Eskom coal million tons ≥10,3 7,54
Container port volumes TEUs ≥4 863 4 424
Pipeline volumes billion litres ≥17,20 17,78
Safety DIFR total ratio ≤0,75 0,73
Operational efficiency and productivity
Transnet Freight Rail
Rail efficiency
General freight GTK/routekm ≥5,74 4,71
Natcor GTK/routekm ≥10,14 7,97
Capecor GTK/routekm ≥6,93 5,09
Southcor GTK/routekm ≥6,67 6,18
Transnet National Ports Authority
Average ship turnaround time
DCT Pier 1
hours
≤55 74
DCT Pier 2 ≤63 79
CTCT ≤32 37
NCT ≤30 37
Average anchorage waiting time
DCT Pier 1
hours
≤25 64
DCT Pier 2 ≤30 80
CTCT ≤25 49
NCT ≤28 53
Transnet Port Terminal
Container moves per ship working hour
DCT Pier 1
number
≥50 41
DCT Pier 2 ≥65 46
CTCT ≥56 38
NCT ≥56 37
Transnet Engineering
Manufacturing
Number of locomotives manufactured
number
≥105 38Number of wagons manufactured ≥450 865Number of coaches manufactured ≥106 0
Transnet PipelinesNMPP – actual usage: capacity at the time (Mℓ/Week) ratio 124:148 106:148Ordered vs delivered volumes (%) % ≥95 98
Geographic expansion Cross border revenue (TIH, TE, TFR, TPT and TNPA) excl TPL R million ≥3 602 3 002
Operational efficiencyMaritime connectivity index % ≥40,11 34,58
Average tariff increase (containers) % ≤6,0 5,5
Average tariff increase (automotive) % ≤6,0 5,4

Report of the directors for the year ended 31 March 2020
24 Annual financial statementsReport of the directors
2020 2020Key performance area Key performance indicator Unit of measure target actual
Maintenance
Number of kilometers screened on the rail network km ≥105 115,3Number of turnouts replaced on the rail network number ≥80 28,0
Number of sleepers installed on the rail network number ≥309 815 320 127Number of kilometers replaced on the rail network km ≥250 46,6
Annexure C: Capital programmes and strategic initiativesUnit of 2020 2020
Key performance area Capital project Key performance indicator measurement target actual
CAPITAL PROGRAMMES
General freight programme
Acquisition of 1064 locomotives
Number of locomotives accepted into operations
number
105 46Wagon new-builds Number of wagons accepted
into operations 340 0
Coal programme
Waterberg – phase 2 Number of project milestones completed 4 2
Overvaal solution Number of project milestones completed 2 0
Pipeline programme New Multi-Product Pipeline (NMPP) phase 1B *
Number of project milestones completed 6 3
Natal Corridor and Port of Durban programme
DCT berth construction, deepening and lengthening
Number of project milestones completed 4 4
STRATEGIC INITIATIVES
Operation Phakisa Implement floating dock at Richard’s Bay
Number of project milestones completed
number5 0
PSP programme Tambo Springs intermodal gateway
Number of project milestones completed 2 0
Revenue initiatives Rand value generated from fibre commercialisation R million ≥200 132,1
Rand value generated from diversification initiatives R million ≥80 0
Property Transnet Property strategy finalised and approved date 30 September 2019
Not achieved
* One of the milestones that were included as part of the target for the 2020 financial year was achieved in March 2019, this was due to timing of the compacting process. This achievement has not been included as part of the actual performance.

25
Annexure D: Socio economic development outcomes2020 2020
Key performance area Key performance indicator Unit of measure target actual
Skills development
Artisan trainees
number≥200 288
Engineering trainees ≥60 60
Technician trainees ≥200 200
Training spend % ≥2,5 2,7
Community development
Number of patients receiving health services
number
≥120 000 105 565Number of schools participating in the whole schools development programme ≥110 147Number of teenagers receiving a package of health services 11 000 45
Environmental stewardship
Group weighted energy efficiency (electricity and fuel) year on year (YOY) improvement (%) % ≥0,3 0,31Carbon emission intensity (kgCO2/ton) reduction YOY improvement % ≥0,5 0,48
Research and development
Research and development spend R million ≥250 234,3Number of innovative products launched number ≥6 2Number of innovative products commercialised number ≥6 0
Industrialisation
Local content % 70 8,6
Supplier development (SD) value % of TMPS subject to SD ≥10 3,00Rand value spent on training incubator suppliers at the hubs R million ≥20 49,2Number of incubation graduates integrated into the supplier value chain number ≥16 18
Transformation
Black women-owned
% of TMPS
≥5 37,26
Black-owned ≥15 55,89
Black youth-owned ≥1 2,70
Qualifying Small Enterprises ≥5 10,84
Exempted Micro Enterprises ≥7 12,78
People living with disabilities ≥0,125 0,24
BBBEE ≥70 111,82
BBBEE status level Certification level 6 2
Remuneration reportDetails of director’s remuneration are included in note 38 of the annual financial statements. A detailed remuneration report is included in the integrated report, on page 140.

Accounting policies for the year ended 31 March 2020
The consolidated financial statements for the year ended 31 March 2020 comprise the Company and its subsidiaries (the Group) and the Group’s interest in associates and joint ventures. The consolidated financial statements were authorised for issue by the Board of Directors on 17 September 2020.
Transnet has applied Directive 12 The Selection of an Appropriate Reporting Framework by Public Entities; issued by the Accounting Standards Board. The directive states that “An entity shall apply International Financial Reporting Standards (IFRS) as its rePorting framework if it meets the criteria in paragraph 11. Otherwise it shall apply Standards of GRAP”.
Paragraph 11 provides that “In assessing whether an entity shall apply IFRS Standards, it considers whether it meets one of the following criteria:(a) the entity is a financial institution; (b) the entity has ordinary shares or potential
ordinary shares that are publicly traded on capital markets; or
(c) its operations are such that they are: (i) commercial in nature; and (ii) only an insignificant portion of the entity’s
funding is acquired through government grants or other forms of financial assistance from government.”
Transnet satisfies the criteria in paragraph 11 as its operations are of a commercial nature which aim to provide services to generate profits, and only an insignificant portion of the entity’s funding is acquired through government grants or other forms of financial assistance from government. In addition, as an entity with publicly listed debt, Transnet is required in terms of the listing requirements of the Johannesburg Securities Exchange, and the Luxembourg Stock Exchange to prepare its financial statements under IFRS. Transnet therefore prepares its financial statements in accordance with IFRS.
Statement of complianceThe Consolidated Financial Statements are prepared in accordance with IFRS issued by the International Accounting Standards Board (IASB), and applicable legislation.
Critical judgements and estimatesThe preparation of financial statements in accordance with IFRS requires management to make judgements, estimates and assumptions that affect the application of accounting policies and reported amounts of equity, assets and liabilities, revenue and expenses. The estimates and underlying assumptions
are based on historical experience, independent experts’ advice and other factors that are considered to be reasonable under the circumstances. Actual results may differ from estimates. Judgements, estimates and assumptions that have a significant effect on the financial statements are disclosed in the relevant notes to the financial statements.
The significant market disruption caused by the Covid-19 pandemic has created uncertainty in Transnet’s operating environment. As a result, the depth and extent of sensitivity testing has been increased in order to ensure a robust understanding of the impact that these assumptions may have on financial reporting. Transnet has factored this into the 31 March 2020 annual financial results, including to the revaluation models, decommissioning and environmental provisions and debtor provisions.
Going concernThe consolidated financial statements are prepared on the going-concern basis. Management have assessed the Group’s ability to continue as a going concern for the foreseeable future. In making the assessment, management considered and evaluated the following:• Financial performance and projections;• Solvency and liquidity considerations;• Current litigation matters;• Contingent liabilities and post balance sheet
events; and• Counter party credit risk.
Financial performance and projectionsAt the end of March 2020, the South African Government implemented lock-down restrictions as part of efforts to combat the spread of Covid-19. The restrictions did not have a significant impact on the Group’s operations in the financial year ended 31 March 2020. However, the restrictions have had a significant effect on the Group’s operations in the new financial year.
The Group had already revised its corporate plan for the financial year ended 31 March 2021 in line with the March 2020 Bureau for Economic Research report issued post the first breakout in South Africa, and revised the planned volumes to the lower end of the range that has been achieved in the recent past.
The outbreak of Covid-19 within South Africa in March 2020 and the subsequent lockdown restrictions since the start of the new financial year has had a negative impact on operations and revenue. Transnet has managed to sustain operations under restrictions throughout the rail, ports and pipelines, albeit with lower operating activity levels and customer demand.
26 Annual financial statementsAccounting policies

27
Following initial declines, the Group has noted an increase in volumes and revenue month-to-month, with actual revenue increasing from 59% vs corporate plan in April 2020, to 73% in May 2020 83% in June 2020, 84% in July 2020 and 101% in August 2020. Volumes are expected to continue to ramp up in the remaining months.
The overall negative impact on cash is expected to be contained through additional mitigating measures.
Solvency and liquidity considerationsCash interest cover (CIC)There is a strong possibility that the Group may breach the CIC loan covenants at the next compliance dates, namely 30 September 2020 and 31 March 2021. Management will continue to closely monitor the Group’s performance, and as soon as reasonable certainty on the expected CIC ratio to be reported for the September and March compliance dates is known, management will engage the affected lenders with a view to negotiating a reprieve, in advance of the said reporting dates.
Gearing Certain of the Company’s loans have financial covenants that require gearing to be maintained at ≤60%. The subdued outlook for freight volumes has resulted in the devaluation of certain asset classes, mainly the rail infrastructure assets. Whilst the internal gearing target of ≤50% is likely to be breached, the covenant of ≤60% is not expected to be breached.
Litigation matters, contingent liabilities and post balance sheet eventsThe directors evaluated all significant matters, including ongoing legal proceedings and contingent liabilities as at 31 March 2020, any developments during the post-reporting period and assessed their impact on the liquidity and solvency of the Group. The Group does not expect a negative impact on its funding ability.
Subsequent to the reporting period date, the National Energy Regulator of South Africa (Nersa) approved the use of a financial security alternative to the Transnet Pipelines Rehabilitation Trust as disclosed in note 37.
Counter party credit riskCounterparty credit risk, described below, mainly arise from Group Treasury activities in the financial markets and specifically relate to investment and hedging activities.
The Group’s exposure to counterparty risks in respect of all Treasury-related transactions are confined to credible counterparties. The Board Audit Committee annually approves limits for counterparties that meet the selection criteria. Utilisation of limits is monitored daily by Group Treasury to ensure compliance. Counterparties credit status is also continually monitored.
The Group was in a net derivative asset position of R12,5 billion at 31 March 2020 (2019: R6,5 billion). Despite the volatility in the financial markets impacting hedging activities, the impact on the income statement of the Group remained low due to the effectiveness of the hedges applied.
The Group’s counterparty risk exposures are well spread amongst a number of banks. The largest portion is with JP Morgan Chase and Rand Merchant Bank. The exposures to the two counterparties are mainly due to increased market values of cross currency swaps as a result of the weakening rand against major currencies.
The stress testing and risk management discussions provided sufficient support for the going concern assumption under which the financial statements have been prepared.
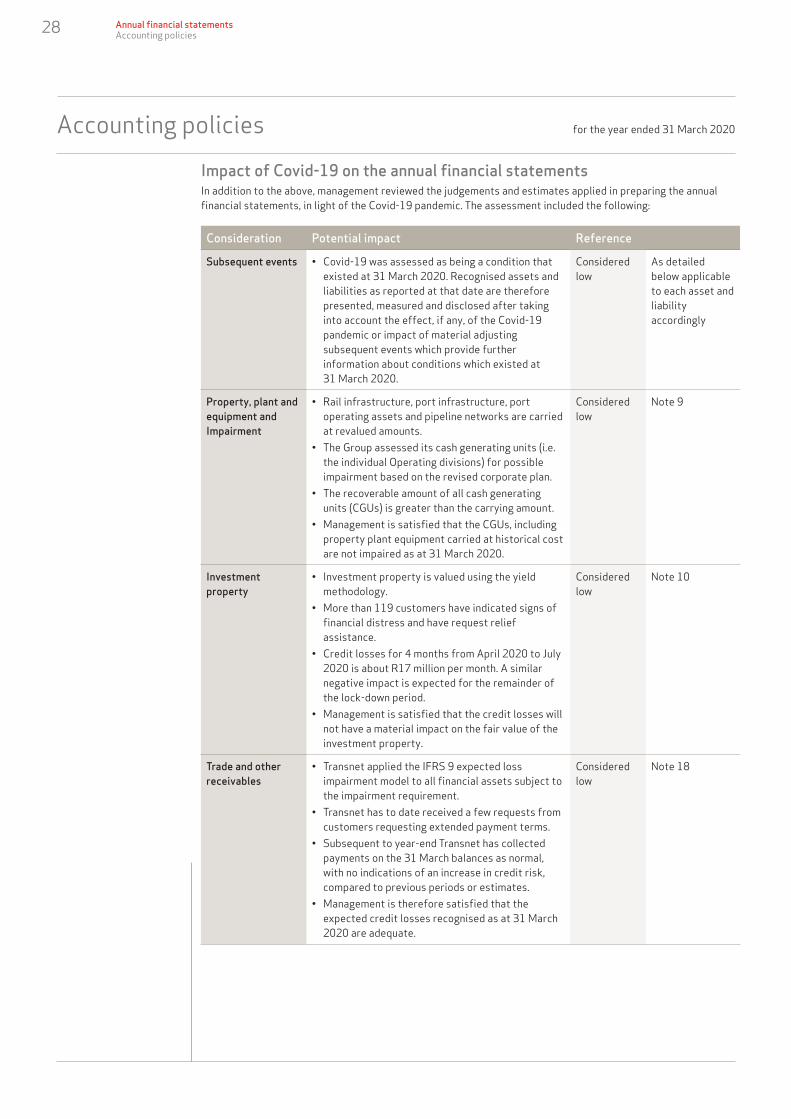
Accounting policies for the year ended 31 March 2020
Impact of Covid-19 on the annual financial statementsIn addition to the above, management reviewed the judgements and estimates applied in preparing the annual financial statements, in light of the Covid-19 pandemic. The assessment included the following:
Consideration Potential impact Reference
Subsequent events • Covid-19 was assessed as being a condition that existed at 31 March 2020. Recognised assets and liabilities as reported at that date are therefore presented, measured and disclosed after taking into account the effect, if any, of the Covid-19 pandemic or impact of material adjusting subsequent events which provide further information about conditions which existed at 31 March 2020.
Considered low
As detailed below applicable to each asset and liability accordingly
Property, plant and equipment and Impairment
• Rail infrastructure, port infrastructure, port operating assets and pipeline networks are carried at revalued amounts.
• The Group assessed its cash generating units (i.e. the individual Operating divisions) for possible impairment based on the revised corporate plan.
• The recoverable amount of all cash generating units (CGUs) is greater than the carrying amount.
• Management is satisfied that the CGUs, including property plant equipment carried at historical cost are not impaired as at 31 March 2020.
Considered low
Note 9
Investment property
• Investment property is valued using the yield methodology.
• More than 119 customers have indicated signs of financial distress and have request relief assistance.
• Credit losses for 4 months from April 2020 to July 2020 is about R17 million per month. A similar negative impact is expected for the remainder of the lock-down period.
• Management is satisfied that the credit losses will not have a material impact on the fair value of the investment property.
Considered low
Note 10
Trade and other receivables
• Transnet applied the IFRS 9 expected loss impairment model to all financial assets subject to the impairment requirement.
• Transnet has to date received a few requests from customers requesting extended payment terms.
• Subsequent to year-end Transnet has collected payments on the 31 March balances as normal, with no indications of an increase in credit risk, compared to previous periods or estimates.
• Management is therefore satisfied that the expected credit losses recognised as at 31 March 2020 are adequate.
Considered low
Note 18
28 Annual financial statementsAccounting policies

29
Consideration Potential impact Reference
Environmental provisions
• The Group reviewed the cash flows required to settle its environmental obligations in light of the Covid-19, including the amount and timing of the cash flows.
• The Group also updated other inputs such as foreign exchange rates and discount rates (WACC), etc. to account for the effect of the pandemic.
• The Group does not expect a significant change in the future cash flows, and the effect of changes in other inputs is not material.
Considered low
Note 25
Derivative financial instruments
• These instruments are carried at fair value – based on market based inputs. No further adjustments were required.
• The impact of Covid-19 has resulted in the volatility of prices in the financial markets which has a direct or an indirect impact on the fair values at the reporting date.
• The Group’s hedges were effective at the end of the financial year (as well as subsequently), and the Group expects all hedged transactions to occur as expected. As such, no adjustments have been made to hedge relationships.
Considered low
Note 14 and 37
Inventory • Inventory is carried at the lower of cost and net realisable value.
• Management expects all inventory to be recovered from normal operations, with no additional write-downs due to the Covid-19 pandemic.
Considered low
Note 17
ConclusionThe directors are confident that the Group has adequate resources to continue operations as a going concern in the foreseeable future, based on the revised corporate plan, including cash flow forecasts and available cash resources.
The directors are satisfied that the impact of the Covid-19 pandemic and lock-down restrictions has been adequately considered in preparing the annual financial statements as required by IFRS.
Further, the directors are satisfied that there are no material uncertainties relating to events or conditions which may cast significant doubt on the Company’s ability to continue as a going concern and thus the directors believe that Transnet will be a going concern in the foreseeable future. For this reason, they continue to apply the going concern assumption in preparing the annual financial statements.
Basis of preparationThe consolidated financial statements are presented in South African Rand, which is the Company’s functional currency, rounded to the nearest million.
The financial statements are prepared on the going-concern basis using the historical cost convention, except for certain financial instruments and investment property which are measured at fair value, non-current assets held-for-sale which are measured at the lower of carrying amount and fair value less costs-to-sell and certain classes of property, plant and equipment which are measured using the revaluation model.
Historical cost is generally based on the fair value of the consideration given in exchange for goods and services at the transaction date.
Fair value is the price that would be received to sell an asset or paid to transfer a liability in an orderly transaction between market participants at the measurement date, regardless of whether that price is directly observable or estimated using another valuation technique. In estimating the fair value of an asset or a liability, the Group takes into account the characteristics of the asset or liability if market participants would take those characteristics into account when pricing the asset or liability at the measurement date. Fair value for measurement and/or disclosure purposes is determined on the above basis, except for measurements that have some similarities to fair value but are not fair value, such as net realisable value in IAS 2 Inventories or value in use in IAS 36 Impairment of Assets.

Accounting policies for the year ended 31 March 2020
In addition, for financial reporting purposes, fair value measurements are categorised into Level 1, 2 or 3 based on the degree to which the inputs to the fair value measurements are observable and the significance of the inputs to the fair value measurement in its entirety, which are described as follows: • Level 1 inputs are quoted prices (unadjusted) in
active markets for identical assets or liabilities that the Group can access at the measurement date;
• Level 2 inputs are inputs, other than quoted prices included within Level 1, that are observable for the asset or liability, either directly or indirectly; and
• Level 3 inputs are unobservable inputs for the asset or liability.
Except as otherwise disclosed, these accounting policies are consistent with those applied in previous years and are consistently applied across the Group.
Basis of consolidationSubsidiariesSubsidiaries (including structured entities) are entities over which the Group has control. The Group controls an entity when it is exposed to, or has rights to, variable returns from its involvement with the entity and has the ability to affect those returns through its power over the entity. The consolidated financial statements include the results of subsidiaries from the effective date of acquisition to the effective date of disposal.
The Group applies the acquisition method to account for business combinations. The cost of acquisition for a subsidiary is the fair value of the assets transferred, the liabilities incurred to the previous owners and equity interests issued by the Group. Acquisition related costs are expensed as incurred.
Inter-company transactions, balances and unrealised gains on transactions between Group entities are eliminated on consolidation. Unrealised losses are also eliminated unless the transaction provides evidence that the asset transferred is impairment.
Investments in equity-accounted investeesEquity accounted investees comprise of investments in associates and joint ventures. The investments are accounted for using the equity method in the consolidated financial statements. The investments are measured at cost, including goodwill, plus the Group’s share of post-acquisition reserves less any accumulated impairment losses.
Unrealised profits and losses on transactions with equity- accounted investees are eliminated to the extent of the Group’s interest in the equity-accounted investees, except to the extent that the losses provide evidence that the asset transferred is impaired.
AssociatesAssociates are entities over which the Group exercises significant influence, but not control or joint control of the financial and operating policies of the entity. Significant influence is presumed in instances where the Group has an equity stake greater than 20% but less than 50% in an entity.
Joint venturesA joint venture is a contractual arrangement whereby the Group and another party undertake an economic activity that is subject to joint control, i.e. where decisions about the relevant activities require the unanimous consent of the parties sharing control and the parties to the joint venture have rights to the net assets of the arrangement.
Separate financial statementsIn the Company’s separate financial statements, investments in subsidiaries and equity-accounted investees are measured at cost less any accumulated impairment losses.
RevenueRevenue from contracts with customersRevenue is recognised when control of promised goods or services is transferred to a customer at an amount that reflects the consideration the Group expects to receive in exchange for those goods or services. The Group accounts for contracts with customers when it has approval and commitment from both parties, each party’s rights have been identified, payment terms are defined, the contract has commercial substance and collection of the consideration is probable.
For contracts that involve multiple performance obligations, the Group allocates the transaction price to each performance obligation in the contract based on relative stand-alone selling prices and recognises revenue as and when each performance obligation in the contract is satisfied. Where stand-alone selling prices are not available, the Group estimates the stand-alone selling price based on the expected cost plus margin approach.
Certain customer agreements include variable consideration in the form of take-or-pay charges, volume based rebates or discounts, penalties and additional revenue based on meeting certain performance targets which affect the transaction price. Variable consideration is recognised as revenue to the extent that it is highly probable that a significant reversal in the amount of cumulative revenue recognised will not occur. Variable consideration is recognised based on management’s best estimate of the expected amount, taking into account available historical, current and forecasted information – and where applicable, following verification processes or confirmation with the customer.
30 Annual financial statementsAccounting policies

31
Revenue is recognised net of value-added tax, and excludes any amounts collected on behalf of third parties.
Payments received from customers in advance of the Group satisfying its performance obligations are initially recognised as contract liabilities. Amounts owing to the Group for goods or services rendered but not yet invoiced are recognised in the financial statements as contract assets.
The Group applies the following practical exemption in IFRS 15:• The Group does not adjust the consideration for
the effects of a significant financing component if it expects, at contract inception, that the period between the transfer of goods or services to a customer and payment will be one year or less.
The Group generates revenue from the following principal activities.
Freight RailFreight Rail generates revenue from the transportation of bulk, break-bulk and containerised freight over the Group’s rail network, and from the provision of broadband electronic communication services through its fibre optic cable network
Rail freight services are based either on the standard conditions of carriage, the rail transport agreement, and where applicable, customer-specific contracts that establish the terms and conditions for rail freight services offered by the Group. For revenue recognition purposes, an agreement for the movement of freight over rail exists when a service request is received from a customer and is accepted by the Group.
The transaction price is generally determined for each customer when the service request is received based on their requirements, except where there is a customer specific contract in place, in which case the contractual rates will apply.
Revenue from the movement of freight over rail is recognised over time over the period of the contract and is measured based on the volumes delivered to the customer. This method provides a faithful depiction of the Group’s transfer of services to the customer as the performance obligation is satisfied on delivery of the consignment to the customer.
Revenue from the provision of broadband electronic communication services is recognised over time, based on the services is provided to the customer during that period.
The payment terms are 25 days from statement date – which is generally the 25th day of the month.
Engineering Engineering generates revenue from the following services:• Manufacture, assembly, and supply of rolling stock
(new and refurbished) and related components;• Overhaul and refurbishment of rolling stock;• Ad-hoc maintenance of rolling stock and
specialised equipment;• Supply of spare parts; and• Shipping.
Under the terms of the contracts with customers, the Group is restricted from redirecting the items manufactured or maintained to another customer and has an enforceable right to payment for work done.
The revenue is recognised over time as services are rendered using the cost-to-cost method based on the proportion of contract costs incurred for work performed to date relative to the estimated total contract costs. Contract costs exclude any amounts incurred that do not contribute to the Group’s progress in satisfying its performance obligations. As costs are generally incurred uniformly as the work progresses and are considered to be proportionate to the Group’s performance, the cost-to-cost method provides a faithful depiction of the Group’s transfer of goods and services to the customer.
The Group applies judgement in measuring variable consideration arising from contractual penalties based on historical information and the latest estimates of progress on the contract compared to targets.
A contract asset is recognised over the period in which the services are performed representing the Group’s right to receive consideration for services performed to date which have not yet been invoiced. The Group invoices customers on attainment of contractual milestones. At this point, contract assets are reclassified to trade receivables. If a milestone payment exceeds the revenue recognised to date under the cost-to-cost method, the Group recognises a contract liability for the difference.
Some goods sold by Engineering include warranties which require the Group to correct defective products during the warranty period if the goods fail to comply with agreed-upon specifications. In accordance with IFRS 15, such warranties are not accounted for as separate performance obligations and no revenue is allocated to them. Instead, a provision is raised for the costs of satisfying the warranties in accordance with IAS 37 Provisions, Contingent Liabilities and Contingent Assets.
The payment terms are 25 days from statement date – which is generally the 25th of the month.

Accounting policies for the year ended 31 March 2020
National Ports AuthorityNational Ports Authority generates revenue from the provision of access to port infrastructure, including waterside and landside services, provision of port services which includes pilotage, berthing, craft assistance and ship repairs among others, and commission from the collection of levies from customers on behalf of the South African Maritime Safety Authority (SAMSA).
For revenue recognition purposes, an agreement for the provisions of access to port infrastructure services and port services exists when an order is received from a customer, is accepted by the Group and the vessel has called in at the port.
The transaction price for access to port infrastructure services and port services is regulated, and is based on published tariffs for each service as determined by the Ports Regulator of South Africa.
Revenue in respect of access to the port infrastructure is recognised over-time at the applicable tariff based on time spent by the vessel within the port. Revenue in respect of port services is recognised over-time at the applicable tariff based on the actual activity or work performed to date on the vessel. Commission received from collection of levies on behalf of SAMSA is recognised as a percentage of the revenue collected from customers during the period.
The payment terms are 25 days from statement date – which is generally the 25th of the month.
Port TerminalsPort Terminals generates revenue from the handling and storage of cargo at various port terminals across South Africa. For revenue recognition purposes, an agreement for the handling and storage of cargo exists when an order is received from a customer and is accepted by the Group.
The transaction price in respect of containers is based on published tariffs, and for non-container cargo is based either on the base price applicable to all customers or, where applicable, on the contractual rate agreed with the customer.
Revenue is recognised over time based on actual volumes handled (loading/unloading of vessels) and actual storage time provided to the customer.
Performance based variable consideration arising from the handling of cargo is constrained due to the fact that the achievement of targets is affected by a number of factors outside the control of the Group, especially the weather. The revenue is only recognised when the work on the vessel is complete and the agreed targets have been met.
The payment terms are 25 days from statement date – which is generally the last day of the month.
PipelinesPipelines generate revenue from the transportation of petroleum products (crude, refined and avtur) and gas products through the Group’s pipeline network, the handling and storage of refined products and additive dosing.
For revenue-recognition purposes, the acceptance of an order placed by the customer constitutes an agreement concluded by the Group and the customer in respect of services to be rendered.
The transaction price for the transportation of petroleum and gas products, and the handling and storage of refined petroleum products is regulated, and is based on published tariffs as determined by the National Energy Regulator of South Africa. The transaction price for additive dosing of refined products is based on the contractual rate agreed with the customer.
Revenue from the transportation of petroleum and gas products is recognised over-time and is measured based on the volumes delivered to the customer. This method provides a faithful depiction of the Group’s transfer of services to the customer as the performance obligation is satisfied on delivery of product to the customer. Revenue from handling and storage of refined products and additive dosing is recognised over-time as the Group renders services to the customer.
The payment terms are 25 days from statement date – which is generally the last day of the month.
Other revenueLease incomeRevenue from the leasing of the Group’s assets is recognised on a straight-line basis over the lease term in accordance with the substance of the relevant agreements. Lease incentives granted are recognised as an integral part of the total lease income.
Dividend incomeDividend income is recognised on the date the Group’s right to receive payments is established, which in the case of quoted securities is the ex-dividend date.
Government grantsGovernment grants are recognised at fair value when there is reasonable assurance that the grant will be received and all relevant conditions will be complied with.
32 Annual financial statementsAccounting policies

33
Where the grant relates to an expense item, it is recognised as income in profit or loss over the periods necessary to match the grant on a systematic basis to the costs that it is intended to compensate.
Where the grant relates to an asset, the fair value is credited to a deferred income account and is released to profit or loss over the expected useful life of the relevant asset on a straight-line basis.
Finance income and finance costsThe Group’s finance income and finance costs comprise:• Interest income;• Interest expense, including amortisation of
discounts and premiums on bonds;• Foreign exchange gains and losses; and• Net gains or losses on de-recognition of financial
assets and financial liabilities carried at amortised cost.
Finance costs exclude amounts capitalised to qualifying assets (see below).
Interest income and interest expense are recognised separately in profit or loss using the effective interest rate method. The effective interest rate is the rate that exactly discounts estimated future cash payments or receipts through the expected life of the financial instrument to:• The gross carrying amount of the financial asset;
or• The amortised cost of the financial liability.
In calculating interest income and interest expense, the effective interest rate is applied to the gross carrying amount of the asset (when the asset is not credit-impaired) or to the amortised cost of the liability. However, for financial assets that have become credit-impaired subsequent to initial recognition, interest income is calculated by applying the effective interest rate to the amortised cost of the financial asset. If the asset is no longer credit-impaired, then the calculation of interest income reverts to the gross basis.
Borrowing costsBorrowing costs comprise interest expense and foreign exchange gains and losses (including hedge accounting adjustments), to the extent that they are regarded as an adjustment to the interest expense.
The Group capitalises borrowing costs that are directly attributable to the acquisition, construction or production of a qualifying asset, as part of the cost of that asset, until such time that the asset is
substantially ready for its intended use. The Group identifies a qualifying asset as one that necessarily takes more than six months to get ready for its intended use.
To the extent that funds are borrowed specifically for the purpose of obtaining a qualifying asset, the Group capitalises the actual borrowing costs incurred less any investment income on the temporary investment of the borrowed funds. To the extent that a qualifying asset is funded through general borrowings, the Group determines borrowing costs eligible for capitalisation by applying the weighted average cost of borrowings in the period, other than borrowings raised specifically for the purpose of obtaining qualifying assets, to the expenditures on qualifying assets.
Where a specific borrowing remains outstanding after the related asset is ready for its intended use or sale, it becomes part of the general borrowings pool for purposes of calculating the capitalisation rate on general borrowings.
Capitalisation of borrowing costs is suspended during extended periods in which the Group suspends the active development of a qualifying asset.
All other borrowing costs are recognised in profit or loss in the period in which they are incurred.
Foreign currency transactionsTransactions in currencies other than the Company’s functional currency are defined as foreign currency transactions. Transactions in foreign currencies are translated into Rand at exchange rates ruling on transaction date or at the average rate of exchange for transactions that occur regularly throughout the year.
Monetary assets and liabilities denominated in foreign currencies are translated into Rand at the rate of exchange ruling at the reporting date. Non-monetary items measured at historical cost in a foreign currency are translated at the exchange rates ruling at the original transaction date, while those items measured at fair value are translated at the exchange rate ruling when the fair value was determined.
Exchange differences are recognised in profit or loss as finance costs in the period in which they arise except for:• Exchange differences relating to assets under
construction which are included in the cost of those assets to the extent they are regarded as an adjustment to interest costs on foreign currency borrowings – see above under ‘Borrowing costs’;
• Exchange differences on hedges of foreign currency risk – see below under Derivative financial instruments and hedge accounting; and

Accounting policies for the year ended 31 March 2020
• Exchange differences on monetary items receivable from or payable to a foreign operating entity for which settlement is neither planned nor likely to occur, which form part of the net investment in the foreign operation and are initially recognised in the foreign currency translation reserve and subsequently recognised in profit or loss on disposal of the investment.
Fair value adjustments arising on acquisition of a foreign entity are treated as assets and liabilities of the foreign entity and translated at the rates of foreign exchange ruling at the reporting date.
On consolidation, exchange differences arising from the translation of the net investment in foreign operations and of related hedges, where hedge accounting is applied, are recognised in equity. Upon disposal, the translation differences are recognised in profit or loss as part of the gain or loss on disposal.
TaxIncome tax for the period comprises current and deferred tax. Income tax is recognised in profit or loss, except to the extent that it relates to items recognised directly in equity, in which case the tax is also recognised in equity.
Current taxCurrent tax is the amount of income taxes payable in respect of the taxable profit for the current period and any adjustment to tax payable in respect of previous years. It is calculated using tax rates that have been enacted or substantively enacted at the reporting date.
Deferred taxDeferred tax is recognised on temporary differences arising between the tax bases of assets and liabilities and their carrying amounts in the financial statements. Deferred tax is not recognised if it arises from the initial recognition of goodwill, the initial recognition of assets and liabilities, other than in a business combination, which affect neither accounting nor taxable profit or loss, and differences relating to investments in subsidiaries, associates and joint ventures to the extent that it is probable they will not reverse in the foreseeable future.
Deferred tax liabilities are recognised for taxable temporary differences associated with investments in subsidiaries, associates and joint ventures, except where the Group is able to control the timing of the reversal of the temporary differences and it is probable that it will not reverse in the foreseeable future. Deferred tax assets are recognised only to the extent that it is probable that future taxable profits will be available against which the temporary
differences can be utilised. The Group assesses the recoverability of its deferred tax assets annually when it prepares its Corporate Plan, taking into consideration the expectation of future taxable profits and availability of sufficient taxable temporary differences against which the deferred tax assets can be utilised.
The measurement of deferred tax assets and liabilities reflects the tax consequences that would follow from the manner in which the Group expects to recover or settle the carrying amount of its assets and liabilities, by applying tax rates that have been enacted or substantively enacted at the reporting date.
Deferred tax assets and liabilities are offset when they relate to income taxes levied by the same tax authority and the Group has the legal right to and intends to settle its current tax assets and liabilities on a net basis.
The Group assesses its intention at the reporting date on recovering an asset or liability to the extent that this intention influences the rate of taxation to be applied in calculating deferred taxation. The Group recognises deferred taxation as follows:
LandAs land is deemed to be realised through sale, there is no deferred tax effect on the difference between the tax base and the original cost of the land. Deferred taxation is calculated on the difference between the carrying amount and the capital gains taxation (CGT) base cost at the CGT rate.
Assets in respect of which no taxation allowances are grantedNo deferred taxation is raised in the case where neither the accounting nor the taxation profit is affected. Where the asset is revalued, deferred taxation is calculated based on the Group’s intention. Where the intention is to sell the asset, deferred taxation is raised at the CGT rate on the difference between the CGT base cost and the revalued carrying amount. Where the intention is to use the asset, deferred taxation is raised at the usage rate on the difference between the taxation base and the revalued carrying amount.
Assets (other than land) carried at costWhere an asset is carried under the cost model and a taxation allowance is available to be claimed against the asset, deferred taxation is calculated on the difference between the carrying amount and the taxation base at the usage rate.
34 Annual financial statementsAccounting policies

35
Assets (other than land) carried at the revalued amount with the intention to useAs the future benefits are expected to flow from the use of the assets, deferred taxation is calculated at the usage rate on the difference between the taxation base and the revalued carrying amount.
Assets (other than land) carried at the revalued amount with the intention to sellWhere the intention is to recover the benefits of the asset through sale, deferred taxation is calculated at usage rate on the difference between the taxation base and the original cost, and at the CGT rate on the difference between the CGT base cost and the revalued carrying amount.
Assets (other than land) carried at the revalued amount with the intention to use and sellWhere the intention is to recover the benefits of the asset through both use and sale, deferred taxation is calculated to reflect this intention. Deferred taxation is calculated at the usage rate on the difference between the taxation base and the original cost, at the CGT rate on the difference between the CGT base cost and the future selling price (residual value), and at the usage rate on the difference between the future selling price and revalued carrying amount.
Investment property (other than land) carried at fair value Deferred taxation on depreciable investment property (i.e. buildings) carried at fair value is calculated at the usage rate on the difference between the taxation base, where taxation allowances are available, and the original cost, and at the CGT rate on the difference between the CGT base cost and the fair value. Where the depreciable investment property is held within a business model whose objective is to consume substantially all of the asset’s economic benefits over the life of the asset, deferred taxation is calculated at the usage rate on the difference between the taxation base and fair value.
Dividends taxThe tax is levied on the date of a dividend payment, which is deemed to be the date on which the dividend accrues to the shareholder. Dividends tax is withheld by the company paying the dividend. An exemption from dividends tax is provided for, inter alia, where the beneficial owner is the Government.
Property, plant and equipmentRecognition and initial measurementProperty, plant and equipment is initially recognised at cost, and subsequently stated at cost or revalued amount less accumulated depreciation and any accumulated impairment losses.
Cost includes expenditure that is directly attributable to the acquisition or construction of an asset including, where applicable, cost of materials, direct labour, an appropriate allocation of overheads, the initial estimate of the costs of dismantling and removing the item and restoring the site on which it is located, capitalised borrowing costs and adjustments in respect of hedge accounting.
Where components of an item of property, plant and equipment have a cost that is significant in relation to the total cost of the item and have different useful lives, they are accounted for as separate components of property, plant and equipment.
Spare parts, standby and servicing equipment are classified as property, plant and equipment if they are expected to be used during more than one period. Otherwise, they are classified as inventory.
Subsequent costsThe Group recognises in the carrying amount of an item of property, plant and equipment the cost of replacing part of the item when it is probable that the future economic benefits will flow to the Group and the cost of the item can be measured reliably. The carrying amount of the replaced part is derecognised. All other repairs and maintenance costs are recognised as expenses when incurred.
Costs of major repairs and overhauls of property, plant and equipment are recognised as separate components of the asset if the recognition criteria are met. The carrying amount of components that are replaced is derecognised.
Assets measured under the revaluation modelCertain assets are carried at their revalued amounts, being the fair value at the date of revaluation, less any subsequent accumulated depreciation and subsequent accumulated impairment losses. Revaluations are performed with sufficient regularity such that the carrying amount does not differ materially from that which would be determined using fair values at the end of the reporting period.
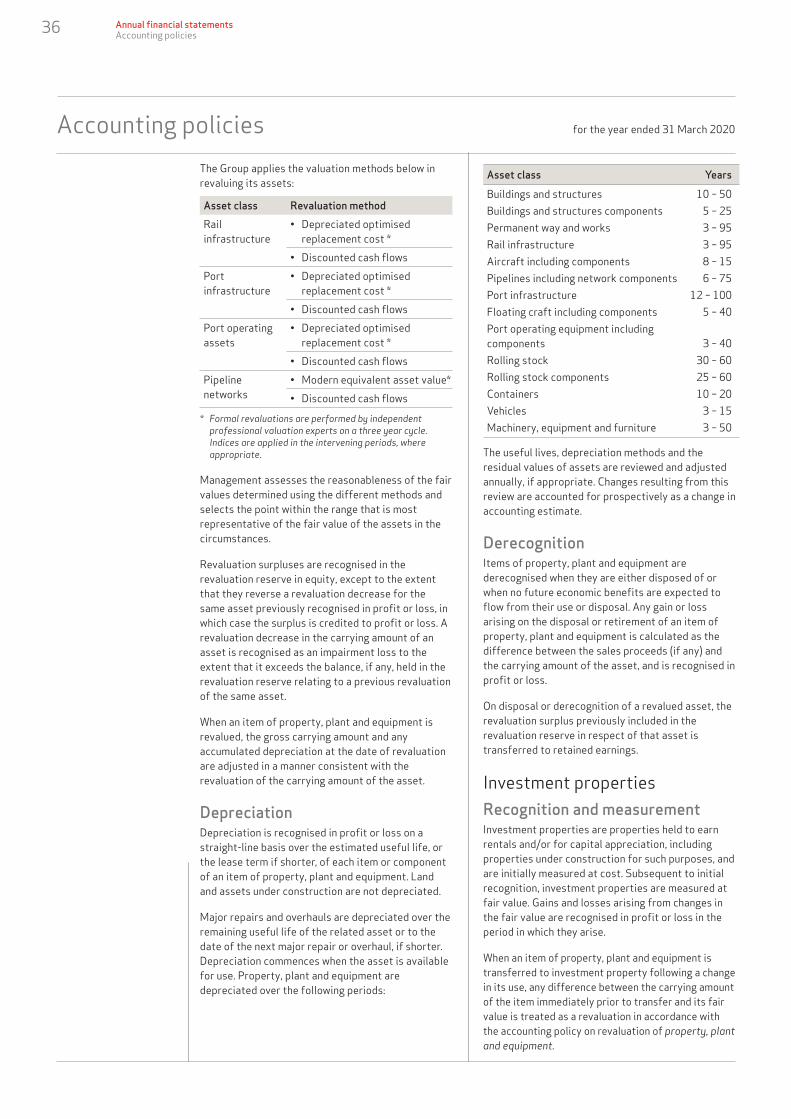
Accounting policies for the year ended 31 March 2020
The Group applies the valuation methods below in revaluing its assets:
Asset class Revaluation methodRail infrastructure
• Depreciated optimised replacement cost *
• Discounted cash flowsPort infrastructure
• Depreciated optimised replacement cost *
• Discounted cash flowsPort operating assets
• Depreciated optimised replacement cost *
• Discounted cash flowsPipeline networks
• Modern equivalent asset value*• Discounted cash flows
* Formal revaluations are performed by independent professional valuation experts on a three year cycle. Indices are applied in the intervening periods, where appropriate.
Management assesses the reasonableness of the fair values determined using the different methods and selects the point within the range that is most representative of the fair value of the assets in the circumstances.
Revaluation surpluses are recognised in the revaluation reserve in equity, except to the extent that they reverse a revaluation decrease for the same asset previously recognised in profit or loss, in which case the surplus is credited to profit or loss. A revaluation decrease in the carrying amount of an asset is recognised as an impairment loss to the extent that it exceeds the balance, if any, held in the revaluation reserve relating to a previous revaluation of the same asset.
When an item of property, plant and equipment is revalued, the gross carrying amount and any accumulated depreciation at the date of revaluation are adjusted in a manner consistent with the revaluation of the carrying amount of the asset.
DepreciationDepreciation is recognised in profit or loss on a straight-line basis over the estimated useful life, or the lease term if shorter, of each item or component of an item of property, plant and equipment. Land and assets under construction are not depreciated.
Major repairs and overhauls are depreciated over the remaining useful life of the related asset or to the date of the next major repair or overhaul, if shorter. Depreciation commences when the asset is available for use. Property, plant and equipment are depreciated over the following periods:
Asset class YearsBuildings and structures 10 – 50Buildings and structures components 5 – 25Permanent way and works 3 – 95Rail infrastructure 3 – 95Aircraft including components 8 – 15Pipelines including network components 6 – 75Port infrastructure 12 – 100Floating craft including components 5 – 40Port operating equipment including components 3 – 40Rolling stock 30 – 60Rolling stock components 25 – 60Containers 10 – 20Vehicles 3 – 15Machinery, equipment and furniture 3 – 50
The useful lives, depreciation methods and the residual values of assets are reviewed and adjusted annually, if appropriate. Changes resulting from this review are accounted for prospectively as a change in accounting estimate.
DerecognitionItems of property, plant and equipment are derecognised when they are either disposed of or when no future economic benefits are expected to flow from their use or disposal. Any gain or loss arising on the disposal or retirement of an item of property, plant and equipment is calculated as the difference between the sales proceeds (if any) and the carrying amount of the asset, and is recognised in profit or loss.
On disposal or derecognition of a revalued asset, the revaluation surplus previously included in the revaluation reserve in respect of that asset is transferred to retained earnings.
Investment propertiesRecognition and measurementInvestment properties are properties held to earn rentals and/or for capital appreciation, including properties under construction for such purposes, and are initially measured at cost. Subsequent to initial recognition, investment properties are measured at fair value. Gains and losses arising from changes in the fair value are recognised in profit or loss in the period in which they arise.
When an item of property, plant and equipment is transferred to investment property following a change in its use, any difference between the carrying amount of the item immediately prior to transfer and its fair value is treated as a revaluation in accordance with the accounting policy on revaluation of property, plant and equipment.
36 Annual financial statementsAccounting policies

37
Intangible assetsSoftware and licencesSoftware and licences are initially recognised at cost and subsequently measured at cost less accumulated amortisation and any accumulated impairment losses.
The cost of licences is amortised in profit or loss on a straight-line basis over the licence period. Costs of maintaining computer software programs are recognised as an expense as incurred.
Research and developmentExpenditure on research to gain new technical knowledge and understanding is recognised as an expense when incurred.
Development expenditure on the production of new or substantially improved products or processes (including feasibility studies) is recognised as an asset if the costs can be measured reliably, the products or processes are technically and commercially feasible, future economic benefits are probable, and the Group intends to, and has sufficient resources, to complete development and to use or sell the product or process.
Cost includes expenditure on materials, direct labour and an allocated portion of project overheads. Development costs that do not meet the recognition criteria are recognised in profit or loss as incurred.
Servitudes Servitudes arising from a binding agreement are recognised as either a separate intangible asset or as part of the related item of property, plant and equipment – depending on whether the intangible or tangible asset is considered the more significant element of the combined asset.
AmortisationIntangible assets not yet available for use are not amortised and are measured at cost less accumulated impairment losses. Intangible assets with a finite useful life are measured at cost less accumulated amortisation and accumulated impairment losses.
Amortisation is recognised on a straight-line basis over their estimated useful lives. The estimated useful life and amortisation method are reviewed at the end of each annual reporting period, and the effect of any changes is accounted for prospectively as a change in accounting estimate. The estimated useful lives are as follows:
Asset class Years
Software 5
Licences Licence period
If an investment property becomes owner-occupied, it is reclassified to property, plant and equipment and its fair value at the date of the reclassification becomes its deemed cost for subsequent accounting purposes.
Some properties comprise a portion that is held to earn rentals or for capital appreciation and another portion that is held for use in the production or supply of goods or services or for administrative purposes (owner-occupied). If these portions could be sold separately or leased out separately under a finance lease, the Group accounts for the different portions separately as investment property or property, plant and equipment. If the portions are not separable, the entire property is only classified as investment property if an insignificant portion is owner-occupied; otherwise the entire property is classified as property, plant and equipment.
The Group has properties with multiple buildings on a single erf or multiple erfs called a precinct. Certain buildings may be owner occupied and others rented to third parties or vacant. For classification purposes, a precinct, station or intermodal hub is assessed in its entirety and is classified as investment property if the relevant criteria are met.
Properties which were acquired for administrative purposes but are currently occupied by a third party tenant with a long term lease in excess of five years are classified as investment property even though there may be no plans to dispose of the assets. If the lease term is less than five years, the asset is not classified as investment property.
The Group’s intention in respect of back of port properties is to hold them strategically for future development. Until the future strategic purpose of these properties is formalised through the relevant governance structures, they shall be held for capital appreciation.
For valuation purposes the external rentals from properties within the precinct, station or intermodal hub as well as back of port properties are used as the basis to determine the fair value of these properties using the normalised income method which entails the capitalisation of the normalised net annual income from the property.
DerecognitionInvestment property is derecognised when it is either disposed of or permanently withdrawn from use and no future economic benefits are expected from its disposal. The difference between the net disposal proceeds and the carrying amount of the asset on retirement or disposal is recognised in profit or loss.

Accounting policies for the year ended 31 March 2020
DerecognitionIntangible assets are derecognised when they are either disposed of or when no future economic benefits are expected from their use or disposal. The difference between the net disposal proceeds, if any, and the carrying amount of the asset on derecognition is recognised in profit or loss.
Impairment of non-financial assetsThe Group’s tangible and intangible assets, other than investment property, non-current assets held-for-sale, inventories and deferred tax assets are assessed for indicators of impairment at each reporting date. Indicators of impairment include factors such as a change in the use of the asset, technological obsolescence, physical damage, change in market conditions – including interest rates, change in the legal environment and other factors affecting the economic performance of the asset. If such indicators exist, the recoverable amount of the asset is estimated. Intangible assets not yet available for use are tested for impairment annually and whenever there are indicators of impairment.
Where an asset does not generate cash flows that are independent from other assets, the Group estimates the recoverable amount of the cash-generating unit to which the asset belongs. The Group considers its operating divisions as separate cash-generating units.
If the recoverable amount of an asset or cash-generating unit is less than its carrying amount, the carrying amount is reduced to the recoverable amount. An impairment loss is recognised immediately in profit or loss, unless the asset is measured at a revalued amount, in which case the impairment loss is treated as a revaluation decrease to the extent of the balance in the revaluation reserve relating to the same asset. Impairment losses recognised in respect of a cash-generating unit are allocated to reduce the carrying amount of the assets in the cash-generating unit on a pro-rata basis.
Calculation of recoverable amountThe recoverable amount of an asset or cash-generating unit is the higher of its fair value less costs of disposal and its value-in-use. Fair value less costs of disposal is the current market value of the asset less any costs relating to the realisation of the asset. In assessing the value-in-use, the expected future cash flows from the asset are discounted to their net present values using a pre-tax discount rate that reflects current market assessments of the time value of money and the risks specific to the asset for which the future cash flows have not been adjusted.
Reversal of impairmentA previously recognised impairment loss is reversed if the recoverable amount increases as a result of a change in the estimates previously used to determine the recoverable amount, to an amount not higher than the carrying amount that would have resulted, net of depreciation or amortisation, had no impairment loss been recognised. A reversal of an impairment loss is recognised immediately in profit or loss, unless the asset is carried at a revalued amount, in which case the reversal is treated as a revaluation increase.
Financial instrumentsRecognition and initial measurementTrade receivables, lease receivables and debt securities are initially recognised when they are originated. All other financial assets and financial liabilities are initially recognised when the Group becomes a party to the contractual provisions of the instrument.
Financial assets (except for trade receivables without a significant financing component) or financial liabilities are initially measured at fair value plus or minus, for items not at fair value through profit or loss (FVTPL), transaction costs that are directly attributable to their acquisition or issue. Trade receivables without a significant financing component are initially measured at the transaction price.
The best evidence of the fair value of a financial instrument at initial recognition is normally the transaction price (i.e. the fair value of the consideration given or received). If the Group determines that the fair value at initial recognition differs from the transaction price, the Group nevertheless recognises the financial instrument at its fair value and accounts for the difference at that date as follows:• If the fair value is evidenced by a quoted price in
an active market for an identical asset or liability (i.e. a Level 1 input) or based on a valuation technique that uses only data from observable markets, the Group recognises the difference between the fair value at initial recognition and the transaction price, also referred to as “day 1 profit or loss” in profit or loss on the fair value line.
• In all other cases, the Group defers the day 1 profit or loss on the statement of financial position in “other financial assets”. After initial recognition, the Group recognises the deferred day 1 profit or loss in profit or loss – on the fair value line – only to the extent that it arises from a change in a factor (including time) that market participants would take into account when pricing the asset or liability. Any amounts not recognised in profit or loss before the date of maturity or derecognition of the financial instrument is recognised in profit or loss on that date.
38 Annual financial statementsAccounting policies

39
Classification and subsequent measurementOn initial recognition, a financial asset is classified as measured at either (i) amortised cost, (ii) at fair value through other comprehensive income (FVTOCI), or (iii) at fair value through profit or loss.
Financial assets are not reclassified subsequent to their initial recognition unless the Group changes its business model for managing financial assets, in which case all affected financial instruments are reclassified on the first day of the financial year following the change in the business model.
A financial asset is measured at amortised cost if it meets both of the following conditions and is not designated at FVTPL on initial recognition:• It is held within a business model whose objective
is to hold assets to collect contractual cash flows; and
• Its contractual terms give rise on specified dates to cash flows that are solely payments of principal plus interest on the principal amount outstanding.
The Group’s financial assets measured at amortised cost include trade and other receivables, contracts assets, short-term deposits and cash and cash equivalents. Cash and cash equivalents comprise cash at bank and on hand, and highly liquid instruments which are readily convertible to known amounts of cash within 90 days from date of acquisition, subject to an insignificant risk of change in value.
For the purposes of the statement of cash flows, cash and cash equivalents include bank overdrafts.
A debt investment is measured at FVTOCI if it meets both of the following conditions and is not designated at FVTPL on initial recognition:• It is held within a business model whose objective
is achieved by both collecting contractual cash flows and selling financial assets; and
• Its contractual terms give rise on specified dates to cash flows that are solely payments of principal plus interest on the principal amount outstanding.
On initial recognition of an equity investment that is not held for trading, the Group may irrevocably elect to present subsequent changes in the investment’s fair value in OCI. This election is made on an investment-by-investment basis.
The Group’s financial assets measured at FVTOCI include investments in Government bonds and equity investments designated as at FVTOCI on initial application of IFRS 9.
All financial assets not classified as measured at amortised cost or at FVTOCI as described above are measured at FVTPL. This includes all derivative financial assets. On initial recognition, the Group may
irrevocably designate a financial asset that otherwise meets the requirements to be measured at amortised cost or at FVTOCI as at FVTPL if doing so eliminates or significantly reduces an accounting mismatch that would otherwise arise.
Business model assessment The Group makes an assessment of the objective of the business model in which a financial asset is held at a portfolio level as this best reflects the way the business is managed and the information provided to management, namely the Group Exco. The Group considers the following sources of information in making the assessment:• The stated policies and objectives of the portfolio
and operation of these policies in practice. These include whether management’s strategy focuses on earning contractual interest income, maintaining a particular interest rate profile, matching the duration of the financial assets to the duration of any related liabilities or expected cash out flows or realising cash flows through the sale of assets;
• How the performance of the portfolio is evaluated and reported to the Group’s management;
• The risks that affect the performance of the business model (and the financial assets held within that business model) and how those risks are managed;
• How the managers of the assets are compensated – e.g. whether compensation is based on the fair value of the assets managed or the contractual cash flows collected; and
• The frequency, volume and timing of sales of financial assets in prior periods, the reasons for such sales and expectations about future sales activity.
Transfers of financial assets to third parties in transactions that do not qualify for derecognition are not considered sales for this purpose, consistent with the Group’s continuing recognition of the assets.
Financial assets that are held for trading or are managed and whose performance is evaluated on a fair value basis are measured at FVTPL.
Assessment of whether contractual cash flows are solely payments of principal and interest For the purposes of this assessment, principal is defined as the fair value of the financial asset on initial recognition. Interest is defined as consideration for the time value of money and for credit risk associated with the principal amount outstanding during a particular period of time and for other basic lending risks and costs (e.g. liquidity and administrative costs), as well as a reasonable profit margin.

Accounting policies for the year ended 31 March 2020
In assessing whether the contractual cash flows are solely payments of principal and interest, the Group considers the contractual terms of the instrument. The group also considers the following:• Contingent events that could change
the amount or timing of cash flows;• Terms that may adjust the contractual coupon rate,
including variable rate features;• Prepayment and extension features; and• Terms that limit the Group’s claim to
cash flows from specified assets (e.g. non-recourse features).
The assessment also includes whether the financial asset contains a contractual term that could change the timing or amount of the contractual cash flows such that it would not meet this condition.
A prepayment feature is consistent with the solely payments of principal and interest criterion if the prepayment amount substantially represents unpaid amounts of principal and interest on the principal outstanding, which may include reasonable additional compensation for early termination of the contract. Additionally, for a financial asset acquired at a significant discount or premium to its contractual par-amount, a feature that permits or requires prepayment at an amount that substantially represents the contractual par amount plus accrued (but unpaid) contractual interest (which may also include reasonable additional compensation for early termination) is treated as consistent with this criterion if the fair value of the prepayment feature is insignificant at initial recognition.
Subsequent measurement and gains and losses Financial assets at FVTPL Subsequently measured at fair value. Net gains and losses, including any
interest or dividend income, are recognised in profit or loss unless they are part of an effective hedge accounting relationship (see policy on derivative financial instruments and hedge accounting).
Financial assets at amortised cost Subsequently measured at amortised cost using the effective interest method. The amortised cost is reduced by impairment losses. Interest income, foreign exchange gains or losses and impairment are recognised in profit or loss. Any gain or loss on derecognition is also recognised in profit or loss.
Debt investment at FVTOCI Subsequently measured at fair value. Interest income calculated using the effective interest rate method, foreign exchange gains and losses and impairment are recognised in profit or loss. Other net gains and losses are recognised in OCI. On derecognition, gains and losses accumulated in OCI are reclassified to profit or loss.
Equity investment at FVTOCI Subsequently measured at fair value. Dividends are recognised as income in profit or loss unless the dividend clearly represents a recovery of part of the cost of the investment. Other net gains and losses are recognised in OCI and are never reclassified to profit or loss.
Financial liabilities: classification, subsequent measurement and gains and lossesFinancial liabilities are classified as measured at amortised cost or at FVTPL. A financial liability is classified as at FVTPL if it is held-for-trading, is a derivative or is designated as such on initial recognition.
The Group’s financial liabilities measured at amortised cost include bonds, loans, trade and other payables and accruals.
A financial liability may be designated at FVTPL on initial recognition if: (a) the contract contains one or more embedded derivatives, (b) such designation would eliminate an accounting mismatch that would otherwise arise from measuring assets and liabilities or recognising the gains or losses on them on
different bases, or (c) a group of financial liabilities or financial assets and financial liabilities is managed and its performance is evaluated on a fair value basis, in accordance with a documented risk management or investment strategy and information about the group is provided internally on that basis to management.
Financial liabilities at FVTPL are measured at fair value and the net gains and losses, including any interest expense, are recognised in profit or loss. Other financial liabilities are subsequently measured at amortised cost using the effective interest rate method. Interest expense, foreign exchanges gains and losses and gains or losses on derecognition are recognised in profit or loss as finance charges, except where they are capitalised to qualifying assets.
40 Annual financial statementsAccounting policies

41
Impairment of financial assetsThe Group uses all available information, in assessing and measuring expected credit losses, including past events, current conditions, reasonable and supportable forecasts that affect the expected collectability of the future cash flows of the instrument.
In applying the forward-looking approach, a distinction is made between:• Financial instruments that have not deteriorated
significantly in credit quality since initial recognition or that have low credit risk (Stage 1); and
• Financial instruments that have deteriorated significantly in credit quality since initial recognition and whose credit risk is not low (Stage 2).
Stage 3 covers financial assets that have objective evidence of impairment at the reporting date.
Under the general approach in IFRS 9, ‘12-month expected credit losses’ are recognised for stage 1 – except for trade and lease receivables and contract assets, where the simplified approach is applied, and ‘lifetime expected credit losses’ are recognised for stages 2 and 3.
The Group recognises loss allowances for expected credit losses (ECLs) on:• Financial assets measured at amortised cost,
which includes trade and lease receivables, short term deposits and bank balances;
• Contract assets (as defined in IFRS 15 Revenue from Contracts with Customers); and
• Debt investments measured at FVTOCI.
Trade and lease receivables and contract assetsThe Group applies the simplified approach in IFRS 9 in measuring expected credit losses which uses a lifetime ECLs allowance for all trade and lease receivables and contract assets. To measure the ECLs; trade and lease receivables and contract assets are grouped based on shared credit risk characteristics and the days past due. The contract assets relate to unbilled work-in-progress and have substantially the same credit risk characteristics as the trade receivables for the same types of contracts. The Group therefore applies the same probability of default rates for trade receivables and the related contract assets.
The expected loss rates are based on the payment profiles of customers over a 5 year period and the corresponding historical credit losses experienced within this period. The historical loss rates are adjusted to reflect current and forward looking information on factors affecting the ability of the customers to settle the receivables. This includes the
customer’s credit risk profile, including their latest credit scores, the general macroeconomic conditions as well as industry sector-specific conditions affecting the Group’s customers.
Investments in Government bonds, short-term deposits and bank balancesThe Group’s investments in Government bonds which are measured at FVTOCI, short-term deposits and bank balances, which are carried at amortised cost are considered to have low credit risk, and the loss allowance recognised on these assets is therefore limited to 12-months ECLs. Management consider ‘low credit risk’ for Government bonds to be an investment grade credit rating with at least one major rating agency. Short term deposits and bank balances are considered to be low credit risk when they have a low risk of default and the issuer has a strong capacity to meet its contractual cash flow obligations in the near term.
If the Group considers that credit risk on a financial instrument has increased significantly since initial recognition, the expected credit losses are estimated based on the lifetime ECLs.
Significant increase in credit risk In assessing whether the credit risk on a financial asset has increased significantly since initial recognition, the Group compares the risk of a default occurring on the financial instrument as at the reporting date with the risk of a default occurring on the financial instrument as at the date of initial recognition. In making this assessment, the Group considers both quantitative and qualitative information that is reasonable and supportable, including historical experience and forward-looking information that is available without undue cost or effort.
Irrespective of the outcome of the above assessment, the Group presumes that the credit risk on a financial asset has increased significantly since initial recognition when contractual payments are more than 30 days past due, unless the Group has reasonable and supportable information that demonstrates otherwise.
Event of default The Group considers the following as constituting an event of default: • The debtor is more than 90 days past due (60 days
for Transnet Properties lease debtors); or• Information developed internally or obtained from
external sources indicates that the debtor is unlikely to pay its credit obligations to the Group in full, without recourse by the Group to actions such as realising security (if any is held).

Accounting policies for the year ended 31 March 2020
Credit-impaired financial assetsAt each reporting date, the Group assesses whether financial assets carried at amortised cost and debt securities at FVTOCI are credit-impaired. A financial asset is credit-impaired when one or more events that have detrimental impact on estimated future cash flows of the financial asset have occurred.
The evidence that a financial asset is credit-impaired includes observable data about any of the following events.• Significant financial difficulty of the debtor or
issuer;• A breach of contract such as default;• Restructuring of a debt, loan or advance by the
Group on terms that the Group would not consider otherwise;
• It is probable that the debtor will enter bankruptcy or other financial reorganisation; or
• The disappearance of an active market for a security because of financial difficulties.
Measurement and recognition of expected credit losses Expected credit losses are a probability-weighted estimate of credit losses. Credit losses are measured as the present value of all cash shortfalls (i.e. the difference between the cash flows due to the Group in accordance with the contract and the cash flows that the Group expects to receive) – calculated either on the 12-month or lifetime expected credit losses as applicable – see above. Expected credit losses are discounted at the effective interest rate of the financial asset.
For lease receivables, the cash flows used for determining the expected credit losses is consistent with the cash flows used in measuring the lease receivable in accordance with IFRS 16 Leases.
Presentation of allowance for expected credit losses The Group recognises an impairment gain or loss in profit or loss with a corresponding adjustment to the carrying amount of the financial asset through a loss allowance account, except for investments in debt instruments that are measured at FVTOCI, for which the loss allowance is recognised in other comprehensive income and accumulated in the investment valuation reserve, and does not reduce the carrying amount of the financial asset in the statement of financial position.
DerecognitionFinancial assetsThe Group derecognises a financial asset when the contractual rights to the cash flows from the financial asset expire, or it transfers the rights to
receive the contractual cash flows in a transaction in which: (a) substantially all the risks and rewards of ownership of the financial asset are transferred, or (b) the Group neither transfers nor retains substantially all the risks and rewards of ownership and it does not retain control of the financial asset.
Transfers of financial assets such as trade receivables under debt discounting arrangements that do not transfer substantially all the risks and rewards from the Group of the transferred assets are not de-recognised.
Write-offThe gross carrying amount of a financial asset is written-off or de-recognised (either partially or in full) when all attempts to recover the outstanding amount have failed or there is no realistic prospect of recovery; e.g. when the counterparty has been placed under liquidation or has entered into bankruptcy proceedings. The amount written-off is recognised as a reduction to the allowance for ECLs.
Financial assets written off may still be subject to enforcement activities under the Group’s recovery procedures, taking into account legal advice where appropriate. Any recoveries made are recognised in profit or loss, as a reduction to the impairment loss for the period.
Financial liabilitiesThe Group derecognises a financial liability when its contractual obligations are discharged or cancelled or expire. The Group also derecognises a financial liability when the terms are modified and the cash flows of the modified liability are substantially different, in which case a new financial liability on the modified terms is recognised at fair value.
On derecognition of a financial liability, the difference between the carrying amount extinguished and the consideration paid (including any non-cash assets transferred or liabilities assumed) is recognised in profit or loss as finance charges.
Derivative financial instruments and hedge accountingDerivative financial instruments The Group holds derivative financial instruments to hedge foreign currency risk, interest rate risk, commodity risk and other market exposures.
Embedded derivatives in non-derivative host contracts that are not financial assets (e.g. financial liabilities) are treated as separate derivatives when (i) they meet the definition of a derivative, (ii) their risks and characteristics are not closely related to those of the host contracts, and (iii) the host contracts are not measured at FVTPL. Derivatives embedded in hybrid contracts that are or contain
42 Annual financial statementsAccounting policies

43
financial assets are not separated. Instead, the entire hybrid contract is classified and subsequently measured as either amortised cost or FVTPL, as appropriate, based on the Group’s policy on classification of financial assets above.
Derivatives are initially measured at fair value. Subsequent to initial recognition, derivatives are measured at fair value, and changes therein are recognised in profit or loss, except where cash flow hedge accounting is applied.
Hedge accountingThe Group designates certain derivatives as hedging instruments to hedge: (a) exposure to changes in the fair value of a recognised asset or liability or an unrecognised firm commitment or a component of any such item, that is attributable to a particular risk and could affect profit or loss (‘fair value hedges’), and (b) exposure to the variability in cash flows that is attributable to a particular risk associated with all, or a component of, a recognised asset or liability or a highly probable forecast transaction (such as foreign exchange rates or interest rates) and could affect profit or loss (‘cash flow hedges’).
At inception of designated hedging relationships, the Group documents the economic relationship between the hedged item and the hedging instrument, including the hedge ratio, along with its risk management objective and strategy for undertaking the hedge.
Furthermore, at the inception of the hedge and on an ongoing basis, the Group documents whether the hedging instrument is effective in offsetting changes in fair values or cash flows of the hedged item attributable to the hedged risk; i.e. whether the hedging relationships meet all of the following hedge effectiveness requirements: • There is an economic relationship between the
hedged item and the hedging instrument;• The effect of credit risk does not dominate the
value changes that result from that economic relationship; and
• The hedge ratio of the hedging relationship is the same as that resulting from the quantity of the hedged item that the Group actually hedges and the quantity of the hedging instrument that the Group actually uses to hedge that quantity of hedged item.
If a hedging relationship ceases to meet the hedge effectiveness requirement relating to the hedge ratio but the risk management objective for that designated hedge relationship remains the same, the Group adjusts the hedge ratio of the hedge relationship (i.e. rebalances the hedge) so that it meets the qualifying criteria again.
The Group designates the full change in the fair value of forward contracts (i.e. including the forward element), and swap contracts (i.e. including the foreign currency basis spread) as the hedging instrument for all of its hedging relationships involving forward and swap contracts.
Fair value hedgesChanges in the fair value of derivatives that are designated as fair value hedges are recognised in profit or loss, or comprehensive income where applicable. Changes in the fair value of the hedged item that are attributable to the hedged risk adjust the carrying amount of the hedged item (if applicable) and are recognised in profit or loss.
When the hedged item in a fair value hedge is a firm commitment (or component thereof) to acquire an asset or assume a liability, the initial carrying amount of the asset or liability that results from the firm commitment is adjusted to include the cumulative change in the fair value of the hedged item that was recognised in the statement of financial position.
Any adjustment to the carrying amount of a financial instrument measured at amortised cost (or a component thereof) arising from fair value hedge accounting as described above is amortised to profit or loss, based on a recalculated effective interest rate at the date that amortisation begins.
Cash flow hedgesThe effective portion of changes in the fair value of a derivative that is designated as a cash flow hedging instrument is recognised in OCI and accumulated in the cash flow hedging reserve. The effective portion of change in the fair value of the derivative that is recognised in OCI is limited to the cumulative change in fair value of the hedged item from inception of the hedge. Any ineffective portion of change in the fair value of the derivative is recognised immediately in profit or loss.
When the hedged forecast transaction subsequently results in the recognition of a non-financial item, such as property, plant and equipment and inventory, the amount accumulated in the cash flow hedging reserve is included directly in the initial cost of the non-financial item when it is recognised. This is not a reclassification adjustment per IAS 1, and hence it does not affect comprehensive income.
For all other hedged forecast transactions, the amount accumulated in the cash flow hedging reserve is reclassified to profit or loss in the same period or periods during which the hedged expected future cash flows affect profit or loss.

Accounting policies for the year ended 31 March 2020
Discontinuation of hedge accountingIf the hedge no longer meets the qualifying criteria for hedge accounting or the hedging instrument is sold, expires, is terminated or is exercised, then hedge accounting is discontinued prospectively. When hedge accounting for cash flow hedges is discontinued, the amount that was previously accumulated in the cash flow hedging reserve remains in equity until, (a) for a hedge of a transaction resulting in recognition of a non-financial item, it is included in the non-financial item’s cost on its original recognition, or (b) for other cash flow hedges, it is reclassified to profit or loss in the same period or periods in which the hedged expected future cash flows affect profit or loss.
If the hedged future cash flows are no longer expected to occur, then the amounts that were previously accumulated in the cash flow hedging reserve are immediately reclassified to profit or loss.
OffsettingAssets and liabilities are offset and the net amount is presented in the statement of financial position when, and only when, the Group currently has a legally enforceable right to set-off the amounts and it intends either to settle on a net basis or to realise the asset and settle the liability simultaneously.
Income and expenses are not offset in profit or loss, except where offsetting reflects the substance of the underlying transaction.
Share capital Issued share capital is stated at the amount of the proceeds received less directly attributable costs of issue.
InventoriesInventories are stated at the lower of cost and net realisable value. Net realisable value is the estimated selling price in the ordinary course of business less estimated costs of completion and selling.
Cost is determined as follows:• Raw materials and consumable stores are stated
at weighted average cost; and• Manufactured goods and work-in-progress are
stated at the weighted average cost of raw material, direct labour and an allocated portion of overheads.
A provision for obsolescence is raised to write down inventory to its net realisable value based on a physical count and inspection of inventory items which is performed at least annually and takes into account the age, condition and usage rates of the inventory.
The cost of inventories used during the period and changes in the provision for obsolescence are recognised in profit or loss.
Non-current assets held-for-saleNon-current assets are classified as held-for-sale if their carrying amount will be recovered principally through a sale transaction rather than continuing use. This condition is met when the sale is highly probable and the asset is available for immediate sale in its present condition.
Immediately before classification as held-for-sale, the measurement of the assets is brought up to date in accordance with applicable IFRS. On initial classification as held-for-sale, non-current assets are recognised at the lower of their carrying amount and fair value less costs to sell.
Impairment losses on initial or subsequent write-down to fair value less costs to sell and gains on subsequent re-measurement are recognised in profit or loss. A gain on subsequent increase in fair value less costs to sell may not exceed the cumulative impairment losses previously recognised on the asset.
Non-current assets classified as held-for-sale are not depreciated or amortised while classified as such.
Where assets classified as held-for-sale are not disposed of within the one-year requirement of the standard, and management believes that the delay was caused by events or circumstances beyond the Group’s control and there is sufficient evidence that the Group remains committed to its plan to sell the assets, such assets will continue to be classified as held-for-sale.
Employee benefitsThe Group operates several defined benefit funds and a defined contribution fund. The assets of each fund are held separately from those of the Group and are administered by the fund’s trustees. The defined benefit funds are actuarially valued for accounting purposes by professional independent consulting actuaries on an annual basis.
Defined contribution fundThe Group’s contributions to the defined contribution fund are recognised in profit or loss in the period to which they relate.
Defined benefit fundsThe benefit costs and obligations under the defined benefit funds are determined separately for each fund using the projected unit credit method.
44 Annual financial statementsAccounting policies

45
The service cost and net interest on the net defined benefit liability or asset are recognised in profit or loss. Where the benefits of a plan are amended or curtailed, the change in the present value of the net defined benefit obligation relating to past service by the employees is recognised in profit or loss in the period of the amendment.
Re-measurements of the net defined benefit liability or asset, comprising actuarial gains and losses, the effect of changes in the asset ceiling, where applicable, and the return on the plan assets, other than interest, are recognised in other comprehensive income in the period in which they arise.
The post-retirement benefit obligation recognised in the statement of financial position represents the present value of the defined benefit obligation less the fair value of any plan assets. An asset resulting from this calculation is recognised only to the extent of any economic benefits available to the Group in the form of refunds or reductions in the future contributions.
Post-retirement medical benefitsPost-retirement medical benefits are provided to qualifying employees and pensioners. The medical benefit costs are determined through annual actuarial valuations by independent consulting actuaries using the projected unit credit method. Actuarial gains or losses are recognised as stated above.
Short-term and long-term benefitsThe cost of all short-term employee benefits, such as salaries, accumulated leave, bonuses, housing allowances, medical and other contributions, is recognised in profit or loss in the period in which the employee renders the related service.
The Group’s obligation in respect of long-term service benefits, other than pension plans and post-retirement medical benefits, is recognised in profit or loss in the period in which the employee renders the related service.
Termination benefitsTermination benefits are payable when an employee’s employment is terminated before the normal retirement date or when an employee accepts voluntary redundancy in exchange for these benefits. The Group recognises termination benefits when it has demonstrated its commitment to either terminate the employment of current employees according to a detailed formal plan without possibility of withdrawal or to provide termination benefits as a result of an offer made to encourage voluntary redundancy.
LeasesGroup as a lesseeAt inception of a new contract, the Group assesses whether the contract is, or contains, a lease. A contract is, or contains, a lease if the contract conveys the right to control the use of an identified asset for a period of time in exchange for consideration. In assessing whether a contract conveys the right to control the use of an identified asset, the Group considers whether:• The contract involves the use of an asset –
explicitly or implicitly identified in the contract – which is physically distinct or represents substantially all the capacity of the asset. If the supplier has a substantive substitution right, then the asset is not identified;
• The Group has the right to obtain substantially all the economic benefits from the use of the asset throughout the period of use; and
• The Group has the right to direct the use of the asset; i.e. the Group has the right to direct how and for what purpose the asset is used, or in rare cases where the decision about how and for what purpose the asset is used is predetermined, the Group has either:
– The right to operate the asset throughout the period of use; or
– The Group designed the asset in such a way that it predetermines how and for what purpose the asset is used.
At inception or on reassessment of a modified contract that contains a lease component, the Group allocates the consideration in the contract to each lease component on the basis of their relative stand-alone prices, and the aggregate stand-alone price of the non-lease components. Non-lease components are recognised as an expense in profit or loss in the period in which they arise, except for leases of motor vehicles in which the Group is the lessee, where the Group has applied the practical expedient in IFRS 16 not to separate the non-lease components and accounts for the lease and non-lease components as a single lease component.
The Group recognises a right-of-use asset and a lease liability at the lease commencement date. The right-of-use asset is initially measured at cost, which comprises the initial amount of the lease liability, adjusted for any lease payments made at or before the commencement date, plus any initial direct costs incurred and an estimate of costs to dismantle and remove the underlying asset or to restore the site on which it is located, less any lease incentives received.
The right-of-use asset is subsequently depreciated using the straight-line method from the commencement date to the earlier of the end of the useful life of the right-or-use asset or the end of the lease term. The estimated useful lives of the

Accounting policies for the year ended 31 March 2020
right-of-use assets are determined on the same basis as those of property, plant and equipment owned by the Group. The right-of-use asset is also adjusted for impairment losses, if any, and for certain re-measurements of the lease liability.
The lease liability is initially measured at the present value of the lease payments that are not paid at the commencement date, discounted using the implicit rate in the lease, or if that rate cannot be readily determined, the Group’s incremental borrowing rate. The incremental borrowing rate is the rate of interest that the Group would pay to borrow over a similar term, with a similar security, the funds necessary to obtain an asset of similar value to the right-of-use asset in a similar economic environment.
Lease payments included in the measurement of the lease liability comprise the following:• Fixed payments, including in-substance fixed
payments;• Variable lease payments that depend on an index
or a rate, initially measured using the index or rate as at the commencement date;
• Amounts expected to be paid under a residual value guarantee; and
• The exercise price under a purchase option that the Group is reasonably certain to exercise, lease payments during an optional extension period if the Group is reasonably certain to exercise the extension option, and penalties for early termination of a lease unless the Group is reasonably certain not to terminate early.
The lease liability is subsequently measured at amortised cost using the effective interest method.
Remeasurement of lease liabilityThe lease liability is remeasured by discounting the remaining lease payments using a revised discount rate if: • There is a change in the lease term; or • If the Group changes its assessment of whether it
will exercise an option to purchase the underlying asset.
The lease liability is remeasured by discounting the remaining lease payments using the original discount rate if there is a change in: • The Group’s estimate of the amount expected to
be payable under a residual value guarantee; or • If there is a change in future lease payments
resulting from a change in an index or a rate used to determine those payments, unless the change in lease payments results from a change in floating rates, in which case the Group uses a revised discount rate that reflects changes in the interest rate.
When the lease liability is remeasured, a corresponding adjustment is made to the carrying amount of the right-of-use asset, or is recognised in profit or loss if the carrying amount of the right-of-use asset has been reduced to zero.
Lease modificationsModifications to the lease are accounted for as a separate lease if they:• Increase the scope of the lease by adding the right
to use one or more underlying assets; and• The consideration for the lease increases by an
amount commensurate with the standalone price for the increase in scope and any appropriate adjustments to that standalone price to reflect the circumstances of the particular contract.
Short-term leases and leases of low-value assetsThe Group does not recognise right-of-use assets and lease liabilities for short-term leases that have a lease term of 12 months or less at the commencement date, and leases of low-value assets with a value when new equal to or less than R50,000. The Group recognises the lease payments associated with these leases as an expense on a straight-line basis over the lease term.
Variable lease expenseVariable lease expenses, which do not depend on an index or a rate, are recognised in profit or loss in the period in which the event giving rise to the expense occurs.
DerecognitionAny gain or loss arising from the partial or full termination of a lease (i.e. derecognition of the right-of-use asset and the corresponding lease liability) is recognised in profit or loss in the period in which it arises.
PresentationThe Group presents the right-of-use assets that do not meet the definition of investment property within property, plant and equipment and the lease liabilities under long-term borrowings and short-term borrowings in the statement of financial position.
Group as a lessorAt inception of a new contract, the Group assesses whether the contract is, or contains, a lease using the above criteria. If the contract is or contains a lease, the Group determines whether each lease is a finance lease or an operating lease. To classify each lease, the Group assesses whether the lease transfers
46 Annual financial statementsAccounting policies

47
substantially all of the risks and rewards incidental to ownership of the underlying assets. If this is the case, the lease is classified as a finance lease, otherwise it is classified as an operating lease.
If the arrangement contains lease and non-lease components, the Group allocates the consideration in the contract to each component on the basis of their relative standalone prices.
Finance leasesFor assets leased out under a finance lease, the Group derecognises the leased asset and recognises the net investment in the lease as a receivable. The difference between the gross receivable and the present value of the receivable is recognised as unearned finance income. Lease income is recognised over the term of the lease using the net investment method, which reflects a constant periodic rate of return.
Operating leasesAssets leased to third parties under operating leases are included in property, plant and equipment or investment property. Lease income, net of any incentives given to the lessee, is recognised in profit or loss on a straight-line basis over the lease term.
Mandatory leasehold improvements to the Group’s assets by lessees, in accordance with the provisions of the lease agreement or concession arrangement, are recognised as an asset and are measured at their fair value on completion date, with a corresponding credit to deferred lease income. Subsequently, the deferred lease income is recognised in profit or loss on a straight-line basis over the lease or concession period.
Sale and leasebackWhere the Group transfers an asset to another entity and immediately leases the same asset back from the buyer-lessor, the Group applies the requirements in IFRS 15 for determining when a performance obligation is satisfied to determine whether the transfer is accounted for as a sale of that asset.
Transfer of the asset is a saleIf the transfer is a sale, the Group measures the right-of-use asset arising from the leaseback at the proportion of the previous carrying amount of the asset that relates to the right-of-use asset retained by the Group, and recognises only the gain or loss that relates to the rights transferred to the buyer-lessor.
If the fair value of the consideration for the sale of the asset does not equal the fair value of the asset, or if payments for the lease are not at market rates, the Group makes the following adjustments to measure the sale proceeds at fair value:
• Any below-market terms are accounted for as prepayment of lease payments; and
• Any above-market terms are accounted for as additional financing provided by the buyer-lessor to the Group.
The Group makes the above adjustment on the basis of the more readily determinable of:• The difference between the fair value of the
consideration for the sale and the fair value of the asset; or
• The difference between the present value of the contractual payments for the lease and the present value of the payments for the lease at market prices.
Transfer of the asset is not a saleIf the transfer is not a sale, the Group continues to recognise the transferred asset and recognises a financial liability equal to the transfer proceeds in accordance with IFRS 9 Financial Instruments.
Provisions and contingenciesProvisions are recognised when the Group has a present legal or constructive obligation, as a result of a past event, and it is probable that the Group will be required to settle the obligation, and a reliable estimate can be made of the amount of the obligation.
The provision is recognised at the best estimate of the consideration required to settle the obligation at the end of the reporting period, taking into account the risks and uncertainties surrounding the obligation. Where the effect of time value of money is material, the provision is determined by discounting the expected future cash flows at a pre-tax rate that reflects current market assessments of the time value of money and the risks specific to the liability. The unwinding of the discount in subsequent financial periods is recognised as an expense in profit or loss under finance costs.
When some or all of the economic benefits required to settle a provision are expected to be recovered from a third party, a receivable is recognised as an asset when it is virtually certain that the reimbursement will be received and the amount of the receivable can be measured reliably.
Decommissioning liabilitiesA provision for the dismantling and removal of an item of property, plant and equipment and restoring the site is recognised when the Group has a present obligation, legal or constructive, to decommission the asset and restore the site on which the asset is located and a reliable estimate can be made of the amount of the obligation.

Accounting policies for the year ended 31 March 2020
The amount recognised as a provision is the best estimate of the cost to dismantle and remove the item and rehabilitate the site and may change from year to year taking into account the changes in intended use of the asset, new techniques and know-how in rehabilitating affected sites, estimated risks and uncertainties surrounding the obligation and the time value of money. These estimates are reviewed at least annually.
The initial estimate of costs to decommission an asset, the obligation for which arises as a result of either having acquired or constructed the asset or as a consequence of having used the asset in the current and/or prior periods for purposes other than to produce inventories, is capitalised as part of the cost of the asset. Where the obligation arises as a result of having used the asset to produce inventories, the decommissioning costs are recognised as part of the cost of the inventory.
The effect of subsequent changes to assumptions in estimating an obligation for which the provision was recognised as part of the cost of the asset is adjusted against the cost of the asset unless the asset is carried under the revaluation model.
For assets carried under the revaluation model, changes in the provision are accounted for as follows:• A decrease in the decommissioning liability is
recognised in other comprehensive income and increases the revaluation surplus within equity, except that it is recognised in profit or loss to the extent that it reverses a revaluation deficit on the asset that was previously recognised in profit or loss.
• An increase in the decommissioning liability is recognised in profit or loss, except that it is recognised in other comprehensive income and reduces the revaluation surplus within equity to the extent of any credit balance existing in the revaluation surplus in respect of that asset.
Environmental liabilitiesIn accordance with the Group’s environmental policy and applicable legislation, a provision for environmental rehabilitation costs is recognised when the Group has a present obligation, legal or constructive, as a result of a past event and a reliable estimate can be made of the amount of the obligation.
The Group’s environmental obligations arise from legislation which requires the Group to rehabilitate quarries, remove waste material and remediate land contaminated by asbestos, ferromanganese, manganese, mixed soil (including chrome, sulphur and manganese), fuel, rubble and ballast.
A number of factors are considered in determining the amount of the obligation, including: • The nature and extent of the contamination;• The appropriate method to remediate the
contamination;• The cost per ton/square metre/kilometre of
removal and disposal of the contamination, including transportation costs where applicable;
• The cost of rehabilitation of the identified areas of contamination; and
• The costs for the removal and replacement of asbestos roof sheeting and cladding on buildings.
The provision is initially recognised as an expense in profit or loss and is reviewed at least annually. Subsequent changes to the provision are recognised prospectively in profit or loss as a change in accounting estimate.
Onerous contractsA provision for onerous contracts is recognised when the unavoidable costs of meeting the Group’s obligations under a contract exceed the economic benefits expected to be received under the contract.
Contingent liabilitiesContingent liabilities are not recognised in the financial statements but are disclosed in the notes to the financial statements unless the probability of occurrence is remote.
Contingent assetsContingent assets are not recognised in the financial statements and are only disclosed in the notes to the financial statements where an inflow of economic benefits is probable.
Financial guarantee contracts The Group recognises financial guarantee contracts initially at fair value. Subsequently they are measured at the higher of:• The amount of loss allowance determined in
accordance with IFRS 9 Financial Instruments, and • The amount initially recognised less, where
appropriate, the cumulative amount of income recognised in accordance with the principles of IFRS 15 Revenue from Contracts with Customers.
48 Annual financial statementsAccounting policies

49
Legal claimsA provision for legal claims is recognised when the Group has a present obligation as a result of a past event, it is probable that the Group will be required to settle the obligation, and a reliable estimate can be made of the amount of the obligation taking into account legal opinion and the risk and uncertainties surrounding the claim.
Compensation receivableCompensation receivable from third parties, such as insurance companies in respect of assets that are impaired or lost or for any other loss incurred, is recognised in the profit or loss when it is virtually certain that the payment will be received and the amount can be measured reliably.
The compensation receivable is treated as a separate transaction and is not offset against the original loss recognised in profit or loss.
Segment information disclosureFor management purposes, the Group is organised into five Operating divisions, based on products and services, which represent the main segments for reporting segment information in accordance with IFRS 8 Operating Segments. The operating segments are identified based on internal reports that the Group executive team reviews regularly in allocating resources to segments and in assessing their performance. All the Group’s major operations are located in the Republic of South Africa.
Transfer prices between operating segments are on an arm’s-length basis, similar to transactions with third parties. Inter-segment revenues are eliminated upon consolidation and reflected in the ‘elimination of inter-segment transactions’ column of the segment report.
Irregular, fruitless and wasteful expenditureIrregular expenditure is defined as expenditure, other than unauthorised expenditure, incurred in contravention of or that is not in accordance with a requirement of any applicable legislation.
When confirmed, irregular expenditure is disclosed in the notes to the financial statements, at the amount equal to the value of the irregular expenditure incurred unless it is impracticable to determine the value thereof. Where such impracticality exists, the reasons therefore are provided in the notes. Irregular expenditure is removed from the notes when it is either (a) condoned by the National Treasury or the relevant authority; (b) it is transferred to receivables for recovery; or (c) it is not condoned and is irrecoverable. A receivable related to irregular expenditure is only recognised in the financial statements when it is virtually certain that the payment will be received and the amount can be measured reliably.
Fruitless and wasteful expenditure is defined as expenditure which was made in vain and would have been avoided had reasonable care been exercised. Fruitless and wasteful expenditure is recognised as expenditure in profit or loss in the period in which it is identified, and disclosed in the notes to the annual financial statements. The expenditure is classified in accordance with the nature of the expense. Fruitless and wasteful expenditure is removed from the notes to the financial statements when it is resolved or transferred to receivables for recovery. A receivable is only recognised in the financial statements when it is virtually certain that the payment will be received and the amount can be measured reliably.
Financial reporting standards and interpretations issued but not yet effectiveThe following new or revised International Financial Reporting Standards, amendments and interpretations, which are applicable to the Group were not yet effective for the year ended 31 March 2020 and were not applied in preparing these financial statements. Transnet will not be early adopting any of the standards on pages 50 and 51.

Accounting policies for the year ended 31 March 2020
Standard or interpretation Detail Effective date
IAS 1 and IAS 8(amendments)
Presentation of financial statements, and accounting policies, changes in accounting estimates and errors
Definition of ‘material’The amendments clarify and align the definition of ‘material’ and provide guidance to help improve consistency in the application of that concept whenever it is used in IFRS Standards.
Classification of liabilitiesNarrow-scope amendments to IAS 1 to clarify how to classify debt and other liabilities as current or non-current.
The revised standards will not have a material impact on the Group’s financial statements.
Annual periods beginning on or after 1 January 2020.
Annual periods beginning on or after 1 January 2022.
IFRS 3 (amendment)
Business combinations
Definition of a businessThe amendments confirmed that a business must include inputs and a process, and• Further narrowed the definitions of a business by focusing the definition of
outputs on goods and services provided to customers and other income from ordinary activities, rather than on providing dividends or other economic benefits directly to investors or lowering costs; and
• Added a test that makes it easier to conclude that a company has acquired a group of assets, rather than a business, if the value of the assets acquired is substantially all concentrated in a single asset or group of similar assets.
Reference to the Conceptual FrameworkThe amendment updates a reference in IFRS 3 to the Conceptual Framework for financial reporting without changing the accounting requirements for business combinations.
The amendments will be applied prospectively and will not have a material impact on the Group’s financial statements.
Annual periods beginning on or after 1 January 2020.
Annual periods beginning on or after 1 January 2022.
IFRS 7 and IFRS 9 (amendments)
Financial instruments and financial instruments: disclosure
Interest rate benchmark reformThe amendments to IFRS 9, IAS 39 and IFRS 7 amend requirements for hedge accounting to support the provision of useful financial information during the period of uncertainty caused by the phasing out of interest-rate benchmarks such as interbank offered rates (IBORs) on hedge accounting. • The amendments modify some specific hedge accounting requirements to provide
relief from potential effects of the uncertainty caused by the IBOR reform. • In addition, the amendments require companies to provide additional information
to investors about their hedging relationships which are directly affected by these uncertainties.
The amendments will be applied retrospectively and will not have a material impact on the Group’s financial statements.
Annual periods beginning on or after 1 January 2020.
IFRS 9 (amendments)
Financial instruments
Annual improvements to IFRS 2018 – 2020The amendment clarifies which fees an entity includes when it applies the 10% test in assessing whether to derecognise a financial liability.
The amendment will not have a material impact on the Group’s financial statements.
Annual periods beginning on or after 1 January 2020.
IFRS 10 and IAS 28(amendment)
Consolidated financial statements and investments in associates and joint ventures
Sale or contribution of assets between an investor and its associate or joint ventureNarrow-scope amendment to address an acknowledged inconsistency between the requirements in IFRS 10 and those in IAS 28 (2011), in dealing with the sale or contribution of assets between an investor and its associate or joint venture.
The revised standard will be applied prospectively and will not have a material impact on the Group’s financial statements.
Effective date to be determined.
50 Annual financial statementsAccounting policies

51
Standard or interpretation Detail Effective date
IFRS 16(amendment)
Leases
Covid-19 related rent concessions The amendment provides lessees with an exemption from assessing whether a Covid-19-related rent concession (a concession that reduces lease payments due on or before 30 June 2021) is a lease modification. Previously, IFRS 16 required the lessee to assess whether a change in lease payments is a lease modification by considering whether there has been a change in the scope of a lease or the consideration for a lease.
The amendments are not expected to have a material impact on the Group’s financial statements.
Annual periods beginning on or after 1 June 2020.
IAS 16(amendment)
Property, plant and equipment
Proceeds before intended use The amendments prohibit an entity from deducting from the cost of an item of property, plant and equipment any proceeds from selling items produced while bringing that asset to the location and condition necessary for it to be capable of operating in the manner intended by management. Instead, an entity recognises the proceeds from selling such items, and the cost of producing those items, in profit or loss.
The revised standard will not have a material impact on the Group’s financial statements.
Annual periods beginning on or after 1 June 2020.
IAS 37(amendment)
Provisions, contingent liabilities and contingent assets
Onerous contracts – cost of fulfilling a contractThe amendments specify which costs should be included in an entity’s assessment of whether a contract will be loss-making.
The revised standard will not have a material impact on the Group’s financial statements.
Annual periods beginning on or after 1 June 2022.
The financial reporting standards, amendments or interpretations listed below are currently not applicable to the Group and will have no impact on the Group’s financial statements:
Standard or interpretation Detail Effective date
IFRS 17(new)
Insurance contracts
IFRS 17 creates a single accounting model for all insurance contracts under IFRS. The standard requires an entity to:• Measure insurance contracts using updated estimates and assumptions that reflect
the timing of cash flows and take into account any uncertainty relating to insurance contracts;
• Reflect the time value of money in estimated payments required to settle incurred claims;
• Measure insurance contracts based only on the obligations created by the contracts; • Recognise profits as an insurance service is delivered, rather than on receipt of
premiums.
This standard replaces IFRS 4 Insurance Contracts.
Annual periods beginning on or after 1 January 2023.
IAS 41(amendment)
Agriculture
Annual improvements to IFRS 2018 – 2020The amendment removes the requirement for entities to exclude taxation cash flows when measuring the fair value of a biological asset using a present value technique.
The revised standard will not have a material impact on the Group’s financial statements.
Annual periods beginning on or after 1 June 2022.

52 Annual financial statementsConsolidated financial statements
Company Group
2019 2020 2020 2019R million R million Notes R million R million
74 070 75 065 Revenue 1 75 065 74 070
(40 348) (41 079)Net operating expenses excluding depreciation, derecognition and amortisation 2 (41 081) (40 320)
33 722 33 986 Profit from operations before depreciation, derecognition, amortisation and items listed below 33 984 33 750
(14 274) (14 955) Depreciation, derecognition and amortisation 3 (14 955) (14 274)
19 448 19 031 Profit from operations before the items listed below 4.1 19 029 19 476 (444) (799) Impairment of financial assets 4.2.1 (799) (444)
(2 244) (1 544) Impairment of non-financial assets 4.2.2 (1 544) (2 244)— 3 Dividends received 4.3
(287) (221) Post-retirement benefit obligation expense 4.4 (221) (287) 3 273 763 Fair value adjustments 5 762 3 271
Income from associates and joint ventures 13 19 19
19 746 17 233 Profit from operations before net finance costs 17 246 19 791 (11 597) (11 337) Finance costs 6 (11 337) (11 597)
368 148 Finance income 7 171 387
8 517 6 044 Profit before tax 6 080 8 581 (2 526) (2 136) Tax 8 (2 142) (2 534)
5 991 3 908 Profit for the year 3 938 6 047
Income statements for the year ended 31 March 2020

53
Statements of comprehensive income for the year ended 31 March 2020
Company Group
2019 2020 2020 2019R million R million Notes R million R million
5 991 3 908 Profit for the year 3 938 6 047
Other comprehensive (loss)/income
(18 616) (22 246)Net items that will not be reclassified subsequently to profit or loss (22 246) (18 616)
(25 897) (30 934) Items that will not be reclassified subsequently to profit or loss (30 934) (25 897)
(25 987) (31 055) – Loss on revaluations (31 055) (25 987) 90 121 – Actuarial gain on post-retirement benefit obligations 121 90
7 281 8 688 Tax relating to components that will not be reclassified subsequently to profit or loss 8.1 8 688 7 281
597 (76) Net items that may be reclassified subsequently to profit or loss (96) 595
810 (105) Items that may be reclassified subsequently to profit or loss (140) 806
793 (104) – (Loss)/gain on cash flow hedges (104) 793 17 (1) – (Loss)/gain on revaluation (36) 13
(213) 29 Tax relating to components that may be reclassified subsequently to profit or loss 8.1 44 (211)
(18 019) (22 322) Other comprehensive loss for the year, net of tax (22 342) (18 021)
(12 028) (18 414) Total comprehensive loss for the year (18 404) (11 974)

54 Annual financial statementsConsolidated financial statements
Disclosure of components of other comprehensive incomefor the year ended 31 March 2020
Company Group
2019 2020 2020 2019R million R million Notes R million R million
Items that will not be reclassified subsequently to profit or loss
(18 681) (22 333) Net loss on revaluation reserve (22 333) (18 681)
(25 987) (31 055) Loss on revaluations (31 055) (25 987)
698 427 – Gain on revaluation of pipeline networks 22 427 698 (3 592) (16 631) – Loss on revaluation of port facilities 22 (16 631) (3 592)
(23 191) (14 905) – Loss on revaluation of rail infrastructure 22 (14 905) (23 191) (42) 38 – Decommissioning restoration liability adjustment 22 38 (42)
140 16 – Net gain on revaluation of land, buildings and structures 22 16 140 7 306 8 722 Tax effect of revalued items 8.1 8 722 7 306
65 87 Net actuarial gain on post-retirement benefit obligations 87 65
90 121 Actuarial gain on post-retirement benefit obligations 22 121 90
11 12 – Actuarial gain on the Transport Pension Fund:
Transnet Sub-fund 32.1.2 12 11 3 3 – Actuarial gain on the Transnet Top Management pensions 32.1.4 3 3
38 43 – Actuarial gain on the Transnet Workmen’s Compensation
Act pensioners 32.1.4 43 38
32 22 – Actuarial gain on the Transnet SATS pensioners medical
benefits 32.2.1 22 32 6 41 – Actuarial gain on the Transnet employees’ medical benefits 32.2.2 41 6
(25) (34) Tax effect of net actuarial gains 8.1 (34) (25)
Items that may be reclassified subsequently to profit or loss
13 (1) Net (loss)/gain on revaluation reserve (21) 11
— — – Loss on revaluation of debt investment 22 (35) (4) 17 (1) – (Loss)/gain on revaluation of equity investment 22 (1) 17
(4) — – Taxation effect of revalued items 8.1 15 (2)
584 (75) Net loss on cash flow hedging reserve (75) 584
793 (104) – (Loss)/gain on cash flow hedges 22 (104) 793 (209) 29 – Tax effect of cash flow hedge loss 8.1 29 (209)
(18 019) (22 322) Other comprehensive loss for the year (22 342) (18 021)
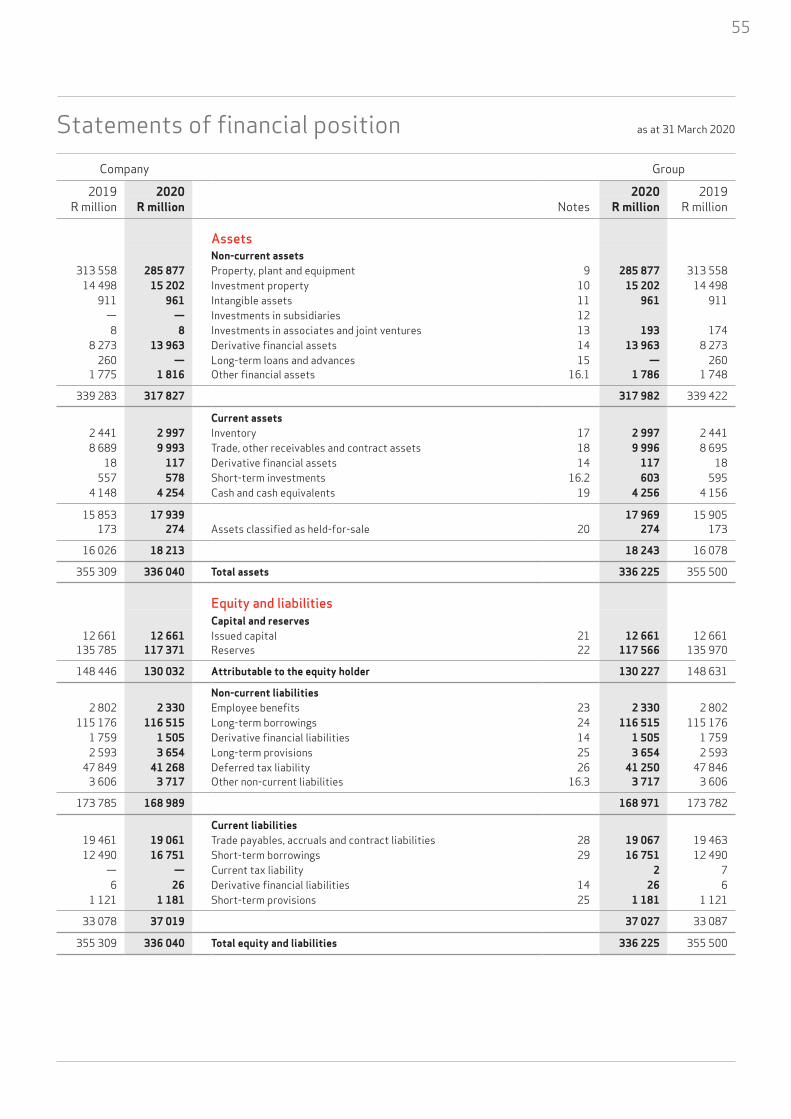
Statements of financial position as at 31 March 2020
55
Company Group
2019 2020 2020 2019R million R million Notes R million R million
AssetsNon-current assets
313 558 285 877 Property, plant and equipment 9 285 877 313 558 14 498 15 202 Investment property 10 15 202 14 498
911 961 Intangible assets 11 961 911 — — Investments in subsidiaries 12 8 8 Investments in associates and joint ventures 13 193 174
8 273 13 963 Derivative financial assets 14 13 963 8 273 260 — Long-term loans and advances 15 — 260
1 775 1 816 Other financial assets 16.1 1 786 1 748
339 283 317 827 317 982 339 422
Current assets 2 441 2 997 Inventory 17 2 997 2 441 8 689 9 993 Trade, other receivables and contract assets 18 9 996 8 695
18 117 Derivative financial assets 14 117 18 557 578 Short-term investments 16.2 603 595
4 148 4 254 Cash and cash equivalents 19 4 256 4 156
15 853 17 939 17 969 15 905 173 274 Assets classified as held-for-sale 20 274 173
16 026 18 213 18 243 16 078
355 309 336 040 Total assets 336 225 355 500
Equity and liabilitiesCapital and reserves
12 661 12 661 Issued capital 21 12 661 12 661 135 785 117 371 Reserves 22 117 566 135 970
148 446 130 032 Attributable to the equity holder 130 227 148 631
Non-current liabilities 2 802 2 330 Employee benefits 23 2 330 2 802
115 176 116 515 Long-term borrowings 24 116 515 115 176 1 759 1 505 Derivative financial liabilities 14 1 505 1 759 2 593 3 654 Long-term provisions 25 3 654 2 593
47 849 41 268 Deferred tax liability 26 41 250 47 846 3 606 3 717 Other non-current liabilities 16.3 3 717 3 606
173 785 168 989 168 971 173 782
Current liabilities 19 461 19 061 Trade payables, accruals and contract liabilities 28 19 067 19 463 12 490 16 751 Short-term borrowings 29 16 751 12 490
— — Current tax liability 2 7 6 26 Derivative financial liabilities 14 26 6
1 121 1 181 Short-term provisions 25 1 181 1 121
33 078 37 019 37 027 33 087
355 309 336 040 Total equity and liabilities 336 225 355 500

56 Annual financial statementsConsolidated financial statements
Statements of changes in equity for the year ended 31 March 2020
Revalu- Actuarial Cash flowIssued ation gains and hedging Retainedcapital reserve losses reserve Other* earnings Total
R million R million R million R million R million R million R million
CompanyOpening balances as at 1 April 2018 12 661 85 598 2 374 (1 010) 250 60 601 160 474
Profit for the year — — — — — 5 991 5 991Other comprehensive (loss)/income for the year (net of tax) — (18 668) 65 584 — — (18 019)Transfer to retained earnings — (96) — — — 96 —
Balances at 31 March 2019 12 661 66 834 2 439 (426) 250 66 688 148 446
Profit for the year — — — — — 3 908 3 908 Other comprehensive (loss)/income for the year (net of tax) — (22 334) 87 (75) — — (22 322)Transfer to retained earnings — (73) — — — 73 —
Balances at 31 March 2020 12 661 44 427 2 526 (501) 250 70 669 130 032
GroupOpening balances as at 1 April 2018 12 661 85 598 2 374 (1 010) 249 60 733 160 605
Profit for the year — — — — — 6 047 6 047Other comprehensive (loss)/income for the year (net of tax) — (18 670) 65 584 — — (18 021)Transfer to retained earnings — (96) — — — 96 —
Balances at 31 March 2019 12 661 66 832 2 439 (426) 249 66 876 148 631
Profit for the year — — — — — 3 938 3 938 Other comprehensive (loss)/income for the year (net of tax) — (22 354) 87 (75) — — (22 342)Transfer to retained earnings — (73) — — — 73 —
Balances at 31 March 2020 12 661 44 405 2 526 (501) 249 70 887 130 227
* Other reserves relate to the share of pension fund surplus (retained for application against pensioners).

57
Statements of cash flows for the year ended 31 March 2020
Company Group
2019 2020 2020 2019R million R million Notes R million R million
21 919 21 965 Cash flows from operating activities 21 946 21 930
35 143 35 950 Cash generated from operations 34.1 35 911 35 165 (1 610) (2 501) Changes in working capital 34.2 (2 493) (1 633)
33 533 33 449 Cash generated from operations after working capital changes 33 418 33 532 (10 968) (10 968) Finance costs 34.3 (10 968) (10 968)
368 148 Finance income 34.4 171 387 — — Tax paid 34.5 (11) (7)
(144) (155) Settlement of post–retirement benefit obligations (155) (144) (870) (509) Derivatives settled and raised (509) (870)
(19 830) (20 158) Cash flows utilised in investing activities (20 145) (20 124)
(15 024) (15 351) Investment to maintain operations (15 338) (15 318)
(14 682) (15 086) Replacements to property, plant and equipment (15 086) (14 682) (9) (6) Acquisition of investment property (6) (9)
(118) (177) Acquisition of intangible assets (177) (118) (112) (107) Borrowing costs capitalised (107) (112) 130 84 Proceeds on the disposal of property, plant and equipment 84 130
28 — Proceeds on the disposal of investment property — 28— 3 Dividend income — —
(258) — Net advances of long-term loans and advances — (258) (3) (62) Net increase in other investments (46) (297)
(4 806) (4 807) Investment to expand operations (4 807) (4 806)
(3 259) (3 475) Expansions – property, plant and equipment (3 475) (3 259) (1 547) (1 332) Borrowing costs capitalised (1 332) (1 547)
(2 028) (1 701) Cash flows utilised in financing activities (1 701) (2 030)
8 389 11 357 Borrowings raised* 11 357 8 387 (10 417) (13 058) Borrowings repaid (13 058) (10 417)
61 106 Net increase/(decrease) in cash and cash equivalents 100 (224) 4 087 4 148 Cash and cash equivalents at the beginning of the year 4 156 4 380
4 148 4 254 Total cash and cash equivalents at the end of the year 34.6 4 256 4 156
* Borrowings raised excludes deferred interest of R453 million (2019: R702 million), refer note 34.3 and for the prior year also excludes the IFRS 16 lease liability transitional adjustment of R777 million.

58 Annual financial statementsConsolidated financial statements
Segment information for the year ended 31 March 2020
Other EliminationNational Total for segments of inter-
Ports Port reportable and other segmentFreight Rail Engineering Authority Terminals Pipelines segments adjustments1 transactions Total
R million R million R million R million R million R million R million R million R million
Revenue from contracts with customers 43 145 875 8 864 13 809 5 674 72 367 — — 72 367
Coal 14 930 — — — — 14 930 — — 14 930Iron ore and manganese 13 804 — — — — 13 804 — — 13 804Mineral mining and chrome 5 767 — — — — 5 767 — — 5 767Steel and cement 4 090 — — — — 4 090 — — 4 090Agricultural and bulk liquids 1 993 — — — — 1 993 — — 1 993Marine services — — 2 326 — — 2 326 — — 2 326Containers 1 989 — 3 768 6 860 — 12 617 — — 12 617Automotive 321 — 371 925 — 1 617 — — 1 617Break-bulk — — 124 2 123 — 2 247 — — 2 247Bulk — — 1 983 3 894 — 5 877 — — 5 877Pipelines – oil and gas — — — — 5 619 5 619 — — 5 619Engineering — 875 — — — 875 — — 875Other2 251 — 292 7 55 605 — — 605
Other revenue 466 — 1 436 — 53 1 955 743 — 2 698
Lease income 466 — 1 436 — — 1 902 738 2 640Government grant — — — — 53 53 — — 53Finance income from lending activities — — — — — — 5 — 5
External revenue3 43 611 875 10 300 13 809 5 727 74 322 743 — 75 065Internal revenue 1 016 11 004 1 872 — 5 13 897 1 281 (15 178) —
Total revenue 44 627 11 879 12 172 13 809 5 732 88 219 2 024 (15 178) 75 065Energy costs (5 666) (224) (593) (734) (322) (7 539) (159) — (7 698)Maintenance costs (1 884) (183) (335) (413) (122) (2 937) (50) 1 766 (1 221)Material costs (606) (4 098) (87) (562) (5) (5 358) 47 4 612 (699)Personnel costs (13 434) (5 705) (2 518) (4 842) (473) (26 972) (1 927) 5 622 (23 277)Other costs4 (4 242) (864) (773) (2 470) (1 000) (9 349) (2 013) 3 176 (8 186)
Earnings before interest, tax, depreciation, derecognition and amortisation (EBITDA) 18 795 805 7 866 4 788 3 810 36 064 (2 078) (2) 33 984Depreciation and amortisation (8 780) (975) (2 182) (1 465) (1 282) (14 684) (513) 242 (14 955)Impairment of assets (1 971) (288) (33) 351 (2) (1 943) (400) — (2 343)Dividends received and income from associates — — — — — — 19 — 19Fair value adjustments and post-retirement benefit obligation expense 97 4 588 3 — 692 (151) — 541Finance costs (6 087) (1 404) (1 100) 98 (914) (9 407) (13 740) 11 810 (11 337)Finance income 30 12 13 87 6 148 11 833 (11 810) 171
Profit before tax 2 084 (1 846) 5 152 3 862 1 618 10 870 (5 030) 240 6 080
Total assets5 166 531 18 901 76 399 18 784 43 210 323 825 28 515 (16 389) 335 951Total liabilities 120 691 20 669 28 093 3 356 19 302 192 111 25 364 (11 477) 205 998Capital expenditure6 13 932 306 1 626 2 224 412 18 500 61 — 18 561Cash generated from operations after working capital changes 16 956 (255) 7 461 4 701 4 336 33 199 219 n/a 33 418EBITDA margin (%) 42,1 6,8 64,6 34,7 66,5 40,9 n/a n/a 45,3Number of employees 26 053 9 851 4 155 8 063 674 48 796 1 764 n/a 50 5601 Other adjustments include the Corporate Centre functions. 2 Other revenue relates mainly to lighthouse related tariff income, the use of ship repair facility related income at the ports, telecommunication services
provided on the rail network and rail related demurrage income.3 Revenue from segments below the quantitative thresholds are attributable to two specialist units, namely Transnet Property, which manages internal and
external leases of commercial and residential property and Transnet Group Capital which manages the Group’s large capital projects.4 Other costs include the remaining net operating expense line items as disclosed in note 2.5 Excludes assets held-for-sale.6 Excludes capitalised borrowing costs; includes capitalised finance leases and capitalised decommissioning liabilities.

59
Other EliminationNational Total for segments of inter-
Ports Port reportable and other segmentFreight Rail Engineering Authority Terminals Pipelines segments adjustments1 transactions Total
R million R million R million R million R million R million R million R million R million
Revenue from contracts with customers 43 145 875 8 864 13 809 5 674 72 367 — — 72 367
Coal 14 930 — — — — 14 930 — — 14 930Iron ore and manganese 13 804 — — — — 13 804 — — 13 804Mineral mining and chrome 5 767 — — — — 5 767 — — 5 767Steel and cement 4 090 — — — — 4 090 — — 4 090Agricultural and bulk liquids 1 993 — — — — 1 993 — — 1 993Marine services — — 2 326 — — 2 326 — — 2 326Containers 1 989 — 3 768 6 860 — 12 617 — — 12 617Automotive 321 — 371 925 — 1 617 — — 1 617Break-bulk — — 124 2 123 — 2 247 — — 2 247Bulk — — 1 983 3 894 — 5 877 — — 5 877Pipelines – oil and gas — — — — 5 619 5 619 — — 5 619Engineering — 875 — — — 875 — — 875Other2 251 — 292 7 55 605 — — 605
Other revenue 466 — 1 436 — 53 1 955 743 — 2 698
Lease income 466 — 1 436 — — 1 902 738 2 640Government grant — — — — 53 53 — — 53Finance income from lending activities — — — — — — 5 — 5
External revenue3 43 611 875 10 300 13 809 5 727 74 322 743 — 75 065Internal revenue 1 016 11 004 1 872 — 5 13 897 1 281 (15 178) —
Total revenue 44 627 11 879 12 172 13 809 5 732 88 219 2 024 (15 178) 75 065Energy costs (5 666) (224) (593) (734) (322) (7 539) (159) — (7 698)Maintenance costs (1 884) (183) (335) (413) (122) (2 937) (50) 1 766 (1 221)Material costs (606) (4 098) (87) (562) (5) (5 358) 47 4 612 (699)Personnel costs (13 434) (5 705) (2 518) (4 842) (473) (26 972) (1 927) 5 622 (23 277)Other costs4 (4 242) (864) (773) (2 470) (1 000) (9 349) (2 013) 3 176 (8 186)
Earnings before interest, tax, depreciation, derecognition and amortisation (EBITDA) 18 795 805 7 866 4 788 3 810 36 064 (2 078) (2) 33 984Depreciation and amortisation (8 780) (975) (2 182) (1 465) (1 282) (14 684) (513) 242 (14 955)Impairment of assets (1 971) (288) (33) 351 (2) (1 943) (400) — (2 343)Dividends received and income from associates — — — — — — 19 — 19Fair value adjustments and post-retirement benefit obligation expense 97 4 588 3 — 692 (151) — 541Finance costs (6 087) (1 404) (1 100) 98 (914) (9 407) (13 740) 11 810 (11 337)Finance income 30 12 13 87 6 148 11 833 (11 810) 171
Profit before tax 2 084 (1 846) 5 152 3 862 1 618 10 870 (5 030) 240 6 080
Total assets5 166 531 18 901 76 399 18 784 43 210 323 825 28 515 (16 389) 335 951Total liabilities 120 691 20 669 28 093 3 356 19 302 192 111 25 364 (11 477) 205 998Capital expenditure6 13 932 306 1 626 2 224 412 18 500 61 — 18 561Cash generated from operations after working capital changes 16 956 (255) 7 461 4 701 4 336 33 199 219 n/a 33 418EBITDA margin (%) 42,1 6,8 64,6 34,7 66,5 40,9 n/a n/a 45,3Number of employees 26 053 9 851 4 155 8 063 674 48 796 1 764 n/a 50 5601 Other adjustments include the Corporate Centre functions. 2 Other revenue relates mainly to lighthouse related tariff income, the use of ship repair facility related income at the ports, telecommunication services
provided on the rail network and rail related demurrage income.3 Revenue from segments below the quantitative thresholds are attributable to two specialist units, namely Transnet Property, which manages internal and
external leases of commercial and residential property and Transnet Group Capital which manages the Group’s large capital projects.4 Other costs include the remaining net operating expense line items as disclosed in note 2.5 Excludes assets held-for-sale.6 Excludes capitalised borrowing costs; includes capitalised finance leases and capitalised decommissioning liabilities.
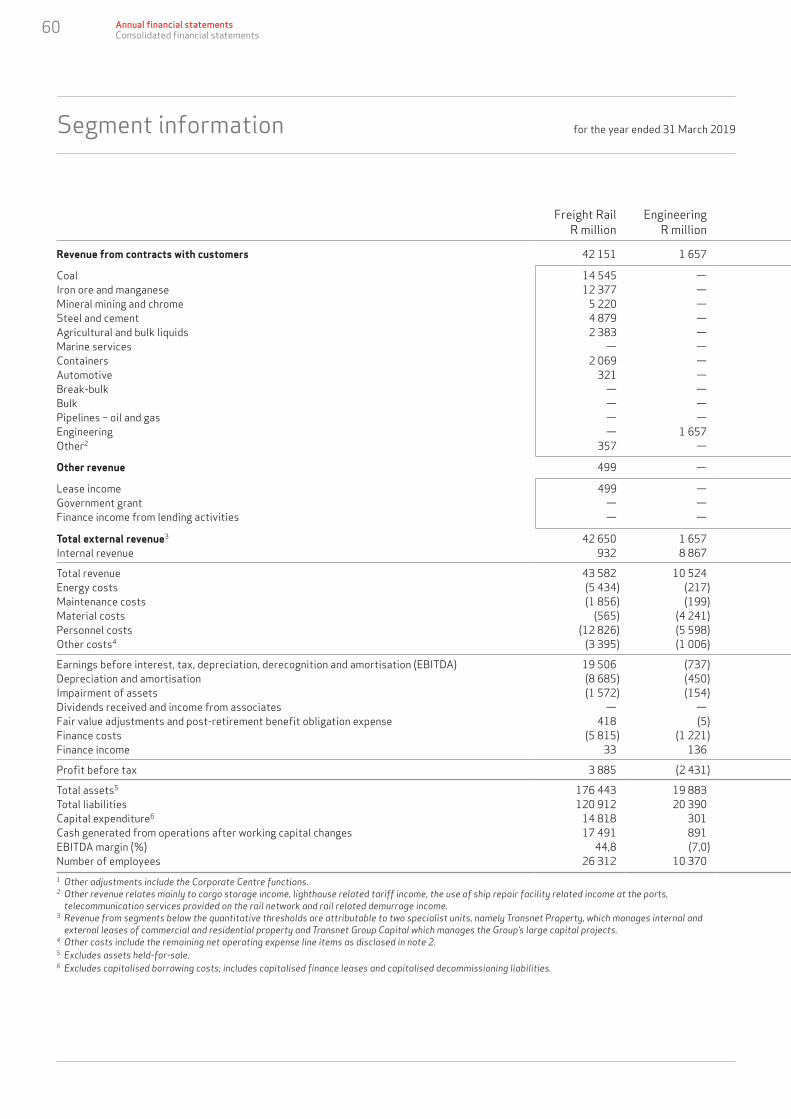
60 Annual financial statementsConsolidated financial statements
Segment information for the year ended 31 March 2019
Other EliminationNational Total for segments of inter-
Ports Port reportable and other segmentFreight Rail Engineering Authority Terminals Pipelines segments adjustments1 transactions Total
R million R million R million R million R million R million R million R million R million
Revenue from contracts with customers 42 151 1 657 9 400 13 073 5 205 71 486 — — 71 486
Coal 14 545 — — — — 14 545 — — 14 545Iron ore and manganese 12 377 — — — — 12 377 — — 12 377Mineral mining and chrome 5 220 — — — — 5 220 — — 5 220Steel and cement 4 879 — — — — 4 879 — — 4 879Agricultural and bulk liquids 2 383 — — — — 2 383 — — 2 383Marine services — — 2 286 — — 2 286 — — 2 286Containers 2 069 — 4 239 5 845 — 12 153 — — 12 153Automotive 321 — 403 626 — 1 350 — — 1 350Break-bulk — — 208 1 913 — 2 121 — — 2 121Bulk — — 1 999 3 645 — 5 644 — — 5 644Pipelines – oil and gas — — — — 5 167 5 167 — — 5 167Engineering — 1 657 — — — 1 657 — — 1 657Other2 357 — 265 1 044 38 1 704 — — 1 704
Other revenue 499 — 1 355 — 53 1 907 677 — 2 584
Lease income 499 — 1 355 — — 1 854 672 — 2 526Government grant — — — — 53 53 — — 53Finance income from lending activities — — — — — — 5 — 5
Total external revenue3 42 650 1 657 10 755 13 073 5 258 73 393 677 — 74 070Internal revenue 932 8 867 1 695 13 4 11 511 1 599 (13 110) —
Total revenue 43 582 10 524 12 450 13 086 5 262 84 904 2 276 (13 110) 74 070Energy costs (5 434) (217) (534) (668) (298) (7 151) (191) — (7 342)Maintenance costs (1 856) (199) (285) (434) (112) (2 886) (224) 1 389 (1 721)Material costs (565) (4 241) (82) (522) (9) (5 419) 23 3 942 (1 454)Personnel costs (12 826) (5 598) (2 383) (4 492) (438) (25 737) (1 968) 4 806 (22 899)Other costs4 (3 395) (1 006) (849) (2 429) (409) (8 088) (1 254) 2 438 (6 904)
Earnings before interest, tax, depreciation, derecognition and amortisation (EBITDA) 19 506 (737) 8 317 4 541 3 996 35 623 (1 338) (535) 33 750Depreciation and amortisation (8 685) (450) (2 042) (1 524) (1 283) (13 984) (532) 242 (14 274)Impairment of assets (1 572) (154) (141 (770) 24 (2 613) (75) — (2 688)Dividends received and income from associates — — — — — — 19 — 19Fair value adjustments and post-retirement benefit obligation expense 418 (5) 2 715 2 — 3 130 (146) — 2 984Finance costs (5 815) (1 221) (1 387) (57) (1 125) (9 605) (13 667) 11 675 (11 597)Finance income 33 136 19 (5) — 183 11 879 (11 675) 387
Profit before tax 3 885 (2 431) 7 481 2 187 1 612 12 734 (3 860) (293) 8 581
Total assets5 176 443 19 883 93 077 16 970 43 515 349 888 21 918 (16 479) 355 327Total liabilities 120 912 20 390 35 399 4 508 21 100 202 309 15 925 (11 365) 206 869Capital expenditure6 14 818 301 941 1 515 326 17 901 40 — 17 941Cash generated from operations after working capital changes 17 491 891 8 040 4 160 3 545 34 127 (595) n/a 33 532EBITDA margin (%) 44,8 (7,0) 66,8 34,7 75,9 42,0 n/a n/a 45,6Number of employees 26 312 10 370 4 182 7 392 672 48 928 1 870 n/a 50 7981 Other adjustments include the Corporate Centre functions. 2 Other revenue relates mainly to cargo storage income, lighthouse related tariff income, the use of ship repair facility related income at the ports,
telecommunication services provided on the rail network and rail related demurrage income.3 Revenue from segments below the quantitative thresholds are attributable to two specialist units, namely Transnet Property, which manages internal and
external leases of commercial and residential property and Transnet Group Capital which manages the Group’s large capital projects.4 Other costs include the remaining net operating expense line items as disclosed in note 2.5 Excludes assets held-for-sale.6 Excludes capitalised borrowing costs; includes capitalised finance leases and capitalised decommissioning liabilities.

61
Other EliminationNational Total for segments of inter-
Ports Port reportable and other segmentFreight Rail Engineering Authority Terminals Pipelines segments adjustments1 transactions Total
R million R million R million R million R million R million R million R million R million
Revenue from contracts with customers 42 151 1 657 9 400 13 073 5 205 71 486 — — 71 486
Coal 14 545 — — — — 14 545 — — 14 545Iron ore and manganese 12 377 — — — — 12 377 — — 12 377Mineral mining and chrome 5 220 — — — — 5 220 — — 5 220Steel and cement 4 879 — — — — 4 879 — — 4 879Agricultural and bulk liquids 2 383 — — — — 2 383 — — 2 383Marine services — — 2 286 — — 2 286 — — 2 286Containers 2 069 — 4 239 5 845 — 12 153 — — 12 153Automotive 321 — 403 626 — 1 350 — — 1 350Break-bulk — — 208 1 913 — 2 121 — — 2 121Bulk — — 1 999 3 645 — 5 644 — — 5 644Pipelines – oil and gas — — — — 5 167 5 167 — — 5 167Engineering — 1 657 — — — 1 657 — — 1 657Other2 357 — 265 1 044 38 1 704 — — 1 704
Other revenue 499 — 1 355 — 53 1 907 677 — 2 584
Lease income 499 — 1 355 — — 1 854 672 — 2 526Government grant — — — — 53 53 — — 53Finance income from lending activities — — — — — — 5 — 5
Total external revenue3 42 650 1 657 10 755 13 073 5 258 73 393 677 — 74 070Internal revenue 932 8 867 1 695 13 4 11 511 1 599 (13 110) —
Total revenue 43 582 10 524 12 450 13 086 5 262 84 904 2 276 (13 110) 74 070Energy costs (5 434) (217) (534) (668) (298) (7 151) (191) — (7 342)Maintenance costs (1 856) (199) (285) (434) (112) (2 886) (224) 1 389 (1 721)Material costs (565) (4 241) (82) (522) (9) (5 419) 23 3 942 (1 454)Personnel costs (12 826) (5 598) (2 383) (4 492) (438) (25 737) (1 968) 4 806 (22 899)Other costs4 (3 395) (1 006) (849) (2 429) (409) (8 088) (1 254) 2 438 (6 904)
Earnings before interest, tax, depreciation, derecognition and amortisation (EBITDA) 19 506 (737) 8 317 4 541 3 996 35 623 (1 338) (535) 33 750Depreciation and amortisation (8 685) (450) (2 042) (1 524) (1 283) (13 984) (532) 242 (14 274)Impairment of assets (1 572) (154) (141 (770) 24 (2 613) (75) — (2 688)Dividends received and income from associates — — — — — — 19 — 19Fair value adjustments and post-retirement benefit obligation expense 418 (5) 2 715 2 — 3 130 (146) — 2 984Finance costs (5 815) (1 221) (1 387) (57) (1 125) (9 605) (13 667) 11 675 (11 597)Finance income 33 136 19 (5) — 183 11 879 (11 675) 387
Profit before tax 3 885 (2 431) 7 481 2 187 1 612 12 734 (3 860) (293) 8 581
Total assets5 176 443 19 883 93 077 16 970 43 515 349 888 21 918 (16 479) 355 327Total liabilities 120 912 20 390 35 399 4 508 21 100 202 309 15 925 (11 365) 206 869Capital expenditure6 14 818 301 941 1 515 326 17 901 40 — 17 941Cash generated from operations after working capital changes 17 491 891 8 040 4 160 3 545 34 127 (595) n/a 33 532EBITDA margin (%) 44,8 (7,0) 66,8 34,7 75,9 42,0 n/a n/a 45,6Number of employees 26 312 10 370 4 182 7 392 672 48 928 1 870 n/a 50 7981 Other adjustments include the Corporate Centre functions. 2 Other revenue relates mainly to cargo storage income, lighthouse related tariff income, the use of ship repair facility related income at the ports,
telecommunication services provided on the rail network and rail related demurrage income.3 Revenue from segments below the quantitative thresholds are attributable to two specialist units, namely Transnet Property, which manages internal and
external leases of commercial and residential property and Transnet Group Capital which manages the Group’s large capital projects.4 Other costs include the remaining net operating expense line items as disclosed in note 2.5 Excludes assets held-for-sale.6 Excludes capitalised borrowing costs; includes capitalised finance leases and capitalised decommissioning liabilities.

Notes to the annual financial statements for the year ended 31 March 2020
Company Group
2019 2020 2020 2019R million R million R million R million
1. Revenue 71 486 72 367 Revenue from contracts with customers 72 367 71 486
42 151 43 145 Rail freight 43 145 42 151 1 657 875 Engineering 875 1 657
22 473 22 673 Ports 22 673 22 473 5 205 5 674 Pipelines – petroleum products and gas 5 674 5 205
2 584 2 698 Other revenue 2 698 2 584
2 526 2 640 Lease income 2 640 2 526 53 53 Government grants 53 53 5 5 Finance income from lending activities 5 5
74 070 75 065 Total revenue 75 065 74 070
Refer to the segmental report for the disaggregation of revenue streams.
Revenue from performance obligations partially satisfied in previous periods
289 239 Rail freight 239 289
9 — Pipelines – petroleum products and gas — 9
Revenue recognised in the current financial year in respect of performance obligations that were partially satisfied in previous periods relates to the following:
Rail freight – goods-in-transit at 31 March 2019 whose delivery was completed in the current financial year.
Pipelines – revenue from petroleum products and gas which were in the pipeline system on 31 March 2019, and whose delivery was completed in the current financial year.
Performance obligations partially unsatisfied at the end of the year170 199 204 100 Rail freight and ports 204 100 170 199
Revenue expected to be recognised in future periods from performance obligations that were unsatisfied or partially unsatisfied at 31 March 2020 relates to committed volumes to be transported over rail or processed through the ports on long-term take-or-pay contracts with customers. The Group expects 18% of the above amount to be recognised in revenue during the 2021 financial year, 19% in 2022, 20% in 2023, 21% in 2024 and 22% in 2025. The above amount excludes variable consideration such as take-or-pay penalties, demurrage, volume rebates and other penalties that may be applicable in future.
The Group applies the practical expedient in paragraph 121 of IFRS 15 Revenue from Contracts with Customers, and does not disclose information about remaining performance obligations on contracts where either: – The original contractual period is for one year or less; or – The Group’s right to consideration from a customer corresponds directly with the Group’s performance completed to date.
Significant judgementsThe Group, through its Freight Rail division did not recognise R411,9 million (2019: nil) from Prasa in accordance with IFRS 15 Revenue from Contracts with Customers as the collectability requirement was not met due to a history of late and non-payment by Prasa, as well as its subsequent placement under administration by the Minister of Transport on 9 December 2019. Transnet continues to engage with Prasa and the South African government to ensure recovery of all amounts owed by Prasa. The Group recognises revenue from Prasa, when cash is received and the Group has no remaining performance obligations with respect to that revenue.
62 Annual financial statementsNotes to the annual financial statements

63
Notes to the annual financial statements for the year ended 31 March 2020
Company Group
2019 2020 2020 2019R million R million R million R million
2. Net operating expenses excluding depreciation, derecognition and amortisation
264 266 Accommodation and refreshments 266 264 1 292 1 167 Electronic data costs 1 167 1 292 7 342 7 698 Energy costs 7 698 7 342
354 622 Haulage costs 622 354 512 608 Health and sanitation 608 512 215 250 Insurance 250 215
1 721 1 221 Maintenance costs 1 221 1 721 907 1 191 Managerial and technical consulting fees (refer note 4.1) 1 192 907
1 454 699 Material costs 699 1 454 1 104 1 564 Lease expenses (refer note 4.1) 1 564 1 104
22 899 23 277 Personnel costs 23 277 22 899 52 43 Printing and stationery 43 52
(54) 1 Loss/(profit) on disposal of property, plant and equipment (refer note 4.1) 1 (54)
98 77 Promotions and advertising 77 98 1 276 1 467 Security 1 467 1 276
132 146 Telecommunications 146 132 124 97 Transport 97 124
77 55 Research and development costs (refer note 4.1) 55 77 378 419 Water 419 378
201 211 Other costs1, 2 212 173
40 348 41 079 41 081 40 320
1 Included in other costs is Covid-19 related expenses of R70 million (2019: nil) .2 Other costs is mainly made up of environmental management expense, rates and taxes, corporate and social investment costs, travel costs, partially offset by
operating income relating to scrap income, lease recoveries, Prasa related recoveries, and insurance recoveries.

Notes to the annual financial statements for the year ended 31 March 2020
Company Group
2019 2020 2020 2019R million R million R million R million
3. Depreciation and amortisation Depreciation and derecognition (refer note 9)
7 590 8 369 Depreciation and derecognition – owned assets at historic cost 8 369 7 590
10 46 Aircraft 46 10 176 197 Floating craft 197 176 905 1 399 Land, buildings and structures 1 399 905 978 717 Machinery, equipment and furniture 717 978
17 17 Permanent way and works 17 17 5 484 5 987 Rolling stock and containers 5 987 5 484
20 6 Vehicles 6 20
5 620 5 418 Depreciation and derecognition – owned assets revalued portion 5 418 5 620
1 207 1 935 Pipeline networks 1 935 1 207 2 123 1 205 Rail infrastructure 1 205 2 123 2 290 2 278 Port facilities 2 278 2 290
591 703 Depreciation and derecognition – right-of-use assets at historic cost 703 591
412 477 Vehicles 477 412 139 213 Land, buildings and structures 213 139
38 10 Machinery, equipment and furniture 10 38 2 3 Permanent way and works 3 2
13 801 14 490 14 490 13 801
Amortisation of intangible assets (refer note 11) 473 465 Software and licences 465 473
14 274 14 955 Total depreciation, derecognition and amortisation 14 955 14 274
4.1 Profit from operations before impairment of assets, dividends received, post-retirement benefit obligation expense, fair value adjustments and income from associates and joint venturesis stated after taking into account the following amounts:
Auditors’ remunerationGroup auditors
40 45 Audit fees – current year 45 4037 58 Audit fees – prior year 58 3710 12 Fees for audit – related and other services 12 10 3 3 Expenses 3 3
90 118 118 90
907 1 191 Managerial and technical consulting fees 1 192 907
64 Annual financial statementsNotes to the annual financial statements

65
Notes to the annual financial statements for the year ended 31 March 2020
Company Group
2019 2020 2020 2019R million R million R million R million
4.1 Profit from operations before impairment of assets, dividends received, post-retirement benefit obligation expense, fair value adjustments and income from associates and joint ventures continuedis stated after taking into account the following amounts:
Lease expenses
22 34 Variable lease payments not included in the measurement of lease liabilities 34 22
7 4 Expenses relating to short-term leases 4 7 1 075 1 526 Expenses relating to leases of low-value assets 1 526 1 075
1 104 1 564 1 564 1 104
(54) 1 Loss/(profit) on disposal of property, plant and equipment 1 (54)
77 55 Research and development costs 55 77
Directors’ and executives’ emoluments (refer note 38) 13 19 Executive directors 19 13
7 7 Non-executive directors 7 7 62 69 Senior executives 69 62
82 95 95 82
4.2.1 Impairment of financial assets 17 260 Long-term loans and advances (refer note 15) 260 17
384 500 Trade receivables from contracts with customers 500 384 1 — Contract assets — 1
42 39 Other receivables 39 42
444 799 799 444
4.2.2 Impairment of non-financial assets1
2 244 1 544 Property, plant and equipment (refer note 9) 1 544 2 244
4.3 Dividends received— 3 Dividends from associate — —
4.4 Post-retirement benefit obligation expense16 17 Transport Pension Fund: Transnet Sub-fund 17 16— — Transnet Second Defined Benefit Fund — —
5 5 Transnet Top Management pensions 5 539 38 Transnet Workmen’s Compensation Act pensioners 38 3929 27 Transnet SATS pensioners’ post-retirement medical benefits 27 2928 29 Transnet employees’ post-retirement medical benefits 29 28
170 105 Other post-retirement and medical benefits (refer note 23) 105 170
287 221 221 287
1 Impairment of non-financial assets mainly arose at Freight Rail relating to locomotives and wagons after a physical verification and useful life assessment and to Engineering rolling stock and rotables, partially offset by the net reversal of port operating assets impairment, as a result of the related valuation, applied as per the Group accounting policy.

Notes to the annual financial statements for the year ended 31 March 2020
Company Group
2019 2020 2020 2019R million R million R million R million
5. Fair value adjustments3 160 681 Fair value adjustment of investment property (refer note 10) 681 3 160 218 101 Derivative fair value adjustments (refer note 14) 101 218 (109) (42) Fair value adjustments on firm commitments (42) (109)
4 23 Fair value adjustments on other financial assets held at FVTPL 23 4
— — Reclassification of fair value adjustments on Government bonds held at FVTOCI (1) (2)
3 273 763 762 3 271
6. Finance costs(67) (74) Net foreign exchange gain on translation (74) (67)
(6) (10) Discounts on bonds amortised (10) (6)110 108 Interest on lease liabilities 108 110
13 219 12 752 Interest cost – financial liabilities at amortised cost 12 752 13 219 13 256 12 776 Gross finance costs 12 776 13 256 (1 659) (1 439) Borrowing costs capitalised* (1 439) (1 659)
11 597 11 337 11 337 11 597* The weighted average capitalisation rate on funds borrowed generally is
10,21% per annum (2019: 10,39% per annum).
7. Finance income109 47 Bank deposits 47 111 259 101 Financial assets at amortised cost 101 259
— — Financial assets at FVTOCI 23 17368 148 171 387
8. Tax South African normal tax
(7) — – Current year 6 — Deferred tax (refer note 26)
2 533 2 136 – Current year 2 136 2 534 2 526 2 136 2 142 2 534
% % Reconciliation of tax rate % % 28,00 28,00 Standard rate – South African normal tax 28,00 28,00
1,66 7,34 Adjustment for differences 7,23 1,53 1,27 5,11 Expenses/(income) not included for tax purposes 5,11 1,27 0,44 0,36 Permanent provisions 0,36 0,44
2,26 3,31 Depreciation on property, plant and equipment (PPE) not subject to tax allowances 3,31 2,26
0,14 0,77 Impairment of PPE 0,77 0,14 (2,08) (0,63) Fair value adjustments (0,63) (2,08) (0,15) 0,14 Disposal of fixed assets not subject to tax allowances 0,14 (0,15) 0,02 0,01 Disposal of investments 0,01 0,02 0,45 0,13 Capital legal, professional and other expenses 0,13 0,45 0,02 0,15 Disallowed donations 0,15 0,02
— 0,38 Fruitless and wasteful expenditure 0,38 — 0,17 0,43 Fines, interest and penalties 0,43 0,17
— 0,06 Capital gain on disposal of fixed assets 0,06 —— (0,01) Exempt local dividends — —
0,39 2,24 Adjustment to deferred tax charge 2,12 0,26 (0,12) (0,28) Capital gain on disposal of fixed assets (0,25) (0,12) 0,03 1,49 Treasury instruments 1,49 0,03 0,29 0,03 Release of equity on revaluations realised 0,03 0,29 0,34 1,00 PPE adjustments 1,00 0,31
(0,15) — Provisions not through the income statement (0,15) (0,25)
29,66 35,34 Effective rate of tax 35,23 29,53
66 Annual financial statementsNotes to the annual financial statements

67
Notes to the annual financial statements for the year ended 31 March 2020
Company Group
2019 2020 2020 2019R million R million R million R million
8. Tax continued
8.1 Tax recognised in other comprehensive incomeArising on the tax effects of items recognised in comprehensive income:
(184) (126)Gain on revaluation of pipeline networks and decommissioning restoration liability (126) (184)
1 006 4 678 Loss on revaluation of port facilities and decommissioning liability 4 678 1 006 6 493 4 173 Loss on revaluation of rail infrastructure 4 173 6 493
(8) (3) Gain on revaluation of land, buildings and structures (3) (8) (5) — Gain on revaluation of investments to market value (Rumo Ltd) — (3)— — Loss on revaluation of debt instrument 15 —
(209) 29 Cash flow hedge loss/(gain) 29 (209) (25) (34) Actuarial gain on post-retirement benefit obligations (34) (25)
7 068 8 717 Total tax recognised in other comprehensive income 8 732 7 070
9. Property, plant and equipment Property, plant and equipment is stated at historical cost except for pipeline networks, port facilities and rail infrastructure, which are stated at revalued amounts.
313 558 285 877 Net book value 285 877 313 558
467 696 438 685 Gross carrying value 438 685 467 696 (154 138) (152 808) Accumulated depreciation and impairment (152 808) (154 138)
Comprising:Historical cost
212 320 219 552 Gross carrying value 219 552 212 320
192 438 – Aircraft 438 192 5 135 5 033 – Floating craft 5 033 5 135
31 254 31 965 – Land, buildings and structures 31 965 31 254 12 773 12 950 – Machinery, equipment and furniture 12 950 12 773
1 078 1 122 – Permanent way and works 1 122 1 078 130 141 138 118 – Rolling stock and containers 138 118 130 141
2 806 3 286 – Vehicles 3 286 2 806 28 941 26 640 – Capital work-in-progress 26 640 28 941
(62 731) (68 934) Accumulated depreciation (68 934) (62 731)
(166) (212) – Aircraft (212) (166) (1 356) (1 476) – Floating craft (1 476) (1 356) (9 430) (11 024) – Land, buildings and structures (11 024) (9 430) (8 017) (8 669) – Machinery, equipment and furniture (8 669) (8 017)
(170) (190) – Permanent way and works (190) (170) (41 964) (45 459) – Rolling stock and containers (45 459) (41 964)
(1 628) (1 904) – Vehicles (1 904) (1 628)

Notes to the annual financial statements for the year ended 31 March 2020
Company Group
2019 2020 2020 2019R million R million R million R million
9. Property, plant and equipment continued
(4 991) (6 376) Accumulated impairment (refer note 4.2.2) (6 376) (4 991)
(37) (41) – Land, buildings and structures (41) (37) (183) (197) – Machinery, equipment and furniture (197) (183)
(1) (1) – Permanent way and works (1) (1) (3 698) (4 903) – Rolling stock and containers (4 903) (3 698)
(34) (32) – Vehicles (32) (34) (1 038) (1 202) – Capital work-in-progress (1 202) (1 038)
144 598 144 242Net book value of property, plant and equipment stated at historical cost 144 242 144 598
Revaluation 255 376 219 133 Gross carrying value 219 133 255 376
54 589 56 540 – Pipeline networks 56 540 54 589 125 684 100 958 – Port facilities 100 958 125 684
75 103 61 635 – Rail infrastructure 61 635 75 103
(83 963) (75 328) Accumulated depreciation (75 328) (83 963)
(16 617) (18 417) – Pipeline networks (18 417) (16 617) (49 606) (41 897) – Port facilities (41 897) (49 606) (17 740) (15 014) – Rail infrastructure (15 014) (17 740)
(2 453) (2 170) Accumulated impairment (refer note 4.2.2) (2 170) (2 453)
(357) (359) – Pipeline networks (359) (357) (2 033) (1 652) – Port facilities (1 652) (2 033)
(63) (159) – Rail infrastructure (159) (63)
168 960 141 635Net book value of property, plant and equipment stated at revalued amounts 141 635 168 960
313 558 285 877 Total net book value 285 877 313 558
Land, buildings and structuresA register of land, buildings and structures is available for inspection at the Company.
During the year, the Group transferred R17 million (2019: R104 million) to investment properties from property, plant and equipment. The fair values of these properties are deemed cost for subsequent accounting in accordance with IAS 40 Investment Property.
Assets under leaseIncluded in property, plant and equipment are assets under lease with a carrying value of R1 228 million (2019: R1 200 million).
68 Annual financial statementsNotes to the annual financial statements

69
Notes to the annual financial statements for the year ended 31 March 2020
Company Group
2019 2020 2020 2019R million R million R million R million
9. Property, plant and equipment continued
Revaluation approachThe Group applies the depreciated optimised replacement cost, modern equivalent asset value and discounted cash flow methods, as applicable to revalue certain assets as further described below.
Management considers such factors as the economic and operating environment of the assets – including the regulatory decisions where applicable, and the impact thereof on expected volumes and the future cash flows of the assets (including the impact of the Covid-19 lockdown on operations), the age and condition of the assets, the specialised nature of certain assets, as well as the sensitivity of each method to these factors in selecting the point within the range of fair values given by different valuation methods which is most representative of the fair value of the assets in the circumstances.
As at 31 March 2020, management concluded that the discounted cash flow valuation was most representative of the fair value of rail and port infrastructure while the depreciated optimised replacement cost and modern equivalent asset value methods were most representative of the fair value of port operating assets and pipeline networks respectively.
Pipeline networksPipeline networks were revalued at 31 March 2020 based on the modern equivalent asset value and discounted cash flow methods. Details of significant unobservable inputs applied in the valuation are provided below.
The last full revaluation based on the modern equivalent asset value was performed at 31 March 2019, by Arthur D. Little Inc., an independent firm of professional valuers – and resulted in a fair value of R26,3 billion at that date. In accordance with the Group accounting policy, indices are applied in the intervening periods.
At 31 March 2020, the index valuation resulted in a fair value of R28,0 billion. The discounted cash flow method resulted in a fair value of R41,6 billion at 31 March 2020 (2019: R40,4 billion).
The index valuation was applied and resulted in a net increase of R427 million (2019: R698 million net increase) to the carrying value of the pipeline networks.
Fair value hierarchy — — Level 1 – quoted prices in active markets — — — — Level 2 – significant observable inputs — —
37 615 37 766 Level 3 – significant unobservable inputs* 37 766 37 615 32 889 32 899 The historic cost carrying values of these assets amount to 32 899 32 889
* For more detail regarding the measurement of level 3 fair values refer to the table on page 73 in note 9.

Notes to the annual financial statements for the year ended 31 March 2020
Company Group
2019 2020 2020 2019R million R million R million R million
9. Property, plant and equipment continued
Port facilitiesPort infrastructurePort infrastructure was revalued at 31 March 2020 based on the depreciated optimised replacement cost and discounted cash flow methods.
The last full revaluation based on the depreciated optimised replacement cost method was performed at 31 March 2017, by ZAA Engineering Project & Naval Architecture (Pty) Ltd, an independent firm of professional valuers and resulted in a fair value of R68,2 billion. The full external revaluation scheduled for the current financial year could not be completed due to the impact of Covid-19. In accordance with the Group accounting policy, appropriate indices are applied in the intervening periods. The fair value of port infrastructure based on the index valuation at 31 March 2020 was R75,8 billion (2019: R73,2 billion).
The discounted cash flow method resulted in a fair value of the port infrastructure assets of R50,0 billion (2019: R67,0 billion) as at 31 March 2020, which resulted in a decrease of R17,0 billion (2019: R3,1 billion decrease) to the carrying value of the port infrastructure.
The fair value of port infrastructure assets based on the discounted cash flow method is sensitive to changes in the discount rate and terminal growth rates. The rates applied at 31 March 2020 were 11,96% and 6,02% respectively. For example, a 0,1% change in the discount rate would result in a fair value change of R0,9 billion. Similarly, a 0,1% change in the terminal growth rate would result in the fair value changing by R0,6 billion.
Port operating assetsPort operating assets were revalued at 31 March 2020 based on the depreciated optimised replacement cost and discounted cash flow methods.
Mangi & Ngwazi Investments (Pty) Ltd, t/a MANI Industries, an independent firm of professional valuers, performed an independent valuation on port operating assets as at 31 March 2020 on the basis of the depreciated optimised replacement cost method. The fair value of port operating assets based on the depreciated optimised replacement cost at 31 March 2020 was R7,2 billion (2019: R7,0 billion).
The discounted cash flow method resulted in a fair value at 31 March 2020 of R25,1 billion.
The depreciated optimised replacement cost valuation was applied and resulted in an increase of R328 million (2019: R465 million decrease) in the carrying value of the port operating assets.
Fair value hierarchy— Level 1 – quoted prices in active markets —— Level 2 – significant observable inputs —
74 045 57 409 Level 3 – significant unobservable inputs* 57 409 74 045 21 156 22 297 The historical carrying values of these assets amount to 22 297 21 156
* For more detail regarding the measurement of level 3 fair values refer to the table on page 73 in note 9.
70 Annual financial statementsNotes to the annual financial statements

71
Notes to the annual financial statements for the year ended 31 March 2020
Company Group
2019 2020 2020 2019R million R million R million R million
9. Property, plant and equipment continued
Rail infrastructure Rail infrastructure was revalued at 31 March 2020 based on the depreciated optimised replacement cost and discounted cash flow methods. The last full revaluation based on the depreciated optimised replacement cost method was performed at 31 March 2019, by Ernst & Young and Hatch consortium, an independent firm of professional valuers and resulted in a fair value of R247,8 billion.
The discounted cash flow method resulted in a fair value of the rail infrastructure at 31 March 2020 of R155,7 billion (2019: R165,3 billion).
The discounted cash flow valuation was applied and resulted in a decrease of R14 905 million (2019: R23 191 million decrease) in the carrying value of rail infrastructure.
The fair value of rail infrastructure based on the discounted cash flow valuation is sensitive to changes in key inputs, such as the discount rate and terminal growth rate. For example, a 0,1% change in the terminal growth rate would change the asset value by R37 million, whereas the same change in the discount rate will change the asset value by R87 million.
Fair value hierarchy— — Level 1 – quoted prices in active markets — —— — Level 2 – significant observable inputs — —
57 300 46 462 Level 3 – significant unobservable inputs* 46 462 57 30035 755 35 304 The historical carrying values of these assets amount to 35 304 35 755
* For more detail regarding the measurement of level 3 fair values refer to the table on page 73 in note 9.

Notes to the annual financial statements for the year ended 31 March 2020
9. Property, plant and equipment continued
Useful lives and residual valuesIn terms of IAS 16 Property, Plant and Equipment, the useful lives and residual values of property, plant and equipment must be reviewed at each reporting date. The useful lives are estimated by management based on historic analysis, benchmarking and other available information. The residual values are based on the estimated recoverable amount from disposal of the asset at the end of its economic life.
Residual valuesDuring the year, management conducted its annual assessment of residual values on existing assets. The exercise resulted in a change in the residual values of the rolling stock and railway component of the permanent way assets. The residual values are based on actual income recovered in the past financial year, which is influenced by the scrap steel market prices. The current reporting period impact is a R57 million decrease in depreciation (2019: R15 million decrease) and a R75 million impairment reversal (2019: nil) to align impaired assets to increased determined residual value.
Useful livesThe useful lives for all assets were reviewed in line with estimated usage by Transnet Freight Rail. The review was done with the assistance of asset owners and specialists. The results of the assessment were a net decrease of approximately R312 million (2019: R337 million increase) in the depreciation expense due to a general increase in the useful lives, especially rolling stock locomotives, rail infrastructure, buildings and general assets.
Fully depreciated assets in useFully depreciated assets still in use are considered to be an insignificant portion of the total asset base of the Company and Group.
Management’s estimation of the asset’s useful life bears resemblance to the asset’s economic life and the useful life of the asset (not changed or restated) where:• Assets were found to be a in a better condition than expected compared to when initial and subsequent estimations were made to determine
its useful life and therefore are expected to be used for a longer period of time; or• Management has assessed, at least annually, its useful life and decided that those initial estimations were reflective of the asset’s useful
life, but the asset will continue to be used, as it is still fit for usage in its intended manner.
The net carrying value of property, plant and equipment, stated at historical cost, includes fully depreciated assets with a gross carrying value of R2,4 billion (2019: R2,5 billion).
72 Annual financial statementsNotes to the annual financial statements

73
9. Property, plant and equipment continued
Measurement of level 3 fair values
The table below shows the valuation techniques and significant unobservable inputs applied in measuring level 3 fair values for property, plant and equipment at 31 March 2020.
Asset group Valuation technique Significant unobservable inputs Range (weighted average)
Pipeline networks Modern equivalent asset value • Physical condition r• Remaining useful life r
Discounted cash flow • Discount rate (%) 13,17• Terminal growth rate (%) 4,90
Port infrastructure Depreciated optimised replacement cost**
• Physical condition r• Remaining useful life r
Discounted cash flow • Discount rate (%) 11,95 • Terminal growth rate (%) 5,00 – 6,02
Port operating assets Depreciated optimised replacement cost**
• Physical condition r• Remaining useful life r• Residual value r• Availability r• Design capacity r• Indices – Marine index* 104,23 – Dredging index* 103,98• PPI – General and special purpose
machinery (142,1)* 109,60• PPI – Transport equipment (142,7)* 108,10
Discounted cash flow • Discount rate (%) 11,95 • Terminal growth rate (%) 5,00 – 6,02
Rail infrastructure Depreciated optimised replacement cost**
• Physical condition r• Remaining useful life r• Residual value r• Availability r• Design capacity r
Discounted cash flow • Discount rate (%) 10,83• Terminal growth rate (%) 4,36
r Range or weighted average not applicable.* Base year = 2019.** The depreciated optimised replacement cost method values assets at the amount it would cost to replace the asset with a technologically modern equivalent new
asset with similar service potential (i.e. capacity, functionality and remaining useful life), taking into account the age and physical condition of the asset and allowing for any differences in the quantity and quality of output and in operating costs.
Notes to the annual financial statements for the year ended 31 March 2020

Notes to the annual financial statements for the year ended 31 March 2020
9. Property, plant and equipment continued
PPE reconciliation
Land, Machinerybuildings equipment Permanent Rail Rolling Capital 31 March 31 March
Floating and and way and Pipeline Port infra- stock and work-in- 2020 2019 Aircraft craft structures furniture works networks facilities structure containers Vehicles progress Total TotalR million R million R million R million R million R million R million R million R million R million R million R million R million
Company and GroupBalance at the beginning of the yearHistorical cost and revaluation 192 5 135 31 254 12 773 1 078 54 589 125 684 75 103 130 141 2 806 28 941 467 696 485 145 Accumulated depreciation (166) (1 356) (9 430) (8 017) (170) (16 617) (49 606) (17 740) (41 964) (1 628) — (146 694) (144 382)Accumulated impairment — — (37) (183) (1) (357) (2 033) (63) (3 698) (34) (1 038) (7 444) (5 275)
Opening net carrying value at 1 April 26 3 779 21 787 4 573 907 37 615 74 045 57 300 84 479 1 144 27 903 313 558 335 488
Current year movementsReplacements 128 14 4 70 — — — 2 806 6 965 28 5 071 15 086 14 682 Expansions — — 54 14 — — 1 — — 692 2 714 3 475 3 259 Decommissioning liability — — 188 — — — — — — — — 188 (2)Disposals — — (2) (10) — — (9) — (11) (26) (26) (84) (73)Depreciation (46) (197) (1 612) (727) (20) (1 205) (2 278) (1 782) (5 351) (475) — (13 693) (13 104)Derecognition — — — — — — — (153) (636) (8) — (797) (697)(Devaluation)/revaluation adjustment recognised in other comprehensive income — — 16 — — 427 (16 631) (14 905) — — — (31 093) (25 945)Impairment/(reversal of impairment) recognised in profit or loss — — (5) (23) — (1) 369 (97) (1 624) 1 (164) (1 544) (2 244)Transferred to intangibles assets — — — — — — — — — — (338) (338) (108)Transfers to non-current assets classified as held-for-sale — — — — — — 4 — (106) — — (102) (57)Transfer to investment property — — (15) — — — — — — — (2) (17) (104)Forex adjustment — — — — — — — — — — — — 75 IFRS 16 adjustment — — — — — — — — — — — — 777 Borrowing costs capitalised 5 — 15 8 — — — — 5 — 1 406 1 439 1 659 Release of firm commitment — — — — — — — — — — (12) (12) (23)Transfer from/(to) inventory — — 1 1 — — — — 203 — (394) (189) (25)Transfer from capital work-in-progress to assets 113 (39) 469 178 44 928 1 908 3 293 3 832 (6) (10 720) — —
200 (222) (887) (489) 24 149 (16 636) (10 838) 3 277 206 (2 465) (27 681) (21 930)
Closing carrying value 226 3 557 20 900 4 084 931 37 764 57 409 46 462 87 756 1 350 25 438 285 877 313 558
Made up as follows:Historical cost and revaluation 438 5 033 31 965 12 950 1 122 56 540 100 958 61 635 138 118 3 286 26 640 438 685 467 696 Accumulated depreciation (212) (1 476) (11 024) (8 669) (190) (18 417) (41 897) (15 014) (45 459) (1 904) — (144 262) (146 694)Accumulated impairment — — (41) (197) (1) (359) (1 652) (159) (4 903) (32) (1 202) (8 546) (7 444)
Closing carrying value at 31 March 226 3 557 20 900 4 084 931 37 764 57 409 46 462 87 756 1 350 25 438 285 877 313 558
Assets held under right-of-use contracts PPE comprise owned and leased assets, as follows (at historical cost): – Property, plant and equipment owned 226 3 557 20 677 4 054 911 37 764 57 409 46 462 87 756 395 25 438 284 649 312 358 – Right-of-use assets — — 223 30 20 — — — — 955 — 1 228 1 200
Total 226 3 557 20 900 4 084 931 37 764 57 409 46 462 87 756 1 350 25 438 285 877 313 558
Right-of-use assets Additions during the year (included above) — — 36 12 — — — — — 718 — 766 828 Depreciation expense during the year (included above) — — (213) (10) (3) — — — — (477) — (703) (591)
74 Annual financial statementsNotes to the annual financial statements
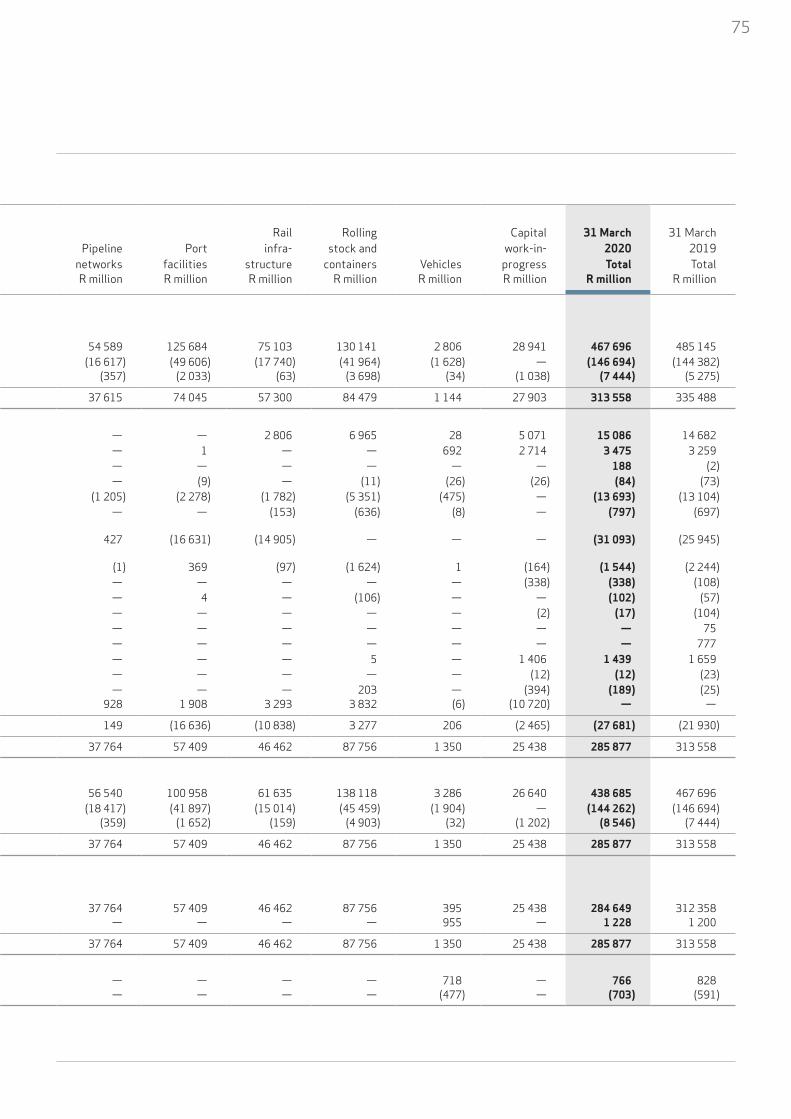
75
9. Property, plant and equipment continued
PPE reconciliation
Land, Machinerybuildings equipment Permanent Rail Rolling Capital 31 March 31 March
Floating and and way and Pipeline Port infra- stock and work-in- 2020 2019 Aircraft craft structures furniture works networks facilities structure containers Vehicles progress Total TotalR million R million R million R million R million R million R million R million R million R million R million R million R million
Company and GroupBalance at the beginning of the yearHistorical cost and revaluation 192 5 135 31 254 12 773 1 078 54 589 125 684 75 103 130 141 2 806 28 941 467 696 485 145 Accumulated depreciation (166) (1 356) (9 430) (8 017) (170) (16 617) (49 606) (17 740) (41 964) (1 628) — (146 694) (144 382)Accumulated impairment — — (37) (183) (1) (357) (2 033) (63) (3 698) (34) (1 038) (7 444) (5 275)
Opening net carrying value at 1 April 26 3 779 21 787 4 573 907 37 615 74 045 57 300 84 479 1 144 27 903 313 558 335 488
Current year movementsReplacements 128 14 4 70 — — — 2 806 6 965 28 5 071 15 086 14 682 Expansions — — 54 14 — — 1 — — 692 2 714 3 475 3 259 Decommissioning liability — — 188 — — — — — — — — 188 (2)Disposals — — (2) (10) — — (9) — (11) (26) (26) (84) (73)Depreciation (46) (197) (1 612) (727) (20) (1 205) (2 278) (1 782) (5 351) (475) — (13 693) (13 104)Derecognition — — — — — — — (153) (636) (8) — (797) (697)(Devaluation)/revaluation adjustment recognised in other comprehensive income — — 16 — — 427 (16 631) (14 905) — — — (31 093) (25 945)Impairment/(reversal of impairment) recognised in profit or loss — — (5) (23) — (1) 369 (97) (1 624) 1 (164) (1 544) (2 244)Transferred to intangibles assets — — — — — — — — — — (338) (338) (108)Transfers to non-current assets classified as held-for-sale — — — — — — 4 — (106) — — (102) (57)Transfer to investment property — — (15) — — — — — — — (2) (17) (104)Forex adjustment — — — — — — — — — — — — 75 IFRS 16 adjustment — — — — — — — — — — — — 777 Borrowing costs capitalised 5 — 15 8 — — — — 5 — 1 406 1 439 1 659 Release of firm commitment — — — — — — — — — — (12) (12) (23)Transfer from/(to) inventory — — 1 1 — — — — 203 — (394) (189) (25)Transfer from capital work-in-progress to assets 113 (39) 469 178 44 928 1 908 3 293 3 832 (6) (10 720) — —
200 (222) (887) (489) 24 149 (16 636) (10 838) 3 277 206 (2 465) (27 681) (21 930)
Closing carrying value 226 3 557 20 900 4 084 931 37 764 57 409 46 462 87 756 1 350 25 438 285 877 313 558
Made up as follows:Historical cost and revaluation 438 5 033 31 965 12 950 1 122 56 540 100 958 61 635 138 118 3 286 26 640 438 685 467 696 Accumulated depreciation (212) (1 476) (11 024) (8 669) (190) (18 417) (41 897) (15 014) (45 459) (1 904) — (144 262) (146 694)Accumulated impairment — — (41) (197) (1) (359) (1 652) (159) (4 903) (32) (1 202) (8 546) (7 444)
Closing carrying value at 31 March 226 3 557 20 900 4 084 931 37 764 57 409 46 462 87 756 1 350 25 438 285 877 313 558
Assets held under right-of-use contracts PPE comprise owned and leased assets, as follows (at historical cost): – Property, plant and equipment owned 226 3 557 20 677 4 054 911 37 764 57 409 46 462 87 756 395 25 438 284 649 312 358 – Right-of-use assets — — 223 30 20 — — — — 955 — 1 228 1 200
Total 226 3 557 20 900 4 084 931 37 764 57 409 46 462 87 756 1 350 25 438 285 877 313 558
Right-of-use assets Additions during the year (included above) — — 36 12 — — — — — 718 — 766 828 Depreciation expense during the year (included above) — — (213) (10) (3) — — — — (477) — (703) (591)

Notes to the annual financial statements for the year ended 31 March 2020
Company Group
2019 2020 2020 2019R million R million R million R million
10. Investment property 11 225 14 498 Fair value at the beginning of the year 14 498 11 225
104 17 Transferred from property, plant and equipment (refer note 9) 17 104 3 160 681 Fair value adjustment recognised in profit and loss (refer note 5) 681 3 160
9 6 Additions 6 9
14 498 15 202 Fair value at the end of the year 15 202 14 498
Fair value hierarchy— — Level 1 – quoted prices in active markets — —— — Level 2 – significant observable inputs — —
14 498 15 202 Level 3 – significant unobservable inputs 15 202 14 498
14 498 15 202 15 202 14 498
The fair value of the Group’s investment property at 31 March 2020 was arrived at on the basis of valuations carried out at that date by Transnet Property valuers.
The valuations, which conform to the Property Valuers Profession Act, No 47 of 2000, were arrived at by capitalising the first year’s normalised net operating income at a market-derived capitalisation rate.
Various assumptions were made in order to derive the net present value of the future cash flows. These assumptions were arrived at after wide consultation with subject matter experts.
The most critical assumption made was that future cash flows were based on the after-tax market-related rentals per investment property.
The lease income earned by the Group from its investment property which is leased out under operating leases amounted to R2,2 billion (2019: R2,0 billion). Of this amount, nil related to variable lease payments that do not depend on an index or a rate. Direct operating expenses arising on the investment property during the year amounted to R1 243 million (2019: R1 213 million). No material direct expenses (including repairs and maintenance) arising on investment property, that did not generate rental income during the year, were incurred.
Measurement of level 3 fair valuesThe table below shows the valuation techniques and significant unobservable inputs applied in measuring level 3 fair values for investment properties at 31 March 2020.
Asset group Valuation technique Significant unobservable inputs Range (weighted average)
Investment property Yield methodology • Capitalisation rate (%) 8,5 – 10,0
76 Annual financial statementsNotes to the annual financial statements

77
Notes to the annual financial statements for the year ended 31 March 2020
Company Group
2019 2020 2020 2019R million R million R million R million
11. Intangible assets 911 961 Intangible assets 961 911
3 319 3 778 Cost 3 778 3 319 (2 408) (2 817) Accumulated amortisation and impairment (2 817) (2 408)
Comprising:Finite life intangible assets
911 961 Software and licences: carrying value 961 911
3 319 3 778 Cost 3 778 3 319
3 108 3 319 Balance at the beginning of the year 3 319 3 108 118 177 Additions 177 118
(15) (56) Disposals (56) (15) 108 338 Transfers from property, plant and equipment (refer note 9) 338 108
(2 408) (2 817) Accumulated amortisation and impairment (2 817) (2 408)
(1 950) (2 408) Balance at the beginning of the year (2 408) (1 950) 15 56 Disposals 56 15
(473) (465) Amortisation (refer note 3) (465) (473)
911 961 961 911
Software and licences are assessed as having a finite life and are amortised on a straight-line basis over a period of three to five years.
12. Investments in subsidiaries (refer note 37)— — Shares at carrying value— — Amounts owing by subsidiaries
— —— — Allowance for impairment
— —
13. Investments in associates and joint ventures (refer note 37)
8 8 193 174
8 8 Balance at the beginning of the year 174 155 — — Share of profit 19 19
8 8Directors’ valuation of unlisted investments in associates and joint ventures 193 174
Income from associates and joint ventures 19 19

Notes to the annual financial statements for the year ended 31 March 2020
Company Group
2019 2020 2020 2019R million R million R million R million
14. Derivative financial assets and liabilitiesBoth the Company and the Group use approved financial instruments, in particular forward exchange contracts, cross-currency swaps and interest rate swaps, to hedge the financial risks associated with underlying business activities. All derivative financial instruments are measured at fair value with gains or losses taken to profit or loss or other comprehensive income – where cash flow hedge accounting is applied.
The methods used to measure financial assets and financial liabilities carried at fair value are disclosed in note 36, together with a description of the Group’s financial instrument risks, and risk management objectives and policies.
8 291 14 080 Derivative financial assets 14 080 8 291
2 856 8 291 Opening balance 8 291 2 856 5 107 5 850 Fair value adjustments 5 850 5 107
328 (61) Derivatives settled and raised (61) 328
1 765 1 531 Derivative financial liabilities 1 531 1 765
2 455 1 765 Opening balance 1 765 2 455 (148) 336 Fair value adjustments 336 (148)(542) (570) Derivatives settled and raised (570) (542)
5 255 5 514 Net fair value adjustments 5 514 5 255
218 101 Derivative fair value adjustments (refer note 5)* 101 218 (108) — Impact of change in accounting policy — (108)
(1 625) (1 480) Finance costs (1 480) (1 625) 6 770 6 893 Recognised in other comprehensive income (refer note 22) 6 893 6 770
Comprise the following financial instruments: 8 273 13 963 Non-current assets 13 963 8 273
8 256 13 945 Cross-currency swaps and options 13 945 8 256 17 18 Interest rate swaps and options 18 17
18 117 Current assets 117 18
15 64 Forward exchange contracts 64 153 53 Cross-currency swaps and options 53 3
1 759 1 505 Non-current liabilities 1 505 1 759
1 — Forward exchange contracts — 1 1 758 1 505 Interest rate swaps and options 1 505 1 758
6 26 Current liabilities 26 6
6 26 Forward exchange contracts 26 6— — Interest rate swaps and options — —
Ratio Ratio Hedge accounting Ratio Ratio 1:1 1:1 Hedge ratio 1:1 1:1
The hedged items and hedging instruments are denominated in the same currencies and have the same nominal values, resulting in a hedge ratio of 1:1 on all hedges.
* Comprised of hedge ineffectiveness loss of R18 million (2019: R55 million loss) and fair value gains and losses on economic hedges to which hedge accounting was not applied resulted in a net gain of R119 million (2019: R273 million gain).
78 Annual financial statementsNotes to the annual financial statements
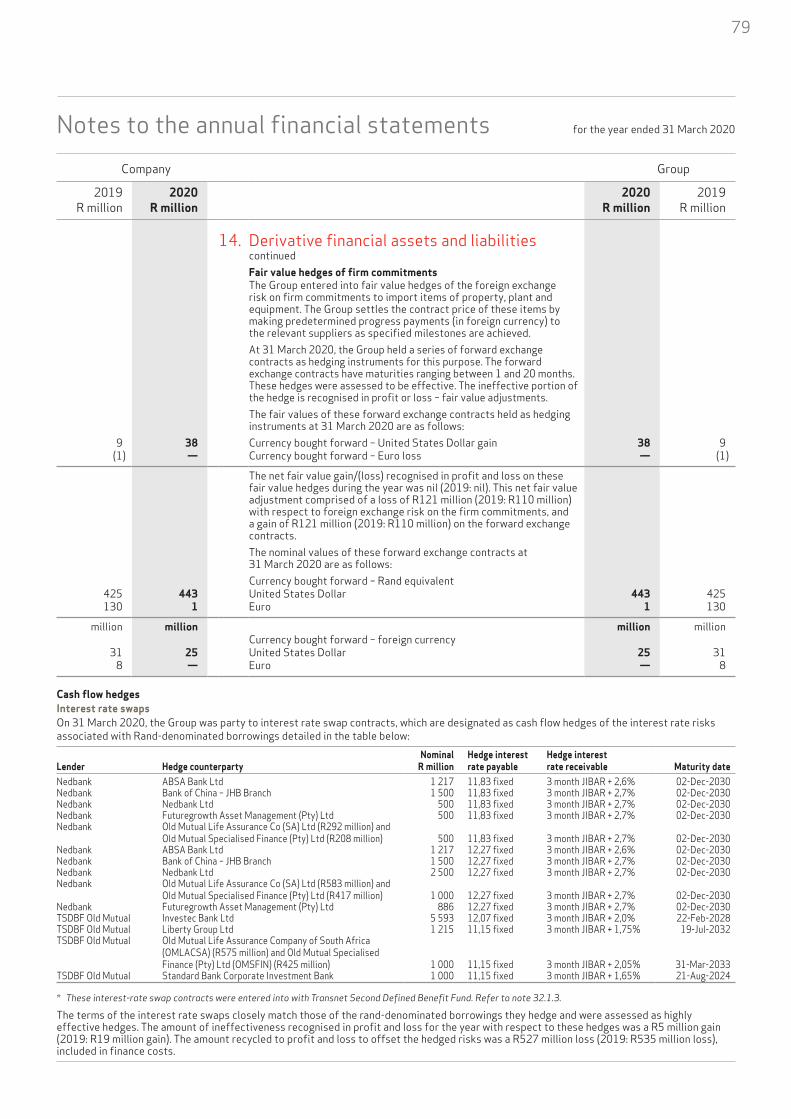
79
Notes to the annual financial statements for the year ended 31 March 2020
Company Group
2019 2020 2020 2019R million R million R million R million
14. Derivative financial assets and liabilities continuedFair value hedges of firm commitmentsThe Group entered into fair value hedges of the foreign exchange risk on firm commitments to import items of property, plant and equipment. The Group settles the contract price of these items by making predetermined progress payments (in foreign currency) to the relevant suppliers as specified milestones are achieved.At 31 March 2020, the Group held a series of forward exchange contracts as hedging instruments for this purpose. The forward exchange contracts have maturities ranging between 1 and 20 months. These hedges were assessed to be effective. The ineffective portion of the hedge is recognised in profit or loss – fair value adjustments.The fair values of these forward exchange contracts held as hedging instruments at 31 March 2020 are as follows:
9 38 Currency bought forward – United States Dollar gain 38 9 (1) — Currency bought forward – Euro loss — (1)
The net fair value gain/(loss) recognised in profit and loss on these fair value hedges during the year was nil (2019: nil). This net fair value adjustment comprised of a loss of R121 million (2019: R110 million) with respect to foreign exchange risk on the firm commitments, and a gain of R121 million (2019: R110 million) on the forward exchange contracts. The nominal values of these forward exchange contracts at 31 March 2020 are as follows:Currency bought forward – Rand equivalent
425 443 United States Dollar 443 425 130 1 Euro 1 130
million million million millionCurrency bought forward – foreign currency
31 25 United States Dollar 25 31 8 — Euro — 8
Cash flow hedgesInterest rate swapsOn 31 March 2020, the Group was party to interest rate swap contracts, which are designated as cash flow hedges of the interest rate risks associated with Rand-denominated borrowings detailed in the table below:
Lender Hedge counterpartyNominal
R millionHedge interestrate payable
Hedge interestrate receivable Maturity date
Nedbank ABSA Bank Ltd 1 217 11,83 fixed 3 month JIBAR + 2,6% 02-Dec-2030Nedbank Bank of China – JHB Branch 1 500 11,83 fixed 3 month JIBAR + 2,7% 02-Dec-2030Nedbank Nedbank Ltd 500 11,83 fixed 3 month JIBAR + 2,7% 02-Dec-2030Nedbank Futuregrowth Asset Management (Pty) Ltd 500 11,83 fixed 3 month JIBAR + 2,7% 02-Dec-2030Nedbank Old Mutual Life Assurance Co (SA) Ltd (R292 million) and
Old Mutual Specialised Finance (Pty) Ltd (R208 million) 500 11,83 fixed 3 month JIBAR + 2,7% 02-Dec-2030Nedbank ABSA Bank Ltd 1 217 12,27 fixed 3 month JIBAR + 2,6% 02-Dec-2030Nedbank Bank of China – JHB Branch 1 500 12,27 fixed 3 month JIBAR + 2,7% 02-Dec-2030Nedbank Nedbank Ltd 2 500 12,27 fixed 3 month JIBAR + 2,7% 02-Dec-2030Nedbank Old Mutual Life Assurance Co (SA) Ltd (R583 million) and
Old Mutual Specialised Finance (Pty) Ltd (R417 million) 1 000 12,27 fixed 3 month JIBAR + 2,7% 02-Dec-2030Nedbank Futuregrowth Asset Management (Pty) Ltd 886 12,27 fixed 3 month JIBAR + 2,7% 02-Dec-2030TSDBF Old Mutual Investec Bank Ltd 5 593 12,07 fixed 3 month JIBAR + 2,0% 22-Feb-2028TSDBF Old Mutual Liberty Group Ltd 1 215 11,15 fixed 3 month JIBAR + 1,75% 19-Jul-2032TSDBF Old Mutual Old Mutual Life Assurance Company of South Africa
(OMLACSA) (R575 million) and Old Mutual Specialised Finance (Pty) Ltd (OMSFIN) (R425 million) 1 000 11,15 fixed 3 month JIBAR + 2,05% 31-Mar-2033
TSDBF Old Mutual Standard Bank Corporate Investment Bank 1 000 11,15 fixed 3 month JIBAR + 1,65% 21-Aug-2024
* These interest-rate swap contracts were entered into with Transnet Second Defined Benefit Fund. Refer to note 32.1.3.
The terms of the interest rate swaps closely match those of the rand-denominated borrowings they hedge and were assessed as highly effective hedges. The amount of ineffectiveness recognised in profit and loss for the year with respect to these hedges was a R5 million gain (2019: R19 million gain). The amount recycled to profit and loss to offset the hedged risks was a R527 million loss (2019: R535 million loss), included in finance costs.

Notes to the annual financial statements for the year ended 31 March 2020
14. Derivative financial assets and liabilities continued
Cash flow hedges continuedCross-currency interest rate swapsOn 31 March 2020, the Group was party to cross-currency interest rate swap contracts which are designated as cash flow hedges of the foreign exchange and interest rate risks associated with foreign currency-denominated borrowings detailed in the table below:
Lender Hedge counterpartyNominal
USD millionHedge interest rate payable
Hedge interest rate receivable Maturity date
TNUS 22 GMTN US Dollar bondTranche 1 JPMorgan Chase Bank – JHB Branch 500 8,98% fixed (ZAR) 4% fixed (USD) 26-Jul-2022Tranche 2 RMB/Division of FirstRand Bank Ltd 500 8,935% fixed (ZAR) 4% fixed (USD) 26-Jul-2022China Development Bank (CDB)Loan 1 JPMorgan Chase Bank – JHB Branch 322 3-month JIBAR + 4,35% 3-month LIBOR + 2,57% (USD) 12-Jun-2030Loan 2 JPMorgan Chase Bank – JHB Branch 15 3-month JIBAR + 4,33% 3-month LIBOR + 2,57% (USD) 12-Jun-2030Loan 3 JPMorgan Chase Bank – JHB Branch 15 3-month JIBAR + 4,365% 3-month LIBOR + 2,57% (USD) 12-Jun-2030Loan 4 JPMorgan Chase Bank – JHB Branch 7 3-month JIBAR + 4,360% 3-month LIBOR + 2,57% (USD) 12-Jun-2030Loan 5 JPMorgan Chase Bank – JHB Branch 21 3-month JIBAR + 4,31% 3-month LIBOR + 2,57% (USD) 12-Jun-2030Loan 6 JPMorgan Chase Bank – JHB Branch 20 3-month JIBAR + 4,30% 3-month LIBOR + 2,57% (USD) 12-Jun-2030Loan 7 JPMorgan Chase Bank – JHB Branch 21 3-month JIBAR + 4,295% 3-month LIBOR + 2,57% (USD) 12-Jun-2030Loan 8 JPMorgan Chase Bank – JHB Branch 18 3-month JIBAR + 4,17% 3-month LIBOR + 2,57% (USD) 12-Jun-2030Loan 9 JPMorgan Chase Bank – JHB Branch 18 3-month JIBAR + 4,25% 3-month LIBOR + 2,57% (USD) 12-Jun-2030Loan 10 JPMorgan Chase Bank – JHB Branch 29 3-month JIBAR + 4,07% 3-month LIBOR + 2,57% (USD) 12-Jun-2030Loan 11 JPMorgan Chase Bank – JHB Branch 9 3-month JIBAR + 4,01% 3-month LIBOR + 2,57% (USD) 12-Jun-2030Loan 12 JPMorgan Chase Bank – JHB Branch 22 3-month JIBAR + 3,97% 3-month LIBOR + 2,57% (USD) 12-Jun-2030Loan 13 JPMorgan Chase Bank – JHB Branch 14 3-month JIBAR + 4,01% 3-month LIBOR + 2,57% (USD) 12-Jun-2030Loan 14 JPMorgan Chase Bank – JHB Branch 28 3-month JIBAR + 3,84% 3-month LIBOR + 2,57% (USD) 12-Jun-2030Loan 15 JPMorgan Chase Bank – JHB Branch 12 3-month JIBAR + 3,84% 3-month LIBOR + 2,57% (USD) 12-Jun-2030Loan 16 JPMorgan Chase Bank – JHB Branch 14 3-month JIBAR + 3,96% 3-month LIBOR + 2,57% (USD) 12-Jun-2030Loan 17 JPMorgan Chase Bank – JHB Branch 7 3-month JIBAR + 3,995% 3-month LIBOR + 2,57% (USD) 12-Jun-2030Loan 18 JPMorgan Chase Bank – JHB Branch 20 3-month JIBAR + 4,00% 3-month LIBOR + 2,57% (USD) 12-Jun-2030Loan 19 JPMorgan Chase Bank – JHB Branch 10 3-month JIBAR + 3,94% 3-month LIBOR + 2,57% (USD) 12-Jun-2030Loan 20 JPMorgan Chase Bank – JHB Branch 24 3-month JIBAR + 3,88% 3-month LIBOR + 2,57% (USD) 12-Jun-2030Loan 21 JPMorgan Chase Bank – JHB Branch 14 3-month JIBAR + 3,89% 3-month LIBOR + 2,57% (USD) 12-Jun-2030Loan 22 JPMorgan Chase Bank – JHB Branch 19 3-month JIBAR + 3,89% 3-month LIBOR + 2,57% (USD) 12-Jun-2030Loan 23 JPMorgan Chase Bank – JHB Branch 19 3-month JIBAR + 3,88% 3-month LIBOR + 2,57% (USD) 12-Jun-2030Loan 24 JPMorgan Chase Bank – JHB Branch 19 3-month JIBAR + 3,91% 3-month LIBOR + 2,57% (USD) 12-Jun-2030Loan 25 JPMorgan Chase Bank – JHB Branch 18 3-month JIBAR + 3,86% 3-month LIBOR + 2,57% (USD) 12-Jun-2030Loan 26 JPMorgan Chase Bank – JHB Branch 14 3-month JIBAR + 3,94% 3-month LIBOR + 2,57% (USD) 12-Jun-2030Loan 27 JPMorgan Chase Bank – JHB Branch 7 3-month JIBAR + 3,87% 3-month LIBOR + 2,57% (USD) 12-Jun-2030Loan 28 JPMorgan Chase Bank – JHB Branch 18 3-month JIBAR + 3,82% 3-month LIBOR + 2,57% (USD) 12-Jun-2030Loan 29 JPMorgan Chase Bank – JHB Branch 30 3-month JIBAR + 3,775% 3-month LIBOR + 2,57% (USD) 12-Jun-2030Loan 30 JPMorgan Chase Bank – JHB Branch 33 3-month JIBAR + 3,78% 3-month LIBOR + 2,57% (USD) 12-Jun-2030Loan 31 JPMorgan Chase Bank – JHB Branch 15 3-month JIBAR + 3,79% 3-month LIBOR + 2,57% (USD) 12-Jun-2030Loan 32 JPMorgan Chase Bank – JHB Branch 5 3-month JIBAR + 3,80% 3-month LIBOR + 2,57% (USD) 12-Jun-2030Loan 33 JPMorgan Chase Bank – JHB Branch 11 3-month JIBAR + 3,78% 3-month LIBOR + 2,57% (USD) 12-Jun-2030Loan 34 JPMorgan Chase Bank – JHB Branch 21 3-month JIBAR + 3,71% 3-month LIBOR + 2,57% (USD) 12-Jun-2030Loan 35 JPMorgan Chase Bank – JHB Branch 5 3-month JIBAR + 3,72% 3-month LIBOR + 2,57% (USD) 12-Jun-2030Loan 36 JPMorgan Chase Bank – JHB Branch 20 3-month JIBAR + 3,79% 3-month LIBOR + 2,57% (USD) 12-Jun-2030Loan 37 JPMorgan Chase Bank – JHB Branch 19 3-month JIBAR + 3,85% 3-month LIBOR + 2,57% (USD) 12-Jun-2030Loan 38 JPMorgan Chase Bank – JHB Branch 9 3-month JIBAR + 3,84% 3-month LIBOR + 2,57% (USD) 12-Jun-2030Loan 39 JPMorgan Chase Bank – JHB Branch 8 3-month JIBAR + 3,82% 3-month LIBOR + 2,57% (USD) 12-Jun-2030Loan 40 JPMorgan Chase Bank – JHB Branch 45 3-month JIBAR + 3,66% 3-month LIBOR + 2,57% (USD) 12-Jun-2030Loan 41 JPMorgan Chase Bank – JHB Branch 12 3-month JIBAR + 3,56% 3-month LIBOR + 2,57% (USD) 12-Jun-2030
80 Annual financial statementsNotes to the annual financial statements

81
Notes to the annual financial statements for the year ended 31 March 2020
14. Derivative financial assets and liabilities continued
The terms of the cross-currency interest rate swaps closely match those of the foreign currency-denominated borrowings they hedge and were assessed as highly effective hedges. The amount of ineffectiveness recognised in profit and loss – fair value adjustment for the year with respect to these hedges was a R23 million loss (2019: R74 million loss). The main source of hedge ineffectiveness in the hedging relationships is the effect of the counterparty and the Group’s own credit risk on the fair value of the swaps, which is not reflected in the fair value of the hedged items attributable to changes in the hedged risks. No other sources of ineffectiveness emerged from these hedging relationships.
The amount recycled to profit and loss to offset the hedged risks was a R5 061 million credit (2019: R5 977 million credit), included in finance costs.
The cash flows are projected to occur:• Semi–annually in July and January until July 2022 on both tranches of the TNUS22 bond hedge; and• Quarterly until June 2030 on the CDB hedge.
Company Group
2019 2020 2020 2019R million R million R million R million
The fair values of the cross–currency interest rate swaps at 31 March 2020 are as follows:
652 — AFLAC — 652 943 4 045 CDB 4 045 943
6 548 9 953 TNUS22 9 953 6 548 116 — BTMU — 116
The nominal amounts of the cross–currency interest rate swaps at 31 March 2020 are as follows:
23 657 21 724 South African Rand 21 724 23 657 15 000 — Japanese Yen — 15 000
2 088 2 008 United States Dollar 2 008 2 088
Day-one loss 1 108 1 004 Loss at the beginning of the year 1 004 1 108
— — Day-one loss recognised — — (104) (104) Amortised to profit or loss (104) (104)
1 004 900 Loss at the end of the year 900 1 004
The unamortised day-one loss is included within the long-term financial assets.

Notes to the annual financial statements for the year ended 31 March 2020
Company Group
2019 2020 2020 2019R million R million R million R million
15. Long-term loans and advances260 — — 260
19 260 Balance at the beginning of the year 260 19258 — Advances — 258(17) (260) Impairment (refer note 4.2) (260) (17)
Comprising:— — Employee housing and other loans — —
17 — Balance at the beginning of the year — 17(17) — Impairment — (17)
260 — Other loans and advances — 260
2 260 Balance at the beginning of the year 260 2258 — Advances — 258
— (260) Impairment (260) —
260 — — 260
The directors estimate that the carrying amount of long-term loans and advances approximate their fair value.
16. Other investments, long-term financial assets and other liabilities
16.1 Other financial assets 1 597 1 615 Held at amortised cost1 1 256 1 264
— — Held at FVTOCI2 329 306178 201 Held at FVTPL3 201 178
1 775 1 816 1 786 1 748
16.2 Short-term investments
557 578Short-term portion of other financial assets, including resale agreements4 603 595
557 578 603 595
16.3 Other non-current liabilities 3 530 3 477 Security of supply petroleum levy 3 477 3 530
76 240 Other5 240 76
— — Deferred income – National Ports Authority — —
5 527 — Balance at the beginning of the year — 5 527 (5 527) — Impact of change in accounting policy — (5 527)
— — Deferred income – Pipelines — —
434 — Balance at the beginning of the year — 434 (434) — Impact of change in accounting policy — (434)
3 606 3 717 3 717 3 6061 The directors estimate that the carrying amount of financial assets held at amortised cost approximate their fair value.2 Restricted debt investment held by the TPL Rehabilitation Trust.3 Freight Dynamics Guardrisk insurance cell captive held for insurance purposes for Freight Rail customers.4 Includes restricted short-term investment held by the TPL Rehabilitation Trust.5 Other financial liabilities relate mainly to warranty provisions for the locomotive build programmes.
82 Annual financial statementsNotes to the annual financial statements

83
Notes to the annual financial statements for the year ended 31 March 2020
Company Group
2019 2020 2020 2019R million R million R million R million
17. InventoryAt weighted average cost
2 052 1 995 Maintenance material 1 995 2 052 247 457 Consumables 457 247
37 37 Finished goods 37 37 — (41) Work-in-progress1 (41) —
(375) (248) Provision for stock obsolescence2 (248) (375)
1 961 2 200 2 200 1 961
At net realisable value 490 784 Maintenance material 784 490
33 73 Consumables 73 33 (43) (60) Provision for stock obsolescence (60) (43)
480 797 797 480
2 441 2 997 2 997 2 441 1 Included in work in progress are costs for contact assets (refer note 27).2 The decrease in the provision for stock obsolescence is due to slow moving
items assessed at the end of the current financial year. No items of inventory have been pledged as security at 31 March 2020 (2019: nil).
The cost of inventory used during the period of R809 million and the decrease in the provision for obsolescence of R110 million are recognised in operating expenses (refer note 2 – material costs).
18. Trade, other receivables and contract assets 6 222 7 839 Trade receivables – net of allowances for credit losses 7 840 6 224
8 803 10 953 Trade receivables3 10 954 8 821 (2 581) (3 114) Less: Allowance for expected credit losses (3 114) (2 597)
449 297 Contract assets – net of allowance for expected credit losses 297 449
450 297 Contract assets (refer note 27) 297 450 (1) — Less: Allowance for expected credit losses — (1)
2 017 1 857 Prepayments and other amounts receivable – net of allowances for credit losses 1 859 2 021
2 291 2 084 Prepayments and other amounts receivable 2 086 2 295 (274) (227) Less: Allowance for expected credit losses (227) (274)
1 — Short-term portion of loans and advances — 1
8 689 9 993 9 996 8 6953 Trade receivables include an amount of R3,8 billion (2019: R2,8 billion) relating to receivables which were discounted under a full recourse arrangement with a
financial institution and did not meet the derecognition criteria in IFRS 9. The corresponding liability is included in trade payables, accruals and contract liabilities (refer note 28).

Notes to the annual financial statements for the year ended 31 March 2020
Company Group
2019 2020 2020 2019R million R million R million R million
18. Trade, other receivables and contract assets continued
Total allowance for expected credit losses (2 345) (2 856) Opening balance (2 872) (2 361)
(549) — Impact of change in accounting policy – initial application of IFRS 9 — (549)(2 894) (2 856) Adjusted balance (2 872) (2 910)
(705) (1 118) Raised (1 118) (705) 743 633 Amounts written-off 649 743
(2 856) (3 341) Closing balance (3 341) (2 872)
(2 581) (3 114)Allowance for expected credit losses on trade receivables from contracts with customers (3 114) (2 597)
(1) — Allowance for expected credit losses on contract assets — (1) (274) (227) Allowance for expected credit losses on other receivables (227) (274)
(2 856) (3 341) Total allowance for expected credit losses (3 341) (2 872)
19. Cash and cash equivalents 4 148 4 254 Cash and cash equivalents 4 256 4 156*
4 148 4 254 4 256 4 156 * Included in cash and cash equivalents are restricted TPL Rehabilitation Trust
accounts amounting to R1,8 million (2019: R8,5 million).
20. Assets classified as held-for-sale and liabilities directly associated with assets classified as held-for-saleNon-current assets classified as held-for-sale
114 216 Property, plant and equipment1 216 114 60 115 Net carrying value at the beginning of the year 115 60
(3) (1) Disposals (1) (3) 57 102 Transferred from property, plant and equipment (refer note 9) 102 57
9 9 Investment property2 9 9 37 9 Fair value at the beginning of the year 9 37 (28) — Disposals — (28) 50 49 Other investments3 49 50 33 50 Balance at the beginning of the year 50 33 17 (1) Fair value movement during the year (1) 17
173 274Total assets transferred to non-current assets classified as held-for-sale 274 173 1 Property, plant and equipment classified as held-for-sale mainly relate to rolling
stock and containers that are damaged, obsolete or no longer in use. 2 Transnet is currently disposing the properties that are classified as non-core,
and hence are no longer required for mainline business. The fair value measurements are categorised as level 3 – refer note 10 for more detail.
3 Equity investment in Rumo Logistica Operadora Multi-model S.A. (Rumo), a Brazilian registered Company. The investment, previously accounted for as available-for-sale, was designated as at FVTOCI on initial application of IFRS 9. The fair value measurement is categorised as level 1 – refer note 36 for more detail.
21. Issued capitalAuthorised
30 000 30 000 30 000 000 000 ordinary par value shares of R1 each 30 000 30 000Issued
12 661 12 66112 660 986 310 ordinary par value shares of R1 each (2019: 12 660 986 310). 12 661 12 661
The unissued share capital is under the control of the South African Government, the sole shareholder of the Company.
84 Annual financial statementsNotes to the annual financial statements
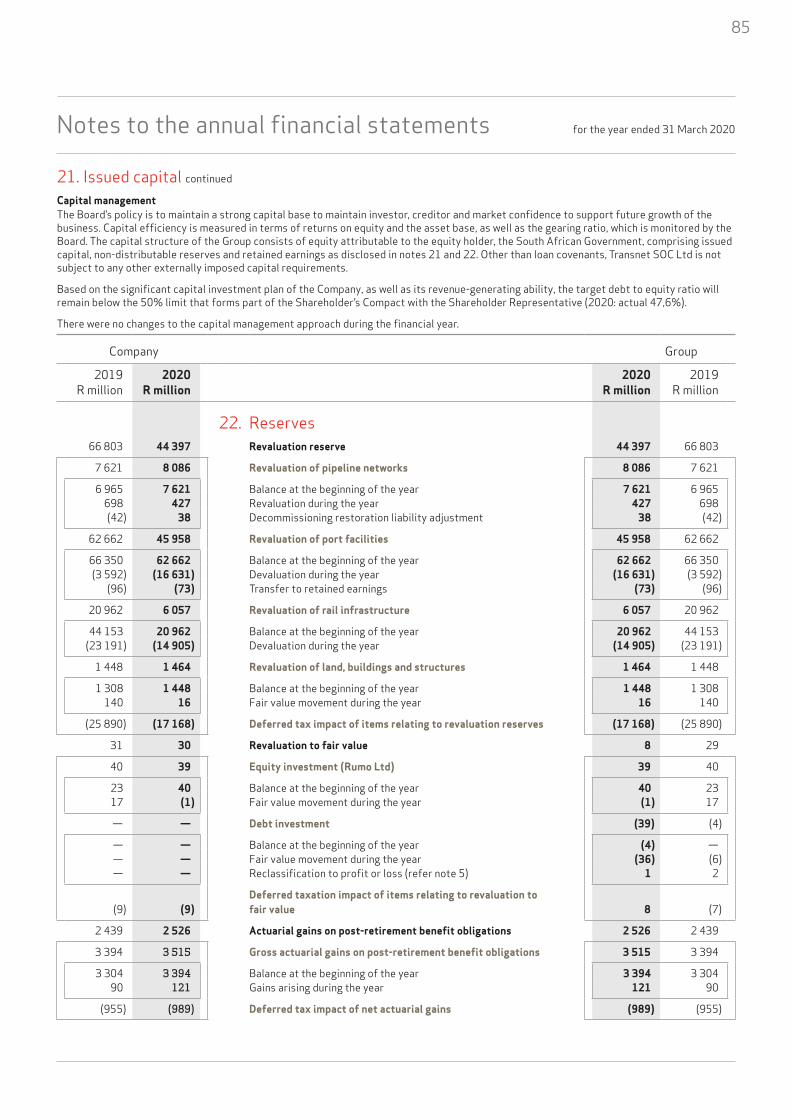
85
Notes to the annual financial statements for the year ended 31 March 2020
21. Issued capital continued
Capital managementThe Board’s policy is to maintain a strong capital base to maintain investor, creditor and market confidence to support future growth of the business. Capital efficiency is measured in terms of returns on equity and the asset base, as well as the gearing ratio, which is monitored by the Board. The capital structure of the Group consists of equity attributable to the equity holder, the South African Government, comprising issued capital, non-distributable reserves and retained earnings as disclosed in notes 21 and 22. Other than loan covenants, Transnet SOC Ltd is not subject to any other externally imposed capital requirements.
Based on the significant capital investment plan of the Company, as well as its revenue-generating ability, the target debt to equity ratio will remain below the 50% limit that forms part of the Shareholder’s Compact with the Shareholder Representative (2020: actual 47,6%).
There were no changes to the capital management approach during the financial year.
Company Group
2019 2020 2020 2019R million R million R million R million
22. Reserves 66 803 44 397 Revaluation reserve 44 397 66 803
7 621 8 086 Revaluation of pipeline networks 8 086 7 621
6 965 7 621 Balance at the beginning of the year 7 621 6 965 698 427 Revaluation during the year 427 698
(42) 38 Decommissioning restoration liability adjustment 38 (42)
62 662 45 958 Revaluation of port facilities 45 958 62 662
66 350 62 662 Balance at the beginning of the year 62 662 66 350 (3 592) (16 631) Devaluation during the year (16 631) (3 592)
(96) (73) Transfer to retained earnings (73) (96)
20 962 6 057 Revaluation of rail infrastructure 6 057 20 962
44 153 20 962 Balance at the beginning of the year 20 962 44 153 (23 191) (14 905) Devaluation during the year (14 905) (23 191)
1 448 1 464 Revaluation of land, buildings and structures 1 464 1 448
1 308 1 448 Balance at the beginning of the year 1 448 1 308 140 16 Fair value movement during the year 16 140
(25 890) (17 168) Deferred tax impact of items relating to revaluation reserves (17 168) (25 890)
31 30 Revaluation to fair value 8 29
40 39 Equity investment (Rumo Ltd) 39 40
23 40 Balance at the beginning of the year 40 23 17 (1) Fair value movement during the year (1) 17
— — Debt investment (39) (4)
— — Balance at the beginning of the year (4) — — — Fair value movement during the year (36) (6)— — Reclassification to profit or loss (refer note 5) 1 2
(9) (9)Deferred taxation impact of items relating to revaluation to fair value 8 (7)
2 439 2 526 Actuarial gains on post-retirement benefit obligations 2 526 2 439
3 394 3 515 Gross actuarial gains on post-retirement benefit obligations 3 515 3 394
3 304 3 394 Balance at the beginning of the year 3 394 3 304 90 121 Gains arising during the year 121 90
(955) (989) Deferred tax impact of net actuarial gains (989) (955)

Notes to the annual financial statements for the year ended 31 March 2020
Company Group
2019 2020 2020 2019R million R million R million R million
22. Reserves continued
(426) (501) Cash flow hedging reserve (501) (426)
(615) (719) Gross cash flow hedging reserve (719) (615)
(1 300) (615) Balance at the beginning of the year (615) (1 300) (108) — Impact of change in accounting policy — (108)
6 770 6 893 Gains arising during the year 6 893 6 770 (5 977) (6 997) Transfer to foreign exchange differences (6 997) (5 977)
189 218 Deferred taxation impact of items relating to cash flow hedging reserve 218 189
250 250 Other reserves* 249 249
250 250 Share of pension fund surplus (retained for application against pensioners) 249 249
66 688 70 669 Retained earnings 70 887 66 876
56 792 66 688 Balance at the beginning of the year 66 876 56 924 3 809 — Impact of change in accounting policy — 3 809
96 73 Transfers into retained earnings 73 965 991 3 908 Profit for the year attributable to the equity holder 3 938 6 047
135 785 117 371 117 566 135 970
* Other reserves relate to the share of pension fund surplus (retained for application against pensioners).
23. Employee benefits1 015 855 Post-retirement benefit obligations 855 1 015
1 132 1 015 Balance at the beginning of the year 1 015 1 132117 116 Recognised in profit or loss 116 117
(144) (155) Settlements during the year (155) (144)(90) (121) Actuarial gains (121) (90)
Comprising:— — Transport Pension Fund: Transnet Sub-fund (refer note 32.1.2) — —— — Transnet Second Defined Benefit Fund (refer note 32.1.3) — —58 51 Transnet Top Management pensions (refer note 32.1.4) 51 58
412 359 Transnet Workmen’s Compensation Act pensioners (refer note 32.1.4) 359 412
327 258 Transnet SATS pensioners’ post-retirement medical benefits (refer note 32.2.1) 258 327
218 187 Transnet employees’ post-retirement medical benefits (refer note 32.2.2) 187 218
1 015 855 855 1 015
86 Annual financial statementsNotes to the annual financial statements

87
Notes to the annual financial statements for the year ended 31 March 2020
Company Group
2019 2020 2020 2019R million R million R million R million
23. Employee benefits continued
Various assumptions have been applied by management and actuaries in the calculation of post-retirement benefit obligations.The assumptions and their sensitivities are disclosed in note 32.
— — Other post-retirement and medical benefits — —
101 127 Balance at the beginning of the year 127 101 170 105 Recognised in profit or loss 105 170 (144) (112) Utilised during the year (112) (144)
127 120 120 127 (127) (120) Less: Short-term portion classified as current liabilities (120) (127)
1 434 1 231 Leave pay 1 231 1 434
2 331 2 472 Balance at the beginning of the year 2 472 2 331 465 410 Accruals recognised during the year 410 465 (324) (589) Utilised during the year (589) (324)
2 472 2 293 2 293 2 472 (1 038) (1 062) Less: Short-term portion classified as current liabilities (1 062) (1 038)
353 244 Incentive bonuses 244 353
2 376 1 164 Balance at the beginning of the year 1 164 2 376 1 087 442 Accruals recognised during the year 442 1 087
(2 299) (1 044) Utilised during the year (1 044) (2 299)
1 164 562 562 1 164 (811) (318) Less: Short-term portion classified as current liabilities (318) (811)
2 802 2 330 Total employee benefits 2 330 2 802
Other post-retirement and medical benefitsThis relates to payments made for SATS pensioners medical expenses.
Leave payRelates to accrual for unutilised leave at year-end. The leave is expected to be taken over the next two financial years and is calculated based on employee total cost to Company.
Incentive bonusesAccrual for incentive bonuses in terms of the incentive bonus scheme and ex-gratia incentives.

Notes to the annual financial statements for the year ended 31 March 2020
Company Group
2019 2020 2020 2019R million R million R million R million
24. Long-term borrowings (refer note 36)115 176 116 515 116 515 115 176
93 591 115 176 Total long-term borrowings at the beginning of the year 115 176 93 5938 545 10 018 Recognised in the reporting period 10 018 8 5434 983 6 680 Foreign exchange differences 6 680 4 983
(3) 44 Amortisation of discount 44 (3)
(6 778) (15 403)Current portion of long-term borrowings redeemable within one year transferred to short-term borrowings (refer note 29) (15 403) (6 778)
14 838 — Transfer from short-term borrowings (refer note 29)* — 14 838
Made up as follows:Unsecured liabilities
78 510 77 477 Rand-denominated 77 477 78 510
45 001 42 618 Bonds at nominal value 42 618 45 001(668) (783) Unamortised discounts (783) (668)
44 333 41 835 Bonds at carrying value1 41 835 44 33334 177 35 642 Other unsecured liabilities2 35 642 34 177
16 025 17 746 Foreign currency-denominated3 17 746 16 025
14 421 17 800 Bonds at nominal value 17 800 14 421(63) (54) Unamortised discounts (54) (63)
14 358 17 746 Bonds at carrying value 17 746 14 3581 667 — Other unsecured liabilities — 1 667
20 641 21 292 Secured loans4 and lease liabilities5 21 292 20 641
6 413 5 418 Rand-denominated 5 418 6 41314 228 15 874 Foreign currency-denominated6 15 874 14 228
115 176 116 515 Total long-term borrowings 116 515 115 176* The transfer from short-term borrowings in the prior year relates to borrowings that are no longer short-term as a result of the 2018 financial year audit
qualification loan covenant breach being resolved in the 2019 financial year. Whilst these loans are still subject to this covenant, the qualified opinion in the 2019 and 2020 financial year was technical in nature (PFMA specific) and was not related to compliance with IFRS nor the Companies Act of South Africa. Management assessed the situation and believed that the 2019 and 2020 financial year position did not necessitate a need to reclassify any of this debt as short term (other than that which is already classified as short term in the normal course of business).
1 Rand denominated domestic bonds bear interest between 8,858% and 10,8% and are repayable over periods between the 2022 and 2041 financial years. Rand denominated Eurorand bonds bear interest between 10,0% and 13,5% and are repayable in 2028 and 2029 (refer note 36). Rand denominated foreign bonds bear interest at 9,5% and are repayable on 13 May 2021.
2 Rand denominated unsecured domestic loans are repayable over periods between 2 August 2021 and 1 February 2036, and bears interest at rates ranging between 7,7% and 15,79%.
3 Foreign currency bonds are denominated in United States Dollar, is redeemable on 26 July 2022, and bears interest at a rate of 4,0%.4 Rand denominated secured loans are repayable over periods between 20 December 2021 and 17 September 2029 and bear interest at rates ranging between
6,15% and 10,37% with floating rates linked to JIBAR. 5 Rand denominated lease liabilities bear interest at rates ranging between 7,25% and 16,93% with all rates fixed. These liabilities are repayable over periods between
the 2022 and 2027 financial years.6 Foreign currency secured loans are denominated in United States Dollar, bear interest at 3,35413% and are repayable on 12 June 2030.
88 Annual financial statementsNotes to the annual financial statements

89
Notes to the annual financial statements for the year ended 31 March 2020
Company Group
2019 2020 2020 2019R million R million R million R million
25. Provisions2 593 3 654 Comprising: 3 654 2 593
2 258 2 593 Long-term provisions at the beginning of the year 2 593 2 2581 782 2 913 Provisions recognised during the year and unwinding of discounts 2 913 1 782
(1 385) (1 792) Provisions utilised (1 792) (1 385)(62) (60) Increase in short-term provisions classified as current liabilities (60) (62)
322 402 Third-party claims1 402 322
493 322 Balance at the beginning of the year 322 493871 867 Provisions recognised during the year 867 871
(1 042) (787) Utilised during the year (787) (1 042)
170 172 Customer claims1 172 170
162 170 Balance at the beginning of the year 170 1628 7 Provisions recognised during the year 7 8
— (5) Utilised during the year (5) —
2 835 3 999 Decommissioning and environmental liabilities1 3 999 2 835
2 418 2 835 Balance at the beginning of the year 2 835 2 418511 1 303 Provisions recognised during the year and unwinding of discounts 1 303 511(94) (139) Utilised during the year (139) (94)
24 24 Restructuring 24 24
24 24 Balance at the end of the year 24 24
363 238 Other1, 2 238 363
220 363 Balance at the beginning of the year 363 220392 736 Provisions recognised during the year 736 392
(249) (861) Utilised during the year (861) (249)
3 714 4 835 Total provisions 4 835 3 7141 121 1 181 Less: Short-term provisions classified as current liabilities 1 181 1 121
321 335 Third-party claims1 335 321170 172 Customer claims1 172 170432 436 Decommissioning and environmental liabilities1 436 432198 238 Other1, 2 238 198
2 593 3 654 Long-term provisions 3 654 2 593
1 Certain third party and customer claims and decommissioning and environmental liabilities provisions were reallocated from other provisions in the prior year. 2 Other provisions include, uniform and clothing, repairs and maintenance, and cleaning related provisions.

Notes to the annual financial statements for the year ended 31 March 2020
25. Provisions continued Various assumptions are applied in arriving at the carrying value of provisions that are recognised in terms of the requirements of IAS 37 Provisions, Contingent Liabilities and Contingent Assets.
Management further relies on input from the Group’s lawyers in assessing the probability on matters of a contingent nature. Contingent liabilities are disclosed in note 31.
Third-party claimsThis provision represents the best estimate of known third-party legal claims against the Group, plus an allowance for losses incurred, but not yet reported, based on historical experience. These claims are expected to be paid within 12 months of the reporting date.
Customer claimsThis provision represents claims made by customers arising from non-performance on contracts or damage to goods in transit. Settlement of claims are expected in the following year. These claims are expected to be paid within 12 months of the reporting date.
Decommissioning and environmental liabilitiesThis is a provision for the dismantling and removal of an asset as a result of the requirement to restore the site on which the asset is located. The provision has been computed by discounting future cash flows.
In accordance with the Group’s environmental policy and applicable legal requirements, a provision for environmental rehabilitation costs is recognised when it meets the recognition requirements for provisions. The provision includes the estimated rehabilitation costs for quarries and historical contamination of land caused by asbestos, ferromanganese, manganese, mixed soil (including chrome, sulphur and manganese), fuel, rubble and ballast.
Transnet engaged external consultants to perform risk assessments on identified areas of contamination and the Group’s related rehabilitation obligation. These obligations are expected to be settled within 1 – 68 years. A number of factors were considered in determining the obligation, which included:• The nature and extent of the contamination;• The appropriate method to remediate the contamination;• The cost per ton/per running line kilometre of removal and disposal of the contamination;• The costs of rehabilitation of the identified areas of contamination; and• The costs estimated for the removal and replacement of asbestos roof sheeting and cladding on buildings.
The provision was computed by discounting the future cash flows required to satisfy the obligations at discount rates between 5,0% and 12,2%.
RestructuringProvision for restructuring costs in terms of strategic plans that do not include any termination benefits payable to employees.
90 Annual financial statementsNotes to the annual financial statements

91
Notes to the annual financial statements for the year ended 31 March 2020
Company Group
2019 2020 2020 2019R million R million R million R million
26. Deferred tax liability47 849 41 268 Comprising: 41 250 47 846
50 913 47 849 Opening balance 47 846 50 911 2 533 2 136 Income statement charge (refer note 8) 2 136 2 534
(123) — Impact of change in accounting policy: IFRS 9 — (123) 1 594 — Impact of change in accounting policy: IFRS 15 — 1 594
(7 068) (8 717) Recognised in other comprehensive income (refer note 8.1) (8 732) (7 070)
Analysis of major categories of temporary differences 14 249 15 750 Deferred tax assets 15 754 14 252
1 044 1 395 Provisions 1 395 1 039 1 518 1 259 Employee benefit obligations 1 259 1 518 1 334 1 452 Revenue received in advance and deferred income 1 452 1 334
363 381 Capitalised lease liability 381 363 623 726 Doubtful debts 726 623
26 63 Cross-currency swaps 63 26 9 317 10 474 Estimated tax loss 10 474 9 317
24 — Other 4 32
62 098 57 018 Deferred tax liabilities 57 004 62 098
184 179 Deferred expenditure 179 184 61 710 56 648 Property, plant and equipment 56 650 61 710
204 175 Future expenditure allowance 175 204 — 16 Other — —
47 849 41 268 Net deferred tax liability 41 250 47 846
27. Contract assetsContracts in progress at the statement of financial position date:
204 58 Engineering 58 204 245 239 Ports 239 245
1 — Pipelines – oil and gas — 1
450 297 297 450
Contract assets relate to the Group’s rights to consideration in respect of: Engineering – revenue accrued in respect of work completed on engineering contracts but not yet billed at year-end, including retention debtors.Ports – revenue accrued in respect of work on cargo and vessels at the ports but not yet invoiced at year-end. Pipelines – revenue accrued in respect of surplus crude oil delivered to customers in the last few days before year-end, compared to intake volumes. Contract assets are reclassified to trade receivables when the rights become unconditional and the customer is invoiced.
The decrease in contract assets relate to the completion of contracts in the current financial year.

Notes to the annual financial statements for the year ended 31 March 2020
Company Group
2019 2020 2020 2019R million R million R million R million
28. Trade payables, accruals and contract liabilities 2 102 2 292 Trade payables 2 297 2 100
16 365 15 383 Accruals 15 384 16 369
10 344 9 709 Accrued expenditure 9 710 10 348 149 191 Deposits received 191 149
2 430 2 427 Accrued interest 2 427 2 430 863 918 Personnel costs 918 863 127 120 Other post-retirement and medical benefits (refer note 23) 120 127
1 038 1 062 Leave pay (refer note 23) 1 062 1 038 811 318 Incentive bonus (refer note 23) 318 811
18 23 SARS – withholding tax 23 18 585 615 SARS – value-added tax 615 585
994 1 386 Contract liabilities 1 386 994
19 461 19 061 19 067 19 463
Contract liabilities primarily relate to: (i) consideration received in advance from customers, including cash customers, which is recognised as revenue in future periods upon satisfaction of the related performance obligations, and (ii) accrual for shortfalls in crude oil delivered to customers in the last few days before year-end, compared to intake volumes.
Contract liabilities are generally recognised in revenue within 12 months after the reporting date.
The increase in contract liabilities is due mainly to increased lease rental income received in advance from property rental customers.
29. Short-term borrowings 28 957 12 490 Total short-term borrowings at the beginning of the year 12 490 28 957
1 323 1 792 Recognised in the reporting period 1 792 1 323 (10 417) (13 058) Repayments in the reporting period (13 058) (10 417)
690 178 Foreign exchange movement 178 690 (3) (54) Amortisation of discount (54) (3)
6 778 15 403Current portion of long-term interest-bearing borrowings (refer note 24) 15 403 6 778
(14 838) — Transfer to long-term borrowings (refer note 24)* — (14 838)
12 490 16 751 16 751 12 490
* The transfer to long-term borrowings in the prior year relates to borrowings that are no longer short-term as a result of the 2018 financial year audit qualification loan covenant breach being resolved in the 2019 financial year.
Short-term borrowings relate to the market-making portfolio and comprise the Group’s position on bonds and other financial instruments, net of related repayments.
The short-term borrowings bear interest at rates between 3,35% and 10,5%, is repayable between April 2020 and March 2021 and are not guaranteed.
92 Annual financial statementsNotes to the annual financial statements

93
Notes to the annual financial statements for the year ended 31 March 2020
Company Group
2019 2020 2020 2019R million R million R million R million
30. Commitments30.1 Capital commitments*
133 198 Contracted for in US Dollars 198 133 — 121 Contracted for in Euros 121 —
30 457 20 374 Contracted for in SA Rands 20 374 30 457 87 — Contracted for in various other currencies — 87
30 677 20 693 Total capital commitments contracted for 20 693 30 677 122 856 106 969 Authorised by the directors but not yet contracted for 106 969 122 856
153 533 127 662 127 662 153 533
Total capital commitments are expected to be incurred as follows: 28 911 21 647 Within one year 21 647 28 911
124 622 106 015 After one year, but not more than five years 106 015 124 622
153 533 127 662 127 662 153 533
These capital commitments will be financed utilising net cash flow from operations, debt capital markets, project finance and the use of operating leases.
* Excludes capitalised borrowing costs of R4 918 million (2019: R6 886 million).
30.2 Lease commitmentsThe Group as lesseeMaturity analysis of lease liabilities
635 725 Less than one year 725 635728 863 One to five years 863 728135 56 More than five years 56 135
1 498 1 644 Total undiscounted lease liabilities 1 644 1 498(201) (285) Less: Amount representing finance charges (285) (201)
1 297 1 359 Lease liabilities 1 359 1 297
553 539 Short-term lease liabilities 539 553744 820 Long-term lease liabilities 820 744
Total cash payments made by the Group for leases during the financial year amounted to R688 million (2019: R510 million), including repayment of capital on lease liabilities, interest payments, variable lease payments not included in the measurement of the lease liability, as well as payments made under short-term leases and leases of low-value assets.
The Group leases land and buildings for its office space, motor vehicles, equipment, and IT equipment.
The leases of land and buildings typically run for periods of one to ten years.
The leases for motor vehicles and equipment have average lease terms of one to five years. In some cases the Group has options to purchase the assets at the end of the lease term, or guarantees the residual value of leased assets at the end of the lease term. As at 31 March 2020, the Group did not expect any material payments under these options and guarantees which are not already included in the lease liability.
The leases of IT equipment have average contract terms of three years. The majority of these leases have been classified as leases of low-value assets. The Group elected not to recognise right-of-use assets and lease liabilities for these leases.

Notes to the annual financial statements for the year ended 31 March 2020
Company Group
2019 2020 2020 2019R million R million R million R million
30. Commitments continued
30.2 Lease commitments continuedVariable lease paymentsThe motor vehicle leases include variable lease payments that do not depend on an index or a rate, and are excluded from the measurement of the lease liability (e.g. excess kilometres travelled, tyres, e-toll fees, traffic fines, etc). The amount of variable lease payments made during the year is disclosed in note 4.1. The Group does not expect future variable lease payments to differ significantly from the amount recognised during the financial year.
The Group as lessorLease income receivableThe Group leases out its investment properties, namely land and buildings, under short-term leases with an annual escalation varying from 7,0% to 14,0%. The Group has classified these leases as operating leases, as they do not transfer substantially all of the risks and rewards incidental to ownership of the leased assets.
Future minimum rentals under operating leases are as follows:
Property2 160 2 261 Less than one year 2 261 2 1602 236 2 385 More than one year but less than two years 2 385 2 2362 290 2 418 More than two years but less than three years 2 418 2 2902 343 2 495 More than three years but less than four years 2 495 2 3432 513 2 413 More than four years but less than five years 2 413 2 513
15 673 16 855 More than five years 16 855 15 673
27 215 28 827 28 827 27 215
The Group manages the risks associated with the rights it retains in the underlying leased assets. Lessees are prohibited from selling or pledging the underlying assets as security. The Group generally imposes a restriction that, unless there is a contractual right for the lessee to sublet the asset to another party, the leased asset can only be used by the lessee. Leases are either non-cancellable or may only be cancelled by mutual agreement which will normally require payment of a cancellation fee.
Lessees are required to keep leased properties in a good state of repair and return the properties in their original condition at the end of the lease, subject to normal wear and tear. The Group also requires upfront deposits from tenants, depending on their credit assessment, to help mitigate any credit risk associated with the lease.
31. Contingent liabilities and guarantees
2 091 2 085Various contingent liabilities where no material losses are expected to materialise1 2 085 2 091
67 53Various contingent assets where the inflow of economic benefits is probable, but not virtually certain2 53 67
1 The owners and underwriters of a plaintiff issued summons against Transnet for loss of a vessel and damages arising from alleged breaches of legal and statutory duties imposed upon Transnet, as well as alleged breaches of legal duties owed by Transnet to the plaintiff in the circumstances. The summons relates to the loss of the vessel and cargo. Transnet continues to defend all claims.
A plaintiff has sought from the High Court a declaration that the agreement incorporating the so-called ‘Neutrality Principle’ remains valid and binding upon Transnet, notwithstanding the advent of the National Regulator and the Petroleum Pipelines Act. In the event that such agreement is declared to remain so valid, monetary compensation is claimed.
2 Contingent assets relate mainly to various legal claims by the Group against third parties.
94 Annual financial statementsNotes to the annual financial statements

95
Notes to the annual financial statements for the year ended 31 March 2020
32. Post-retirement benefit obligationsThe Group offers pension benefits through two defined benefit pension funds and one defined contribution fund. The Group also offers post-retirement medical benefits to its employees. Specific retirement benefits are offered to top management and under the Workmen’s Compensation Act. The following sections summarise the relevant components of the pension benefits and post-retirement medical benefits. (Unless otherwise stated, all amounts disclosed are the same for both Company and Group).
32.1 Pension benefits
Transnet has three pension funds, namely the Transnet Retirement Fund, Transport Pension Fund and Transnet Second Defined Benefit Fund. Except for the Transnet Retirement Fund, actuarial valuations are performed annually in accordance with IAS 19 Employee Benefits. The Transnet Pension Funds are governed by the Transnet Pension Fund Act, No. 62 of 1990, as amended.
32.1.1 Transnet Retirement FundThe fund is structured as a defined contribution fund and all employees of the Group are eligible members of the fund. There were 51 490 members at 31 March 2020 (2019: 59 336). Actuarial valuations are performed regularly to determine the financial position of the fund. The last actuarial valuation was performed as at 31 March 2019 and the actuaries were satisfied with the status of the member’s credit account as at that date. The total contributions for the year constitute member contributions of R1 344 million (2019: R1 269 million) and employer contributions of R2 108 million (2019: R1 992 million).
32.1.2 Transport Pension Fund: Transnet Sub-fundThe fund is a defined benefit pension fund. The fund has been closed to new members since 1 December 2000. Members are current employees of Transnet who elected to remain as members of the fund at 1 November 2000 and pensioner members who retired subsequent to that date.
Members of the fund are entitled to minimum benefits as per the Pensions Fund Second Amendment Act, 2001, as set out in Section 14A of the Act. This minimum benefit is defined in Section 14B (2)(a) of the Act as the fair value equivalent of the present value of the member’s accrued deferred pension calculated at a prescribed rate of discount.
The Transnet Pension Fund Amendment Act, promulgated in 2007, changed the name of the fund with effect from 11 November 2005 to the Transport Pension Fund. The Act restructured the Transport Pension Fund (formerly the Transnet Pension Fund) into a multi-employer pension fund. From the date the Act came into operation, all existing members, pensioners, dependant pensioners, liabilities, assets, rights and obligations, of the Transport Pension Fund, were attributed to three Sub-funds, with Transnet as the principal employer for one of the Sub-funds. In terms of the amendments to the Act, a Sub-fund in the name of South African Airways (Pty) Ltd was also established as at 1 April 2006, with South African Airways (Pty) Limited as the principal employer of that Sub-fund, and a further Sub-fund in the name of the South African Rail Commuter Corporation Ltd (now Passenger Rail Agency of South Africa) was established with effect from 1 May 2006, with the South African Rail Commuter Corporation Ltd as the principal employer of that Sub-fund.
All active members and pensioner members belonging to South African Airways (Pty) Ltd and the South African Rail Commuter Corporation Ltd were assigned to the new Sub-funds. The Transport Pension Fund therefore comprises three independent and separate Sub-funds, each with their own principal employer. An employer’s liability to the Transport Pension Fund is limited to those attributable to its members, pensioners and dependent pensioners assigned to its Sub-fund.
There were 4 266 members and pensioners at 31 March 2020 (2019: 4 351). The fund gives members the option to transfer to the Transnet Retirement Fund twice a year. Altogether, no members opted to transfer to the Transnet Retirement Fund in the current year (2019: 4). The effect of the transfers is included under benefits paid in the reconciliations below.
The duration of the defined benefit obligation is estimated, based on the current membership profile, to be 6 years.

Notes to the annual financial statements for the year ended 31 March 2020
Company and Group
2020 2019R million R million
32. Post-retirement benefit obligations continued
32.1.2 Transport Pension Fund: Transnet Sub-fund continued An actuarial valuation was performed as at 31 March 2020 based on the projected unit credit method. The principal actuarial assumptions used are as follows:Discount rate (%) 11,66 9,54Inflation rate (%) 7,16 6,08Salary increase rate (%) 8,16 7,08Pension increase allowance (%) 2,00 2,00
The adjustments arising from the settlement agreement and court order which has put an end to the class action litigation, is included in the present value of obligations and fair value of plan assets below.
The results of the actuarial valuation are as follows:
Benefit liabilityPresent value of obligation (2 850) (2 561)Fair value of plan assets 3 329 6 093
Surplus 479 3 532 Unrecognised asset (479) (3 532)
Net asset/(liability) recognised in the statement of financial position — —
The liability recognised for this fund relating to the Company amounts to nil (2019: nil).
The surplus was not recognised as the rules of the fund do not provide for the surpluses to be distributed.
Net expense recognised in profit or lossService cost (17) (16)Net interest income 337 300
320 284 Less: Interest on asset limit (337) (300)
(17) (16)
Actual return on plan assets (744) (60)
Total measurements recognised in other comprehensive income for the year 12 11
– net actuarial loss (953) (342)– interest on asset limit 337 300 – past service cost (as a result of the class action settlement ruling) (696) —– asset not recognised 1 324 53
Movements in the net asset/(liability) recognised in the statement of financial positionOpening net asset 3 532 3 585 Profit or loss as above (17) (16)Remeasurements – actuarial loss (953) (342) – interest on asset limit 337 300 – past service cost (as a result of the class action settlement ruling) (696) —Contributions paid by employer 5 5 Transfer payable to Transnet Second Defined Benefit Fund (as a result of the class action settlement ruling) (1 729) —
Closing net asset 479 3 532 Asset not recognised (479) (3 532)
Net asset/(liability) recognised in the statement of financial position — —
96 Annual financial statementsNotes to the annual financial statements

97
Notes to the annual financial statements for the year ended 31 March 2020
Company and Group
2020 2019R million R million
32. Post-retirement benefit obligations continued
32.1.2 Transport Pension Fund: Transnet Sub-fund continued Reconciliation of movement in benefit liabilityOpening benefit liability (2 561) (2 837)Service cost (17) (16)Contributions by members (3) (4)Interest cost (257) (227)Actuarial gain 385 125
– change in economic assumptions 256 222 – experience adjustments 170 8 – bonus award to pensioners (41) (105)
Past service cost (as a result of the class action settlement ruling) (696) —Benefits paid 299 398
(2 850) (2 561)Transfer to the retirement fund — —
Closing benefit liability (2 850) (2 561)
Reconciliation of movement in fair value of plan assetsOpening fair value of plan assets 6 093 6 422 Interest income 594 527 Actuarial loss (1 338) (467)Contributions by employer and members 8 9 Benefits paid (299) (398)
5 058 6 093 Transfer to the retirement fund — —Transfer payable to Transnet Second Defined Benefit Fund (as a result of the class action settlement ruling) (1 729) —
Closing fair value of plan assets 3 329 6 093
The estimated contributions by both employer and members for the year beginning 1 April 2020 amount to R8 million (2019: R9 million).
Sensitivity analysisClosing benefit liability based on changes in the discount rate:10,66% (2019: 8,54%) (3 012) (2 710)12,66% (2019: 10,54%) (2 705) (2 428)
Closing benefit liability based on changes in the inflation rate:6,16% (2019: 5,08%) (2 823) (2 536)8,16% (2019: 7,08%) (2 879) (2 587)
The major categories of plan assets as a % of total plan assets are:Equity – local and international (%) 48 43Property (%) 5 8Bonds (%) 34 24Commodities (%) 6 11Cash (%) 7 14
Total (%) 100 100

Notes to the annual financial statements for the year ended 31 March 2020
Company and Group
2020 2019R million R million
32. Post-retirement benefit obligations continued
32.1.3 Transnet Second Defined Benefit FundThe fund was established on 1 November 2000 for the benefit of existing retired members and qualifying beneficiaries. The fund includes the spouses of black pensioners who retired from Transnet between 16 December 1974 and 1 April 1986. There were 12 524 members at 31 March 2020 (2019: 14 026). This excludes widows and children of pensioners. The all inclusive membership is 43 896 at 31 March 2020 (2019: 46 988). The entire obligation relates to Transnet SOC Ltd.The duration of the defined benefit obligation is estimated, based on the current membership profile, to be 5 years.The actuarial valuation was based on the projected unit credit method. The principal actuarial assumptions used are as follows:Discount rate (%) 10,59 9,08Pension increase allowance (%) 2,00 2,00The adjustments arising from the settlement agreement and court order which has put an end to the class action litigation, is included in the present value of obligations and fair value of plan assets below.The results of the actuarial valuation are as follows:Benefit liabilityPresent value of obligation (11 320) (9 770)Fair value of plan assets 13 223 12 895 Surplus 1 903 3 125 Unrecognised asset (1 903) (3 125)Net asset/(liability) recognised in the statement of financial position — — The surplus was not recognised as the rules of the fund do not provide for the surpluses to be distributed.Net expense recognised in profit or lossService cost — — Net interest income 284 286
284 286 Less: Interest on asset limit (284) (286)
— — Actual return on plan assets 506 227Total measurements recognised in other comprehensive income for the year — — – net actuarial loss (201) (804)– interest on asset limit 284 286 – past service cost (as a result of the class action settlement ruling) (3 034) —– net asset not recognised 2 951 518 Movements in the net asset/(liability) recognised in the statement of financial positionOpening net asset 3 125 3 643 Profit or loss as above — — Remeasurements – actuarial loss (201) (804) – interest on asset limit 284 286 – past service cost (as a result of the class action settlement ruling) (3 034) —Transfer receivable from Transport Pension Fund: Transnet Sub fund (as a result of the class action settlement ruling) 1 729 —
Closing net asset 1 903 3 125 Asset not recognised (1 903) (3 125)
Net asset/(liability) recognised in the statement of financial position — —
98 Annual financial statementsNotes to the annual financial statements

99
Notes to the annual financial statements for the year ended 31 March 2020
Company and Group
2020 2019R million R million
32. Post-retirement benefit obligations continued
32.1.3 Transnet Second Defined Benefit Fund continuedReconciliation of movement in benefit liabilityOpening benefit liability (9 770) (11 165)Interest cost (824) (818)Actuarial gain 918 73
– change in economic assumptions 604 737 – experience adjustments 314 (58)– bonus award to pensioners — (606)
Past service cost (as a result of the class action settlement ruling) (3 034) —Benefits paid 1 390 2 140
Closing benefit liability (11 320) (9 770)
Reconciliation of movement in fair value of plan assetsOpening fair value of plan assets 12 895 14 808 Interest income 1 108 1 104 Actuarial loss (1 119) (877)Benefits paid (1 390) (2 140)Transfer receivable from Transport Pension Fund: Transnet Sub fund (as a result of the class action settlement ruling) 1 729 —
Closing fair value of plan assets 13 223 12 895
The estimated contributions by both employer and members for the year beginning 1 April 2020 amount to nil (2019: nil).
Sensitivity analysisClosing benefit liability based on changes in discount rate:9,59% (2019: 8,08%) (11 886) (10 308)11,59% (2019: 10,08%) (10 811) (9 285)
The major categories of plan assets as a % of total plan assets are:Equity (%) 23 14Property (%) — —Bonds (%) 49 55Derivatives* (%) 6 7Cash (%) 22 24
Total (%) 100 100
* During the 2017 financial year the Group entered into interest-rate swaps with Transnet Second Defined Benefit Fund. Refer to note 14.

Notes to the annual financial statements for the year ended 31 March 2020
32. Post-retirement benefit obligations continued
32.1.4 Top Management pensions and Workmen’s Compensation Act pensionersThe Top Management Pensions are additional benefits to top up pensions received to eliminate the effects of any early retirement and resignation penalties applied under the Group’s existing pension fund schemes to management appointed prior to 1 April 1999. There were 330 members at 31 March 2020 (2019: 348). The entire obligation relates to Transnet SOC Ltd. The duration of the defined benefit obligation is estimated, based on the current membership profile, to be 4,77 years.
The Workmen’s Compensation Pension Fund Act benefit relates to the pension benefits that the Company pays to current and former employees who were disabled whilst in service prior to the corporatisation of Transnet in 1990. There were 895 members at 31 March 2020 (2019: 942). The duration of the defined benefit obligation is estimated, based on the current membership profile, to be 7,69 years.
Actuarial valuations for both benefits were performed to determine the present value of the obligations based on the projected unit credit method. There are no plan assets held to fund these obligations.
The following summarises the components of expense and liability recognised in the financial statements together with the assumptions adopted.
Company and Group
2020 2019R million R million
Top Management pensionsThe principal assumptions in determining the benefits are as follows:Discount rate (%) 10,59 8,88Pension increase allowance (%) 2,00 2,00
Benefit liabilityPresent value of obligations (51) (58)
Liability recognised in the statement of financial position (51) (58)
Net expense recognised in profit or lossInterest cost (5) (5)
(5) (5)
Actuarial gain recognised in other comprehensive income for the year 3 3
Reconciliation of movement in benefit liabilityOpening benefit liability (58) (65)Expense as above (5) (5)Actuarial gain 3 3
– change in economic assumptions 3 3 – experience adjustments — —
Benefits paid 9 9
Benefit liability at year-end (51) (58)
The estimated contributions (based on current year contribution) for the year beginning 1 April 2020 amount to R9 million (2019: R9 million).
Sensitivity analysisClosing benefit liability based on changes in discount rate:9,59% (2019: 7,88%) (53) (61)11,59% (2019: 9,88%) (49) (55)
100 Annual financial statementsNotes to the annual financial statements

101
Notes to the annual financial statements for the year ended 31 March 2020
Company and Group
2020 2019R million R million
32. Post-retirement benefit obligations continued
32.1.4 Top Management pensions and Workmen’s Compensation Act pensioners continuedWorkmen’s Compensation Act pensioners’ fundThe principal assumptions in determining the benefits are as follows:Discount rate (%) 11.85 9,60Pension increase (%) 6.70 6,11Inflation rate (%) 6.70 6,11
Benefit liabilityPresent value of obligations (359) (412)
Liability recognised in the statement of financial position (359) (412)
Net expense recognised in profit or lossInterest cost (38) (39)
(38) (39)
Actuarial gain recognised in other comprehensive income for the year 43 38
Reconciliation of movement in benefit liabilityOpening benefit liability (412) (458)Interest cost (38) (39)Actuarial gain 43 38
– change in economic assumptions 34 34 – experience adjustments 9 4
Benefits paid 48 47
Benefit liability at year-end (359) (412)
The estimated contributions (based on current year contribution) for the year beginning 1 April 2020 amount to R48 million (2019: R47 million).
Sensitivity analysisClosing benefit liability based on changes in discount rate:10,85% (2019: 8,60%) (386) (447)12,85% (2019: 10,60%) (336) (382)
Closing benefit liability based on changes in the inflation rate:5,70% (2019: 5,11%) (334) (381)7,70% (2019: 7,11%) (387) (448)
32.1.5 HIV/Aids benefitsTransnet Group offers certain assistance to employees diagnosed with Aids. The related data is not sufficient to actuarially value any liability the Group may have in this regard.

Notes to the annual financial statements for the year ended 31 March 2020
32. Post-retirement benefit obligations continued
32.2 Post-retirement medical benefitsSATS pensioners’ post-retirement medical benefitsThe SATS pensioners are the retired employees of the former South African Transport Services (SATS) and their dependants. The liability is in respect of pensioners and their dependants who have elected to belong to the Transnet in-house medical scheme, Transmed, whose membership is voluntary. Transnet subsidises the medical contribution costs at a flat contribution of R800 per principal member per month.
Transnet employees’ post-retirement medical benefitsThis includes the current and past employees of Transnet who are members of Transnet accredited medical schemes, namely Transnet’s in-house medical aid, Transmed Medical Fund, Bestmed, Bonitas, Discovery Health and Sizwe. Membership is voluntary.
Transnet subsidises members at a flat contribution of R213 per month per member family.
To enable the Company to fully provide for such post-retirement medical liabilities, since April 2000, actuarial valuations are obtained annually. There are no assets held to fund the obligation.
The duration of the post-retirement medical defined benefit obligations is estimated, based on the current membership profile, to be 6 years.
Analysis of benefit expenseThe following summarises the components of the net benefit expense recognised in both the statement of comprehensive income and statement of financial position as at 31 March 2020 for both SATS pensioners and Transnet employees. The projected unit credit method has been used for the purposes of determining the actuarial valuation for both the funds.
Company and Group
2020 2019R million R million
32.2.1 SATS pensionersDiscount rate (%) 11,66 9,08
Benefit liabilityPresent value of obligations (258) (327)
Liability recognised in the statement of financial position (258) (327)
Net expense recognised in profit or lossInterest cost (27) (29)
(27) (29)
Actuarial gain recognised in other comprehensive income for the year 22 32
Reconciliation of movement in benefit liabilityOpening benefit liability (327) (392)Interest cost (27) (29)Company contributions 74 62 Actuarial gain 22 32
– change in economic assumptions 13 18 – experience adjustments 9 14
Closing benefit liability (258) (327)
The estimated contributions (based on current year contribution) for the year beginning 1 April 2020 amount to R74 million (2019: R62 million).The medical inflation has no impact on the aggregate current service cost and interest cost and the benefit liability. However, the assumed discount rate has an impact. The sensitivity of the obligation to a change in the discount rate on the present value of the obligation is as follows:Sensitivity analysisClosing benefit liability based on changes in discount rate:10,66% (2019: 8,08%) (268) (341)12,66% (2019: 10,08%) (249) (314)
102 Annual financial statementsNotes to the annual financial statements

103
Notes to the annual financial statements for the year ended 31 March 2020
Company and Group
2020 2019R million R million
32. Post-retirement benefit obligations continued
32.2.2 Transnet employeesDiscount rate (%) 11,66 9,08
Benefit liabilityPresent value of obligations (187) (218)
Liability recognised in the statement of financial position (187) (218)
Net expense recognised in profit or lossService cost (10) (11)Interest cost (19) (17)
(29) (28)
Actuarial gain recognised in other comprehensive income for the year 41 6
Reconciliation of movement in benefit liabilityOpening benefit liability (218) (217)Expense as above (29) (28)Company contributions 19 21 Actuarial gain 41 6
– change in economic assumptions 47 7 – experience adjustments (6) (1)
Closing benefit liability (187) (218)
The estimated contributions (based on current year contribution) for the year beginning 1 April 2020 amount to R19 million (2019: R21 million).
Transnet subsidises members at a flat contribution of R213 per month per member family. The medical inflation has no impact on the aggregate current service cost and interest cost and the benefit liability. However, the assumed discount rate has an impact. The sensitivity of the obligation to a change in the assumed discount rate on the present value of the obligation is as follows:
Sensitivity analysisClosing benefit liability based on changes in discount rate:10,66% (2019: 8,08%) (197) (231)12,66% (2019: 10,08%) (178) (207)
Exposure to risksThe risks faced by Transnet as a result of the post-employment pension obligations and assets can be summarised as follows:• Inflation: The risk that future CPI inflation is higher than expected.• Longevity: The risk that pensioners live longer than expected and thus their pension benefit is payable for longer than expected.• Open-ended, long-term liability: The risk that the liability may be volatile in the future and uncertain.• Change in legislation: The risk that changes to legislation, including tax laws with respect to the post-employment benefits, may
increase the liability for the Group.• Investment risk: The plan assets held by the Transport Pension Fund: Transnet Sub-fund and the Transnet Second Defined Benefit
Fund are primarily invested in equities and bonds. This exposes the funds to a slight concentration of market risk. In addition, as the two pension funds are defined benefit plans, if the plan assets are not adequate to fund the liabilities of the funds, Transnet will be required to fund the deficit, thereby exposing it to investment return risk.

Notes to the annual financial statements for the year ended 31 March 2020
33. Related-party transactionsTransnet is a Schedule 2 Public Entity in terms of the Public Finance Management Act (PFMA). It therefore has a significant number of related parties including other state-owned entities, Government departments and all other entities within the national sphere of Government. The Group has utilised the database maintained by the National Treasury to identify related parties. A list of all related parties is available on the National Treasury website at www.treasury.gov.za or at the Company’s registered office.
In addition, the Company has a related-party relationship with its subsidiaries (refer note 37). The Company and Group have related-party relationships with its associates (refer note 37) and with its directors and senior executives (key management).
Unless otherwise disclosed, all transactions with the above related parties are concluded on an arm’s-length basis.
Furthermore, neither the Group nor any of its related parties are obligated to procure from or render services to their related parties.
Transactions with related entitiesServices rendered to related parties comprise principally transportation services. Services purchased from related parties comprised principally energy, telecommunications, information technology and property-related services.
The following is a summary of transactions with related parties during the year and balances due at year-end according to Transnet’s records:
Company Group
2019 2020 2020 2019R million R million R million R million
Services rendered518 452 Major public enterprises 452 518
1 131 1 575 Other public enterprises 1 575 1 131 1 083 520 National Government business enterprises* 520 1 083
24 29 Associates 29 24 20 — Subsidiaries — —
2 776 2 576 2 576 2 756
Services received 2 969 3 446 Major public enterprises 3 446 2 969
577 651 Other public enterprises 651 577 432 350 National Government business enterprises 350 432
3 978 4 447 4 447 3 978
Amount due (to)/from 495 (1 511) Major public enterprises (1 511) 495 222 257 Other public enterprises 257 222
(1 603) (1 527) National Government business enterprises* (1 527) (1 603)5 16 Associates 16 5
(881) (2 765) (2 765) (881)
* Included are transactions with Prasa as detailed in note 1. In the prior year, this related debt balance was subject to extended trade credit terms that are outside normal credit terms provided to other customers..
During the year the Group reversed R252 million (2019: R167 million raised) in relation to provisions and write-offs of bad debts on related parties and at year-end the Group had a provision of R1 193 million (2019: R1 445 million) against debtors pertaining to related parties.
Transactions with key management personnelDetails of key management compensation are set out in note 38.
None of key management has or had significant influence in any entity with whom the Group had significant transactions during the year.
104 Annual financial statementsNotes to the annual financial statements

105
Notes to the annual financial statements for the year ended 31 March 2020
Company Group
2019 2020 2020 2019R million R million R million R million
34. Cash flow information34.1 Cash generated from operations
8 517 6 044 Profit before tax 6 080 8 581 11 670 11 421 Finance costs (refer note 34.3) 11 421 11 670
(368) (148) Finance income (refer note 34.4) (171) (387)— (3) Dividend income
15 324 18 636 Elimination of non-cash items 18 581 15 301
14 274 14 955 – Depreciation, amortisation and derecognition (refer note 3) 14 955 14 274 182 (196) – (Decrease)/increase in provision for employee benefits (196) 182
444 799 – Impairment of trade and other receivables, and loans and advances
(refer note 4.2.1) 799 444 2 244 1 544 – Impairment of property, plant and equipment (refer note 4.2.2) 1 544 2 244
354 1 270 – Movement in provisions 1 270 354 – Income from associates and joint ventures (refer note 13) (19) (19)
(4 678) (5 618) – Fair value adjustments on derivatives (5 618) (4 678) (4) (23) – Fair value adjustments on other financial assets (refer note 5) (23) (4)
5 673 6 858 – Unrealised foreign exchange movements 6 858 5 673
(54) 1 – Loss/(profit) on disposal of property, plant and equipment (refer note 2) 1 (54)
(6) (10) – Discount on bonds amortised (refer note 6) (10) (6) 99 (110) – Provision for inventory obsolescence (110) 99
(52) 12 – Release of firm commitments and foreign exchange adjustments
(refer note 9) 12 (52) 2 (188) – Decommissioning liability (refer note 9) (188) 2
(3 160) (681) – Fair value adjustment of investment property (refer note 5) (681) (3 160)6 23 – Other non-cash items* (13) 2
35 143 35 950 35 911 35 165
34.2 Changes in working capital 767 (257) (Increase)/decrease in inventories (257) 767 (583) (1 843) Increase in trade and other receivables (1 840) (583)
(1 794) (401) Decrease in trade and other payables (396) (1 817)
(1 610) (2 501) (2 493) (1 633)
34.3 Finance costs 11 597 11 337 Finance costs 11 337 11 597
67 74 Net foreign exchange gain on translation 74 67 6 10 Discounts on bonds amortised 10 6
11 670 11 421 11 421 11 670 (702) (453) Deferred interest (453) (702)
10 968 10 968 10 968 10 968
* Other non-cash items relate to minor non-cash transactions.
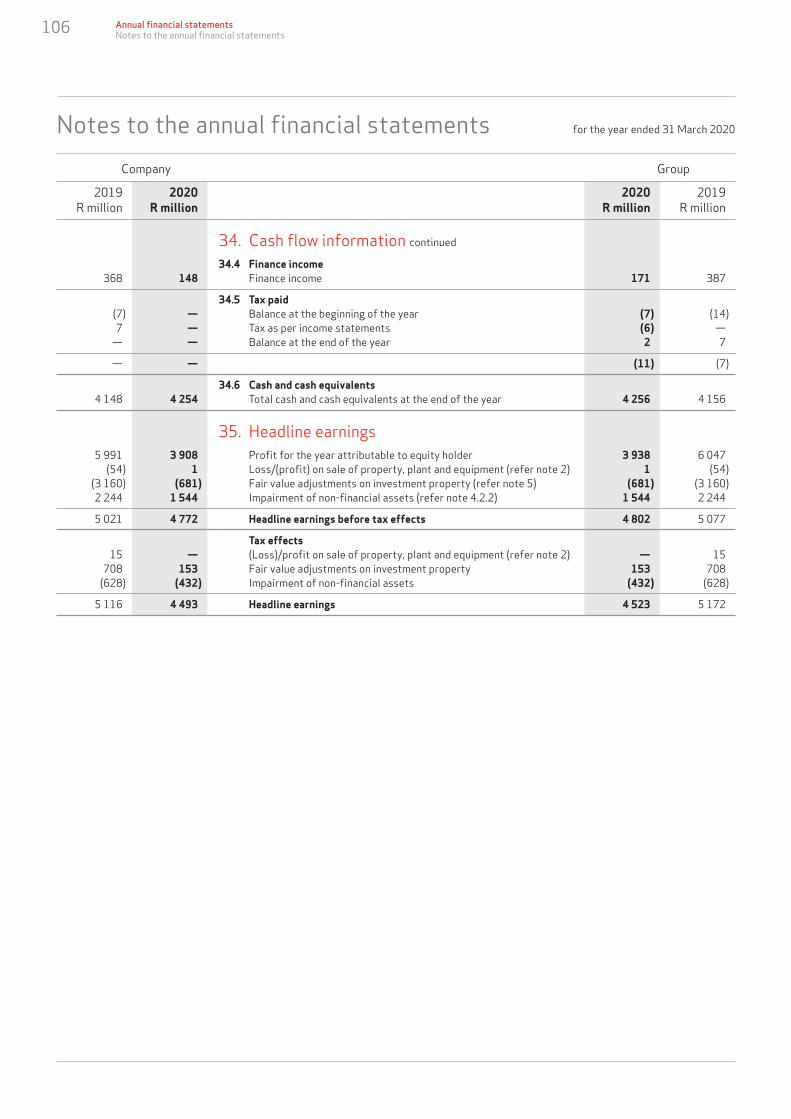
Notes to the annual financial statements for the year ended 31 March 2020
Company Group
2019 2020 2020 2019R million R million R million R million
34. Cash flow information continued
34.4 Finance income 368 148 Finance income 171 387
34.5 Tax paid (7) — Balance at the beginning of the year (7) (14) 7 — Tax as per income statements (6) —— — Balance at the end of the year 2 7
— — (11) (7)
34.6 Cash and cash equivalents 4 148 4 254 Total cash and cash equivalents at the end of the year 4 256 4 156
35. Headline earnings5 991 3 908 Profit for the year attributable to equity holder 3 938 6 047
(54) 1 Loss/(profit) on sale of property, plant and equipment (refer note 2) 1 (54) (3 160) (681) Fair value adjustments on investment property (refer note 5) (681) (3 160) 2 244 1 544 Impairment of non-financial assets (refer note 4.2.2) 1 544 2 244
5 021 4 772 Headline earnings before tax effects 4 802 5 077
Tax effects 15 — (Loss)/profit on sale of property, plant and equipment (refer note 2) — 15
708 153 Fair value adjustments on investment property 153 708 (628) (432) Impairment of non-financial assets (432) (628)
5 116 4 493 Headline earnings 4 523 5 172
106 Annual financial statementsNotes to the annual financial statements

107
Notes to the annual financial statements for the year ended 31 March 2020
36. Financial risk managementThe Group has a centralised Treasury function that supports the Company in its strategic objectives by providing funding from a range of sources.
PoliciesThe financial risk management policies are contained in a Board-approved Financial Risk Management Framework (FRMF) that is approved by the Board of Directors.
The FRMF provides clear guidelines for effective risk management by ensuring that:• Risks are independently identified, assessed, quantified, mitigated and monitored regularly;• Mitigating hedging strategies are developed and implemented;• The effectiveness of hedging strategies are monitored monthly; and• Risk exposures are performance-measured and formally reported to the appropriate authorities.
Apart from the requirements of the FRMF, Treasury operates within the confines of the Transnet Delegation of Authority (DOA) Framework, as approved by the Board of Directors.
Risk philosophy and managementTransnet SOC Ltd takes a risk-averse approach in managing risks that include, but is not limited to, market, credit, liquidity and operational risks.
The Group’s business operations expose it to liquidity, credit and market risks, comprising foreign currency, commodity, interest rate and other price risks. Given the level of volatility in the markets, Treasury will continuously manage all risks very closely so as to implement risk-mitigating initiatives timeously, when required.
Financial risk assessment and analysis are reported monthly through various governance structures that include the Board of Directors, Board committees and management committees tasked with managing financial risks.
Credit riskCredit risk is the risk of financial loss to the Group, if a customer or counterparty to a financial instrument fails to meet its contractual obligations. The Group is mainly exposed to credit risk from trade and other receivables (including lease receivables and contract assets) as well as cash and cash equivalents, deposits with banks and financial institutions, favourable positive fair market values of derivative financial instruments, and investments in government bonds – see counterparty risk that follows.
Trade receivables, lease receivables and contract assetsThe risk management committee, a sub-committee of the executive committee (Exco), has established a credit policy under which the Group conducts a thorough customer credit review as part of the contract approval process for new customers, as well as on an ongoing basis as part of the revenue and credit management process to assess the credit risk of customers and ensure that the consideration receivable under the contract is recoverable before services are rendered to a customer.
The Group’s review includes an internal financial evaluation model, as well as external credit ratings where available. The model evaluates the ability of the customer to meet its financial obligations and allocates a credit risk score. Based on the credit risk score, credit limits and terms are established for each customer, which represents the maximum credit facility available, as well as whether or not the customer is required to post a bank guarantee with the Group, or pay in advance. The customer’s credit risk score is reviewed and updated on an annual basis, and whenever there is significant change to a customer’s financial status.
Customers are categorised into the following credit risk bands based on their credit risk scores: A Very low risk.B Low risk.C Medium risk.D High risk.E Very high risk.
The Group applies the simplified approach in IFRS 9 Financial Instruments to measure expected credit losses using a lifetime expected credit loss provision for trade receivables, lease receivables and contract assets. To measure expected credit losses on a collective basis, trade receivables and contract assets are grouped based on similar credit risk characteristics and aging. The contract assets, which arise from revenue recognised on contracts with customers but not yet invoiced, have similar risk characteristics to the trade receivables for similar types of contracts.

Notes to the annual financial statements for the year ended 31 March 2020
36. Financial risk management continued
For the purposes of calculating expected credit losses under IFRS 9, these credit risk bands are combined as follows:A+B Low risk.C Medium risk.D+E High risk.
In addition to the above, each Operating division is treated as a separate debtors’ portfolio, in order to better reflect the unique economic exposure and customer behaviour of each division. The Operating divisions are: • Transnet Freight Rail; • Transnet Engineering; • Transnet National Ports Authority; • Transnet Port Terminals;• Transnet Pipelines; and • Transnet Property.
Stage 2 expected loss rates (i.e. for balances less than 90 days past due) are calculated based on the payment profiles of customers over the five-year period prior to the financial year-end, and the historical default rates experienced during this period for each credit risk band above, and separately for each Operating division. Stage 3 expected loss rates (i.e. for balances already in default) are estimated at 100%, due to the high likelihood of non-collection of these balances, although the Group will always continue with collection efforts and enforcement activities until there is no hope of collection.
The historical loss rates are adjusted for current and forward-looking information on macroeconomic factors affecting the ability of the customers to settle their outstanding amounts. The Group has identified the gross domestic product (GDP), the global commodity cycle, and the inflation rate as the key macroeconomic factors affecting its customers, and accordingly adjusts the historical loss rates based on changes in these factors.
Further disclosures regarding trade and other receivables are provided in note 18 and later in this note.
South African government bonds The Group considers South African government bonds held by the Transnet Pipelines Environmental Rehabilitation Trust, which are measured at fair value through other comprehensive income (FVOCI), to have low credit risk and which has not increased significantly since initial recognition. Therefore management calculates credit losses based on 12 months expected credit losses on these bonds.
Counterparty risk Counterparty risk exposures arise mainly as a result of the investment of operational cash on hand, surplus cash due to prefunding strategies, positive fair market values of derivative hedging instruments, investments in government bonds and guarantees issued by counterparties to mitigate financial risks in supply agreements. The Group’s main objectives of its counterparty risk policies are:• To mitigate counterparty risk exposures;• To diversify counterparty risk exposures;• To set limits for the different types of counterparty risk exposures; and• To ensure that financial transactions are done with approved high-credit-quality counterparties.
The counterparty risk policy of the Group is fully aligned with the requirements of the Treasury Regulations as referred to in the PFMA:• Selection of counterparties through credit risk analysis;• Establishment of investment limits per institution;• Establishment of investment limits per investment instrument;• Monitoring of investments against limits;• Reassessment of investment policies on a regular basis;• Reassessment of counterparty credit risk based on credit ratings; and• Assessment of investment instruments based on liquidity requirements.
The Group’s exposures to counterparty risks in respect of all Treasury-related transactions are confined to credible counterparties and are managed within Board-approved credit limits. Limits are reviewed and approved by the Board Audit Committee on an annual basis. Treasury performs ongoing credit evaluations of the financial position of its counterparties to limit exposure to undue credit risk. Guarantees are issued under specific powers granted in terms of section 66 of the PFMA and in accordance with a Board-approved DOA Framework.
108 Annual financial statementsNotes to the annual financial statements

109
Notes to the annual financial statements for the year ended 31 March 2020
36. Financial risk management continued
Market riskForeign currency riskForeign currency risk arises where payments need to be made in currencies that are not denominated in Rand hence exposing the Company to exchange rate fluctuations. The objective is to mitigate foreign currency risk by bringing certainty to future currency payments by hedging it to the Rand, thereby insulating the Group’s income statement against exchange rate fluctuations.
It is the Group’s preference to enter into Rand-based agreements to mitigate foreign currency risks. Where this is not possible, Transnet will hedge any currency exposure as soon as the agreements become firm and ascertainable.
Business units report all open exposures on a monthly basis. Transnet’s policy allows for a portion of Operating divisions’ exposures to be unhedged with the limits set in the FRMF.
Hedge accounting is applied to all exposures greater than USD5 million to minimise volatility in the income statement, and the performance is monitored monthly by the hedge accounting committee, a sub-committee of the finance committee.
Commodity riskCommodity risk refers to the variability of payments due to changes in underlying commodities such as Brent crude oil, steel and iron ore. Although Transnet is exposed to such underlying commodity price changes, only fuel exposures will be hedged subject to a maximum tenor of 18 months using vanilla type instruments that are well correlated to fuel prices.
As a mitigating measure most General Freight Business (GFB) revenue contracts are linked to a surcharge levy that adjusts the rail price based on changes in fuel prices, exchange rates, steel prices and electricity.
Interest rate riskInterest rate risks arise due to fluctuations in interest rates that can impact the Group’s borrowing programme, investments in interest-bearing instruments and derivative financial instruments by changing future interest payments or receipts. To this extent, Transnet aims to maintain or reduce the weighted average cost of debt (WACD) of borrowings within and fixed to floating rate ratio allowed in the FRMF, taking cognisance of interest rate cycles.
Transnet aims to enter into contracts that will result in the desired exposure to fixed or floating interest rates rather than changing the risk profile via derivative transactions. Foreign currency interest rate exposures in borrowings are hedged to the Rand as soon as transactions are concluded to mitigate against foreign interest rate movements. The impact of changes are reported monthly to governance structures.
Other price riskThe only other market risk that Transnet is exposed to is equity price risk. Although Transnet does not trade in equities, it has an equity investment in Brazil, which is listed on the Brazilian Stock Exchange. This is a very small portion of the overall risk exposure of Transnet.
Liquidity risk Liquidity risk impacts the ability to have the appropriate funds available to effect the payment to third parties. To mitigate and manage liquidity risk, cash flow projections, consisting of short-, medium- and long-term projections from Operating divisions, are monitored to enable Treasury to manage the funding requirement of the Group. In addition, Transnet has access to various funding sources that include the debt capital markets, direct foreign investment, export credit agencies and various short-term facilities that assist in effectively managing its working capital requirements.
The DMTN programme size is R80,0 billion, of which an amount of R36,5 billion is still available. The global medium-term note (GMTN) programme size is USD6,0 billion, of which an amount of USD 4,5 billion is available. No issues were done on the GMTN programme during the 2020 financial year.
Various liquidity measures are in place to ensure that Transnet will be able to honour its commitments. Transnet only invests surplus cash that ensures capital preservation. Capital market investments are only allowed if there is a requirement to ringfence cash for longer periods on a specific project, or as a result of a condition stipulated by a regulator. These will be held to maturity.

Notes to the annual financial statements for the year ended 31 March 2020
36. Financial risk management continued
Bonds at carrying and nominal valuesTransnet issues bonds listed on the Johannesburg Stock Exchange (JSE), Luxembourg Stock Exchange and the London Stock Exchange.
The following bonds were in issue at 31 March 2020 for the Company and the Group:
2020 2019Coupon Carrying Nominal Carrying Nominal
Redemption rate value value value valueBond date % R million R million R million R million
Domestic Rand bonds TN20 17 Sept 20 10,50 7 022 7 000 7 076 7 000TN21U 13 May 21 9,50 990 1 000 982 1 000TN23 6 Nov 23 10,80 7 156 7 000 7 193 7 000TN25 19 Aug 25 9,50 9 002 9 000 7 021 7 000TN27 14 Nov 27 8,90 6 727 7 192 6 509 7 000TN30 9 Oct 30 10,50 3 794 3 821 3 347 3 371TN40 9 Oct 40 10,75 3 563 3 605 3 123 3 130TNF20U 14 Apr 20 8,55 1 000 1 000 1 000 1 000TNF25U 14-Feb-25 8,86 2 500 2 500 — —
Total domestic Rand bonds 41 754 42 118 36 251 36 501
Foreign Rand bonds TNZA21 13 May 21 9,50 5 000 5 000 5 000 5 000Euro 20281 18 Apr 28 13,50 1 137 2 000 1 964 2 000Euro 20291 30 Mar 29 10,00 1 966 1 500 1 118 1 500
Total foreign Rand bonds 8 103 8 500 8 082 8 500
USD bonds TNUS22 26 Jul 22 4,00 17 746 17 800 14 358 14 421
Total foreign currency bonds 17 746 17 800 14 358 14 421
Total bonds in issue at year-end 67 603 68 418 58 691 59 4221 These bonds are guaranteed by the Government of the Republic of South Africa, and the Company paid R1,2 million in guarantee fees (2019: R1,2 million).
The amounts in the above table are all in respect of bonds held at amortised cost.
110 Annual financial statementsNotes to the annual financial statements
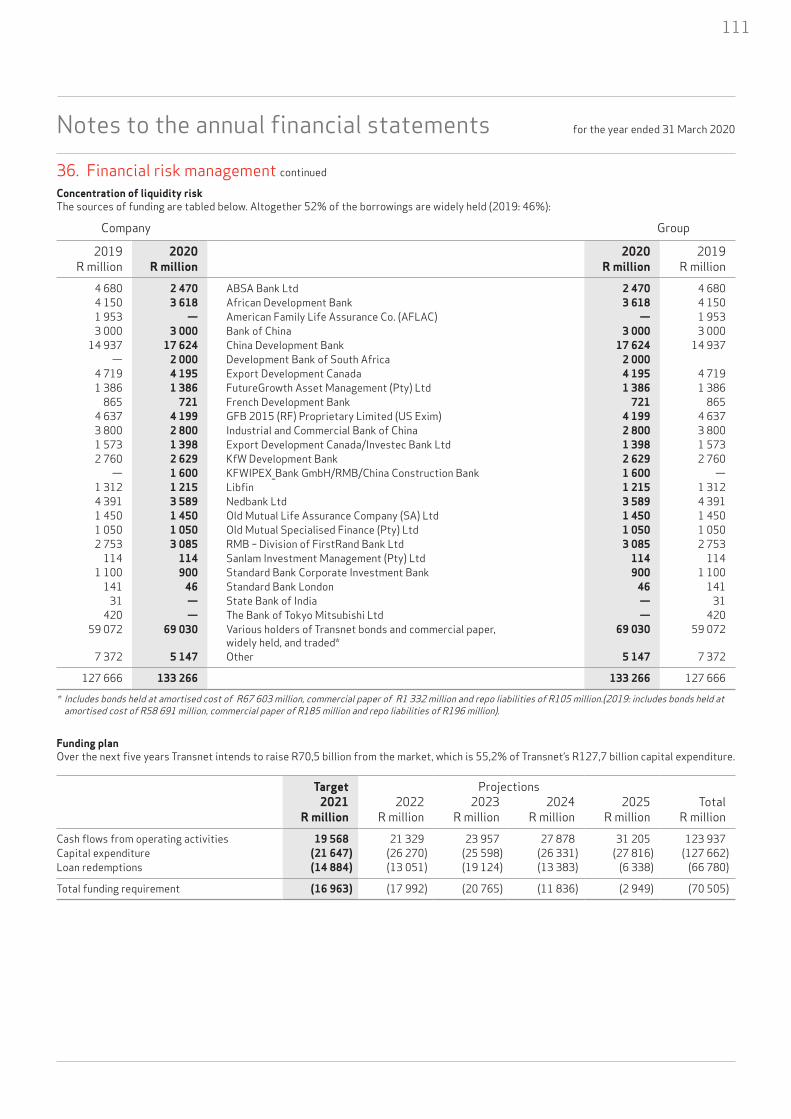
111
Notes to the annual financial statements for the year ended 31 March 2020
36. Financial risk management continued
Concentration of liquidity riskThe sources of funding are tabled below. Altogether 52% of the borrowings are widely held (2019: 46%):
Company Group
2019 2020 2020 2019R million R million R million R million
4 680 2 470 ABSA Bank Ltd 2 470 4 6804 150 3 618 African Development Bank 3 618 4 1501 953 — American Family Life Assurance Co. (AFLAC) — 1 9533 000 3 000 Bank of China 3 000 3 000
14 937 17 624 China Development Bank 17 624 14 937— 2 000 Development Bank of South Africa 2 000
4 719 4 195 Export Development Canada 4 195 4 7191 386 1 386 FutureGrowth Asset Management (Pty) Ltd 1 386 1 386
865 721 French Development Bank 721 8654 637 4 199 GFB 2015 (RF) Proprietary Limited (US Exim) 4 199 4 6373 800 2 800 Industrial and Commercial Bank of China 2 800 3 8001 573 1 398 Export Development Canada/Investec Bank Ltd 1 398 1 5732 760 2 629 KfW Development Bank 2 629 2 760
— 1 600 KFWIPEX_Bank GmbH/RMB/China Construction Bank 1 600 —1 312 1 215 Libfin 1 215 1 3124 391 3 589 Nedbank Ltd 3 589 4 3911 450 1 450 Old Mutual Life Assurance Company (SA) Ltd 1 450 1 4501 050 1 050 Old Mutual Specialised Finance (Pty) Ltd 1 050 1 0502 753 3 085 RMB – Division of FirstRand Bank Ltd 3 085 2 753
114 114 Sanlam Investment Management (Pty) Ltd 114 1141 100 900 Standard Bank Corporate Investment Bank 900 1 100
141 46 Standard Bank London 46 141 31 — State Bank of India — 31
420 — The Bank of Tokyo Mitsubishi Ltd — 42059 072 69 030 Various holders of Transnet bonds and commercial paper,
widely held, and traded*69 030 59 072
7 372 5 147 Other 5 147 7 372
127 666 133 266 133 266 127 666
* Includes bonds held at amortised cost of R67 603 million, commercial paper of R1 332 million and repo liabilities of R105 million.(2019: includes bonds held at amortised cost of R58 691 million, commercial paper of R185 million and repo liabilities of R196 million).
Funding planOver the next five years Transnet intends to raise R70,5 billion from the market, which is 55,2% of Transnet’s R127,7 billion capital expenditure.
Target Projections2021 2022 2023 2024 2025 Total
R million R million R million R million R million R millionCash flows from operating activities 19 568 21 329 23 957 27 878 31 205 123 937Capital expenditure (21 647) (26 270) (25 598) (26 331) (27 816) (127 662)Loan redemptions (14 884) (13 051) (19 124) (13 383) (6 338) (66 780)
Total funding requirement (16 963) (17 992) (20 765) (11 836) (2 949) (70 505)

Notes to the annual financial statements for the year ended 31 March 2020
36. Financial risk management continued
The following schedule depicts the probable sources of funding to be used by Transnet over the next five financial years, which will be driven by the Group’s business strategy, liquidity and investor/lender appetite:
2021 2022 2023 2024 2025 TotalR million R million R million R million R million R million
Commercial paper (DMTN) 1 580 — — — — 1 580DMTN bonds 5 510 6 950 7 316 6 000 3 000 28 776Bilateral loans 9 905 11 331 13 150 5 314 — 39 700
Total funding 16 995 18 281 20 466 11 314 3 000 70 056
Contractual maturity analysisThe following are the contractual maturities of financial liabilities, including interest payments and excluding the impact of netting arrangements, as at 31 March 2020, for the Company and the Group:
Carrying Contractual More value cash flows 0 to 12 1 to 2 2 to 3 3 to 4 4 to 5 than 2020 2020 months years years years years 5 years
R million R million R million R million R million R million R million R million
Non-derivative financial liabilitiesBonds (Company and Group) (67 603) (101 218) (13 293) (10 635) (21 292) (10 575) (5 669) (39 754)Secured bank loans (Company and Group) (23 345) (28 513) (3 847) (3 705) (3 038) (2 871) (2 726) (12 326)Unsecured bank loans (Company and Group) (33 610) (53 457) (6 519) (6 223) (5 937) (5 819) (5 472) (23 487)Commercial paper (Company and Group) (1 322) (1 363) (1 363) — — — — —Other borrowings (Company and Group) (7 386) (8 657) (2 095) (1 382) (5 114) (36) (24) (6)
Total borrowings (Company and Group) (133 266) (193 208) (27 117) (21 945) (35 381) (19 301) (13 891) (75 573)
Trade payables and accruals (Company)1 (18 303) (18 303) (18 303) — — — — —Trade payables and accruals (Group)1 (18 309) (18 309) (18 309) — — — — —
Derivative financial liabilities (Company and Group)Interest rate swaps (1 505) (1 262) (867) (677) (442) (165) 76 813Forward exchange contracts used for hedging (25) (25) (25) — — — — —
Outflow (206) (206) (206) — — — — —Inflow 181 181 181 — — — — —
Other forward exchange contracts (1) (1) (1) — — — — —
Outflow (16) (16) (16) — — — — —Inflow 15 15 15 — — — — —
Total derivative financial liabilities (1 531) (1 288) (893) (677) (442) (165) 76 813
1 Trade payables and accruals, excluding post-retirement employee benefit and tax related accruals.
112 Annual financial statementsNotes to the annual financial statements

113
Notes to the annual financial statements for the year ended 31 March 2020
36. Financial risk management continued
Contractual maturity analysis continuedThe following are the contractual maturities of financial liabilities, including interest payments and excluding the impact of netting arrangements, as at 31 March 2019, for the Company and the Group:
Carrying Contractual More value cash flows 0 to 12 1 to 2 2 to 3 3 to 4 4 to 5 than 2019 2019 months years years years years 5 years
R million R million R million R million R million R million R million R million
Non-derivative financial liabilitiesBonds (Company and Group) (58 691) (92 248) (5 219) (11 790) (9 974) (17 822) (9 779) (37 664)Secured bank loans (Company and Group) (21 658) (29 616) (3 176) (3 720) (3 579) (2 875) (2 689) (13 577)Unsecured bank loans (Company and Group) (36 776) (56 800) (10 215) (6 850) (6 391) (5 859) (5 060) (22 425)Commercial paper (Company and Group) (185) (185) (185) — — — — —Other borrowings (Company and Group) (10 356) (12 209) (4 775) (1 452) (919) (5 049) (5) (9)
Total borrowings (Company and Group) (127 666) (191 058) (23 570) (23 812) (20 863) (31 605) (17 533) (73 675)
Trade payables and accruals (Company)1 (18 731) (18 731) (18 731) — — — — — Trade payables and accruals (Group)1 (18 733) (18 733) (18 733) — — — — —
Derivative financial liabilities (Company and Group)Interest rate swaps (1 758) (2 166) (535) (451) (373) (296) (200) (311)Forward exchange contracts used for hedging (6) (10) (10) — — — — —
Outflow (298) (302) (302) — — — — —Inflow 292 292 292 — — — — —
Other forward exchange contracts (1) (1) (1) — — — — —
Outflow (18) (18) (18) — — — — —Inflow 17 17 17 — — — — —
Total derivative financial liabilities (1 765) (2 177) (546) (451) (373) (296) (200) (311)1 Trade payables and accruals, excluding post-retirement employee benefit and tax related accruals.

Notes to the annual financial statements for the year ended 31 March 2020
36. Financial risk management continued
Credit risk
Maximum exposure and analysis of exposures to credit riskThe following maximum exposures to credit risk existed at year-end in respect of financial assets:
2020 2019Gross Expected Expected Net Gross Expected Expected Net
carrying credit loss carrying carrying credit loss carryingvalue losses rate value value losses rate value
R million R million % R million R million R million % R million
CompanyTrade receivables and contract assets– Low risk 6 742 (1 766) 26 4 976 5 296 (729) 14 4 567 – Medium risk 2 018 (500) 25 1 518 1 916 (698) 36 1 218 – High risk 2 490 (848) 34 1 642 2 041 (1 155) 62 886
11 250 (3 114) 28 8 136 9 253 (2 582) 31 6 671
Other amounts receivable1 1 252 (227) 18 1 025 1 658 (274) 17 1 384 Investments – current 578 — — 578 557 — — 557 Long- and short-term loans and advances2 260 (260) 100 — 261 — — 261Loans to subsidiaries and associates — — — — — — — — Guarantees issued — — — — — — — —Investment and price risk 12 965 — — 12 965 2 340 — — 2 340
GroupTrade receivables and contract assets– Low risk 6 743 (1 766) 26 4 977 5 295 (727) 14 4 568 – Medium risk 2 018 (500) 25 1 518 1 916 (698) 36 1 218 – High risk 2 490 (848) 34 1 642 2 060 (1 173) 63 887
11 251 (3 114) 28 8 137 9 271 (2 598) 31 6 673
Other amounts receivable1 1 254 (227) 18 1 027 1 663 (274) 16 1 389 Investments – current* 603 — — 603 595 — — 595Long- and short-term loans and advances2 260 (260) 100 — 261 — — 261Investment in government bonds** 329 — — 329 306 — — 306Guarantees issued — — — — — — — —Investment and price risk 12 965 — — 12 965 2 340 — — 2 3401 Reconciliation to note 18 Prepayments and other amounts receivable Company Group Other amounts receivable R1 025 million (2019: R1 384 million) R1 027 million (2019: R1 389 million) Prepayments R832 million (2019: R633 million) R832 million (2019: R632 million)
R1 857 million (2019: R2017 million) R1 859 million (2019: R2 021 million)
2 Long-term loans and advances (Company and Group) R0 million (2019: R260 million) Short-term loans and advances (Company and Group) R0 million (2019: R1 million)
Low risk: No guarantee is required from the customer.Medium risk: 50% to 75% guarantee required from the customer.High risk: In such instances, customers are required either to provide 100% guarantee or transact on a cash basis only.The balances for other receivables and loans and advances are not disaggregated for internal reporting purposes.Price risk: The risk that financial derivatives and bond transactions have to be closed out at a market value loss as a result of the unfavourable movements in market rates.Bond issuer risk: The risk that an issuer of bonds will not be able to fulfil its financial obligations on maturity date in accordance with the terms and conditions of the bond issues.IFRS 7: Financial Instruments: Disclosure defines credit risk as the risk that one party to a financial instrument will cause a financial loss for the other party by failing to discharge an obligation. As such, Transnet will suffer financial losses on guarantees issued as the Group would be required to make good the failure by a third party to discharge an obligation.Credit enhancements in the form of title deeds and pension fund cessions for loans and advances, and deposits, bank and holding company guarantees in respect of amounts included in trade and other receivables are held by the Group.
* Includes restricted short-term investment held by the TPL Rehabilitation Trust.** Restricted debt investment held by the TPL Rehabilitation Trust.
114 Annual financial statementsNotes to the annual financial statements

115
Notes to the annual financial statements for the year ended 31 March 2020
36. Financial risk management continued
Guarantees and deposits to the value of R3,1 billion were held as collateral in respect of trade and other receivables (2019: R1,9 billion).
Trade receivables to the value of nil (2019: nil) were written off in the current year and remain subject to enforcement activity by the Group.
Concentration of credit riskThe Group determines concentration of credit risk from trade receivables based on the size of individual customer balances and by industry sector. The Company’s and Group’s 12 most significant customers comprise 21% of the trade receivables at 31 March 2020 (2019: 39%).
The following charts and graphs reflect the distribution of credit risk, expressed in terms of long-term credit ratings, excluding guarantees and trade receivables. The exposures below include cash investments (call, fixed deposits and money market funds), price risk exposures and operational bank balances:
AA+ 7 030.59
A- 5 934.06
A 0.07
A+ 0.05
Risk (derivatives) per long-term rating (R million)
2020
Risk (derivatives) per long-term rating 2020
0
1 000
2 000
3 000
4 000
6 000
5 000
5 934,06 2 814,10
A-
R m
illio
n
AA+
Risk (investments) per long-term rating 2020
3 000
2 500
2 000
1 500
1 000
500
0
4 216,49
A A+
R m
illio
n
AA+
0,050,07
AA+ 1 709.18
A- 548.41
A 82.09
Risk (derivatives) per long-term rating (R million)
2019
Risk (derivatives) per long-term rating 2019
0
300
600
900
1 200
1 500548,41 73,19 1 205,90
A- A AA+
R m
illio
n
Risk (investments) per long-term rating 2019
600
500
400
300
200
100
0
8,90 503,28
A
R m
illio
n
AA+

Notes to the annual financial statements for the year ended 31 March 2020
36. Financial risk management continued
Market risk
Foreign currency riskThe Company’s and Group’s net long/(short) foreign currency risk exposures as at 31 March 2020 are reflected below (expressed in notional amounts):
2020 2019USD JPY EUR USD JPY EUR
US$/m ¥/m €/m US$/m ¥/m €/mForeign currency bonds (1 000) — — (1 000) — —Unsecured bank loans (1 008) — — (1 088) (15 000) —Brazil equity investment 3 — — 3 — —
Gross financial position exposure (2 005) — — (2 085) (15 000) —Exposures for future expenditure (26) — — (32) — (8)
Gross foreign currency exposure (2 031) — — (2 117) (15 000) (8)Forward exchange contracts 25 — — 31 — 8Cross-currency swaps 2 008 — — 2 088 15 000 —
Net uncovered exposure 2 — — 2 — —
Sensitivity analysisThe table below shows the impact on profit and loss (non-hedge-accounted transactions) of a stronger and weaker Rand for the Company and Group, as a result of fair value movements of cross-currency interest rate swaps and forward exchange contracts:
2020 2019Impact Impact
Currency of Rand Impact Currency of Rand Impact exposure in strength- of Rand exposure in strength- of Rand
millions of Fair value ening weakening millions of Fair value ening weakeningCurrency currency R million R million R million currency R million R million R million USD 27 6 7 (7) (13) (0,3) (3) 3
Totals 6 7 (7) (0,3) (3) 3
Hedge accounting is applied to 99% of currency hedges where structures are designated either as fair value hedges or cash flow hedges as detailed in note 14. The sensitivity analysis above includes the impact of fair value movements on derivatives that are part of effective hedge accounting, hence the analysis is on the net balance, after the offsetting effect of the hedged item and hedging instruments. The sensitivity analysis was calculated using a 95% confidence interval over a 90-day horizon, and assumes all other variables remain unchanged. Basis swap adjustments have been added to the curves when doing the sensitivities to ensure that a more accurate market value is reflected, taking into account market liquidity.
Value at risk (fx)The value at risk (VaR) for direct committed capital and operational exposures and the Brazilian equity investment is R5 million (2019: R2 million). VaR calculates the maximum pre-tax loss expected (or worst-case scenario) on a position held, over a 90-day horizon given a 95% confidence level, and is used on a limited basis at Transnet. The VaR methodology is a statistically defined, probability-based approach that takes into account, inter alia, market volatilities relative to a position held. The Group uses historical simulation and the model assumes that historical patterns will repeat into the future and does not take extreme market conditions into account.
116 Annual financial statementsNotes to the annual financial statements
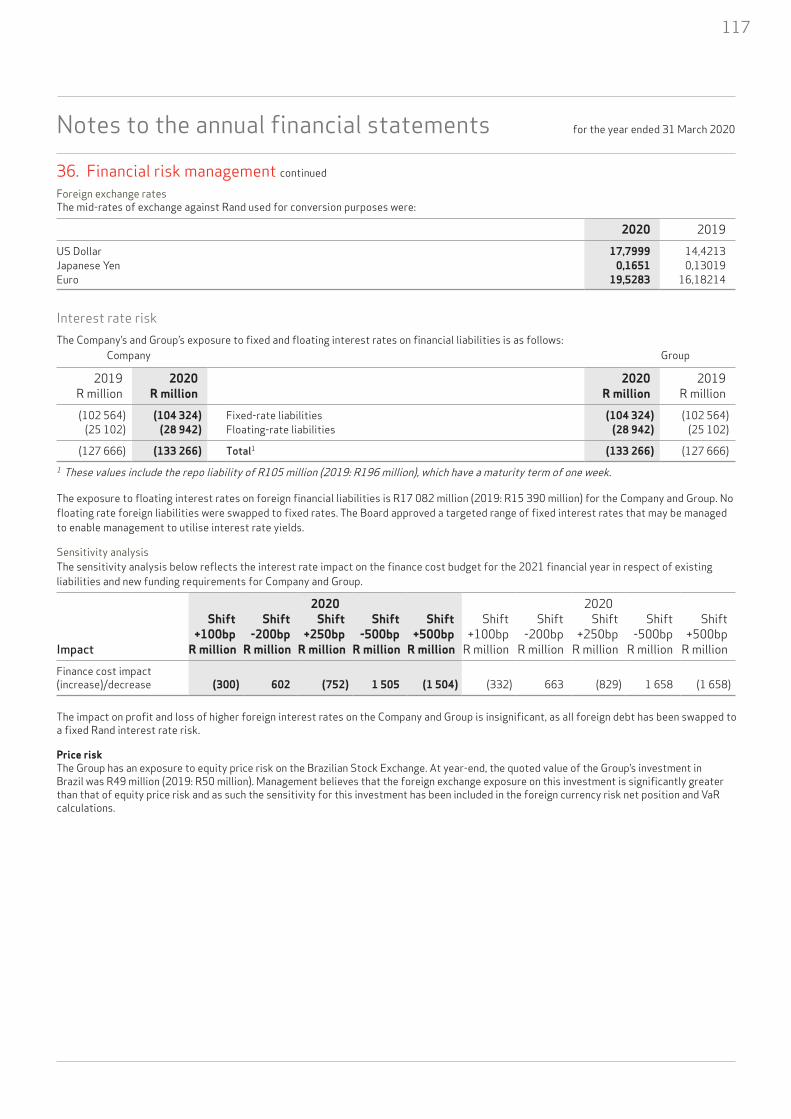
117
Notes to the annual financial statements for the year ended 31 March 2020
36. Financial risk management continued
Foreign exchange ratesThe mid-rates of exchange against Rand used for conversion purposes were:
2020 2019US Dollar 17,7999 14,4213Japanese Yen 0,1651 0,13019Euro 19,5283 16,18214
Interest rate riskThe Company’s and Group’s exposure to fixed and floating interest rates on financial liabilities is as follows:
Company Group
2019 2020 2020 2019R million R million R million R million(102 564) (104 324) Fixed-rate liabilities (104 324) (102 564)
(25 102) (28 942) Floating-rate liabilities (28 942) (25 102)
(127 666) (133 266) Total1 (133 266) (127 666)1 These values include the repo liability of R105 million (2019: R196 million), which have a maturity term of one week.
The exposure to floating interest rates on foreign financial liabilities is R17 082 million (2019: R15 390 million) for the Company and Group. No floating rate foreign liabilities were swapped to fixed rates. The Board approved a targeted range of fixed interest rates that may be managed to enable management to utilise interest rate yields.
Sensitivity analysisThe sensitivity analysis below reflects the interest rate impact on the finance cost budget for the 2021 financial year in respect of existing liabilities and new funding requirements for Company and Group.
2020 2020Shift Shift Shift Shift Shift Shift Shift Shift Shift Shift
+100bp -200bp +250bp -500bp +500bp +100bp -200bp +250bp -500bp +500bpImpact R million R million R million R million R million R million R million R million R million R millionFinance cost impact (increase)/decrease (300) 602 (752) 1 505 (1 504) (332) 663 (829) 1 658 (1 658)
The impact on profit and loss of higher foreign interest rates on the Company and Group is insignificant, as all foreign debt has been swapped to a fixed Rand interest rate risk.
Price riskThe Group has an exposure to equity price risk on the Brazilian Stock Exchange. At year-end, the quoted value of the Group’s investment in Brazil was R49 million (2019: R50 million). Management believes that the foreign exchange exposure on this investment is significantly greater than that of equity price risk and as such the sensitivity for this investment has been included in the foreign currency risk net position and VaR calculations.

Notes to the annual financial statements for the year ended 31 March 2020
36. Financial risk management continued
Commodity price risk (fuel)The table below shows the cash flow at risk scenarios against the approved fuel budget for the 2021 financial year at various levels of Brent crude and USD/ZAR ($/R) exchange rates as at 31 March 2020 (excluding energy levies) for Company and Group. Amounts are in R million:
Performance to budget31 March 2020 $/R17.20 $/R17.70 $/R18.20 $/R18.70 $/R19.20
BRT @ $22 297 281 265 249 233BRT @ $27 172 152 132 113 93BRT @ $32 47 23 — (23) (47)BRT @ $37 (79) (105) (132) (159) (186)BRT @ $42 (204) (234) (265) (295) (326)
The table below shows the cash flow at risk scenarios against the approved fuel budget for the 2020 financial year at various levels of Brent crude and USD/ZAR ($/R) exchange rates as at 31 March 2019 (excluding energy levies) for Company and Group. Amounts are in R million:
Performance to budget31 March 2019 $/R12,04 $/R13,50 $/R14,33 $/R15,50 $/R16,62Brent @ $48 459 345 281 189 102Brent @ $55 326 196 122 18 (82)Brent @ $67 88 (71) (161) (288) (411)Brent @ $75 (63) (241) (342) (484) (620)Brent @ $86 (282) (487) (603) (766) (923)
Classification, fair values and analysis of financial instrumentsCategories of financial instruments:
Company Group
2019 2020 2020 2019R million R million R million R million
Financial assets at amortised cost13 654 14 825 – Trade and other receivables (including bank and cash)* 14 855 13 706
Fair value through profit or loss8 291 14 080 – Derivatives held for risk management 14 080 8 291
178 201 – Other financial assets 201 178
Fair value through other comprehensive income— — – Investment in government bonds** 329 30650 49 – Equity investment (Rumo) 49 50
Financial liabilities at amortised cost
146 397 151 569– Liabilities measured at amortised cost (including trade payables
and accruals***) 151 575 146 399
Fair value through profit or loss1 765 1 531 – Derivatives held-for-hedging 1 531 1 765
* Includes restricted short-term investment held by the TPL Rehabilitation Trust.** Restricted debt investment held by the TPL Rehabilitation Trust.*** Trade payables and accruals, excluding post-retirement employee benefit and tax related accruals.
118 Annual financial statementsNotes to the annual financial statements
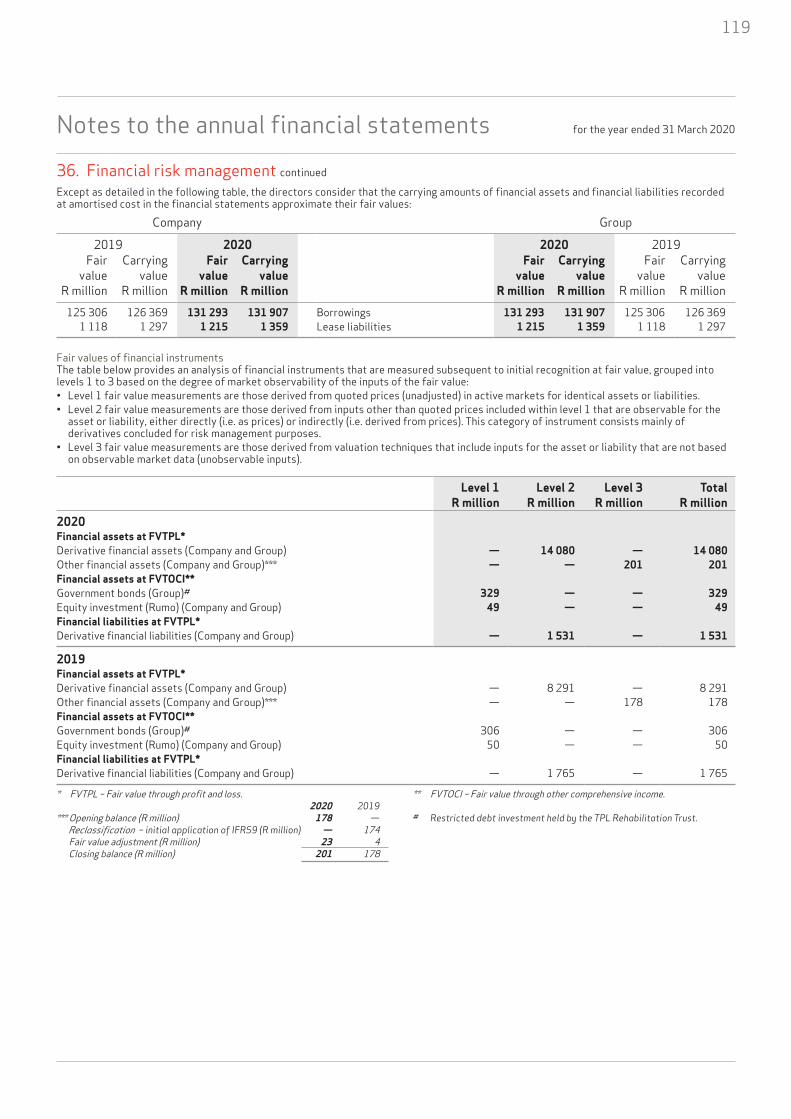
119
Notes to the annual financial statements for the year ended 31 March 2020
36. Financial risk management continued
Except as detailed in the following table, the directors consider that the carrying amounts of financial assets and financial liabilities recorded at amortised cost in the financial statements approximate their fair values:
Company Group
2019 2020 2020 2019Fair Carrying Fair Carrying Fair Carrying Fair Carrying
value value value value value value value value R million R million R million R million R million R million R million R million
125 306 126 369 131 293 131 907 Borrowings 131 293 131 907 125 306 126 3691 118 1 297 1 215 1 359 Lease liabilities 1 215 1 359 1 118 1 297
Fair values of financial instrumentsThe table below provides an analysis of financial instruments that are measured subsequent to initial recognition at fair value, grouped into levels 1 to 3 based on the degree of market observability of the inputs of the fair value:• Level 1 fair value measurements are those derived from quoted prices (unadjusted) in active markets for identical assets or liabilities.• Level 2 fair value measurements are those derived from inputs other than quoted prices included within level 1 that are observable for the
asset or liability, either directly (i.e. as prices) or indirectly (i.e. derived from prices). This category of instrument consists mainly of derivatives concluded for risk management purposes.
• Level 3 fair value measurements are those derived from valuation techniques that include inputs for the asset or liability that are not based on observable market data (unobservable inputs).
Level 1 Level 2 Level 3 TotalR million R million R million R million
2020Financial assets at FVTPL* Derivative financial assets (Company and Group) — 14 080 — 14 080Other financial assets (Company and Group)*** — — 201 201Financial assets at FVTOCI**Government bonds (Group)# 329 — — 329Equity investment (Rumo) (Company and Group) 49 — — 49Financial liabilities at FVTPL*Derivative financial liabilities (Company and Group) — 1 531 — 1 531
2019Financial assets at FVTPL* Derivative financial assets (Company and Group) — 8 291 — 8 291Other financial assets (Company and Group)*** — — 178 178Financial assets at FVTOCI**Government bonds (Group)# 306 — — 306Equity investment (Rumo) (Company and Group) 50 — — 50Financial liabilities at FVTPL*Derivative financial liabilities (Company and Group) — 1 765 — 1 765
* FVTPL – Fair value through profit and loss. ** FVTOCI – Fair value through other comprehensive income. 2020 2019*** Opening balance (R million) 178 — # Restricted debt investment held by the TPL Rehabilitation Trust. Reclassification – initial application of IFRS9 (R million) — 174 Fair value adjustment (R million) 23 4 Closing balance (R million) 201 178

Notes to the annual financial statements for the year ended 31 March 2020
36. Financial risk management continued
Measurement of fair valuesThe table below shows the valuation techniques used in measuring level 2 and level 3 fair values, as well as the significant unobservable inputs used:
Financial instruments measured at fair value Valuation technique
Significant unobservable inputs
Interrelationship between significant unobservable inputs and fair value measurement
Cross-currency and interest rate swaps and forward exchange contracts used for hedging1
Discounted cash flow method using market yield curves to project and discount cash flows. The Monte Carlo simulation model is used, incorporating market inputs that were observable, probabilities of default, recovery rates and expected future exposures per counterparty.
Not applicable Not applicable
Issued bonds2 Bonds were priced at fair values using quoted market prices. Not applicable Not applicableOther financial liabilities3 Loans were valued using risk-free yield curves adjusted for
credit risk of counterparties.Not applicable Not applicable
1 Fair values include market observable credit valuation adjustments (CVAs).2 Fair values include market observable debit valuation adjustments (DVAs).3 Other financial liabilities include borrowings and finance lease obligations.
Transfers between levels 1 and 2There were no transfers in either direction between levels 1 and 2 in both the current and prior reporting period.
Level 3 fair valuesThere were no transfers into or out of level 3 in both the current and prior reporting period.
The net gains and losses on financial instruments are detailed below:
Company Group
Net Netgain/(loss) gain/(loss)
R million R million
2020Liabilities measured at amortised cost1 (refer note 6) 12 742 12 742Financial assets at amortised cost (refer note 7) 148 148Financial assets and liabilities held at fair value through profit or loss2 (refer note 5) 124 124Equity and debt investments held at fair value through other comprehensive income — 22
2019Liabilities measured at amortised cost1 (refer note 6) 13 213 13 213Financial assets at amortised cost (refer note 7) 368 371Financial assets and liabilities held at fair value through profit or loss2 (refer note 5) 222 222Equity and debt investments held at fair value through other comprehensive income — 151 The net loss on financial liabilities measured at amortised cost consists mainly of interest expense after offsetting against effective cash flow hedges.2 The net (loss)/gain on Company and Group financial assets and financial liabilities held-for-trading is a R101 million gain (2019: R218 million gain). These are held
for hedging purposes.
120 Annual financial statementsNotes to the annual financial statements

121
Notes to the annual financial statements for the year ended 31 March 2020
36. Financial risk management continued
Transnet’s credit ratingTransnet has two officially recognised rating agencies: Moody’s and S&P. Transnet’s credit rating is depicted in the table below:
Rating category Moody’s S&P
Foreign currency rating Ba1/negative outlook BB-/stable outlookLocal currency rating Ba1/negative outlook BB-/stable outlookNational scale rating (NSR) – long and short term Aa2.za/P-1.za zaAA/zaA-1+BCA/SACP ba2/negative outlook bb-/stable outlook
The foreign currency rating is specifically associated with the raising of foreign debt and the similar logic applies for the local currency rating. At the above credit ratings, Moody’s foreign currency and local currency ratings are one notch below investment grade with the standalone credit rating (as measured by the BCA) at two notches below investment grade. The S&P’s foreign currency, local currency and standalone (as measured by the SACP) ratings are three notches below investment grade.
The NSR credit rating is associated with bond issuances under the DMTN programme and both Moody’s and S&P currently rate Transnet at high investment grade. From a credit rating perspective, Transnet is still well positioned to raise funding through the DMTN programme.
The above credit rating actions were taken by Moody’s and S&P on 23 July 2020 and 12 May 2020, respectively, and both credit rating agencies strongly link the Transnet credit rating to that of the sovereign whilst expressing concern on Transnet’s liquidity compression. Accordingly, if Transnet’s above credit ratings were to improve, they will still remain constrained by those of the sovereign.

Notes to the annual financial statements for the year ended 31 March 2020
37. Details of investments in subsidiaries and associates Voting Interest of holding Interest of holding Accumulated
Effective holding power held Shares at cost company net profit/(loss) company indebtedness impairment and losses
2020 2019 2020 2020 2019 2020 2019 2020 2019 2020 2019Subsidiaries1 % % % R million R million R million R million R million R million R million R millionEnvironmental responsibilityTransnet Pipelines Rehabilitation Trust2 100 100 100 — — 43 56 — — — —
Social responsibilityTransnet Foundation Trust3 100 100 100 — — — — — — — —
International business activitiesTransnet International Holdings SOC Ltd (TIH)4 100 100 100 — — — — — — — —1 Incorporated in the Republic of South Africa, unless stated otherwise.2 Subsequent to the reporting year end, the National Energy Regulator of South Africa (Nersa) approved the use of a financial security alternative to the Transnet
Pipelines Rehabilitation Trust (the Trust) resulting in the trustees passing a resolution to terminate the Trust. The Trust is therefore in the process of dissolution.3 In dissolution.4 Dormant.
Interest of holding Accumulated impairment Share of post-Effective holding Shares at cost company indebtedness and losses acquisition reserves Total
2020 2019 2020 2019 2020 2019 2020 2019 2020 2019 2020 2019Equity-accounted investees1 Principal activity % % R million R million R million R million R million R million R million R million R million R million
AssociatesCommercial Cold Storage (Ports) (Pty) Ltd Storage and bondage 30 30 — — 1 1 — — 13 12 14 13
Comazar (Pty) Ltd2 Transport logistics 32 32 13 13 8 8 21 21 — — — —
RainProp (Pty) Ltd Property development and management 20 20 — — 1 1 — — 149 132 150 133
Joint ventures
Gaborone Container Terminal3 Container terminal 36 36 6 6 — — — — 23 22 29 28
Cytobix (Pty) Ltd (Godisa supplier development fund) Supplier development 50 50 — — 55 55 55 55 — — — —
19 19 65 65 76 76 185 166 193 1741 Incorporated in the Republic of South Africa, unless stated otherwise.2 Dormant.3 Incorporated in Botswana.
Summarised financial information of significant equity-accounted investeesCommercial Cold Gaborone
Storage (Ports) Container RainProp(Pty) Ltd Terminal (Pty) LtdR million R million R million
Financial positionTotal assets 90 132 1 281 Total liabilities 6 10 513
Results of operationsRevenue 22 25 168 Net profit 14 4 93
122 Annual financial statementsNotes to the annual financial statements

123
37. Details of investments in subsidiaries and associates Voting Interest of holding Interest of holding Accumulated
Effective holding power held Shares at cost company net profit/(loss) company indebtedness impairment and losses
2020 2019 2020 2020 2019 2020 2019 2020 2019 2020 2019Subsidiaries1 % % % R million R million R million R million R million R million R million R millionEnvironmental responsibilityTransnet Pipelines Rehabilitation Trust2 100 100 100 — — 43 56 — — — —
Social responsibilityTransnet Foundation Trust3 100 100 100 — — — — — — — —
International business activitiesTransnet International Holdings SOC Ltd (TIH)4 100 100 100 — — — — — — — —1 Incorporated in the Republic of South Africa, unless stated otherwise.2 Subsequent to the reporting year end, the National Energy Regulator of South Africa (Nersa) approved the use of a financial security alternative to the Transnet
Pipelines Rehabilitation Trust (the Trust) resulting in the trustees passing a resolution to terminate the Trust. The Trust is therefore in the process of dissolution.3 In dissolution.4 Dormant.
Interest of holding Accumulated impairment Share of post-Effective holding Shares at cost company indebtedness and losses acquisition reserves Total
2020 2019 2020 2019 2020 2019 2020 2019 2020 2019 2020 2019Equity-accounted investees1 Principal activity % % R million R million R million R million R million R million R million R million R million R million
AssociatesCommercial Cold Storage (Ports) (Pty) Ltd Storage and bondage 30 30 — — 1 1 — — 13 12 14 13
Comazar (Pty) Ltd2 Transport logistics 32 32 13 13 8 8 21 21 — — — —
RainProp (Pty) Ltd Property development and management 20 20 — — 1 1 — — 149 132 150 133
Joint ventures
Gaborone Container Terminal3 Container terminal 36 36 6 6 — — — — 23 22 29 28
Cytobix (Pty) Ltd (Godisa supplier development fund) Supplier development 50 50 — — 55 55 55 55 — — — —
19 19 65 65 76 76 185 166 193 1741 Incorporated in the Republic of South Africa, unless stated otherwise.2 Dormant.3 Incorporated in Botswana.
Summarised financial information of significant equity-accounted investeesCommercial Cold Gaborone
Storage (Ports) Container RainProp(Pty) Ltd Terminal (Pty) LtdR million R million R million
Financial positionTotal assets 90 132 1 281 Total liabilities 6 10 513
Results of operationsRevenue 22 25 168 Net profit 14 4 93

Notes to the annual financial statements for the year ended 31 March 2020
38. Group executive committee and director emolumentsThe table below depicts the guaranteed pay of the Transnet Exco for the reporting year:
Guaranteed Pay of Transnet Group Executive team
Retirement benefit fund Other Other Total Total
Salary contributions contributions payments 2020 2019Exco member R 000 R 000 R 000 R 000 R 000 R 000TC Morwe2, 3 804 — — — 804 3 667
S Gama2, 4 — — — — — 4 740
MM Buthelezi4, 8 — — — — — 17 216
EAN Sishi5, 8 4 480 443 2 2 762 7 687 5 000
MMA Mosidi4 — — — — — 1 721
GJ Pita2, 4 — — — — — 290
T Jiyane4 1 369 164 1 — 1 534 5 025
GJE de Beer5 5 031 534 2 — 5 567 5 565
KV Reddy 4 045 430 2 — 4 477 4 476
XB Mpongoshe 3 526 274 2 — 3 802 1 763
M Mahomedy2, 3, 6, 8 6 791 206 2 5 178 12 177 4 480
SA Vorster3, 6 2 943 275 2 — 3 220 195
R Madiba6 2 259 167 2 — 2 428 1 074
T Majoka6 3 119 213 2 — 3 334 1 591
GLN Sithole 4 288 306 2 — 4 596 744
S Qalinge5 4 186 411 2 — 4 599 745
N Mdawe6 2 544 209 2 — 2 755 153
LM Moodley5 3 134 263 2 — 3 399 549
R Nair4, 8 — — — — — 13 358
LL Tobias6 4 163 276 2 — 4 441 234
MA Fanucchi5, 9 4 117 437 2 — 4 556 806
PPJ Derby1, 7 1 298 119 — — 1 417 —
M Phillips6 2 041 104 1 — 2 146 —
K Phihlela6 2 254 144 1 — 2 399 —
S Khathi6 2 399 140 2 — 2 541 —
MD Gregg-Macdonald1, 6 3 798 327 2 — 4 127 —Total 68 589 5 442 35 7 940 82 006 73 3921 Group executives who are members of the Board of directors.2 Group executives who were members of the Board of directors.3 Contract terminated during the year.4 Contract terminated during the prior year.5 Contract terminated after year end.6 Acted as Exco member.7 Appointed as Group Chief Executive on 1 February 2020.8 Includes settlement in respect of service termination.9 Member of Exco for 11 months of the financial year.
124 Annual financial statementsNotes to the annual financial statements

125
Notes to the annual financial statements for the year ended 31 March 2020
38. Group executive committee and director emoluments continued
The table below reflects the short- and long-term incentive payments for the Transnet Exco for the reporting year:
Long-term incentive*
Long-term incentive*
Short-term incentive*
Ex Gratiaincentive*
2020 2019 2020 2019Exco member R 000 R 000 R 000 R 000TC Morwe2, 3 — — — —
S Gama2, 4 — — — —
MM Buthelezi4, 8 — — — —
EAN Sishi5, 8 — — — —
MMA Mosidi4 — — — —
GJ Pita2, 4 — — — —
T Jiyane4 — — — —
GJE de Beer5 — — — 232
KV Reddy 1 006 237 — 186
XB Mpongoshe — — — 70
M Mahomedy2, 3, 6, 8 — 221 — 187
SA Vorster3, 6 — 15 — 8
R Madiba6 210 — — 41
T Majoka6 402 97 — 64
GLN Sithole 594 36 — 31
S Qalinge5 — — — —
N Mdawe6 — — — 6
LM Moodley5 — — — —
R Nair4, 8 — — — —
LL Tobias6 574 16 — 10
MA Fanucchi5, 9 — — — 34
PPJ Derby1, 7 — — — —
M Phillips6 373 — — —
K Phihlela6 934 — — —
S Khathi6 405 — — —
MD Gregg-Macdonald1, 6 899 — — —
Total 5 397 622 — 869 * Included in trade payables, accruals and contract liabilities (refer note 28).1 Group executives who are members of the Board of directors.2 Group executives who were members of the Board of directors.3 Contract terminated during the year.4 Contract terminated during the prior year.5 Contract terminated after year end.6 Acted as Exco member.7 Appointed as Group Chief Executive on 1 February 2020.8 Includes settlement in respect of service termination.9 Member of Exco for 11 months of the financial year.

Notes to the annual financial statements for the year ended 31 March 2020
38. Group executive committee and director emoluments continued
The table below depicts the actual remuneration for the Transnet non-executive directors for the reporting year:
Other Total TotalFees payments 2020 2019
Board member R 000 R 000 R 000 R 000LC Mabaso (Chairperson)1 — — — 112
Y Forbes1, 3 — — — 62
PEB Mathekga1 — — — 67
ZA Nagdee1 — — — 67
VM Nkonyane1 — — — 60
AC Kinley1 — — — 91
SM Radebe1, 3 — — — 121
P Molefe (Chairperson) 1 276 2 1 278 1 078
LL Von Zeuner 777 — 777 647
EC Kieswetter2 62 — 62 566
R Ganda2 671 — 671 566
DC Matshoga 671 — 671 566
UN Fikelepi 675 — 675 485
GT Ramphaka 656 — 656 472
OM Motaung4 575 — 575 472
FS Mufamadi 671 — 671 550
AP Ramabulana 575 — 575 472
ME Letlape 671 — 671 517
V McMenamin1 — — — 278
Total 7 280 2 7 282 7 2491 Resigned during the prior year.2 Resigned during the current year.3 Trustees fees included.4 Advocate OM Motaung passed away in September 2020.
126 Annual financial statementsNotes to the annual financial statements

127
Notes to the annual financial statements for the year ended 31 March 2020
39. Information required by the Public Finance Management Act Sections 51 and 55 of the PFMA impose certain obligations on the Company relating to the prevention, identification and reporting of
fruitless and wasteful expenditure; irregular expenditure; losses through criminal conduct; and the collection of all revenue. Details of irregular expenditure, fruitless and wasteful expenditure, losses through criminal conduct and non-collection of revenue are presented in the tables that follow. The information relates to both Company and Group.
39.1 Irregular expenditure Irregular expenditure is defined as expenditure incurred in contravention of, or that is not in accordance with, any legislative
requirements notwithstanding that value was received. Irregular expenditure identified and incurred in the current year, is disclosed below.
2020 2019R million R million
Expenditure arising from contracts where the tender/bid process was flawed or the procurement was executed without the correct delegation of authority 1 120 3 498Contract management process not correctly followed 7 202 Unjustified use of the emergency procurement process 910 1 552 Expenditure against expired contracts 262 315 Non-compliance to the Preferential Procurement Policy Framework Act (PPPFA)– Various 10 594 – Use of tender pre-qualification criteria after release of the PPPFA 2011 regulations 3 635 7 368 – Continued use of tender pre-qualification criteria after release of the PPPFA 2017 regulations 1 874 837 – Spend in respect of the 1 064, 95 and 100 locomotive transactions 2 100 3 837Non-compliance to National Treasury requirements 14 299 Non-compliance to Construction Industry Development Board regulations 33 —Other — 4
9 965 18 506
Expenditure arising from contracts entered into in prior years 9 571 16 888Expenditure arising from contracts entered into in the current year 394 1 618
The vast majority of reported irregular expenditure relates to contracts that were entered into in prior years. This is indicative of the improvement in the procurement control environment that is now preventing new incidences of non-compliance. Appropriate action is taken against implicated individuals as any non-compliance is identified and, where appropriate, application for condonation is made to National Treasury.
On 23 January 2007, cabinet formally adopted the Competitive Supplier Development Programme (CSDP). Transnet implemented this policy by stipulating in certain of its procurement tenders that, as a pre-qualifying tender criterion, bidders must commit to certain supplier development objectives. The CSDP directive was issued in pursuit of the Reconstruction and developmental programme (RDP) published in the Government Gazette in 1994.
Prior to the 2019 annual report, Transnet’s external auditors did not find that Transnet’s implementation of the CSDP was inconsistent with the PPPFA Regulations. In the 2019 financial year, it was established that the continued use of the tender pre-qualification criteria, after the release of the Preferential Procurement Regulations in 2017 (PPR 2017), was inconsistent with legislation, and contract expenditure arising from such tenders was reported as irregular in the 2019 annual report.
In the 2020 financial year, Transnet external auditors determined that the use of the tender pre-qualification criteria, was inconsistent with the legislation, after the release of the Preferential Procurement Regulations in 2011 (as opposed to after the PPR 2017 as determined in the prior year audit).
The current determination that contracts arising from tenders issued after the 2011 regulations, that contained the pre-qualification criteria, are also irregular, required the following adjustments to the irregular expenditure register:• Increase in the 2019 reported irregular expenditure opening balance R40,1 billion;• Increase in the reported irregular expenditure for the 2019 financial year R7,4 billion; and• Increase in the reported irregular expenditure for the 2020 financial year R3,6 billion.
The legacy of non-compliant procurement events including past procurement practices not in accordance with the Preferential Procurement Framework, and the manual process to identify and accurately report all irregular expenditure continues to result in reporting inaccuracies. The resultant concern relating to the completeness of the reported irregular expenditure, as set out only in this note, has resulted in the external auditors issuing a qualified opinion for the year under review.

Notes to the annual financial statements for the year ended 31 March 2020
39.2 Condonation, recovery and removal of irregular expenditure Irregular expenditure is removed from the register when it is condoned by National Treasury, recovered or removed by the accounting authority.
2020 2019*R million R million
Opening balance brought forward 104 401 85 895 Amounts condoned — —
104 401 85 895 Irregular expenditure in the current year 9 965 18 506 Amounts recovered (95) —Closing balance carried forward 114 271 104 401 * Restated.
As noted in 39.1 on page 127, the Preferential Procurement Regulations in 2011 required the restatement of opening balances and hence the significant increase in the accumulated opening balance that was reported in the prior year.
In terms of paragraph 55 and 56 of the Irregular Expenditure Framework the relevant authority may, at the request of the accounting officer or accounting authority, condone the irregular expenditure with specific requirements being met. Transnet is in the process of following appropriate steps to meet these requirements.
39.3 Fruitless and wasteful expenditureFruitless and wasteful expenditure is expenditure which was made in vain and would have been avoided had reasonable care been exercised. During the reporting period, the Company enhanced its processes for dealing with fruitless and wasteful expenditure by implementing a PFMA sanction guide to ensure consistency of sanctions imposed through the consequence management process, as well as in alignment with the National Treasury Guideline on fruitless and wasteful expenditure.
2020 2019R million R million
Poor contract management 74 241 PPM tender/bid process not followed and insufficient delegation of authority 14 —Illegal occupations 5 —Redundant assets and stock 6 128 Fines and penalties 9 61 Expired contracts — 33 Settlements — 8 Other — 16
108 487Amounts recovered — (3)
108 484
The Group experienced 62 incidents of fruitless and wasteful expenditure during the reporting period. Management continues to institute preventive and corrective measures, including disciplinary action, as considered appropriate. Furthermore, management is obligated to pursue the recovery of the fruitless and wasteful expenditure from those who caused it.
39.4 Criminal conduct
2020 2019Note R million R million
Theft of product (a) 136 —Cable theft (b) 93 44 General theft and damage of assets (mostly TFR building and rail) (c) 41 32 Collusion and fraud (d) 4 20
Theft of signals, perway and equipment (e) 14 13 Other 5 4
Amounts recovered (12) — 281 113
39. Information required by the Public Finance Management Act continued
128 Annual financial statementsNotes to the annual financial statements

129
Notes to the annual financial statements for the year ended 31 March 2020
2020 2019Note R million R million
Bad debts written-off (a) — 432 Delayed invoicing — 2
— 434 Amounts recovered — (2)Amounts removed — (432)
— —
(a) Bad debts written off The debt write off in 2019 related to rental income at Transnet Property. All reasonable steps were taken to recover the debt,
including the appointment of debt collectors. The process to improve the controls for the collection of rentals is in progress.
40. Reportable irregularity The Company’s external auditors reported one irregularity in terms of section 45 (1) of the Auditing Profession Act, No 26 of 2005, to
the Independent Regulatory Board for Auditors.
Irregularity Status
The Company failed to comply with the requirements of section 42 of the Financial Intelligence Centre Act, 38 of 2001, which requires the company to have a Risk Management Compliance Framework approved by the Board, and submitted to the JSE.
The Company has developed a Risk Management Compliance Framework which was approved by the Board, and submitted to the JSE on 31 July 2020.
The Transnet Board, together with management, will continue to enhance controls to avoid the recurrence of such instances of non-compliance.
39. Information required by the Public Finance Management Act continued
39.4 Criminal conduct continued (a) Theft of product The Group experienced numerous incidents relating to the theft of product from the fuel pipeline during the reporting period with
three cases reported to SAPS. Efforts to combat further incidents include immediate additional security interventions and the establishment of a product theft task committee to implement long-term solutions.
(b) Theft of copper, cabling and related equipment The Group experienced numerous incidents relating to theft of conductor, cabling and related equipment during the year. Actions to
combat these losses are managed in collaboration with other affected state-owned companies and the South African Police Service. The combined effort resulted in 547 cases reported to SAPS and R1,4 million worth of stolen material was recovered.
(c) General theft and damage to assets The Group experienced numerous incidents relating to theft and damage of assets during the year. Actions to combat these losses
are managed in collaboration with other affected state-owned companies and the South African Police Service. The combined effort resulted in 170 cases reported to SAPS and R10,2 million of stolen material was recovered.
(d) Collusion and fraud There was one case of misconduct reported during the year relating to collusion by an employee with a supplier. Disciplinary and
criminal proceedings are to be instituted against those involved.
(e) Theft of signals, perway and equipment The Group experienced 118 incidents relating to theft of signals, perway and related equipment during the reporting period. All
instances were reported to security and to SAPS and stolen equipment to the value of R156 000 was recovered.
39.5 Non-collection of revenue

Abbreviations and acronymsAFLAC American Family Life Assurance Co.
Aids Acquired immune deficiency syndrome
B-BBEE Broad-Based Black Economic Empowerment
bp Basis point
BTMU Bank of Tokyo-Mitshibishi UFJ, Ltd (Japan)
CGT Capital gains tax
CGU Cash generating unit
CIC Cash interest cover
CIDB Construction Industry Development Board
CIPC Companies and Intellectual Property Commission
CPI Consumer price index
CTCT Cape Town Container Terminal
CVA Credit valuation adjustment
DCF Discounted cash flows
DCT Durban Container Terminal
DIFR Disabling injury frequency rate
DMTN Domestic medium-term note
DOA Delegation of authority
DoT Department of Transport
DPE Department of Public Enterprises
DVA Debit valuation adjustments
EBITDA Earnings before interest, tax, depreciation and amortisation
Exco Executive committee
FRMF Financial risk management framework
FVTPL Fair value through profit or loss
FVTOCI Fair value through other comprehensive income
GDP Gross domestic product
GFB General freight business
GMTN Global medium-term note
GRAP Generally recognised accounting practice
GTK Gross tonnage kilometer
HIV Human immunodeficiency virus
IAS International Accounting Standards
IASB International Accounting Standards Board
IFRS International Financial Reporting Standards
ISA International Standards on Auditing
JIBAR Johannesburg Interbank Average Rate
JMoA Joint memorandum of agreement
JPY Japanese Yen
KPI Key performance indicator
LIBOR London Interbank Offered Rate
NCT Ngqura Container Terminal
Nersa National Energy Regulator of South Africa
NMPP New multi product pipeline
NSR National scale rating
PAA Public Audit Act of South Africa, No 25 of 2004
PFMA Public Finance Management Act, No 1 of 1999
Ports Act National Ports Act, No 12 of 2005
PPM Procurement Procedure Manual
PPE Property, plant and equipment
PPPFA Preferential Procurement Policy Framework Act
Prasa Passenger Rail Agency of South Africa
RFI Request for information
RSR Railway Safety Regulator
Rumo Rumo Logistica Operadora Multi-model S.A.
S&P S&P Global Ratings
SACP Stand-alone credit profile
SAMSA South African Maritime Safety Authority
SAPS South African Police Service
SARS South African Revenue Service
SATS South African Transport Services
SD Supplier development
SOC State-owned company
SP Special meeting
TEU Twenty-foot equivalent unit
TMPS Total measured procurement spend
TN Transnet bond
TNZA Transnet Rand bond
TNFU Transnet floating rate unlisted bond
TSDBF Transnet Second Defined Benefit Fund
TTPF Transport Pension Fund: Transnet Sub-fund
USD US Dollar
WACC Weighted average cost of capital
WACD Weighted average cost of debt
ZAR South African Rand
130 Annual financial statementsAbbreviations and acronyms and glossary of terms

131
Glossary of terms
Cash interest cover (times)Cash generated from operations divided by net finance costs (net finance costs include finance costs, finance income and capitalised borrowing costs from the cash flow statement).
Debt (for gearing calculation)Long-term borrowings, short-term borrowings, employee benefits, derivative financial liabilities plus overdraft less other short-term investments, less derivative financial assets and less cash and cash equivalents.
EBITDAProfit/(loss) from operations before depreciation, derecognition, amortisation, impairment of assets, dividend received, post-retirement benefit obligation (expense)/income, fair value adjustments, income/(loss) from associates and net finance costs.
EBITDA marginEBITDA expressed as a percentage of revenue.
EquityIssued capital and reserves.
GearingDebt (as define above) expressed as a percentage of the sum of debt and equity (as defined above).
Headline earningsAs defined in Circular 2/2015, issued by the South African Institute of Chartered Accountants, all items of a capital nature are separated from earnings (by headline earnings).
Operating profitProfit/(loss) from operations after depreciation, derecognition and amortisation but before impairment of assets, dividends received, post-retirement benefit obligation (expense)/income, fair value adjustments, income/(loss) from associates and net finance costs.
Operating profit marginOperating profit expressed as a percentage of revenue.
Return on total average assetsOperating profit expressed as a percentage of total average assets, as defined below (total average assets exclude capital work-in-progress).
Total assetsNon-current and current assets.
Total average assetsTotal assets, where ‘average’ is equal to the total assets at the beginning of the reporting year plus total assets at the end of the reporting year, divided by two.
Total debtNon-current and current liabilities.

Corporate information
Transnet SOC LtdIncorporated in the Republic of South Africa.Registration number 1990/000900/30.Waterfall Business Estate9 Country Estate DriveMidrand1662
Executive directorsMs PPJ Derby(Group Chief Executive)
Ms NS Dlamini(Group Chief Financial Officer)
Ms PPJ Derby was appointed on 1 February 2020.
Ms NS Dlamini was appointed on 1 July 2020.
Mr MS Mahomedy’s appointment as the Acting Group Chief Executive was terminated on 31 January 2020 and he was reappointed as the Acting Group Chief Financial Officer on 1 February 2020. He subsequently resigned as the Acting Group Chief Financial Officer on 31 March 2020.
Mr MD Gregg-Macdonald’s appointment as the Acting Group Chief Financial Officer was terminated on 31 January 2020. He was re-appointed as the Acting Group Chief Financial Officer on 1 April 2020 and he subsequently resigned as the Acting Group Chief Financial Officer on 30 June 2020.
Independent non-executive directorsDr PS Molefe (Chairperson)Ms UN Fikelepi, Ms DC Matshoga Mr LL von Zeuner, Ms ME Letlape Adv OM Motaung, Ms GT Ramphaka Mr AP Ramabulana, Dr FS Mufamadi
Ms RJ Ganda resigned on 31 March 2020.
Adv OM Motaung passed away in September 2020.
Interim Group Company SecretaryS BopapeWaterfall Business Estate2nd Floor, 9 Country Estate DriveMidrand1662
AuditorsSizweNtsalubaGobodo Grant Thornton Inc.20 Morris Street EastWoodmeadJohannesburg2191
132 Annual financial statementsCorporate information

www.transnet.net