Embed Size (px)
Citation preview

AnnualFinancial Report to the Citizens
For the year ending December 31, 2020

2
One of the Village Board’s goals is to improve communication with the public. Towards that goal, this report has been prepared to summarize the past year’s results in an easily understandable manner.
The financial information presented is taken from the annual audit report, which is available in its entirety online at www.villagesussex.org (Finance Department Page). This report’s focus is on the funds of
interest to most citizens and does not include all of the Village’s operations.
The funds included are as follows:
If you have questions or comments about how to improve this report, or requests for additional information, please contact the Village’s Finance Department by email to [email protected]; by phone (262) 246-5225, or by mail to N64W23760 Main Street, Sussex, WI 53089.
IntroductionIntroduction
Funds that Use Property Tax Revenues• General Fund: Includes general government (administration, clerk, election, IT
and finance), police, fire, building inspection, public works, parks, recreation, health and sanitation (garbage and recycling), planning and library.
• Debt Service Funds: Used for external debt issuance and repayment.• Tax Increment Financing District (TIF): Funds established to encourage
development by providing assistance to the developer.
Enterprise Funds that use Service Fees and Operate Like Private Businesses• Water Utility: Supplies safe drinking water to residents and businesses.• Wastewater (Sewer) Utility: Treats all wastewater generated in Sussex, as well as
parts of the Town of Lisbon/Lisbon Sanitary District, Lannon and Menomonee Falls.
• Stormwater Utility: Carries out the Village’s Stormwater Management Plan and addresses the requirements of the Village’s State Stormwater Discharge NR 216 permit.
Front Row: Trustee Greg Zoellick, Village President Anthony LeDonne, Trustee Stacy Riedel. Back Row: Trustees Ron Wells, Scott Adkins, Lee Uecker, and Ben Jarvis.

3
The Village of Sussex is a full service, mid-size village providing services that include fire and police protection; thoughtful development and economic growth; maintenance of the Village’s
infrastructure (roads, sidewalks, water, sewer and stormwater facilities); quality of life options such as parks, recreation, senior services, the library; and municipal owned utilities.
2020 saw 85 building permits issued for a total valuation of about $44.9 million. About 73% of those permits were for single family homes as several subdivisions saw building begin in new phases and one subdivision opened up. There was 1 permit for a multi-family building at a value of $7 million which is included in the above total. There were 22 permits issued for commercial or industrial properties at a value of just over $20 million which is included in the total above.
One of the primary statistics used to determine the size of a municipality is the dollar value of the property within the municipality’s borders. The Village contracts with an outside appraiser who places an assessed value on each parcel; however, this method is not comparable from one municipality to the next. To make the values comparable, the Wisconsin Department of Revenue converts the assessed values to a uniform level through equalization. The converted amounts are called equalized values or “estimated fair market values” and are a better source when comparing values across different municipalities.
The Village has seen over 33.2% of growth in equalized value over the past 10 years, as shown above, after the great recession saw values decline until 2013.
Who Who We We AreAre
During the period shown, the population has increased 28.8% and the average number of utility customers has increased 38.6%
2000 2005 2010 2015 2020Population 8,828 9,761 10,518 10,743 11,373Utility Customers 2,542 3,061 3,251 3,427 3,523
2,000 4,000 6,000 8,000
10,000 12,000
Census Data
Population Utility Customers
1,100,000 1,150,000 1,200,000 1,250,000 1,300,000 1,350,000 1,400,000 1,450,000 1,500,000 1,550,000 1,600,000
2011 2012 2013 2014 2015 2016 2017 2018 2019 2020
Equalized Value (000 Omitted)

4
Another statistic that indicates growth from one year to the next is net new construction. This is the change in our equalized value due to new growth less demolished property. This percentage is one of the primary factors in our levy limit calculations. It indicates the percentage that the tax levy can increase from one year to the next (excluding certain debt service costs).
For more information about assessed and equalized values, see the publication “Guide for Property Owners,” available on the Department of Revenue website
https://www.revenue.wi.gov/DOR%20Publications/pb060.pdf
Wh
o W
e A
reW
ho
We
Are
0.00%
0.50%
1.00%
1.50%
2.00%
2.50%
3.00%
3.50%
2011 2012 2013 2014 2015 2016 2017 2018 2019 2020
Net New Construction
Dunkin Donuts/Baskin Robbins
The Courtyard at Sussex

5
Many businesses call the Village of Sussex home and provide employment opportunities for our residents. Several of these businesses are also among the largest taxpayers in the Village.
Wh
o W
e Are
Wh
o W
e Are
MAJOR EMPLOYERSMAJOR EMPLOYERSEmployer Business Services Employees
Quad/Graphics, Inc. Printer 2,600 Amazon Retail 365Beer Capital Distributing Distributor 340 Sussex IM Custom plastic molder 340Nature’s Path Manufacturer of organic cereal 250Sharp Packaging Plastic products 211Meijer Retail 189Pick ‘N Save Grocer 163Hamilton School District Elementary and secondary education 132Power Test Inc. Manufacturer of testing equipment 127
LARGEST TAXPAYERSLARGEST TAXPAYERS
Taxpayer2020
Assessed Value
Percent of Total Assessed
Valuation
Quad/Graphics, Inc. $48,729,800 3.35%
Mammoth Spring Apartments $39,347,800 2.70%
Meijer Stores $18,806,800 1.29%
Beer Capital Distributing $14,975,300 1.03%
Seasons Apartments $14,096,800 .97%
Maple Creek/Grove Apts $11,768,800 0.81%
Sussex IM $9,701,400 0.67%
GPT Sussex Owner LLC (Amazon) $8,741,400 0.60%
Exchangeright Net Leased Portfolio (McAdams Realty) $8,664,500 0.60%
Stantine-Silver Spring WI Properties (Sharp Packaging) $8,321,100 0.57%
Top 10 TOTAL $183,153,700 12.59%
TOTAL ASSESSED VALUE FOR 2020 $1,454,938,300

6
Most of the money the Village receives is from two sources: property tax levy and utility charges to customers. The following graphs of the revenues by source (excluding transfers between funds)
compare the most recent results with 10 years ago. Amounts recorded as “Other Revenue” include asset contributions by developers and RCA payments.
A 10-year comparison of these same revenue sources follows:
Where Where the Money the Money Comes Comes FromFrom
$-
$1,000,000
$2,000,000
$3,000,000
$4,000,000
$5,000,000
$6,000,000
2011
2020
$-
$5,000,000
$10,000,000
$15,000,000
$20,000,000
$25,000,000
2011 2012 2013 2014 2015 2016 2017 2018 2019 2020
Other Revenue
Stormwater Charges for Service
Intergovernmental Aid
Other Charges for Service
Sewer Charges for Service
Water Charges for Service
Property Taxes - Debt & TIF
Property Taxes - Operations

7
In 2010, the average home value used for comparing residential taxes year after year was $300,000. Since that time, the value has fluctuated based on annual reassessments. In the following chart, the value used for the average home was $292,500 in 2011 and $318,850 in 2020.
Over the past 10 years, the Village share of the property taxes on the average home value is as follows:
Wh
ere the M
on
ey Co
mes Fro
mW
here th
e Mo
ney C
om
es From
Since 2011, the overall tax bill has increased at a rate of 3.0%. One main driver of this increase has been for debt service as we have taken on many major projects during the past 10 years; however, the Board was able to maintain the same Village share of the tax bill in 2020 as in the prior year despite an increase in debt.
-
10.00
20.00
30.00
40.00
50.00
60.00
70.00
80.00
2011 2012 2013 2014 2015 2016 2017 2018 2019 2020
Average Household Monthly Utility Bill
Public Fire Protection
Stormwater
Sewer
Water
1,250.00
1,350.00
1,450.00
1,550.00
1,650.00
1,750.00
1,850.00
2011 2012 2013 2014 2015 2016 2017 2018 2019 2020
Village Share of Tax Bill
3.0% Trend
Utility charges are collected for all three of the Village-owned utilities (Water, Sewer and Stormwater) and are primarily based on the water meter size and individual usage for water and sewer. Stormwater charges are based on the number of ERUs (Equivalent Runoff Units) with a single-family residence being charged one ERU. In 2019, the utilities changed to a monthly billing cycle. All prior years were converted for comparability. In 2019, the charge for public fire protection was converted to a direct charge to customers and is shown as a separate charge.

8
Wh
ere
the
Mo
ney
Co
mes
Fro
mW
her
e th
e M
on
ey C
om
es F
rom
STORM
Year EndedDecember 31,
Volume Charge per 1,000 gal of
water
Service Charge
Public Fire Protection
Volume Charge per 1,000 gal of
water
Service Charge
Service Charge
2011 2.56 10.50 - 4.22 5.56 5.00 2012 2.75 10.50 - 4.37 5.75 5.00 2013 2.75 10.50 - 4.50 5.92 5.00 2014 2.83 10.82 - 4.64 6.10 5.00 2015 2.83 10.82 - 4.78 6.28 5.00 2016 3.05 11.00 - 4.92 6.47 5.00 2017 3.05 11.00 - 4.97 6.54 7.32 2018 3.14 11.33 - 5.09 6.70 8.04 2019 3.71 12.50 10.55 5.14 6.77 8.76 2020 4.55 13.00 11.45 5.14 4.77 8.76
WATER SEWER
School Districts$0.53
Village$0.33
County$0.11
WCTC$0.02
Utility charges are collected for all three of the Village-owned utilities (Water, Sewer and Stormwater) and are primarily based on the water meter size and individual usage for water and sewer. Stormwater charges are based on the number of ERUs (Equivalent Runoff Units) with a single-family residence being charged one ERU. In 2019, the Stormwater Utility implemented the final of three phases of the rate increase.
Water usage is measured in gallons and the sewer usage is based on the number of gallons of water used. There are currently five categories of utility customers: residential, commercial, industrial, public and multi-family residential. Volumetric charges are the same for all types of customers. The quarterly service charges for water and stormwater vary based on the meter size for water and the number of ERUs for stormwater. The following shows the history of rates based on a single-family residence. Bolded rates are the years when there was a rate increase.
For every dollar collected from taxpayers, $0.33 is for Village government purposes.
The Village collects property taxes for several taxing jurisdictions including the county, school districts and technical college.

9
Wh
ere the M
on
ey Co
mes Fro
mW
here th
e Mo
ney C
om
es From
Information about the taxing entities can be found at:
Arrowhead School District
Tax Rates Over Time
2011 $ 4.7311
2020 $ 5.5923
2011 $10.3523
2020 $ 8.9089
2011 $11.7096
2020 $7.9822
2011 $2.0548
2020 $1.859
2011 $ 1.2787
2020 $ 0.3704
10
Where Where the the Money Money GoesGoes
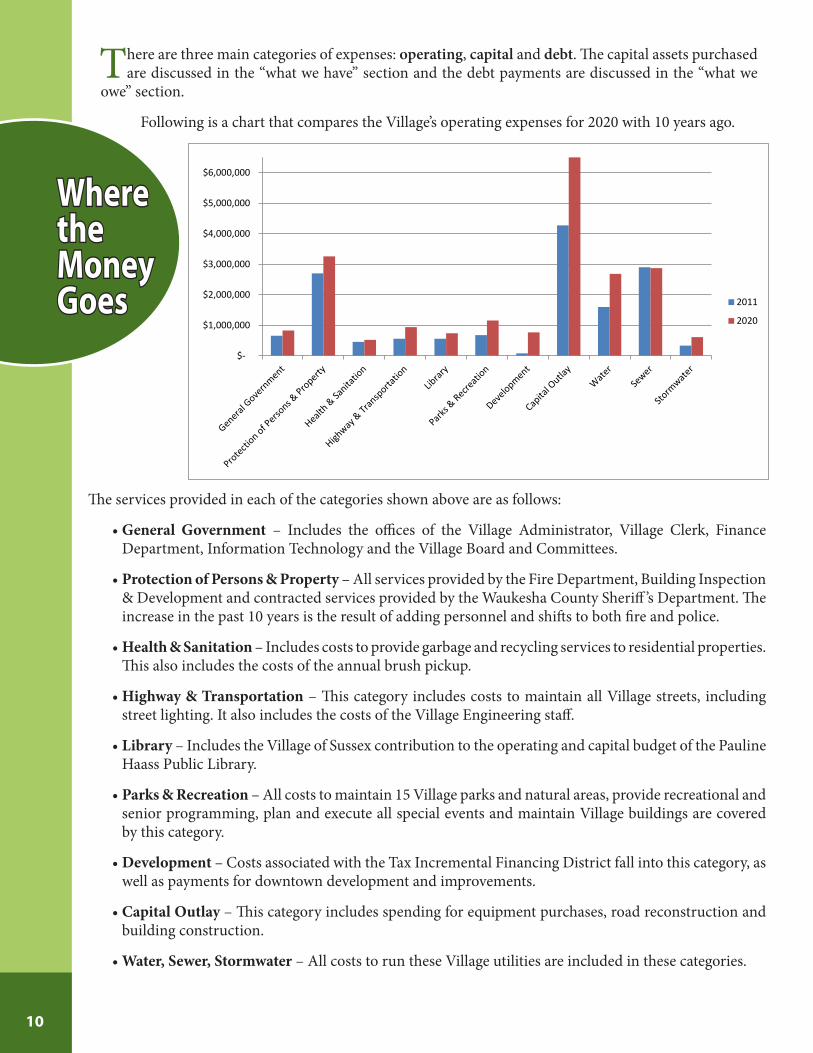
The services provided in each of the categories shown above are as follows:
• General Government – Includes the offices of the Village Administrator, Village Clerk, Finance Department, Information Technology and the Village Board and Committees.
• Protection of Persons & Property – All services provided by the Fire Department, Building Inspection & Development and contracted services provided by the Waukesha County Sheriff ’s Department. The increase in the past 10 years is the result of adding personnel and shifts to both fire and police.
• Health & Sanitation – Includes costs to provide garbage and recycling services to residential properties. This also includes the costs of the annual brush pickup.
• Highway & Transportation – This category includes costs to maintain all Village streets, including street lighting. It also includes the costs of the Village Engineering staff.
• Library – Includes the Village of Sussex contribution to the operating and capital budget of the Pauline Haass Public Library.
• Parks & Recreation – All costs to maintain 15 Village parks and natural areas, provide recreational and senior programming, plan and execute all special events and maintain Village buildings are covered by this category.
• Development – Costs associated with the Tax Incremental Financing District fall into this category, as well as payments for downtown development and improvements.
• Capital Outlay – This category includes spending for equipment purchases, road reconstruction and building construction.
• Water, Sewer, Stormwater – All costs to run these Village utilities are included in these categories.
$-
$1,000,000
$2,000,000
$3,000,000
$4,000,000
$5,000,000
$6,000,000
2011
2020
There are three main categories of expenses: operating, capital and debt. The capital assets purchased are discussed in the “what we have” section and the debt payments are discussed in the “what we
owe” section.
Following is a chart that compares the Village’s operating expenses for 2020 with 10 years ago.

11
Wh
ere the M
on
ey Go
esW
here th
e Mo
ney G
oes
The amount spent for Capital Outlay is generally the spending of funds borrowed for specific projects. Oftentimes, spending for capital outlay is for the construction or acquisition of capital assets but it could also be for maintenance of the capital assets, such as the annual road program or development incentives.
The above chart shows a 10-year spending history for the Village.
• The majority of expenses show minimal increases from year to year. Outlay, however, shows fluctuations that typically coincide with the years that the Village has borrowed money for major projects. 2016 included construction of the Civic Campus and Main Street reconstruction. 2020 included the Maple Avenue reconstruction. Portions of the Maple Avenue also increased the expenses of the utilities as repairs were made.
• Development costs coincide with payments for TIF #6 in 2014, 2015, 2016 and 2018 and TIF #7 in 2019 and 2020.
-
5,000,000
10,000,000
15,000,000
20,000,000
25,000,000
30,000,000
2011 2012 2013 2014 2015 2016 2017 2018 2019 2020
Development
Capital Outlay
Stormwater
Library
Health &Sanitation
Highway
GeneralGovernment
Parks &Recreation
Water
Sewer
ProtectionPersons/Prop
Kwik Trip at Highlands Business Park

12
Protection of Persons & Property - Police 2020 2019 % ChangeCalls for Service 6,071 6,211 -2.25%Citations (see note) 1,372 2,191 -37.38%Traffic Incidents (see note) 737 996 -26.00%Other Incidents 1,599 1,573 1.65%House/Building Checks 4,945 4,464 10.78%
Protection of Persons & Property - FireEMS Calls 621 687 -9.61%Fire Calls 220 184 19.57%Fire Inspections 885 984 -10.06%
Protection of Persons & Property - Building InspectionPermits - Single Family Homes 62 50 24.00%Permits - Multi-Family Buildings 1 - Permits - Commercial/Industrial 22 6 266.67%Permits - All Other 1,558 1,408 10.65%
Public Works DepartmentLane Miles of Roads Maintained 54 53 1.89%Miles of Sidewalks Maintained 23.37 19.27 21.28%
Parks and Recreation DepartmentAcres of Parks Maintained 274 274 0.00%Number of Playgrounds 11 11 0.00%Community Special Events (see note) 10 25 -60.00%Registered Participants (Rec prog & spec events) (see note) 2,447 6,313 -61.24%
Wh
ere
the
Mo
ney
Go
esW
her
e th
e M
on
ey G
oes
Included in the operating expenses are personnel costs. Excluding part-time positions, such as the Village Board and its committees, paid-on-call firefighters, recreation program instructors and election workers, the Village provides all of the above services with 55 full-time equivalent employees, including 14 for the library. Police services are provided through a contract with the Waukesha County Sheriff ’s Department.
Some statistics regarding the services provided are as follows:
Sledding Party at Village Park
Note: These numbers in 2020 were affected by the COVID-19 pandemic Forcing shutdowns and limiting interactions with citizens.

13
What What We We
HaveHave
To assist in our planning for the replacement of large capital assets and other major expenses, the Village prepares an eight-year Capital Improvement Program (CIP). The CIP is a tool to assess the long-term
capital needs, values and desires of the Village and to establish funding of high-priority projects in a timely, cost-effective manner. The current CIP is available on the Village’s website at www.villagesussex.org under the Executive Department.
The major component of the CIP is capital asset replacement. Capital assets consist of equipment, buildings, land and infrastructure owned by the Village that are expected to serve our residents over multiple years. The Village has $132.3 million (net of depreciation) in capital assets across all departments and functions at the end of 2020.
For comparison, the balances at year end 2020 are compared to year end 2011 above. The largest component, infrastructure, includes 54.3 miles of roads, as well as water, sewer and stormwater mains and the water towers and hydrants.
Infrastructure$89,678,136
Equip$14,138,192
Buildings$22,756,476
Land & Land Improvements
$5,607,804
Construction in Progress$88,177
2020
Infrastructure$76,280,791
Equipment$10,633,982
Buildings$10,362,761
Land & Land Improvements
$3,914,184
2011
14
Wh
at W
e H
ave
Wh
at W
e H
ave
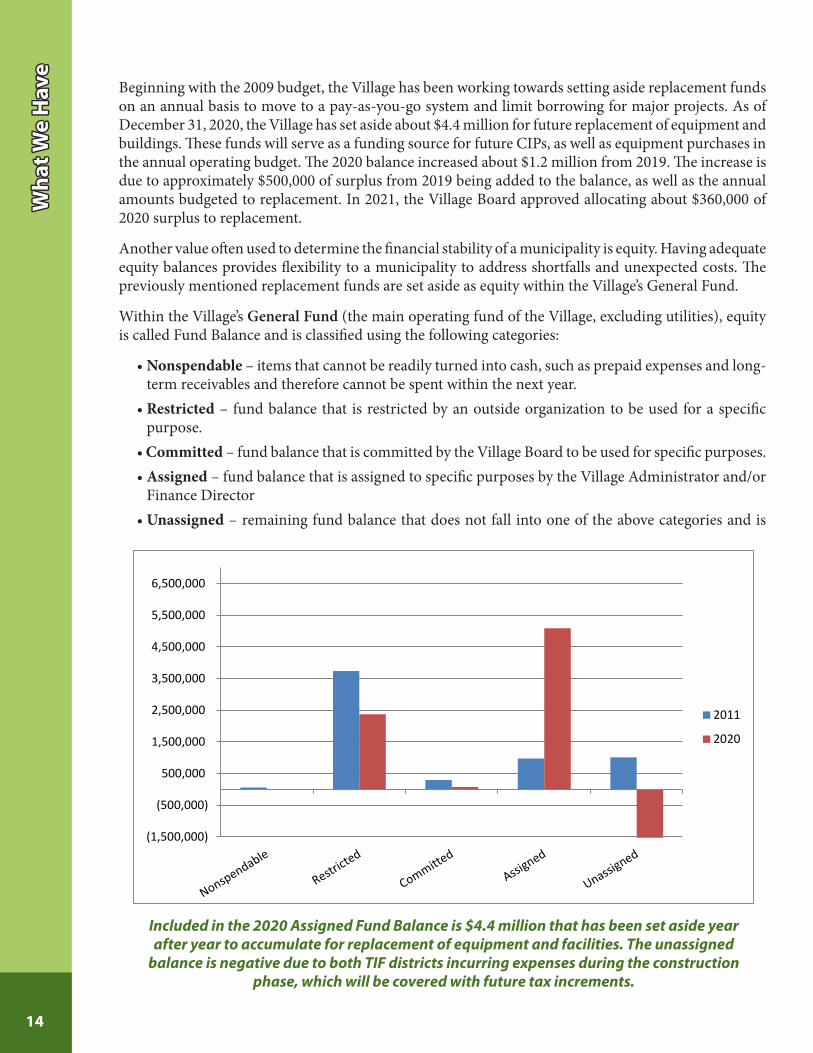
Beginning with the 2009 budget, the Village has been working towards setting aside replacement funds on an annual basis to move to a pay-as-you-go system and limit borrowing for major projects. As of December 31, 2020, the Village has set aside about $4.4 million for future replacement of equipment and buildings. These funds will serve as a funding source for future CIPs, as well as equipment purchases in the annual operating budget. The 2020 balance increased about $1.2 million from 2019. The increase is due to approximately $500,000 of surplus from 2019 being added to the balance, as well as the annual amounts budgeted to replacement. In 2021, the Village Board approved allocating about $360,000 of 2020 surplus to replacement.
Another value often used to determine the financial stability of a municipality is equity. Having adequate equity balances provides flexibility to a municipality to address shortfalls and unexpected costs. The previously mentioned replacement funds are set aside as equity within the Village’s General Fund.
Within the Village’s General Fund (the main operating fund of the Village, excluding utilities), equity is called Fund Balance and is classified using the following categories:
• Nonspendable – items that cannot be readily turned into cash, such as prepaid expenses and long-term receivables and therefore cannot be spent within the next year.
• Restricted – fund balance that is restricted by an outside organization to be used for a specific purpose.
• Committed – fund balance that is committed by the Village Board to be used for specific purposes.• Assigned – fund balance that is assigned to specific purposes by the Village Administrator and/or
Finance Director• Unassigned – remaining fund balance that does not fall into one of the above categories and is
Included in the 2020 Assigned Fund Balance is $4.4 million that has been set aside year after year to accumulate for replacement of equipment and facilities. The unassigned
balance is negative due to both TIF districts incurring expenses during the construction phase, which will be covered with future tax increments.
(1,500,000)
(500,000)
500,000
1,500,000
2,500,000
3,500,000
4,500,000
5,500,000
6,500,000
2011
2020

15
Within the three utilities, equity is called Net Position, which is made up of three components: net investment in capital assets, restricted net position and unrestricted net position. Following is the total net position held by the three utilities comparing the most recent year end with 10 years ago:
Overall, the Village is financially healthy. The establishment of the equipment replacement fund was specifically recognized by our credit rating agency during their last report. The Village’s credit rating remains at Aa2 for general obligation debt, Aa3 for Sewer and Stormwater Utility revenue bonds and A1 for Water Utility revenue bonds.
Wh
at We H
aveW
hat W
e Have
80.3% of the Utilities’ equity is tied to capital assets, which cannot easily be turned into cash to meet future needs.
-
10,000,000
20,000,000
30,000,000
40,000,000
50,000,000
60,000,000
Unrestricted Restricted Net Investment inCapital Assets
Utility Net Position
2011
2020
The Grove at Village Park

16
What What We We OweOwe
It is the Village’s practice to issue debt for projects that cannot be financed from current revenues or reserves. Debt is paid back within a period of time not to exceed the useful life of the project being funded, which, in general, is at or below 20 years.
A benefit of issuing debt to pay for large projects is to allocate the payment of the project to those that benefit from the project. In other words, the debt payments will be made by
future generations that use the asset acquired through the project rather than by previous generations that did not have access to the particular asset.
In general, the Village borrows every two to three years depending on the scheduled project in the CIP, as well as the current interest rates. Debt issues are structured to maintain level payments over the life of the outstanding debt in order to avoid large fluctuations in the tax rate.
General obligation (G.O.) debt is external debt owed by the Village that is supported by the ability to levy property taxes to make the payments. Other than debt held for the utilities,
most of the Village’s external borrowing is G.O. debt. State statutes limit the amount of G.O. debt we are allowed to hold at 5% of our equalized value. As shown in the chart below, our outstanding
debt has remained below 60% of the allowed limit until the 2020 borrowing, which pushed us to 62.3% of the limit; however, the 2020 borrowing was for the last arterial road reconstruction, so future borrowing will be less.
$-
$10,000,000
$20,000,000
$30,000,000
$40,000,000
$50,000,000
$60,000,000
$70,000,000
$80,000,000
2011 2012 2013 2014 2015 2016 2017 2018 2019 2020
G.O. Debt Outstanding Debt Limit

17
Revenue bonds are external debt owed by the Village utilities that is supported by future customer revenues. The revenue bonds held by the Water and Sewer Utilities are subject to debt covenants that require a certain level of revenues be pledged towards payment of the debt. Each month, the pledged portion is segregated into a separate fund and the cash is reserved for the upcoming debt payments. A reserve fund was also established when the debt was issued and is intended to subsidize any future decrease in revenues that results in an inability to make a debt payments. Throughout the life of the debt, the reserve fund has not been needed.
Over the past 10 years, the Water Utility has known it would incur significant debt for radium treatment and took steps to reduce the existing debt before the 2017 borrowing. During 2018 and 2019, the Water Utility incurred additional debt in the form of Revenue Bond Anticipation Notes (BANs) of $5,105,000 which are not included in the chart. Once the full effects of the 2019 and 2020 rate increases take place, the BANs will be refunded with additional revenue bond debt. The Sewer Utility debt, prior to 2018, was for the wastewater treatment plant expansion in 2007. The repayment of this debt is shared with the communities that are served by the plant.
Wh
at We O
we
Wh
at We O
we
Utility Debt
$-
$1,000,000
$2,000,000
$3,000,000
$4,000,000
$5,000,000
$6,000,000
$7,000,000
$8,000,000
2011 2012 2013 2014 2015 2016 2017 2018 2019 2020
Water
Sewer
Radium Treatment

18
Within the next 10 years, the population of the Village is expected to increase to about 17,000 and the Village will reach its boundary limit with the Town of Lisbon. This makes the decade incredibly
important to address the needs of that growth and provide the Village with a sustainable future. Here are some of the changes for the next decade.
Downtown DevelopmentThe Sussex Downtown continues to adjust with a walkable center, new construction, re-use
of older buildings and economic revitalization. About 1,000 new residents have, or will, move into the downtown, adding to a core base to support downtown retail. There will be a continued emphasis on downtown special events and community gathering to spur a quality of life for the community.
Village Park Master PlanWith The Grove completed, the rest of the Village Park update will occur over the decade,
with a goal that the park has been refreshed and ready to meet the needs of a community of 17,000 by the 75th Anniversary of the Park.
Village InfrastructureThe Village will focus on the sustainable roadway and utility infrastructure maintenance to ensure 13–15 year cycles with 60-plus year life spans for the most efficient use of resources and quality of experience for the residents. The goal over the next decade is get to a place where these costs are built into the annual budget so as to avoid long-term borrowing once growth is done. At the end of the decade there may be need for one more well in the water system, but the Wastewater treatment is sized for Village needs (the plant will double in size for growth in Menomonee Falls).
Other ProjectsThe Village will continue to see older neighborhoods transition to younger families, driving the median age further younger. The last farmland of the Village will develop over the next decade (along Plainview Road) and along STH 164. Some infill projects will remain to develop. Some type of transition on commercial properties will likely occur as that market adjusts to new shopping behaviors. You’ll see some industrial expansions, but no new business parks, as there is no land to develop on. By the end of the decade you will see a significant shift in staffing, as positions move from growth mode to maintenance mode and the different needs therein are addressed.
Where Where We Are We Are GoingGoing

19
Wh
ere We A
re Go
ing
Wh
ere We A
re Go
ing
The Grove Ribbon Cutting Ceremony
Civic Center Ice Rink
Maple Avenue Reconstruction