Embed Size (px)
Citation preview

ANNUAL FINANCIAL REPORTFOR THE YEARS ENDED JUNE 30, 2017 AND 2016
A MEMBER OF MINNESOTA STATE
2017 Annual Financial Report Cover.indd 1 10/5/17 10:57 AM


ST. CLOUD STATE UNIVERSITY
A MEMBER OF MINNESOTA STATE
ANNUAL FINANCIAL REPORT
FOR THE YEARS ENDED JUNE 30, 2017 AND 2016
Prepared by:
Chief Financial Officer St. Cloud State University 720 Fourth Avenue South, AS 205 St. Cloud, Minnesota 56301

Upon request, this publication is available in alternate formats by calling one of the following: General number (651) 201-1800 Toll free: 1-888-667-2848 For TTY communication, contact Minnesota Relay Service at 7-1-1 or 1-800-627-3529.

ST. CLOUD STATE UNIVERSITY
ANNUAL FINANCIAL REPORT FOR THE YEARS ENDED JUNE 30, 2017 AND 2016
TABLE OF CONTENTS
INTRODUCTION
Page
Transmittal Letter ................................................................................................................................... 4
Organizational Chart .............................................................................................................................. 7
FINANCIAL SECTION
Independent Auditors’ Report .............................................................................................................. 10
Management’s Discussion and Analysis .............................................................................................. 13
Basic Financial Statements
Statements of Net Position ............................................................................................................ 19
St. Cloud State University Foundation, Inc. – Statements of Financial Position .......................... 20
Statements of Revenues, Expenses, and Changes in Net Position ................................................ 21
St. Cloud State University Foundation, Inc. – Statements of Activities ........................................ 22
Statements of Cash Flows ............................................................................................................. 24
Notes to the Financial Statements ................................................................................................. 26
REQUIRED SUPPLEMENTARY INFORMATION SECTION
Schedule of Funding Progress for Net Other Postemployment Benefits ……………………………... 63
Schedules of Proportionate Share of Net Pension Liability and Contributions
State Employees Retirement Fund ……………………………………………………………… 64
Teachers Retirement Fund ……………………………………………………………………… 65
General Employees Retirement Fund ........................................................................................... 66
SUPPLEMENTARY SECTION
Report on Internal Control Over Financial Reporting and on Compliance and Other Matters Based on an Audit of Financial Statements Performed in Accordance with Government Auditing Standards ................................................................... 68
1

This page intentionally left blank
2

INTRODUCTION
3

4

5

This page intentionally left blank
6

St. C
loud
Sta
te U
nive
rsity
Org
aniz
atio
nal C
hart
BOA
RD O
F TR
UST
EES
Min
neso
ta S
tate
Col
lege
s an
d U
nive
rsiti
es
Dev
inde
r M
alho
tra
Inte
rim
Cha
ncel
lor
Ash
ish
K. V
aidy
aIn
teri
m P
resi
dent
Dan
Gre
gory
Inte
rim
Pro
vost
/Vic
e
Pres
iden
t for
Aca
dem
ic A
ffairs
Tam
my
L.H
. McG
eeVi
ce P
resi
dent
for
Fina
nce
and
Adm
inis
trati
on
Wan
da O
verl
and
Vice
Pre
side
nt fo
r
Stud
ent L
ife a
nd
Dev
elop
men
t
Matt
And
rew
Vice
Pre
side
nt fo
r
Uni
vers
ity
Adv
ance
men
t
Judi
th S
imin
oeSp
ecia
l Adv
isor
to th
e Pr
esid
ent
Elly
n Ba
rtge
sEq
uity
&
Acc
ess
Offi
cer
Hea
ther
Wee
ms
Dire
ctor
of A
thle
tics
Bern
ie O
man
nD
irect
or o
f Uni
vers
ity
Rela
tions
/Leg
isla
tive
Rela
tions
Lisa
Fos
sVi
ce P
resi
dent
for
Plan
ning
and
Enga
gem
ent a
nd C
hief
Stra
tegy
Offi
cer
7

The financial activity of St. Cloud State University is included in this report. The university is one of 37 colleges and universities included in the Minnesota State Colleges and Universities Annual Financial Report which is issued separately. The university’s portion of the Revenue Fund is also included in this report. The Revenue Fund activity is included both in the Minnesota State Colleges and Universities Annual Financial Report and in a separately issued Revenue Fund Annual Financial Report. All financial activity of the Minnesota State Colleges and Universities is included in the state of Minnesota Comprehensive Annual Financial Report.
8

FINANCIAL SECTION
9
CliftonLarsonAllen LLPCLAconnect.com
INDEPENDENT AUDITORS’ REPORT Board of Trustees Minnesota State Colleges and Universities St. Paul, Minnesota Report on the Financial Statements We have audited the accompanying financial statements of St. Cloud State University (the University), a campus of Minnesota State Colleges and Universities, and the discretely presented component unit, as of and for the years ended June 30, 2017 and 2016, and the related notes to the financial statements, which collectively comprise the University’s basic financial statements as listed in the table of contents. Management’s Responsibility for the Financial Statements
Management is responsible for the preparation and fair presentation of these financial statements in accordance with accounting principles generally accepted in the United States of America; this includes the design, implementation, and maintenance of internal control relevant to the preparation and fair presentation of financial statements that are free from material misstatement, whether due to fraud or error. Auditors’ Responsibility
Our responsibility is to express opinions on these financial statements based on our audit. We conducted our audit in accordance with auditing standards generally accepted in the United States of America and the standards applicable to financial audits contained in Government Auditing Standards, issued by the Comptroller General of the United States. Those standards require that we plan and perform the audit to obtain reasonable assurance about whether the financial statements are free from material misstatement. The financial statements of the St. Cloud State University Foundation were not audited in accordance with Government Auditing Standards. An audit involves performing procedures to obtain audit evidence about the amounts and disclosures in the financial statements. The procedures selected depend on the auditors’ judgment, including the assessment of the risks of material misstatement of the financial statements, whether due to fraud or error. In making those risk assessments, the auditor considers internal control relevant to the University’s preparation and fair presentation of the financial statements in order to design audit procedures that are appropriate in the circumstances, but not for the purpose of expressing an opinion on the effectiveness of the University’s internal control. Accordingly, we express no such opinion. An audit also includes evaluating the appropriateness of accounting policies used and the reasonableness of significant accounting estimates made by management, as well as evaluating the overall presentation of the financial statements. We believe that the audit evidence we have obtained is sufficient and appropriate to provide a basis for our audit opinions.
10

Board of Trustees Minnesota State Colleges and Universities
Opinions
In our opinion, the financial statements referred to above present fairly, in all material respects, the financial position of St. Cloud State University as of June 30, 2017 and 2016, and the respective changes in financial position and cash flows, were applicable, thereof for the years then ended, in accordance with accounting principles generally accepted in the United States of America. Emphasis of Matters
As discussed in Note 1, the financial statements present only St. Cloud State University and do not purport to, and do not, present fairly the financial position of Minnesota State Colleges and Universities as of June 30, 2017 and 2016, the changes in its financial position, or cash flows for the years then ended in accordance with accounting principles generally accepted in the United States of America. Our opinion is not modified with respect to this matter. Other Matters
Required Supplementary Information
Accounting principles generally accepted in the United States of America require that the management’s discussion and analysis, the schedule of funding progress – net other postemployment benefit plan, the schedule of the proportionate share of net pension liability, and the schedule of contributions, as listed in the table of contents be presented to supplement the basic financial statements. Such information, although not a part of the basic financial statements, is required by the Governmental Accounting Standards Board who considers it to be an essential part of financial reporting for placing the basic financial statements in an appropriate operational, economic, or historical context. We have applied certain limited procedures to the required supplementary information in accordance with auditing standards generally accepted in the United States of America, which consisted of inquiries of management about the methods of preparing the information and comparing the information for consistency with management’s responses to our inquiries, the basic financial statements, and other knowledge we obtained during our audit of the basic financial statements. We do not express an opinion or provide any assurance on the information because the limited procedures do not provide us with sufficient evidence to express an opinion or provide any assurance. Other Reporting Required by Government Auditing Standards In accordance with Government Auditing Standards, we have also issued our report dated November 14, 2017, on our consideration of St. Cloud State University’s internal control over financial reporting and on our tests of its compliance with certain provisions of laws, regulations, contracts, and grant agreements and other matters. The purpose of that report is solely to describe the scope of our testing of internal control over financial reporting and compliance and the results of that testing, and not to provide an opinion on the effectiveness of St. Cloud State University’s internal control over financial reporting or on compliance. That report is an integral part of an audit performed in accordance with Government Auditing Standards in considering St. Cloud State University’s internal control over financial reporting and compliance.
CliftonLarsonAllen LLP
Minneapolis, Minnesota November 14, 2017
11

This page intentionally left blank
12

MANAGEMENT’S DISCUSSION AND ANALYSIS (Unaudited) INTRODUCTION The following discussion and analysis provides an overview of the financial position and activities of St. Cloud State University, a member of Minnesota State Colleges and Universities (Minnesota State), for the years ended June 30, 2017 and 2016. This discussion has been prepared by management and should be read in conjunction with the financial statements and accompanying footnotes, which follow this section. St. Cloud State University is one of 37 colleges and universities comprising Minnesota State. Minnesota State is governed by a fifteen member board of trustees appointed by the Governor. Twelve trustees serve six-year terms; eight represent each of Minnesota’s congressional districts, and four serve at large. Three student trustees, one from a state university, one from a community college and one from a technical college, serve two-year terms. The board of trustees selects the chancellor and has broad policy responsibility for system planning, academic programs, fiscal management, personnel, admissions requirements, tuition and fees, and policies and procedures. The university is a comprehensive doctoral public institution of higher learning, serving 19,000 students annually, including 2,500 graduate and professional students. Approximately 1,350 faculty and staff members are employed by the university. Founded in 1869, the university offers 160 majors, minors, and pre-professional programs in business, education, fine arts and humanities, science and engineering and social sciences, and 90 master’s and doctoral degrees. In addition, online offerings include over 360 courses and degree completion opportunities for several graduate programs. St. Cloud State University has total built space of 3.2 million square feet including 100 acres at the Main campus along with the Twin Cities Graduate Center campus in Plymouth, which makes it the largest in the system. Colleges and Schools that comprise the university’s academic programs include:
• College of Liberal Arts • School of the Arts • Herberger Business School • School of Public Affairs • College of Science and Engineering • School of Computing, Engineering, and Environment • School of Education • School of Health and Human Services
The university is accredited by several national accrediting agencies including the Higher Learning Commission, the Association to Advance Collegiate Schools of Business International, and the National Council for Accreditation of Teacher Education. The university has student organizations in areas such as the arts, communication, fraternities and sororities, honorary, language and culture, political and social concerns, recreational sports and student government. The university offers intercollegiate sports such as Division I men’s and women’s hockey, and 17 other Division II athletic teams.
13

FINANCIAL HIGHLIGHTS Governmental Accounting Standards Board (GASB) Statement No. 68, Accounting and Financial Reporting for Pensions, and Statement No. 71, Pension Transition for Contributions Made Subsequent to the Measurement Date, were implemented during fiscal year 2015. The beginning net position as of July 1, 2014 was restated by $50.1 million to retroactively report the net pension liability and the deferred inflows and deferred outflows of resources. Fiscal year 2014 financial statement amounts for net pension liabilities, pension expense, deferred outflows of resources and deferred inflows of resources were not restated because the information was not available. In the past, pension expense was the amount of the employer contribution. Current reporting provides a more comprehensive measure of pension expense which is more reflective of the amounts employees earned during the year. Comparability between fiscal years will have variances due to this new accounting standard and is explained throughout the management discussion and analysis. Excluding the GASB Statement No. 68 pension adjustment, the university recognized an improvement to its unrestricted net position of $5.2 million. In fiscal year 2017 total revenues increased by $0.9 million to a total of $200.7 million. Operating expenses decreased as due to significant reductions in the number of full time equivalent employees, which resulted in reductions to total compensation and fringe benefits. With GASB Statement No. 68, however, the university recognized a decrease in unrestricted net position of $15.8 million in fiscal year 2017, the cumulative effect since fiscal year 2015 for pension liability is a $62.4 million decrease in the university’s net position. The university experienced a decrease of $1.0 million in state appropriation revenue and a $0.8 million decrease in its gross tuition and fees revenue during fiscal year 2017 due to a decrease in enrollment of 3.0 percent. The university also saw an increase in operating expenses of $23.4 million in fiscal year 2017 due primarily to a $21.0 million allocation of fringe benefit expenses related to GASB Statement No. 68. Excluding the GASB Statement No. 68 effect, fiscal year 2017 operating expenses decreased by $2.3 million from fiscal year 2016, of which $2.0 million was from a reduction in salaries and benefits resulting from a 2.8 percent reduction in full time equivalent employees. The net impact of these changes resulted in a $0.3 million increase to cash due to continued focus on productivity measures across the university. For the fiscal year ended June 30, 2017, assets and deferred outflows totaled $432.6 million while liabilities and deferred inflows totaled $298.7 million. Net position, which represents the residual interest in the university’s assets and deferred outflows after liabilities and deferred inflows are deducted, is comprised of net investment in capital assets of $160.0 million, restricted net position of $17.8 million and unrestricted net position of negative $44.0 million. The total impact of GASB Statement No. 68 is a reduction of $62.4 million on net position. Excluding GASB 68, the unrestricted net position would have been a positive $18.3 million. Total liabilities would have also shown a decrease excluding GASB Statement No. 68 as the university continues to pay down long term debt while depreciating recent investments like Coborns Plaza, Integrated Science Engineering Laboratory Facility, and upgrades to Shoemaker and Case-Hill Hall. USING THE FINANCIAL STATEMENTS The university’s financial report includes three financial statements: the statements of net position, the statements of revenues, expenses and changes in net position, and the statements of cash flows. These financial statements are prepared in accordance with applicable generally accepted accounting principles (GAAP) as established by the Governmental Accounting Standards Board (GASB) through authoritative pronouncements. These GASB statements establish standards for external financial reporting for public colleges and universities and require that financial statements be presented on a consolidated basis to focus on the university as a whole, with resources classified for accounting and reporting purposes into three net position categories. A summary of significant accounting policies followed by the university is included in Note 1 to the financial statements.
14

STATEMENTS OF NET POSITION The statements of net position present the financial position of the university at the end of the fiscal year and include all assets and deferred outflows and liabilities and deferred inflows of the university as measured using the accrual basis of accounting. The difference between total assets and deferred outflows and total liabilities and deferred inflows is net position, one indicator of the current financial condition of the university. The change in net position is an indicator of whether the overall financial condition has improved or declined during the year. Capital assets are stated at historical cost net of accumulated depreciation, with current year depreciation reflected as a period expense on the statements of revenues, expenses and changes in net position. A summary of the university’s statements of net position as of June 30, 2017, 2016, and 2015 follows:
2017 2016 2015Current assets $ 80,690 $ 79,782 $ 76,248 Noncurrent assets 4,916 4,847 4,858 Capital assets, net 236,614 243,409 257,082 Deferred outflows of resources 110,357 8,566 3,622 Total assets and deferred outflows of resources 432,577 336,604 341,810
Current liabilities 36,061 35,107 33,936 Noncurrent liabilities 251,747 125,846 133,058 Deferred inflows of resources 10,932 21,697 22,928 Total liabilities and deferred inflows of resources 298,740 182,650 189,922 Net position $ 133,837 $ 153,954 $ 151,888
(In Thousands)
Current assets consist primarily of cash and cash equivalents (unrestricted) and investments totaling $60.6 million at June 30, 2017. This is an increase of $0.4 million over fiscal year 2016 and represents 3.6 months of operating expenses (excluding depreciation). This is compared to 4.0 months and 3.8 months for the fiscal years ended June 30, 2016 and 2015, respectively. This is a measure of liquid asset availability to cover operating expenses in the event of a temporary interruption to or decrease in the university’s revenues. In fiscal years 2017 and 2016, $110.4 million and $8.6 million of deferred outflows were reported respectively, which represent the consumption of net position in one period that is applicable to future periods, and is primarily due to the GASB Statement No. 68 implementation. Accounts receivable, net of allowance increased $1.1 million due primarily to a change in estimate of uncollectible receivables. Current liabilities consist primarily of accounts payable and other liabilities, salaries and benefits payable, compensated absences, current portion of long-term debt, and unearned revenue. Salaries and benefits payable at June 30, 2017 decreased from the prior year by $1.3 million, or 9.3 percent, to a total of $12.8 million, as the prior year included $1.0 million in Inter Faculty Organization equity back pay accruals. Consistent with prior years, the salaries and benefits payable accrual included about two months of earned salary for faculty who elected to receive salaries over twelve months. Accounts payable and other liabilities, including payables from restricted assets, decreased $2.1 million or 39.7 percent, primarily due to decreased construction activity, technology and classroom amenity purchases. Unearned revenue consists of $3.8 million of summer session tuition and grant receipts received, but not yet earned at June 30, 2017. Summer session began in May and ended in August 2017, with tuition being allocated based on the number of session days in fiscal year 2017. In fiscal year 2017, the university entered into a new food service contract with Chartwells which resulted in an additional $4.8 million in unearned revenue related to unamortized leasehold improvements made by the vendor.
15

In fiscal years 2017 and 2016, $10.9 million and $21.7 million of deferred inflows were reported respectively, which represent the acquisition of net position in one period that is applicable to future periods, and is primarily due to GASB Statement No. 68. Additionally, GASB Statement No. 68 resulted in a net pension liability for fiscal years 2017 and 2016 in the amounts of $162.3 million and $28.5 million, respectively. Net position represents the residual interest in the university’s assets and deferred outflows after liabilities and deferred inflows are deducted. The university’s net position as of June 30, 2017, 2016, and 2015 follows:
2017 2016 2015Net investment in capital assets $ 160,051 $ 163,270 $ 168,285 Restricted expendable, bond covenants 8,350 9,225 8,865 Restricted expendable, other 9,441 9,703 10,176 Unrestricted (44,005) (28,244) (35,438) Total Net Position $ 133,837 $ 153,954 $ 151,888
(In Thousands)
Net investment in capital assets represents the university’s capital assets net of accumulated depreciation and outstanding principal balances of debt attributable to the acquisition, construction or improvement of those assets. Restricted net position primarily includes donations received for specific purposes, capital projects, bond covenants, and debt service. CAPITAL AND DEBT ACTIVITIES One of the critical factors in maintaining the quality of the university’s academic programs and student life programs is the development and renewal of its property, plant, and equipment. The university continues to implement its comprehensive facilities plan to update its older facilities, balanced with new construction. Capital assets, net of accumulated depreciation, totaled $236.6 million as of June 30, 2017. This represents a decrease of $6.8 million compared to June 30, 2016 and a decrease of $20.5 million compared to June 30, 2015. Capital outlays primarily consist of recently completed replacement and renovation of existing facilities, as well as investments in equipment and library materials. Capital outlays totaled $10.0 million in fiscal year 2017, an increase of $6.8 million from fiscal year 2016. The increase primarily resulting from the capitalization of $5.2 million in leasehold improvements made by the new food service vendor during fiscal year 2017. Other significant capital outlays made in fiscal year 2017 include Mitchell Hall plumbing upgrades of $1.2 million, Stewart Hall exterior brick replacement of $1.2 million and $0.7 million for the five year extension of the Welcome Center capital lease. Long-term debt payable on June 30, 2017 consisted primarily of $21.8 million of general obligation bonds and $35.8 million of revenue bonds. The general obligation bonds are issued to finance construction of buildings and repairs. Revenue bonds are issued for the construction and maintenance of revenue producing facilities such as residence halls, a student union, and parking ramps. Additional information on capital asset and debt activities can be found in Notes 6 and 8 in the financial statements.
16

STATEMENTS OF REVENUES, EXPENSES AND CHANGES IN NET POSITION The statements of revenues, expenses and changes in net position represent the university’s results of operations for the year. Users of these statements should note that GASB requires classification of state appropriations and federal and state grants as non-operating revenues. A summary of the university’s statements of revenues, expenses and changes in net position as of June 30, 2017, 2016 and 2015 follows:
2017 2016 2015Operating revenues: Tuition and fees, net $ 70,670 $ 70,499 $ 67,971 Room and board, net 17,814 17,792 17,206 Sales and services, net 12,742 12,271 10,804 Other income 2,684 1,135 2,523 Total operating revenues 103,910 101,697 98,504
Nonoperating revenues and other revenues: State appropriations 62,979 63,939 61,193 Capital appropriations 1,751 1,583 1,534 Grants 31,437 32,006 33,725 Other 613 531 573 Total nonoperating and other revenues 96,780 98,059 97,025 Total revenues 200,690 199,756 195,529
Operating expenses: Salaries and benefits 157,789 134,105 139,103 Depreciation 16,847 16,410 16,634 Financial aid, net 3,535 3,337 3,400 Other 38,451 39,356 39,234 Total operating expenses 216,622 193,208 198,371
Nonoperating and other expenses: Interest expense 3,353 3,532 3,498 Other 832 950 548 Total nonoperating and other expenses 4,185 4,482 4,046 Total expenses 220,807 197,690 202,417
Change in net position (20,117) 2,066 (6,888) Net position, beginning of year 153,954 151,888 208,887 Cumulative effect of change in accounting principle - - (50,111) Net position, beginning of year, as restated 153,954 151,888 158,776 Net position, end of year $ 133,837 $ 153,954 $ 151,888
(In Thousands)
Tuition and state appropriations are the primary sources of funding for the university’s academic programs. Gross tuition revenue decreased $1.4 million to $84.2 million in fiscal year 2017 as a result of a 3.0 percent decrease in enrollment and flat tuition rates. This follows an increase of $2.8 million in fiscal year 2016 as a net result of flat enrollment and a 3.4 percent increase in tuition rates. State appropriations totaled $63.0 million in fiscal year 2017, a decrease of $1.0 million over fiscal year 2016 and an increase of $1.8 million over fiscal year 2015.
17
Operating expenses as of June 30, 2017 increased by $23.4 million over fiscal year 2016 due primarily to the allocation of fringe pension benefit expenses related to GASB Statement No. 68, an increase to fiscal year 2017 of $21.0 million and a decrease to fiscal year 2016 of $4.7 million. Excluding the GASB Statement No. 68 effect, the resources expended for employee compensation and benefits totaled $136.8 million for the fiscal year ended June 30, 2017, which represents a decrease of $2.0 million over fiscal year 2016. This change in compensation is due to a decrease of 38.9 full time equivalent employees in fiscal year 2017 and offset by increases in bargaining unit contracts. FOUNDATION The St. Cloud State University Foundation, Inc. is a component unit of St. Cloud State University. As such, the separately audited financial statements for the foundation are included, but shown separately from those of the university in compliance with the requirements of GASB Statement No. 39. Additional information regarding the foundation can be found in Note 18 to the financial statements. ECONOMIC FACTORS THAT WILL AFFECT THE FUTURE Enrollment growth at both the undergraduate and graduate levels through new academic program development that aligns with current academic strengths and strong student and market demand is critical to the future vitality of the institution. Growth through gains in student credit-taking behavior and retention and persistence will be additional, key contributors to our enrollment and financial stability and eventual growth. Expanding our footprint through programs at the St. Cloud State at Plymouth location and through onsite 2+2 programs at our partner 2-year community colleges, as well as on-line and alternative delivery, will provide additional points of access for students and increased enrollment for the university. State capital appropriations will remain a critical funding source to sustain the physical and technological infrastructure of the university. The development of additional alternative revenue sources through applied research grants and contracts from industry partners will be key, as will expanding private funding through external grants and private fundraising. The Foundation continues preparation for a comprehensive campaign to tie in with the university’s Sesquicentennial Celebration in 2019. REQUESTS FOR INFORMATION This financial report is designed to provide a general overview of St. Cloud State University’s finances for all those with an interest. Questions concerning any of the information provided in this report or requests for additional financial information should be addressed to: Director, Business Services St. Cloud State University
720 Fourth Avenue South, AS 205 St. Cloud, MN 56301-4498
18

STATEMENTS OF NET POSITIONAS OF JUNE 30, 2017 AND 2016(IN THOUSANDS)
Assets 2017 2016Current Assets
Cash and cash equivalents $ 58,289 $ 57,879 Investments 2,317 2,320 Grants receivable 1,026 1,204 Accounts receivable, net 7,111 6,047 Prepaid expense 3,262 2,858 Inventory and other assets 197 305 Student loans, net 1,000 1,050
Total current assets 73,202 71,663 Current Restricted Cash and Cash Equivalents 7,488 8,119 Noncurrent Restricted Assets
Construction in progress 801 3,183 Total noncurrent restricted assets 801 3,183
Total restricted assets 8,289 11,302 Noncurrent Assets
Student loans, net 4,916 4,847 Capital assets, net 235,813 240,226
Total noncurrent assets 240,729 245,073 Total Assets 322,220 328,038
Deferred Outflows of Resources 110,357 8,566 Total Assets and Deferred Outflows of Resources 432,577 336,604
LiabilitiesCurrent Liabilities
Salaries and benefits payable 12,846 14,168 Accounts payable and other liabilities 3,082 4,891 Unearned revenue 8,590 4,183 Payable from restricted assets 81 356 Interest payable 363 383 Funds held for others 570 641 Current portion of long-term debt 8,420 8,399 Other compensation benefits 2,109 2,086
Total current liabilities 36,061 35,107 Noncurrent Liabilities
Noncurrent portion of long-term debt 66,478 74,822 Other compensation benefits 17,646 17,209 Net pension liability 162,258 28,477 Capital contributions payable 5,365 5,338
Total noncurrent liabilities 251,747 125,846 Total Liabilities 287,808 160,953
Deferred Inflows of Resources 10,932 21,697 Total Liabilities and Deferred Inflows of Resources 298,740 182,650
Net PositionNet investment in capital assets 160,051 163,270 Restricted expendable, bond covenants 8,350 9,225 Restricted expendable, other 9,441 9,703 Unrestricted (44,005) (28,244)
Total Net Position $ 133,837 $ 153,954
The notes are an integral part of the financial statements.
ST. CLOUD STATE UNIVERSITY
19

ST. CLOUD STATE UNIVERSITY FOUNDATION, INC.STATEMENTS OF FINANCIAL POSITIONAS OF JUNE 30, 2017 AND 2016(IN THOUSANDS)
2017 2016AssetsCurrent Assets
Cash and cash equivalents $ 113 $ 561 Investments 38,108 33,758 Restricted cash and cash equivalents 1,022 1,022 Pledges and contributions receivable 417 420 Other receivables 151 70 Accrued investment/Interest income 38 43 Finance lease receivable from university 945 910
Total current assets 40,794 36,784
Noncurrent AssetsLong-term pledges receivable 658 1,009 Finance lease receivable, net 3,938 4,883 Annuities/Remainder interests/Trusts 330 321 Property and equipment, net 208 231
Total noncurrent assets 5,134 6,444 Total Assets $ 45,928 $ 43,228
Liabilities and Net AssetsCurrent Liabilities
Accounts payable $ 92 $ 118 Interest payable 38 47 Annuities payable 46 45 Notes payable - 1,201 Bonds payable 945 910 Funds held for others 996 94
Total current liabilities 2,117 2,415
Noncurrent LiabilitiesAnnuities payable 275 278 Bonds payable 5,372 6,387
Total noncurrent liabilities 5,647 6,665 Total Liabilities 7,764 9,080
Net AssetsUnrestricted 2,645 1,709 Temporarily restricted 16,101 13,822 Permanently restricted 19,418 18,617
Total Net Assets 38,164 34,148 Total Liabilities and Net Assets $ 45,928 $ 43,228
The notes are an integral part of the financial statements.
20

ST. CLOUD STATE UNIVERSITYSTATEMENTS OF REVENUES, EXPENSES, AND CHANGES IN NET POSITIONFOR THE YEARS ENDED JUNE 30, 2017 AND 2016(IN THOUSANDS)
2017 2016Operating Revenues
Tuition, net $ 58,529 $ 58,776Fees, net 8,912 8,379Sales, net 14,255 13,305Restricted student payments, net 19,530 20,102Other income 2,684 1,135
Total operating revenues 103,910 101,697
Operating ExpensesSalaries and benefits 157,789 134,105 Purchased services 21,520 22,402 Supplies 6,609 7,092 Repairs and maintenance 1,864 1,743 Depreciation 16,847 16,410 Financial aid, net 3,535 3,337 Other expense 8,458 8,119
Total operating expenses 216,622 193,208 Operating loss (112,712) (91,511)
Nonoperating Revenues (Expenses)Appropriations 62,979 63,939 Federal grants 19,060 19,978 State grants 9,642 8,857 Private grants 2,735 3,171 Interest income 607 531 Interest expense (3,353) (3,532) Grants to other organizations (832) (651)
Total nonoperating revenues (expenses) 90,838 92,293
Income (Loss) Before Other Revenues, Expenses, Gains, or Losses (21,874) 782
Capital appropriations 1,751 1,583 Gain (loss) on disposal of capital assets 6 (299)
Change in net position (20,117) 2,066
Total Net Position, Beginning of Year 153,954 151,888 Total Net Position, End of Year $ 133,837 $ 153,954
The notes are an integral part of the financial statements.
21

ST. CLOUD STATE UNIVERSITY FOUNDATION, INC.STATEMENTS OF ACTIVITIESFOR THE YEARS ENDED JUNE 30, 2017 AND 2016(IN THOUSANDS)
UnrestrictedTemporarily Restricted
Permanently Restricted
2017 Total
2016 Total
Support and RevenueContributions $ 208 $ 1,833 $ 989 $ 3,030 $ 3,131 In-kind contributions 2,162 - - 2,162 2,097 Investment income 348 654 6 1,008 849 Realized gains (losses) 55 382 3 440 (1,060) Unrealized gains (losses) 319 2,192 20 2,531 (14) Transfers 306 (89) (217) - - Net assets released from restrictions 2,693 (2,693) - - -
Total support and revenue 6,091 2,279 801 9,171 5,003
Expenses Program services
Program services 446 - - 446 430 Scholarships 2,195 - - 2,195 2,422 Total program services 2,641 - - 2,641 2,852
Supporting servicesInterest expense 194 - - 194 239 Management and general 1,449 - - 1,449 1,391 Fundraising 871 - - 871 932 Total supporting services 2,514 - - 2,514 2,562 Total expenses 5,155 - - 5,155 5,414
Change in Net Assets 936 2,279 801 4,016 (411)
Net Assets, Beginning of Year 1,709 13,822 18,617 34,148 34,559 Net Assets, End of Year $ 2,645 $ 16,101 $ 19,418 $ 38,164 $ 34,148
The notes are an integral part of the financial statements.
22

ST. CLOUD STATE UNIVERSITY FOUNDATION, INC.STATEMENTS OF ACTIVITIESFOR THE YEAR ENDED JUNE 30, 2016(IN THOUSANDS)
UnrestrictedTemporarily Restricted
Permanently Restricted
2016 Total
Support and RevenueContributions $ 213 $ 2,345 $ 573 $ 3,131 In-kind contributions 2,097 - - 2,097 Investment income 344 499 6 849 Realized losses (13) (1,024) (23) (1,060) Unrealized losses (1) (12) (1) (14) Transfers 300 (294) (6) - Net assets released from restrictions 3,500 (3,500) - -
Total support and revenue 6,440 (1,986) 549 5,003
Expenses Program services
Program services 430 - - 430 Scholarships 2,422 - - 2,422 Total program services 2,852 - - 2,852
Supporting servicesInterest expense 239 - - 239 Management and general 1,391 - - 1,391 Fundraising 932 - - 932 Total supporting services 2,562 - - 2,562 Total expenses 5,414 - - 5,414
Change in Net Assets 1,026 (1,986) 549 (411)
Net Assets, Beginning of Year 683 15,808 18,068 34,559 Net Assets, End of Year $ 1,709 $ 13,822 $ 18,617 $ 34,148
The notes are an integral part of the financial statements.
23

ST. CLOUD STATE UNIVERSITYSTATEMENTS OF CASH FLOWSFOR THE YEARS ENDED JUNE 30, 2017 AND 2016(IN THOUSANDS)
2017 2016Cash Flows from Operating Activities
Cash received from customers $ 101,896 $ 100,468 Cash repayment of program loans 939 1,036 Cash paid to suppliers for goods or services (40,156) (38,378) Cash payments for employees (137,923) (138,398) Financial aid disbursements (3,503) (3,428) Cash payments for program loans (1,041) (1,071)
Net cash flows used in operating activities (79,788) (79,771)
Cash Flows from Noncapital Financing ActivitiesAppropriations 62,979 63,939 Agency activity (71) 43 Federal grants 20,229 18,464 State grants 9,642 8,857 Private grants 1,839 3,426 Grants to other organizations (832) (651)
Net cash flows provided by noncapital financing activities 93,786 94,078
Cash Flows from Capital and Related Financing ActivitiesInvestment in capital assets (4,664) (2,963) Capital appropriation 1,751 1,583 Proceeds from sale of capital assets 42 189 Proceeds from borrowing 4 177 Proceeds from bond premium 1 30 Interest paid (3,266) (3,387) Repayment of lease principal (3,965) (4,002) Repayment of bond principal (4,428) (4,256)
Net cash flows used in capital and related financing activities (14,525) (12,629)
Cash Flows from Investing ActivitiesProceeds from sales and maturities of investments 964 1,881 Purchase of investments (976) (1,836) Investment earnings 318 184
Net cash flows provided by investing activities 306 229
Net Increase (Decrease) In Cash and Cash Equivalents (221) 1,907
Cash and Cash Equivalents, Beginning of Year 65,998 64,091 Cash and Cash Equivalents, End of Year $ 65,777 $ 65,998
The notes are an integral part of the financial statements.
24
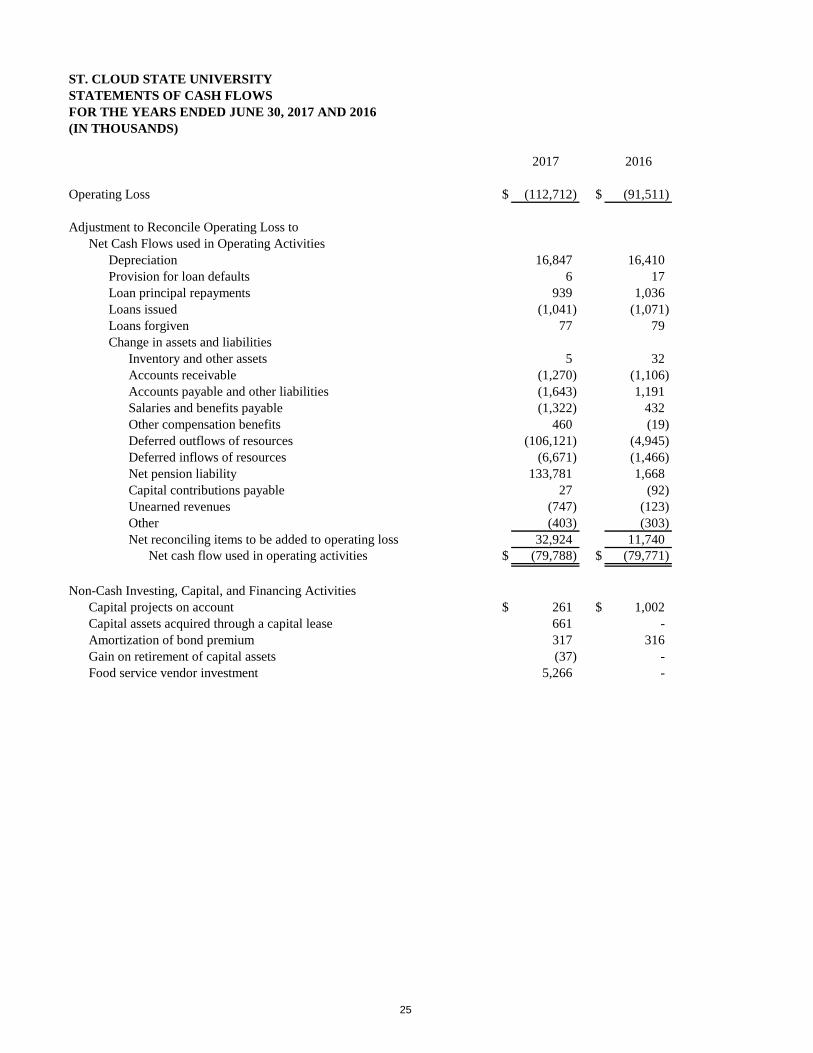
ST. CLOUD STATE UNIVERSITYSTATEMENTS OF CASH FLOWSFOR THE YEARS ENDED JUNE 30, 2017 AND 2016(IN THOUSANDS)
2017 2016
Operating Loss $ (112,712) $ (91,511)
Adjustment to Reconcile Operating Loss toNet Cash Flows used in Operating Activities
Depreciation 16,847 16,410 Provision for loan defaults 6 17 Loan principal repayments 939 1,036 Loans issued (1,041) (1,071) Loans forgiven 77 79 Change in assets and liabilities
Inventory and other assets 5 32 Accounts receivable (1,270) (1,106) Accounts payable and other liabilities (1,643) 1,191 Salaries and benefits payable (1,322) 432 Other compensation benefits 460 (19) Deferred outflows of resources (106,121) (4,945) Deferred inflows of resources (6,671) (1,466) Net pension liability 133,781 1,668 Capital contributions payable 27 (92) Unearned revenues (747) (123) Other (403) (303) Net reconciling items to be added to operating loss 32,924 11,740
Net cash flow used in operating activities $ (79,788) $ (79,771)
Non-Cash Investing, Capital, and Financing ActivitiesCapital projects on account $ 261 $ 1,002 Capital assets acquired through a capital lease 661 - Amortization of bond premium 317 316 Gain on retirement of capital assets (37) - Food service vendor investment 5,266 -
25

ST. CLOUD STATE UNIVERSITY NOTES TO THE FINANCIAL STATEMENTS FOR THE YEARS ENDED JUNE 30, 2017 AND 2016
1. SUMMARY OF SIGNIFICANT ACCOUNTING AND REPORTING POLICIES
Basis of Presentation — The reporting policies of St. Cloud State University, a member of Minnesota State Collegesand Universities (Minnesota State), conform to Generally Accepted Accounting Principles (GAAP) in the UnitedStates, as prescribed by the Governmental Accounting Standards Board (GASB). The statements of net position,statements of revenues, expenses and changes in net position, and statements of cash flows include financial activitiesof St. Cloud State University.
Financial Reporting Entity — Minnesota State is an agency of the state of Minnesota and receives appropriationsfrom the state legislature, substantially all of which are used to fund general operations. St. Cloud State Universityreceives a portion of the Minnesota State appropriation. The operations of most student organizations are included inthe reporting entity because the board of trustees has certain fiduciary responsibilities for these resources.
Minnesota State may finance the construction, renovation and acquisition of facilities for student residences andstudent unions through the sale of revenue bonds. These activities are accounted for and reported in the RevenueFund, a legally separate entity, and are also included here. Details on the Revenue Fund bonds are available in theseparately audited and issued Revenue Fund annual financial report. Copies are available from the FinancialReporting System Director, Minnesota State, 30 7th St. E., Suite 350, St. Paul, Minnesota 55101-7804.
Discretely presented component units are legally separate organizations that raise and hold economic resources forthe direct benefit of a college or university in accordance with GASB Statement No. 39, Determining WhetherCertain Organizations are Component Units. The St. Cloud State University Foundation, Inc. is consideredsignificant to the university and is included as a discretely presented component unit and separately identified in Note18. Complete financial statements may be obtained from the St. Cloud State University Foundation, Inc. Alumni andFoundation Center, 720 Fourth Avenue South, St. Cloud, MN 56301-4498.
Basis of Accounting — The basis of accounting refers to when revenues and expenses are recognized and reported in the financial statements. The accompanying financial statements have been prepared as a special purpose government entity engaged in business type activities. Business type activities are those that are financed in whole or in part by fees charged to external parties for goods or services. Accordingly, these financial statements have been presented using the economic resources measurement focus and the accrual basis of accounting. Revenues are recognized when earned and expenses are recognized as they are incurred. Eliminations have been made to minimize the double counting of internal activities. Interfund receivables and payables have been eliminated in the statements of net position.
Budgetary Accounting — University budgetary accounting, which is the basis for annual budgets and the allocation of state appropriations, differs from GAAP. University budgetary accounting includes all receipts and expenses up to the close of the books in August for the budget fiscal year. Revenues not yet received by the close of the books are not included. The criterion for recognizing expenses is the actual disbursement, not when the goods or services are received.
The state of Minnesota operates on a two year (biennial) budget cycle ending on June 30 of odd-numbered years. Minnesota State is governed by a 15 member board of trustees appointed by the Governor with the advice and consent of the state senate. The board approves the university biennial budget request and allocation as part of Minnesota State total budget.
Budgetary control is maintained at the university. The university President has the authority and responsibility to administer the budget and can transfer money between programs within the university without board approval. The budget of the university can be legally amended by the authority of the Vice Chancellor/Chief Financial Officer.
26

The state appropriations do not lapse at year end. Any unexpended appropriation from the first year of a biennium is available for the second year. Any unexpended balance may also carry over into future bienniums. Capital Appropriation Revenue — Minnesota State is responsible for paying one third of the debt service for certain general obligation bonds sold for capital projects, as specified in the authorizing legislation. The portion of general obligation bond debt service that is payable by the state of Minnesota is recognized by Minnesota State as capital appropriation revenue when the related expenses are incurred. Individual colleges and universities are allocated cash, capital appropriation revenue, and debt based on capital project expenses. Cash and Cash Equivalents — The cash balance represents cash in the state treasury and demand deposits in local bank accounts as well as cash equivalents. Cash equivalents are short term, highly liquid deposits having original maturities (remaining time to maturity at acquisition) of three months or less. Cash and cash equivalents include amounts in demand deposits with the Minnesota State Board of Investment, savings accounts, cash management pools, repurchase agreements, and money market funds.
Restricted cash is cash held for capital projects and cash in the Revenue Fund for capital projects and debt service. The Revenue Fund is used to account for the revenues, expenses and net position of revenue producing facilities which are supported through usage. It has the authority to sell revenue bonds for the construction and maintenance of revenue producing facilities. All balances related to the state appropriation, tuition revenues, and most fees are in the state treasury. The university also has two accounts in a local bank. The activities handled through the local bank include financial aid, student payroll, auxiliary, and student activities. Investments — Investments are reported at fair value. Receivables — Receivables are shown net of an allowance for uncollectible accounts. Inventories — Inventories are valued at cost using the first in, first out method. Prepaid Expense — Prepaid expense consists primarily of deposits in the state of Minnesota Debt Service Fund for future general obligation bond payments. Capital Assets — Capital assets are recorded at cost or, for donated assets, at fair value at the date of acquisition. Estimated historical cost has been used when actual cost is not available. Such assets are depreciated or amortized on a straight line basis over the useful life of the assets. Estimated useful lives are as follows:
Asset Type Useful Life Buildings 35-40 years Building improvements 5-20 years Equipment 3-20 years Library collections 7 years
Equipment includes all items purchased with an original cost of $10,000 and over. Buildings and building improvements include all projects with a cost of $250,000 and over for projects started since July 1, 2008, and $100,000 and over for projects started prior to July 1, 2008. All land and library collection purchases are capitalized regardless of amount spent.
Funds Held for Others — Funds held for others are assets primarily held in a custodial capacity such as student organizations, student loans and other clearing accounts that serve as a flow-through conduit. Unearned Revenue — Unearned revenue consists primarily of tuition received, but not yet earned, for summer and fall term. It also includes room deposits, amounts received from grants that have not yet been earned under the terms of the agreement, and advanced athletic ticket revenue received. In fiscal year 2017 $4,836,971 was recorded for food service vendor capital improvements that will benefit the university revenues over the next several years. The amount of revenue recognized in fiscal year 2017 was $428,529.
27

Long Term Liabilities — The state of Minnesota appropriates for and sells general obligation bonds to support construction and renovation of the Minnesota State facilities as approved through the state’s capital budget process. The university is responsible for a portion of the debt service on the bonds sold for some of its projects. The university may sell revenue bonds and may also enter into capital lease agreements for certain capital assets. Other long term liabilities include compensated absences, net pension liability, net other postemployment benefits, early termination benefits, notes payable and capital contributions associated with Perkins Loan agreements with the United States Department of Education. Deferred Outflows and Deferred Inflows of Resources — Deferred outflows of resources represent the consumption of net position by the university in one period that is applicable to future periods. Deferred inflows of resources represent the acquisition of net position that is applicable to future periods. Deferred outflows and inflows are related to defined benefit pension plans, and to economic gains/losses related to revenue fund and general obligation bond refunding, which is the difference in the carrying value of the refunded debt and its reacquisition price.
The following tables summarize the university’s deferred outflows and inflows:
Deferred Deferred Outflows Inflows
of Resources of ResourcesRelated to Pensions:Differences between projected and actual investment earnings $ 7,131 $ - Changes in actuarial assumptions 100,251 5,412 Contributions paid to pension plans subsequent to the measurement date 2,155 - Differences between expected and actual experience 630 2,905 Changes in proportion 168 2,147 Total related to pensions 110,335 10,464 Related to Refunding:Economic loss on refunding of revenue bonds 22 - Economic gain on refunding of general obligation bonds - 468 Total $ 110,357 $ 10,932
(In Thousands)Year Ended June 30, 2017
Deferred Deferred Outflows Inflows
of Resources of ResourcesRelated to Pensions:Differences between projected and actual investment earnings $ 4,329 $ 8,397 Changes in actuarial assumptions 1,097 8,259 Contributions paid to pension plans subsequent to the measurement date 2,152 - Differences between expected and actual experience 713 3,936 Changes in proportion 251 870 Total related to pensions 8,542 21,462 Related to Refunding:Economic loss on refunding of revenue bonds 24 - Economic gain on refunding of general obligation bonds - 235 Total $ 8,566 $ 21,697
(In Thousands)Year Ended June 30, 2016
28

Operating Activities — Operating activities as reported in the statements of revenues, expenses, and changes in net position are those that generally result from exchange transactions such as payments received for providing services and payments made for services or goods received. Nearly all of the university’s expenses are from exchange transactions. Certain significant revenue streams relied upon for operations are recorded as nonoperating revenues, including state appropriations, federal, state and private grants and investment income. Tuition, Fees, and Sales, Net — Tuition, fees, and sales are reported net of scholarship allowances. Sales consist of room, board and other miscellaneous sales and services. Note 12 to the financial statements provides additional information. Restricted Student Payments — Restricted student payments consist of room, board, sales, and fee revenue restricted for payment of revenue bonds, and are net of scholarship allowances. Note 12 to the financial statements provides additional information. Federal Grants — The university participates in several federal grant programs. The largest programs include Pell, Supplemental Educational Opportunity Grant and Federal Work Study. Federal Grant revenue is recognized as nonoperating revenue in accordance with GASB Statement No. 33, Accounting and Financial Reporting for Nonexchange Transactions. Expenditures under government contracts are subject to review by the granting authority. To the extent, if any, that such a review reduces expenditures allowable under these contracts, the university will record such disallowance at the time the determination is made.
Defined Benefit Pensions — For purposes of measuring the net pension liability, deferred outflows and deferred inflows of resources related to pensions, and pension expense, information about the fiduciary net position of the plans and additions to and deductions from the plan’s fiduciary net position have been determined on the same basis as they are reported by the plans. For this purpose, plan contributions are recognized as of the employer payroll paid dates and benefit payments (including refunds of employee contributions) are recognized when due and payable in accordance with the benefit terms. Investments are reported at fair value. The actuarially derived net pension liability, deferred outflows, and deferred inflows of resources can vary between years due to actuarial assumption changes, which can result in significant variability between years. For the years ended June 30, 2017 and 2016, the university recognized an increase of pension expense of $23,503,905 and a decrease in pension expense of $2,614,939, respectively.
Use of Estimates — To prepare the basic financial statements in conformity with generally accepted accounting principles management must make estimates and assumptions. These estimates and assumptions may affect the reported amounts of assets and liabilities and disclosure of contingent assets and liabilities, at the date of the financial statements, and the reported amounts of revenues and expenses during the reporting period. Actual results could differ from those estimates. The most significant areas that require the use of management’s estimates relate to compensated absences, allowances for uncollectible accounts, and scholarship allowances. Net Position — The difference between assets and deferred outflows and liabilities and deferred inflows is net position. Net position is further classified for accounting and reporting purposes into the following three net position categories:
• Net investment in capital assets: capital assets, net of accumulated depreciation and outstanding
principal balances of debt and other borrowing attributable to the acquisition, construction or improvement of those assets.
29

• Restricted expendable: net position subject to externally imposed stipulations. Net position restrictions for the university are as follows:
Restricted for bond covenants — revenue bond restrictions Restricted for other — includes restrictions for the following:
Capital projects — restricted for completion of capital projects Debt service — legally restricted for bond debt repayment Donations — restricted per donor requests Faculty contract obligations — faculty development and travel required by contracts Loans — university capital contribution for Perkins loans
Capital projects $ - $ 347 Debt service 6,451 6,394 Donations 282 394 Faculty contract obligations 2,054 1,926 Loans 654 642 Total $ 9,441 $ 9,703
Year Ended June 30(In Thousands)
2017 2016
Net Position Restricted for Other
• Unrestricted: net position that is not subject to externally imposed stipulations. Unrestricted net position may be designated for specific purposes by action of management, the System Office, or the board of trustees.
New Accounting Standards — In June, 2015 the GASB issued Statement No. 75, Accounting and Financial Reporting for Postemployment Benefits Other Than Pensions, which establishes standards for recognizing and measuring liabilities, deferred outflows and inflows of resources, and expense. For defined benefit other postemployment benefits (OPEB), the Statement identifies the methods and assumptions that are required to be used to project benefit payments, discounted projected benefit payments to the actuarial present value and attribute that present value to periods of employee service. Note disclosure and required supplementary information requirements about defined benefit OPEB also are addressed. Statement No. 75 is effective for the fiscal year beginning July 1, 2017. The effect GASB Statement No. 75 will have on the fiscal year 2018 financial statements has not yet been determined. In November, 2016 the GASB issued Statement No. 83, Certain Assets Retirement Obligations, which establishes accounting and financial reporting for certain asset retirement obligations. Statement No. 83 is effective for the fiscal year beginning July 1, 2018. The effect GASB Statement No. 83 will have on the fiscal year 2019 financial statements has not yet been determined. In January, 2017 the GASB issued Statement No. 84, Fiduciary Activities, which establishes standards of accounting and financial reporting for fiduciary activities. Statement No. 84 is effective for the fiscal year beginning July 1, 2019. The effect GASB Statement No. 84 will have on the fiscal year 2020 financial statements has not yet been determined. In March, 2017 the GASB issued Statement No. 85, Omnibus 2017, which establishes accounting and financial reporting requirements for blending component units, goodwill, fair value measurement and application, and postemployment benefits (pensions and other postemployment benefits). Statement No. 85 is effective for the fiscal year beginning July 1, 2017. The effect GASB Statement No. 85 will have on the fiscal year 2018 financial statements has not yet been determined.
30

In May, 2017 the GASB issued Statement No. 86, Certain Debt Extinguishment Issues, which establishes accounting and financial reporting for in-substance defeasance transactions in which cash and other monetary assets acquired with only existing resources are placed in an irrevocable trust for the purpose of extinguishing debt. This statement also amends accounting and financial reporting requirements for prepaid insurance associated with debt that is extinguished, whether through a legal extinguishment or through an in-substance defeasance, regardless of how the cash and other monetary assets were acquired. Statement No. 86 is effective for the fiscal year beginning July 1, 2017. The effect GASB Statement No. 86 will have on the fiscal year 2018 financial statements has not yet been determined.
In June, 2017 the GASB issued Statement No. 87, Leases, which establishes accounting and financial reporting for leases by lessees and lessors. This statement requires recognition of certain lease assets and liabilities for leases that previously were classified as operating leases. It establishes a single model for lease accounting based on the foundational principle that leases are financings of the right to use an underlying asset. Under this statement, a lessee is required to recognize a lease liability and an intangible right to use the lease asset, and a lessor is required to recognize a lease receivable and a deferred inflow of resources. Statement No. 87 is effective for the fiscal year beginning July 1, 2020. The effect GASB Statement No. 87 will have on the fiscal year 2021 financial statements has not yet been determined. Reclassifications — Certain prior year amounts have been reclassified to conform to current year presentation. These classifications had no effect on net position previously reported.
2. CASH, CASH EQUIVALENTS, AND INVESTMENTS
Cash and Cash Equivalents — All balances related to the state appropriation, tuition, and most fees are in the state treasury. In addition, the university has two accounts in a local bank. The activities handled through the local bank include financial aid, student payroll, auxiliary, and student activities. Minnesota Statute, Section 118A.03, requires that deposits be secured by depository insurance or a combination of depository insurance and collateral securities held in the state’s name by an agent of the state. This statute further requires that such insurance and collateral shall be at least 10 percent greater than the amount on deposit. The following table summarizes cash and cash equivalents:
Carrying AmountCash and repurchase agreements $ 6,225 $ 4,702 Cash in bank- Foreign currencies 121 128 Change fund 25 25 Cash, trustee account (US Bank) 3,627 3,628 Total local cash and cash equivalents 9,998 8,483 Total treasury cash accounts 55,779 57,515 Grand Total $ 65,777 $ 65,998
Year Ended June 30(In Thousands)
2017 2016
At June 30, 2017 and 2016, the university’s bank balances were $7,555,959 and $5,177,282, respectively. These balances were adjusted by items in transit to arrive at the university’s cash in bank balance. The university’s balance in the state treasury is invested by the Minnesota State Board of Investment as part of the state investment pool. This asset is reported as a cash equivalent. The university’s excess cash in the local bank is swept nightly to purchase interest bearing cash equivalents. As of June 30, 2017 and 2016, the university had $6,653,509 and $4,529,140, respectively, in repurchase agreements. The cash accounts are invested in short term, liquid, high quality debt securities.
31

Foreign Currency Risk — Foreign currency risk is the risk that changes in exchange rates will adversely affect the fair value of an investment or a deposit. The university has foreign checking accounts, denominated entirely in British Pounds. At June 30, 2017 and 2016, the fair value in U.S. Dollars is $120,543 and $128,095, respectively.
Investments — The Minnesota State Board of Investment manages the majority of the state’s investments. All investments managed by Minnesota State Board of Investment are governed by Minnesota Statutes, Chapters 11A and 356A. Minnesota Statute, Section 11A.24, broadly restricts investments to obligations and stocks of United States and Canadian governments, their agencies and registered corporations, other international securities, short term obligations of specified high quality, and restricted participation as a limited partner in venture capital, real estate, or resource equity investments, and restricted participation in registered mutual funds. Generally, when applicable, the statutes limit investments to those rated within the top four quality rating categories of a nationally recognized rating agency. The statutes further prescribe the maximum percentage of fund assets that may be invested in various asset classes and contain specific restrictions to ensure the quality of the investments.
Within statutory parameters, the Minnesota State Board of Investment has established investment guidelines and benchmarks for all funds under its management. These investment guidelines and benchmarks are tailored to the particular needs of each fund and specify investment objectives, risk tolerance, asset allocation, investment management structure, and specific performance standards. Custodial Credit Risk — Custodial credit risk for investments is the risk that in the event of a failure of the counterparty, the university will not be able to recover the value of the investments that are in the possession of an outside party. Board procedure 7.5.1 requires compliance with Minnesota Statute, Section 118A.03, and further excludes the use of FDIC insurance when meeting collateral requirements. Credit Risk — Credit risk is the risk that an issuer or other counterparty to an investment will not fulfill its obligations. The university’s policy for reducing its exposure to credit risk is to comply with Minnesota Statute, Section 118A.04. This statute limits investments to the top quality rating categories of a nationally recognized rating agency. At June 30, 2017 and 2016, the university’s debt securities were rated equivalent to Standard and Poor’s AA or higher. Concentration of Credit Risk — Concentration of credit risk is the risk of loss attributed to the magnitude of a government’s investment in a single issuer. The university’s policy for reducing this risk of loss is to comply with Board procedure 7.5.1 which recommends investments be diversified by type and issuer. Interest Rate Risk — Interest rate risk is the risk that changes in interest rates will adversely affect the fair value of an investment. The university complies with Board procedure 7.5.1 that recommends considering fluctuation interest rates and cash flow needs when purchasing short-term and long-term investments. The inputs used to measure fair value are categorized into the following three categories:
• Level 1 – Inputs that reflect unadjusted quoted prices in active markets for identical investments, such as stocks, corporate and government bonds.
• Level 2 – Inputs, other than quoted prices, that are observable for the asset or liability either directly or
indirectly, including inputs from markets that are not considered to be active.
• Level 3 – Inputs that are unobservable and significant to the fair value measurement.
32

The university had the following investments and maturities:
Investment Type Fair Value
Weighted Maturity (Years) Level 1 Level 2 Level 3
U.S. agencies $ 2,317 1.34 x
Investment Type Fair Value
Weighted Maturity (Years) Level 1 Level 2 Level 3
U.S. agencies $ 2,320 2.00 x
Year Ended June 30, 2017(In Thousands)
Year Ended June 30, 2016(In Thousands)
3. ACCOUNTS RECEIVABLE The accounts receivable balances are made up primarily of receivables from individuals and businesses. At June 30, 2017 and 2016, the total accounts receivable balances for the university were $9,714,698 and $10,430,093, respectively, less an allowance for uncollectible receivables of $2,603,717 and $4,383,458, respectively. Analysis of historical accounts receivable collections led to a change in estimate and a significant reduction in estimated uncollectible receivables.
The following table summarizes accounts receivable:
2017 2016Tuition $ 3,518 $ 4,423 Room and board 1,947 2,191 Fees 1,366 1,329 Sales and service 961 731 Due from Foundation 896 - Other income 1,027 1,756 Total accounts receivable 9,715 10,430 Allowance for doubtful accounts (2,604) (4,383) Net accounts receivable $ 7,111 $ 6,047
Year Ended June 30(In Thousands)
The allowance for uncollectible accounts has been computed based on the following aging schedule:
YearAllowance
Amount YearAllowance
AmountAllowance Percentage
Summer 2016 $ 45 10 Less than 1 year $ 504 15 2016 946 25 1 to 3 years 1,017 45 2015 628 50 3 to 5 years 825 70 2014 704 80 Over 5 years 258 95 2013 and before 2,060 100 Total $ 2,604 Total $ 4,383
Allowance Percentage
Fiscal Year 2017 (In Thousands)
Fiscal Year 2016 (In Thousands)
33

4. PREPAID EXPENSE Prepaid expense consists primarily of funds which have been deposited in the state’s Debt Service Fund for future general obligation bond payments in the amounts of $2,661,835 and $2,594,181 for fiscal years 2017 and 2016, respectively. Minnesota Statute, Section 16A.641, requires all state agencies to have on hand at December 1, of each year, an amount sufficient to pay all general obligation bond principal and interest due, and to become due, through July 1 of the second year. Also, included in prepaid expense for fiscal years 2017 and 2016 was $419,635 and $263,968, respectively, stemming from prepaid software maintenance agreements, primarily for software fees. In fiscal year 2017 there was also an additional $180,927 prepayment for equipment not yet delivered.
5. LOANS RECEIVABLE
Loans receivable balances consist primarily of loans under the Federal Perkins Loan Program. The federal government provides most of the funding for the loans with amounts collected used for new loan advances. The university is responsible for loan collections. As of June 30, 2017 and 2016, the loans receivable for this program totaled $6,261,473 and $6,237,058, respectively, less an allowance for uncollectible loans of $345,447 and $339,884, respectively.
6. CAPITAL ASSETS
Summaries of changes in capital assets for fiscal years 2017 and 2016 follow:
Beginning Balance Increases Decreases
Completed Construction
Ending Balance
Capital assets, not depreciated: Land $ 13,591 $ - $ - $ - $ 13,591 Construction in progress 4,038 2,772 - (4,433) 2,377 Total capital assets, not depreciated 17,629 2,772 - (4,433) 15,968
Capital assets, depreciated: Buildings and improvements 386,313 5,926 - 4,433 396,672 Equipment 13,708 1,122 2,048 - 12,782 Library collections 5,319 203 755 - 4,767 Total capital assets, depreciated 405,340 7,251 2,803 4,433 414,221
Less accumulated depreciation: Buildings and improvements 166,269 15,362 - - 181,631 Equipment 10,152 804 2,077 - 8,879 Library collections 3,139 681 755 - 3,065 Total accumulated depreciation 179,560 16,847 2,832 - 193,575 Total capital assets depreciated, net 225,780 (9,596) (29) 4,433 220,646 Total capital assets, net $ 243,409 $ (6,824) $ (29) $ - $ 236,614
Year Ended June 30, 2017(In Thousands)
34
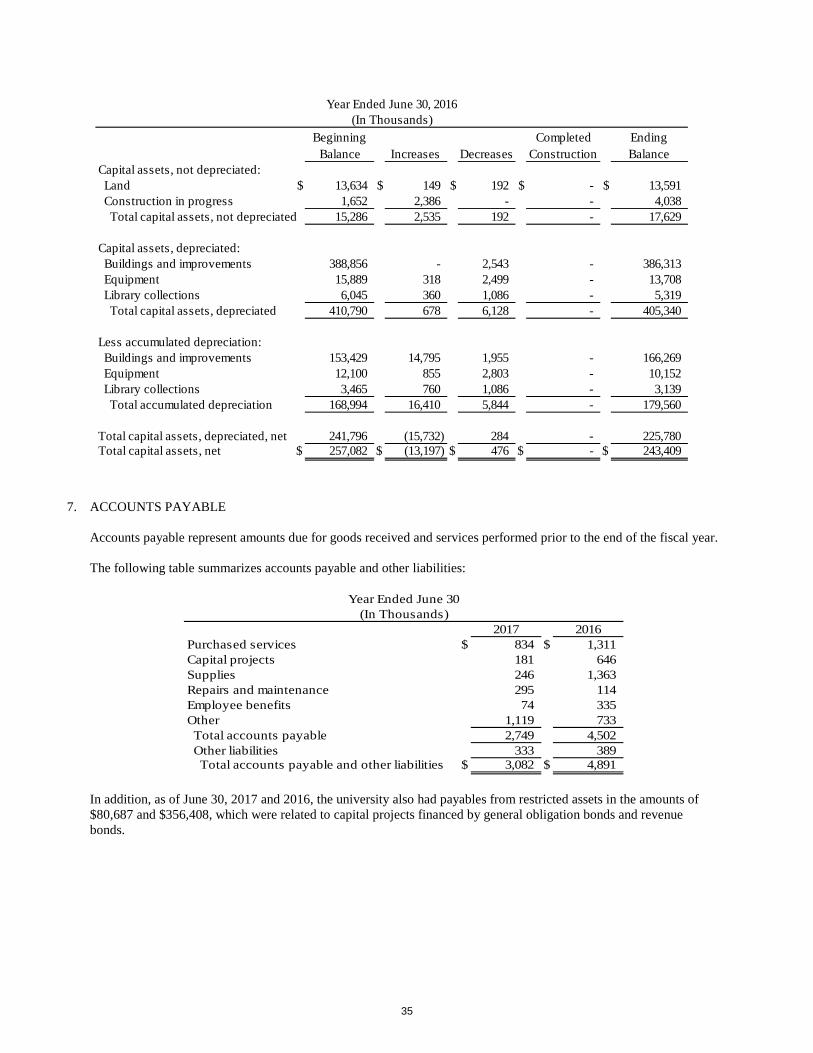
Beginning Balance Increases Decreases
Completed Construction
Ending Balance
Capital assets, not depreciated: Land $ 13,634 $ 149 $ 192 $ - $ 13,591 Construction in progress 1,652 2,386 - - 4,038 Total capital assets, not depreciated 15,286 2,535 192 - 17,629
Capital assets, depreciated: Buildings and improvements 388,856 - 2,543 - 386,313 Equipment 15,889 318 2,499 - 13,708 Library collections 6,045 360 1,086 - 5,319 Total capital assets, depreciated 410,790 678 6,128 - 405,340
Less accumulated depreciation: Buildings and improvements 153,429 14,795 1,955 - 166,269 Equipment 12,100 855 2,803 - 10,152 Library collections 3,465 760 1,086 - 3,139 Total accumulated depreciation 168,994 16,410 5,844 - 179,560 Total capital assets, depreciated, net 241,796 (15,732) 284 - 225,780 Total capital assets, net $ 257,082 $ (13,197) $ 476 $ - $ 243,409
Year Ended June 30, 2016(In Thousands)
7. ACCOUNTS PAYABLE Accounts payable represent amounts due for goods received and services performed prior to the end of the fiscal year. The following table summarizes accounts payable and other liabilities:
2017 2016Purchased services $ 834 $ 1,311 Capital projects 181 646 Supplies 246 1,363 Repairs and maintenance 295 114 Employee benefits 74 335 Other 1,119 733 Total accounts payable 2,749 4,502 Other liabilities 333 389 Total accounts payable and other liabilities $ 3,082 $ 4,891
Year Ended June 30(In Thousands)
In addition, as of June 30, 2017 and 2016, the university also had payables from restricted assets in the amounts of $80,687 and $356,408, which were related to capital projects financed by general obligation bonds and revenue bonds.
35

8. LONG TERM OBLIGATIONS Summaries of amounts due within one year are reported in the current liability section of the statements of net position.
The changes in long-term debt for fiscal years 2017 and 2016 follow:
Beginning Balance Increases Decreases
Ending Balance
Current Portion
Liabilities for: Bond premium $ 2,786 $ 1 $ 317 $ 2,470 $ - Capital leases 18,119 661 3,965 14,815 3,938 General obligation bonds 24,205 4 2,363 21,846 2,089 Revenue bonds 38,111 - 2,344 35,767 2,393 Total long-term debt $ 83,221 $ 666 $ 8,989 $ 74,898 $ 8,420
Beginning Balance Increases Decreases
Ending Balance
Current Portion
Liabilities for: Bond premium $ 3,072 $ 30 $ 316 $ 2,786 $ - Capital leases 22,121 - 4,002 18,119 3,965 General obligation bonds 26,372 177 2,344 24,205 2,089 Revenue bonds 40,456 - 2,345 38,111 2,345 Total long-term debt $ 92,021 $ 207 $ 9,007 $ 83,221 $ 8,399
Year Ended June 30, 2017(In Thousands)
Year Ended June 30, 2016(In Thousands)
The changes in other compensation benefits for fiscal years 2017 and 2016 follow:
Beginning Balance Increases Decreases
Ending Balance
Current Portion
Liabilities for: Compensated absences $ 15,280 $ 2,036 $ 1,788 $ 15,528 $ 1,832 Early termination benefits 298 277 298 277 277 Net other postemployment benefits 3,717 707 474 3,950 - Total other compensation benefits $ 19,295 $ 3,020 $ 2,560 $ 19,755 $ 2,109
Beginning Balance Increases Decreases
Ending Balance
Current Portion
Liabilities for: Compensated absences $ 15,836 $ 1,520 $ 2,076 $ 15,280 $ 1,788 Early termination benefits 142 298 142 298 298 Net other postemployment benefits 3,337 994 614 3,717 - Total other compensation benefits $ 19,315 $ 2,812 $ 2,832 $ 19,295 $ 2,086
Year Ended June 30, 2016(In Thousands)
Year Ended June 30, 2017(In Thousands)
36

Bond Premium — Bonds were issued in fiscal years 2017 and 2016, resulting in premiums of $1,284 and $29,704, respectively. Amortization is calculated using the straight line method and amortized over the average remaining life of the bonds. Capital Leases — Liabilities for capital leases include those leases that are generally defined as one that transfers benefits and risk of ownership to the lessee. Note 11 to the financial statements provides additional information. General Obligation Bonds — The state of Minnesota sells general obligation bonds to finance most of the Minnesota State capital projects. The interest rate on these bonds ranges from 2.0 to 5.5 percent. Minnesota State is responsible for paying one third of the debt service for certain general obligation bonds sold for those capital projects, as specified in the authorizing legislation. This debt obligation is allocated to the colleges and universities based primarily upon the specific projects funded. The general obligation bond liability included in these financial statements represents the university’s share. Revenue Bonds — The Revenue Fund is authorized by Minnesota Statute, Section 136F.98, to issue revenue bonds whose aggregate principal shall not exceed $405,000,000 at any time. The proceeds of these bonds are used to finance the acquisition, construction, and remodeling of buildings for residence hall, student union, parking ramp and other revenue-producing and related facilities at the state colleges and universities. Revenue bonds currently outstanding have interest rates between 1.0 percent and 5.0 percent. The revenue bonds are payable solely from, and collateralized by, an irrevocable pledge of revenues to be derived from the operation of the financed buildings and from student fees. These revenue bonds are payable through fiscal year 2034. Annual principal and interest payments on the bonds are expected to require less than 17.40 percent of net revenues. The total principal and interest remaining to be paid on the revenue bonds is $46,852,713. Principal and interest paid for the current year and total customer net revenues were $3,785,101 and $21,676.299 respectively. Compensated Absences — University employees accrue vacation, sick, and compensatory leave at various rates within limits specified in the collective bargaining agreements. The liability for compensated absences will be converted to a health care savings plan account or severance pay under specific conditions as defined in bargaining unit contracts. This leave is liquidated only at the time of termination from state employment.
Early Termination Benefits — Early termination benefits are benefits received for discontinuing service earlier than planned. Note 9 to the financial statements provides additional information. Net Other Postemployment Benefits — Other postemployment benefits are health insurance benefits for certain retired employees under a single employer fully insured plan. Under the health benefits program retirees are required to pay 100 percent of the total premium cost. Since the premium is a blended rate determined on the entire active and retiree population, the retirees are receiving an implicit rate subsidy. Note 10 to the financial statements provides additional information.
Net Pension Liability — The net pension liability of $162,257,628 and $28,477,355 at June 30, 2017 and 2016, respectively, is the proportionate share of the unfunded pension liability of the defined benefit pension plans as required by GASB Statement No. 68. Note 14 to the financial statements provides additional information. Capital Contributions — Liabilities of $5,365,199 and $5,337,779 at June 30, 2017 and 2016, respectively, represent the amount the university would owe the federal government if it were to discontinue the Perkins loan program. The net increase is $27,420 for fiscal year 2017. There was a net decrease of $91,712 for fiscal year 2016. Principal and interest payment schedules are provided in the following table for capital leases, general obligation bonds, and revenue bonds. Excluded from the table that follows is the unamortized bond premium of $2,469,801, which is amortized over the life of the bonds. There are no payment schedules for compensated absences, early termination benefits, net other postemployment benefits, net pension liability, or capital contributions.
37

Fiscal Years Principal Interest Principal Interest Principal Interest2018 $ 3,938 $ 1,231 $ 2,089 $ 883 $ 2,393 $ 1,366 2019 3,883 1,339 2,036 796 2,488 1,284 2020 3,855 1,438 1,892 718 2,565 1,193 2021 1,589 369 1,662 642 2,655 1,096 2022 1,146 115 1,567 574 2,744 992
2023-2027 404 140 7,048 1,912 10,272 3,618 2028-2032 - - 4,511 629 10,500 1,470 2033-2037 - - 1,041 38 2,150 65
Total $ 14,815 $ 4,632 $ 21,846 $ 6,192 $ 35,767 $ 11,084
Long-Term Debt Repayment Schedule(In Thousands)
General Obligation Bonds Revenue Bonds Capital Leases
9. EARLY TERMINATION BENEFITS
Early termination benefits are defined as benefits received for discontinuing services earlier than planned. Certain bargaining unit contracts, including the Inter Faculty Organization (IFO) contract and Minnesota State University Association of Administrative Service Faculty (MSUAASF), provide for this benefit. The following is a description of the different benefit arrangements for each contract, including the number of retired faculty receiving the benefit, and the amount of future liability as of the end of fiscal years 2017 and 2016. Inter Faculty Organization (IFO) contract — The IFO contract allows faculty members who meet certain eligibility and combination of age and years of service requirements to receive an early retirement incentive cash payment based on base salary at time of separation, as well as an amount equal to the employer’s contribution for one year’s health insurance premiums deposited in his/her health care savings plan at time of separation. The cash incentive can be paid either in one or two payments.
The number of retired faculty who received this benefit and the amount of future liability for those faculty as of the end of fiscal years 2017 and 2016, follow:
Fiscal YearNumber
of Faculty Future Liability (In Thousands)
2017 5 $ 922016 5 114
Minnesota State University Association of Administrative Service Faculty (MSUAASF) contract — The MSUAASF contract allows faculty members who meet certain eligibility and combination of age and years of service requirements to receive an early retirement incentive cash payment based on base salary at time of separation, as well as an amount equal to the employer’s contribution for one year’s health insurance premiums deposited in his/her health care savings plan at time of separation. The cash incentive can be paid either in one or two payments. The number of retired faculty who received this benefit and the amount of future liability for those faculty as of the end of fiscal years 2017 and 2016 follow:
Fiscal YearNumber
of Faculty Future Liability (In Thousands)
2017 6 $ 1852016 5 184
38

10. NET OTHER POSTEMPLOYMENT BENEFITS The university provides health insurance benefits for certain retired employees under a single employer, fully insured plan, as required by Minnesota Statute 471.61 subdivision 2B. Active employees who retire when eligible to receive a retirement benefit from a Minnesota public pension plan and do not participate in any other health benefits program providing coverage similar to that herein described, will be eligible to continue coverage with respect to both themselves and their eligible dependent(s) under the health benefits program. Retirees are required to pay 100 percent of the total premium cost. Since the premium is a blended rate determined on the entire active and retiree population, the retirees are receiving an implicit rate subsidy. As of July 1, 2016 there were approximately 59 retirees receiving health benefits from the health plan. Annual OPEB Cost and Net OPEB Obligation — The annual other postemployment benefit (OPEB) cost (expense) is calculated based on the annual required contribution (ARC) of the employer, an amount actuarially determined in accordance with the parameters of GASB Statement No. 45 Accounting and Financial Reporting by Employers for Postemployment Benefits Other Than Pensions. The ARC represents a level of funding that, if paid on an ongoing basis, is projected to cover normal cost each year and amortize any unfunded actuarial liabilities (or funding excess) over a period not to exceed 30 years.
The following table shows the components of the annual OPEB cost for fiscal years 2017 and 2016, the amount actually contributed to the plan, and changes in the net OPEB obligation:
2017 2016Annual required contribution (ARC) $ 717 $ 979 Interest on net OPEB obligation 106 137 Adjustment to ARC (116) (122) Annual OPEB cost 707 994 Contributions during the year (474) (614) Increase in net OPEB obligation 233 380 Net OPEB obligation, beginning of year 3,717 3,337 Net OPEB obligation, end of year $ 3,950 $ 3,717
Components of the Annual OPEB Cost(In Thousands)
The university’s annual OPEB cost, the percentage of annual OPEB cost contributed to the plan and the net OPEB obligation for fiscal years 2017 and 2016 were as follows:
2017 2016Beginning of year net OPEB obligation $ 3,717 $ 3,337 Annual OPEB cost 707 994 Employer contribution (474) (614) End of year net OPEB obligation $ 3,950 $ 3,717
Percentage contributed 67.04% 61.77%
Year Ended June 30(In Thousands)
39

Funding Status — There are currently no assets that have been irrevocably deposited in a trust for future health benefits. Therefore, the actuarial value of assets is zero.
Actuarial Valuation
Date
Actuarial Value of Assets
(a)
Actuarial Accrued Liability
(b)
Unfunded Actuarial
Accrued Liability (b-a)
Funded Ratio
Percentage (a/b)
Covered Payroll
(c)
UAAL as a Percentage of
Covered Payroll ((b-a)/c)
July 1, 2016 $ - $ 6,415 $ 6,415 0.00 $ 94,806 6.77
Schedule of Funding Progress(In Thousands)
Actuarial Methods and Assumptions — Actuarial valuations involve estimates of the value of reported amounts and assumptions about the probability of the occurrence of events far into the future. Examples include assumptions about future employment, mortality, and healthcare cost trends. Amounts determined regarding the funded status of the plan and the annual required contributions of the employer are subject to continual revision as actual results are compared with past expectations and new estimates are made about the future.
Projections of benefits for financial reporting purposes are based on the substantive plan (as understood by the employer and the plan members) and include the types of benefits provided at the time of each valuation. The actuarial methods and assumptions used include techniques that are designed to reduce the effects of short-term volatility in actuarial accrued liabilities, consistent with the long term perspective of the calculations.
In the July 1, 2016 actuarial valuation, the entry age normal actuarial cost method was used. The actuarial assumptions included a 2.85 percent discount rate, which is based on the estimated long term investment yield on the general assets, using an underlying long term inflation assumption of 2.75 percent. The annual healthcare cost trend rate is 6.4 percent initially, reduced incrementally to an ultimate rate of 3.8 percent after twenty years. The unfunded actuarial accrued liability is being amortized as a level dollar amount over an open 30 year period.
11. LEASE AGREEMENTS
Operating Leases — The university is committed under various leases primarily for building space. These leases are considered for accounting purposes to be operating leases. Lease expenditures for the fiscal years ended June 30, 2017 and 2016, totaled $557,802 and $504,806, respectively. Future minimum operating lease payments for existing lease agreements are as follows:
Fiscal Year Amount2018 $ 538 2019 409 2020 356 2021 360 2022 183 Total $ 1,846
Year Ended June 30(In Thousands)
Income Leases — The university has entered into several income lease agreements, primarily for building space. Lease income for the fiscal years ended June 30, 2017 and 2016, totaled $91,889 and $84,382, respectively, and is included in other income in the statements of revenues, expenses, and changes in net position.
40

Future expected income receipts for existing lease agreements are as follows:
Fiscal Year Amount2018 $ 73 2019 20 2020 20 2021 20 2022 20 Total $ 153
Year Ended June 30(In Thousands)
Capital Leases — The university has entered into several capital lease agreements. The leases meet the criteria of a capital lease as defined by GAAP, which defines a capital lease generally as one that transfers benefits and risk of ownership to the lessee.
In March 2002, the university guaranteed revenue bonds issued by the city of St. Cloud, Housing and Redevelopment Authority to the foundation. The proceeds of the bonds were used to fund an addition to the Atwood Memorial Center and a stadium and student recreation center. Note 18 to the financial statements provides additional information. In August 2010, the university entered into agreements with Wedum St. Cloud Housing LLC for Welcome Center space and a residence hall for a term of ten years with two successive options for five year extensions. The Welcome Center has been extended for an additional five years to August 2025, and the residence hall lease will end in August 2020. The total cost of all capital assets acquired with capital leases and corresponding accumulated depreciation at June 30, 2017, are $47,294,712 and $27,397,416, respectively.
12. TUITION, FEES, AND SALES, NET The following table provides information related to tuition, fees, and sales revenue:
2017 2016
GrossScholarship Allowance Net Gross
Scholarship Allowance Net
Tuition $ 84,222 $ (25,693) $ 58,529 $ 85,621 $ (26,845) $ 58,776 Fees 10,238 (1,326) 8,912 9,596 (1,217) 8,379 Sales and room and board 14,343 (88) 14,255 13,371 (66) 13,305 Restricted student payments 20,430 (900) 19,530 21,035 (933) 20,102 Total $ 129,233 $ (28,007) $ 101,226 $ 129,623 $ (29,061) $ 100,562
Year Ended June 30(In Thousands)
41

13. OPERATING EXPENSES BY FUNCTIONAL CLASSIFICATION The following tables provide information related to operating expenses by functional classification:
Description Salaries Benefits Other Interest TotalAcademic support $ 13,777 $ 7,043 $ 5,863 $ 135 $ 26,818 Institutional support 10,920 7,229 8,770 117 27,036 Instruction 56,327 28,604 11,492 550 96,973 Public service 1,180 504 1,889 49 3,622 Research 1,473 696 1,271 14 3,454 Student services 14,024 7,412 7,630 311 29,377 Auxiliary enterprises 5,999 2,601 18,383 2,177 29,160 Scholarships & fellowships - - 3,535 - 3,535 Less interest expense - - - (3,353) (3,353) Total operating expenses $ 103,700 $ 54,089 $ 58,833 $ - $ 216,622
Year Ended June 30, 2017(In Thousands)
Description Salaries Benefits Other Interest TotalAcademic support $ 13,013 $ 3,440 $ 5,907 $ 154 $ 22,514 Institutional support 11,660 4,558 8,091 151 24,460 Instruction 57,821 14,654 12,012 677 85,164 Public service 962 181 1,842 43 3,028 Research 1,711 294 1,124 19 3,148 Student services 14,215 3,965 7,530 361 26,071 Auxiliary enterprises 6,382 1,249 19,260 2,127 29,018 Scholarships & fellowships - - 3,337 - 3,337 Less interest expense - - - (3,532) (3,532) Total operating expenses $ 105,764 $ 28,341 $ 59,103 $ - $ 193,208
Year Ended June 30, 2016(In Thousands)
14. EMPLOYEE PENSION PLANS The university participates in both mandatory and voluntary retirement plans. Mandatory plans include the State Employees Retirement Fund, administered by the Minnesota State Retirement System; the Teachers Retirement Fund, administered by the Teachers Retirement Association; and, the General Employees Retirement Fund, administered by the Public Employees Retirement Association. Normal retirement age, for employees covered by these defined benefit plans, range from age 62 to age 66, depending upon employment date and years of service. Additionally, the university participates in a Defined Contribution Retirement Plan which is available to faculty, system administrators and other unclassified employees. State Employees Retirement Fund Plan Description — The State Employees Retirement Fund (SERF) is administered by the Minnesota State Retirement System (MSRS), and is established and administered in accordance with Minnesota Statutes, Chapters 352 and 356. SERF includes the General Employees Retirement Plan (General Plan), a multiple-employer, cost-sharing defined benefit plan, and three single-employer defined benefit plans. All state of Minnesota employees who are not members of another plan are covered by the General Plan.
42

Benefits Provided — MSRS provides retirement, disability, and death benefits through the State Employees Retirement Fund. Benefit provisions are established by state statute and can only be modified by the state legislature. Benefits are based on a member’s age, years of credit, and the highest average salary for any sixty successive months of allowable service at termination of service. Benefit increases are provided to benefit recipients each January, and are related to the funded ratio of the plan. Annuitants receive benefit increases of 2.0 percent each year. When the fund reaches a 90 percent funded status for two consecutive years, annuitants will receive a 2.5 percent increase.
Retirement benefits can be computed using one of two methods: the Step formula and the Level formula. Members hired before July 1, 1989, may use the Step or Level formula, whichever is greater. Members hired on or after July 1, 1989, must use the Level formula. Each formula converts years and months of service to a certain percentage. Under the Step formula, members receive 1.2 percent of the high-five average salary for each of the first 10 years of covered service, plus 1.7 percent for each year thereafter. It also includes full benefits under the Rule of 90 (age plus years of allowable service equals 90). In contrast, the Level formula does not include the Rule of 90. Under the Level formula, members receive 1.7 percent of the high-five average salary for all years of covered service, and full benefits are available at normal retirement age.
Contributions — Minnesota Statute Chapter 352 sets the rates for employer and employee contributions. Eligible General Plan members and participating employers were required to contribute 5.50 percent of their annual covered salary in fiscal years 2017 and 2016. The university’s contributions to the General Plan for the fiscal years ending June 30, 2017 and 2016 were $1,304,341 and $1,336,180, respectively. These contributions were equal to the contractually required contributions for each year as set by state statute. Actuarial Assumptions — The university’s net pension liability was measured as of June 30, 2016 and 2015, and the total pension liability used to calculate the net pension liability was determined by an actuarial valuation as of those dates. The total pension liability was determined using the following actuarial assumptions, applied to all periods included in the measurement:
Measurement Date June 30, 2016 June 30, 2015 Inflation 2.50 percent per year 2.75 percent per year Active member payroll growth 3.25 percent per year 3.50 percent per year Investment rate of return 7.50 percent 7.90 percent
Salary increases for the June 30, 2016 valuation were equal to prior year administrative expenses expressed as a percentage of prior year projected payroll. Mortality rates for active members, retirees, survivors and disabilitants were based on RP-2014 generational mortality tables for males or females, as appropriate, with adjustments to match fund experience. Benefit increases for retirees were assumed to be 2.0 percent per annum.
Salary increases for the June 30, 2015 valuation were based on a service-related table. Mortality rates for active members, retirees, survivors and disabilitants were based on RP-2000 generational mortality tables for males or females, as appropriate, with adjustments to match fund experience. Benefit increases for retirees were assumed to be 2.0 percent per annum through 2043 and 2.5 percent thereafter. Actuarial assumptions used in the June 30, 2016, valuation were based on the results of actuarial experience studies for the period July 1, 2009, through June 30, 2014, with an update of economic assumptions in 2014. Actuarial assumptions used in the June 30, 2015, valuation were based on the results of actuarial experience studies for the period July 1, 2004, through June 30, 2008, with an update of economic assumptions in 2014. The long-term expected rate of return on pension plan investments used in the determination of the total pension liability is 7.50 percent. This is a reduction of the assumed rate of 7.90 percent at June 30, 2015. The selection of the rate was determined by looking at the asset class target allocations and long-term rate of return expectations from the State Board of Investment (SBI). During fiscal year 2016, the SBI hired an outside consultant to perform a thorough asset and liability study. Based on the study the asset allocation was updated. The SBI, which manages the investments of MSRS, prepares an analysis of the reasonableness of the long-term expected rate of return on a regular basis using a building-block method. Best estimates of expected future real rates of return are developed for each major asset class.
43

These asset class estimates and target allocations are combined to produce a geometric, expected long-term rate of return as summarized in the following table:
Asset ClassTarget
Percentage
SBI's Long-Term Expected Real Rate of Return (Geometric Mean)
PercentageDomestic stocks 45 5.50International stocks 15 6.00Bonds 18 1.45Alternative assets 20 6.40Cash 2 0.50
Total 100
Discount Rate — The discount rate used to measure the total pension liability as of June 30, 2016 and 2015, was 4.17 percent and 7.90 percent, respectively. As of June 30, 2016, the projection of cash flows used to determine the discount rate assumed that employee and employer contributions will be made at the current statutory contribution rates. Based on these assumptions, the pension plan fiduciary net position as of June 30, 2016 and future contributions were sufficient to finance the benefit payments through 2042. As a result, the long-term expected rate of return on pension plan assets was applied to projected benefit payments through 2042, and the municipal bond rate was applied to all benefit payments after the point of asset depletion. The discount rate at June 30, 2016 was based on the expected rate of return on pension plan investments of 7.50 percent and a municipal bond rate of 2.85 percent, as published by the Federal Reserve Board in June 2016, resulting in a single discount rate of 4.10 percent.
As of June 30, 2015, the projection of cash flows used to determine the discount rate assumed that employee and
employer contributions will be made at the rate specified in statute. Based on that assumption, the pension plan’s fiduciary net position at June 30, 2015 was projected to be available to make all projected future benefit payments of current active and inactive employees. Therefore, the long-term expected rate of return of 7.90 percent on pension plan investments was applied to all periods of projected benefit payments to determine the total pension liability.
Net Pension Liability — At June 30, 2017 and 2016, the university reported a liability of $113,563,641 and $14,342,456, respectively, for its proportionate share of MSRS’ net pension liability. The net pension liability was measured as of June 30, 2016 and 2015, and the total pension liability used to calculate the net pension liability was determined by an actuarial valuation as of those dates. The university’s proportion of the net pension liability was based on the employer contributions received by MSRS during the measurement periods July 1, 2015 through June 30, 2016 and July 1, 2014, through June 30, 2015, relative to the total employer contributions received from all of MSRS’s participating employers. At June 30, 2017 and 2016, the university’s proportion was 0.88 and 0.93 percent, respectively.
There have been no changes in plan provisions since the previous valuation. Changes were made in assumptions that affect the measurement of the total pension liability since the prior measurement date. The assumed post-retirement benefit increase rate was changed from 2.0 percent through 2043 and 2.5 percent thereafter to 2.0 percent for all future years. The assumed investment return was changed from 7.90 percent to 7.50 percent. The single discount rate was changed from 7.90 percent to 4.17 percent. Salary increases, retirement, termination, disability, mortality, percent married, and benefit election assumptions were changed pursuant to the experience study. The assumed future salary increases, payroll growth, and inflation were decreased by a further 0.25 percent from those assumptions.
44

Pension Liability Sensitivity — The following presents the university’s proportionate share of the net pension liability, calculated using the discount rate disclosed above, as well as what the proportionate share of the net pension liability would be if it were calculated using a discount rate that is one percentage point lower or one percentage point higher than the current discount rate:
Year Ended June 30, 2017
One Percent Decrease in
Discount Rate (3.17%)
Discount Rate (4.17%)
One Percent Increase in
Discount Rate (5.17%)
$ 149,728 $ 113,564 $ 84,488
Year Ended June 30, 2016
One Percent Decrease in
Discount Rate (6.90%)
Discount Rate (7.90%)
One Percent Increase in
Discount Rate (8.90%)
$ 29,359 $ 14,342 $ 1,846
Proportionate Share of Net Pension Liability
(In Thousands)
Proportionate Share of Net Pension Liability
(In Thousands)
Pension Plan Fiduciary Net Position — Detailed information about the pension plan’s fiduciary net position is available in the MSRS Comprehensive Annual Financial Report, available on the MSRS website at www.msrs.state.mn.us/financial-information.
Pension Expense and Deferred Outflows and Deferred Inflows of Resources Related to Pensions — For the years ended June 30, 2017 and 2016, the university recognized an increase in pension expense of $16,730,780 and a reduction of $3,412,862 respectively, related to pensions. At June 30, 2017 and 2016, the university reported deferred outflows of resources and deferred inflows of resources related to pensions from the following sources:
Deferred Deferred Outflows Inflows
of Resources of ResourcesDifferences between projected and actual investment earnings $ 4,997 $ - Changes in actuarial assumptions 72,623 5,412 Contributions paid to MSRS subsequent to the measurement date 1,304 - Differences between expected and actual economic experience 156 2,872 Changes in proportion 154 524 Total $ 79,234 $ 8,808
2017(In Thousands)
45
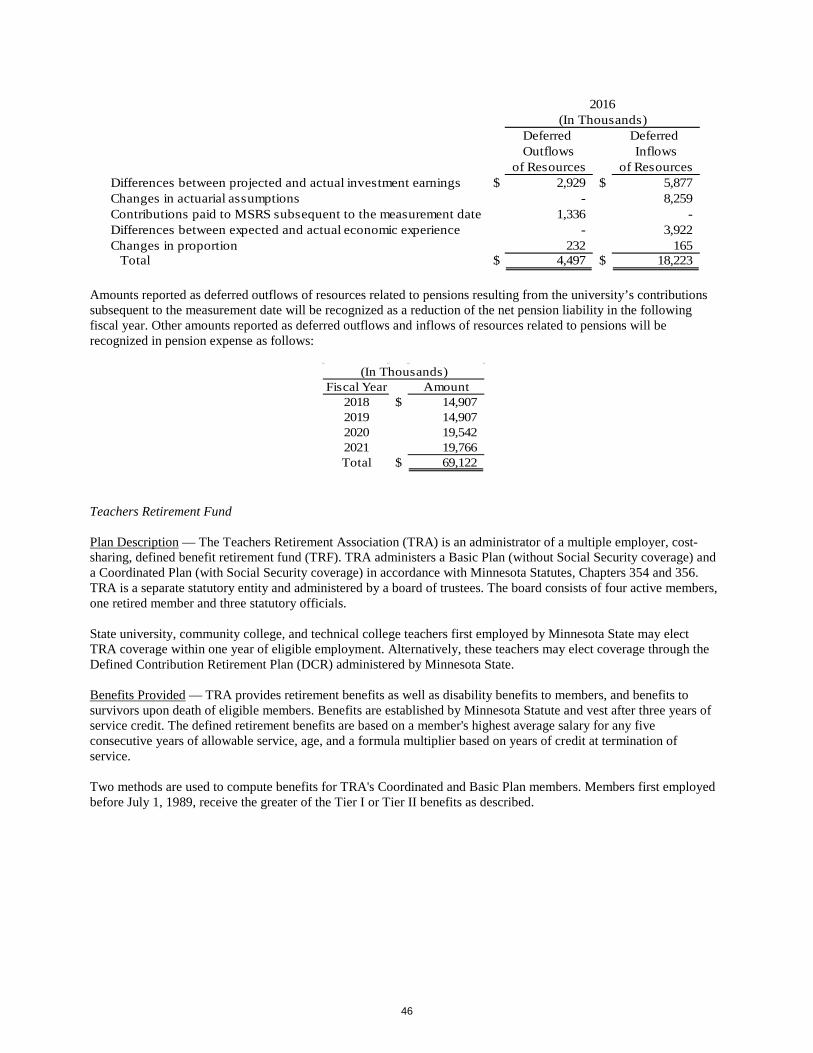
Deferred Deferred Outflows Inflows
of Resources of ResourcesDifferences between projected and actual investment earnings $ 2,929 $ 5,877 Changes in actuarial assumptions - 8,259 Contributions paid to MSRS subsequent to the measurement date 1,336 - Differences between expected and actual economic experience - 3,922 Changes in proportion 232 165 Total $ 4,497 $ 18,223
(In Thousands)2016
Amounts reported as deferred outflows of resources related to pensions resulting from the university’s contributions subsequent to the measurement date will be recognized as a reduction of the net pension liability in the following fiscal year. Other amounts reported as deferred outflows and inflows of resources related to pensions will be recognized in pension expense as follows:
Fiscal Year Amount2018 $ 14,907 2019 14,907 2020 19,542 2021 19,766 Total $ 69,122
(In Thousands)
Teachers Retirement Fund Plan Description — The Teachers Retirement Association (TRA) is an administrator of a multiple employer, cost-sharing, defined benefit retirement fund (TRF). TRA administers a Basic Plan (without Social Security coverage) and a Coordinated Plan (with Social Security coverage) in accordance with Minnesota Statutes, Chapters 354 and 356. TRA is a separate statutory entity and administered by a board of trustees. The board consists of four active members, one retired member and three statutory officials. State university, community college, and technical college teachers first employed by Minnesota State may elect TRA coverage within one year of eligible employment. Alternatively, these teachers may elect coverage through the Defined Contribution Retirement Plan (DCR) administered by Minnesota State.
Benefits Provided — TRA provides retirement benefits as well as disability benefits to members, and benefits to survivors upon death of eligible members. Benefits are established by Minnesota Statute and vest after three years of service credit. The defined retirement benefits are based on a member's highest average salary for any five consecutive years of allowable service, age, and a formula multiplier based on years of credit at termination of service.
Two methods are used to compute benefits for TRA's Coordinated and Basic Plan members. Members first employed before July 1, 1989, receive the greater of the Tier I or Tier II benefits as described.
46

Tier I Benefits
Tier 1 Step Rate Formula PercentageBasic First ten years of service 2.2 percent per year
All years after 2.7 percent per year
Coordinated First ten years if service years are up to July 1, 2006 1.2 percent per yearFirst ten years if service years are July 1, 2006 or after 1.4 percent per yearAll other years of service if service years are up to July 1, 2006 1.7 percent per yearAll other years of service if service years are July 1, 2006 or after 1.9 percent per year
With these provisions:
• Normal retirement age is 65 with less than 30 years of allowable service and age 62 with 30 or more years of allowable service.
• 3.0 percent per year early retirement reduction factor for all years under normal retirement age. • Unreduced benefits for early retirement under a Rule-of-90 (age plus allowable service equals 90 or more).
Tier II Benefits For years of service prior to July 1, 2006, a level formula of 1.7 percent per year for coordinated members and 2.7 percent per year for basic members is applied. For years of service July 1, 2006 and after, a level formula of 1.9 percent per year for coordinated members and 2.7 for basic members applies. Beginning July 1, 2015, the early retirement reduction factors are based on rates established under Minnesota Statute. Smaller reductions, more favorable to the member, will be applied to individuals who reach age 62 and have 30 years or more of service credit.
Members first employed after June 30, 1989, receive only the Tier II calculation with a normal retirement age that is their retirement age for full Social Security retirement benefits, but not to exceed age 66. Six different types of annuities are available to members upon retirement. The No Refund Life Plan is a lifetime annuity that ceases upon the death of the retiree – no survivor annuity is payable. A retiring member may also choose to provide survivor benefits to a designated beneficiary(ies) by selecting one of the five plans that have survivorship features. Vested members may also leave their contributions in the TRA Fund upon termination of service in order to qualify for a deferred annuity at retirement age. Any member terminating service is eligible for a refund of their employee contributions plus interest. The benefit provisions stated apply to active plan participants. Vested, terminated employees who are entitled to benefits but not yet receiving them are bound by the plan provisions in effect at the time they last terminated their public service.
Contributions — Minnesota Statute Chapter 354 sets the rates for employer and employee contributions. Contribution rates can only be modified by the state legislature. TRA Basic Plan members and Coordinated Plan members were required to contribute 11.0 percent and 7.50 percent, respectively, of their annual covered salary in fiscal years 2017 and 2016. In fiscal years 2017 and 2016, the employer was required to contribute 11.50 percent of pay for Basic Plan members and 7.50 percent for Coordinated Plan members. The university’s contributions to the TRA for the fiscal years ended June 30, 2017 and 2016 were $830,580 and $792,540, respectively. These contributions were equal to the required contributions for each year as set by state statute.
47

Actuarial Assumptions — The university’s net pension liability was measured as of June 30, 2016 and 2015, and the total pension liability used to calculate the net pension liability was determined by an actuarial valuation as of those dates. The total pension liability was determined using the following actuarial assumptions, applied to all periods included in the measurement:
Measurement Date June 30, 2016 June 30, 2015 Inflation 2.75 percent per year 3.00 percent per year Active member payroll growth 3.50 to 9.50 percent per year 3.50 to 12.00 percent per year Investment rate of return 8.00 percent 8.00 percent
Salary increases were based on a service-related table. Mortality rates for active members, retirees, survivors and disabilitants were based on RP-2014 generational mortality tables for males or females, as appropriate, with adjustments to match fund experience. Benefit increases for retirees were assumed to be 2.0 percent.
Actuarial assumptions used in the June 30, 2016 valuation was based on the results of actuarial experience studies dated June 10, 2015 that covered the six-year period beginning July 1, 2008 and ending June 30, 2014.
The long-term expected rate of return on pension plan investments is 8.00 percent. The rate assumption was selected as the result of a 2015 actuarial review of economic assumptions. The review combined the asset class target allocations and long-term rate of return expectations from the State Board of Investment (SBI) with return expectations from eight other investment consultants. The review also factored in information from the Social Security Trustees Report, U.S. Department of the Treasury yield curve rates, and historical observations of inflation statistics and investment returns.
The SBI, which manages the investments of TRF, prepares an analysis of the reasonableness of the long-term expected rate of return on a regular basis using a building-block method. Best-estimates of expected future real rates of return are developed for each major asset class. These asset class estimates and target allocations are combined to produce a geometric, expected long-term rate of return as summarized in the following table:
Asset ClassTarget
Percentage
SBI's Long-Term Expected Real Rate of Return (Geometric Mean)
PercentageDomestic stocks 45 5.50International stocks 15 6.00Bonds 18 1.45Alternative assets 20 6.40Cash 2 0.50
Total 100
Discount Rate — The discount rate used to measure the total pension liability as of June 30, 2016 and 2015, was 4.66 percent and 8.00 percent, respectively. As of June 30, 2016, the projection of cash flows used to determine the discount rate assumed that employee and employer contributions will be made at the current statutory contribution rates. Based on these assumptions, the pension plan fiduciary net position as of June 30, 2016 and future contributions were sufficient to finance the benefit payments through 2052. As a result, the long-term expected rate of return on pension plan assets was applied to projected benefit payments through 2052, and the municipal bond rate was applied to all benefit payments after the point of asset depletion. The discount rate at June 30, 2016 was based on the expected rate of return on pension plan investments of 8.00 percent and the municipal bond index rate of 3.01 percent, the monthly average of the Bind Buyers General Obligation 20-year Municipal Bond Index Rate published monthly by the Federal Reserve Board, resulting in a single discount rate of 4.66 percent.
48
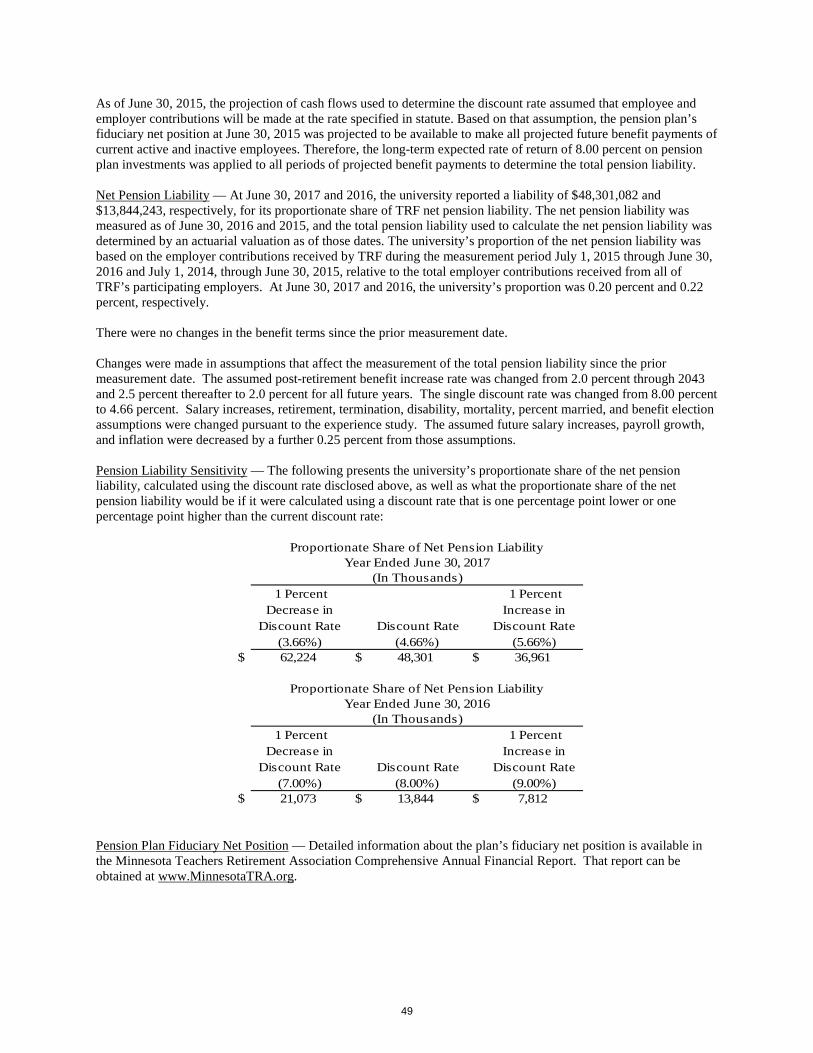
As of June 30, 2015, the projection of cash flows used to determine the discount rate assumed that employee and employer contributions will be made at the rate specified in statute. Based on that assumption, the pension plan’s fiduciary net position at June 30, 2015 was projected to be available to make all projected future benefit payments of current active and inactive employees. Therefore, the long-term expected rate of return of 8.00 percent on pension plan investments was applied to all periods of projected benefit payments to determine the total pension liability. Net Pension Liability — At June 30, 2017 and 2016, the university reported a liability of $48,301,082 and $13,844,243, respectively, for its proportionate share of TRF net pension liability. The net pension liability was measured as of June 30, 2016 and 2015, and the total pension liability used to calculate the net pension liability was determined by an actuarial valuation as of those dates. The university’s proportion of the net pension liability was based on the employer contributions received by TRF during the measurement period July 1, 2015 through June 30, 2016 and July 1, 2014, through June 30, 2015, relative to the total employer contributions received from all of TRF’s participating employers. At June 30, 2017 and 2016, the university’s proportion was 0.20 percent and 0.22 percent, respectively. There were no changes in the benefit terms since the prior measurement date.
Changes were made in assumptions that affect the measurement of the total pension liability since the prior measurement date. The assumed post-retirement benefit increase rate was changed from 2.0 percent through 2043 and 2.5 percent thereafter to 2.0 percent for all future years. The single discount rate was changed from 8.00 percent to 4.66 percent. Salary increases, retirement, termination, disability, mortality, percent married, and benefit election assumptions were changed pursuant to the experience study. The assumed future salary increases, payroll growth, and inflation were decreased by a further 0.25 percent from those assumptions.
Pension Liability Sensitivity — The following presents the university’s proportionate share of the net pension
liability, calculated using the discount rate disclosed above, as well as what the proportionate share of the net pension liability would be if it were calculated using a discount rate that is one percentage point lower or one percentage point higher than the current discount rate:
1 Percent Decrease in
Discount Rate (3.66%)
Discount Rate (4.66%)
1 Percent Increase in
Discount Rate (5.66%)
$ 62,224 $ 48,301 $ 36,961
1 Percent Decrease in
Discount Rate (7.00%)
Discount Rate (8.00%)
1 Percent Increase in
Discount Rate (9.00%)
$ 21,073 $ 13,844 $ 7,812
(In Thousands)
Year Ended June 30, 2017
Year Ended June 30, 2016
Proportionate Share of Net Pension Liability
Proportionate Share of Net Pension Liability
(In Thousands)
Pension Plan Fiduciary Net Position — Detailed information about the plan’s fiduciary net position is available in the Minnesota Teachers Retirement Association Comprehensive Annual Financial Report. That report can be obtained at www.MinnesotaTRA.org.
49

Pension Expense and Deferred Outflows and Deferred Inflows of Resources Related to Pensions — For the years ended June 30, 2017 and 2016, the university’s recognized pension expense of $6,752,435 and $779,468, respectively, related to pensions. At June 30, 2017 and 2016, the university’s reported deferred outflows of resources and deferred inflows of resources related to pensions from the following sources:
Deferred Deferred Outflows Inflows
of Resources of ResourcesDifferences between projected and actual investment earnings $ 2,090 $ - Changes in assumptions 27,543 - Contributions paid to TRA subsequent to the measurement date 831 - Differences between expected and actual economic experience 473 1 Changes in proportion 14 1,573 Total $ 30,951 $ 1,574
Deferred Deferred Outflows Inflows
of Resources of ResourcesDifferences between projected and actual investment earnings $ 1,373 $ 2,458 Changes in assumptions 1,076 - Contributions paid to TRA subsequent to the measurement date 793 - Differences between expected and actual economic experience 710 - Changes in proportion 19 673 Total $ 3,971 $ 3,131
(In Thousands)2016
2017(In Thousands)
Amounts reported as deferred outflows of resources related to pensions resulting from the university’s contributions subsequent to the measurement date will be recognized as a reduction of the net pension liability in the following fiscal year. Other amounts reported as deferred outflows and inflows of resources related to pensions will be recognized in pension expense as follows:
Fiscal Year Amount2018 $ 5,616 2019 5,616 2020 6,314 2021 5,851 2022 5,149 Total $ 28,546
(In Thousands)
General Employees Retirement Fund Plan Description — The university participates in the General Employees Retirement Plan (GERF), a defined benefit pension plans administered by the Public Employees Retirement Association (PERA). PERA’s defined benefit pension plans are established and administered in accordance with Minnesota Statutes, Chapters 353 and 356. PERA’s defined benefit pension plans are tax qualified plans under Section 401(a) of the Internal Revenue Code. GERF members belong to either the Coordinated Plan or the Basic Plan. Coordinated Plan members are covered by Social Security and Basic Plan members are not. The Basic Plan was closed to new members in 1967. All new members must participate in the Coordinated Plan.
50

Benefits Provided — PERA provides retirement, disability, and death benefits. Benefit provisions are established by state statute and can only be modified by the state legislature. Benefit increases are provided to benefit recipients each January. Increases are related to the funding ratio of the plan. Members in plans that are at least 90 percent funded for two consecutive years are given 2.5 percent increases. Members in plans that have not exceeded 90 percent funded, or have fallen below 80 percent, are given 1.0 percent increases. The benefit provisions stated in the following paragraphs of this section are current provisions and apply to active plan participants. Vested, terminated employees who are entitled to benefits but are not receiving them yet are bound by the provisions in effect at the time they last terminated their public service.
GERF Benefits are based on a member’s highest average salary for any five successive years of allowable service, age, and years of credit at termination of service. Two methods are used to compute benefits for PERA's Coordinated and Basic Plan members. The retiring member receives the higher of a step-rate benefit accrual formula (Method 1) or a level accrual formula (Method 2). Under Method 1, the annuity accrual rate for a Basic Plan member is 2.2 percent of average salary for each of the first ten years of service and 2.7 percent for each remaining year. The annuity accrual rate for a Coordinated Plan member is 1.2 percent of average salary for each of the first ten years and 1.7 percent for each remaining year. Under Method 2, the annuity accrual rate is 2.7 percent of average salary for Basic Plan members and 1.7 percent for Coordinated Plan members for each year of service. For members hired prior to July 1, 1989, a full annuity is available when age plus years of service equal 90 and normal retirement age is 65. For members hired on or after July 1, 1989, normal retirement age is the age for unreduced Social Security benefits capped at 66. Disability benefits are available for vested members, and are based upon years of service and average high-five salary.
Contributions — Minnesota Statute Chapter 353 sets the rates for employer and employee contributions. Contribution rates can only be modified by the state legislature. Basic Plan members and Coordinated Plan members were required to contribute 9.1 percent and 6.5 percent, respectively, of their annual covered salary in calendar years 2017 and 2016. In calendar years 2017 and 2016, the employer was required to contribute 11.78 percent of pay for Basic Plan members and 7.5 percent for Coordinated Plan members. University contributions to the GERF for the plan’s fiscal years ended June 30, 2017 and 2016 were $19,921 and $23,071, respectively. These contributions were equal to the required contributions for each year as set by state statute. Actuarial Assumptions — The total pension liability in the June 30, 2016 and 2015, actuarial valuations were determined using the following actuarial assumptions:
Measurement Date June 30, 2016 June 30, 2015
Inflation 2.50 percent per year 2.75 percent per year Active member payroll growth 3.25 percent per year 3.50 percent per year
Investment rate of return 7.50 percent 7.90 percent
Salary increases were based on a service-related table. Mortality rates for active members, retirees, survivors and disabilitants were based on RP-2014 tables for males or females, as appropriate, with slight adjustments.
Actuarial assumptions used in the June 30, 2016 and 2015, valuation were based on the results of actuarial experience studies. The most recent four-year experience study in the GERF was completed in 2015. Economic assumptions were updated in 2014 based on a review of inflation and investment return assumptions. The assumed post-retirement benefit increase rate was changed from 1.0 percent per year through 2035 and 2.50 percent thereafter to 1.0 percent per year for all future years.
The long-term expected rate of return on pension plan investments used in the determination of the total pension liability is 7.50 percent. This is a reduction of the assumed rate of 7.90 percent at June 30, 2015. The State Board of Investment, which manages the investments of PERA, prepares an analysis of the reasonableness of the long-term expected rate of return on a regular basis using a building-block method in which best-estimate ranges of expected future rates of return are developed for each major asset class. The best-estimate ranges were developed in a 2014 economic assumption review using capital market assumptions from SBI and eight additional investment consultants. Ranges are combined to produce an expected long-term rate of return by weighting the expected future rates of return by the target asset allocation percentages and then adding expected inflation.
51

The target allocation and best estimates of arithmetic real rates of return for each major asset class are summarized in the following table:
Asset ClassTarget
Percentage
SBI's Long-Term Expected Real Rate of Return (Geometric Mean)
PercentageDomestic stocks 45 5.50International stocks 15 6.00Bonds 18 1.45Alternative assets 20 6.40Cash 2 0.50
Total 100
Discount Rate — The discount rate used to measure the total pension liability as of June 30, 2016 and 2015 was 7.50 percent and 7.90 percent, respectively. The projection of cash flows used to determine the discount rate assumed that employee and employer contributions will be made at the rate specified in statute. Based on these assumptions, the pension plan’s fiduciary net position was projected to be available to make all projected future benefit payments of current active and inactive employees. Therefore, the long-term expected rate of return on pension plan investments was applied to all periods of projected benefit payments to determine the total pension liability.
Net Pension Liability — At June 30, 2017 and 2016, the university reported a liability of $392,905 and $290,656, respectively, for its proportionate share of the GERF’s net pension liability. The net pension liability was measured as of June 30, 2016 and 2015, and the total pension liability used to calculate the net pension liability was determined by an actuarial valuation as of those dates. The proportion of the net pension liability was based on the university’s contributions received by PERA during the measurement periods for employer payroll paid dates from July 1, 2015 through June 30, 2016 and July 1, 2014, through June 30, 2015, relative to the total employer contributions received from all of PERA’s participating employers. At June 30, 2017 and 2016, the university’s proportion was 0.0005 percent and 0.0056 percent, respectively.
Pension Liability Sensitivity — The following presents the university’s proportionate share of the net pension liability, calculated using the discount rate disclosed above, as well as what the proportionate share of the net pension liability would be if it were calculated using a discount rate that is one percentage point lower or one percentage point higher than the current discount rate:
Year Ended June 30, 2017
1 Percent Decrease in
Discount Rate (6.50%)
Discount Rate (7.50%)
1 Percent Increase in
Discount Rate (8.50%)
$ 558 $ 393 $ 257
Year Ended June 30, 2016
1 Percent Decrease in
Discount Rate (6.90%)
Discount Rate (7.90%)
1 Percent Increase in
Discount Rate (8.90%)
$ 452 $ 291 $ 157
Proportionate Share of Net Pension Liability
Proportionate Share of Net Pension Liability
(In Thousands)
(In Thousands)
Pension Plan Fiduciary Net Position — Detailed information about each defined benefit pension plan’s fiduciary net position is available in a separately-issued PERA financial report. That report may be obtained at www.mnpera.org.
52

Pension Expense and Deferred Outflows and Deferred Inflows of Resources Related to Pensions — For the years ended June 30, 2017 and 2016, the university recognized pension expense of $20,690 and $18,455 related to pensions. At June 30, 2017 and 2016, the university reported deferred outflows of resources and deferred inflows of resources related to pensions from the following sources:
Deferred Deferred Outflows Inflows
of Resources of ResourcesDifferences between projected and actual investment earnings $ 44 $ - Changes in actuarial assumptions 85 - Contributions paid to PERA subsequent to the measurement date 20 - Differences between expected and actual economic experience 1 32 Changes in proportion - 50 Total $ 150 $ 82
(In Thousands)2017
Deferred Deferred Outflows Inflows
of Resources of ResourcesDifferences between projected and actual investment earnings $ 27 $ 62 Changes in actuarial assumptions 21 - Contributions paid to PERAsubsequent to the measurement date 23 - Differences between expected and actual economic experience 3 14 Changes in proportion - 32 Total $ 74 $ 108
2016(In Thousands)
Amounts reported as deferred outflows of resources related to pensions resulting from the university’s contributions
subsequent to the measurement date will be recognized as a reduction of the net pension liability in the following fiscal year. Other amounts reported as deferred outflows and inflows of resources related to pensions will be recognized in pension expense as follows:
Fiscal Year Amount2018 $ 7 2019 (2) 2020 28 2021 15 Total $ 48
(In Thousands)
Minnesota State Defined Contribution Retirement Fund General Information — The Minnesota State Defined Contribution Retirement Fund include two plans: an Individual Retirement Account Plan and a Supplemental Retirement Plan. Both plans are mandatory, tax deferred, single employer, defined contribution plans authorized by Minnesota Statutes, Chapters 354B and 354C. The plans are designed to provide retirement benefits to Minnesota State unclassified employees. An unclassified employee is one who belongs to Minnesota State specific bargaining units. The plans cover unclassified teachers, librarians, administrators, and certain other staff. The plans are mandatory for qualified employees and vesting occurs immediately. The administrative agent of the two plans is Teachers Insurance and Annuity Association College Retirement Equities Fund (TIAA-CREF). Separately issued financial statements can be obtained from TIAA-CREF, Normandale Lake Office Park, 8000 Norman Center Drive, Suite 1100, Bloomington, MN 55437.
53

Individual Retirement Account Plan (IRAP) Participation — Every employee who is in unclassified service is required to participate in TRF or IRAP upon achieving eligibility. An unclassified employee is one who serves in a position deemed unclassified according to Minnesota Statutes. This includes presidents, vice presidents, deans, administrative or service faculty, teachers and other managers, and professionals in academic and academic support programs. Eligibility begins with the employment contract for the first year of unclassified service in which the employee is hired for more than 25 percent of a full academic year, excluding summer session. An employee remains a participant of the plan even if employed for less than 25 percent of a full academic year in subsequent years. Contributions — There are two member groups participating in the IRAP, a faculty group and an administrators group. For both faculty and administrators, the employer and employee statutory contribution rates are 6.0 percent and 4.5 percent, respectively. The contributions are made under the authority of Minnesota Statutes, Chapter 354B. Required contributions for St. Cloud State University were:
Fiscal Year Employer Employee2017 $ 3,416 $ 2,562 2016 3,411 2,558 2015 3,561 2,671
(In Thousands)
Supplemental Retirement Plan (SRP)
Participation — Every unclassified employee who has completed two full time years of unclassified service with the university must participate upon achieving eligibility. The eligible employee is enrolled on the first day of the fiscal year following completion of two full time years. Vesting occurs immediately and normal retirement age is 55.
Contributions — Participants contribute 5.0 percent of eligible compensation up to a defined maximum annual contribution as specified in the following table.
The university matches amounts equal to the contributions made by participants. The contributions are made under the authority of Minnesota Statutes, Chapter 354C.
Required contributions for St. Cloud State University were:
Fiscal Year Amount2017 $ 1,528 2016 1,500 2015 1,553
(In Thousands)
Voluntary Retirement Savings Plans Minnesota State offers two voluntary programs to employees for retirement savings. The Minnesota Deferred Compensation Plan (MNDCP) is a voluntary retirement savings plan authorized under section 457(b) of the Internal Revenue Code and Minnesota Statutes, Section 352.965. The plan is primarily composed of employee pre-tax contributions and accumulated investment gains or losses. Participants may withdraw funds upon termination of public service or in the event of an unforeseeable emergency. As of June 30, 2017, the plan has 520 participants. In addition, to the state’s Deferred Compensation program, Minnesota State also participates in a 403(b) Tax Sheltered Annuity (TSA) program. The plan consists of both pre-tax and after-tax contributions and accumulated investment gains or losses. As of June 30, 2017, the plan has 432 participants.
54
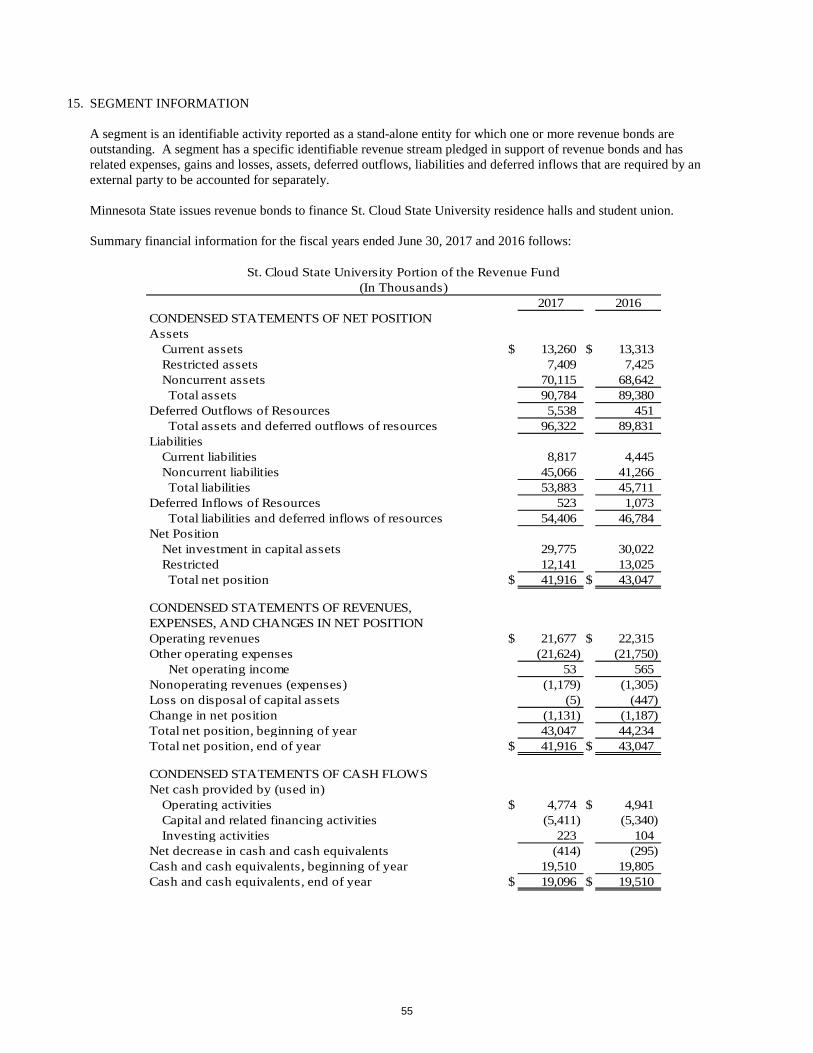
15. SEGMENT INFORMATION
A segment is an identifiable activity reported as a stand-alone entity for which one or more revenue bonds are outstanding. A segment has a specific identifiable revenue stream pledged in support of revenue bonds and has related expenses, gains and losses, assets, deferred outflows, liabilities and deferred inflows that are required by an external party to be accounted for separately. Minnesota State issues revenue bonds to finance St. Cloud State University residence halls and student union. Summary financial information for the fiscal years ended June 30, 2017 and 2016 follows:
2017 2016CONDENSED STATEMENTS OF NET POSITIONAssets Current assets $ 13,260 $ 13,313 Restricted assets 7,409 7,425 Noncurrent assets 70,115 68,642 Total assets 90,784 89,380 Deferred Outflows of Resources 5,538 451 Total assets and deferred outflows of resources 96,322 89,831 Liabilities Current liabilities 8,817 4,445 Noncurrent liabilities 45,066 41,266 Total liabilities 53,883 45,711 Deferred Inflows of Resources 523 1,073 Total liabilities and deferred inflows of resources 54,406 46,784 Net Position Net investment in capital assets 29,775 30,022 Restricted 12,141 13,025 Total net position $ 41,916 $ 43,047
CONDENSED STATEMENTS OF REVENUES, EXPENSES, AND CHANGES IN NET POSITIONOperating revenues $ 21,677 $ 22,315 Other operating expenses (21,624) (21,750) Net operating income 53 565 Nonoperating revenues (expenses) (1,179) (1,305) Loss on disposal of capital assets (5) (447) Change in net position (1,131) (1,187) Total net position, beginning of year 43,047 44,234 Total net position, end of year $ 41,916 $ 43,047
CONDENSED STATEMENTS OF CASH FLOWSNet cash provided by (used in) Operating activities $ 4,774 $ 4,941 Capital and related financing activities (5,411) (5,340) Investing activities 223 104 Net decrease in cash and cash equivalents (414) (295) Cash and cash equivalents, beginning of year 19,510 19,805 Cash and cash equivalents, end of year $ 19,096 $ 19,510
St. Cloud State University Portion of the Revenue Fund(In Thousands)
55

16. COMMITMENTS AND CONTINGENCIES General obligation bond funding of $19,437,000 has been approved for the renovation of Eastman Hall. Construction begins in October 2017 and is expected to be completed in the spring of 2019.
The university has entered into operating agreements with Wedum St. Cloud Housing LLC and also with the St. Cloud State University Foundation, Inc. These operating agreements each contain lease terms meeting the criteria of a capital lease, as defined by GAAP. Note 11 to the financial statements provides additional information. A group of female student athletes initiated a lawsuit against St. Cloud State University after it decided to eliminate certain sports programs in March 2016. The parties to this lawsuit have filed various dispositive motions with the Court, but discovery was recently reopened after Plaintiffs were allowed to amend the complaint a second time. St. Cloud State University is vigorously contesting the case. If the matter is not resolved before trial, the federal district court could issue a permanent injunction, and award damages and attorneys’ fees.
17. RISK MANAGEMENT
Minnesota State is exposed to various risks of loss related to tort; theft of, damage to, or destruction of assets; error or omissions; and employer obligations. Minnesota State manages these risks through state of Minnesota insurance plans including the state of Minnesota Risk Management Fund and through purchased insurance coverage.
Automobile liability coverage is required by the state and is provided by the Minnesota Risk Management Fund. Property and casualty coverage is required by Minnesota State policy. The university also purchased professional liability for employed physicians, and student health services professional liability. Property coverage’s offered by the Minnesota Risk Management Fund are as follows:
Coverage Type AmountInstitution deductible $2,500 to $250,0000Fund responsibility Deductible to $1,000,000Primary re-insurer coverage $1,000,001 to $25,000,000Multiple re-insurers' coverage $25,000,001 to $1,000,000,000Bodily injury and property damage per person $500,000Bodily injury and property damage per occurrence $1,500,000Annual maximum paid by fund, excess by re-insurer $2,500,000Maintenance deductible for additional claims $25,000
The university retains the risk of loss. The university did not have any settlements in excess of coverage the last three years. The Minnesota Risk Management Fund purchased student intern professional liability insurance on the open market for the university. Minnesota State participates in the State Employee Group Insurance Plan, which provides life insurance and hospital, medical, and dental benefits coverage through provider organizations. Workers’ compensation is covered through state participation in the Workers’ Compensation Reinsurance Association, which pays for catastrophic workers’ compensation claims. Other workers’ compensation risks are covered through self-insurance for which Minnesota State pays the cost of claims through the state Workers’ Compensation Fund. A Minnesota State workers’ compensation payment pool helps institutions manage the volatility of such claims. Annual premiums are assessed by the pool based on salary dollars and claims history. From this pool all workers’ compensation claims are paid to the state Workers’ Compensation Fund. Annual premiums for the university for fiscal years 2017 and 2016 were $442,264 and $478,578, respectively.
56

18. COMPONENT UNITS In accordance with Governmental Accounting Standards Board (GASB) Statement No. 39, Determining Whether Certain Organizations Are Component Units, the following foundation affiliated with St. Cloud State University is a legally separate, tax exempt entity and reported as a component unit. The St. Cloud State University Foundation, Inc. is a separate legal entity formed for the purpose of obtaining and disbursing funds for the sole benefit of the university. The university does not appoint any members of the board and the resources held by the foundation can only be used by, or for, the benefit of the university. The foundation’s relationship with the institution is such that exclusion of the foundation’s financial statements would cause the university’s financial statements to be misleading or incomplete. The foundation is considered a component unit of the university and their statements are discretely presented in the university’s financial statements. The foundation financial statements have been prepared on the accrual basis of accounting in accordance with generally accepted accounting principles as prescribed by the Financial Accounting Standards Board (FASB) Accounting Standards Codification (ASC) 958-205, Presentation of Financial Statements. Net assets, which are classified on the existence or absence of donor imposed restrictions, are classified and reported according to the following classes:
• Unrestricted Net Assets: Net assets that are not subject to donor imposed stipulations.
• Temporarily Restricted Net Assets: Net assets subject to donor imposed restrictions as to how the assets are to be used.
• Permanently Restricted Net Assets: Net assets subject to donor imposed stipulations that they be maintained permanently by each foundation. Generally, the donors of these assets permit the foundation to use all or part of the income earned on any related investments for general or specific purposes.
The university has an agreement with the foundation whereby the university has agreed to furnish services for the operation of the foundation. The values of such services, which are included in the university’s expenses, are estimated at $1,669,208 and $1,618,660, respectively, for fiscal years 2017 and 2016. An additional estimated $883,851 and $965,464, respectively, is included in the university’s revenues and the foundation’s expenditures in fiscal years 2017 and 2016, as a result of planned transfers of foundation funds to the university, whereby actual subsequent purchases are made from university accounts. The foundation expended $2,641,327 and $2,852,428, respectively, toward university educational program purposes during fiscal years 2017 and 2016. Of these amounts, approximately $902,293 and $967,784 respectively went to support student scholarships, talent grants, and other awards during fiscal years 2017 and 2016. The foundation’s total assets increased $2,700,991 in fiscal year 2017 after having decreased $2,324,837 in fiscal year 2016.
Investments — The foundation’s investments are presented in accordance with FASB ASC 958-320, Investments-Debt and Equity Securities. Under ASC 958-320, investments in marketable securities with readily determinable fair values and all investments in debt securities are reported at their fair values in the statement of financial position.
57

The inputs used to measure fair value are categorized into the following three categories:
• Level 1 — Inputs that reflect unadjusted quoted prices in active markets for identical investments, such as stocks, corporate and government bonds.
• Level 2 — Inputs, other than quoted prices, that are observable for the asset or liability either directly or
indirectly, including inputs from markets that are not considered to be active.
• Level 3 — Inputs that are unobservable and significant to the fair value measurement.
2017 Level 1 Level 2 Level 3Money market $ 1,158 $ 1,158 $ - $ - Mutual funds 13,935 13,935 - - Equity securities 12,428 12,428 - - Bonds/U.S treasuries 10,582 - 10,582 - Other 5 - 5 - Total $ 38,108 $ 27,521 $ 10,587 $ -
2016 Level 1 Level 2 Level 3Money market $ 561 $ 561 $ - $ - Mutual funds 12,516 12,516 - - Equity securities 10,235 10,235 - - Bonds/U.S treasuries 10,442 - 10,442 - Other 4 - 4 - Total $ 33,758 $ 23,312 $ 10,446 $ -
Fair Value Measurements Using
Schedule of Investments
(In Thousands)Fair Value Measurements Using
Schedule of Investments
(In Thousands)
As of June 30
As of June 30
Capital Assets — Summaries of the foundation’s capital assets for fiscal years 2017 and 2016 are:
2017 2016Capital assets, not depreciated Land $ 175 $ 175 Total capital assets, not depreciated 175 175 Capital assets, depreciated: Equipment 278 278 Leasehold improvements 107 107 Total capital assets, depreciated 385 385 Total accumulated depreciation (352) (329) Total capital assets depreciated, net 33 56 Total capital assets, net $ 208 $ 231
Schedule of Capital Assets
(In Thousands)As of June 30
58

Long-Term Obligations — In March 2002 the foundation entered into an agreement with the Housing and Redevelopment Authority in and for the city of St. Cloud, MN and U.S. Bank National Association to issue $16,515,000 in revenue bonds. Proceeds of the bonds were transferred to the university to finance the construction costs of the Atwood Memorial Center addition and the new stadium and recreational center. In May 2012 the bonds were paid off and refinanced with $10,220,000 of new bonds issued with the Economic Development Authority of St. Cloud, Minnesota and U.S. Bank National Association. The refunding resulted in $1,586,535 gross debt service savings over the next 11 years, and an economic gain of $1,372,639. Of this bond issuance, $5,905,000 is outstanding as of June 30, 2017. A principal payment schedule is provided in the following table for the revenue bonds payable. Excluded from the table below is the unamortized bond premium of $574,313, which is amortized over the life of the bonds. Also excluded from the table below is $161,910, which is unamortized debt issuance costs.
Fiscal YearBonds
Payable2018 $ 945 2019 950 2020 980 2021 1,000 2022 1,010
Thereafter 1,020 Total $ 5,905
Year Ended June 30 (In Thousands)
Endowment Funds — The foundation’s endowment includes both donor-restricted funds and funds designated by the foundation board of trustees to function as endowments. As required by generally accepted accounting principles, net assets associated with endowment funds, including funds designated by the board of trustees to function as endowments, are classified and reported based on the existence or absence of donor-imposed restrictions. Changes in endowment net assets as of June 30, 2017 are as follows:
UnrestrictedTemporarily Restricted
Permanently Restricted
Total Endowment Net Assets
Net assets, beginning of year $ (130) $ 6,208 $ 18,617 $ 24,695 Change in value of trusts 21 2,553 34 2,608 Contributions 2 671 992 1,665 Investment income (loss) 6 673 (5) 674 Amounts appropriated for expenditures (7) (1,439) (3) (1,449) Other transfers 175 36 (217) (6) Net assets, end of year $ 67 $ 8,702 $ 19,418 $ 28,187
Schedule of Endowment Net AssetsAs of June 30, 2017
(In Thousands)
59
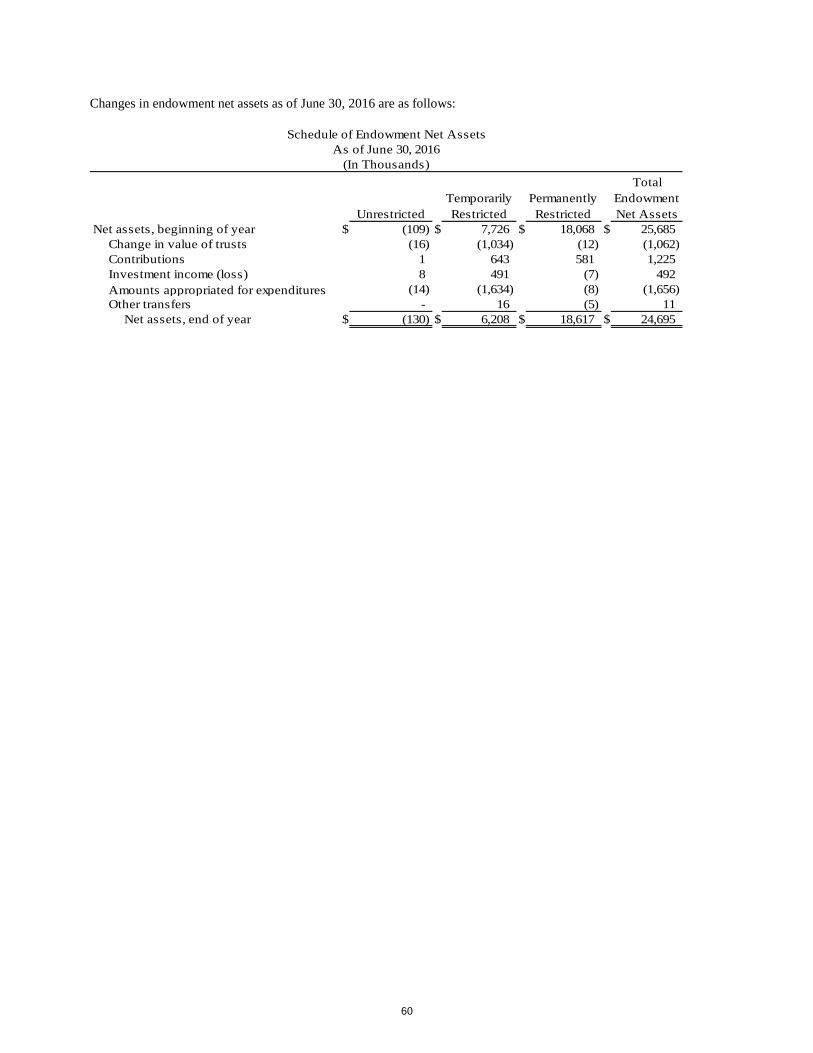
Changes in endowment net assets as of June 30, 2016 are as follows:
UnrestrictedTemporarily Restricted
Permanently Restricted
Total Endowment Net Assets
Net assets, beginning of year $ (109) $ 7,726 $ 18,068 $ 25,685 Change in value of trusts (16) (1,034) (12) (1,062) Contributions 1 643 581 1,225 Investment income (loss) 8 491 (7) 492 Amounts appropriated for expenditures (14) (1,634) (8) (1,656) Other transfers - 16 (5) 11 Net assets, end of year $ (130) $ 6,208 $ 18,617 $ 24,695
Schedule of Endowment Net AssetsAs of June 30, 2016
(In Thousands)
60

REQUIRED SUPPLEMENTARY INFORMATION SECTION
61

This page intentionally left blank
62

ST. CLOUD STATE UNIVERSITY SCHEDULE OF FUNDING PROGRESS FOR NET OTHER POSTEMPLOYMENT BENEFITS
Schedule of Funding Progress (In Thousands)
Actuarial Valuation
Date
Actuarial Value of Assets
Actuarial Accrued Liability
Unfunded Actuarial Accrued
Liability
Funded Ratio
Percentage Covered Payroll
UAAL as a Percentage of
Covered Payroll (a) (b) (b - a) (a/b) (c) ((b - a)/c)
July 1, 2006 $ — $ 9,105 $ 9,105 0.00 $ 99,283 9.17 July 1, 2008 — 8,915 8,915 0.00 103,060 8.65 July 1, 2010 — 11,506 11,506 0.00 113,311 10.15 July 1, 2012 — 8,361 8,361 0.00 98,825 8.46 July 1, 2014 — 9,293 9,293 0.00 106,625 8.72 July 1, 2016 — 6,415 6,415 0.00 94,806 6.77
63

ST. CLOUD STATE UNIVERSITY SCHEDULES OF PROPORTIONATE SHARE OF NET PENSION LIABILITY AND CONTRIBUTIONS STATE EMPLOYEES RETIREMENT FUND
Schedule of Proportionate Share of MSRS Net Pension Liability (In Thousands)
Measurement Date
Proportionate Share as a
Percentage of Net Pension
Liability Proportionate
Share Covered Employee
Payroll
Proportionate Share as a
Percentage of Covered Payroll
Plan Fiduciary Net Position as a
Percentage of Total Pension Liability
June 30, 2014 0.94 $ 15,199 $ 24,003 63.32 87.64 June 30, 2015 0.93 14,342 25,214 56.88 88.32
June 30, 2016 0.88 113,564 24,294 467.45 47.51
Schedule of Employer Contributions (In Thousands)
Fiscal Year Ended
Statutorily Required
Contributions
Contributions Recognized By MSRS
Contribution Deficiency (Excess)
Covered Payroll
Contributions as A Percentage of Covered Payroll
June 30, 2015 $ 1,387 $ 1,387 $ — $ 25,214 5.50 June 30, 2016 1,336 1,336 — 24,294 5.50 June 30, 2017 1,304 1,304 — 23,715 5.50
These schedules are intended to show information for ten years. Additional years will be displayed as they become available.
NOTES TO REQUIRED SUPPLEMENTARY INFORMATION FOR THE YEARS ENDED JUNE 30, 2017 and 2016
There have been no changes in plan provisions since the prior actuarial valuation.
There were changes in actuarial assumptions that affected the measurement of the total pension liability since the prior actuarial valuation. They are summarized as follows:
- The assumed post-retirement benefit increase rate was changed from 2.0 percent through 2043 and 2.5percent thereafter to 2.0 percent for all future years.
- The assumed investment return was changed from 7.90 percent to 7.50 percent. The single discount ratewas changed from 7.90 percent to 4.17 percent.
- Salary increases, retirement, termination, disability, mortality, percent married, and benefit electionassumptions were changed pursuant to the experience study dated June 30, 2015. The assumed futuresalary increases, payroll growth, and inflation were decreased by a further 0.25 percent from thoseassumptions.
64

ST. CLOUD STATE UNIVERSITY SCHEDULES OF PROPORTIONATE SHARE OF NET PENSION LIABILITY AND CONTRIBUTIONS TEACHERS RETIREMENT FUND
Schedule of Proportionate Share of TRA Net Pension Liability (In Thousands)
Measurement Date
Proportionate Share as a
Percentage of Net Pension
Liability Proportionate
Share Covered Employee
Payroll
Proportionate Share as a
Percentage of Covered Payroll
Plan Fiduciary Net Position as a
Percentage of Total Pension Liability
June 30, 2014 0.25 $ 11,303 $ 11,196 100.96 81.50 June 30, 2015 0.22 13,844 11,365 121.82 76.77 June 30, 2016 0.20 48,301 10,567 457.08 44.88
Schedule of Employer Contributions (In Thousands)
Fiscal Year Ended
Statutorily Required
Contributions
Contributions Recognized
By TRA
Contribution Deficiency (Excess)
Covered Payroll
Contributions as A Percentage of Covered Payroll
June 30, 2015 $ 852 $ 852 $ — $ 11,365 7.50 June 30, 2016 792 792 — 10,567 7.50 June 30, 2017 831 831 — 11,074 7.50
These schedules are intended to show information for ten years. Additional years will be displayed as they become available.
NOTES TO REQUIRED SUPPLEMENTARY INFORMATION FOR THE YEARS ENDED JUNE 30, 2017 and 2016
There have been no changes in plan provisions since the prior actuarial valuation.
There were changes in actuarial assumptions that affected the measurement of the total pension liability since the prior actuarial valuation. They are summarized as follows:
- The assumed post-retirement benefit increase rate was changed from 2.0 percent through 2043 and 2.5percent thereafter to 2.0 percent for all future years.
- The single discount rate was changed from 8.00 percent to 4.66 percent.- Salary increases, retirement, termination, disability, mortality, percent married, and benefit election
assumptions were changed pursuant to the experience study dated June 10, 2015. The assumed futuresalary increases, payroll growth, and inflation were decreased by a further 0.25 percent from thoseassumptions.
65

ST. CLOUD STATE UNIVERSITY SCHEDULES OF PROPORTIONATE SHARE OF NET PENSION LIABILITY AND CONTRIBUTIONS GENERAL EMPLOYEES RETIREMENT FUND
Schedule of Proportionate Share of PERA Net Pension Liability (In Thousands)
Measurement Date
Proportionate Share as a
Percentage of Net Pension
Liability Proportionate
Share Covered Employee
Payroll
Proportionate Share as a
Percentage of Covered Payroll
Plan Fiduciary Net Position as a
Percentage of Total Pension Liability
June 30, 2014 0.0065 $ 307 $ 343 89.48 78.75 June 30, 2015 0.0056 291 315 92.30 78.19 June 30, 2016 0.0005 393 308 127.73 68.91
Schedule of Employer Contributions (In Thousands)
Fiscal Year Ended
Statutorily Required
Contributions
Contributions Recognized By PERA
Contribution Deficiency (Excess)
Covered Payroll
Contributions as A Percentage of Covered Payroll
June 30, 2015
$ 24 $ 24 $ — $ 315 7.50 June 30, 2016 23 23 — 308 7.50 June 30, 2017 20 20 — 266 7.50
These schedules are intended to show information for ten years. Additional years will be displayed as they become available.
NOTES TO REQUIRED SUPPLEMENTARY INFORMATION FOR THE YEARS ENDED JUNE 30, 2017 and 2016
There have been no changes in plan provisions since the prior actuarial valuation.
There were changes in actuarial assumptions that affected the measurement of the total pension liability since the prior actuarial valuation. They are summarized as follows:
- The assumed post-retirement benefit increase rate was changed from 1.0 percent through 2035 and 2.5percent thereafter to 1.0 percent for all years.
- The assumed investment return was changed from 7.90 percent to 7.50 percent. The single discountrate was changed from 7.90 percent to 7.50 percent.
- Salary increases, retirement, termination, disability, mortality, percent married, and benefit electionassumptions were changed pursuant to the experience study dated June 30, 2015. The assumed futuresalary increases, payroll growth, and inflation were decreased by a further 0.25 percent from thoseassumptions.
66

SUPPLEMENTARY SECTION
67

CliftonLarsonAllen LLPCLAconnect.com
INDEPENDENT AUDITORS’ REPORT ON INTERNAL CONTROL OVER FINANCIAL REPORTING AND ON COMPLIANCE AND OTHER MATTERS BASED ON AN AUDIT
OF FINANCIAL STATEMENTS PERFORMED IN ACCORDANCE WITH GOVERNMENT AUDITING STANDARDS
Board of Trustees Minnesota State Colleges and Universities St. Paul, Minnesota We have audited, in accordance with the auditing standards generally accepted in the United States of America and the standards applicable to financial audits contained in Government Auditing Standards issued by the Comptroller General of the United States, the financial statements of St. Cloud State University (the University), a campus of Minnesota State Colleges and Universities, and the discretely presented component unit, as of and for the year ended June 30, 2017, and the related notes to the financial statements, which collectively comprise St. Cloud State University’s basic financial statements, and have issued our report thereon dated November 14, 2017. The financial statements of the St. Cloud State University Foundation were not audited in accordance with Government Auditing Standards. Internal Control Over Financial Reporting In planning and performing our audit of the financial statements, we considered St. Cloud State University’s internal control over financial reporting (internal control) to determine the audit procedures that are appropriate in the circumstances for the purpose of expressing our opinions on the financial statements, but not for the purpose of expressing an opinion on the effectiveness of the University’s internal control. Accordingly, we do not express an opinion on the effectiveness of the University’s internal control. A deficiency in internal control exists when the design or operation of a control does not allow management or employees, in the normal course of performing their assigned functions, to prevent, or detect and correct misstatements on a timely basis. A material weakness is a deficiency, or a combination of deficiencies, in internal control such that there is a reasonable possibility that a material misstatement of the University’s financial statements will not be prevented, or detected and corrected on a timely basis. A significant deficiency is a deficiency, or combination of deficiencies, in internal control that is less severe than a material weakness, yet important enough to merit attention by those charged with governance. Our consideration of internal control was for the limited purpose described in the first paragraph of this section and was not designed to identify all deficiencies in internal control that might be material weaknesses or significant deficiencies and therefore, material weaknesses or significant deficiencies may exist that have not been identified. We did identify a deficiency in internal control described in the accompanying schedule of findings and recommendations as item 2017-001 that we consider to be a significant deficiency.
68

Board of Trustees Minnesota State Colleges and Universities
Compliance and Other Matters As part of obtaining reasonable assurance about whether the University’s financial statements are free of material misstatement, we performed tests of its compliance with certain provisions of laws, regulations, contracts, and grant agreements, noncompliance with which could have a direct and material effect on the determination of financial statement amounts. However, providing an opinion on compliance with those provisions was not an objective of our audit and, accordingly, we do not express such an opinion. The results of our test disclosed no instances of noncompliance or other matters that are required to be reported under Government Auditing Standards. St. Cloud State University’s Response to the Finding St. Cloud State University’s response to the finding identified in our audit is described in the accompanying schedule of findings and recommendations. The University’s response was not subjected to the auditing procedures applied in the audit of the financial statements and, accordingly, we express no opinion on it. Purpose of this Report The purpose of this report is solely to describe the scope of our testing of internal control and compliance and the results of that testing, and not to provide an opinion on the effectiveness of the University’s internal control or compliance. This report is an integral part of an audit performed in accordance with Government Auditing Standards in considering the University’s internal control and compliance. Accordingly, this communication is not suitable for any other purpose.
CliftonLarsonAllen LLP
Minneapolis, Minnesota November 14, 2017
69

ST. CLOUD STATE UNIVERSITY SCHEDULE OF FINDINGS AND RECOMMENDATIONS
YEAR ENDED JUNE 30, 2017
SIGNIFICANT DEFICIENCY 2017-01 FOOD SERVICE CONTRACT AUDIT ADJUSTMENT
Criteria: University management is responsible for establishing controls, processes, and procedures to ensure proper recording of transactions in accordance with generally accepted accounting principles.
Condition: During our audit procedures, we became aware of a new food service contract whereby the third party vendor made significant improvements to University facilities. An audit adjustment was proposed to record the building improvements as a capital asset and depreciate it in accordance with the amortization schedule of the contract. The asset balance is offset with unearned revenue for which the University will recognize revenue at the same rate the building improvement is depreciated. Cause: This issue is related to the University signing a new contract with a unique situation relating to improvements being paid for by a third party vendor. Effect: The University’s assets and liabilities were increased by $4,836,971. Other income and depreciation expense were increased by $428,529 as a result of the annual depreciation on the capital asset during the year. Recommendation: We recommend the University review processes and procedures related to vendor contracts in order to ensure proper recording of transactions and balance sheet activity. Management Response: University management concurs with the auditors’ recommendations and intends to review all newly signed contracts for financial statement implications upon signature of the contract.
70