Embed Size (px)
Citation preview
2013A N N U A L F I N A N C I A L R E P O R T O F T U F T S U N I V E R S I T Y

TABLE OF CONTENTS
PAGE
HIGHLIGHTS 2
2013 FINANCIAL REPORT 3
2013 ENDOWMENT AND INVESTMENT REPORT 9
REPORT OF INDEPENDENT AUDITORS 12
CONSOLIDATED FINANCIAL STATEMENTS AS OF AND FOR
THE YEAR ENDED JUNE 30, 2013, WITH SUMMARIZED
INFORMATION AS OF AND FOR THE YEAR ENDED JUNE 30, 2012:
Statement of Financial Position 13
Statement of Activities 14
Statement of Cash Flows 15
Notes to Consolidated Financial Statements 16
THE BOARD OF TRUSTEES OF TUFTS COLLEGE 38

2
TUFTS UNIVERSITY HIGHLIGHTS Fiscal years ended June 30, 2013 and 2008 (in thousands)
2013 2008 FINANCIAL
Total operating revenue $773,202
$651,016
Total net assets 2,076,651
2,078,046
Land, buildings and equipment, net 801,091
609,134
Investments, net of receivables and payables 2,003,680 1,807,912
Bonds and notes payable
639,958 349,809
CREDIT RATING
Standard & Poors AA- AA-
Moody's Aa2 Aa2 STUDENTS
Enrollment (full-time equivalent enrollment)
Undergraduate
5,167 4,996
Graduate
2,918 2,338
Professional
1,938 1,706
Certificate and other
287 315
Total full-time equivalent enrollment
10,310 9,355
Undergraduate Admission
Applicants
18,419 15,387
Selectivity
19% 28%
Yield
38% 32%
SAT (mean)
1,438 1,405
Total undergraduate student charges (tuition, room, board, mandatory fees)
$56,546
$46,860 PERSONNEL
Faculty
1,107 996
Staff
3,028 2,689
Total full-time equivalent
4,135 3,685
FACILITIES
Gross square feet 5,005,006 4,577,718

3
Other Assets
4%
Property and Equipment
27%
Investments69%
TUFTS UNIVERSITY 2013 FINANCIAL REPORT Fiscal year 2013 produced improved financial results with an increase in total net assets of $128 million. Investment performance accounted for the largest portion of the increase in net assets. The total return pool, which comprises the majority of the University’s investments, returned approximately 11% for the fiscal year. Capital contributions also continued to yield favorable results in 2013 as $76.9 million was raised in total achievement by the University. Unrestricted operating performance produced an increase in net assets of $6 million.
ASSETS Investments Long-term investment and related accounts ended the year at $2.0 billion, an $83 million or 4.3% one-year increase and a five-year compound annual growth rate of 2.1%. Please refer to the next section, 2013 Endowment and Investment Report, for additional discussion on the endowment and investments.
Property and Equipment Representing 27% of balance sheet assets, the University’s physical plant assets had an $801 million book value net of depreciation, growing by 3.6% this past year. Total 2013 capital expenditures amounted to $68 million with the completion of the Tisch Sports and Fitness Center expansion and renovations at the Dental Tower, Arnold building laboratories, TAB facade and the biology collaborative cluster. Major projects in progress include the Dental Building windows project, TAB Data Center, renovation of the Stearns facade, and renovation work on Wren and Haskell Halls and the Dewick-MacPhie dining hall.
-500
-400
-300
-200
-100
0
100
200
300
2009 2010 2011 2012 2013
Change in Net Assets $ in millions
Operations Capital Contributions Excess Investment Returns and Other Changes
Comprised primarily of cash and investments at 69% and property and equipment at 27%, total assets of $3.0 billion increased by 3.1% during the year with a compound five-year average increase of 2.4%.

4
Current21%
Long-term79%
Renewal The University is committed to preserving and renewing its physical resources, made possible by an increasing commitment of annual operating revenue and the prudent use of debt. During fiscal year 2012, the board approved a plan to significantly increase funds available for deferred maintenance. In accordance with the funding plan, the University spent $35 million in 2013 improving the condition of the physical plant. Funding in 2014 will decrease to $30 million. Funding over the next ten years is scheduled to total $433 million.
LIABILITIES
Debt The University’s outstanding debt totaled $640 million at fiscal year end June, 30, 2013. The University issued no new debt during the year. The proceeds of the $250 million Tufts University Series 2012A taxable bonds issued in fiscal year 2012 and due in April 2112 are being used as planned over five years to fund construction and renovation of classroom, office and research facilities to advance the University’s academic priorities. The University’s overall weighted average cost of capital as of June 30, 2013 was 4.84%. The debt service to operations ratio was 4.92% in fiscal year 2013, in keeping with the goal of maintaining debt service levels less than 5% of the operating budget. Over the past five years, this ratio ranged between 3.8% and 4.9%, enabling the University to maintain its strong credit ratings while benefiting from a low cost of capital.
The liability associated with interest rate swap agreements decreased from $77.0 million at June, 30, 2012 to $51.5 million at June, 30, 2013. These long term swaps are matched to the University’s variable rate debt to assure effectively fixed rate debt instruments. The agreements do not have covenants and do not require the University to post collateral.
Total liabilities reached a level of $915 million, a year-over-year decrease of $38 million. Long-term liabilities include bonds and notes payable, interest rate agreements, and government advances for student loans while current liabilities represent accounts payable, deferred revenue and other liabilities.

5
OPERATING RESULTS Despite the weak U.S economic recovery, the University demonstrated its commitment to fund strategic investments. Operations contributed $6 million to unrestricted net assets in fiscal year 2013 compared to $15 and $29 million, respectively, in fiscal year 2012 and 2011. Planned increases in tuition rates and student enrollment plus improved investment return utilized funded strategic investments in faculty, financial aid, systems, the Tufts Effectiveness in Administrative Management (TEAM) implementations, and century bond interest expense. Operating expenses outpaced revenue growth, posting a 5.3% increase to $767 million compared with operating revenue growth of 4.0% reaching $773 million.
A diversified revenue base mitigates the impact of losses in any one revenue source. In the last several years, the relative share of revenue components remained stable.
Tuition Tuition and fees increased 5.5% to $431 million with rate increases the main driver supplemented with higher enrollments than planned. From the prior year, undergraduate total student charges rose 3.8% and enrollment added 62 students to the unusually high 2011 level. Also contributing to growth were 103 extra graduate students in Arts & Sciences and 42 additional professional degree students in Medical, Dental and Cummings Schools along with rate increases of 2% to 5%.
Financial Aid Financial aid for all degree programs grew 5.9% to $113 million in fiscal year 2013 and remains among Tufts highest priorities. Supporting enrollment growth, aid expanded for Arts & Sciences PhD enrollment increases, and demonstrated need for undergraduate upperclass students required more funds than anticipated. The Medical School also continued with its plan to increase the number of ¼ tuition scholarships to MD students. Investment Return Utilized Investment return utilized includes investment income distributed from the Total Return Pool per the University’s spending policy along with income earned on short-term investments of the University’s working capital. Investment income utilized grew 17.1% over 2012 representing planned spending increases, additional spending on endowment funds that emerged from underwater, new gifts, interest from the century bond proceeds and a positive return on the Omidyar-Tufts Microfinance Fund.
As a percentage of total revenues, this strategically important funding source fell from 13.4% in 2008, a high water mark, to 12.0% in 2013 while improving from 10.7% in 2012. A significant portion of the increase this year was attributed to draws from temporarily restricted net assets accumulated in prior years.
Additional information regarding the Total Return Pool, the University’s spending policy, and the performance of the University’s investments can be found in the next section, 2013 Endowment and Investment Report.
Net Tuition and Fees, 41%
Government Grants and Contracts, 17%
Clinic, Other, 15%
Auxiliary , 7%
Contributions, Grants , 8%
Investment Return , 12%

6
Gifts, Grants and Contracts Comprising government and private research grants and contracts, the Commonwealth of Massachusetts appropriation for the Cummings School and gifts for operating use, revenue of $182 million rose 0.5% from the prior year. Though government grant and contract revenue totaling $135.3 million declined 1.9 % in fiscal year 2013, private grants of $30 million rose 9.3%. Due to termination of the federal stimulus funding program several schools experienced significant declines, most prominently the Medical and Cummings Schools and the Human Nutrition Research Center on Aging. Significant increases occurred in the Friedman School for the child obesity program, Arts & Sciences’ research in the Child Development and Mathematics departments, and the Biochemical Engineering department. The state appropriation rose over $1 million to $3.25 million, while gifts for current use achieved nearly $17 million posting a 6.2% increase.
Clinical and Other Educational Activities Revenue from clinical and other educational activities totaled $113 million in fiscal year 2013, falling almost $3 million from fiscal year 2012. Royalty payments accounted for more than $2 million of the decrease as did the $1.5 million final payment in 2012 for the Dental School’s graduate medical education program and a $1.5 million Medical School reduction in foreign fellow placements. The Cummings School’s Foster Hospital, Hospital for Large Animals and Tufts VETS performed well in 2013 with increased case loads and fees per case driving revenue up by over $2 million.
Expenses Operating expenses increased 5.3% from $729 million to $767 million in fiscal year 2013. Compensation, comprising 59% of expenses, rose 4% due primarily to a 2.8% annual merit salary increase, salaries and direct costs associated with revenue-generating programs, and a 7% increase in fringe benefit expense due to rising health care costs and higher than normal workmen’s compensation expenses.
The University continued its commitment to attract and retain outstanding faculty by providing competitive compensation packages and supporting research and teaching. Faculty salaries increased 5%, and much of the growth beyond merit is attributable to new faculty hires in several schools. Non-compensation expense increased 6% from $298 million to $317 million in fiscal year 2013. Interest expense on the new century bond, depreciation for the new Tisch Sports and Fitness Center, the biology collaborative cluster and the TAB façade, new Tufts Effectiveness in Administrative Management (TEAM) implementation expenses, and the variable costs of increased clinical revenue comprised most of the increase.
The pie chart displays the major natural classification categories. Over time, the share of expense components remained relatively stable with the exception of the facilities share adding the new century bond interest costs.
Compensation, 59%
Facilities, 16%
Supplies, 15%
Purchased Services, 8%
Travel, 2%
7
12 13 14 15 16 17
2009
2010
2011
2012
2013
Annual Giving$ in millions
020406080
100120
2009 2010 2011 2012 2013
Achievement$ in millions
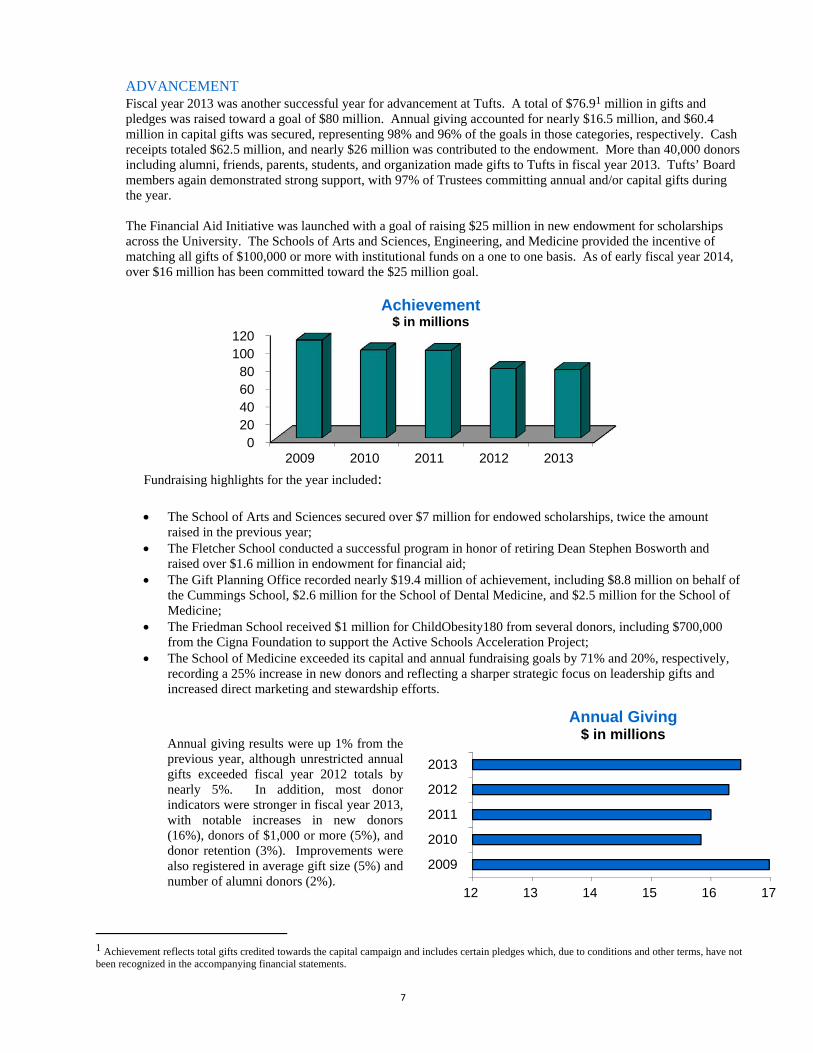
ADVANCEMENT Fiscal year 2013 was another successful year for advancement at Tufts. A total of $76.91 million in gifts and pledges was raised toward a goal of $80 million. Annual giving accounted for nearly $16.5 million, and $60.4 million in capital gifts was secured, representing 98% and 96% of the goals in those categories, respectively. Cash receipts totaled $62.5 million, and nearly $26 million was contributed to the endowment. More than 40,000 donors including alumni, friends, parents, students, and organization made gifts to Tufts in fiscal year 2013. Tufts’ Board members again demonstrated strong support, with 97% of Trustees committing annual and/or capital gifts during the year. The Financial Aid Initiative was launched with a goal of raising $25 million in new endowment for scholarships across the University. The Schools of Arts and Sciences, Engineering, and Medicine provided the incentive of matching all gifts of $100,000 or more with institutional funds on a one to one basis. As of early fiscal year 2014, over $16 million has been committed toward the $25 million goal.
Fundraising highlights for the year included:
The School of Arts and Sciences secured over $7 million for endowed scholarships, twice the amount
raised in the previous year; The Fletcher School conducted a successful program in honor of retiring Dean Stephen Bosworth and
raised over $1.6 million in endowment for financial aid; The Gift Planning Office recorded nearly $19.4 million of achievement, including $8.8 million on behalf of
the Cummings School, $2.6 million for the School of Dental Medicine, and $2.5 million for the School of Medicine;
The Friedman School received $1 million for ChildObesity180 from several donors, including $700,000 from the Cigna Foundation to support the Active Schools Acceleration Project;
The School of Medicine exceeded its capital and annual fundraising goals by 71% and 20%, respectively, recording a 25% increase in new donors and reflecting a sharper strategic focus on leadership gifts and increased direct marketing and stewardship efforts.
1 Achievement reflects total gifts credited towards the capital campaign and includes certain pledges which, due to conditions and other terms, have not been recognized in the accompanying financial statements.
Annual giving results were up 1% from the previous year, although unrestricted annual gifts exceeded fiscal year 2012 totals by nearly 5%. In addition, most donor indicators were stronger in fiscal year 2013, with notable increases in new donors (16%), donors of $1,000 or more (5%), and donor retention (3%). Improvements were also registered in average gift size (5%) and number of alumni donors (2%).

8
STUDENT DEMAND AND QUALITY The University continues to enjoy strong student demand in 2013-14 with the number of applicants totaling 18,419 and a freshman enrollment of 1,314. Tufts experienced improvement in the number of applicants who were accepted (selectivity) and of those accepted who matriculated (yield). The graph below shows these trends for the undergraduate population.
The quality of matriculating undergraduate students as measured by SAT scores continues to be excellent. Mean combined scholastic aptitude test (SAT) scores of Tufts’ entering classes reflect a trend of continuing student quality and mirror highly selective institutions.
0%
10%
20%
30%
40%
50%
13,000
14,000
15,000
16,000
17,000
18,000
19,000
2009-10 2010-11 2011-12 2012-13 2013-14
Undergraduate Student Demand
Applicants Selectivity Yield
1300
1350
1400
1450
2009-10 2010-11 2011-12 2012-13 2013-14
Mean Combined SATs
9
TUFTS UNIVERSITY
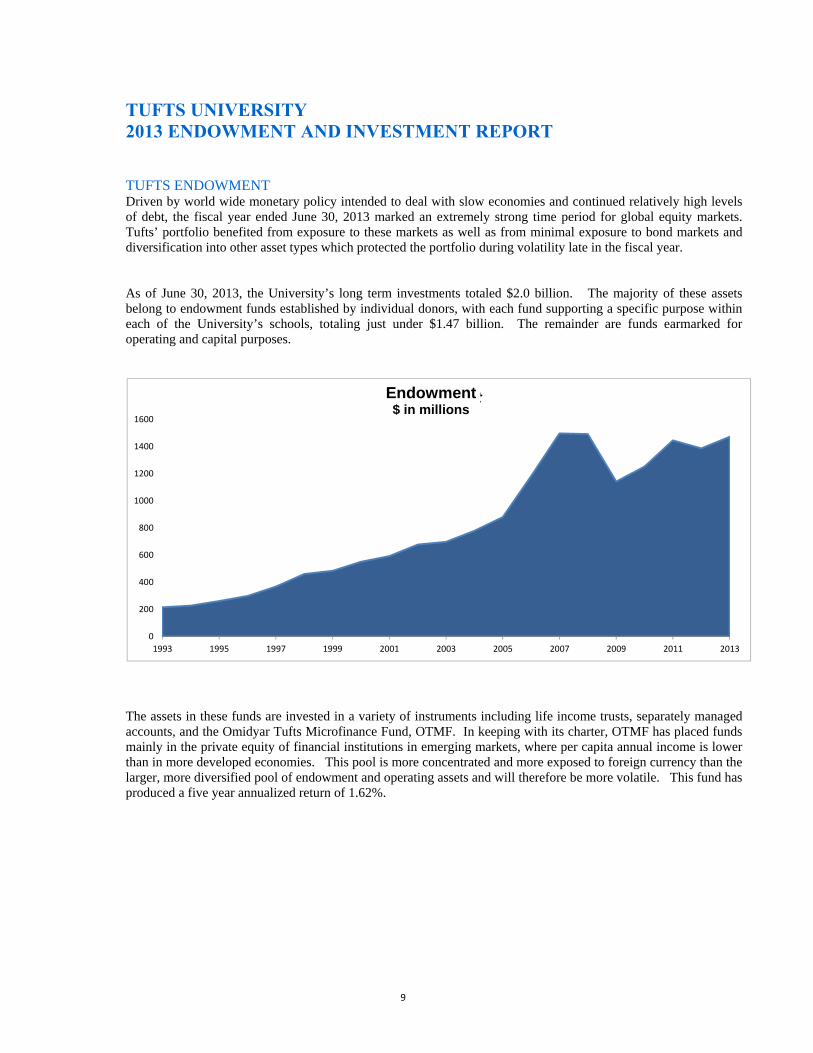
2013 ENDOWMENT AND INVESTMENT REPORT TUFTS ENDOWMENT Driven by world wide monetary policy intended to deal with slow economies and continued relatively high levels of debt, the fiscal year ended June 30, 2013 marked an extremely strong time period for global equity markets. Tufts’ portfolio benefited from exposure to these markets as well as from minimal exposure to bond markets and diversification into other asset types which protected the portfolio during volatility late in the fiscal year. As of June 30, 2013, the University’s long term investments totaled $2.0 billion. The majority of these assets belong to endowment funds established by individual donors, with each fund supporting a specific purpose within each of the University’s schools, totaling just under $1.47 billion. The remainder are funds earmarked for operating and capital purposes.
The assets in these funds are invested in a variety of instruments including life income trusts, separately managed accounts, and the Omidyar Tufts Microfinance Fund, OTMF. In keeping with its charter, OTMF has placed funds mainly in the private equity of financial institutions in emerging markets, where per capita annual income is lower than in more developed economies. This pool is more concentrated and more exposed to foreign currency than the larger, more diversified pool of endowment and operating assets and will therefore be more volatile. This fund has produced a five year annualized return of 1.62%.
0
200
400
600
800
1000
1200
1400
1600
1993 1995 1997 1999 2001 2003 2005 2007 2009 2011 2013
EndowmentEndowment$ in millions

10
TRP w/o Accruals, $1,580.5, 79%
Managed Outside Tufts, $25.0 , 1%
OTMF, $118.1 , 6%
Other (net), $277.6 , 14%
$2,001.2 million as of June 30, 2013
By far the largest investment is a diversified pool known within the University as the Total Return Pool, or TRP. This pool is managed for total return rather than current income and is the source of the cash for the spending distribution that supports the University’s purposes each year. The investment and performance discussion that follows applies to this Total Return Pool. Investment Objectives and Strategy Chief among endowment and investment goals is to provide intergenerational equity, meaning that future generations of students will enjoy the same level of support as the current generation. To achieve this, the endowment must maintain its purchasing power by earning a long term return that covers current budget support and incorporates growth to keep up with inflation. The Board of Trustees has established investment objectives for the endowment. Five percent of the value of the endowment is spent annually to support donors’ purposes. The Board applies a level of inflation to this required real rate of return, currently around three percent, to bring the current target rate of return to eight percent. During the 2013 fiscal year, the Board’s Administration and Finance Committee studied the level of spending from the endowment, and concluded that current spending levels are sustainable given long term (minimum of ten years) expected returns on asset classes and the endowment. These long term objectives are unlikely to change substantially from year to year, or even decade to decade. However the Board of Trustees, Investment Committee, and investment staff, regularly review portfolio strategy in light of the University’s changing needs and evolving risk tolerance. As a strong and well managed institution that typically “runs lean”, Tufts’ risk tolerance is moderate compared to many institutions, so it may be misleading to compare absolute returns without taking the risk component into account. Asset Allocation This past year the Investment Committee thoroughly reviewed and substantially revised its investment policies, including changes to the policy portfolio to reflect a simple, 70/30 allocation between global stocks and US bonds. In addition, each year the Investment Committee establishes an evaluation benchmark or portfolio reflecting a more diversified group of assets that respond differently to various economic conditions. This evaluation benchmark measures what performance would be if the Total Return Portfolio were invested in the exact market index for each asset class. The difference between these two portfolios measures the value added by allocating to a diversified pool of assets.

11
There have been no significant changes to the TRP’s asset allocation (as guided by the evaluation benchmark, formerly known as the policy benchmark or portfolio) in FY 2013 compared to prior fiscal years. Investment staff works consistently to insure that the portfolio does not deviate excessively from the allocations in the evaluation benchmark, despite shifting market conditions, since this represents the risk level to which the Investment Committee wishes to manage the portfolio. Performance Needless to say, in a year when equity markets performed well, the policy benchmark, with its high allocation to global equities exceeded the value of a diversified portfolio by a considerable margin. During 2013, the return of the 70% equity/30% US bonds portfolio was 11.17% vs. a return to the evaluation benchmark of 8.97%. The actual portfolio returned 11.14% for the fiscal year, net of all costs. The portfolio captured much of the upside provided by equity markets this year, at a considerably lower level of risk. Moreover the portfolio performed much as we would have expected in a volatile environment. Given political, fiscal and monetary uncertainty, more volatility is ahead and the portfolio should be well positioned to meet the challenges these conditions will present.
Endowments are managed to a perpetual time horizon and no single year will determine the future of the University. The Investment Committee remains focused on its mission to provide the best possible long term stewardship of the assets entrusted to the University.
10 Years 5 Years 3 Years 1 Year
Tufts Actual 6.67% 2.08% 9.46% 11.14%
Tufts Evaluation 7.27% 3.59% 8.29% 8.97%
Value Added ‐0.60% ‐1.51% 1.17% 2.17%
‐4.00%
‐2.00%
0.00%
2.00%
4.00%
6.00%
8.00%
10.00%
12.00%
Annualized Returns (Net of Fees) period ending June 30, 2013

PricewaterhouseCoopers LLP, 125 High Street, Boston, MA 02110 T: (617) 530 5000, F: (617) 530 5001, www.pwc.com/us
Independent Auditor's Report
To the Board of Trustees of
Tufts University
We have audited the accompanying consolidated financial statements of Tufts University (the “University”), which comprise the consolidated statement of financial position as of June 30, 2013, and the related consolidated statements of activities and cash flows for the year then ended. Management's Responsibility for the Consolidated Financial Statements
Management is responsible for the preparation and fair presentation of the consolidated financial statements in accordance with accounting principles generally accepted in the United States of America; this includes the design, implementation, and maintenance of internal control relevant to the preparation and fair presentation of consolidated financial statements that are free from material misstatement, whether due to fraud or error. Auditor's Responsibility Our responsibility is to express an opinion on the consolidated financial statements based on our audit. We conducted our audit in accordance with auditing standards generally accepted in the United States of America. Those standards require that we plan and perform the audit to obtain reasonable assurance about whether the consolidated financial statements are free from material misstatement. An audit involves performing procedures to obtain audit evidence about the amounts and disclosures in the consolidated financial statements. The procedures selected depend on our judgment, including the assessment of the risks of material misstatement of the consolidated financial statements, whether due to fraud or error. In making those risk assessments, we consider internal control relevant to the University's preparation and fair presentation of the consolidated financial statements in order to design audit procedures that are appropriate in the circumstances, but not for the purpose of expressing an opinion on the effectiveness of the University's internal control.
Accordingly, we express no such opinion. An audit also includes evaluating the
appropriateness of accounting policies used and the reasonableness of significant accounting estimates made by management, as well as evaluating the overall presentation of the consolidated financial statements. We believe that the audit evidence we have obtained is sufficient and appropriate to provide a basis for our audit opinion. Opinion In our opinion, the consolidated financial statements referred to above present fairly, in all material respects, the financial position of the University at June 30, 2013, and the changes in their net assets and their cash flows for the year then ended in accordance with accounting principles generally accepted in the United States of America. Other Matter We have previously audited the University’s 2012 financial statements, and we expressed an unmodified audit opinion on those audited financial statements in our report dated November 2, 2012. In our opinion, the summarized comparative information presented herein as of and for the year ended June 30,2012 is consistent, in all material respects, with the audited financial statements from which it has been derived.
November 1, 2013

13
TUFTS UNIVERSITY
AS OF JUNE 30, 2013 AND JUNE 30, 2012 (in thousands)
2013 2012
ASSETS
Cash and cash equivalents 64,195$ 72,463$ Receivables and other assets, net 33,955 34,267 Receivables for investments purchased, net 2,469 3,239 Contributions receivable, net 36,518 47,422 Student loans receivable, net 51,968 52,847
Investments 2,001,211 1,917,593
Land, buildings, and equipment, net 801,091 773,585
TOTAL ASSETS 2,991,407$ 2,901,416$
LIABILITIES AND NET ASSETS
LIABILITIES:
Accounts payable and accrued expenses 138,651$ 144,017$
Deferred revenue and deposits 57,219 57,690
Bonds and notes payable 639,958 646,805
Interest rate agreements 51,509 76,971
Government advances for student loans 27,419 27,104
Total liabilities 914,756 952,587
NET ASSETS:
Unrestricted 1,112,194 1,019,940
Temporarily restricted 426,847 404,007
Permanently restricted 537,610 524,882
Total net assets 2,076,651 1,948,829
TOTAL LIABILITIES AND NET ASSETS 2,991,407$ 2,901,416$
The accompanying notes are an integral part of these consolidated financial statements.
CONSOLIDATED STATEMENTS OF FINANCIAL POSITION

14
TUFTS UNIVERSITYCONSOLIDATED STATEMENTS OF ACTIVITIES FOR THE YEAR ENDED JUNE 30, 2013, WITH SUMMARIZED INFORMATION FOR THE YEAR ENDED JUNE 30, 2012 (in thousands)
Temporarily PermanentlyUnrestricted Restricted Restricted 2013 2012
OPERATIONS: REVENUE: Tuition and fees 431,044$ -$ -$ 431,044$ 408,543$ Less scholarships and fellowships (113,458) - - (113,458) (107,173)
Tuition and fees, net 317,586 - - 317,586 301,370 Government grants and contracts 135,334 - - 135,334 137,961 Clinical and other educational activities 112,582 - - 112,582 115,361 Auxiliary enterprises 52,371 - - 52,371 49,849 Contributions and grants 46,487 11,639 - 58,126 55,065 Investment return utilized 85,244 7,703 - 92,947 79,391 Net assets released from restrictions 23,598 (23,598) - - -
Total revenue 773,202 (4,256) - 768,946 738,997
EXPENSES: Salaries and wages 363,832 - - 363,832 350,592 Benefits 85,889 - - 85,889 80,066 Materials, supplies and other 114,008 - - 114,008 111,017 Purchased services 65,955 - - 65,955 62,830 Facility and maintenance costs 49,583 - - 49,583 50,489 Depreciation 42,961 - - 42,961 38,248 Interest 29,922 - - 29,922 21,175 Travel 14,983 - - 14,983 14,231
Total expenses 767,133 - - 767,133 728,648
INCREASE (DECREASE) IN NET ASSETS FROM OPERATING ACTIVITIES 6,069 (4,256) - 1,813 10,349
NONOPERATING ACTIVITIES: Investment return reinvested (utilized) 40,673 42,153 2,372 85,198 (83,188) Contributions and grants 2,347 1,753 10,356 14,456 14,296 Net assets released from restrictions for capital and other nonoperating purposes 16,810 (16,810) - - - Net unrealized gain (loss) on interest rate agreements 25,462 - - 25,462 (37,635) Change in funded status of postretirement health care plan 1,181 - - 1,181 (3,145) Other nonoperating activities (288) - - (288) (1,286)
INCREASE (DECREASE) IN NET ASSETS FROM NONOPERATING ACTIVITIES 86,185 27,096 12,728 126,009 (110,958)
INCREASE (DECREASE) IN NET ASSETS 92,254 22,840 12,728 127,822 (100,609)
NET ASSETS—Beginning of year 1,019,940 404,007 524,882 1,948,829 2,049,438
NET ASSETS—End of year 1,112,194$ 426,847$ 537,610$ 2,076,651$ 1,948,829$
Total
The accompanying notes are an integral part of these consolidated financial statements.

15
TUFTS UNIVERSITY
CONSOLIDATED STATEMENTS OF CASH FLOWSFOR THE YEAR ENDED JUNE 30, 2013 AND JUNE 30, 2012 (in thousands)
2013 2012
CASH FLOWS FROM OPERATING ACTIVITIES: Total increase (decrease) in net assets 127,822$ (100,609)$ Adjustments to reconcile total increase (decrease) in net assets to net cash and cash equivalents provided by operating activities: Net realized and unrealized investment (gains) losses (160,700) 19,602 Depreciation and amortization 42,134 37,384 Loss on disposal of fixed assets 2,631 728 Gifts of securities, property and equipment (2,798) (2,732) Settlements on interest rate swap agreements 7,697 7,549 Net unrealized (gain) loss on interest rate agreements (25,462) 37,635 Contributions restricted for long-term investment (17,160) (14,897) Changes in operating assets and liabilities: Receivables and other assets 312 (303) Contributions receivable 10,904 10,730 Accounts payable and accrued expenses (10,491) 22,492 Deferred revenue and deposits (471) (6,693)
Net cash and cash equivalents (used in) provided by operating activities (25,582) 10,886
CASH FLOWS FROM INVESTING ACTIVITIES: Student loans granted (6,076) (6,185) Student loans repaid 6,955 6,874 Change in receivable for investments sold 770 (3,239) Change in payable for investments purchased - (19,930) Purchases of investments (983,617) (922,953) Proceeds from sale of investments 1,063,416 771,659 Changes in funds held under bond agreements - 1,495 Additions to land, buildings, and equipment (67,890) (93,356) Net cash and cash equivalents provided by (used in) investing activities 13,558 (265,635)
CASH FLOWS FROM FINANCING ACTIVITIES: Increase in government advances for student loans 315 (166) Proceeds from issuance of bonds and notes 7,026 247,442 Cash paid on interest rate swap agreements (7,697) (7,549) Repayments of bonds and notes (13,048) (12,001) Proceeds from contributions restricted for long-term investment 17,160 14,897 Net cash and cash equivalents provided by financing activities 3,756 242,623
NET DECREASE IN CASH AND CASH EQUIVALENTS (8,268) (12,126)
CASH AND CASH EQUIVALENTS—Beginning of year 72,463 84,589
CASH AND CASH EQUIVALENTS—End of year 64,195$ 72,463$
SUPPLEMENTAL DATA:
Cash paid for interest, net of amounts capitalized 31,685$ 19,116$
Construction amounts remaining in accounts payable 16,495$ 11,370$
Gifts of securities, property and equipment 2,798$ 2,732$
The accompanying notes are an integral part of these consolidated financial statements.

16
TUFTS UNIVERSITY
NOTES TO CONSOLIDATED FINANCIAL STATEMENTS AS OF AND FOR THE YEARS ENDED JUNE 30, 2013 AND 2012
1. ORGANIZATION
Tufts University (the “University”), founded in 1852, is a not-for-profit institution committed to education and research. The University is a complex independent nonsectarian university, with approximately 10,300 students and three campuses in Boston, Medford/Somerville and Grafton, Massachusetts. The University provides degree programs at both undergraduate and graduate levels in a variety of liberal arts and professional areas. The University has been granted a tax-exemption as described in Section 501(c)(3) of the Internal Revenue Code (the “Code”) and is generally exempt from income taxes pursuant to Section 501(a) of the Code.
The following organizations are included in the consolidated financial statements of the University:
Walnut Hill Properties Corporation (“Walnut Hill”)—Walnut Hill is a not-for-profit corporation established by the University to own and manage certain investment and rental properties.
Tufts Veterinary Emergency Treatment & Specialties (“Tufts VETS”)—Tufts VETS is a not-for-profit corporation organized by the University to provide emergency and specialty veterinary services in a community environment. It provides postgraduate training in its emergency and critical care training program and training to veterinary students on elective rotations.
Tufts Media LLC (“Tufts Media”)—Tufts Media is a single member limited liability company created by the University to operate its consumer publishing and media capability.
JM Holding Corporation (“JM Holdings”)—JM Holdings is a for-profit development corporation created by the University to develop 106 acres designated for commercial use at the Cummings School of Veterinary Medicine. At this time, there is no development agreement.
Omidyar–Tufts Microfinance Fund (“Microfinance Fund”)—The Microfinance Fund was organized in October 2005 as a charitable trust to support, benefit and carry out the purposes of public charity beneficiaries, including the University, by engaging in two activities: promoting the relief of the poor and distressed through microfinance investments, and promoting education through grants. The capital assets of the Microfinance Fund were contributed by a third party and, according to the donor’s stipulation, are to be invested in microfinance-related ventures. The majority of the Microfinance Fund’s trustees are appointed by the University. In 2006, a $100 million contribution to establish the Microfinance Fund was recorded in temporarily restricted net assets.
The assets of any of the organizations included in the consolidated financial statements may not be available to meet the obligations of the other entities.
2. SUMMARY OF SIGNIFICANT ACCOUNTING POLICIES
Basis of Presentation—The accompanying consolidated financial statements have been prepared in accordance with accounting principles generally accepted in the United States of America on the accrual basis with net assets and revenues, expenses, gains and losses classified based on the existence or absence of donor-imposed restrictions. Accordingly, net assets of the University are classified and reported as follows:
Permanently Restricted—Net assets subject to donor-imposed stipulations that they be maintained in perpetuity by the University. Such net assets consist primarily of donor-restricted endowment funds.
Temporarily Restricted—Net assets subject to donor-imposed stipulations that may be satisfied by actions of the University that will expire with the passage of time or the occurrence of specific events.

17
Unrestricted—Net assets not subject to donor-imposed stipulations. Unrestricted net assets may be designated for specific purposes.
Consolidation—The consolidated financial statements include the accounts of the University and its wholly owned or controlled subsidiaries. Intercompany accounts and transactions have been eliminated.
Classifications—Expenses are reported as decreases in unrestricted net assets. Gains and losses on investments are reported as increases or decreases in unrestricted net assets unless their use is restricted by explicit donor stipulations or by law. Contributions and investment return for operating activities subject to donor-imposed stipulations not utilized in the current period are released from temporarily restricted net assets when spent and are reported as net assets released from restrictions under revenue from operating activities. Expirations of all other temporarily restricted net assets are reported in the nonoperating section of the statement of activities.
Contributions—Contributions, including unconditional promises to give, are recognized as revenue in the period received. Contributions restricted for the acquisition of land, buildings, and equipment are reported as increases in temporarily restricted net assets. These contributions are reclassified to unrestricted net assets as the funds are expended, or in the case of construction, when the related assets are placed in service. Promises to give subject to donor-imposed stipulations that the corpus be maintained in perpetuity are recognized as increases in permanently restricted net assets.
Conditional promises to give are not recognized until the conditions on which they depend are substantially met. Contributions of assets other than cash are reported at their estimated fair value at the date of gift. Pledges for contributions scheduled to be received after one year are discounted using factors that approximate the risk and the expected term of the promise to give. Amortization of the discount is recorded as additional contributions in the appropriate net asset class.
Investments—Investments are reported at fair value. Dividends, interest, gains and losses on investments are reported as increases or decreases:
in permanently restricted net assets if the terms of the gift require that they be added to the principal of a permanent endowment or loan fund;
in temporarily restricted net assets if the terms of the gift or relevant state law impose restrictions on the current use of the income or net gains. The University has relied on the Massachusetts Attorney General’s interpretation of relevant state law that unappropriated endowment gains should generally be classified as temporarily restricted; and
in unrestricted net assets in all other cases.
Investments are comprised of the assets of the University’s endowment and nonendowment funds. The majority of these assets are invested in the University’s Total Return Pool. The Total Return Pool assets are owned by participating funds based on shares acquired by each fund when it entered the pool. The fair value of the pooled assets is determined each month and the resulting value per share is used to account for funds entering or leaving the pool. The University has established spending policies for endowment and nonendowment investments in the Total Return Pool as follows:
Endowment Spending Policy—The Board of Trustees determines the method to be used to appropriate endowment funds for expenditure. The objective of the policy is to ensure that endowment income available to support operations is stable and predictable, while at the same time increases over time to offset the effects of inflation. Endowment funds receive income distributions equal to the current spending level of all funds in the Total Return Pool. The targeted distribution is 5% of each fund’s market value, but may vary with market conditions. The dollar amount is then increased each year by 3-4%. The policy provides for management to adjust the spending rate as necessary if it does not remain within a range of 4.5% to 5.5% of the pool’s market value calculated as of December 31 of the previous year. In establishing this policy, the Board considered the expected long term rate of return on its endowment.
Nonendowment Spending Policy—The nonendowment investments in the Total Return Pool consist of operating and capital funds. These long-term funds, while invested in a similar manner as the endowment, are
18
not intended to be held in perpetuity. For these investments, the University has adopted a fixed annual spending rate equivalent to 6% of the market value calculated as of June 30 of the previous year.
Spending on all investments held outside the Total Return Pool represents the yield earned, unless otherwise prescribed by donor restrictions.
The Board of Trustees of the University has interpreted the “Uniform Prudent Management of Institutional Funds Act” (“UPMIFA”) as requiring the preservation of the original gift as of the gift date of the donor-restricted endowment funds absent explicit donor stipulations to the contrary. As a result of this interpretation, the University classifies as permanently restricted net assets, (a) the original value of gifts donated to the permanent endowment, (b) the original value of subsequent gifts to the permanent endowment, and (c) accumulations to the permanent endowment made in accordance with the direction of the applicable donor gift instrument at the time the accumulation is added to the fund. The remaining portion of the donor-restricted endowment fund that is not classified in permanently restricted net assets is classified as temporarily restricted net assets until those amounts are appropriated for expenditure in a manner consistent with the standard of prudence prescribed by UPMIFA.
Operations and Nonoperating Activities—The consolidated statement of activities reports changes in unrestricted, temporarily restricted, and permanently restricted net assets from operations and nonoperating activities. Operations include temporarily restricted contributions that will be released to unrestricted as used for operational purposes. Non-operating includes the release from restrictions of contributions restricted to the acquisition of buildings and equipment and other transfers between restriction categories; investment return in excess of the University’s operating needs as defined by its spending policy or amounts used in excess of investment return; endowment contributions, unrealized gains or losses on interest rate agreements; changes in the funded status of the postretirement health care plan; and unrestricted bequests and gifts of property.
Tuition revenue is reported in the period earned net of the discount attributable to reductions in amounts charged to students, whether as unrestricted University financial aid, distributions from endowment funds, or government aid awarded to students by the University. Revenue associated with research and other grants and contracts is recognized when related expenses are incurred. Revenue from all other sources is recognized in the period earned. Included in operating activities are revenues earned and related expenses incurred for auxiliary enterprises. Auxiliary enterprises include student housing, dining, health fees and other miscellaneous charges.
Cash and Cash Equivalents—Short-term investments with maturities at the dates of purchase of three months or less are classified as cash and cash equivalents. Certain balances meeting the definition of cash equivalents have been classified as investments as a result of the University’s intent to segregate funds from cash available for current operations.
Land, Buildings, and Equipment—Land, buildings, and equipment are stated at cost at date of purchase or fair value at date of donation in the case of gifts. Depreciation is provided using the straight-line method over the assets’ estimated useful lives, which range from 15 to 60 years for land improvements, 10 to 60 years for buildings, and 7 to 20 years for equipment and furnishings.
Perpetual Trusts, Life Income, and Annuity Agreements—The University has an interest in various perpetual trusts, irrevocable charitable remainder trusts, and life income and annuity agreements. Assets held in these trusts and agreements, which are administered by the University or third-party trustees, are included in investments and totaled approximately $51,100,000 and $47,500,000 at June 30, 2013 and 2012, respectively. Contributions are recognized at the date the trusts or annuity agreements are established. The primary unobservable input used in the fair value measurement of the charitable remainder trust and life income and annuity assets is the discount rate. Significant fluctuation in the discount rates utilized in this calculation could result in a material change in fair value. The primary unobservable inputs used in the fair value measurement of the perpetual trust assets are the underlying securities held by the trust. Significant fluctuation in the market value of these underlying securities could result in a material change in fair value. Liabilities associated with life income and annuity agreements are recorded at the present value of the estimated future payments to be made to the donors and/or other beneficiaries by the University. The liabilities associated with life income and annuity agreements are adjusted during the term of the life income agreement or annuity for changes in the value of the assets, accretion of the discount and other changes in the estimates of future payments. The liabilities are included in accounts payable and accrued expenses and totaled approximately $11,700,000 and $11,200,000 at June 30, 2013 and 2012, respectively.

19
Use of Estimates—The preparation of financial statements in conformity with accounting principles generally accepted in the United States of America requires management to make estimates and assumptions that affect the reported amounts of assets and liabilities and disclosure of contingent assets and liabilities at the date of the financial statements and the reported amounts of revenues and expenses during the reporting period. Actual results could differ from these estimates.
New Accounting Pronouncements— Effective July 1, 2012, the University adopted ASU 2011-4, Amendments to Achieve Common Fair Value Measurement and Disclosure Requirements in U.S. GAAP and IFRS. ASU 2011-4 aids entities in measuring fair value, as well as provides guidelines for additional quantitative and qualitative disclosures for instruments categorized within Level 3 of the FASB’s fair value hierarchy. The effects of adopting this amendment are addressed in the University’s Investments and Fair Value Measurements note.
In addition to the disclosures above, additional disclosures under the fair value measurement standard became effective for fiscal years beginning after December 31, 2010. The new guidance required the activity in the Level 3 rollforward to be reported on a gross, rather than net basis. The University adopted this guidance as of June 30, 2012.
In October 2012, the FASB issued ASU 2012-05, Not-for-Profit Entities: Classification of the Sale Proceeds of Donated Financial Assets in the Statement of Cash Flows. This standard defines the appropriate financial reporting for the receipt of donated securities in the Statement of Cash Flows. Donated securities with no donor-imposed restrictions are to be included in the Operating section of the statement, while donated securities with donor-imposed long-term restrictions should be included in the financing section. ASU 2012-05 is effective for fiscal year 2014. The implementation of ASU 2012-05 is not expected to have any material effect on the University’s consolidated financial statements.
Subsequent events—The University has evaluated the impact of subsequent events through November 1, 2013, representing the date the financial statements were issued. Prior Year Summarized Information—The consolidated statement of activities includes certain prior-year summarized comparative information in total, but not by net asset class. Such information does not include sufficient detail to constitute a presentation in conformity with generally accepted accounting principles. Accordingly, such information should be read in conjunction with the University’s consolidated statement of activities for the year ended June 30, 2012, from which the summarized information was derived.
3. RECEIVABLES AND OTHER ASSETS Receivables represent amounts due from students, grants and contracts, clinic billings, and other sources. Other assets include deferred charges, prepaid expenses, and inventories. The components at June 30, 2013 and 2012 are as follows (in thousands):
2013 2012
Gross receivables 27,113$ 28,099$
Less allowance for uncollectible amounts (1,547) (1,627)
Receivables, net 25,566 26,472
Other assets 8,389 7,795
Total 33,955$ 34,267$

20
4. CONTRIBUTIONS RECEIVABLE
Contributions receivable at June 30, 2013 and 2012, which are recorded at fair value, consisted of the following (in thousands):
2013 2012
Unconditional promises scheduled to be collected in:
Less than one year 26,684$ 36,635$
One year to five years 14,934 16,431 More than five years 1,189 907
Gross contributions receivable 42,807 53,973
Less allowance for uncollectible amounts (5,503) (5,671)
Less discount to present value (786) (880)
Total 36,518$ 47,422$
Contributions receivable at June 30, 2013 and 2012 were intended for the following purposes (in thousands):
2013 2012
Endowment for educational and general purposes 18,101$ 23,404$
Construction and modernization of plant 4,250 5,952
Support of current operations 14,167 18,066
Total 36,518$ 47,422$
5. STUDENT LOANS RECEIVABLE
Student loans receivables at June 30, 2013 and 2012 consisted of the following (in thousands):
2013 2012
Student loans receivable 52,813$ 53,710$
Less allowance for uncollectible amounts (845) (863)
Total 51,968$ 52,847$
Loans receivable are principally amounts due from students under U.S. Government-sponsored loan programs, which are subject to significant restrictions. Generally, payment on student loans receivable commences upon graduation and can extend up to 20 years. Interest rates range from 2% to 18%.
The University assesses the adequacy of the allowance for doubtful accounts by evaluating the loan portfolio, including such factors as the differing economic risks associated with each loan category, the financial condition of specific borrowers, the economic environment in which the borrowers operate, the level of delinquent loans, and, where applicable, the existence of any guarantees or indemnifications. In addition to these factors, the University reviews the aging of the loans receivable and the default rate in comparison to prior years. The allowance is adjusted based on these reviews. The University considers the allowance at June 30, 2013 and 2012 to be reasonable and adequate to absorb potential credit losses inherent in the loan portfolio.

21
6. INVESTMENTS AND FAIR VALUE MEASUREMENTS
The accounting standard for fair value measurement establishes a hierarchy of valuation inputs based on the extent to which the inputs are observable in the marketplace. Observable inputs reflect market data obtained from sources independent of the reporting entity and unobservable inputs reflect the entities’ own assumptions about how market participants would value an asset or liability based on the best information available. Valuation techniques used to measure fair value under the accounting standard must maximize the use of observable inputs and minimize the use of unobservable inputs. The accounting standard describes a fair value hierarchy based on three levels of inputs, of which the first two are considered observable and the last unobservable, that may be used to measure fair value.
The following describes the hierarchy of inputs used to measure fair value and the primary valuation methodologies used by the University for financial instruments measured at fair value on a recurring basis. The three levels of inputs are as follows:
Level 1 - Quoted prices in active markets for identical assets or liabilities.
Level 2 - Inputs other than Level 1 that are observable, either directly or indirectly, such as quoted prices for similar assets or liabilities; quoted prices in markets that are not active; or other inputs that are observable or can be corroborated by observable market data for substantially the same term of the assets or liabilities.
Level 3 - Unobservable inputs that are supported by little or no market activity and that are significant to the fair value of the assets or liabilities.
A financial instrument's categorization within the valuation hierarchy is based upon the lowest level of input that is significant to the fair value measurement.
The University invests in alternative investments, consisting of hedge funds, private equities, real estate, natural resources and commingled public equity funds through various limited partnerships and similar vehicles. Alternative investments utilize a variety of investment strategies incorporating marketable securities and, in some cases, derivative instruments, all of which are reported at fair value or its equivalent as estimated by management using values provided by external investment managers. Hedge funds consist of limited partnership investments in stocks, bonds, commodities, currencies, derivatives and other instruments and often use non-traditional portfolio management techniques including shorting, leveraging, arbitrage and swaps. Commingled public equity funds consist of investments in commingled investment products that invest in long positions of publicly traded equity. Private equity investments consist of long-term private investment securities. Real estate consists of investments in privately held and publicly traded REITs and other privately held entities. Natural resources consist of private investments. Estimates of fair value may differ significantly from values that would have been used had a ready market for the investments existed. The University is obligated under certain limited partnership agreements and other alternative investment arrangements to advance additional funding periodically up to specified levels.

22
The following tables present the financial instruments carried at fair value as of June 30, 2013 and 2012, by the fair value hierarchy defined above (in thousands):
Assets as of June 30, 2013:
Quoted Prices in Active Markets (Level 1)
Significant Other
Observable Inputs
(Level 2)
Significant Unobservable
Inputs (Level 3)
Total Fair Value
Investments: Equity securities $ 24,055 $ - $ 17,531 41,586$ Commingled public equity funds - 359,166 12,809 371,975 Fixed income securities 374,314 1,651 22,285 398,250 Hedge funds - 410,988 180,840 591,828 Private equities - - 283,078 283,078 Real estate 15,580 19,123 141,176 175,879 Natural resources - - 80,793 80,793 Other - 5,552 8,325 13,877 Total Investments $ 413,949 $ 796,480 $ 746,837 1,957,266$
Liabilities:Interest rate swaps liability $ - 51,509$ $ - 51,509$
Assets as of June 30, 2012:
Quoted Prices in Active Markets (Level 1)
Significant Other
Observable Inputs
(Level 2)
Significant Unobservable
Inputs (Level 3)
Total Fair Value
Investments:
Equity securities $ 20,666 $ - $ 16,252 36,918$
Commingled public equity funds - 337,319 - 337,319
Fixed income securities 380,267 2,043 27,462 409,772
Hedge funds - 365,815 208,623 574,438
Private equities - - 277,208 277,208
Real estate 18,757 16,141 124,070 158,968
Natural resources - 28,496 64,663 93,159
Other - 5,399 7,737 13,136
Total Investments $ 419,690 $ 755,213 $ 726,015 1,900,918$
Liabilities:Interest rate swaps liability $ - 76,971$ $ - 76,971$
23
Excluded from the tables above, but included in total investments at June 30, 2013 and 2012, are cash and cash equivalents amounting to approximately $43,945,000 and $16,675,000, respectively. The value of certain alternative investments represents the ownership interest in the net asset value (“NAV”) of the respective partnership. The fair values (NAV) of the securities held by limited partnerships that do not have readily determinable fair values are determined by the general partner and are based on appraisals, or other estimates that require varying degrees of judgment. These values are agreed to by management of the University. If no public market exists for the investment securities, the fair value is determined by the general partner or management for securities held directly, taking into consideration, among other things, the cost of the securities, prices of recent significant placements of securities of the same issuer, and subsequent developments concerning the companies to which the securities relate. The University has performed significant due diligence around these investments to ensure NAV is an appropriate measure of fair value as of June 30. Interest rate swaps, held for investment purposes, are valued using both observable and unobservable inputs, such as quotations received from the counterparty, dealers or brokers, whenever available and considered reliable. In instances where models are used, the value of the interest rate swap depends upon the contractual terms of, and specific risks inherent in the instrument as well as the availability and reliability of observable inputs. Such inputs include market prices for reference securities, yield curves, credit curves, measures of volatility, prepayment rates, assumptions for nonperformance risk, and correlations of such inputs. The interest rate swap arrangements have inputs which can generally be corroborated by market data and are therefore classified within Level 2.
Beneficial and perpetual trusts held by third parties are valued at the present value of the future distributions expected to be received over the term of the agreement and are classified as Level 3.
The methods described above may produce a fair value calculation that may not be indicative of net realizable value or reflective of future fair values. Furthermore, while the University believes its valuation methods are appropriate and consistent with other market participants, the use of different methodologies or assumptions to determine the fair value of certain financial instruments could result in a different estimate of fair value at the reporting date.
The University also invests directly in private companies that are primarily valued using industry standard methodologies, as applicable. Management strives to corroborate information from third-party sources for relevance and accuracy; these valuations are subject to significant review and consideration by management. The valuation procedures performed on these assets are based on industry standard processes for each respective asset class. The inputs utilized in any valuation model may be significant and unobservable, and require a certain degree of judgment. Management examines market data and collaborates closely with industry experts to attempt to arrive at the best estimation of fair value for each respective asset. While the inputs described below represent the range of inputs utilized as of the measurement date, these inputs may change over time, which may have a material effect on the valuation of these types of investments in the future.
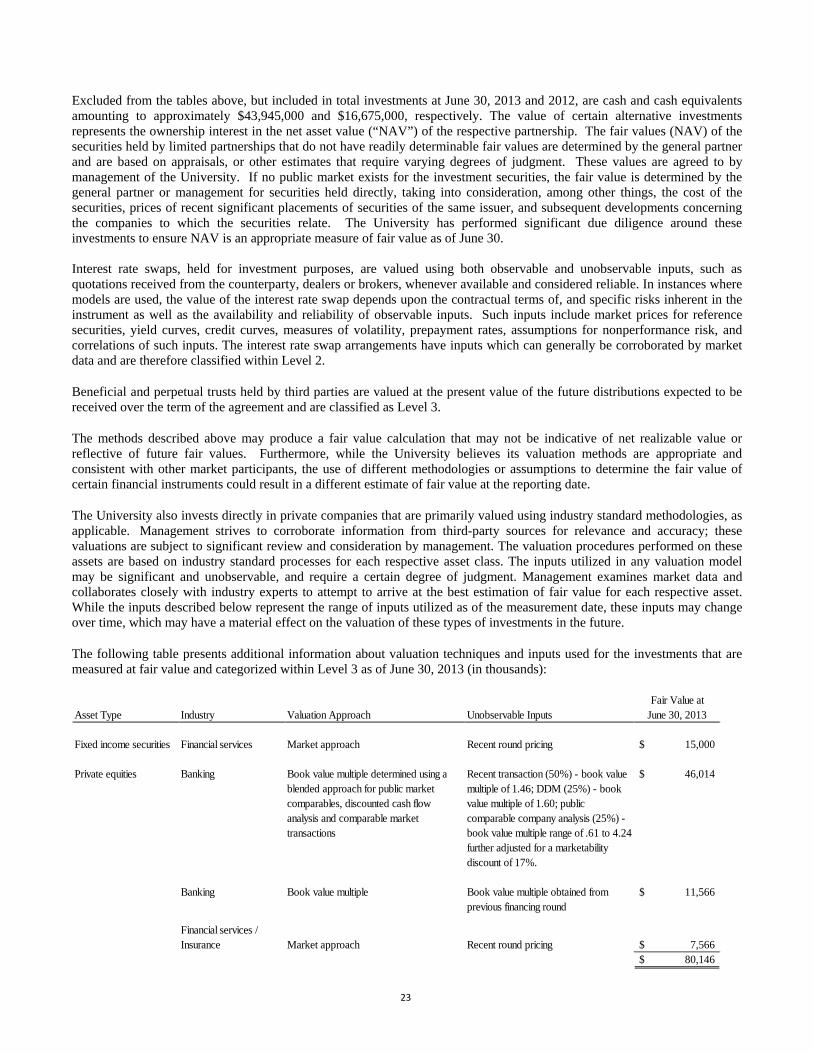
The following table presents additional information about valuation techniques and inputs used for the investments that are measured at fair value and categorized within Level 3 as of June 30, 2013 (in thousands):
Fair Value atAsset Type Industry Valuation Approach Unobservable Inputs June 30, 2013
Fixed income securities Financial services Market approach Recent round pricing 15,000$
Private equities Banking Book value multiple determined using a blended approach for public market comparables, discounted cash flow analysis and comparable market transactions
Recent transaction (50%) - book value multiple of 1.46; DDM (25%) - book value multiple of 1.60; public comparable company analysis (25%) - book value multiple range of .61 to 4.24 further adjusted for a marketability discount of 17%.
46,014$
Banking Book value multiple Book value multiple obtained from previous financing round
11,566$
Financial services / Insurance Market approach Recent round pricing 7,566$
80,146$
24
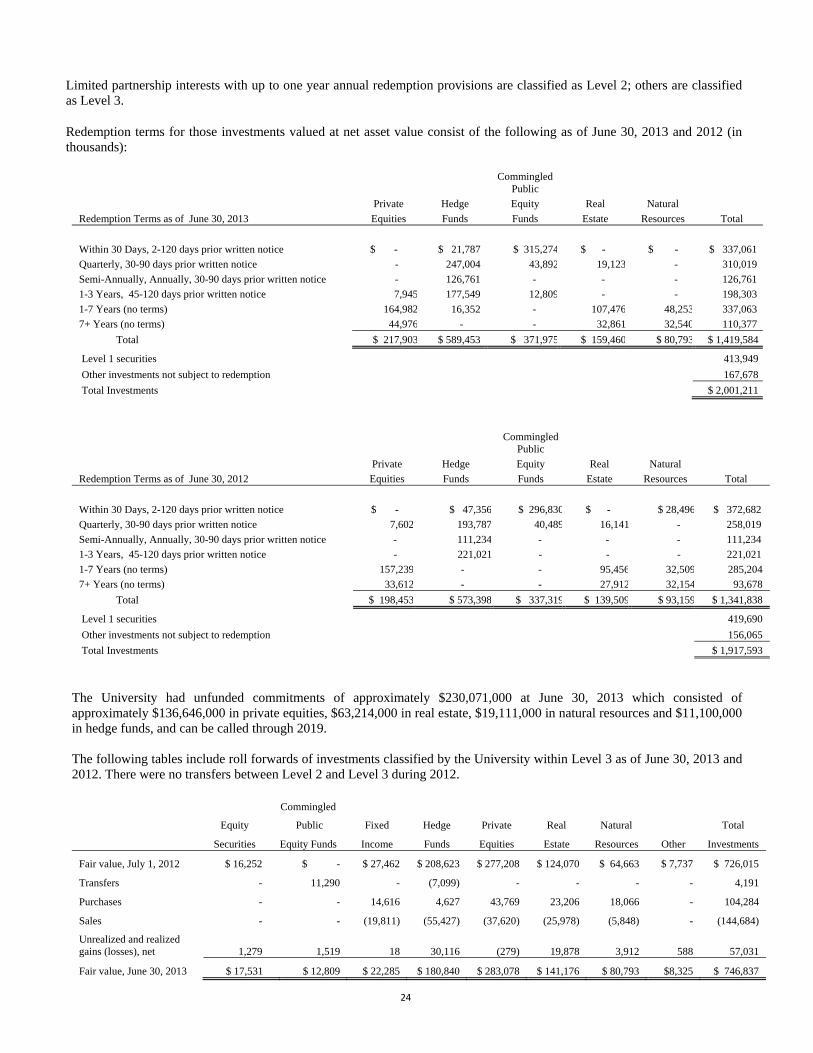
Limited partnership interests with up to one year annual redemption provisions are classified as Level 2; others are classified as Level 3.
Redemption terms for those investments valued at net asset value consist of the following as of June 30, 2013 and 2012 (in thousands):
Commingled Public
Private Hedge Equity Real Natural
Redemption Terms as of June 30, 2013 Equities Funds Funds Estate Resources Total
Within 30 Days, 2-120 days prior written notice $ - $ 21,7878 $ 315,274 $ - $ - $ 337,061
Quarterly, 30-90 days prior written notice - 247,0044 43,892 19,123 - 310,019
Semi-Annually, Annually, 30-90 days prior written notice - 126,7611 - - - 126,761
1-3 Years, 45-120 days prior written notice 7,945 177,5499 12,809 - - 198,303
1-7 Years (no terms) 164,982 16,3522 - 107,476 48,253 337,063
7+ Years (no terms) 44,976 - - 32,861 32,540 110,377
Total $ 217,903 $ 589,4533 $ 371,975 $ 159,460 $ 80,793 $ 1,419,584
Level 1 securities 413,949
Other investments not subject to redemption 167,678
Total Investments $ 2,001,211
Commingled Public
Private Hedge Equity Real Natural
Redemption Terms as of June 30, 2012 Equities Funds Funds Estate Resources Total
Within 30 Days, 2-120 days prior written notice $ - $ 47,356 $ 296,830 $ - $ 28,496 $ 372,682
Quarterly, 30-90 days prior written notice 7,602 193,787 40,489 16,141 - 258,019
Semi-Annually, Annually, 30-90 days prior written notice - 111,234 - - - 111,234
1-3 Years, 45-120 days prior written notice - 221,021 - - - 221,021
1-7 Years (no terms) 157,239 - - 95,456 32,509 285,204
7+ Years (no terms) 33,612 - - 27,912 32,154 93,678
Total $ 198,453 $ 573,398 $ 337,319 $ 139,509 $ 93,159 $ 1,341,838
Level 1 securities 419,690
Other investments not subject to redemption 156,065
Total Investments $ 1,917,593
The University had unfunded commitments of approximately $230,071,000 at June 30, 2013 which consisted of approximately $136,646,000 in private equities, $63,214,000 in real estate, $19,111,000 in natural resources and $11,100,000 in hedge funds, and can be called through 2019. The following tables include roll forwards of investments classified by the University within Level 3 as of June 30, 2013 and 2012. There were no transfers between Level 2 and Level 3 during 2012.
Equity
Commingled
Public Fixed Hedge Private Real Natural Total
Securities Equity Funds Income Funds Equities Estate Resources Other Investments
Fair value, July 1, 2012 $ 16,252 $ - $ 27,462 $ 208,623 $ 277,208 $ 124,070 $ 64,663 $ 7,737 $ 726,015
Transfers - 11,290 - (7,099) - - - - 4,191
Purchases - - 14,616 4,627 43,769 23,206 18,066 - 104,284
Sales - - (19,811) (55,427) (37,620) (25,978) (5,848) - (144,684)
Unrealized and realized gains (losses), net 1,279 1,519 18 30,116 (279) 19,878 3,912 588 57,031
Fair value, June 30, 2013 $ 17,531 $ 12,809 $ 22,285 $ 180,840 $ 283,078 $ 141,176 $ 80,793 $8,325 $ 746,837

25
Equity Fixed Hedge Private Real Natural Total
Securities Income Funds Equities Estate Resources Other Investments
Fair value, July 1, 2011 $ 16,187 $ 27,856 $ 215,472 $ 225,275 $ 107,430 $ 56,955 $
6,954 $ 656,129
Purchases - 350 10,000 68,595 23,086 9,005 - 111,036
Sales - (179) (21,923) (27,812) (11,014) (7,282) - (68,210)
Unrealized and realized gains (losses), net 65 (565) 5,074 11,150 4,568 5,985 783 27,060
Fair value, June 30, 2012 $ 16,252 $ 27,462 $ 208,623 $ 277,208 $ 124,070 $ 64,663 $7,737 $ 726,015
The total return on investments for the years ended June 30, 2013 and 2012 is as follows (in thousands):
7. LAND, BUILDINGS, AND EQUIPMENT
Land, buildings, and equipment at June 30, 2013 and 2012 consisted of the following (in thousands):
Depreciation expense charged to operations was approximately $42,959,000 and $38,248,000 in 2013 and 2012, respectively. Net interest cost capitalized in fiscal 2013 and 2012 was $1,159,000 and $1,141,000 respectively. Maintenance and repairs are expensed as incurred, and improvements are capitalized. When assets are retired or disposed of, the cost and accumulated depreciation thereon are removed from the accounts and gains or losses are included in other nonoperating activities on the statement of activities.
2013 2012
Land and land improvements 45,891$ 45,809$
Buildings 1,096,973 1,017,282
Construction in progress 67,824 94,280
Equipment and furnishings 172,526 159,561
1,383,214 1,316,932
Less accumulated depreciation (582,123) (543,347)
Total 801,091$ 773,585$
2013 2012
Dividends and interest 17,445$ 15,805$
Net realized and unrealized gains (losses) 160,700 (19,602)
Total return on investments 178,145 (3,797)
Investment return utilized (92,947) (79,391)
Investment return reinvested (utilized) 85,198$ (83,188)$

26
8. BONDS AND NOTES PAYABLE
Bonds and notes payable at June 30, 2013 and 2012 consisted of the following (in thousands):
2013 2012Massachusetts Industrial Finance Agency (“MIFA”):
Series H, fixed rate bonds at 5.50%, due through 2013 -$ 1,830$
Massachusetts Health and Educational Facilities Authority ("MHEFA"):
Series G, variable rate bonds, 5.21% average rate for 2013,
due 2024-2026 25,100 25,100
Series J, fixed rate bonds at 5.50%, due 2013-2018 28,530 31,300
Series M, fixed rate bonds at 5.00-5.50%, due 2014-2028 59,150 59,150
Series N-1, variable rate bonds, 4.09% average rate for 2013, 84,400 84,700
due 2029-2040
Series N-2, variable rate bonds, 3.99% average rate for 2013, 54,200 54,200
due 2022-2034
Series O, fixed rate bonds at 4.00%-5.38%, due 2013-2038 73,280 74,360
Massachusetts Development Finance Agency ("MDFA"):
Series P, fixed rate bonds at 3.00%, due 2036 49,835 49,835
Tufts Issue 2012A, taxable fixed rate bond at 5.017%, due 2112 250,000 250,000
Citizens Bank
Note - rate fixed at 5.46% until maturity in 2016 7,500 7,500
Letter of credit at fixed rate of 5.46% until maturity in 2016 1,500 1,500
Note, rate fixed at 7.19% until maturity in 2016 96 123
Capital Leases—various imputed interest rates, due through 2014 68 82 633,659 639,680
Net unamortized bond premium 6,299 7,125
Total bonds and notes payable 639,958$ 646,805$
The average rates reflected above for the variable rate bonds are computed based on the variable interest, fees and related swap interest payments. Series P is a long term multi-modal bond (final maturity 2036), the first mode of which is a 5 year put bond with a 3% coupon. The issue has two associated swaps; one fixed to variable and the second variable to fixed. The average rate for fiscal 2013 was 6.30%.

27
Scheduled aggregate principal repayments on bonds and notes payable at June 30, 2013 are as follows (in thousands):
Fiscal Year
Ending Scheduled Principal
Maturities
2014 $ 5,721
2015 6,800
2016 15,721
2017 7,379
2018 7,772
Thereafter 590,266
Total $ 633,659
Included in the University’s debt is $164,000,000 of variable rate demand bonds (“VRDBs”). The University has entered into standby bond purchase agreements with a diverse group of financial institutions to secure bond repayment and interest obligations associated with its VRDBs. In fiscal year 2012, the University replaced the three standby bond purchase agreements with substantially similar agreements with other financial institutions. In the event a bond cannot be remarketed, the bond may be “put” to the standby bond purchase agreements providers, resulting in a loan to fund redemption of the bond. If it is assumed that outstanding bonds are put during fiscal year 2013, the maximum aggregate scheduled principal repayments under the VRDB-related standby bond purchase agreements would be as follows: $54,566,667 in 2014, $54,566,667 in 2015 and $54,566,667 in 2016.
The University’s debt is stated at cost. The fair value has been calculated by determining the net present value of future cash outlays using an appropriate interest rate based on the length of time to maturity and non-performance risk. The rates were based upon market conditions as of June 30, 2013 and 2012. The estimated fair values at June 30, 2013 and 2012 are approximately $647,233,000 and $706,956,000, respectively. The University determined the fair value of its existing fixed rate debt obligations based on trade data, broker/dealer quotes and other observable market data. The carrying amounts of its variable rate debt obligations approximately fair value because the obligations are currently callable at a price equal to the carrying amounts. The University considers this to be a Level 2 measurement.
The University issued $250,000,000 of Tufts University, Taxable Bonds, Series 2012A in March 2012. The University issued the series, which is due April 2112, at par.
Interest Rate Agreements— The University has entered into derivative transactions for the purpose of reducing the impact of fluctuations in interest rates and reducing interest expense. The University has entered into fixed-to-floating and floating-to-fixed interest rate swaps and basis swaps.

28
The following summarizes the terms for each of the interest rate swap agreements as of June 30, 2013 and June 30, 2012 (in thousands).
Swap Agreements as of June 30, 2013
Swaps Interest Rate
Swap Interest Rate
Swap Interest Rate
Swap Interest Rate
Swap Interest Rate
Swap Interest Rate
Reverse Swap
Debt Hedged (Series P) (Series G & N-1) (Series N-1) (Series N-1) (Series N-2)
(Series P)
Notional Amount $50,500 $39,900 $40,000 $34,000 $54,000
$50,500
Termination Date
February 15, 2036
August 15, 2033
August 15, 2040
August 15, 2036
August 15, 2034
February 16, 2016
Fair Value June 30, 2013
($19,718) ($10,050) ($5,565) ($8,273) ($10,127)
$2,224
Swap Agreements as of June 30, 2012
Swaps Interest Rate
Swap Interest Rate
Swap Interest Rate
Swap Interest Rate
Swap Interest Rate
Swap Interest Rate
Reverse Swap
Debt Hedged (Series P) (Series G & N-1) (Series N-1) (Series N-1) (Series N-2)
(Series P)
Notional Amount $50,500 $39,900 $40,000 $34,000 $54,000
$50,500
Termination Date
February 15, 2036
August 15, 2033
August 15, 2040
August 15, 2036
August 15, 2034
February 16, 2016
Fair Value June 30, 2012 ($26,222) ($13,881) ($10,091) ($12,982) ($16,538)
$2,743
The University reported the fair value of its interest rate swap agreements in the statement of financial position as a liability of $51,509,000 and $76,971,000 at June 30, 2013 and 2012, respectively. The change in fair market value of approximately $25,462,000 and $37,635,000 for the years ended June 30, 2013 and 2012, respectively, is included in the statement of activities as net unrealized gain or loss on interest rate agreements.
The interest rate swap on Series N-1 for $40,000,000 was amended in November 2009 to change the rate paid by the counterparty to 69% of one month of LIBOR for three years. In November 2012, the rate reverted back to 64.4% of the five year USD-ISDA swap rate.
The estimated market value of the interest rate exchange agreements at June 30, 2013 and June 30, 2012, was computed using the net present value of fixed and floating future cash flows, with floating future cash flows estimated through the use of forward interest rate yield curves adjusted for non-performance risk. These financial instruments necessarily involve counterparty credit exposure. The counterparties for these interest rate exchange transactions are a diversified group of major financial institutions that meet the University’s criteria for financial stability and credit worthiness.

29
9. NET ASSETS
Net assets at June 30, 2013 and 2012 consisted of the following (in thousands):
Temporarily Permanently 2013 2012Unrestricted Restricted Restricted Total Total
Endowment 585,615$ 369,566$ 517,174$ 1,472,355$ 1,386,697$
Invested in physical plant 335,919 - - 335,919 331,364
Operating 129,759 49,396 19 179,174 158,817
Building projects 38,326 7,835 - 46,161 29,918
Student loans 22,575 50 20,417 43,042 42,033
Total 1,112,194$ 426,847$ 537,610$ 2,076,651$ 1,948,829$
Endowment consists of resources that have been restricted by the donor, trust, split interest agreement, or designated by the Board of Trustees for investment to provide future resources to support the University’s activities. Temporarily restricted endowment includes unappropriated gains of approximately $189,744,000 and $148,857,000 in 2013 and 2012, respectively. Unrestricted operating includes funds that have been internally designated for use by various schools, departments, and programs throughout the University.
The University’s endowment consists of approximately 1,800 individual donor restricted endowment funds and 50 board-designated endowment funds for a variety of purposes plus the following where the assets have been designated for endowment: pledges receivables, split interest agreements, and other net assets. The net assets associated with endowment funds, including funds designated by the Board of Trustees to function as endowments, are classified and reported based on the existence or absence of donor imposed restrictions.

30
Changes in endowment net assets for the years ended June 30, 2013 and June 30, 2012 are as follows (in thousands):
Temporarily Permanently 2013 2012
Unrestricted Restricted Restricted Total Total
Endowment net assets, beginning of year
$ 551,843 $ 329,945 $ 504,909 $ 1,386,697 $ 1,445,681
Investment return:
Investment income 6,284 7,373 - 13,657 14,018
Realized and unrealized gains (losses) 61,220 83,342 1,557 146,119 (5,812)
Total investment return 67,504 90,715 1,557 159,776 8,206
Contributions 1,053 8 10,063 11,124 8,005
Appropriation of endowment assets for expenditure (38,401) (52,241) - (90,642) (79,572)
Other changes, net 3,616 1,139 645 5,400 4,377
Endowment net assets, end of year 585,615$ 369,566$ 517,174$ 1,472,355$ 1,386,697$
Other changes include additions or deductions to the endowment from net transfers resulting from changes in donor restrictions or University designations. The temporarily restricted endowment funds consist of the following components (in thousands): 2013 2012 Subject to time restriction $116,291 $114,768 Restricted for program support 253,275 215,177 Total endowment assets classified as temporarily restricted net assets $369,566 $329,945 The portion of perpetual endowment funds that is required to be retained (in thousands): 2013 2012 Restricted for scholarship support $222,815 $212,053 Restricted for faculty support 121,450 115,215 Restricted for program support 172,909 177,641 Total endowment assets classified as permanently restricted net assets $517,174 $504,909 Endowment Funds with Deficits From time to time, the fair value of assets associated with individual donor-restricted endowment funds may fall below the value of the initial and subsequent donor gift amounts. When donor endowment deficits exist, they are classified as a reduction of unrestricted net assets. Deficits of this nature reported in unrestricted net assets were approximately $1,474,000 and $4,498,000 as of June 30, 2013 and 2012, respectively. These deficits resulted from market losses.

31
10. FUNCTIONAL CLASSIFICATION OF EXPENSES
The University reports operating expenses in its consolidated statement of activities by natural classification. Operating expenses by functional category for the years ended June 30, 2013 and 2012 consisted of the following (in thousands):
2013 2012
Instruction 231,497$ 212,153$ Sponsored programs 149,855 147,386 Clinical and other educational activities 134,444 132,397 Academic and student services 109,994 105,219 Auxiliary enterprises 55,046 51,879 Institutional support 86,297 79,614
Total expenses 767,133$ 728,648$
Interest, depreciation, operations, and maintenance expenses have been allocated to functional expense classifications based on square footage utilized.
11. BENEFIT PLANS
Defined Contribution Plan—The University sponsors a defined contribution retirement plan under Section 401(a) of the Code, which is available to eligible faculty and administrative staff. All retirement benefits are funded by the University and are subject to a vesting schedule. The University’s contributions to the plan amounted to approximately $26,401,000 and $25,500,000 in 2013 and 2012, respectively.
The University also offers a supplemental retirement plan under Section 403(b) of the Code, which is fully funded by voluntary employee contributions.
Deferred Compensation Plans—The University maintains two separate plans under Section 457(b) of the Code for eligible officers, faculty and administrative staff. The University funded the Officers’ Plan with approximately $79,000 and $70,000 in 2013 and 2012, respectively. Under the terms of the Faculty and Administrative Staff Plan, no contributions are made by the University but are fully funded by voluntary employee contributions. The assets and related liabilities of these plans are recorded in investments and accrued liabilities in the consolidated financial statements and total approximately $10,443,000 and $8,538,000 in 2013 and 2012, respectively. The University also maintains a plan under Section 457(b) of the Code for eligible faculty and administrative staff that was closed to future participants in 1989. The University funded this plan with approximately $3,900 and $3,900 in 2013 and 2012, respectively. The investment assets and related liabilities of these plans, which total approximately $4,752,000 and $5,135,000 in 2013 and 2012, respectively, are recorded in investments and accrued liabilities in the consolidated financial statements of financial position.
Health and Welfare Benefit Plan—The University provides postretirement health care benefits to eligible retired employees and their eligible spouses. Retirees share in the cost of their health care benefits through co-payments and deductibles related to years of service and date of retirement. Employees who were hired after December 31, 1993, must pay for the entire cost of their benefit when they retire. The University established a trust to fund the postretirement health care benefits for most of the eligible employees. The trust qualifies as a “voluntary employees beneficiary association” (“VEBA”) under the provisions of Section 501(c)(9) of the Code in order that the trust be exempt from certain taxes.

32
Changes in the University’s postretirement health care benefit obligation for the years ended June 30, 2013 and 2012 are as follows (in thousands):
2013 2012
Benefit obligation—Beginning of year 32,255$ 30,893$
Service cost 403 370
Interest cost 1,121 1,515
Benefits paid (3,800) (3,888)
Participants’ contributions 1,916 1,846
Actuarial loss 1,245 1,519
Special termination benefits 85 -
Benefit obligation—end of year 33,225$ 32,255$
The funded status of the University’s postretirement health care plan and the amounts recognized in the consolidated statements of financial position at June 30, 2013 and 2012 are as follows (in thousands):
2013 2012
Fair value of plan assets—beginning of year $ 29,134 $ 30,895
Actual return on plan assets 3,686 (65)
Additional employer contributions to VEBA 260 324
Employer contributions for key employees 30 22
Plan participant contributions 1,916 1,846
Benefits paid (3,800) (3,888)
Fair value of plan assets—end of year $ 31,226 $ 29,134
Funded Status $ (1,999) $ (3,121)
Amounts recognized in the Statement of Financial Position (in thousands):
2013 2012
Accounts payable and accrued expenses (1,999)$ (3,121)$
Net amount recognized in the statement of financial position (1,999)$ (3,121)$

33
Amounts not yet reflected in net periodic benefit cost and included in unrestricted net sssets
(in thousands):
2013 2012
Unamortized net transition obligation -$ 813$
Unamortized actuarial loss 4,437 4,805
Change to unrestricted net assets 4,437$ 5,618$
2013
Amortization of transition obligation -$
Amortization of actuarial loss 123
Amounts to be recognized in the following year 123$
Amounts expected to be recognized in net periodic cost in the following year (in thousands):
The components of net periodic benefit cost (in thousands):
2013 2012
Service cost 403$ 370$
Interest cost 1,121 1,515
Expected return on plan assets (2,243) (2,377)
Amortization of net obligation at transition 813 816
Amortization of net actuarial loss 170 -
Special termination benefits 85 -
Net periodic benefit cost 349$ 324$

34
Health Care Cost Trend Rate
Fiscal Year Ending 2013
Fiscal Year Ending 2012
2014 7.50% 2013 7.50%
2015 6.50% 2014 6.50%
2016 5.50% 2015 5.50%
2017 + 4.50% 2016 + 4.50%
Other changes recognized in unrestricted net assets in nonoperating activities (in thousands):
2013 2012
Net gain (198)$ 3,961$
Amortization of transition (obligation) (813) (816)
Amortization of loss (170) -
Total changes recognized in unrestricted net assets (1,181)$ 3,145$
Total changes recognized in net periodic cost and in nonoperating activities (832)$ 3,469$
Additional Disclosure Information on Assets and Cash Flows
The weighted-average assumptions to determine obligations are as follows:
2013 2012
Discount rate at end of year 4.10% 3.60%
The weighted-average assumptions to determine net periodic benefit cost are as follows:
2013 2012
Discount rate at beginning of year 3.60% 5.10%
Expected return on plan assets during year 8.00% 8.00%

35
Impact of 1% increase in health care cost trend on
Interest cost plus service cost during past year 173,000$
Accumulated postretirement benefit obligation 3,227,000$
Impact of 1% decrease in health care cost trend on
Interest cost plus service cost during past year (147,000)$
Accumulated postretirement benefit obligation (2,776,000)$
The expected future benefit payments net of employee contributions (in thousands):
Expected Net Expected Medicare
Benefit Payments Part D Subsidy Payments
Fiscal Year Ending in 2014 2,422 360
Fiscal Year Ending in 2015 2,514 383
Fiscal Year Ending in 2016 2,603 401
Fiscal Year Ending in 2017 2,603 419
Fiscal Year Ending in 2018 2,548 444
Fiscal Year Ending in 2019 through fiscal year ending 2023 11,897 2,578
The estimated University cash contributions for fiscal year 2014 are $349,000.
VEBA Trust Asset Allocation and Investment Strategy— The weighted-average investment allocation of plan assets by category is as follows:
2013 2012Target
Allocation
Equity securities 59% 58% 58%
Debt securities 28% 29% 29%
Real estate securities 13% 13% 13%
Total 100% 100% 100%
The Health and Welfare Benefit Plan fiduciaries set the investment policy and strategy for investment of plan assets, including selecting investment managers and setting long-term risk and return objectives. The asset allocations are broadly diversified among asset category and within each category, which lowers the expected volatility of the portfolio’s return and may protect against negative market environments.
To determine the expected long-term rate of return on plan assets, the University considers the target asset allocations, and the expected return on assets by category.
Equity securities primarily include mutual fund investments in large-cap and small-cap companies primarily located in the United States. Debt securities include high quality, investment grade and international bond funds. Real estate securities consist of mutual fund investments in domestic and international real estate investment trusts.

36
The fair values of the University's post-retirement health care plan assets at June 30, 2013 and 2012 by asset category (in thousands):
VEBA Trust Investments at June 30, 2013 Level 1 Level 2 Level 3 Total
Equity securities $ 18,182 $ - $ - $ 18,182 Debt securities 8,734 - - 8,734 Real estate securities 3,850 - - 3,850 $ 30,766 $ - $ - $ 30,766
VEBA Trust Investments at June 30, 2012 Level 1 Level 2 Level 3 Total
Equity securities $ 16,862 $ - $ - $ 16,862 Debt securities 8,240 - - 8,240 Real estate securities 3,828 - - 3,828 $ 28,930 $ - $ - $ 28,930
At June 30, 2013 and 2012, the plan also held cash and cash equivalents amounting to $460,000 and $202,000.
12. RELATED ORGANIZATIONS
Tufts Shared Services, Inc. (“TSS”)—The University and Tufts Medical Center, Inc. (“Medical Center”) jointly formed TSS, a not-for-profit service corporation, to provide the organization and facilities for coordinating certain education and health services activities. The administrative board of TSS includes equal representation from the University and the Medical Center. The cost of services provided by TSS to the University for the years ended June 30, 2013 and 2012 were approximately $5,691,000 and $5,653,000, respectively. The University’s investment in TSS has been recorded at approximately $8,325,000 and $7,737,000 at June 30, 2013 and 2012 using the equity method of accounting. The accounts of TSS are included in the accompanying consolidated financial statements of the University using the equity method of accounting, in investments and non-operating revenues.

37
13. CONTINGENCIES AND COMMITMENTS
Outstanding commitments on construction contracts amounted to approximately $25,127,000 at June 30, 2013.
There are currently several legal cases pending involving labor relations and other matters related to the normal operation of the University. The University believes that the outcome of these cases will have no significant effect on the financial position or results of operations of the University.
Operating Leases—The University has several noncancelable operating lease commitments at June 30, 2013, with terms in excess of one year for office space. Expenses associated with operating leases totaled approximately $5,081,000 and $6,150,000 for the years ended June 30, 2013 and 2012, respectively.
Future minimum lease payments under operating leases are as follows (in thousands):
Fiscal Year 2014 $ 4,637 Fiscal Year 2015 3,971 Fiscal Year 2016 2,966 Fiscal Year 2017 2,623 Fiscal Year 2018 2,180 Thereafter 3,736 Total $ 20,113

38
TUFTS UNIVERSITY
The Board of Trustees of Tufts College AS OF JUNE 30, 2013
OFFICERS OF THE CORPORATION James A. Stern, Chair David Kahle, Vice President for Information Technology Peter Dolan, Vice Chair William O’Reilly Vice Chair
and Chief Information Officer Tod Hibbard, Assistant Treasurer
Jonathan Tisch Vice Chair Anthony P. Monaco, President of the University
Paul Tringale; Secretary of the Corporation Michael Baenen, Assistant Secretary of the Corporation
David R. Harris, Provost and Senior Vice President Patricia Campbell, Executive Vice President Eric C. Johnson, Vice President for University Advancement PRESIDENTS EMERITIMary R. Jeka, Senior Vice President for University Relations John DiBiaggio (1992-2001)Kathleen Cronin, Vice President for Human Resources Lawrence S. Bacow (2002-2012) Thomas S. McGurty, Vice President for Finance and Treasurer Linda Snyder, Vice President for Operations MEMBERS OF THE BOARD OF TRUSTEES TRUSTEES EMERITI (cont.) MEMBERS OF THE James A. Stern, Chair A. Dana Callow, Jr. (2002-2012) ADMINISTRATION AND Peter Dolan, Vice Chair Warren Ellis Carley (1964-1981) FINANCE COMMITTEE William O’Reilly Vice Chair Kathryn C. Chenault (1998-2008) Steven Galbraith , Chair Jonathan M. Tisch Vice Chair Anthony Monaco, President of the University
Robert S. Cohen (1984-1993) William S. Cummings (1986-1996)
Thomas Alperin Daniel Doherty
Thomas M. Alperin Robert R. Bendetson
Marilyn J. Ducksworth (1993-2003) Steven B. Epstein (1999-2009)
Laurie A. Gabriel Michael S. Gordon
Alison “Sunny” Breed Issam Fares (1992-2000) Brian H. Kavoogian Betsy Busch, M.D. Nathan Gantcher (1983-2003) Jeffrey B. Kindler Anthony D. Cortese Leslie H. Gelb (1988-1998) Jeffrey M. Moslow John H. de Jong Nelson S. Gifford (1978-1995) Karen M. Pritzker Jeannie Diefenderfer Brian M. Golden M.D. (1996-2006) Hugh R. Roome III Daniel Doherty Laurie A. Gabriel
Maurene L. Golden (1985-1996) Dr. Bernard M. Gordon (1996-2006)
Andrew Safran James A Stern
Steven M. Galbraith Martin J. Granoff (1998-2008) Tina Surh Steven A. Goldstein Annetta Grisard-Schrafl (1997-2007) James Wong Michael S. Gordon Sharon Mead Halverson (2004-2009) Anthony Monaco ex officio Diane S. Hessan Varney Hintlian
Joanne S. Gowa (2000-2010) Dr.Bernard Harleston (2002-2007)
Deborah Jospin Frederick H. Hauck (1988-2002) MEMBERS OF THE AUDITBrian H. Kavoogian Monte R. Haymon (1994-2004) COMMITTEE Jeffrey B. Kindler Irwin M. Heller (1998-2008) Brian H. Kavoogian, Chair Debra S. Knez Jane C.I. Hirsh (1999-2009) Peter R. Dolan Ellen J. Kullman Michael Jaharis (1993-2003) Ellen J. Kullman Andrew Liveris Abby F. Kohnstamm (1999-2009) Kathleen O’Loughlin Kathleen A. McCartney Daniel A. Kraft (2002-2012) David Rone Seth I. Merrin John A. Krol (1992-2002) Hugh R. Roome III Ioannis Miaoulis Robert Legvold (1991-2001) Jeffrey Moslow Bruce M. Male (2000-2006) Kathleen O’Loughlin Karen M. Pritzker
Ursula B. Marvin (1975-1985) Karen B. Mavrides (2002-2007)
David Rone David J. McGrath (1999-2009) Hugh R. Roome III Edward H. Merrin (1980-1991) Andrew Safran William G. Meserve (1979-1997) Janice Savin-Williams Joseph E. Neubauer (1986-2008) Neal Shapiro Thomas O'Brien (1978-1992) Tina Surh Pierre M. Omidyar (2000-2010) Alfred I. Tauber, M.D. Inez Smith Reid (1988-1998) Teri Coleman Volpert Ruth L. Remis (1980-1990) Gloria White-Hammond Honorable William B Richardson (2003-2008) James J. Wong Barbara A. Rockett (1988-2002) William W. Sellers (1985-2000) TRUSTEES EMERITI Alan D. Solomont (1999-2009) Dr. Peter Ackerman (1996-2006) Ira Stepanian (1981-1993) Shirley Aidekman-Kaye (1991-1999) Placido Arango (1987-1996)
Edward M. Swan, Jr. (2002-2012) Morris Tanenbaum (1977-1986)
Fred G. Arrigg (1981-1991) William C. Thompson (2003-2008) Joyce L. Barsam (1994-2004) Judith l. Vaitukaitis (1998-2008) Paul A. Brown (1980-1990) Ione D. Vargus (198- 1991) Edward H. Budd (199- 2003) JoAnn Giffuni Wellner (1989-1999) Matthew J. Burns (1973-1987)) Dr. Gordon S. Wood (1991-2002) John G.L. Cabot (1983-1993) Allan D. Callow (1971-1986)