Embed Size (px)
Citation preview

POSITION STATEMENT Open Access
Annual dialysis data report for 2018, JSDTRenal Data Registry: survey methods,facility data, incidence, prevalence, andmortalityKosaku Nitta1, Shunsuke Goto1,2*, Ikuto Masakane1, Norio Hanafusa1, Masatomo Taniguchi1, Takeshi Hasegawa1,Shigeru Nakai1, Atsushi Wada1, Takayuki Hamano1, Junichi Hoshino1, Nobuhiko Joki1, Masanori Abe1,Keiichi Yamamoto1, Hidetomo Nakamoto1 and on behalf of the Japanese Society for Dialysis Therapy Renal DataRegistry Committee
Abstract
The annual survey of the Japanese Society for Dialysis Therapy Renal Data Registry (JRDR) was sent to 4458 dialysisfacilities at the end of 2018; among these facilities, 4402 facilities (98.7%) responded to the facility questionnaire,and 4222 (94.7%) responded to the patient questionnaire. The number of chronic dialysis patients in Japancontinues to increase every year; as of the end of 2018, it had reached 339,841 patients, representing 2688 patientsper million population. Among the prevalent dialysis patients, the mean age was 68.75 years, and diabeticnephropathy was the most common primary disease among the prevalent dialysis patients (39.0%), followed bychronic glomerulonephritis (26.8%) and nephrosclerosis (10.8%). The number of incident dialysis patients was 40,468, and a reduction by 491 from 2017. The mean age of the incident dialysis patients was 69.99 years old. Diabeticnephropathy was also the most common primary disease (42.3%), representing a 0.2 percent point reduction from2017. The distribution of diabetic nephropathy appears to have reached a plateau. The number of deceasedpatients during 2018 was 33,863, and the crude annual death rate was 10.0%. Heart failure was the most commoncause of death (23.5%), followed by infection (21.3%) and malignant tumor (8.4%); these causes were similar to(Continued on next page)
© The Author(s). 2020 Open Access This article is licensed under a Creative Commons Attribution 4.0 International License,which permits use, sharing, adaptation, distribution and reproduction in any medium or format, as long as you giveappropriate credit to the original author(s) and the source, provide a link to the Creative Commons licence, and indicate ifchanges were made. The images or other third party material in this article are included in the article's Creative Commonslicence, unless indicated otherwise in a credit line to the material. If material is not included in the article's Creative Commonslicence and your intended use is not permitted by statutory regulation or exceeds the permitted use, you will need to obtainpermission directly from the copyright holder. To view a copy of this licence, visit http://creativecommons.org/licenses/by/4.0/.The Creative Commons Public Domain Dedication waiver (http://creativecommons.org/publicdomain/zero/1.0/) applies to thedata made available in this article, unless otherwise stated in a credit line to the data.
* Correspondence: [email protected] article is translated from part of a Japanese article that was originallypublished as “Annual Dialysis Data Report 2018, JSDT Registry” in the Journalof the Japanese Society for Dialysis Therapy, 2019; 52: 679-754 withpermission from the Japanese Society for Dialysis Therapy. The original workis at “https://doi.org/10.4009/jsdt.52.679” (Accessed May 19, 2020).The original Japanese report contained 11 chapters with 71 figures, 4 tablesand 71 supplementary tables; as this report was too large to submit to RenalReplacement Therapy, we reconstructed it into three English manuscripts. Thisarticle is one of three manuscripts.1Japanese Society for Dialysis Therapy Renal Data Registry Committee,Japanese Society for Dialysis Therapy, Tokyo, Japan2Division of Nephrology and Kidney Center, Kobe University Graduate Schoolof Medicine, 7-5-1 Kusunoki-cho, Chuo-ku, Kobe 650-0017, Japan
Nitta et al. Renal Replacement Therapy (2020) 6:41 https://doi.org/10.1186/s41100-020-00286-9

(Continued from previous page)
those for 2017. The number of patients receiving hemodiafiltration has been increasing since 2012, reaching 125,793 or 37.0% of all dialysis patients at the end of 2018. The number of patients receiving peritoneal dialysis hasbeen gradually increasing since 2017, reaching 9445, and 19.7% of these patients were treated using a combinationof peritoneal dialysis and hemodialysis or hemodiafiltration. The proportion of patients receiving combinationtherapy has remained at around 20% of all peritoneal dialysis patients. The number of patients undergoing homehemodialysis was 720, representing an increase of 36 patients from 2017. The 2018 JRDR survey included severaltopics such as the present status of the patient kinetics of chronic dialysis patients at the end of 2018, watertreatment and hemodiafiltration, peritoneal dialysis, treatments for diabetes, mental and physical conditions, andthe present status of viral hepatitis. In this paper, we describe the patient and facility kinetics.
Trial registration: The JRDR was approved by the ethics committee of the JSDT (approval number 1-3) and wasregistered in the “University hospital Medical Information Network (UMIN) Clinical Trials Registry” under the clinicaltrial ID of UMIN000018641 on August 8, 2015: (Accessed June 2, 2020)
Keywords: Dialysis modality, Hemodialysis, Peritoneal dialysis, Incidence, Prevalence, Mortality
IntroductionSince 1968, the Japanese Society for Dialysis Therapy(JSDT) has conducted a survey of the status of chronicdialysis treatment in Japan at the end of every year. Thissurvey, known as the JSDT Renal Data Registry (JRDR),covers nearly all dialysis facilities throughout the country[1, 2]. Although these facilities participate voluntarily, theresponse rate is nearly 100%, which means that this surveyrepresents the status of regular dialysis in Japan. The 2018JRDR survey contained many topics such as the kinetics ofchronic dialysis patients and dialysis facilities at the end of2018, water treatment and hemodiafiltration, peritonealdialysis, treatments for diabetes, mental and physical con-ditions, and the present status of viral hepatitis. In this art-icle, we describe the method used to conduct this surveyand the results of the patient and facility kinetics.
MethodsSending and recovering the questionnairesThe JRDR annual surveys consist of two types of ques-tionnaires: a facility-survey questionnaire and a patient-survey questionnaire. The facility-survey questionnaireincludes the number of dialysis consoles, number of staffmembers, number of patients, and related information.The patient-survey questionnaire includes data such asdialysis prescriptions, laboratory data, and outcome fac-tors for each patient at the dialysis facilities. For the2018 survey, USB memory devices were mailed to dialy-sis facilities throughout Japan in December 2018. Thedevices contained the facility surveys and 2017 anon-ymized patient surveys in an Excel format. The dialysisfacilities decoded the patient names using the decodingkey in the USB memory device that was sent to themand then updated the patient data related to patient out-comes, including survival vs. death and transfer to an-other facility, as well as other data. They also registeredincident patients into the system. Once all the patient
records had been entered and the update tasks had beencompleted, they once again anonymized the data. After allthe dialysis facilities had completely anonymized the pa-tient data, only the USB memory device containing thequestionnaires was returned to the administrative office ofthe JSDT. The initial deadline for the data was January 31,2019, but facilities that had not returned data as of thatdate were encouraged to do so. To accommodate these fa-cilities, a final deadline of June 18, 2019, was set, and thedata collection for the end of 2018 was closed at this time.
Survey itemsThe following items were surveyed in 2018:
1. Facility survey
a) Overview and scope of facilities
i. Facility code, name of facility, and the date (monthand year) that dialysis was begun at the facility
ii. Dialysis capabilities: simultaneous dialysis treatmentcapacity, and maximum dialysis treatment capacity
iii. Number of dialysis consoles, number of consoleswith endotoxin retentive filters (ETRF)
b) Patient dynamicsi. Number of prevalent dialysis patients at the end
of 2018 (number of patients according totreatment modality, outpatient/inpatient)
ii. Number of dialysis patients undergoingnightshift dialysis in 2018
iii. Number of incident dialysis patients beginninghemodialysis (HD) or hemodiafiltration (HDF)and the number beginning peritoneal dialysis(PD) in 2018
Nitta et al. Renal Replacement Therapy (2020) 6:41 Page 2 of 18

iv. Number of deceased patients in 2018c) Dialysis fluid quality control
a. Frequency at which dialysis fluid endotoxin (ET)concentrations were measured and ETconcentration
b. Frequency at which the dialysis fluid total viablemicrobial count (TVC) was measured and theTVC
c. Source of dialysis waterd. Frequency of residual chlorine measurement
before daily dialysis session and measurementtechnique
ii. Awareness of JSDT standard for dialysis fluid(chemical contamination standard) and frequencyof measurement
2. Patient survey
a. Patient basic information
i. Sex, date of birth, year and month of start ofdialysis, primary disease, residence (prefecture),
year and month of transfer from anotherhospital, facility code before and after transfer,outcome category, outcome date (transfer,death, dropout, or transplantation), cause ofdeath, change or revision of name or date ofbirth, dialysis modality, status of combinedtherapies involving PD with HD or HDF (etc.),PD experience, and number of kidneytransplants
b) HD/HDF therapy conditionsi. Frequency of dialysis session per week, dialysis
time per session, and blood flow rateii. HDF: dilution methods, substitution fluid
volume per sessioniii. Body height, body weight before and after
dialysis, systolic blood pressure before dialysis,diastolic blood pressure before dialysis, andpulse rate before dialysis
c) Laboratory findingsi. Serum urea nitrogen (UN) before and after
dialysis, serum creatinine concentration before
Table 1 Summary of chronic dialysis therapy in Japan, 2018*Number of surveyed facilities 4458 facilities (increase of 45 facilities,1.0% increase)
Number of responded facilities 4402 facilities (increase of 42 facilities,1.0% increase)
Capacity Number of bedside consoles 139,887 units (increase of 2639 units,1.9% increase)
Capacity for simultaneous HD treatments 138,155 treatments (increase of 2519 patients,1.9% increase)
Maximum capacity 458,597 patients (increase of 7759 patients, 1.7% increase)
Prevalent dialysis patients 339,841 patients (increase of 5336 patients, 1.6% increase)
Outpatients Inpatients Total
Hemodialysis Hemodialysis (HD) 177,718 (57.6) 24,704 (79.4) 202,422 (59.6)
Hemodiafiltration (HDF) 119,959 (38.9) 5,834 (18.8) 125,793 (37.0)
Hemofiltration (HF) 11 (0.0) 3 (0.0) 14 (0.0)
Blood adsorption dialysis 1401 (0.5 ) 46 (0.1) 1,447 (0.4)
Home hemodialysis 703 (0.2 ) 17 (0.1) 720 (0.2)
Peritoneal dialysis PD only 7140 (2.3) 442 (1.4) 7,582 (2.2)
PD + HD 1/week 1583 (0.5) 38 (0.1) 1,621 (0.5)
PD + HD 2/week 136 (0.0) 6 (0.0) 142 (0.0)
PD + HD 3/week 26 (0.0) 4 (0.0) 30 (0.0)
PD + HD other frequencies 68 (0.0) 2 (0.0) 70 (0.0)
Subtotal 8953 (2.9) 492 (1.6) 9,445 (2.8)
Total 308,745 (100.0) 31,096 (100.0 ) 339,841 (100.0)
Per million of general population 2687.7 patients (increase of 47.7 patients)
Patients count in the night shift 31544 patients
Incident dialysis patients 40,468 patients (decrease of 491 patients,1.2% decrease)
Incident hemodialysis patients (including HDF) 38,175 patients
Incident peritoneal dialysis patients 2293 patients
Deceased patients 33,863 patients (increase of 1331 patients, 4.0% increase)
PD + HD patients patients treated by the combination of PD and HD, HDF hemoadsorption, or hemofiltration (excluding those who underwent onlyperitoneal lavage)*The above data were obtained from the facility survey.
Nitta et al. Renal Replacement Therapy (2020) 6:41 Page 3 of 18

and after dialysis, serum albumin concentrationbefore dialysis, C-reactive protein (CRP) con-centration before dialysis, serum calcium con-centration before dialysis, serum phosphorusconcentration before dialysis, serum parathyroidhormone (PTH) assay method, PTH level (intactor whole PTH), hemoglobin concentration be-fore dialysis, serum total cholesterol concentra-tion (total cholesterol), serum high-density-lipoprotein-cholesterol concentration (HDL-C),aspartate aminotransferase (AST), hepatitis Bsurface antigen, hepatitis C antibody, hepatitis Cvirus-ribonucleic acid (RNA), casual plasma glu-cose, glycated albumin, and hemoglobin A1c
d) Other outcome-related factorsi. Antihypertensive drug use, smoking status,
history of diabetes, history of ischemic heartdisease, history of cerebral hemorrhage, historyof cerebral infarction, history of limbamputation, history of proximal femur fracture,history of encapsulating peritoneal sclerosis(EPS), history of carpal tunnel syndromeoperation, insulin use, dipeptidyl peptidase-4(DPP-4) inhibitor use, glucagon-like peptide-1(GLP-1) analog use, other anti-diabetes agentuse, dementia, activity of daily life, exercisehabits
e) Peritoneal dialysis (PD) survey
Fig. 1 Trends in the prevalent dialysis patient count for 1968–2018, and the adjusted prevalent dialysis patient count (pmp) for 1983–2018. *Thelow response rate in 1989 caused a dip in the patient count
Nitta et al. Renal Replacement Therapy (2020) 6:41 Page 4 of 18

i. Therapeutic history: dialysis vintage of currentPD and number of months in which PD wasperformed in 2018
ii. Peritoneal function: implementation ofperitoneal equilibration test (PET) and 4-h cre-atinine concentration dialysate/plasma ratio inPET (PET Cr D/P ratio)
iii. Dialysis prescription: type of PD fluid, volumeof PD fluid per day, PD treatment time perday, daily urine volume, mean fluid removalvolume per day, Kt/V by residual kidneyfunction (residual kidney Kt/V), and Kt/V byPD (PD Kt/V)
iv. PD method: use of automated peritoneal dialysis(APD) machine and changing maneuver of PDfluid
v. PD-related infections: frequency of peritonitisduring 2018 and number of exit-site infectionsduring 2018
Ethical basis for the JRDR surveyThe 2018 JRDR survey was conducted based on the “Eth-ical Guidelines for Medical and Health Research InvolvingHuman Subjects,” which was issued in December 2014 bythe Ministry of Health, Labour ,and Welfare (MHLW)and the Ministry of Education, Culture, Sports, Science,and Technology (MEXT) and was revised in Feb 2017 [3].The 2018 JRDR survey protocol was also approved by theethics committee of the JSDT (approval number 1-3) onJanuary 28, 2019, and publicly released on the UMINClinical Trials Registry (UMIN000018641), and the resultswere fully released on the JSDT homepage [4].
Fig. 2 Trends in the incident and deceased dialysis patient counts for 1983–2018
Nitta et al. Renal Replacement Therapy (2020) 6:41 Page 5 of 18

Table
2Prevalen
tdialysispatient
coun
ts,b
ymod
ality
andprefecture,2018*
Prefecture
Num
ber
of surveyed
faciliteis
Num
berof
respon
ded
facilities
Hem
odialysis
Periton
eald
ialysis
Total
Permillion
ofge
neral
popu
latio
n**
Hem
odialysis
Hem
odiafiltration
Hem
ofiltratio
nBloo
dadsorptio
nfiltration
Hom
ehe
mod
ialysis
PD only
PD+HD
1/week
PD+HD
2/week
PD+HD
3/week
PD+HDothe
rfre
quen
cies
Hokkaido
261
257
8940
6524
085
9397
903
111
16,060
3038.2
Aom
ori
4140
1348
2177
05
369
121
00
3615
2862.2
Iwate
4444
2610
432
010
084
110
00
3147
2535.9
Miyagi
6565
3833
1967
013
496
121
12
5929
2560.0
Akita
4242
1402
724
02
253
30
00
2186
2228.3
Yamagata
3635
1666
948
05
1244
81
20
2686
2464.2
Fukushim
a70
682568
2,417
016
071
3310
40
5119
2746.2
Ibaraki
8686
5777
2,392
048
1768
141
00
8317
2890.9
Tochigi
7878
4250
2058
022
7121
181
21
6480
3329.9
Gun
ma
6362
4028
1942
00
1356
181
00
6058
3103.5
Saitama
196
191
10044
8037
060
74239
769
11
18,541
2529.5
Chiba
156
154
9365
5817
035
13228
615
10
15,525
2482.0
Tokyo
442
435
17838
13,422
3140
95896
264
161
732,682
2364.5
Kanagawa
264
264
14113
6818
263
31539
932
03
21,664
2360.7
Niigata
5454
3794
1221
120
2161
262
11
5229
2328.1
Toyama
4242
1875
589
014
393
130
20
2589
2465.7
Ishikawa
4141
1815
813
020
559
60
00
2718
2378.0
Fukui
2525
1026
710
03
376
225
00
1845
2383.7
Yamanashi
3333
1272
1020
06
221
140
00
2335
2858.0
Nagano
7372
3063
2097
212
1883
183
10
5297
2567.6
Gifu
7272
3470
1486
022
2870
191
00
5096
2551.8
Shizuo
ka126
126
5707
5252
144
21104
226
01
11,158
3049.5
Aichi
193
193
12,223
5728
180
46611
912
01
18,783
2492.1
Mie
5552
2849
1015
022
865
121
00
3972
2217.8
Shiga
4039
1682
1370
033
3597
180
00
3235
2291.1
Kyoto
8179
3822
2507
080
11138
748
01
6641
2563.1
Osaka
326
320
12,465
10,851
2168
47428
975
52
24,070
2731.2
Hyogo
201
199
7787
6213
0122
72167
263
00
14,390
2624.0
Nara
5048
1762
1502
030
896
300
01
3429
2560.9
Wakayam
a48
472299
612
011
2758
80
00
3015
3224.6
Nitta et al. Renal Replacement Therapy (2020) 6:41 Page 6 of 18

Table
2Prevalen
tdialysispatient
coun
ts,b
ymod
ality
andprefecture,2018*
(Con
tinued)
Prefecture
Num
ber
of surveyed
faciliteis
Num
berof
respon
ded
facilities
Hem
odialysis
Periton
eald
ialysis
Total
Permillion
ofge
neral
popu
latio
n**
Hem
odialysis
Hem
odiafiltration
Hem
ofiltratio
nBloo
dadsorptio
nfiltration
Hom
ehe
mod
ialysis
PD only
PD+HD
1/week
PD+HD
2/week
PD+HD
3/week
PD+HDothe
rfre
quen
cies
Tottori
2626
668
812
02
451
91
01
1548
2764.3
Shim
ane
3131
730
878
00
253
111
11
1677
2466.2
Okayama
6767
2856
2087
027
5180
146
01
5176
2727.1
Hiro
shim
a100
984128
3074
032
28209
5736
12
7567
2686.2
Yamaguchi
6158
1760
1730
012
186
262
00
3617
2640.1
Tokushim
a39
391355
1285
06
5124
302
13
2811
3819.3
Kagawa
4848
1277
1262
012
8141
490
01
2750
2858.6
Ehim
e54
542040
1826
016
095
340
19
4021
2974.1
Kochi
3939
783
1690
09
018
20
02
2504
3546.7
Fukuoka
198
194
10,389
3954
137
19691
430
12
15,137
2964.0
Saga
3636
1809
739
07
18
70
00
2571
3139.2
Nagasaki
6362
2708
1191
011
19117
112
01
4060
3027.6
Kumam
oto
9089
4901
1511
030
4130
260
02
6604
3758.7
Oita
7068
2958
941
09
4108
324
10
4057
3546.3
Miyazaki
6565
2977
901
04
056
40
06
3948
3652.2
Kago
shim
a95
954016
1305
122
2153
300
06
5535
3429.4
Okinawa
7270
2374
1946
020
274
271
21
4447
3071.1
Total
4,458
4,402
202,422
(59.6)
125,793(37.0)
14(0.0)
1,447(0.4)
720(0.2)
7,582
(2.2)
1,621
(0.5)
142(0.0)
30(0.0)
70(0.0)
339,841
(100.0)
2687.7
*The
abov
eda
tawereob
tained
from
thefacilitysurvey.
**Th
enu
mbe
rsof
dialysispa
tientsweread
justed
aspe
rmillionpo
pulatio
n(pmp)
bythean
nual
governem
entrepo
rtreference[7]
Nitta et al. Renal Replacement Therapy (2020) 6:41 Page 7 of 18

ResultsBasic demographicsFacility dynamicsThe 2018 JRDR survey targeted 4458 facilities through-out Japan, and 4402 facilities (98.7%) responded to thefacility-survey questionnaire. Although the number of fa-cilities that returned facility-survey questionnaires felltemporarily in 2015, the number has increased againsince 2016, and the number in 2018 increased by 42 fa-cilities (1.0%) compared with 2017 (Table 1). Thepatient-survey questionnaire was returned from 4222 fa-cilities (94.7%). Since 2015, the response rate for thepatient-survey questionnaire has fallen from about 96 toabout 95% because of the discontinuation of paper-based surveys in association with improved anonymiza-tion methods. The detail of response rate for each ques-tion is shown in Appendix.The facility survey shows that there were 139,887 dia-
lysis consoles, a simultaneous dialysis capacity of 138,155 patients, and a maximum dialysis treatment capacityof 458,597 patients, representing increases in 1.9%, 1.9%,and 1.7% over the previous year, respectively (Table 1).The number of dialysis consoles is also increasing annu-ally (Supplementary Table 1).
Patient dynamicsAccording to the facility-survey questionnaire, the totalnumber of patients undergoing chronic dialysis
treatment at the end of 2018 was 339,841. This numberindicates the prevalence of chronic kidney disease (CKD)patients undergoing regular dialysis treatment. Althoughthe number of patients undergoing dialysis is increasingannually, the rate of increase has slowed in recent years.In 2018, there was an increase of 5336 patients, com-pared with the previous year (Fig. 1, SupplementaryTable 1). A prediction of the number of dialysis patientsconducted by Nakai et al. [5] in 2012 indicated that thenumber was expected to decline after reaching a peak ofapproximately 349,000 in 2021. In 2018, the total num-ber of patients (N = 339,841) was below the expectedpeak number. The number of dialysis patients per mil-lion population (pmp) indicates the prevalence rate (Fig.1, Supplementary Table 1). The prevalence rate has beenincreasing in recent years. In 2018, the rate was 2687.7pmp, which means that one in 372.1 Japanese people isa dialysis patient. The prevalence rate of dialysis patientsin Japan is the second highest in the world behindTaiwan, according to the 2018 United States Renal DataSystem (USRDS) Annual Data Report [6].The number of new dialysis patients indicates the inci-
dence of CKD patients undergoing dialysis treatment.Although this number had been increasing annuallyuntil 2008, the number in 2009 decreased comparedwith that for 2008. Since 2009, this number has fluctu-ated every year but has tended to increase overall. Theincidence in 2018 was 40,468, representing a reduction
Fig. 3 Prevalent dialysis patient distribution by age and sex for 2018
Fig. 4 Trend in the average age of the prevalent dialysis patients for 1983–2018
Nitta et al. Renal Replacement Therapy (2020) 6:41 Page 8 of 18

by 491 (− 1.2%) compared with 2017 (Fig. 2, Supplemen-tary Table 2). Of these patients, 94.3% received HD(F)and 5.7% received PD (Table 1). The number of de-ceased patients has been increasing annually. Al-though the death rate almost plateaued between 2012and 2014, the figure has once again been increasingsince 2015, with 33,863 deceased patients in 2018;this number represents an increase of 1331 patients(+ 4.1%) compared with 2017 (Fig. 2, SupplementaryTable 2). In general, the number of patients for anygiven year is calculated by adding the number of inci-dent patients to the number of patients from the pre-vious year and then subtracting the number ofdeceased patients. However, the number of patientsthus calculated is not consistent with the actual num-ber of patients. This may be because the calculatednumber does not include the number of patients whodiscontinue dialysis because of kidney transplantation,and there is a possibility that the number of new pa-tients was overestimated and the number of deceasedpatients was underestimated.The numbers of dialysis patients according to prefec-
ture are shown in Table 2. The numbers in Table 2 were
calculated based on the location of the facility where thepatients undergo treatment and not the place of resi-dence. The prevalence rate (number of dialysis patientsper million population) differs considerably among pre-fectures. Since numerous confounding factors are in-volved in this difference, great caution is needed whencomparing prefectures.
Dialysis modality dynamicsHemodialysis (HD) accounted for 59.6% of all dialysismodalities during 2018, followed by hemodiafiltration(HDF) at 37.0%, hemofiltration (HF) at 0.004%,hemadsorption dialysis (HAD) at 0.4%, homehemodialysis (HHD) at 0.2%, and peritoneal dialysis(PD) at 2.8% (Table 1). The use of on-line HDF in-creased rapidly after a 2012 revision to the medicalreimbursement system, and the number of HDF pa-tients increased to 125,793 in 2018. The number ofpatients undergoing PD was 9445, which also repre-sents an increase compared with the previous year(9090). Of these patients, 19.7% were treated with acombination of PD and HD(F). The number of HHDpatients was 720, representing a slight increase. The
Fig. 5 Prevalent dialysis patient count by age for 1982–2018
Nitta et al. Renal Replacement Therapy (2020) 6:41 Page 9 of 18

total percentage of patients undergoing home dialysis,which is calculated by adding the number undergoingPD and HHD, was 3.0%. This figure is the lowest forthis type of dialysis in the developed world [6]. Al-though there were regional differences in the dialysismodality data for each prefecture, the differenceswere affected by various regional factors (Table 2).The number of patients undergoing nighttime dialysis
at the end of 2018 was 31,544 (Table 1). Although thisnumber had remained between 41,000 and 42,000 untilthe 2014 survey, the number decreased sharply to 33,370in 2015. This change is likely to have been affected bythe addition of the phrase “Dialysis during the timeperiod recognized by the insurance system (start at 5 PMor later or finish after 9 PM or later)” to the definition ofnighttime dialysis patients in the 2015 survey. The num-ber of nighttime dialysis patients has decreased slightlysince 2015, and the number in 2018 decreased by 372patients, compared with the number in 2017.
Prevalent dialysis patient dynamics at the end of 2018Clinical backgroundIn the patient survey, data on age and sex were availablefor 327,336 patients. Among these patients, 214,078were male, 113,258 were female, and the mean age was68.75 years (Fig. 3, Supplementary Table 3). The meanage has been increasing annually (Fig. 4, SupplementaryTable 4), and the age group of 70 to 74 years had thehighest percentage of both males and females among theage groups. The number of patients under the age of 65has decreased since 2012, while the number of patientsunder the age of 70 years has decreased since 2017.Expressed another way, these findings suggest that theincrease in the number of prevalent dialysis patients inJapan has been caused by an increase in the number ofpatients aged 70 years and older (Fig. 5, SupplementaryTable 5).The mean dialysis period for chronic dialysis patients
as of the end of 2018 was 6.82 years for males and 8.32
Fig. 6 Prevalent dialysis patient count by dialysis duration and sex for 2018
Nitta et al. Renal Replacement Therapy (2020) 6:41 Page 10 of 18

Fig. 7 Prevalent dialysis patient count by dialysis duration for 1988–2018
Fig. 8 Prevalent dialysis patient distribution by primary disease and sex for 2018. RPGN, rapidly progressive glomerulonephritis; PKD, polycystickidney disease; CAKUT, congenital anomalies of the kidney and urinary tract
Nitta et al. Renal Replacement Therapy (2020) 6:41 Page 11 of 18

years for females (7.34 years overall). A comparison ofdialysis period according to duration showed that 47.5%had a dialysis period of under 5 years, 8.4% had a periodof 20 years or more, 2.2% had a period of 30 years ormore, and 0.3% had a period of 40 years or more (Fig. 6,Supplementary Table 6). The longest duration was 50years and 4months. The number of patients with longerdurations is increasing, with 27.7% of patients having re-ceived dialysis for 10 or more years. The percentage ofpatients with a dialysis period of 20 years or more, whichwas less than 1% at the end of 1992, reached 8.4% as ofthe end of 2018 (Fig. 7, Supplementary Table 7).The most common primary disease among chronic
dialysis patients at the end of 2018 was diabetic ne-phropathy at 39.0%, followed by chronic glomeruloneph-ritis at 26.8% and nephrosclerosis at 10.8% (Fig. 8,Supplementary Table 8). Diabetic nephropathy replacedchronic glomerulonephritis as the most common pri-mary disease in 2011. Although the percentage of dia-betic nephropathy patients has increased continuously,the percentage has recently shown signs of reaching aplateau. The percentage of chronic glomerulonephritispatients has steadily declined, while the percentages of
nephrosclerosis and “undetermined” patients have con-tinuously increased (Fig. 9, Supplementary Table 9).However, caution is required when interpreting these re-sults, because the primary disease code was revised as ofthe 2017 survey.
Causes of deathAlthough 33,863 deaths were reported in the 2018facility-survey questionnaire, the number of patientswhose cause of death was recorded in the patient-surveyquestionnaire according to sex was 31,117. The causesof death, in descending order, were heart failure, infec-tious disease, malignancy, and cerebrovascular disease(23.5%, 21.3%, 8.4%, and 6.0%, respectively). The “Other”category accounted for 10.6% overall. The percentage ofpatients in the “cardiovascular death” category, which in-cludes heart failure, cerebrovascular disease, and myo-cardial infarction, was 33.1% (Fig. 10, SupplementaryTable 10).Heart failure has been the most common cause of
death from 1983 onward, accounting for approximately25% of all deaths from 1995 onward. Death caused byinfectious disease, on the other hand, has been
Fig. 9 Trends in major primary diseases among prevalent dialysis patients for 1983–2018. PKD, polycystic kidney disease; RPGN, rapidlyprogressive glomerulonephritis
Nitta et al. Renal Replacement Therapy (2020) 6:41 Page 12 of 18
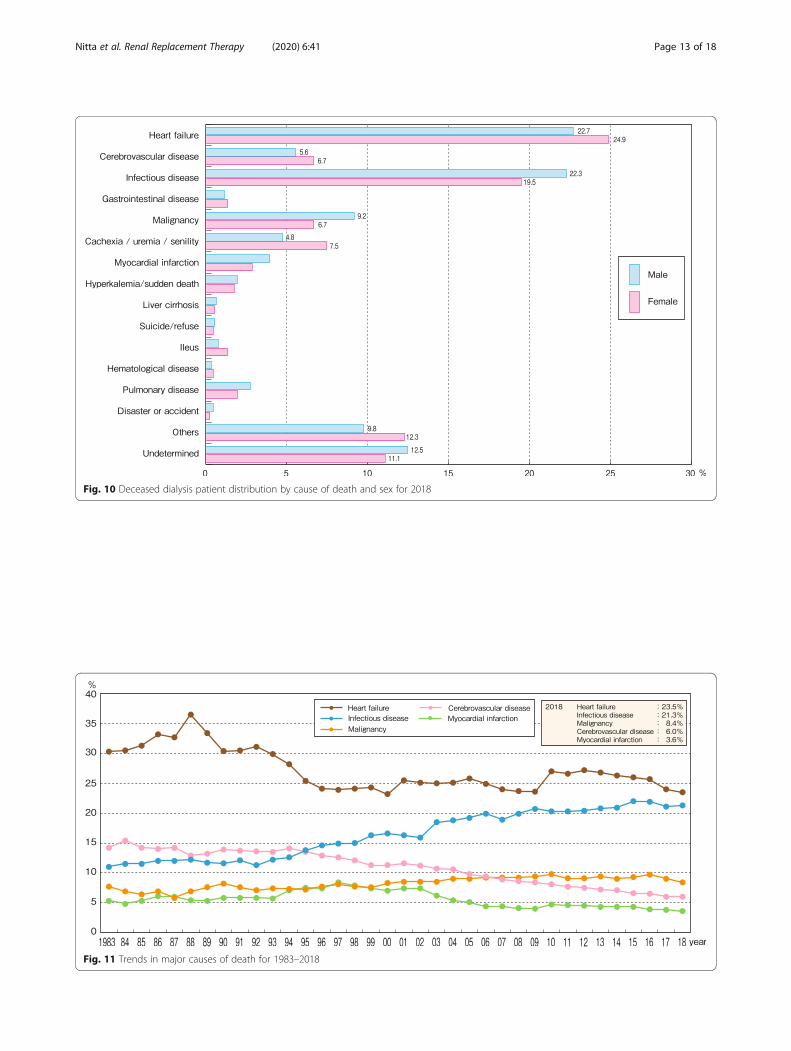
Fig. 10 Deceased dialysis patient distribution by cause of death and sex for 2018
Fig. 11 Trends in major causes of death for 1983–2018
Nitta et al. Renal Replacement Therapy (2020) 6:41 Page 13 of 18

increasing since 1993. Cerebrovascular disease hasbeen gradually decreasing since 1994. Deaths frommyocardial infarction have been gradually decreasingsince reaching a peak of 8.4% in 1997. Malignancy-relateddeaths were at their lowest in 1987 at 5.8%, and althoughthey have increased slightly since then, they haveremained at approximately 9.0% since 2004. The percent-age of cardiovascular deaths mentioned above has consist-ently decreased since reaching a maximum of 54.8% in1988, accounting for 33.1% of deaths in 2018 (Fig. 11, Sup-plementary Table 11). Caution is required when viewingthese statistics, however, as the cause of death codes wererevised three times at the end of 2003, 2010, and 2017 [7].
Crude death rateThe annual crude death rate was calculated using thepatient dynamics reported in the facility survey asfollows:
Crude death rate ¼ fno:of deaths=ðno:of patients; previous yearþno:of patients; target yearÞ � 2g � 100 %ð Þ
The lowest crude death rate was 7.9% observed in1989 (a year in which the questionnaire recovery ratewas low). Generally, however, the rate has fluctuated be-tween 9% and 10%. At the end of 2018, it was 10.0%(Fig. 12, Supplementary Table 12).
Fig. 12 Trend in annual crude death rate for 1983–2018
Fig. 13 Incident dialysis patient distribution by age and sex for 2018
Nitta et al. Renal Replacement Therapy (2020) 6:41 Page 14 of 18

Incident dialysis patient dynamics in 2018Clinical backgroundOf the 38,147 incident patients whose age and sex datawere recorded in the patient survey, 26,397 were maleand 11,750 were female (Fig. 13, Supplementary Table13). The mean age of the incident patients was 69.99years (males 69.27 years, females 71.61 years). The meanage has been increasing annually (Fig. 14, SupplementaryTable 14). The incident patient age data for 5-year agegroups showed that the higher age groups accounted forthe largest percentages of patients, with the highest per-centage of males observed in the 75–79-year age groupand the highest percentage of females observed in the80–84-year age group among all the age groups thatwere examined.The most common primary disease among the inci-
dent patients in 2018 was diabetic nephropathy at
42.3%, followed by chronic glomerulonephritis at15.6%, nephrosclerosis at 15.6%, and “undetermined”at 13.5% (Fig. 15, Supplementary Table 15). In 1998,diabetic nephropathy supplanted chronic glomerulo-nephritis as the most common primary disease amongincident patients; the distribution of diabetic nephrop-athy has increased consistently ever since, but it hasremained nearly the same for the past few years. Incontrast, the percentages of patients with nephro-sclerosis and “undetermined” have increased annually(Fig. 16, Supplementary Table 16).
Causes of deathIn 2018, the most common cause of death among inci-dent patients was infectious disease at 24.0%, followedby heart failure at 23.5%, malignancy at 10.9%, cachexia/uremia/senility at 5.1%, cerebrovascular disease at 4.7%,
Fig. 14 Trend in average age of incident dialysis patients for 1983–2018
Fig. 15 Incident dialysis patient distribution by primary disease and sex for 2018. RPGN, rapidly progressive glomerulonephritis; PKD, polycystickidney disease; CAKUT, congenital anomalies of the kidney and urinary tract
Nitta et al. Renal Replacement Therapy (2020) 6:41 Page 15 of 18

pulmonary disease at 3.5%, and myocardial infarction at2.7%. The total percentage of cardiovascular deaths was30.9% (Fig. 17, Supplementary Table 17). The changes incauses of death within the dialysis incident year showthat in the 1990s, heart failure was the most common,while infectious disease has gradually increased until itsurpassed heart failure in 2006, at which time infectiousdisease became the most common cause of death amongincident patients. Deaths due to malignancy have beenincreasing, and the percentage surpassed 10% in 2006.
Deaths due to cerebrovascular disease have been grad-ually decreasing (Fig. 18, Supplementary Table 18).
ConclusionAn overview of the results of the 2018 JRDR indicatedthat the number of chronic dialysis patients and thenumber of dialysis facilities in Japan were still increasing.However, the rates of increase have been gradually slow-ing. No changes were observed in the primary diseasesof the incident patients and the number of patients at
Fig. 16 Trends in major primary diseases of incident dialysis patients for 1983–2018. PKD, polycystic kidney disease; RPGN, rapidlyprogressive glomerulonephritis
Fig. 17 Incident dialysis patient distribution by cause of death and sex for 2018
Nitta et al. Renal Replacement Therapy (2020) 6:41 Page 16 of 18

the end of the year, with diabetes being the number oneprimary disease. However, the percentage of incident pa-tients with diabetes has been at a plateau for severalyears. HDF treatment has increased rapidly since 2012because of a revision to the medical reimbursement sys-tem, now accounting for 37.0% of all dialysis patients.Although the number of PD patients and homehemodialysis patients increased slightly over the num-bers in 2016, the rate of home dialysis for both remainsthe lowest in the world at 3.0%.
AppendixThe list of response rates for each question is shown inin Supplementary Table 19.
Supplementary informationSupplementary information accompanies this paper at https://doi.org/10.1186/s41100-020-00286-9.
Additional file 1. Trends in the prevalent dialysis patient count for1968-2018, and the adjusted prevalent dialysis patient count (pmp) for1983-2018.
Additional file 2. Trends in the incident and deceased dialysis patientcounts for 1983-2018
Additional file 3. Prevalent dialysis patient distribution by age and sexfor 2018
Additional file 4. Trend in the average age of the prevalent dialysispatients for 1983-2018
Additional file 5. Prevalent dialysis patient count by age for 1982-2018
Additional file 6. Prevalent dialysis patient count by dialysis durationand sex for 2018
Additional file 7. Prevalent dialysis patient count by dialysis duration for1988-2018
Additional file 8. Prevalent dialysis patient distribution by primarydisease and sex for 2018
Additional file 9. Trends in major primary diseases among prevalentdialysis patients for 1983-2018
Additional file 10. Deceased dialysis patient distribution by cause ofdeath and sex for 2018
Additional file 11. Trends in major causes of death for 1983-2018
Additional file 12. Trend in annual crude death rate for 1983-2018
Additional file 13. Incident dialysis patient distribution by age and sexfor 2018
Additional file 14. Trend in average age of incident dialysis patients for1983-2018
Additional file 15. Incident dialysis patient distribution by primarydisease and sex for 2018
Additional file 16. Trends in major primary diseases of incident dialysispatients for 1983-2018
Additional file 17. Incident dialysis patient distribution by cause ofdeath and sex for 2018
Additional file 18. Trends in major causes of death during the incidentyear for 1990-2018
Additional file 19. List of response rate for each question in the 2018survey
AbbreviationsAPD: Automated peritoneal dialysis; AST: Aspartate aminotransferase;CAKUT: Congenital anomalies of the kidney and urinary tract; CKD: Chronickidney disease; CRP: C-reactive protein; D/P Cr ratio: Dialysate/plasmacreatinine ratio; DPP-4: Dipeptidyl peptidase-4; EPS: Encapsulating peritonealsclerosis; ET: Endotoxin; ETRF: Endotoxin retentive filter; GLP-1: Glucagon-likepeptide-1; HAD: Hemadsorption dialysis; HD: Hemodialysis; HDL-C: High-density-lipoprotein-cholesterol concentration; HHD: Home hemodialysis;HDF: Hemodiafiltration; HF: Hemofiltration; IHDF: Intermittent infusion
Fig. 18 Trends in major causes of death during the incident year for 1990–2018
Nitta et al. Renal Replacement Therapy (2020) 6:41 Page 17 of 18

hemodiafiltration; JSDT: Japanese Society for Dialysis Therapy; JRDR: The JSDTRenal Data Registry; Kt/V: Index for standardized dialysis dose defined as K:urea clearance, t: dialysis time, V: body fluid volume; MEXT: Ministry ofEducation, Culture, Sports, Science, and Technology; MHLW: Ministry ofHealth, Labour, and Welfare; PD: Peritoneal dialysis; PET: Peritonealequilibration test; PKD: Polycystic kidney disease; pmp: Per millionpopulation; PTH: Parathyroid hormone; RNA: Ribonucleic acid; RPGN: Rapidlyprogressive glomerulonephritis; TVC: Total viable microbial count;UMIN: University hospital Medical Information Network; USB: Universal serialbus; USRDS: United States Renal Data System; UN: Urea nitrogen
AcknowledgementsWe owe the completion of this survey to the efforts of the members of thesubcommittee for JRDR Regional Cooperation, the members of which arementioned below, and the staff members of the dialysis facilities whoparticipated in the survey and responded to the questionnaires. We wouldlike to express our deepest gratitude to all these people.Subcommittee for JRDR Regional Cooperation: Kazuyuki Maeno, TetsuyaKawata, Chikara Oyama, Koji Seino, Toshinobu Sato, Shigeru Sato, Minoru Ito,Junichiro Kazama, Atsushi Ueda, Osamu Saito, Tetsuo Ando, TomonariOgawa, Hiroo Kumagai, Hiroyuki Terawaki, Ryoichi Ando, Masaki Abe, TetsuyaKashiwagi, Chieko Hamada, Yugo Shibagaki, Nobuhito Hirawa, HisakiShimada, Yoichi Ishida, Hitoshi Yokoyama, Ryoichi Miyazaki, Mizuya Fukasawa,Yuji Kamijyo, Teppei Matsuoka, Akihiko Kato, Noriko Mori, Yasuhiko Ito,Hirotake Kasuga, Sukenari Koyabu, Tetsuro Arimura, Tetsuya Hashimoto,Masaaki Inaba, Terumasa Hayashi, Tomoyuki Yamakawa, Shinichi Nishi, AkiraFujimori, Tatsuo Yoneda, Shigeo Negi, Akihisa Nakaoka, Takafumi Ito, HitoshiSugiyama, Takao Masaki, Yutaka Nitta, Kazuyoshi Okada, Masahito Yamanaka,Masaharu Kan, Kazumichi Ota, Masahito Tamura, Koji Mitsuiki, Yuji Ikeda,Masaharu Nishikido, Akira Miyata, Tadashi Tomo, Shoichi Fujimoto, TsuyoshiNosaki, and Yoshinori Oshiro.
Authors’ contributionsKN, IM, MT, and SG finalized the results of the survey and prepared thismanuscript. SN, NH, and AW designed the survey sheets and made a specialprogram mounted in MS Excel worksheet for the convenience of the self-assessment of dialysis quality by each dialysis facility. T Hase, T Hama, JH, NJ,and MA were responsible for the data analysis. KY and IM were responsiblefor the ethics of the JRDR survey. HN was the president of JSDT in 2018,checked all the results from the 2018 JRDR survey, and approved their publi-cation. All the authors have read and approved the final manuscript.
FundingThe present study did not receive any funding.All efforts and costs for the 2018 JRDR survey and the creation of the ADRwere provided by JSDT.
Availability of data and materialsFor anyone wanting to use the data and materials from the currentmanuscript without modifications, all the data and materials will be freelyavailable provided that “data from the JSDT” is stated.For anyone wanting to use the data and materials from the currentmanuscript with modifications, any re-calculations etc. will require that thefollowing sentence be included with their publication. “The data reportedhere have been provided by the Japanese Society for Dialysis Therapy (JSDT).The interpretation and reporting of these data are the responsibility of theauthors and should in no way be seen as an official policy or interpretationof the JSDT.”
Ethics approval and consent to participateThe JSDT registry was approved by the ethics committee of the JSDT(approval no. 1).The aims of the JSDT Renal Data Registry (JRDR) were well explained to theparticipating dialysis patients at the dialysis facilities.Documented approval forms from the patients were not required becauseall the data had already been collected and there were no newinterventions.The original data was totally anonymized to avoid any risk of compromisingthe privacy of the dialysis facilities and the patients.The data presented in the current manuscript does not contain any images,videos, or voice recording that could be used to identify an individual.
Consent for publicationNot applicable
Competing interestsThe authors declare that they have no competing interests.
Received: 29 June 2020 Accepted: 3 August 2020
References1. Nakai S. The history of Japanese Society for Dialysis Therapy Registry. J Jpn
Soc Dial Ther. 2010;43:119–52 (in Japanese).2. Masakane I, Nakai S. Recent trends of chronic dialysis in Japan from the
viewpoint of the JSDT Renal Data Registry. J Jpn Soc Dial Ther. 2016;49:211–8 (in Japanese).
3. Ministry of Health, Labour, and Welfare and Ministry of Education, Culture,Sports, Science, and Technology: ethical guidelines for medical and healthresearch involving human subjects. (revised in 28, Feb, 2017) http://www.lifescience.mext.go.jp/files/pdf/n1859_01.pdf. (last accessed 15, Nov, 2019).(in Japanese).
4. Japanese Society for Dialysis Therapy. http://www.jsdt.or.jp/info/2308.html.(last accessed 15, Nov, 2019). (in Japanese).
5. Nakai S, Wakai K, Yamagata K, Iseki K, Tsubakihara Y. Prediction of dialysispatients in Japan: based on Japanese Society for Dialysis Therapy Registry. JJpn Soc Dial Ther. 2012;45:599–613 (in Japanese).
6. Chapter 11: International Comparison, the 2018 USRDS Annual Data Report.Washington: United States Renal Data System, 2018. https://www.usrds.org/2018/view/v2_11.aspx (last accessed 3, Sep 2019).
7. Nakai S, Iseki K, Itami N, et al. An overview of regular dialysis treatment inJapan (as of December 31, 2010). Ther Apher Dial. 2012;16:483–521.
Publisher’s NoteSpringer Nature remains neutral with regard to jurisdictional claims inpublished maps and institutional affiliations.
Nitta et al. Renal Replacement Therapy (2020) 6:41 Page 18 of 18