Embed Size (px)
Citation preview

Annual Development Effectiveness Review 2015Driving development through innovation
Annual review
African Development Bank Group

ACKNOWLEDGEMENTS
This fifth edition of the Annual Development Effectiveness Review of the African Development Bank (AfDB) is the product of strong collaboration on the part of staff from most of AfDB’s departments. Olivier Shingiro was the task manager of this report, and Augustin Kouadio Adom, Yeon-Su Kim, Helmi Hmaidi, and Mariem Khelifi provided valuable statistical support. We would like to recognise, Tarek Ahmed, Namawu Alolo Alhassan, Stefan Atchia, Samuel Blazyk, Cyril Blet, Souleymane Dieye, Mbarack Diop, Al Hamndou Dorsouma, Dana Elhassan, Samia Gharbi, Dieudonné Kacoutie Affaly, Benedict Kanu, Patience Kuruneri, Robert Masumbuko, Maimuna Nalubega, Meissa Gueye Ndir, Alain Niyubahwe, Claudius Peter Nkhata, Emily Nwankwo, Rosemond Offei-Awuku, Elise Ouattara, Monojeet Pal, Audrey Rojkoff, Teresa Sarr-Kone, Carina Sugden, Frederik Teufel, Pepin Cyriaque Vougo, and Mohamed Youssouf.
We especially acknowledge the contributions of chief writer Marcus Cox (Agulhas Applied Knowledge), graphic designer Nadim Guelbi (Créon Design), and editor Patricia Rogers, all consultants.
Emmanuel Ebot Mbi Chief Operating Officer and First Vice-President African Development Bank
Simon Mizrahi Director, Quality Assurance and Results Department African Development Bank
Victoria Chisala Manager, Quality Assurance and Results Department African Development Bank
Cover photo: Innovation and technology play a key role in the modernisation of the diamond industry in Botswana. The diamond Innovation Hub aims to attract the best technology companies to Botswana and to promote sustainable downstream diamond activities such as polishing and jewellery making. Photo by Monirul Bhuiyan/AFP.
© 2015 African Development Bank Group
All rights reserved. Published May 2015. Printed in Tunisia.
African Development Bank Group Development Effectiveness Review 2015
The views expressed in this book are those of the authors and do not necessarily reflect the views and policies of the African Development Bank (AFDB), its Board of Governors, its Board of Directors or the governments they represent.
AfDB and its Board of Directors do not guarantee the accuracy of the data included in this publication and accept no responsibility for any consequence of their use.
By making any designation of or reference to a particular territory or geographic area, or by using the term “country” in this document, AfDB does not intend to make any judgments as to the legal or other status of any territory or area.
AfDB encourages printing or copying information exclusively for personal and non-commercial use with proper acknowledgment of AfDB. Users are restricted from reselling, redistributing, or creating derivative works for commercial purposes without the express, written consent of AfDB.
Note: In this report, “$” refers to US dollars.
African Development Bank Group
Immeuble CCIA - Avenue Jean-Paul II - 01 B.P. 1387 Abidjan 01, Côte d’Ivoire Phone: (+225) 20 26 36 56 • Fax: (+225) 20 21 31 00
www.afdb.org

Contents
Abbreviations v
Foreword 1
Executive summary 3
Introduction 11
Level 1: Development in Africa 13
Innovation 13
Inclusive growth 16
Transition towards green growth 23
Conclusion and outlook 26
Level 2: How AfDB contributes to Africa’s development 29
The Bank and innovation 29
Infrastructure development 29
Regional integration 34
Private sector development 35
Skills and technology 36
Governance and accountability 37
Agriculture and food security 38
Promoting gender equality in Africa 39
Addressing fragility and building resilience 39
Conclusion and outlook 40
Level 3: How well AfDB manages its operations 43
Introduction 43
Strengthening results at country level 43
Delivering effective and timely operations 46
Designing gender- and climate-informed operations 48
Conclusion and outlook 49
Level 4: How efficient AfDB is as an organisation 51
Decentralisation: moving closer to our clients 51
Human resources: engaging and mobilising staff 52
Value for money: improving cost-efficiency 54
Conclusion 55
Conclusion and outlook 57

ContentsList of tables
Table 1 Development in Africa (Level 1) 14Table 2 How AfDB contributes to Africa’s development (Level 2) 30Table 3 How well AfDB manages its operations (Level 3) 44Table 4 How efficient AfDB is as an organisation (Level 4) 52
List of boxesBox 1.1 GDP re-basing — recalculating the size of Africa’s economy 17Box 1.2 The far-reaching impact of Ebola 21Box 1.3 Boosting Africa’s competitiveness 22Box 2.1 One billion people, one billion opportunities: The Bank’s first Human Capital Strategy 31Box 2.2 Presidential Award for excellence — for connecting people and cities in the Democratic Republic of Congo 32Box 2.3 The Africa50 Fund: delivering vital infrastructure 32Box 2.4 Improving socioeconomic conditions in rural Senegal 33Box 2.5 Diversification of sea access in West Africa 34Box 2.6 Promoting urban mobility in Côte d’Ivoire 36Box 2.7 Supporting biomedical sciences in East Africa 36Box 2.8 Governance Trust Fund 37Box 2.9 Horticulture exports from Ghana 38Box 2.10 A rapid response to the Ebola epidemic in Guinea, Liberia and Sierra Leone 40Box 3.1 The new credit policy: extending the Bank’s non-concessionary window to low-income countries 43Box 3.2 Applying a fragility lens to our country and regional strategies 45Box 3.3 Modernising the Bank’s procurement policy 47Box 3.4 Learning from our assistance to small and medium-sized enterprises 48Box 3.5 Introducing a gender marker 49Box 4.1 Successes on the road to decentralisation 51Box 4.2 Investing in people at the AfDB 53Box 4.3 A new framework for measuring value for money in multilateral development banks 54Box 4.4 Adapting the Bank’s structure to better respond to countries’ emerging needs 55
List of figuresFigure 1 The Bank’s Results Measurement Framework 11Figure 1.1 Africa is harnessing innovation through... 16Figure 1.2 New frontiers for trade in Africa 18Figure 1.3 Going mobile: A high-profile innovation in financial services 19Figure 1.4 MDGs: 2014 progress chart 20Figure 1.5 Africans investing in Africa 22Figure 1.6 The energy, water and food nexus 23Figure 1.7 Breaking the vicious cycle for African smallholders 24Figure 1.8 Potential hydropower capacity in Africa 25Figure 3.1 Strengthening results at country level 45Figure 3.2 Preparing high-quality operations 46Figure 3.3 Ensuring strong portfolio performance 47Figure 3.4 Learning from our operations 48Figure 3.5 Designing gender- and climate-informed operations 49Figure 4.1 Decentralisation 52Figure 4.2 Human resources 53Figure 4.3 Value for money: improving cost efficiency 54

Annual D
eve
lopm
ent Effe
ctiveness R
evie
w 2
015
v
Abbreviations
ADF African Development Fund
AfDB African Development Bank
ASEAN Association of Southeast Asian Nations
CPIA Country Policy and Institutional Assessment
CPPR Country Portfolio Performance Review
CSP Country Strategy Paper
DRC Democratic Republic of Congo
EITI Extractive Industries Transparency Initiative
ESW Economic and sector work
FDI Foreign direct investment
GDP Gross domestic product
GSMA Global System for Mobile Communications Association
ICT information and communication technology
IEA International Energy Agency
IJHD International Journal of Hydropower and Dams
IMF International Monetary Fund
IPCC Intergovernmental Panel on Climate Change
IRENA International Renewable Energy Agency
IT information technology
PCR Project Completion Report
RMF Results Measurement Framework
SME small and medium enterprise
UA Units of Account
UN United Nations
UNDP United Nations Development Programme
USD United States dollars
Weights and measures
CO2 Carbon dioxide
ha hectares
km kilometres
km2 square kilometre
kWh kilowatt hour
m3 cubic metres
MW megawatts

Ports are critical for allowing African producers to access regional and world markets. Senegal’s Dakar Port Container Development Project has created 24-hour operating capacity, reducing the waiting time for ships from 15 to 2 hours.
© A
fDB,
Arn
e H
oel
vi
The past decade has been one of unprecedented dynamism in the African economy, as growth rates in Africa have outpaced those of the rest of the world. “African lions” became the new epithet for the continent’s lead performers, which were six of the
world’s ten fastest-growing economies in 2014. There is much to celebrate. Growth makes many things possible — stronger domestic markets, increased public investment, improved social services and, most importantly, widespread reductions in poverty.
In the face of this dynamism, there is a rising tide of expectations across Africa, with people — especially young people — impatient to take their place in today’s world. But while we may glimpse ahead of us a future of increasing prosperity, we are not there yet. Although a handful of African economies have begun to move beyond reliance on natural resources toward higher-value manufacturing and services, in most cases African countries have not yet made the full structural transformation required for growth to become self-sustaining, providing jobs and economic opportunities to the majority of Africans.
Africa needs to accelerate the pace of change. For this reason, we in the African Development Bank have chosen innovation as the theme of this year’s Annual Development Effectiveness Review (ADER). Innovation means not only taking ideas from around the world and adapting them to Africa’s unique conditions, but also using new home-grown ideas from across the continent to improve lives. It means not just making use of new technologies, but working creatively right through the value chain, from new crops and farming techniques to the delivery of new services and the development of new uses for mobile telephony.
In this ADER, we celebrate some of the most exciting examples of innovation we see in Africa today. But we also take a realistic look at the conditions that drive innovation and at the obstacles that need to be overcome. For the African Development Bank, many aspects of our work are central to innovation, such as expanding markets through regional integration, promoting skills development in science and technology and, above all, supporting creation of the backbone infrastructure — energy, transport and communications — on which innovation depends.
I believe that Africa is on the verge of a new era of growth and prosperity. But we Africans will need to harness all our creative energy to get there.
Donald Kaberuka
President, African Development Bank Group
Foreword
1
Driving development through innovation
Annual D
eve
lopm
ent Effe
ctiveness R
evie
w 2
015

M-PESA, the world-leading mobile-money system is now used by over 17m Kenyans, equivalent to more than two-thirds of the adult population; and handles the equivalent of 25% of Kenya’s GDP in transactions each year. Similar mobile-money systems are replicated across the continent.
© A
fDB,
Arn
e H
oel
2

Annual D
eve
lopm
ent Effe
ctiveness R
evie
w 2
015
3
Executive summary
The Annual Development Effectiveness Review (ADER), now in its fifth year, is a key product in the annual calendar of publications of the African Development Bank (AfDB, or the Bank). The ADER examines Africa’s overall development performance across a range of sectors and thematic areas, and assesses how effectively the Bank has contributed through its lending operations and other activities. It also assesses the health of the AfDB portfolio and how well we are developing as an organisation. Besides serving as an important management tool for the Bank, the ADER is written in an accessible style for a broad readership, as part of our commitment to transparency and accountability.
The ADER presents the Bank’s performance against the targets and milestones set out in our One Bank Results Measurement Framework. Like the Framework itself, it is organised into four levels or chapters. The first examines contemporary trends in Africa’s development, presenting an overall picture of the continent’s progress towards the objectives of inclusive and sustainable growth. The second level presents the aggregate results of the Bank’s portfolio of operations over recent years, showing where we have met or fallen short of our targets. The third level measures the health of our portfolio and the systems we use to manage it, and the fourth level looks at our internal capacities and the progress of our organisational reforms.
This year, we explore the theme of innovation in Africa’s development. While Africa today is celebrating unprecedented levels of economic growth, we recognise that the African economy still needs to undergo a profound structural transformation, if it is to deliver jobs and livelihood opportunities for the population at large. We need to find ways to promote innovation and accelerate the pace of change. We explore some of the innovations that are occurring across Africa today and consider how the Bank’s work is helping to unlock Africa’s creative potential.
Innovation and transformation in AfricaDevelopment has long been recognised as a process of creative destruction, in which old ways of working are abandoned in favour of new and more productive activities, at the household, firm and societal levels. Africa today is in a very dynamic period in its history, driven by large-scale demographic shifts, rapid urbanisation, natural resource discoveries, changing global patterns of trade and investment and a changing climate. This dynamism creates both challenges and opportunities, making innovation imperative.
Africa has already begun to leapfrog over old technologies and adapt new ones to the African context. This is especially true in
the communications field, as the spread of mobile telephony opens up new ways of delivering financial and other services. We can also see it happening in the energy sector, as small-scale, renewable technologies begin to offer affordable solutions for remote communities. But innovation is also broader than technology. It means developing products and business models that can succeed in the African context, and finding new ways to organise public institutions and deliver services at the regional, national and local levels.
The need for innovation is now widely recognised, and policy-makers have committed to promoting knowledge-based solutions to Africa’s development challenges. Yet there are still basic conditions that need to be put in place to encourage innovation and change.
Inclusive growth — Africa’s economic dynamism is by now a familiar story. The continent is enjoying its most sustained period of high growth in 40 years. Six African countries are among the top 10 global performers, and most African countries are sustaining growth rates of over 5%. This strong performance is tied to natural resource wealth, high commodity prices and new trade and investment links. It also rests on greatly improved economic management and a more favourable business climate. Over the longer term, urbanisation and the rise of the African middle class are helping to make Africa an increasingly attractive destination for investment.
Yet despite the strong growth performance, poverty rates have fallen relatively slowly. The proportion of the population living below the poverty line reached 42.4% in 2014, an improvement of just 0.1% over 2010. While Africa’s low-income countries are making faster progress, it is clear that the benefits of growth are still concentrated in particular areas or social groups. Africa has yet to see the kind of mass creation of low-skilled employment that enabled large-scale poverty reduction in Asia. A few African countries are beginning to make the shift from traditional, low-value-added agriculture into commercial farming and more productive manufacturing and services, but the pace of change remains slow.
Spatial inclusion — One of the main constraints on structural economic change is Africa’s huge infrastructure deficit, which keeps the growth in Africa’s cities and coastal areas from spreading out into the
Most African countries are sustaining growth rates of over 5%

4
Executive summary
Summary performance scorecard 2014
For Level 1 Africa’s relative performance is measured by comparing its progress with progress in Africa’s peer group (low-and middle-income countries around the world); for Level 2 the Bank’s performance is measured by comparing expected and actual achievements for all operations that have been completed; for Levels 3 and 4 the Bank’s progress is measured against its progress in achieving its 2014 targets set out in the Bank’s Results Measurement Framework.
Good progress: On average the group improved over baselines or reference groups.
Moderate progress: Results are mixed: on average the group of indicators show moderate improvement.
Progress stalled or regressed: On average the group of indicators stalled or regressed.
Progress could not be measured.
LEVEL 2: ARE AfDB OPERATIONS MAKING AN IMPACT?
Transport
Water
Energy
ICT
Private sector
Agriculture
Cross-border transport
Cross-border energy
Vocational training
Education
Health
Financial management
Public sector transparency
Competitive environment
Infrastructure development
Private sector developmentRegional integration
Skills & technology Governance & accountability
LEVEL 1: IS AFRICA MAKING DEVELOPMENT PROGRESS?
Economic inclusion
Spatial inclusion
Social inclusion
Political inclusion
Sustaining growth
Building resilience
Managing natural assets
Reducing waste and pollution
Inclusive growth Transition towards green growth
LEVEL 3: ARE AfDB OPERATIONS MANAGED EFFECTIVELY?
Country-level results Gender & climate changeEffective & timely operations
Country engagement
Aid effectiveness
Gender-informed operations
Climate-informed operations
Quality of operations
Portfolio performance
Learning from operations
LEVEL 4: IS AfDB AN EFFICIENT ORGANISATION?
Moving closer to our clients Engaging & mobilising staff Value for money
Decentralisation
Connectivity
Human resources
Gender
Cost-efficiency
IT services

Annual D
eve
lopm
ent Effe
ctiveness R
evie
w 2
015
5
hinterland. With electrification rates at just 42.5%, African businesses and households face high energy costs and unreliable supply. Firms are forced to rely on back-up generators, at an estimated total fuel cost of $5 billion per year. Yet Africa has huge potential for clean energy, particularly hydropower. As the cost of alternative power technologies falls, the scope for innovative off-grid and mini-grid solutions is increasing rapidly. Transport is another key bottleneck. High transport costs add 75% to the price of goods. Yet countries like Ethiopia, through a long-term investment programme, have succeeded in extending access to road transport, with immediate impact on poverty and food security. Meanwhile, the spread of mobile telephone services — which are growing at 4.2% annually — is opening new ways of delivering financial and other services.
Social inclusion — 2015 marks the end date for the Millennium Development Goals (MDGs). It is clear that the 15-year- old targets have accelerated progress on social inclusion across Africa, particularly in health and education. In the health area, maternal and child mortality have both been substantially reduced, though by less than the MDG targets, through the spread of basic health services and appropriate care for mothers and babies. HIV-AIDS prevalence has fallen from 5.8% in 2000 to 4.7% in 2012, and malaria prevention and treatment campaigns have had a significant effect. However, the Ebola epidemic in Guinea, Liberia and Sierra Leone was a serious setback. The tragic loss of nearly 10 000 lives, including those of 500 health workers, has exposed some sharp deficiencies in national health systems. With support from development partners, the affected countries have now begun to put in place long-term programmes to boost their health infrastructure and increase the numbers of health workers.
In education, Africa is on track to achieve its MDG on primary enrolment, thanks to aggressive national enrolment campaigns. However, many countries are struggling to achieve acceptable learning outcomes, and too many African children are leaving school without basic competencies in reading and mathematics. With half the African population now under 25 years old, youth unemployment has become one of the most pressing social challenges of our time. Formal employment accounts for just 16% of jobs in sub-Saharan Africa and is not expanding at anywhere near the rate needed to absorb new labour market entrants. The great majority of young people therefore work on family farms or in other household enterprises, which offer few opportunities for advancement. Young women are particularly disadvantaged in the search for gainful employment.
Political inclusion — Africa’s recent strong growth performance rests on a foundation of significantly improved economic governance. Across Africa, macroeconomic management and the business environment have improved dramatically. Yet overall performance on governance remains mixed and punctuated by setbacks. In 2014 tax collection as a share of GDP remained
stable compared to 2010, at 22.3%, reflecting the difficulties that resource-rich countries face in taxing the extractive industries. Surveys suggest that a large majority of Africans would be willing to pay higher taxes in return for better public services, but most do not trust government to use the resources appropriately. Overall, there is growing concern as to whether African democracy is robust enough to manage the pressures associated with a rapidly growing population and the lack of economic opportunity for young people.
Competitive economies — In recent years, African countries have introduced a large number of measures to improve the business environment: increasing the efficiency of company registration, property transactions, cross-border trade, tax administration and investor protection. Many of the best performers have been rewarded with increased investment flows. But beyond the regulatory environment, creating competitive economies requires adequate infrastructure, a skilled workforce, access to financial services and a good rate of technology acquisition and diffusion. Against these broader measures, Africa still performs relatively poorly, with its average position on the Global Competitiveness Index improving only marginally in recent years. There have been important innovations in providing financial services to the poor, including Kenya’s famous M-Pesa system, but two-thirds of African adults remain financially excluded. Despite these challenges, Africa is becoming more attractive as an investment destination, with Ghana, Kenya, Mozambique, Nigeria, South Africa, Tanzania and Uganda all receiving increased flows.
Towards green growthAfrica is blessed with abundant natural resources, which could help to lift much of the continent out of poverty. Yet Africa is also acutely vulnerable to the effects of environmental degradation and climate change. It needs to begin to move towards a green growth pathway, managing both renewable and non-renewable resources sustainably and in the interests of future generations.
Building resilience — In a changing climate, Africa’s water resources will come under increasing stress, and rates of soil degradation and desertification will increase. A key priority will be building resilience to water shocks. Currently, sub-Saharan Africa withdraws just 3% of its renewable water resources. Given the diversity of local ecosystems, African countries need to find innovative local solutions for water harvesting and storage, based on better management of
High transport costs add 75% to the price of goods
Two-thirds of African adults remain financially excluded
66% of Africans would be willing to pay higher taxes in return for better public services

6
Executive summary
soil moisture and community-based irrigation. A growing population will also place pressure on food security. The proportion of Africans who are food-insecure has slowly declined, to 27.6% in 2014, but the picture varies substantially across countries, with fragile states particularly vulnerable. Africa still has much to do to put in place the institutional capacity for environmental sustainability and adaptation to climate change.
Managing resources sustainably — As new mineral resource discoveries are made across Africa each year, the management of the extractive industries and their revenues has become a key policy priority. There is a need for more robust governance arrangements, so that decision-making is transparent and revenues are used in the public interest. Agriculture continues to generate 57% of all employment in Africa and provides the main source of income for 90% of the rural population. Boosting agriculture incomes through better farming and agro-processing is therefore key to defeating poverty. Currently, Africa imports $25 billion in foodstuffs. If more of this could be supplied by African agriculture, it would help to drive inclusive growth. Unfortunately, agriculture remains a relatively neglected sector, and agricultural productivity has improved little in recent decades. Africa’s smallholders are caught in a vicious circle; isolated from their markets, they depend on middlemen, which denies them the returns needed to invest in greater productivity. Breaking this cycle calls for innovative business models, which are beginning to emerge in a number of countries through partnerships between agri-businesses and smallholders.
Sustainable infrastructure — While Africa has made a negligible contribution to the global production of greenhouse gases, its ecological footprint is nonetheless growing fast. In particular, its rapidly growing cities pose serious environmental challenges and are in urgent need of sustainable infrastructure. Africa has half of the world’s clean energy potential, particularly in hydropower, barely 10% of which is currently tapped. Pipeline projects in DRC have the potential to transform Africa’s power supply. Africa is also beginning to innovate with mini-grid or off-grid clean energy solutions. With the cost of solar power falling rapidly, sales of solar-powered mobile phone charging devices are doubling annually, while companies are beginning to develop household appliances able to run on the low-voltage direct current produced by solar power systems.
AfDB’s contribution to Africa’s transformationAs Africa’s premier development finance institution, the AfDB has a portfolio of operations valued at more than $31.7 billion. Through our lending, our technical expertise and our policy advocacy, we support Africa’s development in five priority areas: infrastructure, regional
integration, private sector development, skills and technology, and governance and accountability. Our support helps to create the conditions in which Africans can identify and implement innovative solutions to their development challenges.
Infrastructure — Infrastructure remains our highest priority, absorbing the lion’s share of our resources. We invest heavily in transport infrastructure, helping to put in place the backbone highway network to link African countries to each other and the feeder roads that link business and households to markets and services. Over the past two years, we have built or rehabilitated over 6000 km of road and provided 32 million people with improved access to transport. Projects like the 175 km road between Wacha and Maji in Ethiopia have dramatically reduced transportation costs for farmers, raising rural incomes. We are also investing in railways, airports and port facilities. In the energy sector, we have funded over 1.3 GW of new power generation capacity, while providing 10 million people with electricity connections. We are making substantial investments in renewable energy, such as Africa’s largest wind power project in Lake Turkana in Kenya, and we are helping African countries to access international climate funds and leverage private-sector finance for clean energy projects. Our investments in water and sanitation have benefited more than 4 million people, and we have a strong focus on the management of water resources, so as to boost water security.
Regional integration — We believe that regional integration is the foundation for economic transformation in Africa, helping to connect producers into more productive value chains and achieve economies of scale. Under our new Strategy for Regional Integration 2014–2023, we are prioritising the development of regional infrastructure (along with the institutions required to manage it) and the promotion of industrialisation and trade. In the past two years, we have built 680 km of cross-border roads, together with improved border infrastructure. We have ongoing investments in cross-border power transmission lines, helping to join national power grids into more efficient regional power pools. Many of our regional initiatives have an explicit focus on promoting peace and security, such as our support for the International Conference on the Great Lakes Region.
Private sector development — We aim to build an environment in which African business can innovate and flourish. Our Private Sector Strategy 2013–2017 focuses on improving Africa’s business climate and promoting enterprise development. Through our budget support operations and technical assistance, we are helping African countries to modernise their business regulations and make their tax systems more effective. We are also helping to create a sustainable market in micro-finance for household enterprises and small business. Over the past two years, we have provided 17 900 microcredits and created 1.2 million jobs, of which 340 000 were for women. Our private sector window is providing finance for more established businesses, with a focus on public-private partnerships, particularly in the infrastructure sector.
Skills and technology — We are investing in the technical and vocational skills of young Africans, to equip them for gainful
Agriculture continues to generate 57% of all employment in Africa and provides the main source of income for 90% of the rural population

Annual D
eve
lopm
ent Effe
ctiveness R
evie
w 2
015
7
employment and successful entrepreneurship. Our support has a strong focus on science and technology, to promote more innovative, knowledge-based economies. Over the past two years, we have provided vocational training to 5430 young people and constructed over 1480 classrooms and educational support facilities. We are rapidly expanding our investments in this area, with projects to transform systems of vocational training in Congo, Mauritania, Morocco, Rwanda, Tanzania and Zimbabwe. We are also supporting a network of centres of excellence in biomedical science, to help address the skills gap.
Governance and accountability — Our new Governance Strategic Framework and Action Plan 2014–2018 sets out how we will help to tackle Africa’s governance deficits. Our main focus is on economic governance. We are helping to strengthen the business environment through improved regulation. For example, we helped Mozambique establish a one-stop shop for business registration. We are investing in more inclusive and sustainable financial systems. We support many African countries on budgeting and financial management, helping them to raise revenues and target their spending to development priorities, guided by the principles of transparency and accountability. In Comoros, for example, we have helped to strengthen the management of the energy sector, while supporting the work of anti-corruption agencies. In Sierra Leone, we are supporting wide-ranging public financial management reforms, including improved governance of the energy and extractive sectors. Our projects are promoting innovations in governance, such as the use of e-governance and improved engagement with civil society and communities.
Agriculture and food security — Our work in the agriculture sector focuses on lifting productivity and increasing food security, while conserving the natural resource base. Over the past two years, we have delivered improved water management across 53 000 hectares of land and planted or reforested over 440 000 hectares. Through our support, over 2.3 million people now use improved agricultural technologies. A key objective of our strategy is to link farmers to agri-businesses, to create more sophisticated value chains and increase rural incomes. We are paying close attention to promoting resilience in the face of climate change. For example, we are helping seven West African countries manage their natural resources better through irrigation schemes, pastoral facilities, storage and market infrastructure, and new production facilities for fisheries and aquaculture.
Promoting gender equality — Our Gender Strategy 2014–2018 affirms our commitment to promoting gender equality across our portfolio. We are working to strengthen women’s legal and property rights, promote women’s economic empowerment and make sure that women’s voices are reflected in national development policy. To that end, in 2014 we
financed the third Africa Women’s Economic Summit, held in Zambia, which led to concrete commitments from key financial institutions to boost women’s access to finance. We have three flagship initiatives in the pipeline: a fund that will support women-led and managed businesses with high growth potential; a social investment fund to help women affected by the Ebola epidemic; and an interactive platform to link women entrepreneurs across the continent. We are launching the first Africa Gender Equality Index, providing hard data on gender disparities across 52 countries, to inform policy dialogue.
Addressing fragility and building resilience — Following the report of the Bank’s High Level Panel on Fragile States, led by Liberian President Ellen Johnson-Sirleaf, the Bank has launched a new strategy for working in situations of conflict and fragility, with a focus on building resilience. We now apply a “fragility lens” to all our country programmes, to help identify risks and opportunities. In 2014, the Ebola epidemic showed Africa’s vulnerability to shocks. The AfDB moved quickly to mobilise support for the affected countries. Our emergency response enabled doctors from other African countries to deploy quickly to the affected zones. We then approved a total of $210 million to address some of the deficits that had been exposed in national health systems.
How well the Bank manages its operations2014 proved to be a challenging year, both for the Bank and several of our partner countries. The Ebola epidemic caused widespread disruption in Guinea, Liberia and Sierra Leone, while other countries faced difficult social and political conditions. For the Bank, our successful return to our statutory headquarters in Abidjan, Côte d’Ivoire, absorbed a great deal of management effort. Despite these challenges, we achieved many of our targets for portfolio management.
Stronger country programmes — Our Country Strategy Papers (CSPs) are the foundation of our support, identifying how the Bank can best respond to each country’s needs. We have developed new guidance and formats to drive improvements in quality. We have also incorporated fragility assessments to identify opportunities to help build resilience. In 2014, our CSPs scored an average of 5 on a scale of 1–6, showing steady improvement. Our Country Portfolio Performance Reviews were expanded in coverage, generating many useful insights on how to improve quality. We have strengthened learning across the Bank through the introduction of an Evaluation Results and Lessons Learned database, which is searchable by sector and theme. We have continued to press ahead with our aid effectiveness commitments, increasing our use of country systems, and the predictability of our disbursements. In 2014, we produced
Through our support, over 2.3 million people now use improved agricultural technologies
We are launching the first Africa Gender Equality Index, providing hard data on gender disparities across 52 countries

8
Executive summary
32 major pieces of research and analysis, covering a wide range of sectors and issues. This knowledge work helps to inform our policy dialogue with our partner countries.
Timely and effective delivery — While project performance in 2014 remained solid, the twin impact of Ebola and our return to Abidjan presented new challenges in meeting our targets. Our quality-at-entry systems continue to function well, with rigorous processes for checking the quality of project designs. In 2014, all of our new projects were rated satisfactory, while the time required to approve of new operations and to reach first disbursement continued to decrease. We introduced a new quality assurance dashboard to help senior management monitor portfolio quality. We have continued to strengthen our portfolio supervision, with staff in country offices increasingly taking the lead role. As a result, we have been able to reduce the proportion of operations at risk. Overall, however, our disbursement ratio across the portfolio slipped, showing that projects are taking longer to complete. In addition, the average time for procurement of goods and works slipped back to 9 months, against a target of 8. These missed targets are of concern to management, and the Bank is taking remedial action, including by updating our procurement practices. On a more positive note, the proportion of completed operations rated satisfactory increased from 75% in 2010 to 94% in 2014 — a very strong result.
Gender and climate change — In accordance with our new Gender Strategy, 90% of new CSPs and 90% of new projects now have gender-informed design, while 78% of our projects aim for specific gender-equality outcomes. While this is good progress, we still have some way to go to ensure a consistent focus on gender equality across the portfolio. To that end, we are planning to introduce a gender “marker” to identify projects with significant potential for promoting gender equality and ensure that they receive specialist attention. Under our Climate Change Action Plan, we have provided
support to eight countries on climate-related initiatives and have co-financed 20 projects with international climate funds. Three-quarters of our new projects have climate-informed designs, although this is short of our target of 90%. We are active in international climate-change negotiations, providing technical and
other support to the African Group of Negotiators, and we have produced 59 climate-related knowledge products to deepen the understanding of climate change across Africa.
How well the Bank manages its own organisationDecentralisation — Moving staff and functions closer to our partner countries has been a long-term objective of the Bank. Between 2001 and 2014, our network of country and regional offices expanded from 4 to 38. A 2014 mid-term review of our Decentralisation Roadmap identified many benefits from this stronger country presence, including improved policy dialogue and donor coordination. In 2014, more than 50% of our projects were managed from field offices, and the proportion of professional staff based in the field reached 50% — both well above our targets. We have a strong communications and IT infrastructure in place to support our decentralised operations.
Human resources — The AfDB aims to be the employer of choice for Africans working in development. Our People Strategy sets out our approach to developing leadership, strengthening employee engagement, improving performance and accountability and creating the workforce of the future. We have introduced a new approach to learning and professional development, to ensure that staff are highly motivated and able to remain at the cutting edge of their disciplines. We have introduced a range of measures to embed a high-quality performance management culture throughout the Bank, based on stronger dialogue between staff and supervisors. We successfully supported more than 1000 staff members and their families through the relocation to Abidjan, minimising disruption to our operations. While recruitment was frozen during this period, we have continued to increase the proportion of women in professional and managerial roles.
Value for money — The AfDB is committed to maximising value for money across all aspects of its operations, with a range of recent reforms to streamline our business processes and contain our overheads. We have implemented such cost rationalisation measures as tightening up on travel costs and ensuring more efficient use of office space. We have introduced better cost accounting to strengthen the link between resource use and results. As a result of these measures, we have made good progress in keeping our costs at reasonable levels, achieving our targets for three of our four value-for-money indicators .We are also leading the work with other multilateral development banks to introduce a new conceptual framework on value for money, which will help us to benchmark our performance.
We approved a total of $210 million to address some of the health system deficits in Ebola-affected countries
We are planning to introduce a gender ‘marker’ to identify projects with significant potential for promoting gender equality
We successfully supported more than 1000 staff members and their families through the relocation to Abidjan, minimising disruption to our operations

Annual D
eve
lopm
ent Effe
ctiveness R
evie
w 2
015
9
Conclusions and way forwardAfrica’s growth prospects remain positive for the coming years, driven by a rapidly growing and urbanising population, shifting patterns of trade and investment and improvements in economic management. But we have yet to see a change to the structure of African economies. We need to accelerate the pace of innovation, turning agriculture into an occupation of opportunity, rather than necessity, and creating new jobs and business opportunities in manufacturing.
Our Bank Strategy 2013–2022 gives us a clear direction for our support of economic change over the coming years. Infrastructure remains our highest priority. We will help to finance transport, power, water and communications infrastructure, to put in place the conditions for inclusive and green growth. We will continue to search for innovative solutions to Africa’s infrastructure deficits, including through new, clean energy technologies. We will work with African countries to help boost their competitiveness and accelerate investment flows. We will help to develop innovative models for increasing access to microfinance and for public-private partnerships. We will help to link up African businesses across national boundaries, so that they can create new value chains and achieve economies of scale. We will continue to pilot innovative solutions to border management and trade promotion, and we will continue to invest in regional power pools to lower the cost of energy.
Building skills and promoting technology is central to our vision for Africa’s development. Africa has shown its capacity to take new ideas and apply them in creative ways to its unique development challenges. New technologies need to be accompanied by innovative business models. At present, the lack of technical skills across Africa remains a critical constraint on economic change. We will therefore intensify our efforts to equip young Africans with the skills they need to succeed in a knowledge-based economy.
Finally, we recognise that Africa’s changing climate will have a major impact in the coming years on agricultural productivity, food and water security and vulnerability to extreme weather. We will help African countries put in place the policies and institutional capacity to adapt to these challenges, with a strong focus on sustainable management of natural resources.
Looking ahead, 2015 promises to be a landmark year for the international development community. We hope to see the adoption of new Sustainable Development Goals at the UN Summit in September, alongside new international commitments on financing for development in Addis Ababa in July and on climate change in Paris in December. As usual, the AfDB will be at the centre of these events, helping to ensure that the African voice is heard.
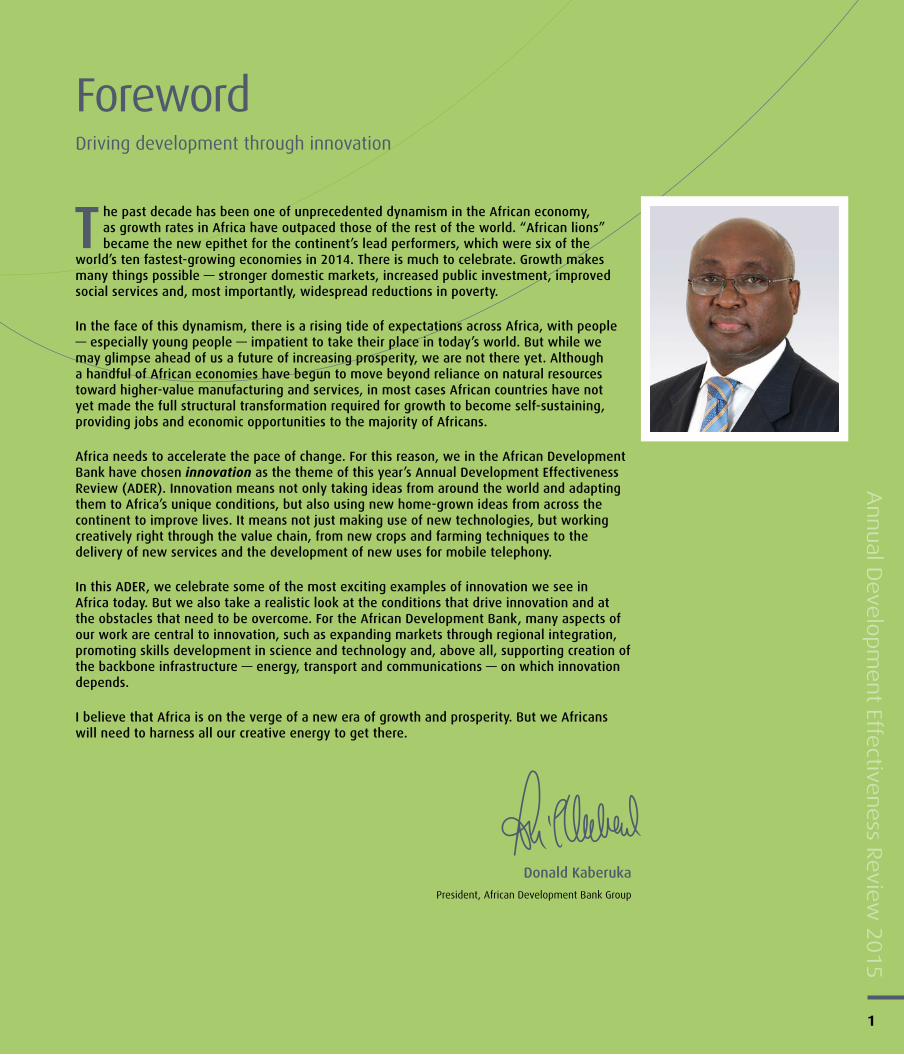
The Bank is setting up a network of centres of excellence in biomedical science and engineering across East Africa in view of the critical shortage of skills in biomedical science, which is constraining health service development.
© A
fDB,
Arn
e H
oel
10

Annual D
eve
lopm
ent Effe
ctiveness R
evie
w 2
015
11
Introduction
Each year, the Annual Development Effectiveness Review (ADER) affords us an opportunity to review contemporary development trends in Africa and to reflect on the contribution of the African Development Bank (AfDB, or the Bank). Drawing on data from a wide range of sources, we explore Africa’s progress against key targets and milestones and assess some of the opportunities and risks that lie ahead. We review whether we have delivered on our own targets, whether our portfolio is properly managed and whether our capacity as a development bank is developing as it should.
2015 is a pivotal year, both for Africa and the AfDB. As the completion year of the Millennium Development Goals, it is a time for reviewing progress and setting new priorities. For the Bank, it marks the completion of our first half-century and a time of transition in our leadership, with a new President taking office in September.
In many ways, this is an optimistic moment in Africa’s history. A decade of strong economic growth has brought with it the prospect of real progress on reducing poverty and spreading prosperity. Yet for most Africans, this has yet to translate into tangible improvements. We have not yet seen the transformation in African economies needed to deliver new jobs and livelihoods for the majority.
The 2015 ADER therefore focuses on the theme of innovation. Structural change will require far-reaching innovation, in agriculture, manufacturing and services. It calls for new thinking in policies, institutions and social organisation. Innovation means taking the best new technologies and ideas available around the world and adapting them to African conditions. Even more, it means using new home-grown ideas to improve lives. Throughout this publication, we highlight examples of successful innovations and review the drivers of and blockages to innovation that we see today.
The ADER follows the structure of our Results Measurement Framework. In the first chapter, we explore Africa’s progress on inclusive growth across five dimensions: economic, spatial, social, and political inclusion, and promoting sustainable growth through improved competitiveness. We also look at Africa’s transition towards green growth, including building resilience in the face of climate change, managing natural resources sustainably and promoting sustainable infrastructure. We introduce the innovation theme and highlight how it links to Africa’s development.
The second chapter maps the Bank’s contribution to helping Africa achieve these transitions. It follows the five priorities set out in the Bank’s Strategy 2013–2022: infrastructure development; regional integration; private sector development; skills and technology; and governance and accountability. In each area, we present our progress towards our targets through the use of simple traffic-light indicators.
The third chapter reviews the health of our portfolio, drawing on 21 indicators and targets from the Results Measurement Framework. The fourth chapter looks at how we manage ourselves as an organisation, looking at progress in areas such as staffing, decentralisation and ensuring value for money. The final chapter draws out some key themes and messages and sets out some priorities for the Bank for the coming period.
The ADER helps us to reflect on our performance and identify areas where we need to enhance our efforts. In addition, as part of our commitment to being transparent and accountable across our operations, the ADER is written in a non-technical manner, so as to be accessible to our partners and stakeholders in Africa and beyond.
Figure 1 The Bank’s Results Measurement Framework
LEVEL 1 – WHAT DEVELOPMENT PROGRESS IS AFRICA MAKING?
LEVEL 2 – HOW WELL IS AFDB CONTRIBUTING TO DEVELOPMENT IN AFRICA?
LEVEL 3 – IS AFDB MANAGING ITS OPERATIONS EFFECTIVELY?
LEVEL 4 – IS AFDB MANAGING ITSELF EFFICIENTLY?

12
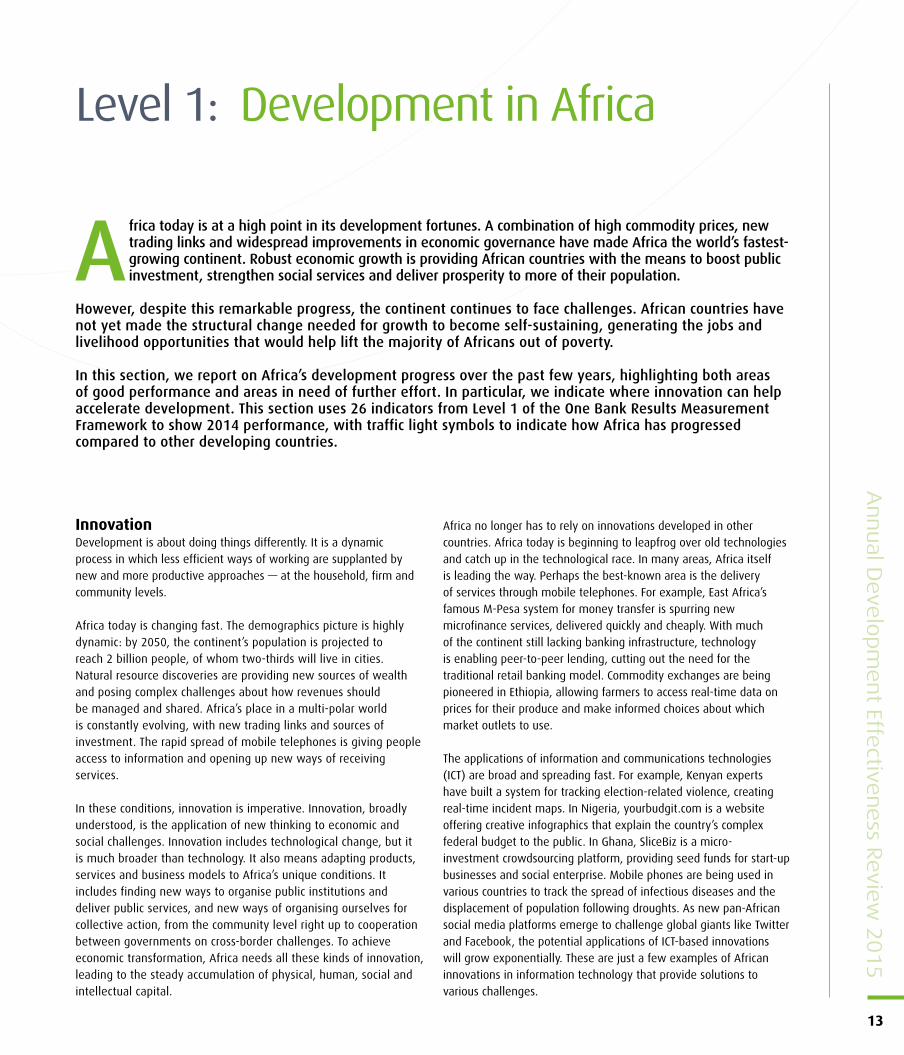
Mobile technology is changing lives in Africa Africa has turned the challenge of limited communication infrastructure into its greatest strength
With technology hubs springing up across Africa
Innovative applications are designed to meet Africans’ unique needs
And almost half of all Africans to be mobile subscribers by 2020
Source: Africa Progress Panel, GSMA, World Bank, iHub research. Mobile subscribers for SSA.
9 8 7 6
18
GhanaKenya
NigeriaSenegal
South Africa
Number of tech hubs
347M504M
2014
Uniquemobilesubscribers
2020
M-Pesa mobile money transferThrough a system of electronic accounts,
M-Pesa facilitates money transfers of up to $500.
M-ShwariThis banking product allows M-Pesa customers to save and borrow money by phone while earning
interest on the money saved.
mWater Geolocational mobile app that helps users find
safe drinking water in their area. It also helps local water authorities, health professionals and others
test and map water.
Tigo Family Care InsuranceProvides life insurance coverage of up to US$520
for the mobile subscriber. Policies last for a month and are renewable monthly, based on deductions
received and airtime usage.
M-Farm Connects farmers with each other in a virtual
space. Helps famers collectively buy inputs directly from manufacturers and sell produce to the
market.
mHero Combines health worker registries, patient data,
real-time monitoring and open messaging systems to ensure a fast and integrated response. Using
‘trigger’ words, it contacts specialised workers if a disease like Ebola is discovered.
M-Kopa Solar‘Pay-as-you-go’ energy for off-grid customers. Customers acquire solar systems for a small
deposit and then purchase daily usage ‘credits’ for US$0.45, or less than the price of traditional
kerosene lighting.
Annual D
eve
lopm
ent Effe
ctiveness R
evie
w 2
015
13
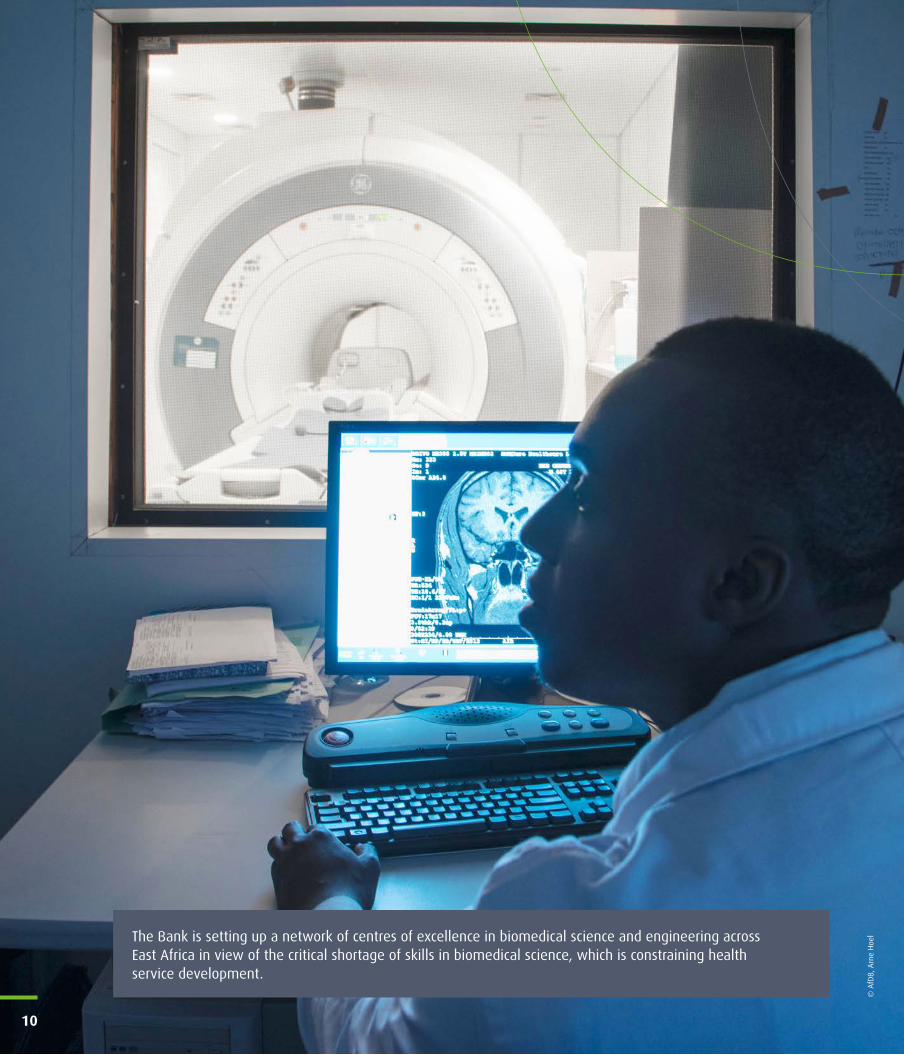
Africa today is at a high point in its development fortunes. A combination of high commodity prices, new trading links and widespread improvements in economic governance have made Africa the world’s fastest-growing continent. Robust economic growth is providing African countries with the means to boost public investment, strengthen social services and deliver prosperity to more of their population.
However, despite this remarkable progress, the continent continues to face challenges. African countries have not yet made the structural change needed for growth to become self-sustaining, generating the jobs and livelihood opportunities that would help lift the majority of Africans out of poverty.
In this section, we report on Africa’s development progress over the past few years, highlighting both areas of good performance and areas in need of further effort. In particular, we indicate where innovation can help accelerate development. This section uses 26 indicators from Level 1 of the One Bank Results Measurement Framework to show 2014 performance, with traffic light symbols to indicate how Africa has progressed compared to other developing countries.
InnovationDevelopment is about doing things differently. It is a dynamic process in which less efficient ways of working are supplanted by new and more productive approaches — at the household, firm and community levels.
Africa today is changing fast. The demographics picture is highly dynamic: by 2050, the continent’s population is projected to reach 2 billion people, of whom two-thirds will live in cities. Natural resource discoveries are providing new sources of wealth and posing complex challenges about how revenues should be managed and shared. Africa’s place in a multi-polar world is constantly evolving, with new trading links and sources of investment. The rapid spread of mobile telephones is giving people access to information and opening up new ways of receiving services.
In these conditions, innovation is imperative. Innovation, broadly understood, is the application of new thinking to economic and social challenges. Innovation includes technological change, but it is much broader than technology. It also means adapting products, services and business models to Africa’s unique conditions. It includes finding new ways to organise public institutions and deliver public services, and new ways of organising ourselves for collective action, from the community level right up to cooperation between governments on cross-border challenges. To achieve economic transformation, Africa needs all these kinds of innovation, leading to the steady accumulation of physical, human, social and intellectual capital.
Africa no longer has to rely on innovations developed in other countries. Africa today is beginning to leapfrog over old technologies and catch up in the technological race. In many areas, Africa itself is leading the way. Perhaps the best-known area is the delivery of services through mobile telephones. For example, East Africa’s famous M-Pesa system for money transfer is spurring new microfinance services, delivered quickly and cheaply. With much of the continent still lacking banking infrastructure, technology is enabling peer-to-peer lending, cutting out the need for the traditional retail banking model. Commodity exchanges are being pioneered in Ethiopia, allowing farmers to access real-time data on prices for their produce and make informed choices about which market outlets to use.
The applications of information and communications technologies (ICT) are broad and spreading fast. For example, Kenyan experts have built a system for tracking election-related violence, creating real-time incident maps. In Nigeria, yourbudgit.com is a website offering creative infographics that explain the country’s complex federal budget to the public. In Ghana, SliceBiz is a micro-investment crowdsourcing platform, providing seed funds for start-up businesses and social enterprise. Mobile phones are being used in various countries to track the spread of infectious diseases and the displacement of population following droughts. As new pan-African social media platforms emerge to challenge global giants like Twitter and Facebook, the potential applications of ICT-based innovations will grow exponentially. These are just a few examples of African innovations in information technology that provide solutions to various challenges.
Level 1: Development in Africa

14
Level 1: Development in Africa
Table 1: Development in Africa (Level 1)
This table summarises the continent’s development progress between 2010 and 2014. The indicators are those in the One Bank Results Measurement Framework 2013–2016, reflecting the Bank’s two strategic goals: inclusive growth and the transition towards green growth. Inclusive growth has five dimensions: economic, spatial, social, and political inclusion, and promoting sustainable growth through improved competitiveness. The transition to green growth has three: building resilience and adapting to a changing climate, managing natural resources sustainably, and promoting sustainable infrastructure.
Progress is strong and better than peers1 Progress is positive but less than peers or no progress against the baseline
Regression against the baseline Data are not available to measure progress
INDICATORALL AFRICAN COUNTRIES OF WHICH ADF COUNTRIES
Baseline 2010 Latest 20142 Baseline 2010 Latest 20142
INCLUSIVE GROWTH
Economic inclusion: Reducing poverty and income inequality
Gross domestic product (GDP) growth (%) 4.8 4.3 6.0 5.8
GDP per capita (US$) 905 948 352 380
Population living below the poverty line (%) 42.0 42.3 48.3 45.7
Income inequality (Gini index) 42.3 41.7 40.3 40.9
Spatial inclusion: Expanding access to basic services
Access to improved water source (% population) 66.5 68.2 59.8 61.5
Access to improved sanitation facilities (% population) 40 39.1 24.1 25.1
Access to telephone services (per 1000 people) 538 742.1 367.6 565.7
Access to electricity (% population) 40 42.5 22.4 24.0
Road density (km per km2) 7.9 8.2 6.7 7.1
Share of population living in fragile countries (%) 22 23.4 22.8 22.9
Social inclusion: Ensuring equal opportunities for all
Life expectancy (years) 58 59 57 58
Enrolment in education (%) 45 45 38 39
Enrolment in technical/vocational training (%) 12.5 11.4 8.2 9.9
Unemployment rate (%) 10.6 8.2 6.38 6.4
Women’s participation in the labour market (%) 54.7 64.5 72.9 73.1
Political inclusion: Securing broad-based representation
Mo Ibrahim Index of African Governance (index) 51 51.5 47.5 48.1
Tax and non-tax fiscal revenues (% of GDP) 22 22.3 15.5 16.6
Index of effective and accountable government (index) 2.7 2.8 3.2 2.9
Country Policy and Institutional Assessment (CPIA) score 4.0 3.4 3.4 3.5
Gender-Sensitive Country Institutions (index) .. 0.3 .. 0.3
Sustaining growth: Building competitive economies
Intra-African trade (billion US$) 125 145 23.4 32.4
Cost of trading across borders (US$) 2090 2384 2338 2675
Economic diversification (index) 0.6 0.6 0.6 0.6
Global competitiveness (index) 3.6 3.61 3.4 3.5
Time required for business start-up (days) 42 26.2 39.5 20.4
Access to finance (% population) .. 32.9 .. 14.1

Annual D
eve
lopm
ent Effe
ctiveness R
evie
w 2
015
15
Electricity supply is one major bottleneck in the spread of new technology across Africa. Yet innovation is also helping to find ways around the problem. Simple, off-grid electricity solutions are spreading fast; for example, the use of solar-powered mobile phone chargers is increasingly common.
The future of African agriculture depends heavily on innovation. After decades of stagnant agricultural productivity, climate change now brings the prospect of widespread disruption. Innovations in biotechnology and farming methods are required to deal with the threats of disease, pests and drought, and to boost the low nutritional content of staple crops. Adapting to climate change is a knowledge-intensive process; an understanding of complex changes is needed to inform innovation. This calls for new forms of collaboration among government, academia, business, civil society and farming communities across Africa.
So how well equipped is Africa to promote innovation? Most African countries have Ministries of Science and Technology, which support capacity building and skills training across government and business and provide incentives for research and development
(R&D). A growing number of countries also have technology hubs, which are catalysts for innovation and entrepreneurship. In 2005, the African Ministerial Council on Science and Technology agreed on a Consolidated Action Plan, including promoting new policies and institutional arrangements, strengthening facilities for R&D, and investing in the education of scientists, technicians and engineers. The African Union set a target of 1% of GDP to be spent on R&D, although most countries’ expenditures remain well below that share.
The need for innovation is therefore widely recognised. Yet for Africa to harness its energy and creativity, some constraints need to be overcome (see Figure 1.1). One is the huge deficit in basic infrastructure, including energy, transport and ICT. Infrastructure is the platform for innovation in its many dimensions. The more Africans who are connected through infrastructure, the greater the pace of structural change in the economy. Indeed, Africa also needs to be innovative in the way infrastructure is developed — from off-grid solutions for local power to the development of the continent’s vast hydroelectric potential and the building of infrastructure for its rapidly growing cities.
INDICATORALL AFRICAN COUNTRIES OF WHICH ADF COUNTRIES
Baseline 2010 Latest 20142 Baseline 2010 Latest 20142
THE TRANSITION TOWARDS GREEN GROWTH
Building resilience and adapting to a changing environment
Food insecurity (% of population) 29 27.6 27.8 25.9
Resilience to water shocks (index) .. 3.87 .. 1.72
Managing natural assets efficiently and sustainably
Institutional capacity for environmental sustainability (index) 3.5 3.5 3.3 3.4
Agricultural productivity (US$ per worker) 537 547 290 303
Promoting sustainable infrastructure, reducing waste and pollution
Production efficiency (kg CO2 emissions per US$ of GDP) 0.18 0.16 0.18 0.16
Renewable energy (% total electricity produced) 16 16.3 78 77.3
.. = data not available; ADF = African Development Fund; GDP = gross domestic product; US$ = United States dollars.1 Peers refers to other developing countries around the world. For two indicators — the Mo Ibrahim index and institutional capacity for environmental sustainability — Africa is not
assessed against peers but rather on the basis of progress on historic trends. 2 Where data are not available for 2014, the latest available values are used.
Notes: ADF countries are the 37 lower-income AfDB member countries that qualify for concessional funding: Benin, Burkina Faso, Burundi, Cameroon, Central African Republic, Chad, Comoros, Democratic Republic of the Congo, Côte d’Ivoire, Djibouti, Eritrea, Ethiopia, Gambia, Ghana, Guinea, Guinea-Bissau, Kenya, Lesotho, Liberia, Madagascar, Malawi, Mali, Mauritania, Mozambique, Niger, Rwanda, São Tomé and Principe, Senegal, Sierra Leone, Somalia, Sudan, South Sudan, Tanzania, Togo, Uganda, Zambia, and Zimbabwe.
Source: AfDB, Carbon Dioxide Information Analysis Center, Education Statistics, Food and Agriculture Organization, Freedom House, International Finance Corporation, International Labour Organization, IMF, International Telecommunications Union, Mo Ibrahim Foundation, Organisation for Economic Co-operation and Development, UN Population Information Network, UN Conference on Trade and Development, United Nations Development Programme, United Nations Children’s Fund, World Bank, World Economic Forum.

16
Level 1: Development in Africa
A second constraint is human capital. Africa has done extremely well at expanding basic education, achieving near-universal access. While this is no small feat, the level of skills available is still well short of what is required for economic transformation. Africa needs centres of excellence to train a new generation of leaders in politics, government, business and civil society. It also needs a critical mass of skills in science and technology, to enable business to expand into knowledge-intensive areas.
A third constraint is Africa’s fragmentation into small, national markets, which do not permit the economies of scale required for innovative products and services to become competitive. Innovators across the continent need to be able to link with each other and with their counterparts around the world. Investment across national boundaries drives the spread of technology and innovative approaches, as does the free movement of skilled labour. Around the world, rapid and sustained growth in converging economies has been possible only because the world has become more open and integrated, allowing ideas, technologies and know-how to be transplanted rapidly.
In short, while innovation comes from across society — from individuals, firms, farmers, communities, universities and civil society organisations — it cannot take root and flourish unless the state provides an appropriate environment. When correctly implemented, innovation policies will create jobs and foster inclusive economic growth.
Inclusive growthThe AfDB Strategy 2013–2022 has two overarching goals for Africa: inclusive growth, and a gradual transition towards a green growth development path. Inclusive growth is broken down into several dimensions: economic and spatial growth, social and political
inclusion, and the development of competitive economies. In this section we explore each of these dimensions in turn.
Economic inclusion: Reducing poverty and income inequalityThe story of Africa’s recent economic dynamism is, by now, a familiar one. Africa is enjoying its strongest growth performance in 40 years. Since 2000, most African countries have maintained average growth rates of above 5% per year, despite an adverse international climate. And there have been some exceptional performers. In the decade to 2010, Angola averaged 11.1% growth, Nigeria 8.9%, Ethiopia 8.4%, Mozambique and Chad both 7.9%, and Rwanda 7.6%, putting them among the 10 fastest-growing economies in the world. In addition, other countries came close to the 7% level of growth needed for an economy to double in size every 10 years. In 2014, Africa’s low-income countries averaged 5.8% GDP growth and the growth prospects look solid to the end of this decade and beyond.
There are a range of reasons for this strong performance. High commodity prices have clearly contributed, as have new natural resource discoveries and stronger trade and investment relations with China and other emerging economies. Yet beyond the natural resource boom, the strong growth performance also rests on significantly better economic management and a much improved business climate. Long-term factors, such as strong population growth, urbanisation, the rise of the African middle class and the spread of ICT, have also played a part.
While the growth story is a positive one, performance in the area of economic inclusion is less encouraging. Growth remains concentrated in a limited number of sectors and locations; it is not yet translating into new jobs and livelihood opportunities for the majority of Africans. In Nigeria, for example, a decade of rapid growth was accompanied by substantial increases in unemployment, from 14.8% in 2003 to 24% in 2011. Over three-quarters of Africans are self-employed or in family businesses, mostly in agriculture or micro-trade, which offer few opportunities for advancement.
In the absence of mass employment creation, poverty rates have fallen relatively slowly. The proportion of the population living below the poverty line1 reached 42.3% in 2014 across Africa as a whole — an improvement of just 0.1% since 2010. While the rate of poverty reduction in low-income countries is slightly higher, it is clear that the benefits of growth are not being shared widely. Income inequality, as measured by the Gini Index2, has improved slightly across Africa as a whole, but has slipped backwards in low-income countries. Six of the world’s 10 most unequal countries are in Africa.
One of the more promising trends in the African economy is the rise of the middle class. In 2011, using the threshold of $2 in income per
1 A green bullet indicates that progress is strong and better than peers.
2 A yellow bullet indicates that progress is positive but less than peers or no progress against the baseline.
Figure 1.1 Africa is harnessing innovation through...
1 2 3
Infrastructure Provides the platform
for innovation
Human capital Enables business to expand into knowledge-intensive
areas
Markets integrationLinks innovators across the
continent and the world
In the decade to 2010, Angola averaged 11.1% growth, ranking among the 10 fastest-growing economies in the world

Annual D
eve
lopm
ent Effe
ctiveness R
evie
w 2
015
17
day, we calculated that 313 million Africans had achieved middle-class status. By 2030, this number is expected to reach half a billion, or nearly a third of the population. The rise of the middle class — clustered in Africa’s rapidly growing urban centres and dominated by young, outward-looking people who are quick adopters of new technologies — is a potential game changer for the African economy. It has created an increasingly attractive market for goods and services, for both foreign and domestic investors.
Yet the middle class is growing only slightly faster than the population as a whole. The number of people in the upper-middle-class category ($10–$20 per day) has increased by only 2% over the past decade, despite growth rates of 5–6%. As a result, the consumer boom remains confined to a few countries. Across the board, African households still spend 80% of their income on food. Indeed, in the short to medium term, the innovations required for commercial success in the African market will be around producing inexpensive versions of consumer items and selling them in small packages that are accessible to the poor.
Africa’s relatively slow progress in addressing income poverty indicates a lack of structural transformation in African economies. Asia’s huge progress in poverty reduction came about through the mass creation of low-skilled employment, as Asia become the world’s workshop. We have yet to see this shift in Africa. A few countries — Mauritius, South Africa, and Uganda — have made progress in shifting labour from traditional, low-value-added agriculture into more productive manufacturing and services. Côte d’Ivoire, the world’s largest source of cocoa beans, has begun to capture more value from its exports by expanding local capacity in chocolate production. It has attracted three multinational companies in its effort to capture a share of a global confectionary market estimated to be worth $84 billion.
But overall there has been limited progress in diversifying African economies away from their traditional reliance on unimproved primary products. In fact, sub-Saharan Africa’s share in global manufacturing has declined in recent years. The level of innovation in the African economy — the creative abandonment of inefficient means of production in favour of new, more productive methods — remains far too low.
Surveys of African businesses offer many of reasons for this lack of innovation: unreliable electricity supply, poor transport connections, burdensome regulations, inadequate finance and a lack of skills within the workforce. Until the conditions are in place for greater innovation, Africa’s growth will not be inclusive enough to make major inroads into poverty.
Spatial inclusion: Expanding access to infrastructure Among the various constraints on innovation in Africa, the huge deficit in infrastructure stands out as the most basic. Thirty African countries face chronic power outages. High transport costs add 75% to the price of goods. Poor water and sanitation costs some 5% of GDP. While Internet penetration is increasing quickly in Africa, it is still well behind that of other developing regions. All of these conditions are barriers to the adoption of the new technologies and methods of production.
And yet, the infrastructure deficit in Africa is one of the factors that makes innovation imperative. Africa cannot afford to wait for the slow build-up of its infrastructure stocks over the next two decades. It needs to find innovative ways to fill the gaps and work around the deficiencies.
Electric power is an obvious precondition for the adoption of many new technologies. The electrification rate has increased to 42.5% across Africa (but just 24% in low-income countries), as compared to 77% across the developing world. This means that 620 million people and 10 million small and medium-sized enterprises (SMEs) are without access to power. The rate of electrification is not keeping up with population growth. Since 2000, an additional 145 million people in sub-Saharan Africa gained access to electricity, but the total without access still rose by 100 million.
The wide gulf between electrification in urban areas, which averages 65%, and in rural areas, at just 28%, is a significant driver of inequality. And even those who do have access to electricity face regular outages and prices that are on average three times those of Europe or North America. Losses across poorly maintained networks are double the global average. The lack of reliable power forces firms to rely on back-up generators running on diesel or gasoline, at an estimated total
Box 1.1 GDP re-basing — recalculating the size of Africa’s economy
In recent years, a number of African countries have made upward revisions in their official calculations of the size of their economies, by changing the calculation method. In 2014, Nigeria announced that its economy was nearly 90% larger than previously thought, thereby leapfrogging over South Africa to become Africa’s largest economy. The exercise also reveals a more diversified economy than previously estimated. Earlier, Ghana and Kenya had revised their gross domestic product (GDP) upwards by 60% and 25%, respectively.
Real GDP is calculated by reference to a base year. The further back the base year, the less reliable the estimates become. The International Monetary Fund advises countries to update their base year at least every 5 years. Only 10 of Africa’s 54 countries meet this standard, and a few use base years that are more than 20 years old. The AfDB estimated that Africa’s true GDP may be a third higher that the current estimates — a potentially encouraging signal to investors.
By 2030 the African middle class will reach half a billion, creating an attractive market dominated by young outward-looking people

18
Level 1: Development in Africa
fuel cost of $5 billion in 2012. The lack of power is a major barrier for firms wishing to invest in new plant and equipment. Yet there have been some major successes at the national level, showing what can be achieved through sustained commitment. In Ghana, 25 years of investment have boosted the electrification rate above 70%.
Around 700 million Africans live without clean cooking facilities. The use of biomass — which remains Africa’s dominant energy source — poses both health and environmental threats. Foraging takes up a disproportionate amount of time, especially for women and children. The predominant form of lighting in African homes is kerosene (paraffin), which costs poor households $100 for the equivalent of a kilowatt hour — more than 100 times the cost of lighting in wealthy countries. Indoor pollution from unimproved stoves and lamps is estimated to cause 600 000 deaths in Africa each year.
However, the increasing availability of clean energy is already beginning to make a difference. The use of off-grid and mini-grid solutions is growing rapidly. South Africa is using solar and mini-hydropower plants to provide power to remote areas; by 2014 it had successfully powered 700 schools, 600 health clinics and 800 other public buildings. While solar power remains relatively expensive, exchanging an inefficient kerosene lamp for a solar appliance that can also charge a mobile phone is an increasingly attractive proposition. The latest figures suggest that around 5% of the Africans
without access to electricity grids are now making use of solar lighting. With most of Africa enjoying 320 days of bright sunlight each year, the potential for solar power and other renewables will grow exponentially as technology improves and costs come down.
Transport infrastructure is another basic condition for economic transformation and inclusive growth. Affordable, all-season transport connections are key to linking African producers to each other, to their sources of inputs and to their markets in Africa and beyond. Investment in transport infrastructure is increasing, thanks to major Africa-wide programmes like the Programme for Infrastructure Development in Africa, but it is still well short of what is required. On average, African countries invested 15–25% of their GDP in transport infrastructure between 2005 and 2012; by comparison, India invested 32% and China 42%. As a result, Africa’s transport infrastructure is improving but not yet catching up with other developing regions of the world.
Roads are the dominant form of transport in Africa, carrying 80% of goods and 90% of passengers. Africa’s road density (km of road per km2 of territory) reached 8.2 in 2014, compared to 7.9 in 2010. A high proportion of the road network is unpaved and therefore unusable in the wet season. Just 35% of Africans have access to an all-season road, compared to 67% across all developing countries. Once again, however, the figures show that the problem can be addressed through sustained investment programmes. Ethiopia has succeeded in reducing the average distance to an all-weather road from 21 km in 1997 to 12.4 km in 2012, with a significant impact on poverty and food security. Rail remains underdeveloped across the continent, with few additions since colonial times.
In Ghana, 25 years of investment have boosted the electrification rate above 70%
Figure 1.2 New frontiers for trade in Africa
RadesTanger Med
Casablanca
Kribi
Luanda
Walvis Bey
Durban
Nqura
Beira Port-Louis
Bagamoyo
Djibouti
En�dha
Le Cap
Monrovia
Las Palmas
Port-Said
MombasaLamu
Dar es Salaam
Dakar
Lekki
Conakry
Pointe-noire
Nacala
North America
Asia
Europe
LatinAmerica
Africa represents only 5% of global maritime trade and less than 2% of the container traffic in the world, but trading volumes have increased fourfold since 2007.
A new network is emerging connecting the interior to the sea: along with Tanger, Le Cap, and Dakar, new ports are being developed at Lamu and elsewhere. Between 2007 and 2017, more than 50 billion $ will be invested in Africa to develop ultramodern automated port terminals.
Source: Questions internationales n° 70, Jeune Afrique Economie.
241010
51.8
1.451.351.30
0 5 10 15 20 25
BadagriLekkiBeira
En�dhaNacalaKribi
BagamoyoLamu
Planned investments in port and transport corridorsEstimates, in $ billion
Existing portsFuture ports-industry complexesDistribution zonesTrade routes

Annual D
eve
lopm
ent Effe
ctiveness R
evie
w 2
015
19
Ports are critical for allowing African producers to access world markets, for both inputs and exports. Africa has 64 ports in total, but many are poorly equipped and offer long processing times and poor handling rates. Shipping costs to and from Africa are on average 50% higher than between other continents. However, Africa’s regional hubs — such as Durban, Dar es Salaam, Mombasa and Djibouti — are all developing, and new regional capacity is emerging (see Figure 1.2). For example, Senegal’s Dakar Port Container Development Project has created 24-hour operating capacity, reducing the waiting time for ships from 15 to 2 hours.
Air connections are also becoming increasingly important, especially for landlocked countries. These connections are key to the development of perishable exports, such as cut flowers, meat and vegetables. Air freight costs remain high because of low volumes of passenger traffic, high taxes and limited infrastructure. Ethiopian Airlines has nonetheless doubled its fleet capacity over the past 5 years and plans further expansion.
The expansion of telecommunications in Africa has been one of the most visible drivers of innovation over the past decade.
Access to telephone services reached 742 per 1000 people in 2014 — up from 538 in 2010 — and penetration is growing at 4.2% annually. This figure is dominated by mobile subscriptions, as African countries leapfrog over the heavy infrastructure costs of landlines networks. Mobile phones are also the predominant means of accessing the Internet. Because few carriers offer handset subsidies, the cost of smartphones remains one of the key barriers to Internet access. However, with Africa now the second-largest mobile phone market in the world, more manufacturers are offering affordable products. There has been substantial investment in recent years in submarine cables, bringing broadband coverage up to 16% in 2012, although landlocked countries and remote areas lag behind. Mobile communications are opening up a raft of new business models and ways of delivering education and government services.
With mobile data traffic expected to rise twentyfold by the end of the decade, the main economic impact of this revolution in connectivity is still ahead (see Figure 1.3).
For many African countries, water and sanitation have proved to be the most challenging of the Millennium Development Goal (MDG) commitments for many African countries. Access to an improved water source reached 68.2% in 2014 — an improvement of less than 2% over 2010. Access to improved sanitation3 has in fact
declined slightly, to 39.1%, as investment has failed to keep up with population growth. Sanitation has improved in rural settings in low-income countries, thanks to increases in donor investment, but has stagnated in urban areas, with sharp divisions between wealthier and poorer neighbourhoods. In areas affected by political instability and refugee movements, the lack of clean water and sanitation continues to be a major public health threat. It also poses a significant burden on women and girls, who often walk long distances to access water. Clean water is a critical input for agro-processing industries and therefore key to opening up new livelihood opportunities and increasing food security. As climate change increases water insecurity, communities across Africa will need to become more innovative in their management of this resource.
Social inclusion: Ensuring equal opportunities for all2015 marks the end date for the MDGs and the expected launch of new Sustainable Development Goals. It is therefore an apt time to
60 00017 million 25%of Kenya’s GDP
in transactions each yearAgent outletsKenyans using M-Pesa
Figure 1.3 Going mobile: A high-profile innovation in financial services
Safaricom, Kenya’s largest mobile phone operator, launched the ‘M-Pesa’ mobile money service in 2007. It facilitates money transfers up to $500 through a system of electronic accounts. Exchange of cash for electronic value is done through a network of regional stores (‘agents’), paid on commission, that has now reached 60 000 outlets. The service is used by 17 million Kenyans, or two-thirds of the adult population, and handles the equivalent of 25% of Kenya’s GDP in transactions each year. Over time, the service has extended beyond transfers to include bill payment, disbursing salaries and government-to-citizen payments. A linked service, M-Shwari, now offers additional services, enabling people to borrow and to earn interest through their electronic accounts.
Kenya’s deep mobile penetration, at 70%, made the success of the M-Pesa possible. But success also depended on some important innovations in the business model. While building the M-Pesa system, Safaricom focused on building trust and brand image, rather than on short-term profits, enabling it to acquire a loyal customer base. It also invested considerable resources in training its agents. The Kenyan government facilitated its development through a light-touch regulatory approach.
3 A red bullet indicates that there has been regression against the baseline.
Between 2007 and 2017, more than $50 billion will be invested in Africa to develop ultramodern automated port terminals
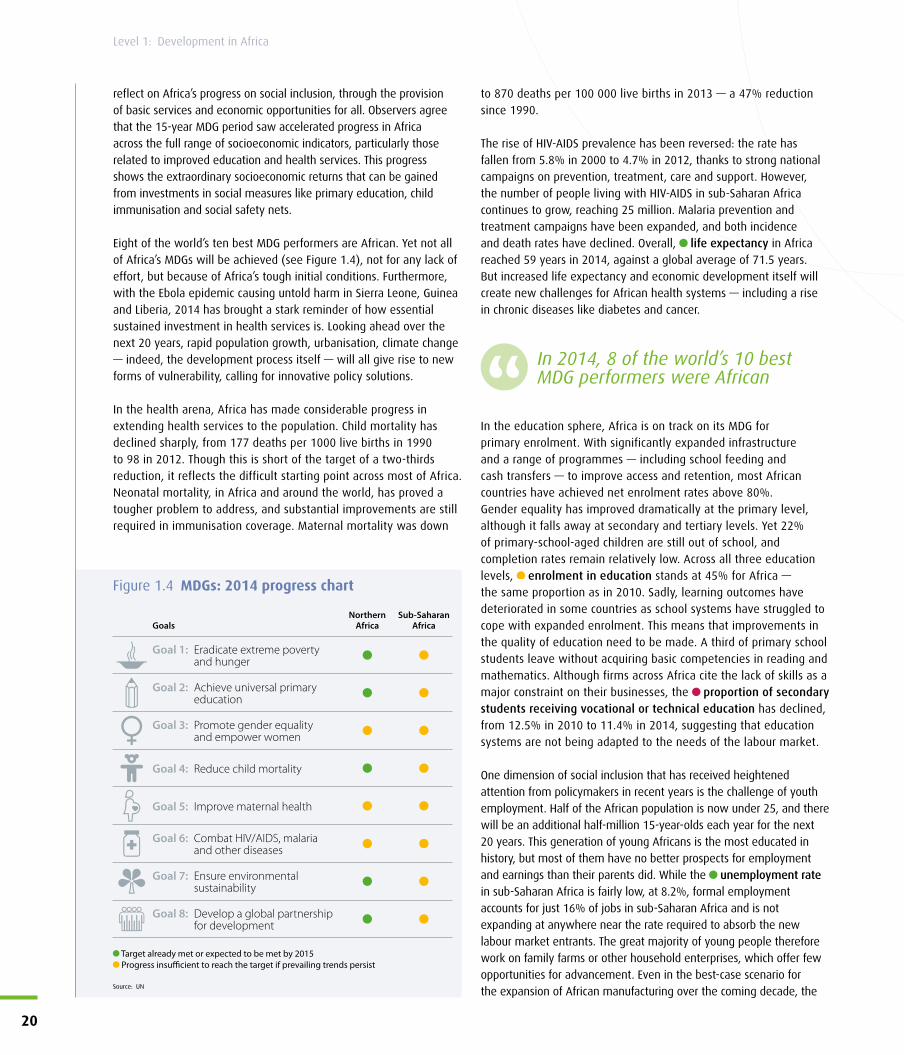
20
Level 1: Development in Africa
reflect on Africa’s progress on social inclusion, through the provision of basic services and economic opportunities for all. Observers agree that the 15-year MDG period saw accelerated progress in Africa across the full range of socioeconomic indicators, particularly those related to improved education and health services. This progress shows the extraordinary socioeconomic returns that can be gained from investments in social measures like primary education, child immunisation and social safety nets.
Eight of the world’s ten best MDG performers are African. Yet not all of Africa’s MDGs will be achieved (see Figure 1.4), not for any lack of effort, but because of Africa’s tough initial conditions. Furthermore, with the Ebola epidemic causing untold harm in Sierra Leone, Guinea and Liberia, 2014 has brought a stark reminder of how essential sustained investment in health services is. Looking ahead over the next 20 years, rapid population growth, urbanisation, climate change — indeed, the development process itself — will all give rise to new forms of vulnerability, calling for innovative policy solutions.
In the health arena, Africa has made considerable progress in extending health services to the population. Child mortality has declined sharply, from 177 deaths per 1000 live births in 1990 to 98 in 2012. Though this is short of the target of a two-thirds reduction, it reflects the difficult starting point across most of Africa. Neonatal mortality, in Africa and around the world, has proved a tougher problem to address, and substantial improvements are still required in immunisation coverage. Maternal mortality was down
to 870 deaths per 100 000 live births in 2013 — a 47% reduction since 1990.
The rise of HIV-AIDS prevalence has been reversed: the rate has fallen from 5.8% in 2000 to 4.7% in 2012, thanks to strong national campaigns on prevention, treatment, care and support. However, the number of people living with HIV-AIDS in sub-Saharan Africa continues to grow, reaching 25 million. Malaria prevention and treatment campaigns have been expanded, and both incidence and death rates have declined. Overall, life expectancy in Africa reached 59 years in 2014, against a global average of 71.5 years. But increased life expectancy and economic development itself will create new challenges for African health systems — including a rise in chronic diseases like diabetes and cancer.
In the education sphere, Africa is on track on its MDG for primary enrolment. With significantly expanded infrastructure and a range of programmes — including school feeding and cash transfers — to improve access and retention, most African countries have achieved net enrolment rates above 80%. Gender equality has improved dramatically at the primary level, although it falls away at secondary and tertiary levels. Yet 22% of primary-school-aged children are still out of school, and completion rates remain relatively low. Across all three education levels, enrolment in education stands at 45% for Africa — the same proportion as in 2010. Sadly, learning outcomes have deteriorated in some countries as school systems have struggled to cope with expanded enrolment. This means that improvements in the quality of education need to be made. A third of primary school students leave without acquiring basic competencies in reading and mathematics. Although firms across Africa cite the lack of skills as a major constraint on their businesses, the proportion of secondary students receiving vocational or technical education has declined, from 12.5% in 2010 to 11.4% in 2014, suggesting that education systems are not being adapted to the needs of the labour market.
One dimension of social inclusion that has received heightened attention from policymakers in recent years is the challenge of youth employment. Half of the African population is now under 25, and there will be an additional half-million 15-year-olds each year for the next 20 years. This generation of young Africans is the most educated in history, but most of them have no better prospects for employment and earnings than their parents did. While the unemployment rate in sub-Saharan Africa is fairly low, at 8.2%, formal employment accounts for just 16% of jobs in sub-Saharan Africa and is not expanding at anywhere near the rate required to absorb the new labour market entrants. The great majority of young people therefore work on family farms or other household enterprises, which offer few opportunities for advancement. Even in the best-case scenario for the expansion of African manufacturing over the coming decade, the
GoalsNorthern
AfricaSub-Saharan
Africa
Goal 1: Eradicate extreme poverty and hunger
Goal 2: Achieve universal primary education
Goal 3: Promote gender equality and empower women
Goal 4: Reduce child mortality
Goal 5: Improve maternal health
Goal 6: Combat HIV/AIDS, malaria and other diseases
Goal 7: Ensure environmental sustainability
Goal 8: Develop a global partnership for development
Target already met or expected to be met by 2015 Progress insufficient to reach the target if prevailing trends persist
Figure 1.4 MDGs: 2014 progress chart
Source: UN
In 2014, 8 of the world’s 10 best MDG performers were African

Annual D
eve
lopm
ent Effe
ctiveness R
evie
w 2
015
21
majority of young people will continue to work in the informal sector. To increase earnings, therefore, it is urgent to boost the productivity of family farms and micro-enterprises.
Another important dimension is gender equality. African women are highly active as workers and entrepreneurs, with female labour force participation of 73.1% in sub-Saharan Africa. However, they face a range of barriers to achieving their productive potential. They are more likely to be self-employed and in low-productivity occupations, with correspondingly lower earnings. Even in formal employment, their wages are 10% to 30% lower than men’s. Women-headed farms tend to be less productive, because women have lower access to inputs like fertiliser. Women face unequal land rights, including restrictions on inheritance and vulnerability to dispossession following divorce or widowhood. The economic empowerment of women is not just morally right; it is also key to promoting inclusive growth.
Political inclusion: Securing broad-based representationIt is clear that Africa’s recent strong growth performance rests on a foundation of significantly improved economic governance. Yet governance remains one of the most important constraints on economic transformation and inclusive growth.
At the level of political representation, many of the indicators look positive. The numbers of countries with regular elections continues to rise, while nondemocratic regimes are increasingly isolated. The African media are becoming freer, helped by the rise in citizens’ access to information through the Internet. According to Afrobarometer, 71% of Africans believe in democracy, but only 43% are satisfied with the way their democracy works. As a result, there is a real question as to whether Africa’s political systems are robust enough to manage the pressures associated with rapid population growth, urbanisation, and the lack of economic opportunity for young people.
Government capacity to promote economic transformation presents a mixed picture. The Mo Ibrahim Index of African Governance registers a slight overall improvement in African governance between 2010 and 2014. The average, however, hides considerable variation. In recent years, 39 countries have improved their performance while 13 have slipped back. Most of the progress has been on participation and human rights, with economic governance static and public safety and the rule of law going backwards. Every country has slipped on at least one indicator, showing the vulnerability of good governance to setbacks and reversals. In the AfDB’s Country Policy and Institutional Assessment, the average score across Africa has slipped backwards since 2010, from 4.0 to 3.43.
Facing huge financing needs, African countries need to do more to mobilise domestic resources. Tax and non-tax collection as a share of GDP remained stable in 2014 compared to 2010, at 22.3%. But it decreased from 29% in 2013 reflecting the difficulties resource-rich countries encounter in taxing multinational companies. The figure for low-income countries is more positive,
showing a slight rise to 17%. The challenges include low savings rates, a limited tax base, poor tax administration, and business regulations that allow opportunities for tax evasion. Africa urgently needs laws that restrict transfer pricing by multinational companies and capital outflows to tax havens.
On the expenditure side, most African countries have improved their budget formulation but have made less progress on budget execution. A continuing disconnect between plans and budgets, and between budgets and actual expenditure, suggests that some countries are still unable to target their expenditure to development priorities. Poor reporting, accounting and auditing practices create inefficiencies and leakage. An Afrobarometer survey found that, while 66% of Africans would agree to pay higher taxes in return for better public services, 62% did not understand the tax system and 76% were unsure of how government used the revenues. Greater integrity and transparency in public financial management might therefore translate into increased willingness of citizens and firms to pay their taxes.
The last two years have seen a worrying spike in armed conflict across Africa. Civil conflict affected the Central African Republic, Sudan, South Sudan, Mali, Nigeria, eastern Congo, and Somalia, causing wider threats to the stability of their regions. The drivers of these conflicts include the lack of economic opportunity, the rising cost of living, prolonged social exclusion, extreme inequality and competition for natural resources — a reminder of the extent to which conflict and poverty are mutually reinforcing. At present, some 20% of Africans or 200 million
people live in fragile states.
Box 1.2 The far-reaching impact of Ebola
As the rate of infection from the Ebola epidemic declines, West Africa is counting the human and economic costs. As of March 2015, nearly 10 000 lives have been lost. Across Guinea, Liberia and Sierra Leone, there has been widespread disruption to agriculture, trade and other livelihood activities, while tourists and investors have stayed away. As a result, the economies of both Sierra Leone and Guinea are expected to contract in 2015, and West Africa as a whole will lose some $1.6 billion in forgone economic growth.
The Ebola crisis exposed sharp deficiencies in the three countries’ public health systems, which were rapidly overwhelmed. Guinea had just 10 doctors per 100 000 people, compared to 80 in South Africa. All three countries now have programmes in place to boost health infrastructure and increase the numbers of health workers. They can offer safer burial practices, increased public awareness of infectious disease and improved tracking systems.
66% of Africans are willing to pay higher taxes in return for better public services

22
Level 1: Development in Africa
Sustaining growth: Building competitive economiesThe private sector is driving Africa’s strong growth performance; it generates 90% of jobs and 70% of the continent’s output. As a result, efforts to improve the business environment can have a significant impact on growth performance. Over the past four years, the average
time required to start a business has fallen from 42 days to 26, and just 20 days in low-income countries. Some 400 000 new African companies are now registered each year. There have been widespread improvements in property registration, cross-border trade, tax regimes and investor protection. On the World Bank’s Doing Business Index, sub-Saharan Africa accounted for 5 of the top 10 improvers (Benin, Togo, Côte d’Ivoire, Senegal and DRC). The countries with more favourable business environments are rewarded by increased levels of trade and investment.
However, an improved regulatory environment for business is just one of the factors required to enhance overall competitiveness and achieve economic transformation. The macroeconomic environment, quality of infrastructure, level of skills in the workforce, levels of domestic savings and investment, foreign investment flows and the level of technology acquisition and diffusion all play an important role. On these broader measures of competitiveness, Africa still performs relatively poorly. On the Global Competitiveness Index, Africa’s average position has improved only very marginally in recent years, and most African countries still have a low ranking. Box 1.3 shows some of the challenges African countries can face in boosting their competitiveness.
Economic transformation will require a lot of investment. It is encouraging that despite the challenges, Africa is becoming more attractive as an investment destination. In a recent survey of business leaders, Africa was ranked as the second-most-favoured region of the world, with 60% of respondents expressing the view that conditions are improving. This investor optimism is reflected in growing foreign direct investment (FDI) figures for sub-Saharan Africa, which have risen by an average of 19.5% per year since 2007. Ghana, Kenya, Mozambique, Nigeria, South Africa, Tanzania, Uganda and Zambia are all among the leading destinations. In addition, FDI projects are diversifying beyond the extractives industries to include more consumer-facing industries: telecommunications, retail, financial services and manufacturing. For example, the Chinese shoe manufacturer Huajian has established a 600-person factory in Addis Ababa and is planning major new investments in Ethiopia’s light-manufacturing sector, while US technology giant General Electric is investing $250 million in an electrical gear manufacturing plant in Nigeria. At the same time, intra-African investment is also on the rise (see Figure 1.5).
One of the key conditions for achieving competitiveness and sustainable growth is regional economic integration. African policymakers have long recognised the need for measures to overcome Africa’s fragmentation into too many national markets, many of them small and landlocked. Over the past four years,
intra-African trade has grown steadily, to $145 billion, or $32 billion for low-income countries. Yet this still represents just 22% of total African trade — a lower level of economic integration than the ASEAN region, at 26%, or the European Union at 62%. To promote integration, Africa has established a complex architecture of regional economic communities (RECs), which is gradually being rationalised. Three major RECs in eastern and southern Africa have established a Tripartite Free Trade Area covering 25 countries with a combined population of 600 million and a total GDP of $1 trillion. In central Africa, two resource-rich RECs
Box 1.3 Boosting Africa’s competitiveness
In 2014-15, Kenya succeeded in moving up six places on the Global Competitiveness Index, to 90th place, registering improvements in 11 of 12 pillars. It performs relatively well on market efficiency, with well-developed financial markets and relatively efficient labour and goods markets. Since the adoption of its 2010 Constitution, it has performed increasingly better on the efficiency of government and reduced corruption. It scores well for basic education and on-the-job training, but its secondary and tertiary enrolment rates are still low. Its most serious challenges include inadequate electricity supply, a weak public health system and continuing security issues.
Source: Global Competitiveness Report 2014-15.
35%45%
38%
12%11%11%
Nigeria
Kenya
South Africa
16%11%11%
Projects Amounts Jobs
Figure 1.5 Africans investing in AfricaShare of FDI projects from Africa as source region
Intra-African investment is gaining momentum. African investors nearly tripled their share of FDI projects over the last decade, from just 8% in 2003 to 22.8% in 2013. As African investors look to develop regional value chains, intra-African investment is now a significant driver of job creation on the continent, helping to promote skills development, technology transfer and innovation.
Source: FDI Intelligence
The private sector is driving Africa’s growth by generating 90% of jobs and 70% of the continent’s output

Annual D
eve
lopm
ent Effe
ctiveness R
evie
w 2
015
23
are planning a merger.4 Yet there are still many barriers to the free movement of goods, services, people and capital, and the
cost of trading across borders has in fact increased by 14% since 2010. A truck on the transport corridor from Koutlala in Mali to Dakar, Senegal, still crosses 100 checkpoints and border posts. Only two mainland African countries — Mozambique and Rwanda — offer visa-free access or visa-on-arrival to other African citizens.
A final key element in sustaining growth is financial inclusion. At present, two-thirds of African adults are financially excluded — that is, they do not use the services of any financial institution. Access to financial services can assist in overcoming the challenges of irregular incomes and unexpected bills, such as an illness in the family. It can help reduce poverty by providing greater access to education and health care, and funds for microbusinesses. Given the challenges to extending conventional banking services across Africa, this is an area that calls for innovation. Financial products need to be tailored to the poor — for example, by timing loan repayments to match seasonal income or by reducing the minimum requirements for savings accounts. Services also need to be made accessible to the poor, either by using retailers as intermediaries or by making using of mobile phone connections. While Kenya has been a leader in this area, other African countries are now following suit.
Transition towards green growthAfrica is blessed with abundant natural resources. With careful husbandry, this natural wealth can offer millions of Africans not just an escape from poverty, but also a route towards lasting prosperity. But Africa’s dependence on natural resources also makes it acutely vulnerable to environmental degradation and climate change. Africa needs to transition towards a green development pathway that protects the rights and interests of future generations.
Green growth means balancing economic development with environmental sustainability by addressing resource depletion, damage to ecosystems, pollution and climate change. It means ensuring that resource rents are reinvested responsibly, to preserve natural and social capital. It means managing growing water stress, adjusting agricultural practices and making communities more resilient to extreme weather. Africa is not going to achieve a green growth pathway overnight. But it needs to begin planning its transition now, to avoid locking itself into unsustainable development pathways.
Building resilience and adapting to a changing environmentOf all the world’s continents, Africa is the most exposed to the impacts of climate change. As global temperatures rise, the hydrological cycle is expected to intensify, with water-scarce areas becoming drier even as more rain falls in the tropics. The climate will become more volatile, with increased frequency
of both droughts and flooding. Climate change will compound existing environmental problems. Currently, 200 million Africans live on degraded land, and 37% of the continent is at risk of desertification. Africa’s vulnerability comes from its heavy dependence on rain-fed agriculture, its lack of economic diversification and its relatively weak institutions.
A major priority will be building resilience to water shocks5. Water is at the centre of the water-energy-food nexus (see Figure 1.6). It is critical to farmers, herders and fishers, as well as to the prospects
4 The RECs are SADC, COMESA, and EAC (Southern African Development Community, Common Market for Eastern and Southern Africa and East Africa Community); those in central Africa are CEMAC and ECCAS (Economic and Monetary Community of Central Africa and Economic Community of Central African States).
5 A grey bullet indicates that data are not available to measure progress
Irrigation,fertilisers,
harvesting, tillage,processing,
storage
Bioenergyproduction
Irrigation,processing
Water quality
Pumping, water/wastewater treatment,drainage, dessalination,
water distribution
Energy generation,cooling, extraction,
transport, bioenergyproduction
FoodEnergy Water
Figure 1.6 The energy, water and food nexus
By 2050, global demand for energy will nearly double, while the demand for food and water will increase by over 50%. Meeting this demand, against a backdrop of limited resources and climate change, will be a significant challenge. Water, energy and food systems are closely interlinked, creating a nexus that determines whether water, energy and food security objectives can be achieved simultaneously. Innovative solutions, such as renewable energy technologies, can help manage the trade-offs, bringing benefits across all three sectors.
Source: IRENA
Africa’s hydropower capacity is estimated at 285 GW — more than 3 times the current electricity needs of sub-Saharan Africa

24
Level 1: Development in Africa
of diversifying rural economies into agro-processing. Currently, sub-Saharan Africa withdraws only 3% of its renewable water resources — the lowest share of any continent. Given the huge diversity of local ecosystems, there is a strong need for innovation in developing local solutions, including improved water harvesting and storage, better management of soil moisture, and small-scale, community-based irrigation schemes.
The challenge of managing a changing climate will be a magnified by a rapidly growing African population, which is projected to reach 2 billion by 2050, putting increasing pressure on food security. Africa has made important progress in this area — the proportion of the population that is food-insecure declined from 29% in 2010
to 27.6% in 2014, and Africa’s position on the Global Hunger Index is now better than South Asia’s. However, the picture is affected by political instability and local food prices, and it varies across countries. In recent years, a number of countries — Burkina Faso, Central African Republic, Gambia, Niger, Mali, Togo and Tanzania — have declared food security emergencies and prepared national action plans to address these challenges.
Africa still has a great deal of work to do to put in place the necessary adaptation measures to avoid being overwhelmed by the effects of climate change. It needs better early-warning systems for droughts and floods and strong local community structures for meeting threats. It needs substantial investment in reforestation to protect surface water systems, and in rainwater catchment and storage to meet human and agricultural needs. Africa’s rapidly growing cities also urgently need investment to protect them against seawater inundation, improve drainage and sanitation, and reduce the risk of water-borne diseases in the aftermath of flooding. The full costs are very difficult to calculate, but World Bank estimates suggest that Africa could face annual costs of $350 billion to adapt its agriculture systems and infrastructure, if global temperatures rise by more than 2°C. Africa’s institutional capacity for environment sustainability also needs to improve substantially.
Managing natural assets efficiently and sustainablyAs new mineral discoveries are made across Africa each year, the responsible management of revenues from the extractive industries has become a key priority. If reinvested in sustainable development, these resources could make a huge contribution to national development. Without proper governance arrangements, however, they can drive both conflict and corruption. The innovations required are therefore primarily in governance. Africa’s resource-rich countries need to ensure greater participation in and transparency of decision-making on natural resource management. They need a clear consensus on national development goals, striking the right balance between spending on immediate social needs and long-term investments. To that end, many of Africa’s resource-rich countries are developing sovereign wealth funds to ensure that resources are used for the benefit of future generations. Since 2012, Angola, Nigeria, Senegal and Ghana have established sovereign wealth funds with initial seed capital of $5 billion, $1 billion, $1 billion and $100 million respectively.
Africa also needs to take care of its abundant renewable resources, especially its land. Over the next 20 years, Africa faces the challenge of doubling its agricultural output while dealing with adverse changes to its climate. Yet this challenge is also an opportunity. African countries currently import $25 billion in foodstuffs, but only $1 billion comes from other African countries. If Africa could supply more of that market through domestic
Low productivityLow incomes
Low output quality
Low availabilityof quality inputs
at a fair price
Low mechanisation/
access totechnology
No investmentinto land
improvements
Di�cultyaccessing formalmarkets due tostructural andinfrastructural
issues
Not enoughinformationand training
Decision-makingbiased towardsrisk mitigation
No availabilityof risk mitigation
mechanisms toguard against totalloss and volatility
Figure 1.7 Breaking the vicious cycle for African smallholders
Smallholder farmers in Africa are caught in a vicious circle. They are lacking training, inputs, mechanisation, investment, risk management and market access. The costs of finance can be prohibitive, at over 35%. Most value chains are relatively unstructured, forcing smallholders to access markets through middlemen and leaving profit margins that are too low to attract commercial investors.
Yet agriculture offers ample opportunity for profitable investment if value chains can be organised more efficiently. Stakeholder collaboration can drastically reduce the unit costs for inputs and services, while increasing prices for farm produce. Innovative models are emerging across the continent to structure smallholders into productive partnerships that mitigate risks, improve efficiency, justify investment and provide smallholders a fairer share of the value that is created.
Source: Grow Africa
African countries import $25 billion in foodstuffs, but only $1 billion comes from other African countries

Annual D
eve
lopm
ent Effe
ctiveness R
evie
w 2
015
25
production, it would provide a route to secure and prosperous livelihoods for a growing population. With agriculture generating 57% of all employment and providing the main source of income for 90% of the rural population, boosting agricultural incomes through better farming and agro-processing is an indispensable step in defeating poverty.
Agricultural productivity, which has improved little over the past 30 years, increased from $537 per worker in 2010 to just $547 today. Less than 5% of agricultural output involves irrigation, and fertiliser use for arable crops is just 8 kg per hectare, compared to a global average of 100 kg. Climate change threatens to reduce yields even further. Improving productivity will require progress in a range of areas, including land tenure, access to inputs and markets, and improved transport and storage facilities. Part of the solution may lie in technological innovations, using biotechnology to create crops that are resistant to pests, disease, drought and waterlogging.
African agriculture needs to become not an occupation of last resort but one of opportunity. At present, smallholders are dependent on middlemen for access to markets for inputs, services and outputs, which deprives them of the income they need to invest in increasing productivity (see Figure 1.7). Breaking out of this vicious circle requires innovations in business models and financing. Some innovations are starting to happen, although on a small scale. For example, in Ghana, the agricultural company Premium Foods is providing “nucleus farmers” with financial guarantees that enable them to supply inputs to out-growers on credit and be repaid in kind from post-harvest produce. In Burkina Faso, Pickou Export Ltd. has developed a professionally managed hub to support smallholders growing sesame and black-eyed peas. Such inclusive business models, in which firms share risks and benefits with smallholders in an equitable way, are crucial to promoting inclusive growth in agriculture.
Promoting sustainable infrastructureAfrica has made a negligible contribution to the global production of greenhouse gases. Nonetheless, its ecological footprint is growing through population growth, urbanisation and economic growth. Its production efficiency (that is, carbon dioxide emissions per dollar of GDP) has decreased slightly, from 0.18 kg in 2010 to 0.16 kg in 2014. Africa now has 52 cities with populations above 1 million (the same number as Europe), and the total urban population is above 400 million, of whom half are slum dwellers. These rapidly growing cities pose serious environmental challenges and are in desperate need of investment in infrastructure. Using the latest technologies and environment management techniques will be expensive in the short term, but unquestionably more economical over the longer term.
One of the areas in which innovation is already beginning to make a real impact is clean energy. Africa has half of the world’s clean energy potential and the potential to bypass older technologies and become a global leader in sustainable power. Its technical hydropower capacity is estimated at 285 GW — more than three
times the current electricity needs of sub-Saharan Africa — of which less than 10% is currently tapped (see Figure 1.8). The Grand Inga project in DRC, if it goes ahead, has the potential to transform Africa’s power supply picture.
But many of the most useful innovations in clean energy will be mini-grid or off-grid solutions using solar, wind or small-scale hydro power, either in combination with, or instead of, diesel generators. The cost of producing solar power is falling quickly — from $4 per watt in 2008 to just $1 today. This is opening up new business opportunities. Some 5% of households without electricity now use solar devices, and this share is expected to grow rapidly. Sales of solar-powered mobile phone charging devices are doubling annually.
There is now a market for innovative appliances that can run on the low-voltage direct current produced by solar power systems. A Ugandan company, SolarNow, has produced a $200 low-voltage television set, and a British-designed refrigerator, Sure Chill, needs only a few hours of power each day to maintain a constant temperature of 4°C. Solar-powered ATMs are being deployed in rural areas with intermittent mains power. Scaled up, such solar power systems can be used to power a school or health clinic, or even a mini-grid. A $500 000 plant in Kisiju Pwani, a village in Tanzania, uses
The cost of producing solar power has fallen from $4 in 2008 to just $1 today, opening up new business opportunities
0
50
100
150
200
250
300
Installedcapacity
2012
Underconstruction
Grand Ingaproject
Remainingtechnicalpotential
Central
Southern
East
West
North
Figure 1.8 Potential hydropower capacity in Africa(GW)
Sources: IPCC (2011); IJHD (2009) and (2010); IEA analysis.

26
Level 1: Development in Africa
32 photovoltaic solar panels and 120 batteries to provide 12 kW of electricity — enough for 20 street lights, 68 homes, 15 businesses, two mosques and the local government office. Considerable investment is still needed to identify innovative clean energy solutions that can be delivered cost-effectively to remote locations. But as the costs come down, the opportunities are growing rapidly.
Conclusion and outlookThere is little doubt that Africa is becoming more innovative. Yet change is not yet fast or deep enough; the current strong growth performance will take Africa only so far. There is a need for structural change in the African economy to create the jobs and livelihood opportunities that will lift more Africans out of poverty. Challenges like urbanisation and climate change need to be addressed early, or they will become increasingly unmanageable. Furthermore, if the rising expectations of a new generation of Africans are not met, African societies will find themselves under increasing pressure.
Mobile technology has become an increasingly important platform for business across Africa. Better communications help in many aspects
of private sector activity. In Kenya, the M-Pesa system has provided new financial services to sections of the community that have no access to traditional banking. It is exciting to see new technologies imported from abroad being adapted to African conditions and used in innovative ways, creating business opportunities that are distinctively African.
Africa needs innovation in many other areas. It needs to use the opportunities created by the falling costs of new energy technologies to bring creative power and water solutions to more Africans. Business must explore new models of delivering goods and services to more Africans. Agriculture must become knowledge-driven, to turn it into an occupation of opportunity, rather than necessity. Communities need to organise themselves in new ways, to become more resilient in the face of a changing climate.
All this in turn requires governments to invest in creating the conditions for innovation — from the infrastructure connections that give businesses the confidence to invest and help them work with each other, to sustained investment in raising the skills of Africans in science and technology.

Annual D
eve
lopm
ent Effe
ctiveness R
evie
w 2
015
27

The applications of information and communications technologies are broad and spreading fast. We are actively generating new knowledge and ideas on the use of new technologies. Looking ahead, we expect that our projects will result in 4.6 million more people gaining access to basic ICT services in 2015–17.
© A
fDB,
Arn
e H
oel
28

Annual D
eve
lopm
ent Effe
ctiveness R
evie
w 2
015
29
As Africa’s premier finance institution, the AfDB provides investments, technical knowledge and policy advocacy to transform lives and livelihoods across the continent and help African countries achieve their development goals. At the end of 2014 our portfolio of operations was valued at more than $31.7 billion.
Our Bank Strategy (2013–22) sets out five core priorities, which provide the structure for this chapter: infrastructure, regional integration, private sector development, skills and technology, and governance and accountability. We also provide an account of our work on cross-cutting policy objectives: strengthening food security, promoting gender equality and reducing conflict and fragility.
In this section, we report on progress against 39 indicators at Level 2 of the One Bank Results Measurement Framework, showing results in the period 2012–14. We use a traffic light system to indicate whether we reached or fell short of our targets. We also set out some of our plans and targets for the next three years.
The Bank and innovationUnder our Bank Strategy (2013–22), the AfDB aims to help Africa achieve inclusive growth and make a gradual transition towards a green development path. These ambitions cannot be achieved without a profound transformation in African economies. Such a transformation will require innovation at many levels and from many different sources across society — from firms, civil society organisations, communities and households. While governments can also innovate, through their policy choices and design of organisations and public services, their primary role is to create an environment in which innovation can take place.
This is also true of the AfDB. We help to put in place the conditions that enable Africans to come up with innovative solutions to their livelihood and development challenges. We invest in the infrastructure solutions that enable the adoption of new technologies and help to connect African firms to each other and to the rest of the world. We promote a sound policy environment and a business climate that fosters investment in innovation. We invest in building the capacity of Africans, through improved health outcomes, better education and more access to finance and opportunities. And in addition to creating the environment for others to innovate, we are always looking for opportunities to support innovative solutions in the public and private sectors.
Yet more is needed to achieve the transformation required to make major inroads into poverty reduction. Our first Human Capacity
Strategy (2014–18) identifies the skill levels in the African workforce as a critical constraint to transformation. Under this Strategy, we will intensify our efforts to build skills that foster creativity, innovation and entrepreneurship, especially those of young people and women.
We will help to equip the next generation of Africans to take up job opportunities in manufacturing and business and to turn farming or low-productivity work in the informal sector into real livelihood opportunities (see Box 2.1). This will require a major investment in vocational training capacity, as well as high-impact investments in education, science and technology.
In this chapter, under each of the five operational priorities of our Bank Strategy (2013–22) and the three areas of special emphasis, we present our approach, our operations, our results in recent years and our plans for the coming period.
Infrastructure development The AfDB has a major portfolio of infrastructure operations, with $22 billion invested in transport, energy, water and sanitation, and telecommunications projects across the continent at end-2014. This section describes our infrastructure work and its results.
Transport In recent years, we have given high priority to investing in transport operations, helping to build the backbone infrastructure network
Level 2: How AfDB contributes to Africa’s development

30
Level 2: How AfDB contributes to Africa’s development
Table 2: How AfDB contributes to Africa’s development (Level 2)
This table presents the contribution the Bank is making to development through its operations in Africa. The Bank’s performance is measured by comparing expected and actual achievements for all operations that have been completed:
Bank operations achieved 95% or more of their targets1 Bank operations achieved 60–94% of their targetsBank operations achieved less than 60% of their targets Data are not available to measure progress
INDICATOR2012–2014 2015–2017
Expected Delivered Expected
INFRASTRUCTURE DEVELOPMENTTransport — Roads constructed, rehabilitated or maintained (km) 6184 5126 83% 21 529
Transport — Staff trained/recruited for road maintenance 9142 9376 103% 26 814
Transport — People educated in road safety, etc 663 240 859 400 130% 1 505 762
Transport — People with improved access to transport 19 510 540 19 350 390 99% 43 593 280
— of which women2 9 897 520 9 816 280 15 479 310
Energy — Power capacity installed (MW) 1334 1334 100% 3730
— of which renewable (MW) 142 142 100% 1849
Energy — Staff trained/recruited in the maintenance of energy facilities 20 20 100% 3982
Energy — People with new or improved electricity connections 9 669 470 10 869 730 112% 22 087 750
— of which women2 5 839 810 6 452 060 7 134 630
Energy — CO2 emissions reduced (tons per year) 635 030 706 700 111% 6 208 740
Water — Drinking water capacity created (m3/day) 76 890 58 940 77% 1 213 460
Water — Workers trained in maintenance of water facilities 5391 5234 97% 88 121
Water — People with new or improved access to water and sanitation 4 010 340 4 234 650 106% 41 036 130
— of which women2 2 568 570 2 712 240 27 315 520
ICT — People benefiting from improved access to basic ICT services 602 780 602 780 100% 4 616 960
REGIONAL INTEGRATIONTransport — Cross-border roads constructed or rehabilitated (km) 695 680 98% 5279
Energy — Cross-border transmission lines constructed or rehabilitated (km) .. .. .. 1215
PRIVATE SECTOR DEVELOPMENTGovernment revenue from investee projects and subprojects (US$ million) 1095 1680 153% 1085
SME effect (turnover from investments) (US$ million) 345 386 112% 1392
Microcredits granted (number) 20 198 17 958 89% 50 607
Microfinance clients trained in business management 312 311 100% 35 130
Jobs created 1 260 950 1 239 670 98% 1 194 740
— of which jobs for women2 .. 338 040 439 810
People benefiting from investee projects and microfinance 2 903 380 2 989 180 103% 3 801 340
— of which women2 .. 1 395 910 ..
Agriculture — Land with improved water management (ha) 76 644 53 004 69% 181 770
Agriculture — Land whose use has been improved: replanted, reforested (ha) 452 090 441 270 98% 393 050
Agriculture — Rural population using improved technology 1 188 680 2 305 670 194% 1 306 330
Agriculture — People benefiting from improvements in agriculture 9 762 940 9 696 310 99% 41 726 070
— of which women2 4 219 800 4 191 000 19 521 820
SKILLS AND TECHNOLOGYPeople benefiting from vocational training 8695 5435 63% 78 747
— of which women2 5868 3669 34 008
Classrooms and educational support facilities constructed 1871 1478 79% 1025
Teachers and other educational staff recruited/trained 40 390 33 747 84% 22 661
People benefiting from better access to education 2 196 600 2 159 210 98% 1 116 690
— of which female2 1 046 880 1 029 060 502 510
Primary, secondary and tertiary health centres constructed/equipped 807 755 94% 260
Health workers trained 13 879 14 661 106% 30 417
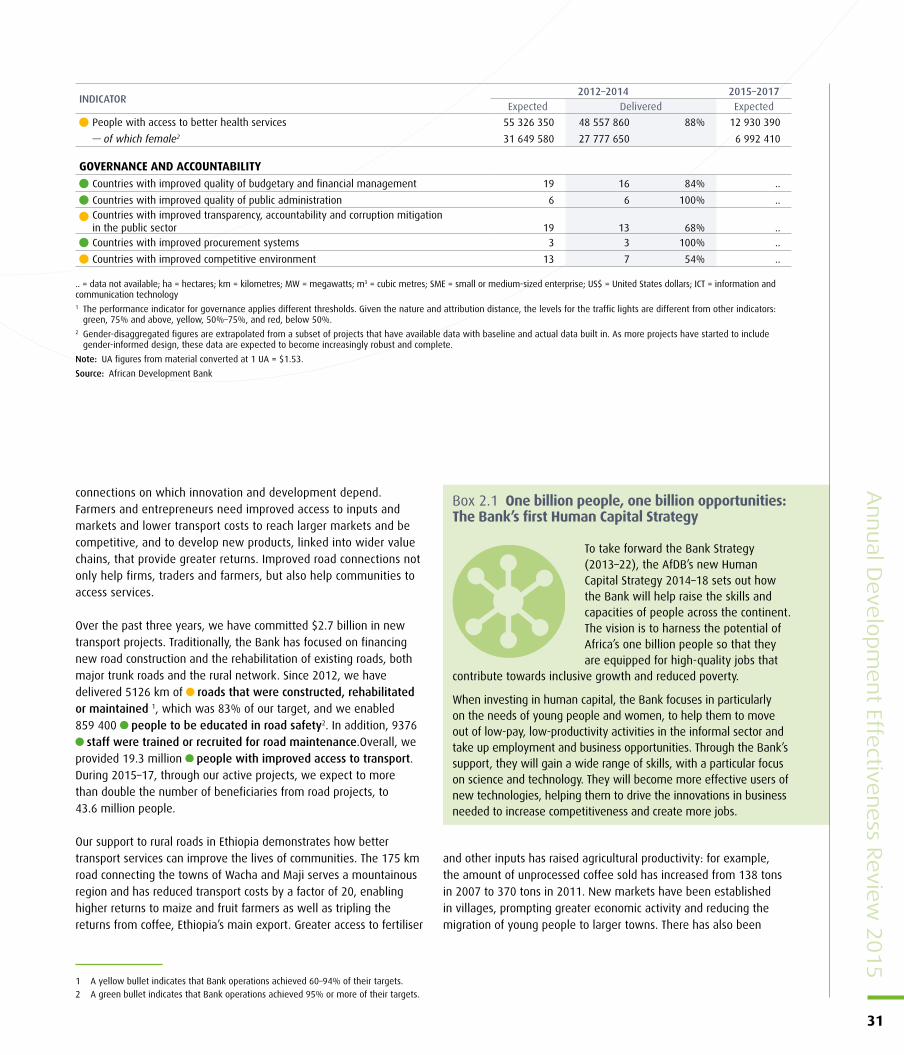
Annual D
eve
lopm
ent Effe
ctiveness R
evie
w 2
015
31
connections on which innovation and development depend. Farmers and entrepreneurs need improved access to inputs and markets and lower transport costs to reach larger markets and be competitive, and to develop new products, linked into wider value chains, that provide greater returns. Improved road connections not only help firms, traders and farmers, but also help communities to access services.
Over the past three years, we have committed $2.7 billion in new transport projects. Traditionally, the Bank has focused on financing new road construction and the rehabilitation of existing roads, both major trunk roads and the rural network. Since 2012, we have delivered 5126 km of roads that were constructed, rehabilitated or maintained 1, which was 83% of our target, and we enabled 859 400 people to be educated in road safety2. In addition, 9376
staff were trained or recruited for road maintenance.Overall, we provided 19.3 million people with improved access to transport. During 2015–17, through our active projects, we expect to more than double the number of beneficiaries from road projects, to 43.6 million people.
Our support to rural roads in Ethiopia demonstrates how better transport services can improve the lives of communities. The 175 km road connecting the towns of Wacha and Maji serves a mountainous region and has reduced transport costs by a factor of 20, enabling higher returns to maize and fruit farmers as well as tripling the returns from coffee, Ethiopia’s main export. Greater access to fertiliser
and other inputs has raised agricultural productivity: for example, the amount of unprocessed coffee sold has increased from 138 tons in 2007 to 370 tons in 2011. New markets have been established in villages, prompting greater economic activity and reducing the migration of young people to larger towns. There has also been
INDICATOR2012–2014 2015–2017
Expected Delivered Expected
People with access to better health services 55 326 350 48 557 860 88% 12 930 390
— of which female2 31 649 580 27 777 650 6 992 410
GOVERNANCE AND ACCOUNTABILITYCountries with improved quality of budgetary and financial management 19 16 84% ..
Countries with improved quality of public administration 6 6 100% ..Countries with improved transparency, accountability and corruption mitigation in the public sector 19 13 68% ..Countries with improved procurement systems 3 3 100% ..
Countries with improved competitive environment 13 7 54% ..
.. = data not available; ha = hectares; km = kilometres; MW = megawatts; m3 = cubic metres; SME = small or medium-sized enterprise; US$ = United States dollars; ICT = information and communication technology1 The performance indicator for governance applies different thresholds. Given the nature and attribution distance, the levels for the traffic lights are different from other indicators:
green, 75% and above, yellow, 50%–75%, and red, below 50%. 2 Gender-disaggregated figures are extrapolated from a subset of projects that have available data with baseline and actual data built in. As more projects have started to include
gender-informed design, these data are expected to become increasingly robust and complete.
Note: UA figures from material converted at 1 UA = $1.53.
Source: African Development Bank
1 A yellow bullet indicates that Bank operations achieved 60–94% of their targets.
2 A green bullet indicates that Bank operations achieved 95% or more of their targets.
Box 2.1 One billion people, one billion opportunities: The Bank’s first Human Capital Strategy
To take forward the Bank Strategy (2013–22), the AfDB’s new Human Capital Strategy 2014–18 sets out how the Bank will help raise the skills and capacities of people across the continent. The vision is to harness the potential of Africa’s one billion people so that they are equipped for high-quality jobs that
contribute towards inclusive growth and reduced poverty.
When investing in human capital, the Bank focuses in particularly on the needs of young people and women, to help them to move out of low-pay, low-productivity activities in the informal sector and take up employment and business opportunities. Through the Bank’s support, they will gain a wide range of skills, with a particular focus on science and technology. They will become more effective users of new technologies, helping them to drive the innovations in business needed to increase competitiveness and create more jobs.

32
Level 2: How AfDB contributes to Africa’s development
accelerated larger-scale investment to develop the rich agricultural land and create jobs. Similarly, in the Democratic Republic of Congo (DRC), the rehabilitation of national and feeder roads has led to important benefits (see Box 2.2).
In addition to giving attention to roads, the AfDB is now responding to the changing context of globalisation, climate change and
rapid urbanisation by diversifying into urban mobility and other transport services — air, rail and ports. We are supporting design work for expanded container capacity at the Walvis Bay port in Namibia. We are beginning to support infrastructure solutions for Africa’s expanding cities, where we finance modernised urban management systems. In 2014 an independent evaluation of our assistance to the transport sector recommended that the Bank improve the sustainability of transport projects through more engagement in the maintenance stages of projects. We will address this issue of sustainability monitoring at the sector level, as our projects are increasingly part of program-based approaches.
EnergyThe Bank has continued to invest in the energy sector to expand access to affordable electricity, which opens up new opportunities for firms and businesses and transforms the lives of individuals. We have contributed to the improvement of the energy sector and its transition towards greater social, economic and environmental sustainability. We have set up a new global partnership platform—the Africa50 Fund—to help address Africa’s energy and wider infrastructure capacity gaps (See Box2.3).
We have delivered well against our targets. In 2012–14, we helped install 1334 MW of new power generating capacity, of which 142 MW was renewable energy. Our investments enabled over 10.8 million people to have new or improved electricity connections and also achieved a reduction of 706 700 tonnes per year in carbon dioxide emissions.
One of our flagship projects was the Tunisia Electricity Project, which helped expand the capacity of the country's power distribution system. A steady increase in Tunisia’s living standards through the early 2000s had generated an annual 12% increase in the demand for electricity, saturating parts of the distribution network and reducing the quality of the service. We supported the installation and rehabilitation of more than 4800 km of transmission and distribution lines and nearly 1700 substations and transformers, along with 202 MW of additional capacity. As a result, over half a million people benefited from more reliable and affordable electricity.
We also financed a major thermal power plant at Abu Qir in Egypt, expanding national generation capacity by 4% to help meet the expected increase in demand from business and individual households. The facility was a combined cycle steam power plant connected to the national grid. The project created 3600 jobs during the construction phase and built technical capacity in the Egyptian Electricity Holding Company and the West Delta Electricity Production Company.
Box 2.2 Presidential Award for excellence — for connecting people and cities in the Democratic Republic of Congo
Roads can transform the economic opportunities for rural communities. In DRC, the Bank rehabilitated 310 km of national and feeder roaders, providing a wide range of benefits to the people of Kenge and Kikwit provinces. Travel times were reduced from 3 days to 4 hours and transport costs fell by 50%, promoting
trade and production. The output of corn increased threefold, and the production of cassava, squash and rice expanded by 48%, 35% and 15%, respectively. The increase in agricultural trade has boosted local incomes and provided food for other parts of the country, with sales in Kinshasa increasing by 85%. Food security has improved, and the cost of nutritious foods, such as fish and fresh fruits and vegetables, has come down. Increased traffic on the road has increased the range of goods available in local markets and allowed more movement of people, creating jobs in hotels, travel agencies, fuel stations and other services.
In DRC, our award-winning road project in Kenge and Kikwit reduced travel time from 3 days to 4 hours, increasing agricultural trade
Box 2.3 The Africa50 Fund: delivering vital infrastructure
It has been estimated that it will take more than $60 billion a year over the next 25 years to overcome Africa’s energy deficit. In 2012, in a Declaration on the Program for Infrastructure Development in Africa (PIDA), the African Heads of State called for innovative financial solutions to meet this gap. In response, the AfDB
created the Africa50 Fund to mobilise finance on a large scale and unlock international private finance to invest in African infrastructure.
Drawing on lessons from previous large investments, the Africa50 Fund’s remit is to ensure a dramatic increase in bankable projects. Currently, major investments take seven years from the initial project idea to financial closure. The Africa50 Fund’s ambition is to reduce this to three years by providing substantially increased funding up front for project development activities. The fund develops innovative partnerships with nontraditional funders, and it uses a wider range of financial instruments and risk mitigation measures.
By accelerating the speed of infrastructure delivery in Africa, the Africa50 Fund will create a new platform for Africa’s growth.

Annual D
eve
lopm
ent Effe
ctiveness R
evie
w 2
015
33
In addition to public sector project investment, we invest in sector-level support — as in Tanzania, Angola and Comoros — which is not only essential for the concerned utility but also contributes to the sound sector policies and legal frameworks that are key to attracting private sector finance.
Under our 2012 Energy Policy, we focused on helping African countries increase access to modern electricity, promote energy efficiency and use more renewable energy. This is reflected both in project work and support for crucial initiatives. For instance, we host the Sustainable Energy for All (SE4ALL) Africa Hub, which is supporting country-level work in the context of the United Nations-led SE4ALL Initiative in Africa.
The achievement of our energy goals is closely tied to innovation. As more investment around the world goes into supporting a transition to green growth, energy technologies are developing rapidly. Energy grids are increasingly supplemented by off-grid and micro-grid solutions to reach people in more remote areas. Smaller-scale technologies such as wind and solar power involve high start-up costs but are cost-effective over the longer term and environmentally friendly.
Overall, our energy policy plans that around half of the necessary expansion in energy generation in Africa could come from renewable technologies, especially hydropower. This is why our work to help governments with the transition to green growth has a major focus on developing hydropower and other innovative clean energy solutions.
For example, we helped develop the financing of sub-Saharan Africa’s largest single wind power project, in Lake Turkana, Kenya. Cofinanced with commercial banks and other development banks, this project will help to bring Kenya’s electricity generation capacity up to 5000 MW. Besides playing a central role in the financing of the independent power producer, we also provided a partial risk guarantee to help protect investors against the risk of governments’ failing to deliver the 428 km transmission line and the substations needed to connect the plant to the national grid.
Water and sanitation Access to clean water and improved sanitation facilities transforms the health of communities, especially when combined with public health education. Improved access to water also transforms the lives of rural women and children, who often spend many hours each day collecting water and whose welfare is most negatively affected by poor access.
We have financed investments in water and sanitation infrastructure across Africa, improving health, promoting socioeconomic development, and reducing waterborne and
hygiene-related diseases. The Bank’s current investments in water and sanitation across 37 countries amount to $3 billion. Our Rural Drinking Water Supply and Sanitation Initiative in Senegal, for example, made an important impact on the lives of rural communities. The participatory approach used in preparing the project helped to ensure its success (see Box 2.4).
In urban areas, we have constructed piped water systems, trained technicians, and built institutional capacity to manage water facilities, improve revenue collection, and contribute to enhanced utility performance. In Ethiopia, for example, our investment in piped water systems in the city of Harar, a World Heritage Site, and four nearby towns addressed the problem of inadequate supply and poor water quality, which had held back public health and economic development in that region. In Zambia, we delivered clean water and improved sanitation services to 300 000 people in eight urban centres by rehabilitating two water treatment plants, constructing five storage reservoirs, installing water kiosks in peri-urban areas to meet the needs of especially the urban poor and building the capacity of the water utility.
Overall, our projects created 58 940 m3 of drinking water capacity. We trained 5234 workers in maintenance of water facilities, and more than 4.2 million people benefitted from improved access to water and sanitation.
The Bank has played a leading role in Africa in promoting special initiatives on water and sanitation. We have succeeded in leveraging additional resources, promoting good practice and developing innovative solutions. To leverage resources and draw on strategic partnerships, we host the Rural Water Supply and Sanitation Initiative
Box 2.4 Improving socioeconomic conditions in rural Senegal
The AfDB helped reduce poverty and improve health in 240 rural localities in three regions in Senegal (Louga, Ziguinchor and Kolda) by providing access to cleaner water and better sanitation facilities. We designed the project in a participatory way, working with government ministries,
development partners and local communities. We helped to establish users’ associations to build community ownership, and cost recovery mechanisms to promote sustainability. Women played a key role throughout the project, including in social marketing and in hygiene and sanitation promotion.
This $44 million project provided 290 000 people with access to drinking water by rehabilitating boreholes and restoring damaged or obsolete water pumps. Some 160 000 people now have individual sanitation facilities, and 42 200 can access public toilet facilities. By collaborating closely with the UNDP’s Millennium Villages Project, the project achieved remarkable access rates.
We helped bring Kenya’s electricity generation capacity up to 5000 MW by financing sub-Saharan Africa’s largest single wind power project, in Lake Turkana

34
Level 2: How AfDB contributes to Africa’s development
(RWSSI), and the RWSSI-Trust Fund, through which development partners provide funding for clean water and better sanitation across the continent. The RWSSI-Trust Fund provides catalytic resources that enable the Bank and partners to strengthen country systems and processes, enhance sustainability frameworks, strengthen institutional capacities, build resilience to climate change impacts, and mainstream gender. We also manage the African Water Facility (AWF), an initiative of the African Ministers’ Council on Water, which attracts finance to the sector and promotes better governance of water resources. Since its inception, every Euro of AWF funding directed at the preparation of investment projects has mobilised 35 Euros for the implementation of follow-on projects.
Finally, we increasingly focus on the impact of climate change on water resources and the management of trans-boundary water resources, with the aim of becoming the leading centre of expertise and finance on water security in Africa.
Regional integration Promoting regional economic integration remains a key objective for the Bank, in line with the priorities of the African Union and New Partnership on Africa’s Development (NEPAD). We are Africa’s main financier of regional projects, and the majority of our regional lending is used to expand transport and energy infrastructure. We also provide assistance to “soft infrastructure” projects dealing with
regulatory issues and capacity building, and we support regional initiatives to promote the financial sector and private sector development.
Our new Strategy for Regional Integration (2014–23) aims to build larger markets, link landlocked countries to international markets and support intra-African trade. The Strategy has two mutually reinforcing pillars: the development of regional infrastructure and the enhancement of industrialisation and trade. To achieve these goals, we need to improve regional and country mechanisms and build institutional capacity. Our regional integration work is enhanced by mainstreaming into our regional programmes other priorities such as reducing conflict and fragility, supporting small and micro enterprises, and promoting the needs of women, youth and the environment.
Regional infrastructure is critical to enabling businesses to access new markets and achieve the lower costs of production and transport needed for competitiveness in regional and global markets. This in turn triggers the cycle of investment and innovation that leads to more rapid industrialisation, resulting in higher returns and more employment creation.
We have a strong record of developing regional transport links and institutional reforms such as one-stop border crossings, which reduce the time and cost of transporting goods across borders. The rehabilitation of the Conakry-Dakar corridor, with feeder roads to reach more remote areas, has produced some dramatic results: the travel time between Dakar and Conakry has fallen from 6 days in 2005 to 2.5 days in 2013. Box 2.5 explains how the Dori-Tera Road project in Burkina Faso and Niger has transformed the lives of many people living on or near the road. Overall, as a result of our projects, 680 km of cross-border roads were constructed or rehabilitated, in line with our target.
We have recently approved a number of new regional road projects with innovative design features. We are upgrading 276 km of road across three fragile states, Guinea, Côte d’Ivoire and Liberia. In response to the Ebola crisis, the project design was adapted to include health screening services at the one-stop border posts. In Cameroon, we are developing nearly 600 km of the major north-south trade route, as well as a network of feeder roads. We have built gender concerns into the project design to maximise benefits to both women and men. The project will also produce a methodological guide on gender mainstreaming in the road sector.
Whilst no cross-border power transmission lines were completed during this period, 1,837 km will be constructed or rehabilitated over the next two years through operations now under way. In particular, a major power transmission line will be constructed in Kenya and Tanzania, enabling trade in electricity across East Africa and leading to improved reliability and affordability of electricity service. The line will connect the regional power pools of Eastern and Southern Africa, opening up trade in energy across the continent and creating greater competitiveness, increased private sector investment in energy generation, and cheaper
More than 4 million people benefitted from new or improved access to water and sanitation through our support
Box 2.5 Diversification of sea access in West Africa
The Dori-Tera Road rehabilitation and transport facilitation programme on the Ouagadougou-Niamey corridor aimed at promoting trade in integration corridors in West Africa by reducing the costs of cross-border transport.
In addition to 91 km of road rehabilitated between Burkina Faso and Niger, the
project built one common border control post and related works. The programme increased the road traffic from 1% in 2006 to 47% in 2011 when the road was first opened to service; in addition, the number of road control points was reduced from 5 to 2.8 every 100 km, further reducing cost and travel time.
The improved conditions of transport to internal and external markets also facilitated increases in agricultural income; reduced the cost of health evacuation and increased awareness of the risks related to diseases such as HIV/AIDS, malaria and other waterborne diseases; and provided easier access to health centres and schools.

Annual D
eve
lopm
ent Effe
ctiveness R
evie
w 2
015
35
and more reliable energy for households and business. In addition, energy trade will enable Kenya to make use of greener energy.
Evaluations of three of our regional programmes in the eastern, western and southern regions generated lessons that were incorporated into our new Regional Strategy. A key message is the critical importance of soft infrastructure and capacity building. As a result, we are strengthening capacity in the NEPAD Planning and Coordination Agency and developing a suite of useful tools, such as sets of indicators for measuring progress on regional integration. In partnership with Canada, we have established an African Trade Fund to build capacity on trade. We also help the regional economic communities provide direct support to regional member countries to deliver the actions needed for regional integration—for example, by engaging with private sector associations and other regional bodies and using tools such as scorecards.
We aim to promote greater coherence between regional and national projects, fully reflecting regional projects in Country Strategy Papers and taking a more integrated approach to managing operations at national level. We also believe that closer collaboration with other African regional institutions, multilateral development banks and development partners will be very important for delivering regional integration.
Being innovative in promoting regional integration depends upon sound knowledge management. We need to be able draw on the lessons from our wide range of economic and sector analyses and from external research and development to identify innovative and cost-effective solutions. For example, we funded a review of options for integrating the electricity grids of the Economic Community of Central African States (ECCAS) and the design of feasible alternatives. Three of the five proposals identified are now in the pipeline for Bank funding.
Regional integration can play a key role in consolidating understanding and cooperation between countries. Some of our regional initiatives contain an explicit focus on promoting peace and security. One example is our support for the International Conference in the Great Lakes Region, a mechanism for regional peace, security, stability and development in the core countries of Africa’s Great Lakes region. Our support has also included organising round tables and hosting and managing the Special Fund for Reconstruction and Development.
Private sector development The Bank’s vision for development in Africa sees the private sector in the driving seat. Developing the private sector, from micro and small enterprises to large-scale businesses, is essential to achieving inclusive growth and reducing poverty across Africa. It is the private sector that will lead on the innovations required to transform African economies. Therefore, many of our projects contribute to creating and promoting a
sound climate for business and investment and equipping people with the skills to participate in the private sector. These interventions are intended to help Africa’s private sector to grow and flourish, providing an environment for greater risk-taking and innovation.
Our Private Sector Strategy (2013–17) focuses on improving Africa’s investment and business climate, expanding access to infrastructure and promoting enterprise development. Barriers to doing business range from difficulties in setting up and growing businesses to trying to operate within weak legal and regulatory frameworks. To create an enabling environment for business, we help African countries modernise their regulations and institutions and make their tax systems more efficient. In Mozambique, for example, we financed a one-stop shop to make it easier for new businesses to register. We also delivered a simplified electronic customs system at a one-stop border post on the South African border.
However, lack of access to finance remains a major constraint for private sector development. In sub-Saharan Africa, financial infrastructure and capital markets are still relatively undeveloped, and the lack of access to credit, especially long-term finance for micro, small and medium-sized enterprises, is a major barrier to progress. Moreover, uncertainties over property rights and a lack of collateral hinder access to finance, especially for women and young people.
In response, we have helped to promote the market in microfinance, combining it with training in entrepreneurial and business skills, to give poor people opportunities to increase their incomes. Over 2012–14, we granted 17 958 microcredits and trained 311 clients in business management. For example, we promoted financial inclusion in Guinea Conakry through a microfinance scheme that has facilitated the establishment of 400 community-based micro-businesses. In Mauritania, microfinance has been combined with training and capacity building for both microfinance institutions and the Central Bank, leading to a healthier and better managed microfinance sector that is contributing to enterprise development and increased rural incomes.
Overall, our support to enterprises has created more than 1.2 million jobs, of which 338 040 were for women. Our projects resulted in 2.9 million people benefiting from investee projects and microfinance, including 1.4 million women.
For more established businesses, through our private sector window we provide direct lending for projects that modernise production facilities or that promote diversification, the uptake of new technologies, and greater innovation — particularly projects that have the potential for wider development impact. A current example
We are financing a 500 km transmission line between Kenya and Tanzania, connecting the Eastern and Southern Africa regional power pools
The new Henri Konan Bédié bridge in Abidjan will reduce congestion and save 90 000 tons of CO2 emissions per year

36
Level 2: How AfDB contributes to Africa’s development
of direct lending is our construction of a 60-bed, state-of-the-art medical facility in Gambia, with outreach services and a training centre for local and regional health workers.
We also leverage private investment funds through public-private partnerships, usually for the purpose of financing infrastructure. Our finance reduces risks to other investors and so attracts private sector investment. We have just completed a major bridge financed by a public-private partnership in the economic capital of Côte d’Ivoire,
Abidjan; the bridge has made an important contribution to easing the costs of doing business in a rapidly growing megacity (see Box 2.6).
Skills and technology The AfDB invests considerably in skills and technology, which we see as fundamental to creating dynamic and innovative economies. In addition, we promote the use of emerging technologies to deliver services and improve governance. We help farmers improve their production or move into agribusiness, and we help entrepreneurs establish and expand their businesses, using technology to increase their competitiveness and link to global value chains. By supporting improvements in education and vocational skills training, we are accelerating our efforts to build the technical and vocational skills of young Africans, so as to equip them for gainful employment or successful entrepreneurship. Developing the potential of young Africans is critical to Africa’s transformation. It is also a challenge of increasing urgency, as youth unemployment is one of Africa’s most pressing social issues.
Over the past two years, our projects resulted in 5435 people benefiting from vocational training, which was 60% of our target. Through our work in education, science and technology, we constructed 1478 classrooms and educational support facilities, and we recruited or trained 33 747 teachers and other educational staff. Overall, more than 2.1 million people — of whom 1 million were female — benefited from better access to education. For example, our support to secondary education in Malawi provided 400 qualified mathematics and science teachers for the country. The project also created new classrooms for 18 schools, enabling old structures to be converted into dormitories for girls to improve their safety at school.
In the future, we plan to give even greater emphasis to vocational training, building on the increased access to basic education across Africa in recent years. Our Human Capital Strategy 2014–18 sets out our plans in this area — projects that will achieve a tenfold increase in the numbers of people benefitting from vocational training. We already have new projects in Congo, Mauritania, Morocco, Rwanda, Tanzania and Zimbabwe, to help them transform their systems of vocational training. We are giving particular attention to ensuring that girls and women can receive technology and vocational skills training. The strategy also emphasises the need to develop regional knowledge networks on science and technology, as we are doing with our support to biomedical sciences in East Africa (see box 2.7).
We have been using our convening power to highlight the importance of scientific and technological innovation in Africa. In October 2014, the Ministerial Forum on Science, Technology
Box 2.6 Promoting urban mobility in Côte d’Ivoire
Africa’s infrastructure challenge now increasingly has an urban face. Abidjan is one of Africa’s fastest growing cities, and its 2014 population of 4.7 million exerts considerable strain on the city infrastructure. To reduce congestion and travel time between residential and central parts of the city, the Bank
invested in a major urban bridge project, the Henri Konan Bédié Bridge. A worker in the city centre is now able to avoid 10 km and 30 minutes of commuting time on each journey to work, with flow-on effects for the cost of doing business in this rapidly developing city. Thanks to the reduced commuting times, Abidjan is now avoiding 90 000 tonnes of carbon dioxide emissions per year. As the city becomes better connected through a series of new road corridors now being planned, the economic returns from this investment will continue to grow.
The project was accomplished through a very successful public-private partnership, illustrating the Bank’s growing experience with this innovative financial mechanism. It seemed highly symbolic that opening of the state-of-the-art bridge coincided with the Bank’s return to its headquarters in Abidjan. In Malawi, our investment in
secondary science education provided 400 qualified mathematics and science teachers for the countryBox 2.7 Supporting biomedical sciences in East Africa
The AfDB’s Human Capital Strategy 2014-18 highlights the need to scale up skills training and develop regional knowledge networks on science and technology. In view of the critical shortage of skills in biomedical science, which is constraining health service development across East Africa, the Bank is setting up a network
of centres of excellence in biomedical science and engineering.
Each of the four centres will specialise in a different area: nephrology and urology in Kenya, oncology in Uganda, cardiovascular issues in Tanzania and biomedical engineering and e-health in Rwanda. The centres will provide high-quality training to biomedical specialists and medical graduates, and will collaborate with world-class institutions in curriculum development, faculty exchange and mentoring, access to resource materials and joint research.

Annual D
eve
lopm
ent Effe
ctiveness R
evie
w 2
015
37
and Innovation took place in Morocco, bringing together African Ministers in charge of higher education, science and technology with industry leaders, academia, diaspora, civil society and global scientific communities. The Forum recognised that greater use of technology and innovation is required throughout the value chain, if African goods are to become competitive in local and global markets. The training young people receive will determine their ability to participate in, and exploit, new economic opportunities.
The use of mobile and other technologies to improve the delivery of social services is still fairly new, but we are increasingly incorporating it into our sector programmes to increase results. For example, in our public health systems project, we helped Ebola-affected countries introduce an emergency alert and first response system. The use of mobile technology facilitated the coordination of health and other professionals within the crisis response. We are also actively generating new knowledge and ideas on the use of new technologies, such as a study in Ethiopia on innovation in the delivery of basic services. During the last two years, 602 780 people benefited from improving access to basic ICT services. Looking ahead, we expect that our projects will result in 4.6 million more people gaining access in 2015–17.
Governance and accountability It is widely recognised that good governance is needed to deliver the economic and social transformation that will promote inclusive growth. We have developed a new Governance Strategic Framework and Action Plan 2014–18 to guide the implementation of our governance and accountability work.
Overall, progress on governance in Africa is mixed. The Mo Ibrahim index for Africa for 2014 showed gradual improvements in governance over the past five years, while highlighting some significant deficits. Several African countries have seen improvements in areas such as participation, human rights and human development, but there has been much less progress on public safety, rule of law and sustainable economic opportunity.
One of the Bank’s key objectives through its governance work is to strengthen governments’ capacity for transparent and accountable use of public resources and citizens’ ability to hold governments to account. For example, through our assistance to budgeting and financial management, we help governments raise revenues and target their spending to national development priorities. We also provide support to strengthen formal accountability functions, helping to ensure that resources are matched to development plans and reducing the potential for rent-seeking and corruption.
In the Union of the Comoros, for example, our support for energy sector reform included improving financial and procurement management and enhancing the work of anticorruption agencies. In Sierra Leone we are working to consolidate public financial management reforms to improve public resources management, including the governance of the extractive and energy sectors.
An important part of improving economic governance is finding ways to enable civil society and citizens to hold government to account. E-governance is opening up innovative new ways to strengthen accountability. For example, following the Jasmine Revolution in Tunisia, transparency of government emerged as a key concern of the public. We therefore helped the Ministry of Finance to publish all budget information online. We also supported greater efficiency and transparency in public procurement through publishing documents and improving and standardising systems.
Our multidonor Governance Trust Fund (GTF) provides flexible funding to support innovative ideas in the field of economic and financial governance. Amongst other things, it finances activities to help African countries become more transparent and accountable in their use of public resources, with a particular emphasis on direct accountability to citizens or civil society. The recent evaluation of the GTF recommended that these “demand-side” activities should be scaled up to allow civil society and parliaments to benefit directly from the Fund (see Box 2.8). The GTF also finances measures to improve our internal capacity to deliver our governance objectives.
Strengthening sector governance is an important part of our governance work. Given the growing importance of revenue from extractive industries across Africa, robust governance of the natural resource sector has emerged as a key priority. We are providing a range of direct assistance in this area to Guinea, Mozambique, Sierra Leone and Togo. For example, in Sierra Leone we promoted the legislation underlying the Extractive Industries Transparency Initiative and published all agreements with mining companies, whilst also providing broader economic and financial management support.
We assess our overall progress in promoting better governance and accountability by drawing on our Country Policy and Institutional Assessment score for each country. By comparing these scores before and after our projects, we can learn whether we are having a positive influence. Over the recent period, we have achieved our
Box 2.8 Governance Trust Fund
The Bank established the Governance Trust Fund (GTF) in 2010 to promote innovative approaches to governance challenges, particularly in the area of government accountability to citizens. The GTF has helped the Malawi Economic Justice Network improve public awareness of the public procurement
process, to reduce corruption and waste of public resources. In Liberia, the GTF is enhancing young women’s oversight of community development funds, so they can monitor and contribute to the use of public resources at the local level. In Togo, to improve revenue management and collection, the GTF financed a study to establish a single autonomous revenue collection agency. Norway, Sweden and Switzerland are contributors to the GTF.

38
Level 2: How AfDB contributes to Africa’s development
strongest results in the areas of quality of public administration and improving procurement systems. We have had creditable results
on budgeting and financial management and public sector transparency, accountability and corruption mitigation. We have been less successful in helping countries improve their competitive environment.
Agriculture and food security The Bank has funded a range of projects in the agriculture sector to raise production, encourage trade and improve livelihoods. Our goal has been to increase agricultural productivity and food security to help people lift themselves out of poverty, whilst conserving the natural resource base and improving sustainable agriculture.
Innovations in technology and business models are beginning to make their mark on the productivity of African agriculture. Our assistance is helping to increase cattle production by eradicating tsetse fly in certain areas, leading to increases in meat and milk output. Our award-winning multinational project New Rice for Africa3 has increased domestic production and food security in seven West African countries, with rice grain yield increasing from 1 ton/hectare to 2.5–3 tons/hectares. In Mozambique, we increased fish production by supporting artisanal fishers with credit and community infrastructure. Fishermen’s incomes more than doubled between 2001 and 2012.
Overall, our projects have delivered 53 004 hectares of land with improved water management, which was 69% of our target, and
441 270 hectares of land whose use has been improved through replanting or reforestation, which was 98% of our target. We have helped 2.3 million of the rural population use improved technology, which was 194% of our target. Overall, we met our targets, with 9.6 million people benefitting from improvements in agriculture, of whom 4.1 million were women.
Our upcoming Agriculture and Agribusiness Strategy (2015-19) sets out our goals of improving skills, financial services, infrastructure, and building resilience and sustainable management of natural resources, so as to turn African agriculture and related agro-processing into an attractive livelihood prospect. Our support for agricultural production will seek to link farmers to agribusinesses, creating more sophisticated value chains that can increase rural incomes. We will continue to finance rural roads, electrification and market infrastructure, and better irrigation and water-management systems. For example, in Uganda our markets and agriculture project has improved rural and market infrastructure and resulted in major increases in rural-urban and cross-border trade in crops, fish and other agricultural products. In Ghana, farmers have benefitted from using new knowledge and technology in horticulture (See Box 2.9)
Africa needs continued innovations in technology and farming methods to deal with the threats of disease, pests and drought, as well as to boost the nutritional content of staple crops. Our strategy has a strong focus on encouraging innovation and the use of technology to produce higher-value products and bring more commercialisation to the sector. We promote agriculture commodity exchange markets as well as the development of low-cost technologies for primary processing. We are supporting African countries in developing coherent agricultural policies to attract more investment into the sector and accelerate skills and technological development. We will focus particularly on helping young people and women in rural areas to become more entrepreneurial and increase their incomes.
To address the challenges of climate change, we will continue to pay close attention to promoting resilience, including better management of natural resources. For example, we are supporting seven West African states in addressing the rise of chronic food insecurity and vulnerability to climate change through such measures as irrigation schemes, pastoral facilities, storage and marketing infrastructure, and development of fisheries and aquaculture with support for processing and marketing. Besides increasing resilience to climate change, this approach should improve nutrition and provide young people with employment.
Our support for improved management of the water resources of the Lake Chad Basin will serve vulnerable communities in
3 New Rice for Africa project received US Treasury Development Impact Honors in 2014.
Our award-winning project New Rice for Africa has increased rice grain yield from 1 to 3 tons per hectare
Box 2.9 Horticulture exports from Ghana
Farmers in Ghana have benefitted from using new knowledge and technology in an AfDB horticultural project whose implementation began in 2005. The project was highly innovative, working with private producers and processors to develop handling, transport and
storage facilities for perishable produce such as mangos, papaya, eggplant and bird’s eye chili. The project developed a laboratory to analyse pesticide residue. At the end of the project the laboratory was handed over to the Ghana Standards Authority, which will use it to test crops destined for European and world markets. The project had a dramatic impact on the incomes of producers, which increased six- or sevenfold for some products.
In Tunisia, we helped publish all budget information online, strengthening accountability and transparency

Annual D
eve
lopm
ent Effe
ctiveness R
evie
w 2
015
39
Cameroon, Central African Republic, Chad, Niger and Nigeria that depend on the Basin’s natural resources for their livelihoods. This is an example of integrated natural resource management in a fragile environment, which requires a multidisciplinary approach. It will improve livelihoods while at the same time reducing the risk of conflict.
Promoting gender equality in Africa Our Gender Strategy (2014–18) reaffirms our commitment to promoting gender equality, both within the Bank as an organisation and through all our country and regional programmes. Gender equality is not only an important development goal in itself, but also a precondition for achieving other development outcomes. Our Bank Strategy expresses our conviction that achieving sustainable development and poverty reduction across Africa requires strengthening women’s legal and property rights and promoting women’s economic empowerment. We also need to promote women’s voice and participation at all levels and to be clear in our dialogue with African countries that gender equality is not only a basic human right, but makes economic sense.
The Bank advocated for women’s economic empowerment by financing the third Africa Women’s Economic Summit, held in 2014 in Zambia. This meeting focused on how economic policies, financial systems, affordable finance and business services can support women entrepreneurs. Following the summit, a number of private institutions — including the Stanbic Bank in Zambia and the National Bank of Rwanda — pledged to increase women’s access to finance.
This year we are developing three flagship initiatives: (i) a fund to support small and medium-sized enterprises with high growth potential that are led and managed by women; (ii) an Ebola Social Investment Fund to help women who have suffered serious socioeconomic impacts as a result of the epidemic; and (iii) an interactive platform to link millions of women entrepreneurs, further catalysing financial inclusion and deepening the ecosystem. We will also explore global and regional value chains to leverage women’s potential in agricultural trade.
Other examples of our work on gender equality include a project in Rwanda to promote education and skills development through technical and vocational training, which targets women and girls as both participants and beneficiaries. Over one-third of the micro, small and medium-sized enterprises that received finance from the project’s quasi-equity fund were owned by women.
In Nigeria, we provided agro-processing facilities to women’s groups to create small-scale value chains and raise incomes. Various women and youth groups were also trained in local productive activities. Our rural water and sanitation project in Ghana involved women as the planners and managers of community water schemes. The availability of water led to new business opportunities, with water sold frozen in small plastic bags to compete with bottled water from industrial producers.
Our gender work cuts across our sectoral operations, and we now incorporate gender performance indicators in all our projects. We have invested in programmes that provide life-changing opportunities for girls and women, including access to water and sanitation, improved food security, and access to better health and education services. However, we still need to promote innovative solutions to enable women to be more active in business and more engaged in the economic, social and institutional areas of public life.
We will also launch the first Africa Gender Equality Index, which will provide hard data on gender disparities across 52 African countries, to focus policymakers’ attention on the importance of gender equality to Africa’s development. In addition, we are increasingly exploring how our portfolio can address peace and security issues, including violence against women.
Addressing fragility and building resilience The AfDB now has a new strategy and operational guidelines for working in fragile situations. It is grounded in our Ten Year Strategy and the principles of the multilateral “New Deal for Engagement in Fragile States”. It is informed by our own experience of engaging in fragile situations and the work of the High Level Panel on Fragile States, led by the President of Liberia, Ellen Johnson Sirleaf, to advise the Bank and the international community on how to address fragility and build resilience in Africa.
More than 250 million Africans live in countries where conflict and fragility reduce the prospects for development. We define fragility as a “condition of elevated risk of institutional breakdown, societal collapse or violent conflict”. Recognising that no country is immune to fragility, our strategy focuses on fragile situations, rather than on a list of “fragile states”. To deepen our understanding of the drivers of fragility and the sources of resilience, we apply to our engagement in all countries a fragility lens that is based on analytical work at country and regional levels.
A key principle underlying our work is the importance of staying engaged. Even in deteriorating situations, as an African institution committed to the development of the continent, we cannot afford to withdraw but instead need to adapt our operations and financial instruments so that we can effectively engage in these complex and dynamic environments.
This is not “business as usual”, and we are using all available instruments and resources to enhance our effectiveness. The Transition Support Facility (formerly Fragile States Facility) continues to play a vital role in this context, providing additional resources and a flexible instrument with which to engage in fragile situations.
We are launching the first Africa Gender Equality Index, which will provide data on gender disparities across 52 African countries

40
Level 2: How AfDB contributes to Africa’s development
Our One Bank approach involves deploying our financial and other resources in a coherent way, taking on the role of a trusted broker where appropriate. This was evident in an early visit by AfDB President Kaberuka to the countries affected by Ebola, as well as in high-level discussions with Burkina Faso and the Central African Republic. We also maintained support to South Sudan, despite persistent security challenges.
In 2014, the Ebola epidemic brought home Africa’s continuing fragility in the face of shocks, as health systems in the affected countries were soon overwhelmed. The AfDB quickly mobilised support for the affected countries, promoting, among other things, regional solutions through the deployment of African medical doctors to affected countries (see Box 2.10). In Zimbabwe, we have been exploring debt policy options with a view to normalising countries’ relations with the international financial institutions and helping them regain access to support. We have also provided funding for infrastructure through the Zimbabwe Trust Fund.
Conclusion and outlookThis has been a very positive year for the Bank. Many of our projects have performed well, achieving their objectives and delivering development benefits to people across Africa. We have achieved or surpassed the majority of our targets, and we have led and supported a number of important continent-wide initiatives.
With our Bank Strategy 2013–22, we now have a clear sense of direction for the Bank for the next decade, which is fully embedded throughout our operations. We have prepared a series of sector strategies that elaborate on our commitment to promote inclusive and green growth. As older projects are completed and new ones are approved, the focus of our portfolio will shift toward greater alignment with the Bank Strategy 2013–22.
We recognise that Africa’s ambitious development goals call for a profound transformation of African economies and societies. The coming years must bring accelerated innovation across the continent, as Africa picks up new ideas from around the world and adapts them to African conditions. We are helping both the public and private sectors to embrace new technologies and ways of working, to improve their effectiveness. We are accelerating our work to help Africans, especially young people and women, gain vocational and technical skills, so that they are equipped to use modern technologies, start enterprises and find creative solutions to tomorrow’s development challenges.
Through our investments in transport, power and water infrastructure, we have provided tangible results, putting in place many of the conditions for economic transformation. We will take a multi-sector approach to address skills needs in our infrastructure projects. We have helped large numbers of people through improved health and education services. Our projects have promoted a better business climate and increased access to finance, alongside improvements to economic governance — all preconditions for an acceleration in development results. We have supported agriculture projects and agribusiness to improve rural livelihoods and promote food security. In addition, our support to fragile contexts is becoming more effective, as we learn better ways to build resilience and sustainability — as demonstrated by our quick and targeted response to the Ebola epidemic.
In the next two sections of this Development Effectiveness Review, we assess our progress in strengthening the management of our portfolio and in building our own organisational capacity to deliver better development results.
Box 2.10 A rapid response to the Ebola epidemic in Guinea, Liberia and Sierra Leone
The Bank responded quickly to the Ebola crisis, approving $60 million in urgent funding to help local health systems respond to the crisis. President Kaberuka visited the region, and the Board was convened to consider and approve the assistance. The emergency funding helped break the transmission chain and
support the three countries’ response programmes.
The AfDB then approved a three-year, $150 million project to address some of deficits in national health systems exposed by the crisis. The project will support recruiting, training and equipping professionals; strengthening emergency alert and response systems, including e-health and mobile networks; and improving governance, including government communications with civil society. It will help the region to be more resilient in the face of any future health crisis.
We supported national health systems in Guinea, Liberia and Sierra Leone following the Ebola crisis, investing $210 million in recruiting and training health professionals

Annual D
eve
lopm
ent Effe
ctiveness R
evie
w 2
015
41

42
The African Development Bank invested $32 billion across the continent
Total AfDB funding by countryUS dollars, million
Less than 2525 to 99100 to 199200 to 299300 to 1000More than 1000
Project locations 2002–2013
Enhancing transparency
The Bank is committed to increasing transparency and demonstrating results. It has developed a new geocoding tool, MapAfrica — an interactive, online platform that maps the locations of the Bank’s investments in Africa. Explore our 6000 project locations by visiting mapafrica.afdb.org.

Annual D
eve
lopm
ent Effe
ctiveness R
evie
w 2
015
43
Box 3.1 The new credit policy: extending the Bank’s non-concessionary window to low-income countries
The Bank has developed a new policy to enable low-income countries to access loans from its non-concessionary sovereign window. This new policy responds to low-income countries’ increased demand for credit, arising from the successful economic growth and development across much of Africa over the last decade. Already, many African countries are borrowing on capital markets at rates much higher than those they could obtain from the Bank. This new policy will give the Bank greater scope to help accelerate the structural transformation of low-income countries through strategic investments.
At the African Development Bank, we continually strive to improve our performance in strategy and project management. In recent years we have introduced many new measures to help us achieve higher-quality results. This section assesses how well we are managing our portfolio of projects, using 22 indicators from Level 3 of our One Bank Results Measurement Framework. We review the design and
supervision of our projects, to ensure that we are making the best use of our resources to promote inclusive and green growth. We look at whether our portfolio is optimised to deliver results efficiently and effectively, and at whether we are learning lessons from past projects to improve our performance. We assess progress on our cross-cutting agendas of gender equality and addressing fragility and climate change.
The return to the Bank headquarters, tight budgets and the Ebola epidemic in Guinea, Liberia and Sierra Leone has affected many of our operations, postponing supervision missions and delaying consultation on Country Strategy Papers. Nonetheless, we have achieved many of our targets for portfolio management and we have also set ourselves some ambitious goals for the coming years.
Introduction2014 proved to be a challenging year for several of our regional member countries. The Ebola crisis caused widespread disruption in Guinea, Liberia and Sierra Leone, and some of our partners faced difficult social and political conditions. Despite these challenges, the strength of our portfolio has continued to grow. We responded swiftly to the Ebola crisis and found ways to reschedule our missions and adjust our plans as needed.
A major event for the Bank in 2014 was our return to our permanent headquarters in Abidjan, Côte d’Ivoire. This was an immense logistical challenge, absorbing a great deal of management attention and staff time. It has now been largely completed.
The Bank is continuously reflecting on ways to improve the quality of its operations and better serve its client countries, making full use of innovative financial instruments and new ways to respond to country needs. One example is the recent adoption of a new credit policy (see Box 3.1).
Strengthening results at country level
Country strategiesOur Country Strategy Papers (CSPs) are the foundation of our support to our regional member countries and a key tool for maximising the effectiveness of our operations. They identify how
the Bank can best respond to each country’s specific needs, and they help to knit our operations in each country into a coherent whole, for greatest development impact. We take a selective approach, focusing on a limited number of themes and sectors that reflect the Bank’s comparative advantage, so that our support is not spread too thin. We also prepare Regional Strategies that define our approach to supporting regional integration and major cross-border investments.
In recent years, we have developed new guidance and formats for our country and regional strategies. We also use a quality-at-entry
Level 3: How well AfDB manages its operations

44
Level 3: How well AfDB manages its operations
Table 3: How well AfDB manages its operations (Level 3)
This table presents the Bank’s progress in achieving its 2014 targets for portfolio management.
We have achieved or are within 90% of achieving the target We are regressing against the baseline or are within 80% of achieving the target
We are not moving towards the target Data points are missing
AfDB ADF
INDICATOR Baseline 2012
Latest 2014
Target 2014
Baseline 2012
Latest 2014
STRENGTHENING RESULTS AT COUNTRY LEVEL
Average CSP rating (1-6) 4.7 5 4.9 4.7 5
Timely CPPR coverage (%) 25 56 26 19 60
Development resources recorded on budget (%) 67 68 74 67 51
Predictable disbursements (%) 72 75 76 72 72
Use of country systems (%) 58 69 60 58 65
New ESW and related papers (number) 27 32 27 .. 18
DELIVERING EFFECTIVE AND TIMELY OPERATIONS
Preparing high-quality operations
Time to first disbursement (months) 13 10.6 11 11 10
New operations rated satisfactory (%) 96 100 more than 95 95 100
Time for approving operations (months) 7 6.5 6 6 6.3
Ensuring strong portfolio performance
Disbursement ratio of ongoing portfolio (%) 22 19 22 22 18
Time for procurement of goods and works (months) 8 9 8 8 9
Operations with satisfactory mitigation measures (%) 60 72 68 68 80
Operations no longer at risk (%) 28 59 30 30 57
Operations at risk (%) 19 11 17 21 12.5
Operations eligible for cancellation (%) 9 13 7 7 12.4
Learning from our operations
Completed operations rated satisfactory (%) 75 94 77 77 94
Completed operations with sustainable outcomes (%) 81 82 85 85 77
Completed operations with a timely PCR (%) 91 66 95 95 69
DESIGNING GENDER- AND CLIMATE-INFORMED OPERATIONS
New CSPs with gender-informed design (%) 75 89 85 85 100
Projects with satisfactory gender-equality outcomes (%) 67 78 71 71 71
New projects with gender-informed design1 (%) 78 89 83 83 91
New projects with climate-informed design (%) 65 75 90 90 80
.. = Data not available; AfDB = African Development Bank; ADF = African Development Fund; CSP = Country Strategy Paper; CPPR = Country Portfolio Performance Review; ESW = economic and sector work; PCR = Project Completion Report.1 This indicator builds on five dimensions: sector-specific gender analysis, a gender-equality-related outcomes statement, a gender-equality-related baseline, specific activities to
address gender gaps, and adequate budgets and human resources to implement the activities.
Source: African Development Bank
1 A green bullet indicates that we have achieved or are within 90% of achieving the target.
tool to check that our strategies are of appropriate quality. These measures have helped to drive improvements in quality, against some demanding targets. In 2014, readiness reviews rated our
Country Strategy Papers1 5 on a scale of 1–6, which was above our target and reflects steady improvement since 2012.
One important change to the preparation of new CSPs and Regional Integration Strategy papers is that they will be informed by dedicated fragility assessments. This helps us better understand the volatile and dynamic context in which we engage, the political economy and underlying risks to our engagement.

Annual D
eve
lopm
ent Effe
ctiveness R
evie
w 2
015
45
This is an important step to enhance our effectiveness and ensure that we address fragility and build resilience (see Box 3.2). We are also piloting this approach of applying a “fragility lens” in our operations.
Country Portfolio Performance ReviewsCountry Portfolio Performance Reviews (CPPRs) are holistic assessments of the Bank’s operations in a particular country. They play a key role in improving our development effectiveness. CPPRs are conducted in a participatory manner, drawing together findings from stakeholder consultations, desk reviews, visits to project sites and discussions with executing agencies. They encompass public and private sector projects, regional operations and economic and sector work, identifying patterns of performance across the portfolio and opportunities for us to strengthen our assistance.
During 2014, we delivered 56% CPPR coverage, more than double our target. This effort has enriched our understanding of our portfolio and generated many useful lessons on how to raise quality. We have now decided to combine our CPPRs with our CSP midterm and completion reports, to ensure that portfolio performance is closely linked to strategy and project planning. This change also reduces transaction costs and achieves greater efficiency.
Aid effectivenessAs part of our commitment to the principles and practices of aid effectiveness set out in the 2005 Paris Declaration, the Bank is an active participant in the Global Partnership for Effective Development Cooperation established at the Busan High-Level Forum in 2011. As such, we work closely with governments and other development agencies to make development assistance more effective in achieving its goals. At the country level, the Bank is a trusted and active development partner. We belong to some 250 sector or thematic groups across Africa, an average of 5 per country. In 2014, we chaired 74 of these groups.
We monitor our own performance on aid effectiveness against three indicators. This year our use of country systems, including public financial management and procurement systems, is well above our target, at 69% of total disbursements. Channelling our funds through a government’s own systems is more efficient, in terms of transaction costs, and puts us in a better position to help strengthen those systems, so that they become more robust.
We achieved 75% predictable disbursements, which was close to our target of 76%. The more predictable our disbursements, the easier it is for governments to integrate our financial assistance into their annual budgets, making overall resource allocation more efficient. As the level of budget support provided to our regional member countries increased from 2013, our third indicator improved, with 68% of our
development resources recorded on budget, compared to 64% in 2013.
New economic and sector workIn addition to providing development finance, the Bank strives to be a source of knowledge and expertise on Africa’s development challenges. We therefore invest considerable effort each year in research and analysis that helps build our knowledge base. This year we produced 32 new economic and sector work and related papers, exceeding our target of 27. Covering a wide range of countries, sectors and issues, our knowledge generation effort is a direct contribution to development
Figure 3.1 Strengthening results at country level
Average CSP rating (1-6)
Timely CPPR coverage (%)
Development resources recorded on budget (%)
Predictable disbursements (%)
Use of country systems (%)
New ESW and related papers (number)
5
28
79
78
4.7
25
72
69
25
58
2732
61
67 68
56
5
2012 2013 2014 2015
Target Actual
75
Box 3.2 Applying a fragility lens to our country and regional strategies
The AfDB now has a new strategy, "Addressing Fragility and Building Resilience in Africa 2014–2019", for working in fragile situations.
To begin carrying out this strategy, the Bank is conducting regional and country-level fragility assessments to inform the preparation of all new strategies. Deepening our understanding of the issues of fragility and the role of the various stakeholders is a pre-condition for effective engagement in these dynamic and volatile environments, allowing for effective risk mitigation approaches. Taking a nuanced approach, we both analyse the drivers of fragility and identify opportunities for the Bank to build resilience.
For example, in Guinea Bissau, the fragility assessment clearly highlighted the need to support reforms in the security and justice sector and to invest in infrastructure to open up isolated areas of the country. This is in line with and part of our support to the New Deal for Engagement in Fragile States. In view of the fact that fragility does not respect national boundaries, we are now commissioning regional fragility assessments in the Sahel, the Horn of Africa and the Great Lakes region. As new strategies will become increasingly “fragility-sensitive”, we will ensure that our operations are also informed by these fragility assessments and are able to adjust and adapt if and when the situation changes.

46
Level 3: How well AfDB manages its operations
policy across Africa and informs our policy dialogue with governments, civil society organisations and other development partners.
A number of our more recent knowledge products have focused on competitiveness, including the areas of innovation, productivity, industrial policy and regional development. A key finding from our analytical work on East Africa is that inclusive growth can be promoted through special economic zones or industrial parks that are well serviced with infrastructure and offer a good environment for business activity. This finding has formed the basis for useful discussion with governments on their industrial policy.
Capacity building on results managementAs governments and institutions across Africa improve their ability to manage for results, they also build their capacity to promote development. Africa for Results (AfriK4R), which we launched in 2012, holds workshops and events to strengthen African countries’ capacity to deliver results. In 2014 AfriK4R partners in 17 countries, working in conjunction with two regional economic communities and our country offices, held 20 country and 6 regional capacity-building events, including cabinet-level retreats, assessment report validation workshops and events on rapid results initiatives. Helping to build capacity among our counterparts in turn strengthens the delivery of our own operations. For example, AfriK4R helped Zimbabwe develop its national monitoring and evaluation system, which now supports AfDB projects.
Delivering effective and timely operationsThe Bank’s core business is delivering strategic investments in national development. We aim for the highest quality in project design and supervision, and we continually work to improve our portfolio performance so that projects deliver the maximum impact.
Overall in 2014, we were able to maintain good levels of project performance. However, there were some challenges associated with moving our headquarters from Tunis back to our permanent location in Abidjan. At the same time, some of our regional member countries faced serious difficulties, including the Ebola
epidemic. These factors contributed to our inability to meet some of our demanding institutional targets, as this section shows. In response, a cross-Bank task force has been formed to examine systemic portfolio issues and submit practical recommendations.
Preparing high-quality operationsOur main tool for checking that projects are technically sound and designed to deliver the maximum benefit is quality-at-entry reviews. Errors in project design are often difficult and costly to correct once a project is under way, so we use a readiness review tool up front to check for compliance with our demanding quality standards and criteria. For our private sector operations we use a similar tool to assess additionality and development outcomes.
In 2014, we continued to make good progress in improving the quality of our operations. All of our new projects were rated satisfactory, surpassing our target of 95%. This indicator is calculated as the share of all operations reviewed that are rated satisfactory or above in the readiness review process. Furthermore, the time for approving operations, from concept note to Board approval, decreased from 7 months in 2012 to 6.5 months, which was close to our target of 6 months.
We succeeded in reducing the time to first disbursement from 13 months in 2012 to 10.6 months in 2014, which was better than our target of 11 months. While some delays are outside our control, careful design and close liaison with governments can minimise the time required to ratify projects, meet project conditions and undertake procurement.
To streamline the management of the portfolio and enhance our performance, we continue to improve our design and supervision processes. We have increased efficiency by delegating responsibility for operations under US$30 million to our country offices for procurement decisions. We also fine-tuned our quality-at-entry standards, to ensure consistency with the Bank Strategy and other policies and business processes. In addition, we introduced a quality assurance dashboard that enables management to monitor the progress of our various quality assurance tools — the readiness review, Progress and Results Reports and Project Completion Reports — over the life of the project.
Ensuring strong portfolio performance Supervision of our projects is essential to their success: if projects are well supervised, problems can be noted early and action taken to resolve them. We continually seek to improve our processes for supervising our operations to meet more ambitious targets. Increased staffing in our country offices is creating opportunities for
Figure 3.2 Preparing high-quality operations
Time to first disbursement(months)
New operations rated satisfactory(%)
Time for approving operations(months)
≥95
2012 2013 2014 2015
96
100
Target Actual
11
6
7
13
6.5
10.6
It took us 3 months — less than in 2012 — to disburse the first time on our investments

Annual D
eve
lopm
ent Effe
ctiveness R
evie
w 2
015
47
closer collaboration with executing agencies and local project teams, promoting smooth and timely implementation.
We have made good progress in reducing the share of our operations at risk, from 19% to 11% of the total portfolio,
exceeding our target of 17%. Our operations no longer at risk, as a proportion of the total projects at risk at the start of the year, have increased to 59% from just 28% in 2012 — well above our target of 30%. This shows our success in taking corrective measures. However, the share of
operations eligible for cancellation2 has increased to 13%, almost twice the 7% target. Projects become eligible for cancellation because of delays in start-up and challenges in implementation. This indicator does have a strong seasonal component: it tends to increase significantly at the end of the budget year. By the first quarter of 2015, the overall number of operations eligible for cancellation went down again to 2013 levels. We are taking strong proactive measures to clean up the portfolio by cancelling or restructuring inactive projects or balances and redirecting them to other priority areas.
We aim to ensure that our resources are disbursed according to schedule, so that project benefits can be delivered as planned. However, our performance in this area slipped in 2014. The
disbursement ratio of the ongoing portfolio3 fell to 19% from 22%, showing that projects are taking longer to be completed. In addition, the average time for procurement of goods and works, which measures the period between receiving procurement notices to signing contracts, was 9 months, against a target of 8. One important reason is insufficient project readiness: bidding documents not ready in time and delays in setting up project implementation units. In our decentralised environment, to make sure that risks are adequately managed, we are taking more lead time for international bidding in countries that are facing particular capacity and governance challenges and where the level of the fiduciary risk is high. However, in countries with greater capacity, we are devolving more procurement processes and decisions for low-risk contracts. We are also updating and modernising our procurement policy and practices (see Box 3.3), including delegation of authority. The proposed changes will bring about increased efficiency and effectiveness in the use of our resources.
We have developed guidelines to help our clients use our integrated safeguard system when they prepare projects for us to finance. We have also developed an online tracking system so that clients and beneficiaries have access to safeguard documentation. We have revised our Environmental and Social Procedures to reflect the most recent evidence and knowledge in this field. The revised procedures provide detailed operational guidance for each stage of the project cycle, for both our own staff and our partners to use, which strengthens local environmental, social and climate
management capacity. Over this period, 72% of our operations had satisfactory mitigation measures, above our target of 68%.
Learning from our operationsWe give high priority to capturing lessons from our operations, so that we can achieve greater impact from future investments. Development assistance is complex and dynamic, and we are continually learning to improve our organisational processes and achieve better development results. Effective knowledge sharing amongst our staff ensures better project design and improved supervision. Our Evaluation Results and Lessons Learned database became available to staff on our intranet in November 2013,
Box 3.3 Modernising the Bank’s procurement policy
The Bank is updating its procurement policy to ensure greater value for money while maintaining high fiduciary standards. The new policy reflects international advances in public procurement practice and provides for increased flexibility, so that the Bank can be more responsive to different levels of procurement capacity in our partner countries. It gives us more scope to work with national systems and build capacity. It should also enable us to work more effectively with other development partners to promote the harmonisation agenda and ensure more effective aid.
The policy will apply across the full procurement cycle, enabling us to assess procurement arrangements, strengthen capacity and monitor the procurement processes of executing agencies. Our new procedures and processes will be robust, streamlined, nimble and efficient.
Figure 3.3 Ensuring strong portfolio performance
Disbursement ratio of ongoing portfolio (%)
Time for procurement of goods and works (months)
Operations with satisfactory mitigation measures (%)
Operations no longer at risk (%)
Operations at risk (%)
Operations eligible for cancellation(%)
22
8
72 72
8
9
2012 2013 2014 2015
2219
60
28
59
31
1117
<7
13
19
9
Target Actual
2 A red bullet indicates that we are not moving towards the target.
3 A yellow bullet indicates that we are regressing against the baseline or are within 80% of achieving the target.

48
Level 3: How well AfDB manages its operations
promoting a culture of learning and managing for results. It will soon be available on our external website, so the lessons can be shared more widely (see Box 3.4).
We use Project Completion Reports (PCRs) to assess how well our projects performed, looking at the relevance of their objectives and design, the efficiency of resource use and the delivery of results. PCRs also consider how projects handle risks and whether measures are in place to ensure sustainable benefits. We carry out an internal review of all PCRs to assess their quality and validate their performance ratings. In 2014, the proportion of
completed operations rated satisfactory or above was 94%, up from 75% in 2012 and well above our target. The share of
completed operations with sustainable outcomes was 82%, an improvement on 2012 but below our target of 85%.
Timely delivery of PCRs is important not only for accountability, but also for learning lessons that can feed into the design and implementation of new projects. This year, just two-thirds of our
completed operations had a timely PCR, falling from 91% in 2012 to 66% in 2014 and considerably below our target of 95%. This was primarily due to a large group of project extensions in 2015: PCRs were delayed to include final project outputs carried out during the extensions.
We will continue to remind teams about PCRs and to track their completion. We are considering providing more time to prepare PCRs, to enable more extensive data collection and raise the quality of the content.
Designing gender- and climate-informed operations Our Bank Strategy commits us to promoting gender equality and addressing climate change as key cross-cutting objectives. We are taking active steps to integrate these thematic commitments into every aspect of our work. Our One Bank Results Measurement Framework has indicators in these areas, to help staff focus on these important areas.
Gender Last year we produced our Gender Strategy, setting out how we will draw on international best practice to intensify our efforts to promote gender equity in our strategies and project design. We have strengthened the gender focus of our CSPs, with an improved process for delivering country gender profiles, to inform decisions. Further work is under way to improve the analytical focus and operational value of our country gender profiles. In 2014, the proportion of new CSPs with gender-informed design was 89%, compared to 75% in 2012.
Our projects increasingly address gender equality issues. In 2014 the proportion of new projects with gender-informed design was 89%, compared to a target of 83%, while 78% of our
projects had satisfactory gender-equality outcomes, more than meeting our target of 71%. Yet this is a complex area and we still have some way to go to ensure a focus on gender equality throughout the portfolio.
While we are proud of the progress we have made in addressing gender equality in our country strategies and operations, we will be setting ourselves more exacting gender standards. To intensify our efforts, we have developed a Gender Action Plan for the Bank, which will be implemented in 2015. We have already strengthened our expertise by creating a cadre of gender specialists who will help promote greater understanding of gender issues throughout the Bank. We will integrate gender into all of our business processes and leverage financial resources from other sources to finance gender activities (see Box 3.5). This comprehensive approach will increase the gender focus of our strategies, improve gender mainstreaming in our operations and increase funding for gender-specific activities.
Climate changeThe midterm review of our Climate Change Action Plan showed that we have performed well against our commitments. We have provided climate-related support to eight countries and co-financed 20 projects with international
Box 3.4 Learning from our assistance to small and medium-sized enterprises
The Bank’s Evaluation Results and Lessons Learned database can look across projects in a sector and provide lessons for future project design and implementation. For example, a number of lessons about our assistance to small and medium-sized enterprises have been highlighted from our work in 22 countries and 15 sectors: the importance of addressing the enabling business environment and regulations at the same time; promoting participation and ownership to enhance demand and improve targeting for poor and remote beneficiaries; defining best practice for providing credit; and the dangers of “imposing” entrepreneurship on firms that do not have sufficient management experience or staff training.
Close to 90% of our new country strategies were gender informed
Figure 3.4 Learning from our operations
Completed operations rated satisfactory (%)
Completed operations with sustainable outcomes (%)
Completed operations with a timely PCR (%)
78
8782
≥95
81
2012 2013 2014 2015
75
94
91
66
Target Actual

Annual D
eve
lopm
ent Effe
ctiveness R
evie
w 2
015
49
climate funds. We have delivered three-quarters of our new projects with climate-informed design, exceeding the
65% share in 2012 but falling short of our target of 90%. These projects use our Climate Safeguard System to identify climate risks and options for adaptation.
We are also active in international climate-change negotiations, providing technical and logistical assistance to the African Group of Negotiators and supporting the participation of African countries at global events. We have produced 59 climate-related knowledge products to deepen understanding of the impacts of climate change across Africa and of ways to respond.
Africa needs innovative ways of mobilising climate finance, particularly to fund initiatives at the local level involving small and medium-sized enterprises and local banks. We are working with multilateral development banks and climate financing instruments such as the Climate Investment Facility to create incentives for the private sector to undertake climate-smart investments.
Conclusion and outlookTo achieve our Bank Strategy, we need to ensure that the quality of our operations is high. To strengthen our in-country results, we have put in place measures to enhance our country strategies and our portfolio reviews. We are active supporters of aid effectiveness initiatives, both internationally and in-country, working closely with governments and other development partners. Our economic and social work remains a high priority and, to inform policy, focuses on
emerging development priorities. Wherever we have fallen short on portfolio quality targets, the Bank’s Board and senior management have taken robust corrective measures. We have also established an Executive Dashboard to provide a further tool for the Bank’s management to drive stronger performance.
Our ambitious goals for our portfolio need to be accompanied by continuous improvements in our own capacity as a development bank. We turn to this area in the next section of this report.
Box 3.5 Introducing a gender marker
The Bank is planning to introduce Gender-marking as a means of differentiating projects, from the concept stage, in terms of their likely contribution to gender equality goals. Projects identified in this way will have a Gender Action Plan and will receive more support from Bank gender experts. This will enable the Bank to make more strategic use of its gender resources and achieve a greater overall impact on gender issues.
Figure 3.5 Designing gender- and climate-informed operations
New CSPs with gender-informed design (%)
Projects with satisfactory gender-equality outcomes (%)
New projects with gender-informed design (%)
New projects with climate-informed design (%)
89
87
2012 2013 2014 2015
75
90
78
89
67
7873
Target Actual
65
9575
We delivered 75% of our new projects with climate-informed design

Access to electricity enables small businesses such as Burn Manufacturing Company in Kenya to grow and produce higher-value products through the use of equipment and technology. It has designed and makes a charcoal cook stove that reduces indoor air pollution by 90% compared to traditional Kenyan cook stoves. It uses 50% less charcoal, thus saving money for the households.
© A
fDB,
Arn
e H
oel
50
Annual D
eve
lopm
ent Effe
ctiveness R
evie
w 2
015
51
The final level of AfDB’s Results Measurement Framework assesses how well we manage ourselves as an organisation. We use 15 indicators to measure how far we have come in improving our structures and management processes to achieve value for money for our partner countries. This section examines our progress in decentralising our staff and functions to the country level and
in strengthening our staff management. It looks at whether business process reforms, including the introduction of new IT systems, have led to greater efficiency. We take stock of the structural changes we introduced to help us deliver the Bank Strategy and respond to the needs of our partner countries. We also reflect on the move back to the Bank’s permanent headquarters in Abidjan, assessing how this major operation has affected the delivery of our operations.
Decentralisation: moving closer to our clientsDecentralisation of staff and functions has been a long-term objective of the Bank, responding to clear demand from our client countries. Decentralisation brings us closer to the people we serve and enables us to participate more effectively in country development processes. Since 2000, the Bank has expanded its country presence outside of headquarters to 38 countries.
Throughout this period, we have undertaken periodic reviews and adjusted the decentralisation approach accordingly. In 2014, we undertook a midterm review of the Decentralisation Roadmap that has guided the process since 2011. This review identified many benefits from our in-country presence (see Box 4.1), noting in particular the progress in policy dialogue and improved donor coordination. A revised decentralisation action plan is now being developed to ensure that country offices are staffed according to each country’s needs and business development opportunities and to ensure delivery on the Bank’s Ten Year Strategy.
We also commissioned an assessment of fiduciary risks and safeguards in the context of our decentralised Bank structure. This review assured the Bank that the current approach did not expose it to any major
risk. However, it identified procedural changes and training needs to improve risk management and awareness and minimise fiduciary risks, so as to ensure efficient and effective operations.
We have exceeded our 2014 targets for decentralising staff and tasks to the field. We devolved more management responsibility to country offices through our 2012 Delegation of Authority Matrices, with more than 50% of projects managed from field offices1, compared to 42% in 2012. The share of our total professional
operational staff based in field offices was 50%, surpassing our target of 40% and enabling us to provide more robust and flexible management of our operations. The necessary infrastructure is in
Level 4: How efficient AfDB is as an organisation
1 A green bullet indicates that we have achieved or are within 90% of achieving the target.
Box 4.1 Successes on the road to decentralisation
A 2014 midterm review of the Bank’s Decentralisation Roadmap concluded that decentralisation has increased the Bank’s visibility in regional member countries. Bank staff who are based in country offices have developed a better understanding of the country context and are able to participate more readily in key policy discussions and local events and workshops.
Many staff and clients also stated that project supervision is more effective when conducted from a field office. Specialist staff are able to offer advice and solve problems, while project teams can address financial and procurement issues and resolve any delays or difficulties. Overall, the local presence means that the Bank has become more responsive in dealing with its clients.
We have exceeded our 2014 targets for decentralising tasks to the field, with 51% of projects managed from the field

52
Level 4: How efficient AfDB is as an organisation
Table 4: How efficient AfDB is as an organisation (Level 4)
This table presents the Bank’s progress in achieving its 2014 targets for organisational performance:
We have achieved or are within 90% of achieving the target We have not made enough progress but are within 80% of achieving the target
We are not moving towards the target Data points are missing
INDICATOR BASELINE 2012
LATEST 2014
TARGETS
2014 2015 2016
DECENTRALISATION: MOVING CLOSER TO OUR CLIENTS
Operational staff based in field offices (%) 36 50 40 45 50
Projects managed from field offices (%) 42 51 50 53 55
Connecting to field offices (% successful videoconferences) 90 98.5 more than 95 more than 95 more than 95
HUMAN RESOURCES: ENGAGING AND MOBILISING STAFF
Employee engagement index (%) 53 .. 64 67 70
Managerial effectiveness index (%) 48 .. 55 60 65
Operations professional staff (%) 67 66 70 70 70
Share of women in professional staff (%) 27 27 28 30 33
Share of management staff who are women (%) 24 31 28 30 32
Net vacancy rate — professional staff (%) 9 16 15 13 9
Time to recruit new staff (days) 223 .. .. 150 100
VALUE FOR MONEY: IMPROVING COST EFFICIENCY
Administrative costs per UA 1 million disbursed (UA 000) 86 98 87 85 80
Cost of preparing a lending project (UA 000) 1 74 71 72 71 70
Cost of supporting project implementation (UA 000) 1 21 14 20 19.5 19
Work environment cost per seat (UA 000) 3.5 3.3 3.4 3.35 3.3
Share of users satisfied with IT service delivery (%) 96 97 more than 97 more than 97 more than 97
.. = Data not available; IT = information technology; UA = Units of Account. 1 Both the cost for project preparation and the cost for project implementation are still based on estimates.
Source: African Development Bank
place to ensure effective communication between staff in field offices and at headquarters, with 97% of videoconferences successfully
connecting to field offices.
Human resources: engaging and mobilising staffAs Africa’s premier development finance institution, the Bank aims to engage professionals of the highest calibre from a wide range of specialties. The Bank’s People Strategy sets out the measures we are taking to ensure that we attract and retain the right mix of skills and expertise. The four pillars of this comprehensive strategy are developing leadership, strengthening employee engagement, improving performance and accountability and creating the workforce of the future. Our Human Resource Action Plan 2013–2015, which sets out in detail how we will deliver on the strategy, is being implemented across the organisation.
To enable staff to deepen their expertise and remain at the cutting edge of their professions, we launched a Learning and Professional Development Strategy. This approach serves to attract dedicated and high-quality professionals to the Bank, strengthening our position as an employer of choice for people who work in development.
Figure 4.1 Decentralisation
Operational staff based in field offices (%)
Projects managed from field offices (%)
Connecting to field offices(% successful videoconferences)
45
53
2012 2013 2014 2015
36
50
>95
42
90
51
98.5
Target Actual

Annual D
eve
lopm
ent Effe
ctiveness R
evie
w 2
015
53
We strive to retain and motivate staff and encourage their high performance by providing an active learning environment that enhances both technical specialisation and leadership and management skills (see Box 4.2).
As part of our drive for better management throughout the Bank, we undertook a strategic review of our staff performance management practice. Drawing on the findings of this review, we made a number of changes to embed a high-quality performance management culture throughout the Bank. Core to this agenda is a more systematic and quality dialogue between staff and supervisor. The principles underpinning the new approach are that performance management practice must clarify expectations; be simple, clear and fair for all parties; and be an ongoing, continuous process.
To assess progress under our People Strategy, we measure employee engagement2 and managerial effectiveness
through staff surveys. Partly because of the Bank’s move to Abidjan, the 2014 survey was conducted in April 2015, later than originally scheduled. The findings of the survey were not available by the time this report went to print but will be published later this year. Staff surveys on specific pillars of the People Strategy will take place in 2015 and 2016, with a full survey on all pillars in 2017. To respond to some key issues raised in the 2013 staff survey, we acted to make decision-making more open and transparent, facilitate better internal communications and feedback, and recognise and reward high staff performance through awards to individuals and teams.
The return to our headquarters in Côte d’Ivoire was an immense logistical challenge and a major change for Bank staff and their families. Over a nine-month period, briefing sessions for relocating staff, along with meet-and-greet arrangements, provided a range of services to help over 1000 staff members and their families settle in Abidjan. Through careful planning and implementation, the move was achieved successfully with minimal disruption to our operational work.
During the move, the staff complement fell by 6.4%, to 2065. The net vacancy rate for professional staff3 stood at 16%, above the
target of 15%. As the Bank implements its strategic staffing exercise, the Bank’s net vacancy rate was deliberately maintained at a high level. This, combined with the freeze on recruitments, provided management with greater flexibility to realign our workforce with the objectives of the Bank’s Ten Year Strategy.
In regard to gender parity in our staffing, we continue working to raise the proportion of women in professional and management positions, but we still have some distance to go. We achieved our
Box 4.2 Investing in people at the AfDB
The Bank’s Learning and Professional Development Strategy (2014–16) helps attract and retain the high-quality workforce needed to implement the Bank Strategy. We are working to provide the learning resources and environment needed for continual staff development by investing in five key areas.
◗ Leader-led learning: developing leadership and management skills so that the leadership team is well equipped to ensure that learning takes place for all staff in their teams.
◗ Business-aligned learning investments: focusing on learning that directly supports the Bank’s business imperatives.
◗ Promoting gender equity: investing in initiatives and activities to promote gender equity, both within the Bank and throughout all our operations.
◗ New architecture for cross-boundary learning: supporting new Professional Practice Groups and strengthened Communities of Practice.
◗ Focus on results, impact and value for money: developing better learning methodologies to achieve results, development impact and better value for money.
Figure 4.2 Human resources
Employee engagement index (%)
Managerial effectiveness index(%)
Operations professional staff(%)
Share of women in professional staff(%)
Share of management staff who are women (%)
Net vacancy rate—professional staff(%)
Time to recruit new staff(days)
60
70
30
48
27 27
30
150
24
223184
31
67 66
52
2012 2013 2014 2015
67
5361
139
16
Target Actual
2 A grey bullet indicates that data points are missing.
3 A yellow bullet indicates that we have not made enough progress but are within 80% of achieving the target.
31% of women hold management positions, up from 24% in 2012

54
Level 4: How efficient AfDB is as an organisation
2014 targets, with the share of women in professional staff roles at 27% and in management roles increasing to 31% from 24% in 2012. Overall, the proportion of our employees who are
operational professional staff was 66%, against a target of 70%, showing that we need to keep this area under active review.
Value for money: improving cost-efficiencyThe Bank is committed to achieving greater value for money in all our development investments. This requires maximising the benefits for our clients and increasing the efficiency of our spending. We are working in this area not only for our own operations, but also in cooperation with other multilateral development banks (see Box 4.3).
In recent years, our administrative costs have been well contained through actions to streamline business processes and procedures. We
have implemented cost-rationalisation measures such as streamlined missions and consultancies, cost-effective printing facilities and better use of office spaces. The ongoing strategic staffing review is expected to align the efforts behind our strategic priorities and results and should also reduce costs. In addition, we are introducing better cost accounting, such as staff time recording to strengthen the link between resources and results. For example, the costs of project design and implementation will in the future be carefully tracked against project achievements.
As a result of these measures, we have made good progress in keeping our costs at reasonable levels, achieving our targets for three of our four value-for-money indicators (Figure 4.3).
Administrative costs per UA 1 million disbursed4, UA 98 000, was a 4% improvement on last year’s figure (UA 102 000), but was above the target of UA 87 000. It is important to note, however, that this failure to meet our target does not reflect increased administrative costs but rather disbursement volumes that were below targets, mainly for the concessionary window (the African Development Fund). Higher disbursement targets were set after an increase in loan commitments, but countries borrowing from that window were experiencing delays in the processing of some procurement and disbursement requests.
We have reduced the cost of preparing a lending project from UA 74 000 in 2012 to UA 71 000 and decreased the cost of supporting project implementation from UA 21 000 to UA 14 000 — well below our target of UA 20 000. Careful office management, control of rental and lease renewals and an increase in office capacity have brought down the work environment cost per seat to UA 3300 from UA 3500.
The provision of a high-quality IT infrastructure is critical to enabling a decentralised Bank to operate effectively whilst containing administrative costs. Efficient and continuous IT services enable both field offices and headquarters to operate in a timely and efficient way, delivering services to our clients, communicating well and providing the back-up and advisory support needed for prompt and effective service delivery. As a result of our efforts, the
share of users satisfied with IT service delivery is 97%.
In 2014, the transfer of our IT infrastructure back to our headquarters in Abidjan proved to be a resounding success. Careful IT recovery plans and procedures were put in place to facilitate the move, and they played a key part in minimising disruption to our operations. In
Box 4.3 A new framework for measuring value for money in multilateral development banks
Achieving good value for money is essential to the multilateral development banks. It underpins their credibility and guides them in improving their institutional efficiency. Led by the AfDB, multilateral development banks are working together to develop a new conceptual framework to provide a common approach to value for money. This work will determine the actions needed to ensure that each development bank maximises value for money and has systems in place to track its progress. While the principles will be shared, the systems need to be tailored to each institution’s unique mandate, structures, governance requirements and activities.
4 This does not include the Bank’s 2014 cost of the return to headquarters, amounting to UA 50.6 million, which are mostly one-off expenses such as transportation cost for staff and families, return and installation allowances, etc.
Careful management and control have brought down the work environment cost per seat from UA 3500 in 2012 to UA 3300
Figure 4.3 Value for money: improving cost efficiency
Administrative costs per UA 1 million disbursed (UA 000)1
Cost of preparing a lending project (UA 000)
Cost of supporting project implementation (UA 000)
Work environment cost per seat (UA 000)
Share of users satisfied with IT service delivery (%)
85
19.5
2012 2013 2014 2015
8698
2114
74
71
3.53.3
71
3.35
>97
Target Actual
9697
1 Revised after final financial statements

Annual D
eve
lopm
ent Effe
ctiveness R
evie
w 2
015
55
addition, improved IT systems have helped to support management reforms such as the new integrated staff performance management system. We also implemented an improved procurement workflow process to increase efficiency and enable staff to collaborate on procurements across geographical boundaries.
Conclusion For more than a decade, the decentralisation of staff and functions has improved our performance for our clients. Yet decentralisation involves complex management challenges. We took stock of our progress with decentralisation in 2014, and as a result, we will make additional efforts to ensure that staff are carefully allocated to country offices in line with the business needs of the country. We have also undertaken a range of reforms to our business processes to contain costs and increase efficiency.
Our new human resource initiatives are improving staff management processes and creating learning and professional development opportunities to attract and retain staff of the highest calibre. We are achieving our diversity targets by increasing the share of women in professional and management roles. Our IT services have delivered high-quality services, enabled improved business processes and procedures and played a key role in the smooth transition back to our headquarters in Abidjan.
To meet the level of ambition set out in the Bank Strategy, we must keep our own organisation under continuous review, seeking out opportunities to drive up performance and achieve better value for our partner countries. This period has therefore been particularly dynamic for the Bank, as we have realigned our structures and resources to deliver on the Strategy (see Box 4.4).
Through all these actions, we are working to ensure that the Bank continues to deliver the best possible development results through its operations across Africa.
Box 4.4 Adapting the Bank’s structure to better respond to countries’ emerging needs
One key focus area in our Strategy is the sustainable development and management of Africa’s vast natural resources. To strengthen and scale up our assistance in this area, we have created an African Natural Resource Centre as a nexus of expertise and specialised services.
Another area on which the Bank has committed to focus is financial inclusion. We have created a new structure to promote robust financial systems and inclusion. Working closely with country offices, the new unit will drive forward the financial sector development priorities in our Bank Strategy.

© A
fDB,
Arn
e H
oel
56

Annual D
eve
lopm
ent Effe
ctiveness R
evie
w 2
015
57
Africa is changing at a remarkable speed. The rapidly growing and urbanising population, the rise of the middle class, shifting global patterns of trade and investment and, above all, strong and sustained economic growth are having a dramatic effect on lives and livelihoods across the continent. The prospects for the coming years remain positive. While a lower oil price will suppress growth in some
countries, it will also lower the costs of doing business and provide a welcome boost to the non-oil sectors.
But we have yet to see the necessary change in the structure of African economies. To generate opportunities for the population at large, we need a more inclusive pattern of growth. We need to turn African agriculture into an occupation of opportunity, rather than necessity, and we need to create new opportunities for jobs and businesses in manufacturing. This calls for innovations in business, government and society, to make Africa the next growth frontier.
Our role in Africa’s transformationThe African Development Bank aims to set in place the conditions that enable Africans to find innovative solutions to their development challenges. Through our Strategy 2013-2022, we have a clear sense of how we can best contribute to Africa’s development and where we should put our efforts in the coming years.
Infrastructure — Infrastructure continues to be our highest priority. Our investments in transport, power and water are helping to put in place the conditions for economic transformation. We will continue to search for solutions to Africa’s infrastructure challenges, including new forms of financing. We will invest in developing Africa’s vast hydropower potential. We will help African countries to leapfrog over old technologies and identify new, cost-effective solutions, including small-scale, clean power for remote communities. We will continue to support the spread of mobile communications, helping to create new methods of delivering services for both business and governments. And we will invest in clean water to enable the growth of agribusiness.
Private sector development — In recent years there have been widespread improvements in the business environment across Africa, in areas such as business registration, property transactions, cross-border trade and investor protection. As a result, Africa is becoming an increasingly attractive investment destination. Yet challenges remain. To boost Africa’s overall competitiveness, we are helping to develop innovative solutions for broadening access to microfinance, based on new and sustainable business models. We are also promoting new approaches to public-private partnerships, helping to show how public investments can mobilise private finance and accelerate progress on national development.
Governance and accountability — The quality of government remains a key frontier for development across Africa. There has been progress in many areas, particularly in economic governance. Free elections are increasingly becoming the norm across most of the continent, but there is still much to be done to give citizens the confidence that their taxes will be used appropriately. African countries must do more to raise domestic revenues and invest them back into national development. We are working to improve revenue collection, budgeting and public financial management, based on the principles of transparency and accountability. We are also intensifying our efforts to strengthen governance in our priority sectors.
Regional integration — Africa’s fragmentation into small national markets is a key barrier to innovation and economic transformation. If African businesses can link to each other and to businesses around the world, they can create new value chains and achieve economies of scale. In our Strategy for Regional Integration 2014–2023 we commit to developing regional infrastructure and enhancing cross-border trade, so as to trigger the cycle of investment and innovation needed for rapid industrialisation and job creation. In recent years, we have piloted fresh approaches to the management of land borders and the development of regional power pools, and we will continue to scale up these investments in the coming years.
Skills and technology — Africa no longer has to rely solely on measures developed in other countries. It has shown that it can take new ideas and adapt them to the African context. We see communications technologies being used in exciting ways, increasing access to financial and other services through new business models. We are beginning to see new, clean energy technologies being used to overcome infrastructure bottlenecks. However, Africa’s level of
Conclusion and outlook
58
Conclusion and outlook
technical skills remains a significant constraint on innovation. For this reason, the Bank has made science and technology the main focus of its support for education and vocational training. We are intensifying our efforts to equip young Africans with the skills they need to succeed in a knowledge economy.
Building resilience and adaptive capacity — In the coming years, Africa’s changing climate will have widespread impact on agricultural productivity, food and water security and the incidence of extreme weather. Africa still has work to do to put in place the necessary measures to adapt, including targeted public investment programmes and more resilient communities and households. Africa needs to improve the management of its natural resources, both renewable and non-renewable, and move towards a sustainable development pathway that protects the interests of future generations.
Building the AfDB that Africa needsThe AfDB is Africa’s premier development finance institution. To maintain this position and meet the diverse needs of our partner countries, we continually strive to improve our strategies, our portfolio and our own organisational capacity.
2014 was in many respects a challenging year. The Ebola crisis in Guinea, Liberia and Sierra Leone caused significant disruption, and other African countries faced other difficult conditions. For the Bank itself, the move back to our permanent headquarters in Abidjan was an enormous logistical undertaking. In the face of such challenges, we fell short of some of our 2014 targets, but overall the Bank continued to move from strength to strength. Our Bank Strategy 2013–2022 has been amplified by a comprehensive set of sectoral
and thematic strategies. Our country strategies are stronger than ever, incorporating fragility assessments and paying closer attention to cross-cutting priorities like gender equality and climate change. Our country portfolios and our operations are subject to a demanding set of quality assurance mechanisms, with close supervision to ensure that implementation problems are quickly identified and addressed. Our commitment to aid effectiveness remains strong, with solid progress on using country systems to deliver our assistance. We produce a wide range of analytical and research outputs, which help to inform high-quality policy dialogue with our partner countries. Lessons from our operations are now captured in a database that can be readily searched by sector and thematic area.
With the return to our headquarters largely completed, we are pressing ahead with ambitious reforms to make the Bank the employer of choice for Africans in development. Our comprehensive People Strategy is helping to promote stronger leadership, strengthen employee performance and create the workforce of the future. We are also working closely with other development banks to create new approaches to maximising value for money across our operations.
Looking ahead, 2015 promises to be a landmark year for the international development community. Decisions are expected on new Sustainable Development Goals at the UN Summit in September, while the Third International Conference on Financing for Development in July in Addis Ababa and the Climate Conference in Paris in December will bring new commitments. As always, the AfDB will be at the centre of these events, helping to ensure that the African voice is heard and that the continent achieves its development objectives.


Annual review
Annual Development Effectiveness Review 2011
African Development Bank Group
African Development Bank Group
Development Effectiveness Review 2012Fragile StateS and ConFliCt-aFFeCted CountrieS
Thematic review
African Development Bank Group
Thematic review
Development Effectiveness Review 2014ENERGY
Development Effectiveness Review 2012GOVERNANCE
Thematic review
African Development Bank GroupAfrican Development Bank Group
Thematic review
Development Effectiveness Review 2012Promoting regional integration
De
ve
lop
me
nt Effe
ctive
ne
ss Re
vie
w 2
01
2 - P
ro
mo
ting
reg
ion
al in
tegr
atio
n
Development Effectiveness Review 2012Rwanda
African Development Bank Group
Country review
Annual Development Effectiveness Review 2012Growing African Economies Inclusively
Annual review
African Development Bank Group
Annual Development Effectiveness Review 2013Towards sustainable growth for Africa
Annual review
African Development Bank Group
Annual Development Effectiveness Review 2014Towards Africa’s transformation
Annual review
African Development Bank Group
Thematic reviews
Country reviews
Annual reviews
The Development Effectiveness Review series of the Bank
Development Effectiveness Review 2013ZAMBIA
African Development Bank Group
Country review
Development Effectiveness Review 2013SENEGAL
African Development Bank Group
Country review


www.afdb.org Des
ign/
layo
ut: w
ww
.cre
onde
sign
.net